Breve análisis del portátil Dell Inspiron 15 5000 5567-1753
| Networking | |
| iperf3 transmit AX12 | |
| Lenovo ThinkPad E470-20H2S00400 | |
| Dell Inspiron 15 5000 5567-1753 | |
| HP Pavilion 17-x110ng | |
| iperf3 receive AX12 | |
| Lenovo ThinkPad E470-20H2S00400 | |
| Dell Inspiron 15 5000 5567-1753 | |
| HP Pavilion 17-x110ng | |
| |||||||||||||||||||||||||
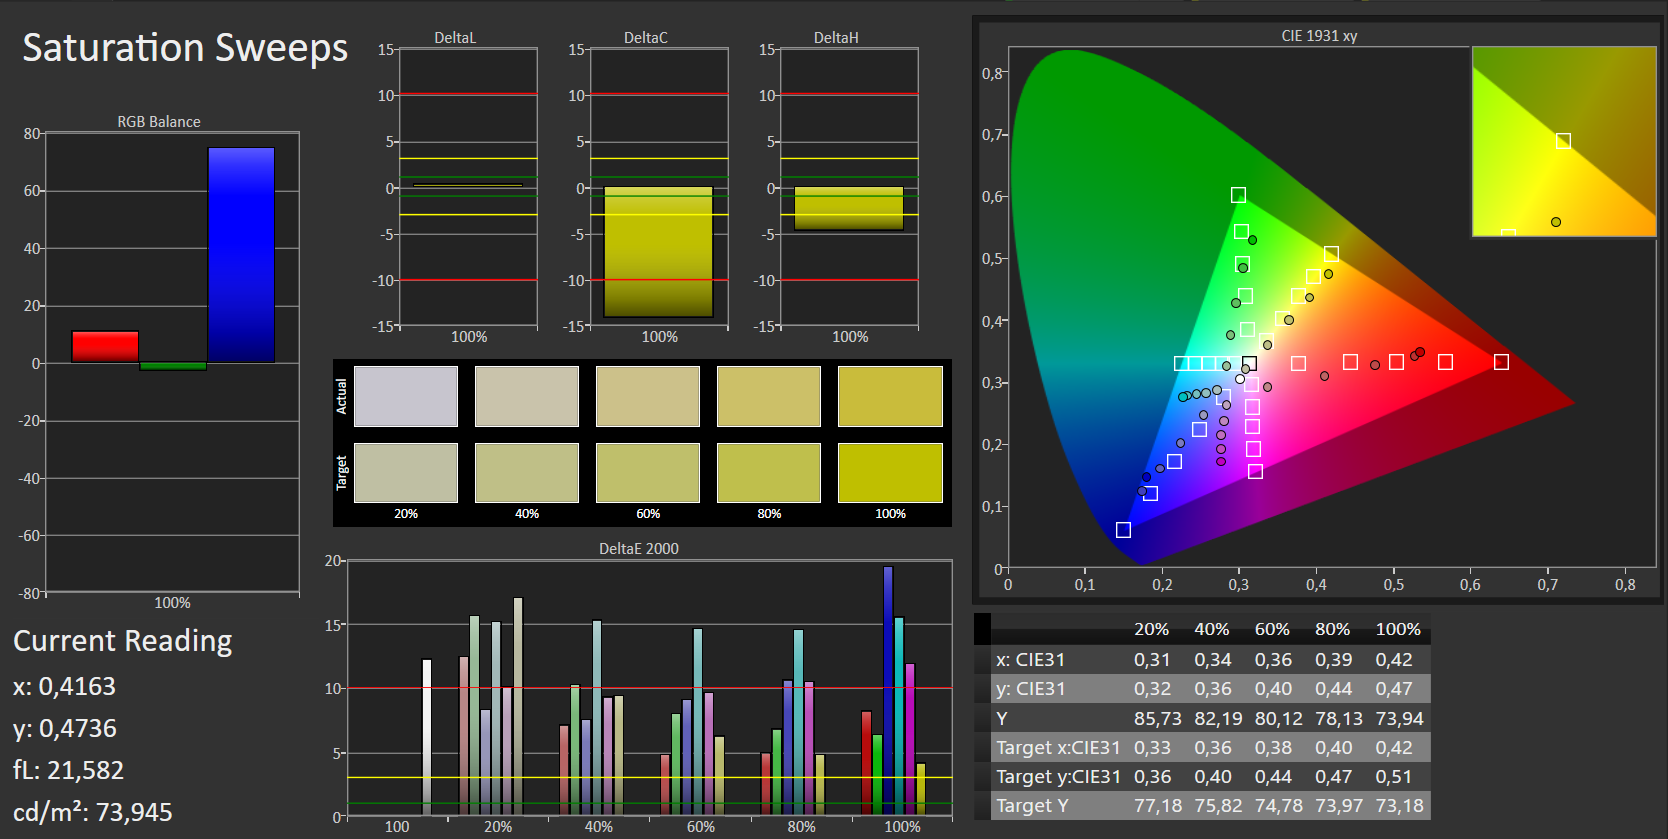
iluminación: 90 %
Brillo con batería: 187 cd/m²
Contraste: 296:1 (Negro: 0.49 cd/m²)
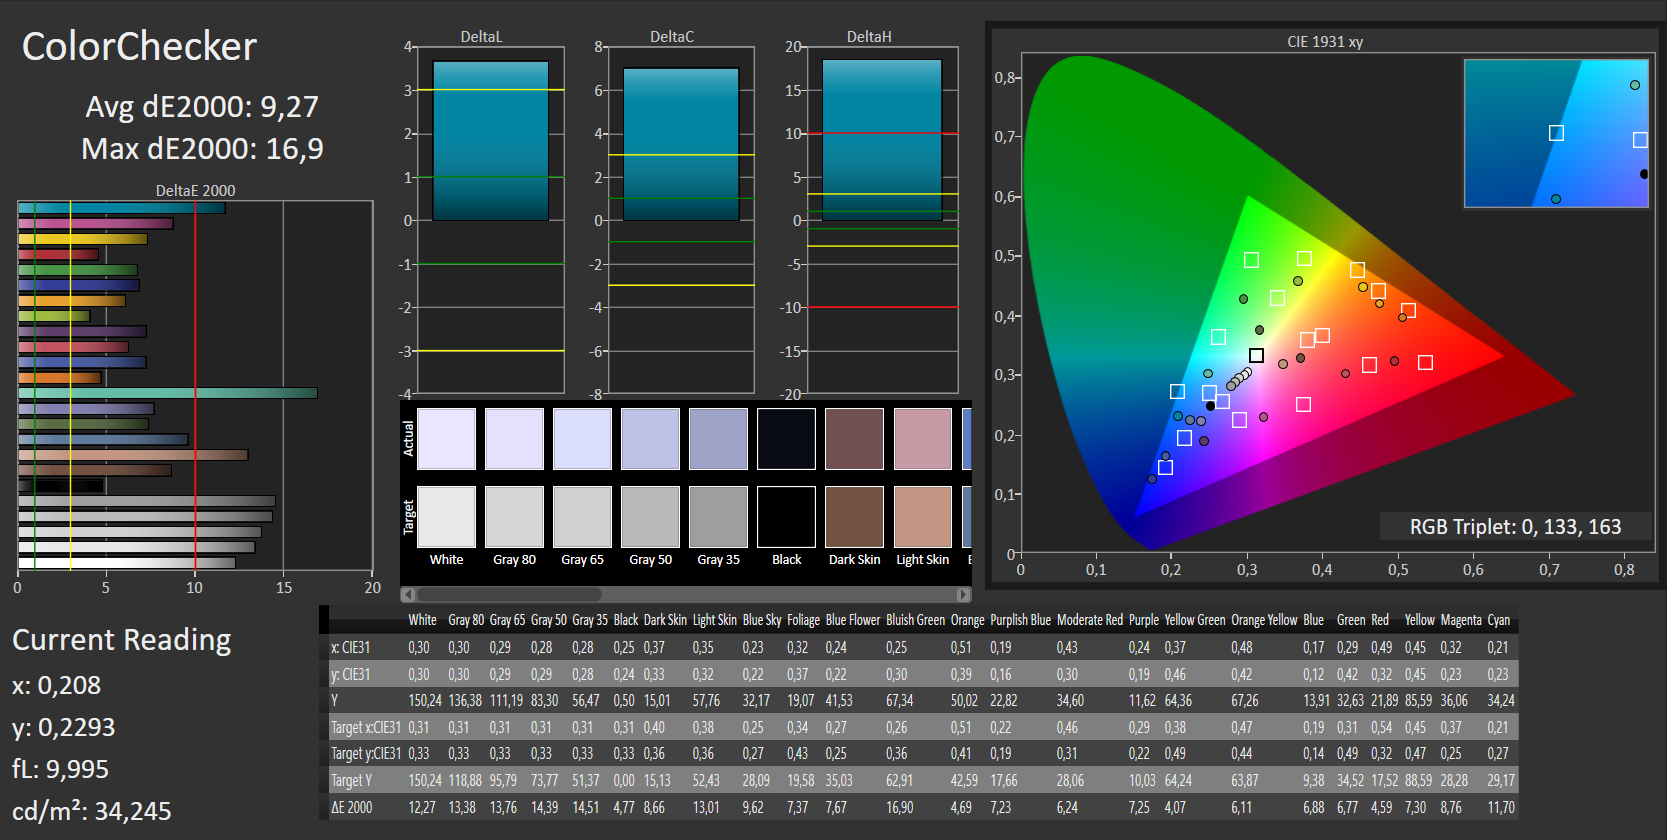
ΔE ColorChecker Calman: 9.27 | ∀{0.5-29.43 Ø4.71}
ΔE Greyscale Calman: 12.28 | ∀{0.09-98 Ø4.96}
55% sRGB (Argyll 1.6.3 3D)
35% AdobeRGB 1998 (Argyll 1.6.3 3D)
37.44% AdobeRGB 1998 (Argyll 3D)
54.6% sRGB (Argyll 3D)
36.24% Display P3 (Argyll 3D)
Gamma: 2.03
CCT: 10732 K
| Dell Inspiron 15 5000 5567-1753 BOE NT15N41, 1920x1080, 15.6" | Acer Aspire E5-575G-549D Chi Mei CMN15C4, 1920x1080, 15.6" | Lenovo IdeaPad 510-15IKB 80SV0087GE BOE HF NV156FHM-N42, 1920x1080, 15.6" | Lenovo ThinkPad E470-20H2S00400 N140HCA-EAB, 1920x1080, 14" | HP Pavilion 15-aw004ng W8Y60EA Chi Mei, 1920x1080, 15.6" | HP Pavilion 17-x110ng Chi Mei CMN1738, 1920x1080, 17.3" | |
|---|---|---|---|---|---|---|
| Display | 6% | 18% | 13% | 11% | 67% | |
| Display P3 Coverage (%) | 36.24 | 38.57 6% | 42.66 18% | 41.23 14% | 40.35 11% | 63.6 75% |
| sRGB Coverage (%) | 54.6 | 57.4 5% | 64.1 17% | 61.4 12% | 60.3 10% | 86.5 58% |
| AdobeRGB 1998 Coverage (%) | 37.44 | 39.89 7% | 44.08 18% | 42.67 14% | 41.71 11% | 63.3 69% |
| Response Times | -31% | -95% | -56% | -30% | -55% | |
| Response Time Grey 50% / Grey 80% * (ms) | 43 ? | 39 ? 9% | 51 ? -19% | 40.8 ? 5% | 41 ? 5% | 41 ? 5% |
| Response Time Black / White * (ms) | 14 ? | 24 ? -71% | 38 ? -171% | 30.4 ? -117% | 23 ? -64% | 30 ? -114% |
| PWM Frequency (Hz) | 50 ? | 200 ? | ||||
| Screen | 13% | 76% | 40% | 19% | 52% | |
| Brightness middle (cd/m²) | 145 | 176 21% | 291 101% | 244 68% | 240 66% | 288 99% |
| Brightness (cd/m²) | 144 | 169 17% | 265 84% | 231 60% | 228 58% | 285 98% |
| Brightness Distribution (%) | 90 | 91 1% | 86 -4% | 89 -1% | 89 -1% | 88 -2% |
| Black Level * (cd/m²) | 0.49 | 0.47 4% | 0.23 53% | 0.37 24% | 0.49 -0% | 0.61 -24% |
| Contrast (:1) | 296 | 374 26% | 1265 327% | 659 123% | 490 66% | 472 59% |
| Colorchecker dE 2000 * | 9.27 | 8.83 5% | 4.78 48% | 6.41 31% | 10.96 -18% | 4.56 51% |
| Colorchecker dE 2000 max. * | 16.9 | 14.01 17% | 9.51 44% | 13.4 21% | 18.36 -9% | 7.76 54% |
| Greyscale dE 2000 * | 12.28 | 8.97 27% | 3.49 72% | 5.94 52% | 11.34 8% | 4.95 60% |
| Gamma | 2.03 108% | 2.43 91% | 2.58 85% | 2.28 96% | 2.27 97% | 2.48 89% |
| CCT | 10732 61% | 10234 64% | 6013 108% | 6101 107% | 12292 53% | 7669 85% |
| Color Space (Percent of AdobeRGB 1998) (%) | 35 | 36.8 5% | 40 14% | 39.3 12% | 39 11% | |
| Color Space (Percent of sRGB) (%) | 55 | 57.3 4% | 64 16% | 61.1 11% | 60 9% | 93 69% |
| Media total (Programa/Opciones) | -4% /
6% | -0% /
41% | -1% /
22% | 0% /
11% | 21% /
40% |
* ... más pequeño es mejor

Tiempos de respuesta del display
| ↔ Tiempo de respuesta de Negro a Blanco | ||
|---|---|---|
| 14 ms ... subida ↗ y bajada ↘ combinada | ↗ 6 ms subida | 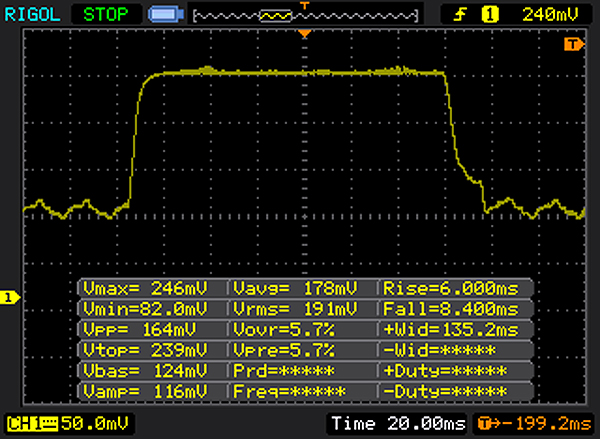 |
| ↘ 8 ms bajada | ||
| La pantalla mostró buenos tiempos de respuesta en nuestros tests pero podría ser demasiado lenta para los jugones competitivos. En comparación, todos los dispositivos de prueba van de ##min### (mínimo) a 240 (máximo) ms. » 34 % de todos los dispositivos son mejores. Esto quiere decir que el tiempo de respuesta medido es mejor que la media (19.8 ms) de todos los dispositivos testados. | ||
| ↔ Tiempo de respuesta 50% Gris a 80% Gris | ||
| 43 ms ... subida ↗ y bajada ↘ combinada | ↗ 18 ms subida | 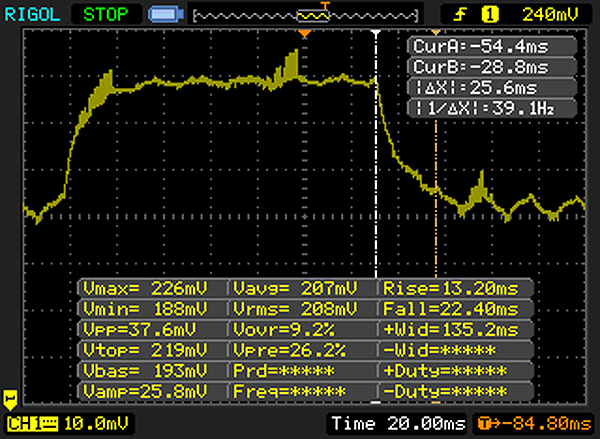 |
| ↘ 25 ms bajada | ||
| La pantalla mostró tiempos de respuesta lentos en nuestros tests y podría ser demasiado lenta para los jugones. En comparación, todos los dispositivos de prueba van de ##min### (mínimo) a 636 (máximo) ms. » 71 % de todos los dispositivos son mejores. Eso quiere decir que el tiempo de respuesta es peor que la media (31 ms) de todos los dispositivos testados. | ||
Parpadeo de Pantalla / PWM (Pulse-Width Modulation)
| Parpadeo de Pantalla / PWM no detectado | ||
Comparación: 52 % de todos los dispositivos testados no usaron PWM para atenuar el display. Si se usó, medimos una media de 7757 (mínimo: 5 - máxmo: 343500) Hz. | ||
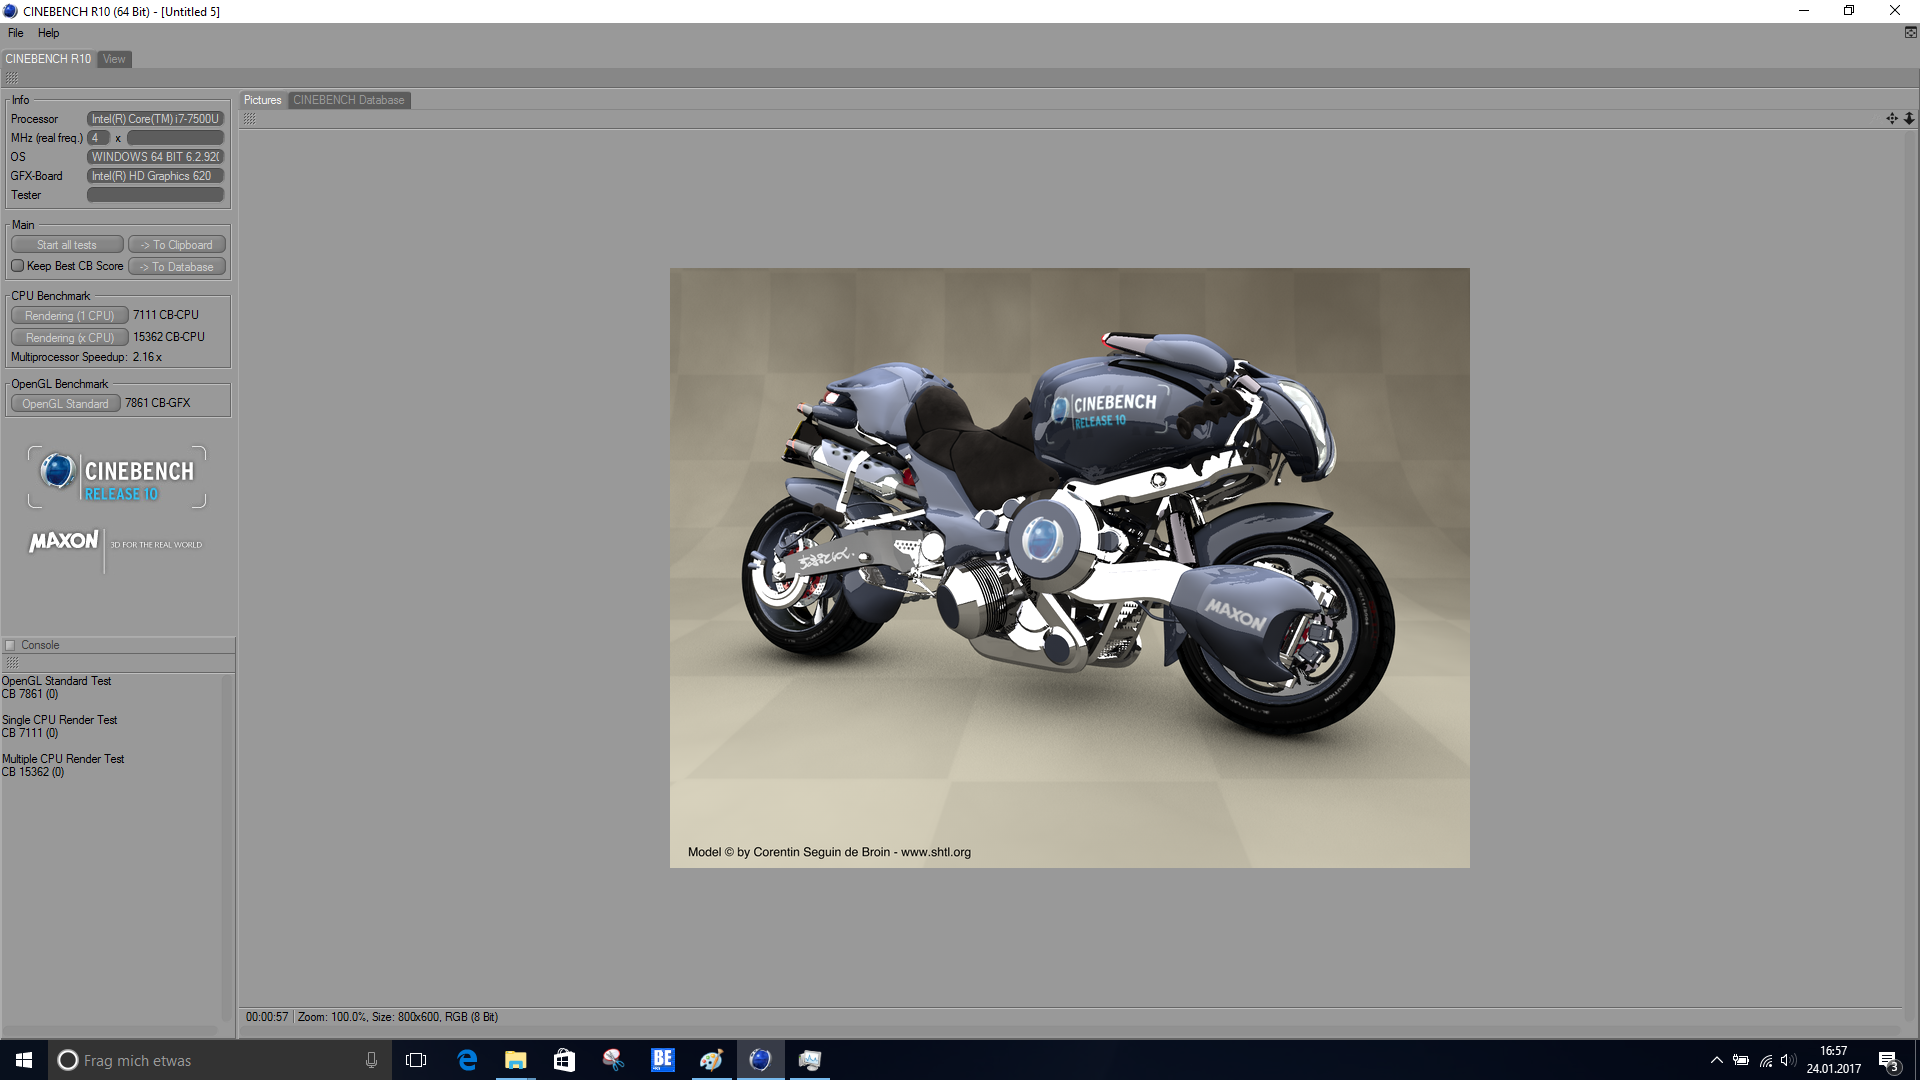
| Cinebench R10 | |
| Rendering Single CPUs 64Bit | |
| Dell Inspiron 15 5000 5567-1753 | |
| HP Pavilion 17-x110ng | |
| Rendering Multiple CPUs 64Bit | |
| Dell Inspiron 15 5000 5567-1753 | |
| HP Pavilion 17-x110ng | |
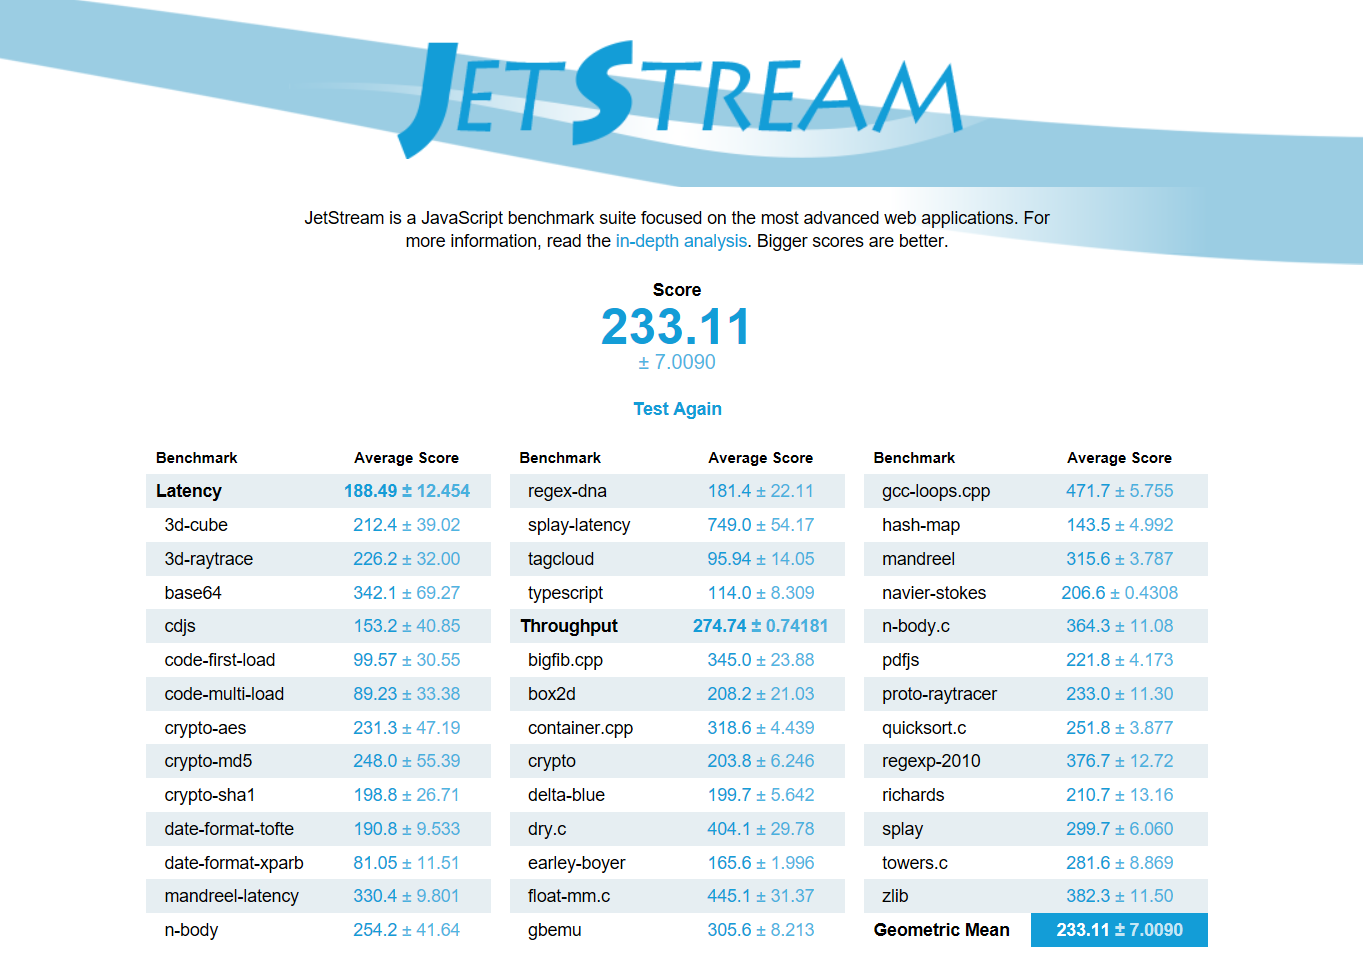
| JetStream 1.1 - 1.1 Total | |
| Lenovo IdeaPad 510-15IKB 80SV0087GE | |
| Dell Inspiron 15 5000 5567-1753 | |
| Acer Aspire E5-575G-549D | |
| HP Pavilion 17-x110ng | |
| Lenovo ThinkPad E470-20H2S00400 | |
| HP Pavilion 15-aw004ng W8Y60EA | |
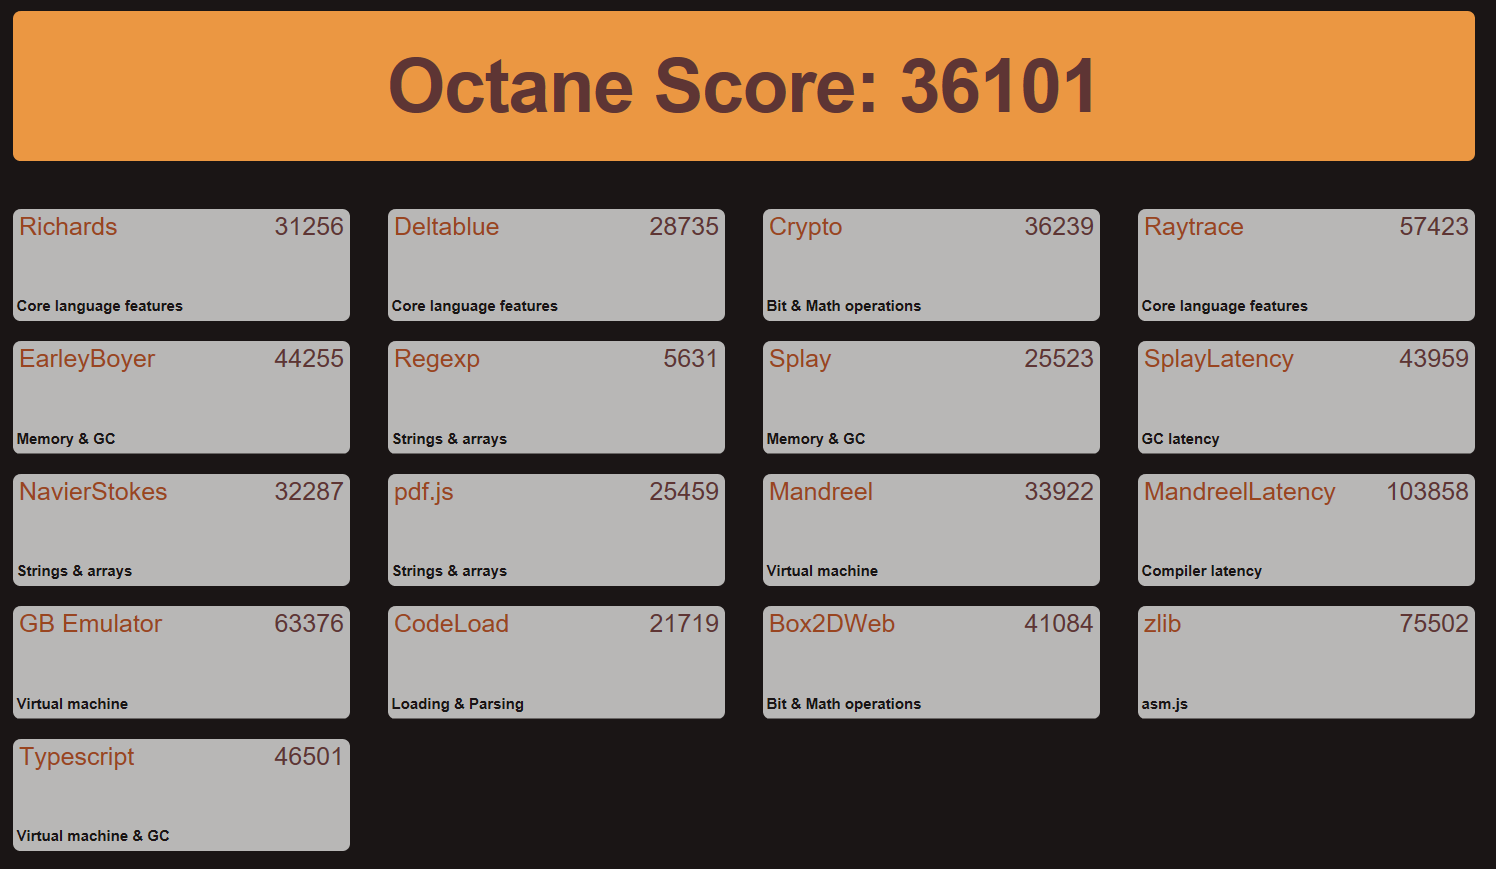
| Octane V2 - Total Score | |
| Dell Inspiron 15 5000 5567-1753 | |
| Lenovo ThinkPad E470-20H2S00400 | |
| HP Pavilion 17-x110ng | |
| Acer Aspire E5-575G-549D | |
| HP Pavilion 15-aw004ng W8Y60EA | |
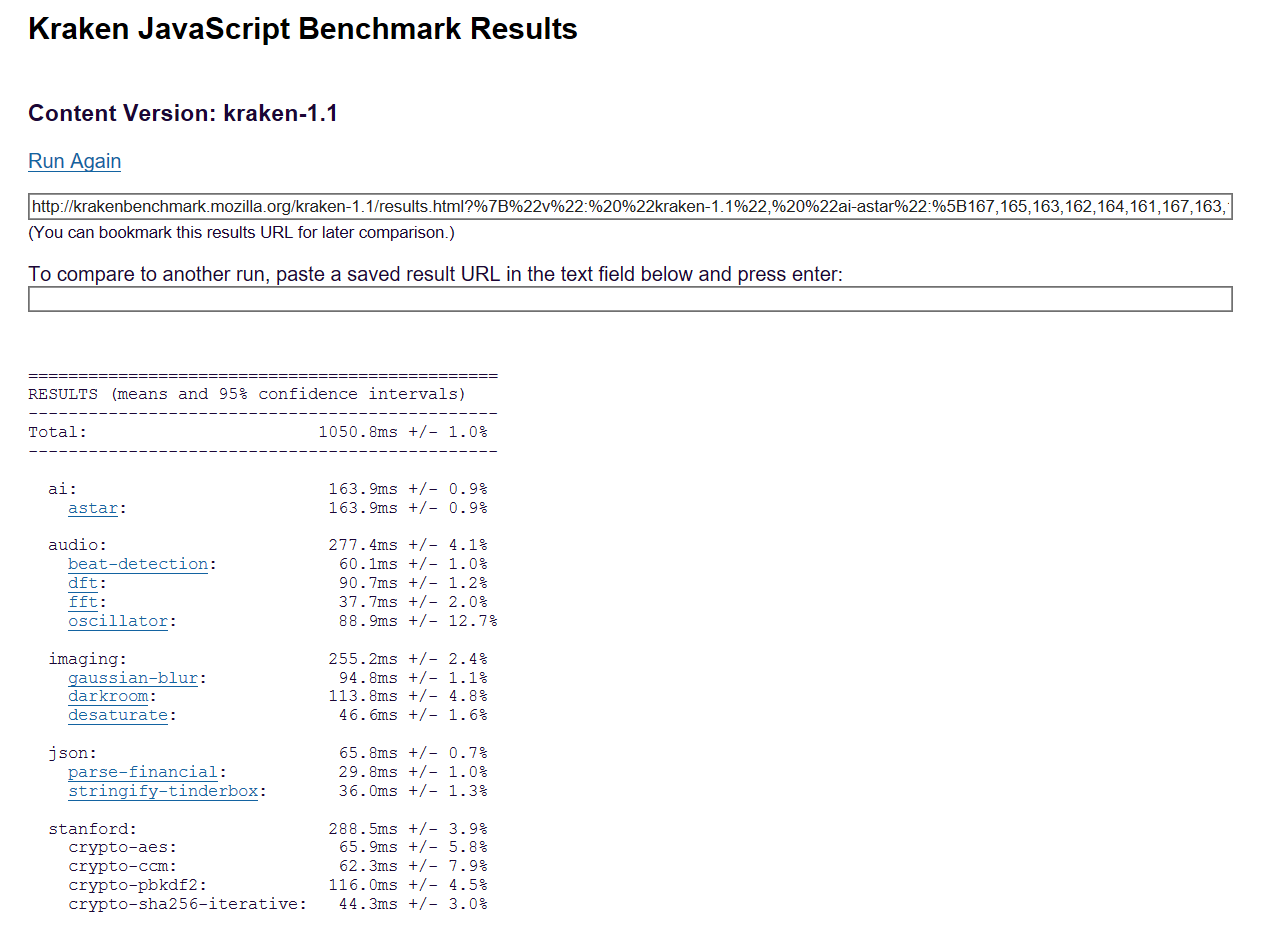
| Mozilla Kraken 1.1 - Total | |
| HP Pavilion 15-aw004ng W8Y60EA | |
| HP Pavilion 17-x110ng | |
| Lenovo ThinkPad E470-20H2S00400 | |
| Acer Aspire E5-575G-549D | |
| Dell Inspiron 15 5000 5567-1753 | |
* ... más pequeño es mejor
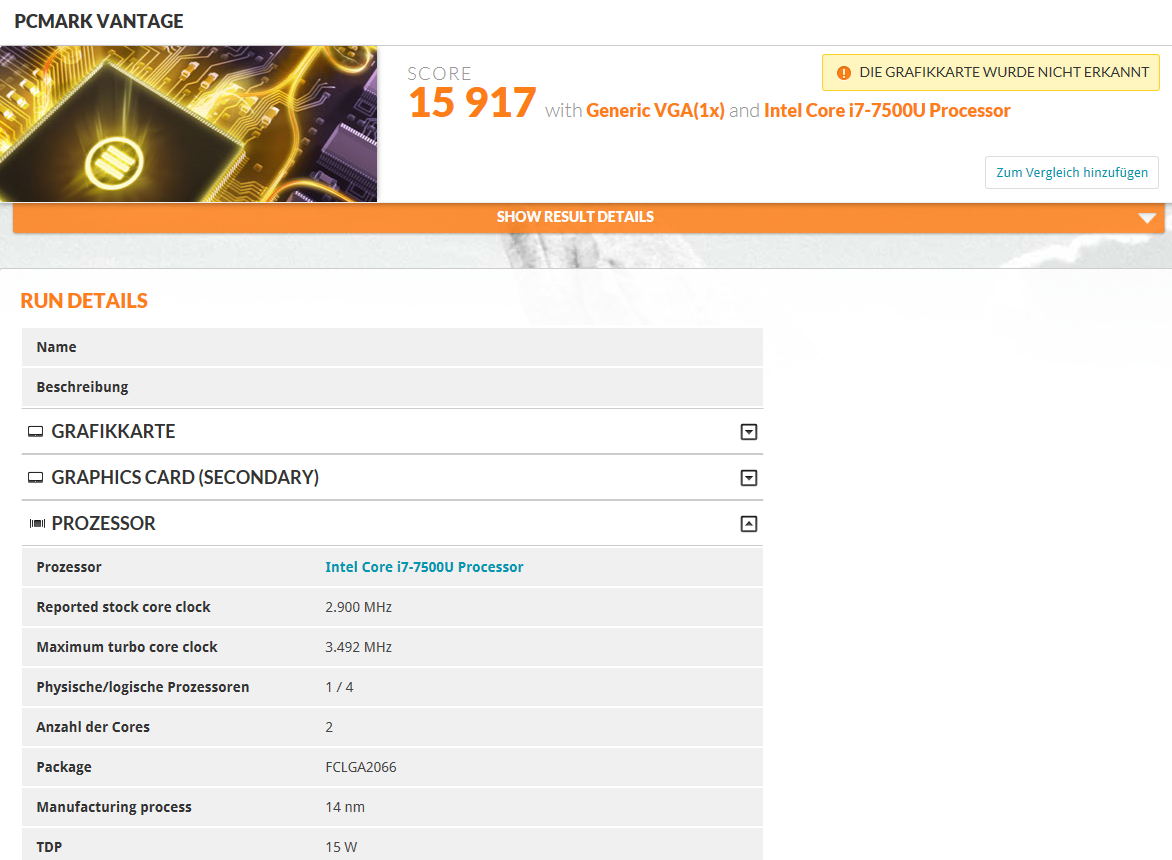
| PCMark Vantage Result | 15917 puntos | |
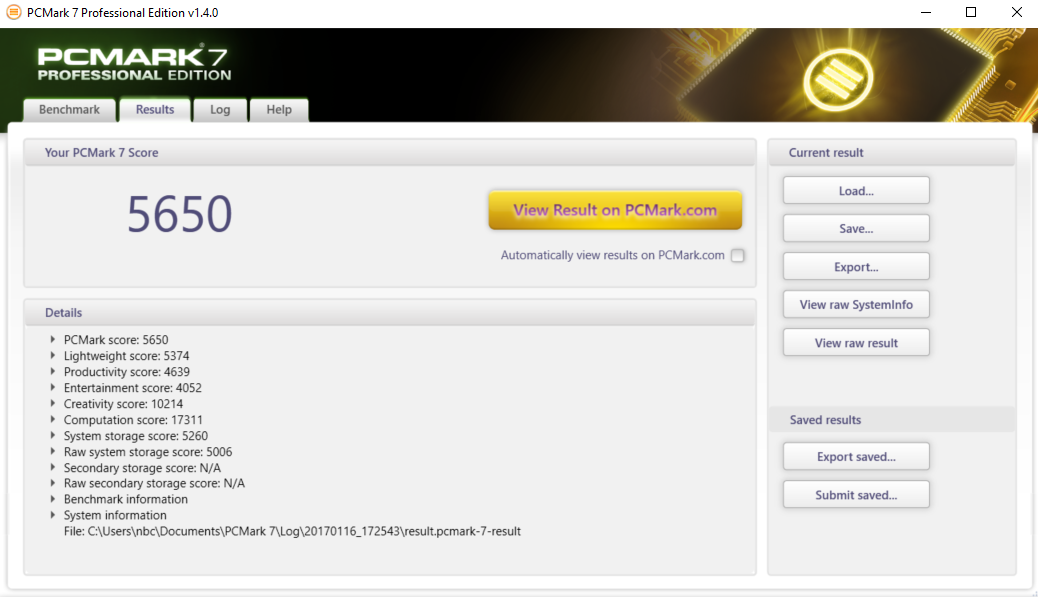
| PCMark 7 Score | 5650 puntos | |
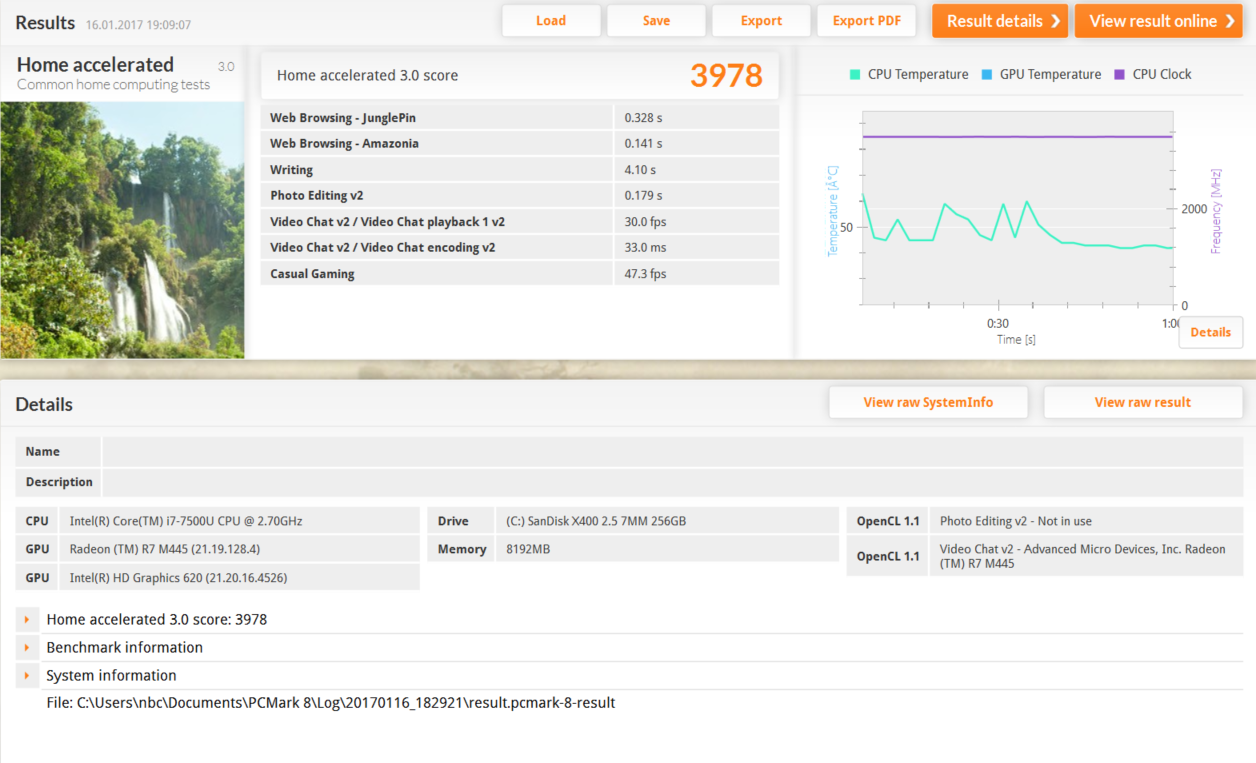
| PCMark 8 Home Score Accelerated v2 | 3978 puntos | |
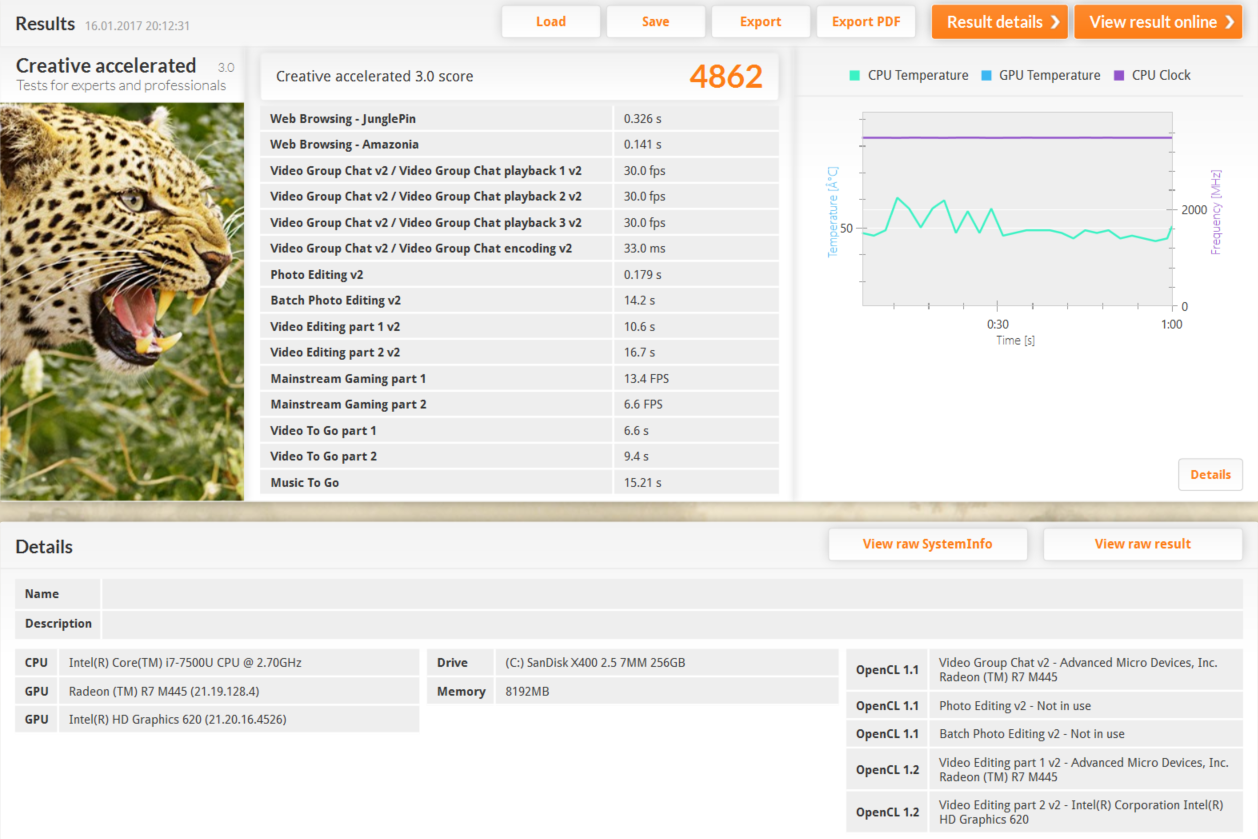
| PCMark 8 Creative Score Accelerated v2 | 4862 puntos | |
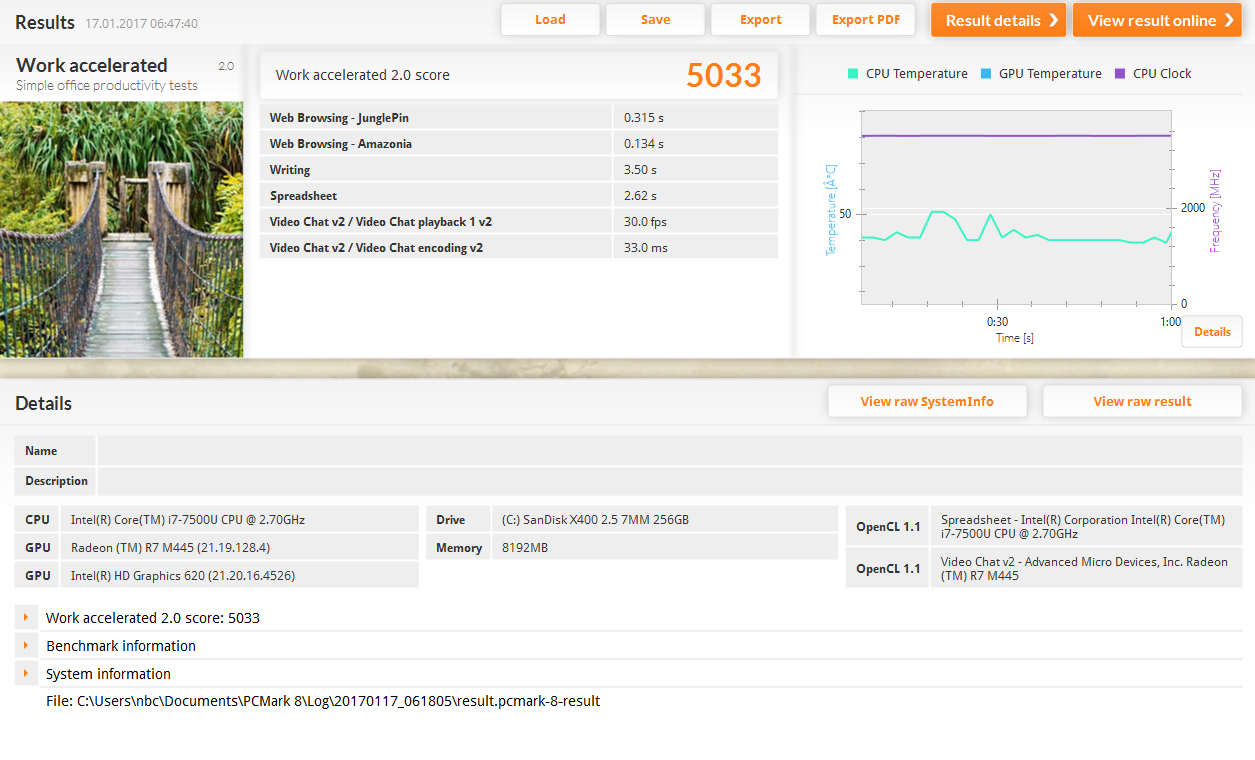
| PCMark 8 Work Score Accelerated v2 | 5033 puntos | |
ayuda | ||
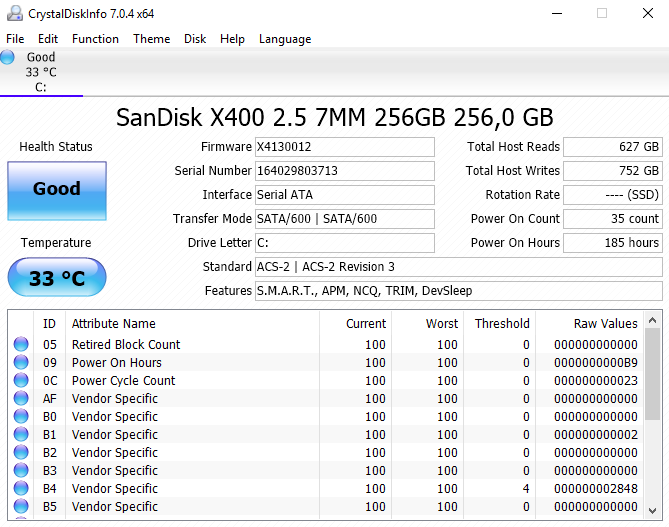
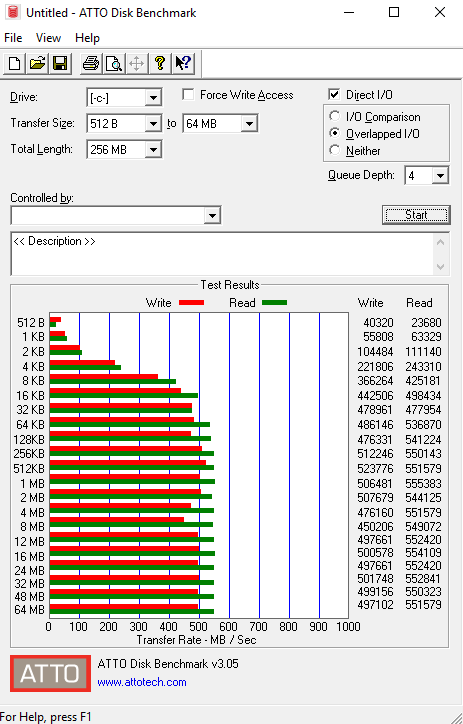
| Dell Inspiron 15 5000 5567-1753 SanDisk X400 SED 256GB, SATA (SD8TB8U-256G) | Acer Aspire E5-575G-549D Toshiba MQ01ABD100 | Lenovo IdeaPad 510-15IKB 80SV0087GE Liteonit CV3-DE256 | Lenovo ThinkPad E470-20H2S00400 SanDisk X400 SED 256GB, SATA (SD8TB8U-256G) | HP Pavilion 15-aw004ng W8Y60EA | HP Pavilion 17-x110ng SanDisk Z400s SD8SNAT-256G | |
|---|---|---|---|---|---|---|
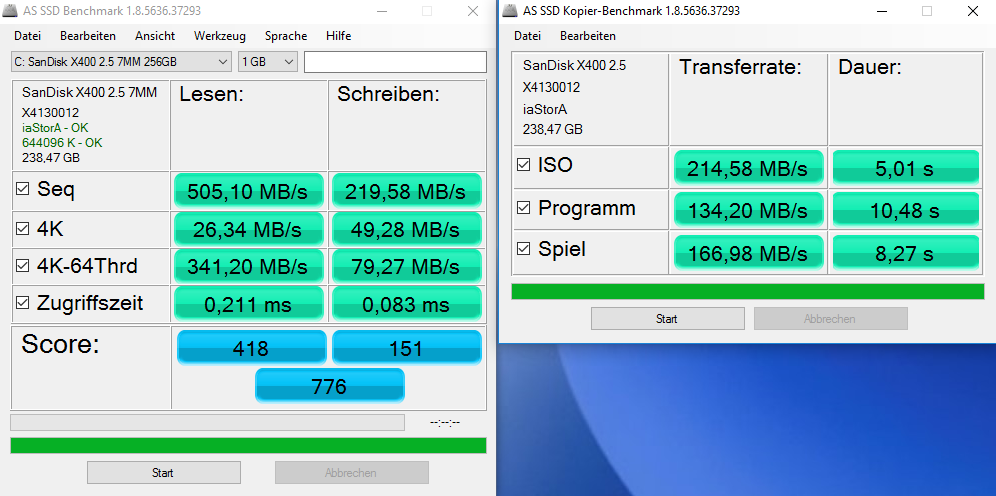
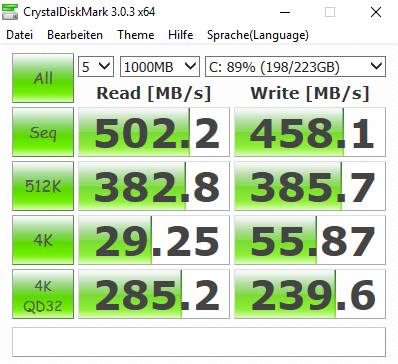
| CrystalDiskMark 3.0 | -93% | 0% | -1% | -31% | -15% | |
| Read Seq (MB/s) | 502 | 95.3 -81% | 469.2 -7% | 476.5 -5% | 503 0% | 500 0% |
| Write Seq (MB/s) | 458.1 | 85.6 -81% | 431.5 -6% | 458.7 0% | 316.6 -31% | 325.1 -29% |
| Read 512 (MB/s) | 382.8 | 29.32 -92% | 338.3 -12% | 346.4 -10% | 261.9 -32% | 290.2 -24% |
| Write 512 (MB/s) | 385.7 | 25.93 -93% | 297.9 -23% | 291.1 -25% | 281.2 -27% | 300.3 -22% |
| Read 4k (MB/s) | 29.25 | 0.366 -99% | 28.68 -2% | 35.15 20% | 17.04 -42% | 11.24 -62% |
| Write 4k (MB/s) | 55.9 | 0.726 -99% | 66.8 19% | 78.8 41% | 46.55 -17% | 86 54% |
| Read 4k QD32 (MB/s) | 285.2 | 0.647 -100% | 364.7 28% | 276 -3% | 125 -56% | 145.4 -49% |
| Write 4k QD32 (MB/s) | 239.6 | 0.722 -100% | 245.9 3% | 178.3 -26% | 131.4 -45% | 272.7 14% |

| 3DMark | |
| 1280x720 Cloud Gate Standard Graphics | |
| Acer Aspire E5-575G-549D | |
| HP Pavilion 15-aw004ng W8Y60EA | |
| Dell Inspiron 15 5000 5567-1753 | |
| Lenovo ThinkPad E470-20H2S00400 | |
| HP Pavilion 17-x110ng | |
| 1920x1080 Fire Strike Graphics | |
| Acer Aspire E5-575G-549D | |
| HP Pavilion 15-aw004ng W8Y60EA | |
| Lenovo ThinkPad E470-20H2S00400 | |
| Dell Inspiron 15 5000 5567-1753 | |
| HP Pavilion 17-x110ng | |
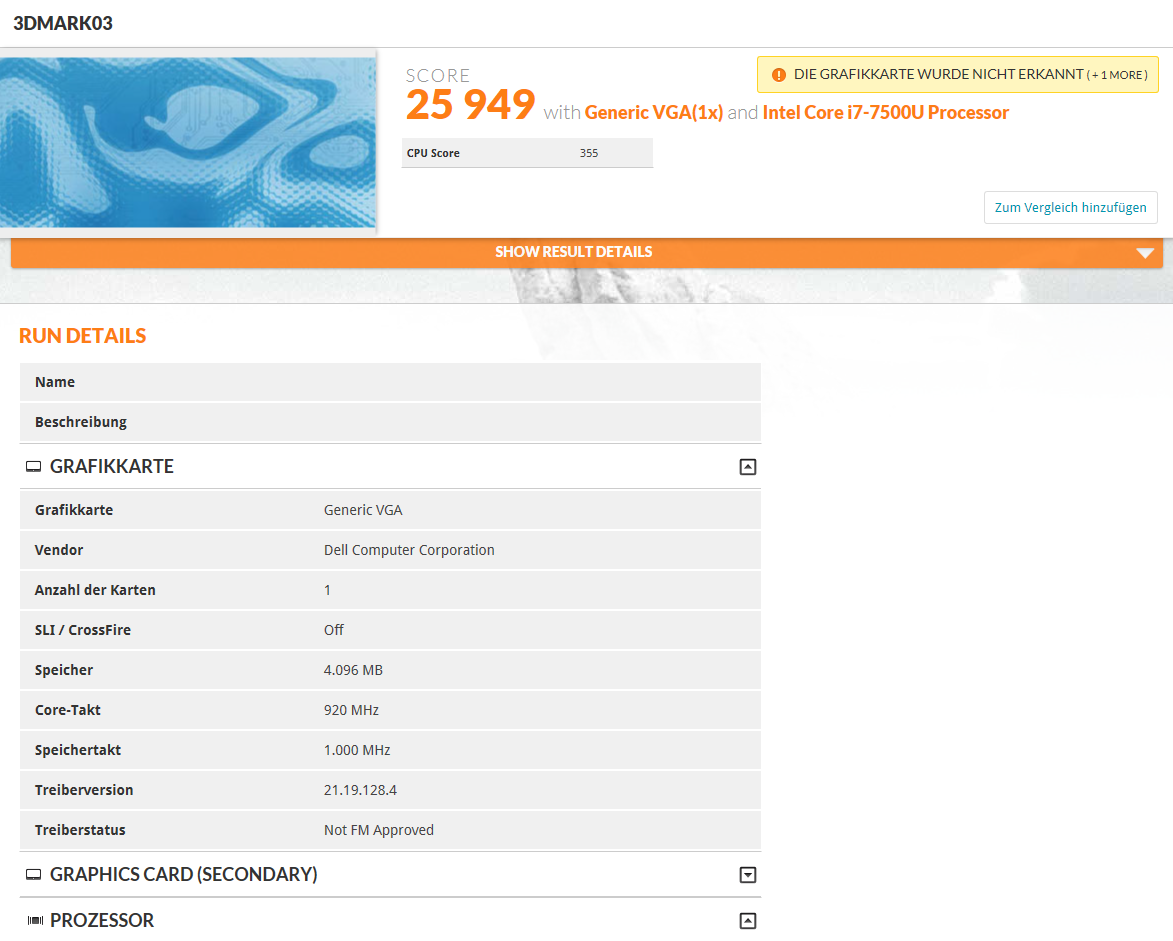
| 3DMark 03 Standard | 25949 puntos | |
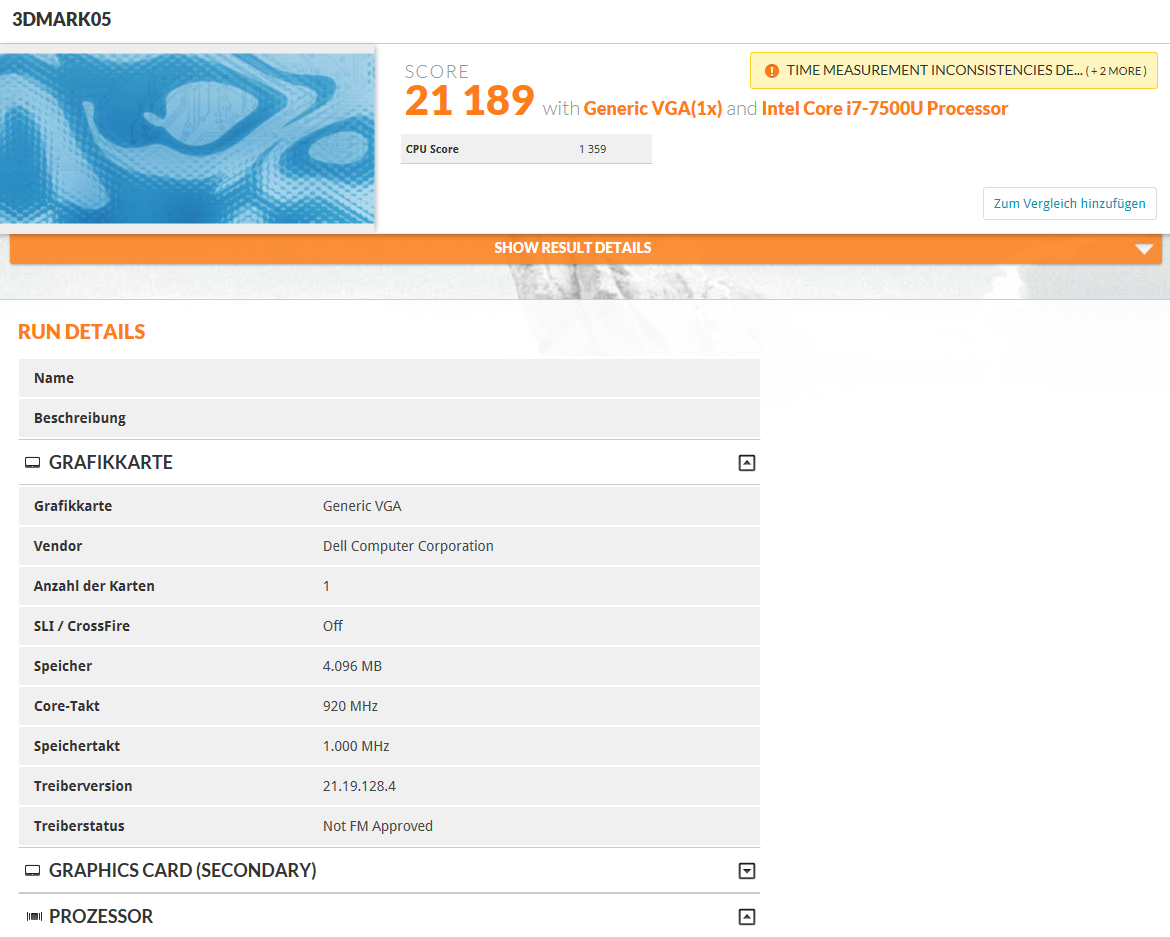
| 3DMark 05 Standard | 21189 puntos | |
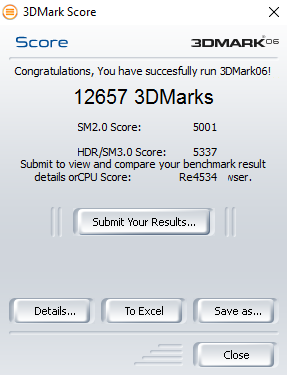
| 3DMark 06 Standard Score | 12657 puntos | |
| 3DMark Vantage P Result | 6872 puntos | |
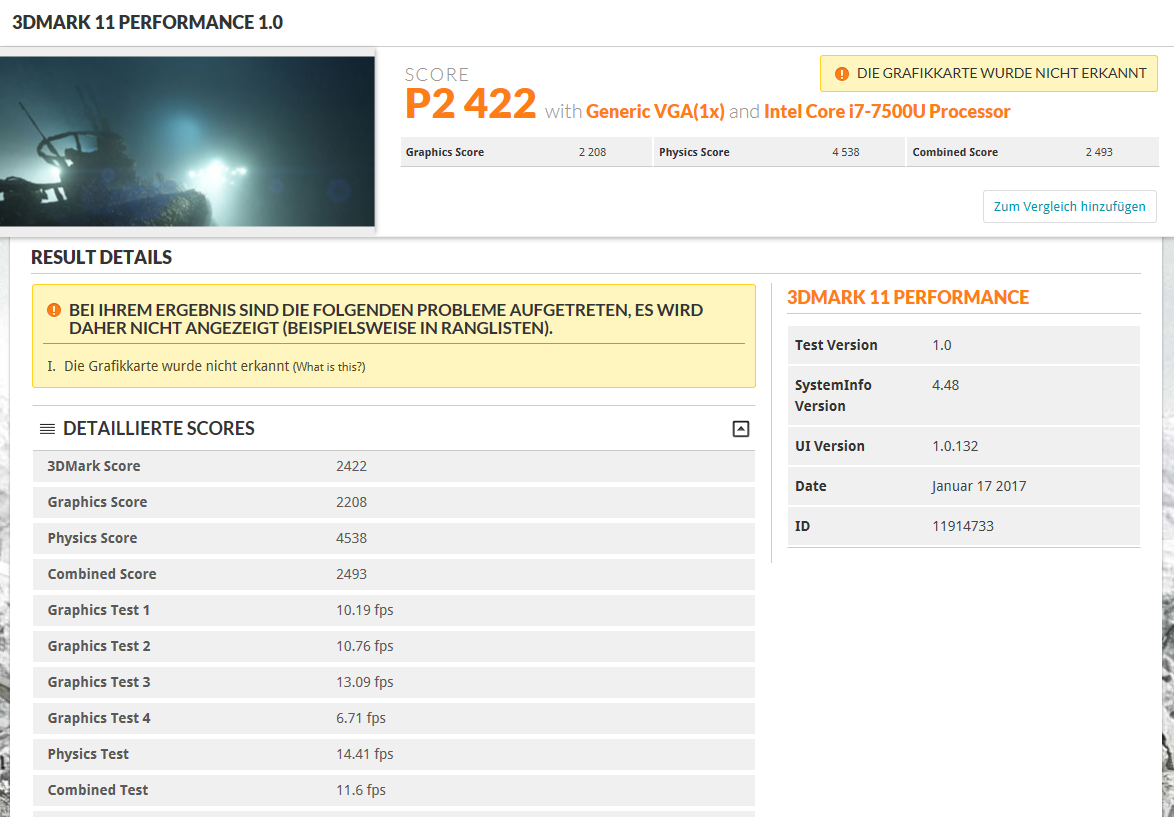
| 3DMark 11 Performance | 2422 puntos | |
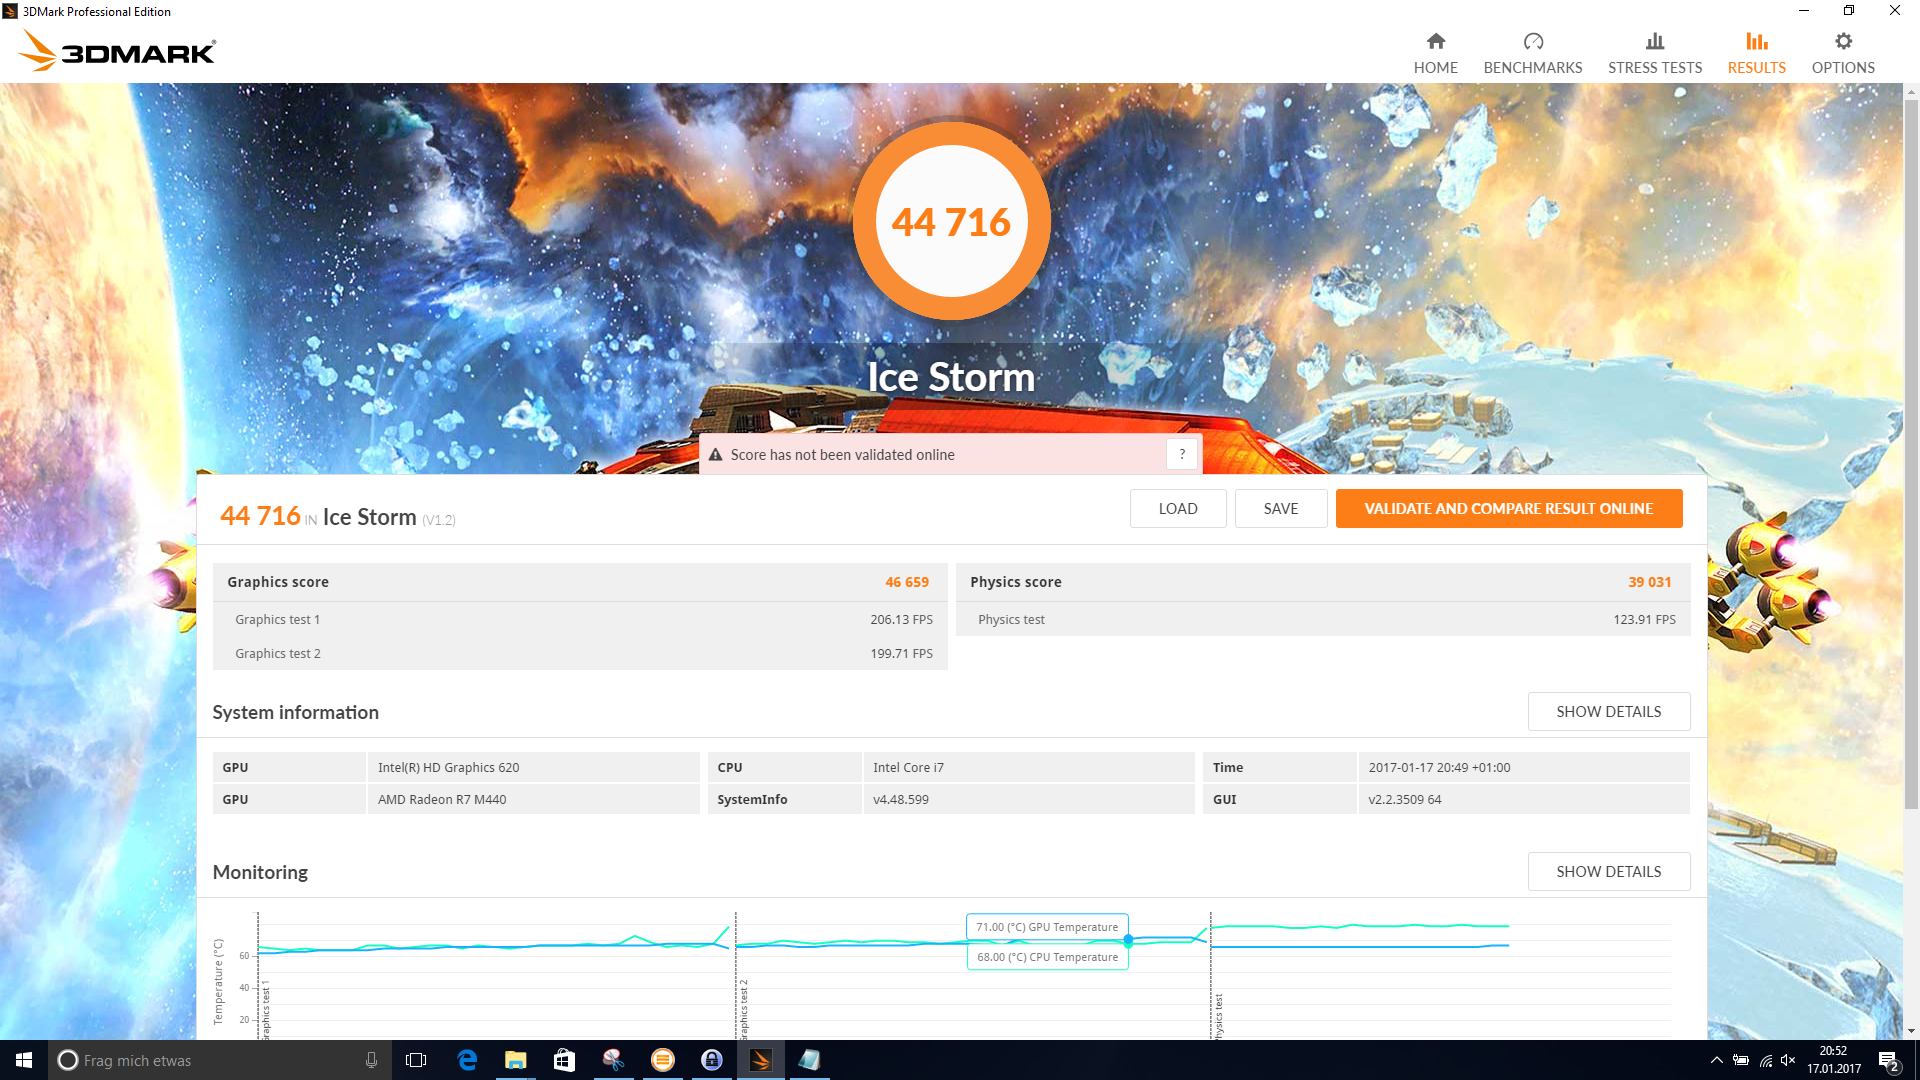
| 3DMark Ice Storm Standard Score | 44716 puntos | |
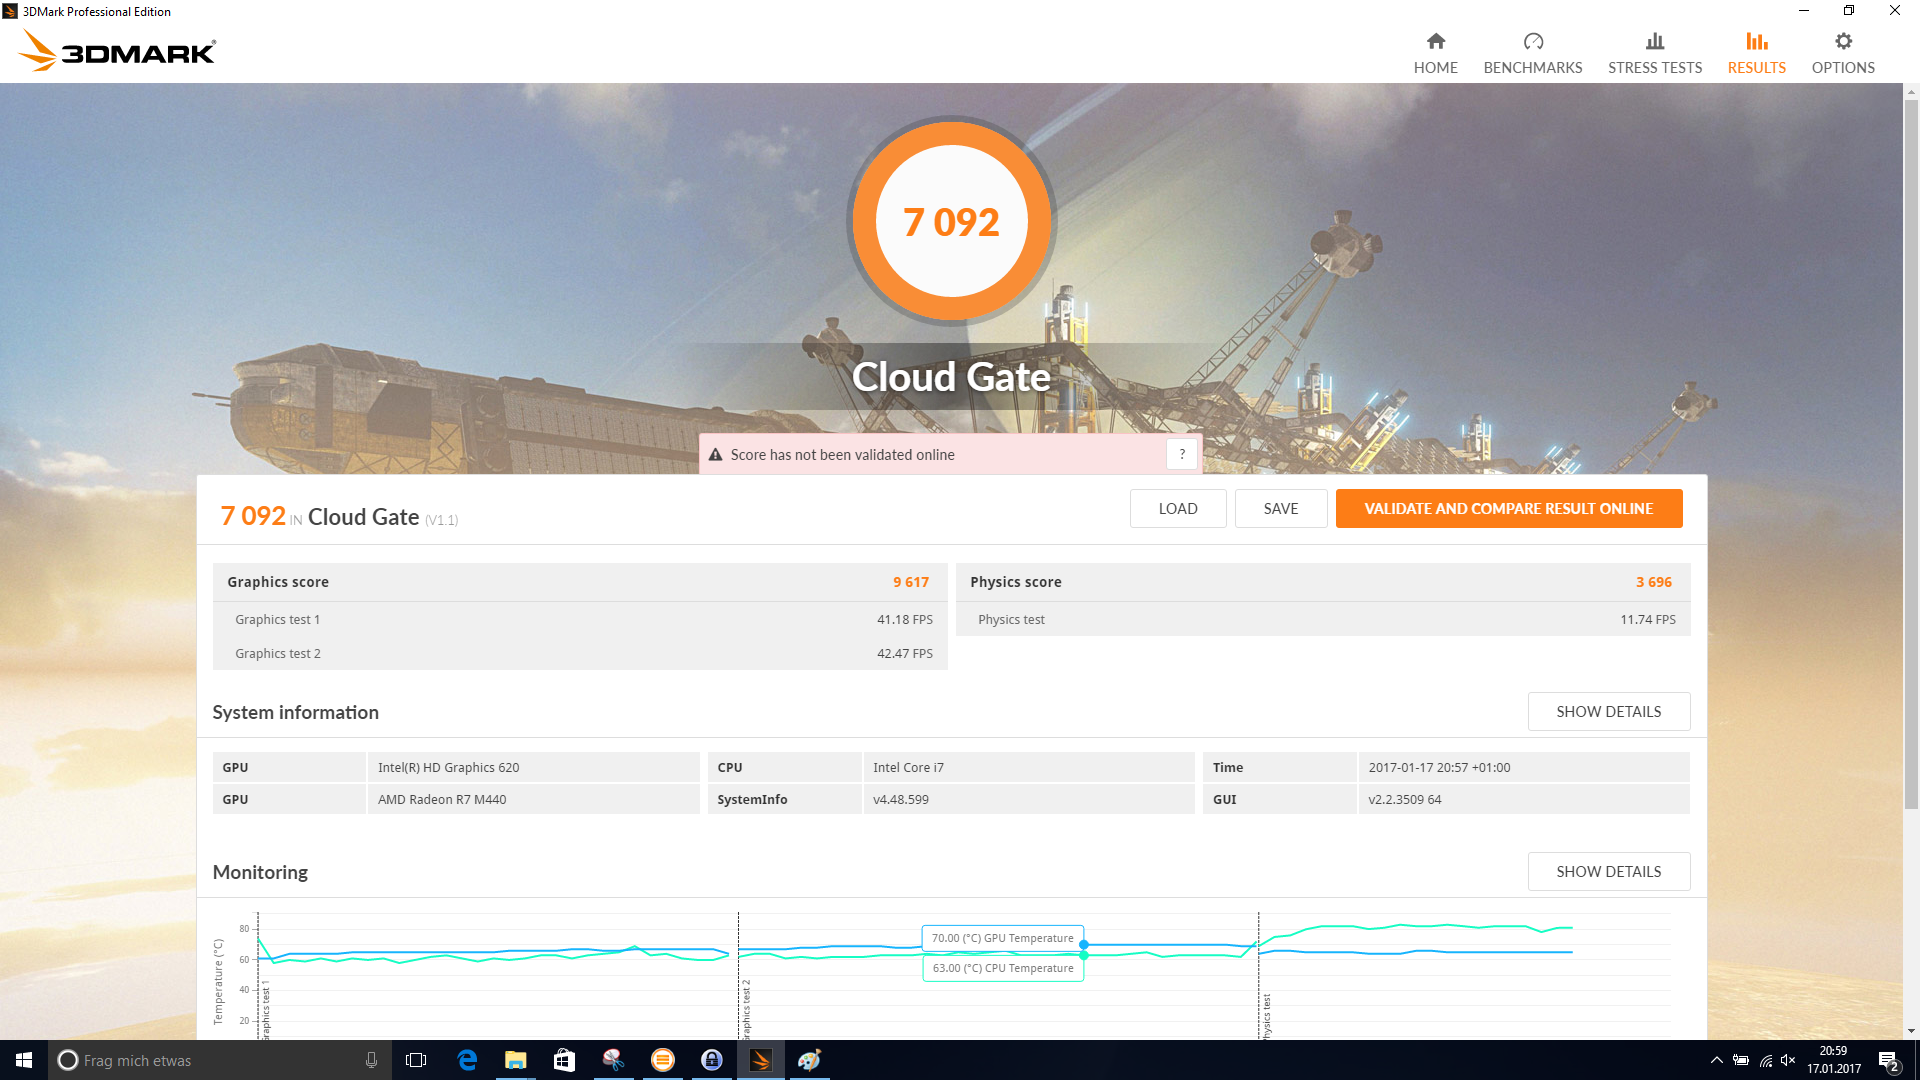
| 3DMark Cloud Gate Standard Score | 7092 puntos | |
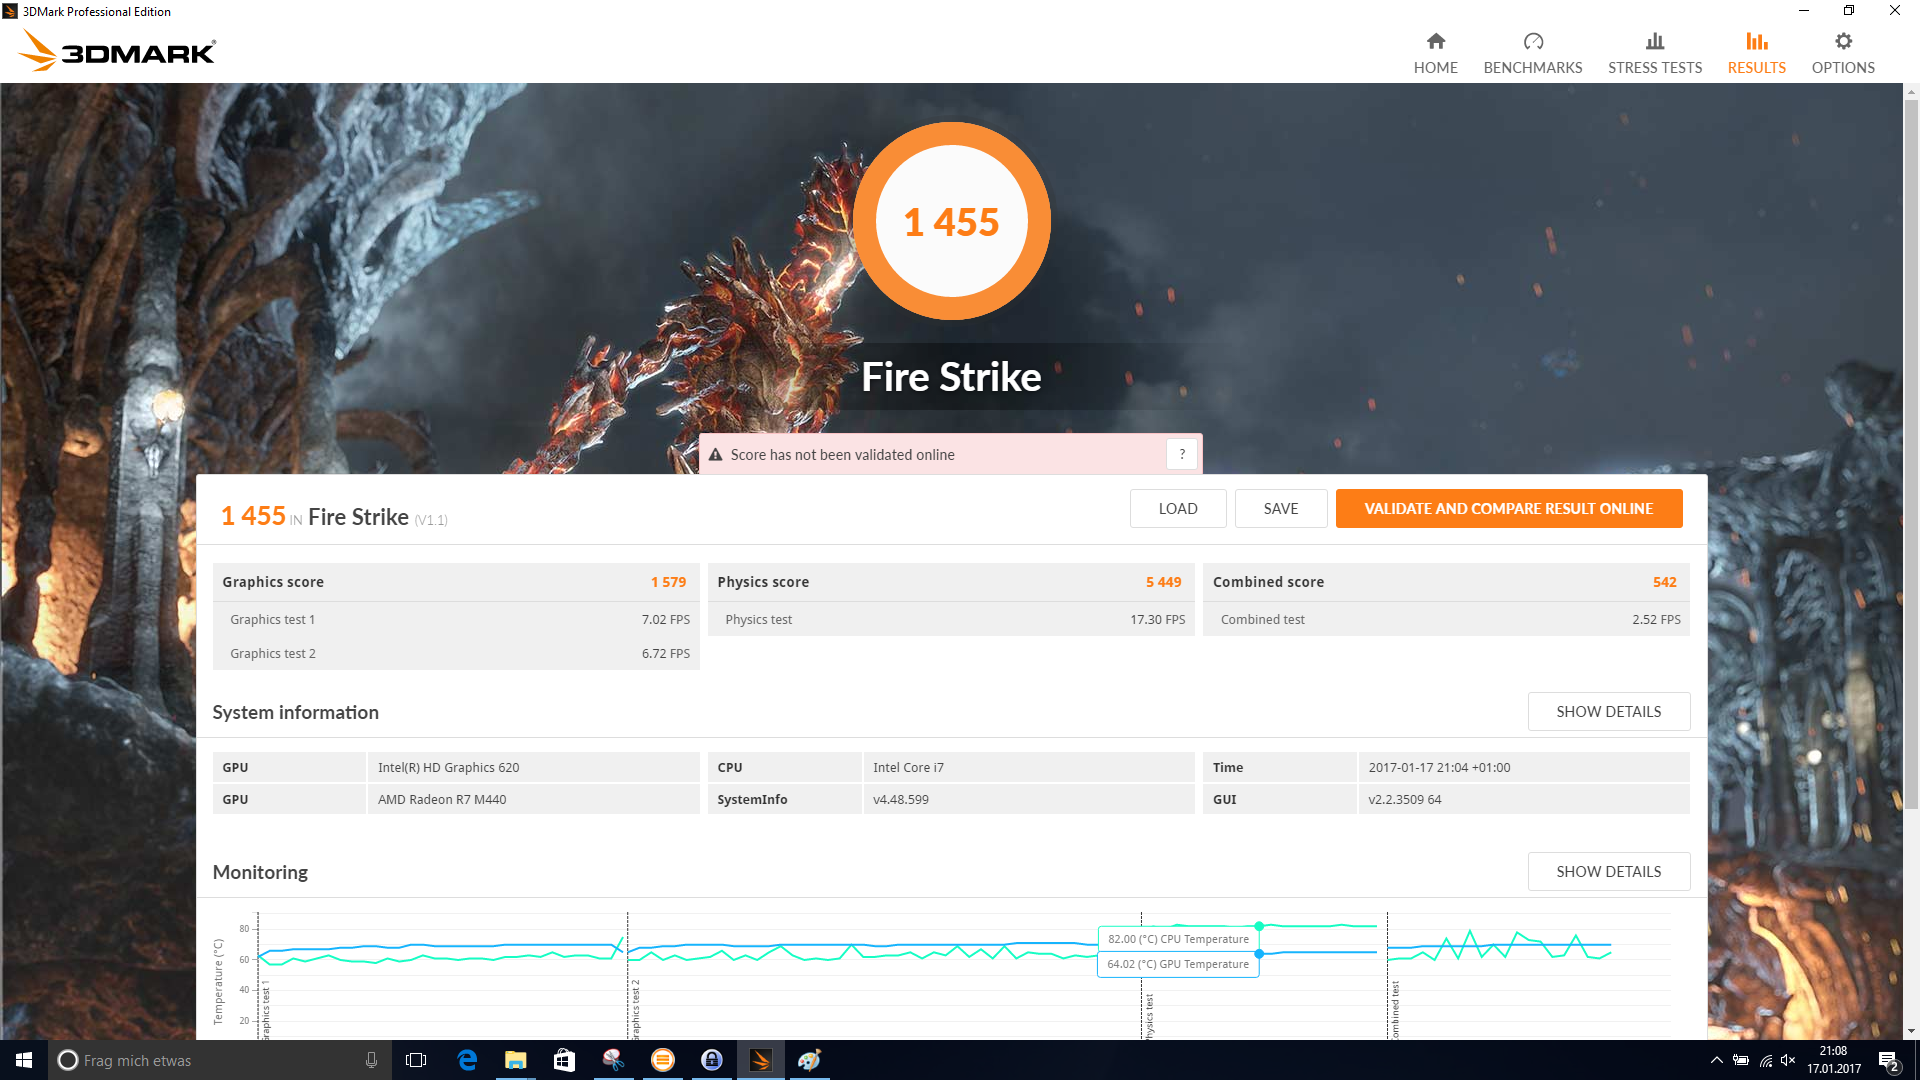
| 3DMark Fire Strike Score | 1455 puntos | |
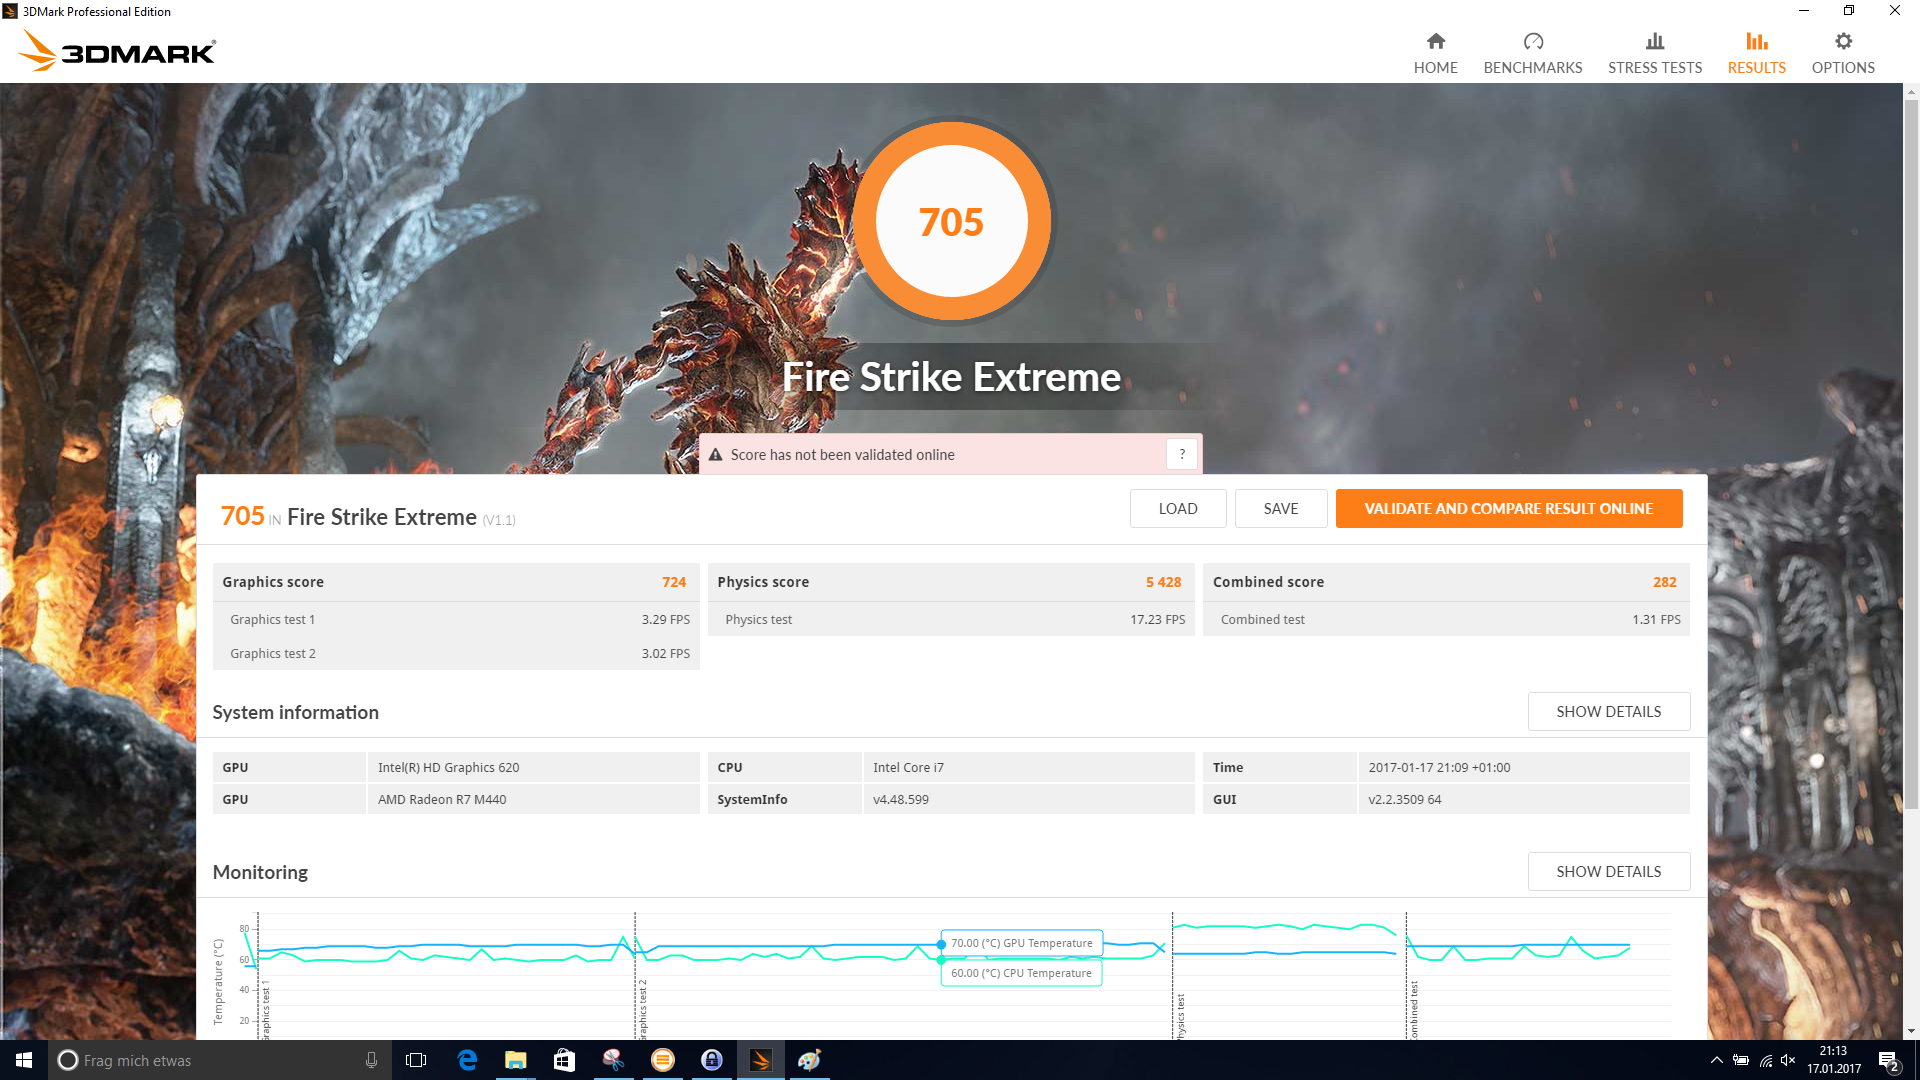
| 3DMark Fire Strike Extreme Score | 705 puntos | |
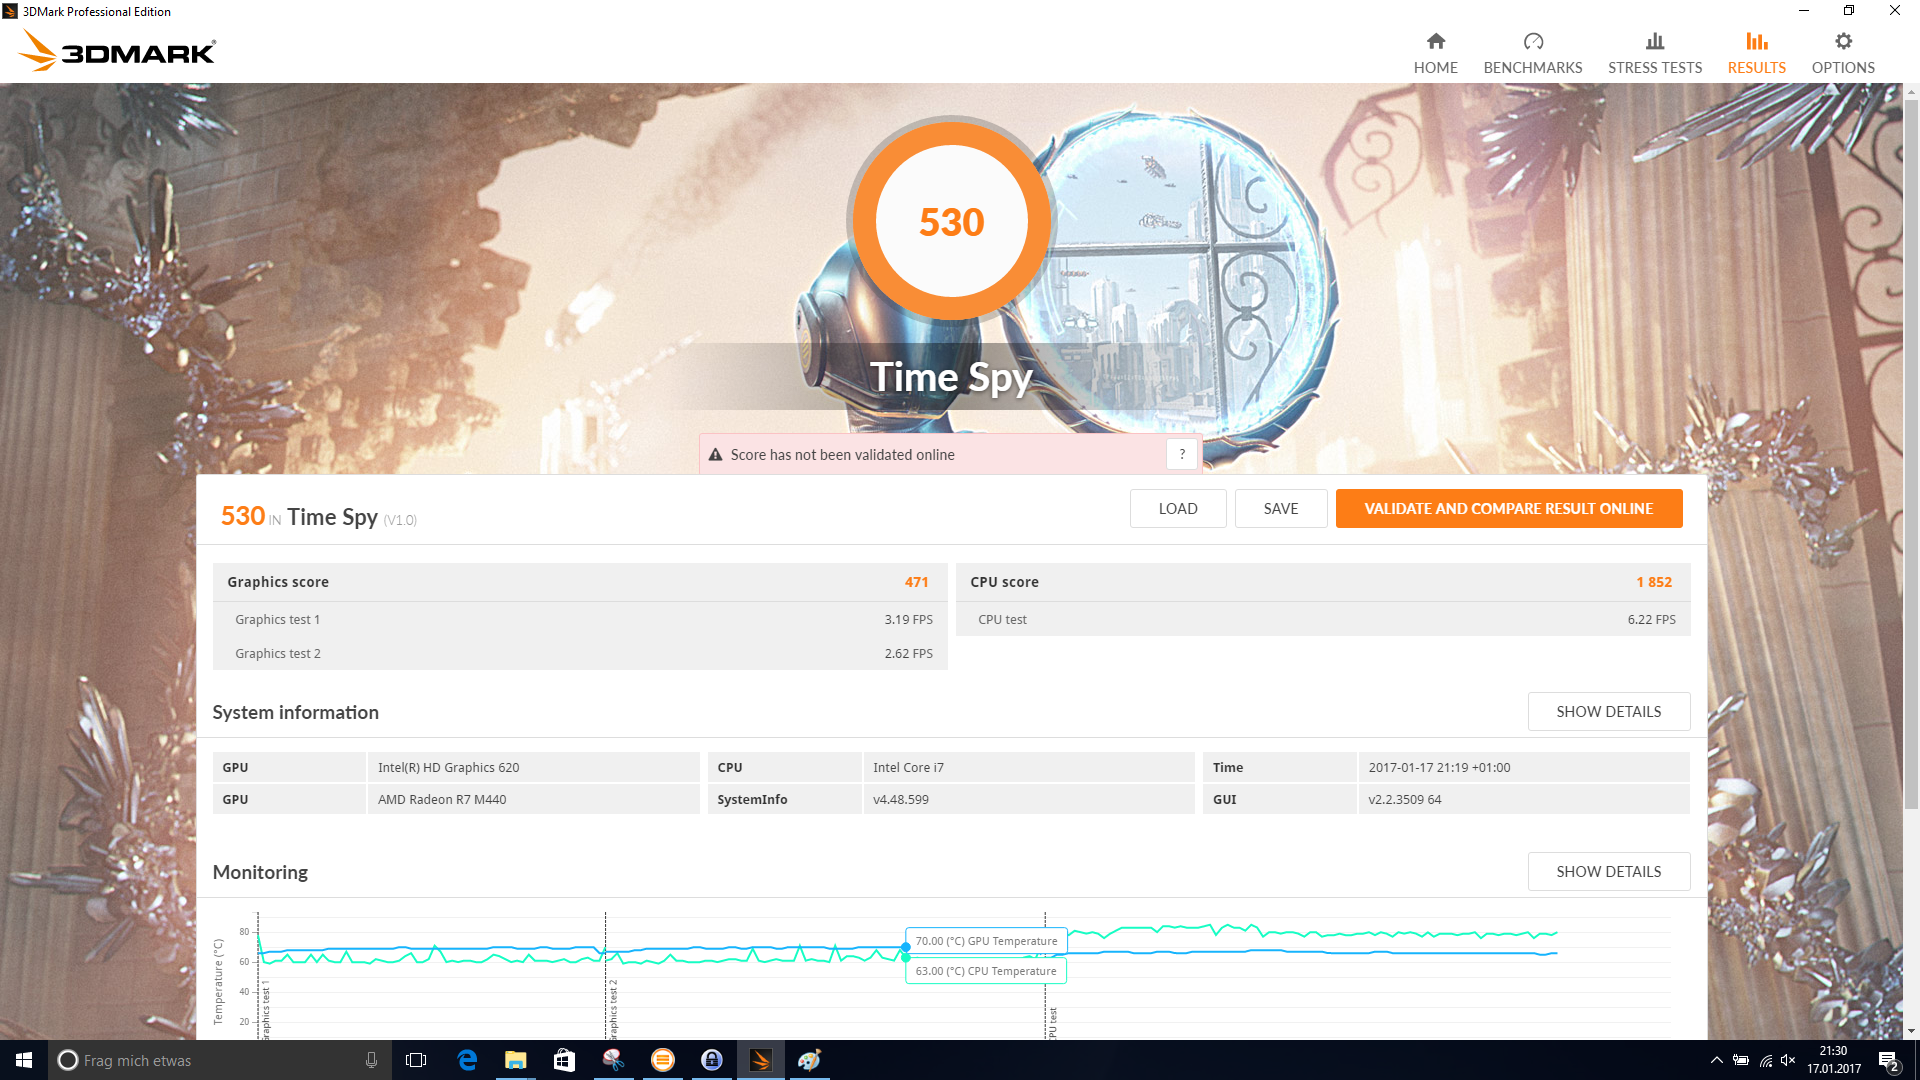
| 3DMark Time Spy Score | 530 puntos | |
ayuda | ||
| BioShock Infinite - 1366x768 Medium Preset | |
| Acer Aspire E5-575G-549D | |
| Dell Inspiron 15 5000 5567-1753 | |
| Lenovo ThinkPad E470-20H2S00400 | |
| Lenovo IdeaPad 510-15IKB 80SV0087GE | |
| HP Pavilion 15-aw004ng W8Y60EA | |
| HP Pavilion 17-x110ng | |
| Rise of the Tomb Raider - 1366x768 Medium Preset AF:2x | |
| Acer Aspire E5-575G-549D | |
| Dell Inspiron 15 5000 5567-1753 | |
| HP Pavilion 15-aw004ng W8Y60EA | |
| HP Pavilion 17-x110ng | |
| Battlefield 4 - 1366x768 Medium Preset | |
| Acer Aspire E5-575G-549D | |
| Dell Inspiron 15 5000 5567-1753 | |
| Lenovo ThinkPad E470-20H2S00400 | |
| HP Pavilion 15-aw004ng W8Y60EA | |
| HP Pavilion 17-x110ng | |
| bajo | medio | alto | ultra | |
|---|---|---|---|---|
| BioShock Infinite (2013) | 98.7 | 53.9 | 44.5 | 13.8 |
| Battlefield 4 (2013) | 74.3 | 49.6 | 32.7 | 11.7 |
| Sims 4 (2014) | 132.9 | 66.9 | 28.8 | 27.4 |
| GTA V (2015) | 50.7 | 43.7 | 12.2 | |
| The Witcher 3 (2015) | 30.8 | 18.2 | 9.6 | 4.7 |
| Rainbow Six Siege (2015) | 64.4 | 37.8 | 20.1 | 13.5 |
| Rise of the Tomb Raider (2016) | 29.6 | 15.1 | 8.5 | 6.7 |
| XCOM 2 (2016) | 22.8 | 7.9 | 5.2 | 4.9 |
| Far Cry Primal (2016) | 27 | 12 | 10 | |
| The Division (2016) | 32.4 | 24.5 | 9.6 | 6.7 |
| Doom (2016) | 35 | 28 | 14 | |
| Overwatch (2016) | 75.3 | 52.6 | 23.5 | 14.1 |
| Deus Ex Mankind Divided (2016) | 21 | 14 | 7 | |
| FIFA 17 (2016) | 61.8 | 59.7 | 34.6 | 29.4 |
| Battlefield 1 (2016) | 40 | 28 | 13 | 12 |
| Farming Simulator 17 (2016) | 64.2 | 42.9 | 16.9 | 10 |
| Titanfall 2 (2016) | 57 | 41 | 17 | 16 |
| Call of Duty Infinite Warfare (2016) | 27 | 24 | 16 | |
| Dishonored 2 (2016) | 23.4 | 18.6 | 12.2 | 9.9 |
| Watch Dogs 2 (2016) | 30.2 | 24.1 | 11.5 | |
| Resident Evil 7 (2017) | 55.3 | 24.1 | 13.9 |
Ruido
| Ocioso |
| 30.6 / 30.6 / 30.6 dB(A) |
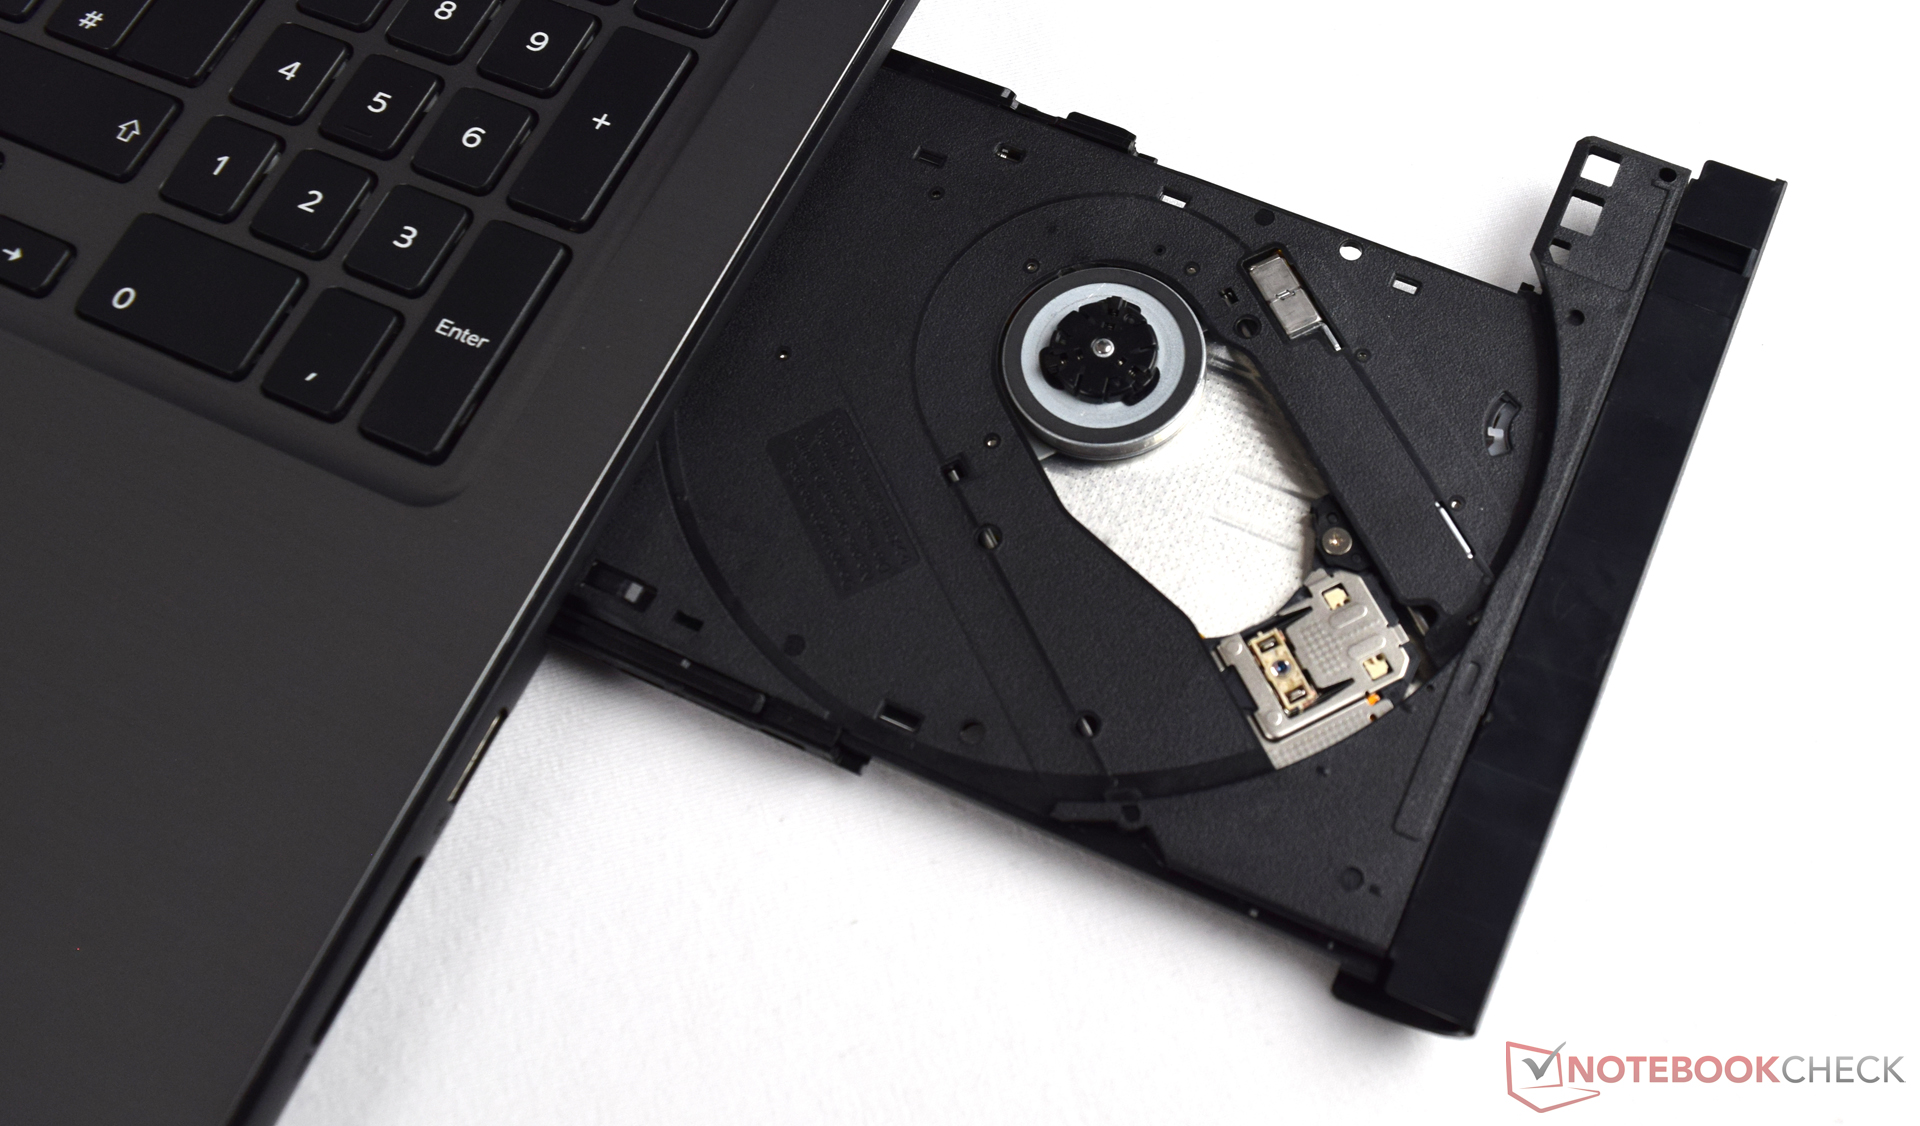
| DVD |
| 36.9 / dB(A) |
| Carga |
| 41.9 / 41.8 dB(A) |
 | ||
30 dB silencioso 40 dB(A) audible 50 dB(A) ruidosamente alto |
||
min: | ||
| Dell Inspiron 15 5000 5567-1753 i7-7500U, Radeon R7 M445 | Acer Aspire E5-575G-549D i5-7200U, GeForce GTX 950M | Lenovo IdeaPad 510-15IKB 80SV0087GE i7-7500U, GeForce 940MX | Lenovo ThinkPad E470-20H2S00400 i5-7200U, GeForce 940MX | HP Pavilion 15-aw004ng W8Y60EA A10-9600P, Radeon R8 M445DX | HP Pavilion 17-x110ng i5-7200U, Radeon R7 M440 | |
|---|---|---|---|---|---|---|
| Noise | 5% | 1% | 7% | -2% | 2% | |
| apagado / medio ambiente * (dB) | 30.6 | 28.9 6% | 31.6 -3% | 29 5% | 31.2 -2% | 29 5% |
| Idle Minimum * (dB) | 30.6 | 30.8 -1% | 32.6 -7% | 29 5% | 31.7 -4% | 31 -1% |
| Idle Average * (dB) | 30.6 | 30.8 -1% | 32.6 -7% | 29 5% | 31.9 -4% | 31 -1% |
| Idle Maximum * (dB) | 30.6 | 30.8 -1% | 32.6 -7% | 29 5% | 31.9 -4% | 31 -1% |
| Load Average * (dB) | 41.9 | 33.4 20% | 35.3 16% | 35.6 15% | 41 2% | 33.8 19% |
| Load Maximum * (dB) | 41.8 | 40.1 4% | 37.1 11% | 38.5 8% | 42.7 -2% | 44.8 -7% |
* ... más pequeño es mejor
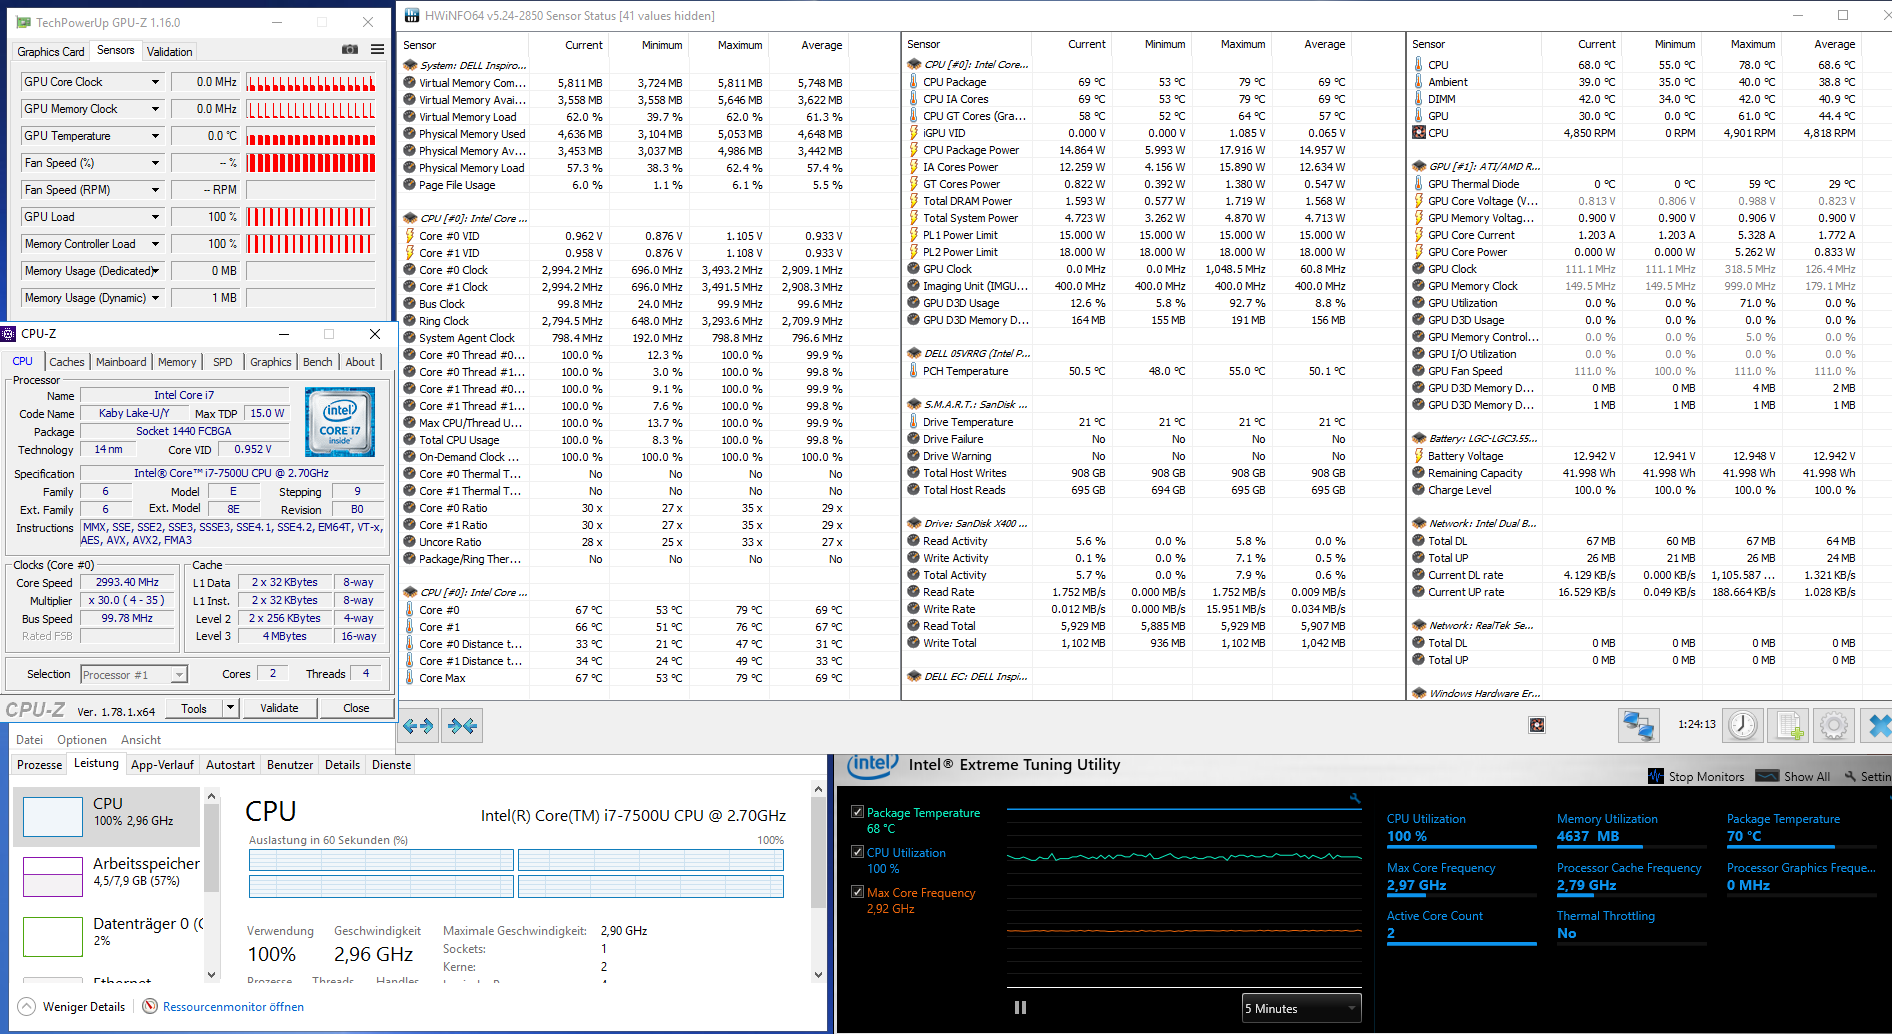
(±) La temperatura máxima en la parte superior es de 41.6 °C / 107 F, frente a la media de 36.8 °C / 98 F, que oscila entre 21 y 71 °C para la clase Multimedia.
(-) El fondo se calienta hasta un máximo de 51.3 °C / 124 F, frente a la media de 39.1 °C / 102 F
(+) En reposo, la temperatura media de la parte superior es de 25.6 °C / 78# F, frente a la media del dispositivo de 31.3 °C / 88 F.
(+) El reposamanos y el panel táctil están a una temperatura inferior a la de la piel, con un máximo de 27.9 °C / 82.2 F y, por tanto, son fríos al tacto.
(±) La temperatura media de la zona del reposamanos de dispositivos similares fue de 28.7 °C / 83.7 F (+0.8 °C / 1.5 F).
| Dell Inspiron 15 5000 5567-1753 i7-7500U, Radeon R7 M445 | Acer Aspire E5-575G-549D i5-7200U, GeForce GTX 950M | Lenovo IdeaPad 510-15IKB 80SV0087GE i7-7500U, GeForce 940MX | Lenovo ThinkPad E470-20H2S00400 i5-7200U, GeForce 940MX | HP Pavilion 15-aw004ng W8Y60EA A10-9600P, Radeon R8 M445DX | HP Pavilion 17-x110ng i5-7200U, Radeon R7 M440 | |
|---|---|---|---|---|---|---|
| Heat | -10% | 19% | 5% | 18% | 15% | |
| Maximum Upper Side * (°C) | 41.6 | 48.1 -16% | 38.3 8% | 43.8 -5% | 33.4 20% | 40.3 3% |
| Maximum Bottom * (°C) | 51.3 | 60.8 -19% | 36 30% | 53 -3% | 32.9 36% | 46.1 10% |
| Idle Upper Side * (°C) | 29.4 | 30.8 -5% | 24.9 15% | 25.9 12% | 27.7 6% | 23.8 19% |
| Idle Bottom * (°C) | 32.4 | 31.9 2% | 25.6 21% | 27.1 16% | 29.4 9% | 23.4 28% |
* ... más pequeño es mejor
Dell Inspiron 15 5000 5567-1753 análisis de audio
(±) | la sonoridad del altavoz es media pero buena (72 dB)
Graves 100 - 315 Hz
(-) | casi sin bajos - de media 19.4% inferior a la mediana
(±) | la linealidad de los graves es media (8.9% delta a frecuencia anterior)
Medios 400 - 2000 Hz
(±) | medias más altas - de media 5.1% más altas que la mediana
(±) | la linealidad de los medios es media (10.2% delta respecto a la frecuencia anterior)
Altos 2 - 16 kHz
(+) | máximos equilibrados - a sólo 2.4% de la mediana
(+) | los máximos son lineales (6.6% delta a la frecuencia anterior)
Total 100 - 16.000 Hz
(±) | la linealidad del sonido global es media (18.6% de diferencia con la mediana)
En comparación con la misma clase
» 57% de todos los dispositivos probados de esta clase eran mejores, 8% similares, 35% peores
» El mejor tuvo un delta de 5%, la media fue 17%, el peor fue ###max##%
En comparación con todos los dispositivos probados
» 42% de todos los dispositivos probados eran mejores, 8% similares, 50% peores
» El mejor tuvo un delta de 4%, la media fue 23%, el peor fue ###max##%
Apple MacBook 12 (Early 2016) 1.1 GHz análisis de audio
(+) | los altavoces pueden reproducir a un volumen relativamente alto (#83.6 dB)
Graves 100 - 315 Hz
(±) | lubina reducida - en promedio 11.3% inferior a la mediana
(±) | la linealidad de los graves es media (14.2% delta a frecuencia anterior)
Medios 400 - 2000 Hz
(+) | medios equilibrados - a sólo 2.4% de la mediana
(+) | los medios son lineales (5.5% delta a la frecuencia anterior)
Altos 2 - 16 kHz
(+) | máximos equilibrados - a sólo 2% de la mediana
(+) | los máximos son lineales (4.5% delta a la frecuencia anterior)
Total 100 - 16.000 Hz
(+) | el sonido global es lineal (10.2% de diferencia con la mediana)
En comparación con la misma clase
» 7% de todos los dispositivos probados de esta clase eran mejores, 2% similares, 90% peores
» El mejor tuvo un delta de 5%, la media fue 18%, el peor fue ###max##%
En comparación con todos los dispositivos probados
» 5% de todos los dispositivos probados eran mejores, 1% similares, 94% peores
» El mejor tuvo un delta de 4%, la media fue 23%, el peor fue ###max##%
| Off / Standby | |
| Ocioso | |
| Carga |
|
Clave:
min: | |
| Dell Inspiron 15 5000 5567-1753 i7-7500U, Radeon R7 M445, SanDisk X400 SED 256GB, SATA (SD8TB8U-256G) | Acer Aspire E5-575G-549D i5-7200U, GeForce GTX 950M, Toshiba MQ01ABD100 | Lenovo IdeaPad 510-15IKB 80SV0087GE i7-7500U, GeForce 940MX, Liteonit CV3-DE256 | Lenovo ThinkPad E470-20H2S00400 i5-7200U, GeForce 940MX, SanDisk X400 SED 256GB, SATA (SD8TB8U-256G) | HP Pavilion 15-aw004ng W8Y60EA A10-9600P, Radeon R8 M445DX, | HP Pavilion 17-x110ng i5-7200U, Radeon R7 M440, SanDisk Z400s SD8SNAT-256G | |
|---|---|---|---|---|---|---|
| Power Consumption | -32% | -2% | 10% | -18% | -59% | |
| Idle Minimum * (Watt) | 4 | 6 -50% | 3.9 2% | 2.7 32% | 5.5 -38% | 7.7 -93% |
| Idle Average * (Watt) | 5.4 | 8.1 -50% | 7.4 -37% | 5.5 -2% | 8.2 -52% | 14 -159% |
| Idle Maximum * (Watt) | 8.3 | 9.8 -18% | 9.5 -14% | 6.5 22% | 9.5 -14% | 15.1 -82% |
| Load Average * (Watt) | 54 | 52.5 3% | 41 24% | 44.2 18% | 44.5 18% | 33 39% |
| Load Maximum * (Watt) | 55.4 | 81.6 -47% | 48 13% | 65.2 -18% | 58 -5% | 54.6 1% |
* ... más pequeño es mejor
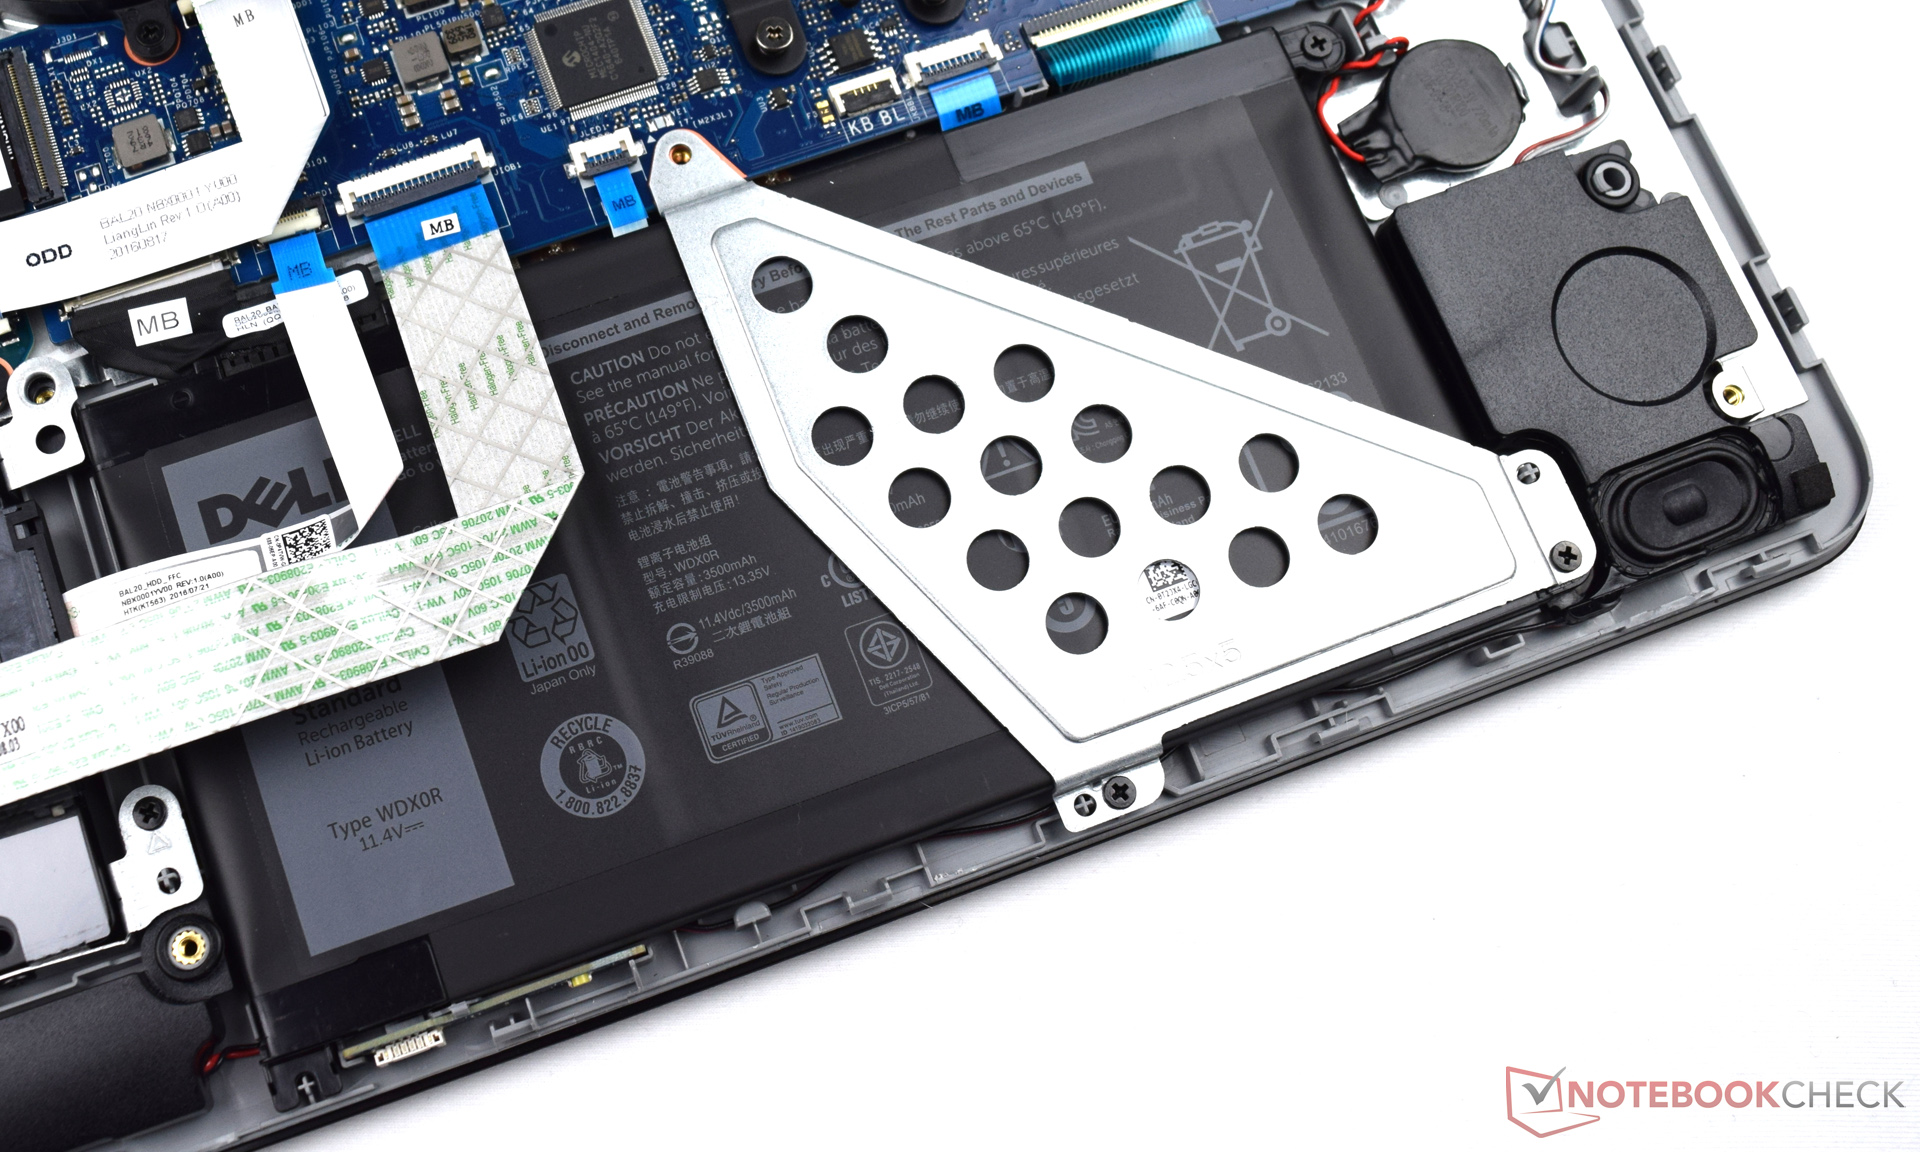
| Dell Inspiron 15 5000 5567-1753 i7-7500U, Radeon R7 M445, 42 Wh | Acer Aspire E5-575G-549D i5-7200U, GeForce GTX 950M, 62 Wh | Lenovo IdeaPad 510-15IKB 80SV0087GE i7-7500U, GeForce 940MX, 30 Wh | Lenovo ThinkPad E470-20H2S00400 i5-7200U, GeForce 940MX, 45 Wh | HP Pavilion 15-aw004ng W8Y60EA A10-9600P, Radeon R8 M445DX, 41 Wh | HP Pavilion 17-x110ng i5-7200U, Radeon R7 M440, 41 Wh | |
|---|---|---|---|---|---|---|
| Duración de Batería | 24% | -34% | 47% | -15% | -5% | |
| Reader / Idle (h) | 7.8 | 12.8 64% | 17.4 123% | 9.3 19% | 8.8 13% | |
| H.264 (h) | 5.3 | 7.7 45% | 8.4 58% | 3.2 -40% | 4.8 -9% | |
| WiFi v1.3 (h) | 7 | 7.5 7% | 4.6 -34% | 5.4 -23% | 4.3 -39% | 5.8 -17% |
| Load (h) | 1.6 | 1.3 -19% | 2.1 31% | 1.6 0% | 1.5 -6% |
Pro
Contra

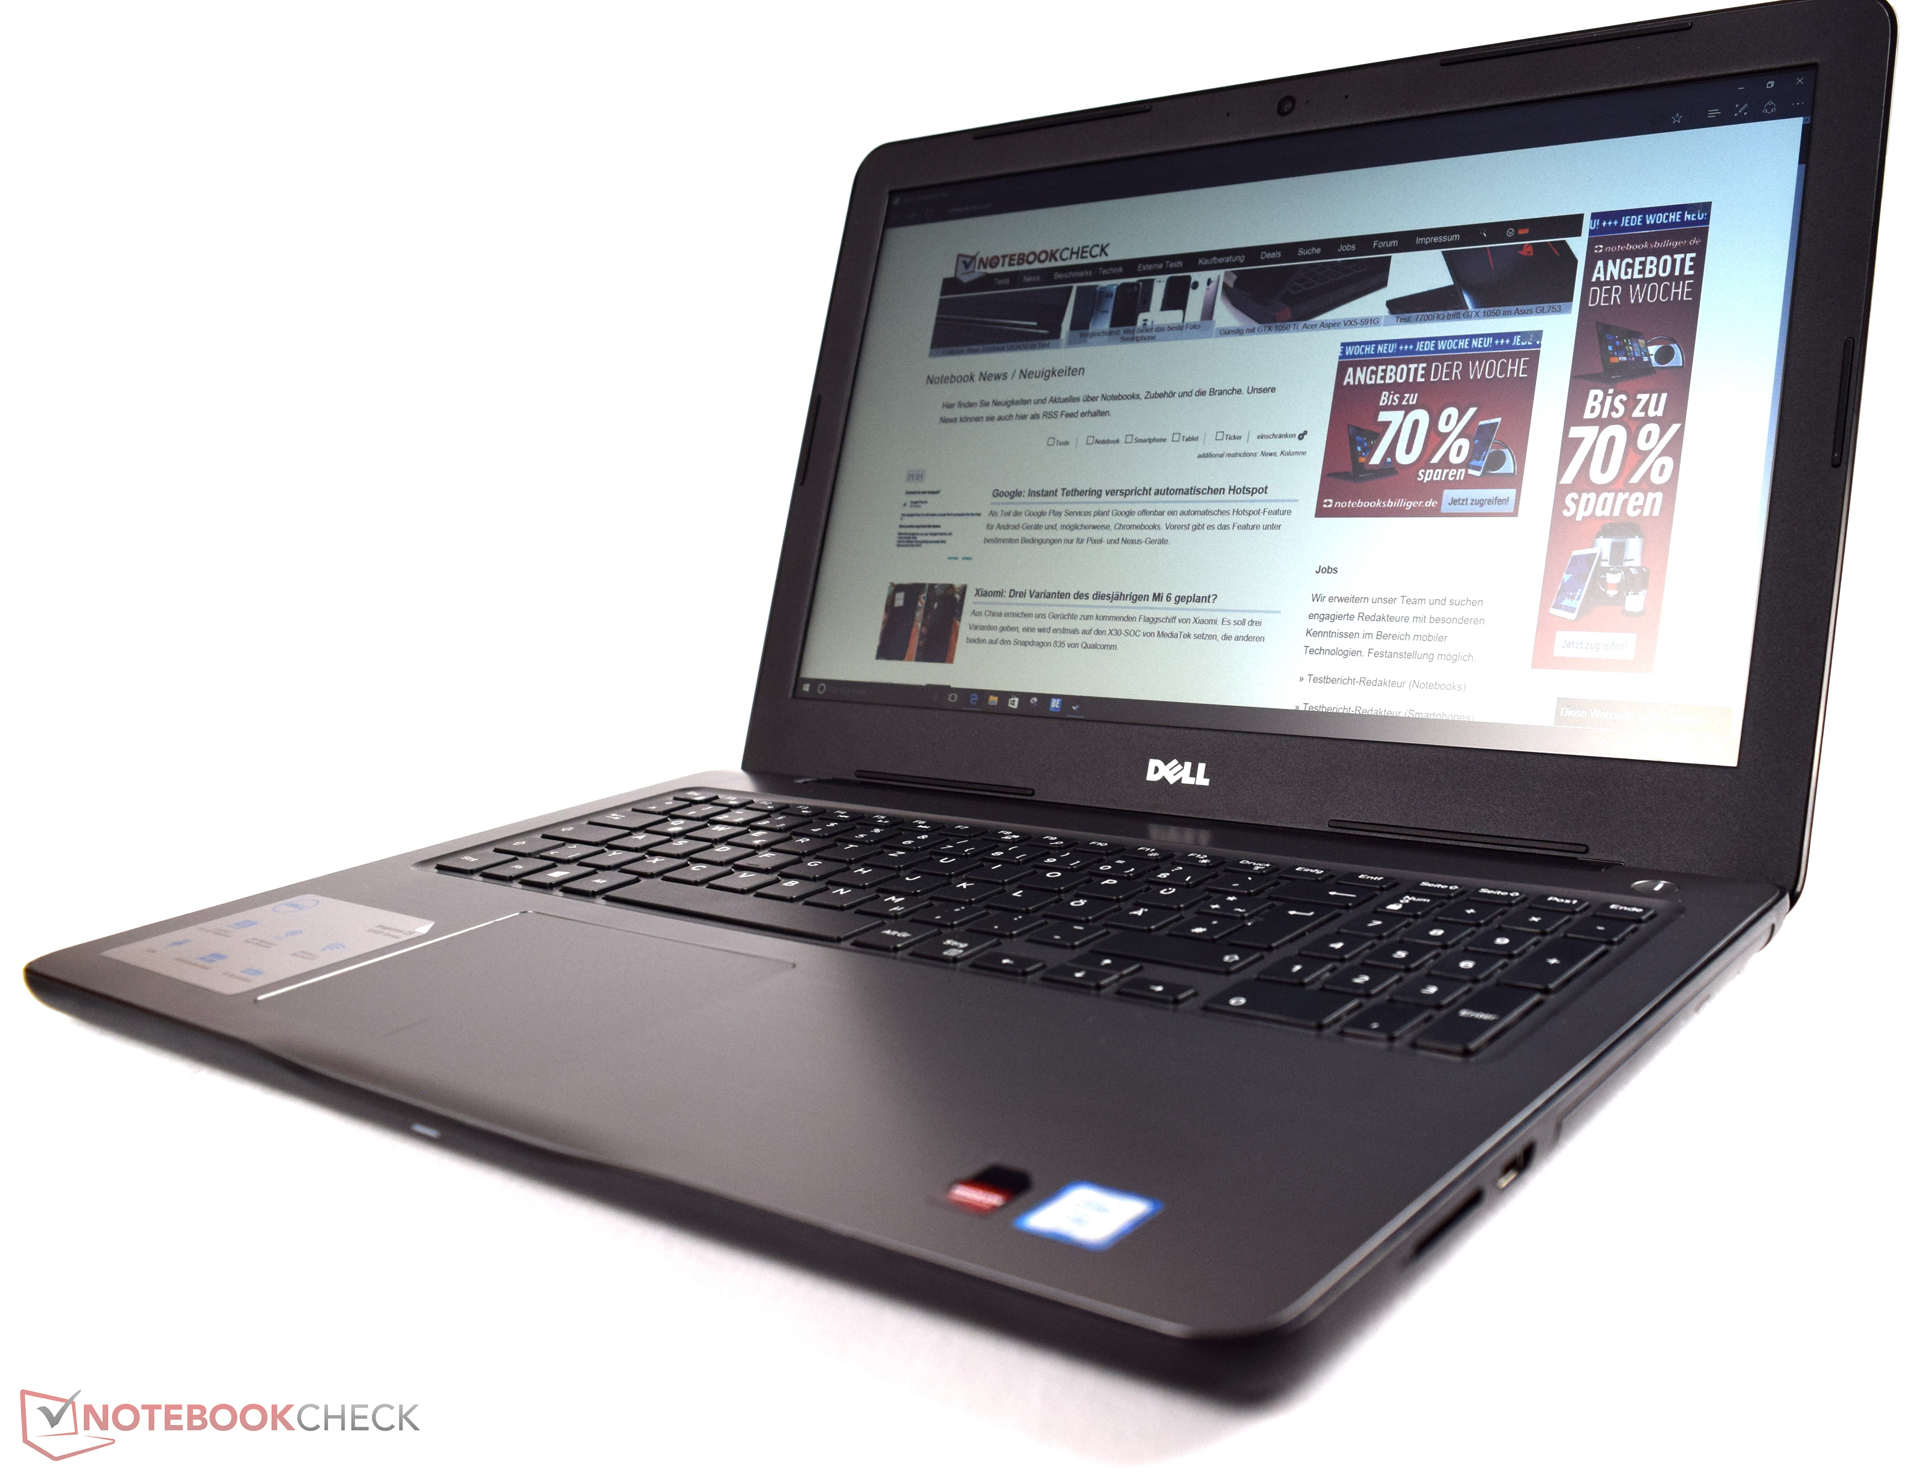
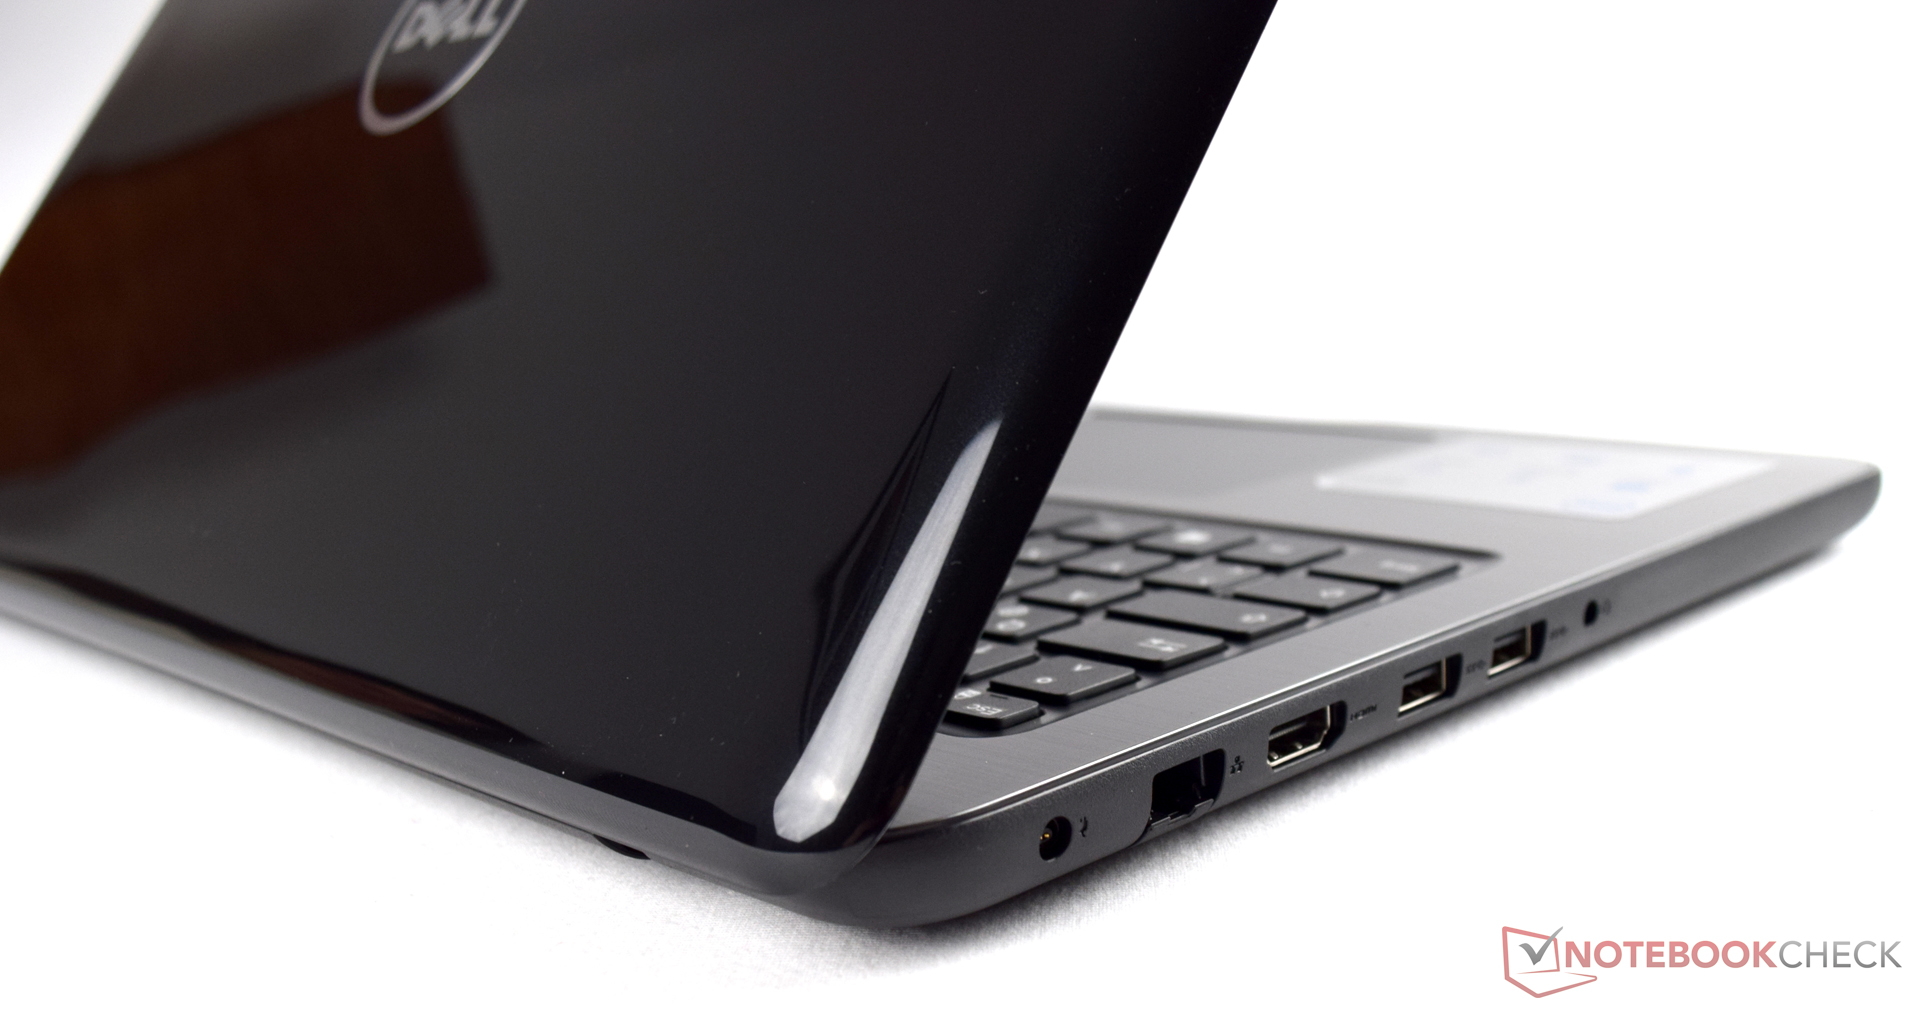
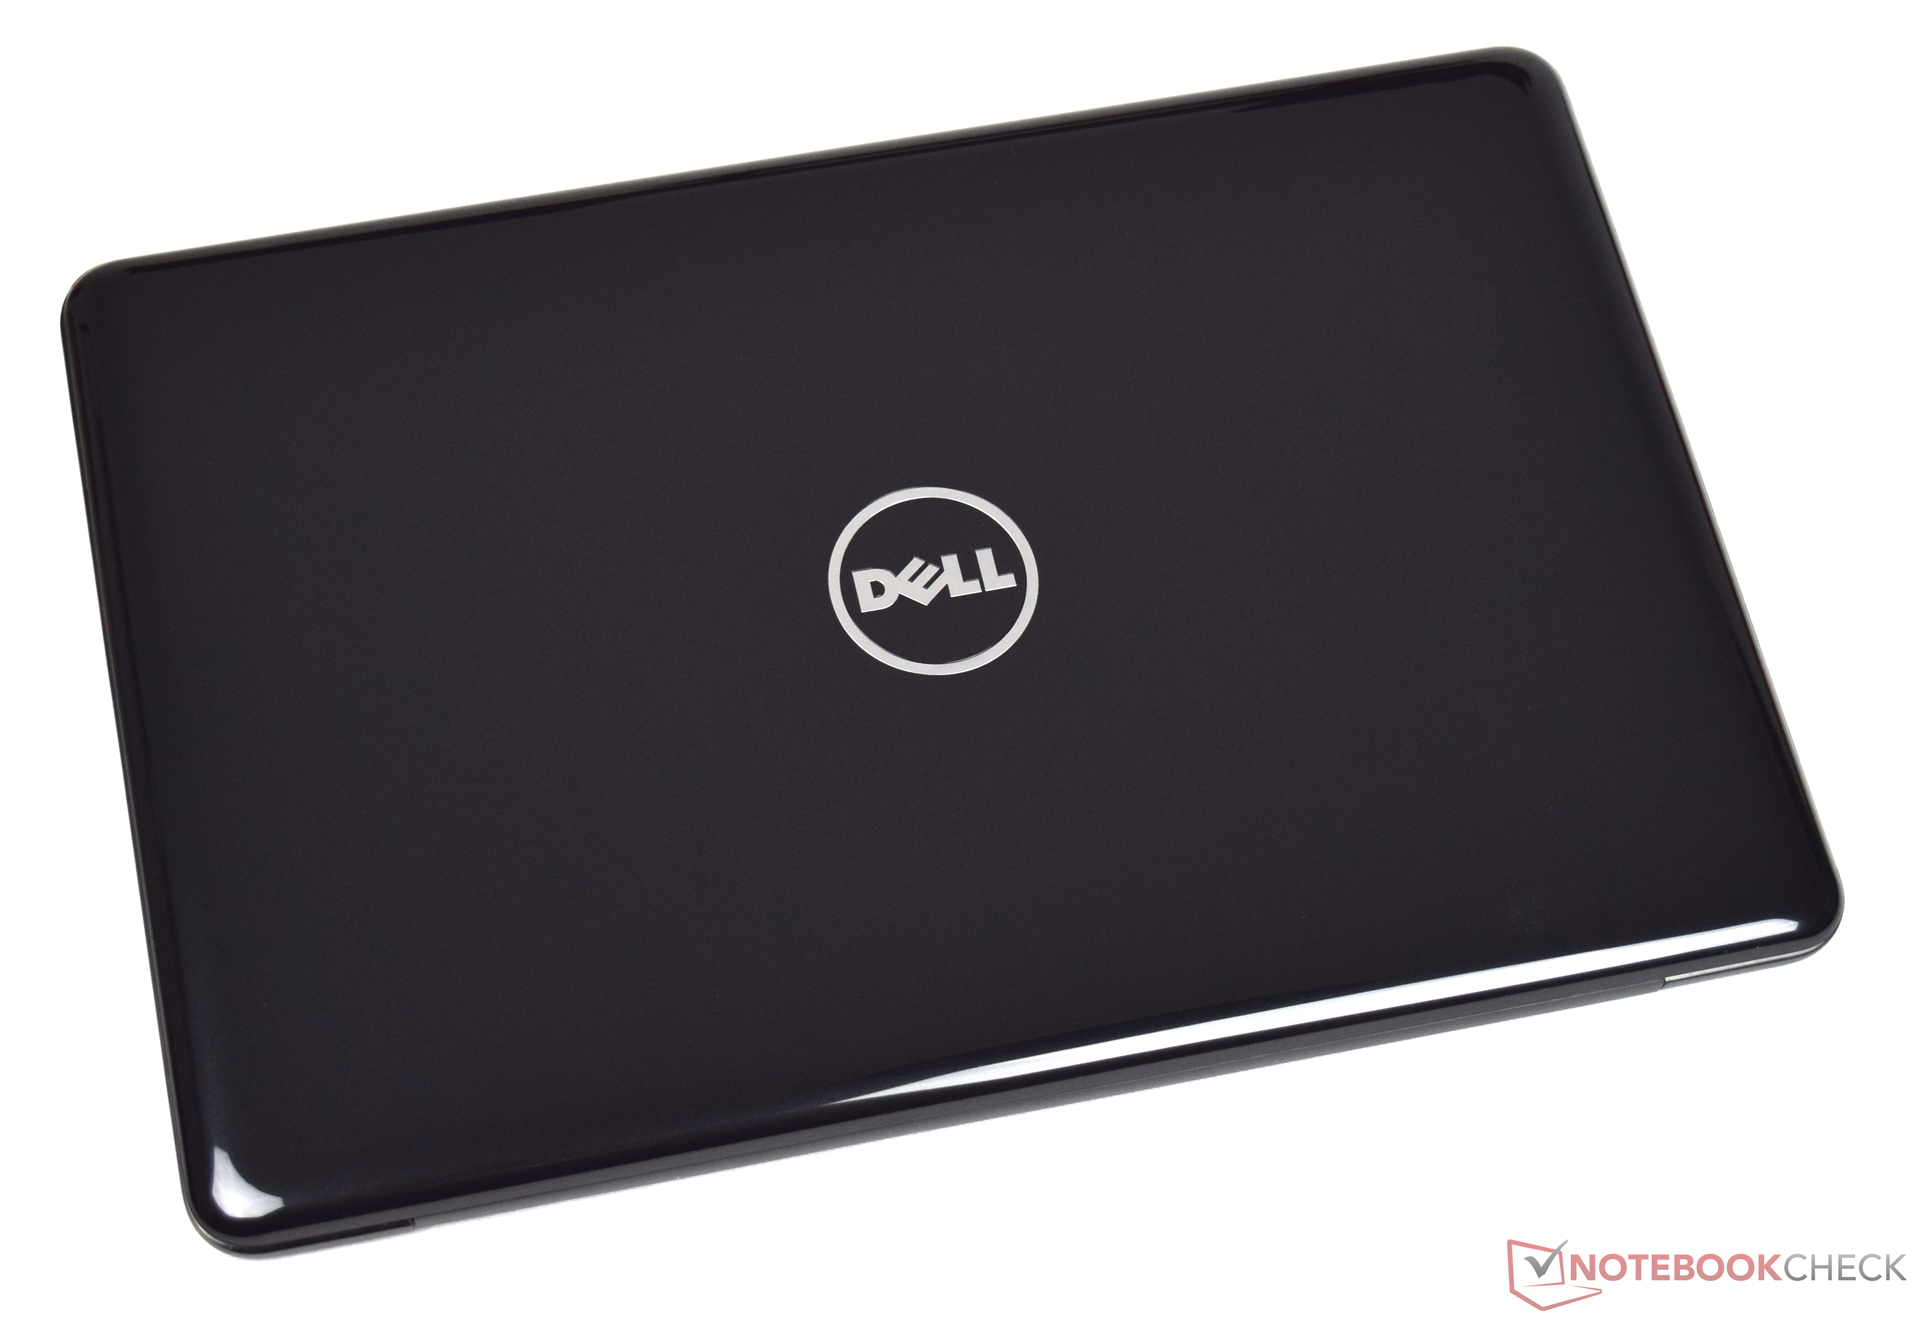
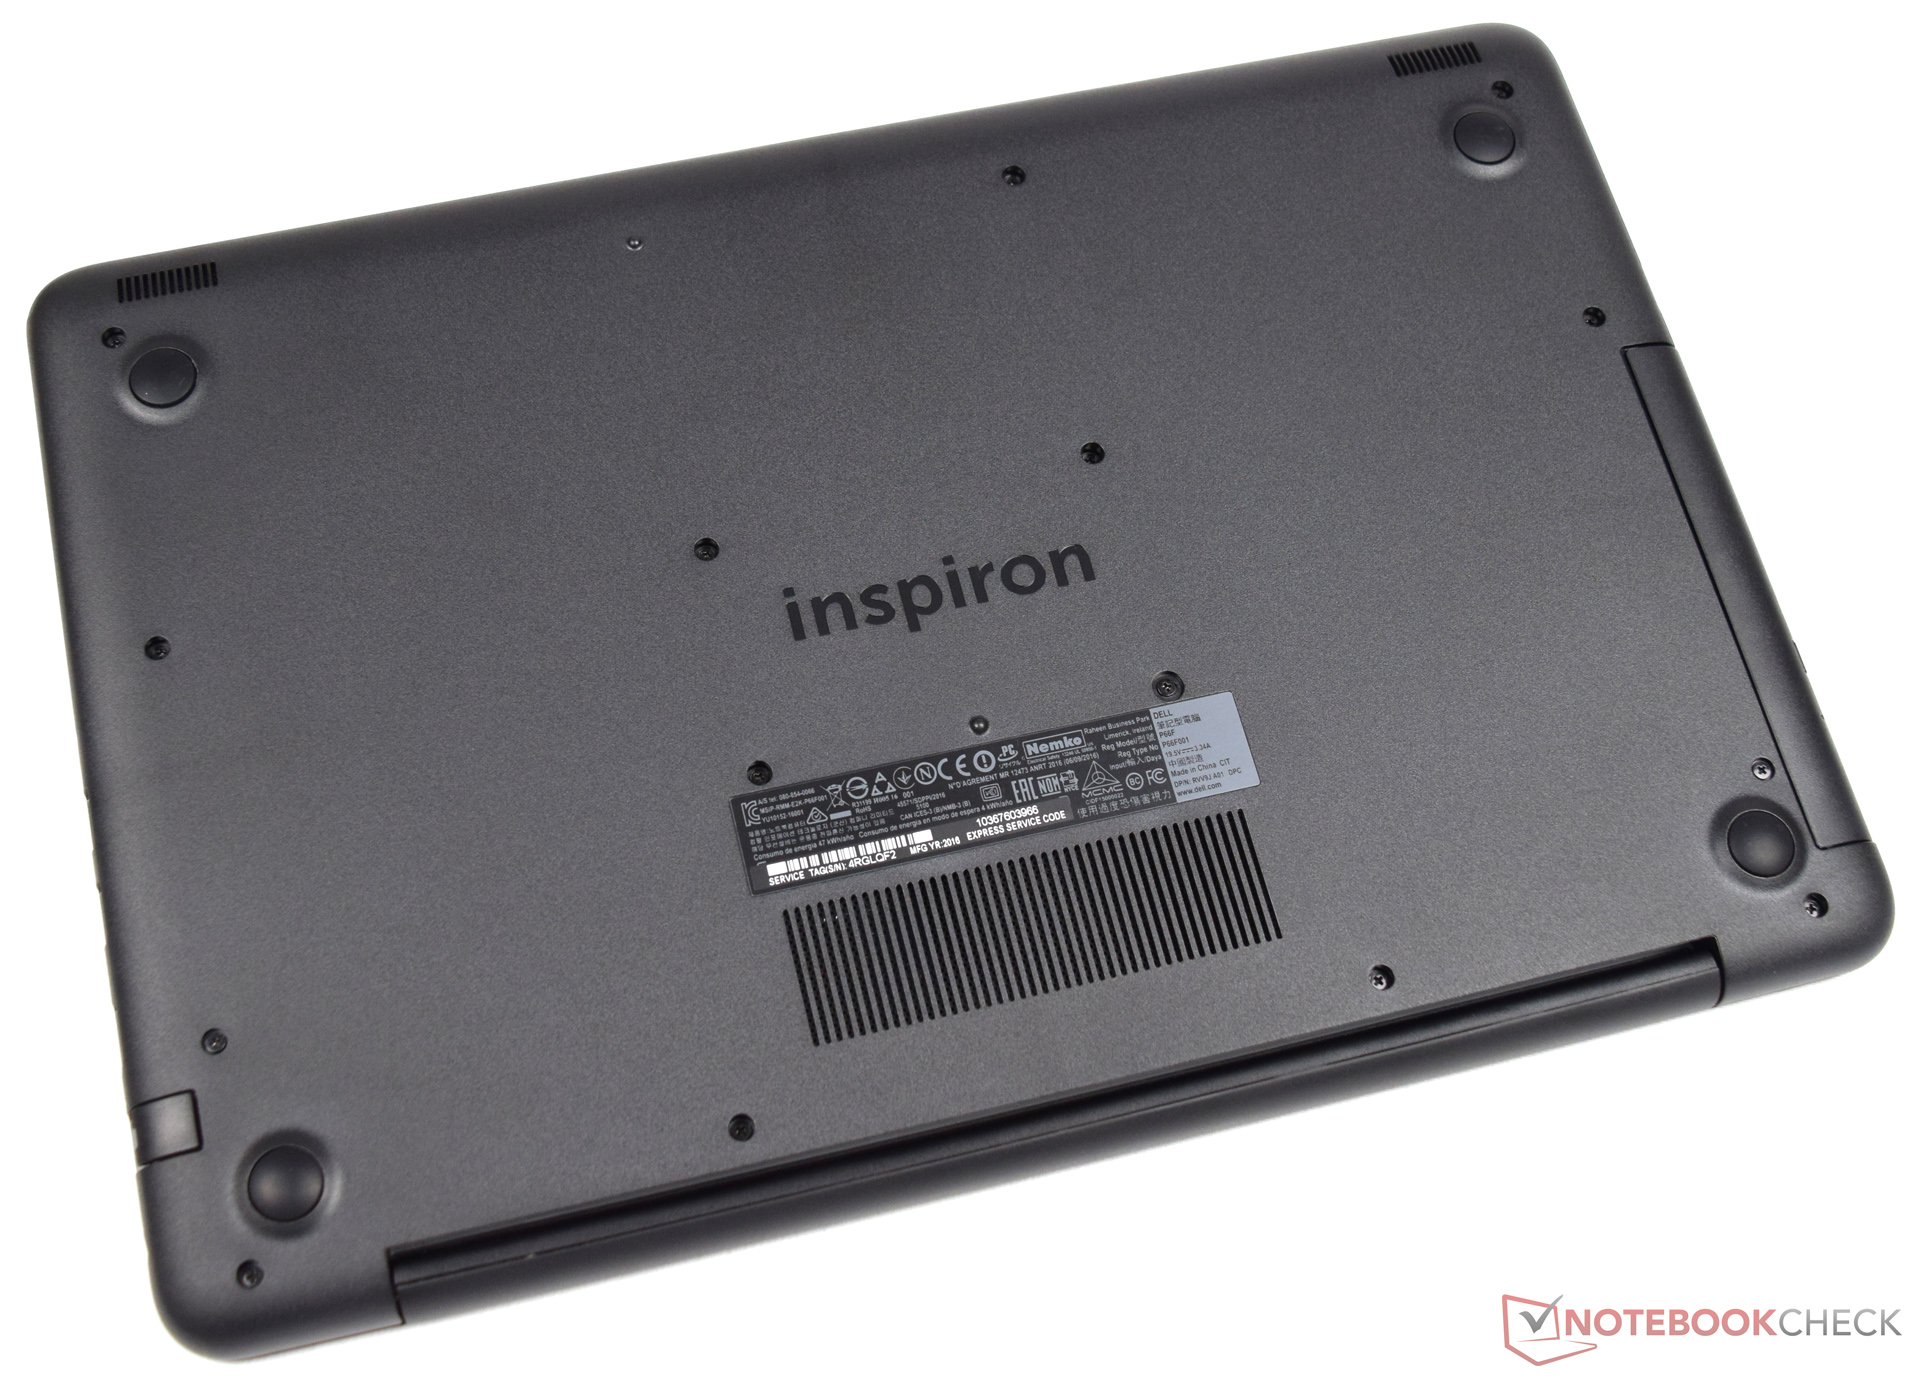
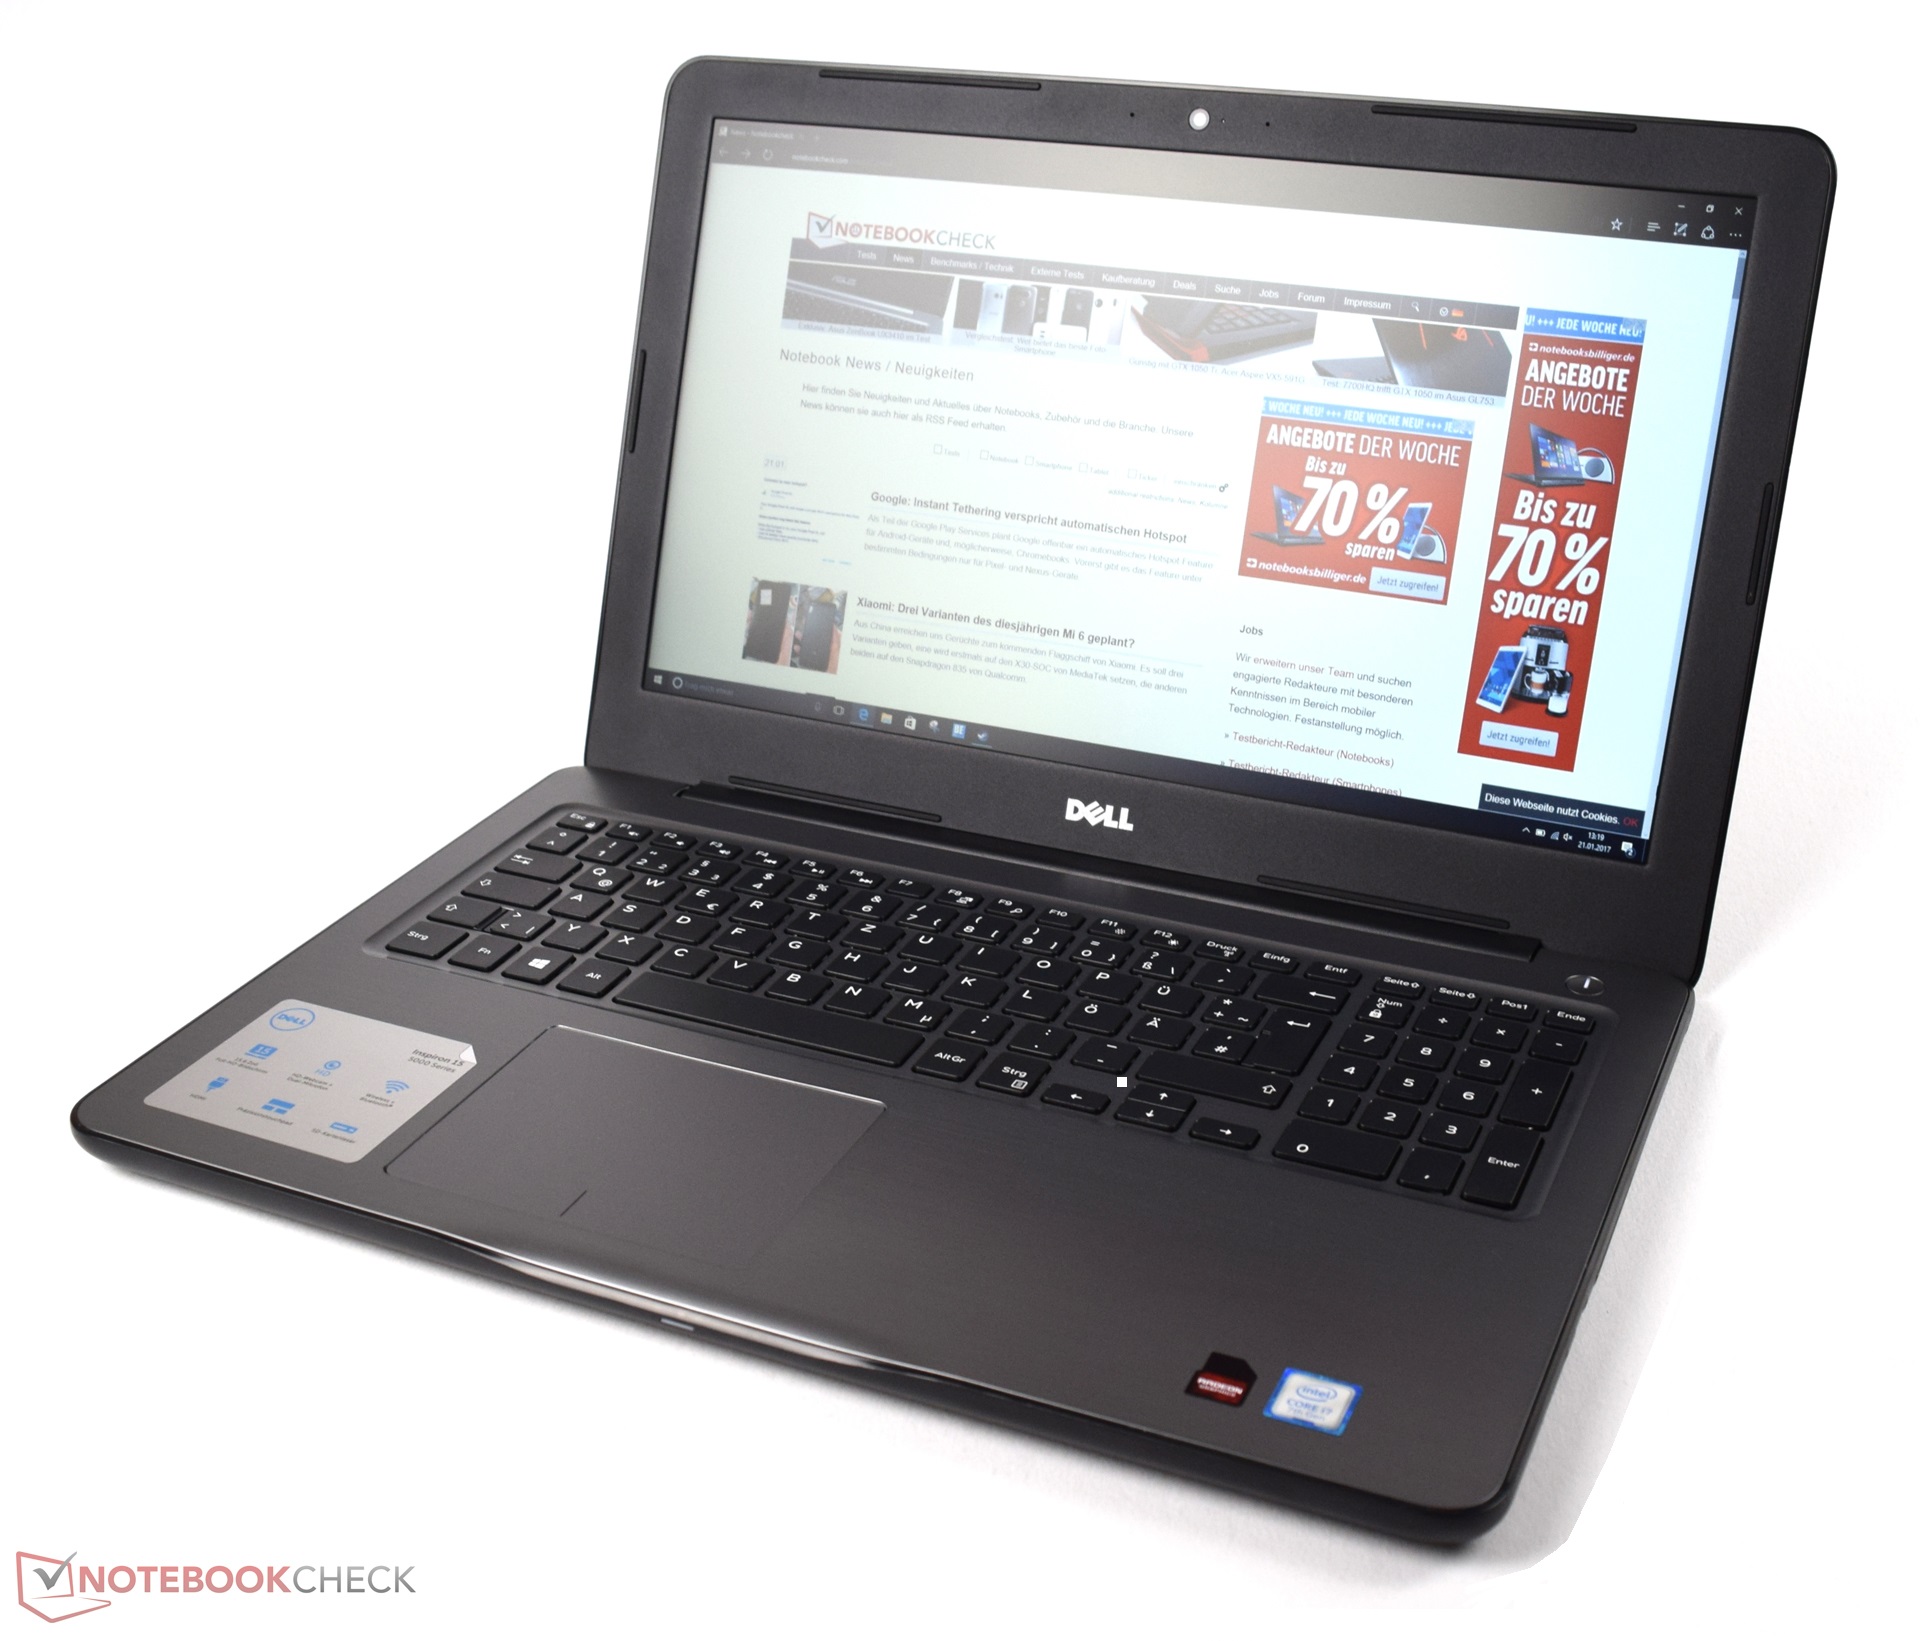
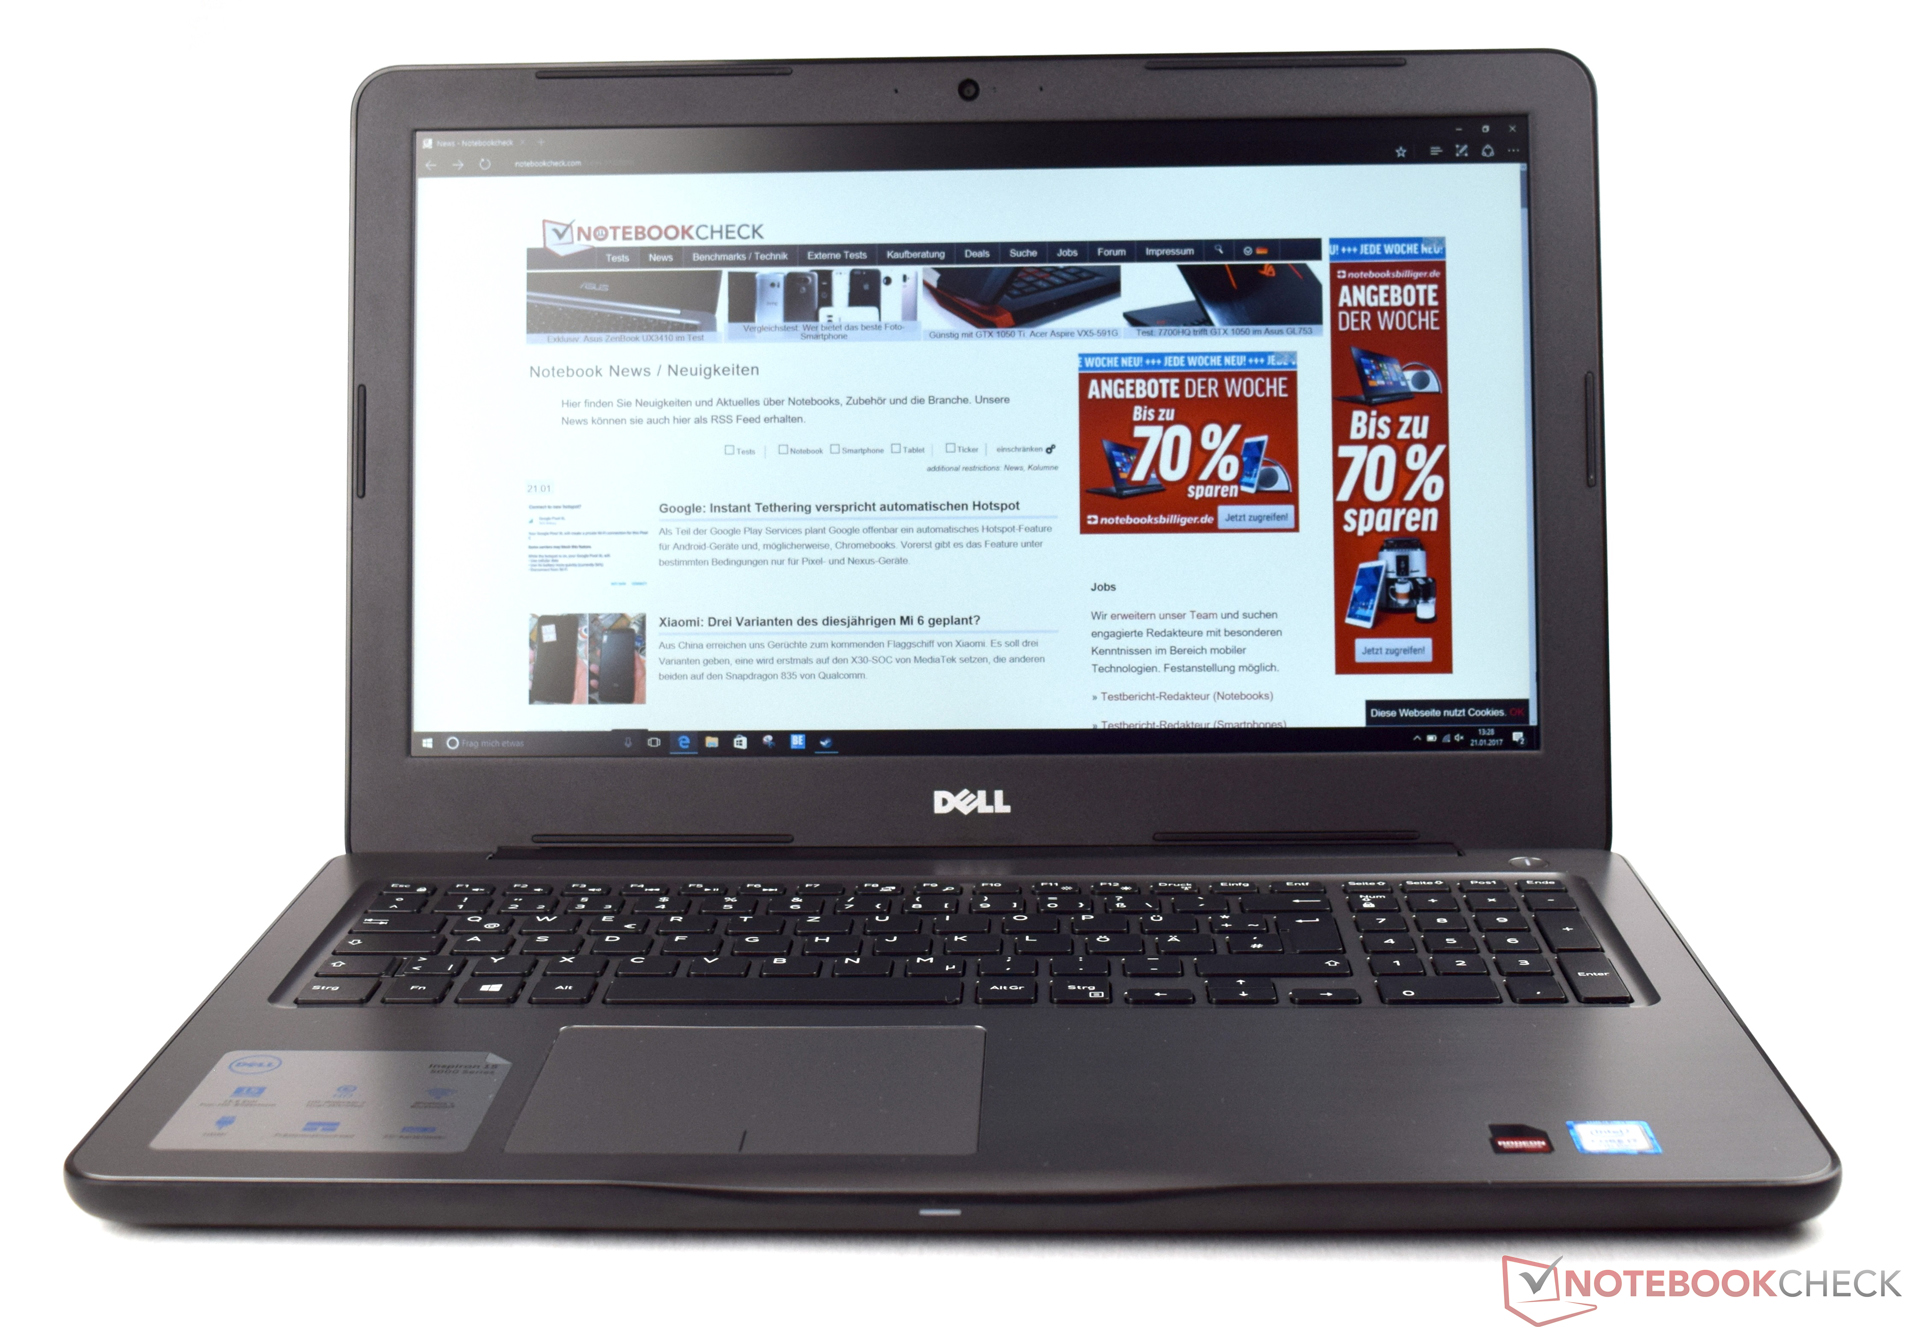
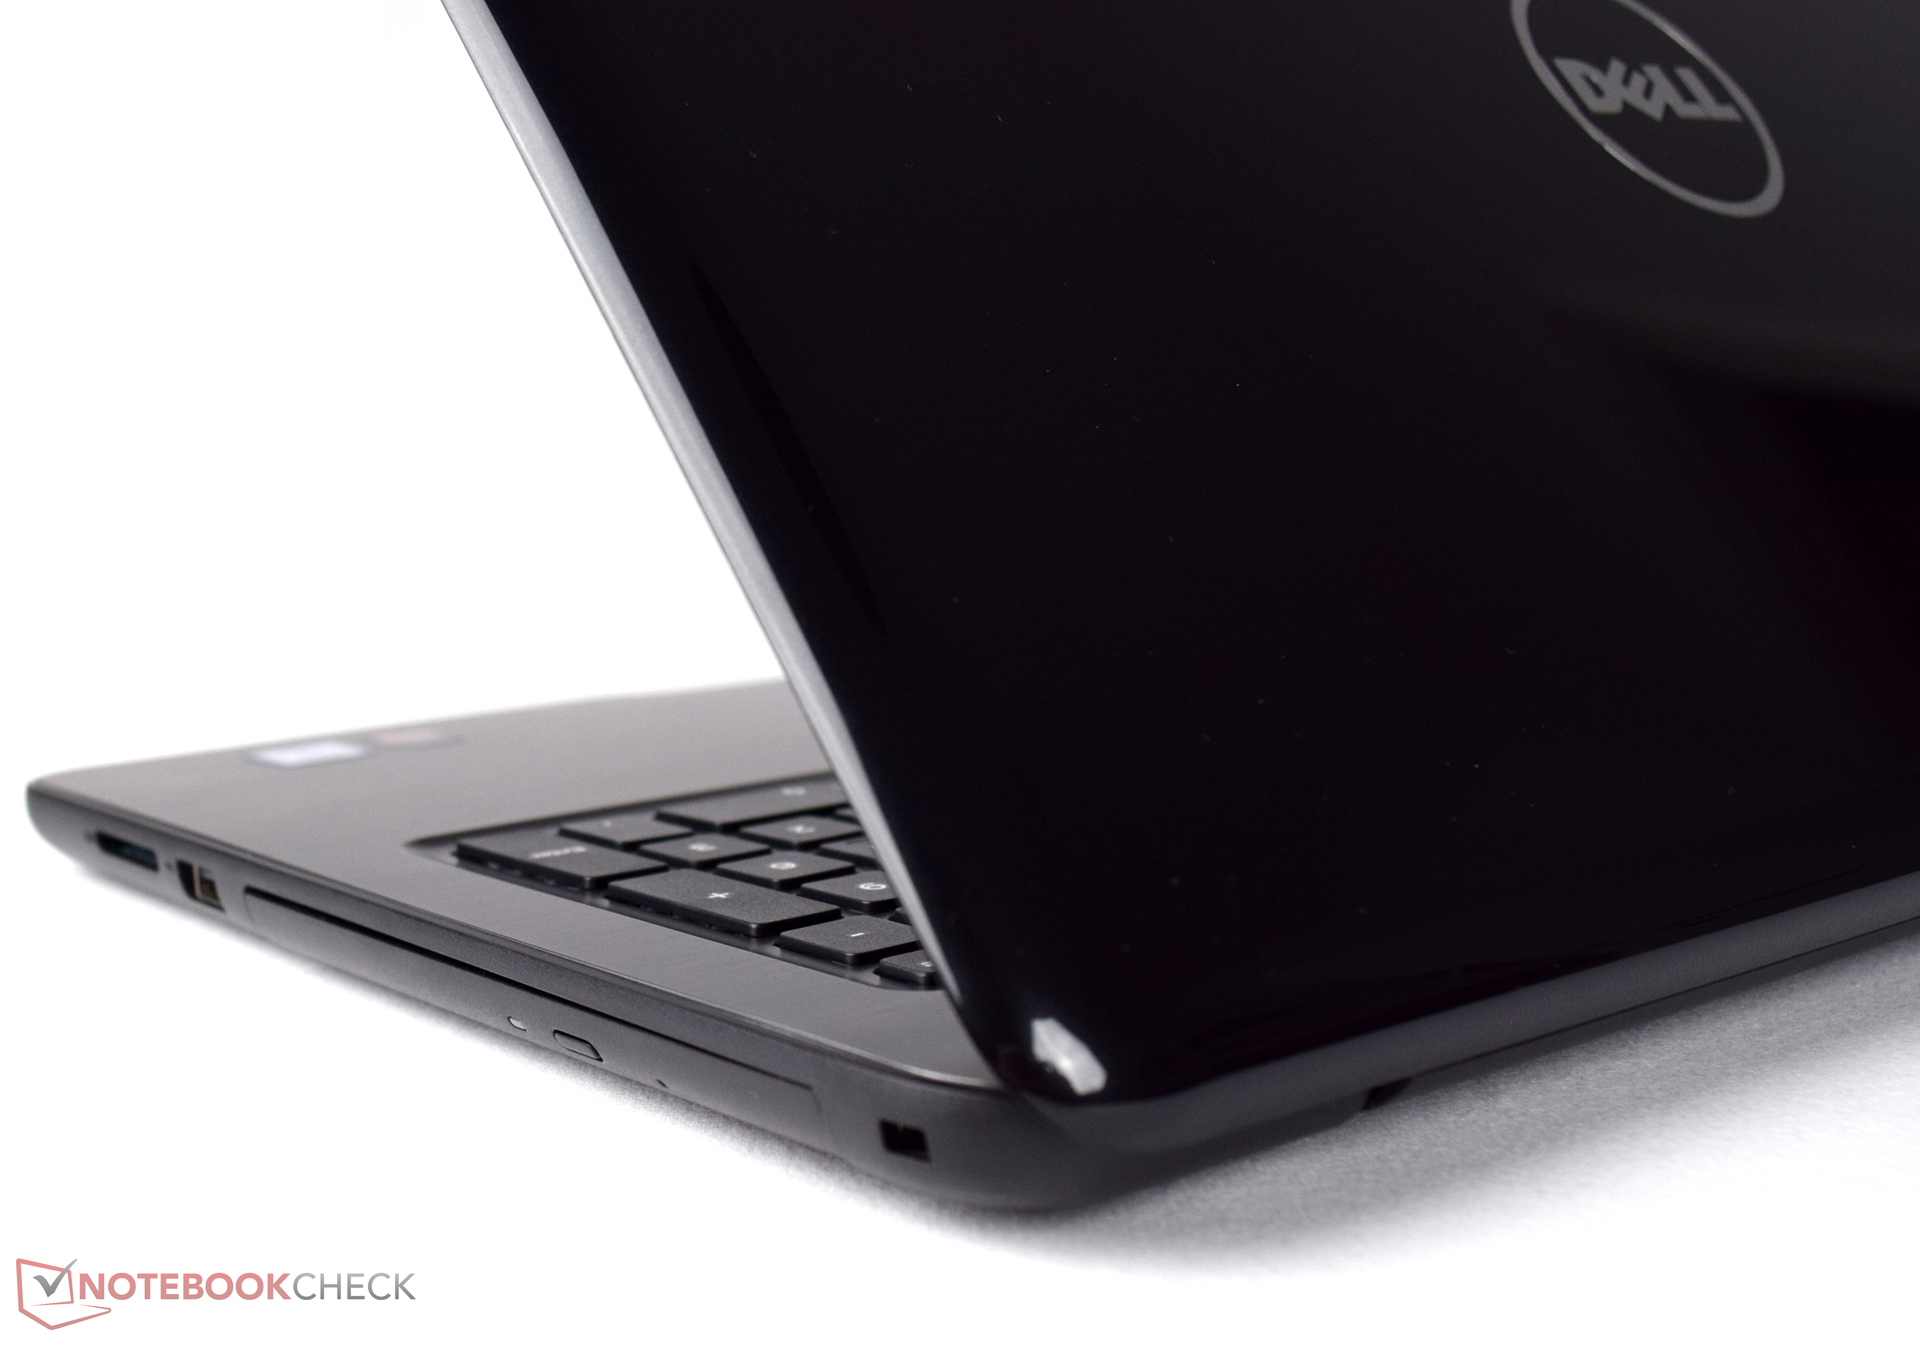
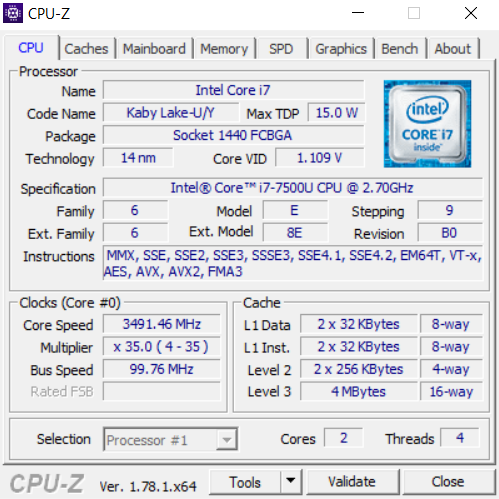
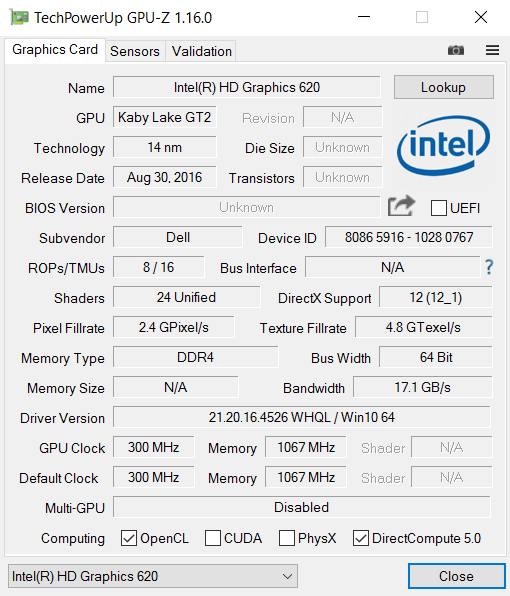
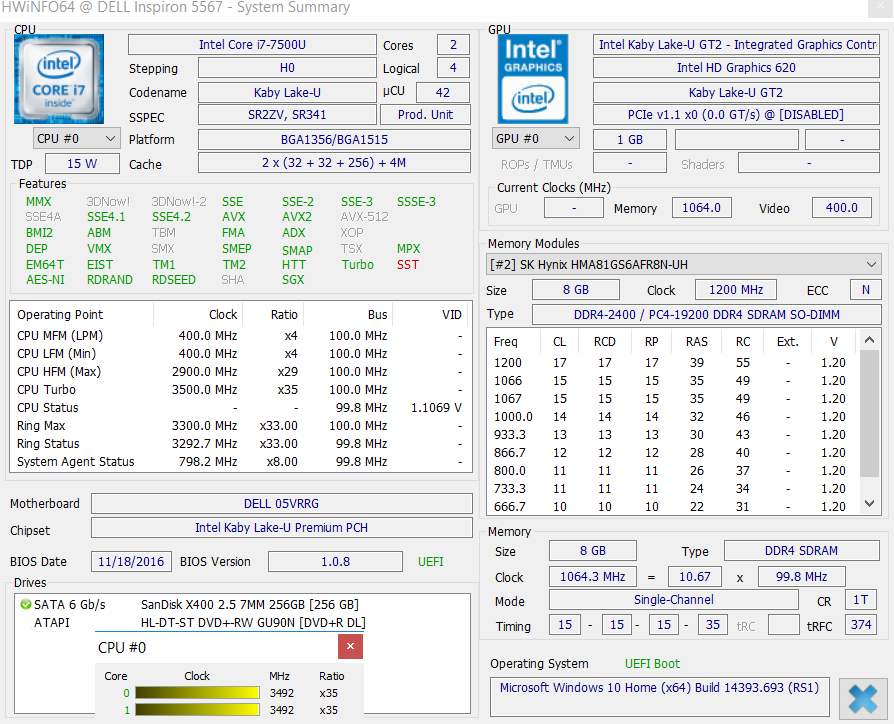
El Dell Inspiron 15 5000 5567-1753 es un portátil multimedia con un diseño sencillo. Sin embargo la superficie brillante de la tapa puede tener problemas con rayazos no deseados, lo que hará que la apariencia se resienta. Nuestro modelo de prueba de 15.6 pulgadas está equipada con un procesador Kaby Lake moderno y potente. El Core i7-7500U ofrece suficiente rendimiento para tareas multimedia cotidianas y la tarjeta gráfica dedicada asegura que puedas jugar a muchos juegos modernos, a pesar de que no siempre a la máxima resolución. Nuestro dispositivo de prueba está disponible por 719 euros en muchas tiendas online.
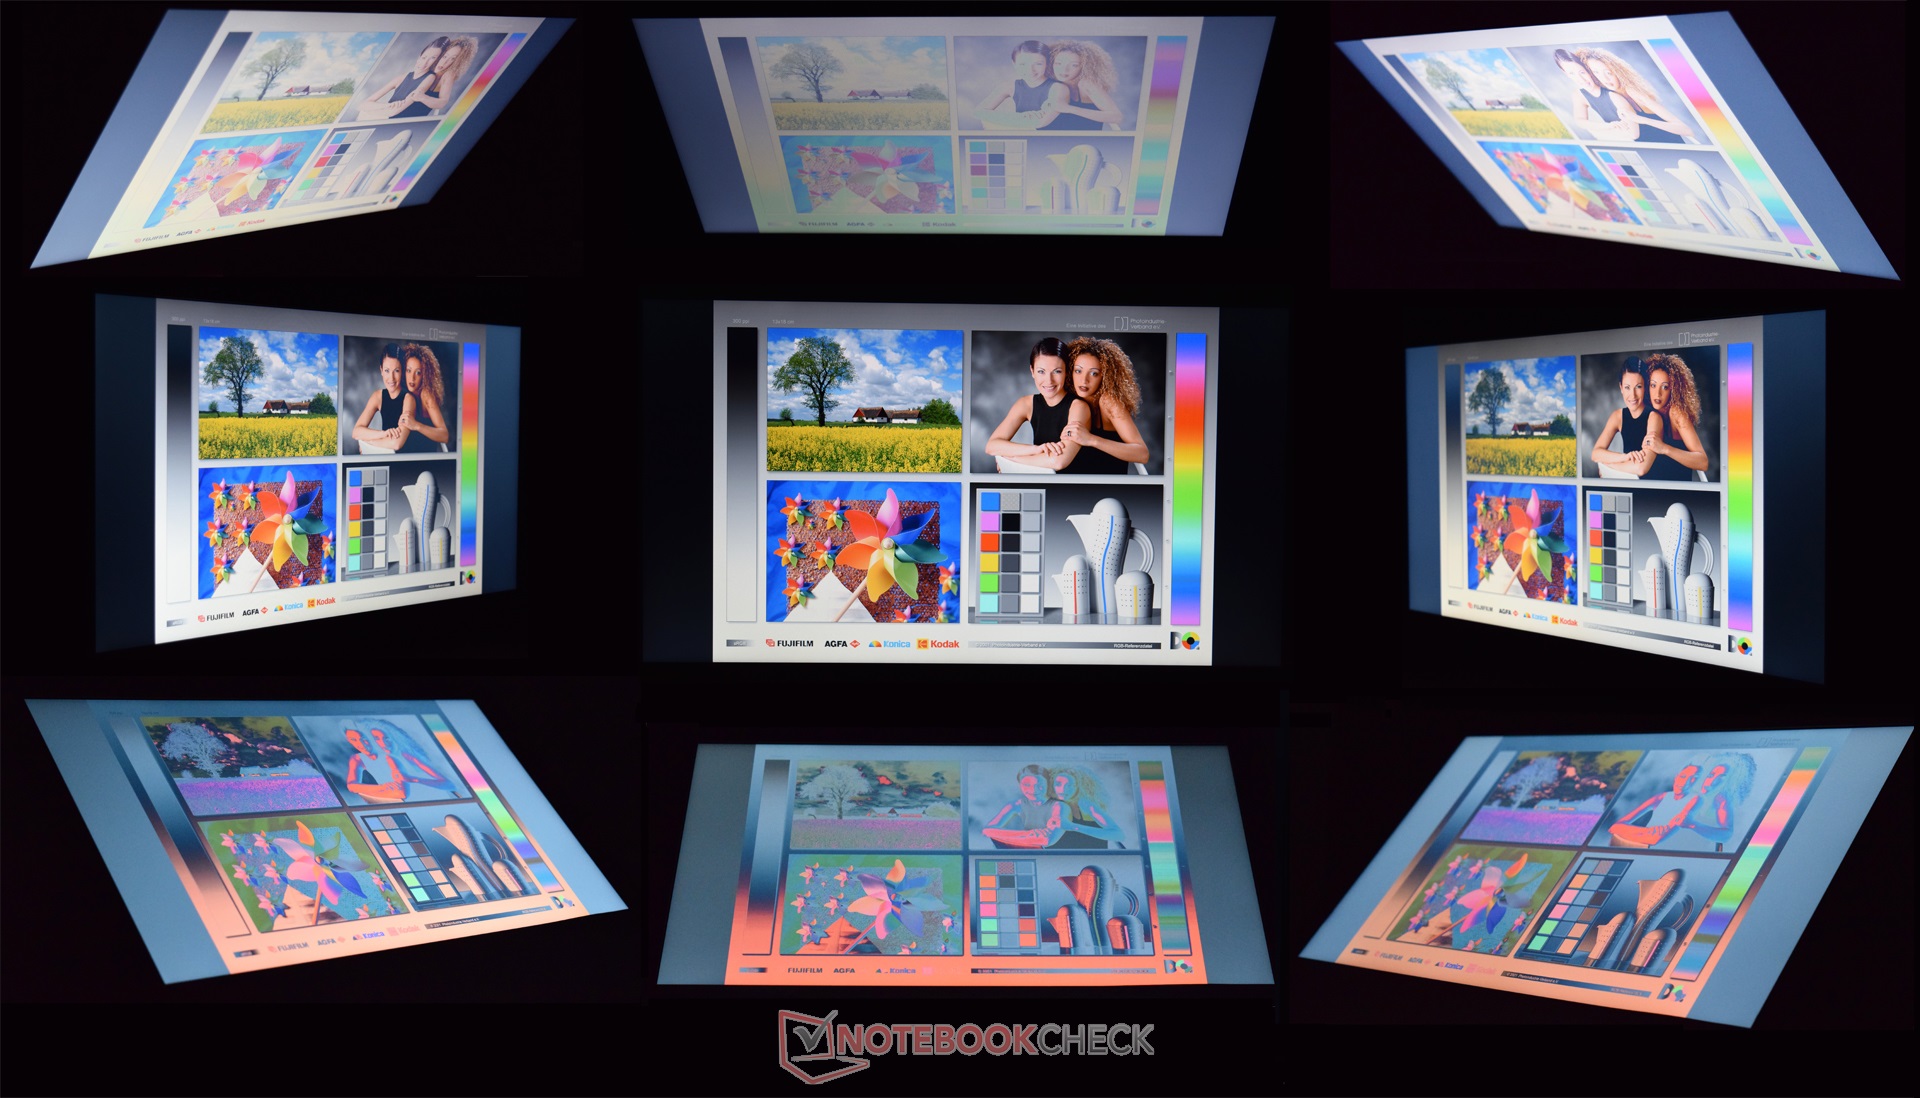
El Inspiron 15 5000 5567-1753 de Dell ofrece buenas cifras de rendimiento en las pruebas y tiene buenos dispositivos de entrada para tareas cotidianas. Sin embargo, la mala pantalla es un inconveniente muy importante. Dell debería cambiarla rápidamente, porque estos paneles TN son cosa del pasado.
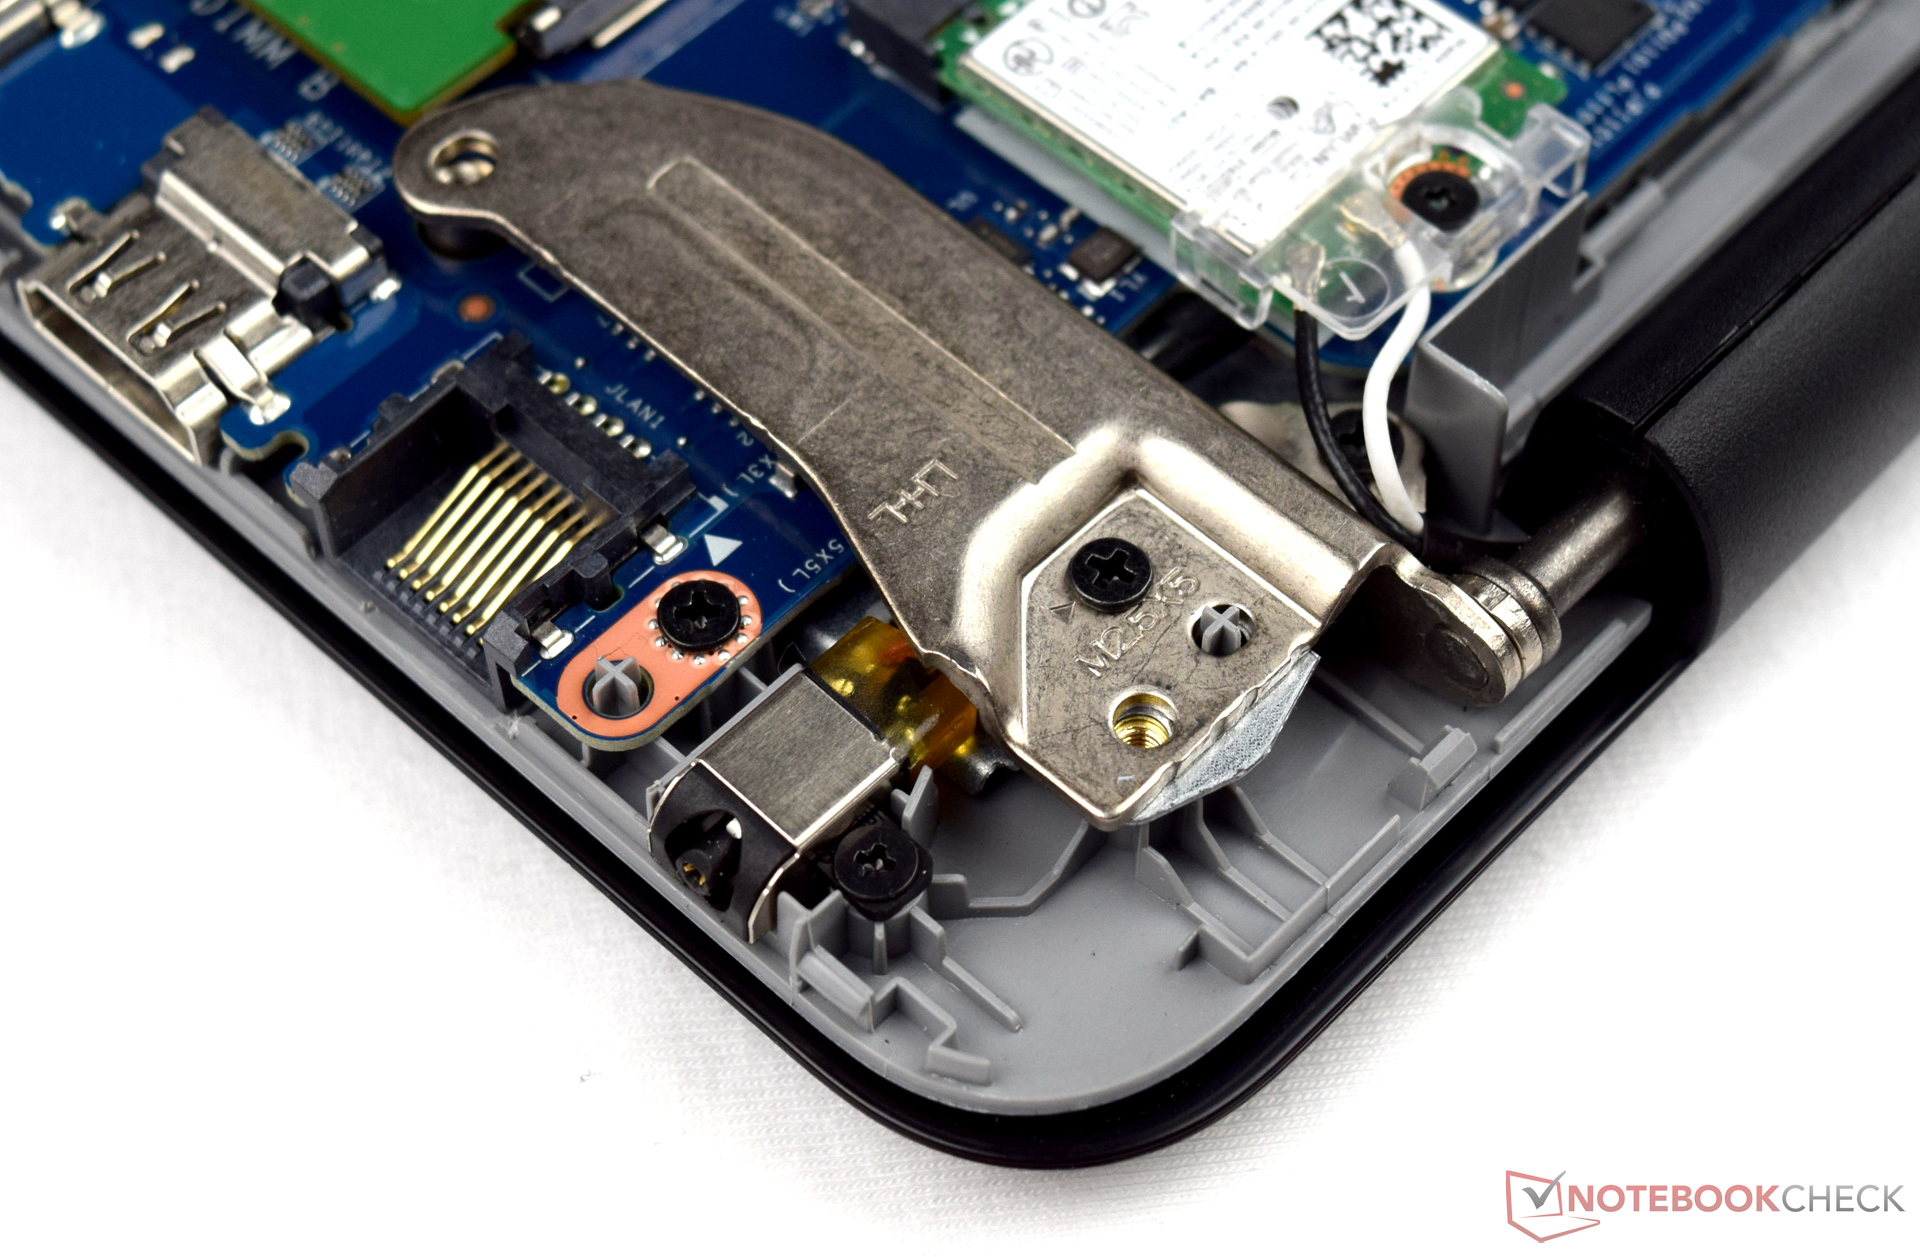
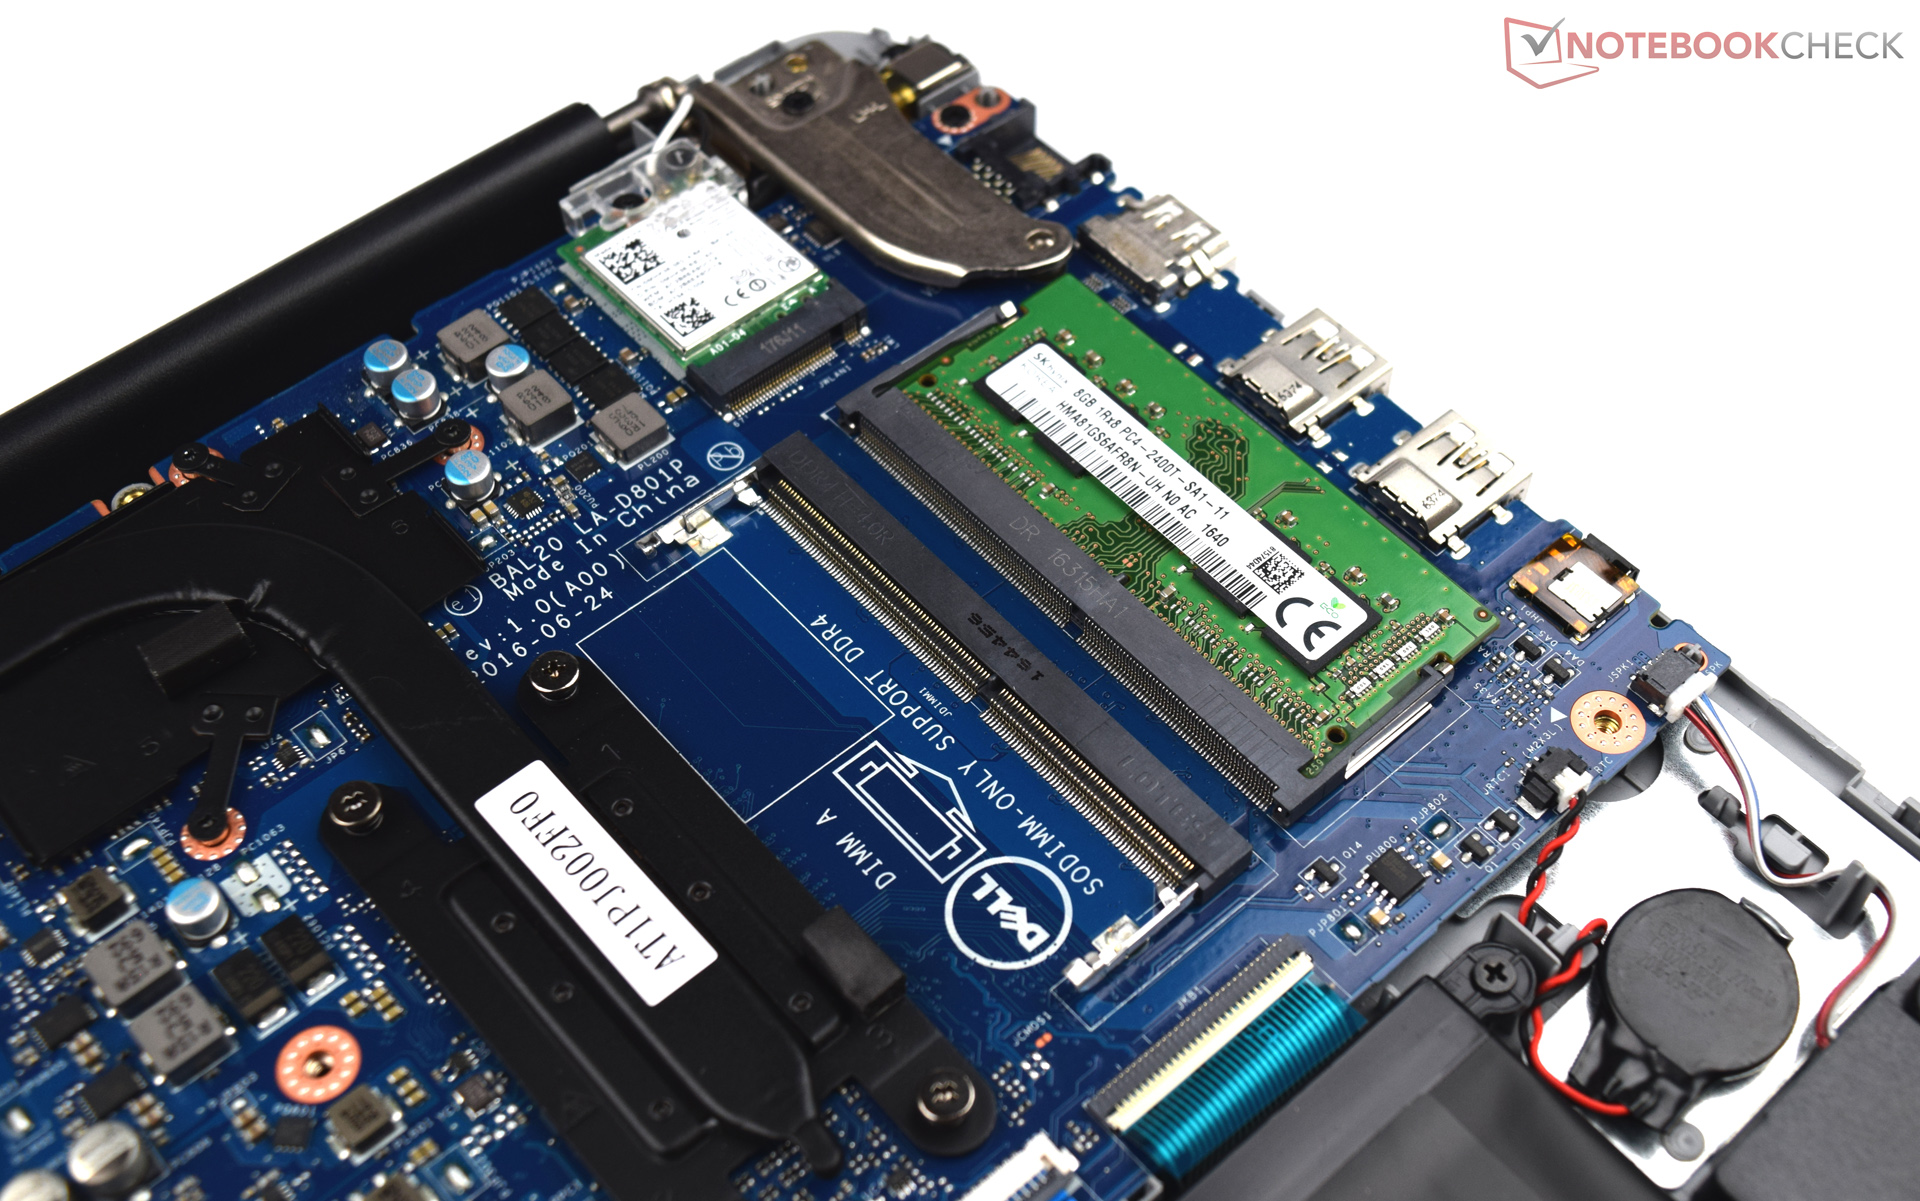
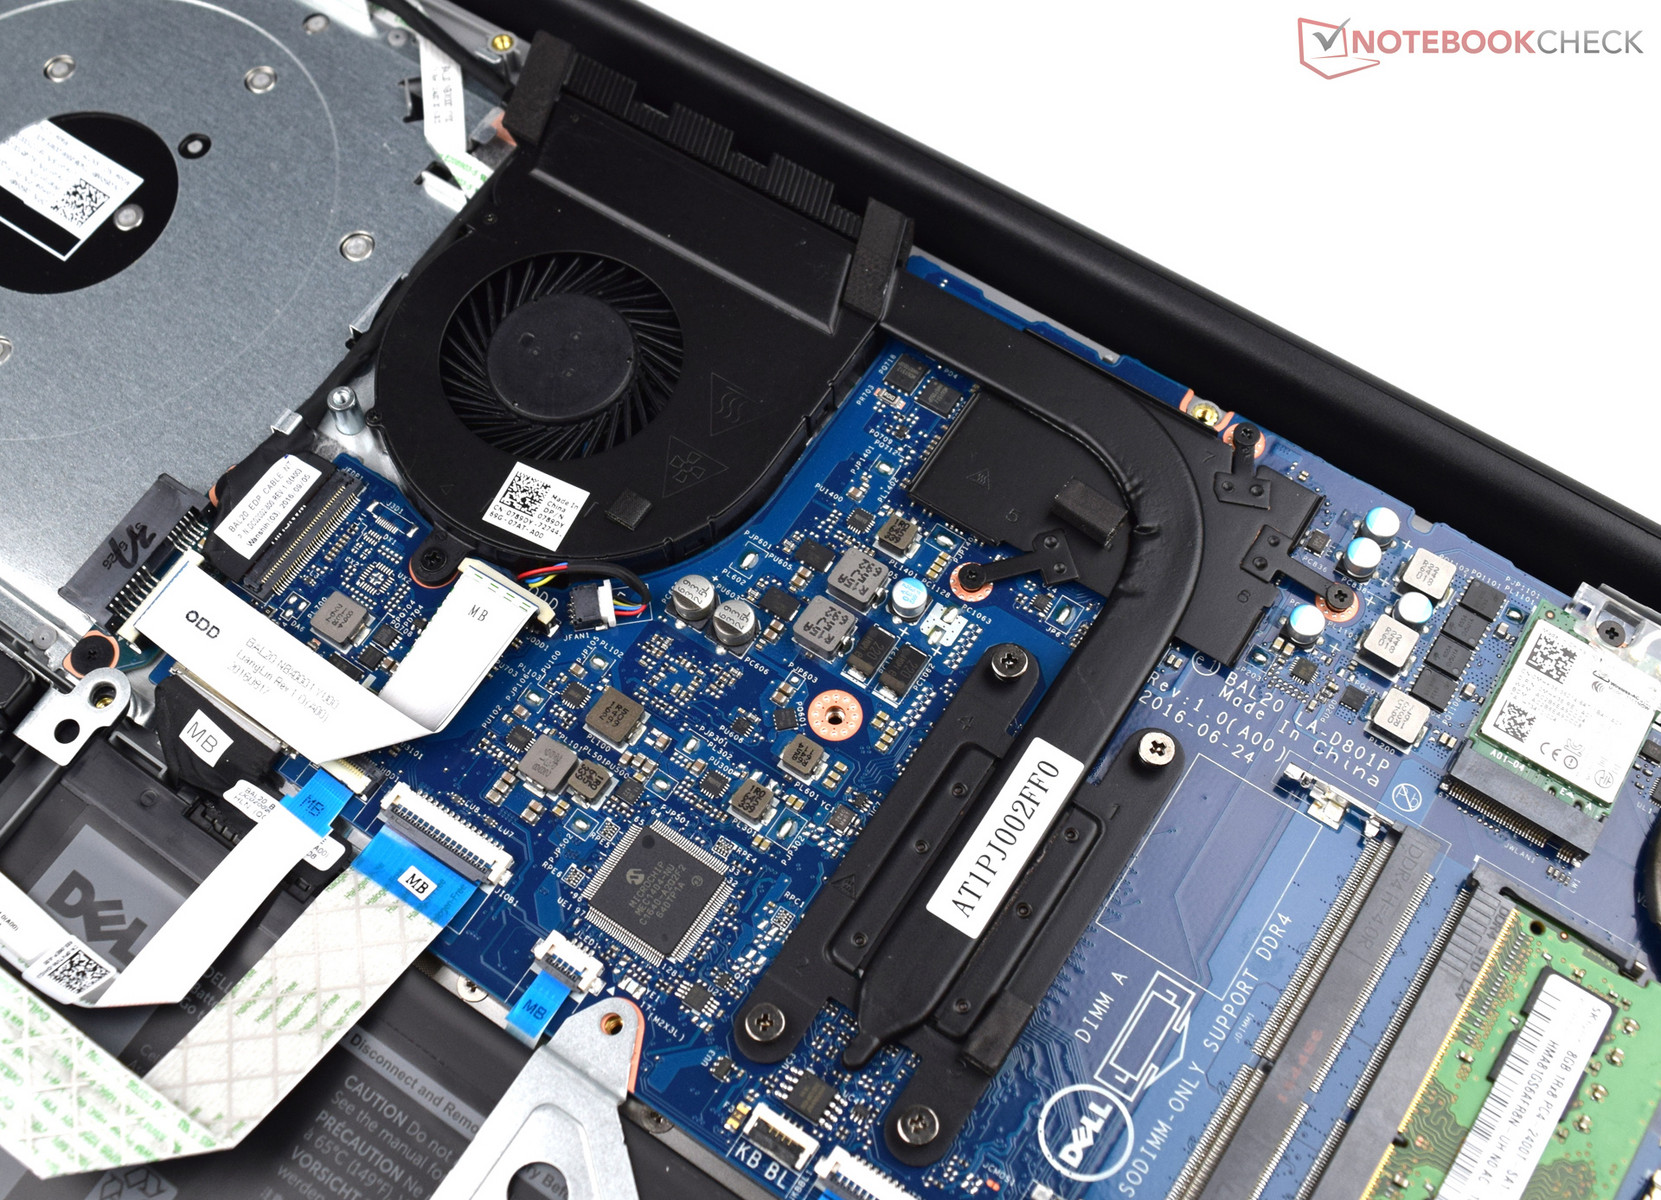
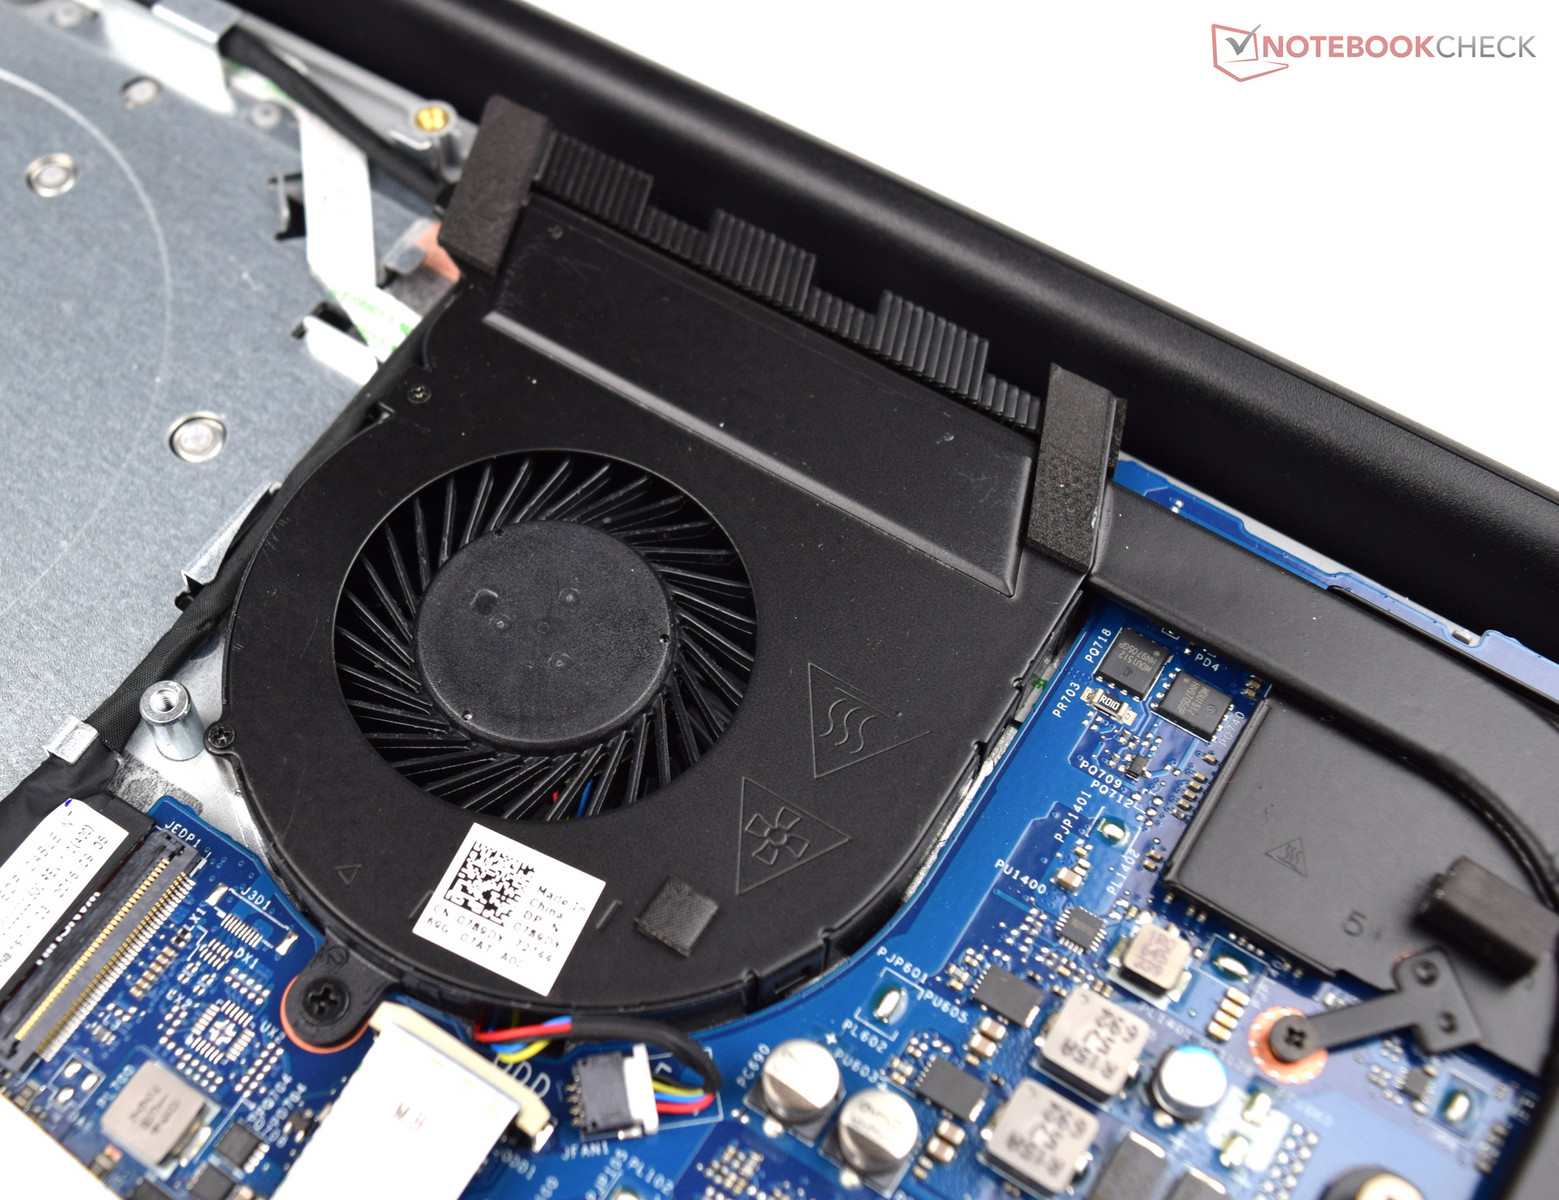
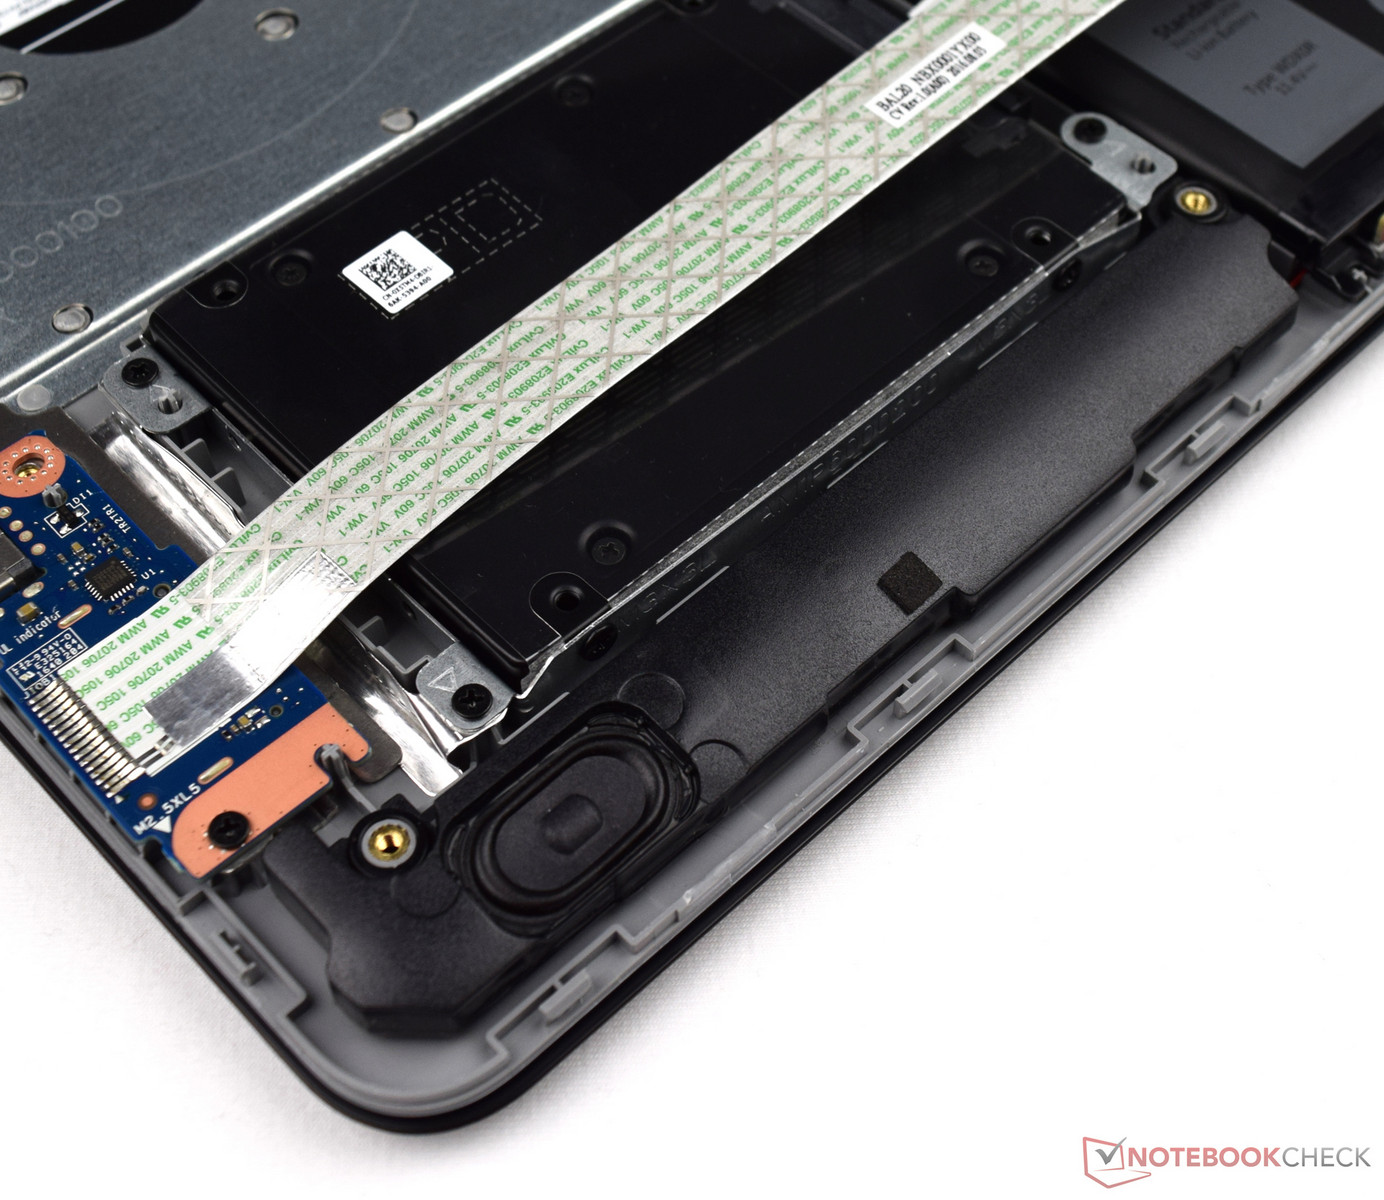
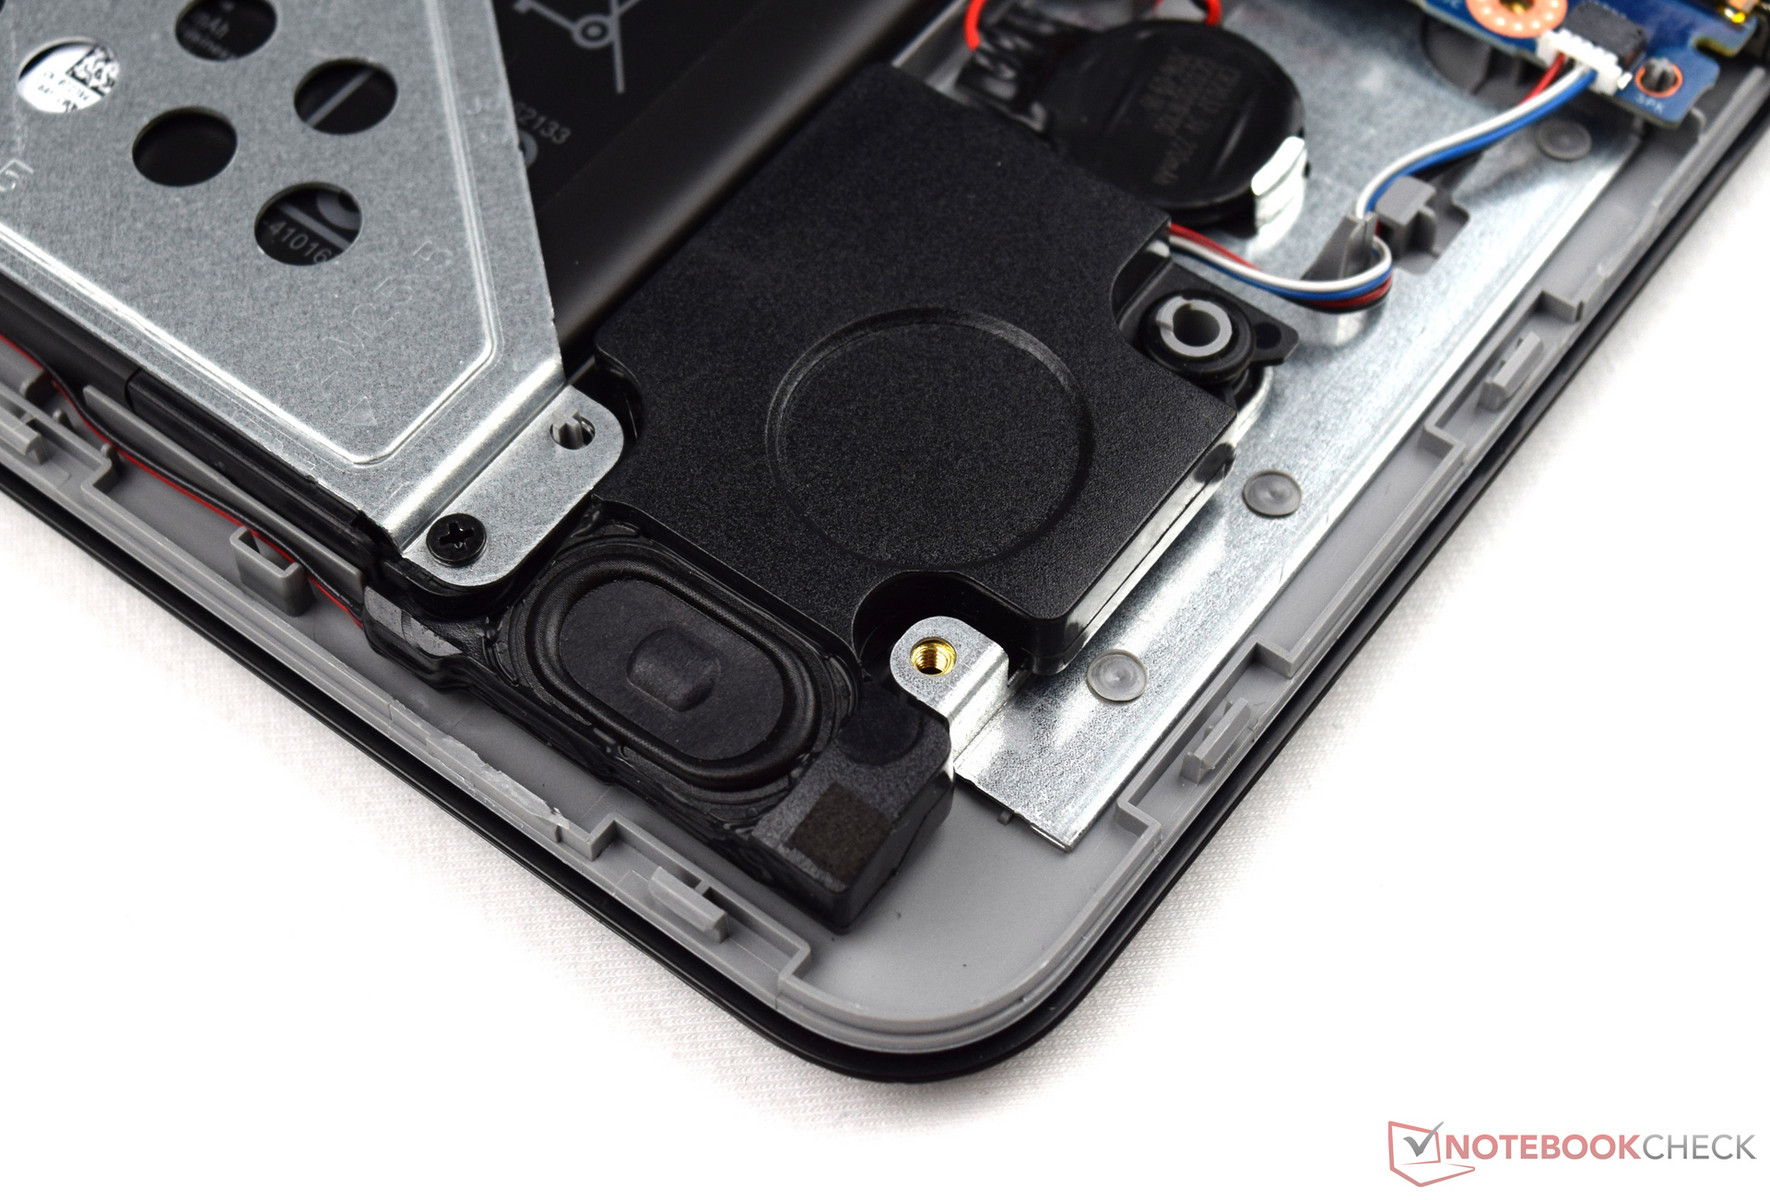
La elección de la solución de almacenamiento depende de cuanto necesites. Podrías tener un problema si quieres jugar a varios juegos, y tendría sentido hacerse con un SSD de mayor capacidad. Esto es posible extrayendo la parte inferior, aunque resulta un proceso un poco complicado.
Ésta es una versión acortada del análisis original. Puedes leer el análisis completo en inglés aquí.
Dell Inspiron 15 5000 5567-1753
- 01/30/2017 v6 (old)
Sebastian Bade
Price comparison
