Breve análisis del Convertible Acer Spin 7 SP714-51-M09D
| Networking | |
| iperf Server (receive) TCP 1 m | |
| Apple MacBook Pro Retina 13 inch 2013-10 | |
| Lenovo Miix 510 Pro 80U10006GE (jseb) | |
| Asus Zenbook UX330UA-FC059T | |
| Asus Zenbook UX360UA-C4159T | |
| Acer Spin 7 SP714-51-M09D (jseb) | |
| Medion Akoya S3409-MD60234 (jseb) | |
| HP ProBook 655 G2 T9X09ET (jseb) | |
| iperf Client (transmit) TCP 1 m | |
| Acer Spin 7 SP714-51-M09D (jseb) | |
| Asus Zenbook UX360UA-C4159T | |
| Apple MacBook Pro Retina 13 inch 2013-10 (Hinum) | |
| Lenovo Miix 510 Pro 80U10006GE (jseb) | |
| Medion Akoya S3409-MD60234 (jseb) | |
| Asus Zenbook UX330UA-FC059T (jseb) | |
| HP ProBook 655 G2 T9X09ET (jseb) | |
| |||||||||||||||||||||||||
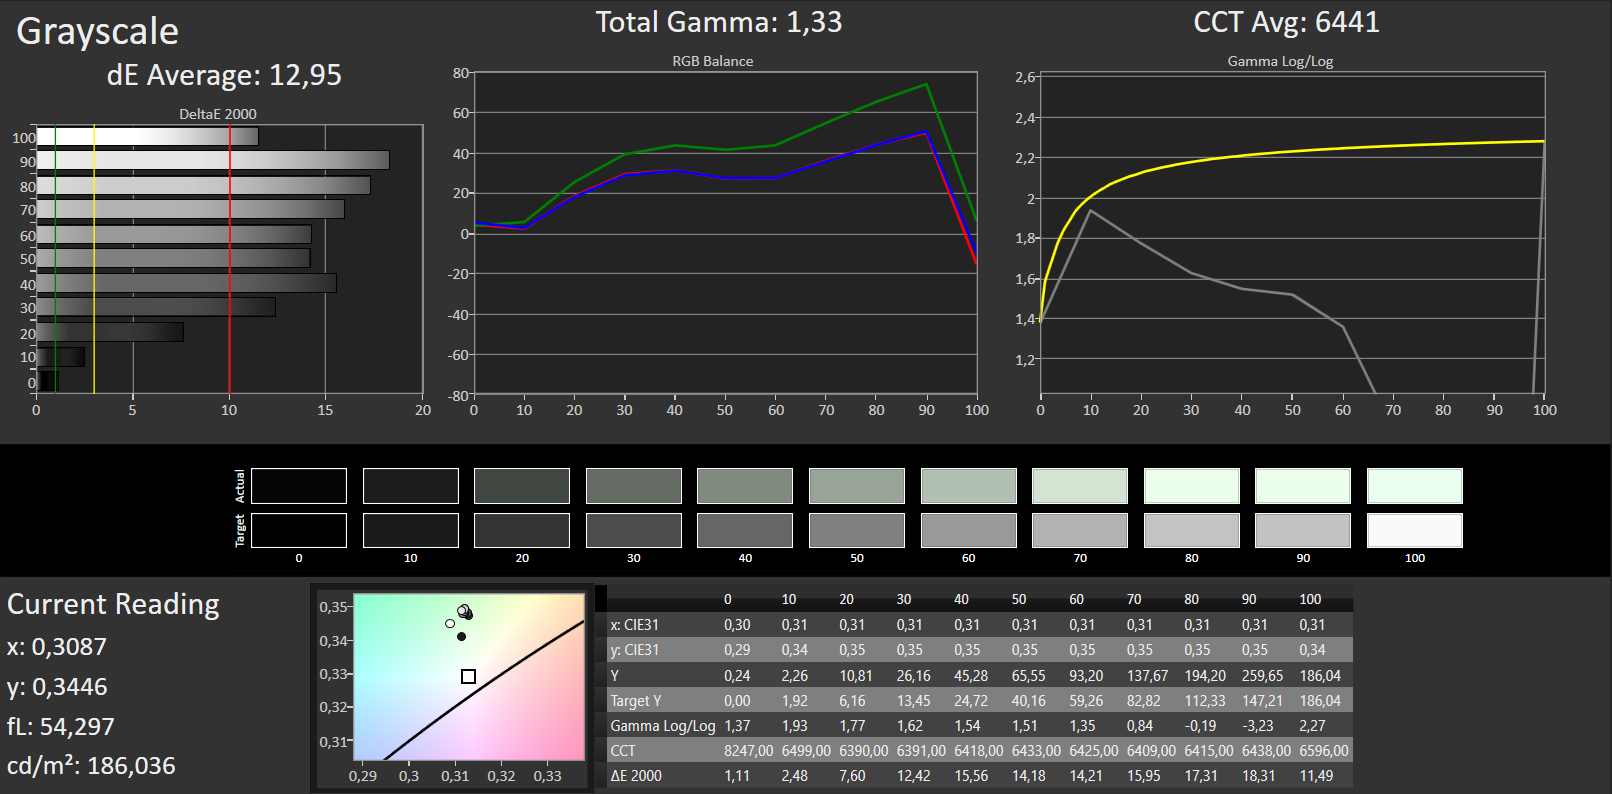
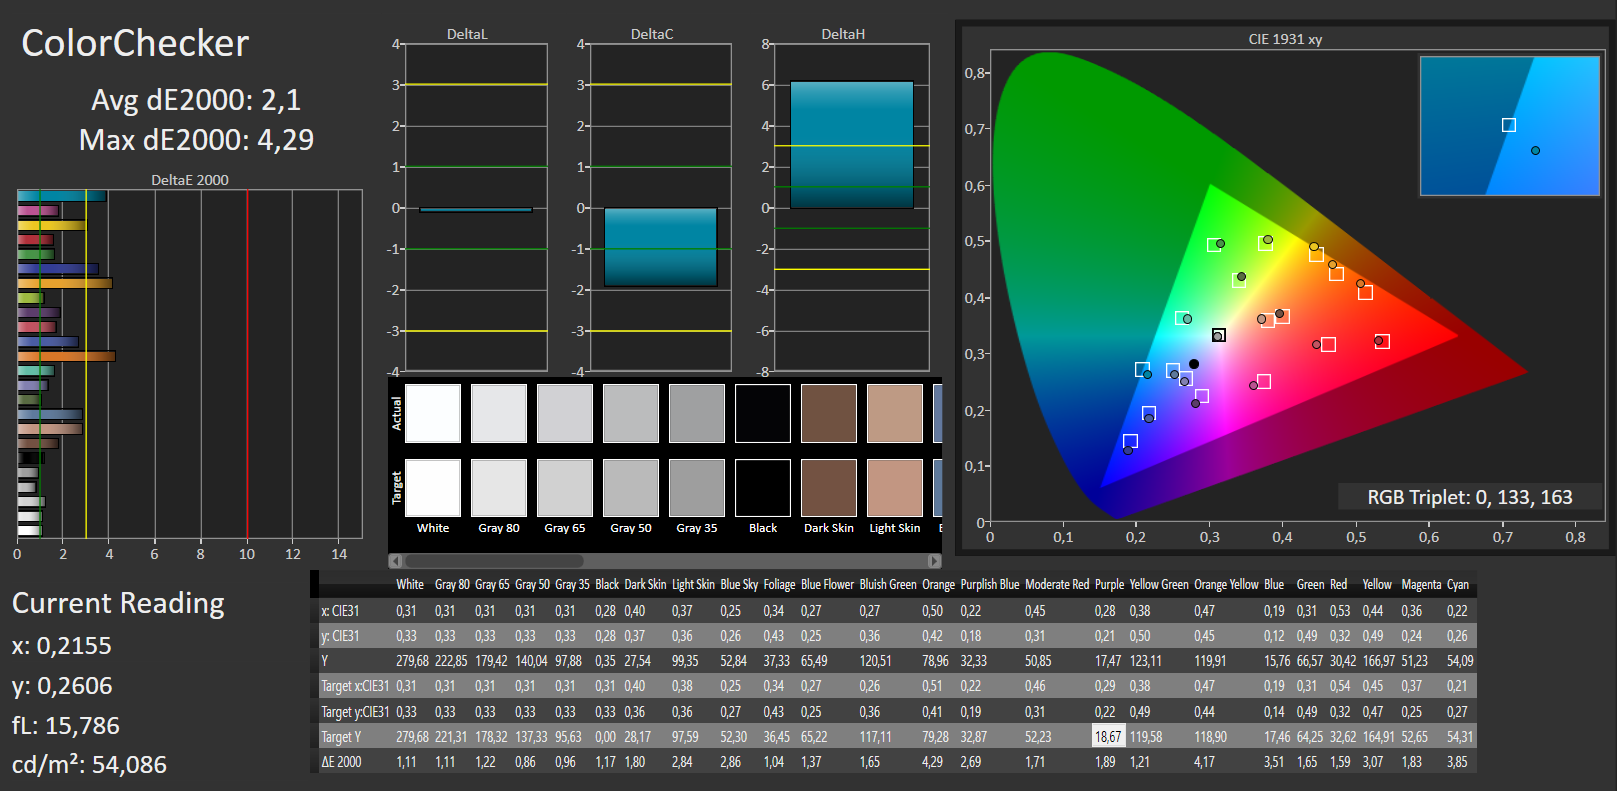
iluminación: 72 %
Brillo con batería: 332 cd/m²
Contraste: 1323:1 (Negro: 0.26 cd/m²)
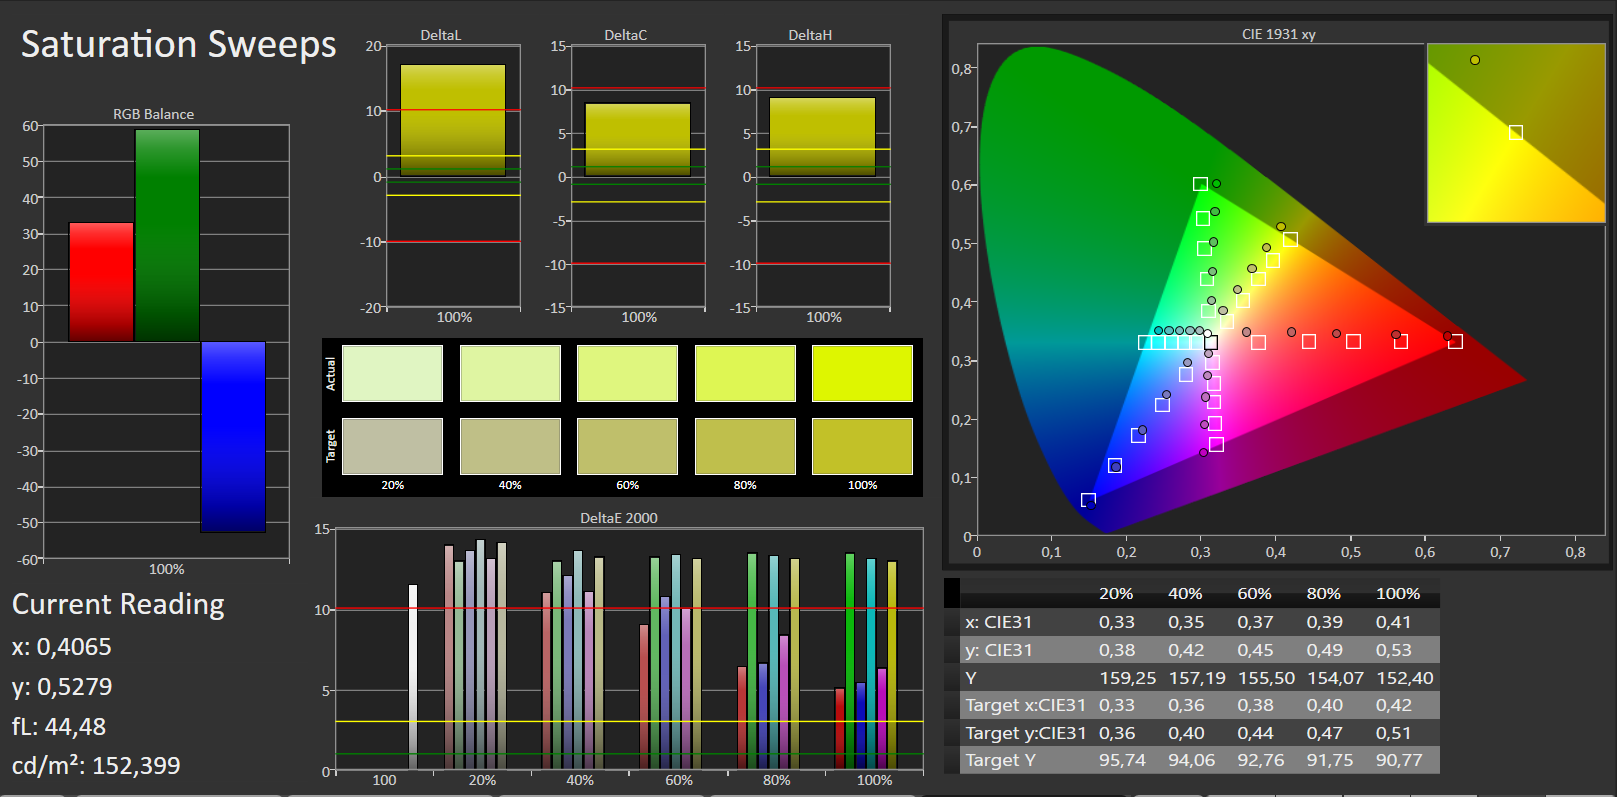
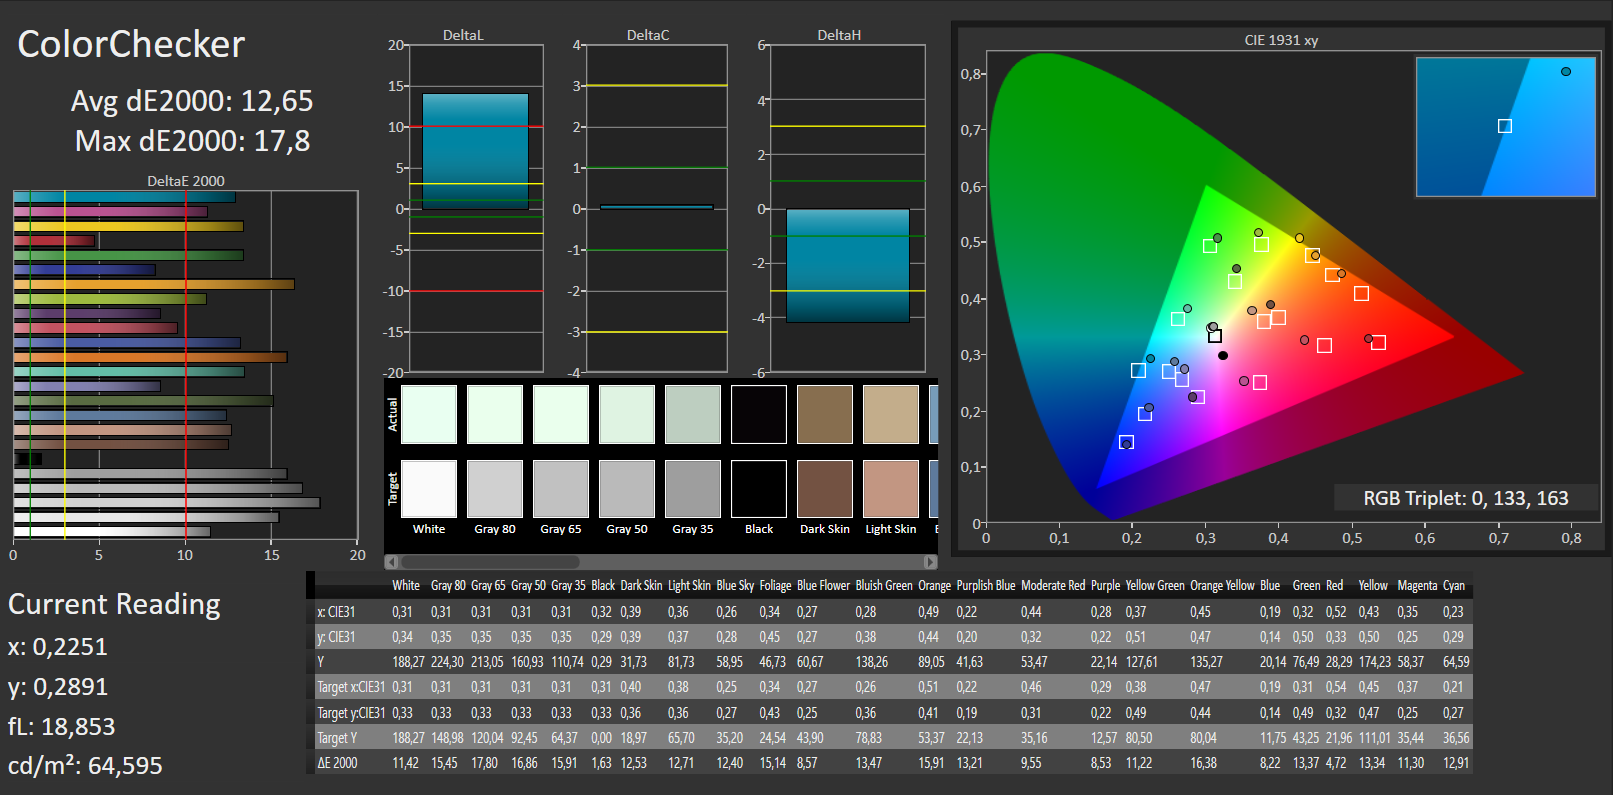
ΔE ColorChecker Calman: 12.65 | ∀{0.5-29.43 Ø4.71}
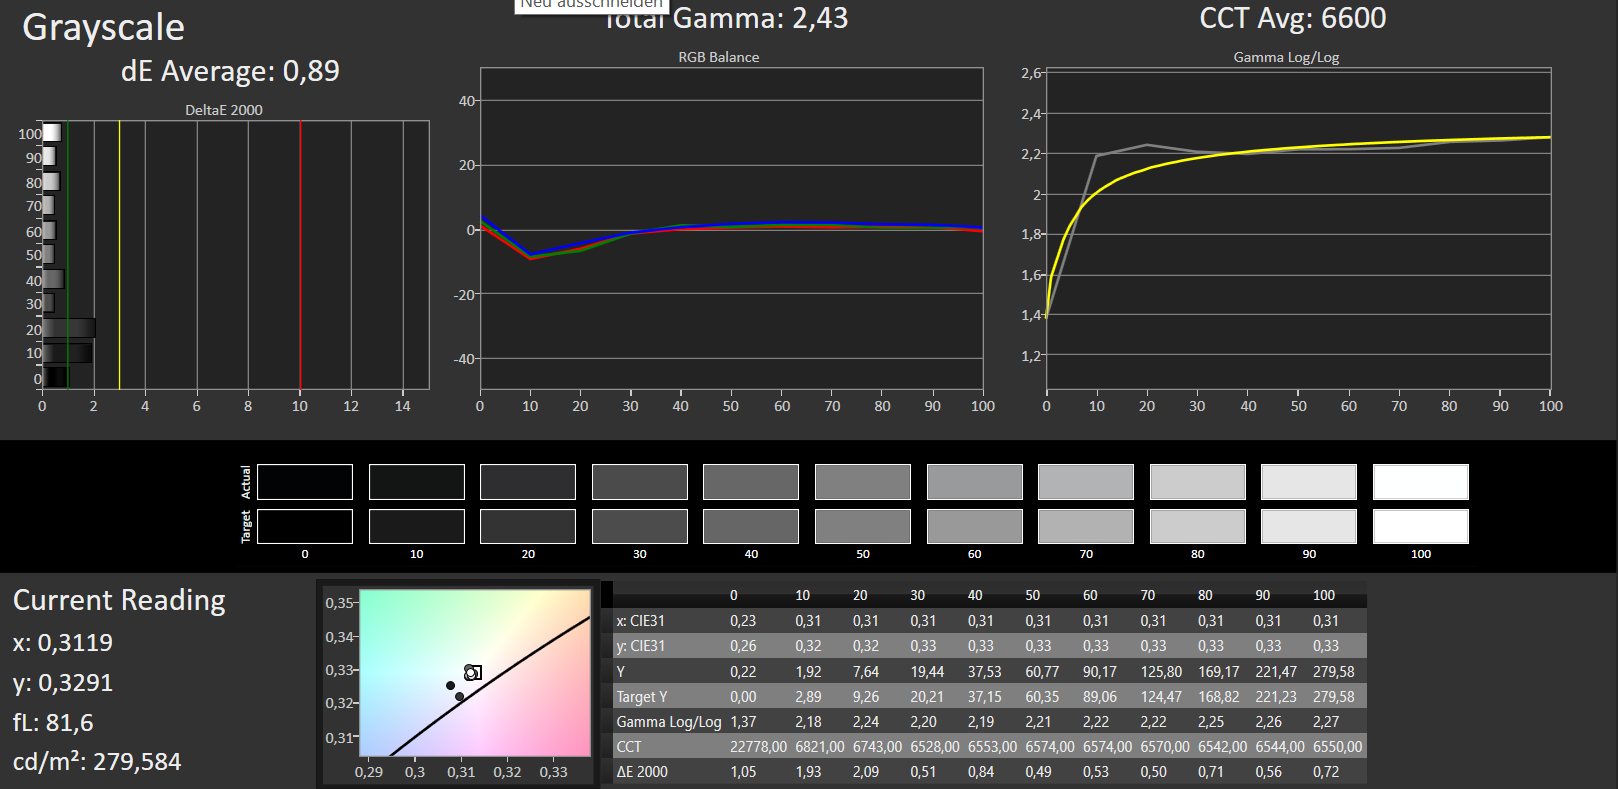
ΔE Greyscale Calman: 12.95 | ∀{0.09-98 Ø4.96}
89% sRGB (Argyll 1.6.3 3D)
58% AdobeRGB 1998 (Argyll 1.6.3 3D)
62.9% AdobeRGB 1998 (Argyll 3D)
89.1% sRGB (Argyll 3D)
61.5% Display P3 (Argyll 3D)
Gamma: 1.33
CCT: 6441 K
| Acer Spin 7 SP714-51-M09D AUO B140HAN03.2 / AUO323D, , 1920x1080, 14" | Asus Zenbook UX360UA-C4159T AU Optronics AOU272D / B133HAN02.7, , 1920x1080, 13.3" | HP Spectre x360 13-w023dx Chi Mei CMN1367, , 1920x1080, 13.3" | Lenovo ThinkPad X1 Yoga-20FRS1VS00 Samsung ATNA40JU01-0, , 2560x1440, 14" | Acer Aspire Switch Alpha 12 SA5-271-56HM Panasonic VVX12T041N00, , 2160x1440, 12" | Lenovo Miix 510 Pro 80U10006GE Unknown, , 1920x1200, 12.2" | |
|---|---|---|---|---|---|---|
| Display | 5% | 4% | 7% | 4% | ||
| Display P3 Coverage (%) | 61.5 | 64.8 5% | 65.4 6% | 65.5 7% | 64.5 5% | |
| sRGB Coverage (%) | 89.1 | 93.1 4% | 90.4 1% | 96.1 8% | 92 3% | |
| AdobeRGB 1998 Coverage (%) | 62.9 | 66 5% | 65.8 5% | 66.9 6% | 65.5 4% | |
| Response Times | 35% | 14% | 97% | 15% | 24% | |
| Response Time Grey 50% / Grey 80% * (ms) | 51 ? | 29 ? 43% | 33.2 ? 35% | 1 ? 98% | 20 ? 61% | 33 ? 35% |
| Response Time Black / White * (ms) | 26 ? | 19 ? 27% | 28 ? -8% | 1 ? 96% | 34 ? -31% | 23 ? 12% |
| PWM Frequency (Hz) | 50 ? | 240 ? | 1000 ? | 125 ? | ||
| Screen | 18% | 10% | 32% | 11% | 6% | |
| Brightness middle (cd/m²) | 344 | 344 0% | 334.6 -3% | 279 -19% | 345 0% | 327 -5% |
| Brightness (cd/m²) | 292 | 326 12% | 319 9% | 277 -5% | 328 12% | 324 11% |
| Brightness Distribution (%) | 72 | 86 19% | 90 25% | 91 26% | 91 26% | 88 22% |
| Black Level * (cd/m²) | 0.26 | 0.27 -4% | 0.336 -29% | 0.38 -46% | 0.35 -35% | |
| Contrast (:1) | 1323 | 1274 -4% | 996 -25% | 908 -31% | 934 -29% | |
| Colorchecker dE 2000 * | 12.65 | 5.53 56% | 6.21 51% | 5.15 59% | 8.4 34% | 6.54 48% |
| Colorchecker dE 2000 max. * | 17.8 | 10.01 44% | 12 33% | 8.28 53% | 11.9 33% | 15.59 12% |
| Greyscale dE 2000 * | 12.95 | 6.67 48% | 7.71 40% | 5.44 58% | 4.3 67% | 9.52 26% |
| Gamma | 1.33 165% | 2.43 91% | 2.36 93% | 2.28 96% | 2.63 84% | 2.35 94% |
| CCT | 6441 101% | 7012 93% | 6458 101% | 5686 114% | 7368 88% | 8802 74% |
| Color Space (Percent of AdobeRGB 1998) (%) | 58 | 60 3% | 58.6 1% | 98 69% | 62 7% | 59 2% |
| Color Space (Percent of sRGB) (%) | 89 | 93 4% | 90 1% | 100 12% | 92 3% | |
| Media total (Programa/Opciones) | 19% /
17% | 9% /
9% | 65% /
45% | 11% /
11% | 11% /
8% |
* ... más pequeño es mejor
Tiempos de respuesta del display
| ↔ Tiempo de respuesta de Negro a Blanco | ||
|---|---|---|
| 26 ms ... subida ↗ y bajada ↘ combinada | ↗ 6 ms subida | |
| ↘ 20 ms bajada | ||
| La pantalla mostró tiempos de respuesta relativamente lentos en nuestros tests pero podría ser demasiado lenta para los jugones. En comparación, todos los dispositivos de prueba van de ##min### (mínimo) a 240 (máximo) ms. » 63 % de todos los dispositivos son mejores. Eso quiere decir que el tiempo de respuesta es peor que la media (19.8 ms) de todos los dispositivos testados. | ||
| ↔ Tiempo de respuesta 50% Gris a 80% Gris | ||
| 51 ms ... subida ↗ y bajada ↘ combinada | ↗ 13 ms subida | |
| ↘ 38 ms bajada | ||
| La pantalla mostró tiempos de respuesta lentos en nuestros tests y podría ser demasiado lenta para los jugones. En comparación, todos los dispositivos de prueba van de ##min### (mínimo) a 636 (máximo) ms. » 87 % de todos los dispositivos son mejores. Eso quiere decir que el tiempo de respuesta es peor que la media (30.9 ms) de todos los dispositivos testados. | ||
Parpadeo de Pantalla / PWM (Pulse-Width Modulation)
| Parpadeo de Pantalla / PWM no detectado | ||
Comparación: 52 % de todos los dispositivos testados no usaron PWM para atenuar el display. Si se usó, medimos una media de 7744 (mínimo: 5 - máxmo: 343500) Hz. | ||
| PCMark 8 Home Score Accelerated v2 | 2979 puntos | |
| PCMark 8 Work Score Accelerated v2 | 4076 puntos | |
ayuda | ||
| Acer Spin 7 SP714-51-M09D Kingston RBUSNS4180S3256GG | Asus Zenbook UX360UA-C4159T SK Hynix Canvas SC300 512GB M.2 (HFS512G39MND) | HP Spectre x360 13-w023dx Samsung PM951 NVMe MZVLV512 | Acer Aspire Switch Alpha 12 SA5-271-56HM Kingston RBU-SNS8152S3256GG2 | Lenovo ThinkPad X1 Yoga-20FRS1VS00 Samsung SSD PM961 1TB M.2 PCIe 3.0 x4 NVMe (MZSLW1T0) | Dell XPS 13 9360 QHD+ i5 Toshiba NVMe THNSN5256GPUK | |
|---|---|---|---|---|---|---|
| CrystalDiskMark 3.0 | -5% | 73% | -17% | 84% | 59% | |
| Read Seq (MB/s) | 472.6 | 452.1 -4% | 1376 191% | 518 10% | 1510 220% | 1168 147% |
| Write Seq (MB/s) | 407.7 | 421.3 3% | 571 40% | 199.9 -51% | 1193 193% | 329 -19% |
| Read 512 (MB/s) | 309.5 | 288.6 -7% | 679 119% | 374.9 21% | 1015 228% | |
| Write 512 (MB/s) | 368.5 | 310.7 -16% | 571 55% | 201 -45% | 307 -17% | |
| Read 4k (MB/s) | 37.57 | 28.52 -24% | 42.66 14% | 29.3 -22% | 37 -2% | 33 -12% |
| Write 4k (MB/s) | 75.5 | 72.1 -5% | 137.9 83% | 76.8 2% | 126 67% | 132 75% |
| Read 4k QD32 (MB/s) | 324.8 | 389.6 20% | 535 65% | 272 -16% | 404 24% | 525 62% |
| Write 4k QD32 (MB/s) | 307.4 | 285.3 -7% | 361.2 18% | 197.1 -36% | 319 4% | 325 6% |

| 3DMark 06 1280x768 Score | 6524 puntos | |
| 3DMark Vantage P Result | 4123 puntos | |
| 3DMark 11 Performance | 1141 puntos | |
| 3DMark Ice Storm Standard Score | 37865 puntos | |
| 3DMark Cloud Gate Standard Score | 4050 puntos | |
ayuda | ||
| bajo | medio | alto | ultra | |
|---|---|---|---|---|
| Hitman: Absolution (2012) | 21.9 | 14 | 7.6 | |
| Crysis 3 (2013) | 21 | 12.7 | ||
| Tomb Raider (2013) | 51.8 | 23.6 | 16 | |
| BioShock Infinite (2013) | 32 | 19.3 | 16.1 | |
| Battlefield 4 (2013) | 22.3 | 16 | 11 | |
| Thief (2014) | 13.9 | 9.2 | ||
| Middle-earth: Shadow of Mordor (2014) | 23.5 | 13.7 | 6.8 | |
| Alien: Isolation (2014) | 26.3 | 19 | 9.7 | |
| Dragon Age: Inquisition (2014) | 17.6 | 12.2 | ||
| Battlefield Hardline (2015) | 19.7 | 15.5 | ||
| Dirt Rally (2015) | 71.6 | 16.26 | ||
| Metal Gear Solid V (2015) | 23.4 | 20.8 | 7.6 | |
| Call of Duty: Black Ops 3 (2015) | 8 graves problemas gráficos (no menue) | |||
| Fallout 4 (2015) | 10.1 | |||
| Star Wars Battlefront (2015) | 19.8 | 11.5 | ||
| Rise of the Tomb Raider (2016) | 11 | |||
| Doom (2016) | 12.9 | 10.1 | ||
| Deus Ex Mankind Divided (2016) | 9.1 | |||
| FIFA 17 (2016) | 36 pequeños problemas gráficos (slow down in game) | 29 pequeños problemas gráficos (slow down in game) | ||
| Battlefield 1 (2016) | 13 | 9.1 |
(-) La temperatura máxima en la parte superior es de 46.5 °C / 116 F, frente a la media de 35.9 °C / 97 F, que oscila entre 21.4 y 59 °C para la clase Subnotebook.
(±) El fondo se calienta hasta un máximo de 45 °C / 113 F, frente a la media de 39.2 °C / 103 F
(+) En reposo, la temperatura media de la parte superior es de 25.2 °C / 77# F, frente a la media del dispositivo de 30.8 °C / 87 F.
(+) El reposamanos y el panel táctil están a una temperatura inferior a la de la piel, con un máximo de 27.6 °C / 81.7 F y, por tanto, son fríos al tacto.
(±) La temperatura media de la zona del reposamanos de dispositivos similares fue de 28.2 °C / 82.8 F (+0.6 °C / 1.1 F).
Acer Spin 7 SP714-51-M09D análisis de audio
(-) | altavoces no muy altos (#66 dB)
Graves 100 - 315 Hz
(±) | lubina reducida - en promedio 13.9% inferior a la mediana
(±) | la linealidad de los graves es media (14.1% delta a frecuencia anterior)
Medios 400 - 2000 Hz
(±) | medias más altas - de media 5.4% más altas que la mediana
(±) | la linealidad de los medios es media (8.5% delta respecto a la frecuencia anterior)
Altos 2 - 16 kHz
(+) | máximos equilibrados - a sólo 1% de la mediana
(+) | los máximos son lineales (5.1% delta a la frecuencia anterior)
Total 100 - 16.000 Hz
(±) | la linealidad del sonido global es media (17.6% de diferencia con la mediana)
En comparación con la misma clase
» 49% de todos los dispositivos probados de esta clase eran mejores, 7% similares, 44% peores
» El mejor tuvo un delta de 5%, la media fue 18%, el peor fue ###max##%
En comparación con todos los dispositivos probados
» 35% de todos los dispositivos probados eran mejores, 8% similares, 57% peores
» El mejor tuvo un delta de 4%, la media fue 23%, el peor fue ###max##%
Asus Zenbook UX360UA-C4159T análisis de audio
(-) | altavoces no muy altos (#66 dB)
Graves 100 - 315 Hz
(±) | lubina reducida - en promedio 14.1% inferior a la mediana
(±) | la linealidad de los graves es media (14.2% delta a frecuencia anterior)
Medios 400 - 2000 Hz
(+) | medios equilibrados - a sólo 3.3% de la mediana
(±) | la linealidad de los medios es media (7.2% delta respecto a la frecuencia anterior)
Altos 2 - 16 kHz
(+) | máximos equilibrados - a sólo 2.9% de la mediana
(+) | los máximos son lineales (3.8% delta a la frecuencia anterior)
Total 100 - 16.000 Hz
(±) | la linealidad del sonido global es media (17.4% de diferencia con la mediana)
En comparación con la misma clase
» 33% de todos los dispositivos probados de esta clase eran mejores, 8% similares, 58% peores
» El mejor tuvo un delta de 6%, la media fue 20%, el peor fue ###max##%
En comparación con todos los dispositivos probados
» 33% de todos los dispositivos probados eran mejores, 8% similares, 58% peores
» El mejor tuvo un delta de 4%, la media fue 23%, el peor fue ###max##%
HP Spectre x360 13-w023dx análisis de audio
(±) | la sonoridad del altavoz es media pero buena (76.2 dB)
Graves 100 - 315 Hz
(-) | casi sin bajos - de media 17% inferior a la mediana
(±) | la linealidad de los graves es media (12.7% delta a frecuencia anterior)
Medios 400 - 2000 Hz
(+) | medios equilibrados - a sólo 3.7% de la mediana
(+) | los medios son lineales (6.3% delta a la frecuencia anterior)
Altos 2 - 16 kHz
(+) | máximos equilibrados - a sólo 2.4% de la mediana
(±) | la linealidad de los máximos es media (7.2% delta a frecuencia anterior)
Total 100 - 16.000 Hz
(±) | la linealidad del sonido global es media (21.9% de diferencia con la mediana)
En comparación con la misma clase
» 63% de todos los dispositivos probados de esta clase eran mejores, 7% similares, 30% peores
» El mejor tuvo un delta de 6%, la media fue 20%, el peor fue ###max##%
En comparación con todos los dispositivos probados
» 63% de todos los dispositivos probados eran mejores, 7% similares, 30% peores
» El mejor tuvo un delta de 4%, la media fue 23%, el peor fue ###max##%
| Off / Standby | |
| Ocioso | |
| Carga |
|
Clave:
min: | |
| Acer Spin 7 SP714-51-M09D i5-7Y54, HD Graphics 615, Kingston RBUSNS4180S3256GG, IPS, 1920x1080, 14" | Asus Zenbook UX360UA-C4159T 6500U, HD Graphics 520, SK Hynix Canvas SC300 512GB M.2 (HFS512G39MND), IPS, 1920x1080, 13.3" | HP Spectre x360 13-w023dx i7-7500U, HD Graphics 620, Samsung PM951 NVMe MZVLV512, IPS, 1920x1080, 13.3" | Lenovo ThinkPad X1 Yoga-20FRS1VS00 6600U, HD Graphics 520, Samsung SSD PM961 1TB M.2 PCIe 3.0 x4 NVMe (MZSLW1T0), OLED, 2560x1440, 14" | Acer Aspire Switch Alpha 12 SA5-271-56HM 6200U, HD Graphics 520, Kingston RBU-SNS8152S3256GG2, IPS, 2160x1440, 12" | Lenovo Miix 510 Pro 80U10006GE 6200U, HD Graphics 520, Samsung PM951 NVMe MZVLV256, IPS, 1920x1200, 12.2" | |
|---|---|---|---|---|---|---|
| Power Consumption | -29% | -24% | -49% | -36% | -33% | |
| Idle Minimum * (Watt) | 4.3 | 6.9 -60% | 5.5 -28% | 4.7 -9% | 7.3 -70% | 4.2 2% |
| Idle Average * (Watt) | 7.4 | 7.9 -7% | 6.7 9% | 8.6 -16% | 10 -35% | 11.5 -55% |
| Idle Maximum * (Watt) | 8 | 8.3 -4% | 7.1 11% | 12.2 -53% | 10.15 -27% | 11.7 -46% |
| Load Average * (Watt) | 22.1 | 30.1 -36% | 33.1 -50% | 29.7 -34% | 25.2 -14% | 31 -40% |
| Load Maximum * (Watt) | 21.7 | 29.6 -36% | 35.2 -62% | 50.5 -133% | 29.3 -35% | 27.4 -26% |
* ... más pequeño es mejor
| Acer Spin 7 SP714-51-M09D i5-7Y54, HD Graphics 615, 42 Wh | Asus Zenbook UX360UA-C4159T 6500U, HD Graphics 520, 57 Wh | HP Spectre x360 13-w023dx i7-7500U, HD Graphics 620, 57.8 Wh | Lenovo ThinkPad X1 Yoga-20FRS1VS00 6600U, HD Graphics 520, 56 Wh | Acer Aspire Switch Alpha 12 SA5-271-56HM 6200U, HD Graphics 520, 37 Wh | Lenovo Miix 510 Pro 80U10006GE 6200U, HD Graphics 520, 50 Wh | |
|---|---|---|---|---|---|---|
| Duración de Batería | 36% | 27% | -9% | -20% | -18% | |
| Reader / Idle (h) | 12.5 | 19.4 55% | 20.6 65% | 13.7 10% | 10.7 -14% | 11.6 -7% |
| WiFi v1.3 (h) | 6.5 | 9.7 49% | 9.3 43% | 5.3 -18% | 5.4 -17% | 5.4 -17% |
| Load (h) | 2.7 | 2.8 4% | 2 -26% | 2.2 -19% | 1.9 -30% | 1.9 -30% |
| H.264 (h) | 8.7 | 7.8 |
Pro
Contra

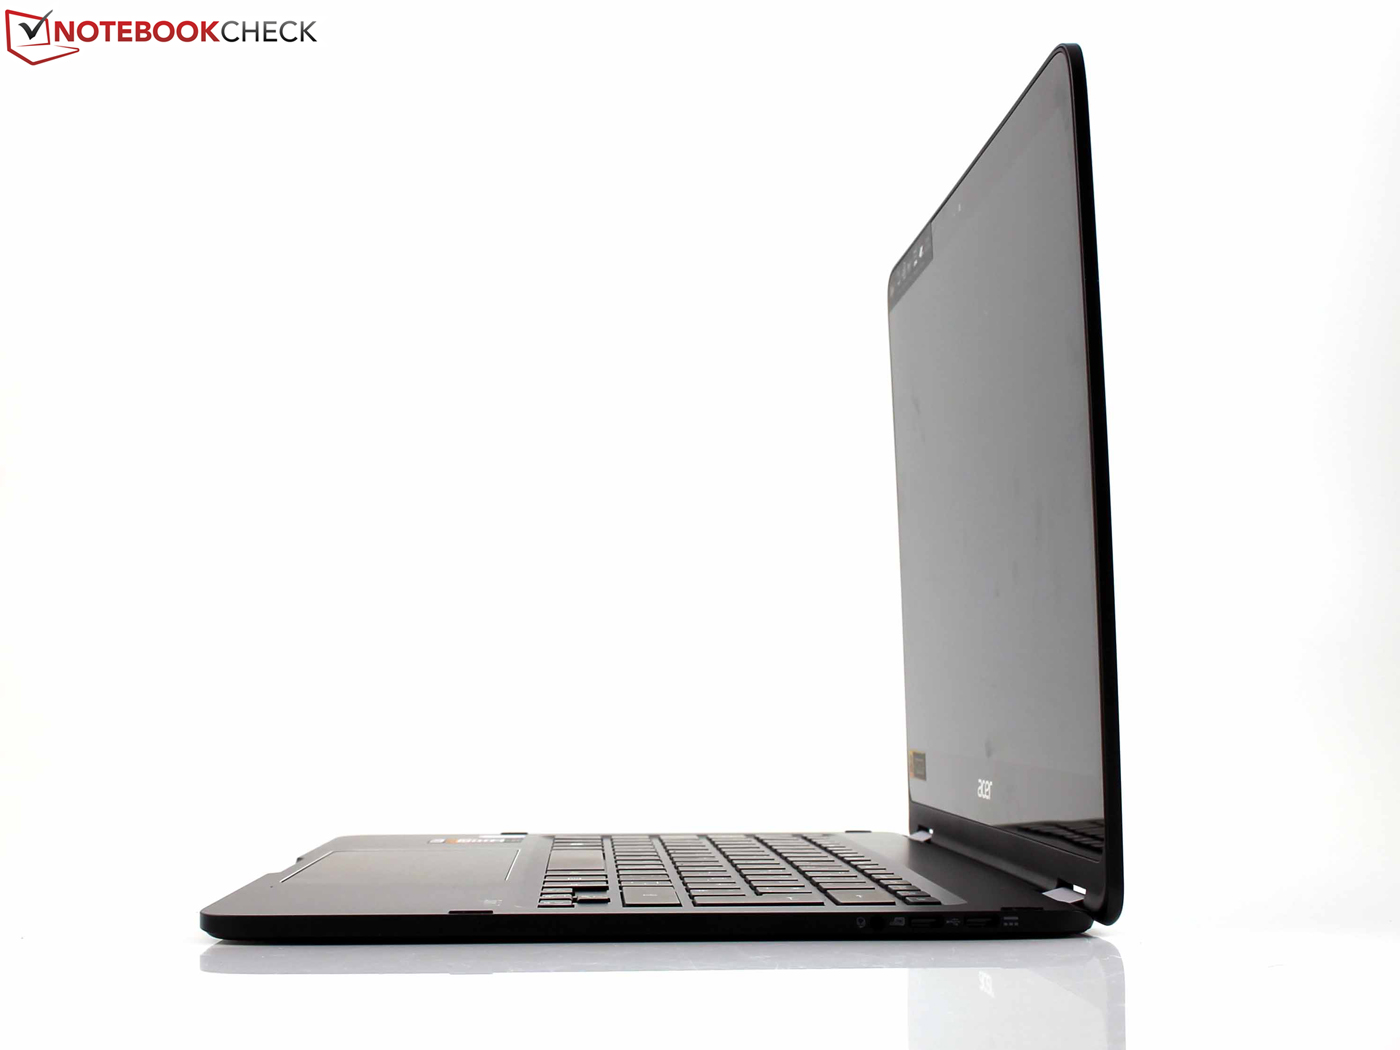
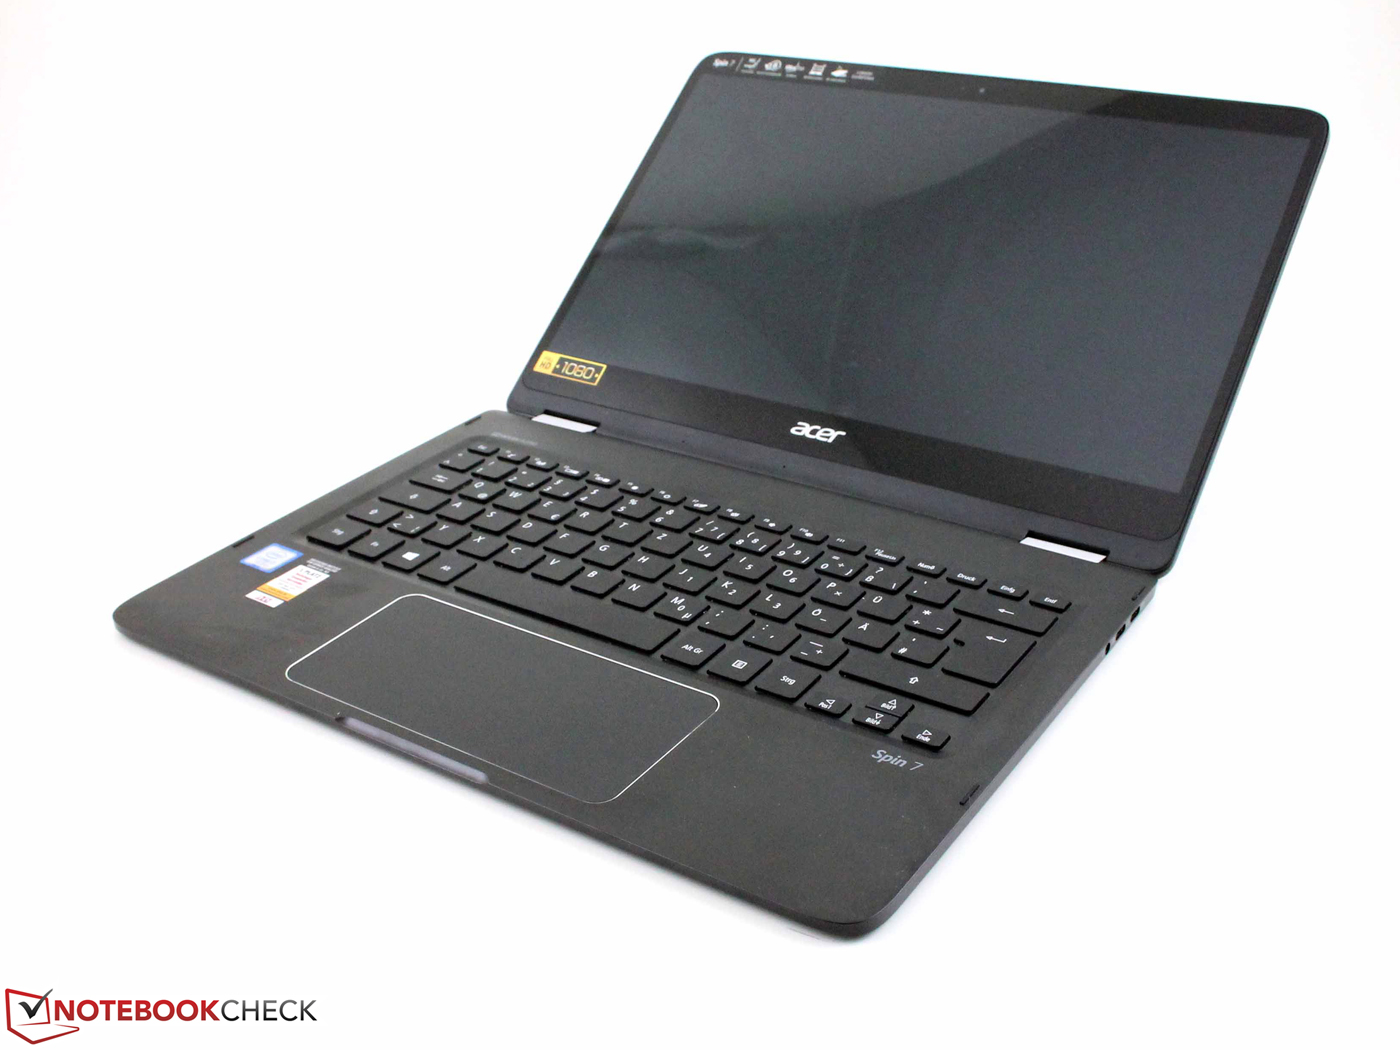
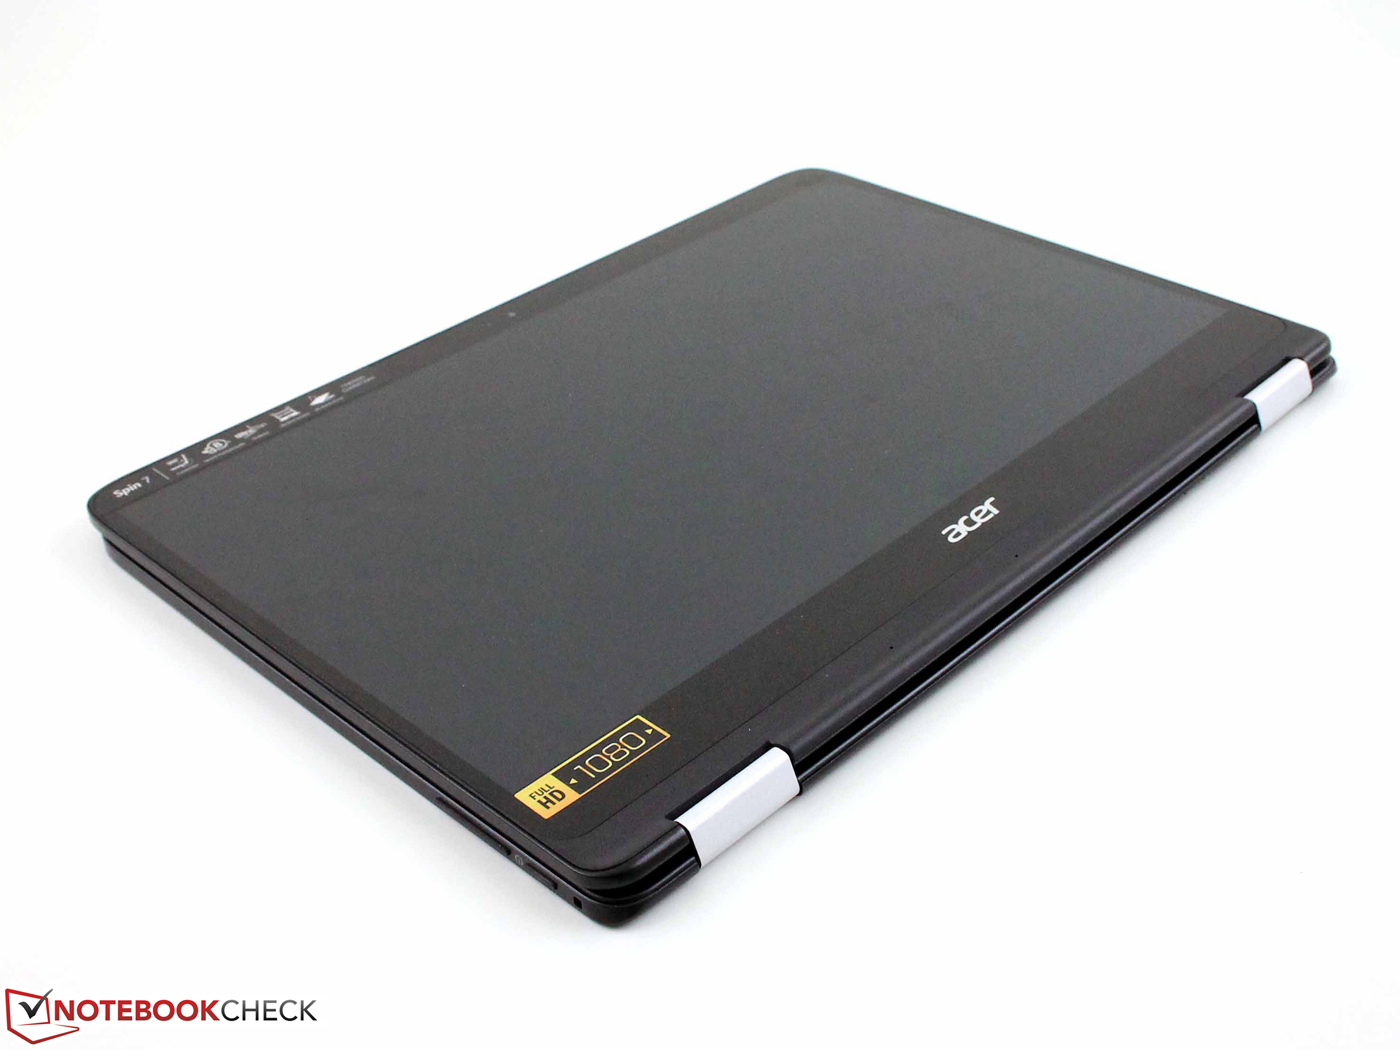
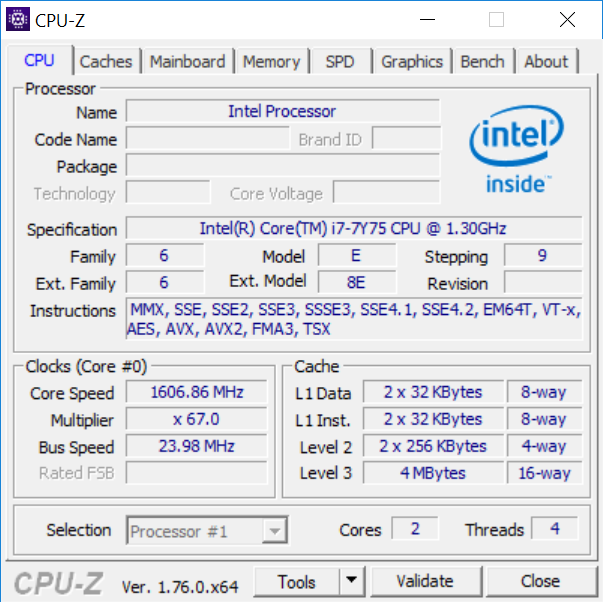
Es un concepto ambicioso, pero el diablo está en los detalles. El Acer Spin 7 (sin "Aspire") es una serie nueva de convertibles ultra delgados de 360º. Analizamos el modelo de 14" SP714-51-M09D, que tuvo un inicio un poco movidito con la CPU Kaby Lake Y (TDP 4.5W) en términos de rendimiento CPU y de aplicación: el predecesor Skylake es a veces más rápido. Nos gustó el chasis compacto y ligero, pero el delgado panel inferior y la falta de estabilidad del chasis afectan a la buena impresión visual.
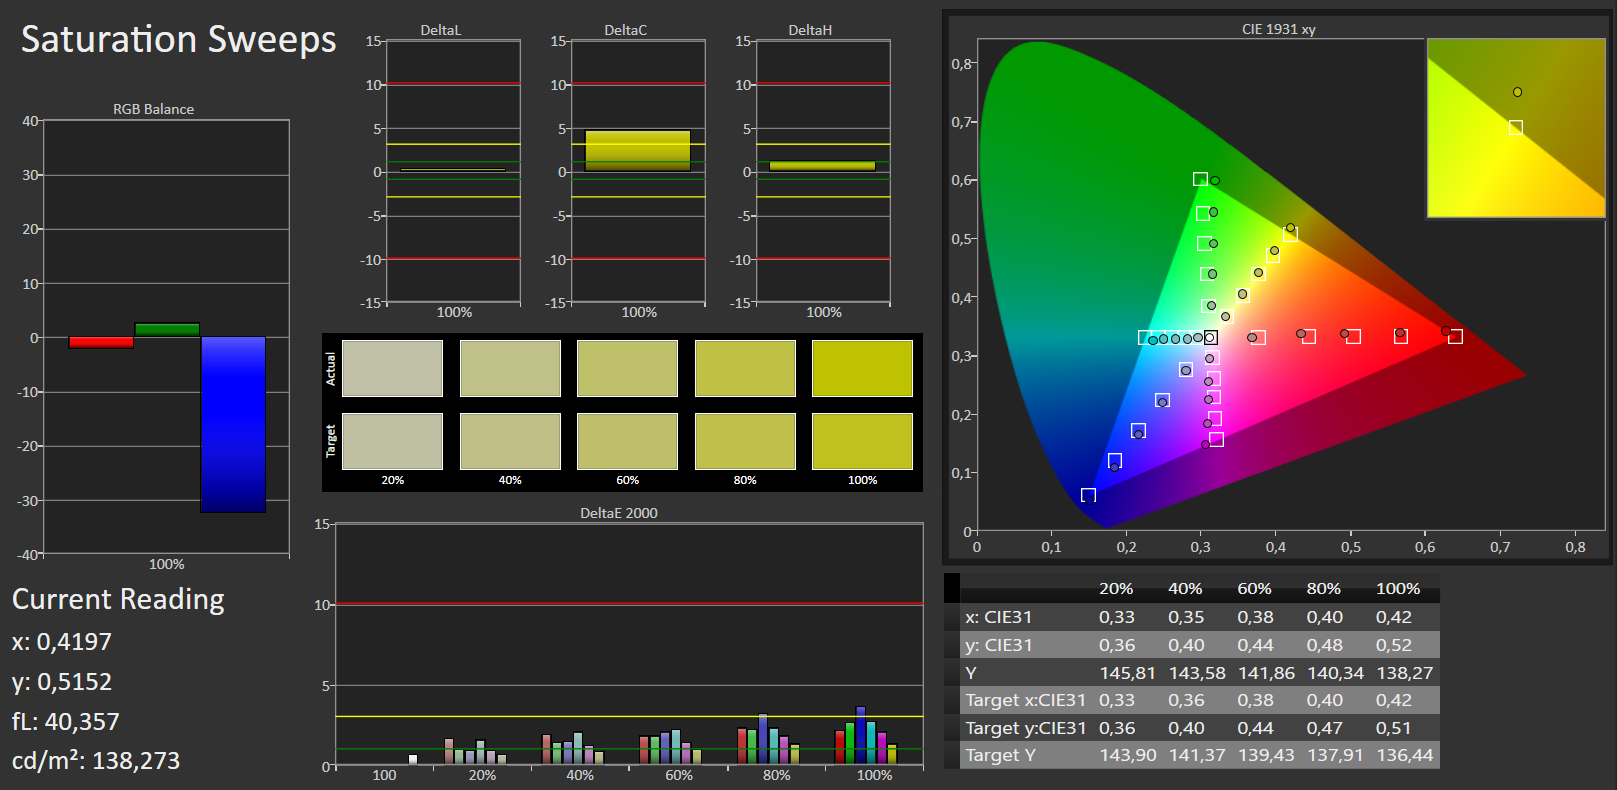
El delgado chasis tiene buena pinta, pero echamos a faltar más estabilidad. El display es realmente bueno, pero sufre de fuertes desviaciones de color de fábrica, si bien un calibrado puede ayudar.
El buen y enorme clickpad con la respuesta clara queda frustrado por un teclado de escaso desplazamiento y respuesta limitada. El display básicamente resplandece, pero también convence con altos cntrastes. Los colores por desgracia no son muy precisos de fábrica. Un calibrado puede cambiar eso, pero ¿qué cliente tiene un espectofotómetro en casa? Puedes mejorar la situación con el perfil enlazado en la caja, aunque los resultados no serán tan buenos como un calibrado manual.
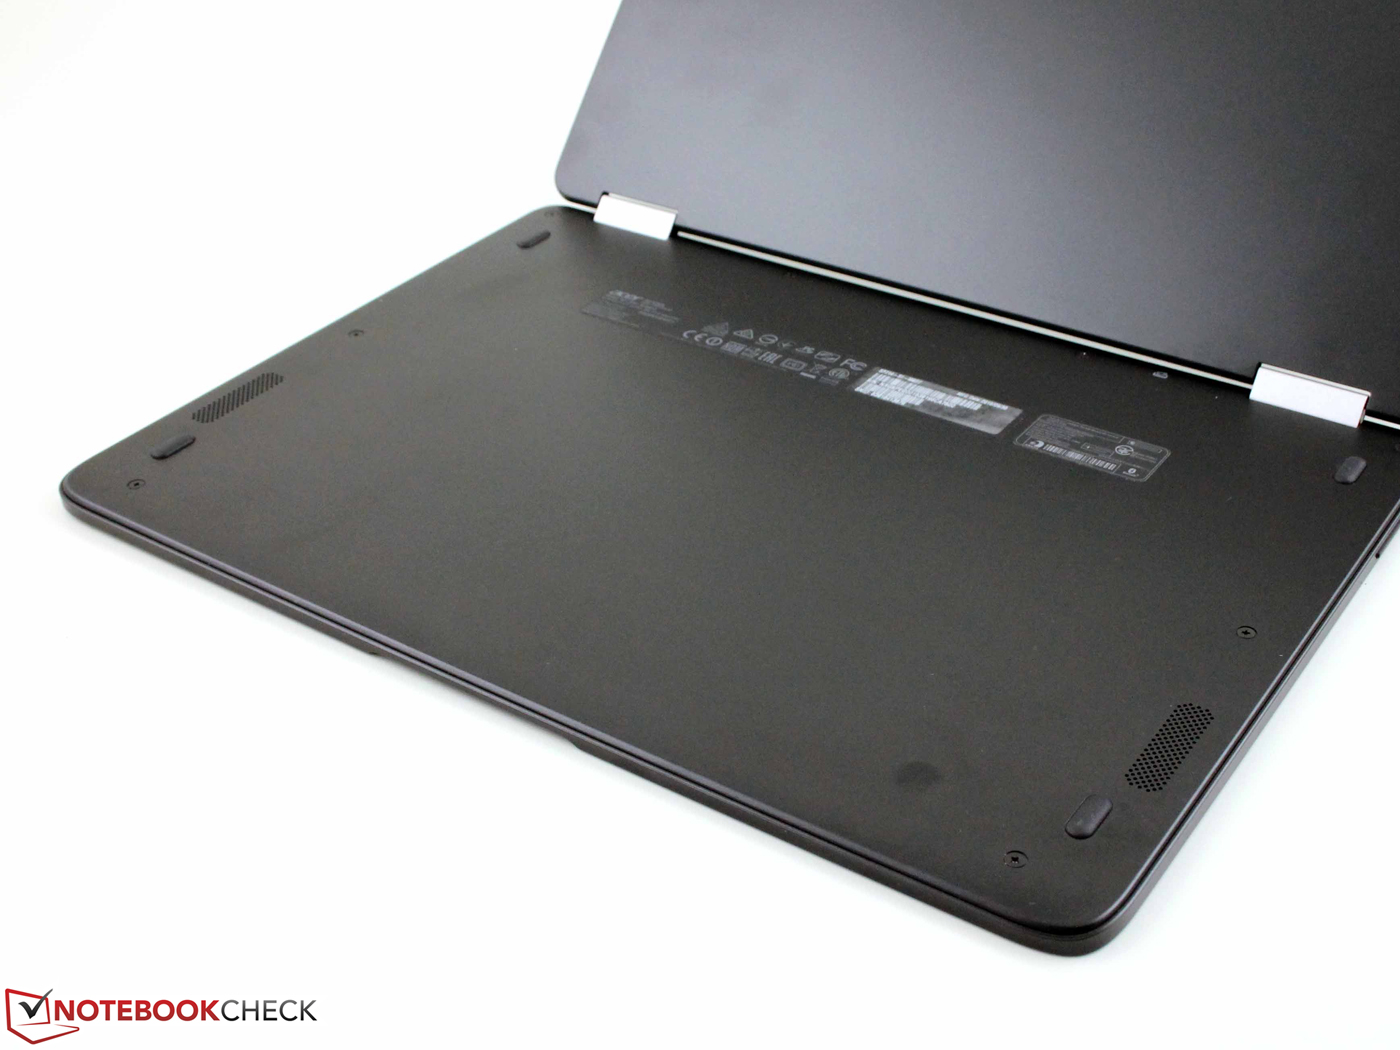
El fácil mantenimiento a través del gran panel inferior es ejemplar. Sólo está la mala webcam y el débil sonido del altavoz.
Kaby Lake ULV no puede convencernos del todo; el SoC suele quedar al fondo del ranking, incluso comparado con el anterior Core m5.
El sistema de 14" SP714-51-M09D actualmente cuesta unos 1200 Euros. El rival de Acer, Zenbook UX360UA-C4159T con SSD 512 GB y Core i7-6500U más potente, cuesta 1130 Euros, y también logra un mayor aguante y colores más precisos de fábrica (perfil de fábrica de Asus). Si Asus arregla la bisagra endeble, el Asus UX360UA claramente sería la mejor recomendación.
¿Es pues el HP Spectre x360 13 una mejor alternativa? La versión Kaby Lake no se encuentra disponible aún, pero el predecesor ya arranca en 1000 Euros. Este modelo viene equipado con la 6200U más rápida, 256 GB de SSD y un mejor teclado. El aguante de batería también es muy superior al del Spin 7. Excepto por el mantenimiento y el concepto sin ventilador, no hay muchos argumentos a favor del Acer Spin 7. Ahora mismo es demasiado caro; debería costar unos 1000 Euros.
Ésta es una versión acortada del análisis original. Puedes leer el análisis completo en inglés aquí.
Acer Spin 7 SP714-51-M09D
- 10/24/2016 v5.1 (old)
Sebastian Jentsch
Price comparison
