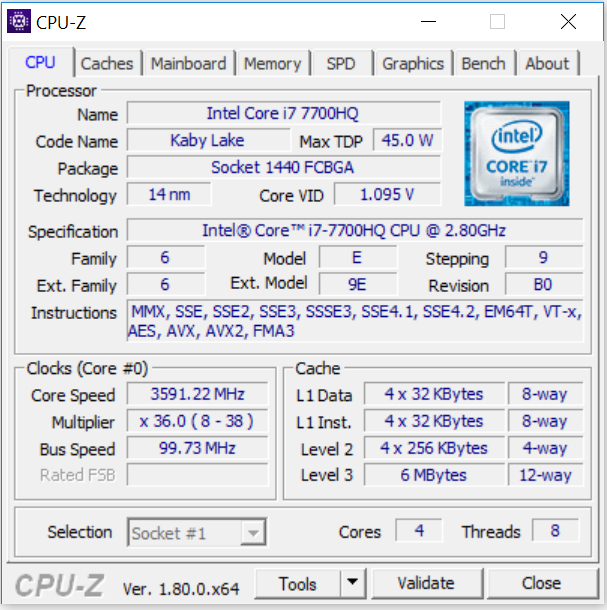
Breve análisis del Gigabyte Aero 14K (i7-7700HQ, GTX 1050 Ti, QHD)
| SD Card Reader | |
| average JPG Copy Test (av. of 3 runs) | |
| Gigabyte Aero 14-K7 (Toshiba Exceria Pro SDXC 64 GB UHS-II)) | |
| Schenker XMG P407 (Toshiba Exceria Pro SDXC 64 GB UHS-II) | |
| Gigabyte Aero 14 (Toshiba Exceria Pro SDXC 64 GB UHS-II) | |
| MSI GS43VR 7RE-069US (Toshiba Exceria Pro SDXC 64 GB UHS-II) | |
| maximum AS SSD Seq Read Test (1GB) | |
| Gigabyte Aero 14-K7 (Toshiba Exceria Pro SDXC 64 GB UHS-II)) | |
| Schenker XMG P407 (Toshiba Exceria Pro SDXC 64 GB UHS-II) | |
| Gigabyte Aero 14 (Toshiba Exceria Pro SDXC 64 GB UHS-II) | |
| MSI GS43VR 7RE-069US (Toshiba Exceria Pro SDXC 64 GB UHS-II) | |
| Networking | |
| iperf3 transmit AX12 | |
| MSI GS43VR 7RE-069US | |
| Gigabyte Aero 14 | |
| Schenker XMG P407 | |
| Gigabyte Aero 14-K7 | |
| iperf3 receive AX12 | |
| Gigabyte Aero 14 | |
| Gigabyte Aero 14-K7 | |
| MSI GS43VR 7RE-069US | |
| Schenker XMG P407 | |
| |||||||||||||||||||||||||
iluminación: 84 %
Brillo con batería: 277 cd/m²
Contraste: 1026:1 (Negro: 0.27 cd/m²)
ΔE ColorChecker Calman: 4.26 | ∀{0.5-29.43 Ø4.72}
ΔE Greyscale Calman: 4.32 | ∀{0.09-98 Ø4.97}
91% sRGB (Argyll 1.6.3 3D)
59% AdobeRGB 1998 (Argyll 1.6.3 3D)
65.9% AdobeRGB 1998 (Argyll 3D)
91.2% sRGB (Argyll 3D)
65.1% Display P3 (Argyll 3D)
Gamma: 2.37
CCT: 7298 K
| Gigabyte Aero 14-K7 IPS, 2560x1440, 14" | Razer Blade (2017) IPS, 1920x1080, 14" | MSI GS43VR 7RE-069US IPS, 1920x1080, 14" | Schenker XMG P407 IPS, 1920x1080, 14" | Gigabyte Aero 14 IPS, 2560x1440, 14" | |
|---|---|---|---|---|---|
| Display | -3% | -7% | -0% | ||
| Display P3 Coverage (%) | 65.1 | 66.3 2% | 64.5 -1% | 64.4 -1% | |
| sRGB Coverage (%) | 91.2 | 85.9 -6% | 82.1 -10% | 91.8 1% | |
| AdobeRGB 1998 Coverage (%) | 65.9 | 62.8 -5% | 60 -9% | 65.5 -1% | |
| Response Times | 20% | 23% | -13% | -1% | |
| Response Time Grey 50% / Grey 80% * (ms) | 40 ? | 25.2 ? 37% | 31.6 ? 21% | 47 ? -18% | 41 ? -2% |
| Response Time Black / White * (ms) | 25.2 ? | 24.8 ? 2% | 19.2 ? 24% | 27 ? -7% | 25 ? 1% |
| PWM Frequency (Hz) | 130 ? | 21370 | 21190 ? | ||
| Screen | -1% | 8% | 0% | -3% | |
| Brightness middle (cd/m²) | 277 | 272 -2% | 306.6 11% | 298 8% | 290 5% |
| Brightness (cd/m²) | 252 | 277 10% | 291 15% | 282 12% | 257 2% |
| Brightness Distribution (%) | 84 | 84 0% | 86 2% | 80 -5% | 79 -6% |
| Black Level * (cd/m²) | 0.27 | 0.26 4% | 0.28 -4% | 0.27 -0% | 0.3 -11% |
| Contrast (:1) | 1026 | 1046 2% | 1095 7% | 1104 8% | 967 -6% |
| Colorchecker dE 2000 * | 4.26 | 4.59 -8% | 3.9 8% | 4.42 -4% | 4.59 -8% |
| Colorchecker dE 2000 max. * | 8.37 | 8.49 -1% | 9 -8% | 8.57 -2% | 8.68 -4% |
| Greyscale dE 2000 * | 4.32 | 4.28 1% | 2 54% | 4.11 5% | 4.32 -0% |
| Gamma | 2.37 93% | 2.23 99% | 2.14 103% | 2.5 88% | 2.25 98% |
| CCT | 7298 89% | 6848 95% | 6626 98% | 6329 103% | 7320 89% |
| Color Space (Percent of AdobeRGB 1998) (%) | 59 | 55 -7% | 56.1 -5% | 54 -8% | 59 0% |
| Color Space (Percent of sRGB) (%) | 91 | 83 -9% | 86.1 -5% | 82 -10% | 92 1% |
| Media total (Programa/Opciones) | 10% /
2% | 9% /
7% | -7% /
-3% | -1% /
-2% |
* ... más pequeño es mejor
Parpadeo de Pantalla / PWM (Pulse-Width Modulation)
| Parpadeo de Pantalla / PWM detectado | 130 Hz | ≤ 95 % de brillo | 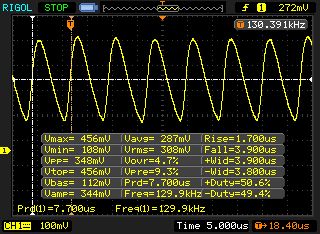 |
La retroiluminación del display parpadea a 130 Hz (seguramente usa PWM - Pulse-Width Modulation) a un brillo del 95 % e inferior. Sobre este nivel de brillo no debería darse parpadeo / PWM. La frecuencia de 130 Hz es bajísima, por lo que el parpadeo puede causar fatiga visual y cefaleas cuando se usa mucho tiempo. Comparación: 52 % de todos los dispositivos testados no usaron PWM para atenuar el display. Si se usó, medimos una media de 7763 (mínimo: 5 - máxmo: 343500) Hz. | |||
Tiempos de respuesta del display
| ↔ Tiempo de respuesta de Negro a Blanco | ||
|---|---|---|
| 25.2 ms ... subida ↗ y bajada ↘ combinada | ↗ 13.2 ms subida | 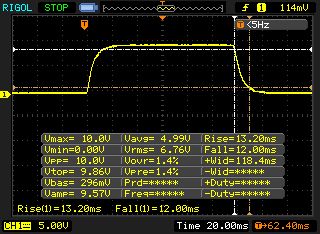 |
| ↘ 12 ms bajada | ||
| La pantalla mostró tiempos de respuesta relativamente lentos en nuestros tests pero podría ser demasiado lenta para los jugones. En comparación, todos los dispositivos de prueba van de ##min### (mínimo) a 240 (máximo) ms. » 61 % de todos los dispositivos son mejores. Eso quiere decir que el tiempo de respuesta es peor que la media (19.8 ms) de todos los dispositivos testados. | ||
| ↔ Tiempo de respuesta 50% Gris a 80% Gris | ||
| 40 ms ... subida ↗ y bajada ↘ combinada | ↗ 19.6 ms subida | 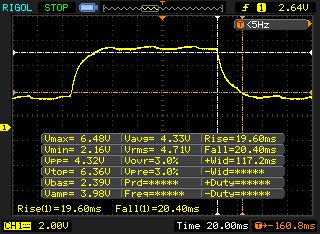 |
| ↘ 20.4 ms bajada | ||
| La pantalla mostró tiempos de respuesta lentos en nuestros tests y podría ser demasiado lenta para los jugones. En comparación, todos los dispositivos de prueba van de ##min### (mínimo) a 636 (máximo) ms. » 61 % de todos los dispositivos son mejores. Eso quiere decir que el tiempo de respuesta es peor que la media (31 ms) de todos los dispositivos testados. | ||
| Cinebench R15 | |
| CPU Single 64Bit | |
| Gigabyte Aero 14-K7 | |
| Gigabyte Aero 14 | |
| Razer Blade (2017) | |
| MSI GS43VR 7RE-069US | |
| Schenker XMG P407 | |
| CPU Multi 64Bit | |
| Gigabyte Aero 14-K7 | |
| Schenker XMG P407 | |
| MSI GS43VR 7RE-069US | |
| Gigabyte Aero 14 | |
| Razer Blade (2017) | |
| Cinebench R11.5 | |
| CPU Multi 64Bit | |
| Gigabyte Aero 14-K7 | |
| MSI GS43VR 7RE-069US | |
| Schenker XMG P407 | |
| CPU Single 64Bit | |
| MSI GS43VR 7RE-069US | |
| Gigabyte Aero 14-K7 | |
| Schenker XMG P407 | |
| Cinebench R10 | |
| Rendering Multiple CPUs 32Bit | |
| Gigabyte Aero 14-K7 | |
| MSI GS43VR 7RE-069US | |
| Schenker XMG P407 | |
| Rendering Single 32Bit | |
| Gigabyte Aero 14-K7 | |
| MSI GS43VR 7RE-069US | |
| Schenker XMG P407 | |
| Geekbench 3 | |
| 32 Bit Multi-Core Score | |
| Gigabyte Aero 14-K7 | |
| Schenker XMG P407 | |
| 32 Bit Single-Core Score | |
| Gigabyte Aero 14-K7 | |
| Schenker XMG P407 | |
| Geekbench 4.0 | |
| 64 Bit Multi-Core Score | |
| Gigabyte Aero 14-K7 | |
| Schenker XMG P407 | |
| 64 Bit Single-Core Score | |
| Gigabyte Aero 14-K7 | |
| Schenker XMG P407 | |
| Geekbench 4.4 | |
| 64 Bit Multi-Core Score | |
| Gigabyte Aero 14-K7 | |
| 64 Bit Single-Core Score | |
| Gigabyte Aero 14-K7 | |
| JetStream 1.1 - 1.1 Total | |
| Gigabyte Aero 14-K7 | |
| Schenker XMG P407 | |
| MSI GS43VR 7RE-069US | |
| PCMark 7 Score | 6103 puntos | |
| PCMark 8 Home Score Accelerated v2 | 3962 puntos | |
| PCMark 8 Creative Score Accelerated v2 | 5282 puntos | |
| PCMark 8 Work Score Accelerated v2 | 4822 puntos | |
| PCMark 10 Score | 4339 puntos | |
ayuda | ||
| PCMark 8 | |
| Home Score Accelerated v2 | |
| Schenker XMG P407 | |
| Gigabyte Aero 14-K7 | |
| Razer Blade (2017) | |
| MSI GS43VR 7RE-069US | |
| Gigabyte Aero 14 | |
| Work Score Accelerated v2 | |
| Schenker XMG P407 | |
| Razer Blade (2017) | |
| Gigabyte Aero 14-K7 | |
| Gigabyte Aero 14 | |
| MSI GS43VR 7RE-069US | |

| Gigabyte Aero 14-K7 Samsung SM961 MZVPW256HEGL | Razer Blade (2017) Samsung PM951 NVMe MZVLV256 | Schenker XMG P407 Samsung SM961 MZVPW256 m.2 PCI-e | Gigabyte Aero 14 LiteOn CX2-8B256 | |
|---|---|---|---|---|
| CrystalDiskMark 3.0 | -29% | -3% | -2% | |
| Read Seq (MB/s) | 1971 | 1122 -43% | 1345 -32% | 1584 -20% |
| Write Seq (MB/s) | 1541 | 311 -80% | 1502 -3% | 795 -48% |
| Read 512 (MB/s) | 432.6 | 682 58% | 320.3 -26% | 985 128% |
| Write 512 (MB/s) | 1283 | 310 -76% | 1276 -1% | 814 -37% |
| Read 4k (MB/s) | 55.4 | 34.8 -37% | 58.9 6% | 44.93 -19% |
| Write 4k (MB/s) | 141.7 | 134.3 -5% | 171 21% | 131.2 -7% |
| Read 4k QD32 (MB/s) | 603 | 565 -6% | 625 4% | 602 0% |
| Write 4k QD32 (MB/s) | 513 | 308 -40% | 539 5% | 441 -14% |
| 3DMark 06 Standard Score | 27789 puntos | |
| 3DMark 11 Performance | 9524 puntos | |
| 3DMark Ice Storm Standard Score | 116034 puntos | |
| 3DMark Cloud Gate Standard Score | 22642 puntos | |
| 3DMark Fire Strike Score | 6667 puntos | |
| 3DMark Fire Strike Extreme Score | 3516 puntos | |
| 3DMark Time Spy Score | 2484 puntos | |
ayuda | ||
| 3DMark 11 - 1280x720 Performance GPU | |
| MSI GS43VR 7RE-069US | |
| Gigabyte Aero 14 | |
| Razer Blade (2017) | |
| Schenker XMG P407 | |
| Gigabyte Aero 14-K7 | |
| 3DMark - 1920x1080 Fire Strike Graphics | |
| MSI GS43VR 7RE-069US | |
| Gigabyte Aero 14 | |
| Razer Blade (2017) | |
| Schenker XMG P407 | |
| Gigabyte Aero 14-K7 | |
| BioShock Infinite - 1920x1080 Ultra Preset, DX11 (DDOF) | |
| MSI GS43VR 7RE-069US | |
| Schenker XMG P407 | |
| Gigabyte Aero 14-K7 | |
| Acer Nitro 5 AN515-51-788E | |
| The Witcher 3 - 1920x1080 High Graphics & Postprocessing (Nvidia HairWorks Off) | |
| MSI GS43VR 7RE-069US | |
| Razer Blade (2017) | |
| Acer Nitro 5 AN515-51-788E | |
| Gigabyte Aero 14-K7 | |
| Prey - 1920x1080 Very High Preset AA:2TX SM AF:16x | |
| MSI GS43VR 7RE-069US | |
| Gigabyte Aero 14-K7 | |
| Acer Nitro 5 AN515-51-788E | |
| F1 2017 - 1920x1080 Ultra High Preset AA:T AF:16x | |
| Acer Nitro 5 AN515-51-788E | |
| Gigabyte Aero 14-K7 | |
| bajo | medio | alto | ultra | |
|---|---|---|---|---|
| Tomb Raider (2013) | 439.9 | 304.3 | 202.2 | 90.7 |
| BioShock Infinite (2013) | 267.7 | 207.7 | 188.5 | 74.4 |
| The Witcher 3 (2015) | 141 | 82.8 | 45.7 | 26.1 |
| Prey (2017) | 142.4 | 101.9 | 80.7 | 67.7 |
| F1 2017 (2017) | 184 | 90 | 70 | 44 |
| FIFA 18 (2017) | 293 | 232.4 | 188.6 | 156.8 |
Ruido
| Ocioso |
| 32 / 33 / 38 dB(A) |
| Carga |
| 46 / 53 dB(A) |
 | ||
30 dB silencioso 40 dB(A) audible 50 dB(A) ruidosamente alto |
||
min: | ||
| Gigabyte Aero 14-K7 i7-7700HQ, GeForce GTX 1050 Ti Mobile | Razer Blade (2017) i7-7700HQ, GeForce GTX 1060 Mobile | MSI GS43VR 7RE-069US i7-7700HQ, GeForce GTX 1060 Mobile | Schenker XMG P407 i7-7700HQ, GeForce GTX 1050 Ti Mobile | Gigabyte Aero 14 i7-7700HQ, GeForce GTX 1060 Mobile | |
|---|---|---|---|---|---|
| Noise | 6% | -5% | 5% | 4% | |
| apagado / medio ambiente * (dB) | 30 | 28 7% | 29 3% | 31 -3% | |
| Idle Minimum * (dB) | 32 | 30 6% | 33 -3% | 31 3% | 31 3% |
| Idle Average * (dB) | 33 | 30 9% | 34.5 -5% | 32 3% | 32 3% |
| Idle Maximum * (dB) | 38 | 30 21% | 35 8% | 36 5% | 33 13% |
| Load Average * (dB) | 46 | 51 -11% | 54.2 -18% | 43 7% | 42 9% |
| Witcher 3 ultra * (dB) | 46 | 56.7 -23% | 45 2% | ||
| Load Maximum * (dB) | 53 | 51 4% | 54.2 -2% | 48 9% | 53 -0% |
* ... más pequeño es mejor
(-) La temperatura máxima en la parte superior es de 51 °C / 124 F, frente a la media de 36.8 °C / 98 F, que oscila entre 21 y 71 °C para la clase Multimedia.
(-) El fondo se calienta hasta un máximo de 58 °C / 136 F, frente a la media de 39.1 °C / 102 F
(+) En reposo, la temperatura media de la parte superior es de 23.8 °C / 75# F, frente a la media del dispositivo de 31.3 °C / 88 F.
(-) Jugando a The Witcher 3, la temperatura media de la parte superior es de 40 °C / 104 F, frente a la media del dispositivo de 31.3 °C / 88 F.
(+) Los reposamanos y el panel táctil alcanzan como máximo la temperatura de la piel (35 °C / 95 F) y, por tanto, no están calientes.
(-) La temperatura media de la zona del reposamanos de dispositivos similares fue de 28.7 °C / 83.7 F (-6.3 °C / -11.3 F).
| Gigabyte Aero 14-K7 i7-7700HQ, GeForce GTX 1050 Ti Mobile | MSI GS43VR 7RE-069US i7-7700HQ, GeForce GTX 1060 Mobile | Schenker XMG P407 i7-7700HQ, GeForce GTX 1050 Ti Mobile | Gigabyte Aero 14 i7-7700HQ, GeForce GTX 1060 Mobile | |
|---|---|---|---|---|
| Heat | -15% | 3% | -2% | |
| Maximum Upper Side * (°C) | 51 | 47.8 6% | 49 4% | 58.3 -14% |
| Maximum Bottom * (°C) | 58 | 63.2 -9% | 50.8 12% | 59.8 -3% |
| Idle Upper Side * (°C) | 24 | 29.8 -24% | 26.3 -10% | 23.3 3% |
| Idle Bottom * (°C) | 25 | 33.2 -33% | 24.1 4% | 23.8 5% |
* ... más pequeño es mejor
Gigabyte Aero 14-K7 análisis de audio
(±) | la sonoridad del altavoz es media pero buena (79 dB)
Graves 100 - 315 Hz
(±) | lubina reducida - en promedio 10.5% inferior a la mediana
(±) | la linealidad de los graves es media (13% delta a frecuencia anterior)
Medios 400 - 2000 Hz
(+) | medios equilibrados - a sólo 4.7% de la mediana
(±) | la linealidad de los medios es media (9.9% delta respecto a la frecuencia anterior)
Altos 2 - 16 kHz
(+) | máximos equilibrados - a sólo 1.7% de la mediana
(+) | los máximos son lineales (4.1% delta a la frecuencia anterior)
Total 100 - 16.000 Hz
(+) | el sonido global es lineal (14.1% de diferencia con la mediana)
En comparación con la misma clase
» 32% de todos los dispositivos probados de esta clase eran mejores, 4% similares, 64% peores
» El mejor tuvo un delta de 5%, la media fue 17%, el peor fue ###max##%
En comparación con todos los dispositivos probados
» 17% de todos los dispositivos probados eran mejores, 4% similares, 79% peores
» El mejor tuvo un delta de 4%, la media fue 24%, el peor fue ###max##%
MSI GS43VR 7RE-069US análisis de audio
(±) | la sonoridad del altavoz es media pero buena (72 dB)
Graves 100 - 315 Hz
(-) | casi sin bajos - de media 21.9% inferior a la mediana
(±) | la linealidad de los graves es media (7.2% delta a frecuencia anterior)
Medios 400 - 2000 Hz
(+) | medios equilibrados - a sólo 3.5% de la mediana
(±) | la linealidad de los medios es media (7.6% delta respecto a la frecuencia anterior)
Altos 2 - 16 kHz
(±) | máximos más altos - de media 5.7% más altos que la mediana
(±) | la linealidad de los máximos es media (11% delta a frecuencia anterior)
Total 100 - 16.000 Hz
(±) | la linealidad del sonido global es media (27.5% de diferencia con la mediana)
En comparación con la misma clase
» 93% de todos los dispositivos probados de esta clase eran mejores, 1% similares, 5% peores
» El mejor tuvo un delta de 6%, la media fue 18%, el peor fue ###max##%
En comparación con todos los dispositivos probados
» 84% de todos los dispositivos probados eran mejores, 3% similares, 13% peores
» El mejor tuvo un delta de 4%, la media fue 24%, el peor fue ###max##%
| Off / Standby | |
| Ocioso | |
| Carga |
|
Clave:
min: | |
| Gigabyte Aero 14-K7 i7-7700HQ, GeForce GTX 1050 Ti Mobile | Razer Blade (2017) i7-7700HQ, GeForce GTX 1060 Mobile | MSI GS43VR 7RE-069US i7-7700HQ, GeForce GTX 1060 Mobile | Schenker XMG P407 i7-7700HQ, GeForce GTX 1050 Ti Mobile | Gigabyte Aero 14 i7-7700HQ, GeForce GTX 1060 Mobile | |
|---|---|---|---|---|---|
| Power Consumption | 13% | 4% | -5% | 1% | |
| Idle Minimum * (Watt) | 9 | 7.5 17% | 9.1 -1% | 10 -11% | 8 11% |
| Idle Average * (Watt) | 14 | 12.1 14% | 11.9 15% | 15 -7% | 13 7% |
| Idle Maximum * (Watt) | 19 | 14.3 25% | 12.2 36% | 24 -26% | 20 -5% |
| Load Average * (Watt) | 84 | 73.5 12% | 77 8% | 82 2% | 78 7% |
| Witcher 3 ultra * (Watt) | 95 | 108 -14% | 126.4 -33% | 110 -16% | |
| Load Maximum * (Watt) | 149 | 110.2 26% | 153 -3% | 124 17% | 146 2% |
* ... más pequeño es mejor
| Gigabyte Aero 14-K7 i7-7700HQ, GeForce GTX 1050 Ti Mobile, 94.24 Wh | Razer Blade (2017) i7-7700HQ, GeForce GTX 1060 Mobile, 70 Wh | MSI GS43VR 7RE-069US i7-7700HQ, GeForce GTX 1060 Mobile, 61 Wh | Schenker XMG P407 i7-7700HQ, GeForce GTX 1050 Ti Mobile, 45 Wh | Gigabyte Aero 14 i7-7700HQ, GeForce GTX 1060 Mobile, 94 Wh | |
|---|---|---|---|---|---|
| Duración de Batería | 2% | -52% | -50% | -5% | |
| Reader / Idle (h) | 15.9 | 9 -43% | 7.4 -53% | 15.2 -4% | |
| H.264 (h) | 7.8 | 3.6 -54% | |||
| WiFi v1.3 (h) | 8.9 | 9.1 2% | 2.9 -67% | 4 -55% | 8.7 -2% |
| Load (h) | 2.4 | 1.3 -46% | 1.5 -37% | 2.2 -8% |
Pro
Contra
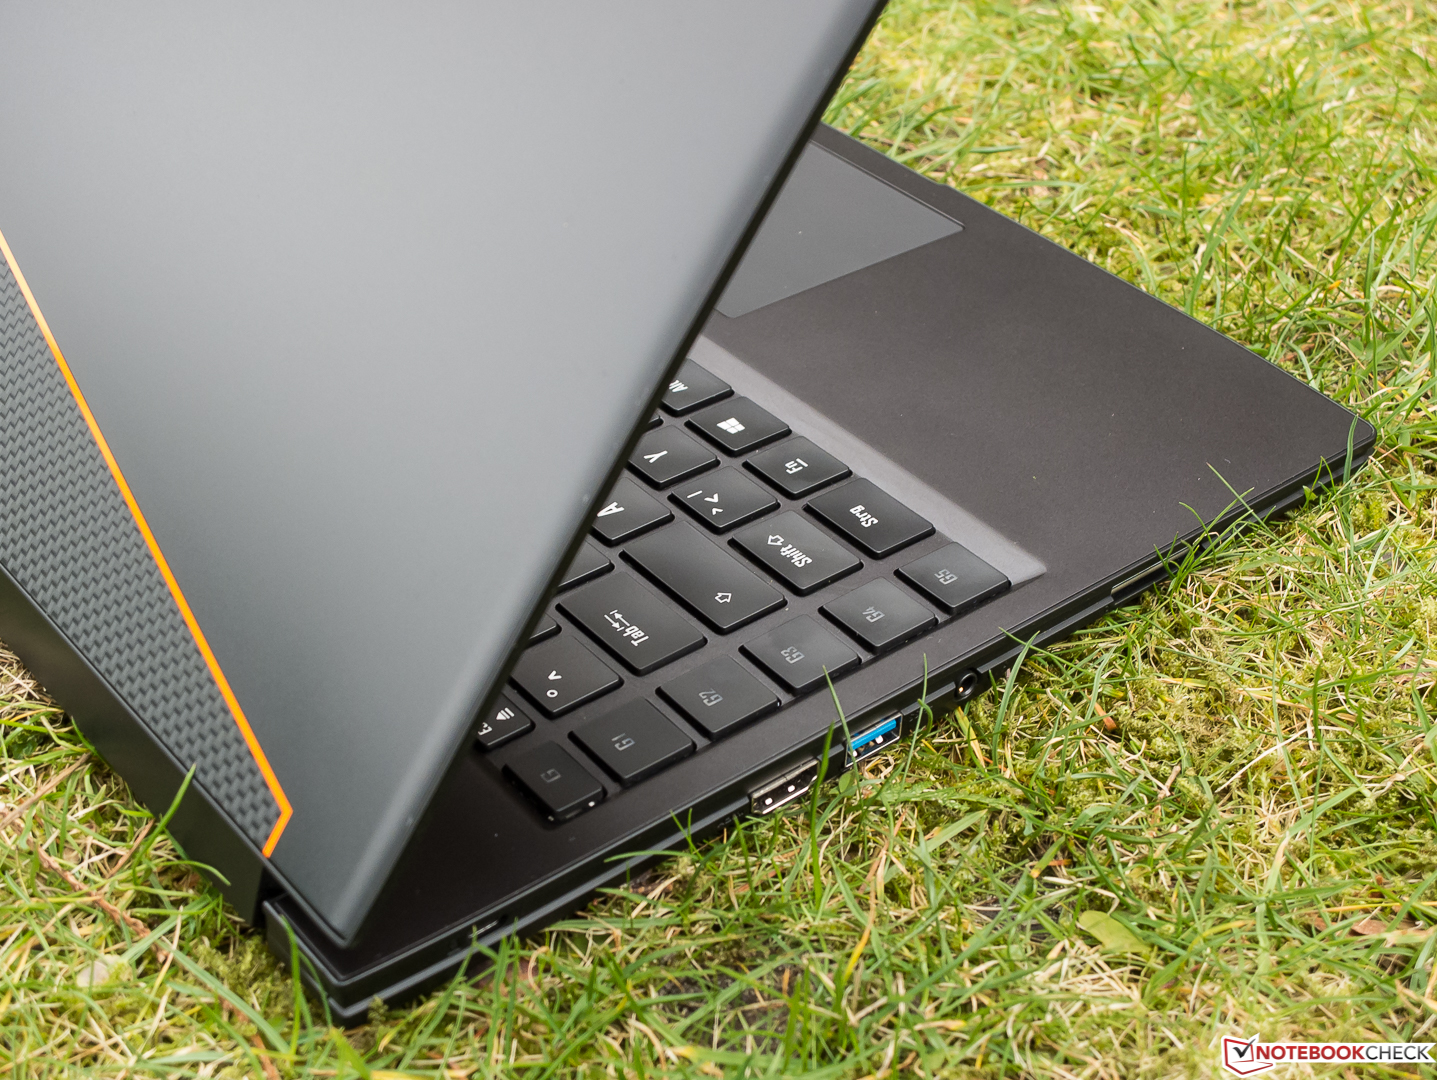
El gamer compacto de Gigabyte puede mostrar todos los videojuegos actuales en su pantalla mate QHD, pero los compradores tendrán que pasar sin los ajustes de calidad más altos. La GPU GeForce GTX 1050 Ti ofrece demasiado poco rendimiento para eso.
El 14" de Gigabyte combina un alto rendimiento de cálculo con un gran aguante de batería.
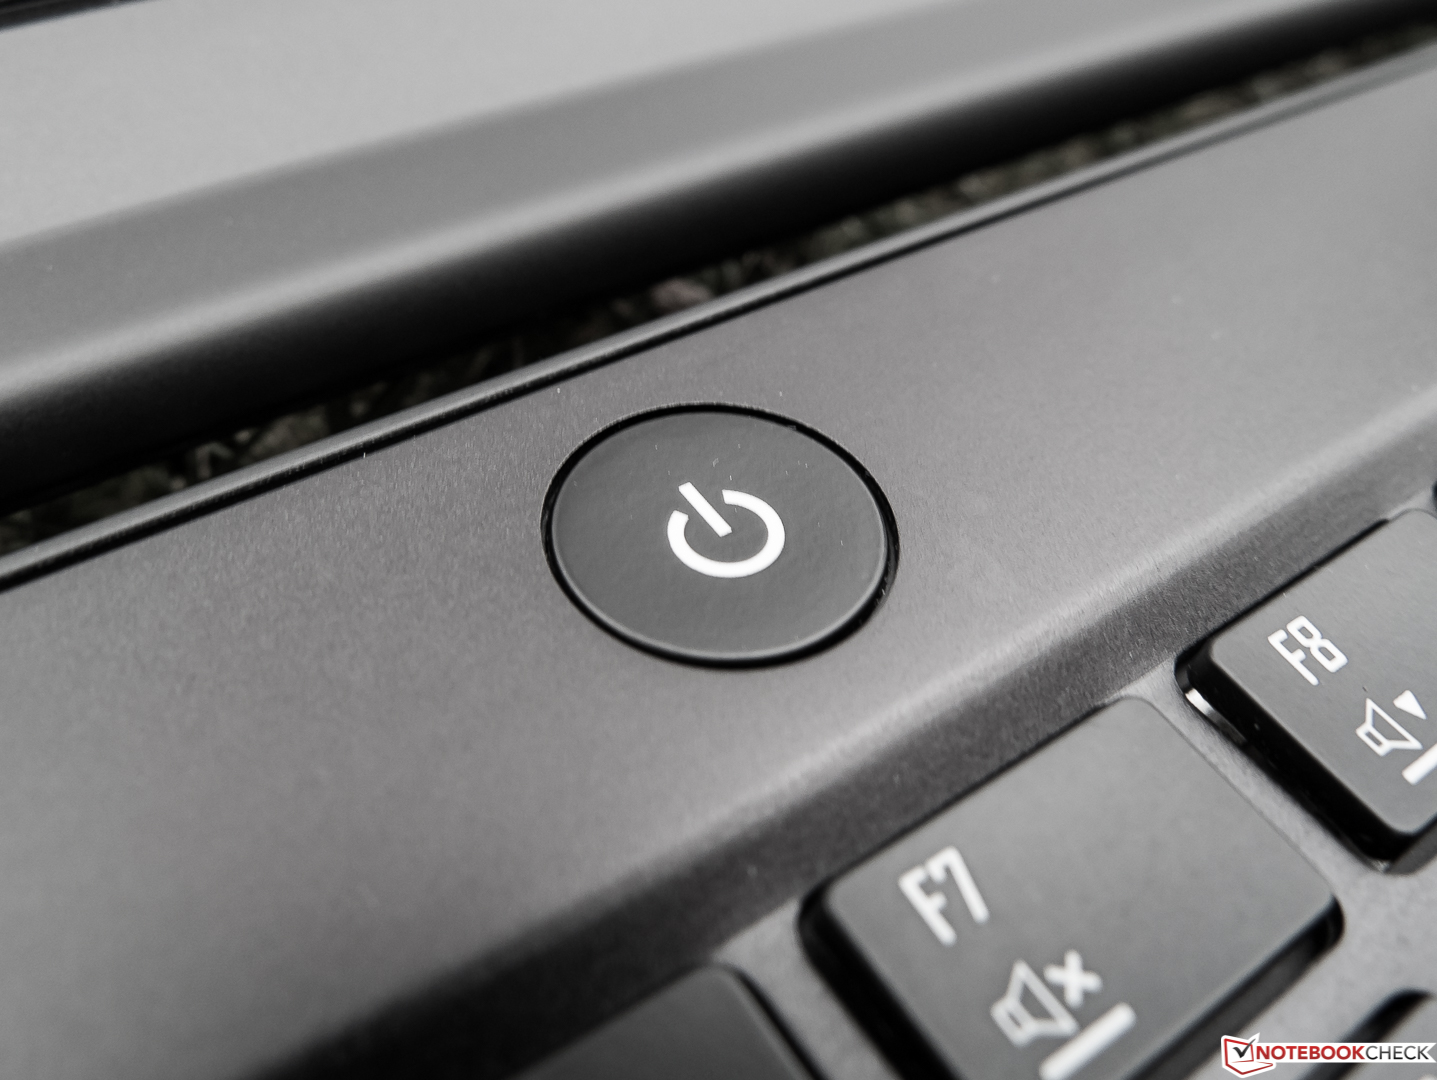
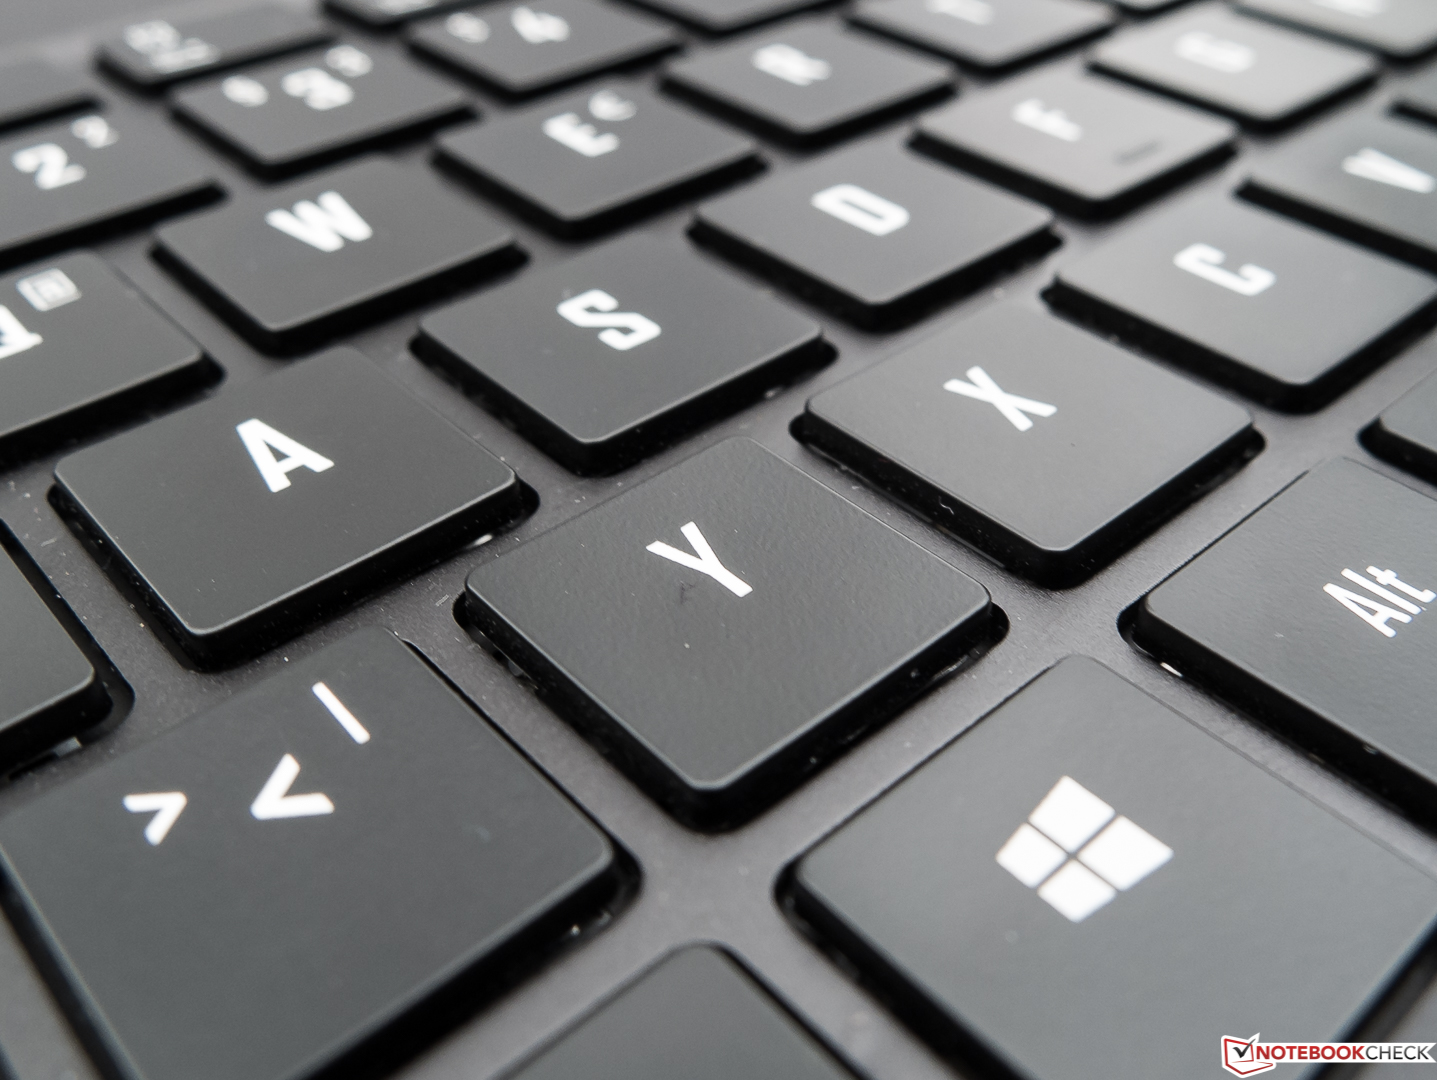
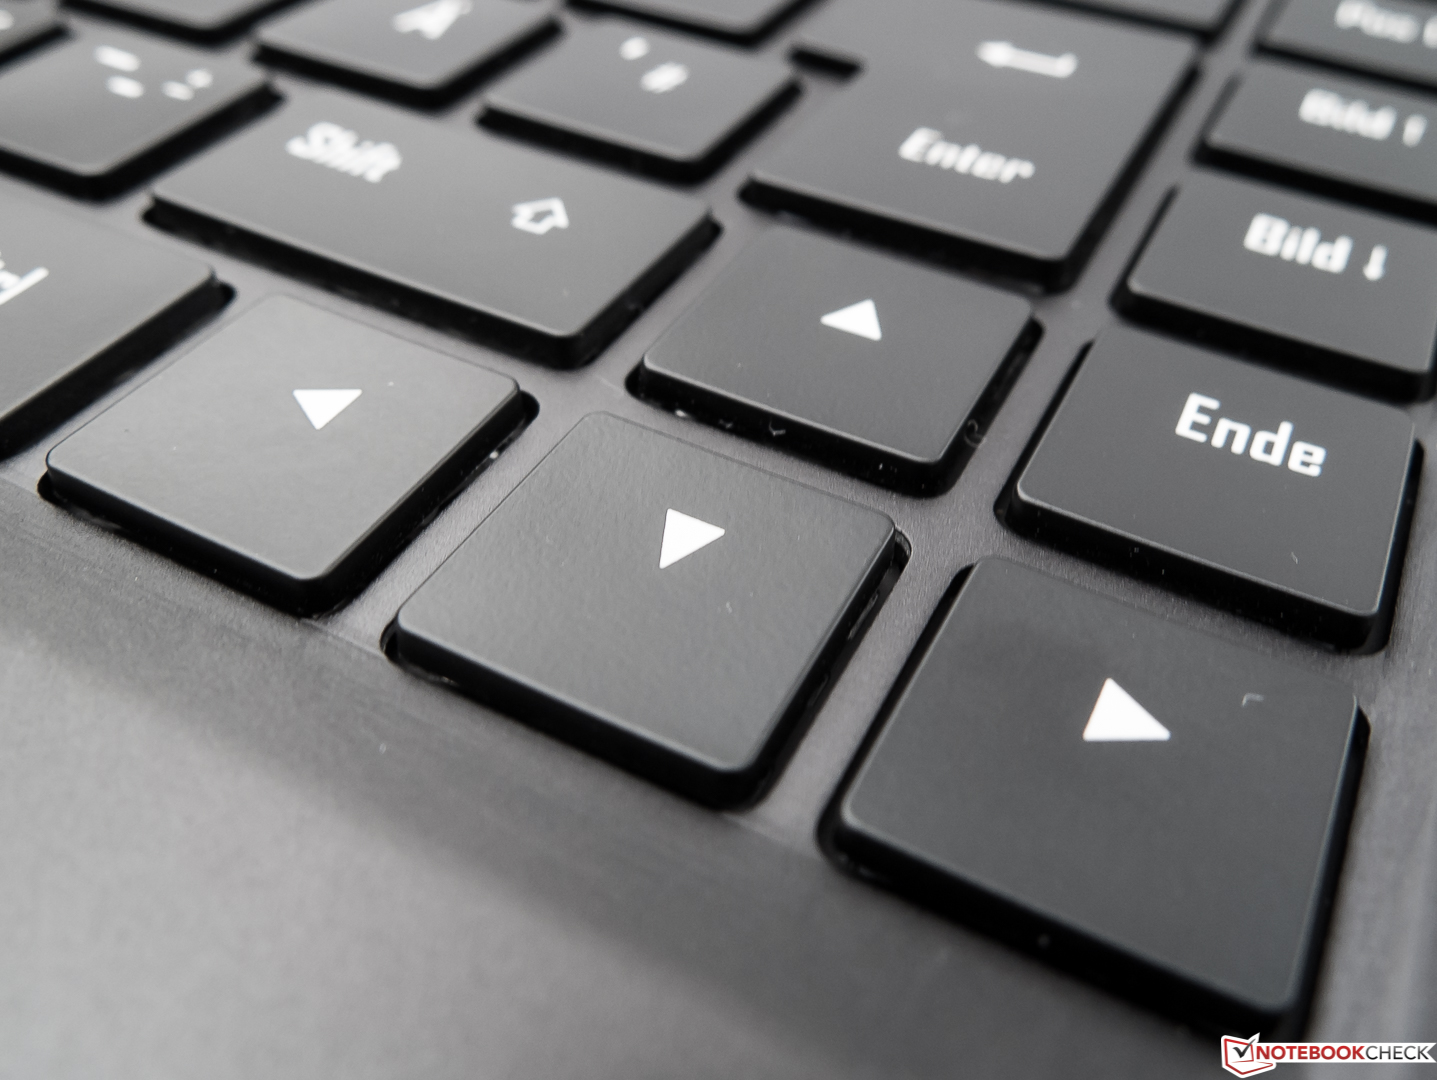
El Aero también lo hizo bien como dispositivo ofimático: El dispositivo tenía un teclado buenísimo y funcionaba entre quedo y silencioso. Y además ofrece uso móvil: Gracias a una batería bien dimensionada, el dispositivo tiene un aguante genial, avergonzando a algunos portátiles ofimáticos.
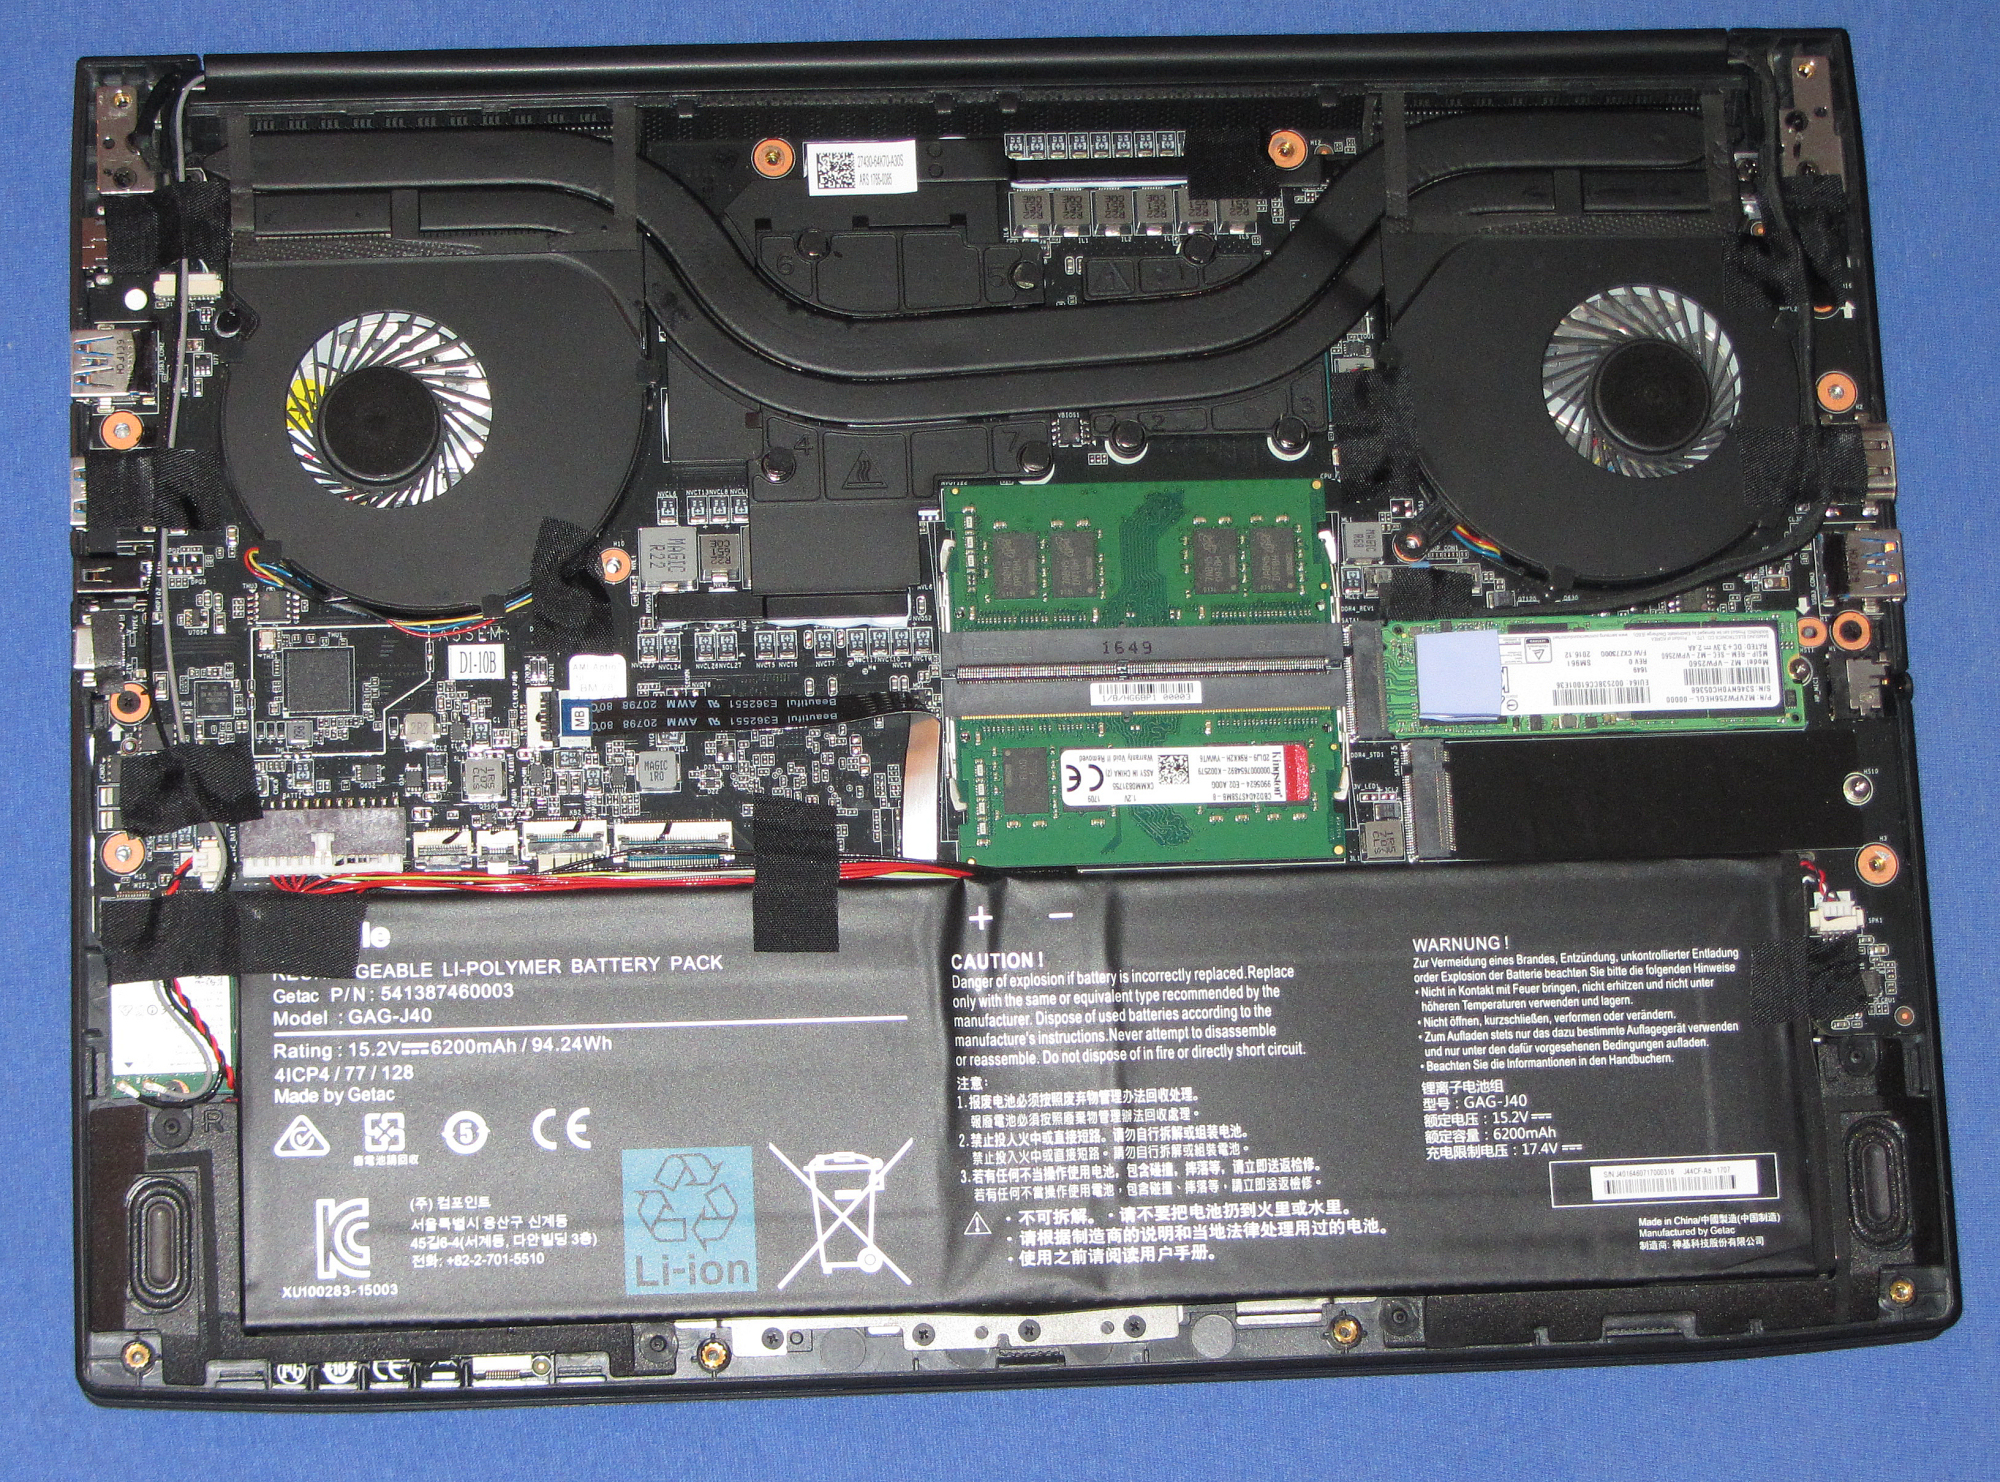
El veloz SSD NVMe asegura un sistema rápido. Se podría cambiar el SSD, y este no tiene mucha capacidad para un gamer con sus 256 GB. También está la posibilidad de instalar un segundo SSD M.2. La pantalla mate QHD es satisfactoria con ángulos de visión estables y un buen contraste. Por desgracia, el brillo del display es más bien bajo para un portátil de este precio.
Ésta es una versión acortada del análisis original. Puedes leer el análisis completo en inglés aquí.
Gigabyte Aero 14-K7
- 10/12/2017 v6 (old)
Sascha Mölck