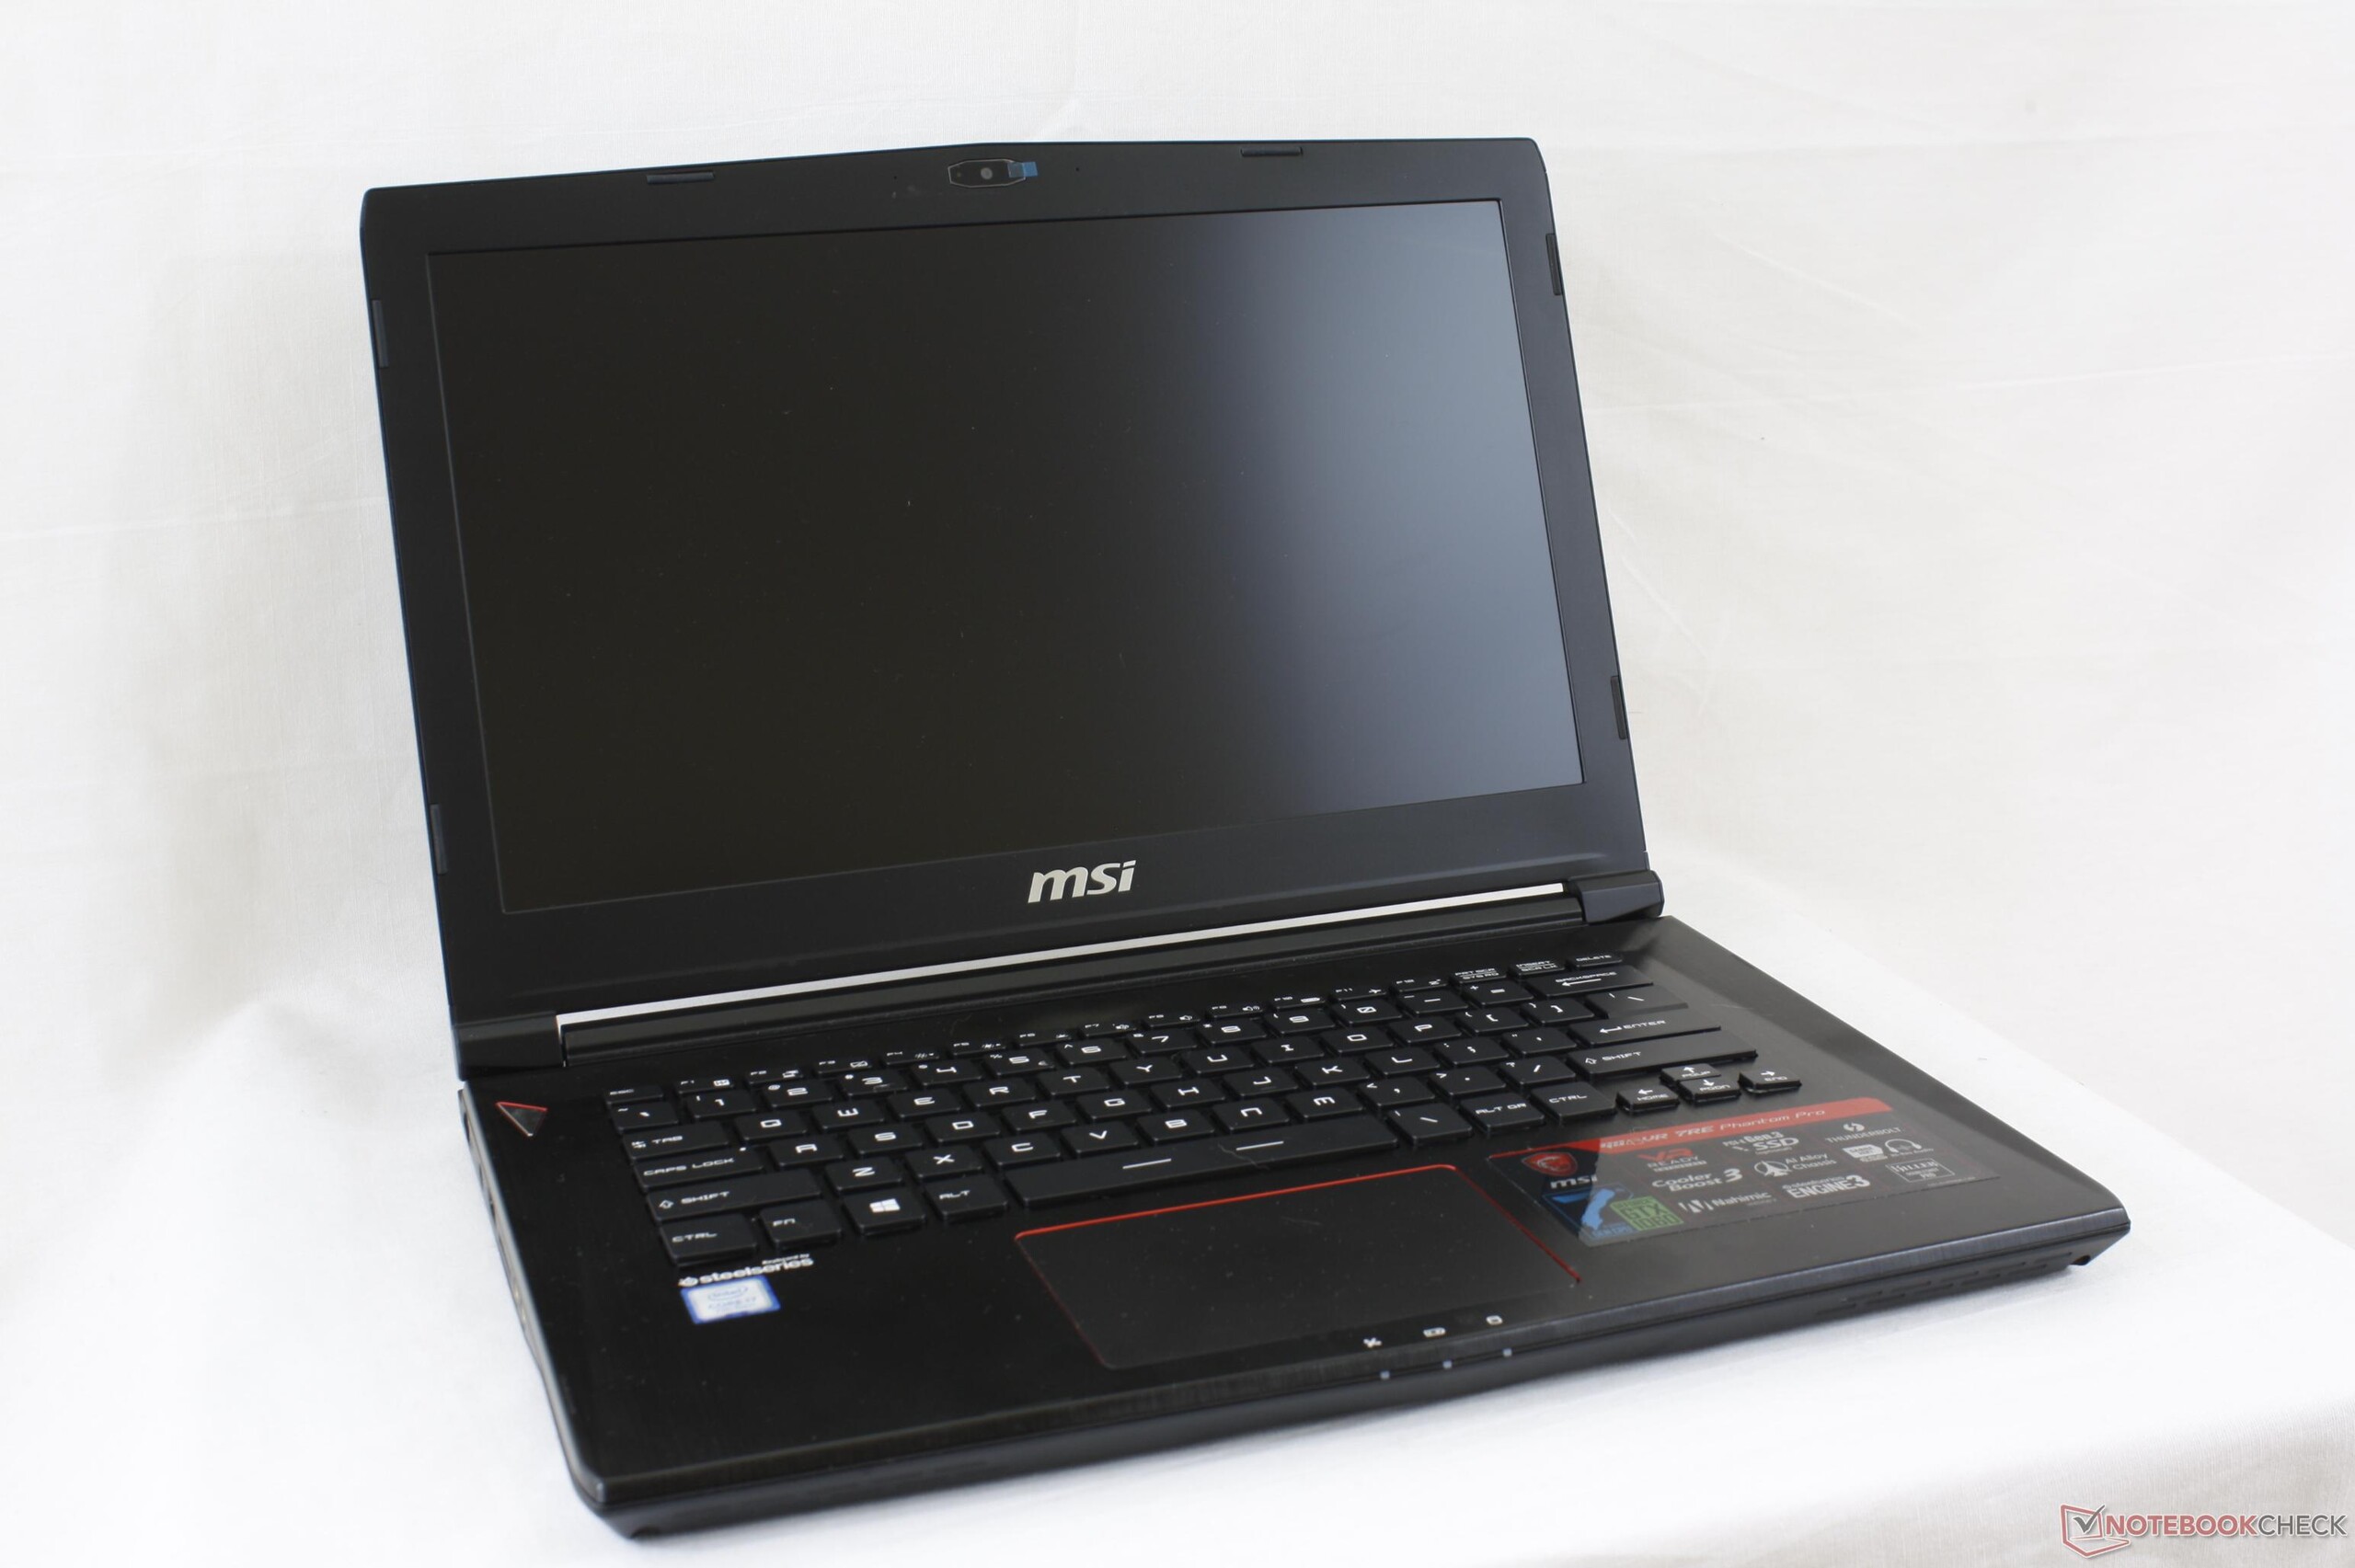
Breve análisis del portátil MSI GS43VR 7RE (i7-7700HQ, GTX 1060)
| SD Card Reader | |
| average JPG Copy Test (av. of 3 runs) | |
| Dell XPS 15 9560 (i7-7700HQ, UHD) | |
| Eurocom Sky MX5 R3 | |
| MSI GS63VR 7RF-228US | |
| MSI GS43VR 7RE-069US | |
| maximum AS SSD Seq Read Test (1GB) | |
| Dell XPS 15 9560 (i7-7700HQ, UHD) | |
| Eurocom Sky MX5 R3 | |
| MSI GS63VR 7RF-228US | |
| MSI GS43VR 7RE-069US | |
| Networking | |
| iperf3 transmit AX12 | |
| MSI GS63VR 7RF-228US | |
| MSI GS43VR 7RE-069US | |
| Razer Blade (2016) FHD | |
| iperf3 receive AX12 | |
| MSI GS63VR 7RF-228US | |
| MSI GS43VR 7RE-069US | |
| Razer Blade (2016) FHD | |
| |||||||||||||||||||||||||
iluminación: 86 %
Brillo con batería: 306.6 cd/m²
Contraste: 1095:1 (Negro: 0.28 cd/m²)
ΔE ColorChecker Calman: 3.9 | ∀{0.5-29.43 Ø4.71}
ΔE Greyscale Calman: 2 | ∀{0.09-98 Ø4.96}
86.1% sRGB (Argyll 1.6.3 3D)
56.1% AdobeRGB 1998 (Argyll 1.6.3 3D)
62.8% AdobeRGB 1998 (Argyll 3D)
85.9% sRGB (Argyll 3D)
66.3% Display P3 (Argyll 3D)
Gamma: 2.14
CCT: 6626 K
| MSI GS43VR 7RE-069US ID: LGD046D, Name: LG Philips LP140WF3-SPD1, IPS, 14", 1920x1080 | MSI GS43VR 6RE-006US Name: LG Philips LP140WF3-SPD1, ID: LGD046D, IPS, 14", 1920x1080 | Razer Blade (2016) FHD LG Philips LP140WF3-SPD1 (LGD046D), IPS, 14", 1920x1080 | Aorus x3 Plus v7 Sharp SHP1401, IGZO TFT, 13.9", 3200x1800 | Apple MacBook Pro 15 2016 (2.6 GHz, 450) IPS, 15.4", 2880x1800 | Asus Zephyrus GX501 AUO B156HAN04.2 (AUO42ED), IPS, 15.6", 1920x1080 | |
|---|---|---|---|---|---|---|
| Display | 0% | -3% | 6% | 3% | ||
| Display P3 Coverage (%) | 66.3 | 65.5 -1% | 65.2 -2% | 66.1 0% | 64.8 -2% | |
| sRGB Coverage (%) | 85.9 | 86.4 1% | 83.4 -3% | 96.5 12% | 91.8 7% | |
| AdobeRGB 1998 Coverage (%) | 62.8 | 63.1 0% | 60.9 -3% | 67.5 7% | 65.9 5% | |
| Response Times | -14% | -42% | -24% | -57% | -27% | |
| Response Time Grey 50% / Grey 80% * (ms) | 31.6 ? | 31.6 ? -0% | 47 ? -49% | 38 ? -20% | 47.3 ? -50% | 40.4 ? -28% |
| Response Time Black / White * (ms) | 19.2 ? | 24.4 ? -27% | 26 ? -35% | 24.4 ? -27% | 31.2 ? -63% | 24 ? -25% |
| PWM Frequency (Hz) | 21190 ? | 201.6 ? | 117000 ? | |||
| Screen | 3% | -15% | 12% | 37% | -23% | |
| Brightness middle (cd/m²) | 306.6 | 288.4 -6% | 272 -11% | 348 14% | 483 58% | 328 7% |
| Brightness (cd/m²) | 291 | 282 -3% | 277 -5% | 359 23% | 465 60% | 305 5% |
| Brightness Distribution (%) | 86 | 83 -3% | 84 -2% | 73 -15% | 92 7% | 83 -3% |
| Black Level * (cd/m²) | 0.28 | 0.35 -25% | 0.26 7% | 0.29 -4% | 0.33 -18% | 0.25 11% |
| Contrast (:1) | 1095 | 824 -25% | 1046 -4% | 1200 10% | 1464 34% | 1312 20% |
| Colorchecker dE 2000 * | 3.9 | 2.61 33% | 4.59 -18% | 2.4 38% | 1.4 64% | 6.02 -54% |
| Colorchecker dE 2000 max. * | 9 | 7.34 18% | 8.49 6% | 5.1 43% | 3 67% | 10.14 -13% |
| Greyscale dE 2000 * | 2 | 1.18 41% | 4.28 -114% | 2.3 -15% | 1.5 25% | 6.32 -216% |
| Gamma | 2.14 103% | 2.24 98% | 2.23 99% | 2.21 100% | 2.34 94% | 2.28 96% |
| CCT | 6626 98% | 6506 100% | 6848 95% | 6206 105% | 6650 98% | 8194 79% |
| Color Space (Percent of AdobeRGB 1998) (%) | 56.1 | 56.4 1% | 55 -2% | 62 11% | 60 7% | |
| Color Space (Percent of sRGB) (%) | 86.1 | 86.4 0% | 83 -4% | 96 11% | 92 7% | |
| Media total (Programa/Opciones) | -4% /
0% | -20% /
-16% | -2% /
6% | -10% /
18% | -16% /
-18% |
* ... más pequeño es mejor
Tiempos de respuesta del display
| ↔ Tiempo de respuesta de Negro a Blanco | ||
|---|---|---|
| 19.2 ms ... subida ↗ y bajada ↘ combinada | ↗ 10 ms subida |  |
| ↘ 9.2 ms bajada | ||
| La pantalla mostró buenos tiempos de respuesta en nuestros tests pero podría ser demasiado lenta para los jugones competitivos. En comparación, todos los dispositivos de prueba van de ##min### (mínimo) a 240 (máximo) ms. » 43 % de todos los dispositivos son mejores. Eso quiere decir que el tiempo de respuesta es similar al dispositivo testado medio (19.8 ms). | ||
| ↔ Tiempo de respuesta 50% Gris a 80% Gris | ||
| 31.6 ms ... subida ↗ y bajada ↘ combinada | ↗ 15.6 ms subida | 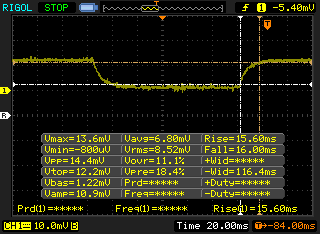 |
| ↘ 16 ms bajada | ||
| La pantalla mostró tiempos de respuesta lentos en nuestros tests y podría ser demasiado lenta para los jugones. En comparación, todos los dispositivos de prueba van de ##min### (mínimo) a 636 (máximo) ms. » 43 % de todos los dispositivos son mejores. Eso quiere decir que el tiempo de respuesta es similar al dispositivo testado medio (31 ms). | ||
Parpadeo de Pantalla / PWM (Pulse-Width Modulation)
| Parpadeo de Pantalla / PWM detectado | 21190 Hz | ≤ 99 % de brillo | 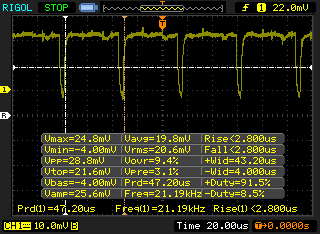 |
La retroiluminación del display parpadea a 21190 Hz (seguramente usa PWM - Pulse-Width Modulation) a un brillo del 99 % e inferior. Sobre este nivel de brillo no debería darse parpadeo / PWM. La frecuencia de 21190 Hz es bastante alta, por lo que la mayoría de gente sensible al parpadeo no debería ver parpadeo o tener fatiga visual. Comparación: 52 % de todos los dispositivos testados no usaron PWM para atenuar el display. Si se usó, medimos una media de 7757 (mínimo: 5 - máxmo: 343500) Hz. | |||
| Cinebench R10 | |
| Rendering Multiple CPUs 32Bit | |
| Eurocom Tornado F5 | |
| Dell Precision 3520 | |
| MSI GS43VR 7RE-069US | |
| EVGA SC15 | |
| MSI GS43VR 6RE-006US | |
| MSI GP62-2QEi781FD | |
| Eurocom Shark 4 | |
| Lenovo IdeaPad Y50 | |
| Rendering Single 32Bit | |
| Eurocom Tornado F5 | |
| EVGA SC15 | |
| MSI GS43VR 7RE-069US | |
| Dell Precision 3520 | |
| MSI GP62-2QEi781FD | |
| Eurocom Shark 4 | |
| Lenovo IdeaPad Y50 | |
| MSI GS43VR 6RE-006US | |
| wPrime 2.10 - 1024m | |
| Lenovo IdeaPad Y50 | |
| Eurocom Shark 4 | |
| MSI GS43VR 6RE-006US | |
| MSI GS43VR 7RE-069US | |
| EVGA SC15 | |
| MSI GP62-2QEi781FD | |
| Eurocom Tornado F5 | |
* ... más pequeño es mejor
| PCMark 8 | |
| Home Score Accelerated v2 | |
| Eurocom Tornado F5 | |
| EVGA SC15 | |
| MSI GS43VR 7RE-069US | |
| Lenovo IdeaPad Y50 | |
| Work Score Accelerated v2 | |
| Eurocom Tornado F5 | |
| EVGA SC15 | |
| MSI GS43VR 7RE-069US | |
| Lenovo IdeaPad Y50 | |
| Creative Score Accelerated v2 | |
| Eurocom Tornado F5 | |
| EVGA SC15 | |
| MSI GS43VR 7RE-069US | |
| Lenovo IdeaPad Y50 | |
| PCMark 8 Home Score Accelerated v2 | 3918 puntos | |
| PCMark 8 Creative Score Accelerated v2 | 5250 puntos | |
| PCMark 8 Work Score Accelerated v2 | 4672 puntos | |
| PCMark 10 Score | 4807 puntos | |
ayuda | ||
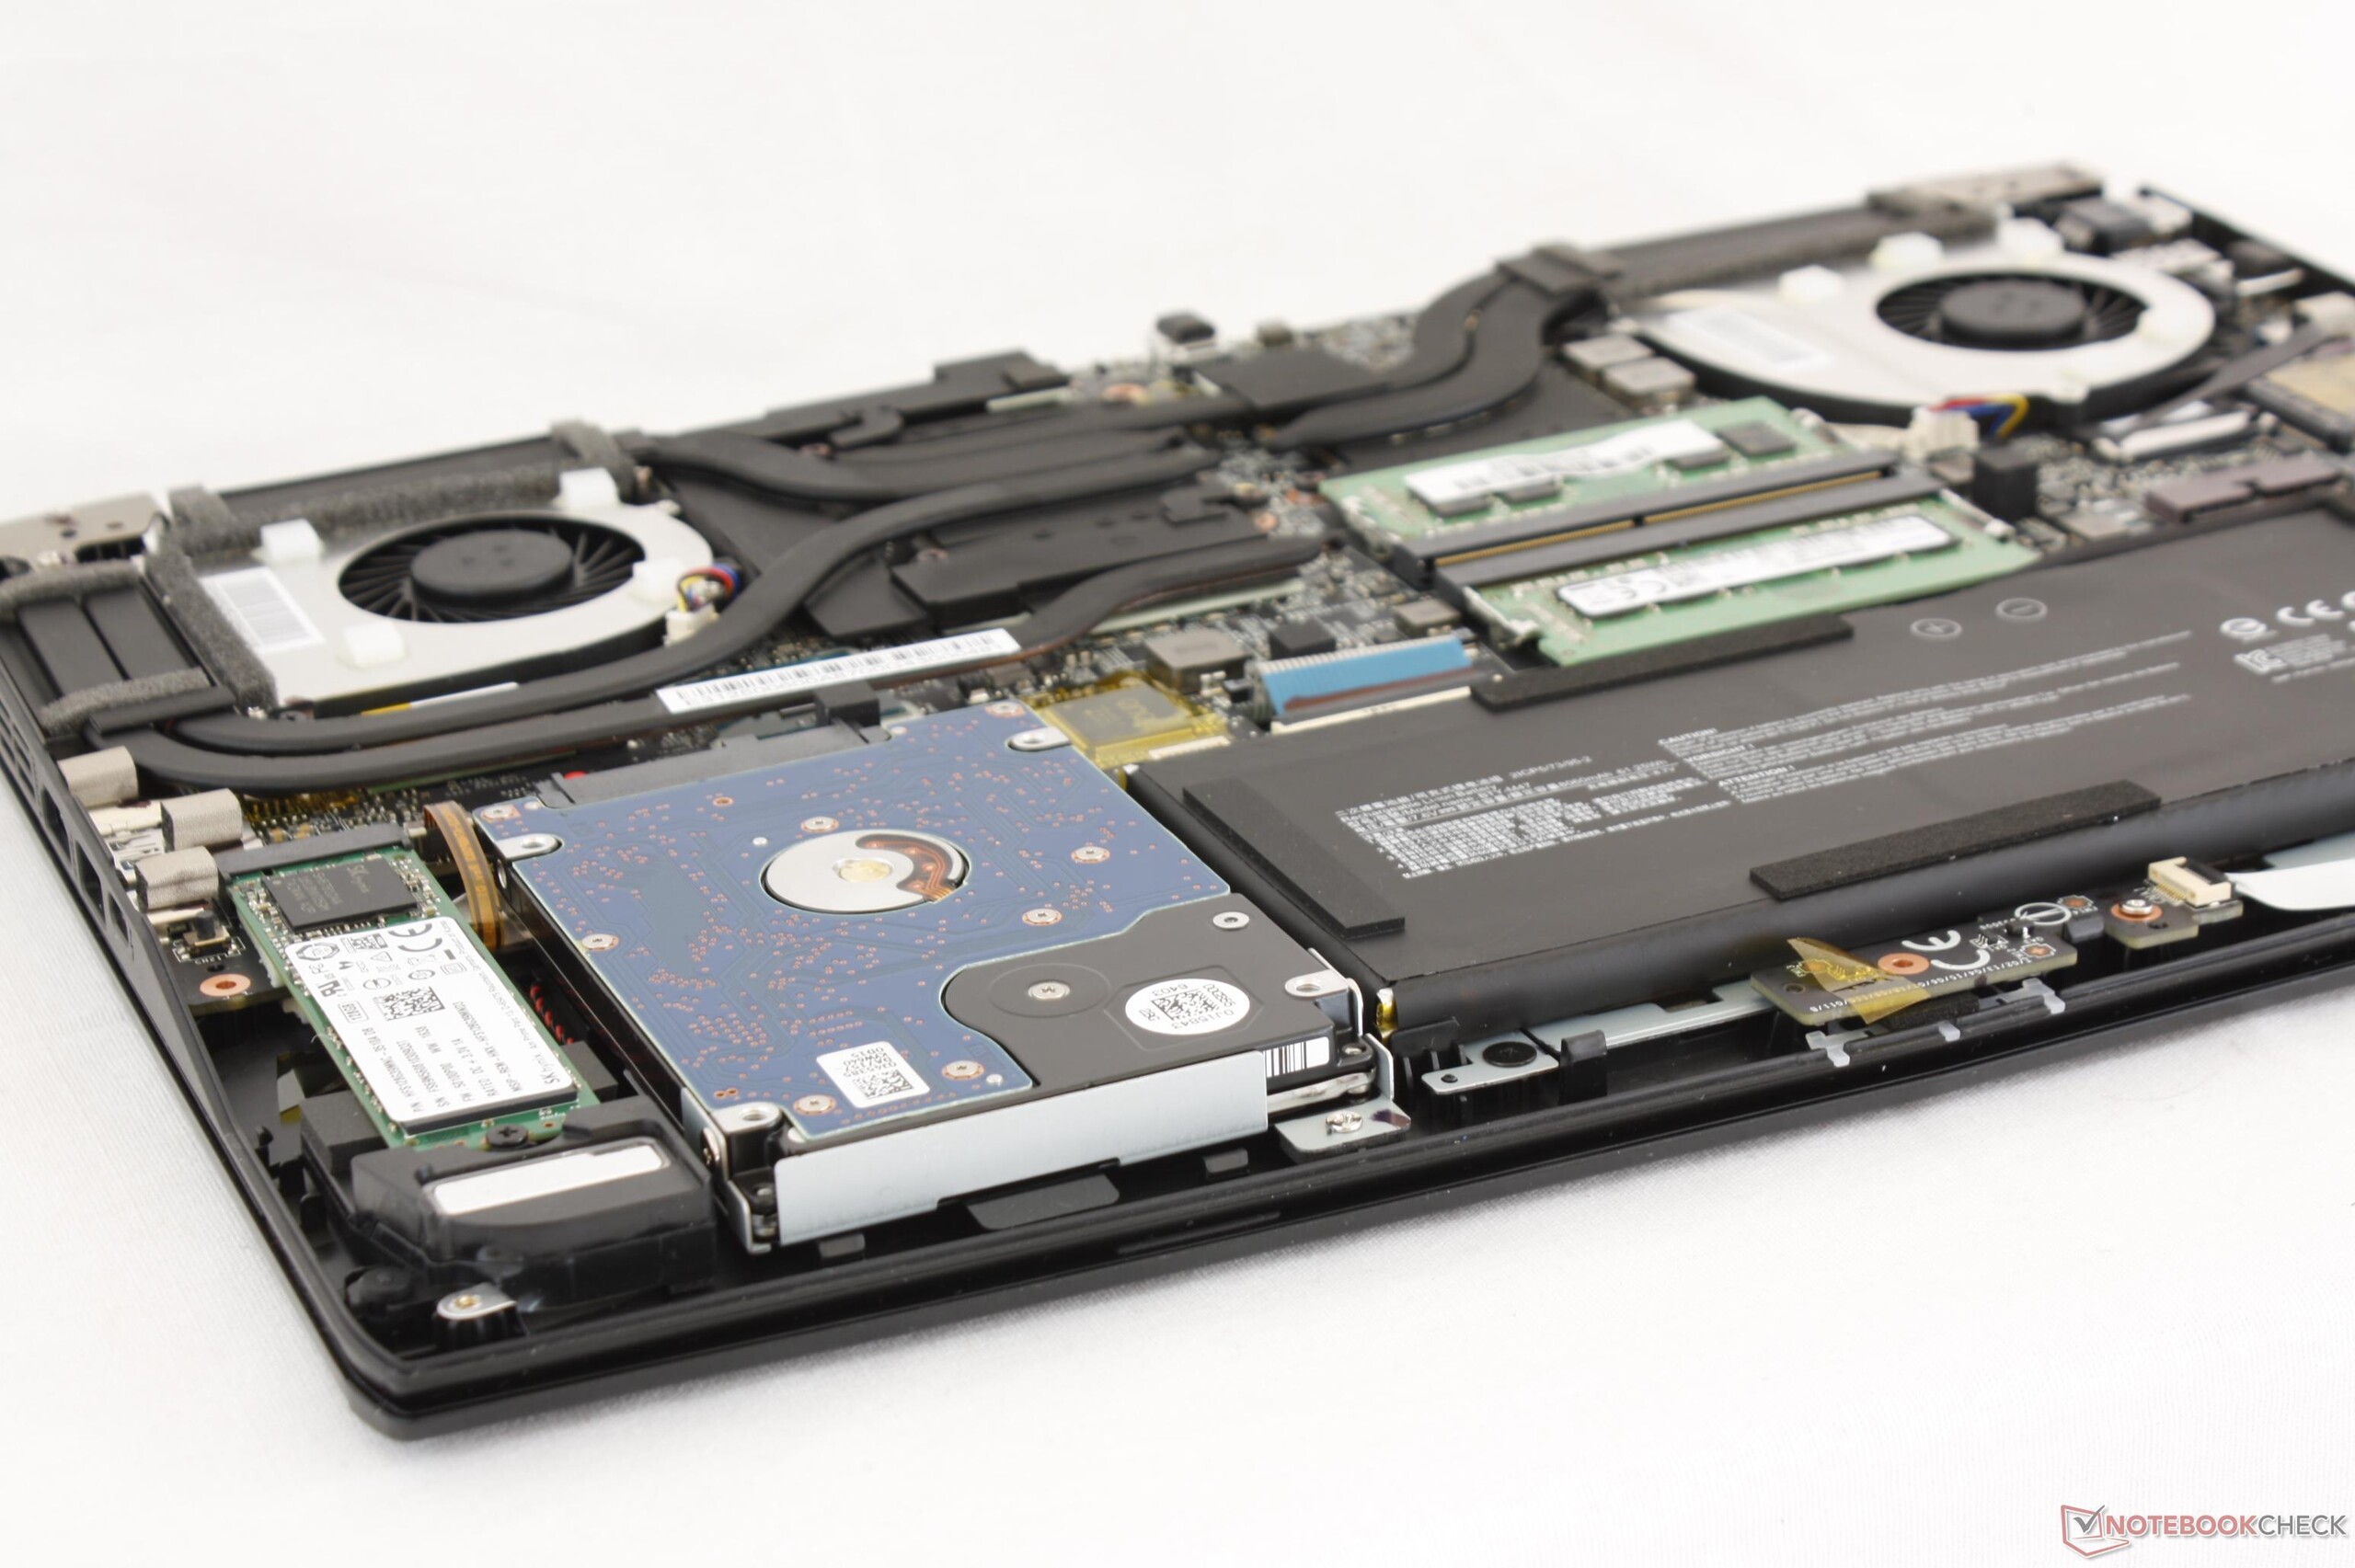
| MSI GS43VR 7RE-069US SK Hynix HFS128G39MNC-3510A | MSI GS63VR 7RF-228US Samsung SM961 MZVKW512HMJP m.2 PCI-e | Razer Blade (2016) FHD | Gigabyte Aero 14 GA-K106Q416-PL-B02 Liteonit CV3-8D256 | Aorus x3 Plus v7 Toshiba NVMe THNSN5512GPU7 | |
|---|---|---|---|---|---|
| AS SSD | 204% | 209% | -11% | 118% | |
| Copy Game MB/s (MB/s) | 332.1 | 1082 226% | 1014 205% | ||
| Copy Program MB/s (MB/s) | 225.4 | 401.9 78% | 399.4 77% | ||
| Copy ISO MB/s (MB/s) | 382.1 | 1666 336% | 1459 282% | ||
| Score Total (Points) | 1126 | 3756 234% | 4067 261% | 917 -19% | 2570 128% |
| Score Write (Points) | 435 | 1468 237% | 1522 250% | 298 -31% | 933 114% |
| Score Read (Points) | 455 | 1549 240% | 1710 276% | 411 -10% | 1112 144% |
| Access Time Write * (ms) | 0.115 | 0.029 75% | 0.032 72% | 0.074 36% | 0.05 57% |
| Access Time Read * (ms) | 0.106 | 0.041 61% | 0.036 66% | 0.089 16% | 0.11 -4% |
| 4K-64 Write (MB/s) | 312.5 | 1185 279% | 1234 295% | 218.9 -30% | 692 121% |
| 4K-64 Read (MB/s) | 373.9 | 1229 229% | 1403 275% | 333 -11% | 857 129% |
| 4K Write (MB/s) | 86.2 | 127.6 48% | 116.6 35% | 50 -42% | 128.6 49% |
| 4K Read (MB/s) | 30.35 | 48.01 58% | 47.65 57% | 26.32 -13% | 41.4 36% |
| Seq Write (MB/s) | 366.6 | 1550 323% | 1715 368% | 291.4 -21% | 1117 205% |
| Seq Read (MB/s) | 509 | 2719 434% | 2594 410% | 517 2% | 2131 319% |
* ... más pequeño es mejor

| 3DMark 11 Performance | 12917 puntos | |
| 3DMark Ice Storm Standard Score | 85006 puntos | |
| 3DMark Cloud Gate Standard Score | 24792 puntos | |
| 3DMark Fire Strike Score | 10096 puntos | |
| 3DMark Fire Strike Extreme Score | 5293 puntos | |
ayuda | ||
| Rise of the Tomb Raider - 1920x1080 Very High Preset AA:FX AF:16x | |
| Alienware 17 R4 | |
| Asus Zephyrus GX501 | |
| Eurocom Sky MX5 R3 | |
| MSI GS43VR 7RE-069US | |
| Nvidia GeForce GTX 1060 Founders Edition 6 GB | |
| Nvidia GeForce GTX 1060 Founders Edition 6 GB | |
| MSI GT72VR 6RD-063US | |
| Aorus X5S v5 | |
| Lenovo Legion Y520-15IKBN-80WK001KUS | |
| The Witcher 3 - 1920x1080 Ultra Graphics & Postprocessing (HBAO+) | |
| Alienware 17 R4 | |
| Eurocom Sky MX5 R3 | |
| Asus Zephyrus GX501 | |
| Nvidia GeForce GTX 1060 Founders Edition 6 GB | |
| MSI GS43VR 7RE-069US | |
| Lenovo Legion Y520-15IKBN-80WK001KUS | |
| BioShock Infinite - 1920x1080 Ultra Preset, DX11 (DDOF) | |
| Alienware 17 R4 | |
| Eurocom Sky MX5 R3 | |
| MSI GS43VR 7RE-069US | |
| MSI GT72VR 6RD-063US | |
| Aorus X5S v5 | |
| Lenovo Legion Y520-15IKBN-80WK001KUS | |
| bajo | medio | alto | ultra | |
|---|---|---|---|---|
| BioShock Infinite (2013) | 105.6 | |||
| Metro: Last Light (2013) | 80.2 | |||
| Thief (2014) | 77.1 | |||
| The Witcher 3 (2015) | 79 | 41 | ||
| Batman: Arkham Knight (2015) | 88 | 60 | ||
| Metal Gear Solid V (2015) | 60 | |||
| Fallout 4 (2015) | 71.5 | |||
| Rise of the Tomb Raider (2016) | 68.8 | |||
| Ashes of the Singularity (2016) | 58.1 | |||
| Overwatch (2016) | 106 | |||
| Mafia 3 (2016) | 42 | |||
| Prey (2017) | 106.7 |
Ruido
| Ocioso |
| 33 / 34.5 / 35 dB(A) |
| Carga |
| 54.2 / 54.2 dB(A) |
 | ||
30 dB silencioso 40 dB(A) audible 50 dB(A) ruidosamente alto |
||
min: | ||
| MSI GS43VR 7RE-069US GeForce GTX 1060 Mobile, i7-7700HQ, SK Hynix HFS128G39MNC-3510A | MSI GS63VR 7RF-228US GeForce GTX 1060 Mobile, i7-7700HQ, Samsung SM961 MZVKW512HMJP m.2 PCI-e | Razer Blade (2016) FHD GeForce GTX 1060 Mobile, 6700HQ | Gigabyte Aero 14 GA-K106Q416-PL-B02 GeForce GTX 1060 Mobile, i7-7700HQ, Liteonit CV3-8D256 | Aorus x3 Plus v7 GeForce GTX 1060 Mobile, i7-7820HK, Toshiba NVMe THNSN5512GPU7 | Apple MacBook Pro 15 2016 (2.6 GHz, 450) Radeon Pro 450, 6700HQ, Apple SSD SM0256L | |
|---|---|---|---|---|---|---|
| Noise | 10% | -2% | 7% | -1% | 12% | |
| apagado / medio ambiente * (dB) | 28 | 28.8 -3% | 31 -11% | 29.1 -4% | 30.4 -9% | |
| Idle Minimum * (dB) | 33 | 33.1 -0% | 35 -6% | 31.3 5% | 31.4 5% | 30.6 7% |
| Idle Average * (dB) | 34.5 | 33.1 4% | 36 -4% | 31.3 9% | 37 -7% | 30.6 11% |
| Idle Maximum * (dB) | 35 | 34 3% | 37 -6% | 31.3 11% | 40.8 -17% | 30.6 13% |
| Load Average * (dB) | 54.2 | 37.2 31% | 43 21% | 50.3 7% | 50 8% | 34.7 36% |
| Witcher 3 ultra * (dB) | 56.7 | 46.1 19% | 53.6 5% | |||
| Load Maximum * (dB) | 54.2 | 47.1 13% | 57 -5% | 53.4 1% | 53.6 1% | 46.3 15% |
* ... más pequeño es mejor
(-) La temperatura máxima en la parte superior es de 47.8 °C / 118 F, frente a la media de 40.4 °C / 105 F, que oscila entre 21.2 y 68.8 °C para la clase Gaming.
(-) El fondo se calienta hasta un máximo de 63.2 °C / 146 F, frente a la media de 43.2 °C / 110 F
(+) En reposo, la temperatura media de la parte superior es de 28.6 °C / 83# F, frente a la media del dispositivo de 33.9 °C / 93 F.
(±) Jugando a The Witcher 3, la temperatura media de la parte superior es de 36.4 °C / 98 F, frente a la media del dispositivo de 33.9 °C / 93 F.
(+) Los reposamanos y el panel táctil alcanzan como máximo la temperatura de la piel (32 °C / 89.6 F) y, por tanto, no están calientes.
(-) La temperatura media de la zona del reposamanos de dispositivos similares fue de 28.8 °C / 83.8 F (-3.2 °C / -5.8 F).
MSI GS43VR 7RE-069US análisis de audio
(±) | la sonoridad del altavoz es media pero buena (72 dB)
Graves 100 - 315 Hz
(-) | casi sin bajos - de media 21.9% inferior a la mediana
(±) | la linealidad de los graves es media (7.2% delta a frecuencia anterior)
Medios 400 - 2000 Hz
(+) | medios equilibrados - a sólo 3.5% de la mediana
(±) | la linealidad de los medios es media (7.6% delta respecto a la frecuencia anterior)
Altos 2 - 16 kHz
(±) | máximos más altos - de media 5.7% más altos que la mediana
(±) | la linealidad de los máximos es media (11% delta a frecuencia anterior)
Total 100 - 16.000 Hz
(±) | la linealidad del sonido global es media (27.5% de diferencia con la mediana)
En comparación con la misma clase
» 93% de todos los dispositivos probados de esta clase eran mejores, 1% similares, 5% peores
» El mejor tuvo un delta de 6%, la media fue 18%, el peor fue ###max##%
En comparación con todos los dispositivos probados
» 84% de todos los dispositivos probados eran mejores, 3% similares, 13% peores
» El mejor tuvo un delta de 4%, la media fue 23%, el peor fue ###max##%
Apple MacBook 12 (Early 2016) 1.1 GHz análisis de audio
(+) | los altavoces pueden reproducir a un volumen relativamente alto (#83.6 dB)
Graves 100 - 315 Hz
(±) | lubina reducida - en promedio 11.3% inferior a la mediana
(±) | la linealidad de los graves es media (14.2% delta a frecuencia anterior)
Medios 400 - 2000 Hz
(+) | medios equilibrados - a sólo 2.4% de la mediana
(+) | los medios son lineales (5.5% delta a la frecuencia anterior)
Altos 2 - 16 kHz
(+) | máximos equilibrados - a sólo 2% de la mediana
(+) | los máximos son lineales (4.5% delta a la frecuencia anterior)
Total 100 - 16.000 Hz
(+) | el sonido global es lineal (10.2% de diferencia con la mediana)
En comparación con la misma clase
» 7% de todos los dispositivos probados de esta clase eran mejores, 2% similares, 90% peores
» El mejor tuvo un delta de 5%, la media fue 18%, el peor fue ###max##%
En comparación con todos los dispositivos probados
» 5% de todos los dispositivos probados eran mejores, 1% similares, 94% peores
» El mejor tuvo un delta de 4%, la media fue 23%, el peor fue ###max##%
| Off / Standby | |
| Ocioso | |
| Carga |
|
Clave:
min: | |
| MSI GS43VR 7RE-069US i7-7700HQ, GeForce GTX 1060 Mobile, SK Hynix HFS128G39MNC-3510A, IPS, 1920x1080, 14" | Alienware 13 R3 i7-7700HQ, GeForce GTX 1060 Mobile, Toshiba NVMe THNSN5256GPUK, OLED, 2560x1440, 13.3" | Razer Blade (2016) FHD 6700HQ, GeForce GTX 1060 Mobile, , IPS, 1920x1080, 14" | Gigabyte Aero 14 GA-K106Q416-PL-B02 i7-7700HQ, GeForce GTX 1060 Mobile, Liteonit CV3-8D256, , 2560x1440, 14" | Aorus x3 Plus v7 i7-7820HK, GeForce GTX 1060 Mobile, Toshiba NVMe THNSN5512GPU7, IGZO TFT, 3200x1800, 13.9" | Apple MacBook Pro 15 2016 (2.6 GHz, 450) 6700HQ, Radeon Pro 450, Apple SSD SM0256L, IPS, 2880x1800, 15.4" | |
|---|---|---|---|---|---|---|
| Power Consumption | -6% | -33% | -44% | -33% | 32% | |
| Idle Minimum * (Watt) | 9.1 | 7 23% | 14 -54% | 12 -32% | 15.1 -66% | 2.9 68% |
| Idle Average * (Watt) | 11.9 | 12 -1% | 18 -51% | 18.1 -52% | 15.8 -33% | 9.7 18% |
| Idle Maximum * (Watt) | 12.2 | 18 -48% | 21 -72% | 21.3 -75% | 16.7 -37% | 10.1 17% |
| Load Average * (Watt) | 77 | 76 1% | 70 9% | 127.2 -65% | 110.9 -44% | 65 16% |
| Witcher 3 ultra * (Watt) | 126.4 | 135 -7% | ||||
| Load Maximum * (Watt) | 153 | 161 -5% | 146 5% | 149.4 2% | 170.4 -11% | 89.5 42% |
* ... más pequeño es mejor
| MSI GS43VR 7RE-069US i7-7700HQ, GeForce GTX 1060 Mobile, 61 Wh | MSI GS63VR 7RF-228US i7-7700HQ, GeForce GTX 1060 Mobile, 65 Wh | Razer Blade (2016) FHD 6700HQ, GeForce GTX 1060 Mobile, 70 Wh | Gigabyte Aero 14 GA-K106Q416-PL-B02 i7-7700HQ, GeForce GTX 1060 Mobile, 94.24 Wh | Aorus x3 Plus v7 i7-7820HK, GeForce GTX 1060 Mobile, 74 Wh | Apple MacBook Pro 15 2016 (2.6 GHz, 450) 6700HQ, Radeon Pro 450, 76 Wh | |
|---|---|---|---|---|---|---|
| Duración de Batería | 2% | 54% | -13% | 30% | 107% | |
| Reader / Idle (h) | 9 | 6.4 -29% | 12.7 41% | 7.8 -13% | 8 -11% | |
| WiFi v1.3 (h) | 2.9 | 3.9 34% | 7.1 145% | 4.9 69% | 10 245% | |
| Load (h) | 1.3 | 1.3 0% | 1 -23% | 1.7 31% | 0.9 -31% | |
| WiFi (h) | 5.2 |
Pro
Contra
El GS43VR 7RE apenas puede considerarse una actualización sobre El GS43VR 6RE. El rendimiento de la CPU es un poco mejor, pero el potencial de Turbo Boost todavía se produce cuello de botella y los usuarios no pueden aprovechar al máximo la actualización del Kaby Lake. Dado que la experiencia principal sigue siendo la misma, la parte más importante de este lanzamiento del GS43VR de Kaby Lake es que el más viejo Skylake GS43VR será más barato.
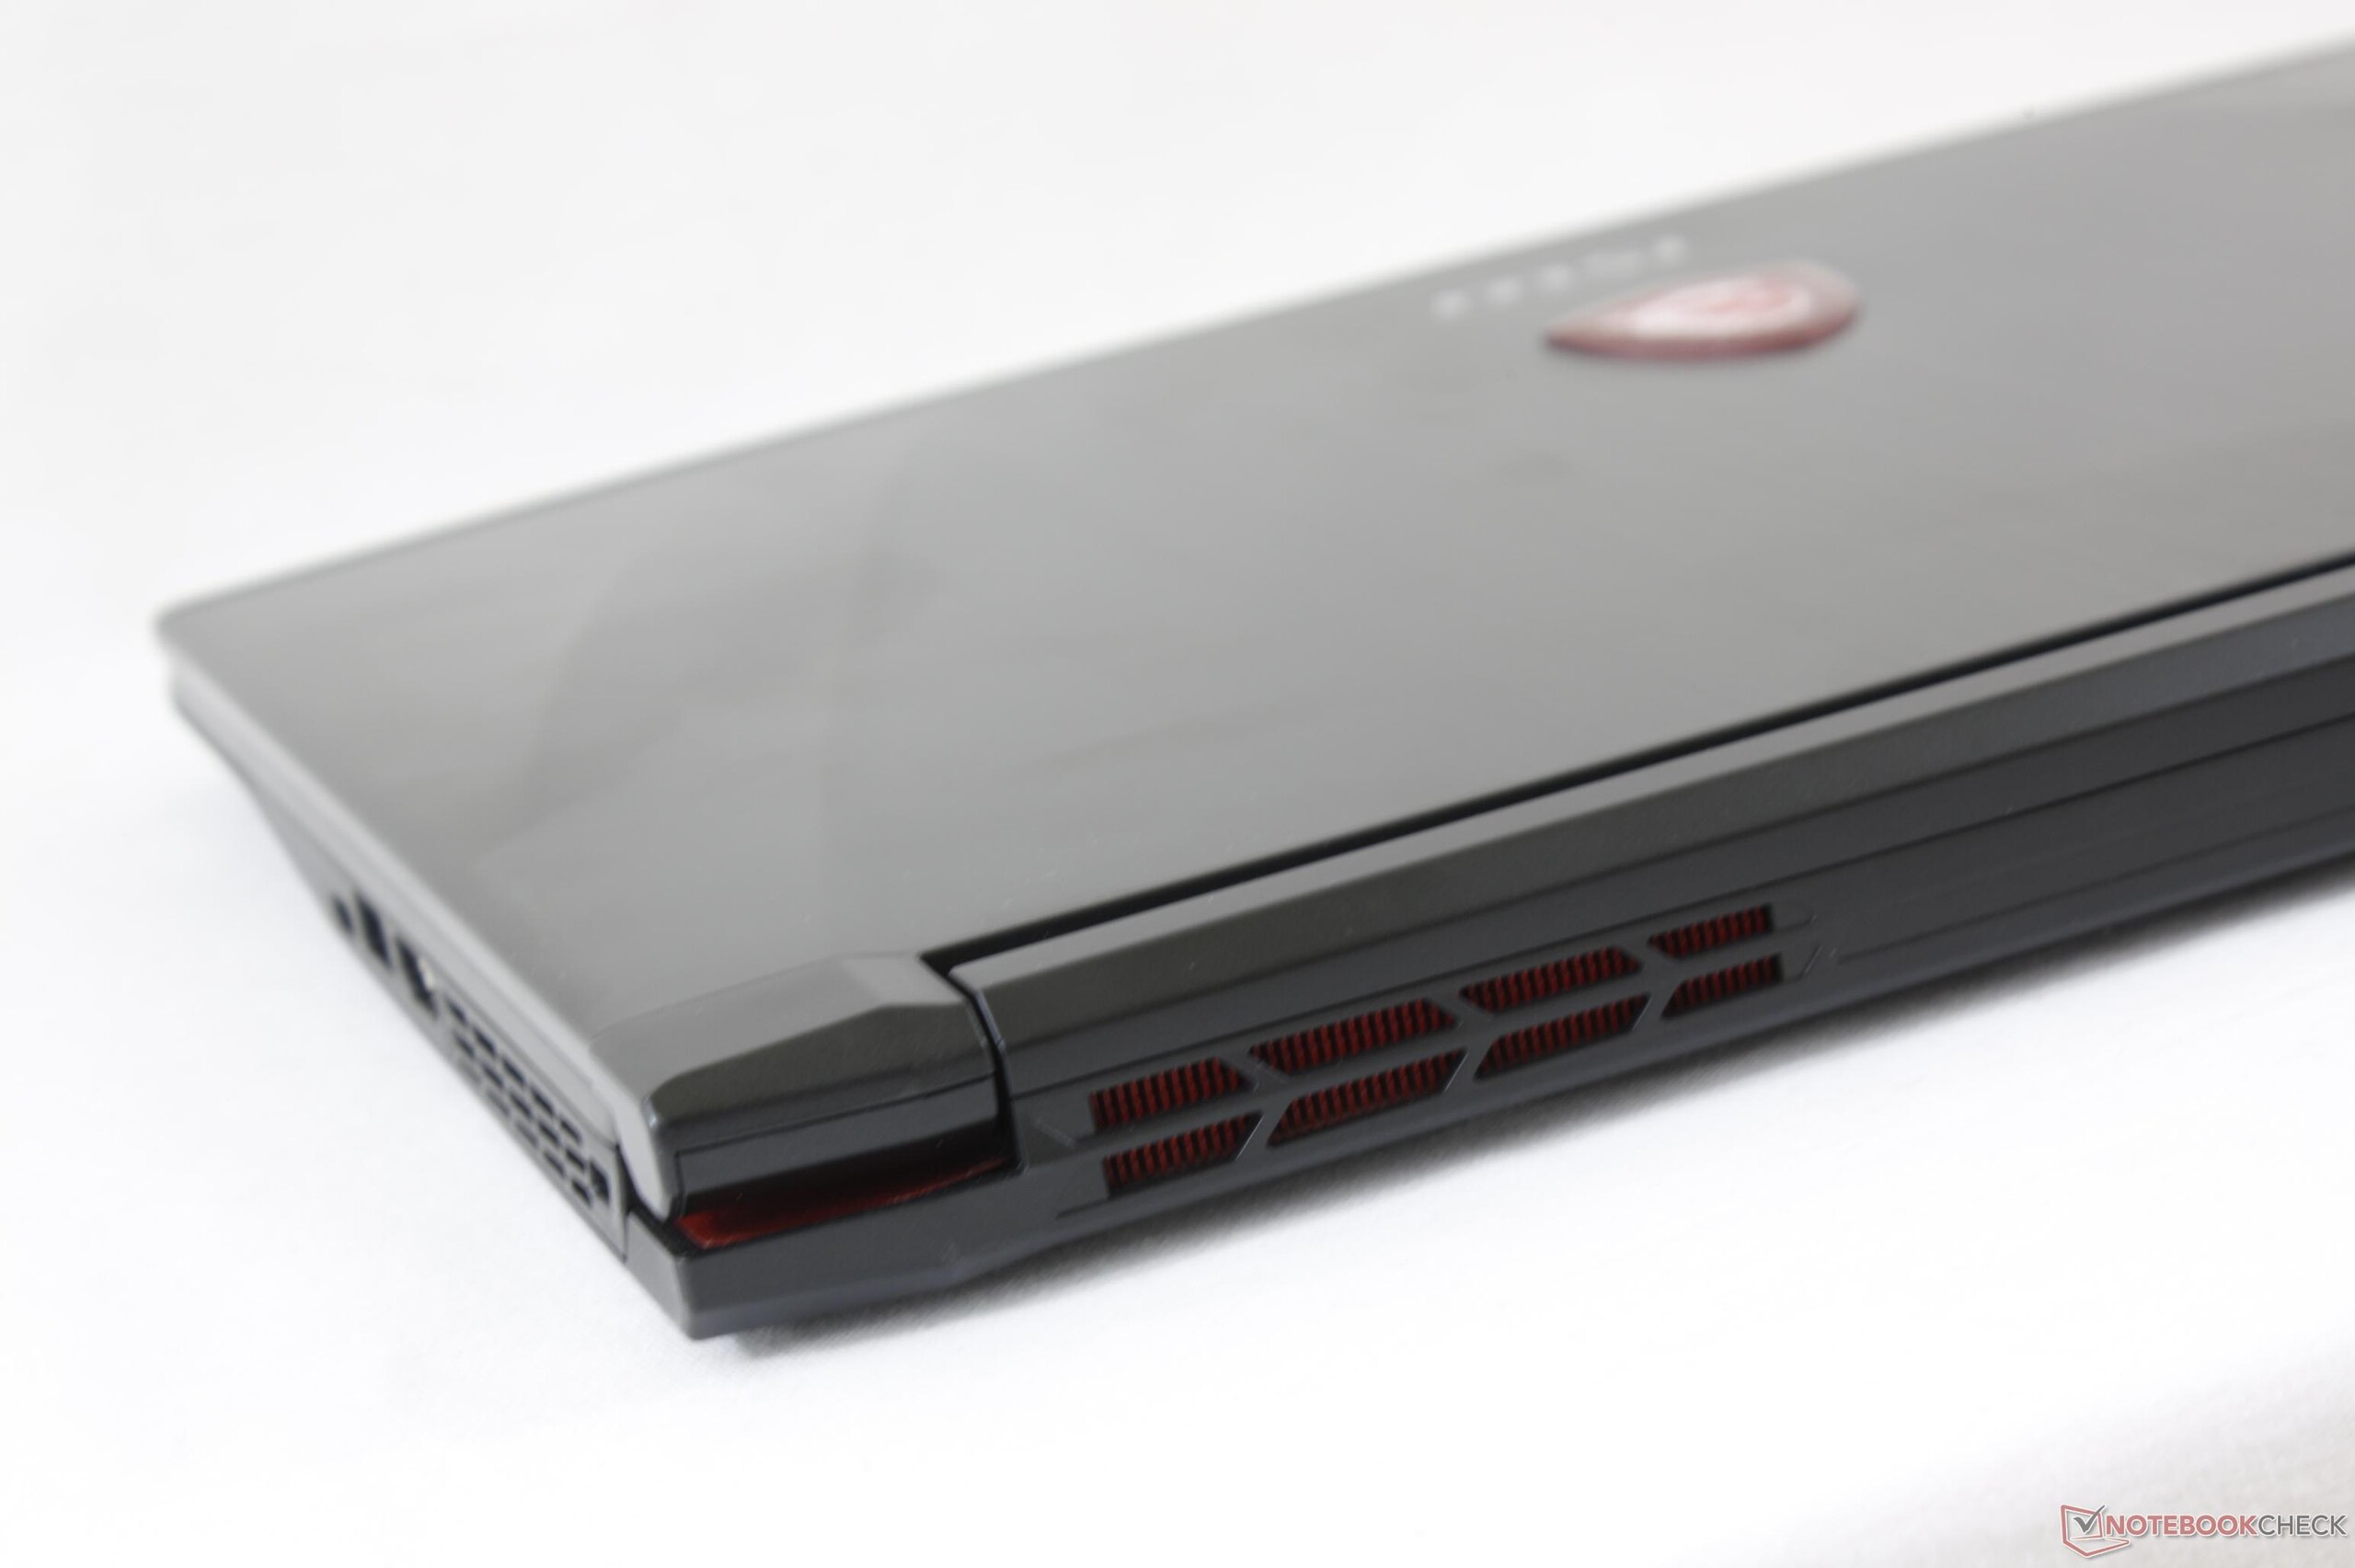
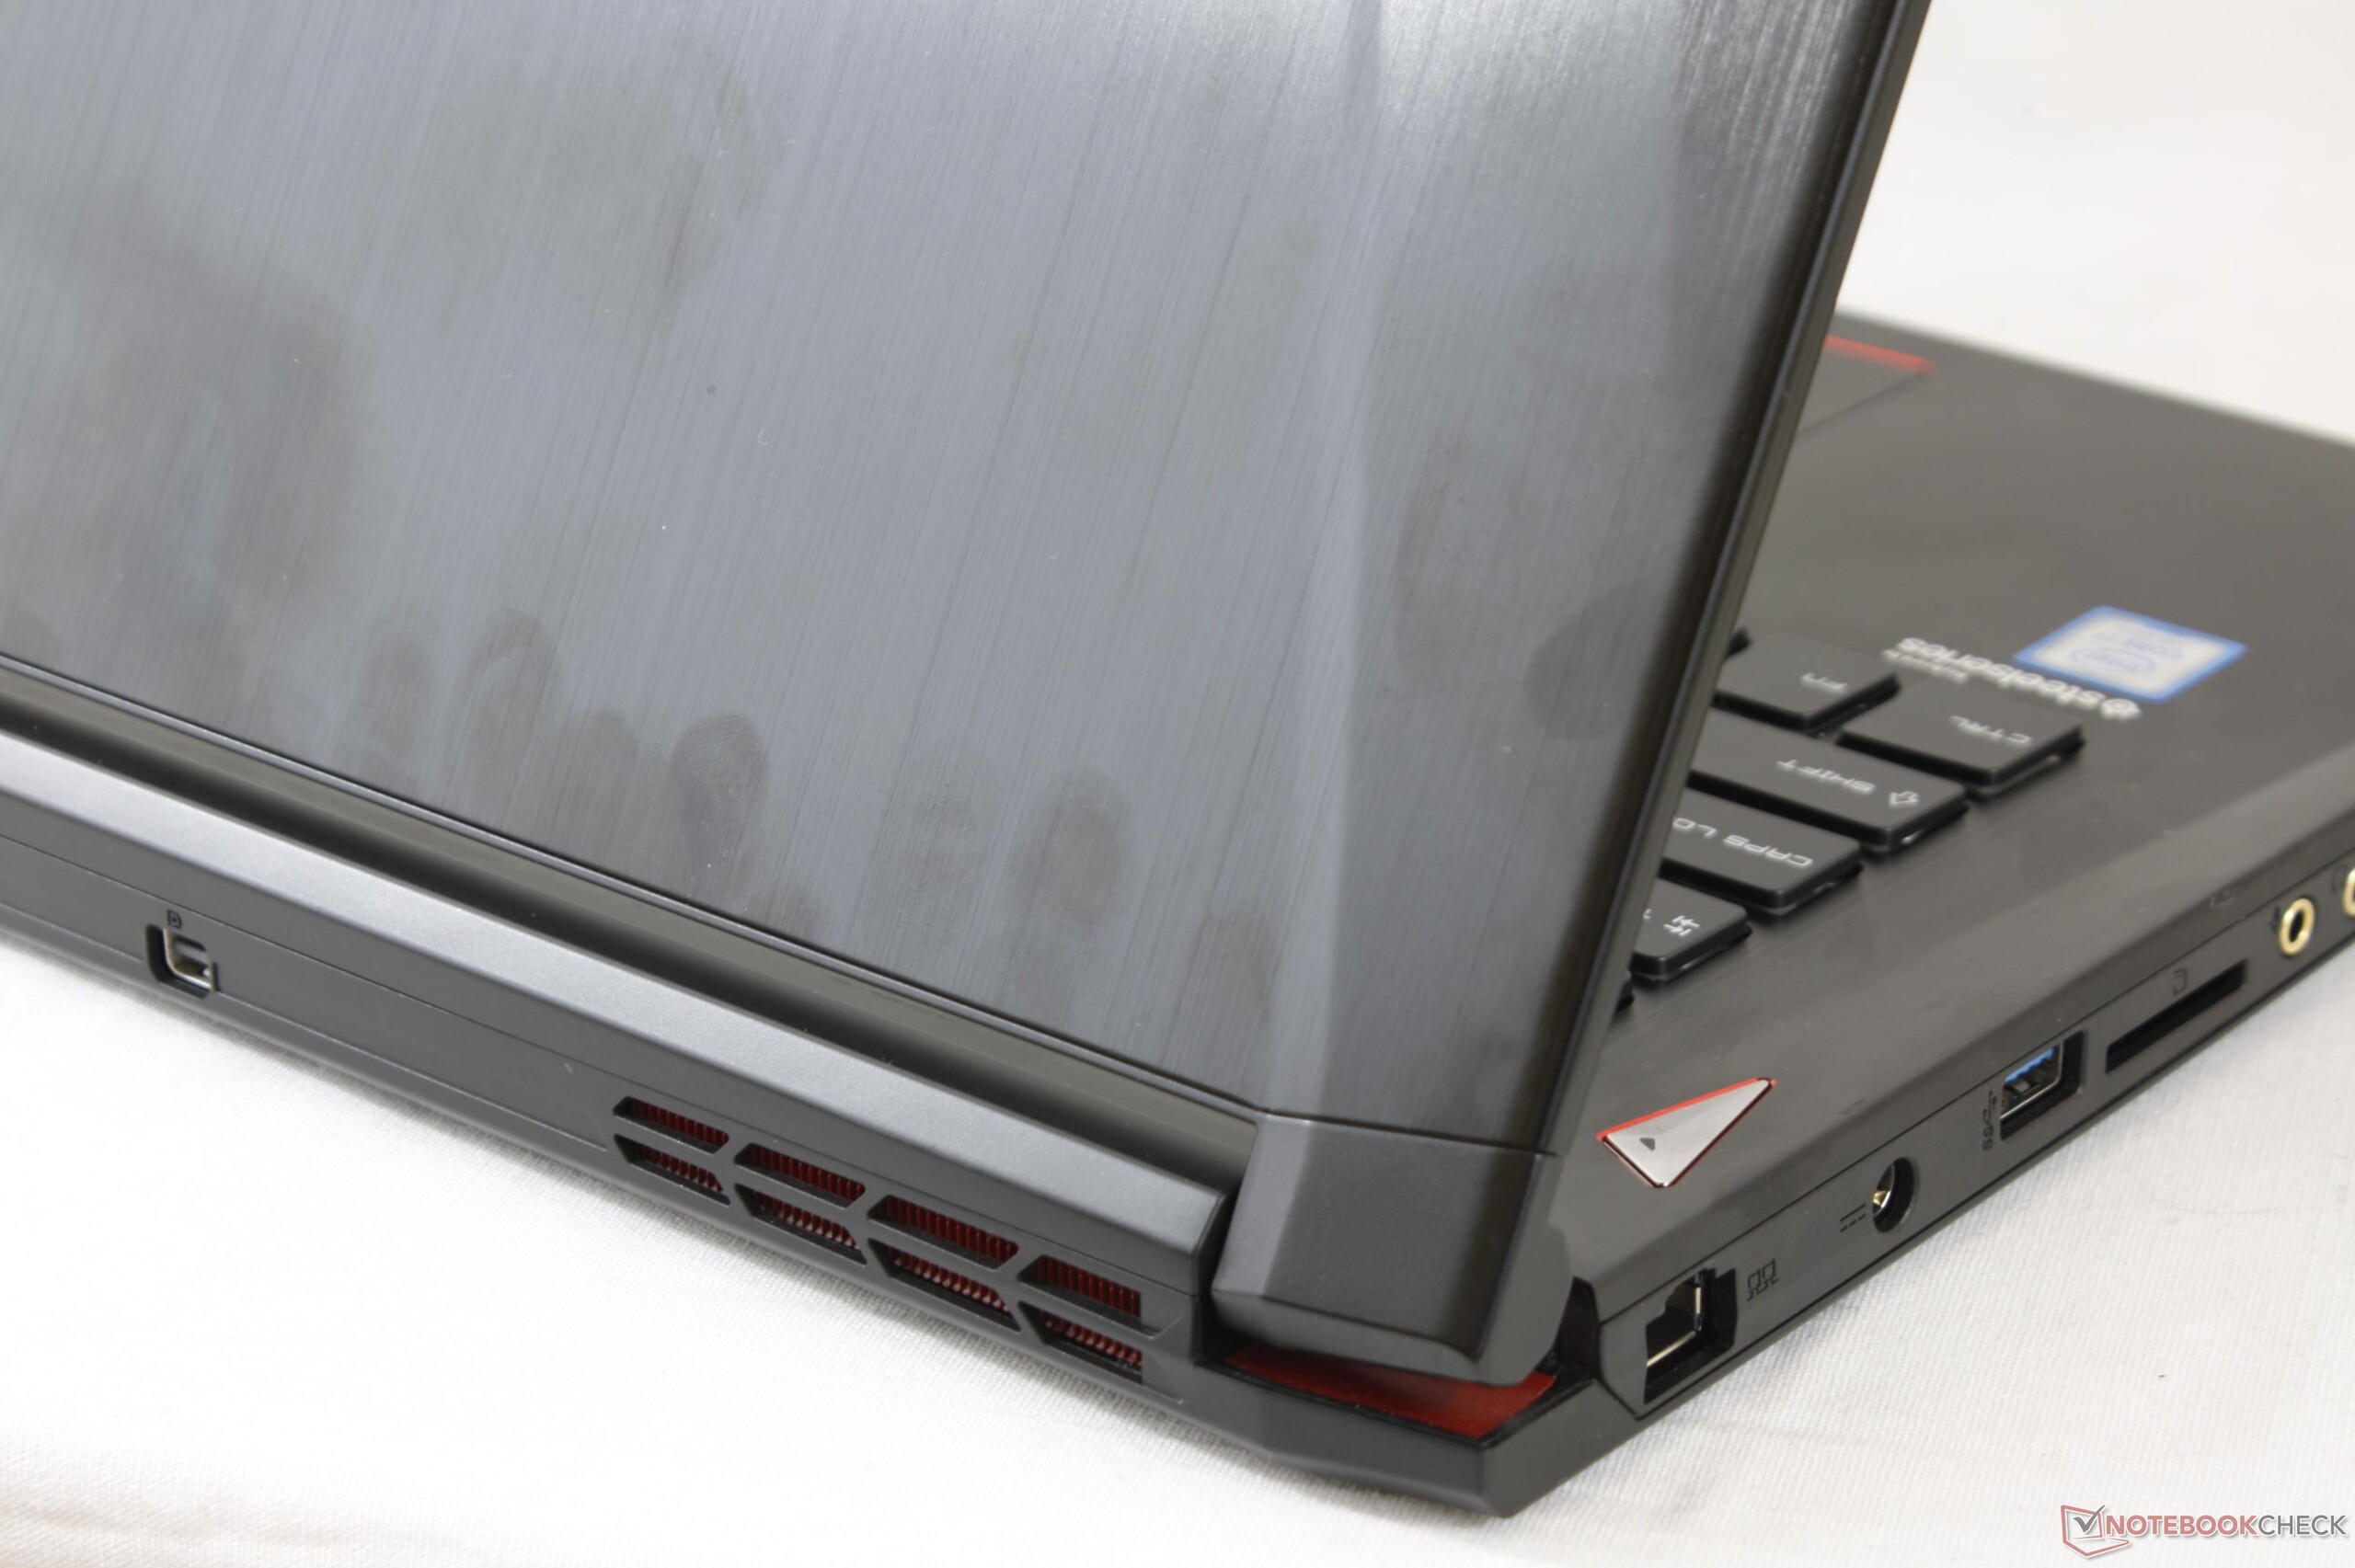
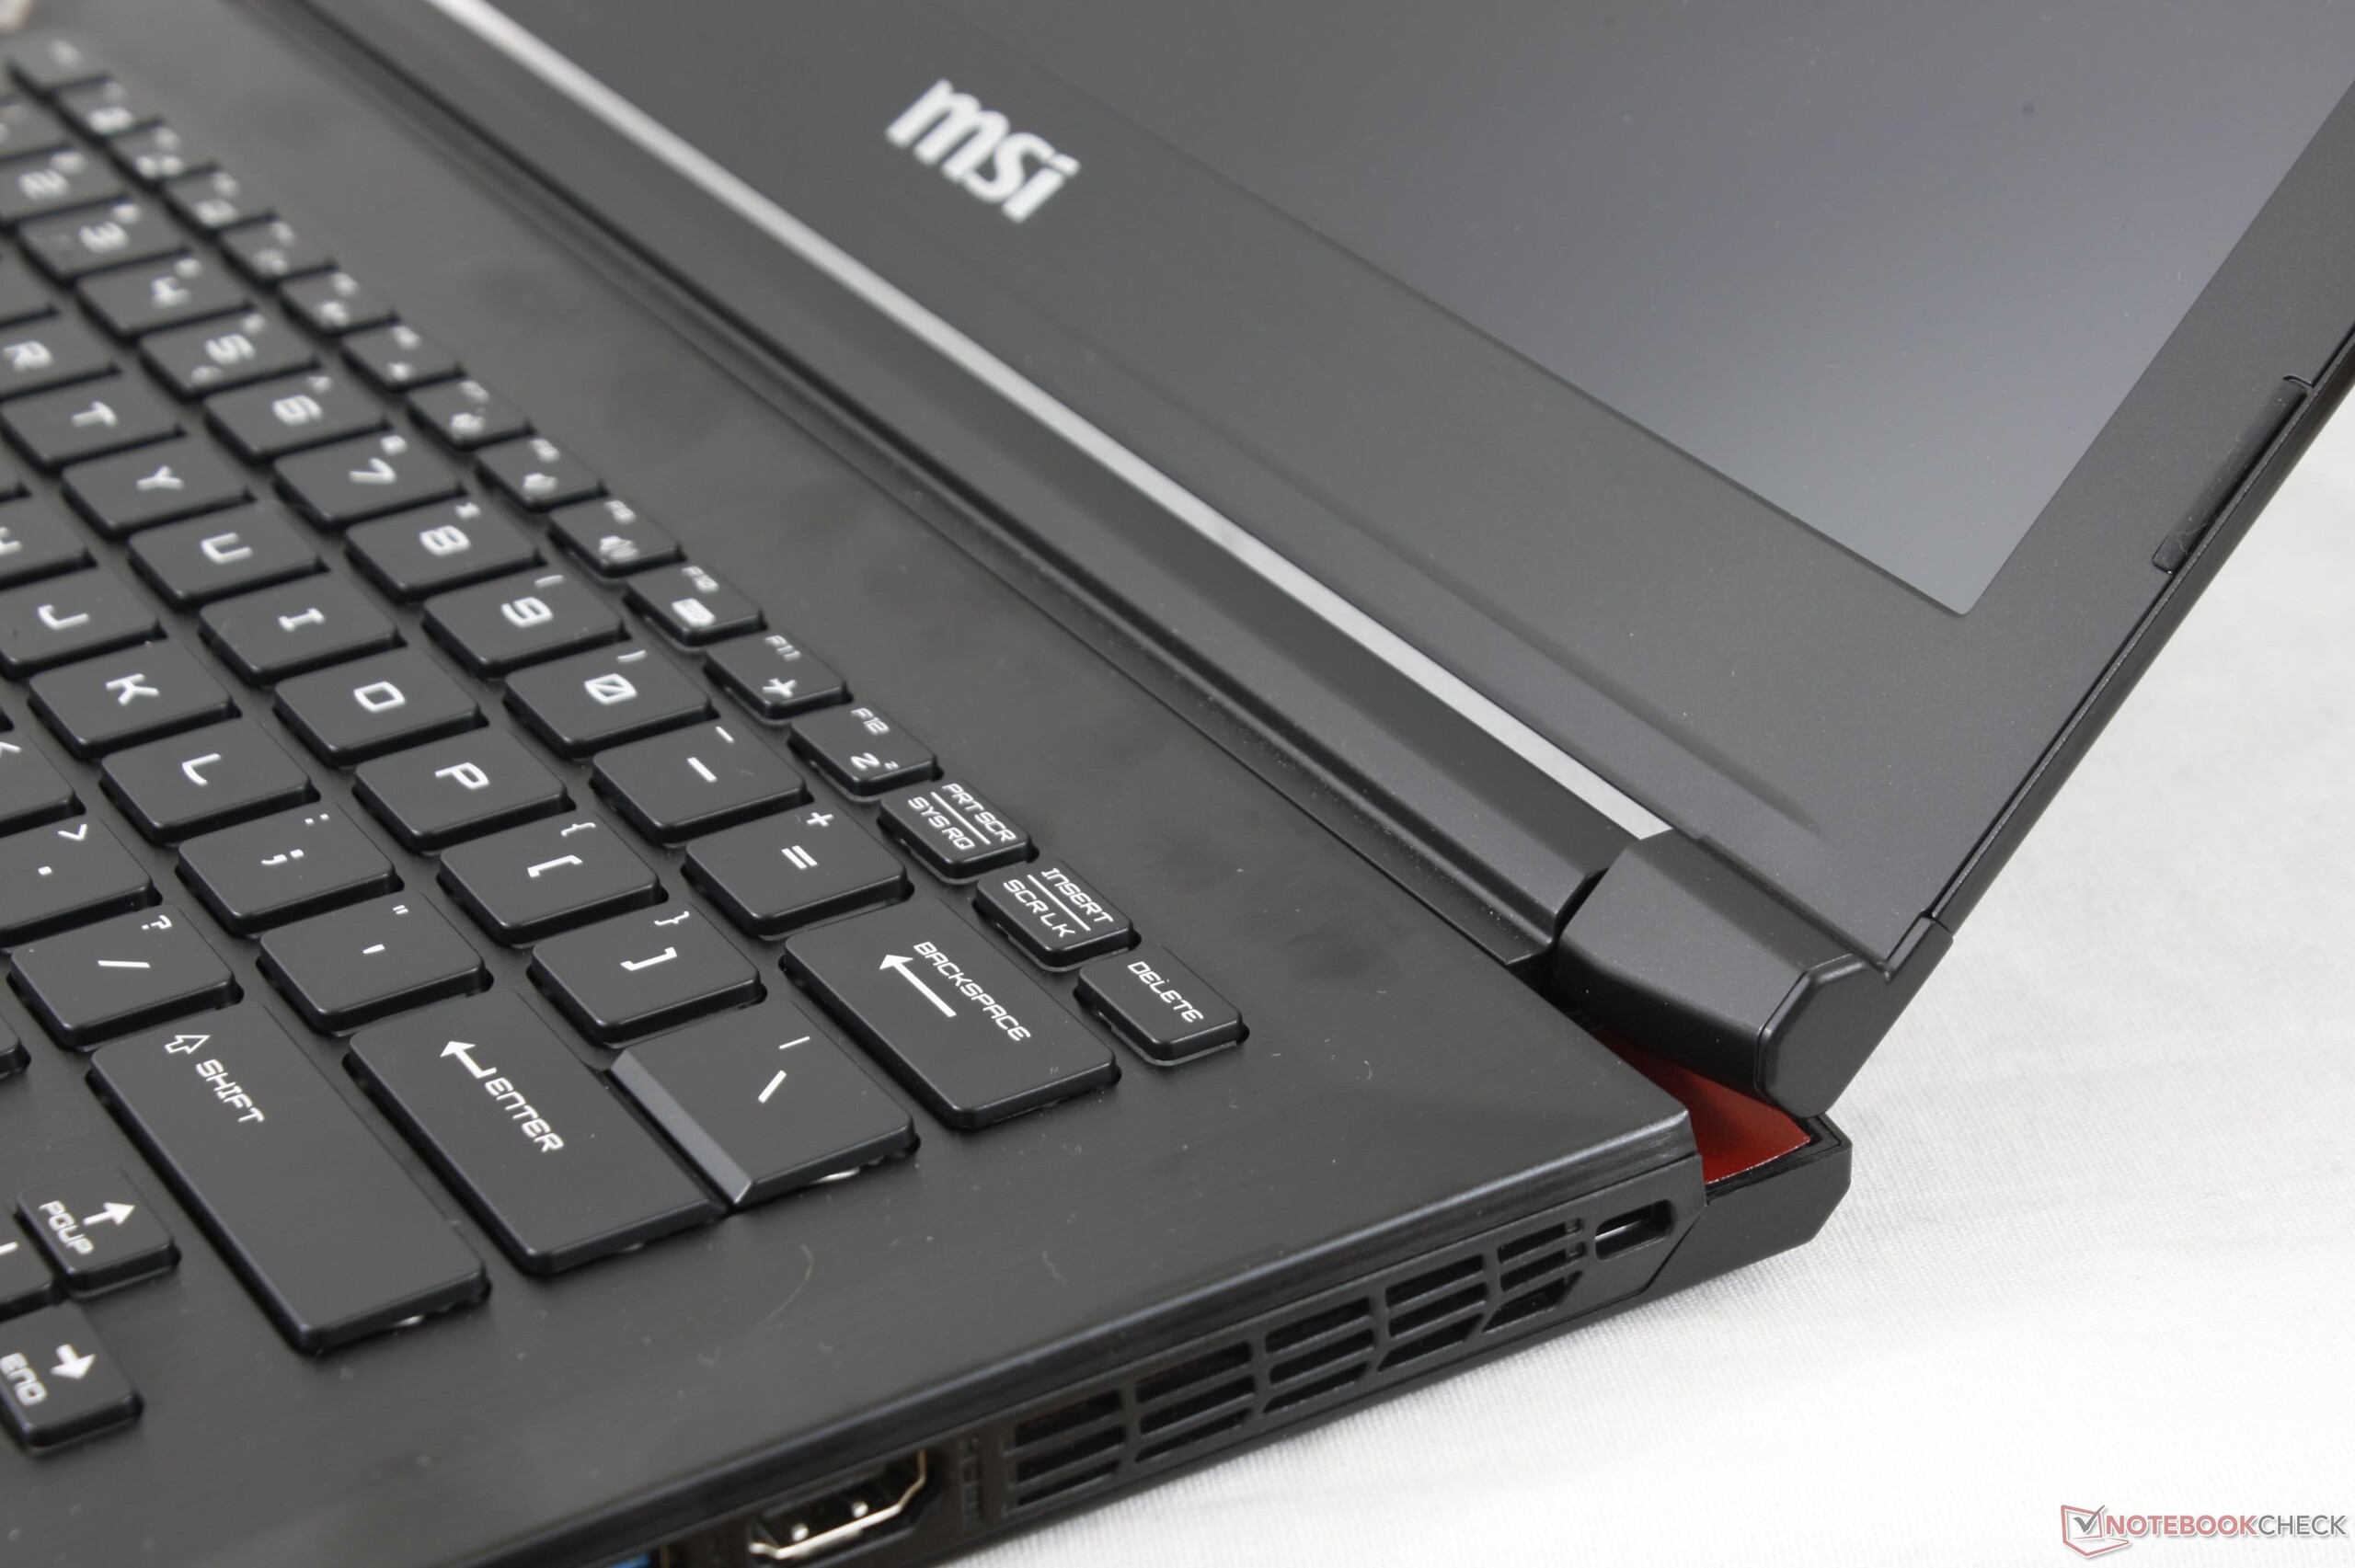
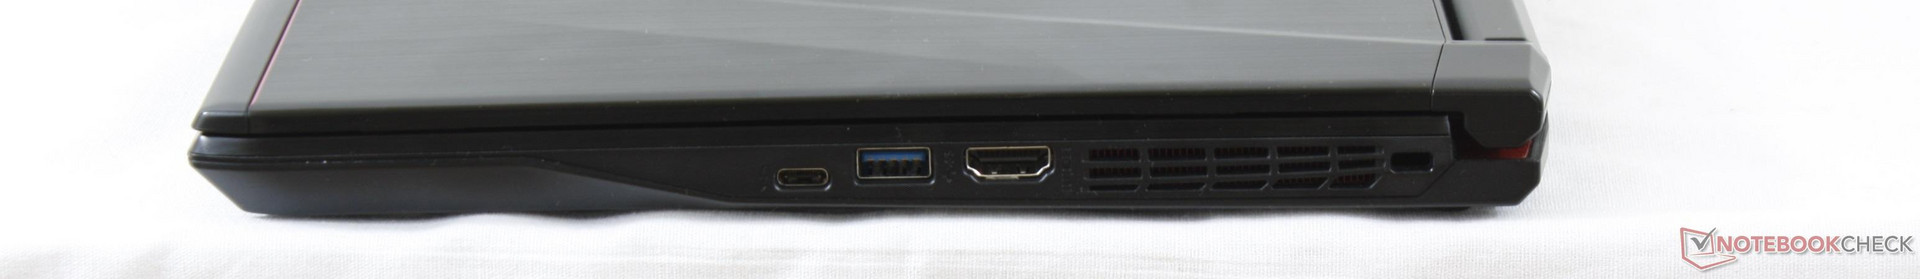
MSI podría haber hecho algunos cambios más para justificar mejor la compra del Kaby Lake GS43VR sobre el modelo del año pasado. Las teclas RGB multizona, HDMI 2.0, un lector de tarjetas SD más rápido, más opciones de visualización (G-Sync, tiempos de respuesta de 3 o 5 ms), y tal vez incluso menos bloatware podrían haberlo mejorado mucho. Está claro que la actual iteración de GS43 podría beneficiarse de una renovación de diseño completo para ponerse al día con las nuevas apariencias de las más conocidas series GE63VR y GT. La gran mejora debe tener todas las características mencionadas anteriormente y debería mejorar la rigidez del chasis y el ruido del ventilador. En este caso, el Alienware 13 y el Razer Blade se sienten más fuertes y resistentes de lo que MSI tiene para ofrecer en esta categoría de tamaños actualmente.
Con una pantalla de sólo 14", la GS43VR sólo se recomienda para los jugadores que están constantemente en movimiento y quieren que el rendimiento de un PC gaming en un paquete tan portable como sea posible. De lo contrario, el GT72 o GT73 son máquinas gaming significativamente mejores en términos de ruido del ventilador, la calidad de la carcasa, la conectividad, y el gran número de opciones para el precio. Sugerimos que los nuevos propietarios de GS43VR se familiaricen con los controles del ventilador y desinstalen el bloatware que parece estar obstaculizando la duración de la batería..
El GS43VR no coincide exactamente con la sensación o la calidad de un Alienware de 13" o un Razer Blade de 13" o 14" y necesita una revisión de diseño. Por $1500 USD, el MSI cuesta aproximadamente lo mismo que el Dell de $ 1550 USD y es más barato que el USD Razer $ 1900. Si tiene que ser el MSI, invertir en el anterior GS43VR Skylake ahorrará unos cientos de dólares sin sacrificar el rendimiento de los juegos.
Ésta es una versión acortada del análisis original. Puedes leer el análisis completo en inglés aquí.
MSI GS43VR 7RE-069US
- 07/27/2017 v6 (old)
Allen Ngo
Price comparison
