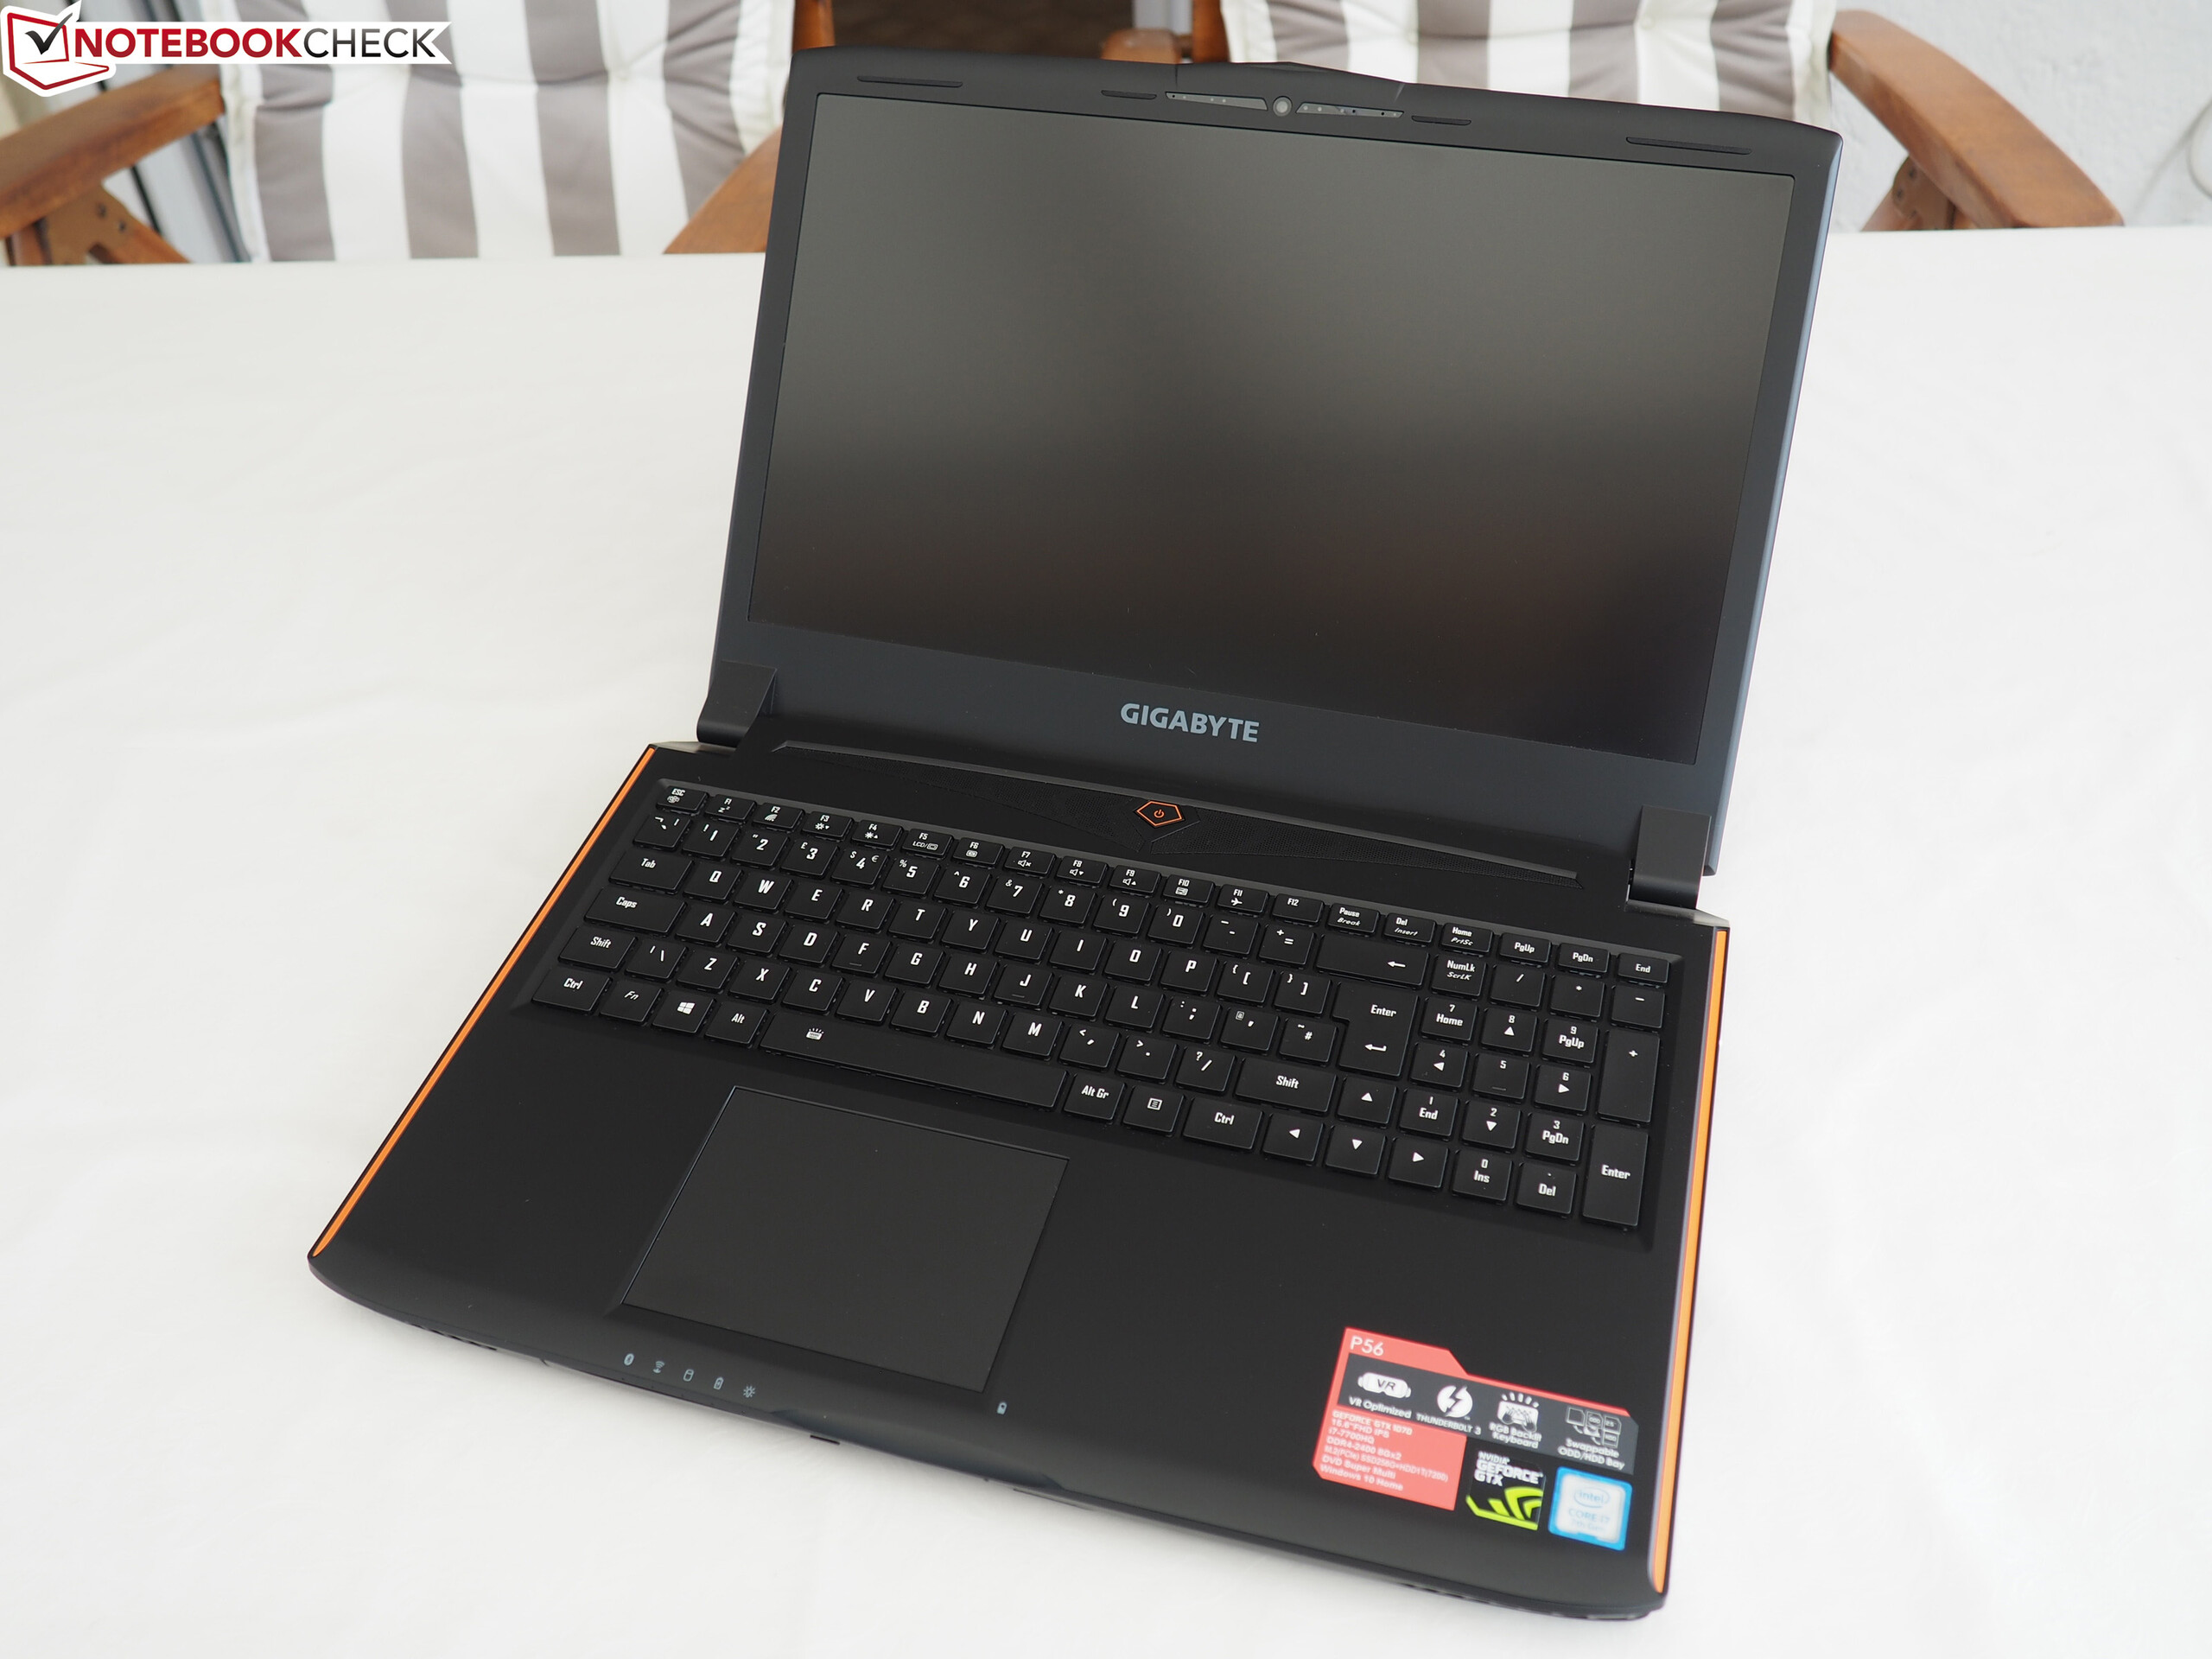
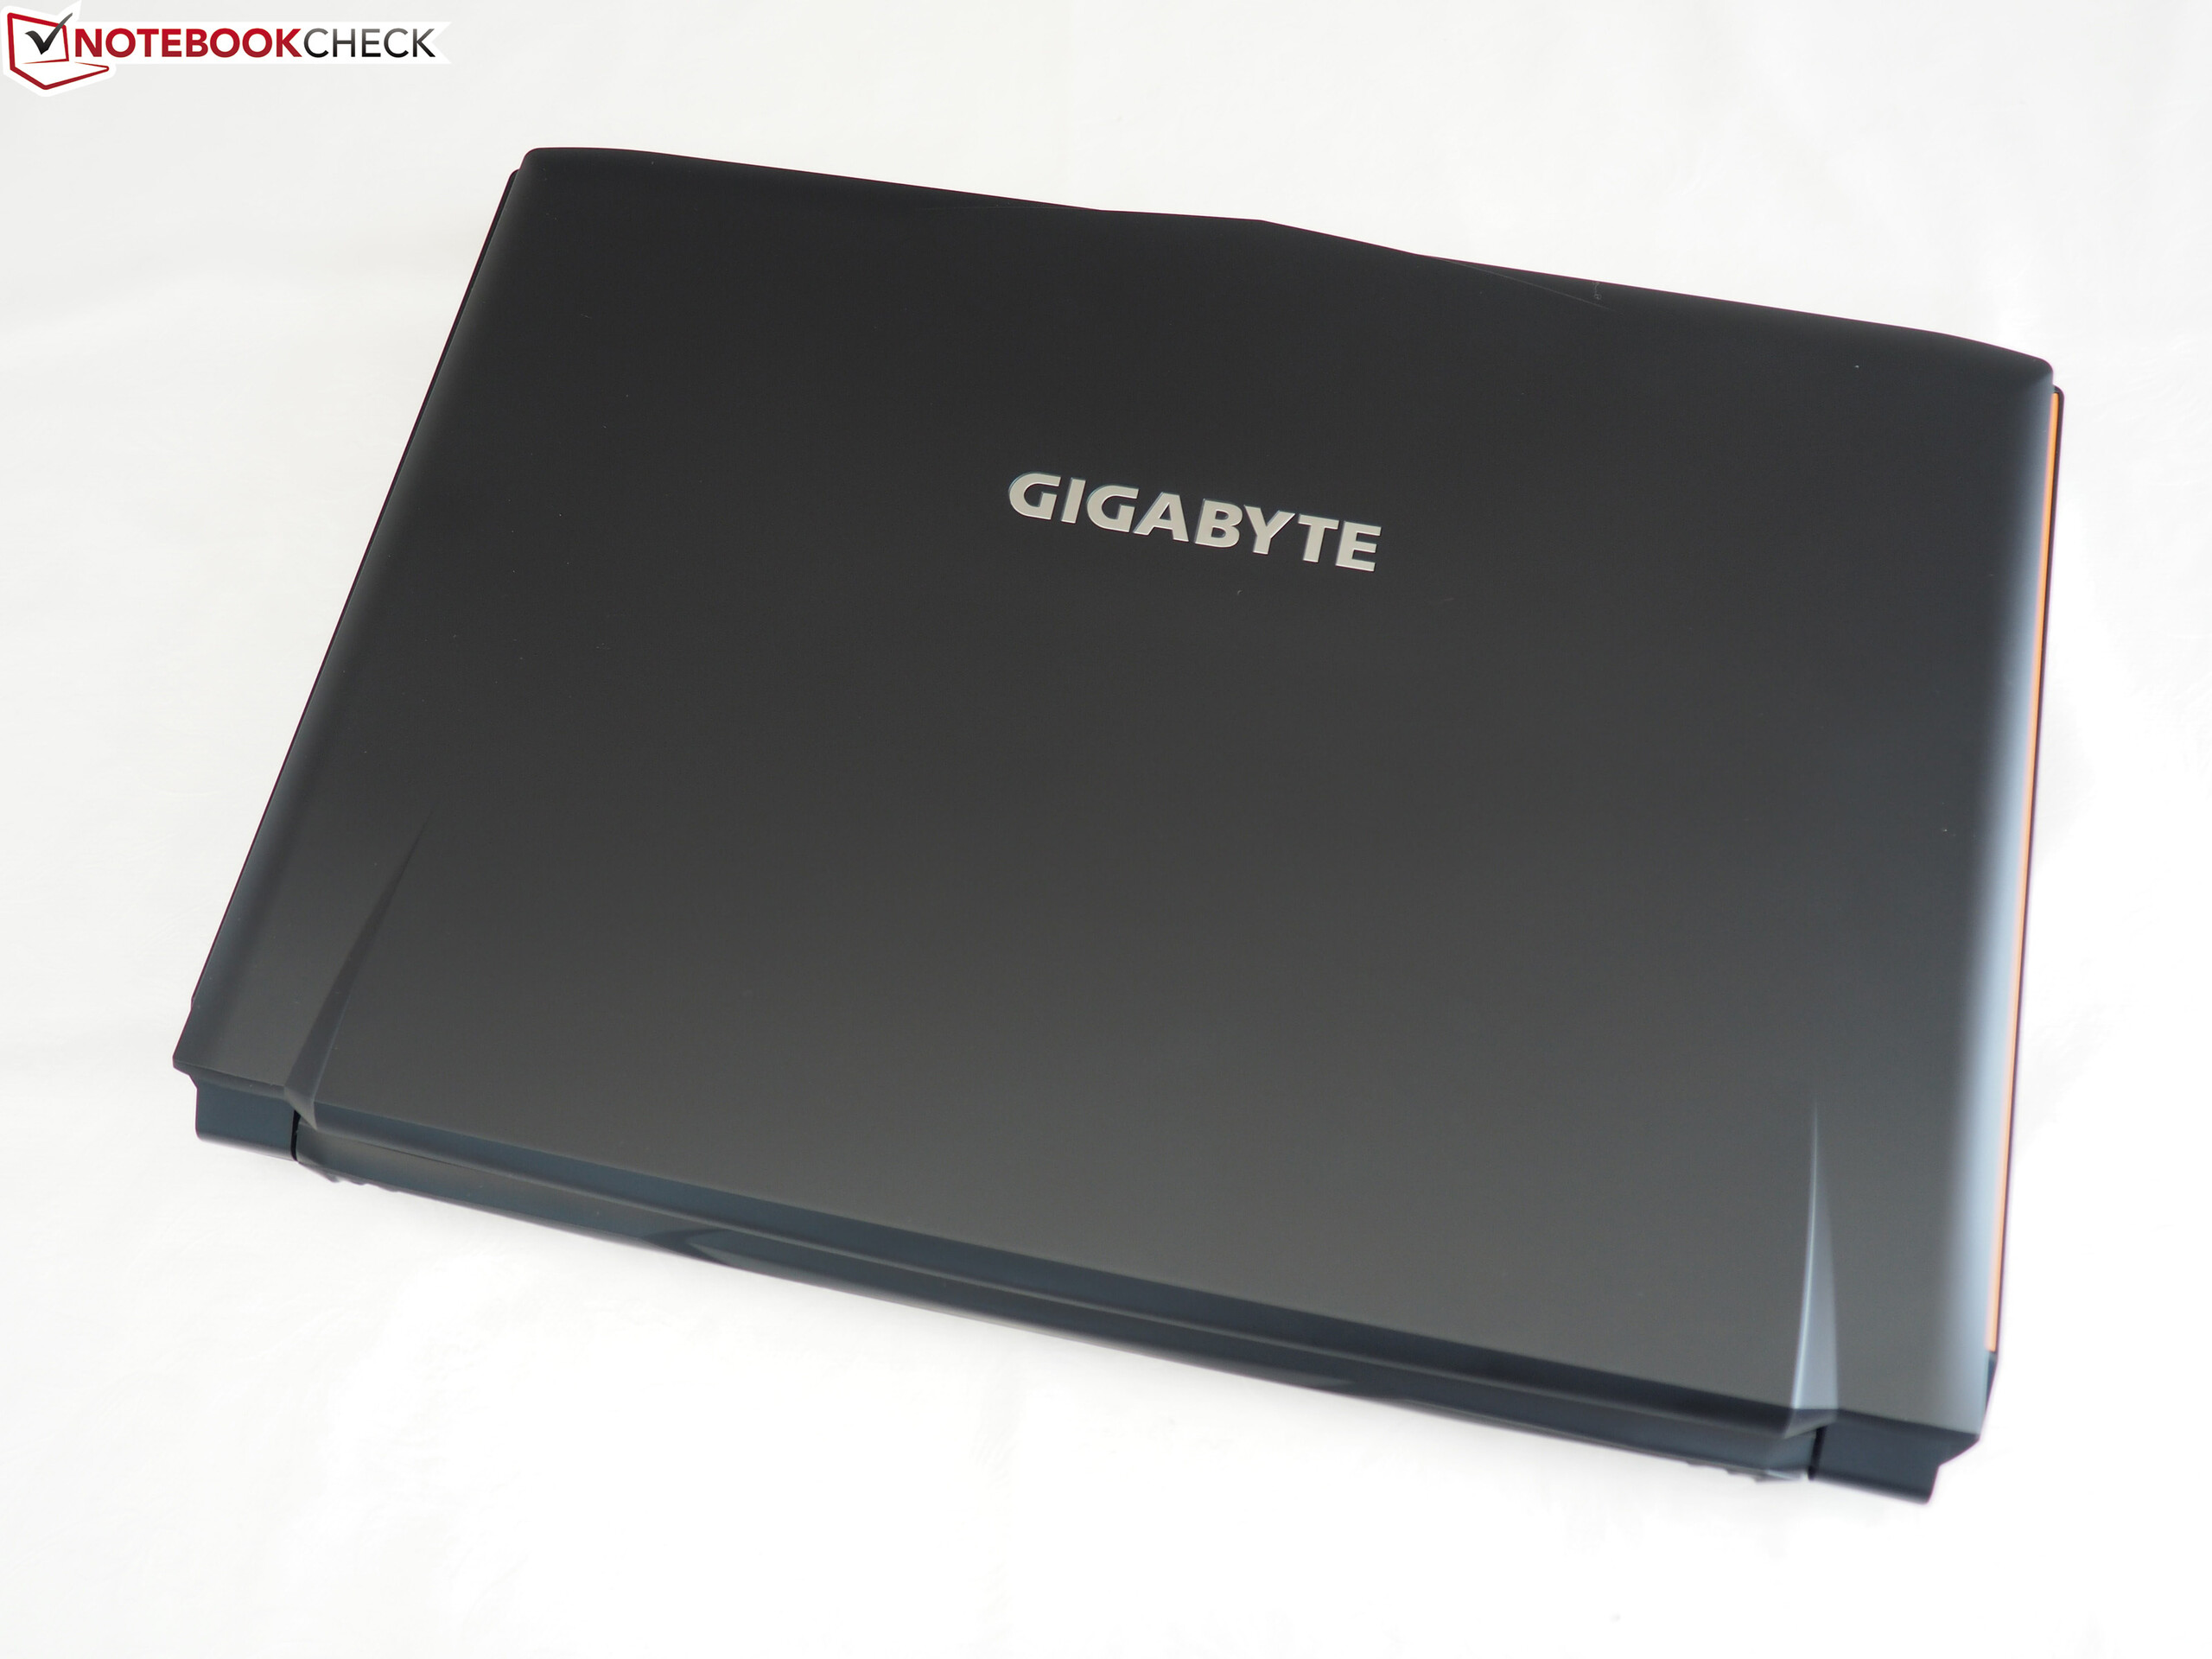
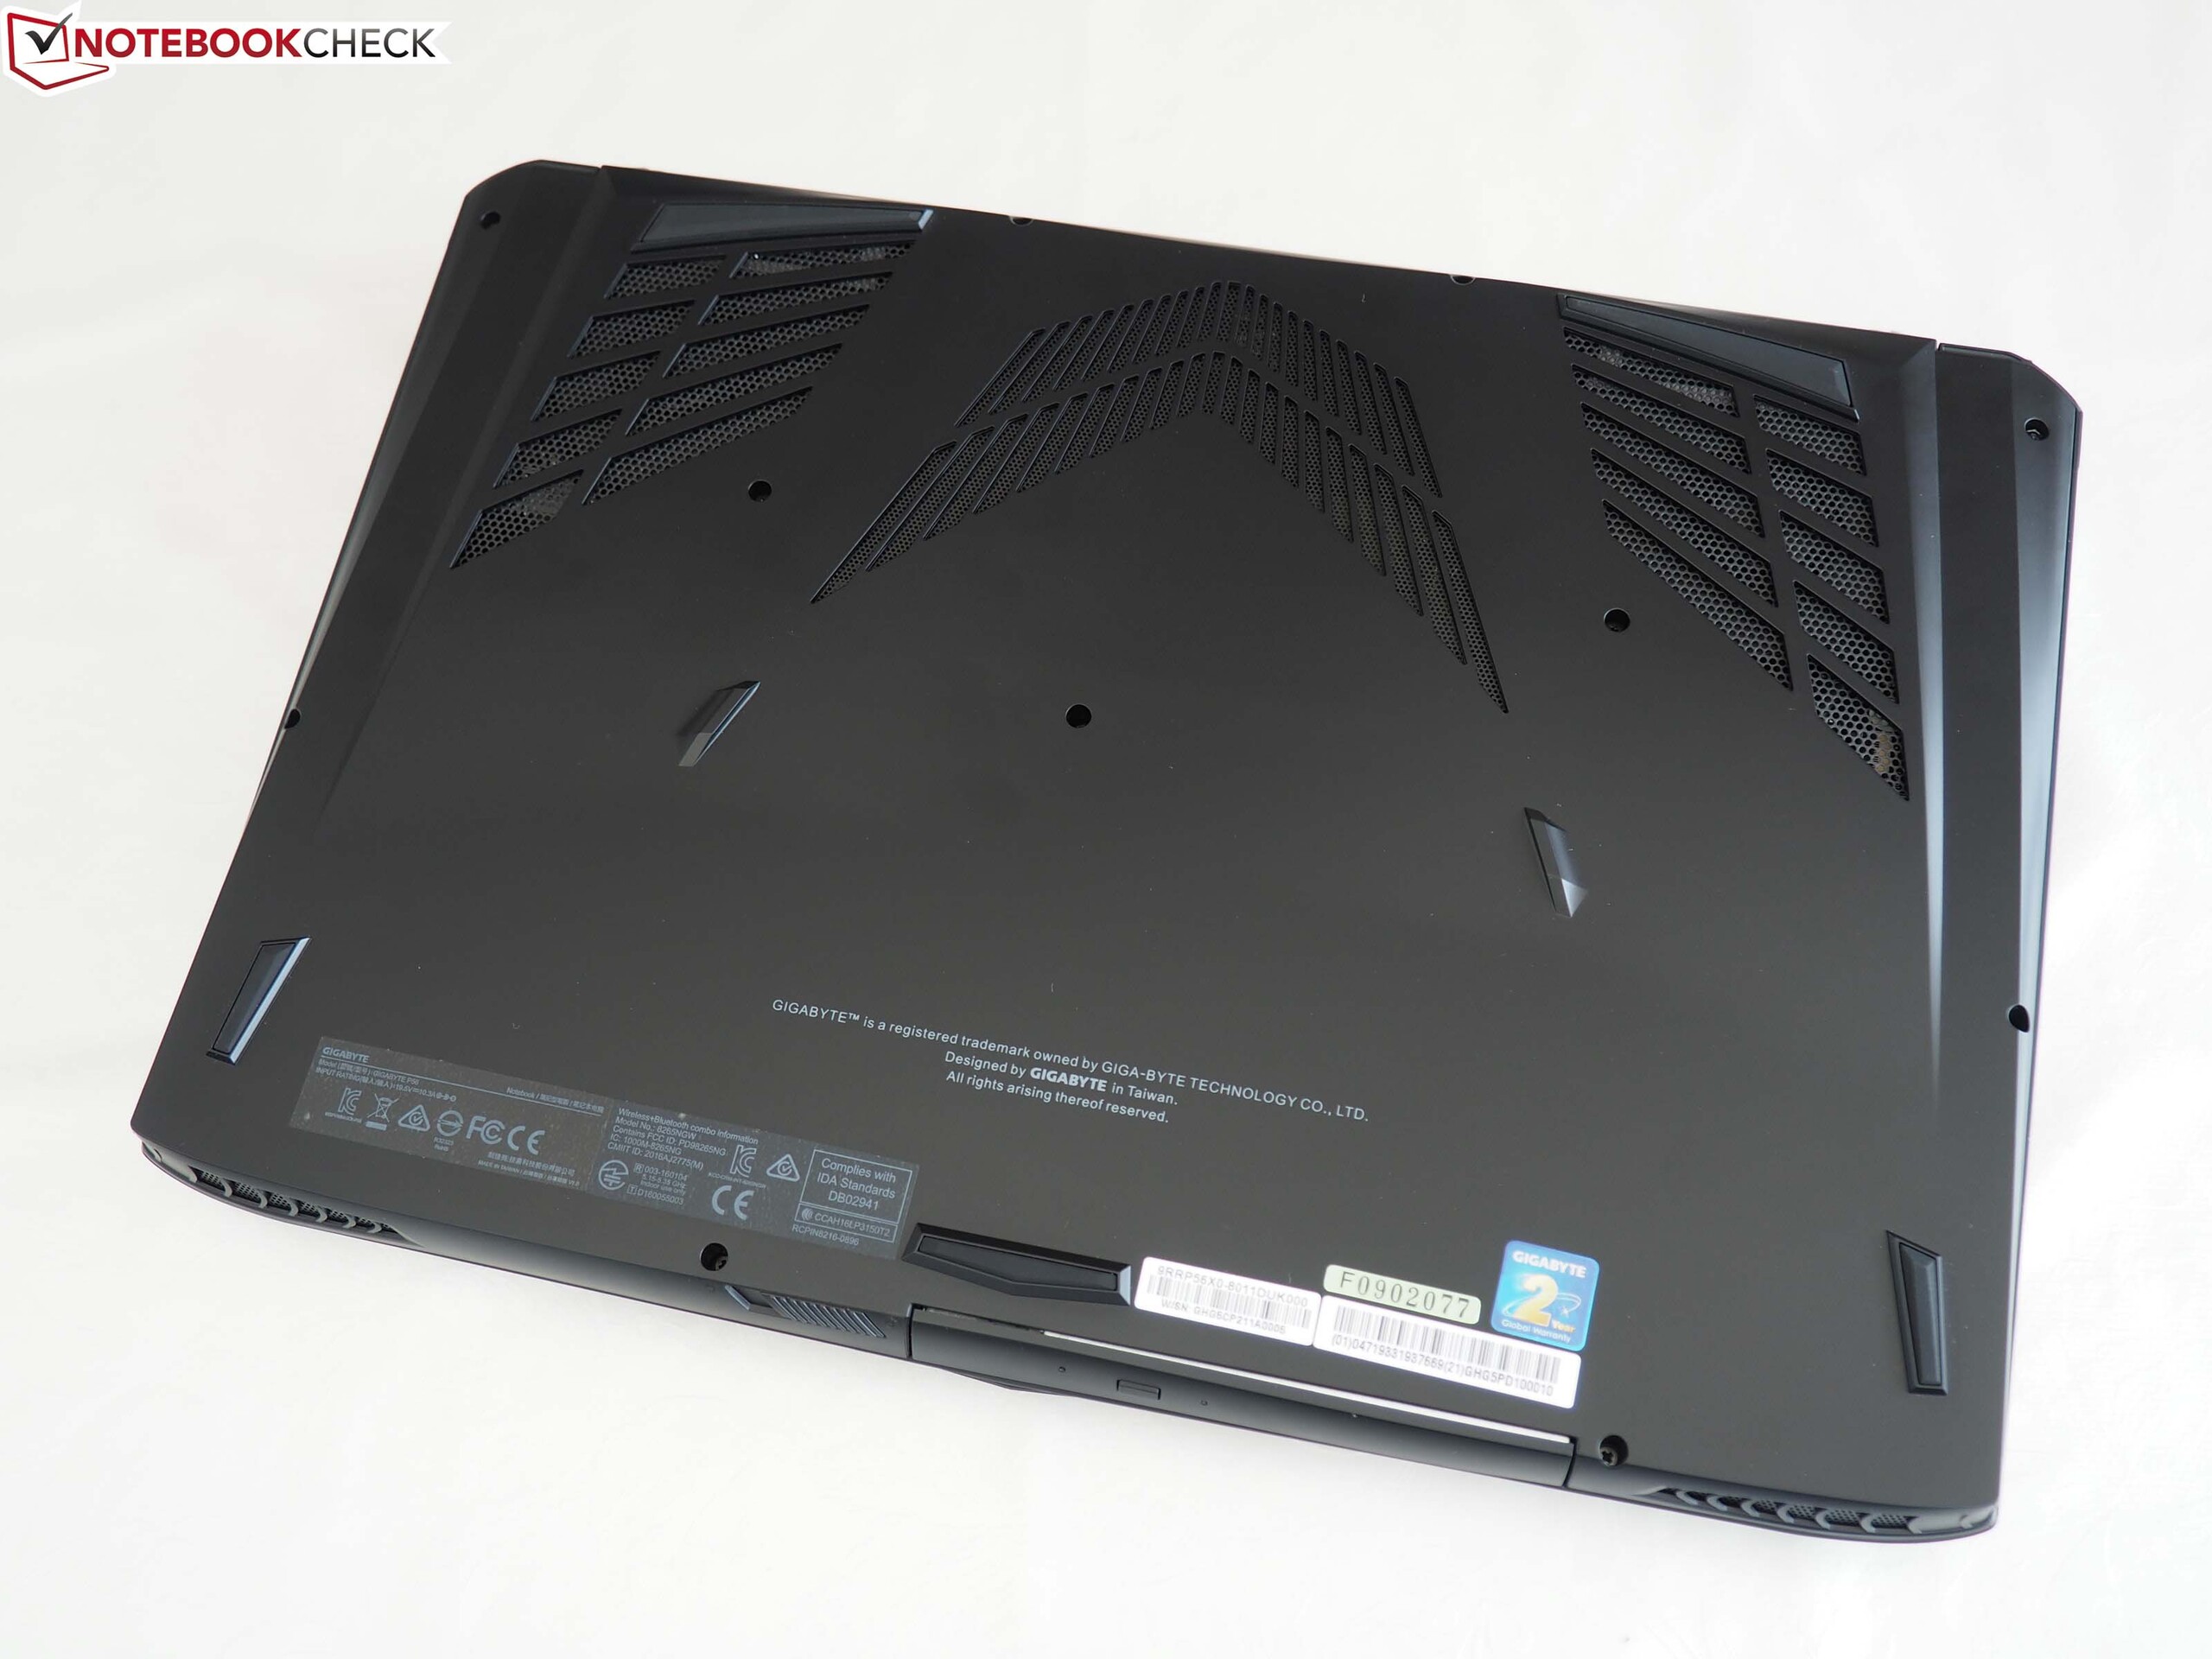
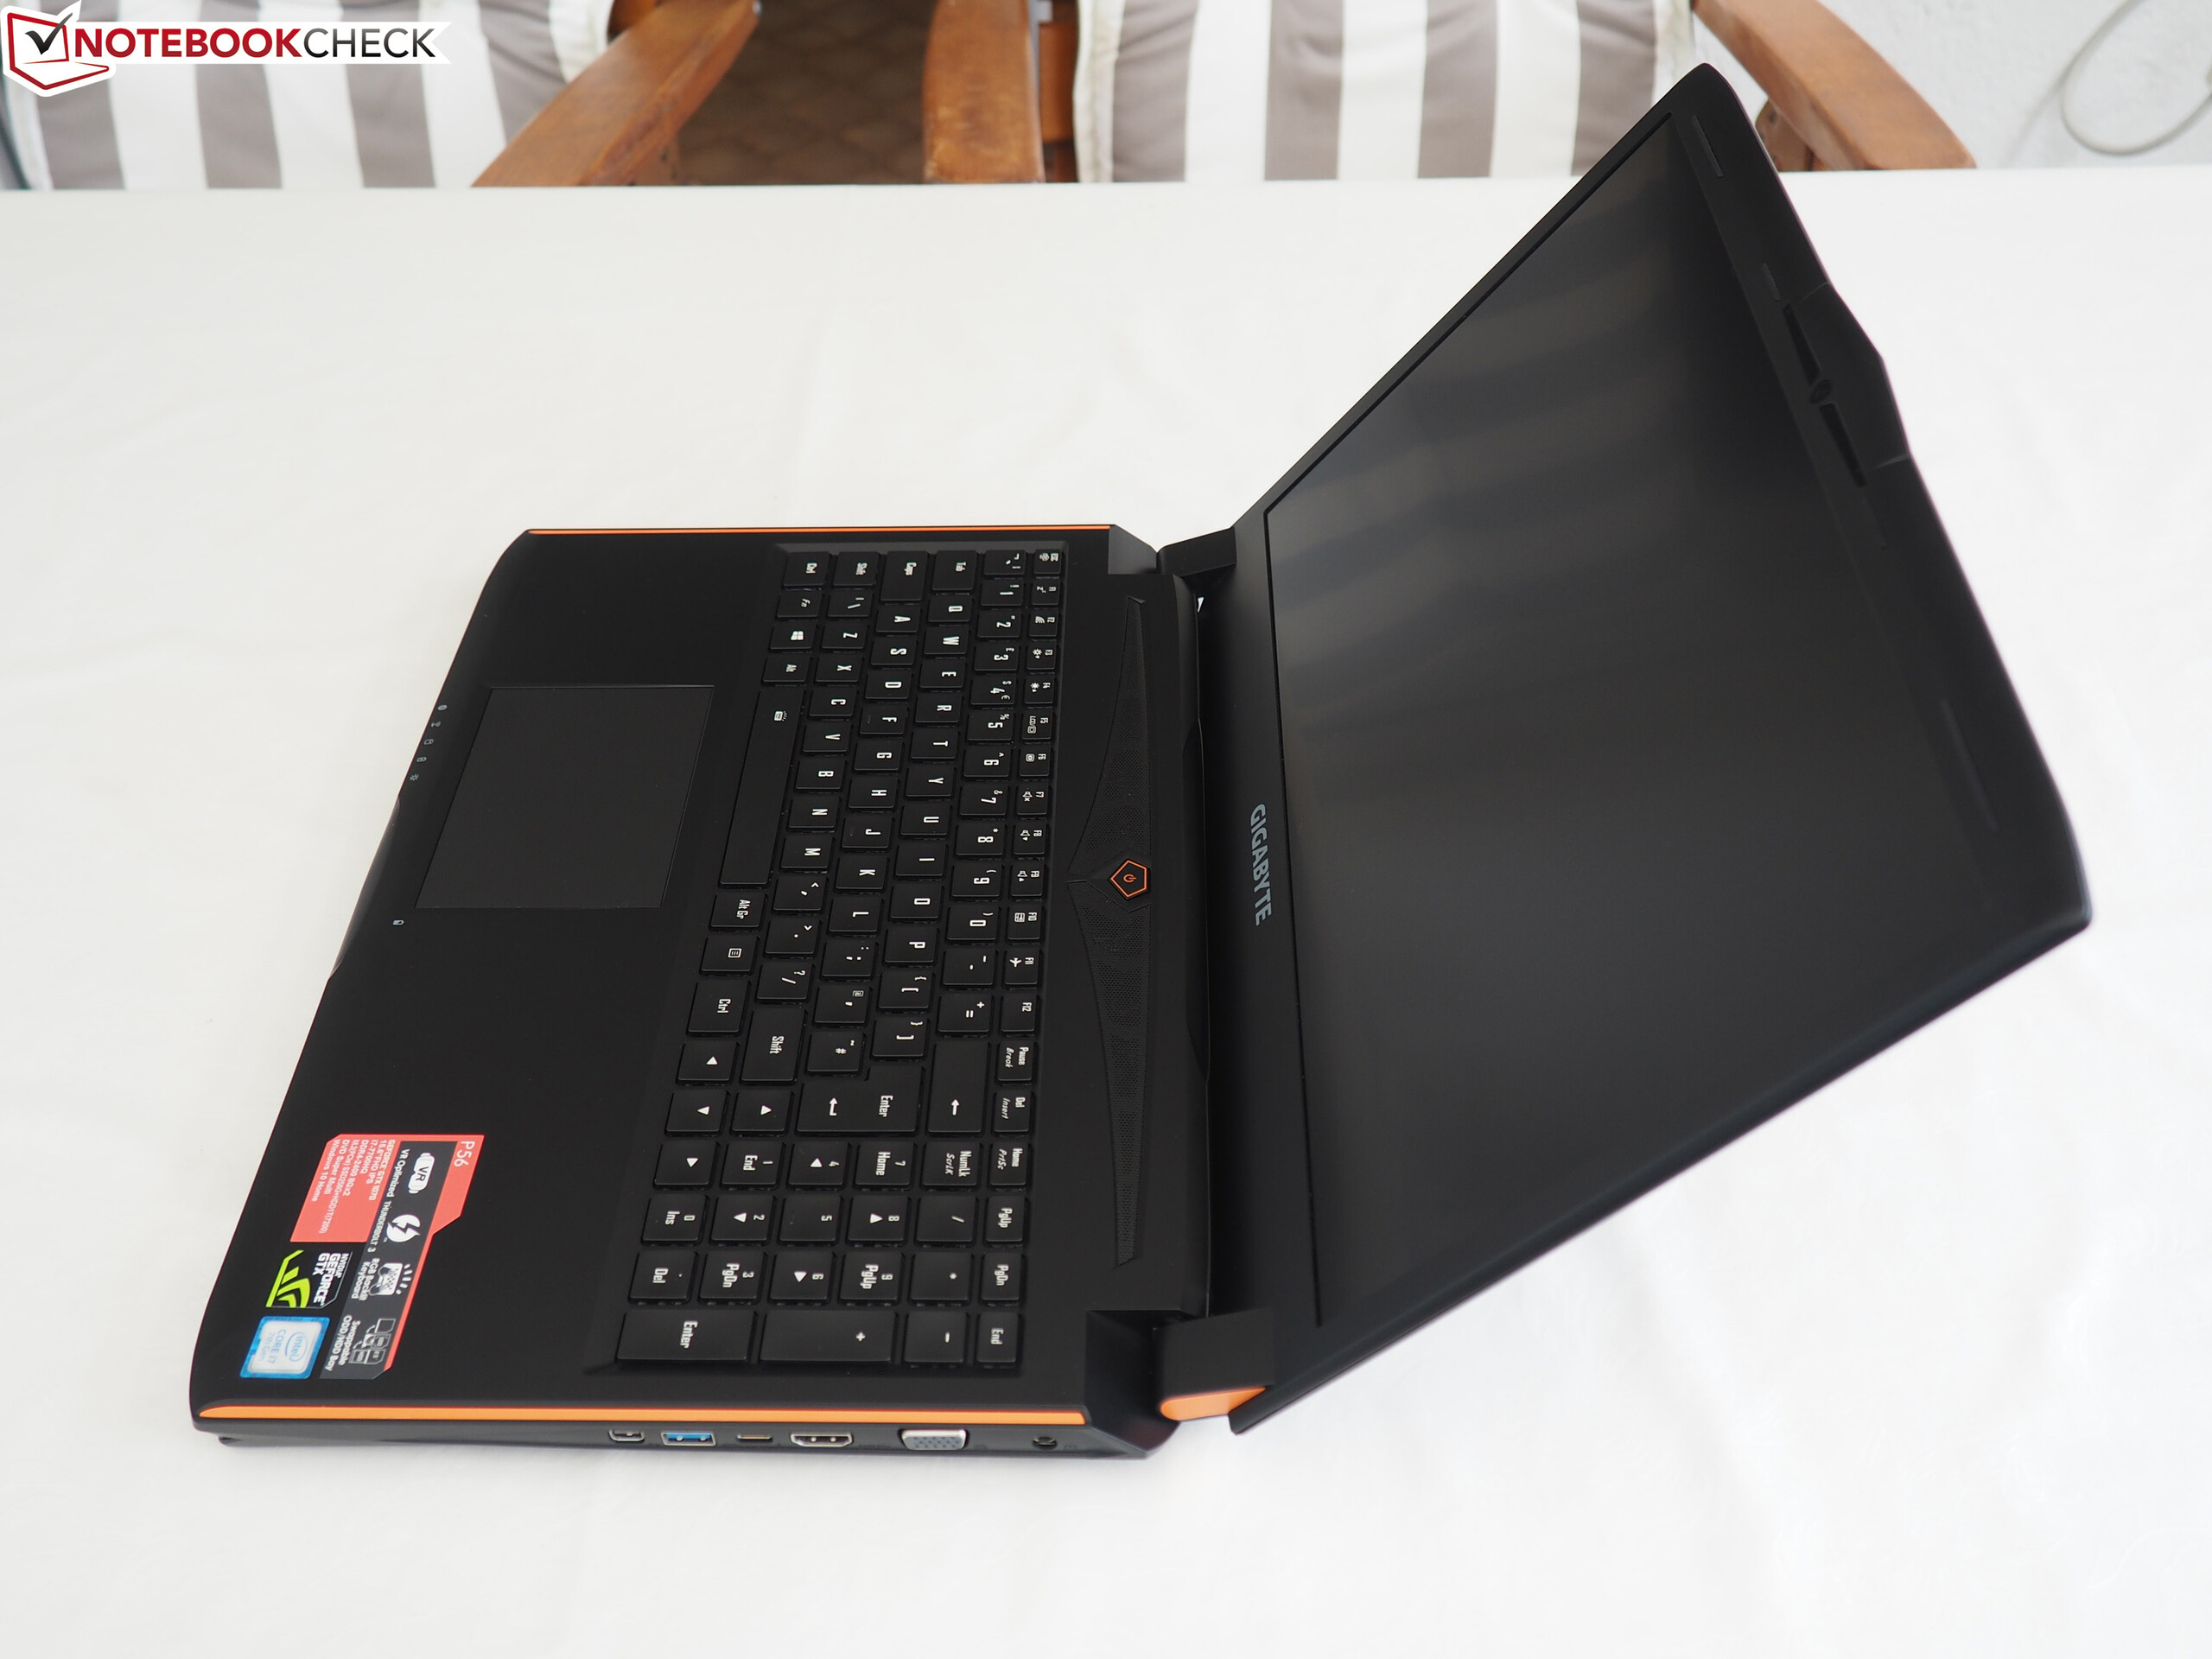
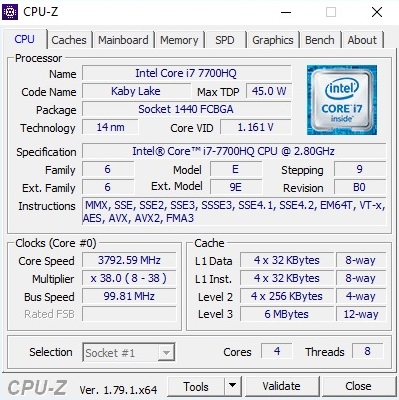
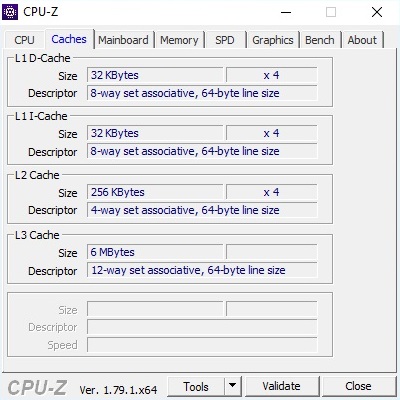
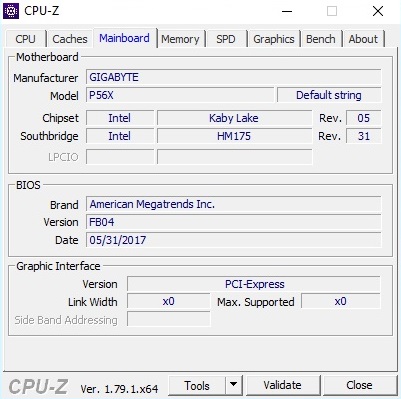
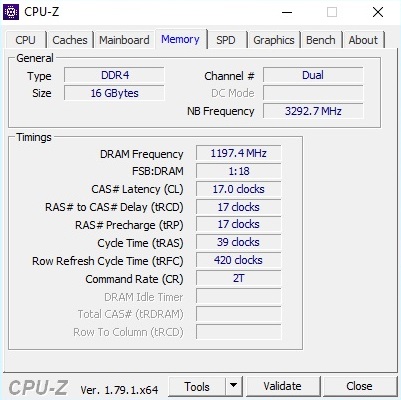
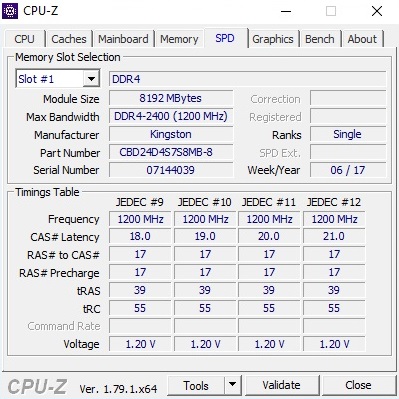
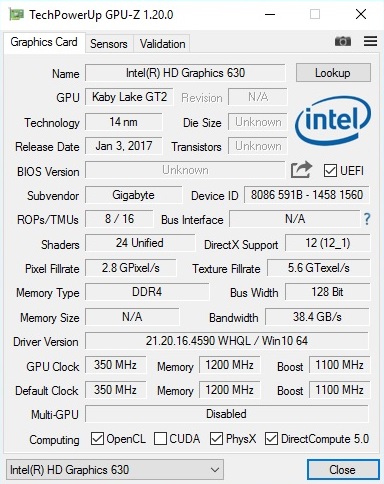
Breve análisis del Gigabyte P56XT (7700HQ, GTX 1070, Full-HD)
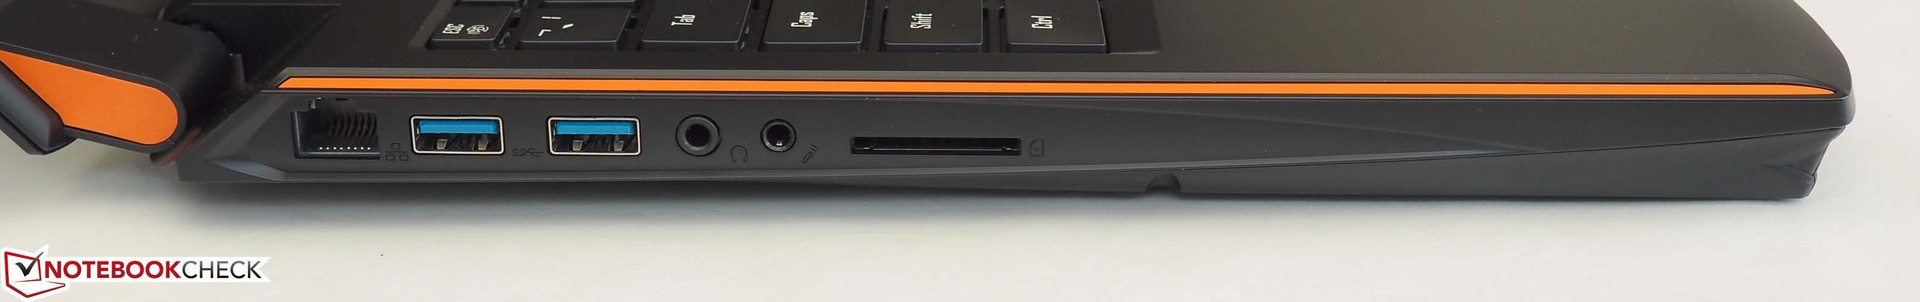
| SD Card Reader | |
| average JPG Copy Test (av. of 3 runs) | |
| Acer Predator 15 G9-593-751X (Toshiba Exceria Pro SDXC 64 GB UHS-II) | |
| Schenker XMG P507 PRO (Toshiba Exceria Pro SDXC 64 GB UHS-II) | |
| Gigabyte Aero 15 (Toshiba Exceria Pro SDXC 64 GB UHS-II) | |
| Gigabyte P56XT (Toshiba Exceria Pro SDXC 64 GB UHS-II) | |
| MSI GS63VR 7RF-228US (Toshiba Exceria Pro SDXC 64 GB UHS-II) | |
| Acer Aspire VN7-593G-73HP V15 Nitro BE | |
| maximum AS SSD Seq Read Test (1GB) | |
| Gigabyte Aero 15 (Toshiba Exceria Pro SDXC 64 GB UHS-II) | |
| Acer Predator 15 G9-593-751X (Toshiba Exceria Pro SDXC 64 GB UHS-II) | |
| Gigabyte P56XT (Toshiba Exceria Pro SDXC 64 GB UHS-II) | |
| Schenker XMG P507 PRO (Toshiba Exceria Pro SDXC 64 GB UHS-II) | |
| Acer Aspire VN7-593G-73HP V15 Nitro BE | |
| MSI GS63VR 7RF-228US (Toshiba Exceria Pro SDXC 64 GB UHS-II) | |
| |||||||||||||||||||||||||
iluminación: 87 %
Brillo con batería: 301 cd/m²
Contraste: 941:1 (Negro: 0.32 cd/m²)
ΔE ColorChecker Calman: 6.21 | ∀{0.5-29.43 Ø4.71}
ΔE Greyscale Calman: 6.08 | ∀{0.09-98 Ø4.96}
84% sRGB (Argyll 1.6.3 3D)
55% AdobeRGB 1998 (Argyll 1.6.3 3D)
61.8% AdobeRGB 1998 (Argyll 3D)
84.6% sRGB (Argyll 3D)
64.8% Display P3 (Argyll 3D)
Gamma: 2.31
CCT: 7375 K
| Gigabyte P56XT LG Philips LP156WF6 (LGD046F), 1920x1080 | Acer Predator 15 G9-593-751X LG Philips LP156WF6-SPP1 (LGD04D5), 1920x1080 | Schenker XMG P507 PRO AUO B156HTN05.2 (AUO52ED), 1920x1080 | MSI GS63VR 7RF-228US 3840x2160 | Acer Aspire VN7-593G-73HP V15 Nitro BE LG Display LP156WF6-SPP1, 1920x1080 | Gigabyte Aero 15 N156HCA-EA1 (CMN15D7), 1920x1080 | |
|---|---|---|---|---|---|---|
| Display | 1% | 4% | -20% | 1% | 6% | |
| Display P3 Coverage (%) | 64.8 | 65.4 1% | 66.4 2% | 48.21 -26% | 65.8 2% | 65.2 1% |
| sRGB Coverage (%) | 84.6 | 85.5 1% | 88.9 5% | 72.6 -14% | 85.1 1% | 92.5 9% |
| AdobeRGB 1998 Coverage (%) | 61.8 | 62.5 1% | 65.1 5% | 49.81 -19% | 62.2 1% | 66.5 8% |
| Response Times | -2% | 44% | 15% | -24% | -22% | |
| Response Time Grey 50% / Grey 80% * (ms) | 37.2 ? | 36 ? 3% | 24 ? 35% | 28 ? 25% | 41 ? -10% | 42.8 ? -15% |
| Response Time Black / White * (ms) | 24.8 ? | 26.4 ? -6% | 12 ? 52% | 23.6 ? 5% | 34 ? -37% | 32 ? -29% |
| PWM Frequency (Hz) | 20000 ? | 20830 ? | 1351 ? | 26000 ? | ||
| Screen | 6% | -19% | -23% | 9% | 6% | |
| Brightness middle (cd/m²) | 301 | 295 -2% | 357 19% | 274.2 -9% | 322 7% | 320 6% |
| Brightness (cd/m²) | 280 | 274 -2% | 365 30% | 263 -6% | 297 6% | 316 13% |
| Brightness Distribution (%) | 87 | 88 1% | 85 -2% | 92 6% | 86 -1% | 90 3% |
| Black Level * (cd/m²) | 0.32 | 0.32 -0% | 0.5 -56% | 0.44 -38% | 0.31 3% | 0.36 -13% |
| Contrast (:1) | 941 | 922 -2% | 714 -24% | 623 -34% | 1039 10% | 889 -6% |
| Colorchecker dE 2000 * | 6.21 | 4.59 26% | 9.93 -60% | 8 -29% | 4.73 24% | 4.62 26% |
| Colorchecker dE 2000 max. * | 10.78 | 11 -2% | 14.87 -38% | 14.6 -35% | 12.37 -15% | 9.75 10% |
| Greyscale dE 2000 * | 6.08 | 4.03 34% | 10.32 -70% | 9.1 -50% | 2.99 51% | 6 1% |
| Gamma | 2.31 95% | 2.3 96% | 2.11 104% | 2.24 98% | 2.32 95% | 2.46 89% |
| CCT | 7375 88% | 7229 90% | 10096 64% | 5020 129% | 6905 94% | 6761 96% |
| Color Space (Percent of AdobeRGB 1998) (%) | 55 | 56 2% | 58 5% | 45.7 -17% | 56 2% | 60 9% |
| Color Space (Percent of sRGB) (%) | 84 | 85 1% | 89 6% | 72.1 -14% | 85 1% | 92 10% |
| Media total (Programa/Opciones) | 2% /
4% | 10% /
-6% | -9% /
-17% | -5% /
3% | -3% /
2% |
* ... más pequeño es mejor
Tiempos de respuesta del display
| ↔ Tiempo de respuesta de Negro a Blanco | ||
|---|---|---|
| 24.8 ms ... subida ↗ y bajada ↘ combinada | ↗ 14 ms subida | 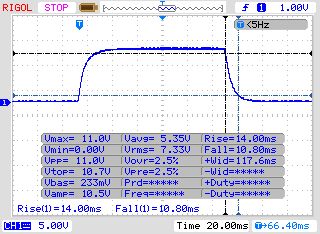 |
| ↘ 10.8 ms bajada | ||
| La pantalla mostró buenos tiempos de respuesta en nuestros tests pero podría ser demasiado lenta para los jugones competitivos. En comparación, todos los dispositivos de prueba van de ##min### (mínimo) a 240 (máximo) ms. » 58 % de todos los dispositivos son mejores. Eso quiere decir que el tiempo de respuesta es peor que la media (19.8 ms) de todos los dispositivos testados. | ||
| ↔ Tiempo de respuesta 50% Gris a 80% Gris | ||
| 37.2 ms ... subida ↗ y bajada ↘ combinada | ↗ 18.4 ms subida | 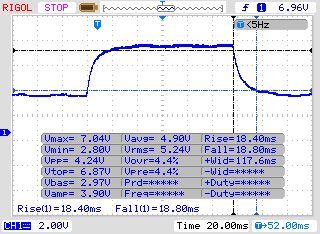 |
| ↘ 18.8 ms bajada | ||
| La pantalla mostró tiempos de respuesta lentos en nuestros tests y podría ser demasiado lenta para los jugones. En comparación, todos los dispositivos de prueba van de ##min### (mínimo) a 636 (máximo) ms. » 54 % de todos los dispositivos son mejores. Eso quiere decir que el tiempo de respuesta es peor que la media (30.9 ms) de todos los dispositivos testados. | ||
Parpadeo de Pantalla / PWM (Pulse-Width Modulation)
| Parpadeo de Pantalla / PWM detectado | 20000 Hz | ≤ 95 % de brillo | 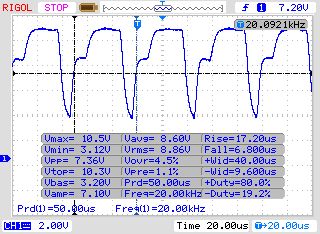 |
La retroiluminación del display parpadea a 20000 Hz (seguramente usa PWM - Pulse-Width Modulation) a un brillo del 95 % e inferior. Sobre este nivel de brillo no debería darse parpadeo / PWM. La frecuencia de 20000 Hz es bastante alta, por lo que la mayoría de gente sensible al parpadeo no debería ver parpadeo o tener fatiga visual. Comparación: 52 % de todos los dispositivos testados no usaron PWM para atenuar el display. Si se usó, medimos una media de 7748 (mínimo: 5 - máxmo: 343500) Hz. | |||
| PCMark 8 | |
| Home Score Accelerated v2 | |
| Acer Predator 15 G9-593-751X | |
| Schenker XMG P507 PRO | |
| Gigabyte Aero 15 | |
| Gigabyte P56XT | |
| MSI GS63VR 7RF-228US | |
| Work Score Accelerated v2 | |
| Acer Predator 15 G9-593-751X | |
| Gigabyte Aero 15 | |
| MSI GS63VR 7RF-228US | |
| Gigabyte P56XT | |
| Schenker XMG P507 PRO | |
| PCMark 10 - Score | |
| Gigabyte P56XT | |
| PCMark 8 Home Score Accelerated v2 | 4239 puntos | |
| PCMark 8 Work Score Accelerated v2 | 5261 puntos | |
| PCMark 10 Score | 5021 puntos | |
ayuda | ||
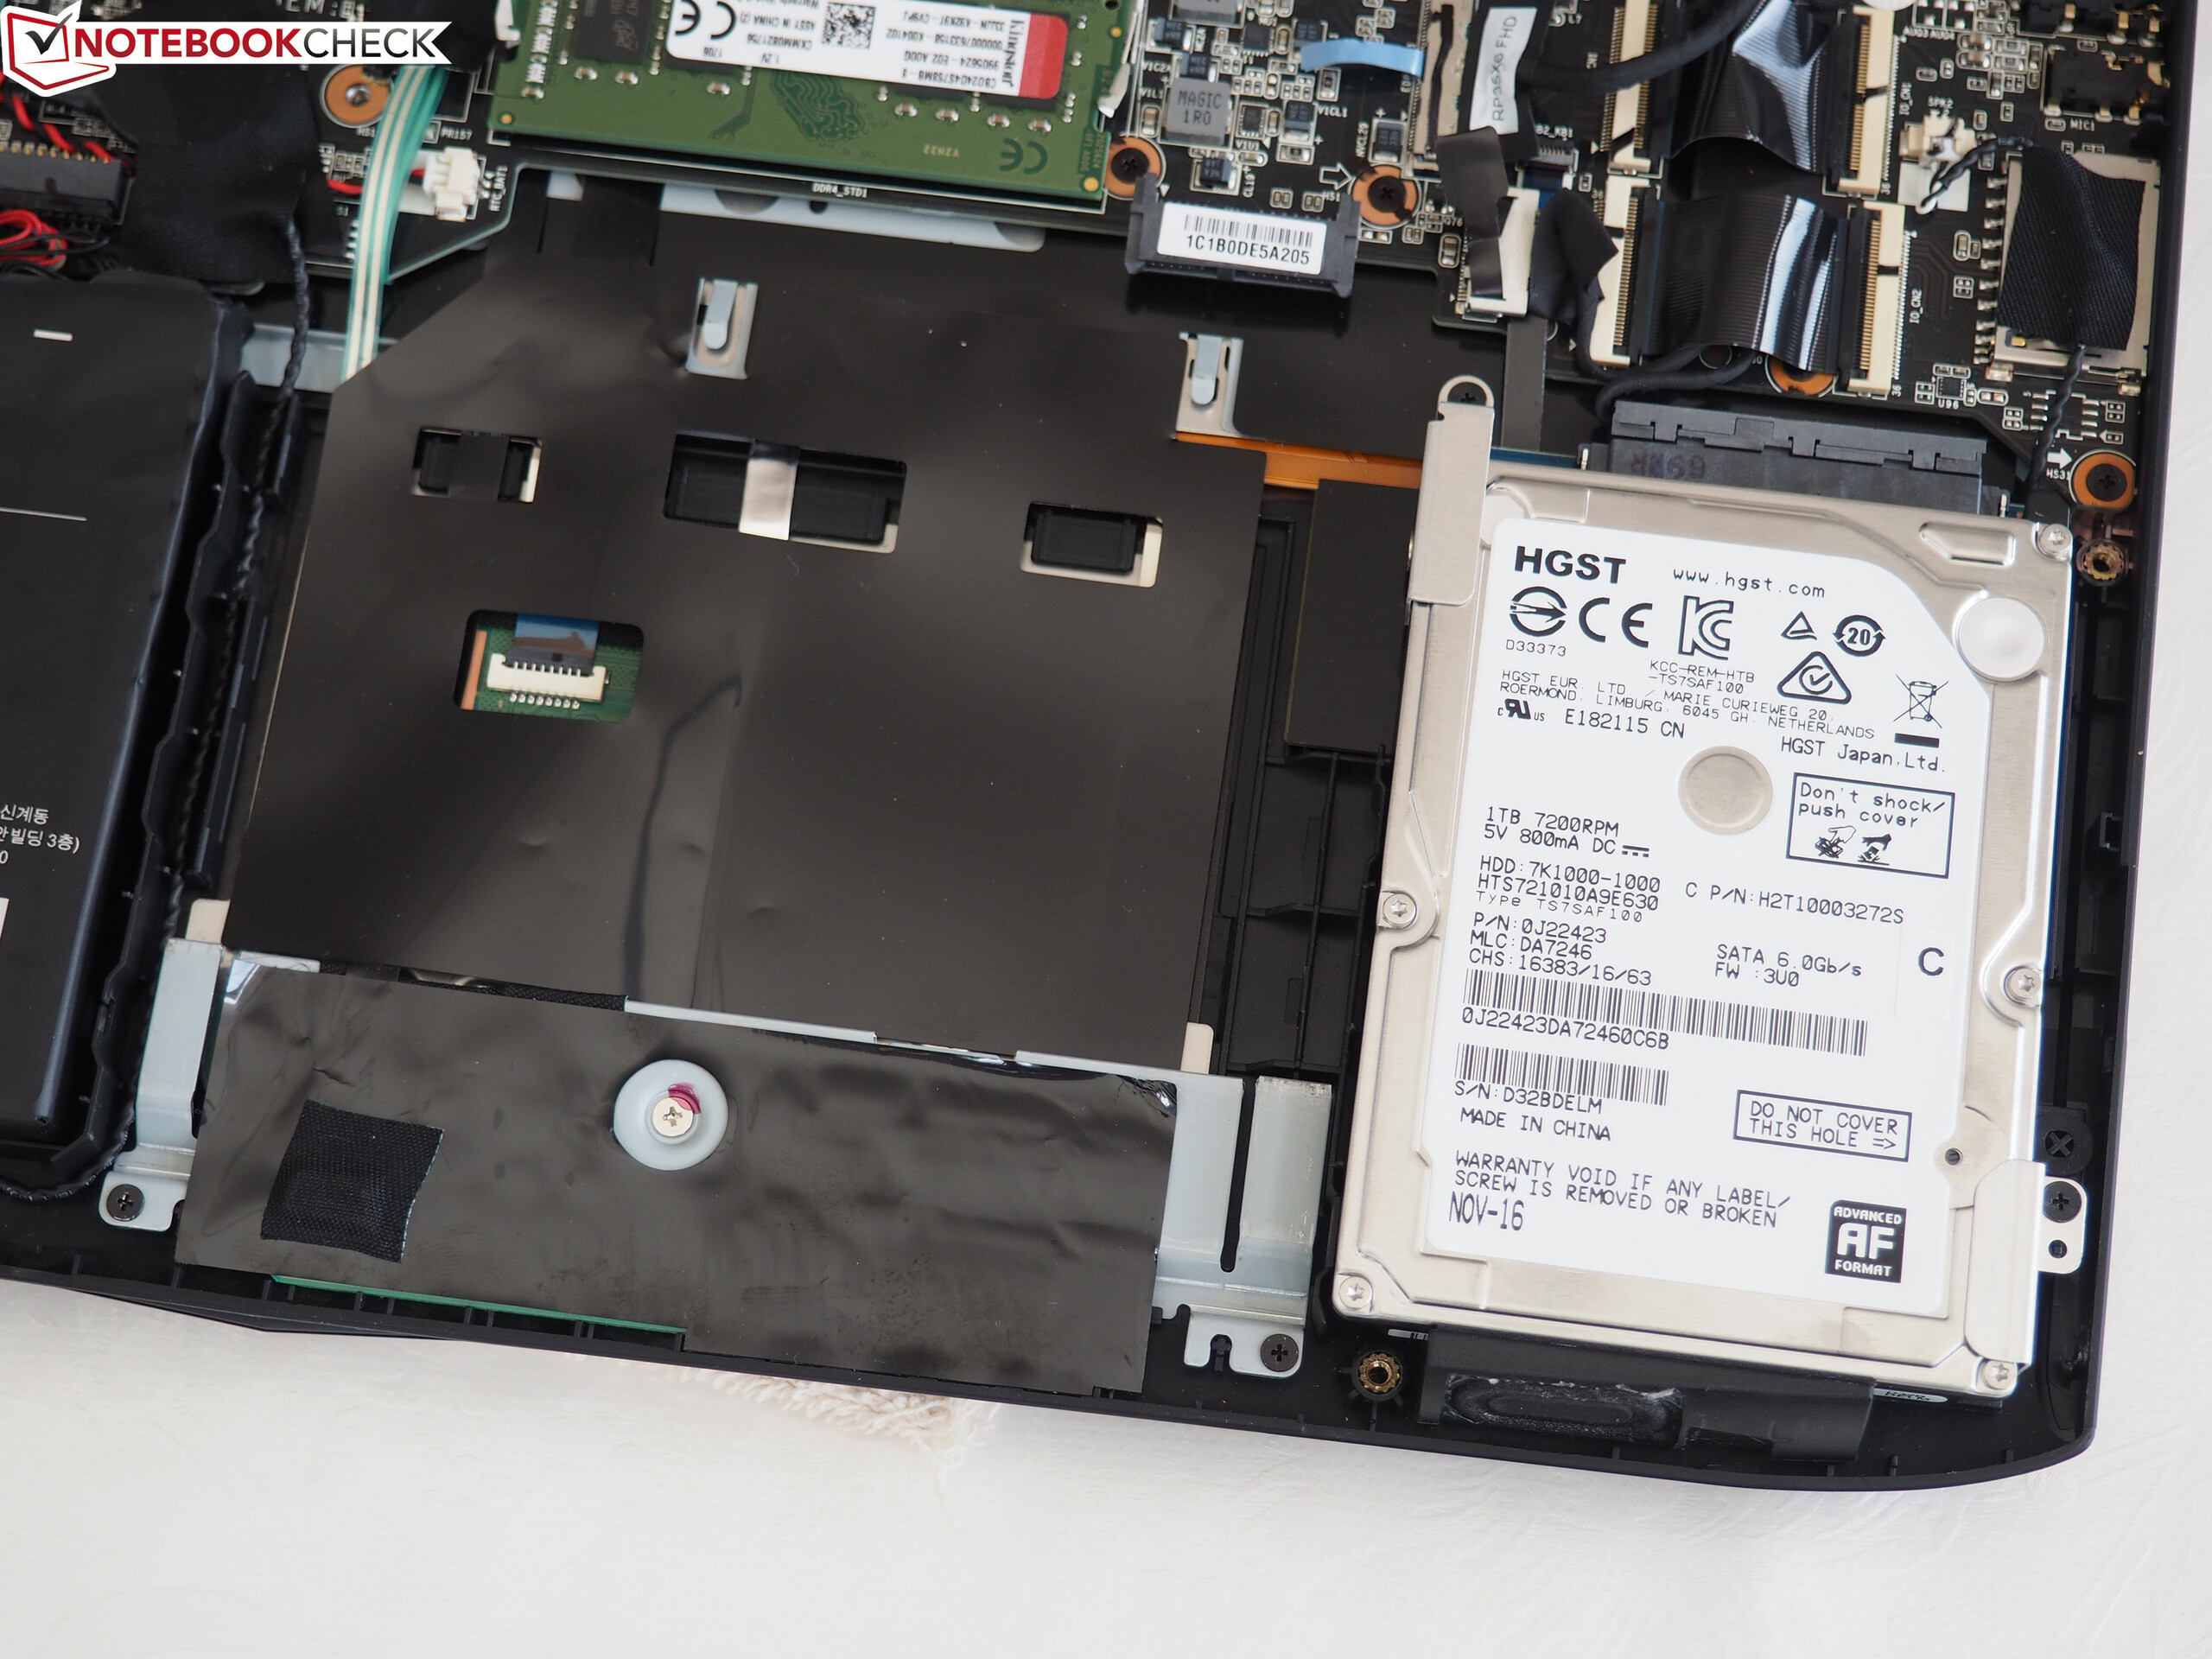
| Gigabyte P56XT LiteOn CX2-8B256 | Asus Zephyrus GX501 Samsung SSD SM961 1TB M.2 MZVKW1T0HMLH | Schenker XMG A517 Samsung SSD 960 Evo 500GB m.2 NVMe | |
|---|---|---|---|
| CrystalDiskMark 5.2 / 6 | 19% | 43% | |
| Read Seq Q32T1 (MB/s) | 2445 | 3445 41% | 3389 39% |
| Write Seq Q32T1 (MB/s) | 790 | 1848 134% | 1706 116% |
| Read 4K Q32T1 (MB/s) | 588 | 547 -7% | 627 7% |
| Write 4K Q32T1 (MB/s) | 455.5 | 463 2% | 591 30% |
| Read Seq (MB/s) | 1881 | 954 -49% | 1856 -1% |
| Write Seq (MB/s) | 797 | 1049 32% | 1652 107% |
| Read 4K (MB/s) | 46.69 | 45 -4% | 49 5% |
| Write 4K (MB/s) | 142.5 | 149 5% | 196 38% |

| 3DMark - 1920x1080 Fire Strike Graphics | |
| Acer Predator 15 G9-593-751X | |
| Schenker XMG P507 PRO | |
| Gigabyte P56XT | |
| Acer Aspire VN7-593G-73HP V15 Nitro BE | |
| MSI GS63VR 7RF-228US | |
| Gigabyte Aero 15 | |
| 3DMark 11 - 1280x720 Performance GPU | |
| Acer Predator 15 G9-593-751X | |
| Schenker XMG P507 PRO | |
| Gigabyte P56XT | |
| Acer Aspire VN7-593G-73HP V15 Nitro BE | |
| MSI GS63VR 7RF-228US | |
| Gigabyte Aero 15 | |
| Unigine Heaven 4.0 - Extreme Preset DX11 | |
| Schenker XMG P507 PRO | |
| Gigabyte P56XT | |
| Gigabyte Aero 15 | |
| 3DMark 11 Performance | 15625 puntos | |
| 3DMark Ice Storm Standard Score | 109939 puntos | |
| 3DMark Cloud Gate Standard Score | 26099 puntos | |
| 3DMark Fire Strike Score | 13179 puntos | |
ayuda | ||
| bajo | medio | alto | ultra | |
|---|---|---|---|---|
| The Witcher 3 (2015) | 90.8 | 50.2 | ||
| Star Wars Battlefront (2015) | 120 | 109 | ||
| Assassin's Creed Syndicate (2015) | 81.6 | 39.7 | ||
| Rainbow Six Siege (2015) | 162 | 141 | ||
| Mass Effect Andromeda (2017) | 70.1 | 60.4 | ||
| Warhammer 40.000: Dawn of War III (2017) | 81.6 | 78.4 | ||
| Rocket League (2017) | 200 | |||
| Dirt 4 (2017) | 129 | 76.6 | ||
| Playerunknown's Battlegrounds (PUBG) (2017) | 75.2 | 70 |
Ruido
| Ocioso |
| 34 / 35 / 39 dB(A) |
| DVD |
| 42 / dB(A) |
| Carga |
| 39 / 49 dB(A) |
 | ||
30 dB silencioso 40 dB(A) audible 50 dB(A) ruidosamente alto |
||
min: | ||
| Gigabyte P56XT i7-7700HQ, GeForce GTX 1070 Mobile | Acer Predator 15 G9-593-751X i7-7700HQ, GeForce GTX 1070 Mobile | Schenker XMG P507 PRO i7-7700HQ, GeForce GTX 1070 Mobile | MSI GS63VR 7RF-228US i7-7700HQ, GeForce GTX 1060 Mobile | Acer Aspire VN7-593G-73HP V15 Nitro BE i7-7700HQ, GeForce GTX 1060 Mobile | Gigabyte Aero 15 i7-7700HQ, GeForce GTX 1060 Mobile | |
|---|---|---|---|---|---|---|
| Noise | -0% | -6% | 5% | 7% | 4% | |
| apagado / medio ambiente * (dB) | 30 | 32 -7% | 31 -3% | 28.8 4% | 30.4 -1% | 31 -3% |
| Idle Minimum * (dB) | 34 | 34 -0% | 33 3% | 33.1 3% | 30.9 9% | 32 6% |
| Idle Average * (dB) | 35 | 36 -3% | 34 3% | 33.1 5% | 30.9 12% | 33 6% |
| Idle Maximum * (dB) | 39 | 38 3% | 44 -13% | 34 13% | 31.5 19% | 34 13% |
| Load Average * (dB) | 39 | 41 -5% | 46 -18% | 37.2 5% | 40.7 -4% | 39 -0% |
| Witcher 3 ultra * (dB) | 48 | 42 12% | 46.1 4% | 45.5 5% | 43 10% | |
| Load Maximum * (dB) | 49 | 50 -2% | 52 -6% | 47.1 4% | 43.9 10% | 50 -2% |
* ... más pequeño es mejor
(-) La temperatura máxima en la parte superior es de 65 °C / 149 F, frente a la media de 40.4 °C / 105 F, que oscila entre 21.2 y 68.8 °C para la clase Gaming.
(-) El fondo se calienta hasta un máximo de 71 °C / 160 F, frente a la media de 43.2 °C / 110 F
(+) En reposo, la temperatura media de la parte superior es de 29.4 °C / 85# F, frente a la media del dispositivo de 33.9 °C / 93 F.
(-) Jugando a The Witcher 3, la temperatura media de la parte superior es de 45.7 °C / 114 F, frente a la media del dispositivo de 33.9 °C / 93 F.
(+) Los reposamanos y el panel táctil alcanzan como máximo la temperatura de la piel (35 °C / 95 F) y, por tanto, no están calientes.
(-) La temperatura media de la zona del reposamanos de dispositivos similares fue de 28.8 °C / 83.8 F (-6.2 °C / -11.2 F).
| Gigabyte P56XT i7-7700HQ, GeForce GTX 1070 Mobile | Acer Predator 15 G9-593-751X i7-7700HQ, GeForce GTX 1070 Mobile | Schenker XMG P507 PRO i7-7700HQ, GeForce GTX 1070 Mobile | MSI GS63VR 7RF-228US i7-7700HQ, GeForce GTX 1060 Mobile | Acer Aspire VN7-593G-73HP V15 Nitro BE i7-7700HQ, GeForce GTX 1060 Mobile | Gigabyte Aero 15 i7-7700HQ, GeForce GTX 1060 Mobile | |
|---|---|---|---|---|---|---|
| Heat | 28% | 9% | 10% | 16% | 19% | |
| Maximum Upper Side * (°C) | 65 | 42.3 35% | 49.2 24% | 51.9 20% | 56 14% | |
| Maximum Bottom * (°C) | 71 | 40.9 42% | 62 13% | 54.6 23% | 61 14% | |
| Idle Upper Side * (°C) | 35 | 28.4 19% | 32.4 7% | 28.4 19% | 29.1 17% | 25 29% |
| Idle Bottom * (°C) | 30 | 25.2 16% | 33 -10% | 29.6 1% | 29.3 2% | 24 20% |
* ... más pequeño es mejor
Gigabyte P56XT análisis de audio
(±) | la sonoridad del altavoz es media pero buena (81 dB)
Graves 100 - 315 Hz
(±) | lubina reducida - en promedio 10.1% inferior a la mediana
(±) | la linealidad de los graves es media (12.5% delta a frecuencia anterior)
Medios 400 - 2000 Hz
(±) | medias más altas - de media 5.7% más altas que la mediana
(+) | los medios son lineales (3.4% delta a la frecuencia anterior)
Altos 2 - 16 kHz
(+) | máximos equilibrados - a sólo 2.7% de la mediana
(+) | los máximos son lineales (4.1% delta a la frecuencia anterior)
Total 100 - 16.000 Hz
(+) | el sonido global es lineal (13.8% de diferencia con la mediana)
En comparación con la misma clase
» 21% de todos los dispositivos probados de esta clase eran mejores, 7% similares, 71% peores
» El mejor tuvo un delta de 6%, la media fue 18%, el peor fue ###max##%
En comparación con todos los dispositivos probados
» 15% de todos los dispositivos probados eran mejores, 4% similares, 81% peores
» El mejor tuvo un delta de 4%, la media fue 23%, el peor fue ###max##%
Schenker XMG P507 PRO análisis de audio
(±) | la sonoridad del altavoz es media pero buena (75 dB)
Graves 100 - 315 Hz
(-) | casi sin bajos - de media 20.2% inferior a la mediana
(±) | la linealidad de los graves es media (7.6% delta a frecuencia anterior)
Medios 400 - 2000 Hz
(+) | medios equilibrados - a sólo 2.2% de la mediana
(+) | los medios son lineales (5.9% delta a la frecuencia anterior)
Altos 2 - 16 kHz
(+) | máximos equilibrados - a sólo 2.2% de la mediana
(+) | los máximos son lineales (4.4% delta a la frecuencia anterior)
Total 100 - 16.000 Hz
(±) | la linealidad del sonido global es media (19.8% de diferencia con la mediana)
En comparación con la misma clase
» 70% de todos los dispositivos probados de esta clase eran mejores, 6% similares, 24% peores
» El mejor tuvo un delta de 6%, la media fue 18%, el peor fue ###max##%
En comparación con todos los dispositivos probados
» 51% de todos los dispositivos probados eran mejores, 7% similares, 42% peores
» El mejor tuvo un delta de 4%, la media fue 23%, el peor fue ###max##%
| Off / Standby | |
| Ocioso | |
| Carga |
|
Clave:
min: | |
| Gigabyte P56XT i7-7700HQ, GeForce GTX 1070 Mobile | Acer Predator 15 G9-593-751X i7-7700HQ, GeForce GTX 1070 Mobile | Schenker XMG P507 PRO i7-7700HQ, GeForce GTX 1070 Mobile | MSI GS63VR 7RF-228US i7-7700HQ, GeForce GTX 1060 Mobile | Acer Aspire VN7-593G-73HP V15 Nitro BE i7-7700HQ, GeForce GTX 1060 Mobile | Gigabyte Aero 15 i7-7700HQ, GeForce GTX 1060 Mobile | |
|---|---|---|---|---|---|---|
| Power Consumption | -21% | -4% | 3% | 26% | 14% | |
| Idle Minimum * (Watt) | 13 | 18 -38% | 14 -8% | 14.5 -12% | 7.2 45% | 12 8% |
| Idle Average * (Watt) | 17 | 23 -35% | 18 -6% | 17.3 -2% | 10.5 38% | 15 12% |
| Idle Maximum * (Watt) | 22 | 30 -36% | 24 -9% | 17.4 21% | 16 27% | 20 9% |
| Load Average * (Watt) | 85 | 89 -5% | 87 -2% | 93 -9% | 82 4% | 82 4% |
| Witcher 3 ultra * (Watt) | 154 | 168 -9% | 128.8 16% | 124 19% | 111 28% | |
| Load Maximum * (Watt) | 208 | 213 -2% | 201 3% | 155 25% | 161 23% |
* ... más pequeño es mejor
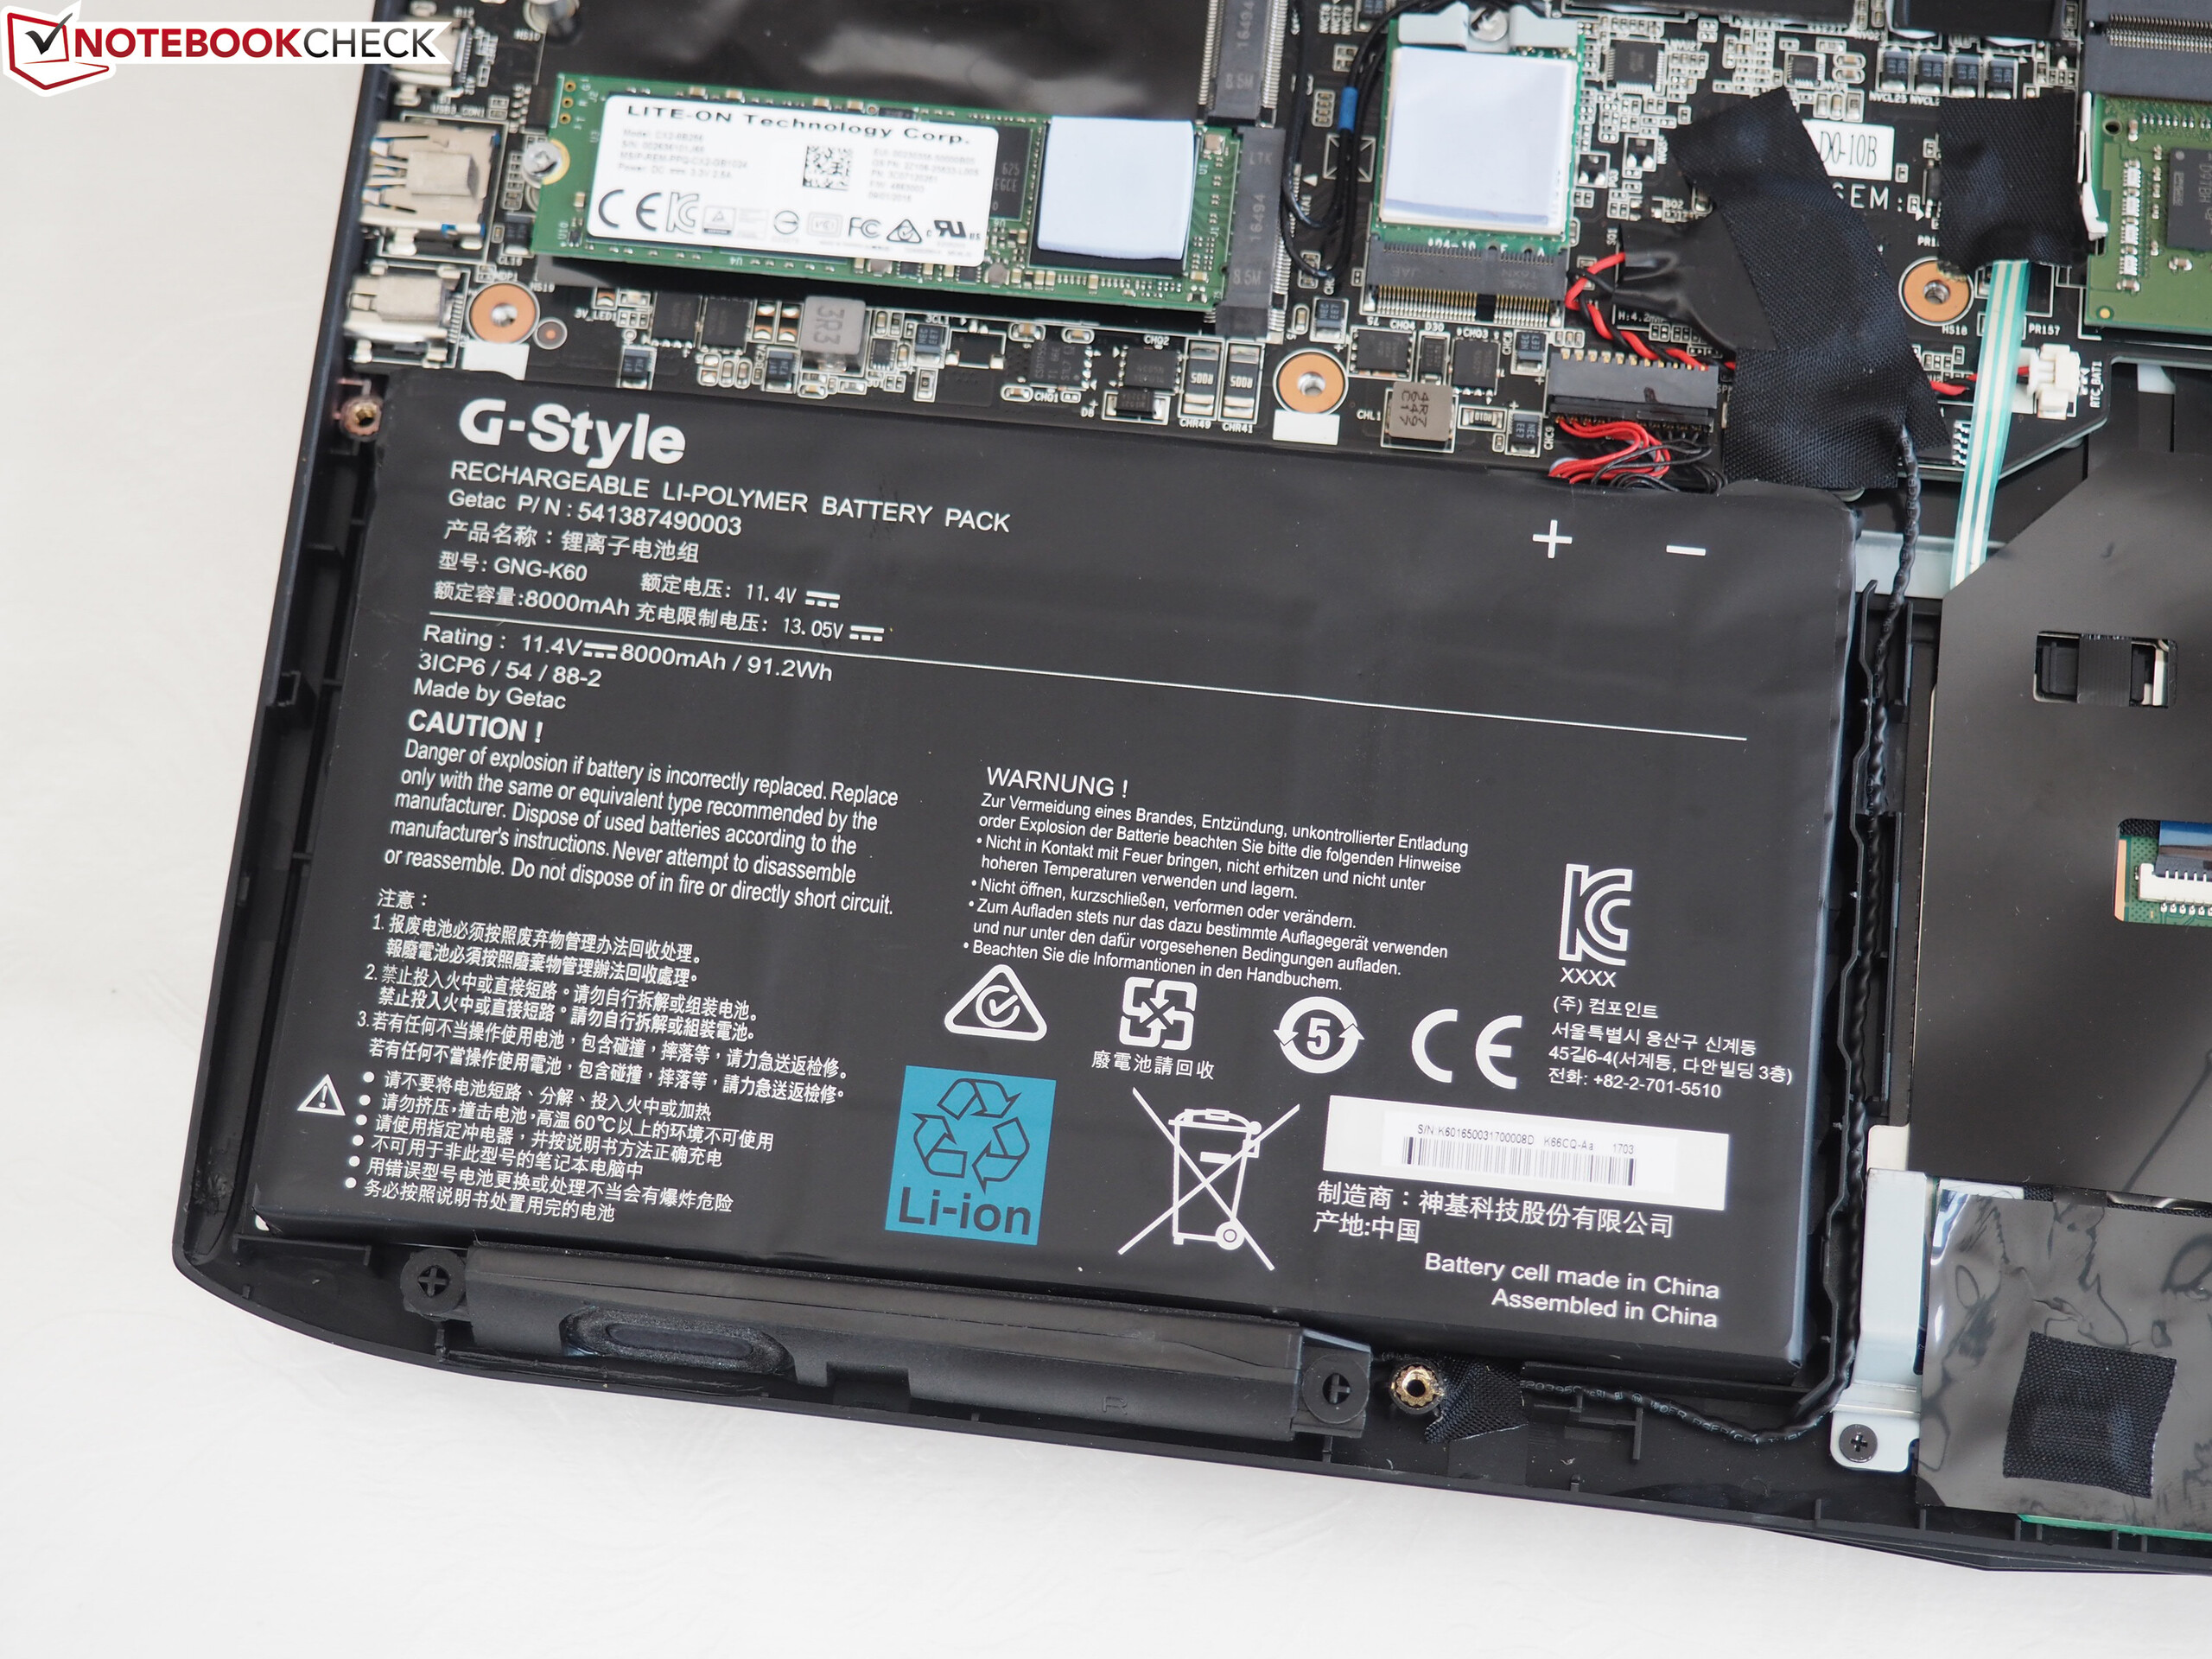
| Gigabyte P56XT i7-7700HQ, GeForce GTX 1070 Mobile, 91.2 Wh | Acer Predator 15 G9-593-751X i7-7700HQ, GeForce GTX 1070 Mobile, 90 Wh | Schenker XMG P507 PRO i7-7700HQ, GeForce GTX 1070 Mobile, 60 Wh | MSI GS63VR 7RF-228US i7-7700HQ, GeForce GTX 1060 Mobile, 65 Wh | Acer Aspire VN7-593G-73HP V15 Nitro BE i7-7700HQ, GeForce GTX 1060 Mobile, 69 Wh | Gigabyte Aero 15 i7-7700HQ, GeForce GTX 1060 Mobile, 94.24 Wh | |
|---|---|---|---|---|---|---|
| Duración de Batería | -12% | -45% | -36% | 1% | 10% | |
| Reader / Idle (h) | 9.5 | 8.4 -12% | 6.4 -33% | 8.4 -12% | 10.6 12% | |
| H.264 (h) | 6.2 | 4.9 -21% | 3.6 -42% | 7.7 24% | ||
| WiFi v1.3 (h) | 6.4 | 5.5 -14% | 3.3 -48% | 3.9 -39% | 6 -6% | 7 9% |
| Load (h) | 2 | 2 0% | 1.3 -35% | 2.4 20% | 1.9 -5% |
Pro
Contra
Hasta que no aclaremos si nuestro modelo de pruebas tuvo un fallo o un problema con el sistema de ventilación no podemos dar un veredicto final al P56XT. Debido a las altas temperaturas de la GPU que el jugón de 15" alcanza durante el testeo 3D, se ven afectadas ambas emisiones (ruido de sistema, temperatura) y rendimiento (ralentización) y ello implica una gran pérdida de puntos.
Sin esos problemas, el P56XT sería un portátil de gama alta genial. Puede que no sobresalga mucho en muchas áreas -aparte del excelente aguante de batería - pero ofrece un rendimiento sólido.
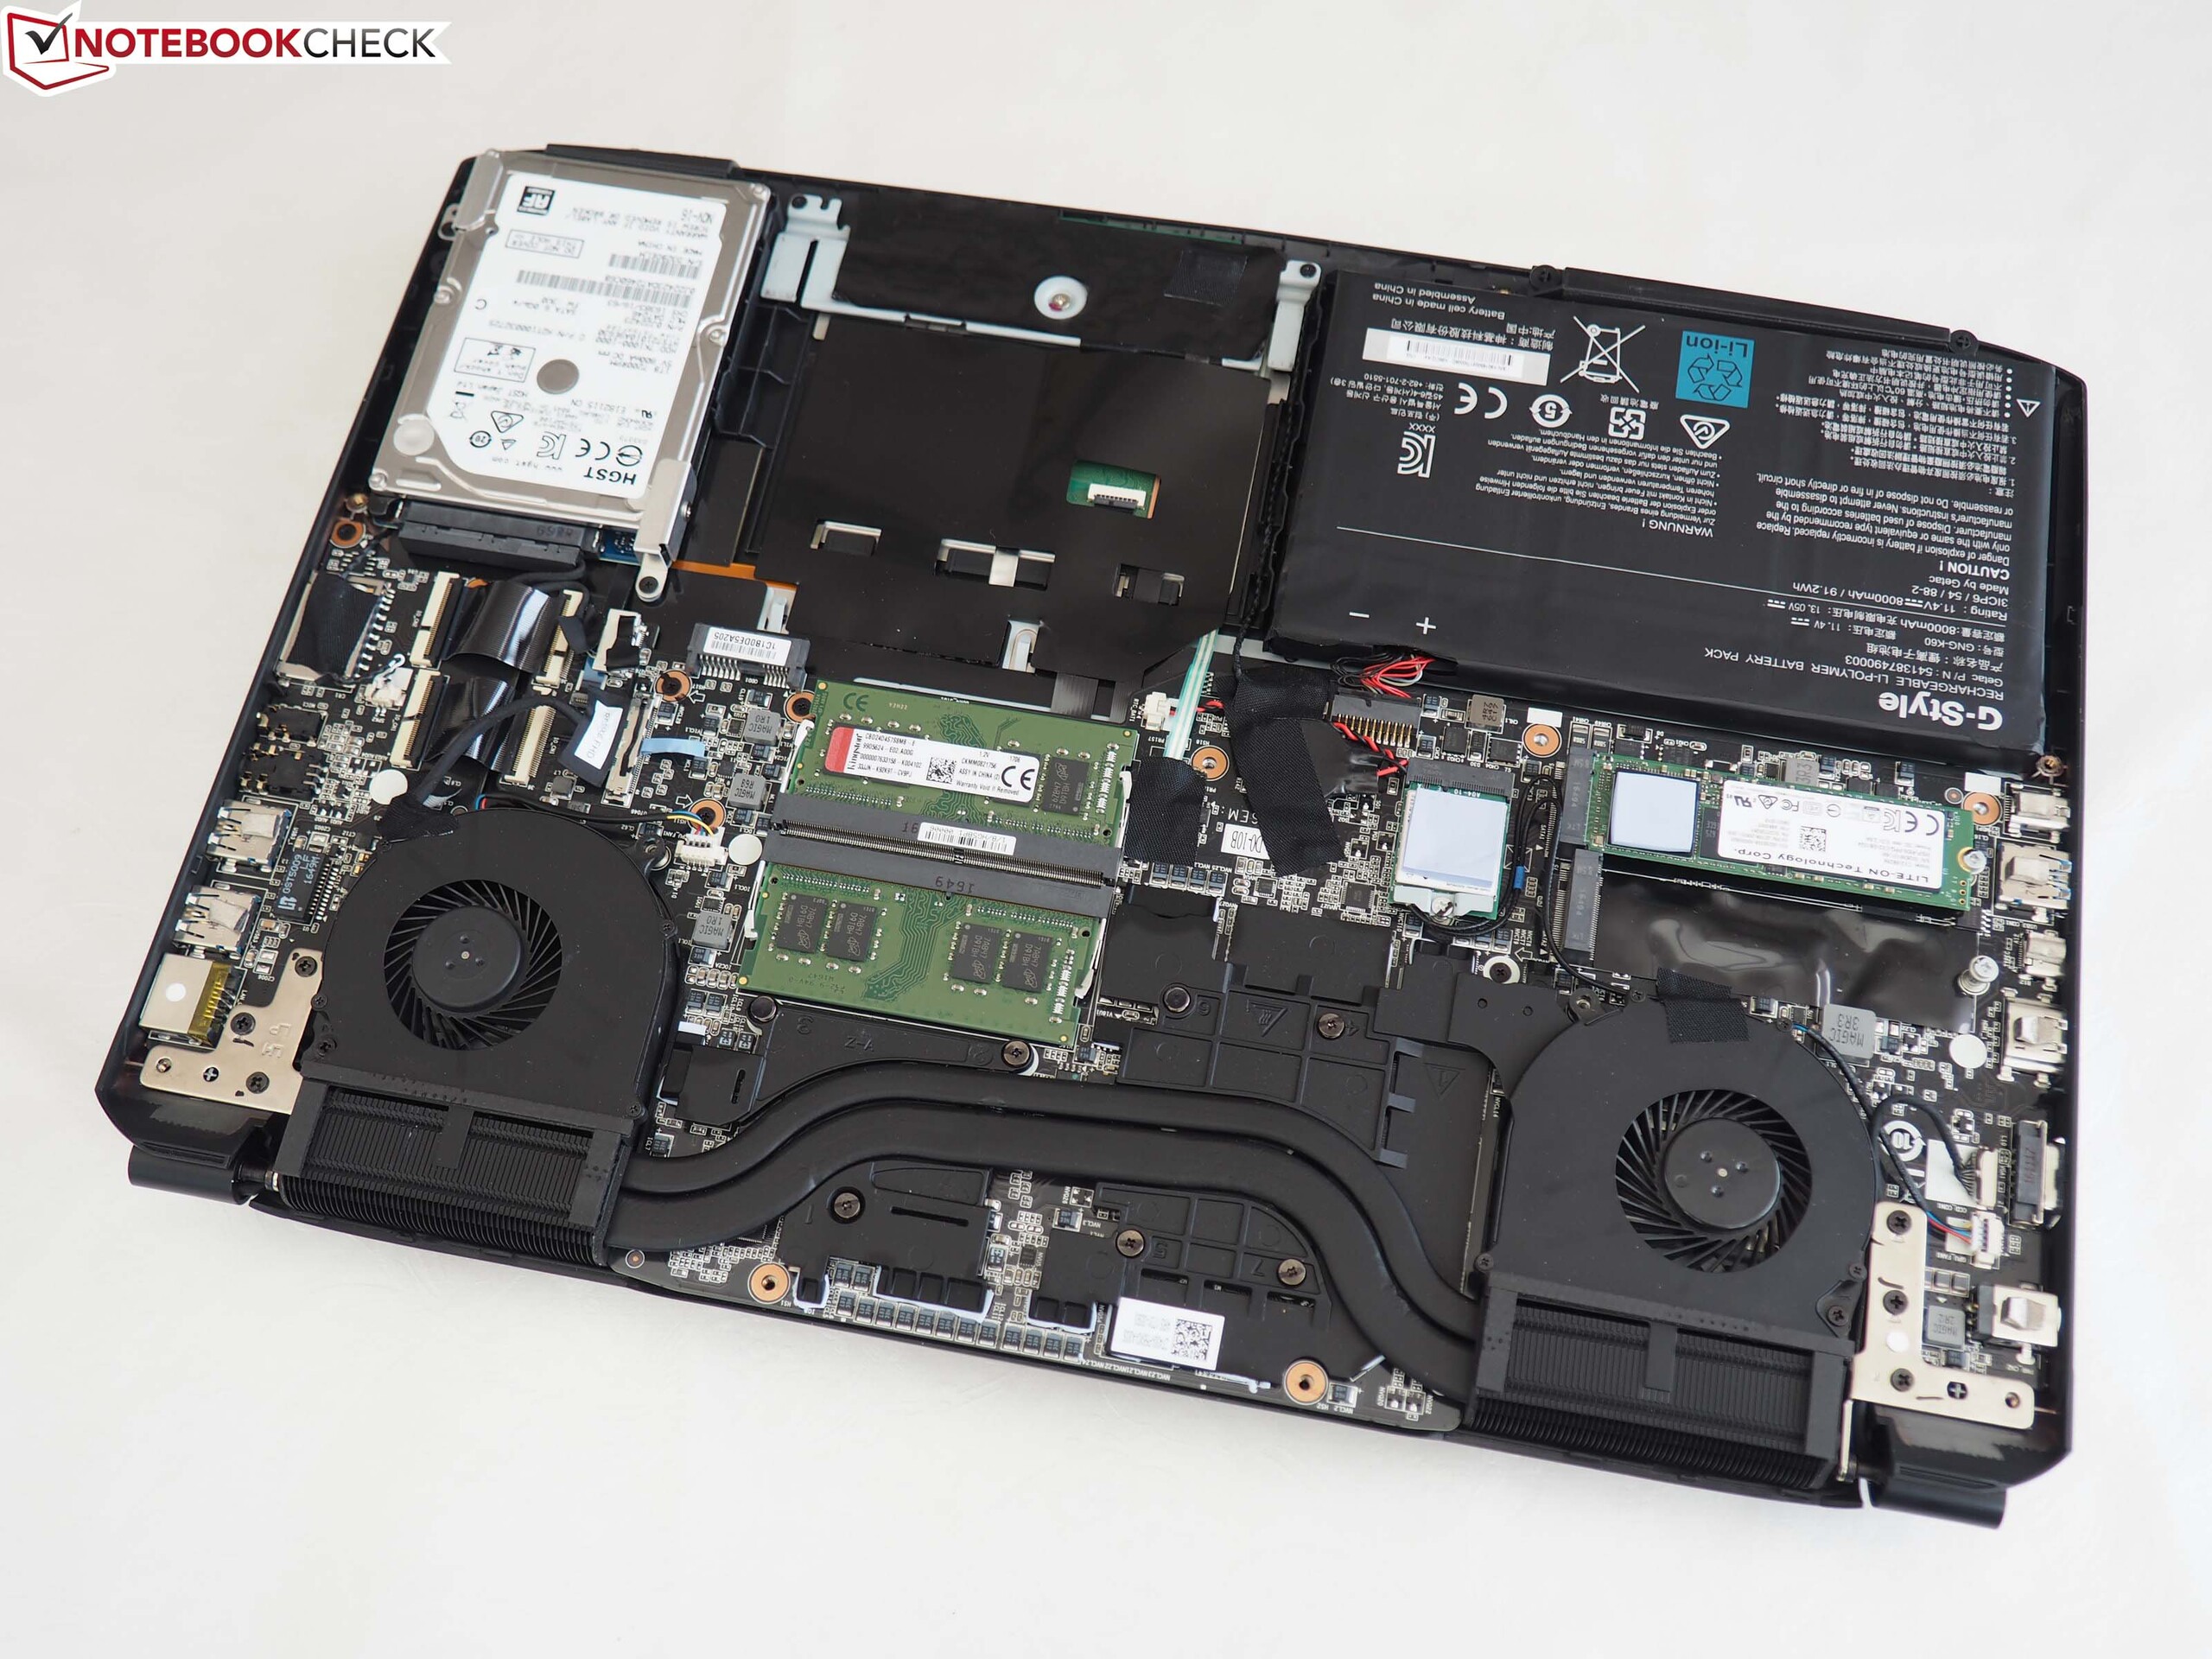
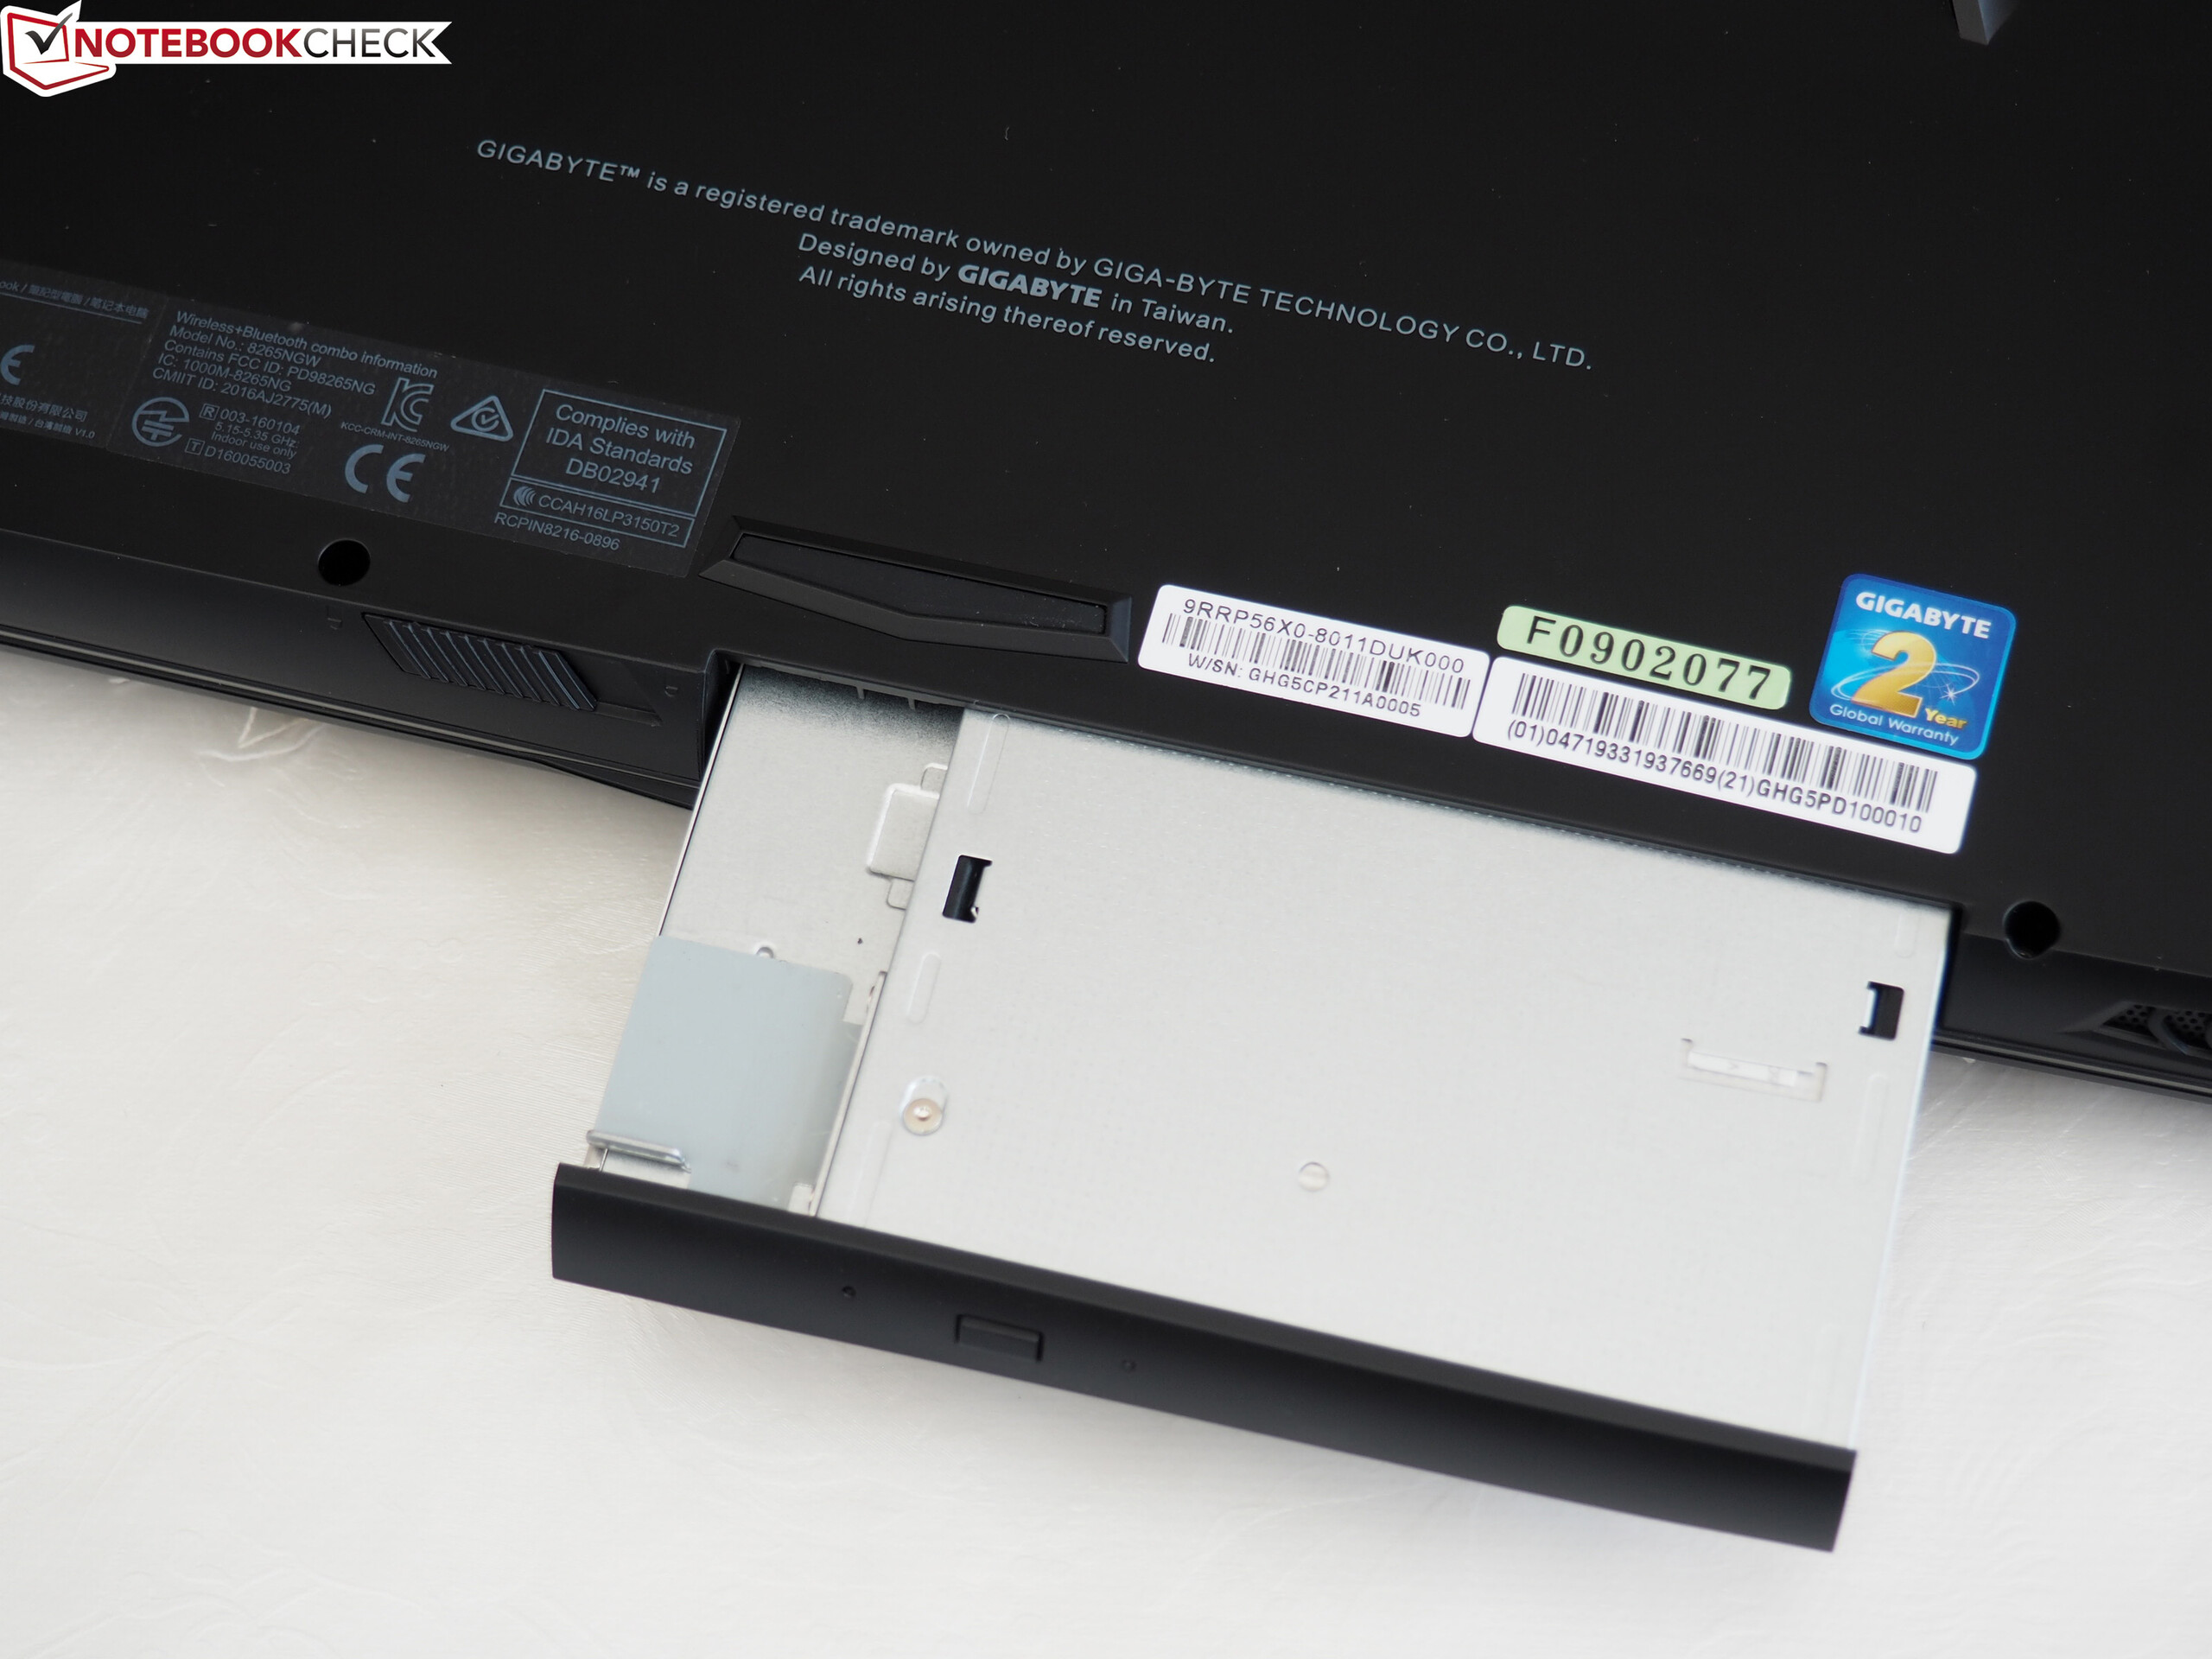
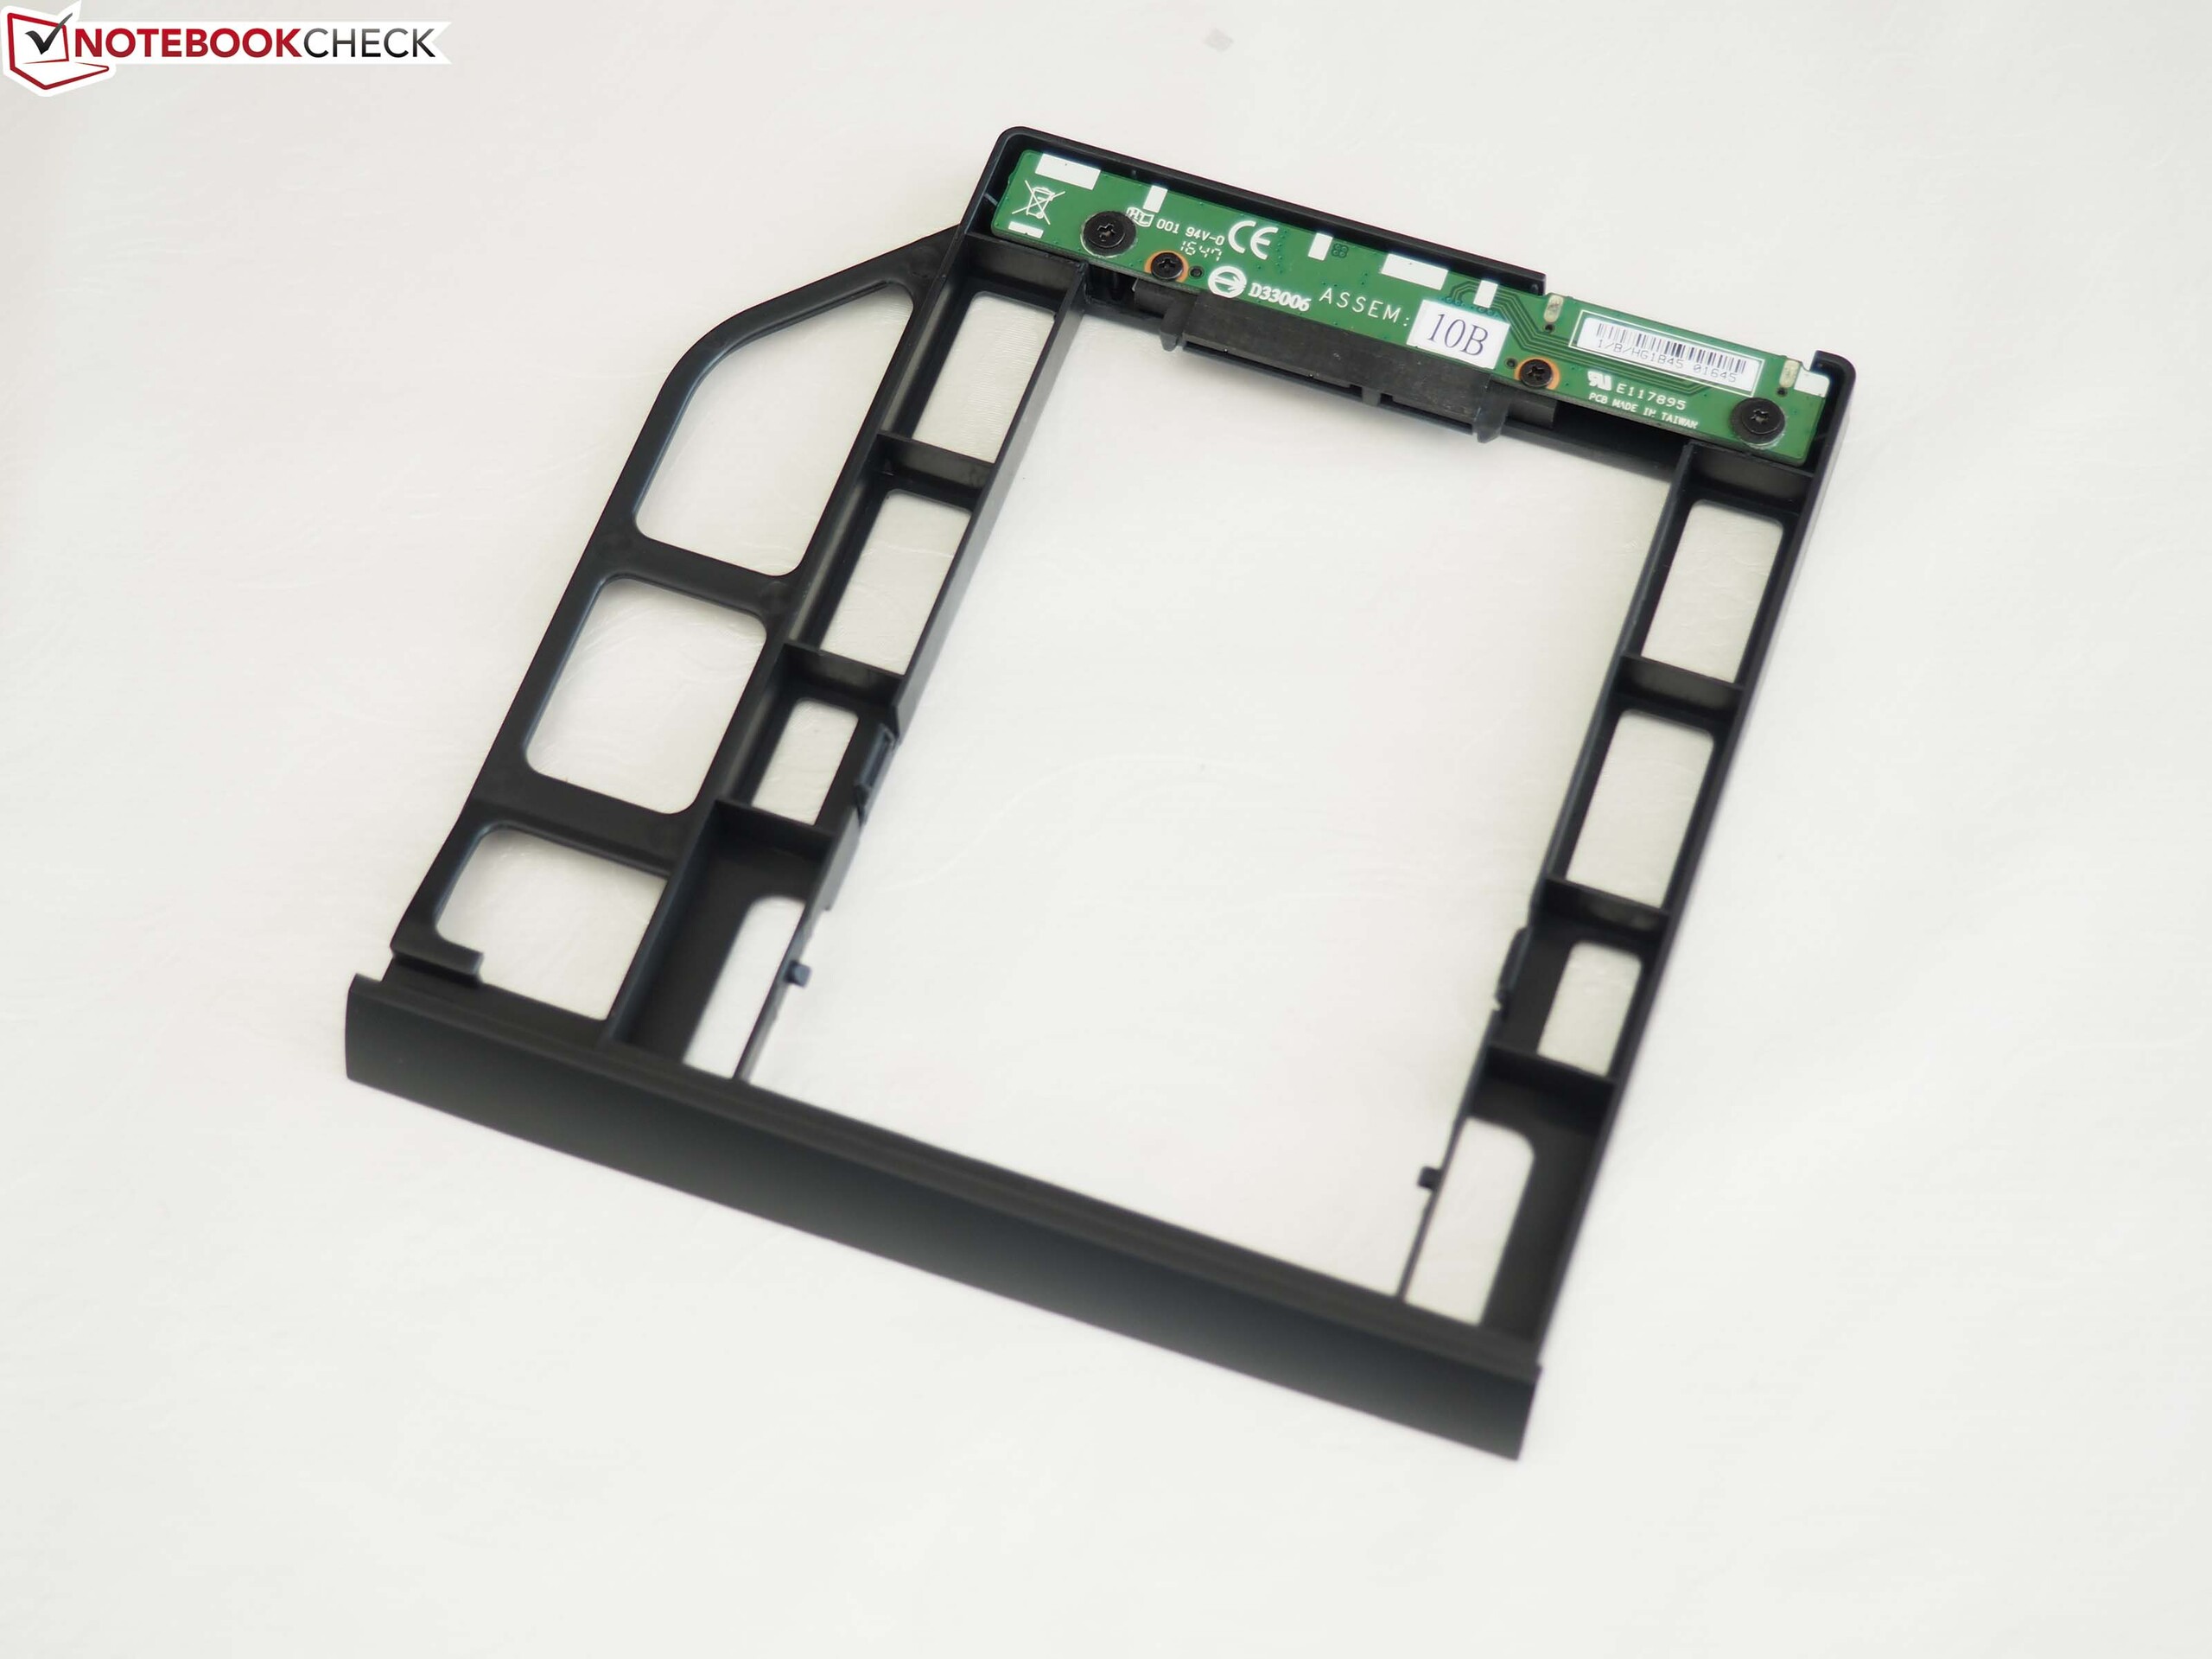
Gracias al concepto de cambio en caliente (unidad óptica o HDD 2.5"), la mezcla de P35 y P55 destaca entre la multitud.
Ésta es una versión acortada del análisis original. Puedes leer el análisis completo en inglés aquí.
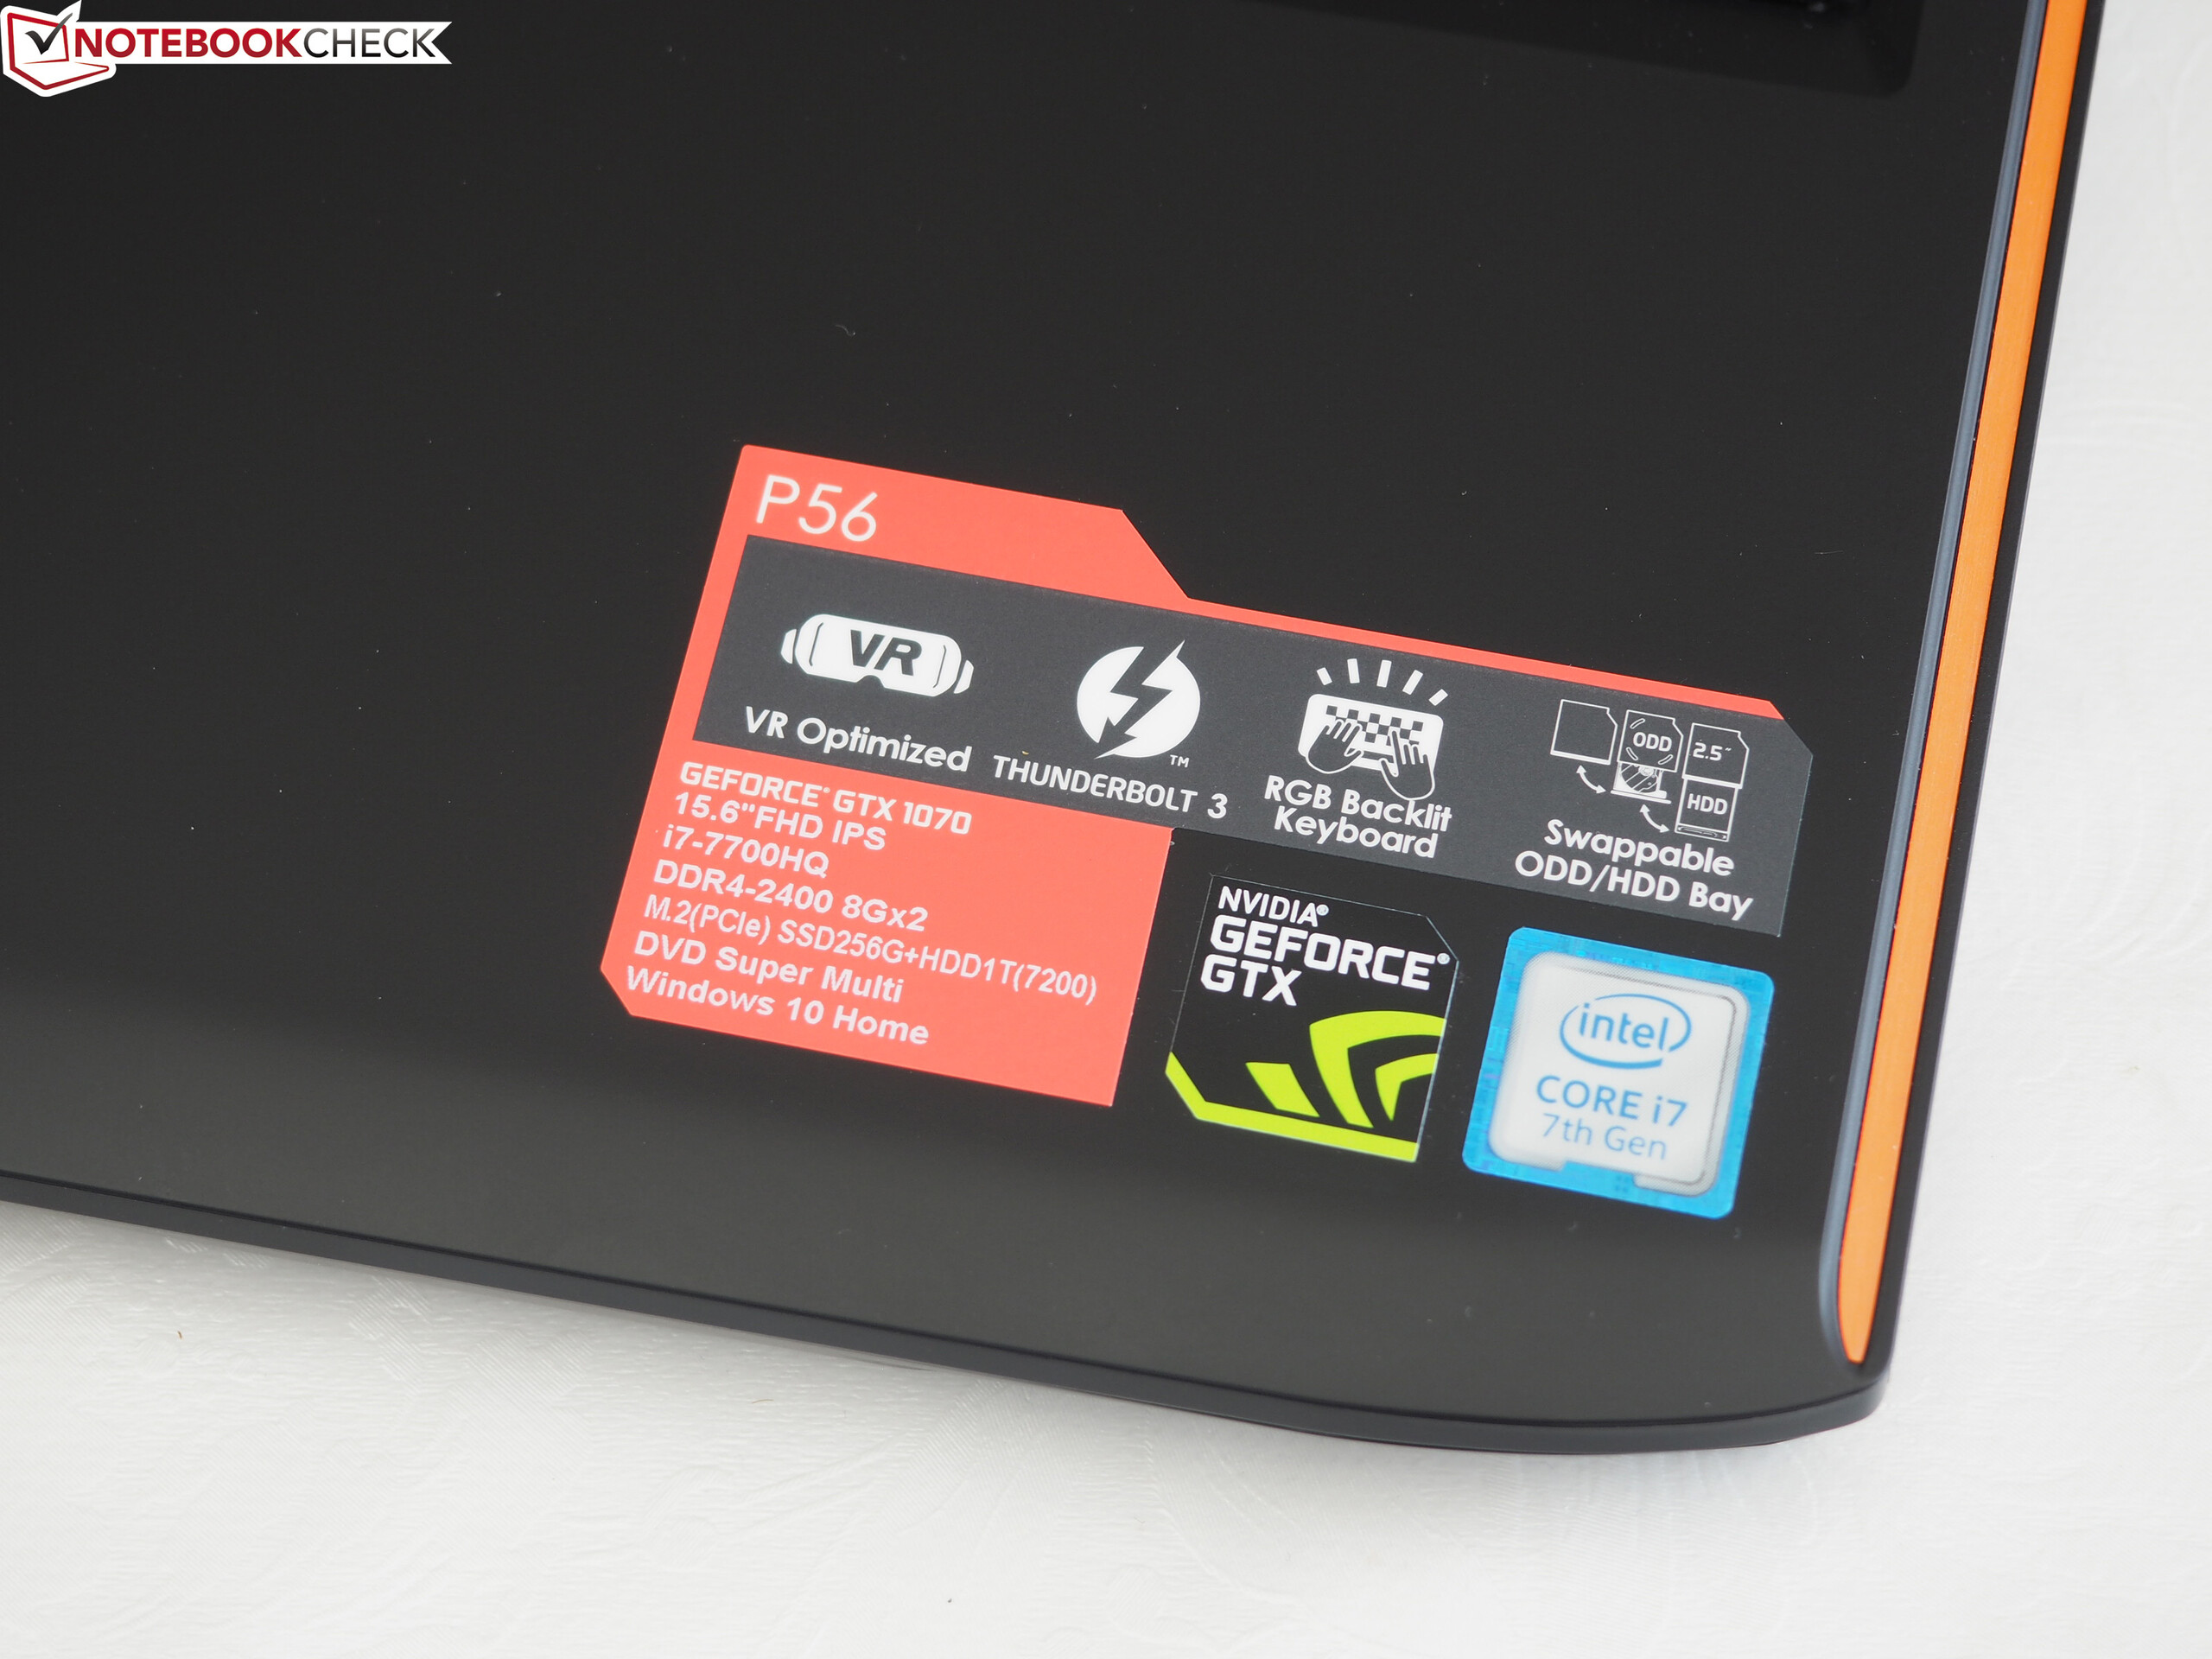
Gigabyte P56XT
- 07/27/2017 v6 (old)
Florian Glaser
Price comparison