Breve análisis del MSI GE73VR 7RF Raider (i7-7700HQ, GTX 1070, Full HD)

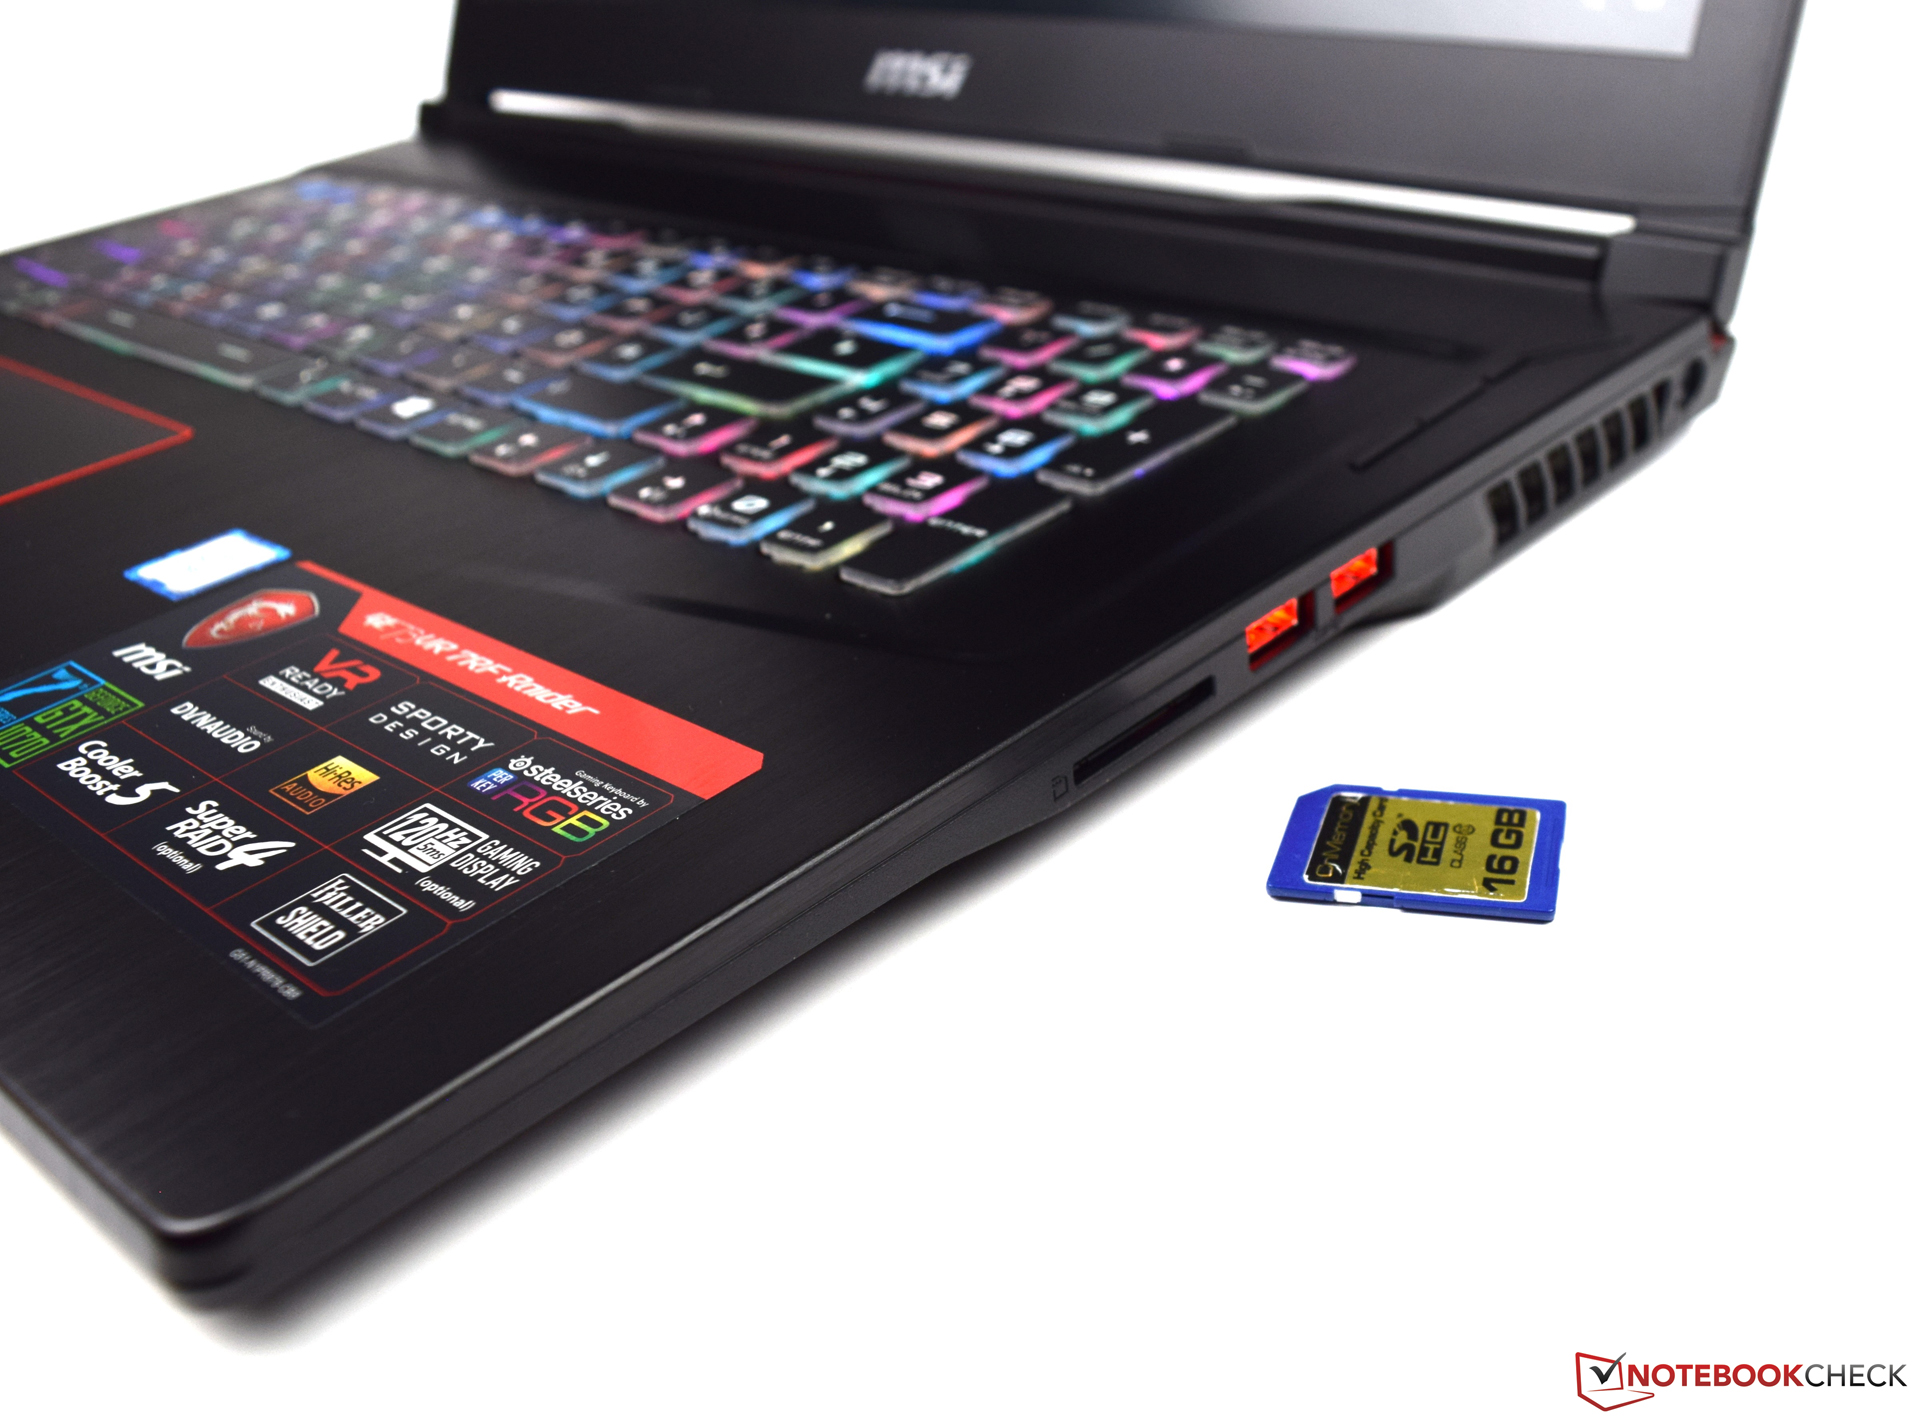
| SD Card Reader | |
| average JPG Copy Test (av. of 3 runs) | |
| MSI GE73VR 7RF Raider (Toshiba Exceria Pro SDXC 64 GB UHS-II) | |
| MSI GT72VR 7RE-433 (Toshiba Exceria Pro SDXC 64 GB UHS-II) | |
| Acer Predator 17 G9-793-70PJ (Toshiba Exceria Pro SDXC 64 GB UHS-II) | |
| Gigabyte P57X v7 (Toshiba Exceria Pro SDXC 64 GB UHS-II) | |
| Asus G752VS-BA338T (Toshiba Exceria Pro SDXC 64 GB UHS-II) | |
| HP Omen 17-an014ng (Toshiba Exceria Pro SDXC 64 GB UHS-II) | |
| maximum AS SSD Seq Read Test (1GB) | |
| MSI GT72VR 7RE-433 (Toshiba Exceria Pro SDXC 64 GB UHS-II) | |
| MSI GE73VR 7RF Raider (Toshiba Exceria Pro SDXC 64 GB UHS-II) | |
| Gigabyte P57X v7 (Toshiba Exceria Pro SDXC 64 GB UHS-II) | |
| Acer Predator 17 G9-793-70PJ (Toshiba Exceria Pro SDXC 64 GB UHS-II) | |
| Asus G752VS-BA338T (Toshiba Exceria Pro SDXC 64 GB UHS-II) | |
| HP Omen 17-an014ng (Toshiba Exceria Pro SDXC 64 GB UHS-II) | |
| |||||||||||||||||||||||||
iluminación: 90 %
Brillo con batería: 296 cd/m²
Contraste: 1410:1 (Negro: 0.21 cd/m²)
ΔE ColorChecker Calman: 3.09 | ∀{0.5-29.43 Ø4.72}
ΔE Greyscale Calman: 3.06 | ∀{0.09-98 Ø4.97}
100% sRGB (Argyll 1.6.3 3D)
75% AdobeRGB 1998 (Argyll 1.6.3 3D)
84.8% AdobeRGB 1998 (Argyll 3D)
99.9% sRGB (Argyll 3D)
90.5% Display P3 (Argyll 3D)
Gamma: 2.19
CCT: 7315 K
| MSI GE73VR 7RF Raider Chi Mei N173HHE-G32 (CMN1747), 1920x1080, 17.3" | HP Omen 17-an014ng AUO149D, 1920x1080, 17.3" | Asus G752VS-BA338T AU Optronics B173HAN01.1 (AUO119D), 1920x1080, 17.3" | Gigabyte P57X v7 SHP145E, 3840x2160, 17.3" | Acer Predator 17 G9-793-70PJ AU Optronics B173ZAN01.0 (AUO109B), 3840x2160, 17.3" | MSI GT72VR 7RE-433 Chi Mei N173HHE-G32 (CMN1747), 1920x1080, 17.3" | |
|---|---|---|---|---|---|---|
| Display | -19% | -23% | 5% | 4% | -21% | |
| Display P3 Coverage (%) | 90.5 | 64.6 -29% | 61.6 -32% | 87.8 -3% | 86.4 -5% | 68.3 -25% |
| sRGB Coverage (%) | 99.9 | 92.9 -7% | 90.3 -10% | 100 0% | 99.9 0% | 86.7 -13% |
| AdobeRGB 1998 Coverage (%) | 84.8 | 66.1 -22% | 62.8 -26% | 98.9 17% | 99.1 17% | 63.4 -25% |
| Response Times | -92% | -60% | -171% | -83% | 24% | |
| Response Time Grey 50% / Grey 80% * (ms) | 28.8 ? | 45.2 ? -57% | 36 ? -25% | 55.6 ? -93% | 50 ? -74% | 29 ? -1% |
| Response Time Black / White * (ms) | 13.4 ? | 30.4 ? -127% | 26 ? -94% | 46.8 ? -249% | 25.6 ? -91% | 7 ? 48% |
| PWM Frequency (Hz) | 26000 ? | 1000 ? | ||||
| Screen | -13% | -41% | -20% | -10% | -64% | |
| Brightness middle (cd/m²) | 296 | 314 6% | 307 4% | 441.3 49% | 343 16% | 299 1% |
| Brightness (cd/m²) | 279 | 309 11% | 300 8% | 408 46% | 328 18% | 277 -1% |
| Brightness Distribution (%) | 90 | 88 -2% | 88 -2% | 86 -4% | 84 -7% | 87 -3% |
| Black Level * (cd/m²) | 0.21 | 0.34 -62% | 0.32 -52% | 0.44 -110% | 0.29 -38% | 0.27 -29% |
| Contrast (:1) | 1410 | 924 -34% | 959 -32% | 1003 -29% | 1183 -16% | 1107 -21% |
| Colorchecker dE 2000 * | 3.09 | 3.19 -3% | 5.53 -79% | 5.1 -65% | 4.01 -30% | 9.65 -212% |
| Colorchecker dE 2000 max. * | 5.97 | 6.1 -2% | 11.54 -93% | 9.8 -64% | 6.03 -1% | 15.43 -158% |
| Greyscale dE 2000 * | 3.06 | 3.49 -14% | 7 -129% | 4.3 -41% | 4.7 -54% | 9.68 -216% |
| Gamma | 2.19 100% | 2.34 94% | 2.48 89% | 2.08 106% | 2.4 92% | 1.89 116% |
| CCT | 7315 89% | 7261 90% | 8103 80% | 7345 88% | 6451 101% | 11652 56% |
| Color Space (Percent of AdobeRGB 1998) (%) | 75 | 60 -20% | 58 -23% | 87 16% | 88 17% | 75 0% |
| Color Space (Percent of sRGB) (%) | 100 | 93 -7% | 90 -10% | 100 0% | 100 0% | 100 0% |
| Media total (Programa/Opciones) | -41% /
-25% | -41% /
-40% | -62% /
-35% | -30% /
-17% | -20% /
-44% |
* ... más pequeño es mejor
Tiempos de respuesta del display
| ↔ Tiempo de respuesta de Negro a Blanco | ||
|---|---|---|
| 13.4 ms ... subida ↗ y bajada ↘ combinada | ↗ 11.4 ms subida | 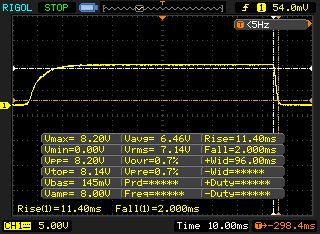 |
| ↘ 2 ms bajada | ||
| La pantalla mostró buenos tiempos de respuesta en nuestros tests pero podría ser demasiado lenta para los jugones competitivos. En comparación, todos los dispositivos de prueba van de ##min### (mínimo) a 240 (máximo) ms. » 34 % de todos los dispositivos son mejores. Esto quiere decir que el tiempo de respuesta medido es mejor que la media (19.8 ms) de todos los dispositivos testados. | ||
| ↔ Tiempo de respuesta 50% Gris a 80% Gris | ||
| 28.8 ms ... subida ↗ y bajada ↘ combinada | ↗ 16.8 ms subida |  |
| ↘ 12 ms bajada | ||
| La pantalla mostró tiempos de respuesta relativamente lentos en nuestros tests pero podría ser demasiado lenta para los jugones. En comparación, todos los dispositivos de prueba van de ##min### (mínimo) a 636 (máximo) ms. » 38 % de todos los dispositivos son mejores. Eso quiere decir que el tiempo de respuesta es similar al dispositivo testado medio (31 ms). | ||
Parpadeo de Pantalla / PWM (Pulse-Width Modulation)
| Parpadeo de Pantalla / PWM detectado | 26000 Hz | ≤ 15 % de brillo | 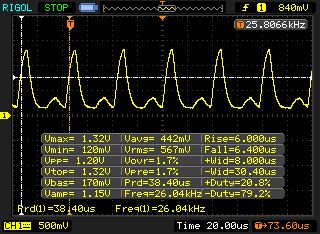 |
La retroiluminación del display parpadea a 26000 Hz (seguramente usa PWM - Pulse-Width Modulation) a un brillo del 15 % e inferior. Sobre este nivel de brillo no debería darse parpadeo / PWM. La frecuencia de 26000 Hz es bastante alta, por lo que la mayoría de gente sensible al parpadeo no debería ver parpadeo o tener fatiga visual. Comparación: 52 % de todos los dispositivos testados no usaron PWM para atenuar el display. Si se usó, medimos una media de 7781 (mínimo: 5 - máxmo: 343500) Hz. | |||
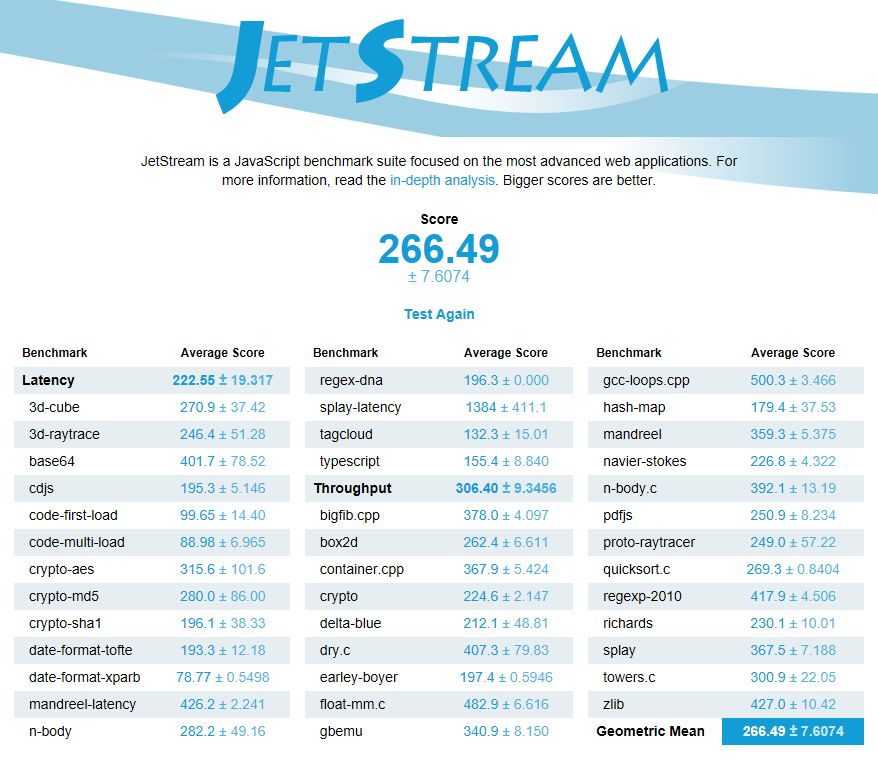
| JetStream 1.1 - 1.1 Total | |
| Asus G752VS-BA338T | |
| MSI GE73VR 7RF Raider | |
| MSI GT72VR 7RE-433 | |
| HP Omen 17-an014ng | |
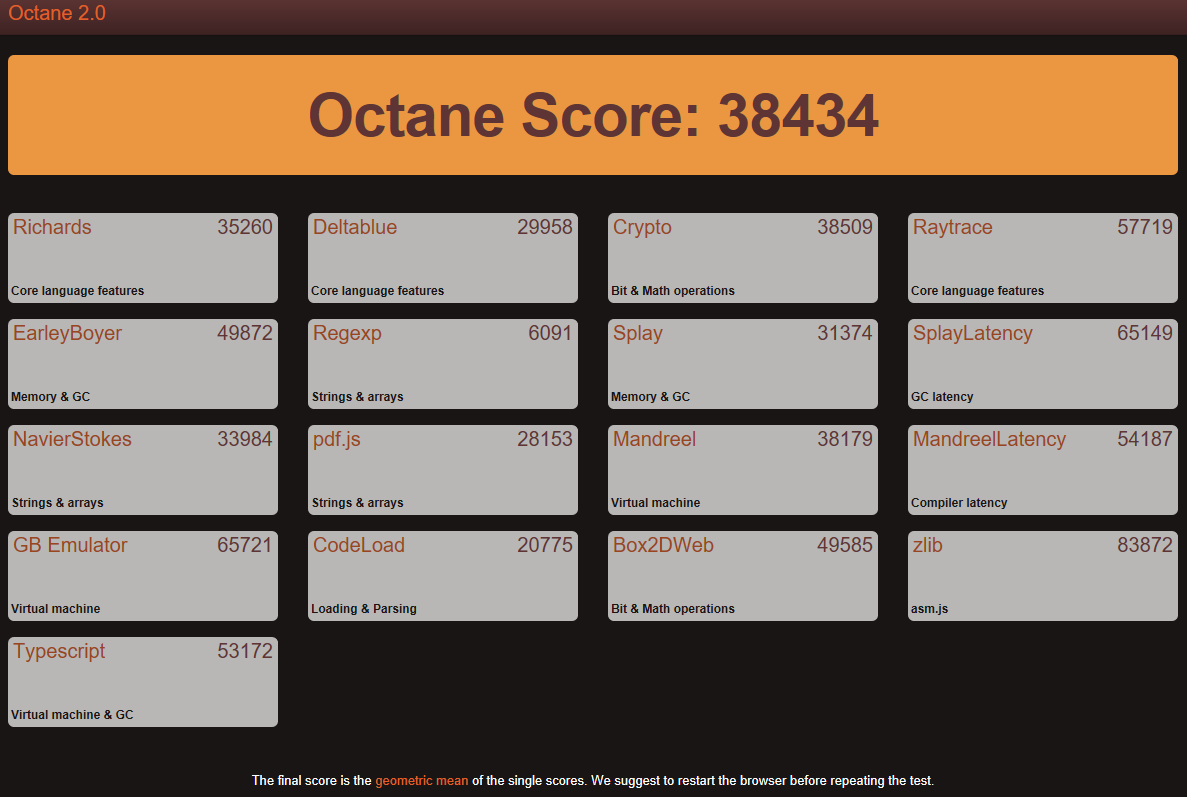
| Octane V2 - Total Score | |
| MSI GT72VR 7RE-433 | |
| MSI GE73VR 7RF Raider | |
| Asus G752VS-BA338T | |
| HP Omen 17-an014ng | |
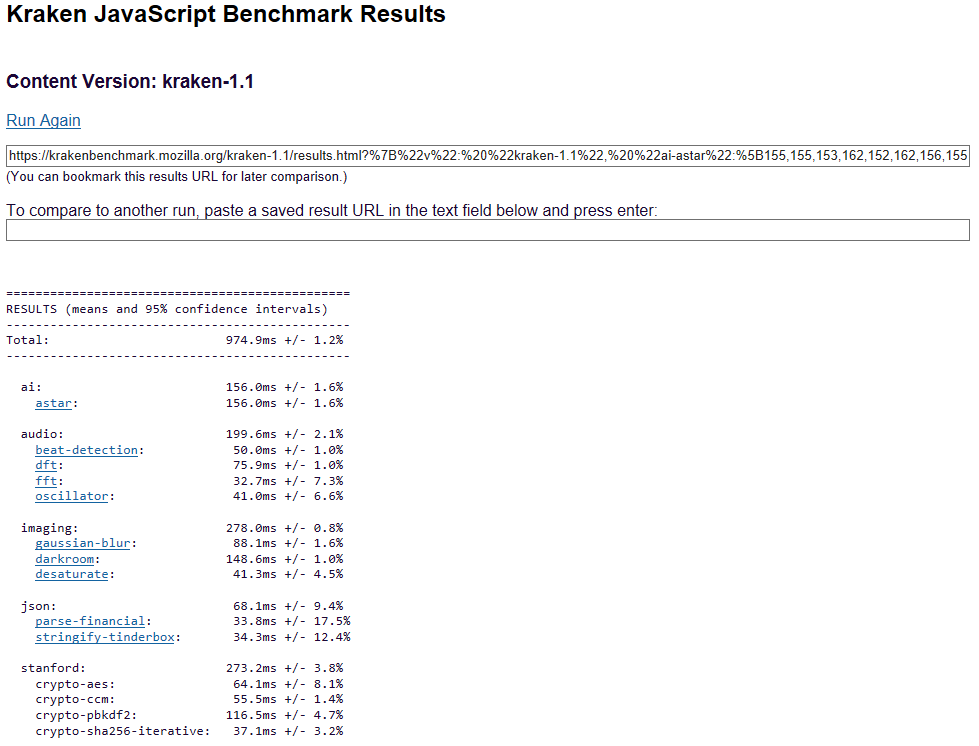
| Mozilla Kraken 1.1 - Total | |
| HP Omen 17-an014ng | |
| MSI GT72VR 7RE-433 | |
| MSI GE73VR 7RF Raider | |
| Asus G752VS-BA338T | |
* ... más pequeño es mejor
| PCMark 8 | |
| Home Score Accelerated v2 | |
| Asus G752VS-BA338T | |
| MSI GT72VR 7RE-433 | |
| HP Omen 17-an014ng | |
| Acer Predator 17 G9-793-70PJ | |
| MSI GE73VR 7RF Raider | |
| Gigabyte P57X v7 | |
| Creative Score Accelerated v2 | |
| Asus G752VS-BA338T | |
| MSI GT72VR 7RE-433 | |
| MSI GE73VR 7RF Raider | |
| Gigabyte P57X v7 | |
| Work Score Accelerated v2 | |
| Asus G752VS-BA338T | |
| MSI GT72VR 7RE-433 | |
| HP Omen 17-an014ng | |
| MSI GE73VR 7RF Raider | |
| Acer Predator 17 G9-793-70PJ | |
| Gigabyte P57X v7 | |
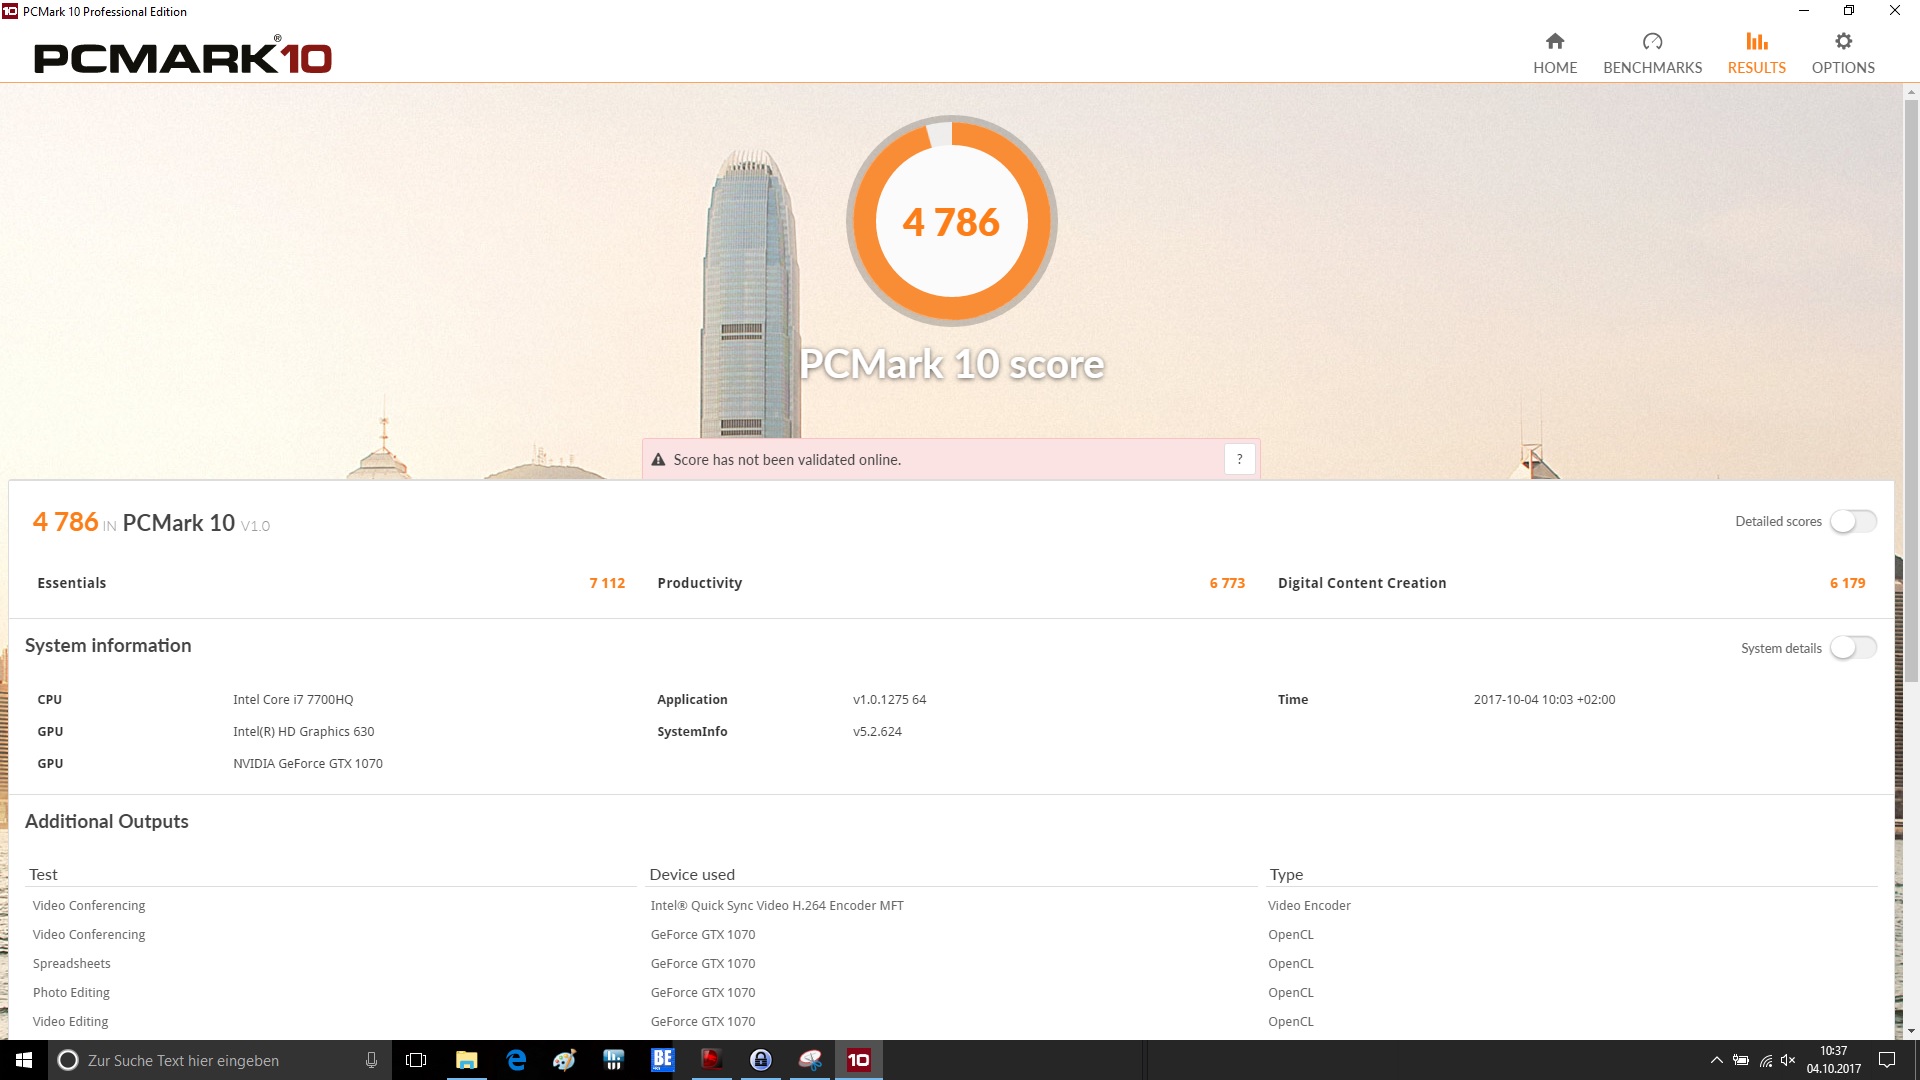
| PCMark 10 - Score | |
| HP Omen 17-an014ng | |
| MSI GE73VR 7RF Raider | |
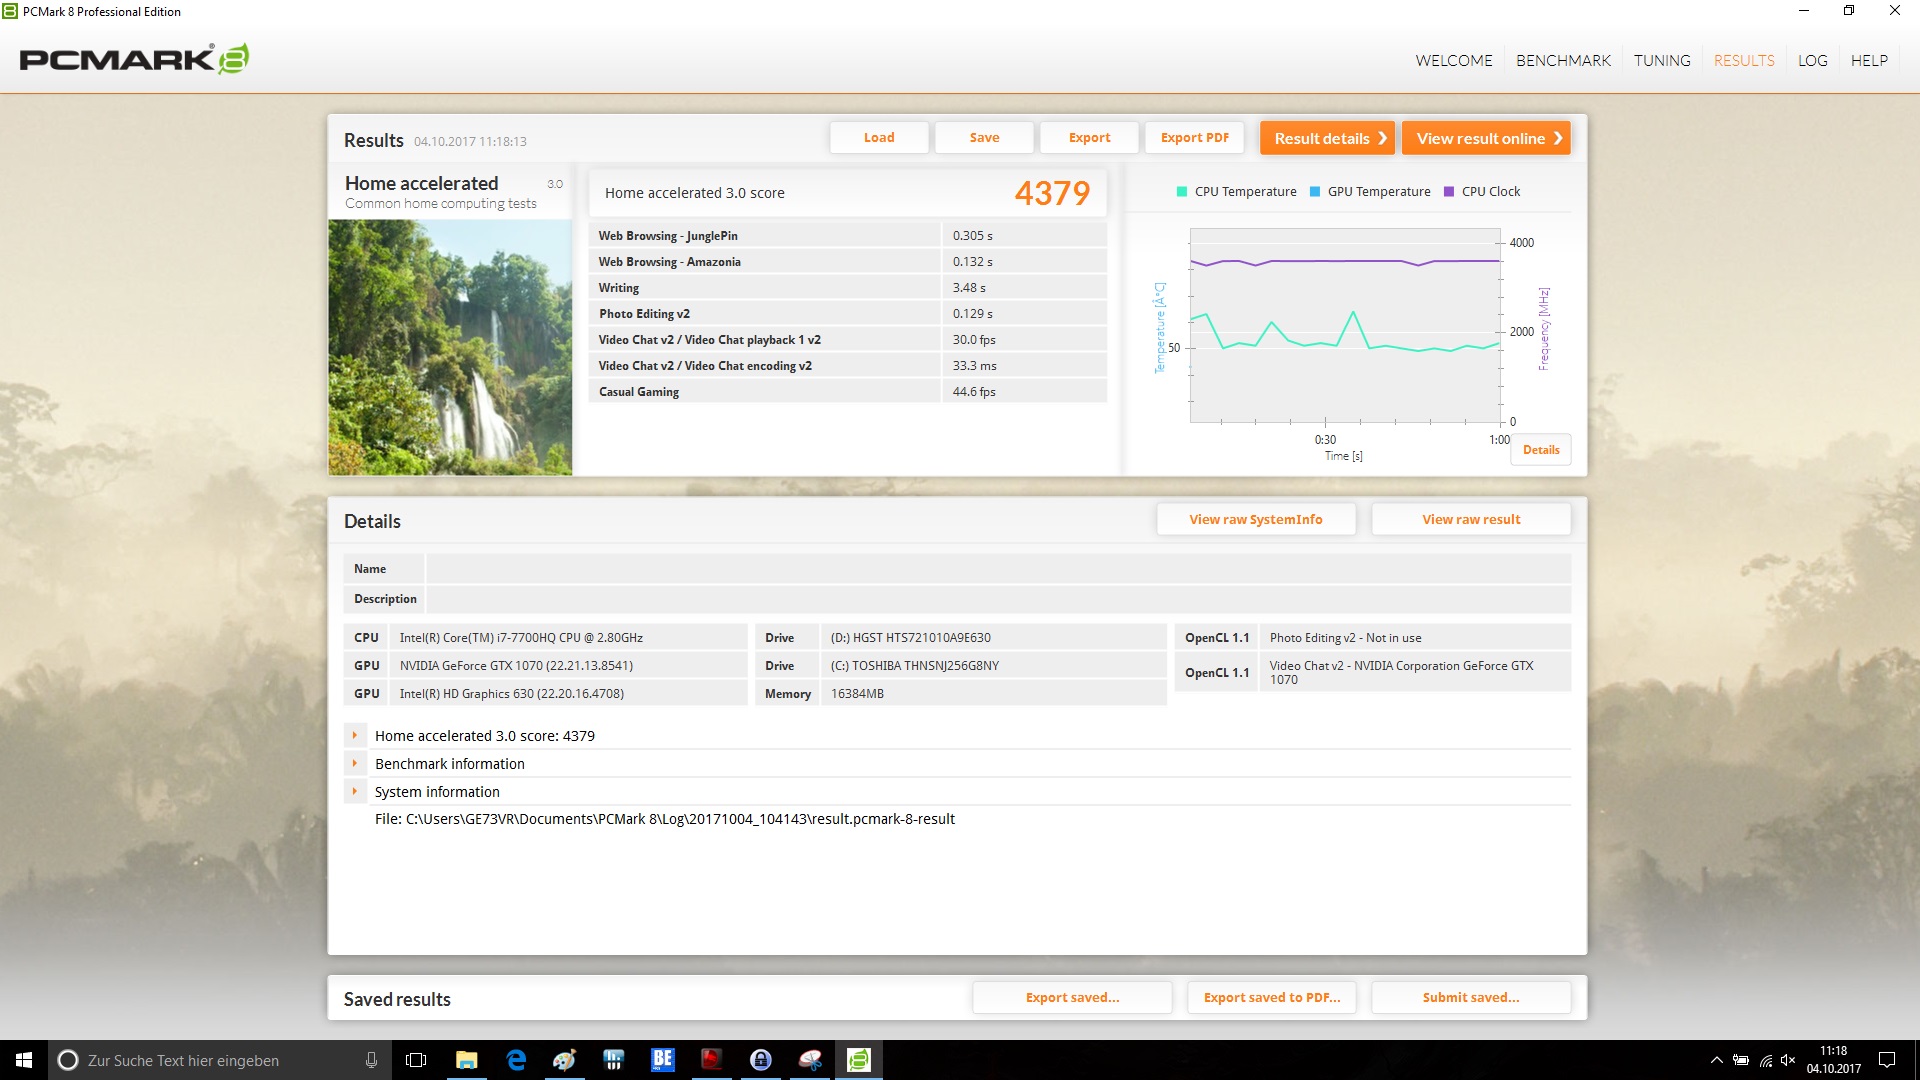
| PCMark 8 Home Score Accelerated v2 | 4379 puntos | |
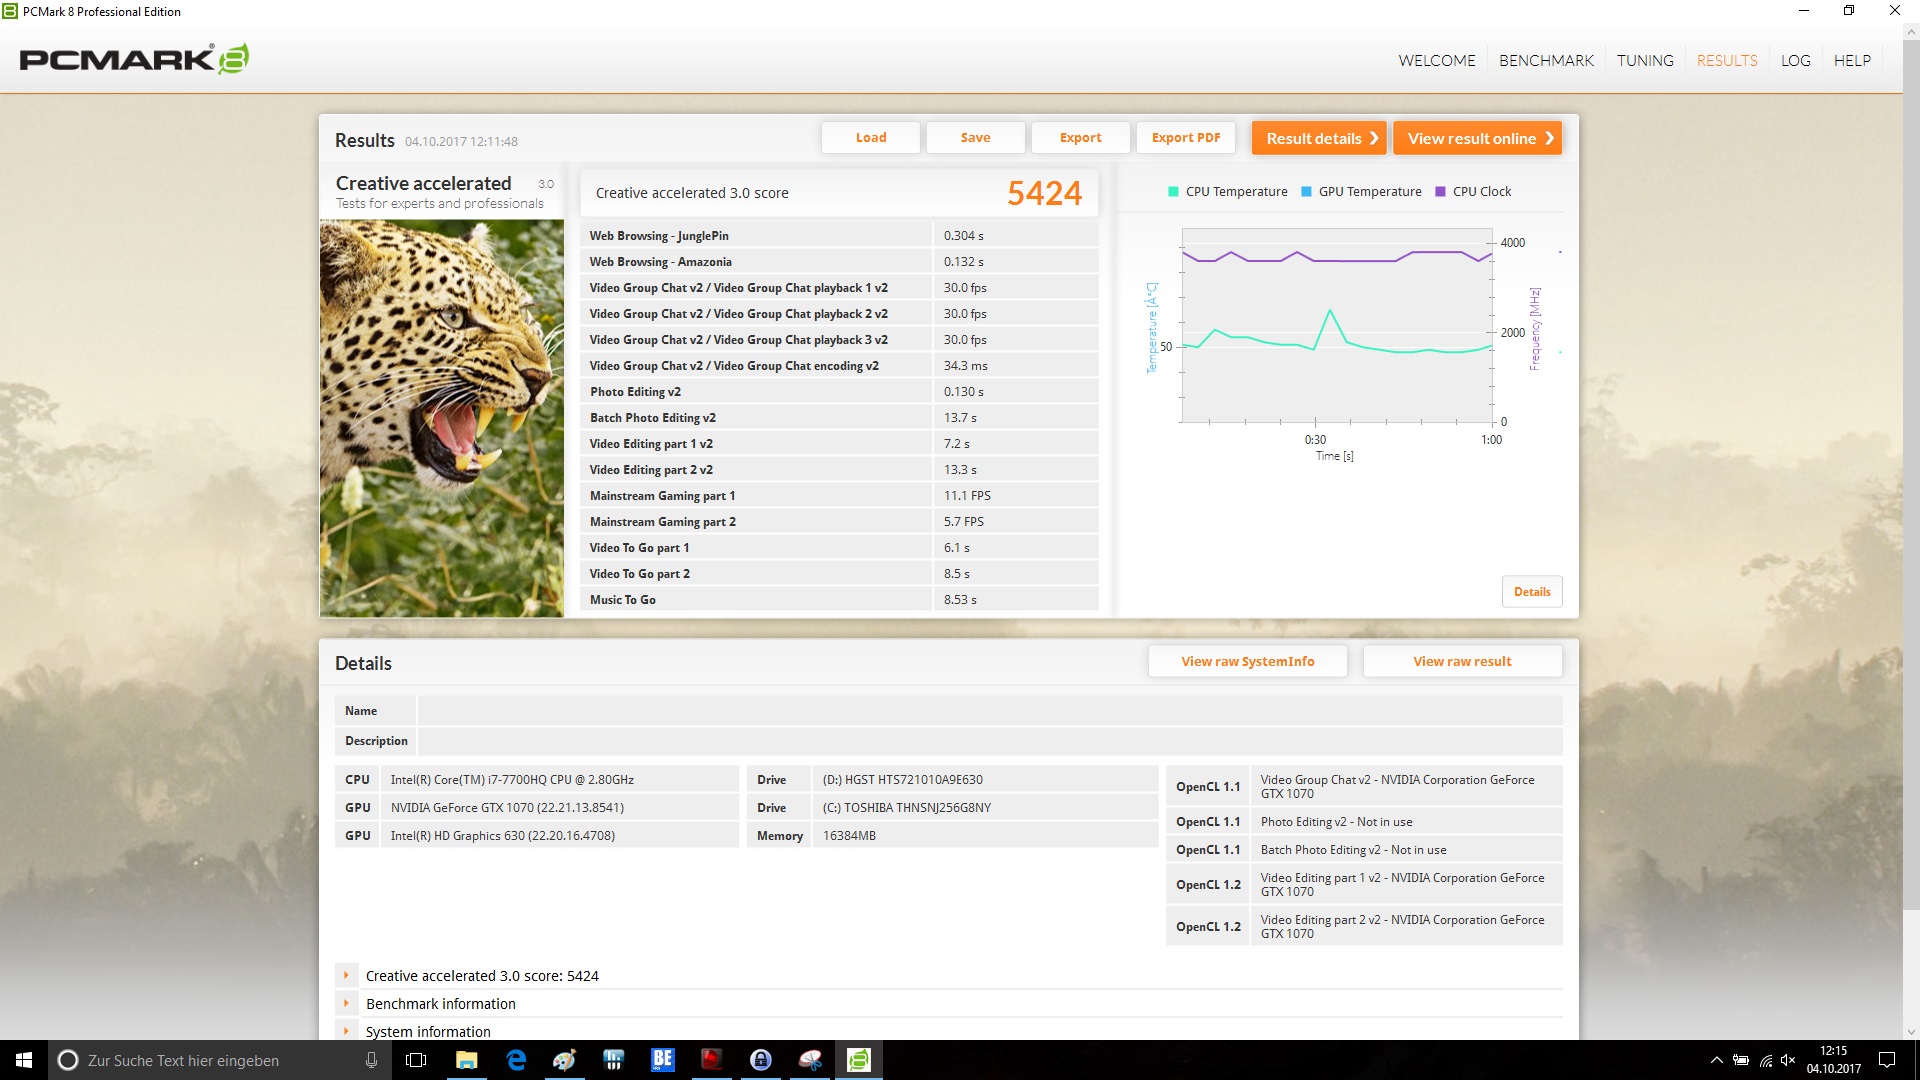
| PCMark 8 Creative Score Accelerated v2 | 5424 puntos | |
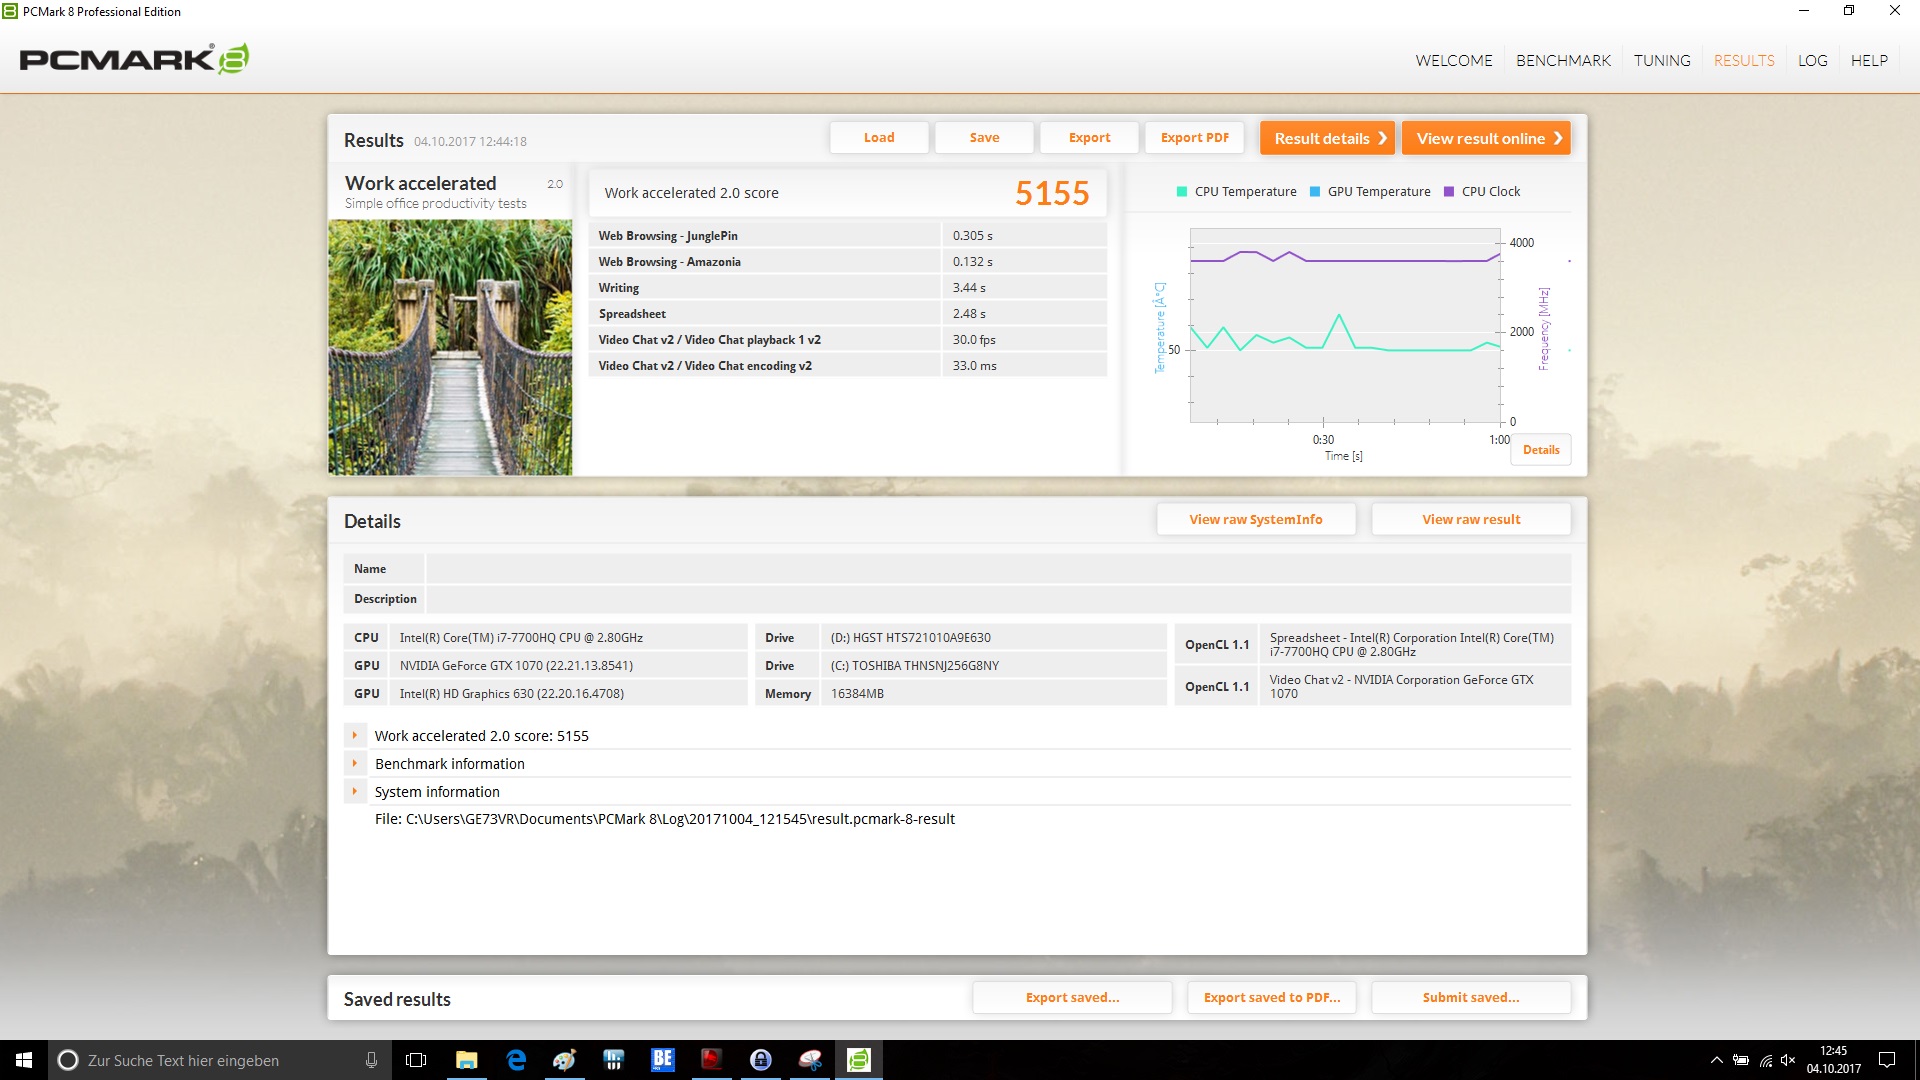
| PCMark 8 Work Score Accelerated v2 | 5155 puntos | |
| PCMark 10 Score | 4786 puntos | |
ayuda | ||
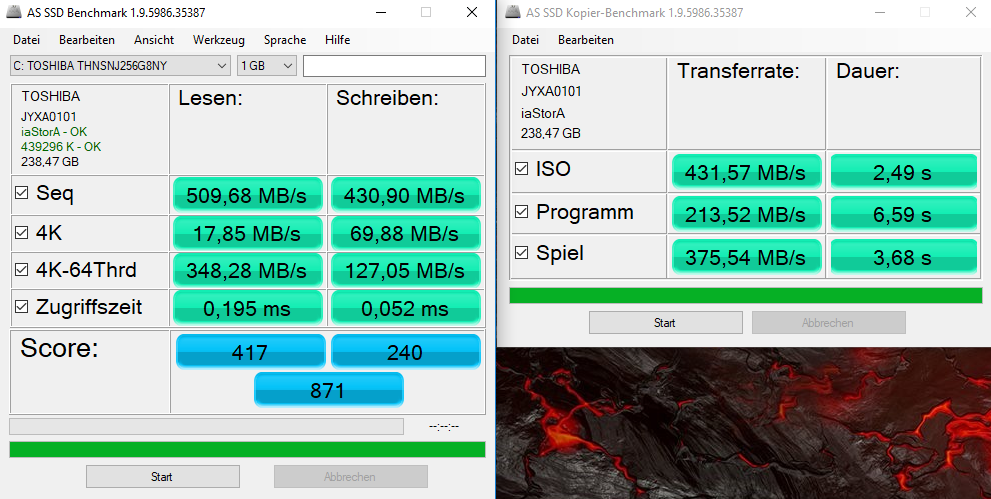
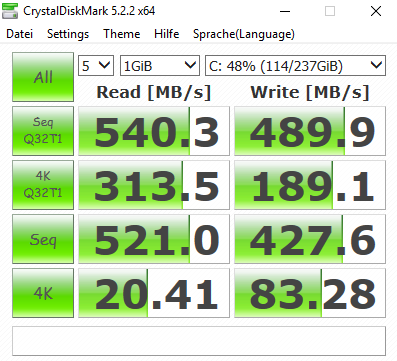
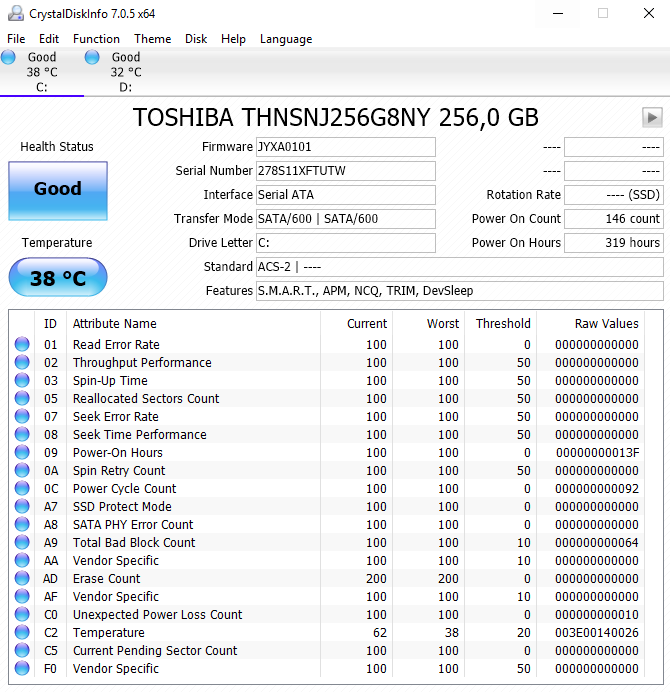
| MSI GE73VR 7RF Raider Toshiba HG6 THNSNJ256G8NY | HP Omen 17-an014ng Samsung PM961 MZVLW256HEHP | Asus G752VS-BA338T Samsung SM961 MZVKW512HMJP m.2 PCI-e | Gigabyte P57X v7 Transcend MTS800 256GB M.2 (TS256GMTS800) | Acer Predator 17 G9-793-70PJ Toshiba NVMe THNSN5512GPU7 | MSI GT72VR 7RE-433 Kingston RBU-SNS8152S3256GG5 | |
|---|---|---|---|---|---|---|
| AS SSD | -344% | 257% | 2% | 171% | 44% | |
| Seq Read (MB/s) | 510 | 2374 365% | 2824 454% | 491.9 -4% | 2237 339% | 509 0% |
| Seq Write (MB/s) | 430.9 | 365.5 -15% | 1554 261% | 260.9 -39% | 1230 185% | 282.1 -35% |
| 4K Read (MB/s) | 17.85 | 47.62 167% | 49.71 178% | 23.65 32% | 37.51 110% | 40.04 124% |
| 4K Write (MB/s) | 69.9 | 1.26 -98% | 138.9 99% | 72 3% | 120.8 73% | 95.8 37% |
| 4K-64 Read (MB/s) | 348.3 | 1129 224% | 744 114% | 241.4 -31% | 851 144% | 394.5 13% |
| 4K-64 Write (MB/s) | 127.1 | 122.9 -3% | 1185 832% | 151.4 19% | 646 408% | 281.4 121% |
| Access Time Read * (ms) | 0.195 | 0.058 70% | 0.058 70% | 0.11 44% | 0.052 73% | 0.077 61% |
| Access Time Write * (ms) | 0.052 | 1.85 -3458% | 0.027 48% | 0.055 -6% | 0.033 37% | 0.035 33% |
* ... más pequeño es mejor

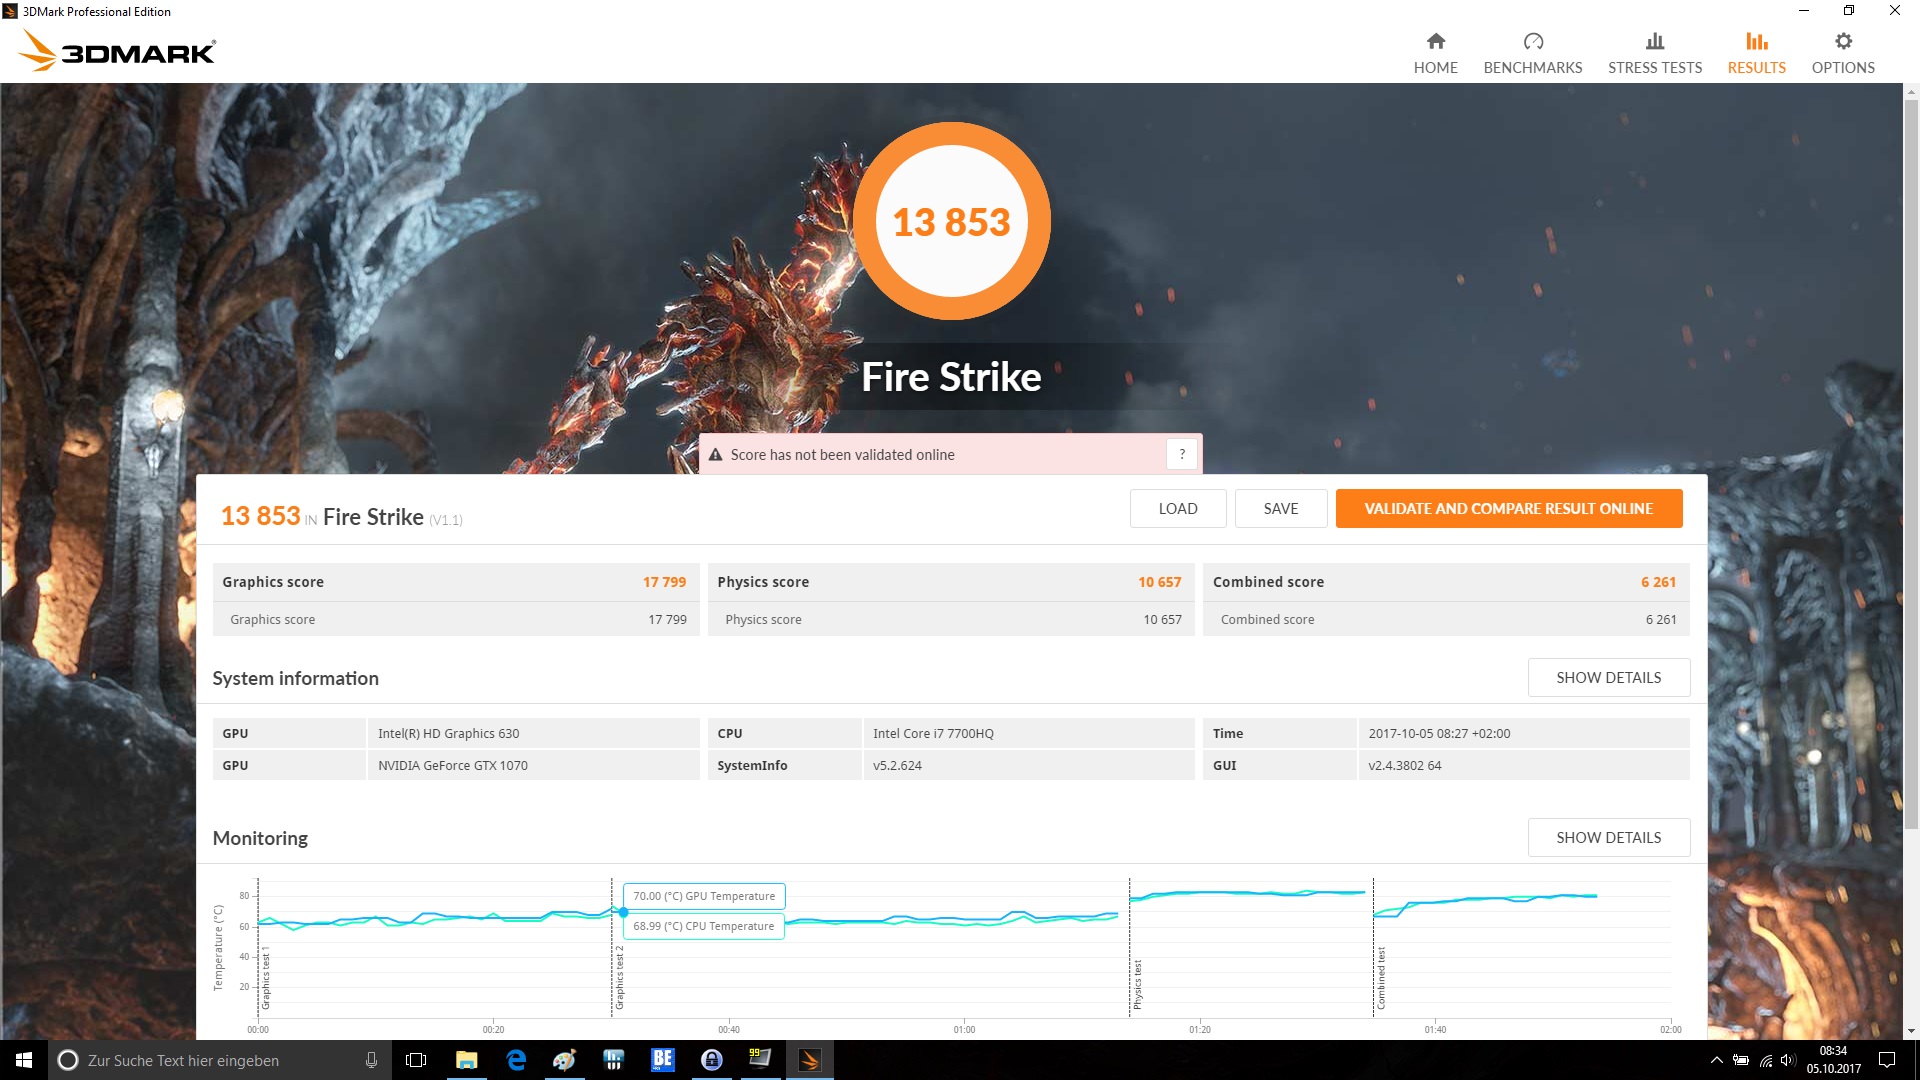
| 3DMark | |
| 1920x1080 Fire Strike Graphics | |
| Asus G752VS-BA338T | |
| MSI GE73VR 7RF Raider | |
| MSI GT72VR 7RE-433 | |
| HP Omen 17-an014ng | |
| Gigabyte P57X v7 | |
| Acer Predator 17 G9-793-70PJ | |
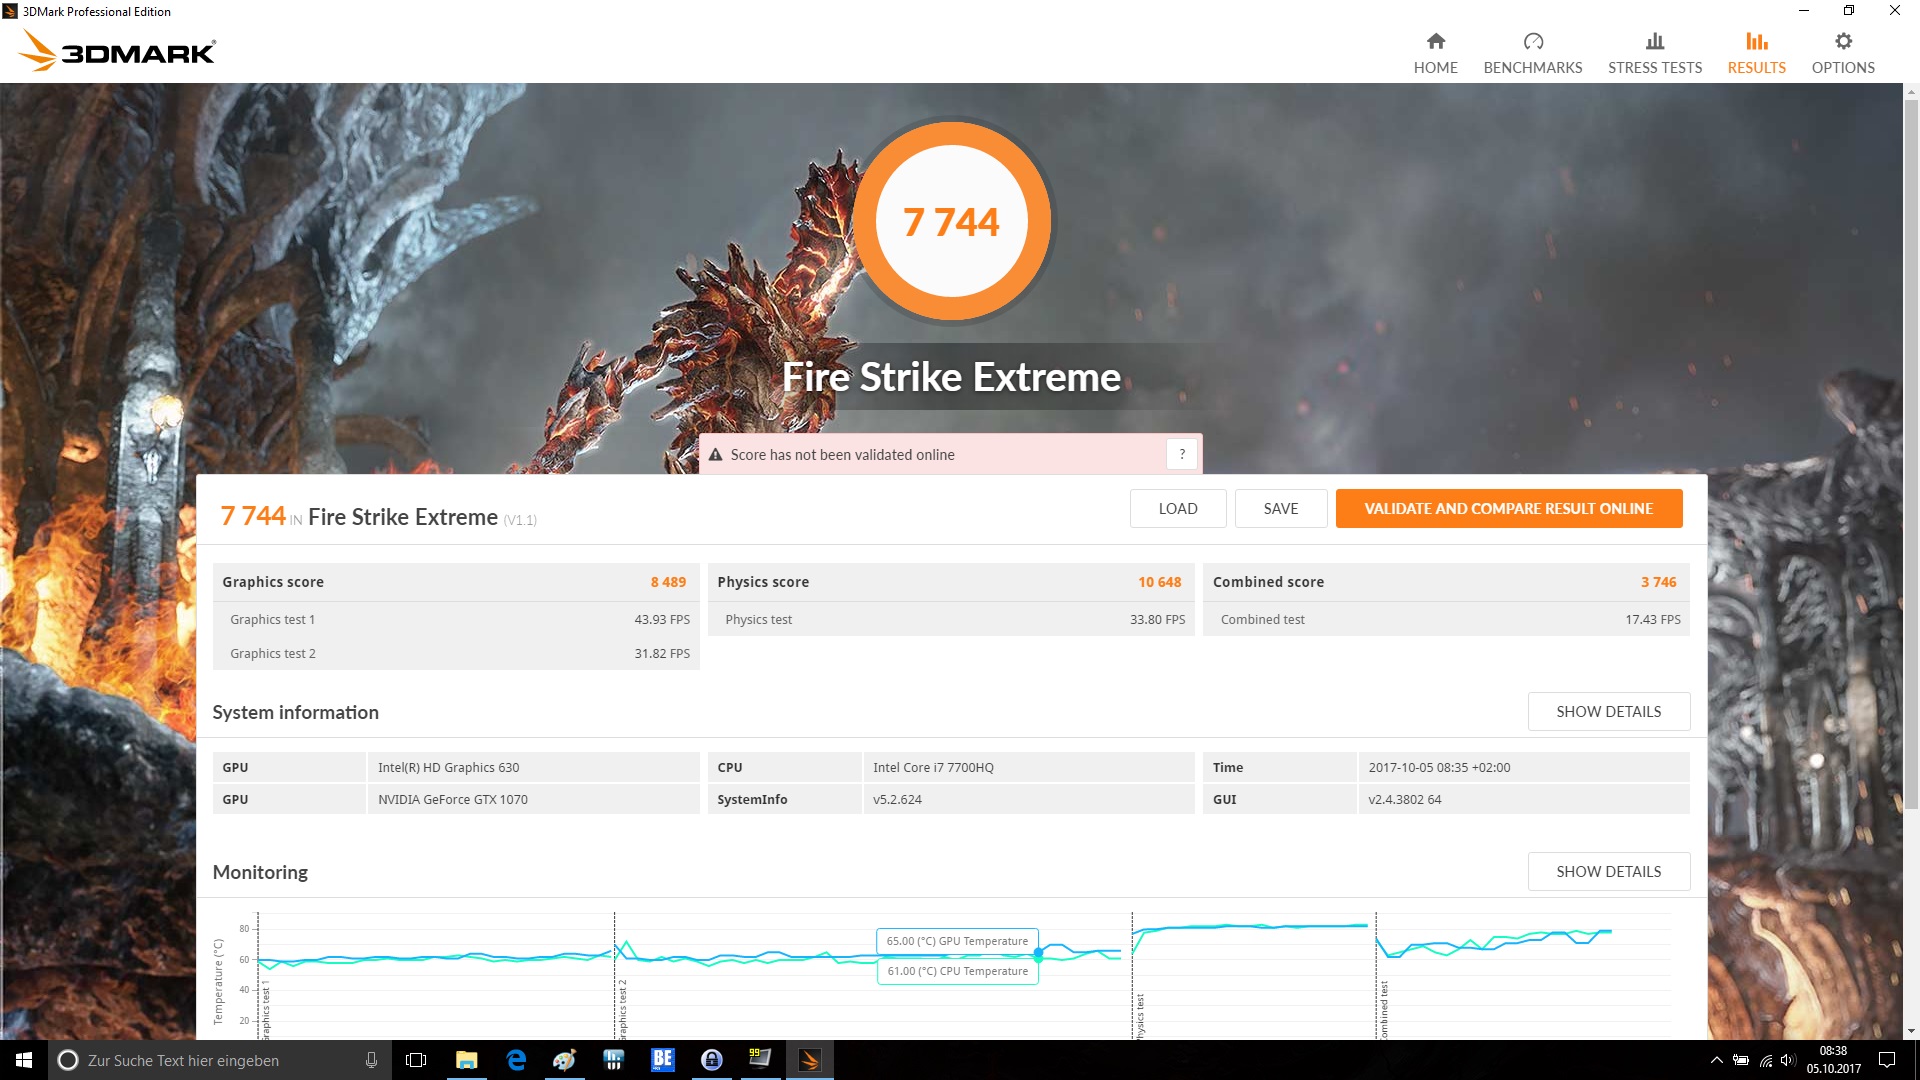
| Fire Strike Extreme Graphics | |
| Asus G752VS-BA338T | |
| MSI GE73VR 7RF Raider | |
| Gigabyte P57X v7 | |
| MSI GT72VR 7RE-433 | |
| 3DMark 11 - 1280x720 Performance GPU | |
| Asus G752VS-BA338T | |
| MSI GE73VR 7RF Raider | |
| Gigabyte P57X v7 | |
| MSI GT72VR 7RE-433 | |
| Acer Predator 17 G9-793-70PJ | |
| HP Omen 17-an014ng | |
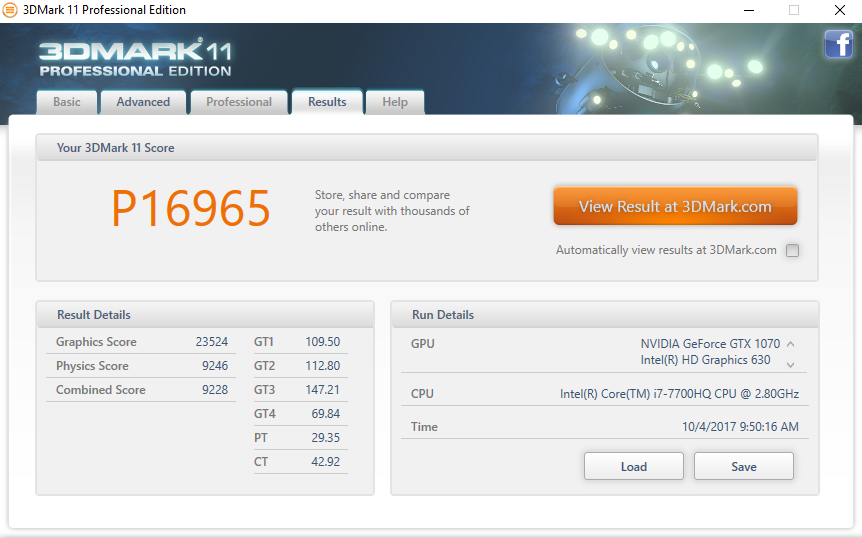
| 3DMark 11 Performance | 16965 puntos | |
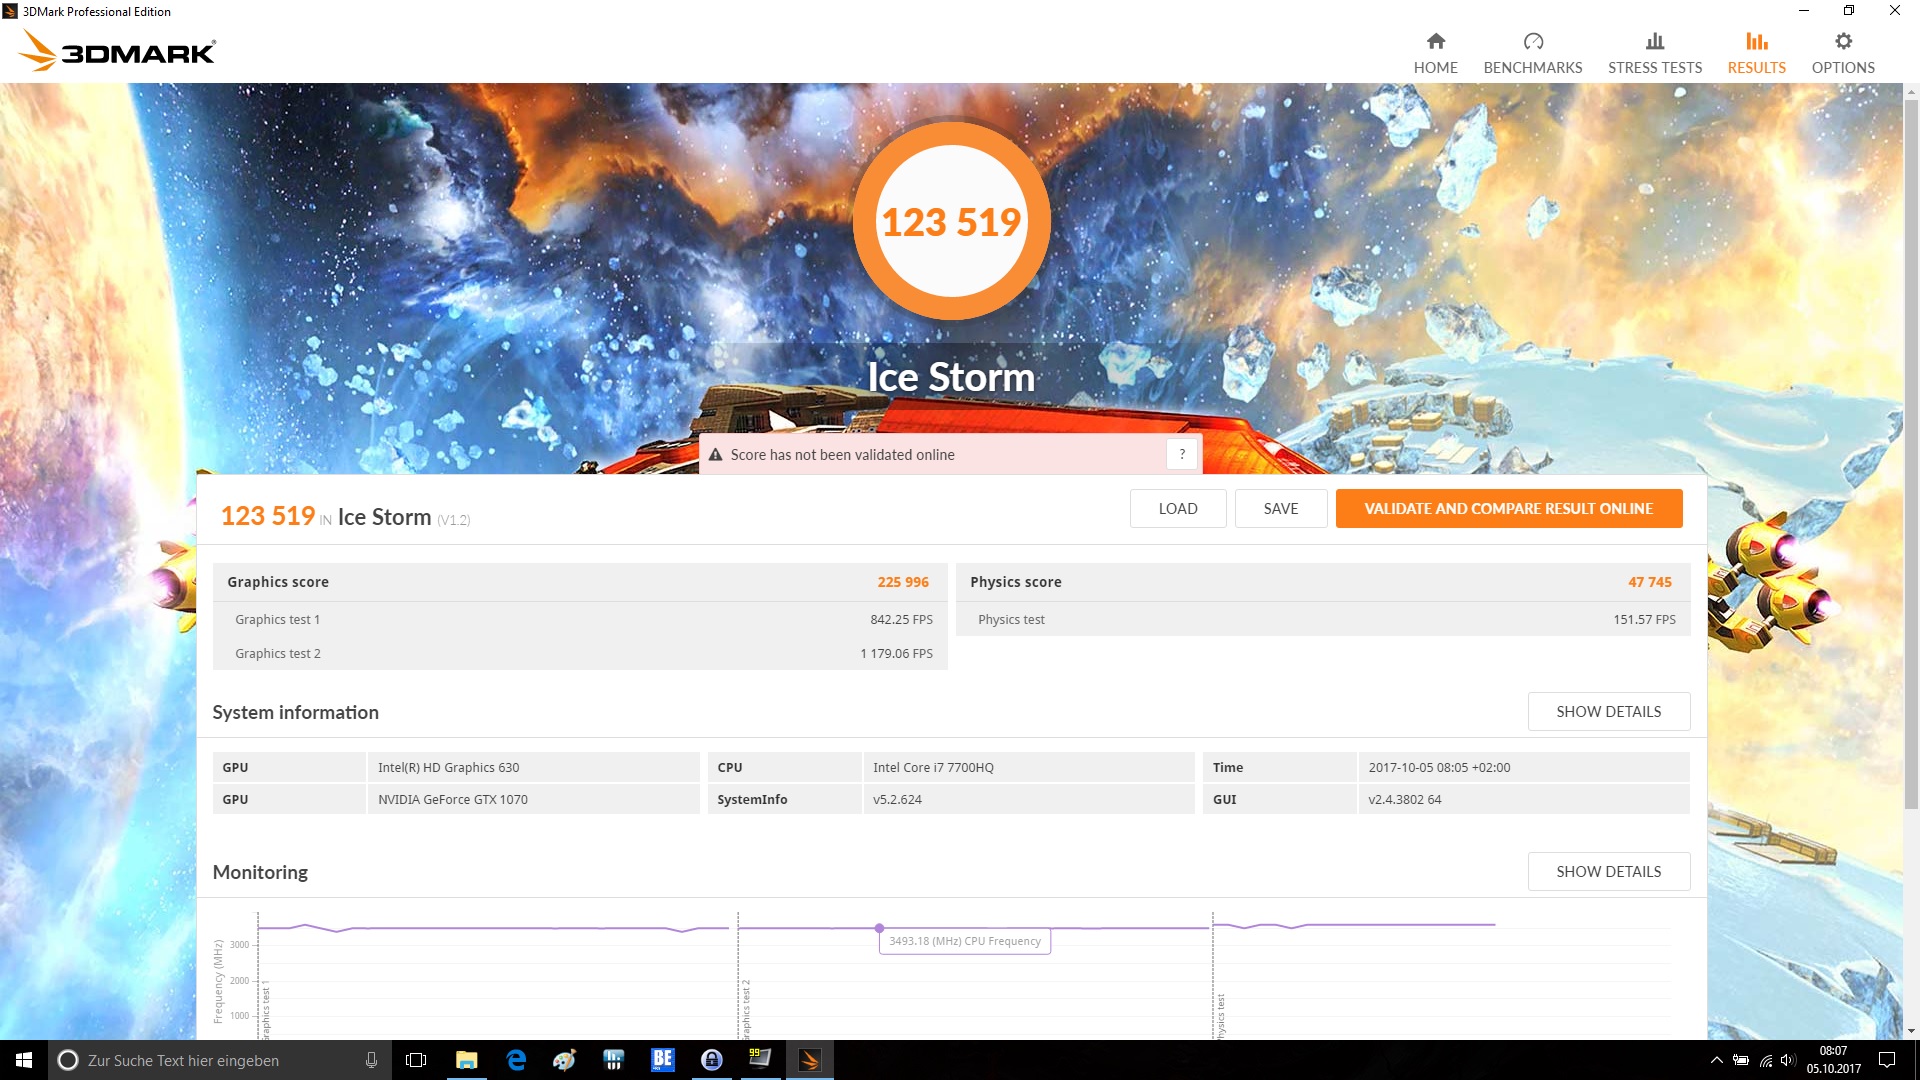
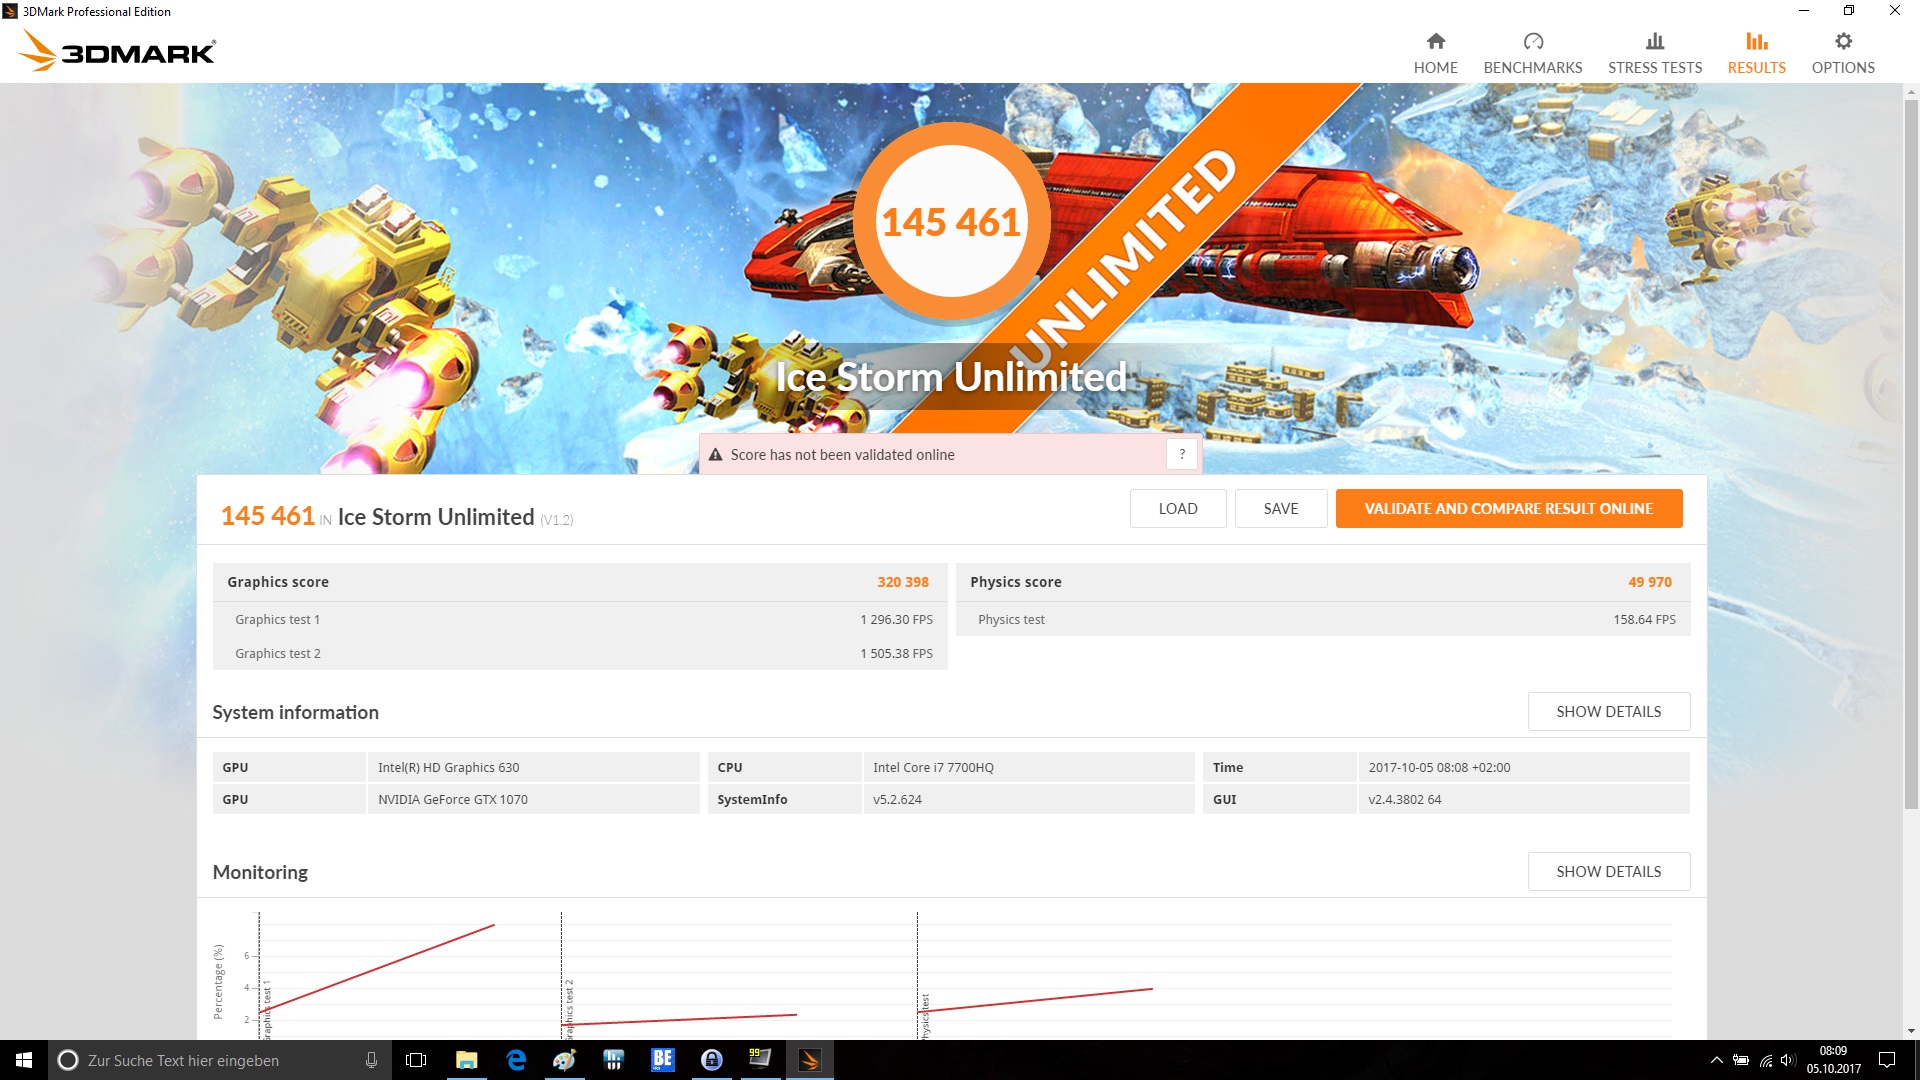
| 3DMark Ice Storm Standard Score | 123519 puntos | |
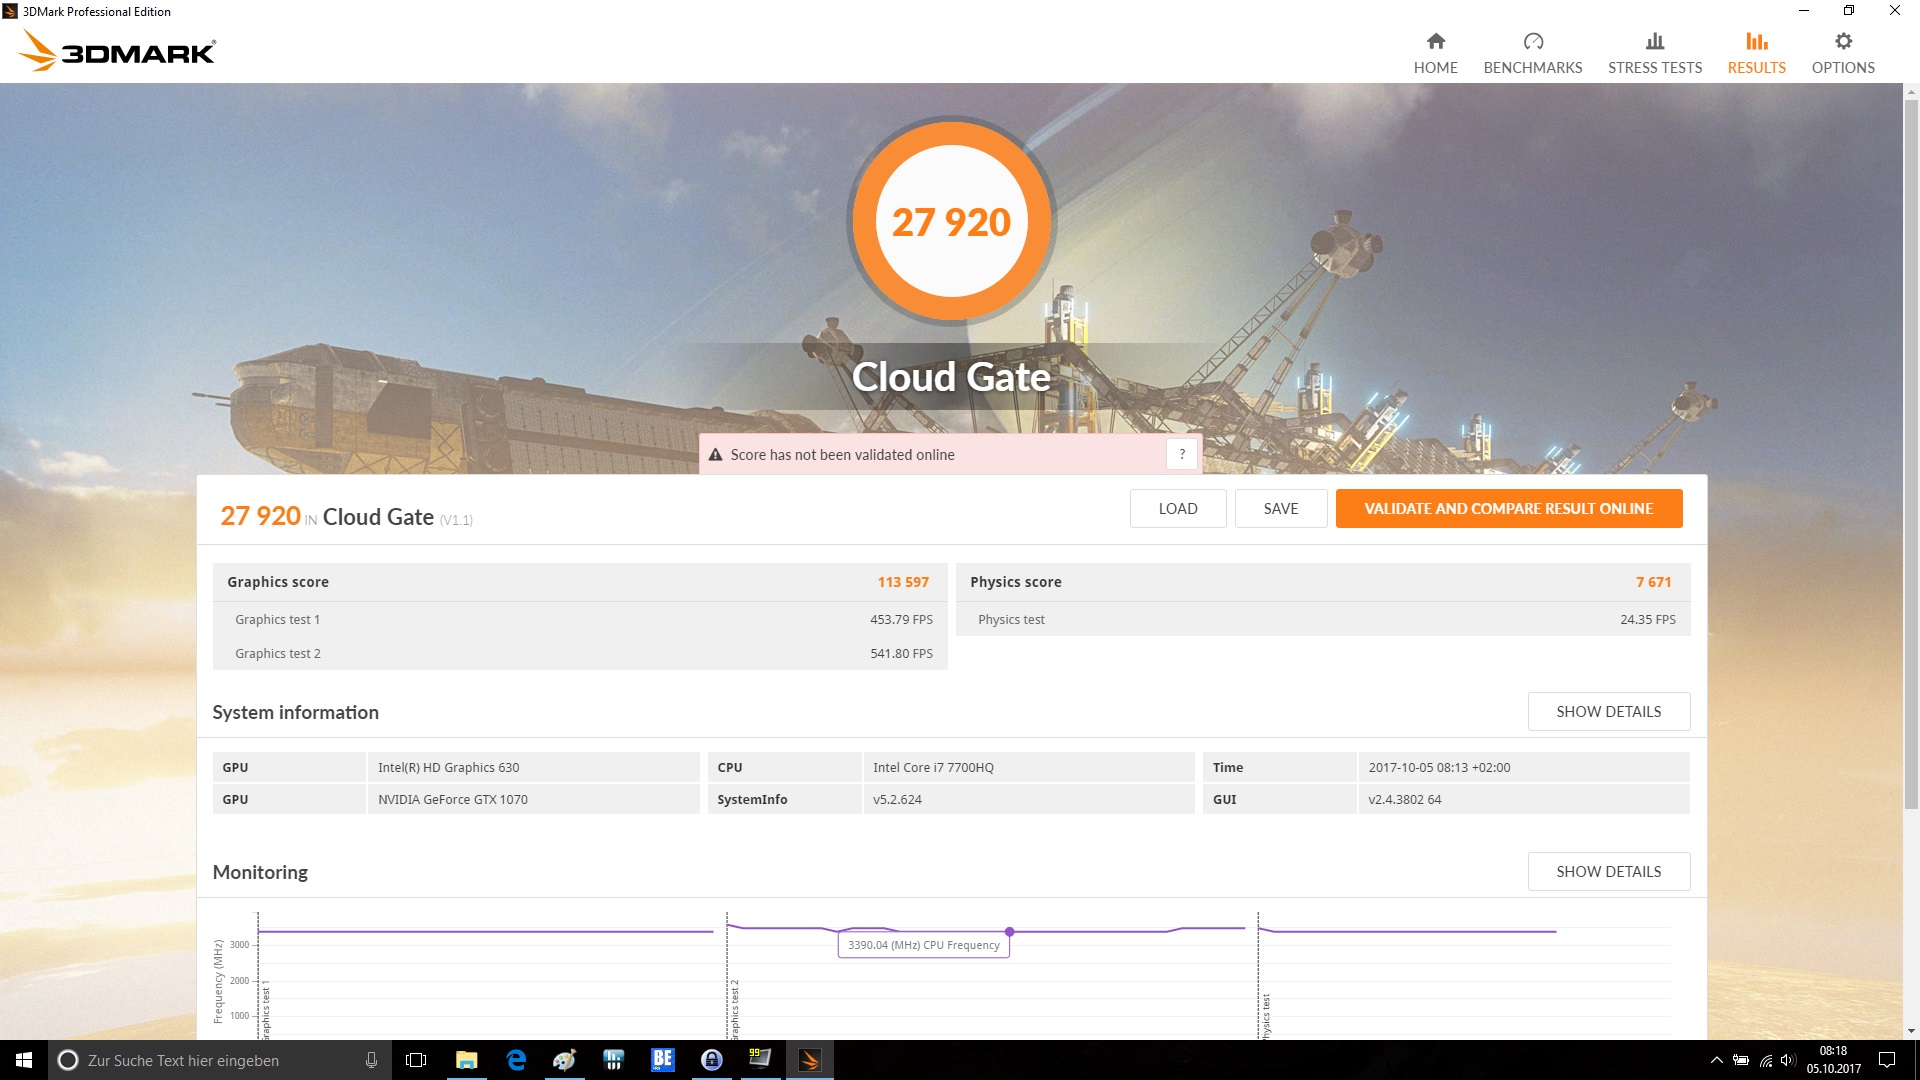
| 3DMark Cloud Gate Standard Score | 27920 puntos | |
| 3DMark Fire Strike Score | 13853 puntos | |
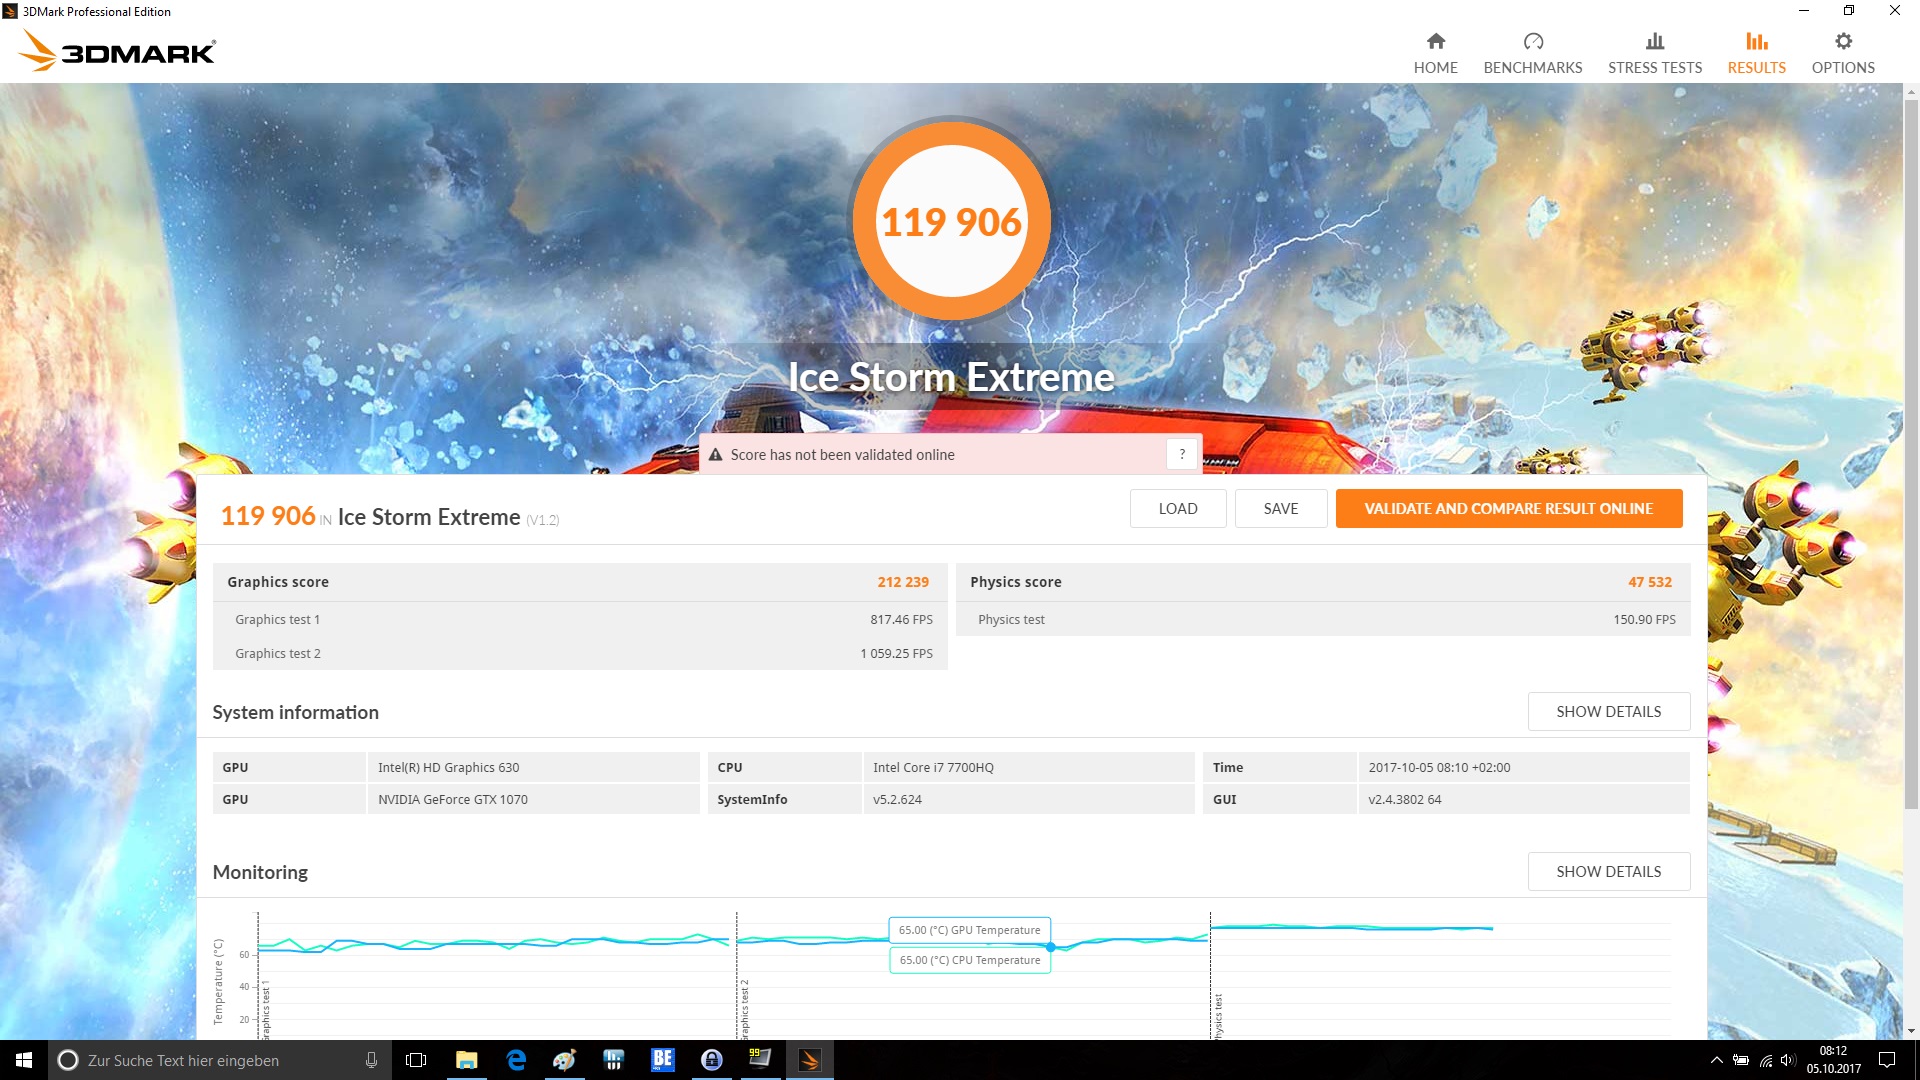
| 3DMark Fire Strike Extreme Score | 7744 puntos | |
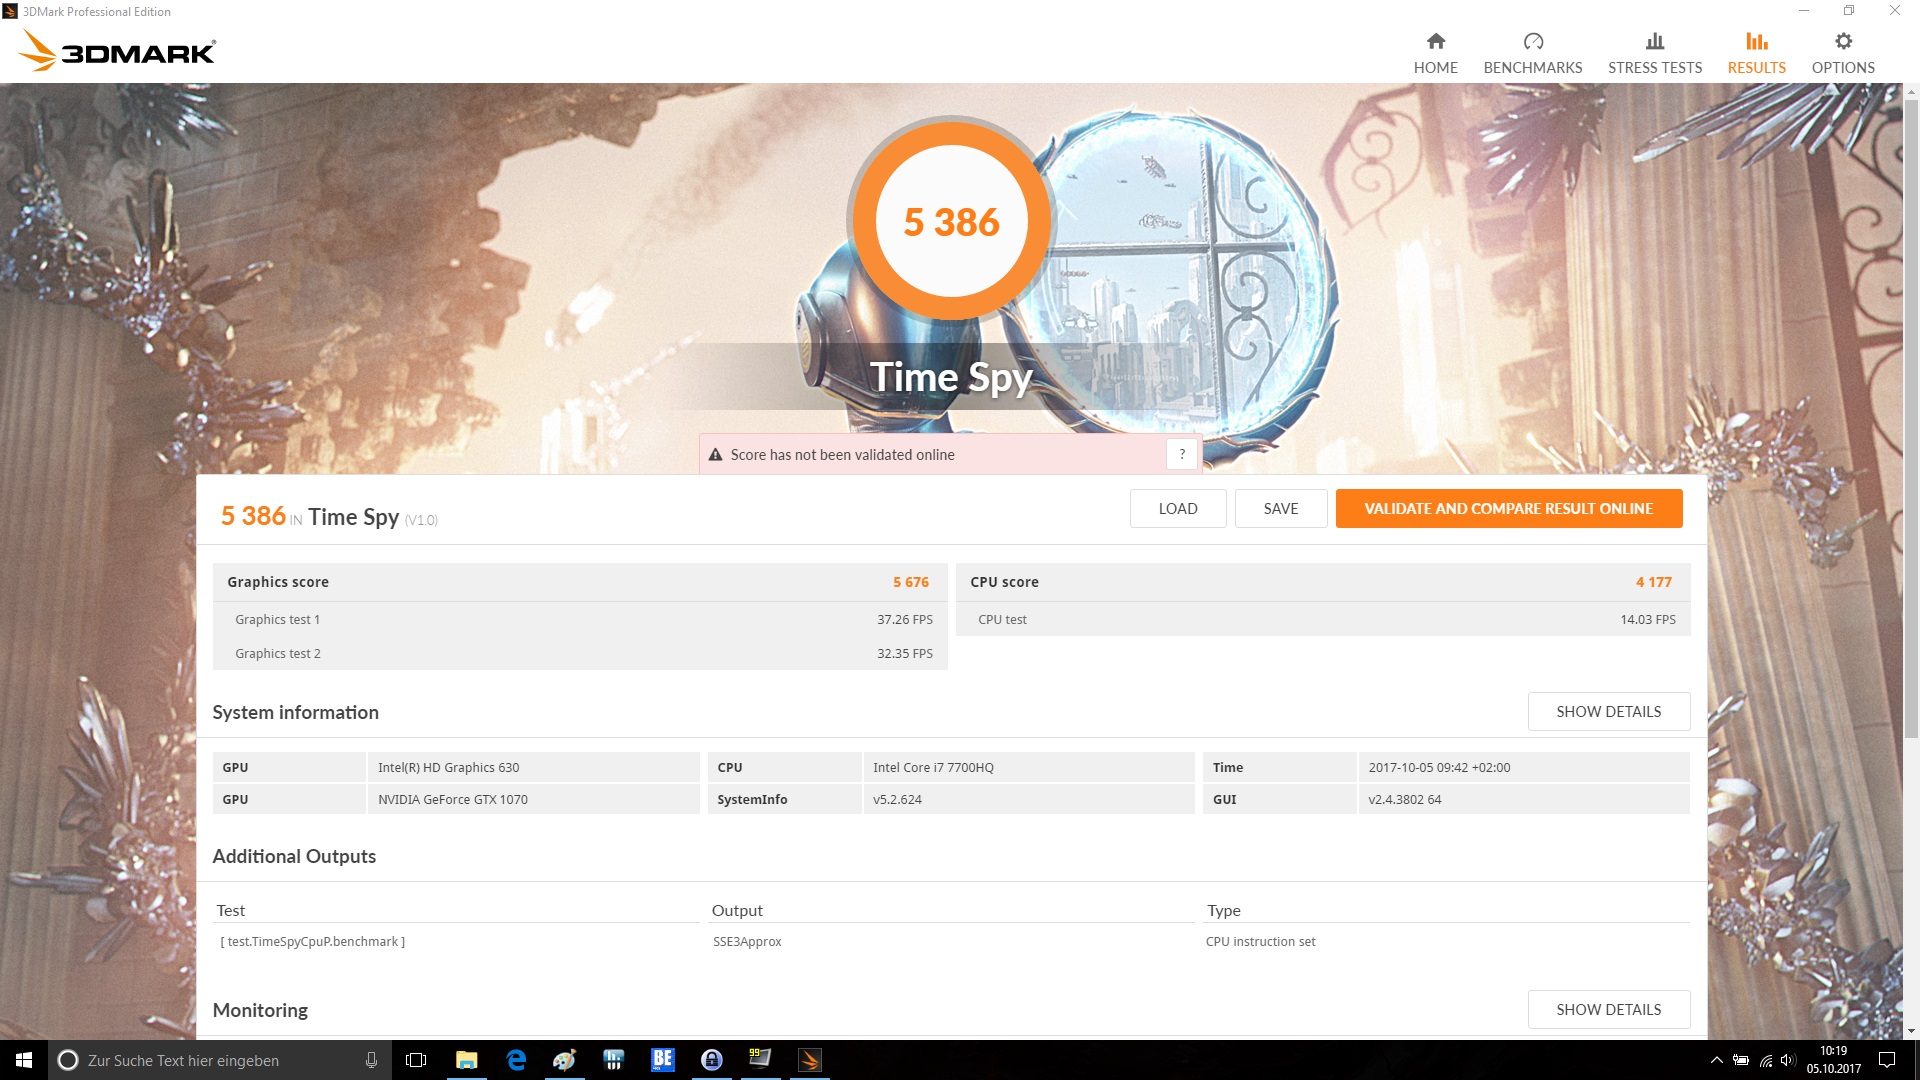
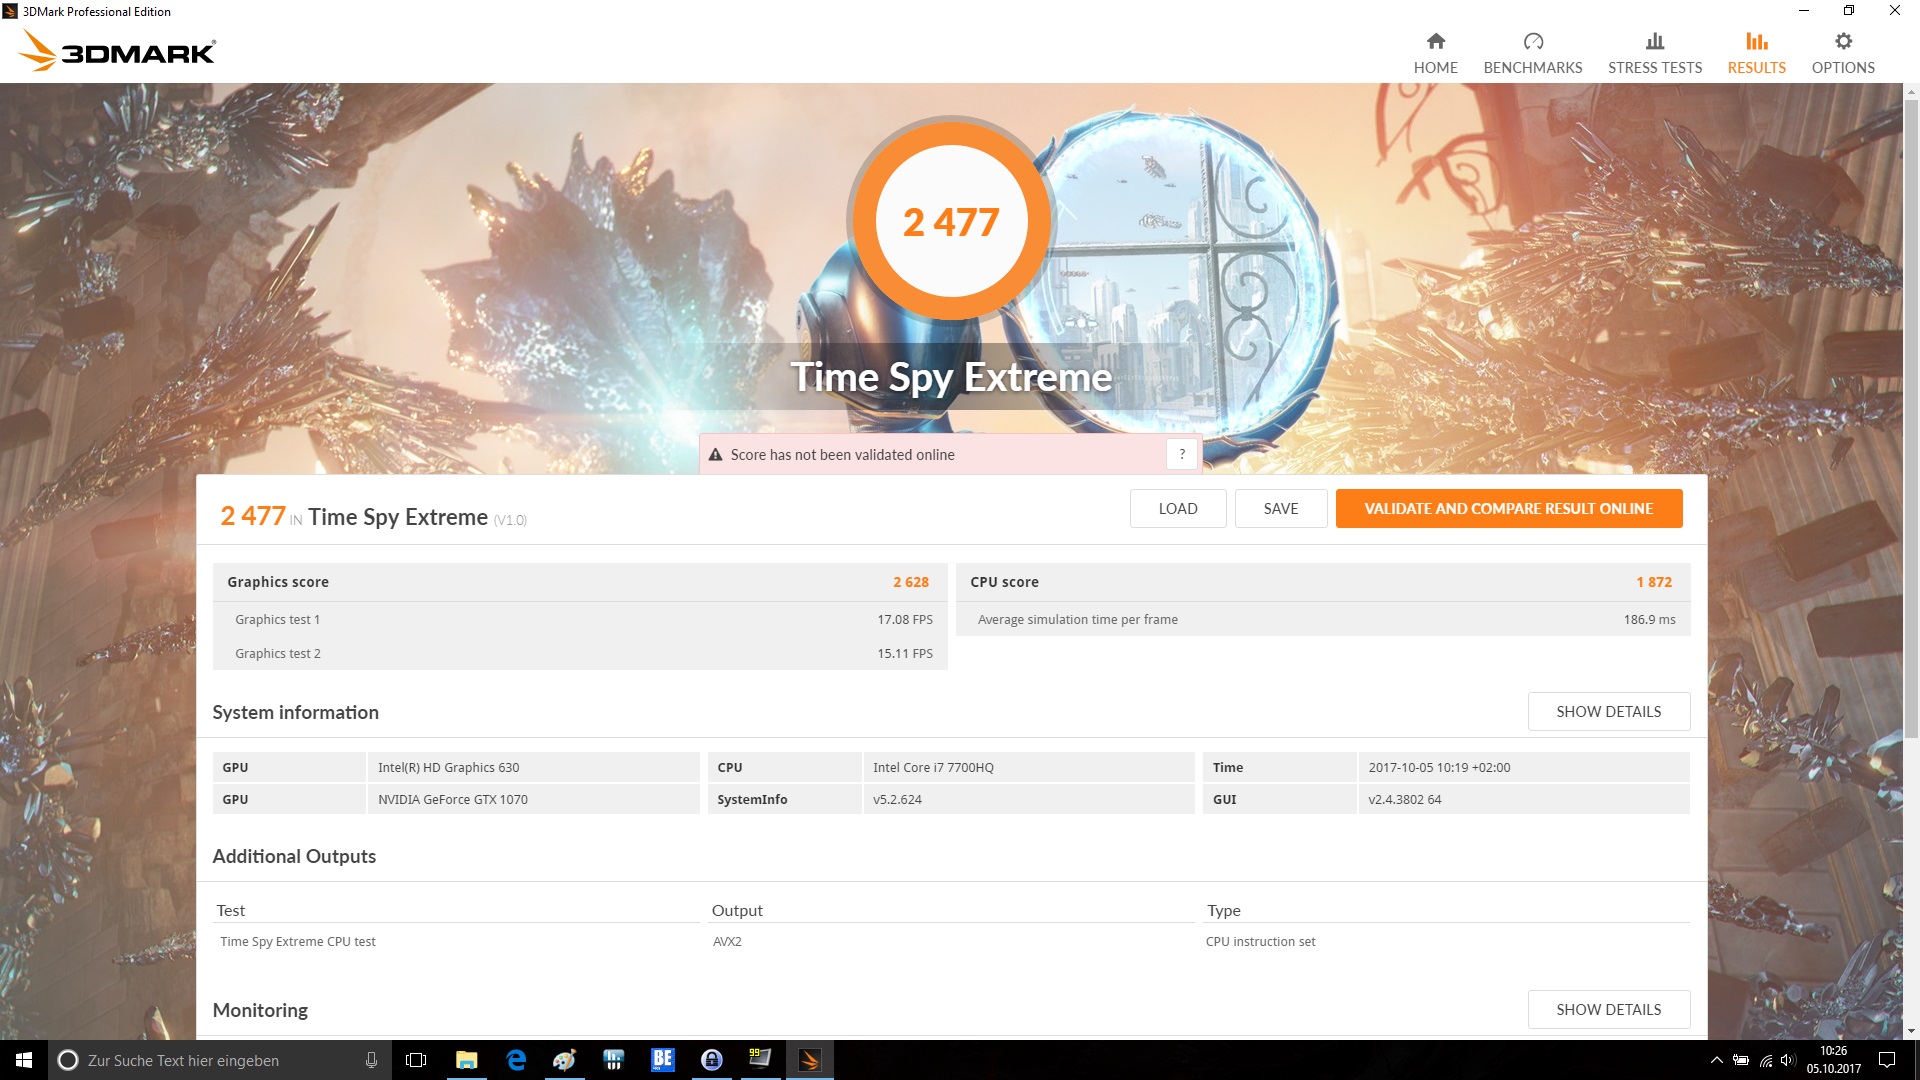
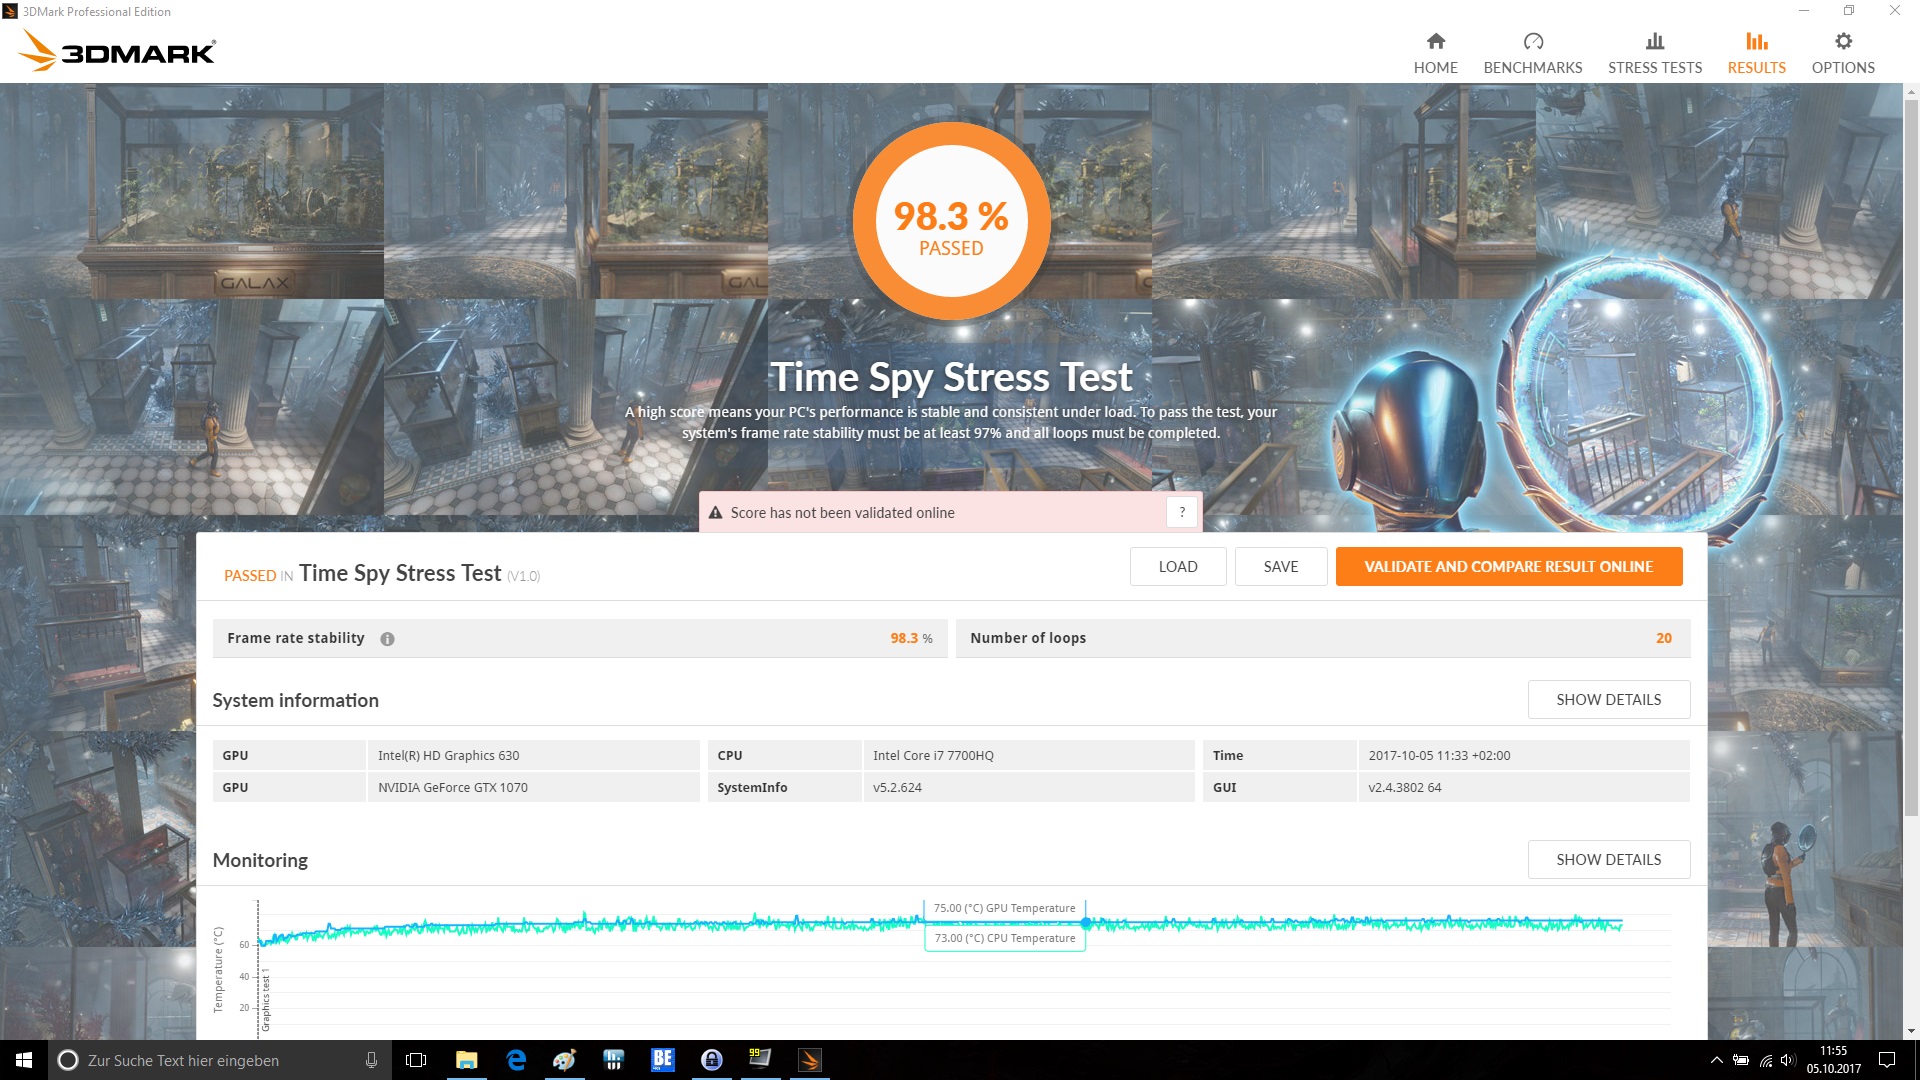
| 3DMark Time Spy Score | 5386 puntos | |
ayuda | ||
| The Witcher 3 - 1920x1080 Ultra Graphics & Postprocessing (HBAO+) | |
| Asus G752VS-BA338T | |
| Acer Predator 17 G9-793-70PJ | |
| MSI GE73VR 7RF Raider | |
| HP Omen 17-an014ng | |
| BioShock Infinite - 1920x1080 Ultra Preset, DX11 (DDOF) | |
| Asus G752VS-BA338T | |
| MSI GE73VR 7RF Raider | |
| MSI GT72VR 7RE-433 | |
| Gigabyte P57X v7 | |
| Rise of the Tomb Raider - 1920x1080 Very High Preset AA:FX AF:16x | |
| Asus G752VS-BA338T | |
| MSI GE73VR 7RF Raider | |
| HP Omen 17-an014ng | |
| Battlefield 1 - 1920x1080 Ultra Preset AA:T | |
| MSI GE73VR 7RF Raider | |
| MSI GT72VR 7RE-433 | |
| Battlefield 4 - 1920x1080 Ultra Preset AA:4x MS | |
| MSI GE73VR 7RF Raider | |
| MSI GT72VR 7RE-433 | |
| Deus Ex Mankind Divided - 1920x1080 Ultra Preset AA:2xMS AF:8x | |
| MSI GE73VR 7RF Raider | |
| MSI GT72VR 7RE-433 | |
| bajo | medio | alto | ultra | 4K | |
|---|---|---|---|---|---|
| BioShock Infinite (2013) | 267.3 | 233.7 | 217.3 | 135 | |
| Battlefield 4 (2013) | 199.9 | 199.9 | 199.5 | 154.2 | 72.6 |
| The Witcher 3 (2015) | 231.9 | 175.7 | 107.8 | 58.6 | 39.9 |
| Rise of the Tomb Raider (2016) | 218.5 | 176.2 | 111.4 | 91.4 | 38.1 |
| Deus Ex Mankind Divided (2016) | 139.8 | 129.7 | 84.5 | 45.9 | 28.5 |
| Battlefield 1 (2016) | 179.2 | 161.8 | 133.4 | 123.2 | 51.8 |
Ruido
| Ocioso |
| 33 / 34 / 39 dB(A) |
| HDD |
| 34 dB(A) |
| Carga |
| 47 / 54 dB(A) |
 | ||
30 dB silencioso 40 dB(A) audible 50 dB(A) ruidosamente alto |
||
min: | ||
| MSI GE73VR 7RF Raider GeForce GTX 1070 Mobile, i7-7700HQ | HP Omen 17-an014ng GeForce GTX 1070 Mobile, i7-7700HQ | Asus G752VS-BA338T GeForce GTX 1070 Mobile, i7-7700HQ | Gigabyte P57X v7 GeForce GTX 1070 Mobile, i7-7700HQ | Acer Predator 17 G9-793-70PJ GeForce GTX 1070 Mobile, i7-7700HQ | MSI GT72VR 7RE-433 GeForce GTX 1070 Mobile, i7-7700HQ | |
|---|---|---|---|---|---|---|
| Noise | 1% | 8% | 7% | 4% | 6% | |
| apagado / medio ambiente * (dB) | 30 | 30 -0% | 30 -0% | 29 3% | 31 -3% | 31 -3% |
| Idle Minimum * (dB) | 33 | 30 9% | 30 9% | 30.4 8% | 32 3% | 34 -3% |
| Idle Average * (dB) | 34 | 37 -9% | 32 6% | 32.1 6% | 35 -3% | 35 -3% |
| Idle Maximum * (dB) | 39 | 39 -0% | 36 8% | 32.1 18% | 38 3% | 37 5% |
| Load Average * (dB) | 47 | 44 6% | 43 9% | 45.6 3% | 42 11% | 37 21% |
| Witcher 3 ultra * (dB) | 49 | 47 4% | 43 12% | 44 10% | ||
| Load Maximum * (dB) | 54 | 55 -2% | 49 9% | 51.5 5% | 50 7% | 44 19% |
* ... más pequeño es mejor
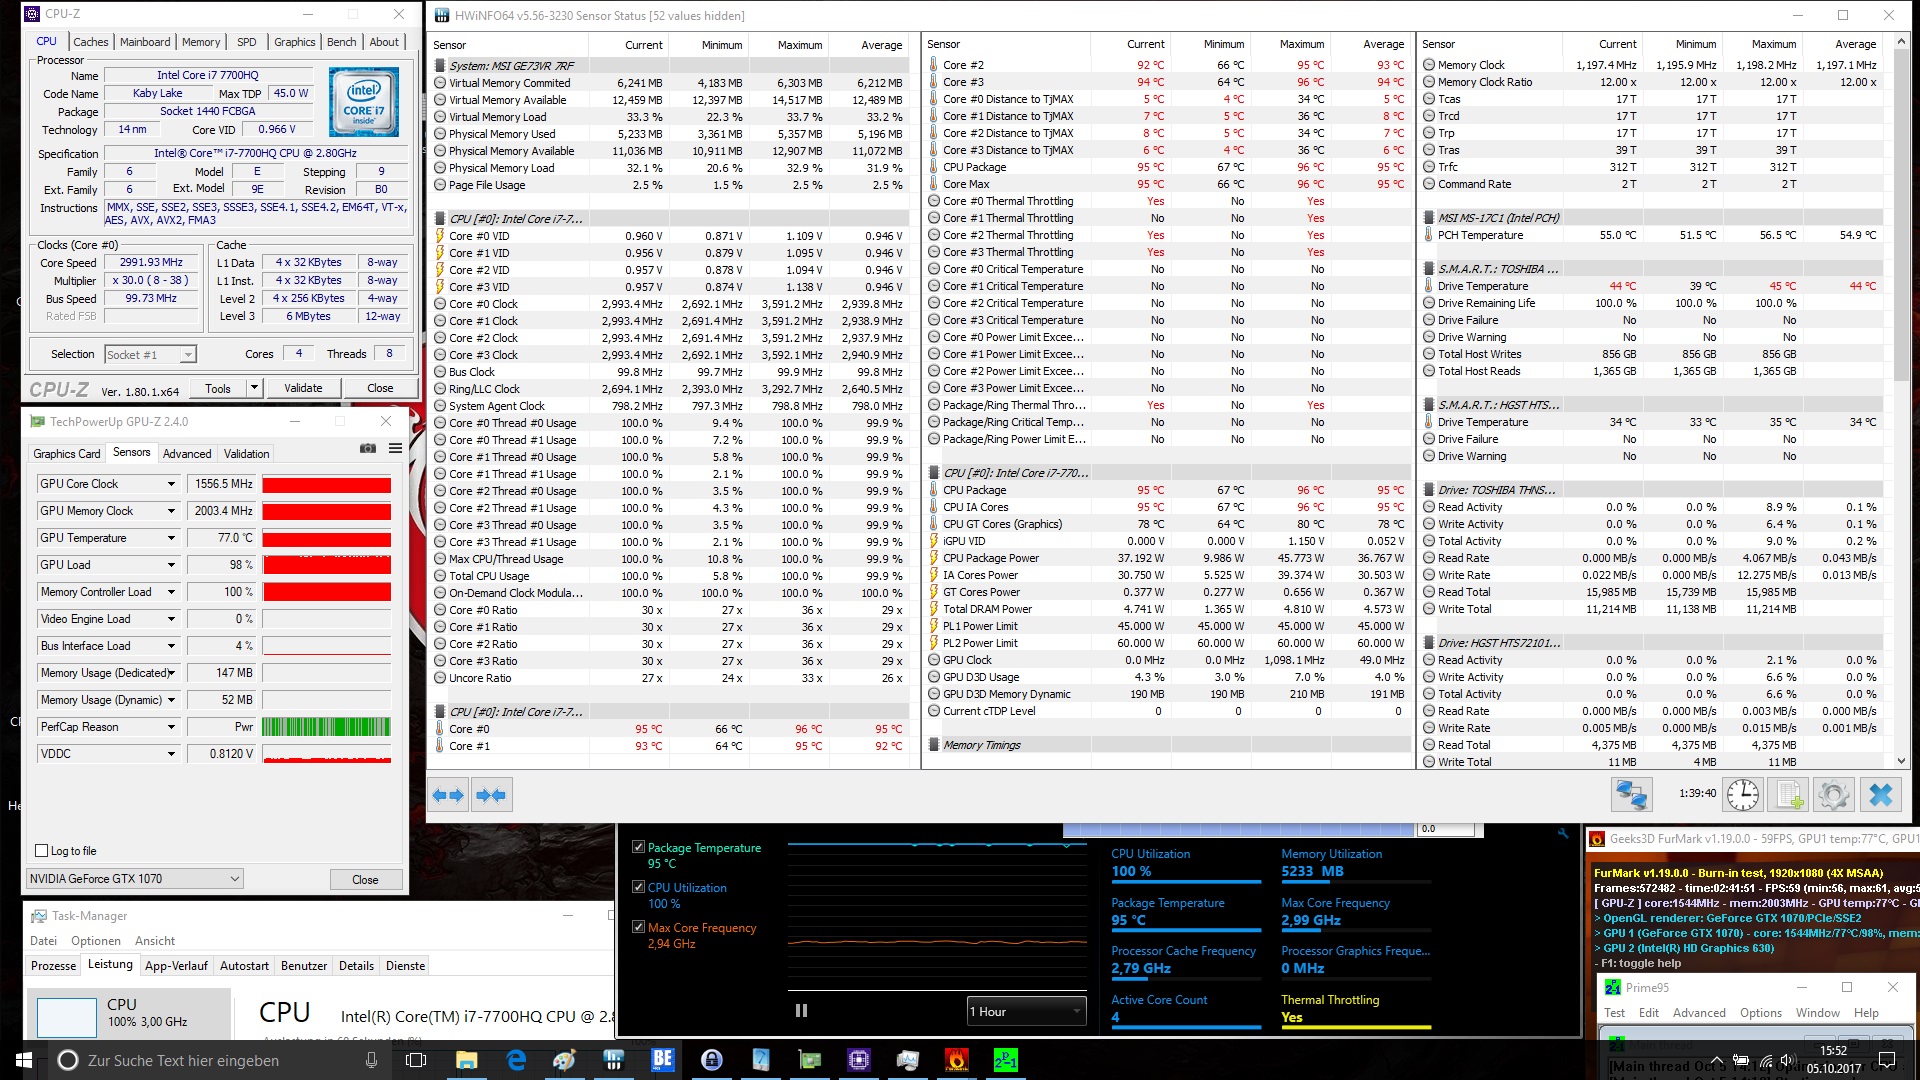
(-) La temperatura máxima en la parte superior es de 48 °C / 118 F, frente a la media de 40.4 °C / 105 F, que oscila entre 21.2 y 68.8 °C para la clase Gaming.
(-) El fondo se calienta hasta un máximo de 49 °C / 120 F, frente a la media de 43.2 °C / 110 F
(+) En reposo, la temperatura media de la parte superior es de 24.3 °C / 76# F, frente a la media del dispositivo de 33.9 °C / 93 F.
(±) Jugando a The Witcher 3, la temperatura media de la parte superior es de 37.9 °C / 100 F, frente a la media del dispositivo de 33.9 °C / 93 F.
(+) El reposamanos y el panel táctil están a una temperatura inferior a la de la piel, con un máximo de 31 °C / 87.8 F y, por tanto, son fríos al tacto.
(-) La temperatura media de la zona del reposamanos de dispositivos similares fue de 28.8 °C / 83.8 F (-2.2 °C / -4 F).
| MSI GE73VR 7RF Raider i7-7700HQ, GeForce GTX 1070 Mobile | HP Omen 17-an014ng i7-7700HQ, GeForce GTX 1070 Mobile | Asus G752VS-BA338T i7-7700HQ, GeForce GTX 1070 Mobile | Gigabyte P57X v7 i7-7700HQ, GeForce GTX 1070 Mobile | Acer Predator 17 G9-793-70PJ i7-7700HQ, GeForce GTX 1070 Mobile | MSI GT72VR 7RE-433 i7-7700HQ, GeForce GTX 1070 Mobile | |
|---|---|---|---|---|---|---|
| Heat | -23% | 4% | -13% | 5% | 2% | |
| Maximum Upper Side * (°C) | 48 | 48 -0% | 41 15% | 51.2 -7% | 39.1 19% | 41.5 14% |
| Maximum Bottom * (°C) | 49 | 54 -10% | 39.3 20% | 56.8 -16% | 42.1 14% | 50.6 -3% |
| Idle Upper Side * (°C) | 25 | 35 -40% | 28.8 -15% | 29.2 -17% | 27.9 -12% | 26.4 -6% |
| Idle Bottom * (°C) | 26 | 37 -42% | 27.3 -5% | 29.2 -12% | 26.1 -0% | 25.4 2% |
* ... más pequeño es mejor
MSI GE73VR 7RF Raider análisis de audio
(+) | los altavoces pueden reproducir a un volumen relativamente alto (#93 dB)
Graves 100 - 315 Hz
(-) | casi sin bajos - de media 18.5% inferior a la mediana
(+) | el bajo es lineal (6.3% delta a la frecuencia anterior)
Medios 400 - 2000 Hz
(±) | medios reducidos - de media 5.4% inferior a la mediana
(+) | los medios son lineales (5.5% delta a la frecuencia anterior)
Altos 2 - 16 kHz
(+) | máximos equilibrados - a sólo 2.5% de la mediana
(+) | los máximos son lineales (3.1% delta a la frecuencia anterior)
Total 100 - 16.000 Hz
(+) | el sonido global es lineal (14.3% de diferencia con la mediana)
En comparación con la misma clase
» 26% de todos los dispositivos probados de esta clase eran mejores, 7% similares, 67% peores
» El mejor tuvo un delta de 6%, la media fue 18%, el peor fue ###max##%
En comparación con todos los dispositivos probados
» 17% de todos los dispositivos probados eran mejores, 4% similares, 79% peores
» El mejor tuvo un delta de 4%, la media fue 24%, el peor fue ###max##%
Asus G752VS-BA338T análisis de audio
(±) | la sonoridad del altavoz es media pero buena (80 dB)
Graves 100 - 315 Hz
(±) | lubina reducida - en promedio 9.4% inferior a la mediana
(±) | la linealidad de los graves es media (11.1% delta a frecuencia anterior)
Medios 400 - 2000 Hz
(+) | medios equilibrados - a sólo 4.2% de la mediana
(+) | los medios son lineales (6% delta a la frecuencia anterior)
Altos 2 - 16 kHz
(±) | máximos reducidos - de media 7.7% inferior a la mediana
(±) | la linealidad de los máximos es media (10% delta a frecuencia anterior)
Total 100 - 16.000 Hz
(±) | la linealidad del sonido global es media (21.2% de diferencia con la mediana)
En comparación con la misma clase
» 76% de todos los dispositivos probados de esta clase eran mejores, 4% similares, 19% peores
» El mejor tuvo un delta de 6%, la media fue 18%, el peor fue ###max##%
En comparación con todos los dispositivos probados
» 59% de todos los dispositivos probados eran mejores, 7% similares, 34% peores
» El mejor tuvo un delta de 4%, la media fue 24%, el peor fue ###max##%
| Off / Standby | |
| Ocioso | |
| Carga |
|
Clave:
min: | |
| MSI GE73VR 7RF Raider i7-7700HQ, GeForce GTX 1070 Mobile | HP Omen 17-an014ng i7-7700HQ, GeForce GTX 1070 Mobile | Asus G752VS-BA338T i7-7700HQ, GeForce GTX 1070 Mobile | Gigabyte P57X v7 i7-7700HQ, GeForce GTX 1070 Mobile | Acer Predator 17 G9-793-70PJ i7-7700HQ, GeForce GTX 1070 Mobile | MSI GT72VR 7RE-433 i7-7700HQ, GeForce GTX 1070 Mobile | |
|---|---|---|---|---|---|---|
| Power Consumption | -31% | -25% | -34% | -43% | -28% | |
| Idle Minimum * (Watt) | 10 | 22 -120% | 21 -110% | 15.7 -57% | 23 -130% | 20 -100% |
| Idle Average * (Watt) | 18 | 28 -56% | 27 -50% | 23.4 -30% | 33 -83% | 27 -50% |
| Idle Maximum * (Watt) | 26 | 35 -35% | 32 -23% | 23.5 10% | 40 -54% | 31 -19% |
| Load Average * (Watt) | 97 | 93 4% | 86 11% | 184.6 -90% | 94 3% | 86 11% |
| Witcher 3 ultra * (Watt) | 183 | 157 14% | 165 10% | 177 3% | ||
| Load Maximum * (Watt) | 230 | 208 10% | 206 10% | 233.1 -1% | 228 1% | 184 20% |
* ... más pequeño es mejor

| MSI GE73VR 7RF Raider i7-7700HQ, GeForce GTX 1070 Mobile, 51 Wh | HP Omen 17-an014ng i7-7700HQ, GeForce GTX 1070 Mobile, 86 Wh | Asus G752VS-BA338T i7-7700HQ, GeForce GTX 1070 Mobile, 90 Wh | Gigabyte P57X v7 i7-7700HQ, GeForce GTX 1070 Mobile, 75.81 Wh | Acer Predator 17 G9-793-70PJ i7-7700HQ, GeForce GTX 1070 Mobile, 88 Wh | MSI GT72VR 7RE-433 i7-7700HQ, GeForce GTX 1070 Mobile, 83 Wh | |
|---|---|---|---|---|---|---|
| Duración de Batería | 43% | 62% | 31% | 42% | 35% | |
| Reader / Idle (h) | 4.4 | 5.8 32% | 7.4 68% | 4.3 -2% | 5.4 23% | 5.3 20% |
| H.264 (h) | 3.4 | 4.3 26% | 4.3 26% | 3.8 12% | ||
| WiFi v1.3 (h) | 4 | 4.5 13% | 4.9 23% | 2.6 -35% | 3.6 -10% | 3.8 -5% |
| Load (h) | 0.7 | 1.4 100% | 1.6 129% | 1.6 129% | 1.5 114% | 1.5 114% |
Pro
Contra
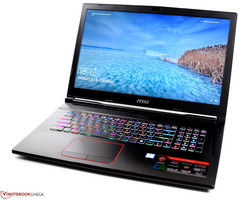
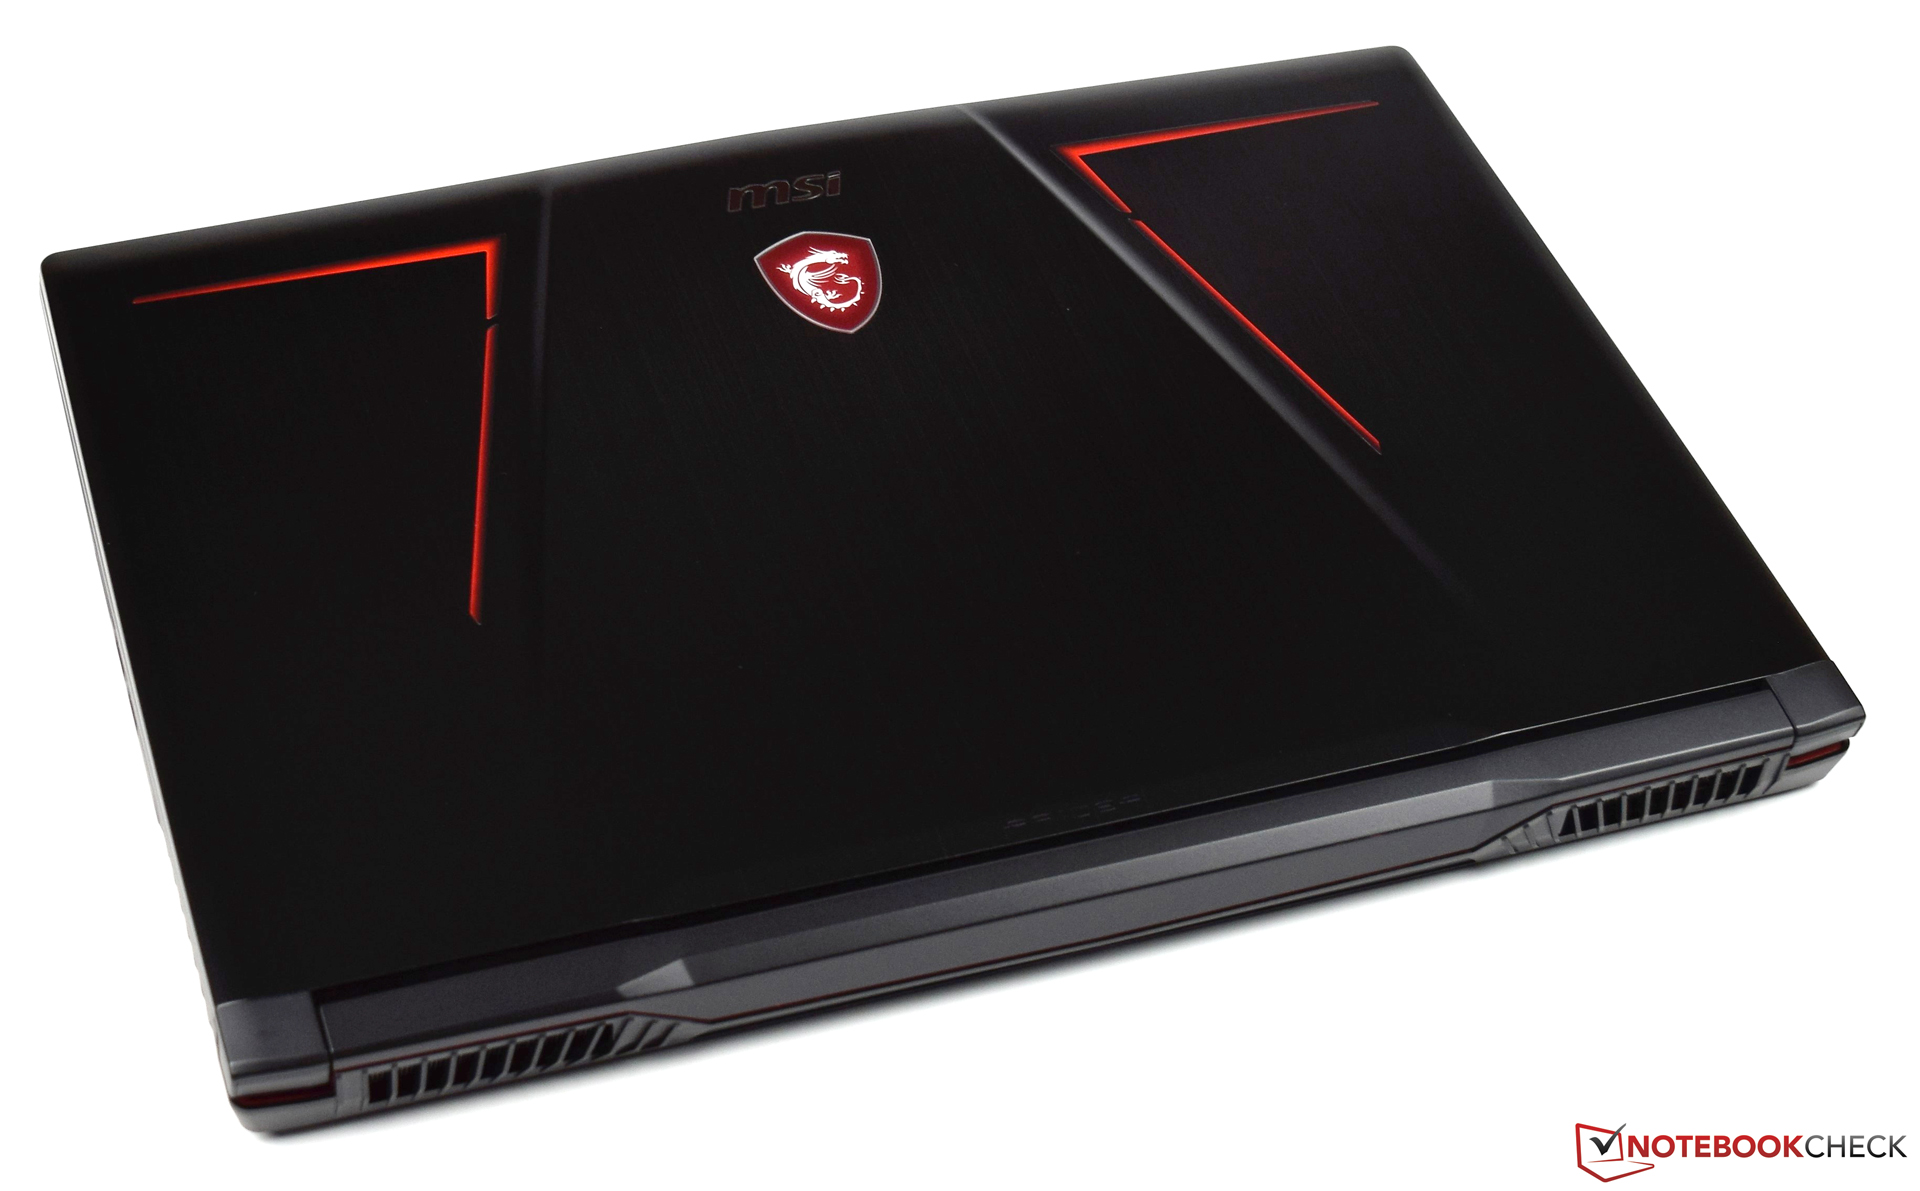
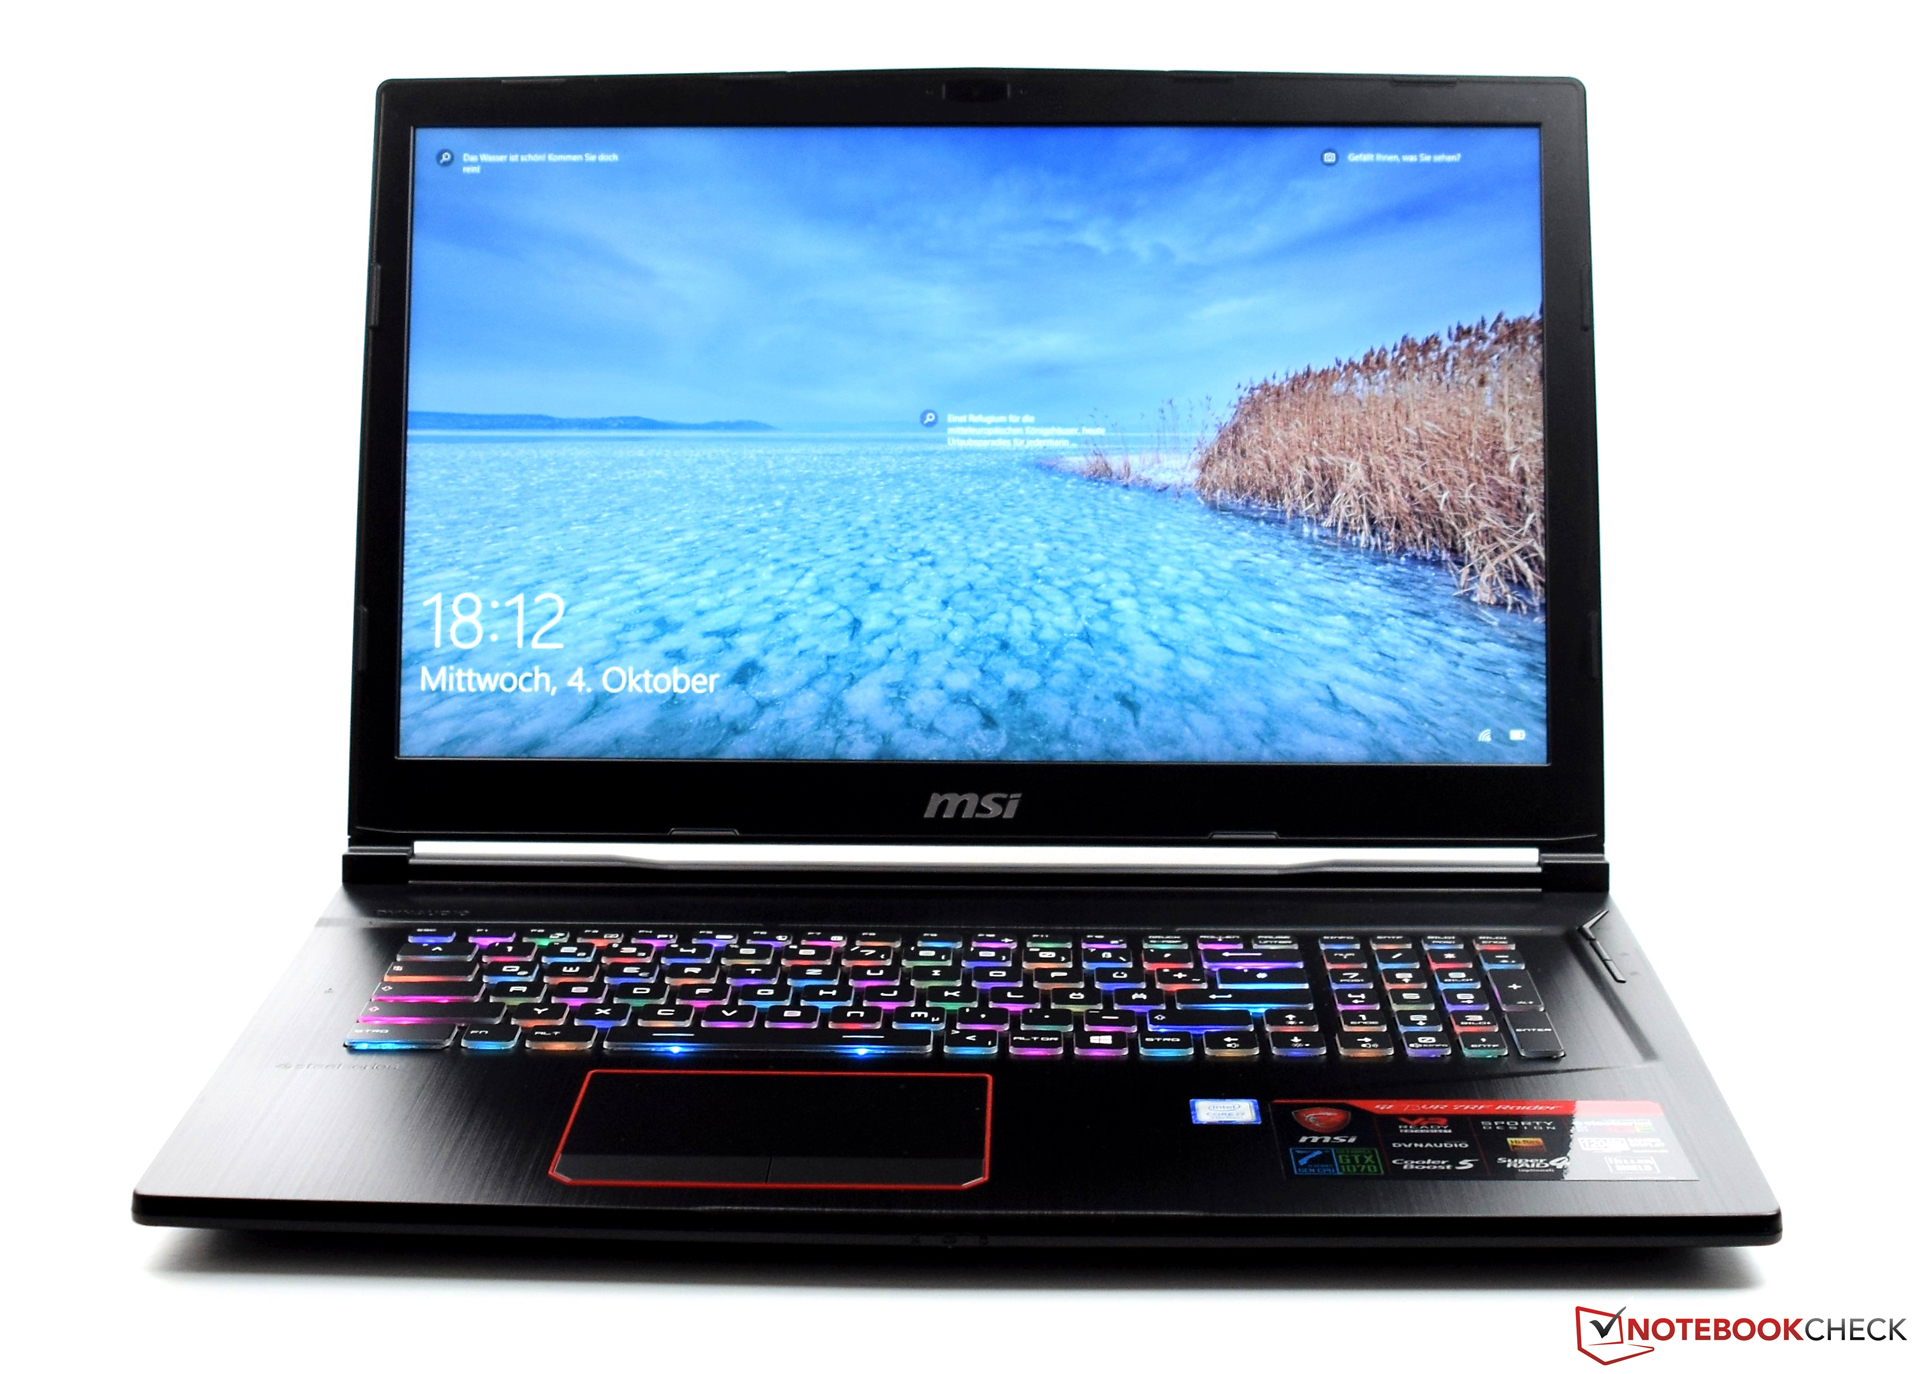
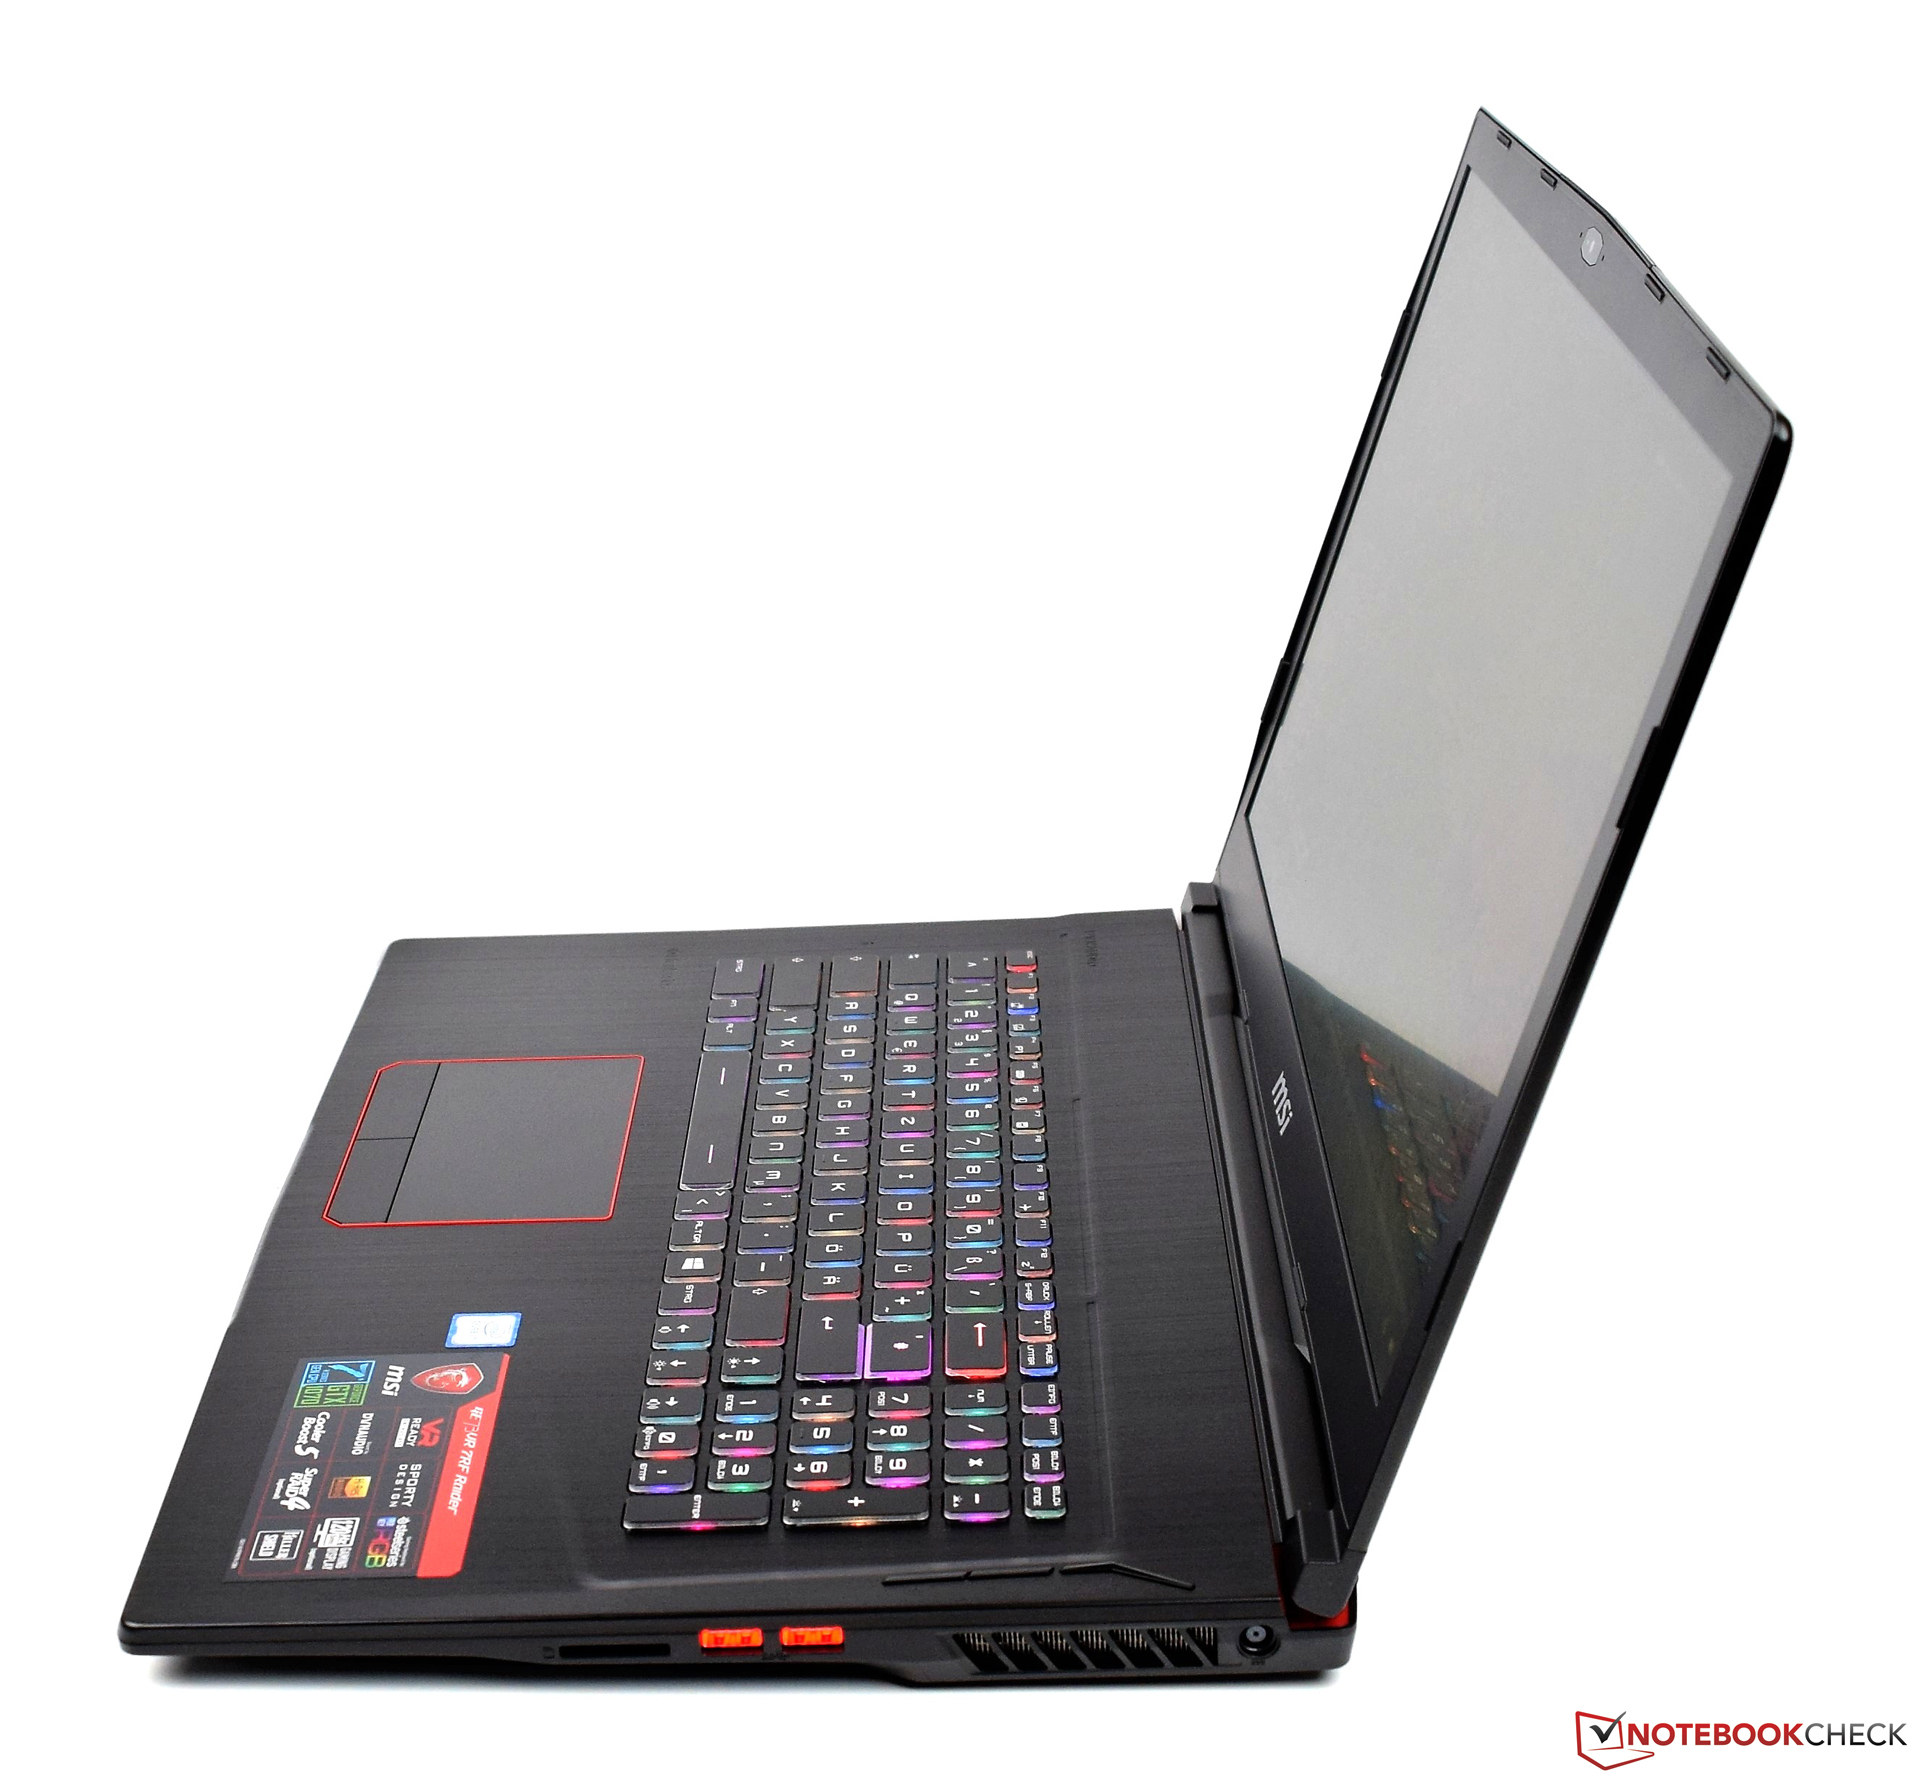
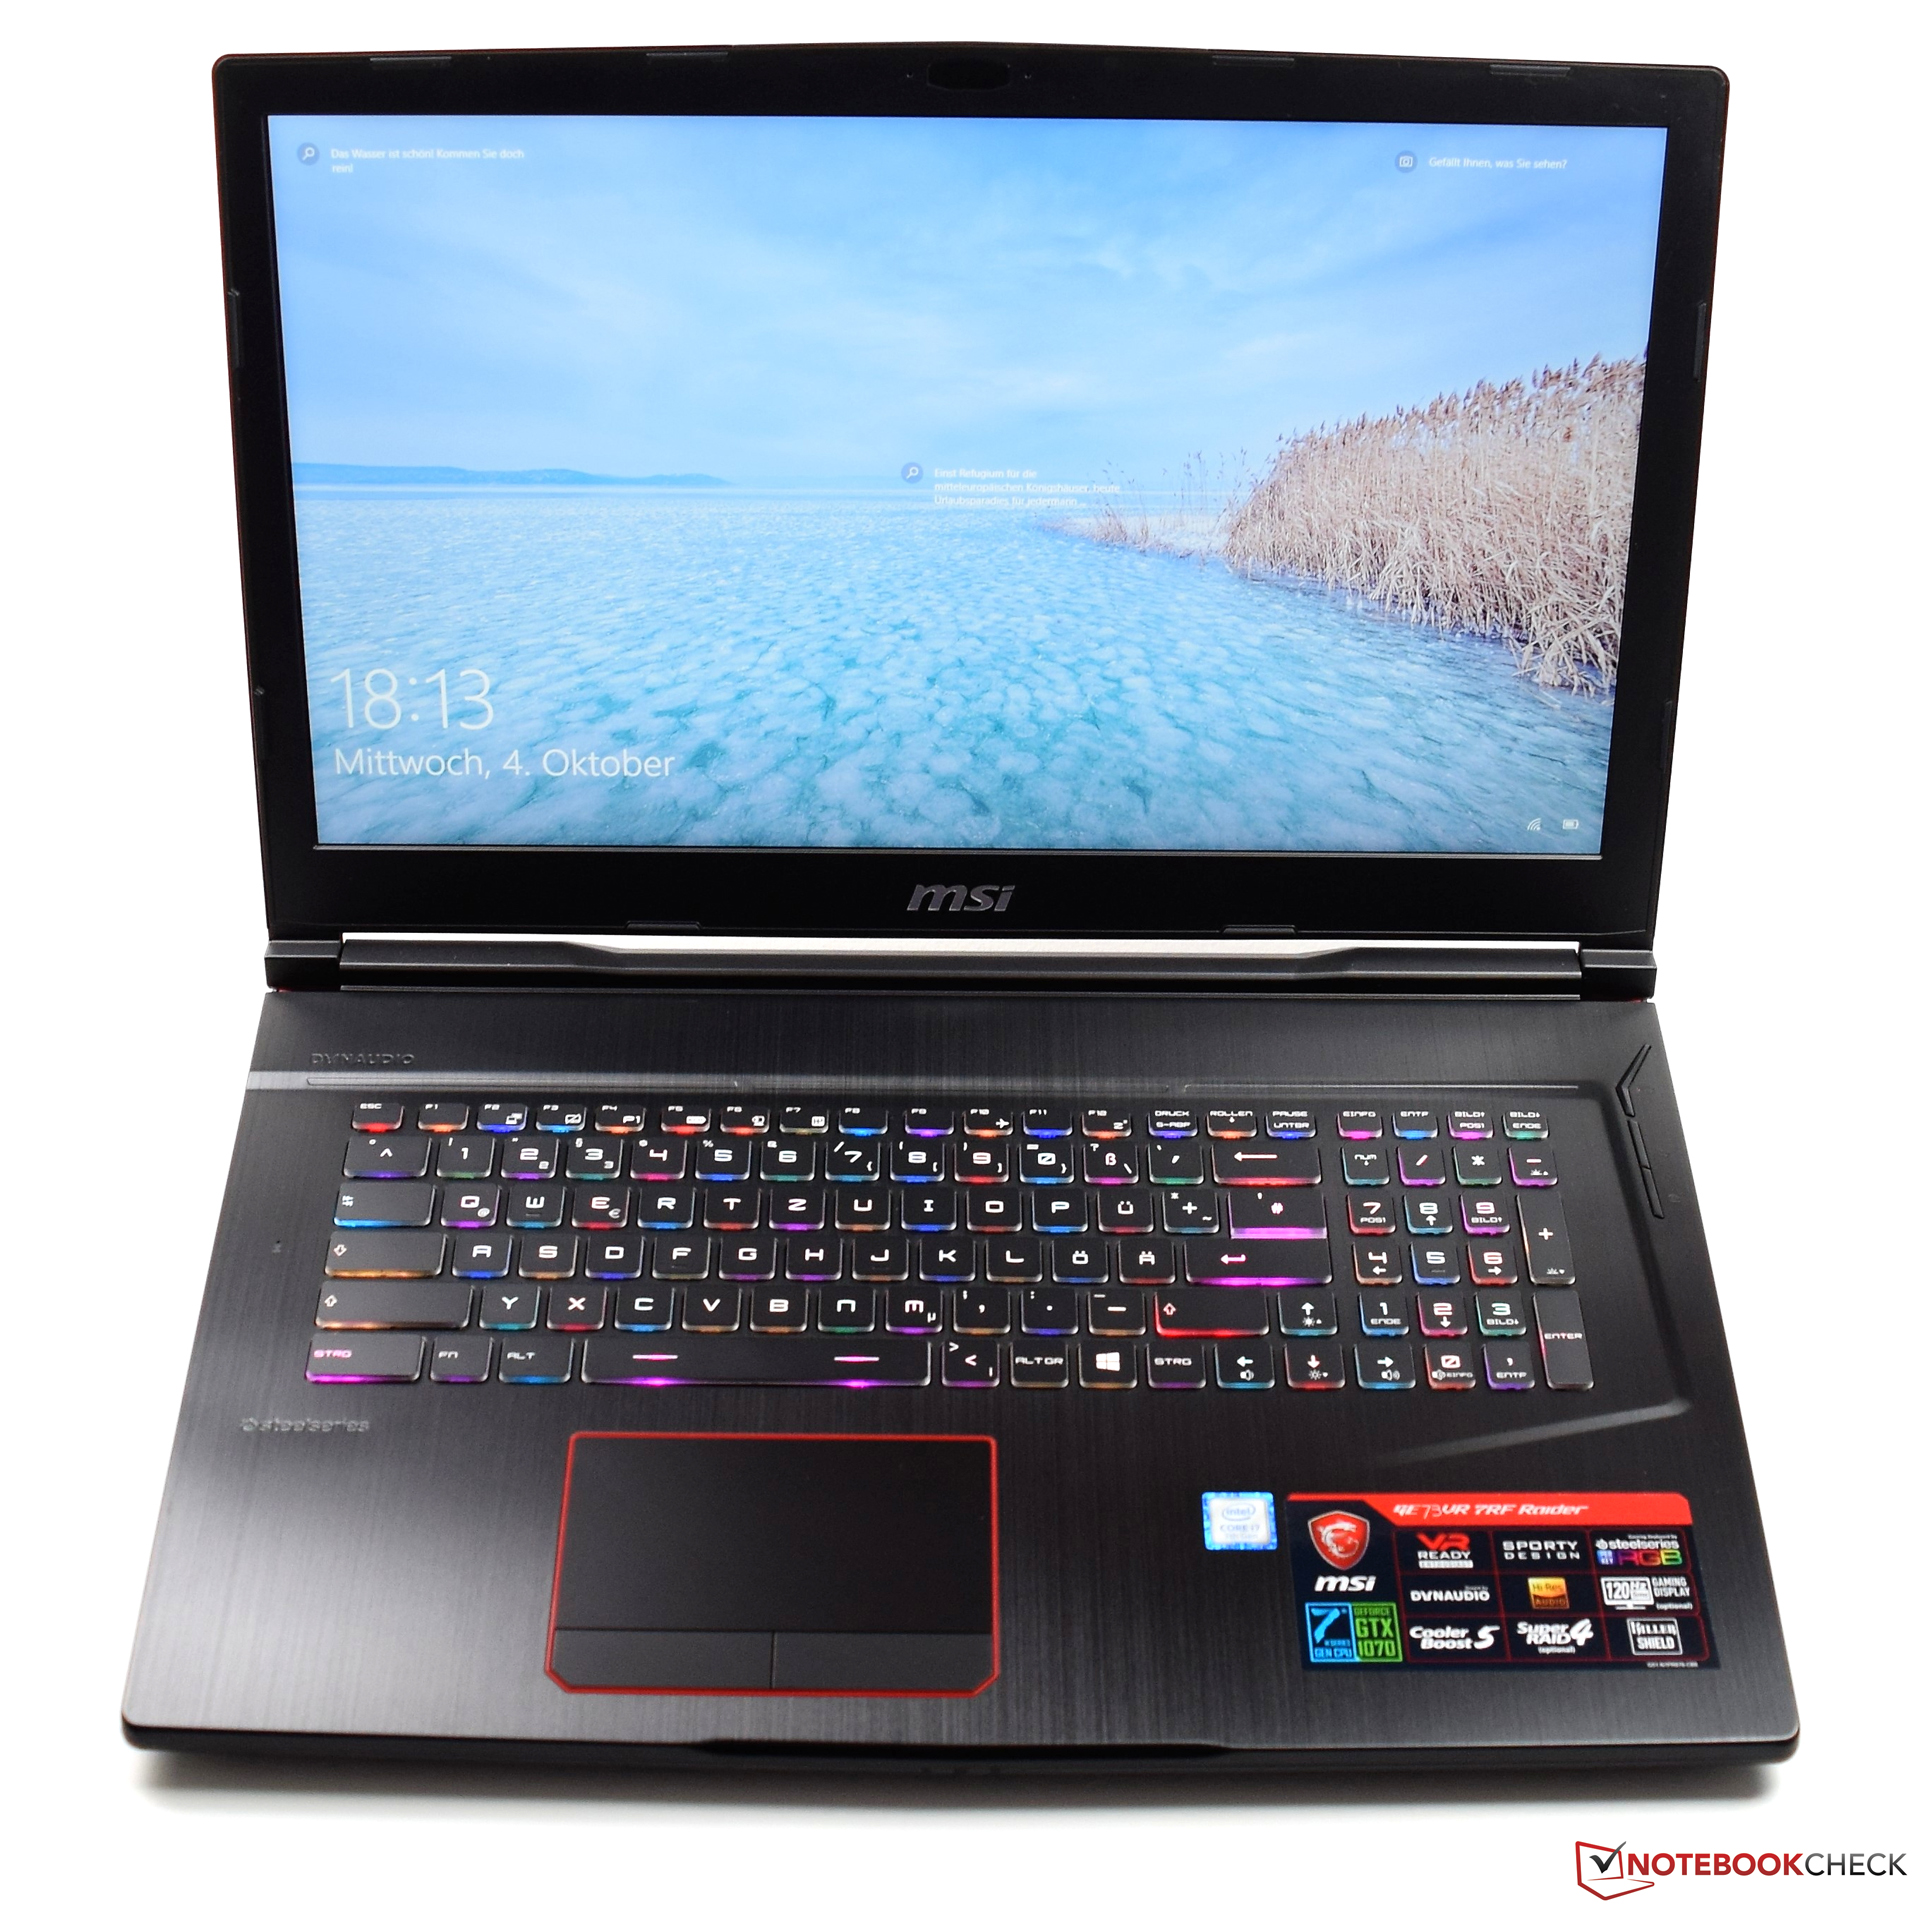
No cabe duda, el MSI GE73VR 7RF Raider es un portátil gaming. Juntos, la veloz Intel Core i7-7700HQ y la Nvidia GeForce GTX 1070 ofrecen una base genial para jugar. También nos gusta el display, que acelera los corazones de los gamers con una alta cobertura de espacio de color y 120 Hz. Por esta configuración del dispositivo, el fabricante pide 1999 Euros, algo similar al precio de otros dispositivos comparables.
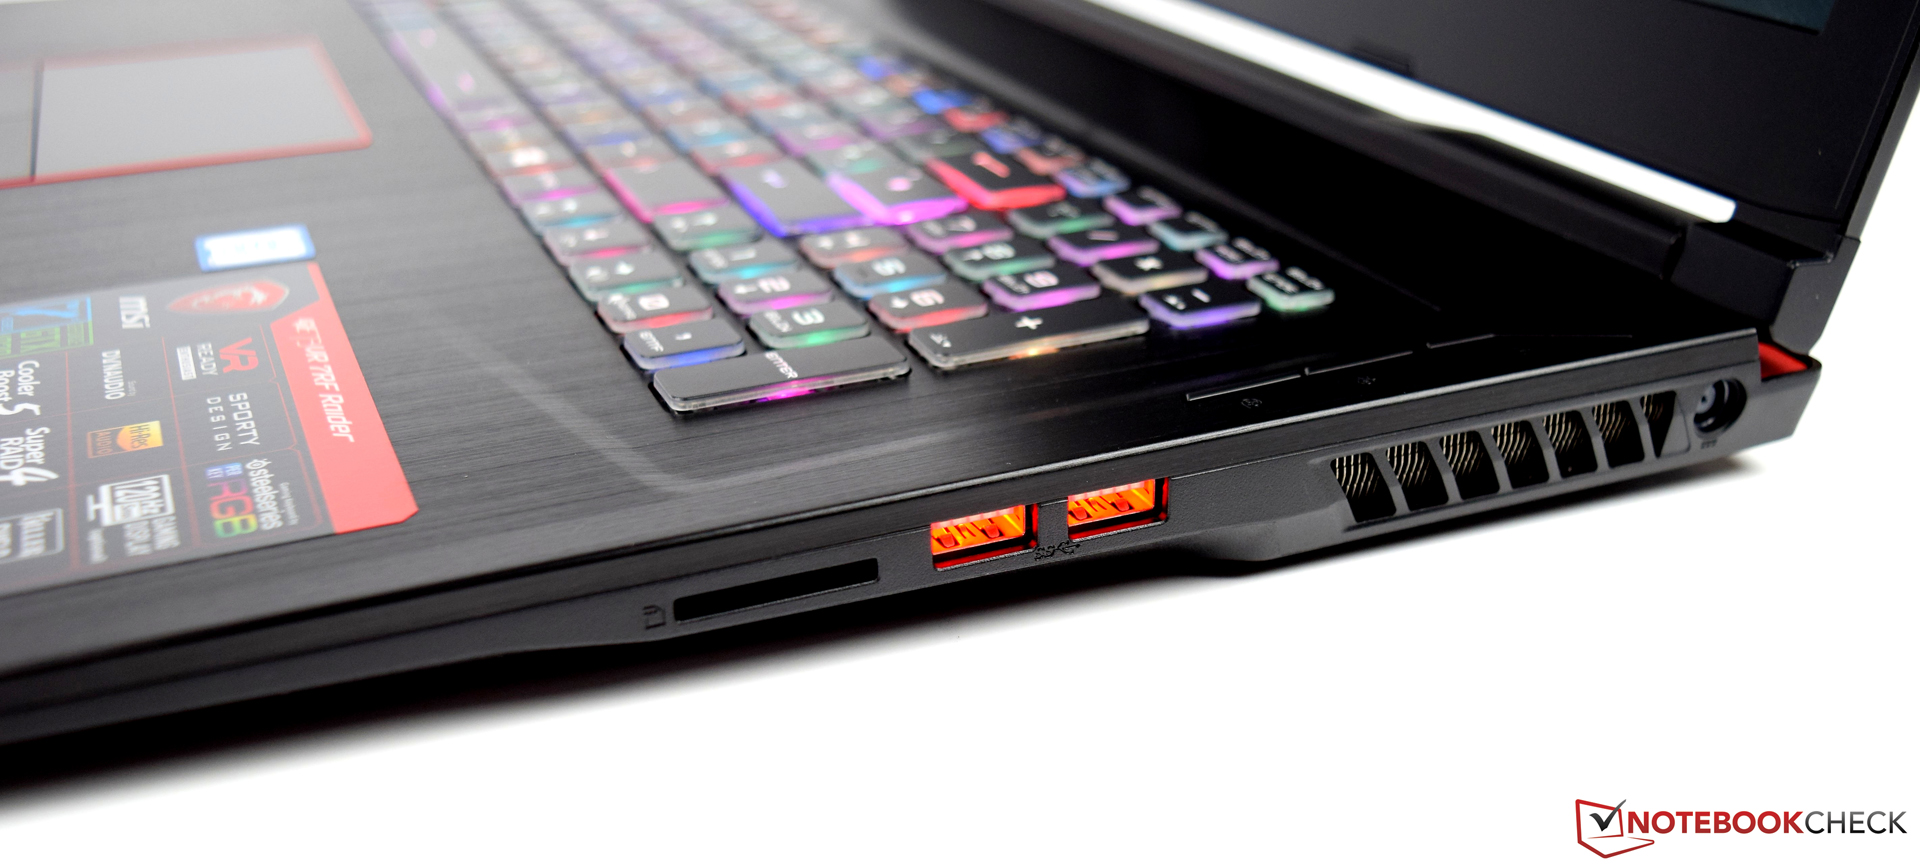
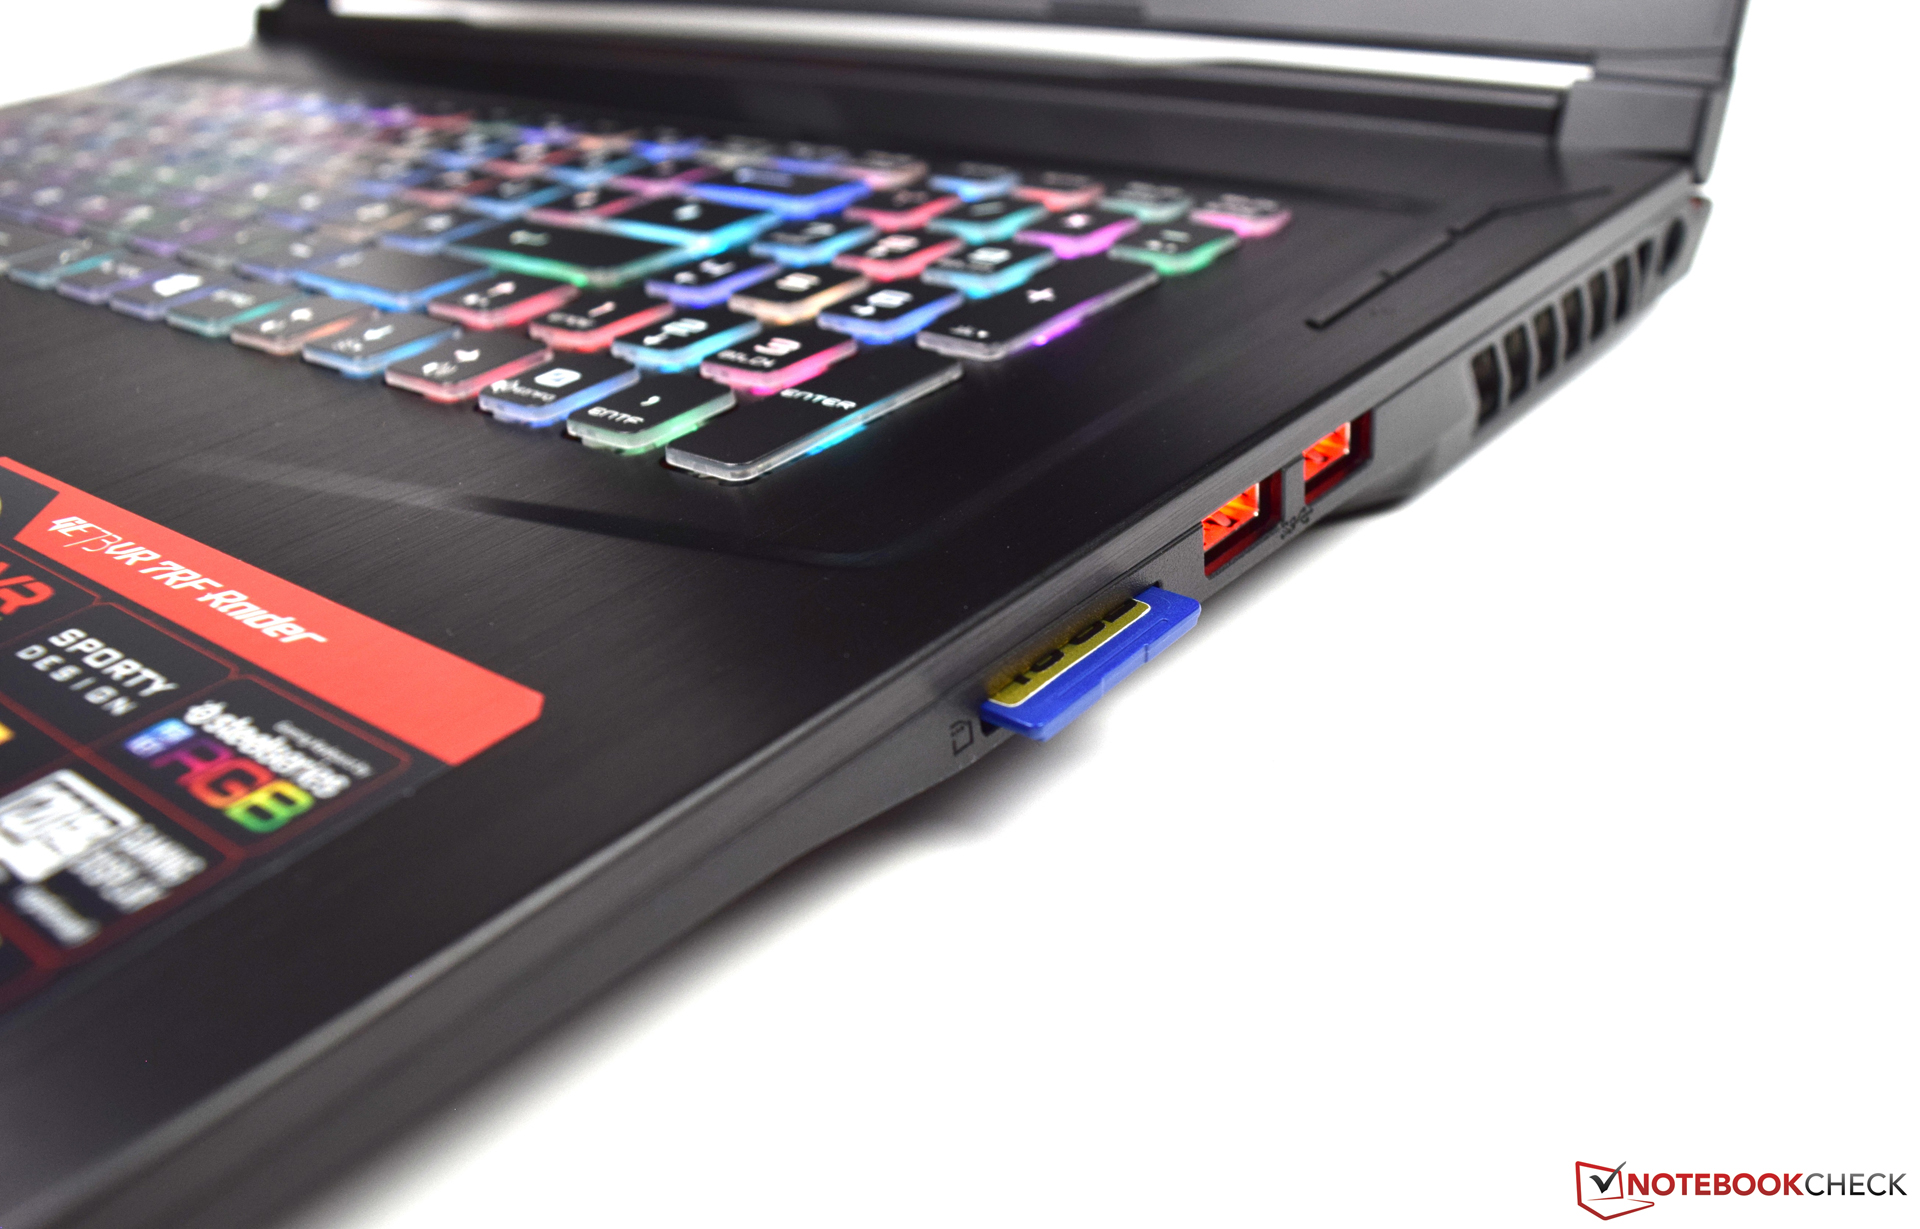
El MSI GE73VR 7RF Raider ofrece una base buenísima para cumplir con las altas exigencias de los gamers a la larga. El teclado de gran calidad hace una buenísima labor y es llama mucho la atención con sus luces coloridas.
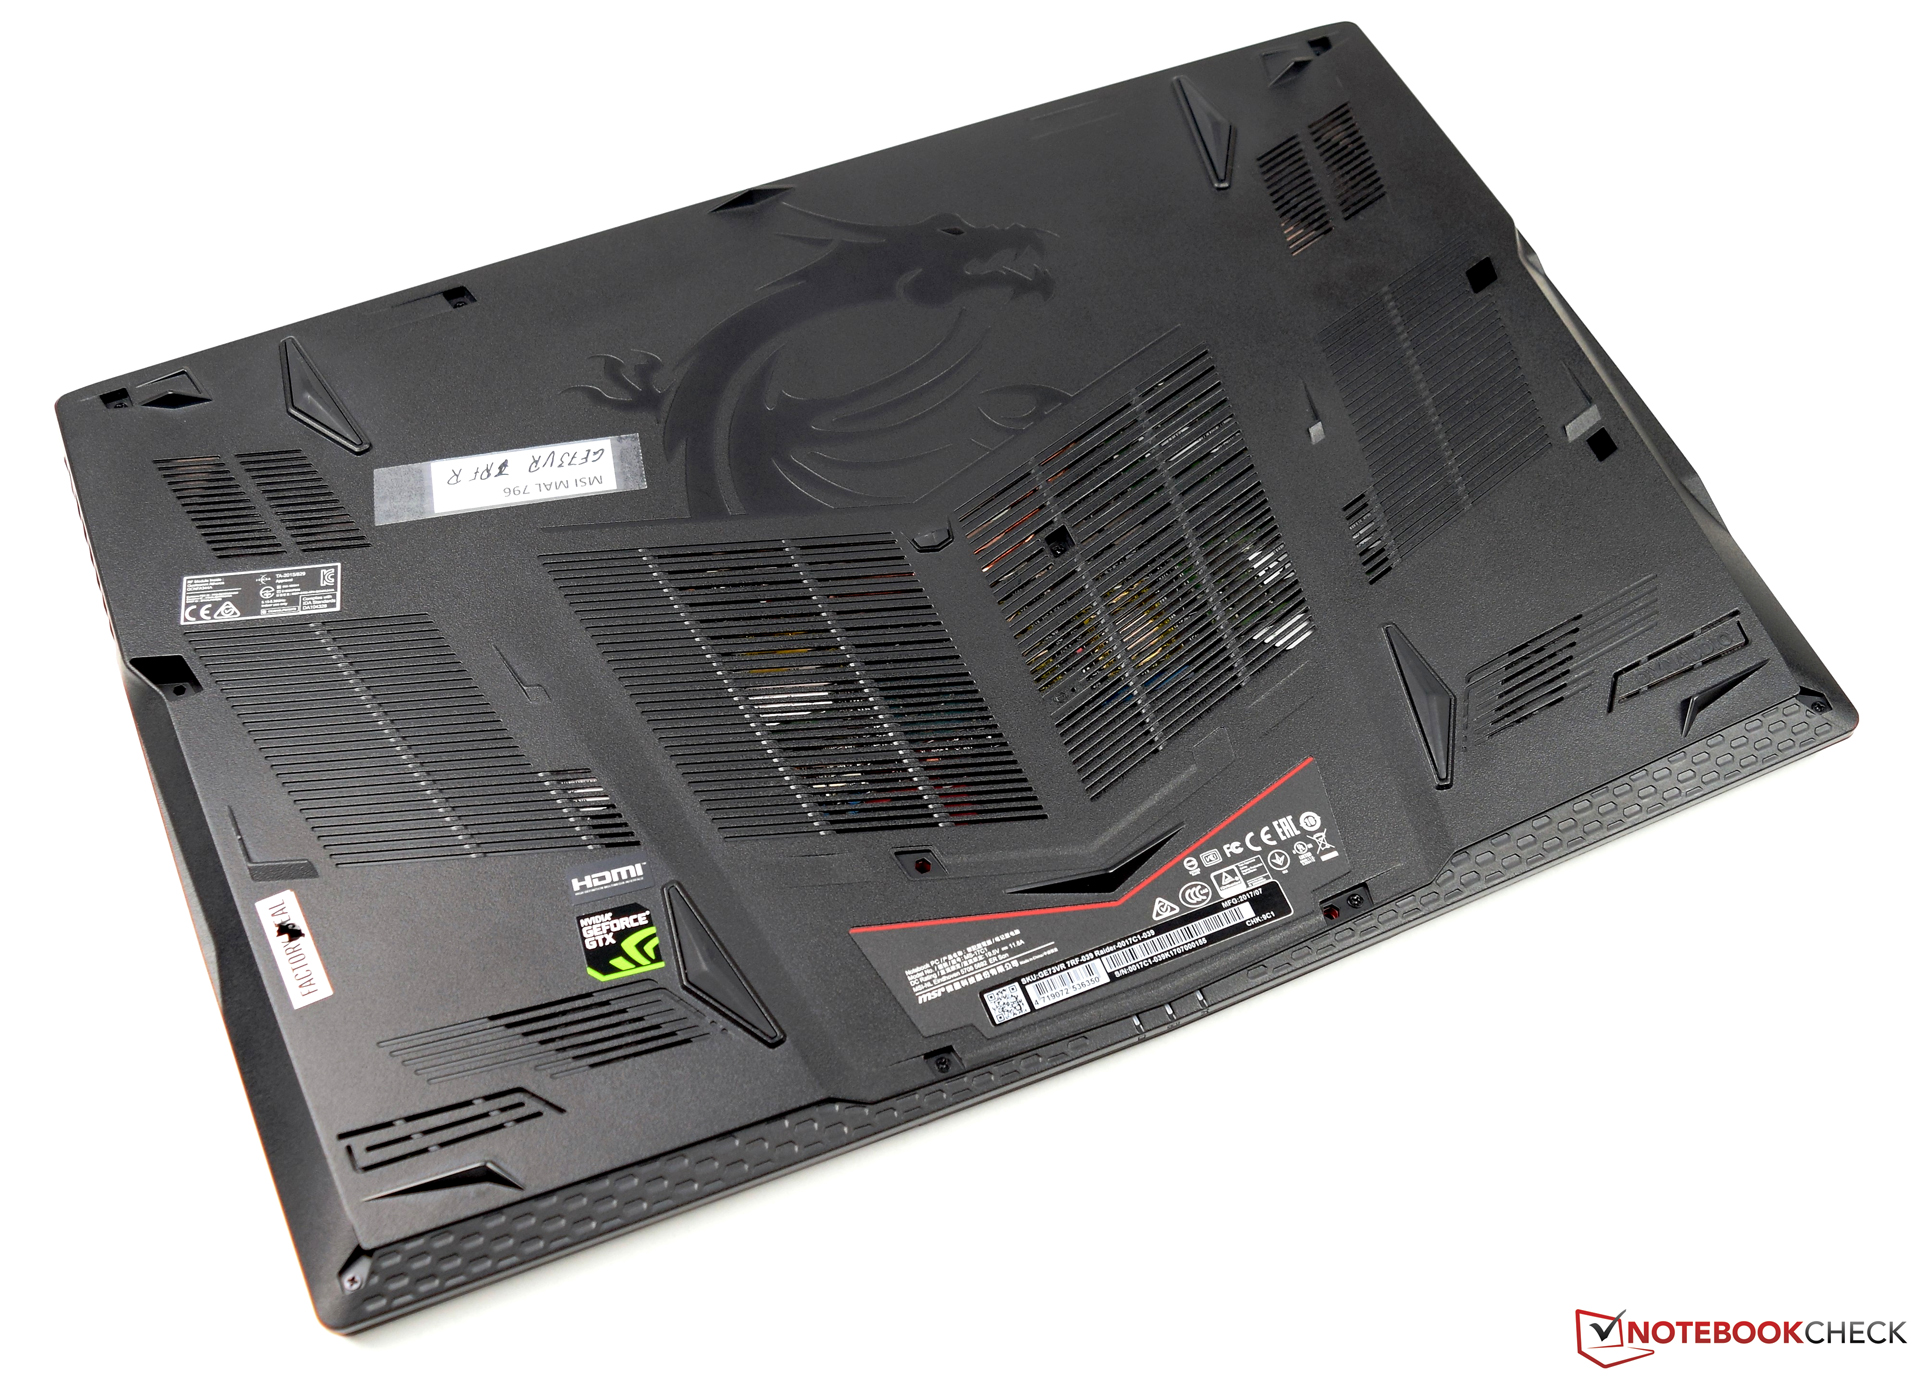
Además de las cualidades positivas que incluyen el bajo consumo de energía, en algunas cosas el MSI GE73VR 7RF Raider también merece cierta crítica. Habríamos preferido que el SSD que usara la conexión PCIe bastante más rápida para poder usar todo el rendimiento del adaptador M.2. El aguante de batería también nos causa sentimientos encontrados, ya que no pudo convencer en la comparativa. Pero dado que es un portátil puramente gaming, esto no debería ser lo más importante a la hora de decidir comprarlo. Por último, en general podemos decir que con el GE73VR 7RF Raider, MSI tiene un portátil gaming buenísimo en un segmento caliente del mercado.
Ésta es una versión acortada del análisis original. Puedes leer el análisis completo en inglés aquí.
MSI GE73VR 7RF Raider
- 10/12/2017 v6 (old)
Sebastian Bade