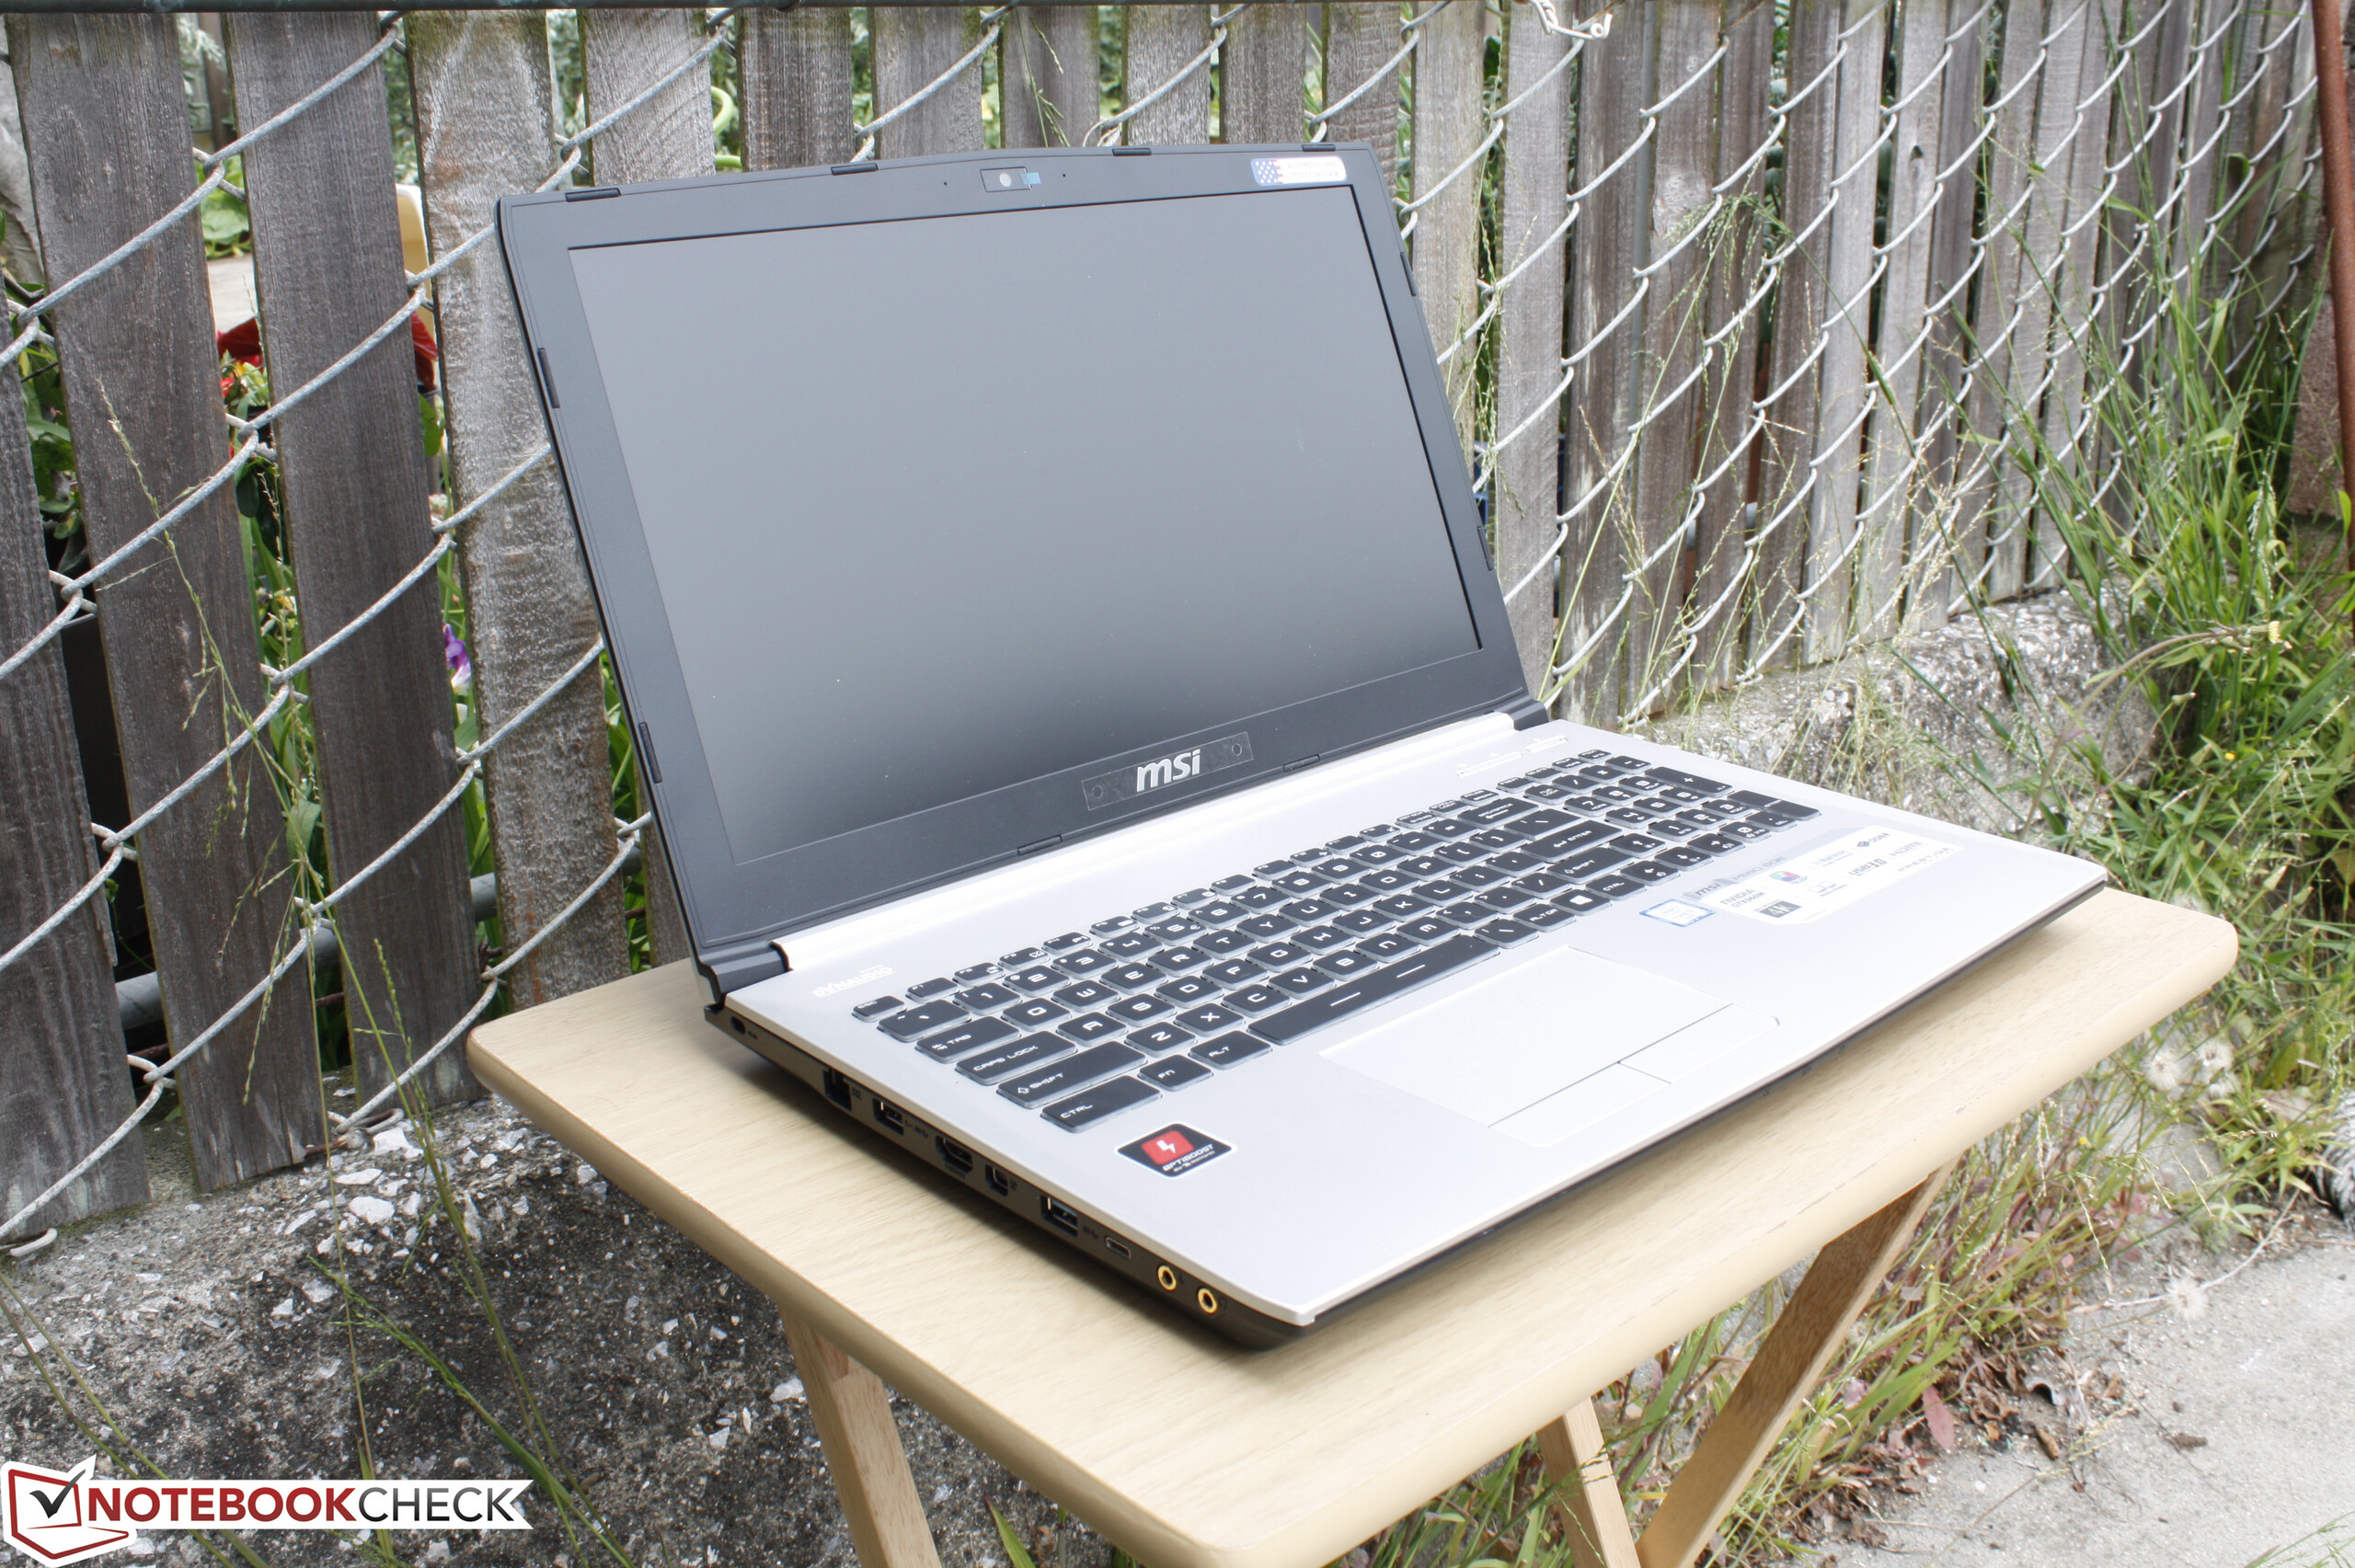
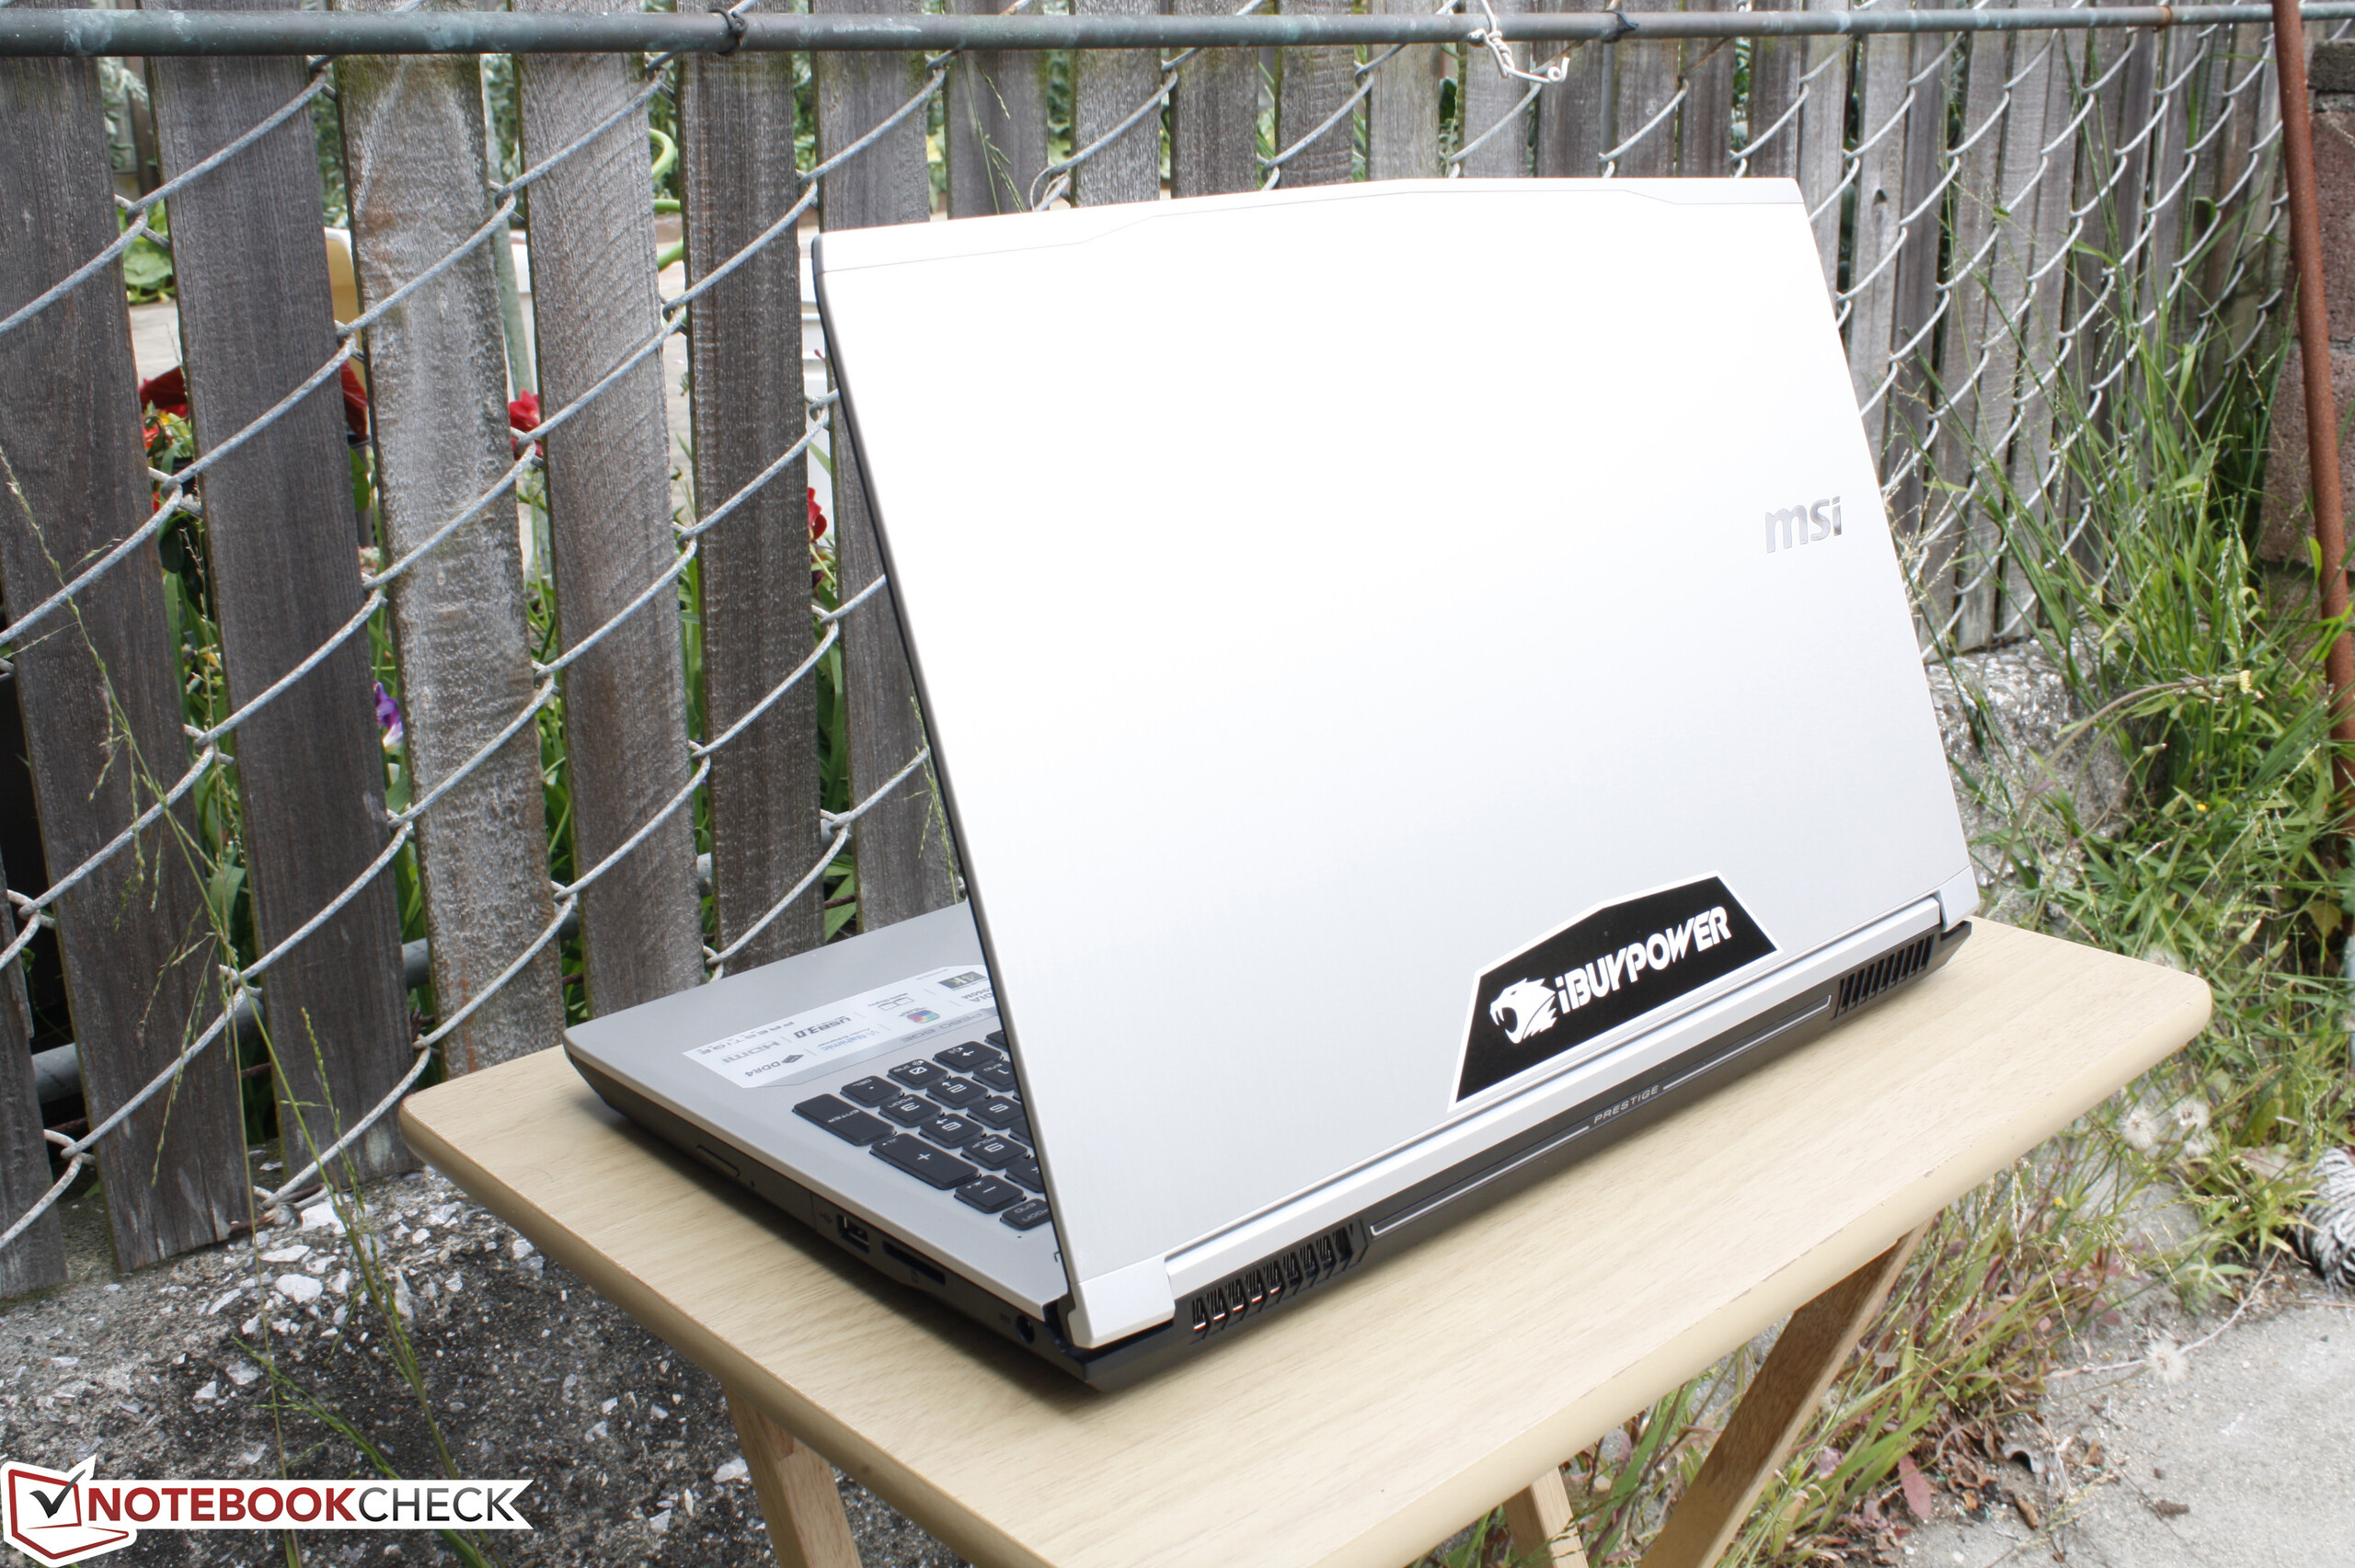
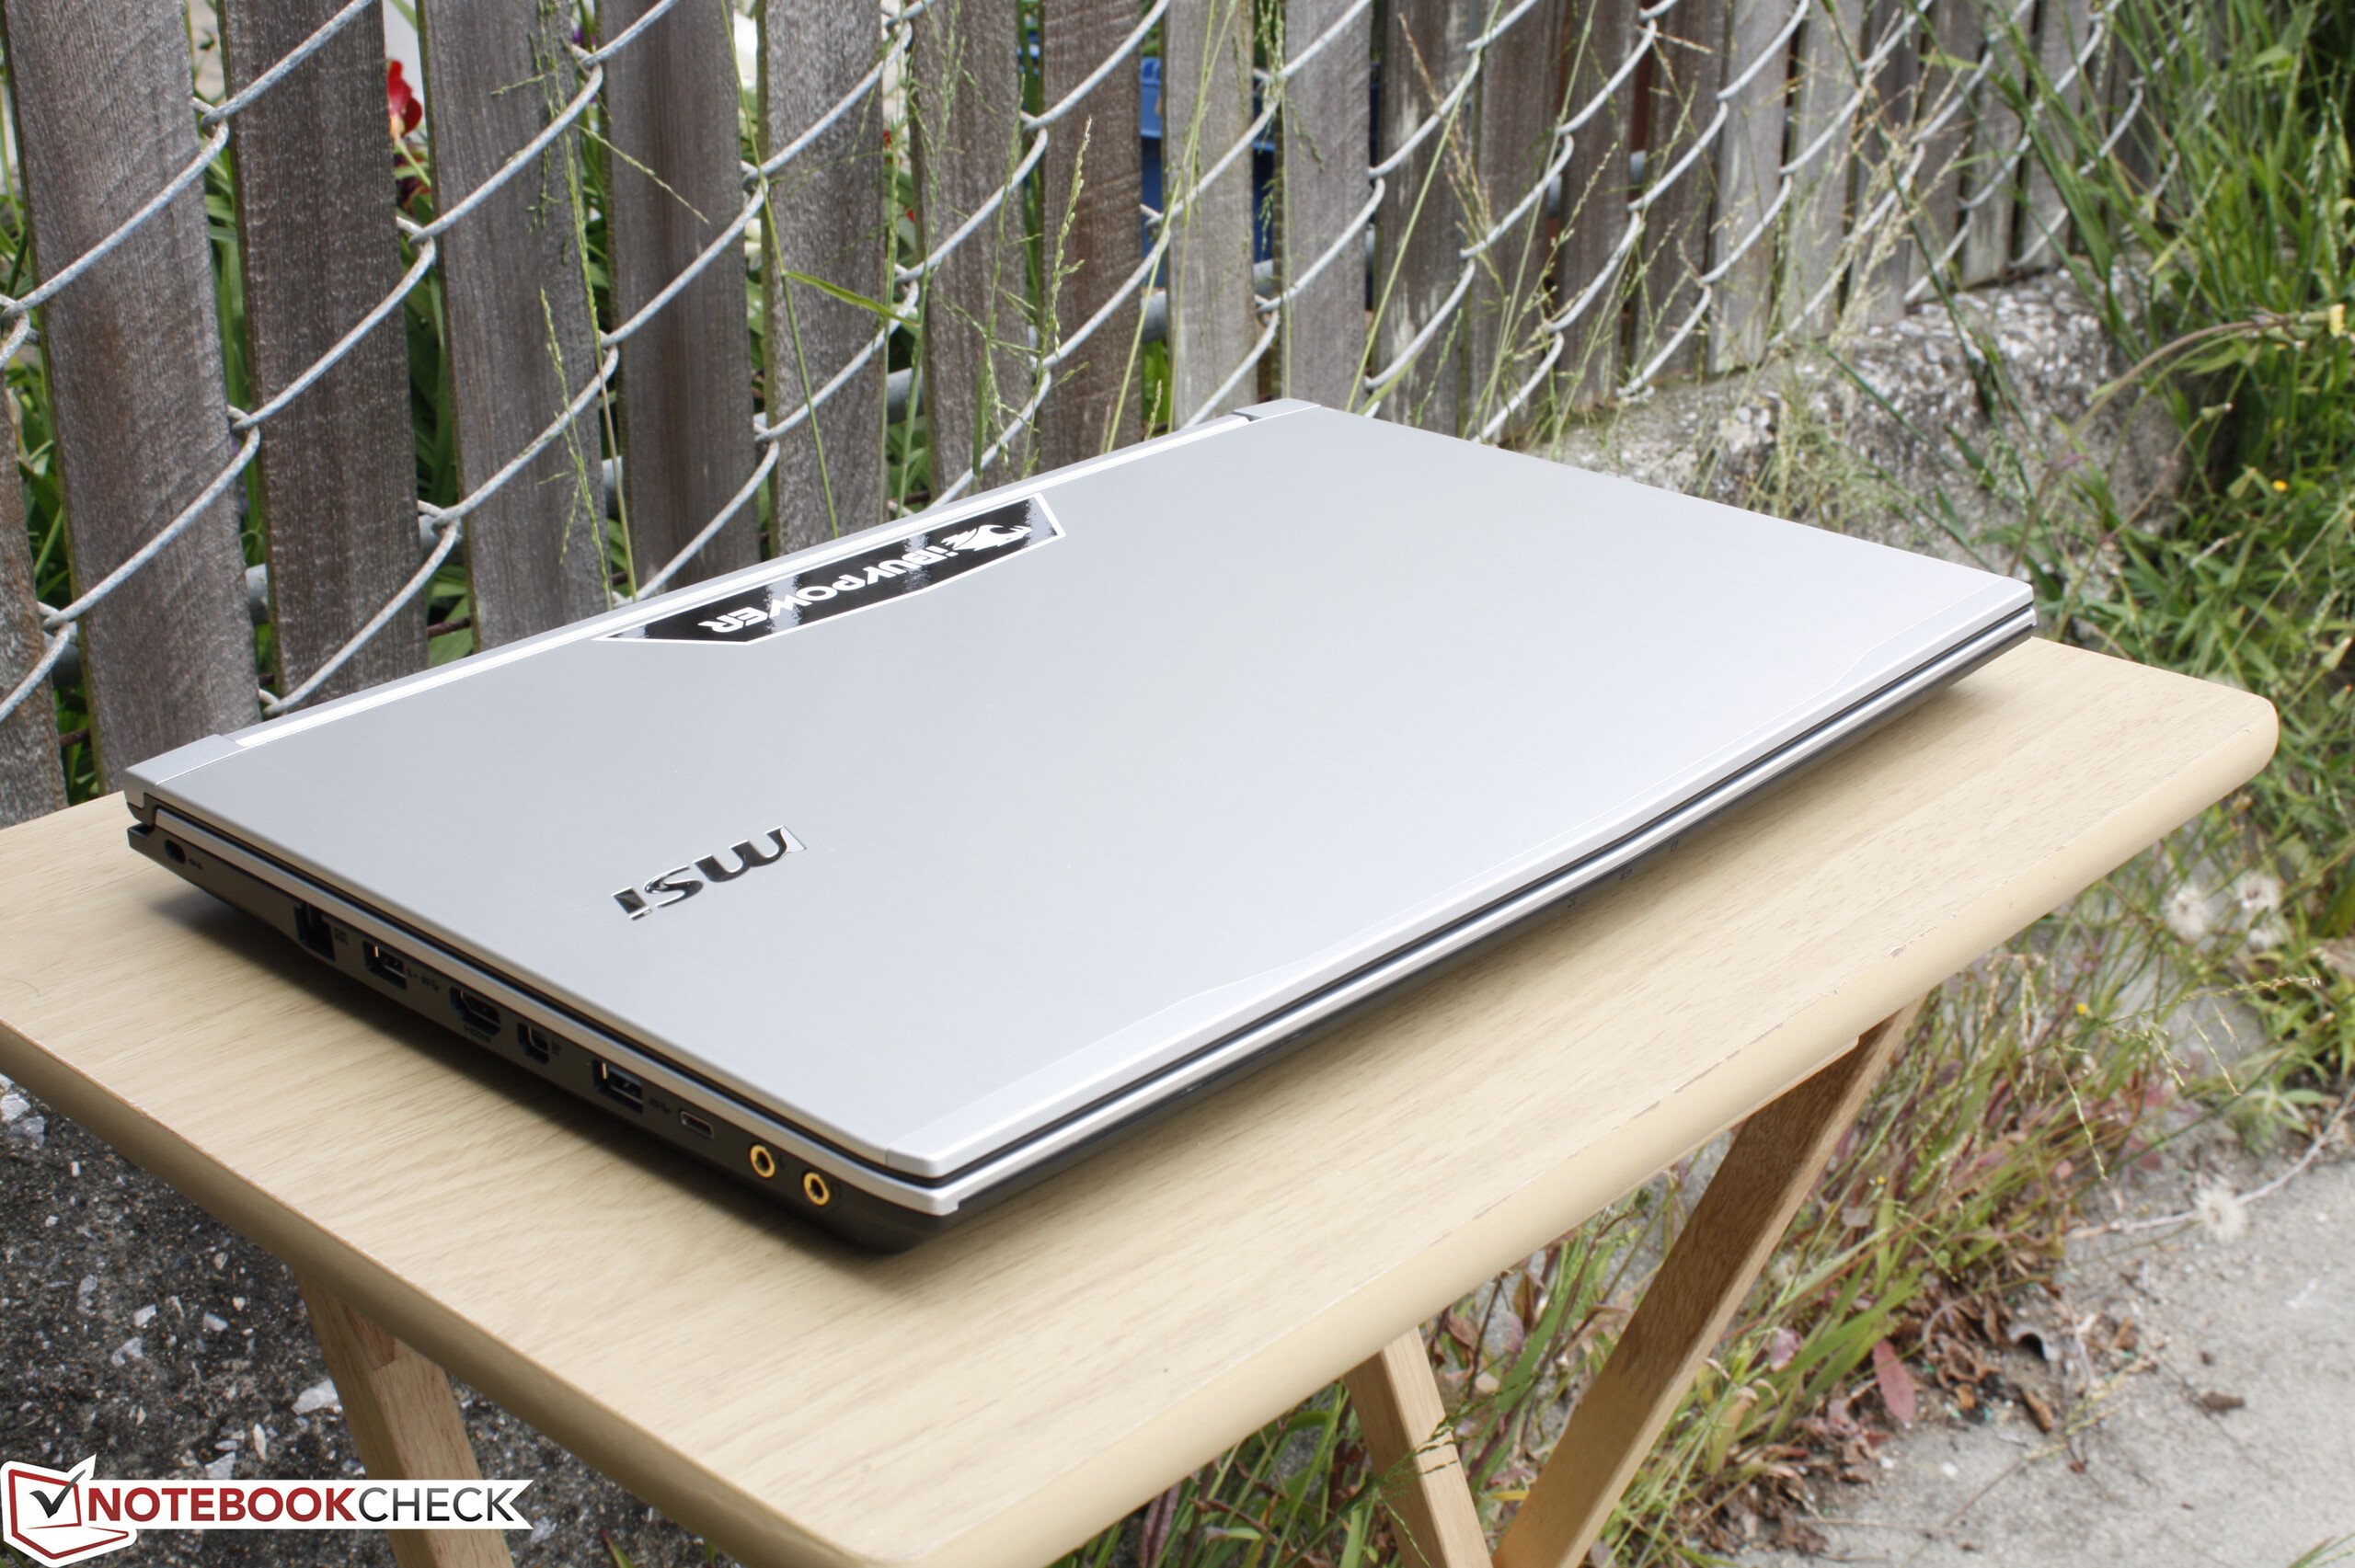
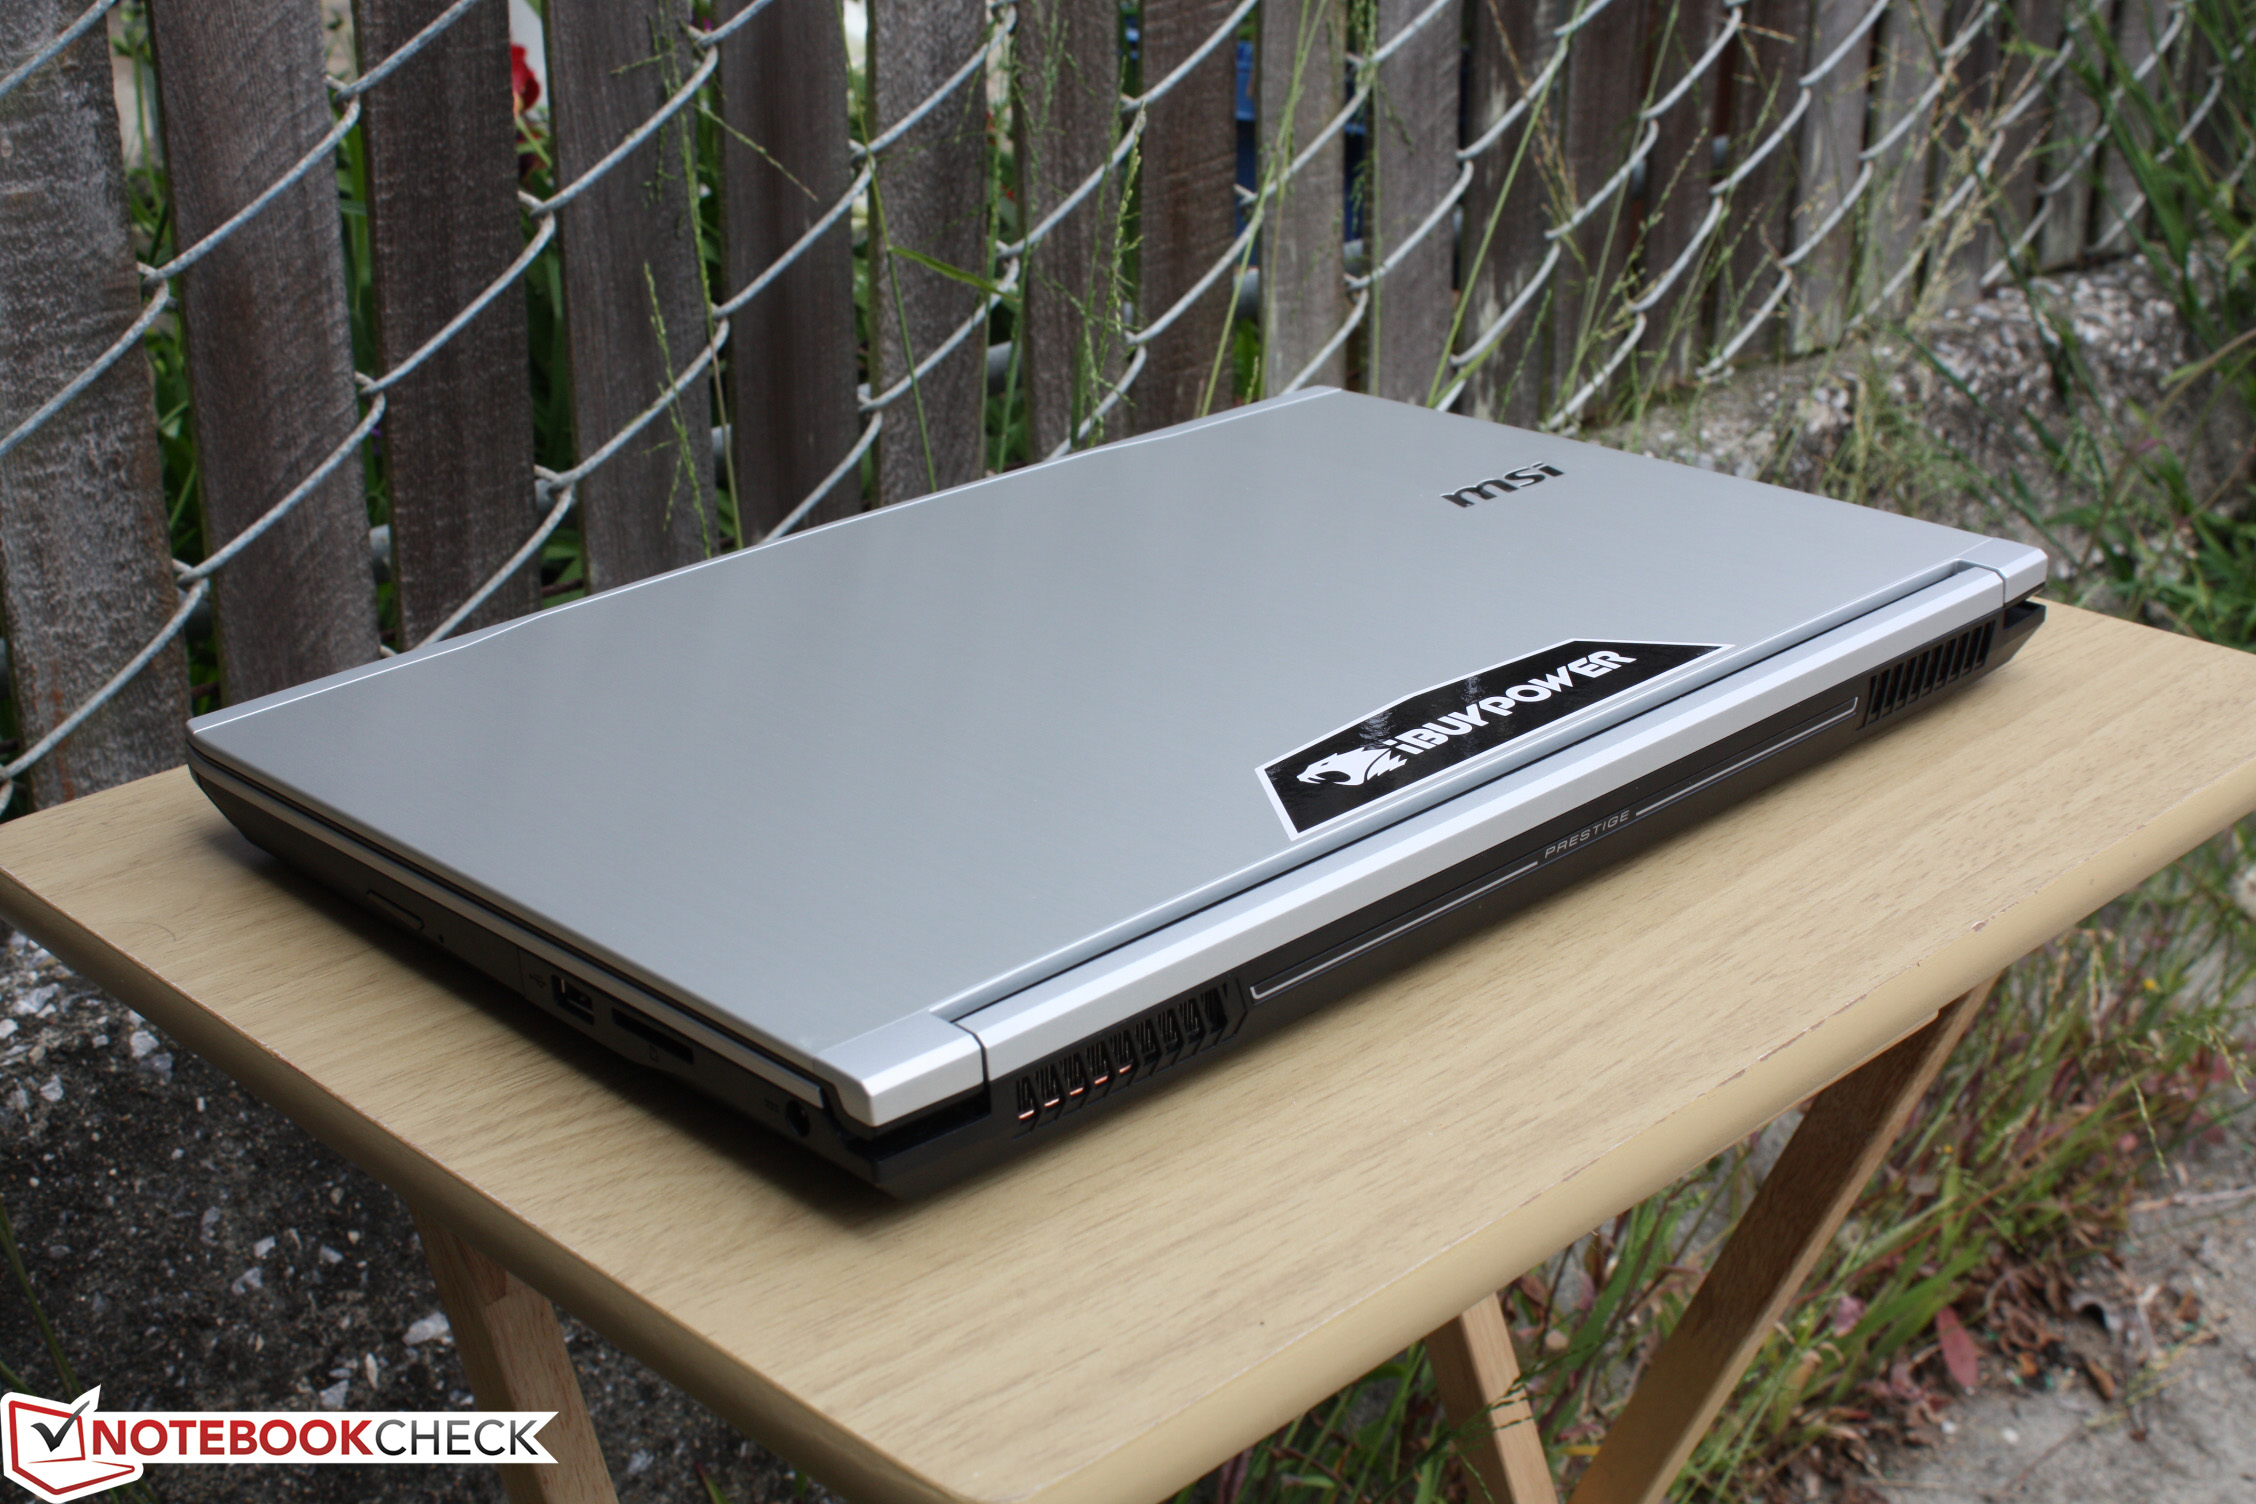
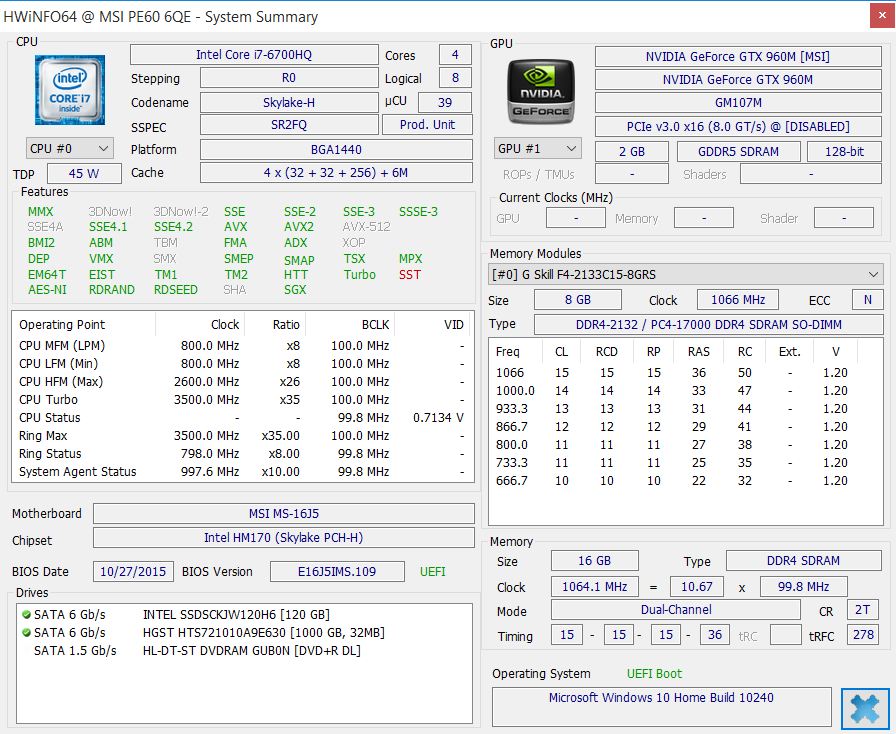
Breve análisis del MSI PE60 6QE Prestige iBuyPower Edition


| |||||||||||||||||||||||||
iluminación: 86 %
Brillo con batería: 200.1 cd/m²
Contraste: 466:1 (Negro: 0.429 cd/m²)
ΔE ColorChecker Calman: 10.63 | ∀{0.5-29.43 Ø4.71}
ΔE Greyscale Calman: 11.51 | ∀{0.09-98 Ø4.96}
99.8% sRGB (Argyll 1.6.3 3D)
74.6% AdobeRGB 1998 (Argyll 1.6.3 3D)
84.2% AdobeRGB 1998 (Argyll 3D)
99.8% sRGB (Argyll 3D)
86% Display P3 (Argyll 3D)
Gamma: 2.23
CCT: 14492 K
| MSI PE60 6QE-056XUS 15.6", 1920x1080 | HP ZBook 15 G3 15.6", 1920x1080 | Lenovo Ideapad Y700 15ISK 80NW 15.6", 1920x1080 | Asus G501VW-FY081T 15.6", 1920x1080 | Dell XPS 15 9550 i7 FHD 15.6", 1920x1080 | |
|---|---|---|---|---|---|
| Display | -15% | -50% | -15% | -13% | |
| Display P3 Coverage (%) | 86 | 66.8 -22% | 38.55 -55% | 66.8 -22% | 68.5 -20% |
| sRGB Coverage (%) | 99.8 | 95.5 -4% | 57.6 -42% | 97.3 -3% | 97.2 -3% |
| AdobeRGB 1998 Coverage (%) | 84.2 | 69 -18% | 39.86 -53% | 68.6 -19% | 70.4 -16% |
| Response Times | -27% | 10% | -28% | -64% | |
| Response Time Grey 50% / Grey 80% * (ms) | 43.6 ? | 54 ? -24% | 40.8 ? 6% | 50 ? -15% | 64 ? -47% |
| Response Time Black / White * (ms) | 27.6 ? | 35.6 ? -29% | 24 ? 13% | 39 ? -41% | 50 ? -81% |
| PWM Frequency (Hz) | 1000 ? | 198 ? | 58.1 | 200 ? | |
| Screen | 33% | 18% | 44% | 54% | |
| Brightness middle (cd/m²) | 200.1 | 306 53% | 258.6 29% | 341 70% | 371.5 86% |
| Brightness (cd/m²) | 194 | 289 49% | 242 25% | 312 61% | 356 84% |
| Brightness Distribution (%) | 86 | 85 -1% | 88 2% | 83 -3% | 92 7% |
| Black Level * (cd/m²) | 0.429 | 0.34 21% | 0.277 35% | 0.32 25% | 0.252 41% |
| Contrast (:1) | 466 | 900 93% | 934 100% | 1066 129% | 1474 216% |
| Colorchecker dE 2000 * | 10.63 | 5.1 52% | 8.1 24% | 4.23 60% | 5.55 48% |
| Colorchecker dE 2000 max. * | 18.19 | 9.9 46% | 8.02 56% | 10.95 40% | |
| Greyscale dE 2000 * | 11.51 | 7.4 36% | 7.23 37% | 4.69 59% | 7.1 38% |
| Gamma | 2.23 99% | 2.37 93% | 1.99 111% | 2.53 87% | 2.1 105% |
| CCT | 14492 45% | 7263 89% | 6567 99% | 7549 86% | |
| Color Space (Percent of AdobeRGB 1998) (%) | 74.6 | 63 -16% | 36.5 -51% | 63 -16% | 63.4 -15% |
| Color Space (Percent of sRGB) (%) | 99.8 | 95 -5% | 57.2 -43% | 97 -3% | 97.9 -2% |
| Media total (Programa/Opciones) | -3% /
15% | -7% /
2% | 0% /
23% | -8% /
25% |
* ... más pequeño es mejor
Tiempos de respuesta del display
| ↔ Tiempo de respuesta de Negro a Blanco | ||
|---|---|---|
| 27.6 ms ... subida ↗ y bajada ↘ combinada | ↗ 10 ms subida | 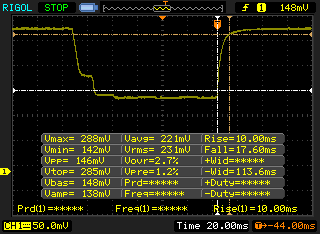 |
| ↘ 17.6 ms bajada | ||
| La pantalla mostró tiempos de respuesta relativamente lentos en nuestros tests pero podría ser demasiado lenta para los jugones. En comparación, todos los dispositivos de prueba van de ##min### (mínimo) a 240 (máximo) ms. » 70 % de todos los dispositivos son mejores. Eso quiere decir que el tiempo de respuesta es peor que la media (19.8 ms) de todos los dispositivos testados. | ||
| ↔ Tiempo de respuesta 50% Gris a 80% Gris | ||
| 43.6 ms ... subida ↗ y bajada ↘ combinada | ↗ 22 ms subida | 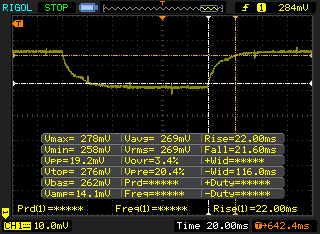 |
| ↘ 21.6 ms bajada | ||
| La pantalla mostró tiempos de respuesta lentos en nuestros tests y podría ser demasiado lenta para los jugones. En comparación, todos los dispositivos de prueba van de ##min### (mínimo) a 636 (máximo) ms. » 73 % de todos los dispositivos son mejores. Eso quiere decir que el tiempo de respuesta es peor que la media (31 ms) de todos los dispositivos testados. | ||
Parpadeo de Pantalla / PWM (Pulse-Width Modulation)
| Parpadeo de Pantalla / PWM detectado | 1000 Hz | ≤ 99 % de brillo | 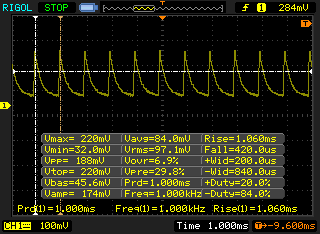 |
La retroiluminación del display parpadea a 1000 Hz (seguramente usa PWM - Pulse-Width Modulation) a un brillo del 99 % e inferior. Sobre este nivel de brillo no debería darse parpadeo / PWM. La frecuencia de 1000 Hz es bastante alta, por lo que la mayoría de gente sensible al parpadeo no debería ver parpadeo o tener fatiga visual. Comparación: 52 % de todos los dispositivos testados no usaron PWM para atenuar el display. Si se usó, medimos una media de 7754 (mínimo: 5 - máxmo: 343500) Hz. | |||

| Cinebench R10 | |
| Rendering Single 32Bit (ordenar por valor) | |
| MSI PE60 6QE-056XUS | |
| DogHouse Systems Mobius SS | |
| Lenovo ThinkPad P70 | |
| Gigabyte P55 V4 | |
| Rendering Multiple CPUs 32Bit (ordenar por valor) | |
| MSI PE60 6QE-056XUS | |
| DogHouse Systems Mobius SS | |
| Lenovo ThinkPad P70 | |
| Gigabyte P55 V4 | |
| wPrime 2.10 - 1024m (ordenar por valor) | |
| MSI PE60 6QE-056XUS | |
| DogHouse Systems Mobius SS | |
| Lenovo ThinkPad P70 | |
| Gigabyte P55 V4 | |
| Super Pi Mod 1.5 XS 32M - 32M (ordenar por valor) | |
| MSI PE60 6QE-056XUS | |
| DogHouse Systems Mobius SS | |
| Lenovo ThinkPad P70 | |
| Gigabyte P55 V4 | |
* ... más pequeño es mejor
| PCMark 8 | |
| Home Score Accelerated v2 (ordenar por valor) | |
| MSI PE60 6QE-056XUS | |
| MSI PE60-2QEi581 | |
| Lenovo Ideapad Y700 15ISK 80NW | |
| Dell XPS 15 9550 i7 FHD | |
| Asus G501VW-FY081T | |
| Work Score Accelerated v2 (ordenar por valor) | |
| MSI PE60 6QE-056XUS | |
| MSI PE60-2QEi581 | |
| Lenovo Ideapad Y700 15ISK 80NW | |
| Dell XPS 15 9550 i7 FHD | |
| Asus G501VW-FY081T | |
| Creative Score Accelerated v2 (ordenar por valor) | |
| MSI PE60 6QE-056XUS | |
| Lenovo Ideapad Y700 15ISK 80NW | |
| Dell XPS 15 9550 i7 FHD | |
| Asus G501VW-FY081T | |
| PCMark 8 Home Score Accelerated v2 | 3766 puntos | |
| PCMark 8 Creative Score Accelerated v2 | 4735 puntos | |
| PCMark 8 Work Score Accelerated v2 | 4827 puntos | |
ayuda | ||
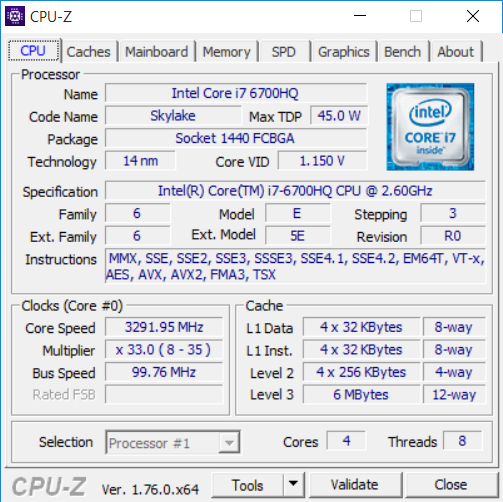
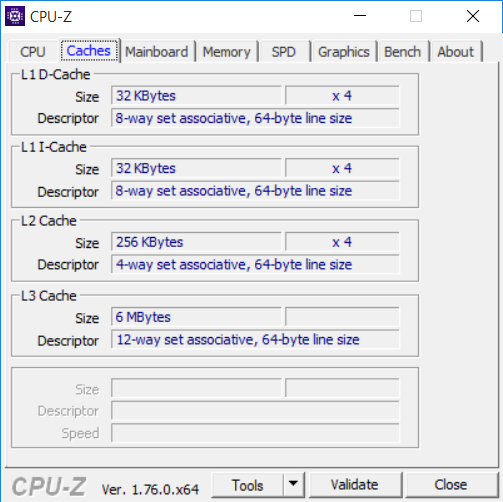
| MSI PE60 6QE-056XUS GeForce GTX 960M, 6700HQ, Intel SSD 535 SSDSCKJW120H6 | MSI PE60-2QEi78H11 SSD/4720HQ GeForce GTX 960M, 4720HQ, Toshiba HG6 THNSNJ128G8NU | HP ZBook 15 G3 Quadro M2000M, E3-1505M v5, Samsung SM951 MZVPV512HDGL m.2 PCI-e | Asus G501VW-FY081T GeForce GTX 960M, 6700HQ, Samsung CM871 MZNLF128HCHP | Dell XPS 15 9550 i7 FHD GeForce GTX 960M, 6700HQ, Samsung PM951 NVMe 512 GB | |
|---|---|---|---|---|---|
| AS SSD | 28% | 268% | -44% | 211% | |
| Copy Game MB/s (MB/s) | 307.1 | 261.9 -15% | 1023 233% | 141.5 -54% | 805 162% |
| Copy Program MB/s (MB/s) | 187.5 | 154.9 -17% | 585 212% | 99.9 -47% | 325.3 73% |
| Copy ISO MB/s (MB/s) | 280 | 353.4 26% | 1494 434% | 163 -42% | 1127 303% |
| Score Total (Points) | 588 | 865 47% | 2495 324% | 269 -54% | 2410 310% |
| Score Write (Points) | 293 | 207 -29% | 548 87% | 63 -78% | 675 130% |
| Score Read (Points) | 198 | 434 119% | 1302 558% | 152 -23% | 1180 496% |
| Access Time Write * (ms) | 0.196 | 0.056 71% | 0.024 88% | 0.225 -15% | 0.035 82% |
| Access Time Read * (ms) | 0.148 | 0.191 -29% | 0.031 79% | 0.207 -40% | 0.038 74% |
| 4K-64 Write (MB/s) | 180.2 | 99.9 -45% | 257 43% | 19.4 -89% | 513 185% |
| 4K-64 Read (MB/s) | 128.9 | 362.6 181% | 1066 727% | 87.6 -32% | 990 668% |
| 4K Write (MB/s) | 91 | 59.5 -35% | 173.1 90% | 30.66 -66% | 105.4 16% |
| 4K Read (MB/s) | 22.59 | 19.79 -12% | 52.5 132% | 13.87 -39% | 31.86 41% |
| Seq Write (MB/s) | 215.9 | 473.6 119% | 1181 447% | 126.9 -41% | 570 164% |
| Seq Read (MB/s) | 460.3 | 514 12% | 1841 300% | 504 9% | 1579 243% |
* ... más pequeño es mejor

| 3DMark 11 | |
| 1280x720 Performance (ordenar por valor) | |
| MSI PE60 6QE-056XUS | |
| Gigabyte P55W v5 | |
| Asus G501VW-FY081T | |
| MSI PE60 2QD | |
| Acer TravelMate P278-MG-76L2 | |
| 1280x720 Performance Combined (ordenar por valor) | |
| MSI PE60 6QE-056XUS | |
| Gigabyte P55W v5 | |
| Asus G501VW-FY081T | |
| MSI PE60 2QD | |
| Acer TravelMate P278-MG-76L2 | |
| 1280x720 Performance Physics (ordenar por valor) | |
| MSI PE60 6QE-056XUS | |
| Gigabyte P55W v5 | |
| Asus G501VW-FY081T | |
| MSI PE60 2QD | |
| Acer TravelMate P278-MG-76L2 | |
| 1280x720 Performance GPU (ordenar por valor) | |
| MSI PE60 6QE-056XUS | |
| Gigabyte P55W v5 | |
| Asus G501VW-FY081T | |
| MSI PE60 2QD | |
| Acer TravelMate P278-MG-76L2 | |
| 3DMark | |
| 1920x1080 Fire Strike Score (ordenar por valor) | |
| MSI PE60 6QE-056XUS | |
| Gigabyte P55W v5 | |
| Asus G501VW-FY081T | |
| MSI PE60 2QD | |
| Acer TravelMate P278-MG-76L2 | |
| 1920x1080 Fire Strike Combined (ordenar por valor) | |
| MSI PE60 6QE-056XUS | |
| Gigabyte P55W v5 | |
| Asus G501VW-FY081T | |
| MSI PE60 2QD | |
| Acer TravelMate P278-MG-76L2 | |
| 1920x1080 Fire Strike Graphics (ordenar por valor) | |
| MSI PE60 6QE-056XUS | |
| Gigabyte P55W v5 | |
| Asus G501VW-FY081T | |
| MSI PE60 2QD | |
| Acer TravelMate P278-MG-76L2 | |
| Fire Strike Extreme Physics (ordenar por valor) | |
| MSI PE60 6QE-056XUS | |
| Acer TravelMate P278-MG-76L2 | |
| 3DMark 11 Performance | 5774 puntos | |
| 3DMark Ice Storm Standard Score | 85812 puntos | |
| 3DMark Cloud Gate Standard Score | 17782 puntos | |
| 3DMark Fire Strike Score | 4088 puntos | |
| 3DMark Fire Strike Extreme Score | 2046 puntos | |
ayuda | ||
| BioShock Infinite - 1920x1080 Ultra Preset, DX11 (DDOF) | |
| Aorus X5S v5 | |
| Aorus X3 Plus v5 | |
| MSI PE60 6QE-056XUS | |
| MSI PX60 QD-034US | |
| Lenovo ThinkPad T460p-20FXS05500 | |
| Metro: Last Light - 1920x1080 Very High (DX11) AF:16x | |
| Aorus X5S v5 | |
| Aorus X3 Plus v5 | |
| MSI PE60 6QE-056XUS | |
| MSI PX60 QD-034US | |
| Lenovo ThinkPad T460p-20FXS05500 | |
| Thief - 1920x1080 Very High Preset AA:FXAA & High SS AF:8x | |
| Aorus X5S v5 | |
| Aorus X3 Plus v5 | |
| MSI PE60 6QE-056XUS | |
| MSI PX60 QD-034US | |
| Lenovo ThinkPad T460p-20FXS05500 | |
| Metal Gear Solid V - 1920x1080 Extra High / On | |
| Aorus X5S v5 | |
| Aorus X3 Plus v5 | |
| MSI PE60 6QE-056XUS | |
| MSI PX60 QD-034US | |
| Fallout 4 - 1920x1080 Ultra Preset AA:T AF:16x | |
| Aorus X5S v5 | |
| Aorus X3 Plus v5 | |
| MSI PE60 6QE-056XUS | |
| Rise of the Tomb Raider - 1920x1080 Very High Preset AA:FX AF:16x | |
| Aorus X5S v5 | |
| MSI PE60 6QE-056XUS | |
| bajo | medio | alto | ultra | |
|---|---|---|---|---|
| BioShock Infinite (2013) | 130 | 117.4 | 45.8 | |
| Metro: Last Light (2013) | 100.3 | 59.9 | 31.7 | |
| Thief (2014) | 65.3 | 55.3 | 27.9 | |
| Batman: Arkham Knight (2015) | 60 | 32 | ||
| Metal Gear Solid V (2015) | 60 | 58 | 39.1 | |
| Fallout 4 (2015) | 57.5 | 31.6 | 24.9 | |
| Rise of the Tomb Raider (2016) | 53.7 | 30.3 | 23 |
| MSI PE60 6QE-056XUS GeForce GTX 960M, 6700HQ, Intel SSD 535 SSDSCKJW120H6 | MSI PE60-2QEi581 GeForce GTX 960M, 4210H, HGST Travelstar 7K1000 HTS721010A9E630 | HP ZBook 15 G3 Quadro M2000M, E3-1505M v5, Samsung SM951 MZVPV512HDGL m.2 PCI-e | Asus G501VW-FY081T GeForce GTX 960M, 6700HQ, Samsung CM871 MZNLF128HCHP | Dell XPS 15 9550 i7 FHD GeForce GTX 960M, 6700HQ, Samsung PM951 NVMe 512 GB | |
|---|---|---|---|---|---|
| Noise | -2% | 1% | 0% | 8% | |
| apagado / medio ambiente * (dB) | 29.3 | 30 -2% | 31.2 -6% | ||
| Idle Minimum * (dB) | 32.4 | 32.8 -1% | 30 7% | 32.1 1% | 29.2 10% |
| Idle Average * (dB) | 32.4 | 32.8 -1% | 30 7% | 32.1 1% | 29.3 10% |
| Idle Maximum * (dB) | 35.4 | 35.4 -0% | 30 15% | 32.1 9% | 29.5 17% |
| Load Average * (dB) | 40.5 | 42.3 -4% | 45.3 -12% | 43.3 -7% | 36.5 10% |
| Load Maximum * (dB) | 45.3 | 47.4 -5% | 49.7 -10% | 44.3 2% | 47.7 -5% |
* ... más pequeño es mejor
Ruido
| Ocioso |
| 32.4 / 32.4 / 35.4 dB(A) |
| DVD |
| / 38.9 dB(A) |
| Carga |
| 40.5 / 45.3 dB(A) |
 | ||
30 dB silencioso 40 dB(A) audible 50 dB(A) ruidosamente alto |
||
min: | ||
(±) La temperatura máxima en la parte superior es de 43.2 °C / 110 F, frente a la media de 36.8 °C / 98 F, que oscila entre 21 y 71 °C para la clase Multimedia.
(-) El fondo se calienta hasta un máximo de 49 °C / 120 F, frente a la media de 39.1 °C / 102 F
(+) En reposo, la temperatura media de la parte superior es de 25.5 °C / 78# F, frente a la media del dispositivo de 31.3 °C / 88 F.
(-) El reposamanos y el touchpad pueden calentarse mucho al tacto con un máximo de 40.6 °C / 105.1 F.
(-) La temperatura media de la zona del reposamanos de dispositivos similares fue de 28.7 °C / 83.7 F (-11.9 °C / -21.4 F).
| MSI PE60 6QE-056XUS GeForce GTX 960M, 6700HQ, Intel SSD 535 SSDSCKJW120H6 | MSI PE60-2QEi581 GeForce GTX 960M, 4210H, HGST Travelstar 7K1000 HTS721010A9E630 | HP ZBook 15 G3 Quadro M2000M, E3-1505M v5, Samsung SM951 MZVPV512HDGL m.2 PCI-e | Asus G501VW-FY081T GeForce GTX 960M, 6700HQ, Samsung CM871 MZNLF128HCHP | Lenovo Y700-15 80NV004LPB GeForce GTX 960M, 6700HQ, Samsung SSD 850 EVO 250GB | Dell XPS 15 2016 9550 GeForce GTX 960M, 6300HQ, WDC WD10SPCX-75KHST0 + LiteON CS1-SP32-11 M.2 2242 32GB | |
|---|---|---|---|---|---|---|
| Power Consumption | -50% | 15% | 22% | 4% | 10% | |
| Idle Minimum * (Watt) | 9.7 | 21.8 -125% | 5.7 41% | 6.9 29% | 4.2 57% | 9.9 -2% |
| Idle Average * (Watt) | 13.1 | 26.1 -99% | 12.2 7% | 10.7 18% | 10.5 20% | 12.6 4% |
| Idle Maximum * (Watt) | 23.2 | 26.6 -15% | 12.6 46% | 13.2 43% | 28.5 -23% | 16.8 28% |
| Load Average * (Watt) | 79.1 | 88.5 -12% | 83.1 -5% | 82 -4% | 113 -43% | 70 12% |
| Load Maximum * (Watt) | 122.9 | 119.7 3% | 138.2 -12% | 94 24% | 114.2 7% | 114 7% |
* ... más pequeño es mejor
| Off / Standby | |
| Ocioso | |
| Carga |
|
Clave:
min: | |
| MSI PE60 6QE-056XUS 42 Wh | MSI PE60-2QEi581 42 Wh | HP ZBook 15 G3 90 Wh | Asus G501VW-FY081T 60 Wh | Lenovo Ideapad Y700 15ISK 80NW 60 Wh | Dell XPS 15 9550 i7 FHD 84 Wh | |
|---|---|---|---|---|---|---|
| Duración de Batería | 4% | 101% | 51% | 68% | 146% | |
| Reader / Idle (h) | 5.7 | 5.8 2% | 13.7 140% | 10.2 79% | 10.3 81% | 16.3 186% |
| WiFi v1.3 (h) | 3 | 2.8 -7% | 6.4 113% | 5.5 83% | 5.9 97% | 9.1 203% |
| Load (h) | 1.2 | 1.4 17% | 1.8 50% | 1.1 -8% | 1.5 25% | 1.8 50% |
Pro
Contra
En esencia, el MSI PE60 Prestige es un GE62 con una nueva capa de pintura y un nombre diferente dirigido a usuarios business y multimedia. Esto hace básicamente que el PE60 sea un portátil de juego disfrazado lo que, para los usuarios business, no es la mejor de las noticias. Aparte del amplio espacio de color del display tras una calibración adecuada, hay muy poco aquí para atraer usuarios. El último XPS 15 le saca mucha ventaja al MSI con su mayor aguante de batería, su diseño más ligero y delgado, su display más brillante, su SSD NVMe más rápido, su USB Type-C con Thunderbolt 3, y su chasis más potente con la misma CPU y GPU.
El PE60 Prestige está dirigido al uso profesional, pero MSI tendrá que esforzarse más en incorporar características que los usuarios business puedan agradecer en vez de cambiarle el traje a una serie de juego ya existente. Se describiría mejor como un "portátil de juego profesional" y hay mejhores opciones para el usuario business dedicado o para los jugones más hardcore en la misma gama de precios.
Ésta es una versión acortada del análisis original. Puedes leer el análisis completo en inglés aquí.
MSI PE60 6QE-056XUS
- 12/09/2016 v6 (old)
Allen Ngo
Price comparison
