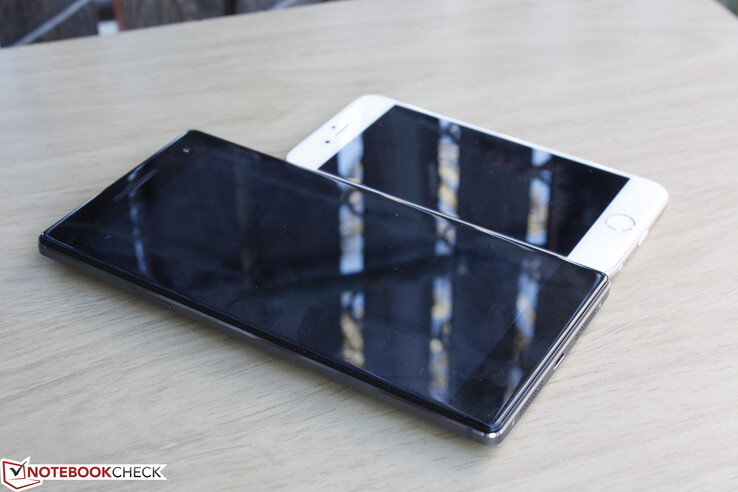
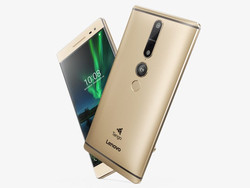
Breve análisis del Smartphone Lenovo Phab 2 Pro
Top 10 Análisis
» Top 10 Portátiles Multimedia
» Top 10 Portátiles de Juego
» Top 10 Portátiles de Juego ligeros
» Top 10 Portátiles Asequibles de Oficina/Empresa
» Top 10 Portátiles de Juego Ligeros
» Top 10 Portátiles de Oficina/Empresa Premium
» Top 10 Estaciones de Trabajo
» Top 10 Subportátiles
» Top 10 Ultrabooks
» Top 10 Convertibles
» Top 10 Tablets
» Top 10 Tablets Windows
» Top 10 Tablets de menos de 250 Euros
» Top 10 Phablets (>5.5")
» Top 10 Smartphones
» Top 10 Smartphones (≤5")
» Top 10 Smartphones de menos de 300 Euros
» Top 10 Smartphones de menos de 120 Euros
» Top 10 Portátiles de menos de 1000 Euros
» Top 10 Portátiles de menos de 500 Euros
» Top 10 Portátiles de menos de 300 Euros
» Los Mejores Displays de Portátiles Analizados por Notebookcheck
| Networking | |
| iperf3 receive AX12 | |
| Google Pixel XL 2016 | |
| Lenovo Phab 2 Pro | |
| Huawei Mate 9 | |
| Asus Zenfone 3 ZE552KL | |
| iperf3 transmit AX12 | |
| Google Pixel XL 2016 | |
| Lenovo Phab 2 Pro | |
| Huawei Mate 9 | |
| Asus Zenfone 3 ZE552KL | |
| SD Card Reader | |
| maximum SDCardreader Maximum Transfer Rate | |
| average SDCardreader Average Transfer Rate |
| |||||||||||||||||||||||||
iluminación: 93 %
Brillo con batería: 472.4 cd/m²
Contraste: 980:1 (Negro: 0.482 cd/m²)
ΔE ColorChecker Calman: 7 | ∀{0.5-29.43 Ø4.77}
ΔE Greyscale Calman: 7.9 | ∀{0.09-98 Ø5}
83.1% sRGB (Calman 2D)
Gamma: 2.34
CCT: 7826 K
| Lenovo Phab 2 Pro IPS, 6.4", 2560x1440 | Apple iPhone 7 Plus Retina HD, IPS, 5.5", 1920x1080 | Huawei Mate 9 IPS, 5.9", 1920x1080 | Asus Zenfone 3 ZE552KL IPS, 5.5", 1920x1080 | Google Pixel XL 2016 AMOLED, 5.5", 2560x1440 | |
|---|---|---|---|---|---|
| Display | |||||
| Display P3 Coverage (%) | 67.2 | ||||
| sRGB Coverage (%) | 99.8 | ||||
| AdobeRGB 1998 Coverage (%) | 69 | ||||
| Response Times | 44% | 13% | 6% | 92% | |
| Response Time Grey 50% / Grey 80% * (ms) | 58.4 ? | 29 ? 50% | 57 ? 2% | 56 ? 4% | 4 ? 93% |
| Response Time Black / White * (ms) | 38.8 ? | 24 ? 38% | 30 ? 23% | 36 ? 7% | 4 ? 90% |
| PWM Frequency (Hz) | 59.5 ? | 238.1 | |||
| Screen | 45% | 33% | 14% | 12% | |
| Brightness middle (cd/m²) | 472.4 | 557 18% | 696 47% | 658 39% | 402 -15% |
| Brightness (cd/m²) | 479 | 553 15% | 680 42% | 633 32% | 408 -15% |
| Brightness Distribution (%) | 93 | 97 4% | 93 0% | 93 0% | 85 -9% |
| Black Level * (cd/m²) | 0.482 | 0.35 27% | 0.42 13% | 0.66 -37% | |
| Contrast (:1) | 980 | 1591 62% | 1657 69% | 997 2% | |
| Colorchecker dE 2000 * | 7 | 1.4 80% | 4.3 39% | 4.9 30% | 4 43% |
| Colorchecker dE 2000 max. * | 11 | 3.1 72% | 9.4 15% | 9.1 17% | 10.1 8% |
| Greyscale dE 2000 * | 7.9 | 1.3 84% | 4.8 39% | 5.8 27% | 3.2 59% |
| Gamma | 2.34 94% | 2.21 100% | 2.33 94% | 2.26 97% | 2.19 100% |
| CCT | 7826 83% | 6667 97% | 7255 90% | 7840 83% | 7037 92% |
| Color Space (Percent of AdobeRGB 1998) (%) | 63.1 | ||||
| Color Space (Percent of sRGB) (%) | 99.83 | ||||
| Media total (Programa/Opciones) | 45% /
45% | 23% /
29% | 10% /
12% | 52% /
32% |
* ... más pequeño es mejor
Tiempos de respuesta del display
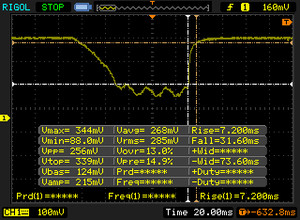
| ↔ Tiempo de respuesta de Negro a Blanco | ||
|---|---|---|
| 38.8 ms ... subida ↗ y bajada ↘ combinada | ↗ 7.2 ms subida | |
| ↘ 31.6 ms bajada | ||
| La pantalla mostró tiempos de respuesta lentos en nuestros tests y podría ser demasiado lenta para los jugones. En comparación, todos los dispositivos de prueba van de ##min### (mínimo) a 240 (máximo) ms. » 96 % de todos los dispositivos son mejores. Eso quiere decir que el tiempo de respuesta es peor que la media (20.2 ms) de todos los dispositivos testados. | ||
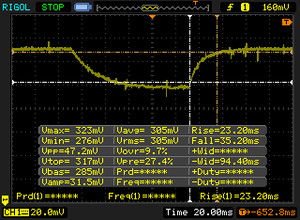
| ↔ Tiempo de respuesta 50% Gris a 80% Gris | ||
| 58.4 ms ... subida ↗ y bajada ↘ combinada | ↗ 23.2 ms subida | |
| ↘ 35.2 ms bajada | ||
| La pantalla mostró tiempos de respuesta lentos en nuestros tests y podría ser demasiado lenta para los jugones. En comparación, todos los dispositivos de prueba van de ##min### (mínimo) a 636 (máximo) ms. » 95 % de todos los dispositivos son mejores. Eso quiere decir que el tiempo de respuesta es peor que la media (31.5 ms) de todos los dispositivos testados. | ||
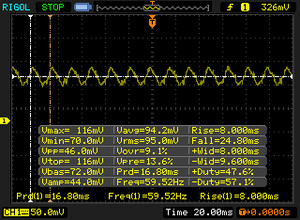
Parpadeo de Pantalla / PWM (Pulse-Width Modulation)
| Parpadeo de Pantalla / PWM detectado | 59.5 Hz | ≤ 30 % de brillo | |
La retroiluminación del display parpadea a 59.5 Hz (seguramente usa PWM - Pulse-Width Modulation) a un brillo del 30 % e inferior. Sobre este nivel de brillo no debería darse parpadeo / PWM. La frecuencia de 59.5 Hz es bajísima, por lo que el parpadeo puede causar fatiga visual y cefaleas cuando se usa mucho tiempo. Comparación: 53 % de todos los dispositivos testados no usaron PWM para atenuar el display. Si se usó, medimos una media de 8070 (mínimo: 5 - máxmo: 343500) Hz. | |||
| AnTuTu v6 - Total Score | |
| Google Pixel XL 2016 | |
| Samsung Galaxy S7 | |
| Huawei Mate 9 | |
| Lenovo Phab 2 Pro | |
| Sony Xperia XA | |
| Fairphone 2 | |
| Geekbench 4.0 | |
| Compute RenderScript Score | |
| Google Pixel XL 2016 | |
| Lenovo Phab 2 Pro | |
| Huawei Mate 9 | |
| Fairphone 2 | |
| 64 Bit Multi-Core Score | |
| Huawei Mate 9 | |
| Google Pixel XL 2016 | |
| Lenovo Phab 2 Pro | |
| Fairphone 2 | |
| 64 Bit Single-Core Score | |
| Huawei Mate 9 | |
| Google Pixel XL 2016 | |
| Lenovo Phab 2 Pro | |
| Fairphone 2 | |
| Octane V2 - Total Score | |
| Samsung Galaxy S7 | |
| Huawei Mate 9 | |
| Lenovo Phab 2 Pro | |
| Google Pixel XL 2016 | |
| Fairphone 2 | |
| Sony Xperia XA | |
| Mozilla Kraken 1.1 - Total | |
| Sony Xperia XA | |
| Fairphone 2 | |
| Lenovo Phab 2 Pro | |
| Huawei Mate 9 | |
| Google Pixel XL 2016 | |
| Samsung Galaxy S7 | |
| WebXPRT 2015 - Overall | |
| Samsung Galaxy S7 | |
| Huawei Mate 9 | |
| Google Pixel XL 2016 | |
| Lenovo Phab 2 Pro | |
| Sony Xperia XA | |
| Fairphone 2 | |
| JetStream 1.1 - Total Score | |
| Samsung Galaxy S7 | |
| Huawei Mate 9 | |
| Google Pixel XL 2016 | |
| Lenovo Phab 2 Pro | |
| Sony Xperia XA | |
| Fairphone 2 | |
* ... más pequeño es mejor
| Lenovo Phab 2 Pro 64 GB eMMC Flash | Huawei Mate 9 64 GB UFS 2.1 Flash | Google Pixel XL 2016 32 GB eMMC Flash | Sony Xperia XA 16 GB eMMC Flash | Samsung Galaxy S7 32 GB UFS 2.0 Flash | |
|---|---|---|---|---|---|
| AndroBench 3-5 | 30% | 26% | -21% | 40% | |
| Sequential Write 256KB SDCard (MB/s) | 54.8 | 29.53 -46% | 50.7 -7% | 53.6 -2% | |
| Sequential Read 256KB SDCard (MB/s) | 71.9 | 54 -25% | 72.9 1% | 72.3 1% | |
| Random Write 4KB (MB/s) | 12.92 | 8.77 -32% | 14.56 13% | 10.6 -18% | 16.01 24% |
| Random Read 4KB (MB/s) | 38.53 | 94.7 146% | 87.7 128% | 22.05 -43% | 85.9 123% |
| Sequential Write 256KB (MB/s) | 138 | 142.9 4% | 83.4 -40% | 68.6 -50% | 145.7 6% |
| Sequential Read 256KB (MB/s) | 255 | 594 133% | 258.2 1% | 240.4 -6% | 483.8 90% |
| Lightmark - 1920x1080 1080p | |
| LG G5 | |
| Huawei Mate 9 | |
| Samsung Galaxy S7 | |
| Lenovo Phab 2 Pro | |
| Huawei Mate 8 | |
(±) La temperatura máxima en la parte superior es de 41.6 °C / 107 F, frente a la media de 35.2 °C / 95 F, que oscila entre 21.9 y 247 °C para la clase Smartphone.
(+) El fondo se calienta hasta un máximo de 34.2 °C / 94 F, frente a la media de 34 °C / 93 F
(+) En reposo, la temperatura media de la parte superior es de 25.4 °C / 78# F, frente a la media del dispositivo de 32.9 °C / 91 F.
Lenovo Phab 2 Pro análisis de audio
(+) | los altavoces pueden reproducir a un volumen relativamente alto (#84.5 dB)
Graves 100 - 315 Hz
(-) | casi sin bajos - de media 22.8% inferior a la mediana
(±) | la linealidad de los graves es media (11.4% delta a frecuencia anterior)
Medios 400 - 2000 Hz
(+) | medios equilibrados - a sólo 2.2% de la mediana
(+) | los medios son lineales (4.7% delta a la frecuencia anterior)
Altos 2 - 16 kHz
(±) | máximos más altos - de media 6.3% más altos que la mediana
(±) | la linealidad de los máximos es media (7.3% delta a frecuencia anterior)
Total 100 - 16.000 Hz
(±) | la linealidad del sonido global es media (21.1% de diferencia con la mediana)
En comparación con la misma clase
» 39% de todos los dispositivos probados de esta clase eran mejores, 8% similares, 53% peores
» El mejor tuvo un delta de 11%, la media fue 35%, el peor fue ###max##%
En comparación con todos los dispositivos probados
» 58% de todos los dispositivos probados eran mejores, 7% similares, 35% peores
» El mejor tuvo un delta de 4%, la media fue 24%, el peor fue ###max##%
Apple MacBook 12 (Early 2016) 1.1 GHz análisis de audio
(+) | los altavoces pueden reproducir a un volumen relativamente alto (#83.6 dB)
Graves 100 - 315 Hz
(±) | lubina reducida - en promedio 11.3% inferior a la mediana
(±) | la linealidad de los graves es media (14.2% delta a frecuencia anterior)
Medios 400 - 2000 Hz
(+) | medios equilibrados - a sólo 2.4% de la mediana
(+) | los medios son lineales (5.5% delta a la frecuencia anterior)
Altos 2 - 16 kHz
(+) | máximos equilibrados - a sólo 2% de la mediana
(+) | los máximos son lineales (4.5% delta a la frecuencia anterior)
Total 100 - 16.000 Hz
(+) | el sonido global es lineal (10.2% de diferencia con la mediana)
En comparación con la misma clase
» 7% de todos los dispositivos probados de esta clase eran mejores, 2% similares, 91% peores
» El mejor tuvo un delta de 5%, la media fue 18%, el peor fue ###max##%
En comparación con todos los dispositivos probados
» 4% de todos los dispositivos probados eran mejores, 1% similares, 94% peores
» El mejor tuvo un delta de 4%, la media fue 24%, el peor fue ###max##%
| Off / Standby | |
| Ocioso | |
| Carga |
|
Clave:
min: | |
| Lenovo Phab 2 Pro 652 MSM8976, Adreno 510, 64 GB eMMC Flash, IPS, 2560x1440, 6.4" | Apple iPhone 7 Plus A10 Fusion, A10 Fusion GPU, 128 GB NVMe, IPS, 1920x1080, 5.5" | Huawei Mate 9 Kirin 960, Mali-G71 MP8, 64 GB UFS 2.1 Flash, IPS, 1920x1080, 5.9" | Asus Zenfone 3 ZE552KL 625, Adreno 506, 64 GB eMMC Flash, IPS, 1920x1080, 5.5" | Google Pixel XL 2016 SD 821, Adreno 530, 32 GB eMMC Flash, AMOLED, 2560x1440, 5.5" | |
|---|---|---|---|---|---|
| Power Consumption | 44% | 46% | 54% | 60% | |
| Idle Minimum * (Watt) | 3 | 0.77 74% | 0.78 74% | 0.83 72% | 0.53 82% |
| Idle Average * (Watt) | 4.1 | 2.04 50% | 2.13 48% | 2.11 49% | 1.07 74% |
| Idle Maximum * (Watt) | 4.2 | 2.24 47% | 2.17 48% | 2.12 50% | 1.12 73% |
| Load Average * (Watt) | 10.4 | 4.69 55% | 6.32 39% | 3.41 67% | 5.53 47% |
| Load Maximum * (Watt) | 8.1 | 8.66 -7% | 6.49 20% | 5.46 33% | 6.26 23% |
* ... más pequeño es mejor
| Lenovo Phab 2 Pro 652 MSM8976, Adreno 510, Wh | Apple iPhone 7 Plus A10 Fusion, A10 Fusion GPU, 11.02 Wh | Huawei Mate 9 Kirin 960, Mali-G71 MP8, Wh | Asus Zenfone 3 ZE552KL 625, Adreno 506, Wh | Google Pixel XL 2016 SD 821, Adreno 530, Wh | |
|---|---|---|---|---|---|
| Duración de Batería | 33% | 34% | 58% | 12% | |
| Reader / Idle (h) | 18.7 | 30.6 64% | 25.6 37% | 25 34% | 22.2 19% |
| WiFi v1.3 (h) | 8.5 | 9.8 15% | 12.6 48% | 13.3 56% | 8.4 -1% |
| Load (h) | 3.2 | 3.8 19% | 3.7 16% | 5.9 84% | 3.8 19% |
Pro
Contra
El gran gancho comercial del Phab 2 Pro es su hardware Tango único. En su estado actual, empero, la característica es más un capricho que una implementación práctica. Aparte de su potencial de juego, Lenovo ha prometido la capacidad de navegar en interiores y entre habitaciones dónde las señales GPS suelen ser débiles. Encontrar el camino en un museo o aeropuerto internacional, por ejemplo, no es posible aún y dependería por completo del soporte del desarrollador. Es demasiado pronto para decir que Tango es un mero truco, pero su software hasta ahora parece endeble y poco representativo del potencial oculto tras la tecnología de aprendizaje de área.
Para los usuarios no interesados en Tango o en ser early adopters de la tecnología, las características principales del Phab 2 Pro siguen siendo sólidas. La pantalla es grande y nítida con soporte 4G y MicroSD, su altavoz es muy claro comparado con la competencia de 5". El rendimiento CPU es veloz y el smartphone parece denso al agarre. Sus otras especificaciones están en la media para su categoría, incluyendo la GPU gama media Adreno 510, el aguante de batería, y los colores y el tiempo de respuesta del display. Sus grandes dimensiones requieren el manejo a dos manos, lo que puede hacer que sus usuarios deseen una versión más pequeña con el mismo hardware Tango.
Como uno de los primeros smartphones oficiales de Lenovo para el mercado americano, el Phab 2 Pro sobresale con su tamaño y su soporte nativo para Tango. Si nada de eso resulta atractivo, empero, los usuarios se quedarán con una experiencia Android respetable, si no mediocre.
Ésta es una versión acortada del análisis original. Puedes leer el análisis completo en inglés aquí.
Lenovo Phab 2 Pro
- 12/06/2016 v6 (old)
Allen Ngo


