Breve análisis del portátil Asus ROG Strix GL703VD-DB74 (7700HQ, GTX 1050, FHD)
| SD Card Reader | |
| average JPG Copy Test (av. of 3 runs) | |
| Acer Predator Helios 300 | |
| HP Omen 17-w206ng | |
| Asus ROG Strix GL703VD-DB74 | |
| MSI GS73VR 7RF | |
| MSI GL72 7RDX-602 | |
| Acer Aspire V17 Nitro BE VN7-793G-52XN | |
| maximum AS SSD Seq Read Test (1GB) | |
| HP Omen 17-w206ng | |
| Asus ROG Strix GL703VD-DB74 | |
| Acer Predator Helios 300 | |
| MSI GS73VR 7RF | |
| Acer Aspire V17 Nitro BE VN7-793G-52XN | |
| MSI GL72 7RDX-602 | |
| |||||||||||||||||||||||||
iluminación: 85 %
Brillo con batería: 421.2 cd/m²
Contraste: 957:1 (Negro: 0.44 cd/m²)
ΔE ColorChecker Calman: 5 | ∀{0.5-29.43 Ø4.71}
ΔE Greyscale Calman: 5 | ∀{0.09-98 Ø4.96}
86.1% sRGB (Argyll 1.6.3 3D)
62.94% AdobeRGB 1998 (Argyll 1.6.3 3D)
62.9% AdobeRGB 1998 (Argyll 3D)
86.1% sRGB (Argyll 3D)
67.6% Display P3 (Argyll 3D)
Gamma: 2.18
CCT: 6882 K
| Asus ROG Strix GL703VD-DB74 LG Philips LP173WF4-SPF5, IPS, 17.3", 1920x1080 | Acer Predator Helios 300 LG LP173WF4-SPF5 (LGD056D), AH-IPS, WLED, 17.3", 1920x1080 | Acer Aspire V17 Nitro BE VN7-793G-52XN AUO B173HAN01.0, a-Si TFT-LCD, WLED, 17.3", 1920x1080 | HP Omen 17-w206ng Chi Mei CMN1738, IPS, 17.3", 1920x1080 | MSI GL72 7RDX-602 Chi Mei CMN1735 N173HGE-E11, TN LED, 17.3", 1920x1080 | MSI GS73VR 7RF AU Optronics AUO109B, IPS, 17.3", 3840x2160 | Acer Aspire V17 Nitro BE VN7-793-738J AU Optronics B173ZAN01.0, IPS, 17.3", 3840x2160 | |
|---|---|---|---|---|---|---|---|
| Display | -0% | 1% | 5% | 3% | 4% | 32% | |
| Display P3 Coverage (%) | 67.6 | 66.8 -1% | 64 -5% | 67.2 -1% | 65.2 -4% | 64.2 -5% | 85.4 26% |
| sRGB Coverage (%) | 86.1 | 85.8 0% | 90.2 5% | 93.1 8% | 94.3 10% | 96.8 12% | 100 16% |
| AdobeRGB 1998 Coverage (%) | 62.9 | 62.8 0% | 65.4 4% | 67.4 7% | 65.6 4% | 66.4 6% | 97.8 55% |
| Response Times | -8% | -22% | -25% | -11% | -25% | -13% | |
| Response Time Grey 50% / Grey 80% * (ms) | 30.8 ? | 36 ? -17% | 36 ? -17% | 38 ? -23% | 29 ? 6% | 38 ? -23% | 29 ? 6% |
| Response Time Black / White * (ms) | 20.4 ? | 20 ? 2% | 26 ? -27% | 26 ? -27% | 26 ? -27% | 26 ? -27% | 27 ? -32% |
| PWM Frequency (Hz) | 119000 ? | 119000 ? | 200 ? | 961 | |||
| Screen | 2% | 5% | 3% | -44% | 2% | 9% | |
| Brightness middle (cd/m²) | 421.2 | 384 -9% | 346 -18% | 318 -25% | 299 -29% | 371.1 -12% | 380 -10% |
| Brightness (cd/m²) | 393 | 373 -5% | 307 -22% | 295 -25% | 274 -30% | 343 -13% | 336 -15% |
| Brightness Distribution (%) | 85 | 93 9% | 84 -1% | 79 -7% | 80 -6% | 86 1% | 81 -5% |
| Black Level * (cd/m²) | 0.44 | 0.35 20% | 0.26 41% | 0.25 43% | 0.25 43% | 0.42 5% | 0.32 27% |
| Contrast (:1) | 957 | 1097 15% | 1331 39% | 1272 33% | 1196 25% | 884 -8% | 1188 24% |
| Colorchecker dE 2000 * | 5 | 4.81 4% | 4.32 14% | 4.7 6% | 12.92 -158% | 4.5 10% | 5.32 -6% |
| Colorchecker dE 2000 max. * | 8.8 | 8.69 1% | 8.05 9% | 8.8 -0% | 19.91 -126% | 9.7 -10% | 7.63 13% |
| Greyscale dE 2000 * | 5 | 5.33 -7% | 5.76 -15% | 5 -0% | 13.16 -163% | 3.1 38% | 4.9 2% |
| Gamma | 2.18 101% | 2.45 90% | 2.35 94% | 2.28 96% | 2.36 93% | 2.17 101% | 2.61 84% |
| CCT | 6882 94% | 7137 91% | 6447 101% | 7374 88% | 15046 43% | 7120 91% | 6558 99% |
| Color Space (Percent of AdobeRGB 1998) (%) | 62.94 | 56 -11% | 59 -6% | 61 -3% | 60 -5% | 61 -3% | 87.2 39% |
| Color Space (Percent of sRGB) (%) | 86.1 | 86 0% | 90 5% | 93 8% | 94 9% | 97 13% | 100 16% |
| Media total (Programa/Opciones) | -2% /
0% | -5% /
0% | -6% /
-0% | -17% /
-30% | -6% /
-1% | 9% /
10% |
* ... más pequeño es mejor
Tiempos de respuesta del display
| ↔ Tiempo de respuesta de Negro a Blanco | ||
|---|---|---|
| 20.4 ms ... subida ↗ y bajada ↘ combinada | ↗ 12 ms subida | 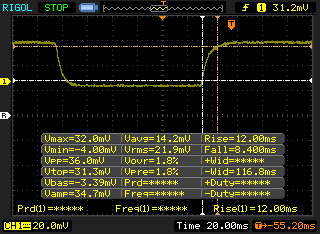 |
| ↘ 8.4 ms bajada | ||
| La pantalla mostró buenos tiempos de respuesta en nuestros tests pero podría ser demasiado lenta para los jugones competitivos. En comparación, todos los dispositivos de prueba van de ##min### (mínimo) a 240 (máximo) ms. » 46 % de todos los dispositivos son mejores. Eso quiere decir que el tiempo de respuesta es similar al dispositivo testado medio (19.8 ms). | ||
| ↔ Tiempo de respuesta 50% Gris a 80% Gris | ||
| 30.8 ms ... subida ↗ y bajada ↘ combinada | ↗ 18 ms subida | 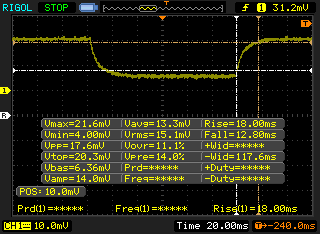 |
| ↘ 12.8 ms bajada | ||
| La pantalla mostró tiempos de respuesta lentos en nuestros tests y podría ser demasiado lenta para los jugones. En comparación, todos los dispositivos de prueba van de ##min### (mínimo) a 636 (máximo) ms. » 41 % de todos los dispositivos son mejores. Eso quiere decir que el tiempo de respuesta es similar al dispositivo testado medio (30.9 ms). | ||
Parpadeo de Pantalla / PWM (Pulse-Width Modulation)
| Parpadeo de Pantalla / PWM detectado | 119000 Hz | ≤ 99 % de brillo | 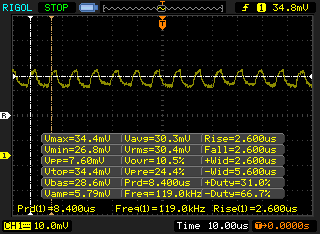 |
La retroiluminación del display parpadea a 119000 Hz (seguramente usa PWM - Pulse-Width Modulation) a un brillo del 99 % e inferior. Sobre este nivel de brillo no debería darse parpadeo / PWM. La frecuencia de 119000 Hz es bastante alta, por lo que la mayoría de gente sensible al parpadeo no debería ver parpadeo o tener fatiga visual. Comparación: 52 % de todos los dispositivos testados no usaron PWM para atenuar el display. Si se usó, medimos una media de 7744 (mínimo: 5 - máxmo: 343500) Hz. | |||
| Cinebench R10 | |
| Rendering Multiple CPUs 32Bit | |
| Acer Aspire V17 Nitro BE VN7-793-738J | |
| Acer Predator Helios 300 | |
| Asus ROG Strix GL703VD-DB74 | |
| Acer Aspire V17 Nitro BE VN7-793G-52XN | |
| Rendering Single 32Bit | |
| Acer Aspire V17 Nitro BE VN7-793-738J | |
| Acer Predator Helios 300 | |
| Asus ROG Strix GL703VD-DB74 | |
| Acer Aspire V17 Nitro BE VN7-793G-52XN | |
| wPrime 2.10 - 1024m | |
| Asus ROG Strix GL703VD-DB74 | |
| MSI GS73VR 7RF | |
* ... más pequeño es mejor
| PCMark 8 Home Score Accelerated v2 | 3868 puntos | |
| PCMark 8 Creative Score Accelerated v2 | 4967 puntos | |
| PCMark 8 Work Score Accelerated v2 | 4998 puntos | |
| PCMark 10 Score | 4309 puntos | |
ayuda | ||
| Asus ROG Strix GL703VD-DB74 SanDisk SD8SN8U256G1002 | Acer Predator Helios 300 Intel SSD 600p SSDPEKKW512G7 | Acer Aspire V17 Nitro BE VN7-793G-52XN SK Hynix HFS256G39TND-N210A | HP Omen 17-w206ng Samsung PM961 MZVLW256HEHP | MSI GL72 7RDX-602 HGST Travelstar 7K1000 HTS721010A9E630 | MSI GS73VR 7RF Samsung SM961 MZVKW512HMJP m.2 PCI-e | |
|---|---|---|---|---|---|---|
| CrystalDiskMark 3.0 | 67% | 5% | 157% | -88% | 149% | |
| Write 4k QD32 (MB/s) | 214.2 | 404.5 89% | 267 25% | 505 136% | 1.102 -99% | 355.3 66% |
| Read 4k QD32 (MB/s) | 327.3 | 457.7 40% | 344.6 5% | 588 80% | 1.068 -100% | 454.1 39% |
| Write 4k (MB/s) | 49.93 | 125.5 151% | 76.2 53% | 155.6 212% | 1.022 -98% | 131.5 163% |
| Read 4k (MB/s) | 26.18 | 34.29 31% | 28.4 8% | 59.9 129% | 0.582 -98% | 48.5 85% |
| Write 512 (MB/s) | 339 | 425.9 26% | 267.8 -21% | 805 137% | 58.3 -83% | 748 121% |
| Read 512 (MB/s) | 321.5 | 580 80% | 325.8 1% | 846 163% | 45.57 -86% | 445.2 38% |
| Write Seq (MB/s) | 444.4 | 569 28% | 270.2 -39% | 1176 165% | 127 -71% | 1609 262% |
| Read Seq (MB/s) | 476 | 899 89% | 493.1 4% | 1606 237% | 135.3 -72% | 2459 417% |

| 3DMark | |
| 1280x720 Cloud Gate Standard Graphics | |
| Acer Predator Helios 300 | |
| Acer Aspire V17 Nitro BE VN7-793G-52XN | |
| MSI GS73VR 7RF | |
| Asus ROG Strix GL703VD-DB74 | |
| MSI GL72 7RDX-602 | |
| 1920x1080 Fire Strike Graphics | |
| Acer Predator Helios 300 | |
| Acer Aspire V17 Nitro BE VN7-793-738J | |
| MSI GS73VR 7RF | |
| Acer Aspire V17 Nitro BE VN7-793G-52XN | |
| Asus ROG Strix GL703VD-DB74 | |
| MSI GL72 7RDX-602 | |
| 3DMark 11 Performance | 7751 puntos | |
| 3DMark Cloud Gate Standard Score | 20414 puntos | |
| 3DMark Fire Strike Score | 5642 puntos | |
| 3DMark Fire Strike Extreme Score | 2765 puntos | |
ayuda | ||
| Rise of the Tomb Raider | |
| 1920x1080 Very High Preset AA:FX AF:16x (ordenar por valor) | |
| Asus ROG Strix GL703VD-DB74 | |
| Acer Predator Helios 300 | |
| Acer Aspire V17 Nitro BE VN7-793G-52XN | |
| MSI GL72 7RDX-602 | |
| MSI GS73VR 7RF | |
| 1920x1080 High Preset AA:FX AF:4x (ordenar por valor) | |
| Asus ROG Strix GL703VD-DB74 | |
| Acer Predator Helios 300 | |
| Acer Aspire V17 Nitro BE VN7-793G-52XN | |
| MSI GL72 7RDX-602 | |
| 1366x768 Medium Preset AF:2x (ordenar por valor) | |
| Asus ROG Strix GL703VD-DB74 | |
| Acer Predator Helios 300 | |
| Acer Aspire V17 Nitro BE VN7-793G-52XN | |
| MSI GL72 7RDX-602 | |
| 1024x768 Lowest Preset (ordenar por valor) | |
| Asus ROG Strix GL703VD-DB74 | |
| Acer Predator Helios 300 | |
| Acer Aspire V17 Nitro BE VN7-793G-52XN | |
| MSI GL72 7RDX-602 | |
| bajo | medio | alto | ultra | |
|---|---|---|---|---|
| Dirt 3 (2011) | 208.6 | 178.2 | 168 | 110.8 |
| Sleeping Dogs (2012) | 186.4 | 159.1 | 154.1 | 69 |
| Hitman: Absolution (2012) | 100.7 | 92.4 | 81.4 | 41.5 |
| Tomb Raider (2013) | 358 | 257.7 | 169 | 77.7 |
| BioShock Infinite (2013) | 237.6 | 178.3 | 158.8 | 64.8 |
| Metro: Last Light (2013) | 103.7 | 95.1 | 60.4 | 50 |
| GRID 2 (2013) | 150 | 111.8 | 101.4 | 74.4 |
| Company of Heroes 2 (2013) | 52.2 | 48 | 45.8 | 25.1 |
| Thief (2014) | 77.3 | 71.2 | 69.2 | 44.1 |
| The Witcher 3 (2015) | 119.2 | 73 | 41.2 | 23 |
| Rise of the Tomb Raider (2016) | 117 | 73 | 43 | 35 |
| Ashes of the Singularity (2016) | 46.4 | 37.9 | 34.3 |
Ruido
| Ocioso |
| 30.4 / 30.4 / 30.4 dB(A) |
| Carga |
| 36.4 / 53 dB(A) |
 | ||
30 dB silencioso 40 dB(A) audible 50 dB(A) ruidosamente alto |
||
min: | ||
| Asus ROG Strix GL703VD-DB74 GeForce GTX 1050 Mobile, i7-7700HQ, SanDisk SD8SN8U256G1002 | Acer Predator Helios 300 GeForce GTX 1060 Mobile, i7-7700HQ, Intel SSD 600p SSDPEKKW512G7 | Acer Aspire V17 Nitro BE VN7-793G-52XN GeForce GTX 1060 Mobile, i5-7300HQ, SK Hynix HFS256G39TND-N210A | HP Omen 17-w206ng GeForce GTX 1050 Ti Mobile, i7-7700HQ, Samsung PM961 MZVLW256HEHP | MSI GL72 7RDX-602 GeForce GTX 1050 Mobile, i7-7700HQ, HGST Travelstar 7K1000 HTS721010A9E630 | MSI GS73VR 7RF GeForce GTX 1060 Mobile, i7-7700HQ, Samsung SM961 MZVKW512HMJP m.2 PCI-e | |
|---|---|---|---|---|---|---|
| Noise | -6% | 3% | -12% | -4% | -1% | |
| apagado / medio ambiente * (dB) | 27.9 | 31 -11% | 30.7 -10% | 30 -8% | 30.8 -10% | 28.1 -1% |
| Idle Minimum * (dB) | 30.4 | 31 -2% | 30.7 -1% | 34 -12% | 32.4 -7% | 30.8 -1% |
| Idle Average * (dB) | 30.4 | 32 -5% | 30.7 -1% | 35 -15% | 32.4 -7% | 30.8 -1% |
| Idle Maximum * (dB) | 30.4 | 33 -9% | 31.4 -3% | 36 -18% | 32.8 -8% | 30.9 -2% |
| Load Average * (dB) | 36.4 | 44 -21% | 32.1 12% | 47 -29% | 40.9 -12% | 42.2 -16% |
| Witcher 3 ultra * (dB) | 46 | 46 -0% | 42.8 7% | 48 -4% | 44.4 3% | |
| Load Maximum * (dB) | 53 | 50 6% | 42.8 19% | 52 2% | 43.6 18% | 48.6 8% |
* ... más pequeño es mejor
(-) La temperatura máxima en la parte superior es de 68.8 °C / 156 F, frente a la media de 40.4 °C / 105 F, que oscila entre 21.2 y 68.8 °C para la clase Gaming.
(-) El fondo se calienta hasta un máximo de 62 °C / 144 F, frente a la media de 43.2 °C / 110 F
(+) En reposo, la temperatura media de la parte superior es de 28.8 °C / 84# F, frente a la media del dispositivo de 33.9 °C / 93 F.
(-) Jugando a The Witcher 3, la temperatura media de la parte superior es de 39 °C / 102 F, frente a la media del dispositivo de 33.9 °C / 93 F.
(+) El reposamanos y el panel táctil están a una temperatura inferior a la de la piel, con un máximo de 31.4 °C / 88.5 F y, por tanto, son fríos al tacto.
(-) La temperatura media de la zona del reposamanos de dispositivos similares fue de 28.8 °C / 83.8 F (-2.6 °C / -4.7 F).
Asus ROG Strix GL703VD-DB74 análisis de audio
(-) | altavoces no muy altos (#66.2 dB)
Graves 100 - 315 Hz
(±) | lubina reducida - en promedio 11% inferior a la mediana
(±) | la linealidad de los graves es media (14.5% delta a frecuencia anterior)
Medios 400 - 2000 Hz
(+) | medios equilibrados - a sólo 3.5% de la mediana
(±) | la linealidad de los medios es media (7.1% delta respecto a la frecuencia anterior)
Altos 2 - 16 kHz
(+) | máximos equilibrados - a sólo 3.3% de la mediana
(±) | la linealidad de los máximos es media (9% delta a frecuencia anterior)
Total 100 - 16.000 Hz
(±) | la linealidad del sonido global es media (19.7% de diferencia con la mediana)
En comparación con la misma clase
» 69% de todos los dispositivos probados de esta clase eran mejores, 6% similares, 25% peores
» El mejor tuvo un delta de 6%, la media fue 18%, el peor fue ###max##%
En comparación con todos los dispositivos probados
» 50% de todos los dispositivos probados eran mejores, 7% similares, 43% peores
» El mejor tuvo un delta de 4%, la media fue 23%, el peor fue ###max##%
Apple MacBook 12 (Early 2016) 1.1 GHz análisis de audio
(+) | los altavoces pueden reproducir a un volumen relativamente alto (#83.6 dB)
Graves 100 - 315 Hz
(±) | lubina reducida - en promedio 11.3% inferior a la mediana
(±) | la linealidad de los graves es media (14.2% delta a frecuencia anterior)
Medios 400 - 2000 Hz
(+) | medios equilibrados - a sólo 2.4% de la mediana
(+) | los medios son lineales (5.5% delta a la frecuencia anterior)
Altos 2 - 16 kHz
(+) | máximos equilibrados - a sólo 2% de la mediana
(+) | los máximos son lineales (4.5% delta a la frecuencia anterior)
Total 100 - 16.000 Hz
(+) | el sonido global es lineal (10.2% de diferencia con la mediana)
En comparación con la misma clase
» 7% de todos los dispositivos probados de esta clase eran mejores, 2% similares, 90% peores
» El mejor tuvo un delta de 5%, la media fue 18%, el peor fue ###max##%
En comparación con todos los dispositivos probados
» 5% de todos los dispositivos probados eran mejores, 1% similares, 94% peores
» El mejor tuvo un delta de 4%, la media fue 23%, el peor fue ###max##%
| Off / Standby | |
| Ocioso | |
| Carga |
|
Clave:
min: | |
| Asus ROG Strix GL703VD-DB74 i7-7700HQ, GeForce GTX 1050 Mobile, SanDisk SD8SN8U256G1002, IPS, 1920x1080, 17.3" | Acer Predator Helios 300 i7-7700HQ, GeForce GTX 1060 Mobile, Intel SSD 600p SSDPEKKW512G7, AH-IPS, WLED, 1920x1080, 17.3" | Acer Aspire V17 Nitro BE VN7-793G-52XN i5-7300HQ, GeForce GTX 1060 Mobile, SK Hynix HFS256G39TND-N210A, a-Si TFT-LCD, WLED, 1920x1080, 17.3" | HP Omen 17-w206ng i7-7700HQ, GeForce GTX 1050 Ti Mobile, Samsung PM961 MZVLW256HEHP, IPS, 1920x1080, 17.3" | MSI GL72 7RDX-602 i7-7700HQ, GeForce GTX 1050 Mobile, HGST Travelstar 7K1000 HTS721010A9E630, TN LED, 1920x1080, 17.3" | MSI GS73VR 7RF i7-7700HQ, GeForce GTX 1060 Mobile, Samsung SM961 MZVKW512HMJP m.2 PCI-e, IPS, 3840x2160, 17.3" | Acer Aspire V17 Nitro BE VN7-793-738J i7-7700HQ, GeForce GTX 1060 Mobile, Intel SSD 600p SSDPEKKW512G7, IPS, 3840x2160, 17.3" | |
|---|---|---|---|---|---|---|---|
| Power Consumption | -24% | -16% | -42% | -30% | -66% | -52% | |
| Idle Minimum * (Watt) | 5.8 | 7 -21% | 7.8 -34% | 11 -90% | 9.6 -66% | 14.2 -145% | 10.5 -81% |
| Idle Average * (Watt) | 11.6 | 13 -12% | 13.3 -15% | 18 -55% | 15 -29% | 23.5 -103% | 20.5 -77% |
| Idle Maximum * (Watt) | 12.3 | 20 -63% | 16.6 -35% | 24 -95% | 16.5 -34% | 23.8 -93% | 22 -79% |
| Load Average * (Watt) | 82.4 | 81 2% | 73 11% | 84 -2% | 104 -26% | 90.9 -10% | 91 -10% |
| Witcher 3 ultra * (Watt) | 97 | 127 -31% | 118 -22% | 101 -4% | 116 -20% | ||
| Load Maximum * (Watt) | 135.5 | 162 -20% | 140 -3% | 146 -8% | 129 5% | 171.6 -27% | 155 -14% |
* ... más pequeño es mejor
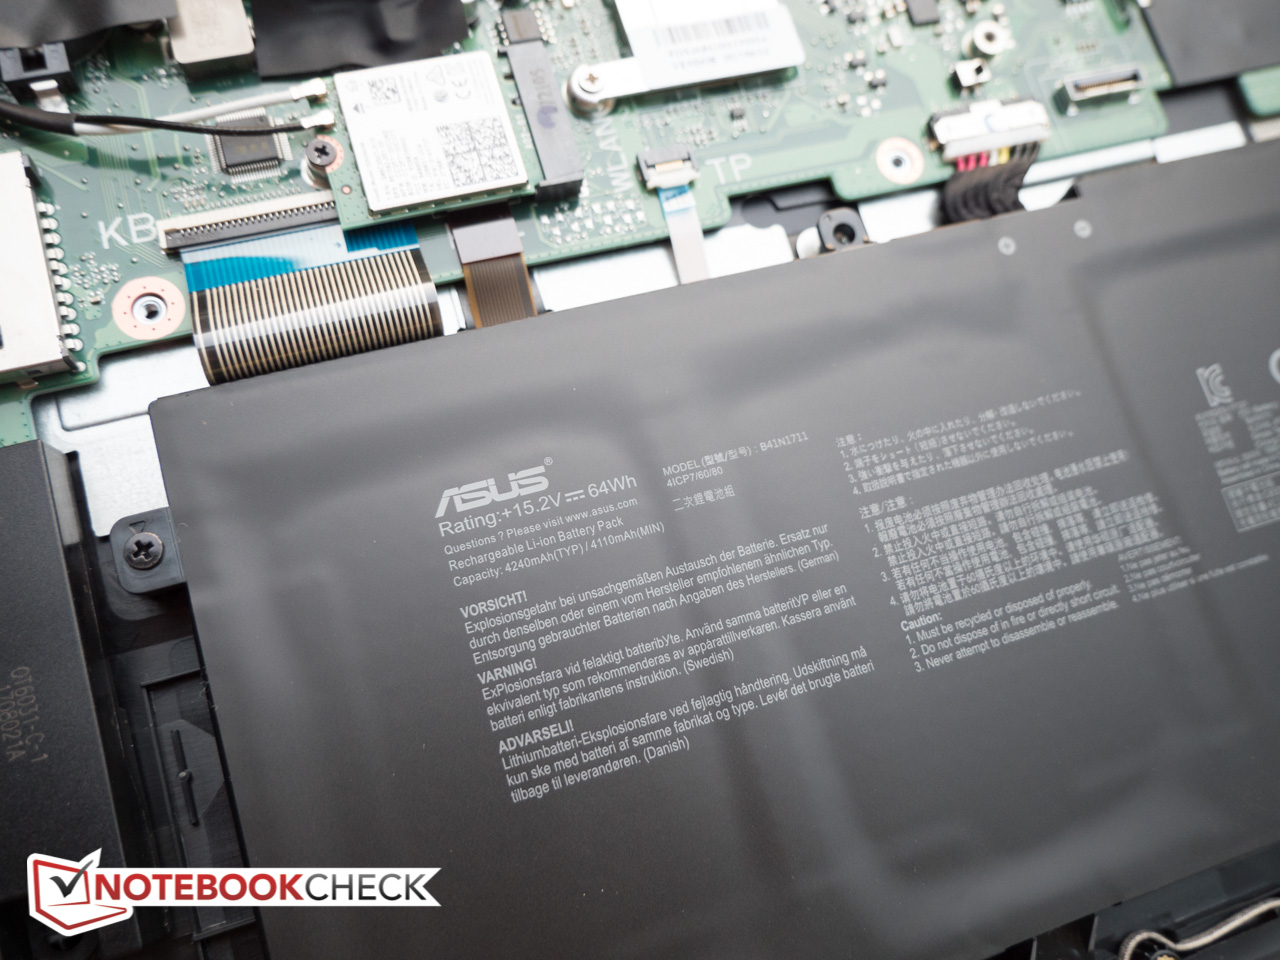
| Asus ROG Strix GL703VD-DB74 i7-7700HQ, GeForce GTX 1050 Mobile, 64 Wh | Acer Predator Helios 300 i7-7700HQ, GeForce GTX 1060 Mobile, 48 Wh | Acer Aspire V17 Nitro BE VN7-793G-52XN i5-7300HQ, GeForce GTX 1060 Mobile, 69 Wh | HP Omen 17-w206ng i7-7700HQ, GeForce GTX 1050 Ti Mobile, 62 Wh | MSI GL72 7RDX-602 i7-7700HQ, GeForce GTX 1050 Mobile, 43.2 Wh | MSI GS73VR 7RF i7-7700HQ, GeForce GTX 1060 Mobile, 65 Wh | |
|---|---|---|---|---|---|---|
| Duración de Batería | -28% | 15% | 7% | -51% | -50% | |
| Reader / Idle (h) | 13.4 | 10.2 -24% | 10.3 -23% | 13.3 -1% | 5.5 -59% | 5 -63% |
| WiFi v1.3 (h) | 7.2 | 4.7 -35% | 6.2 -14% | 6.3 -12% | 3.4 -53% | 2.7 -62% |
| Load (h) | 1.2 | 0.9 -25% | 2.2 83% | 1.6 33% | 0.7 -42% | 0.9 -25% |
Pro
Contra
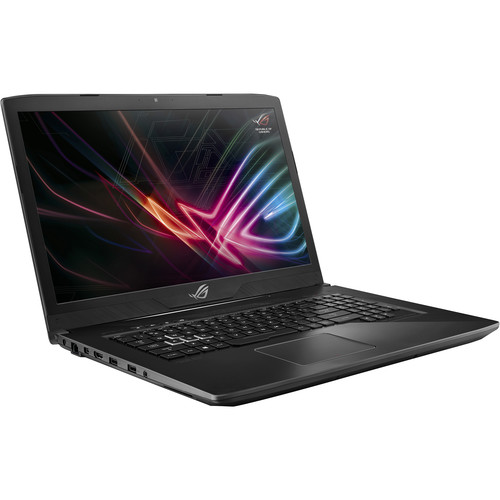

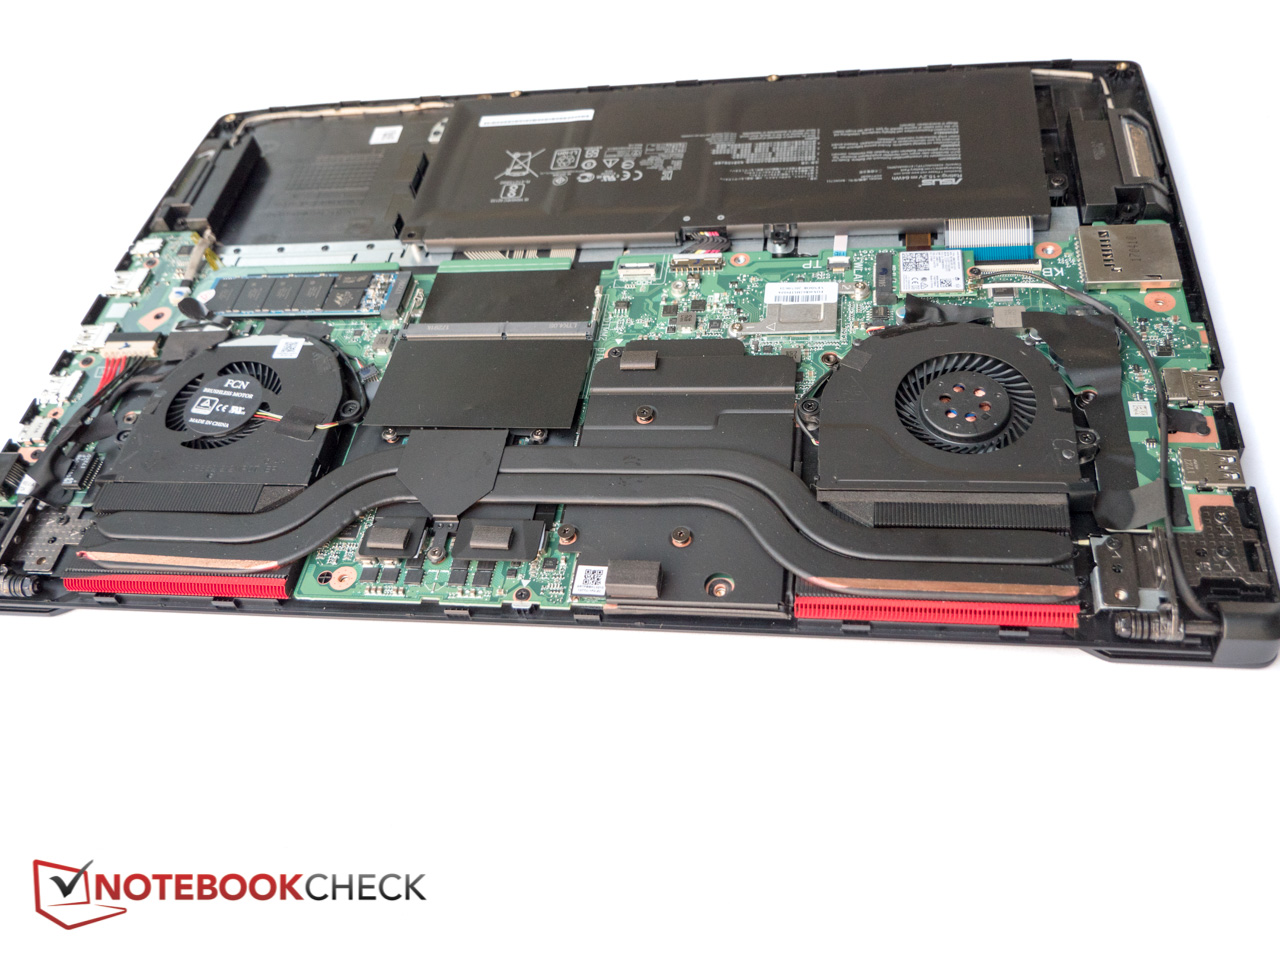
Nos provoca sentimientos encontrados: por un lado, el Asus ROG Strix GL703VD es un portátil gaming de 17" bien construido y extremadamente delgado que funciona bien, presenta una ergonomía decente y viene con una pantalla Full HD mate muy brillante y razonablemente precisa . La combinación de disco SSD primario y HDD para el almacenamiento mejora el rendimiento percibido y el portátil rivaliza con algunos Ultrabooks en lo que respecta al aguante de la batería.
También hay algunas desventajas significativas: para un portátil con una GPU más o menos básica, el GL703VD es simplemente demasiado ruidoso y también se calienta mucho. A 53 dB y con temperaturas cercanas a 70 ºC, el portátil es tan ruidoso y caliente como algunos gigantes de gaming con CPU de sobremesa y tarjetas gráficas de última generación. En este punto, solo podemos esperar que Asus rediseñe el sistema de enfriamiento para las próximas ediciones de SCAR y Hero con gráficos GTX 1060 más potentes.
Tal como está ahora, desgraciadamente no vemos una razón convincente para elegir el Strix GL703VD sobre los muchos otros portátiles gaming GTX 1050 disponibles.
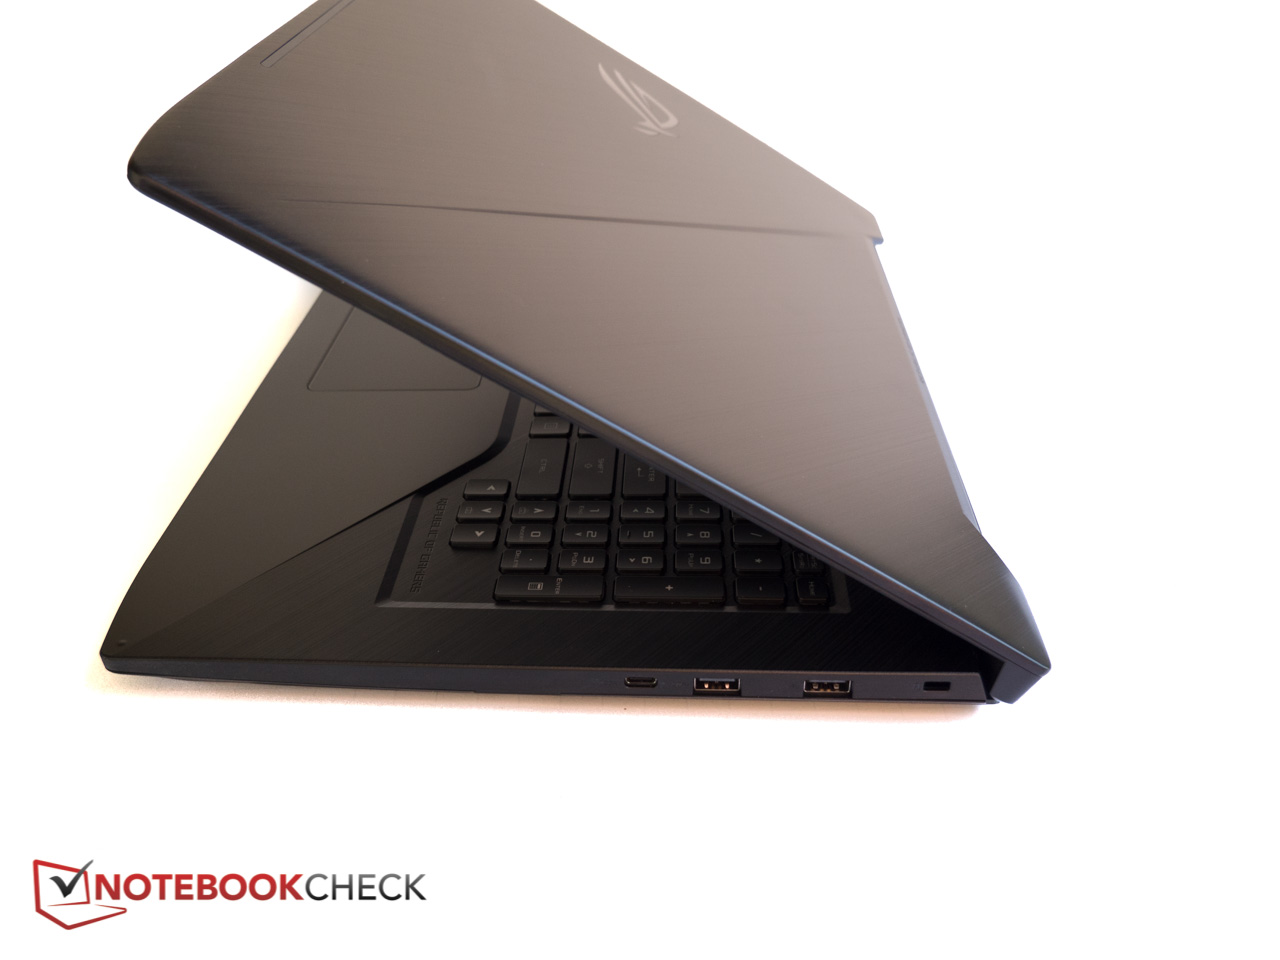
Los usuarios que buscan un portátil de 17.3" delgado y liviano de mayor rendimiento pueden considerar la serie Strix GL702 en su lugar. Incluso cuando está equipado con un GTX 1070, el GL702 permanece sustancialmente más frío y no hace tanto ruidoso. La versión con GeForce GTX 1070, i7-7700HQ, 12GB de RAM y 128GB SSD + 1TB HDD se vende por solo $ 200 más que el portátil de pruebas en el momento de escribir este artículo.
Ésta es una versión acortada del análisis original. Puedes leer el análisis completo en inglés aquí.
Asus ROG Strix GL703VD-DB74
- 10/31/2017 v6 (old)
Bernie Pechlaner
Price comparison
