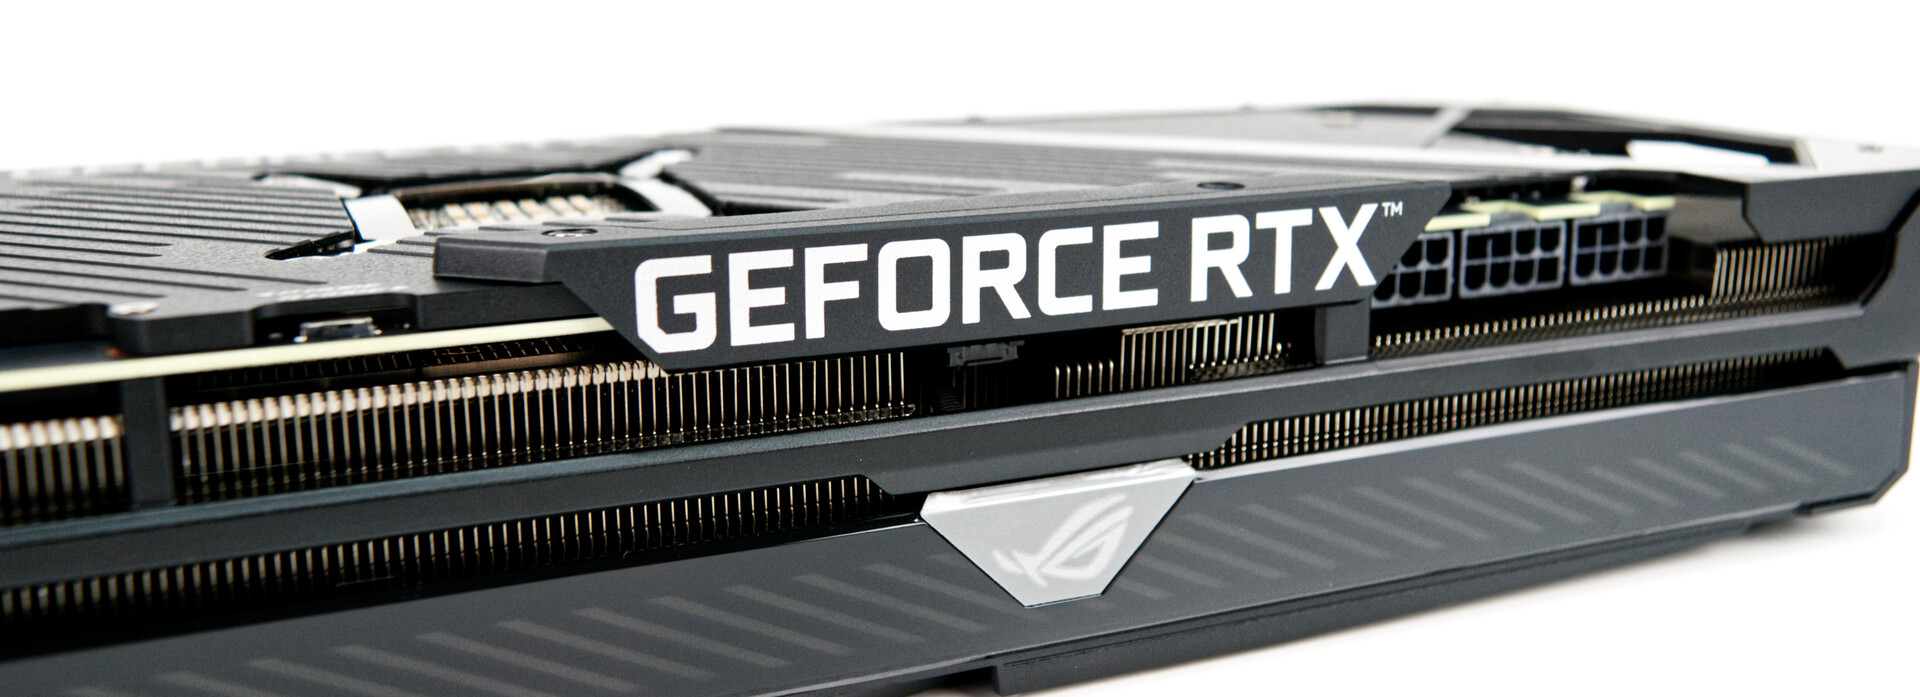
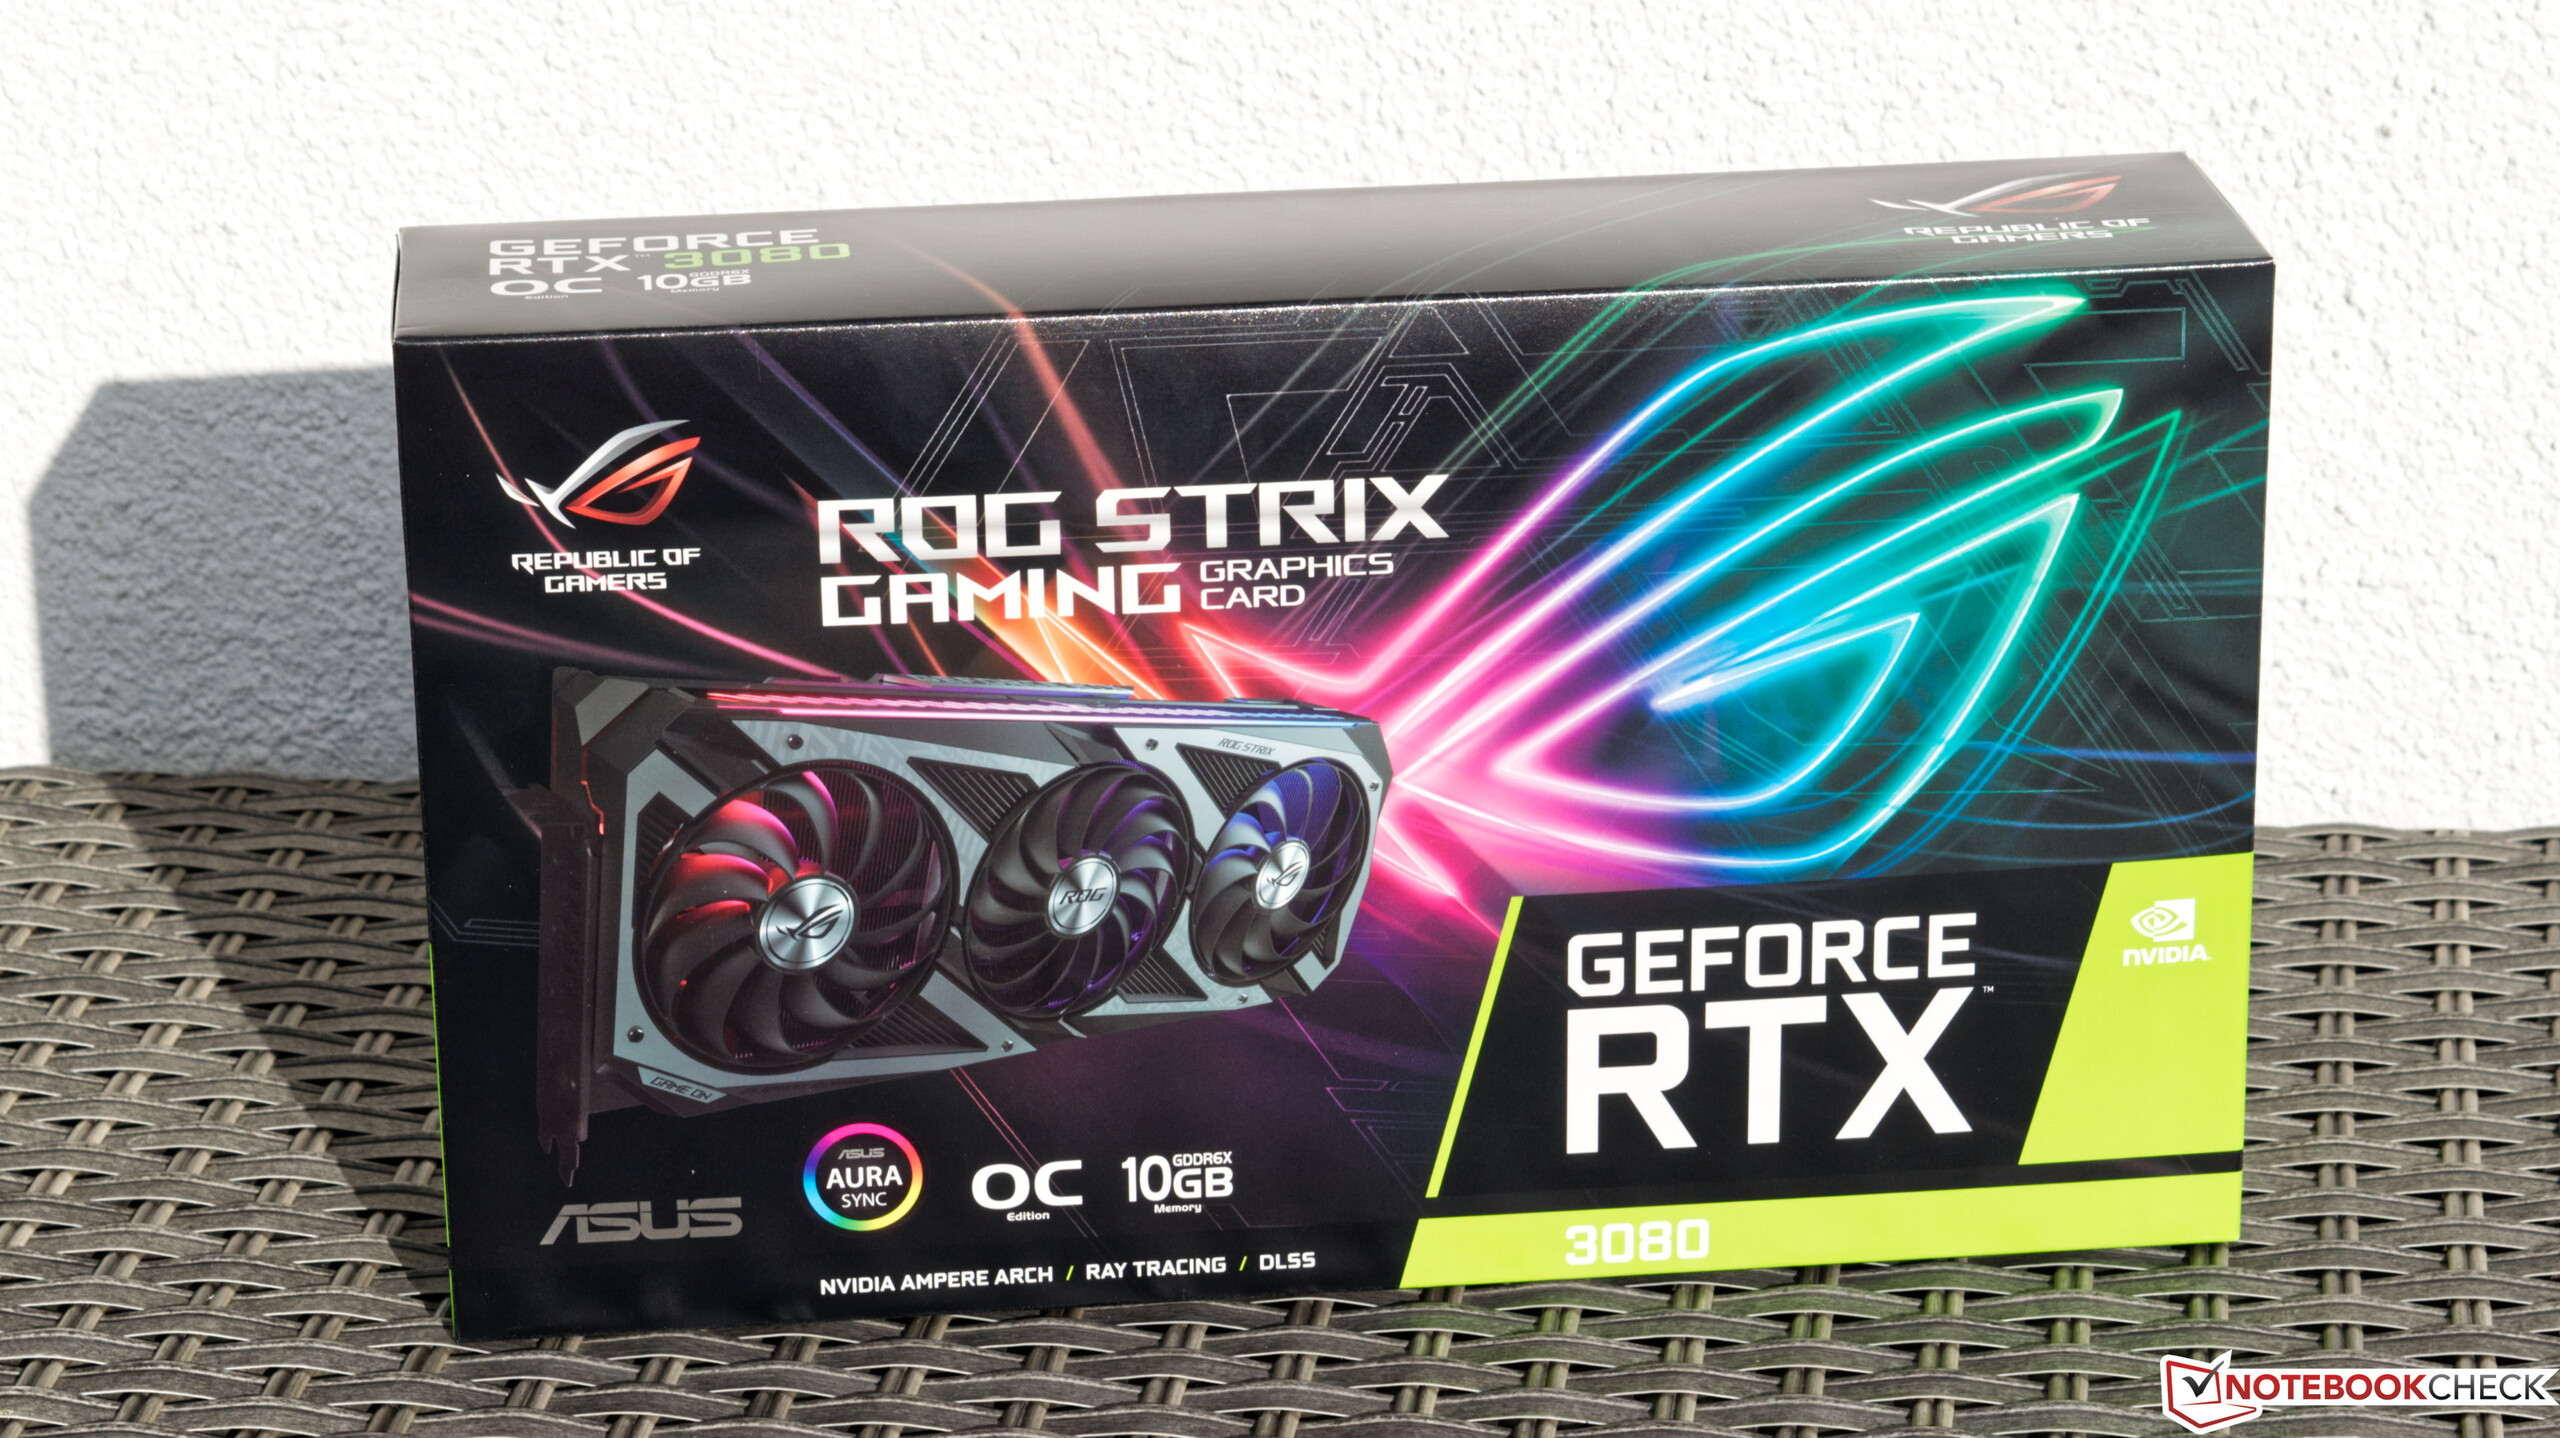
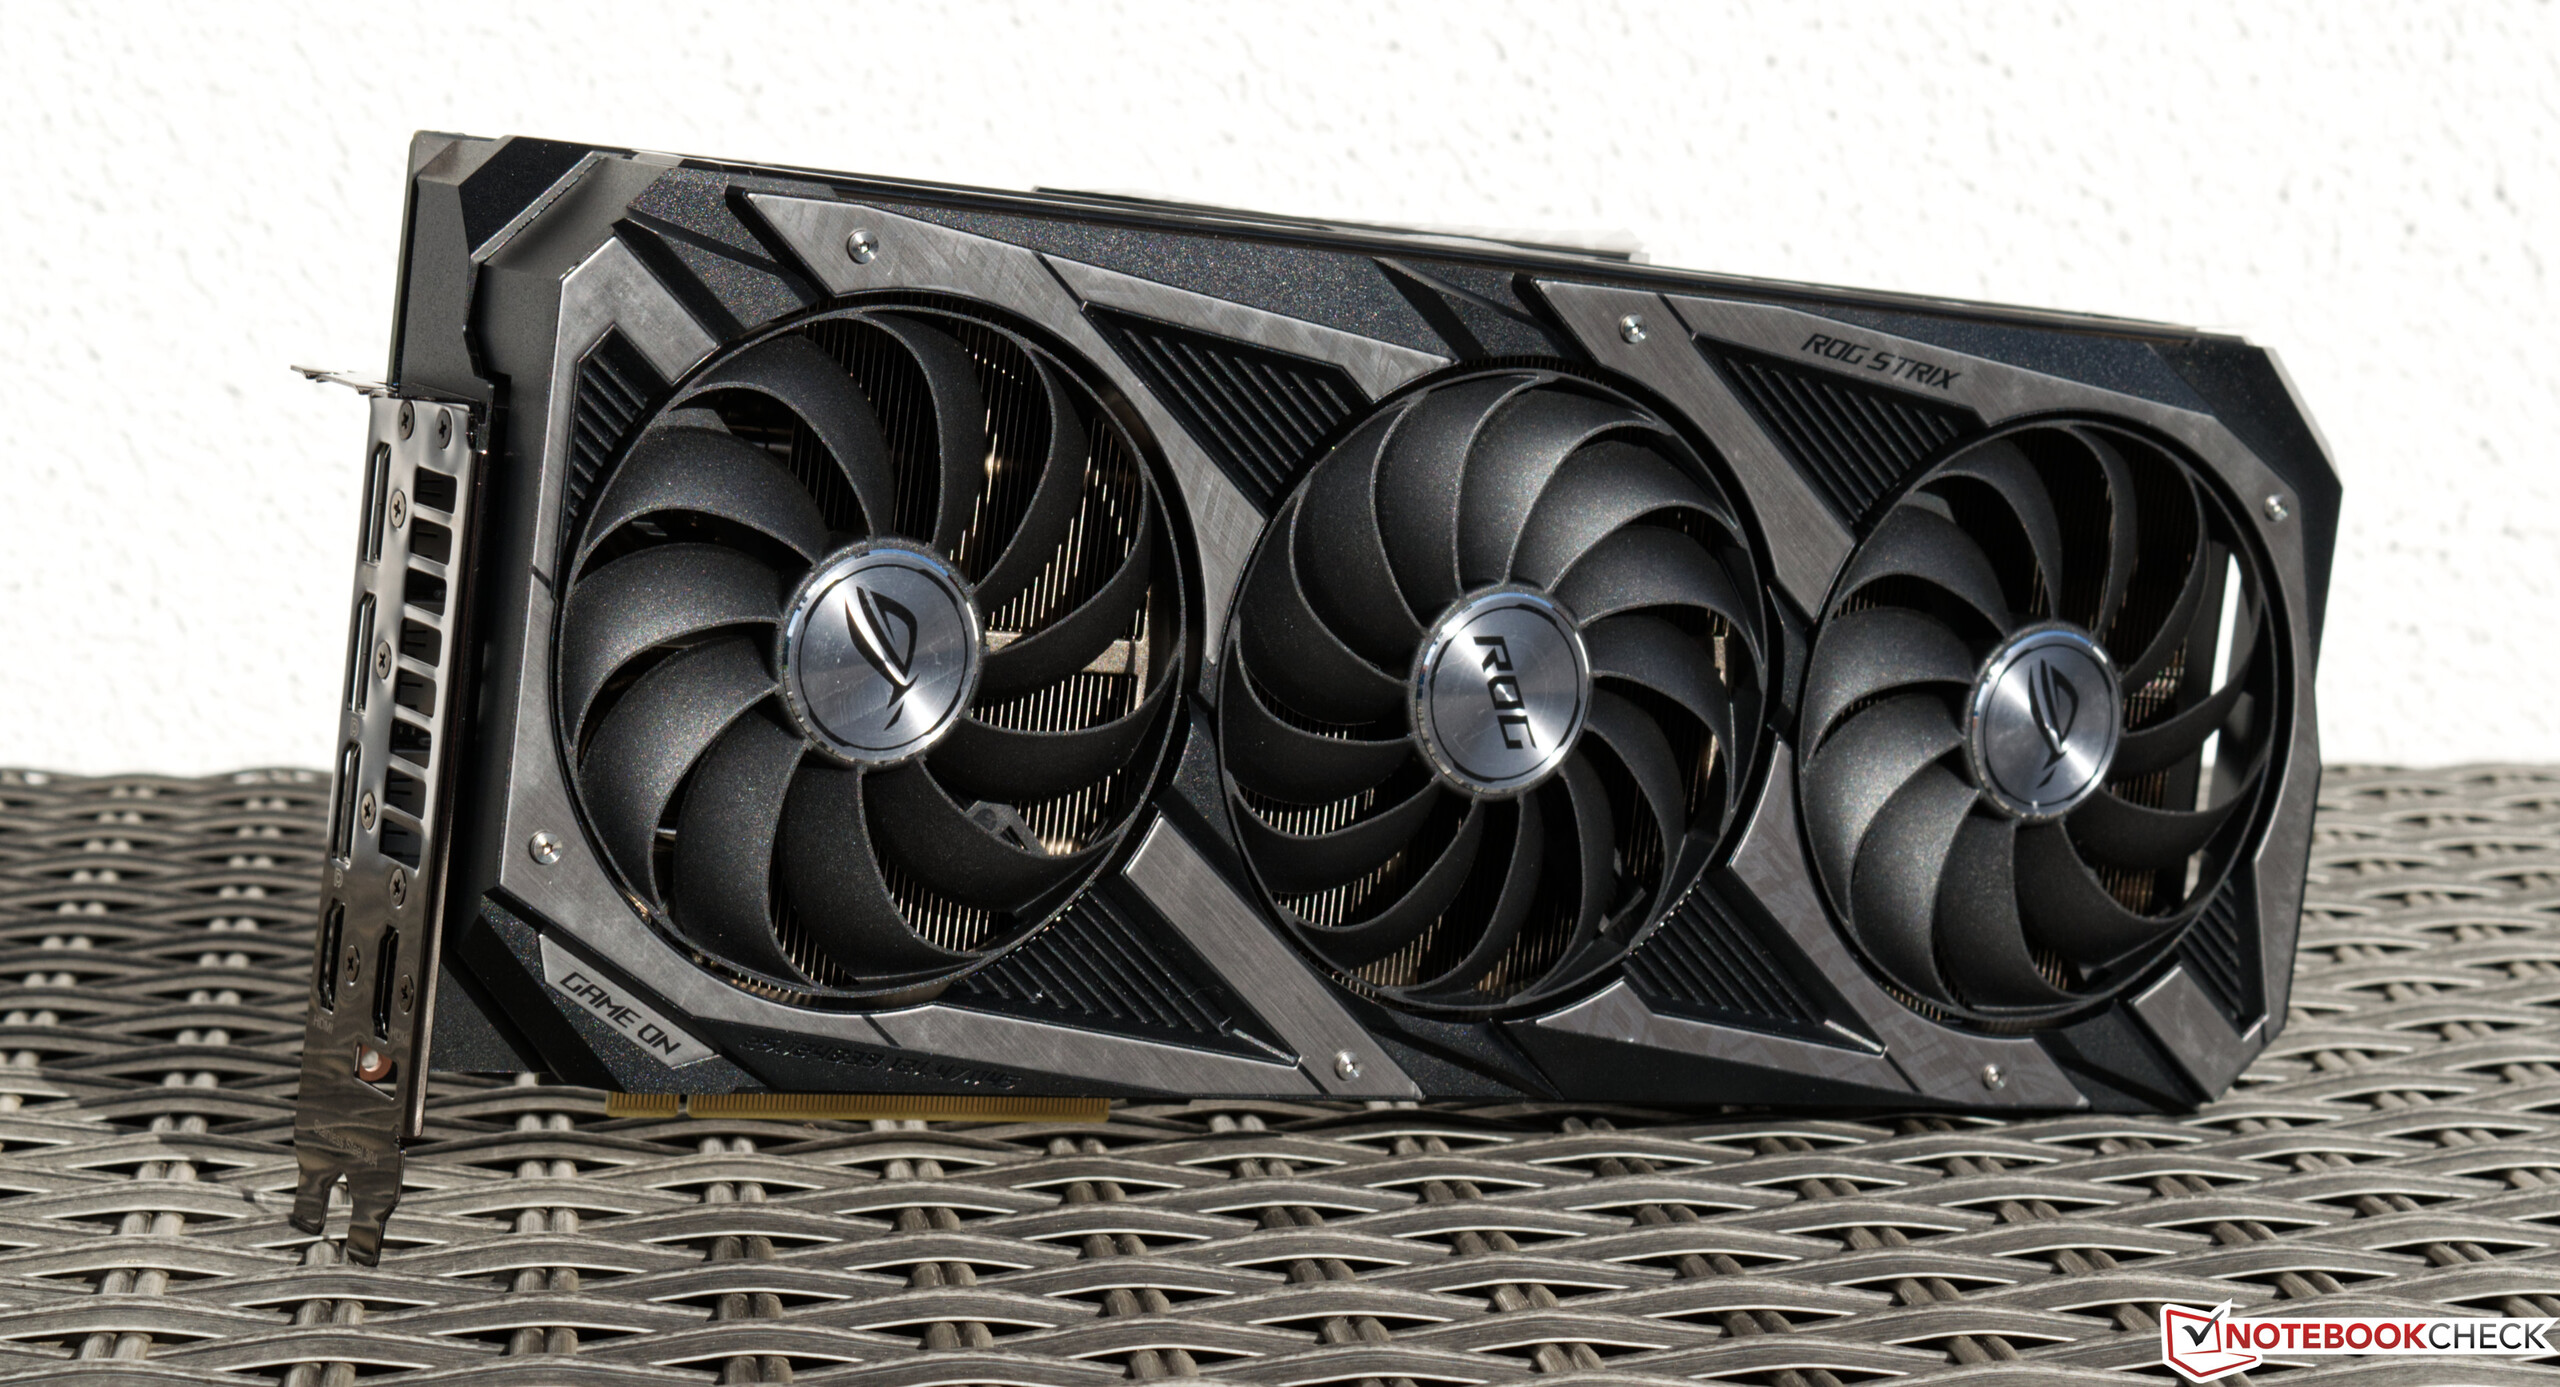
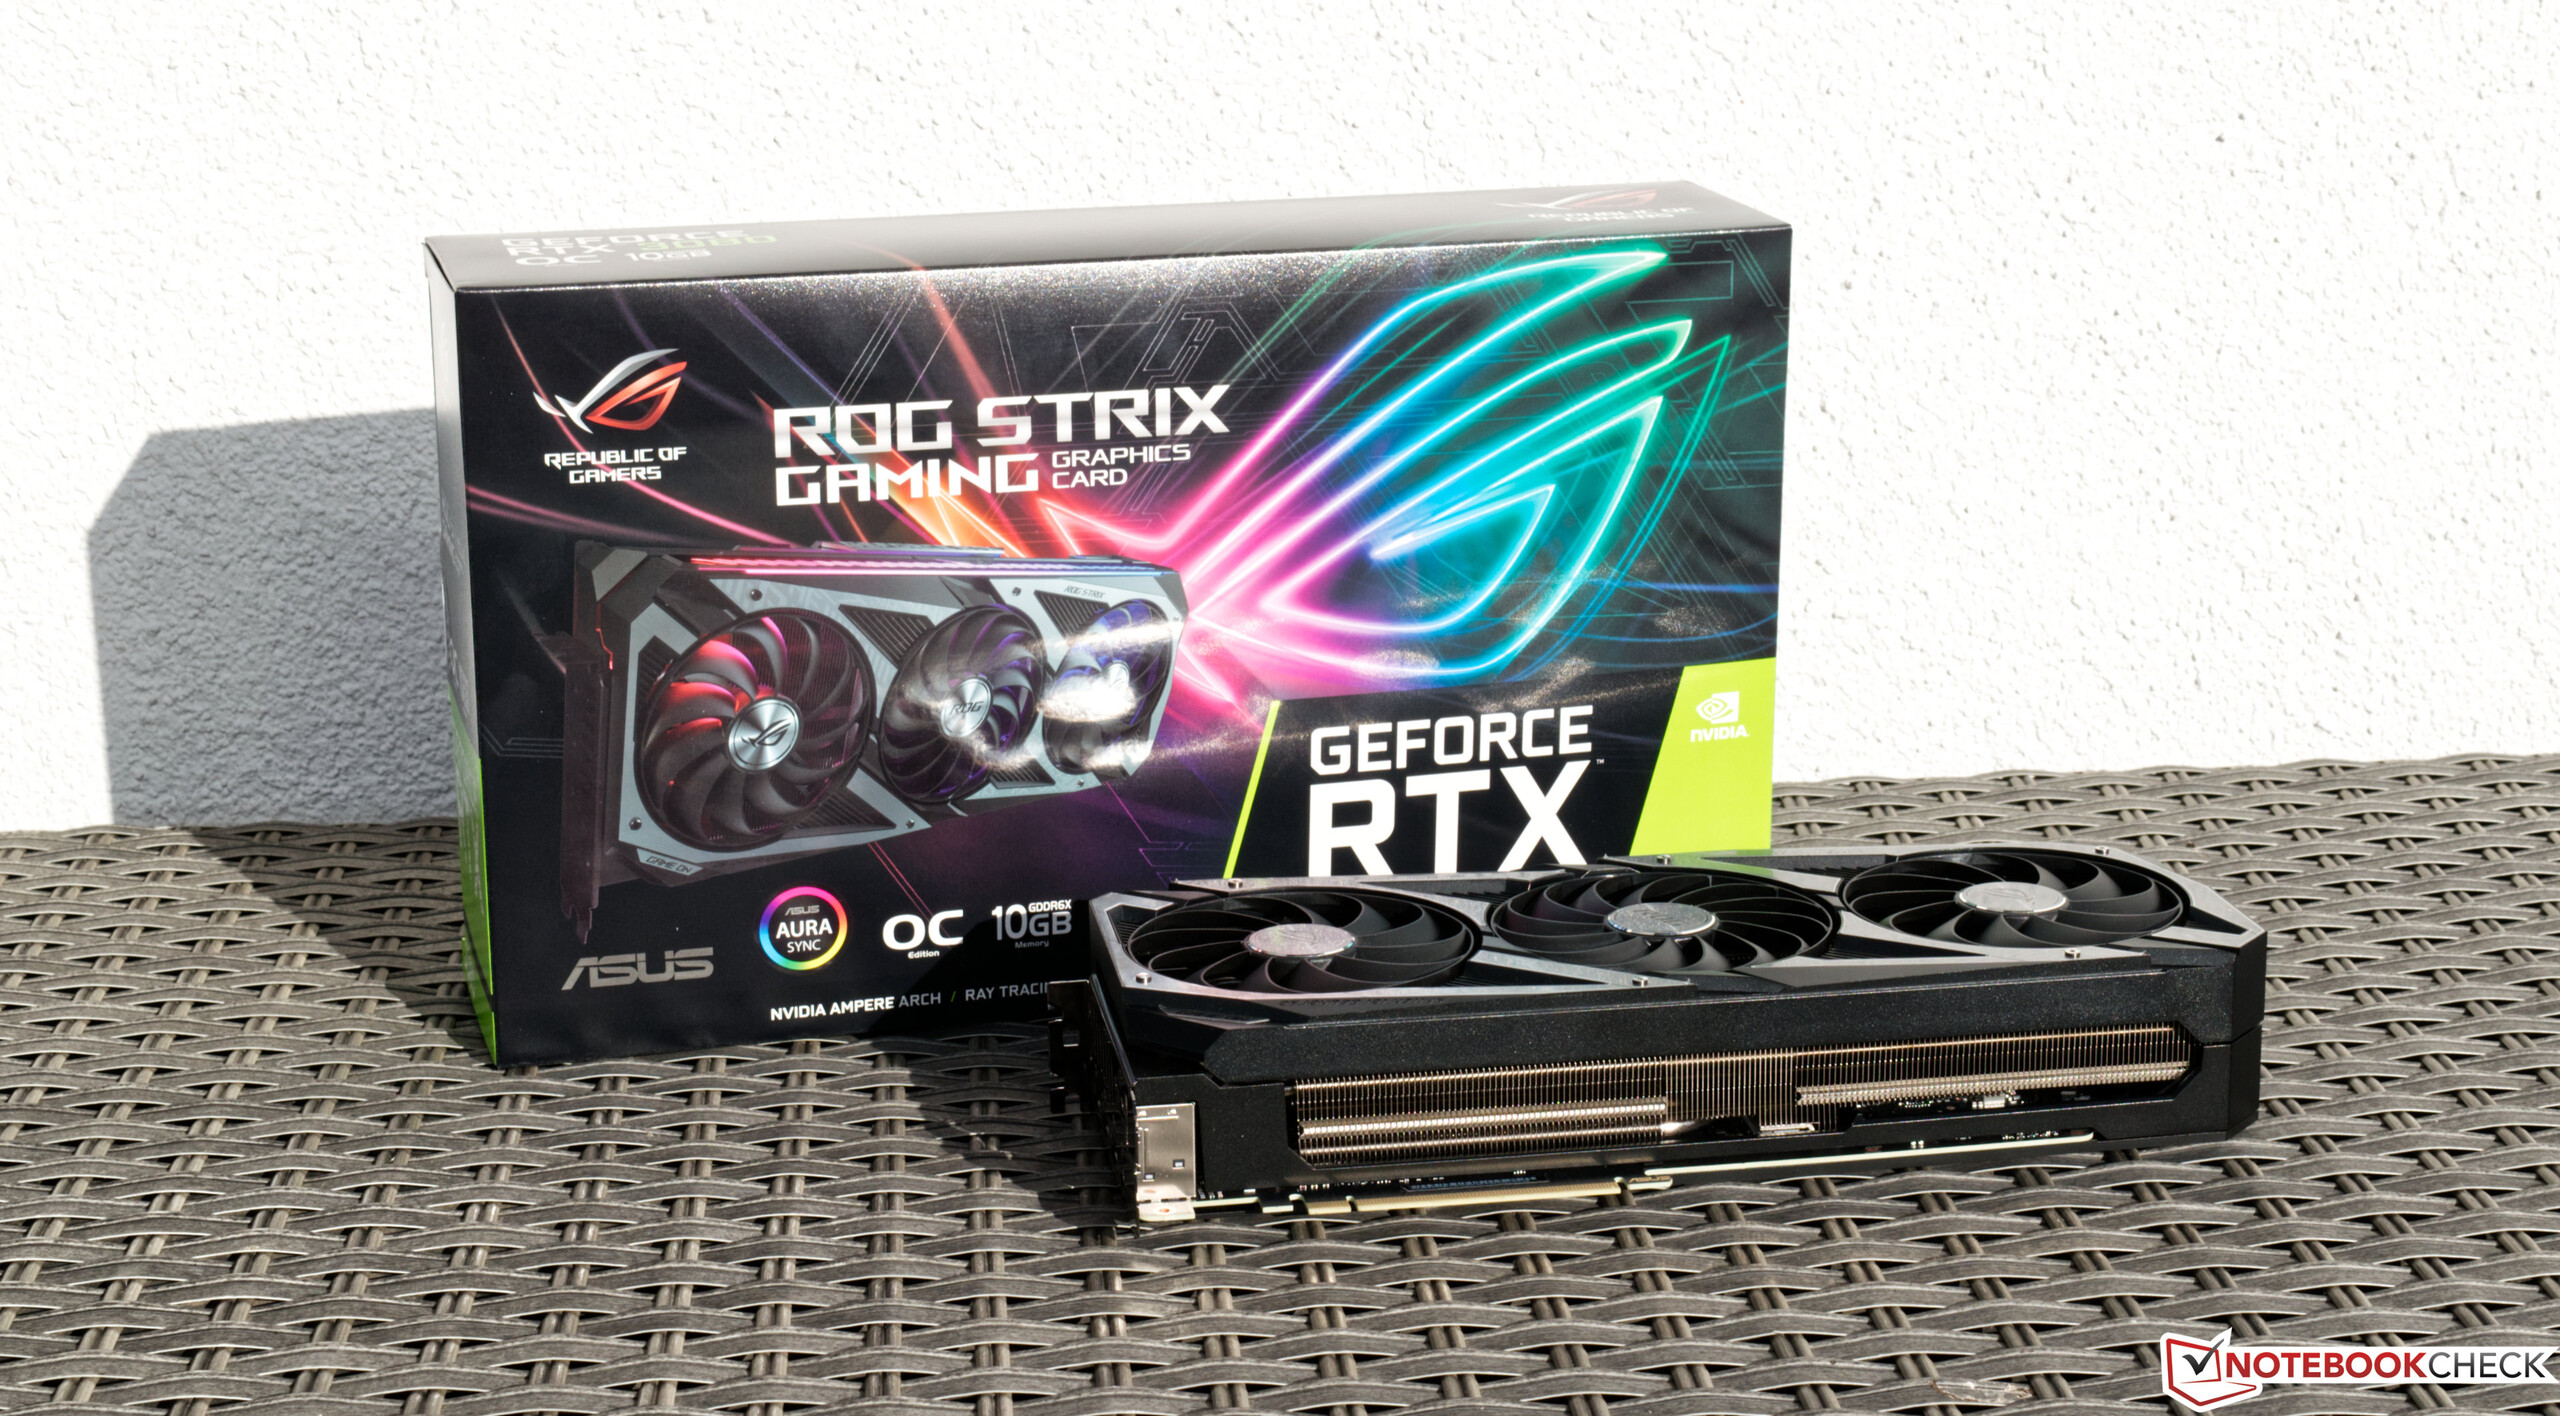
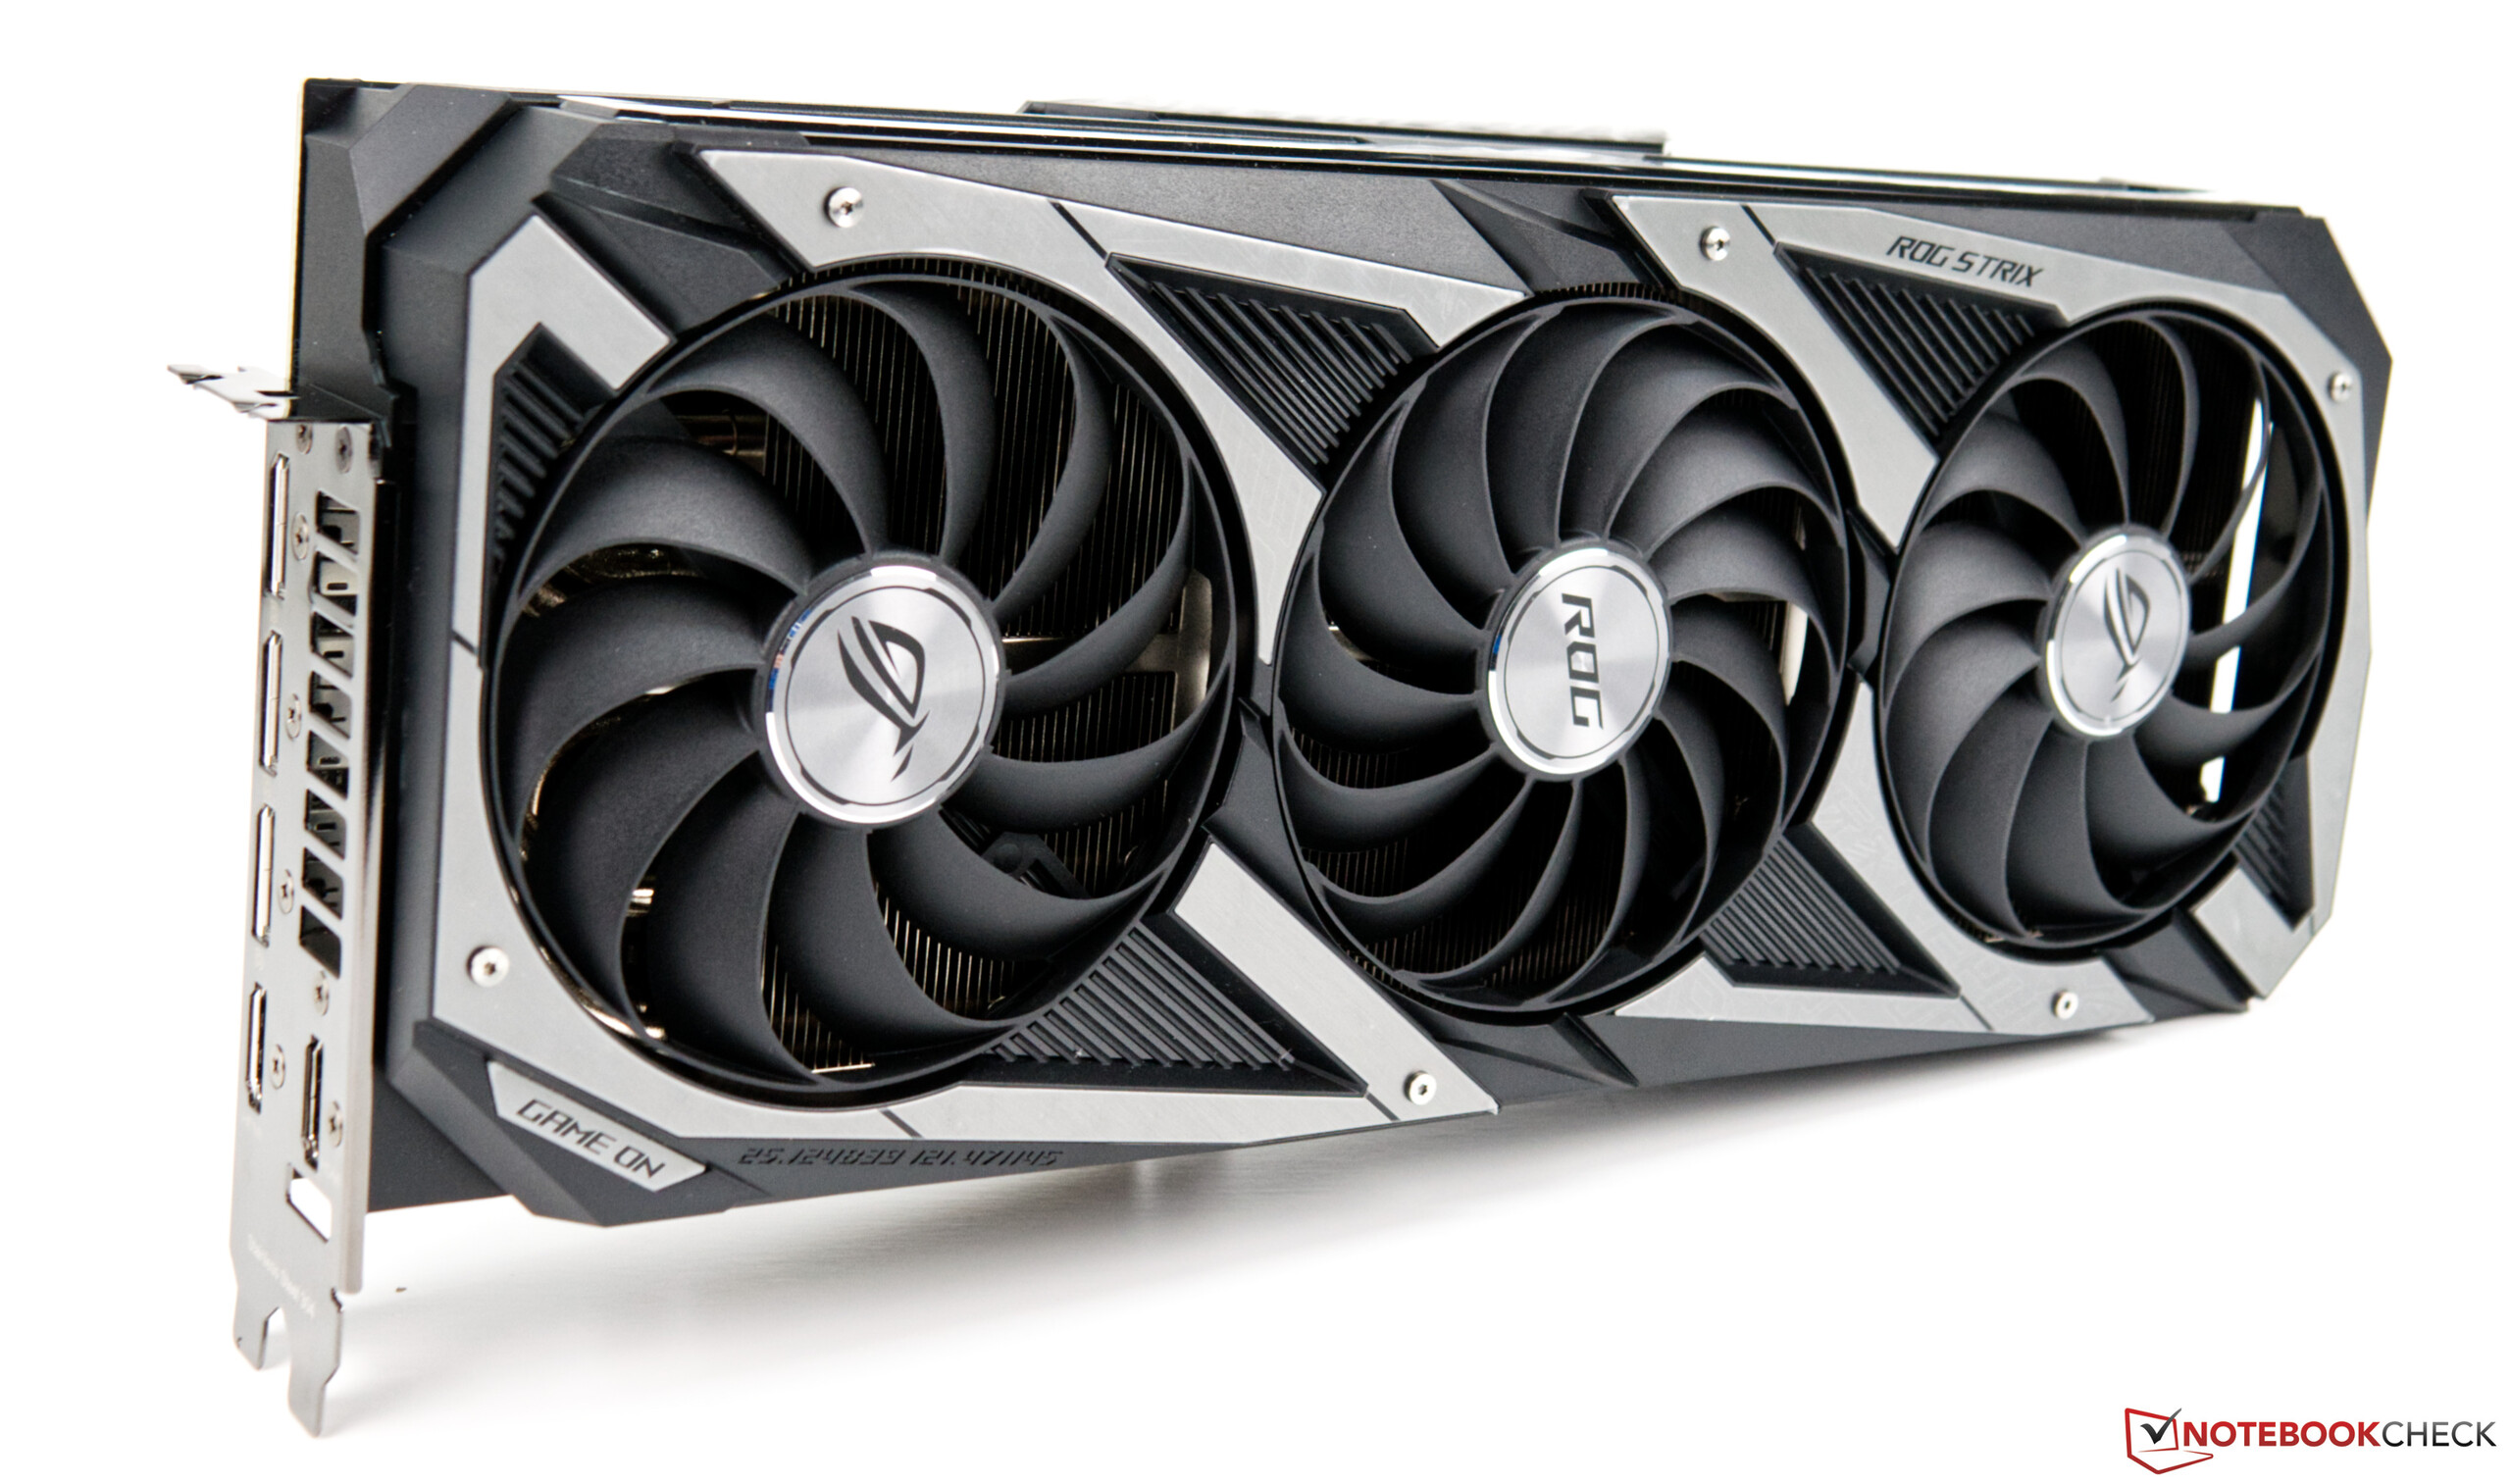
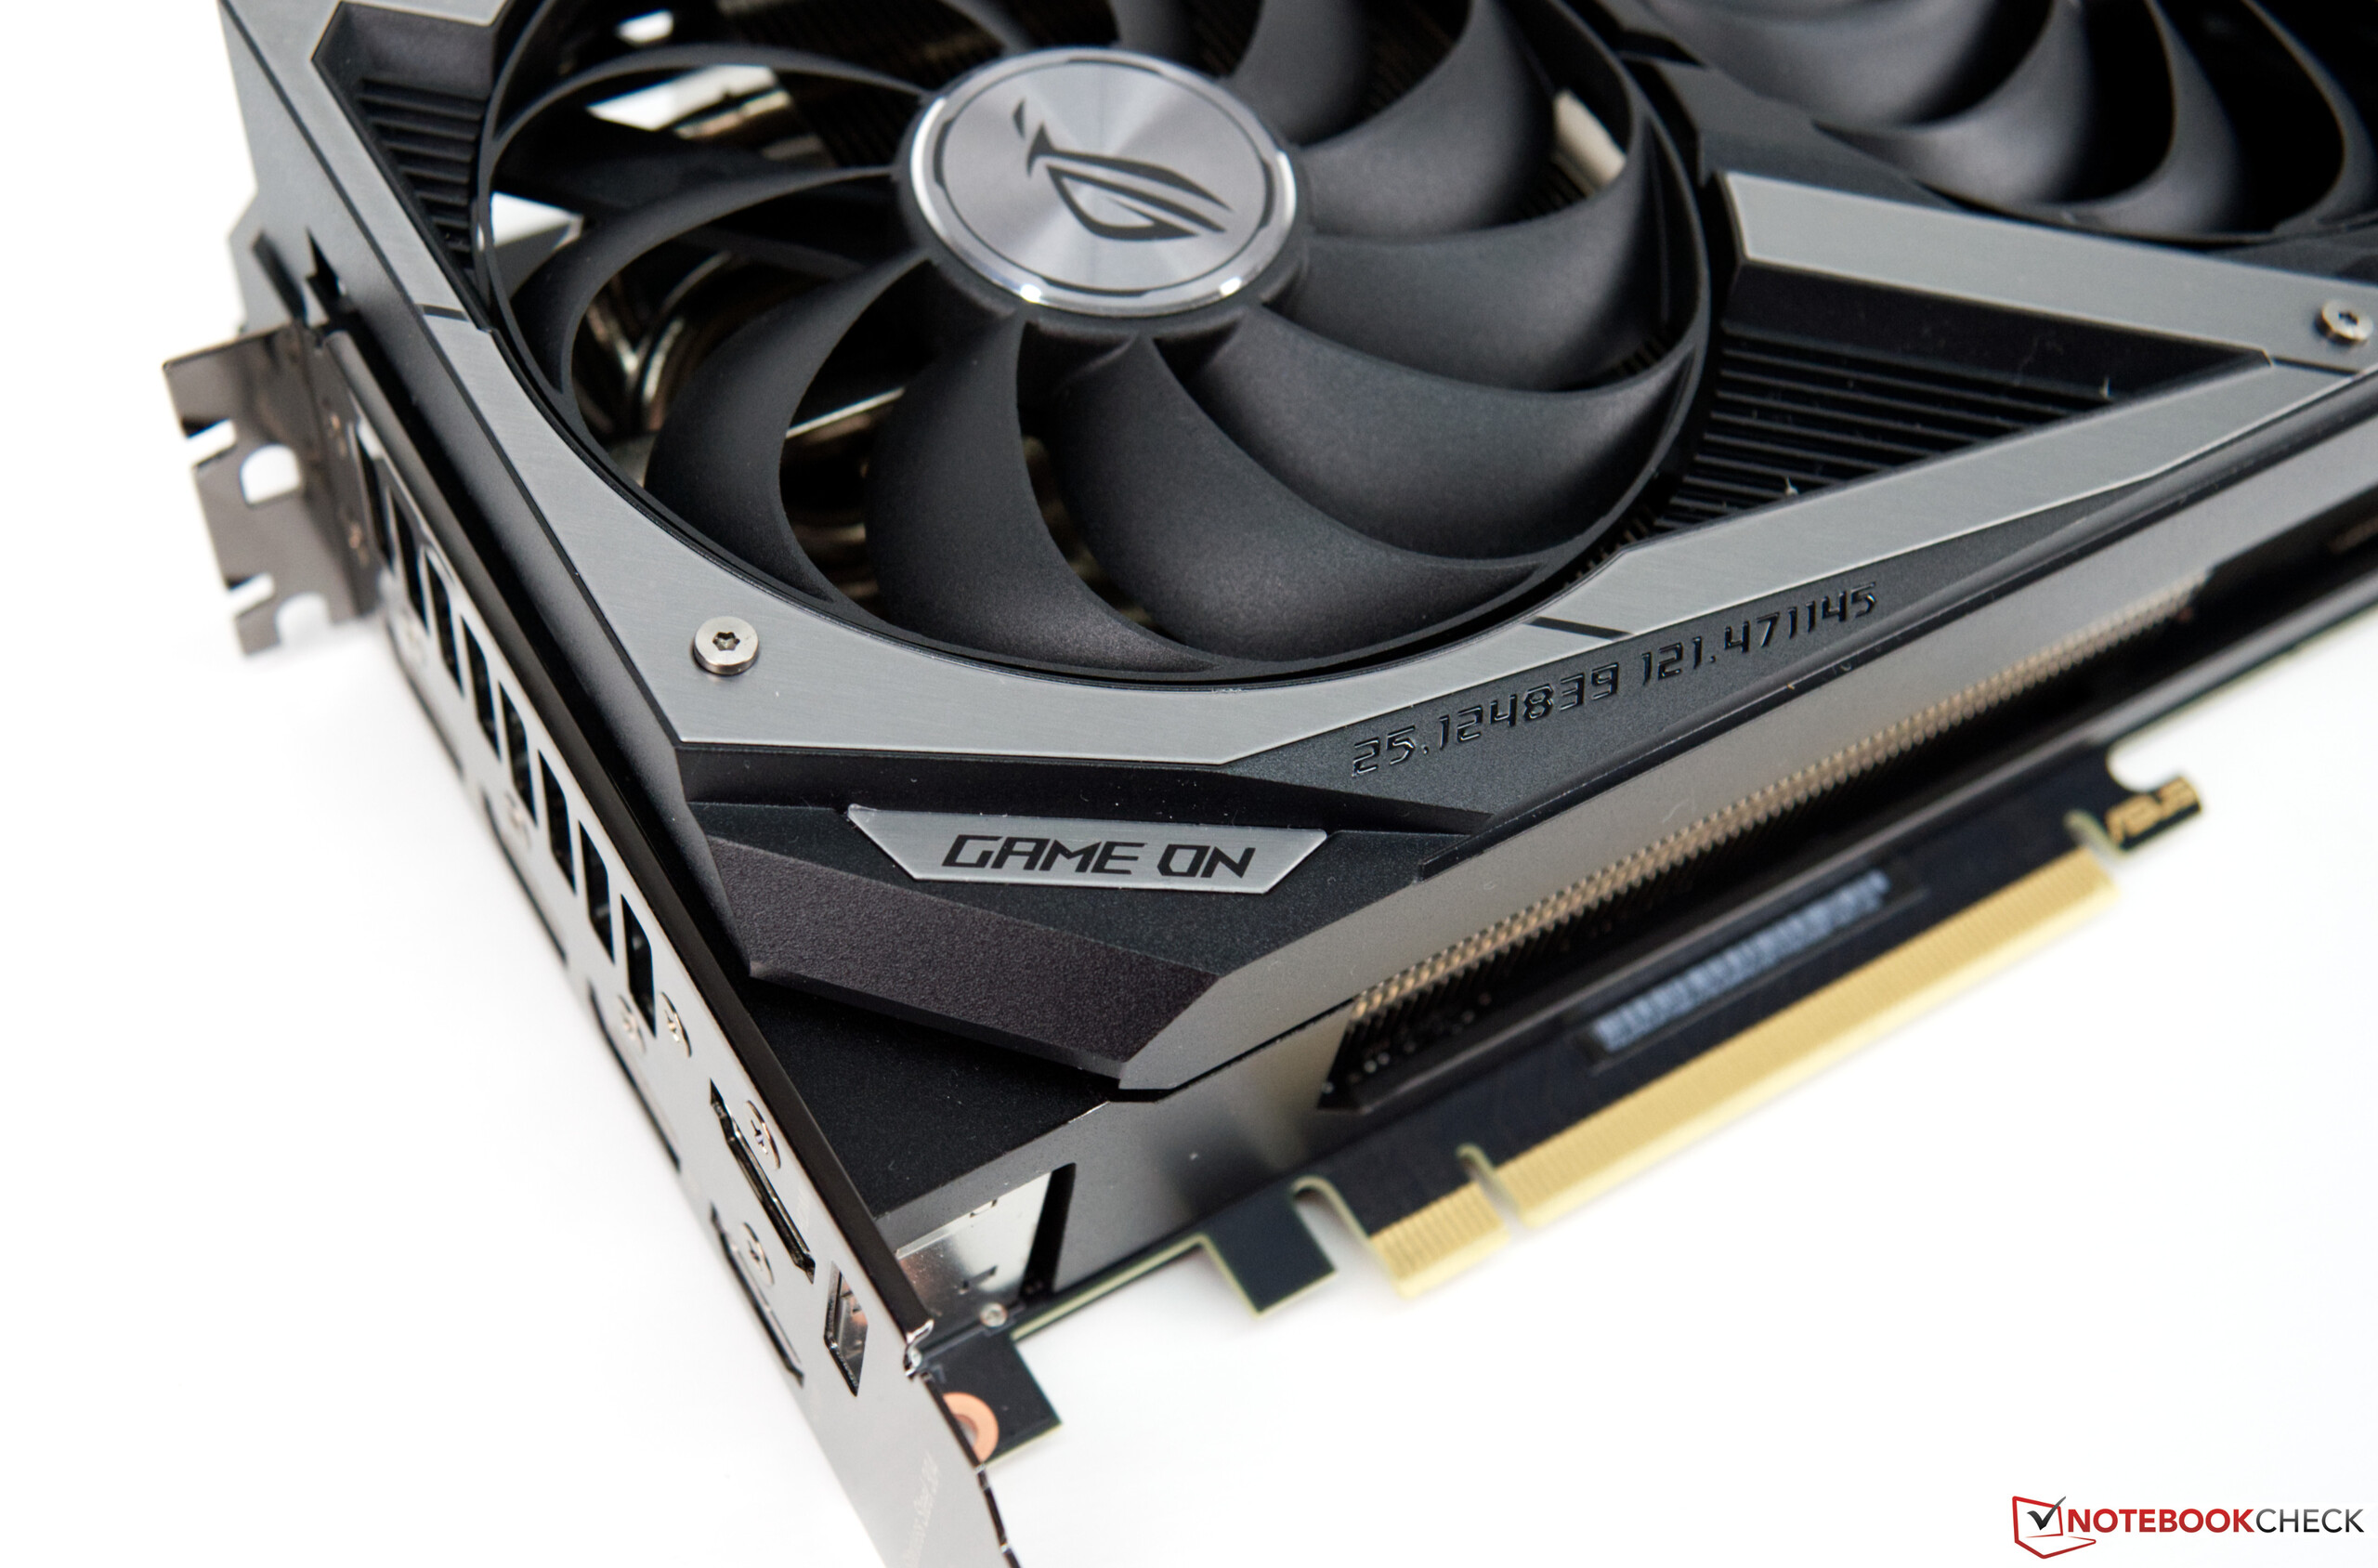
La GPU de escritorio Asus GeForce RTX 3080 ROG Strix Gaming OC en review
El segmento de servidores comenzó a beneficiarse de la nueva arquitectura Ampere de las tarjetas gráficas Nvidia a principios de 2020. Alrededor de medio año después, los modelos de consumo siguieron, lo que debería traer un soplo de aire fresco al mercado de tarjetas gráficas de escritorio. Sin embargo, después de la introducción de la nueva serie RTX 3000, el desencanto fue muy grande, porque el gran número de pedidos no se pudo y sigue sin poder ser cubierto completamente.
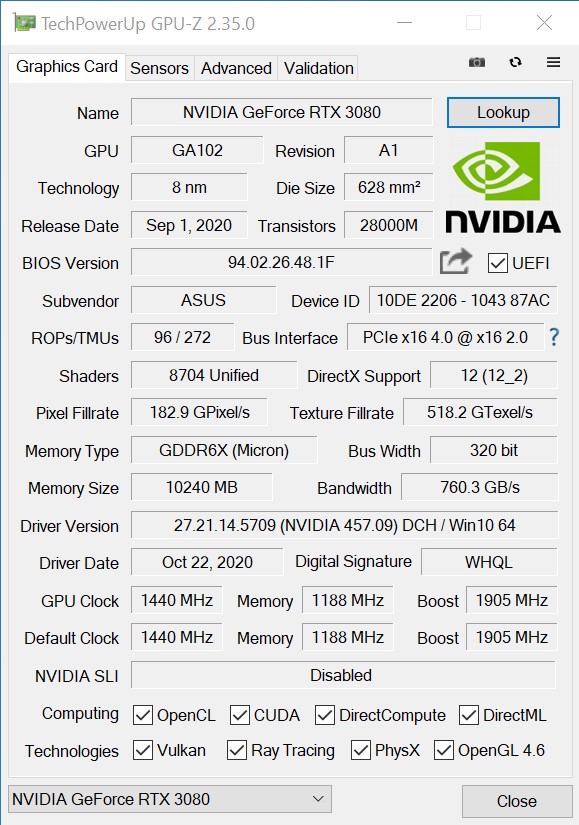
Aquellos que aún pudieron conseguir un modelo de las nuevas tarjetas gráficas Nvidia serán recompensados con un muy buen rendimiento en todo momento; podemos revelarlo con mucha antelación. Para esta revisión, sin embargo, recibimos una muestra de prueba de Asus, que difiere significativamente de la edición de los fundadores. Pero nada ha cambiado en cuanto a la base del chip GA102 Ampere. Lo mismo se aplica a la VRAM, que es idéntica a 10 GB GDDR6X en todos los modelos RTX 3080. Asus concede al GeForce RTX 3080 ROG Strix Gaming OC un poco más de libertad de acción cuando se trata de potenciar, sin embargo - es casi 200 MHz en comparación con la Edición Fundadora de Nvidia.
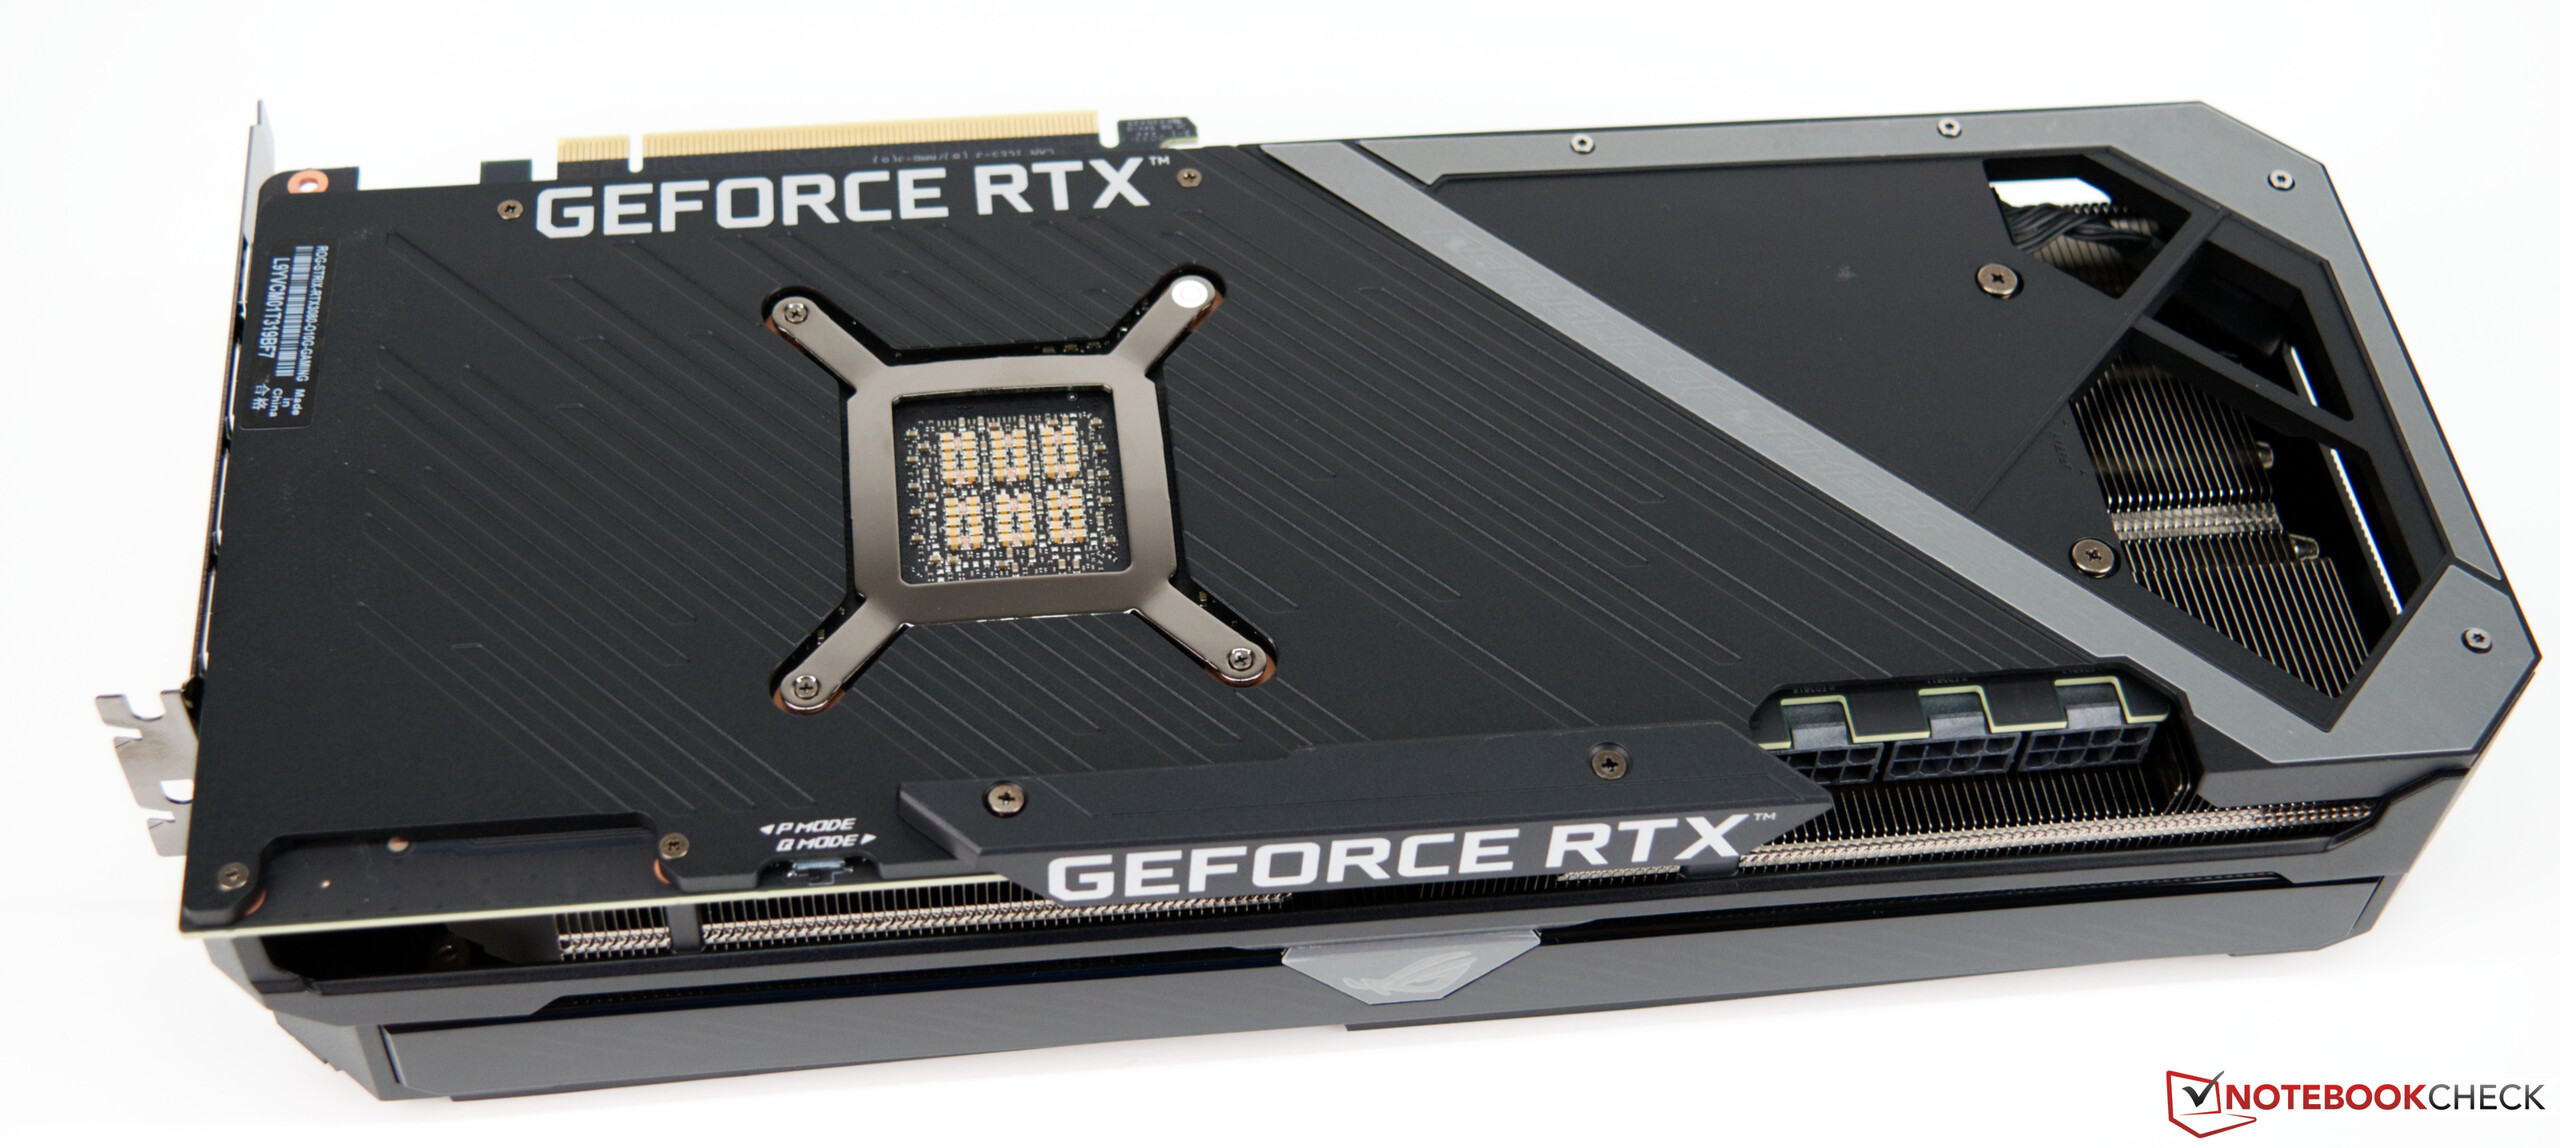
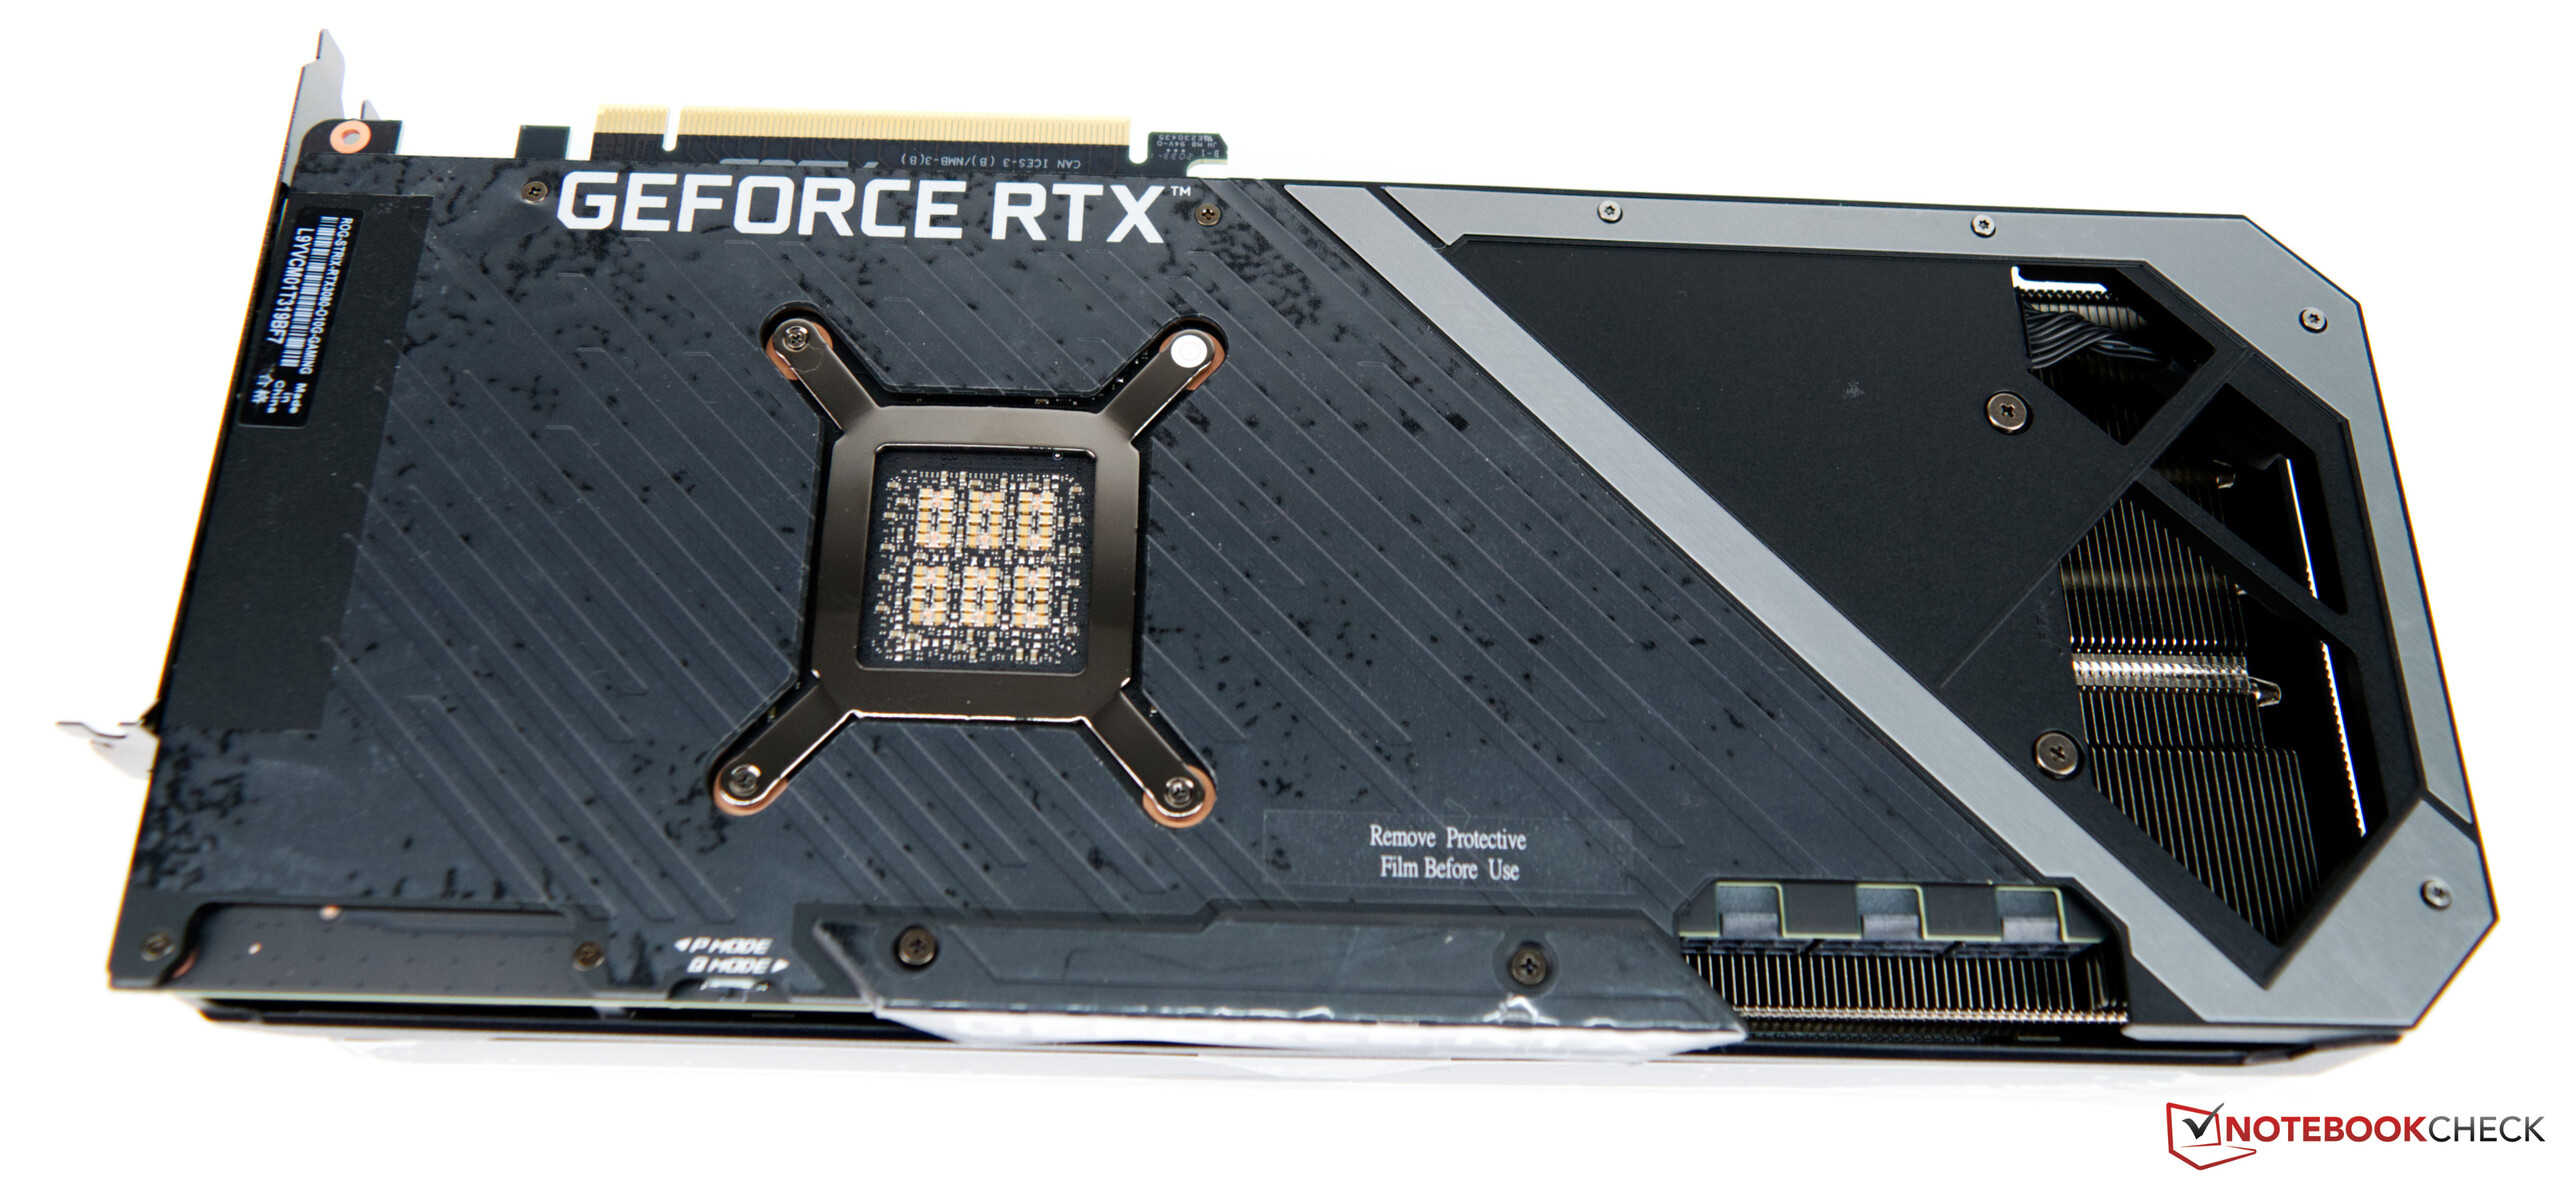
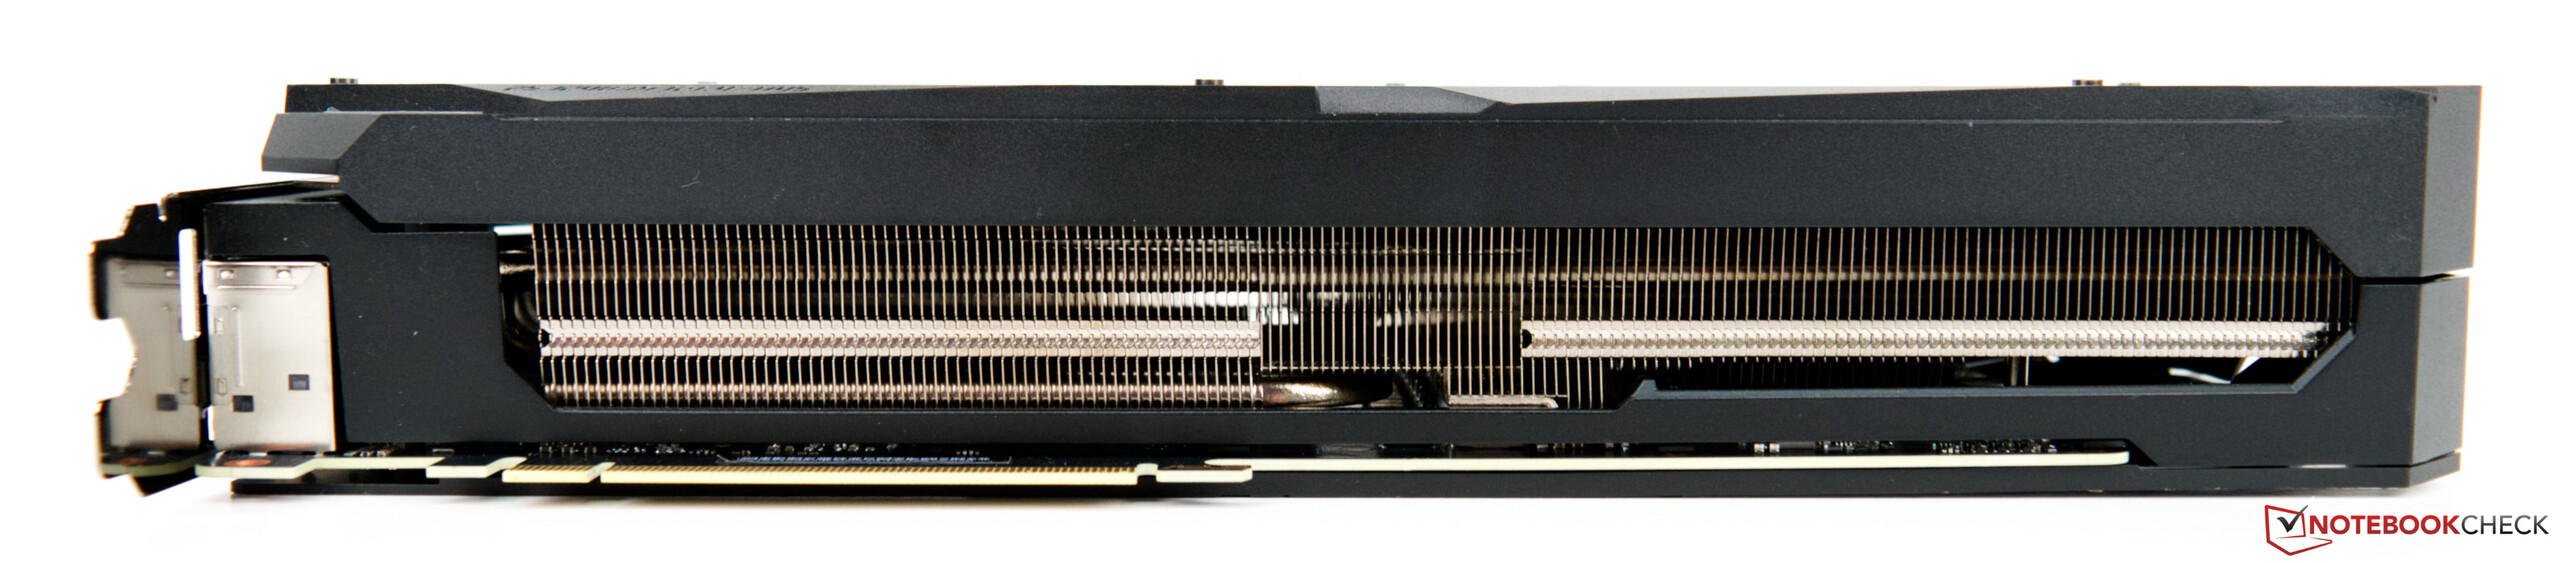
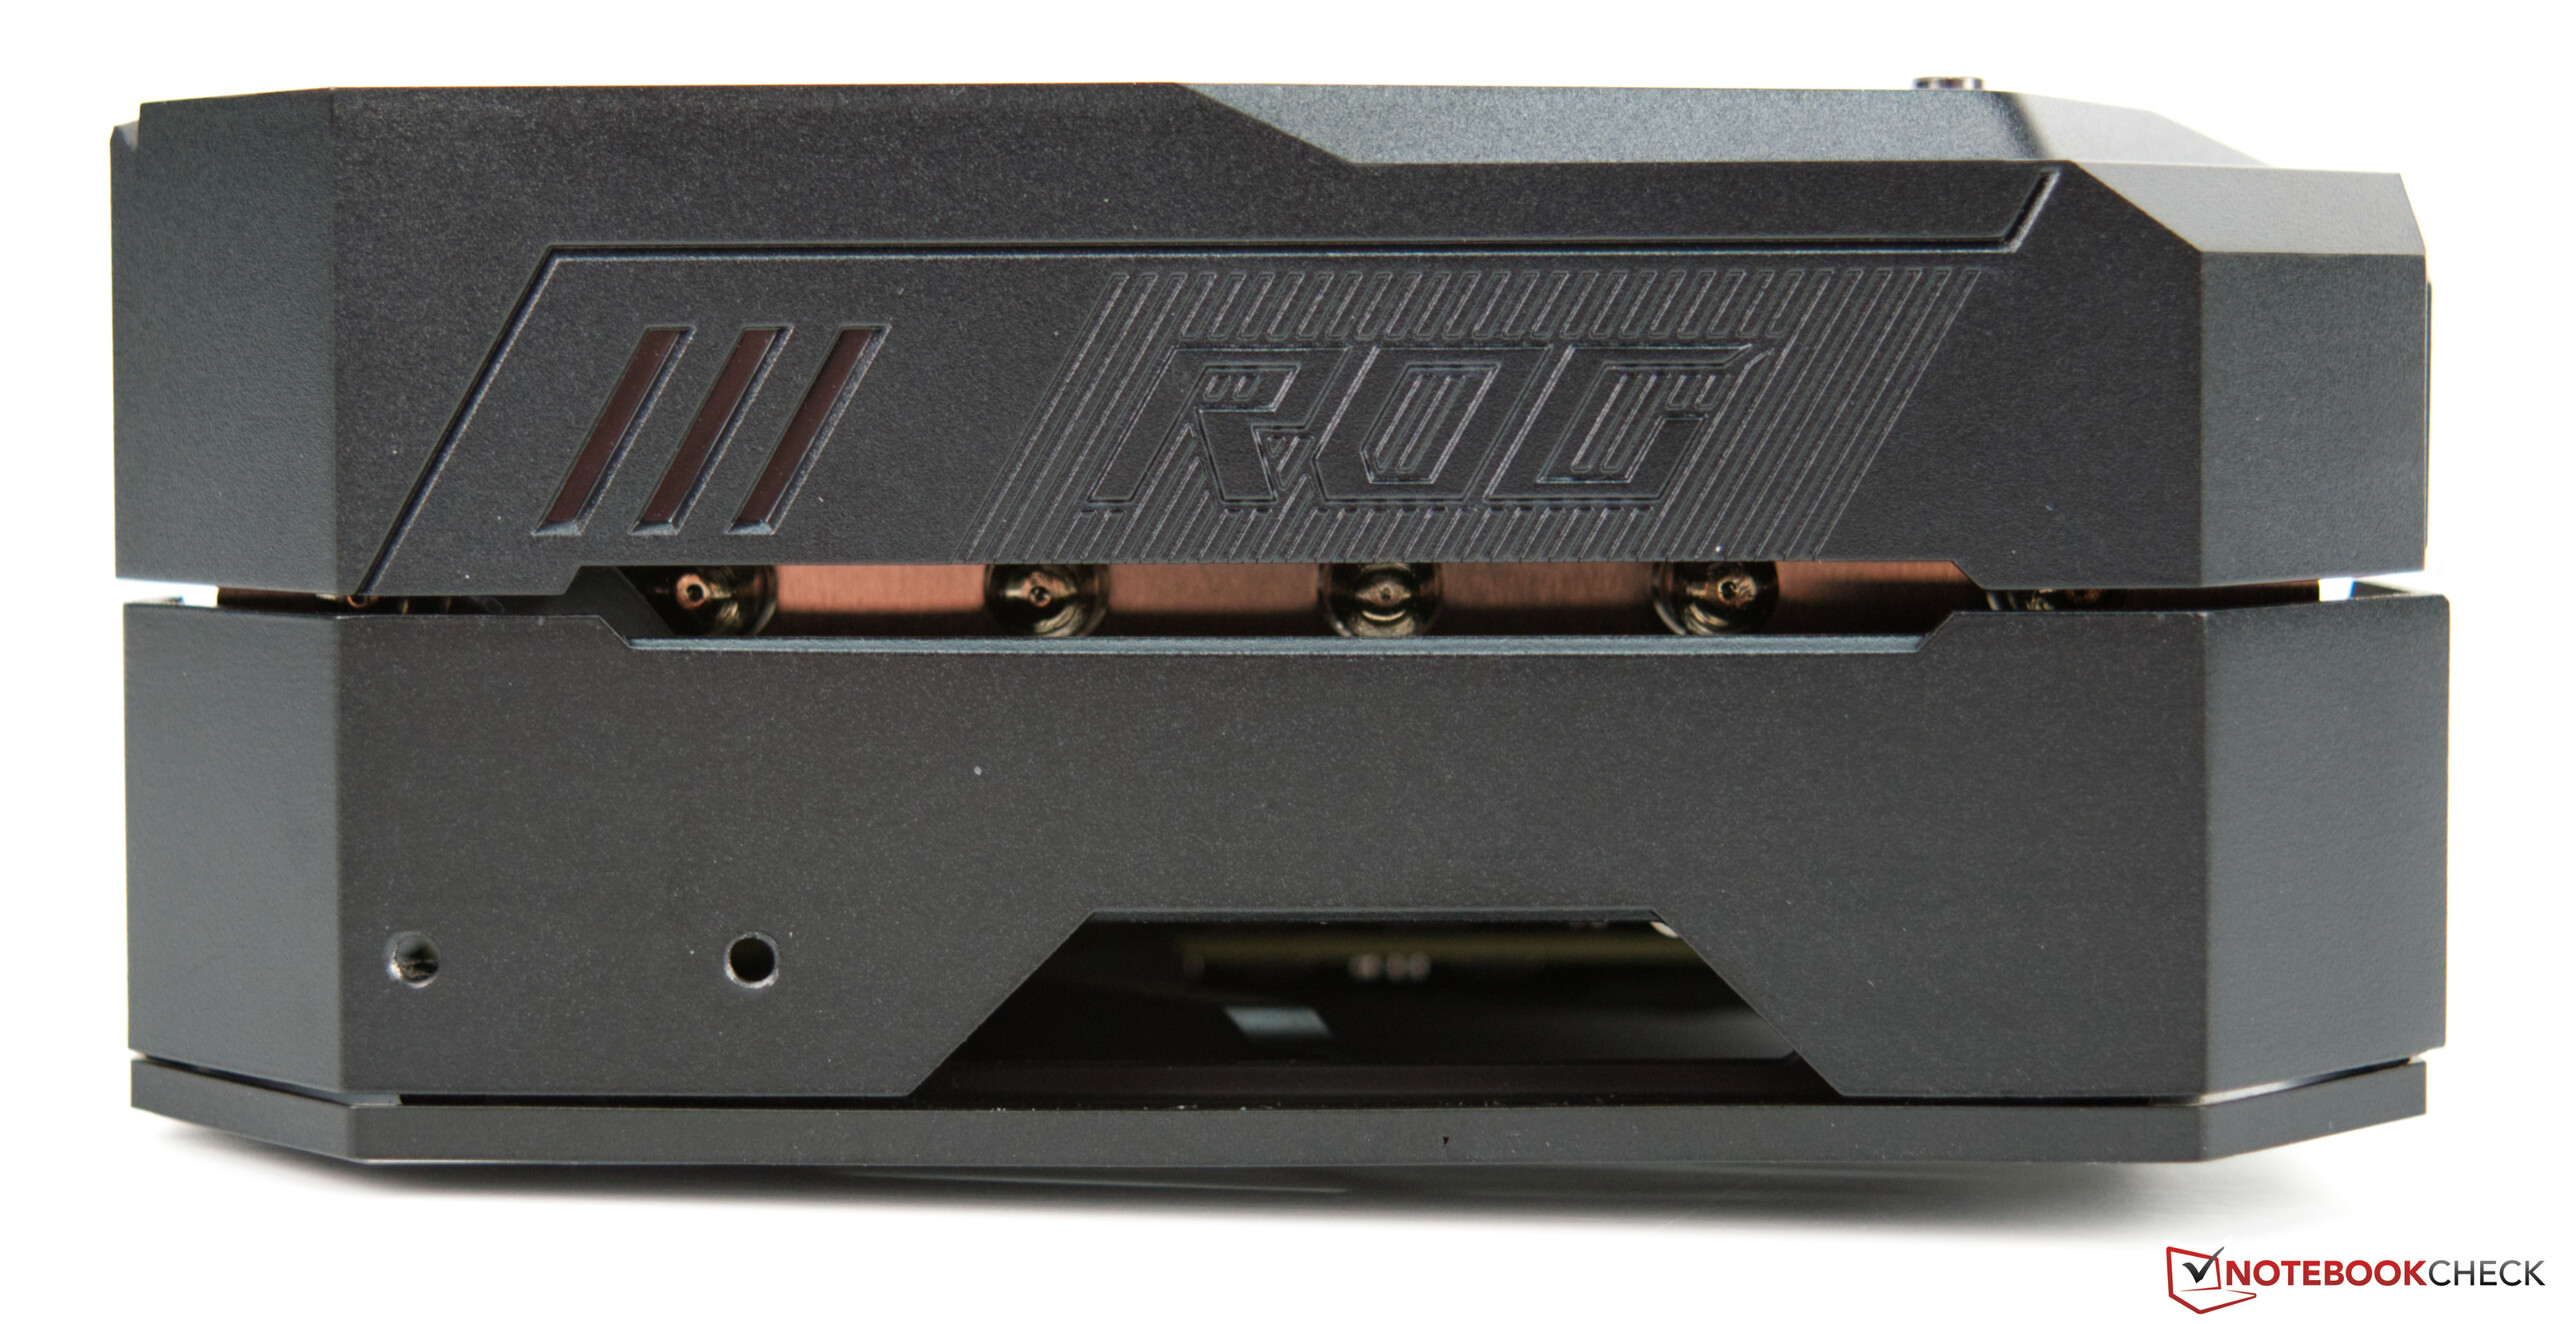
Además, Asus le ha dado a su modelo superior RTX 3080 un refrigerador de triple ranura muy potente. En general, la tarjeta gráfica mide poco menos de 32 centímetros, lo que es absolutamente necesario tener en cuenta a la hora de comprar esta GPU. No todas las carcasas ofrecen tanto espacio para una tarjeta gráfica tan monstruosa.
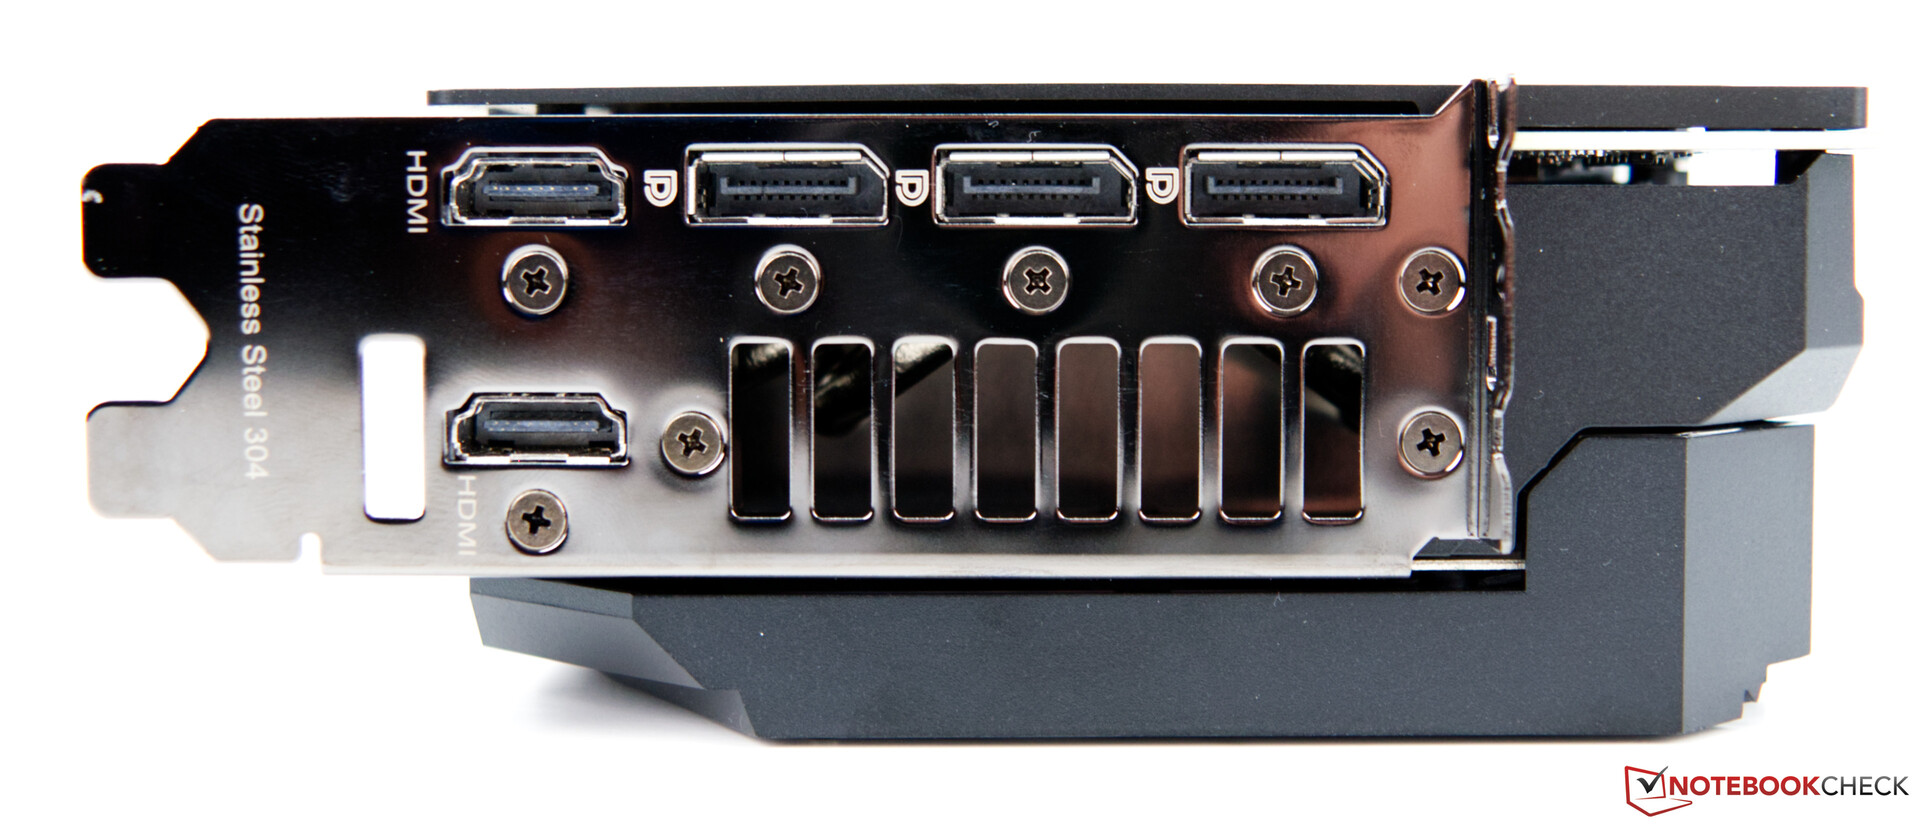
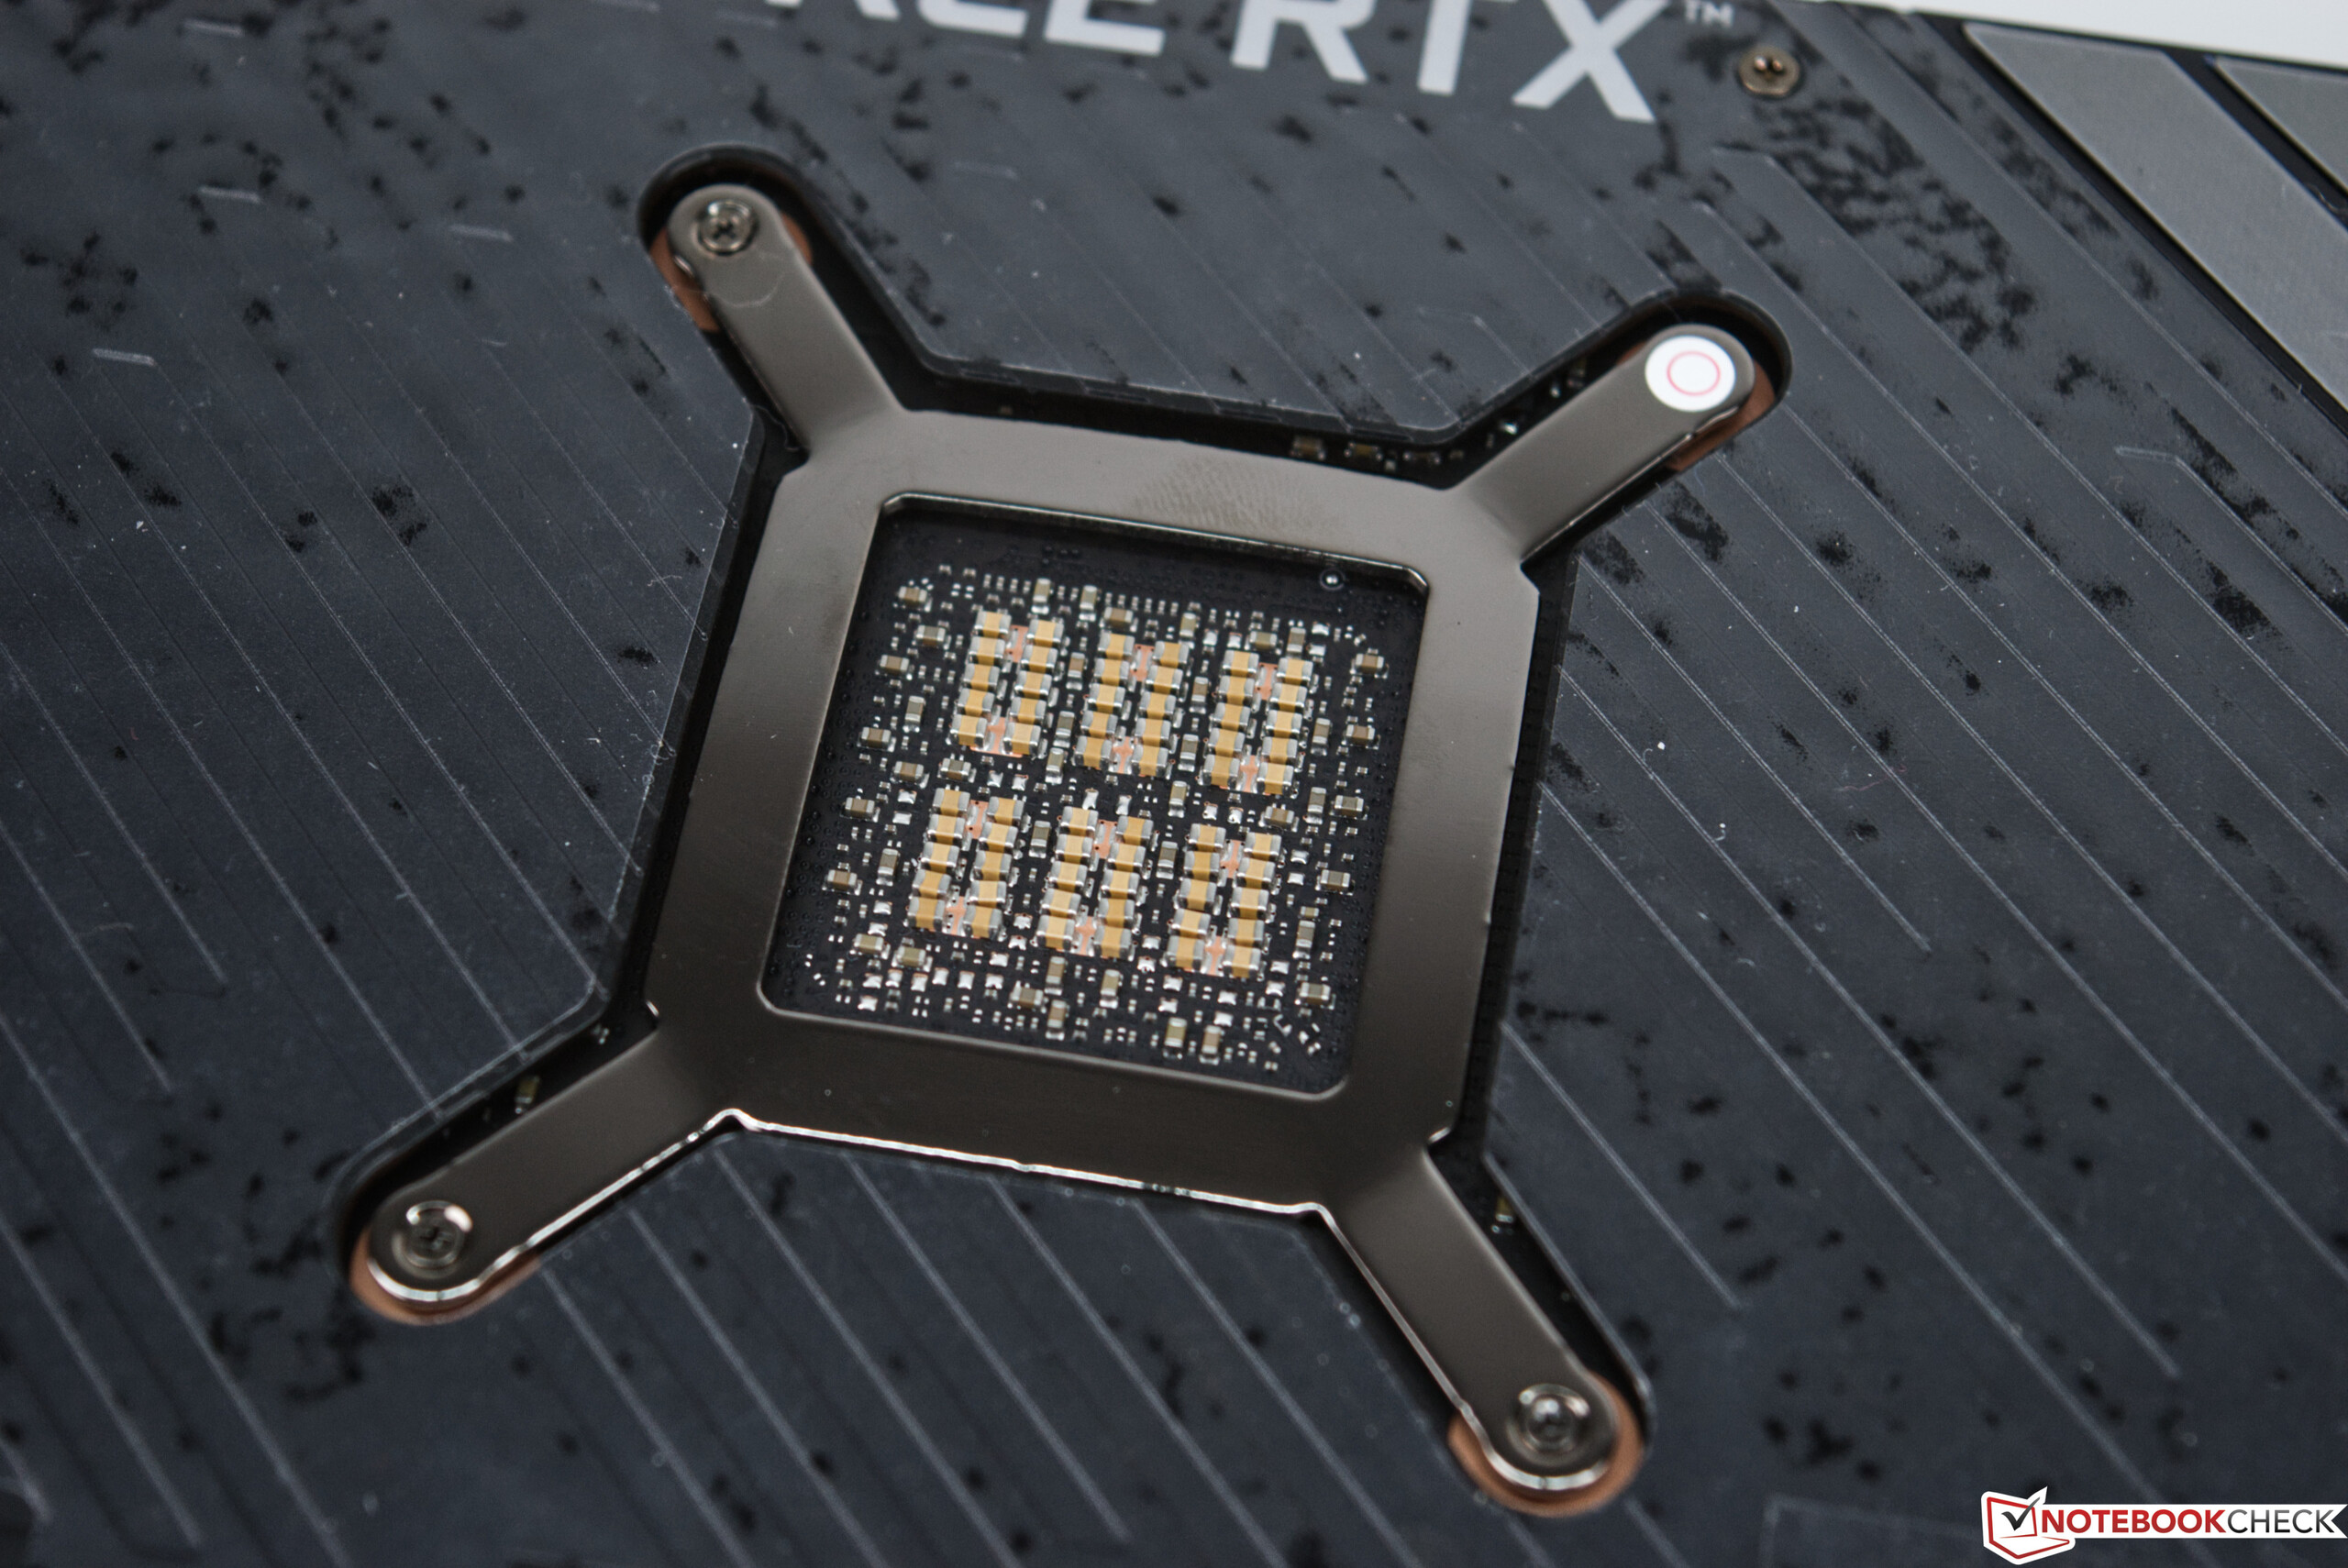
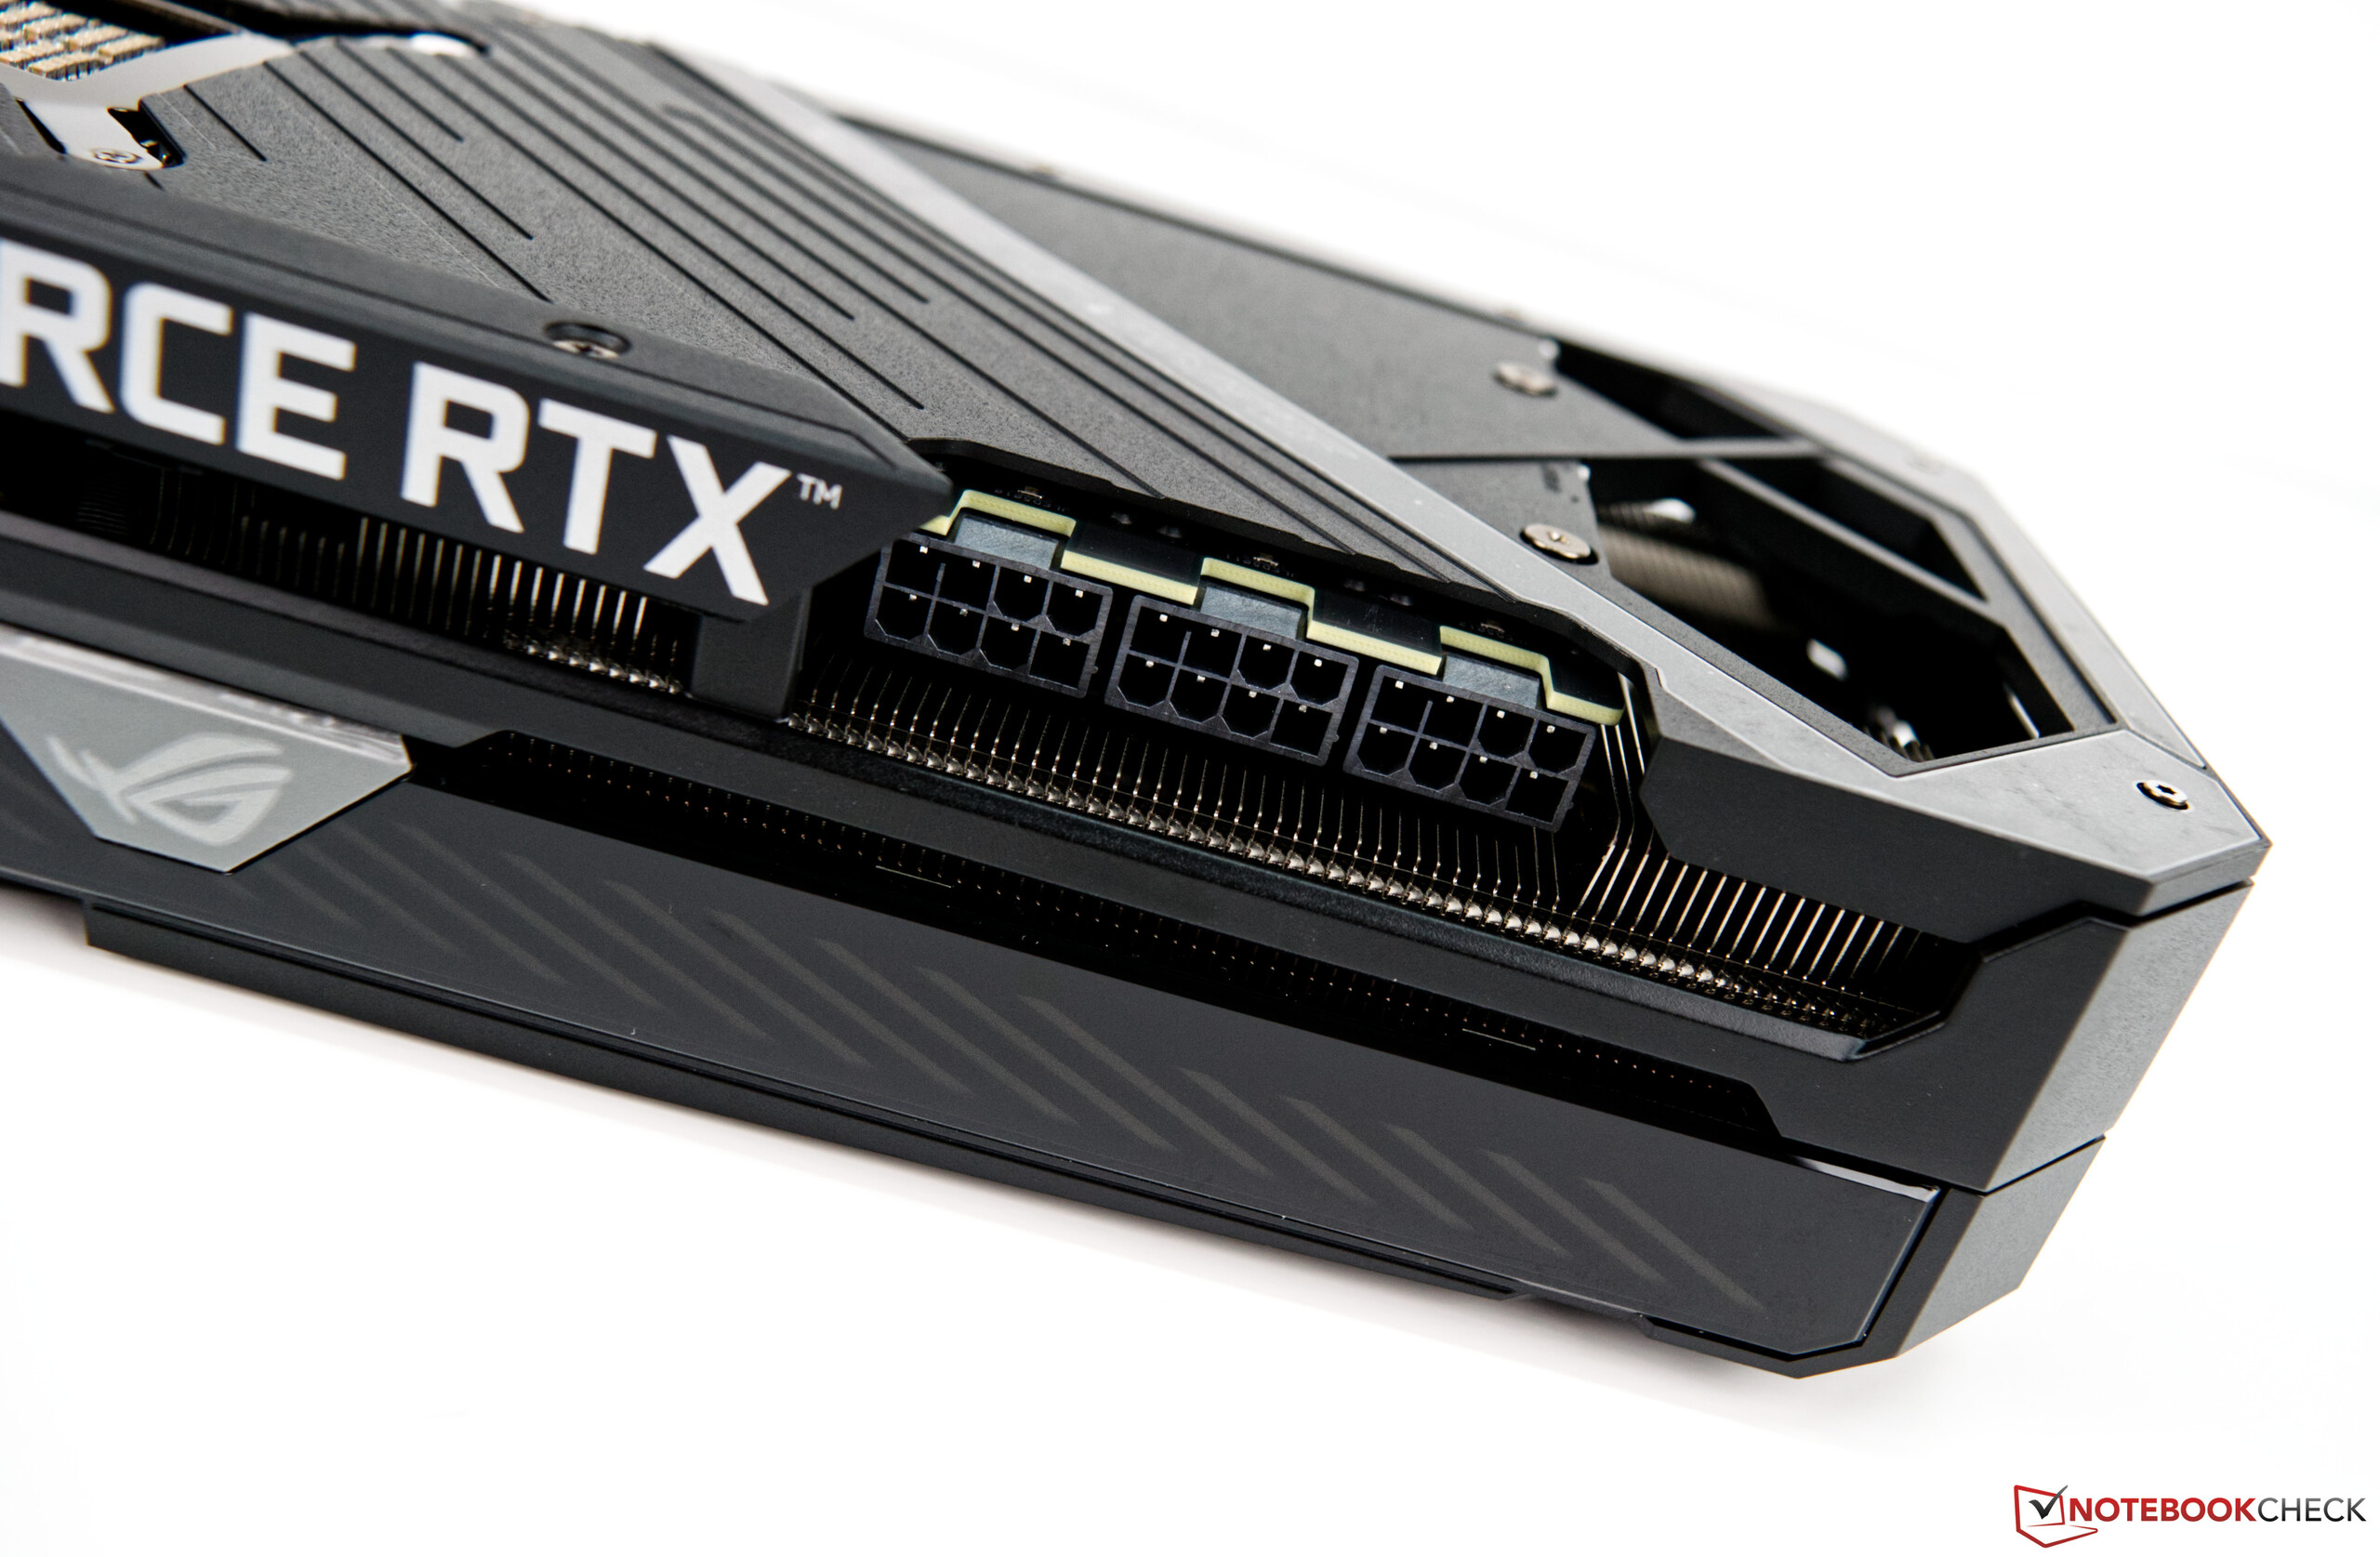
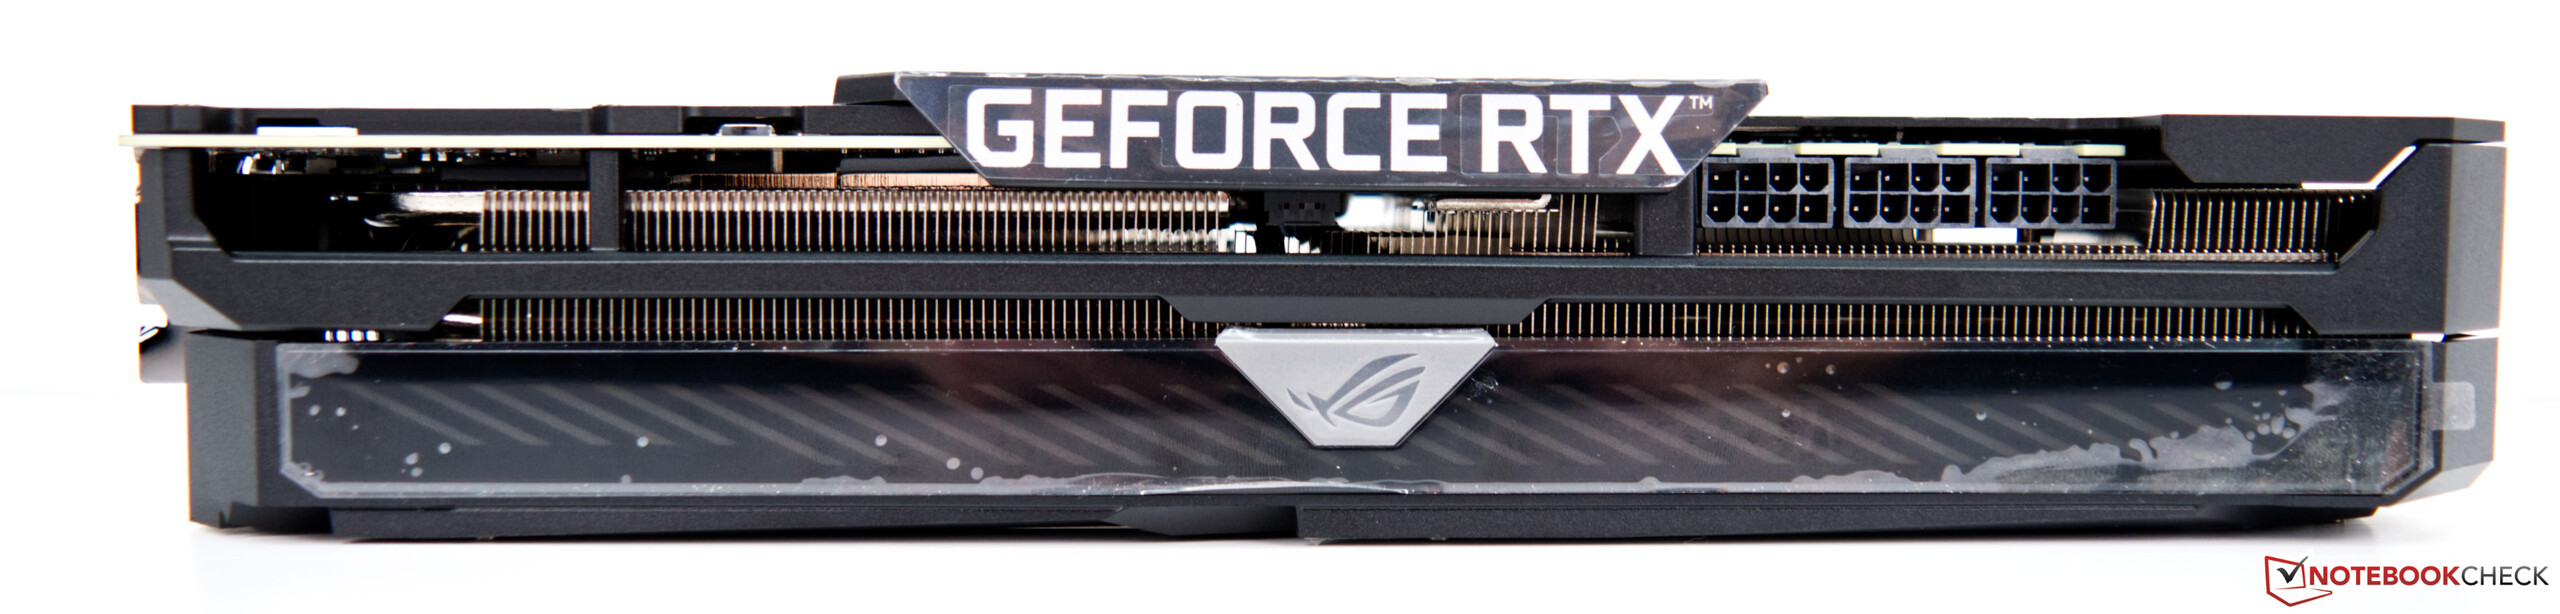
Asus sigue el viejo camino conocido en lo que se refiere a la fuente de alimentación y no se decanta por el conector de 12 pines que Nvidia utiliza con sus tarjetas RTX 3000. La GeForce RTX 3080 ROG Strix Gaming OC requiere tres conectores de 8 pines para su funcionamiento. Como resultado, un fuerte adaptador de corriente es inevitable, y el propio Asus habla de al menos 850 vatios. Se pueden conectar hasta cuatro monitores externos simultáneamente. Para ello, la GPU cuenta con HDMI compatible con el último estándar (2.1), así como con conexiones DisplayPort (1.4a).

The RTX 3080 compared with other NVIDIA GPUs
| Especificación | RTX 3090 | RTX 3080 (Asus ROG) | RTX 3080 FE | RTX 3070 FE | Titan RTX | TITAN X Pascal | RTX 2080 Ti | RTX 2080 |
| Chip | GA102 | GA102 | GA102 | GA104 | TU102 | GP102 | TU102 | TU104 |
| FinFET process | 8 nm | 8 nm | 8 nm | 8 nm | 12 nm | 16 nm | 12 nm | 12 nm |
| CUDA cores | 10,496 | 8,704 | 8,704 | 5,888 | 4,608 | 3,584 | 4,352 | 2,944 |
| Unidades de textura | 328 | 272 | 272 | 184 | 288 | 224 | 272 | 184 |
| Tensor cores | 328 3rd Gen. | 272 3rd Gen. | 272 3rd Gen. | 184 3rd Gen. | 576 2nd Gen. | - | 544 2nd Gen. | 368 2nd Gen. |
| RT Cores | 82 | 68 | 68 | 46 | 72 | - | 68 | 46 |
| GPU base | 1,395 MHz | 1,440 MHz | 1,440 MHz | 1,500 MHz | 1,350 MHz | 1,417 MHz | 1,350 MHz | 1,515 MHz |
| GPU boost | 1,695 MHz | 1,905 MHz | 1,710 MHz | 1,725 MHz | 1,770 MHz | 1,531 MHz | 1,545 MHz | 1,710 MHz |
| Bus de memoria | 384-bit | 320-bit | 320-bit | 256-bit | 384-bit | 384-bit | 352-bit | 256-bit |
| Ancho de banda de memoria | 936 GB/s | 760 GB/s | 760 GB/s | 448 GB/s | 672 GB/s | 480.4 GB/s | 616 GB/s | 448 GB/s |
| Memoria de video | 24 GB GDDR6X | 10 GB GDDR6X | 10 GB GDDR6X | 8 GB GDDR6 | 24 GB GDDR6 | 12 GB GDDR5X | 11 GB GDDR6 | 8 GB GDDR6 |
| Consumo de energía | 350 W | 320 W | 320 W | 220 W | 280 W | 250 W | 250 W | 215 W |
Nuestro sistema de pruebas con el AMD Ryzen 9 3900X como base
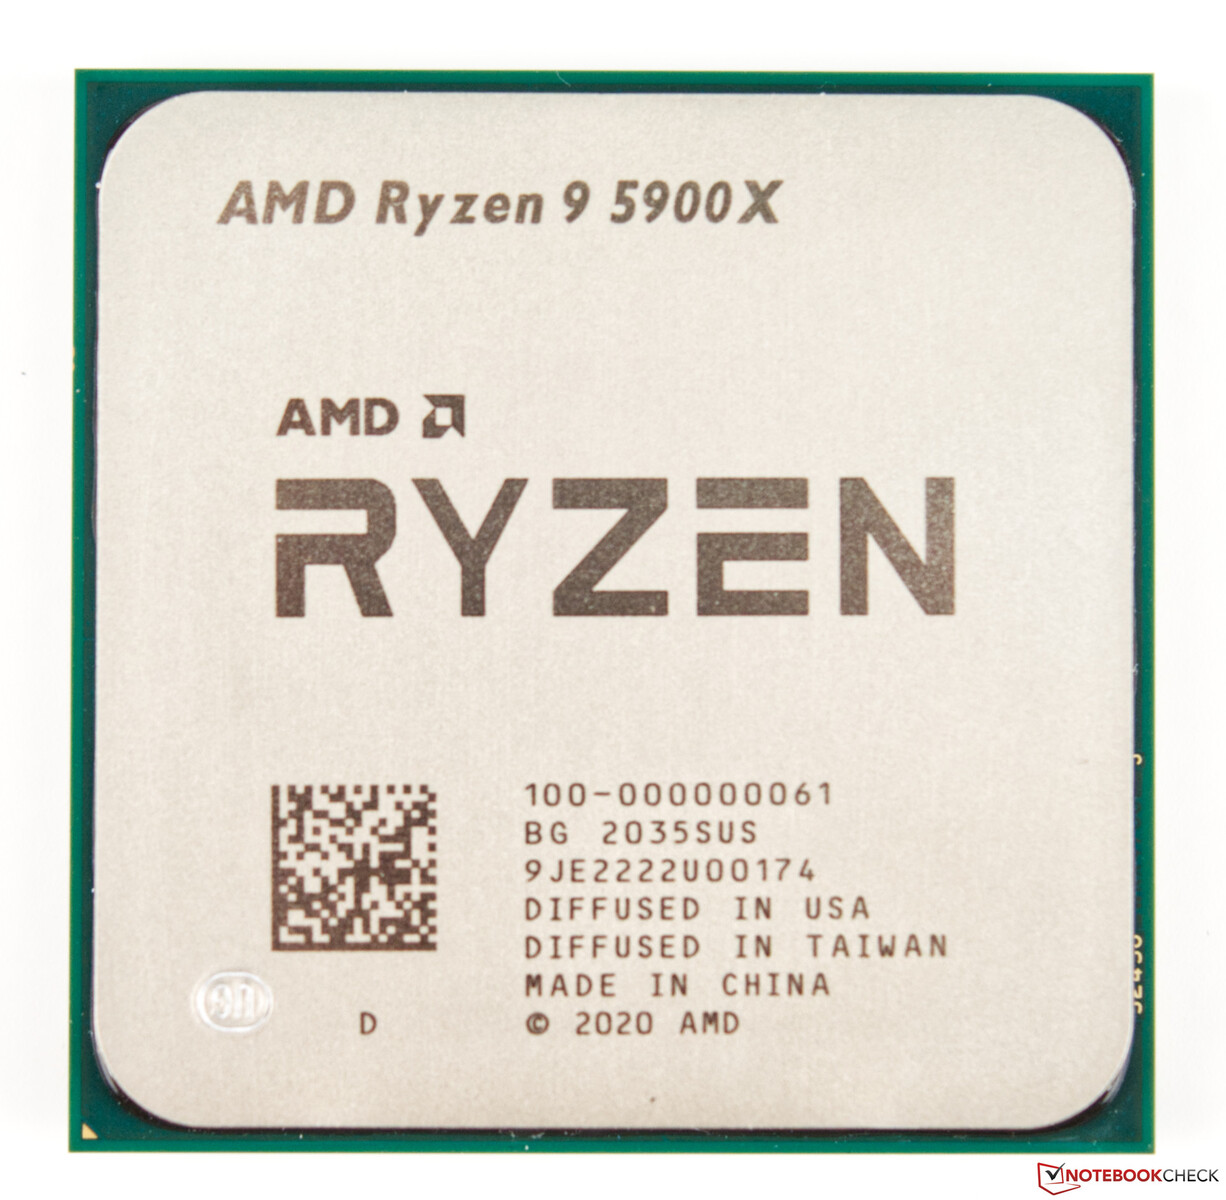
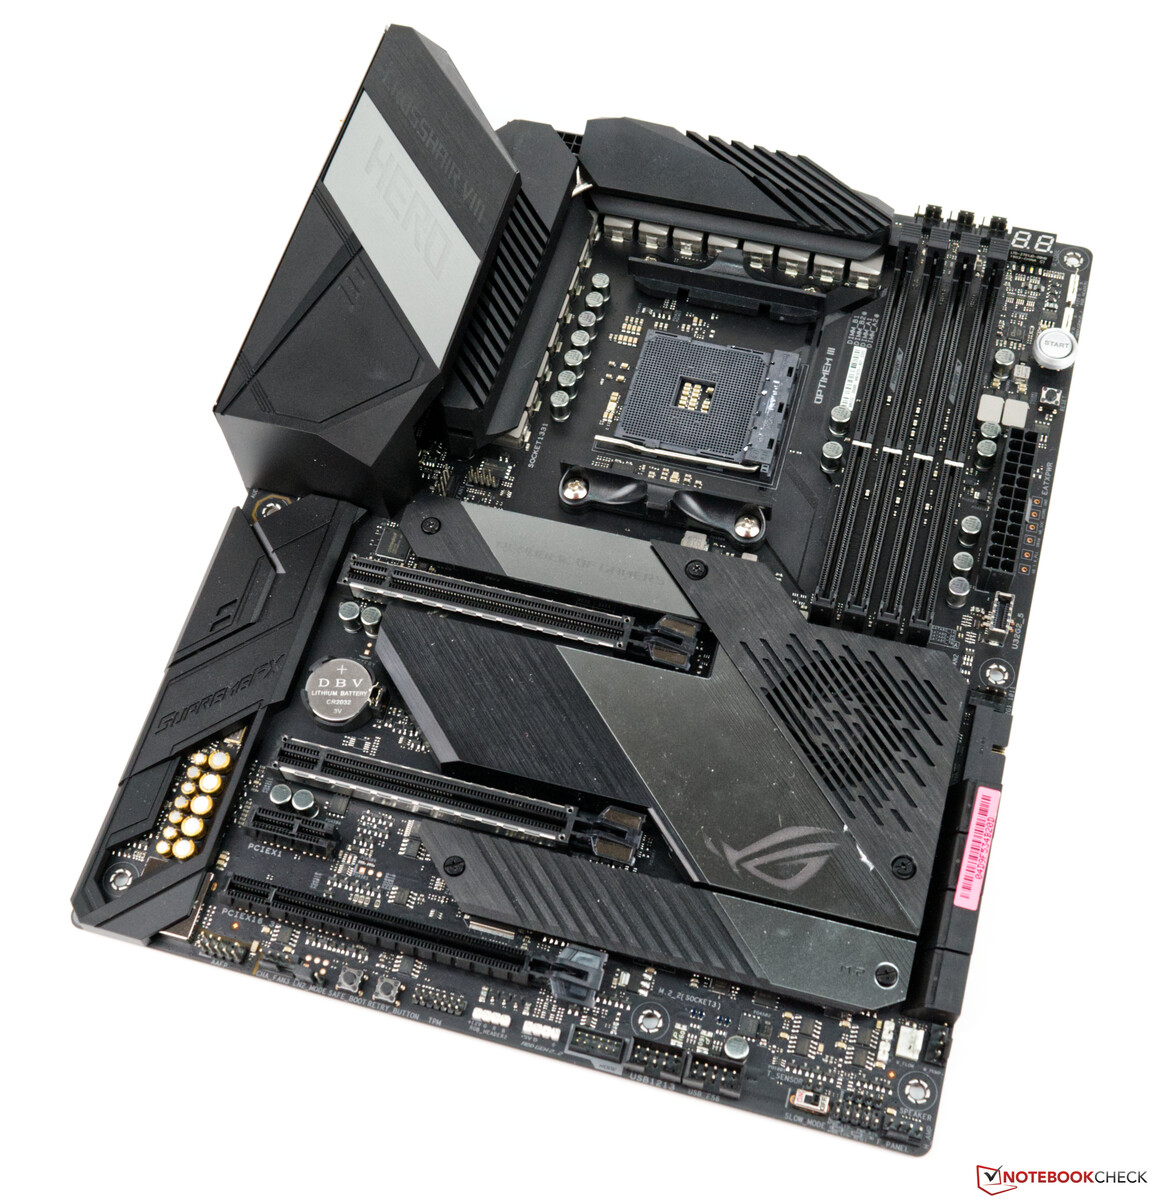
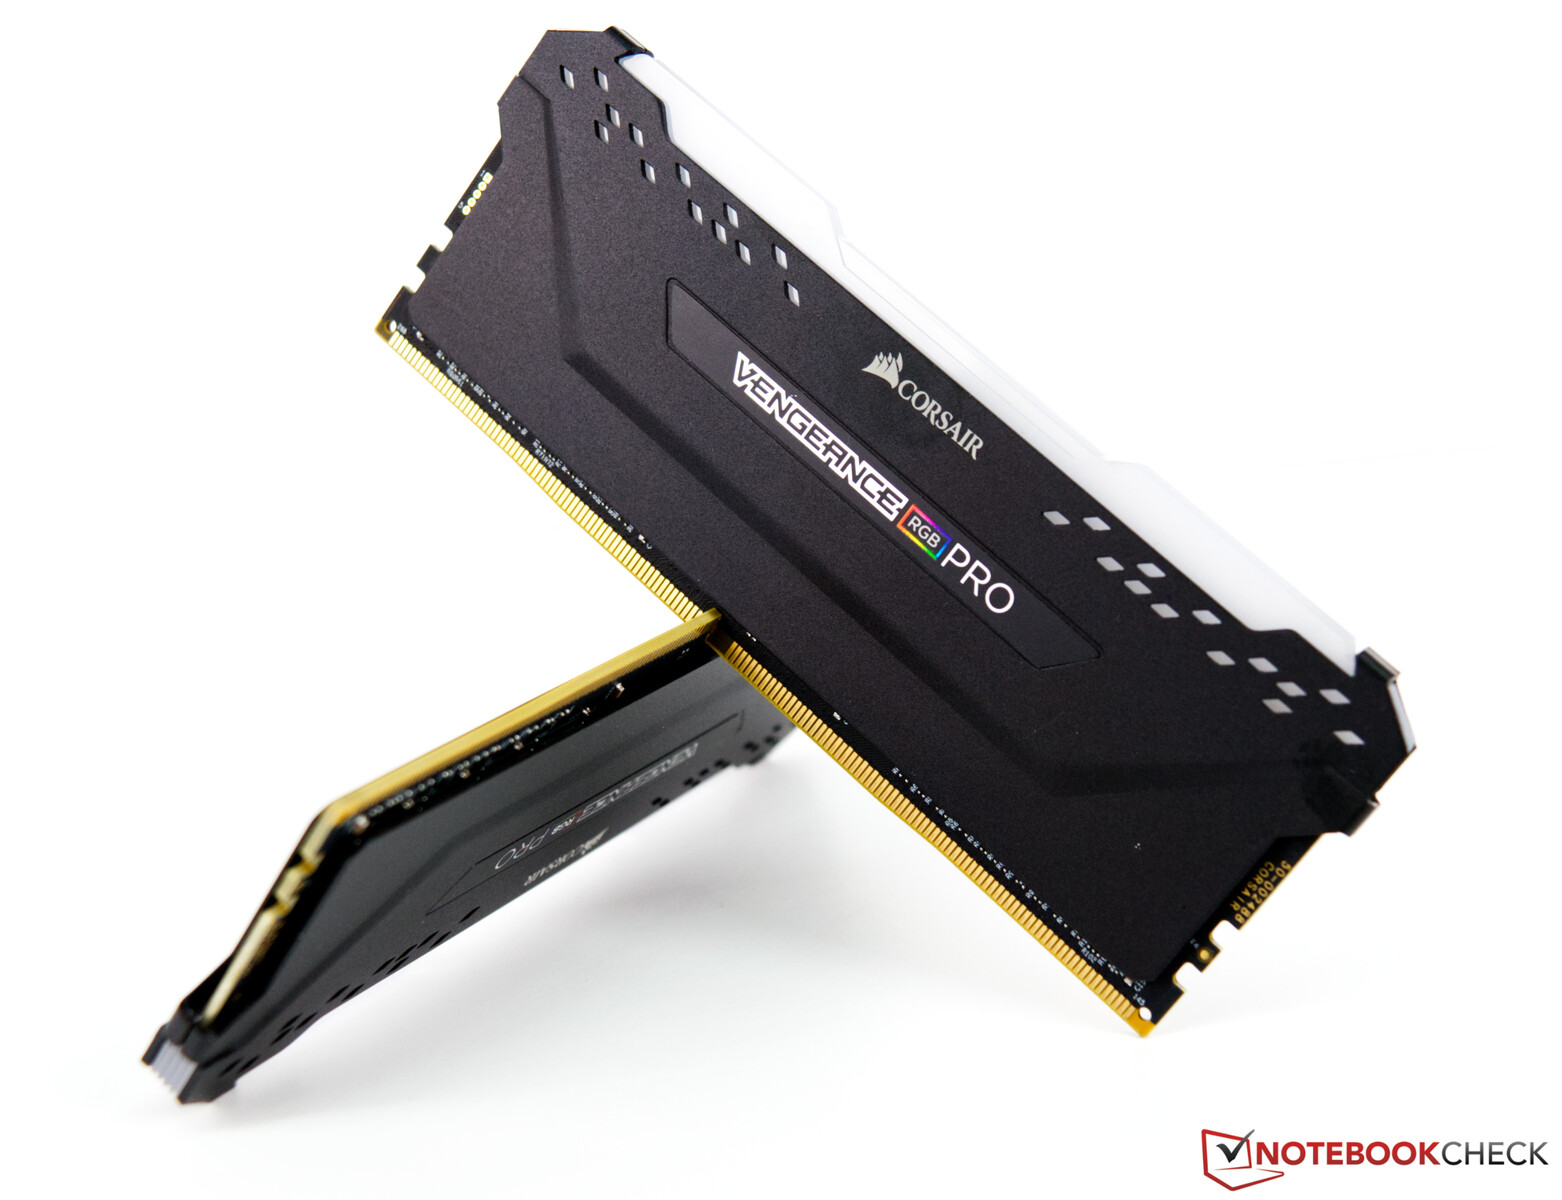
Una plataforma actual de AMD basada en el Asus X570 ROG Crosshair VIII sirve como nuestro sistema de pruebas. El CPU (AMD Ryzen 9 5900X) ofrece un buen rendimiento de CPU, y usamos un AIO (Alphacool Eisbaer 280cmm) para la refrigeración. Los 32 GB de RAM provienen de Corsair y velocidades de 4.000 MHz. Como monitor, usamos el Acer Predator XB321HK. No nos limita debido a su capacidad de UHD. En este punto nos gustaría agradecer a AMD por proporcionar la plataforma de prueba así como a Corsair por el kit de RAM.
Para los próximos puntos de referencia y pruebas, usamos el siguiente sistema:
- Corsair Carbide Air 540 ATX Cube
- AMD Ryzen 9 5900X
- Asus GeForce RTX 3080 ROG Strix Gaming OC (Nvidia driver 457.09)
- Asus X570 ROG Crosshair VIII (BIOS 2402, ajustes por defecto, XMP 1 para DDR4 4000)
- Fuente de alimentación de 1000 vatios Corsair RM1000X
- Corsair Vengeance RGB Pro DDR4 4000 2x 16 GB RAM kit
- Corsair MP600 2 TB M.2 PCIe 4.0 SSD
- Crucial MX500 2 TB (para los juegos)
Las velocidades del Asus GeForce RTX 3080 ROG Strix Gaming OC
A 1.440 MHz, la velocidad base del Asus GeForce RTX 3080 ROG Strix Gaming OC ha permanecido inalterada en comparación con el modelo de referencia. Sin embargo, Asus toma un camino diferente en lo que se refiere a la velocidad de impulso y permite que su modelo alcance una velocidad considerablemente mayor hasta 1.905 MHz. Esta velocidad también se puede mantener sin problemas bajo carga y normalmente incluso se supera. Además, Asus también permite un objetivo de mayor potencia de hasta el 21%. Como resultado, la GeForce RTX 3080 ROG Strix Gaming OC puede incluso funcionar de forma estable a más de 2 GHz. En cuanto a la VRAM, ahora hay GDDR6X en lugar de GDDR6, que se utilizaba anteriormente, aunque 10 GB deberían ser suficientes ahora en comparación con el RTX 2080 Ti. Por el momento, sólo la GeForce RTX 3090 de la actual serie Ampere ofrece más memoria gráfica.

Puntos de referencia sintéticos
En los puntos de referencia sintéticos, el Asus GeForce RTX 3080 ROG Strix Gaming OC ya empieza a mostrar su potencial con bastante claridad. Sólo la GeForce RTX 3090 ofrece más rendimiento; ya la hemos revisado en la configuración de nuestro socio Zotac. Comparada con la GeForce RTX 2080 Ti, nuestra muestra de prueba puede diferenciarse con una ventaja de alrededor del 30%. La significativamente más cara Nvidia Titan RTX sólo logra ocupar el tercer lugar en nuestra comparación y no puede seguir el ritmo de la GeForce RTX 3080.
A diferencia de la Edición de Fundadores, Asus tiene una mejor estructura de refrigeración en la GeForce RTX 3080 ROG Strix Gaming OC, lo que resulta en una ligera ventaja de rendimiento sobre el modelo de referencia.
| Unigine Superposition | |
| 1280x720 720p Low | |
| Titan RTX | |
| Asus GeForce RTX 3080 ROG Strix Gaming OC | |
| 1920x1080 1080p High | |
| GeForce RTX 3090 | |
| Asus GeForce RTX 3080 ROG Strix Gaming OC | |
| Titan RTX | |
| 1920x1080 1080p Extreme | |
| GeForce RTX 3090 | |
| Asus GeForce RTX 3080 ROG Strix Gaming OC | |
| Titan RTX | |
| 3840x2160 4k Optimized | |
| GeForce RTX 3090 | |
| Asus GeForce RTX 3080 ROG Strix Gaming OC | |
| Titan RTX | |
| 7680x4320 8k Optimized | |
| GeForce RTX 3090 | |
| Asus GeForce RTX 3080 ROG Strix Gaming OC | |
| Titan RTX | |
| 3DMark 05 Standard | 46192 puntos | |
| 3DMark 06 Standard Score | 44255 puntos | |
| 3DMark Vantage P Result | 93066 puntos | |
| 3DMark 11 Performance | 32211 puntos | |
| 3DMark Ice Storm Standard Score | 238949 puntos | |
| 3DMark Cloud Gate Standard Score | 75364 puntos | |
| 3DMark Fire Strike Score | 33440 puntos | |
| 3DMark Fire Strike Extreme Score | 20455 puntos | |
| 3DMark Time Spy Score | 15712 puntos | |
ayuda | ||
Puntos de referencia de juego
Las pruebas de juego realizadas revelan que la GeForce RTX 3080 es más adecuada para altas resoluciones. Casi todos los juegos que probamos se podían jugar a 2160p sin problemas. Sin embargo, hay juegos específicos, como Flight Simulator 2020, en los que incluso la GeForce RTX 3080 alcanza sus límites. La nueva tarjeta gráfica muestra la mayor ventaja cuando va más allá de los 1080p. Si no se juega a altas resoluciones, la compra de un RTX 3080 no vale la pena actualmente.
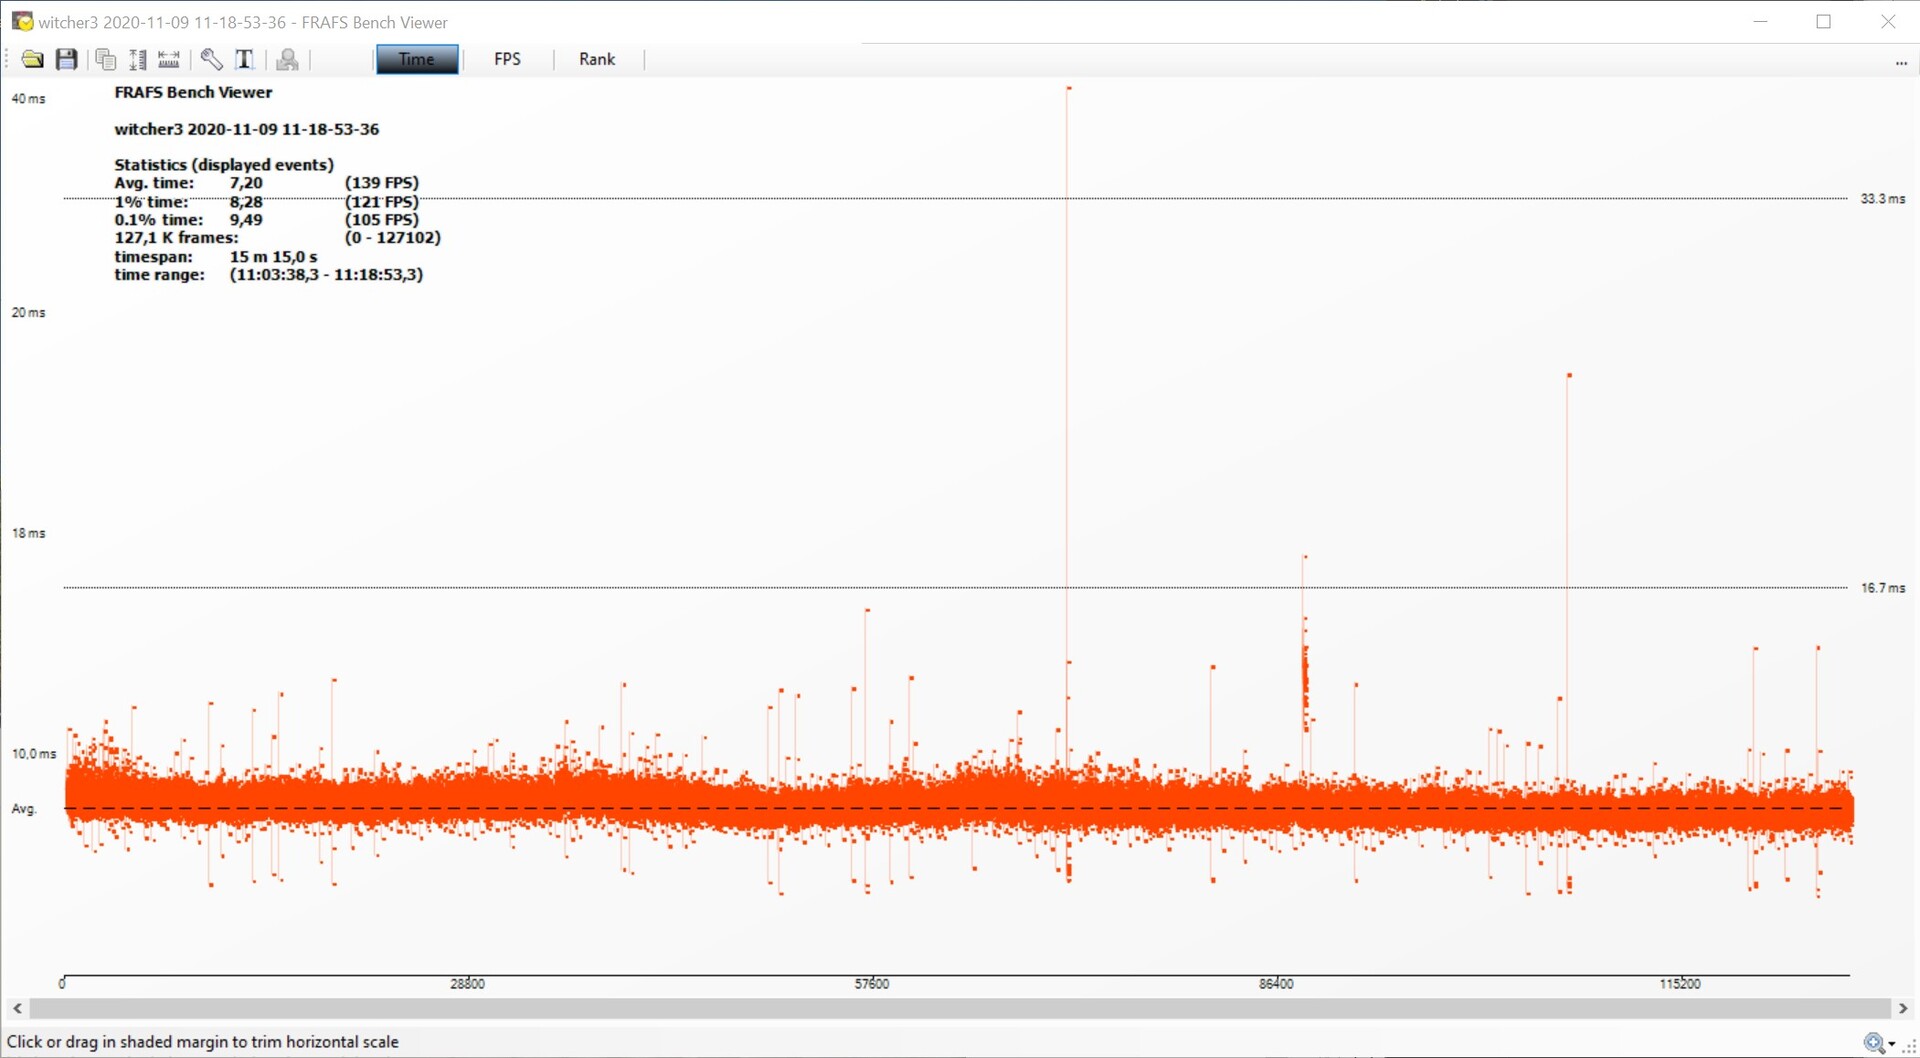
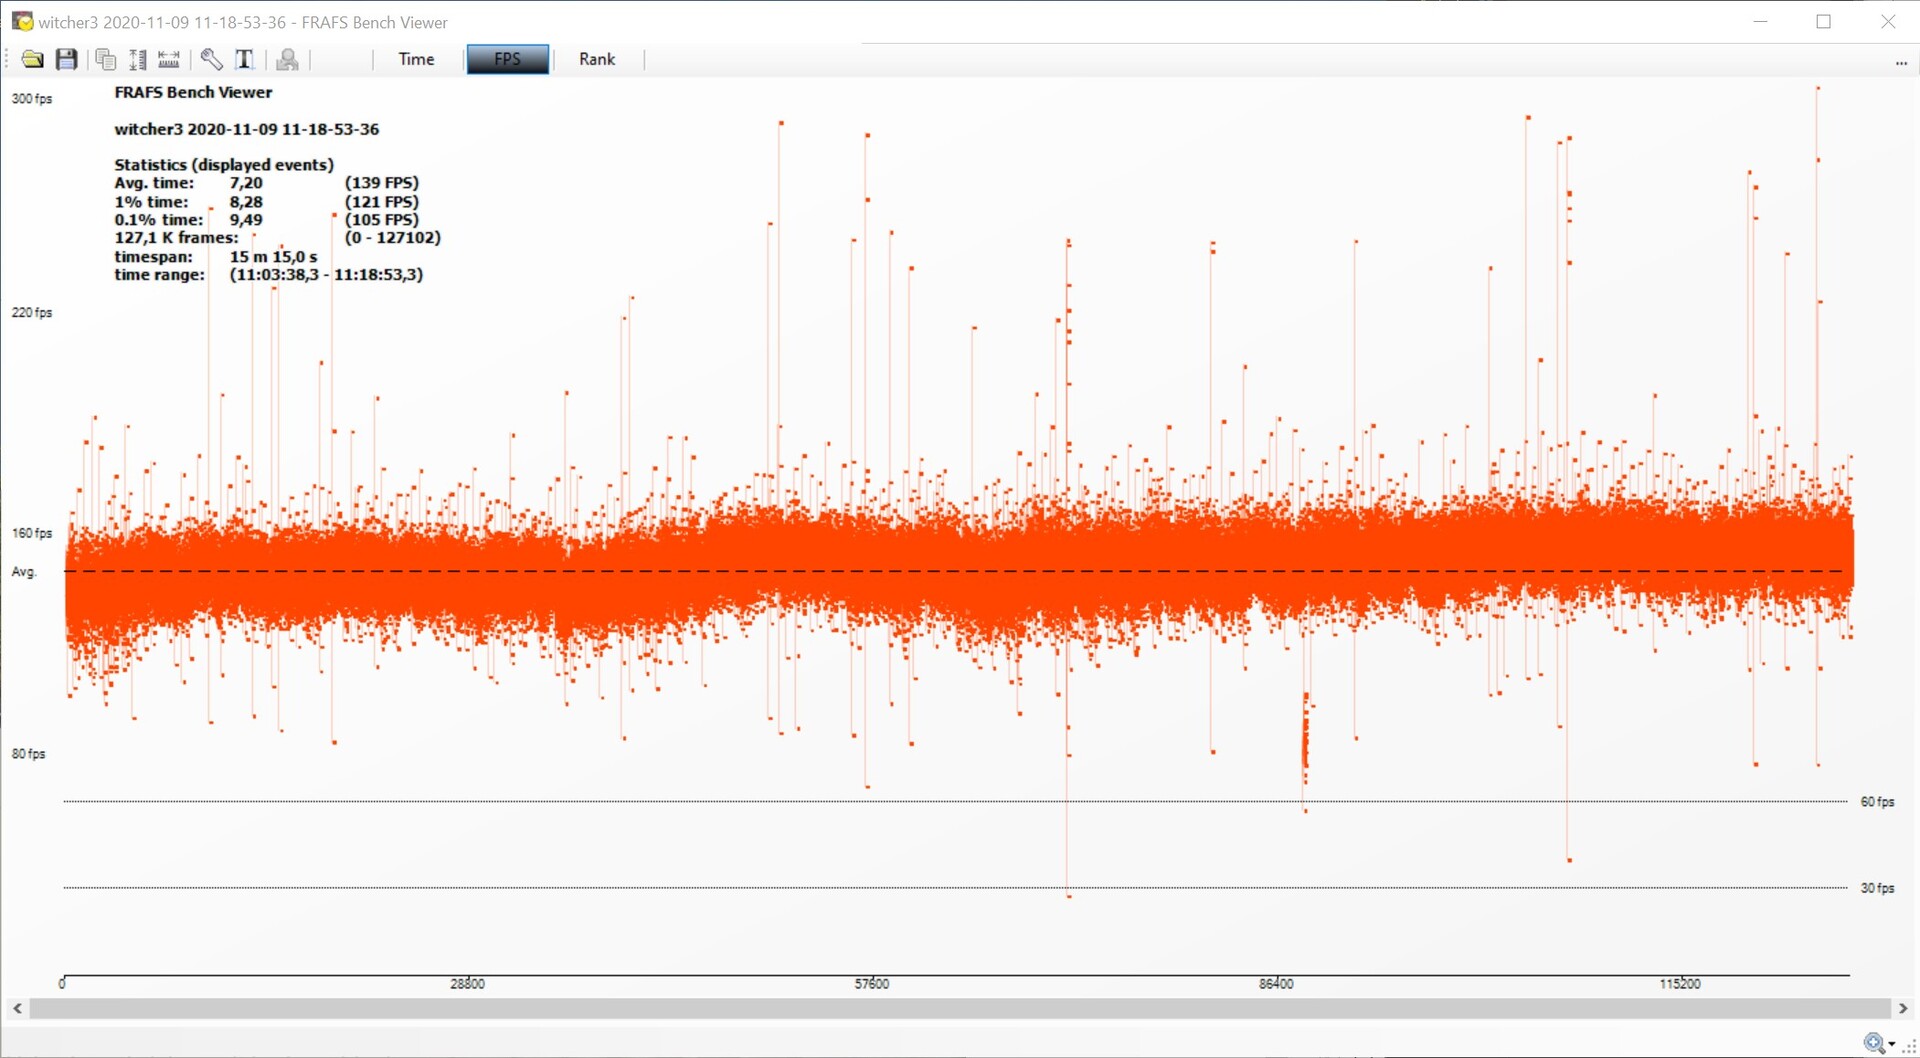
Pero la fluidez de juego está garantizada con el Asus GeForce RTX 3080 ROG Strix Gaming OC. Examinamos la progresión de fotogramas y también los tiempos de fotogramas en el juego The Witcher 3 (Ultra preset) y no encontramos ninguna irregularidad digna de mención. Documentamos los valores atípicos individuales. Sin embargo, a 139 FPS, la fluidez del juego está definitivamente garantizada.
The Witcher 3 progresión de fotogramas - Ultra
| F1 2020 - 3840x2160 Ultra High Preset AA:T AF:16x | |
| GeForce RTX 3090 | |
| Asus GeForce RTX 3080 ROG Strix Gaming OC | |
| Titan RTX | |
| Borderlands 3 - 3840x2160 Badass Overall Quality (DX11) | |
| GeForce RTX 3090 | |
| Asus GeForce RTX 3080 ROG Strix Gaming OC | |
| Titan RTX | |
| Titan RTX | |
| GeForce RTX 2080 Ti (Desktop) | |
| Red Dead Redemption 2 - 3840x2160 Maximum Settings | |
| GeForce RTX 3090 | |
| Asus GeForce RTX 3080 ROG Strix Gaming OC | |
| Titan RTX | |
| Rise of the Tomb Raider - 3840x2160 High Preset AA:FX AF:4x | |
| Asus GeForce RTX 3080 ROG Strix Gaming OC | |
| GeForce RTX 2080 Ti (Desktop) | |
| GeForce RTX 2080 Super (Desktop) | |
| GeForce RTX 2080 (Desktop) | |
| GeForce RTX 2070 Super (Desktop) | |
| GeForce RTX 2070 (Desktop) | |
| Radeon VII | |
| GeForce RTX 2060 Super (Desktop) | |
| RX Vega 64 | |
| GeForce RTX 2060 (Desktop) | |
| bajo | medio | alto | ultra | QHD | 4K | |
|---|---|---|---|---|---|---|
| GTA V (2015) | 187 | 187 | 184 | 130 | 122 | 136 |
| The Witcher 3 (2015) | 427 | 375 | 286 | 152 | 115 | |
| Dota 2 Reborn (2015) | 216.6 | 197.1 | 184.4 | 168.7 | 159.1 | |
| Rise of the Tomb Raider (2016) | 327 | 231 | 217 | 217 | 107 | |
| Final Fantasy XV Benchmark (2018) | 228 | 205 | 156 | 124 | 76.1 | |
| X-Plane 11.11 (2018) | 165 | 153 | 123 | 105 | ||
| Far Cry 5 (2018) | 184 | 162 | 155 | 145 | 137 | 95 |
| Strange Brigade (2018) | 567 | 416 | 336 | 289 | 220 | 135 |
| Shadow of the Tomb Raider (2018) | 227 | 206 | 198 | 185 | 147 | 83.9 |
| Battlefield V (2018) | 192 | 178 | 163 | 152 | 132 | 94.2 |
| Apex Legends (2019) | 144 | 144 | 144 | 144 | 144 | 143 |
| Far Cry New Dawn (2019) | 150 | 132 | 127 | 115 | 110 | 89 |
| Metro Exodus (2019) | 212 | 155 | 143 | 111 | 92.2 | 64.1 |
| The Division 2 (2019) | 240 | 197 | 168 | 140 | 107 | 65 |
| Anno 1800 (2019) | 142 | 139 | 99.3 | 54.1 | 52.5 | 46.3 |
| Rage 2 (2019) | 294 | 209 | 182 | 180 | 134 | 72.1 |
| Control (2019) | 240 | 196 | 155 | 106 | 56.2 | |
| Borderlands 3 (2019) | 165 | 143 | 129 | 128 | 103 | 61.5 |
| Star Wars Jedi Fallen Order (2019) | 134 | 132 | 133 | 132 | 92.9 | |
| Red Dead Redemption 2 (2019) | 167 | 154 | 135 | 96 | 81 | 56 |
| Hunt Showdown (2020) | 236 | 173 | 172 | 155 | 95.8 | |
| Doom Eternal (2020) | 283 | 277 | 270 | 268 | 248 | 153 |
| F1 2020 (2020) | 367 | 255 | 239 | 185 | 155 | 118 |
| Horizon Zero Dawn (2020) | 164 | 151 | 147 | 141 | 133 | 95 |
| Flight Simulator 2020 (2020) | 115 | 97.4 | 79.9 | 62.8 | 55.6 | 37.3 |
| Serious Sam 4 (2020) | 182.5 | 148.6 | 138.1 | 135.2 | 124.8 | 117 |
| Mafia Definitive Edition (2020) | 199 | 184 | 169 | 137 | 78.2 | |
| Star Wars Squadrons (2020) | 586 | 433 | 379 | 358 | 266 | 169 |
| FIFA 21 (2020) | 306 | 312 | 293 | 295 | 295 | 284 |
| Watch Dogs Legion (2020) | 147 | 146 | 125 | 103 | 81.6 | 54.1 |
| Dirt 5 (2020) | 176 | 121 | 111 | 111 | 69.1 | 55.3 |
Rendimiento de cálculo
En LuxMark y ComputeMark, el Asus GeForce RTX 3080 ROG Strix Gaming OC obtiene una puntuación significativamente mejor que los antiguos modelos de comparación. Las pruebas SPECviewperf están dirigidas principalmente a las estaciones de trabajo. Aquí, los modelos Quadro y FirePro suelen ofrecer un mayor rendimiento gracias a las optimizaciones de los controladores. La Nvidia Titan RTX tiene una posición especial aquí, ya que es idéntica en su construcción a la RTX 6000 de la serie Quadro. En general, ofrece el mejor rendimiento aquí, aunque las nuevas tarjetas gráficas Ampere ofrecen mejores valores en cada una de las disciplinas.
Emisiones del Asus GeForce RTX 3080 ROG Strix Gaming OC
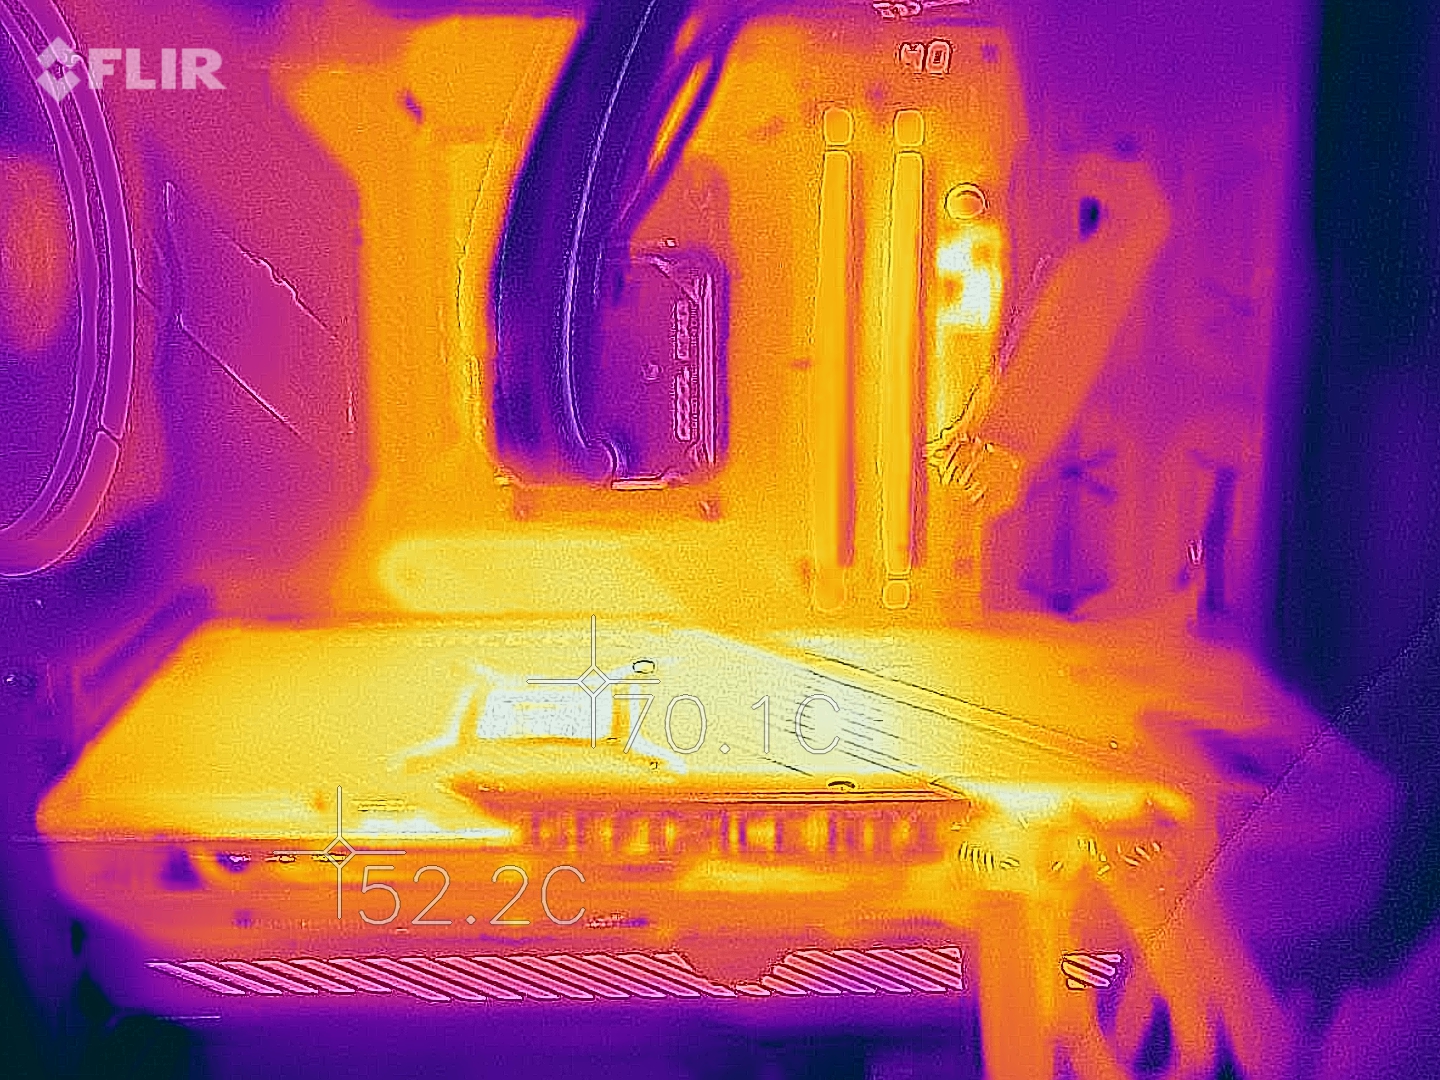
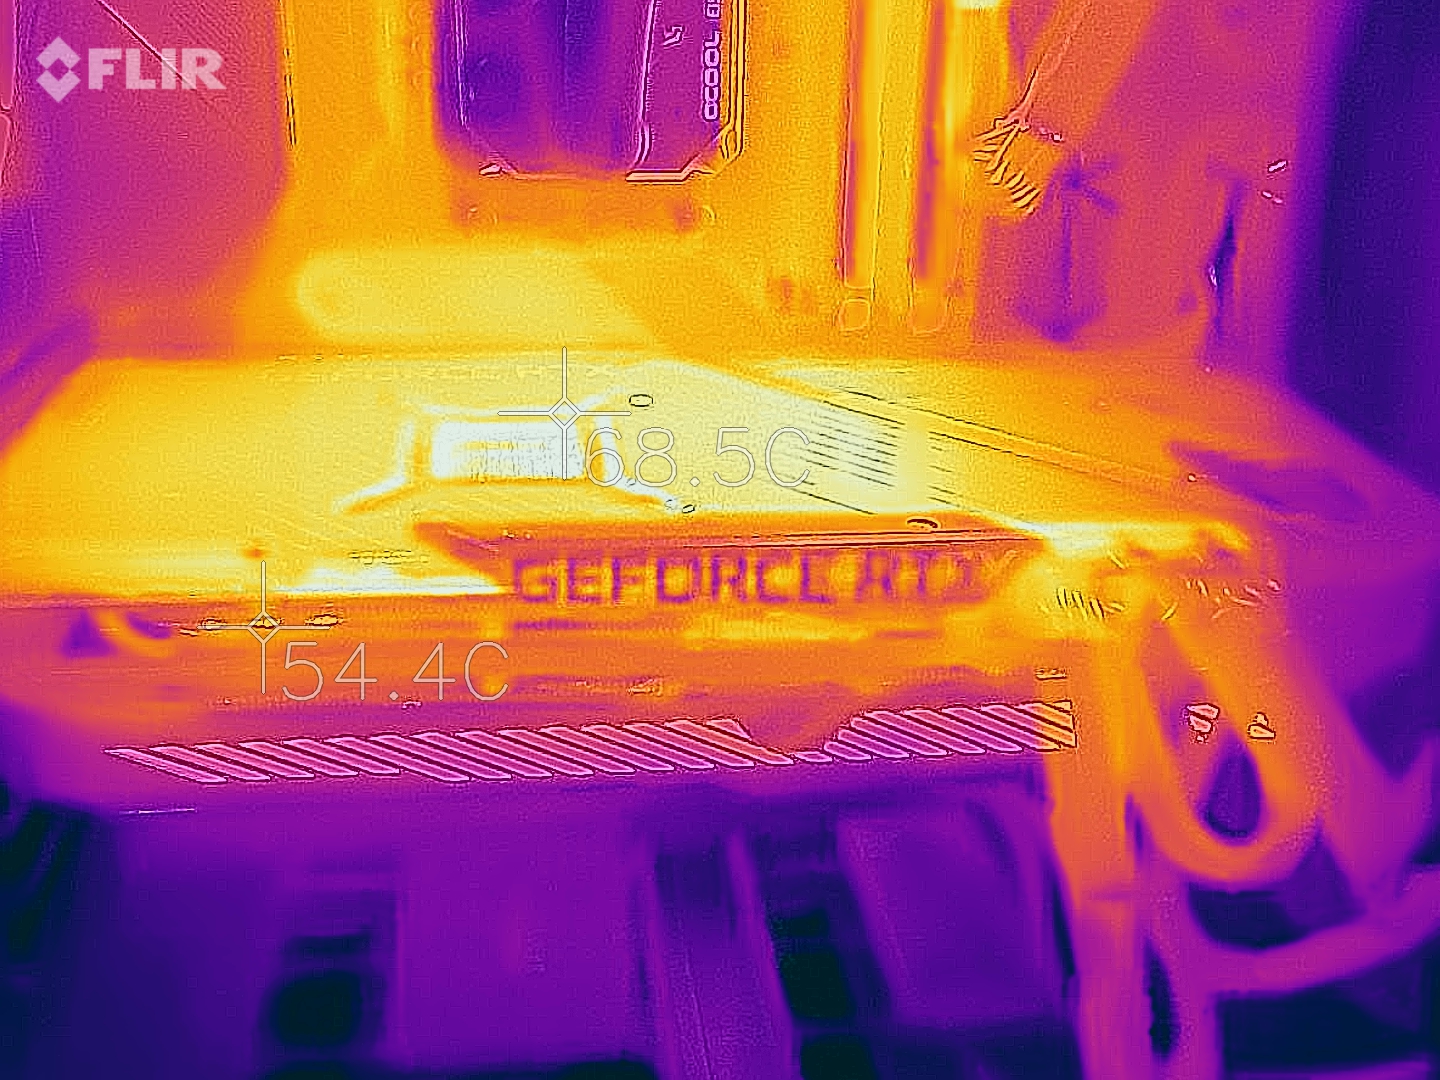
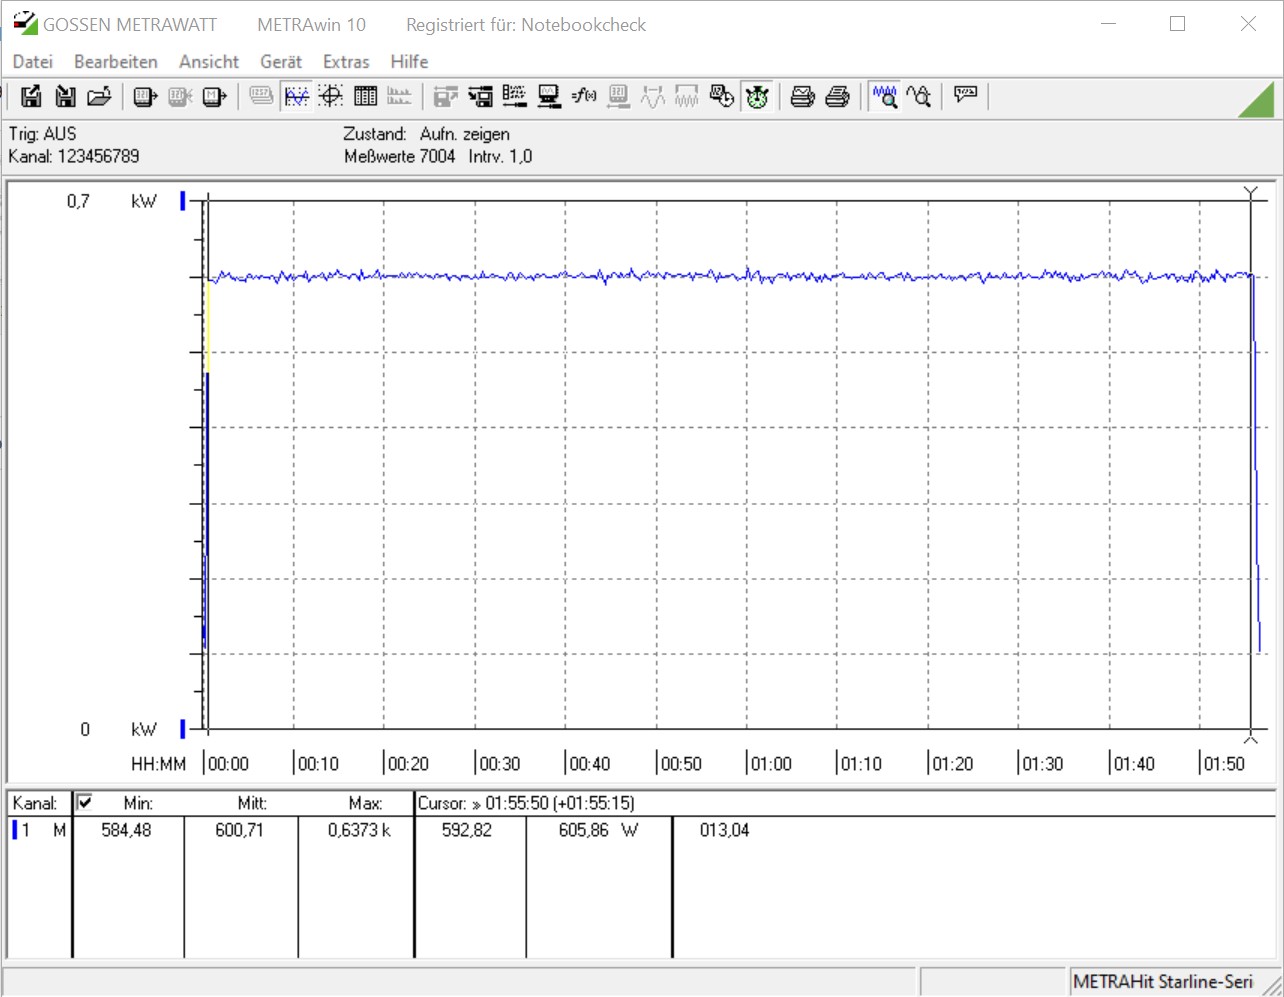
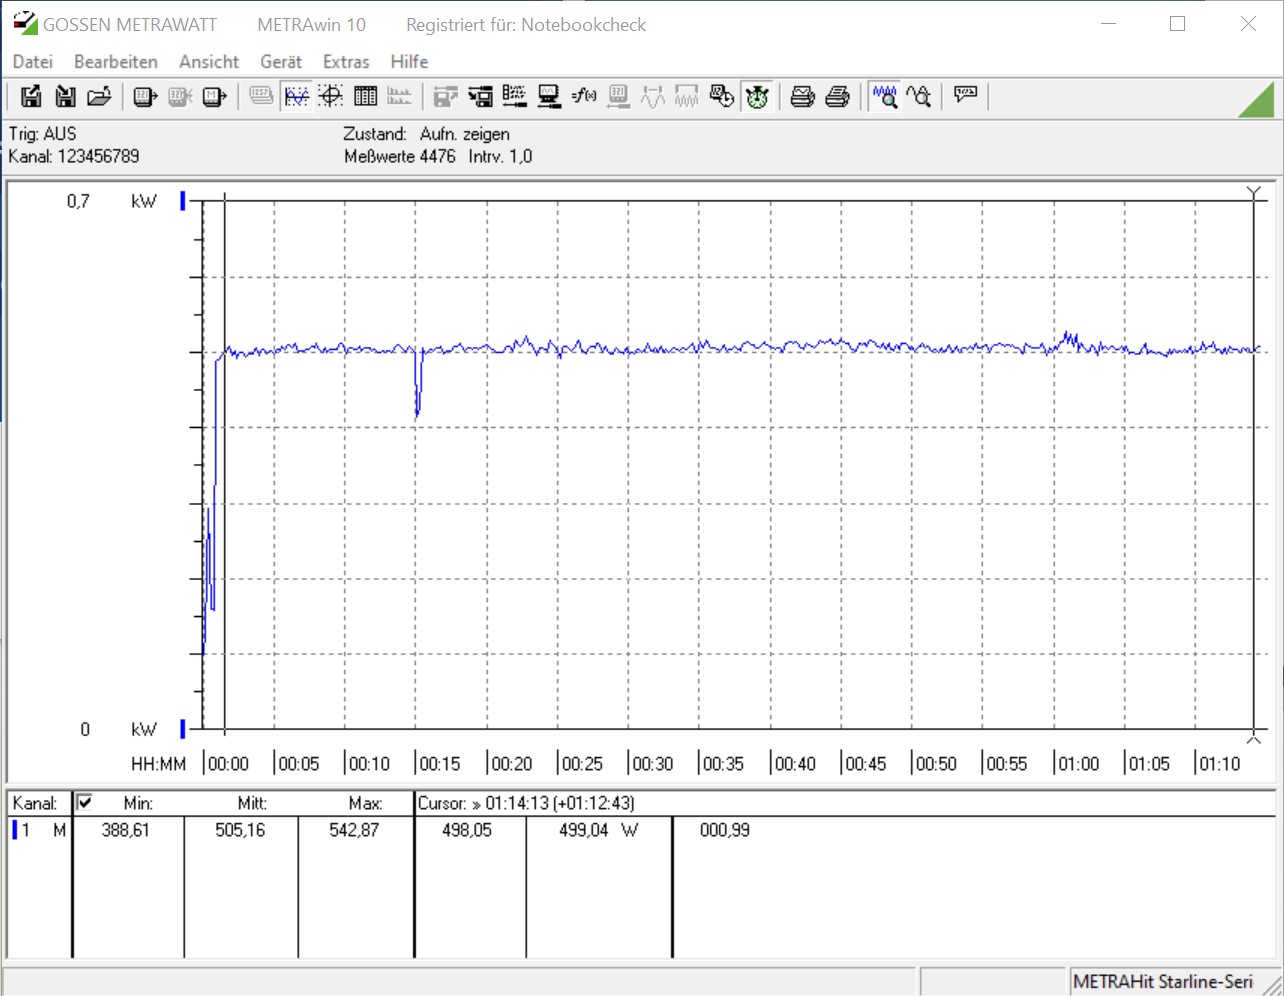
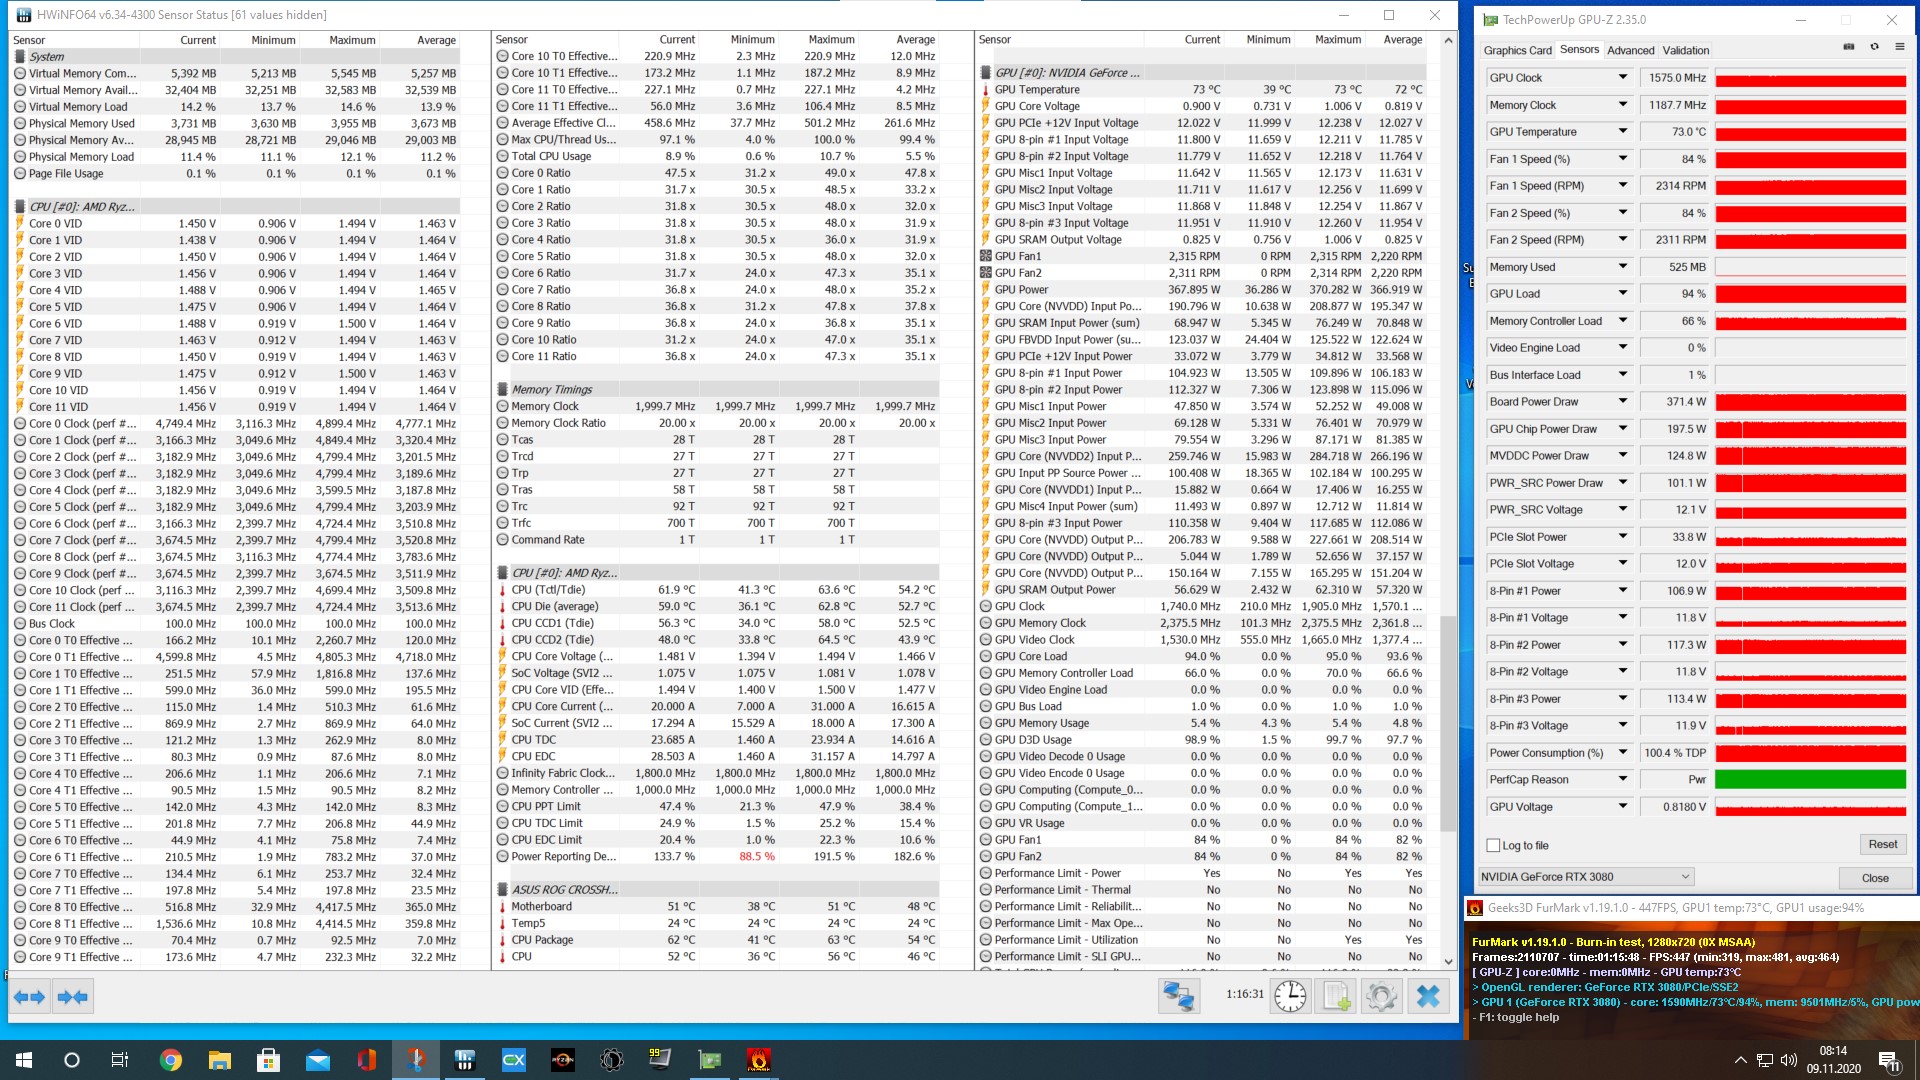
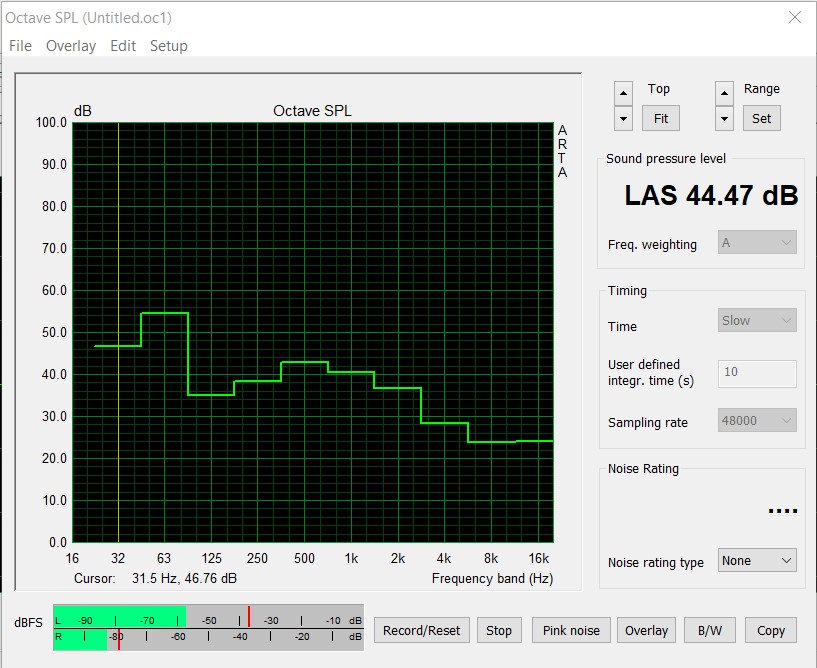
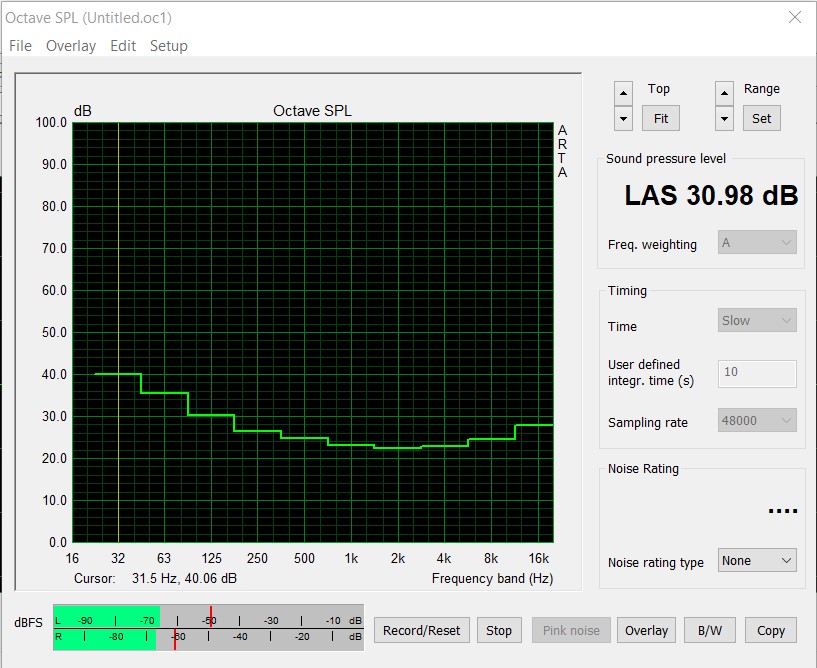
El Asus GeForce RTX 3080 ROG Strix Gaming OC no es en absoluto una tarjeta gráfica de bajo consumo. Pero con un TDP de 320 vatios, está a la par de la Edición Fundadora. El refrigerador extremadamente saliente es ventilado por tres ventiladores axiales, y esto fue compensado con buenas temperaturas en la prueba. Vale la pena mencionar que el ventilador del medio gira en dirección opuesta a los dos laterales. En la prueba de esfuerzo con la carcasa cerrada, la tarjeta gráfica se calentó hasta 73 °C, lo que definitivamente puede considerarse un muy buen resultado. Además, el nivel de ruido no es demasiado alto, incluso cuando los ventiladores giran a unas buenas 2.300 revoluciones por minuto. Con nuestro sistema de medición, fuimos capaces de detectar alrededor de 44 dB(A). En el uso en reposo, la tarjeta gráfica es completamente silenciosa debido al modo de parada del ventilador. El chillido de la bobina baja se produce de vez en cuando tan pronto como las velocidades de cuadro en los menús superan los 1.000. En general, el problema no está tan presente en el Asus GeForce RTX 3080 ROG Strix Gaming OC como en otras tarjetas gráficas que ya hemos probado.
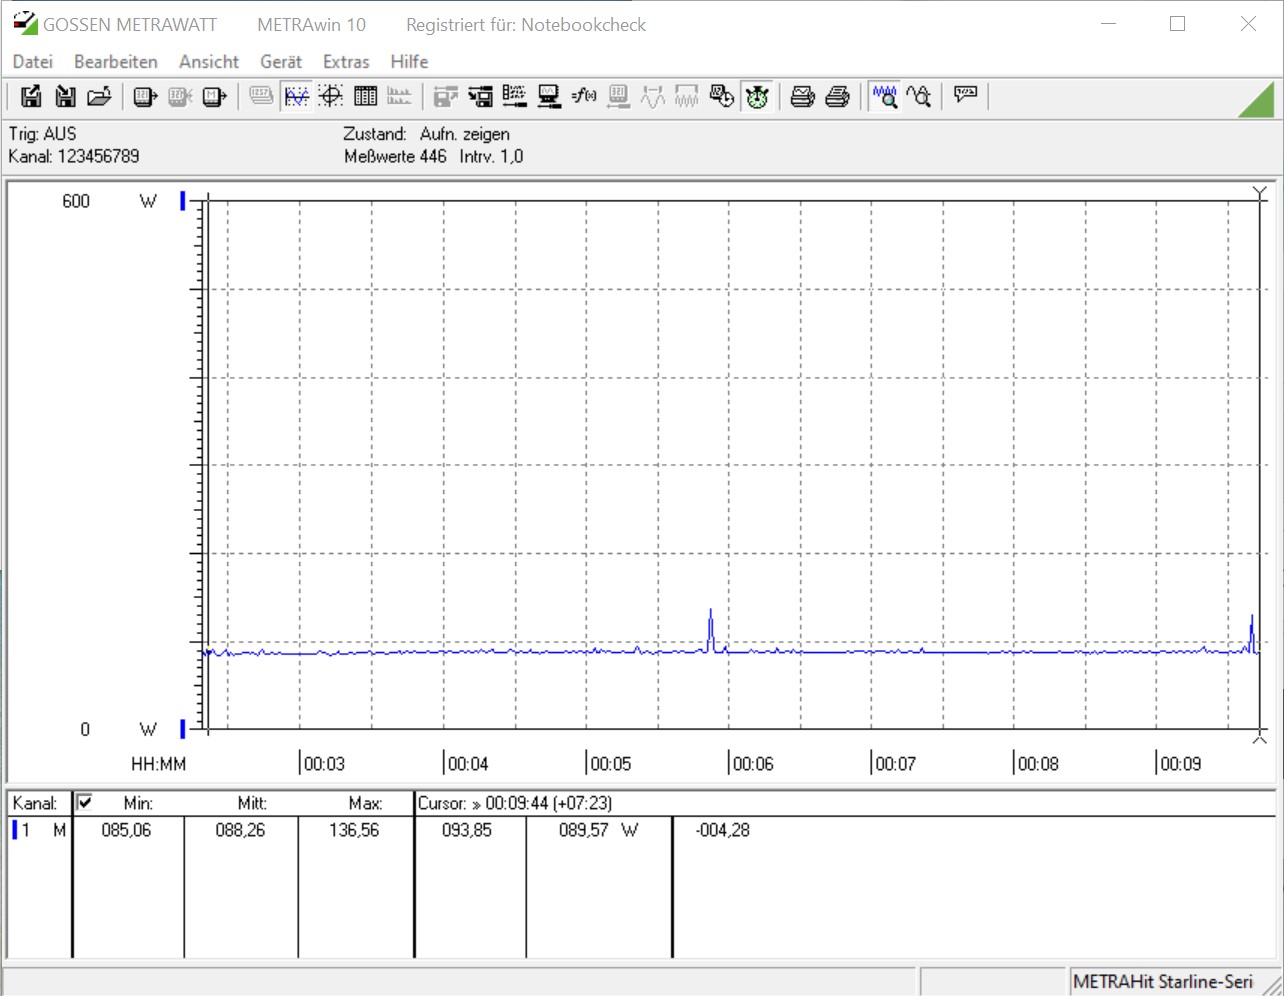
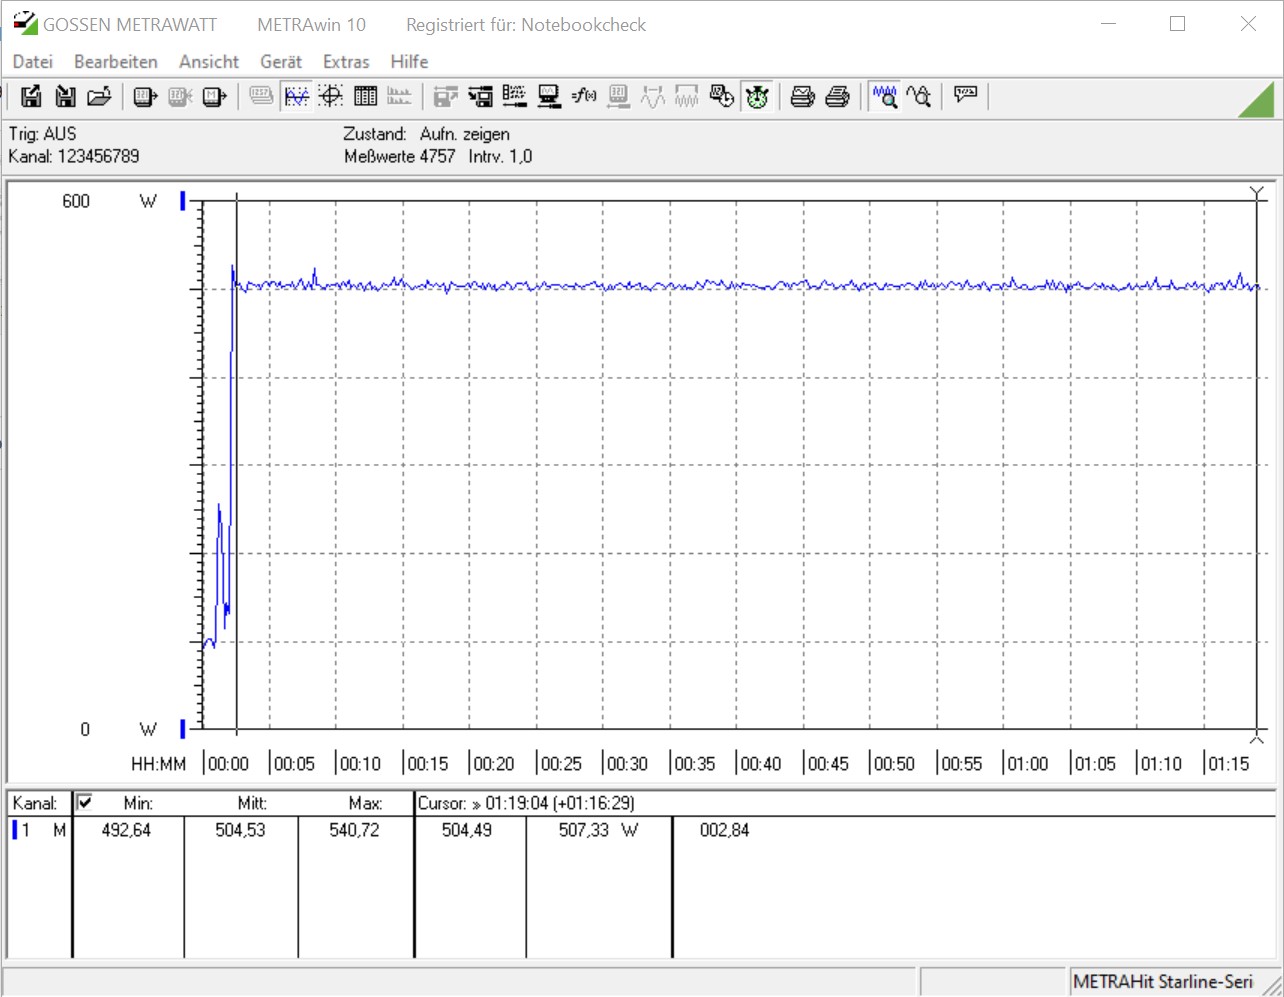
La GeForce RTX 3080 es bastante hambrienta de energía en términos de consumo de energía. Con sólo mirar la tarjeta gráfica se ve rápidamente que aquí se necesita una fuente de alimentación fuerte, ya que el Asus GeForce RTX 3080 ROG Strix Gaming OC requiere tres conexiones de alimentación de 8 pines. Con alrededor de 505 vatios, hemos medido valores casi idénticos para todo el sistema bajo carga, tanto en la prueba de esfuerzo como en la prueba de juego. Si ahora aumentamos el objetivo de potencia al 121%, nuestro dispositivo de medición muestra un poco más de 600 vatios en la prueba de esfuerzo. Por consiguiente, no es sorprendente que Asus especifique una recomendación de suministro de energía de al menos 850 vatios.
| Power Consumption | |
| 1920x1080 The Witcher 3 ultra (external Monitor) | |
| ASUS GeForce RTX 3080 ROG STRIX OC GAMING (Idle: 88.3 W) | |
| KFA2 GeForce RTX 2080 Ti EX (Idle: 100.5 W) | |
| AMD Radeon RX Vega 64 (Idle: 74.3 W) | |
| MSI RTX 2080 Gaming X Trio (Idle: 87.78 W) | |
| Nvidia GeForce RTX 2080 Super (Idle: 78.87 W) | |
| AMD Radeon RX 5700 XT (Idle: 69.8 W) | |
| Nvidia GeForce RTX 2070 Super (96.8 fps, Idle: 80.5 W) | |
| MSI RTX 2070 Gaming Z 8G (Idle: 73.3 W) | |
| AMD Radeon VII (Idle: 81.39 W) | |
| Nvidia GeForce RTX 2060 Super (82.7 fps, Idle: 77.12 W) | |
| AMD Radeon RX 5700 (84.2 fps, Idle: 64.5 W) | |
| MSI RTX 2060 Gaming Z 6G (Idle: 74.66 W) | |
| 1280x720 FurMark 1.19 GPU Stress Test (external Monitor) | |
| ASUS GeForce RTX 3080 ROG STRIX OC GAMING (Idle: 88.3 W) | |
| AMD Radeon VII (Idle: 81.39 W) | |
| MSI RTX 2080 Gaming X Trio | |
| KFA2 GeForce RTX 2080 Ti EX (Idle: 100.5 W) | |
| Nvidia GeForce RTX 2080 Super (Idle: 78.87 W) | |
| MSI RTX 2070 Gaming Z 8G (Idle: 73.3 W) | |
| AMD Radeon RX 5700 XT (239 fps, Idle: 69.8 W) | |
| Nvidia GeForce RTX 2070 Super (283 fps, Idle: 80.5 W) | |
| MSI RTX 2060 Gaming Z 6G (Idle: 74.66 W) | |
| Nvidia GeForce RTX 2060 Super (237 fps, Idle: 77.12 W) | |
| AMD Radeon RX 5700 (207 fps, Idle: 64.5 W) | |
* ... más pequeño es mejor
Pro
Contra
Veredicto - Rápido y silencioso bajo carga

Con la GeForce RTX 3080 ROG Strix Gaming OC, Asus tiene sin duda una tarjeta gráfica muy rápida en el mercado. Todos los últimos juegos se pueden jugar sin problemas con ella. Pero esta tarjeta gráfica sólo empieza a sentirse bien cuando supera la resolución nativa de 1080p. La actual generación de Ampere puede distinguirse claramente de la de Turing. Si añadimos DLSS o Ray Tracing encima, la ventaja de la nueva arquitectura se hace aún mayor. Sin embargo, los usuarios deben vivir con inconvenientes en comparación con un RTX 2080 Ti en términos de VRAM, porque a 10 GB en el RTX 3080, esto es más pequeño que en el 2080 Ti (11 GB). A largo plazo, sin embargo, eso podría convertirse en la caída del RTX 3080, porque AMD ya ha anunciado sus tres modelos superiores de la serie 6000 y utiliza constantemente 16 GB de VRAM aquí. El rumor de Nvidia está en boca de todos, y un RTX 3080 Ti con más sombreadores y 20 GB de VRAM se supone que ya está en marcha.
¿Pero de qué sirve una tarjeta gráfica rápida si no se puede comprar? Nvidia, y por lo tanto sus socios de la junta directiva también, ya han desperdiciado mucho potencial aquí, porque la demanda todavía no puede ser satisfecha. Según informes internos, se espera que esta situación continúe en 2021.
La Asus GeForce RTX 3080 ROG Strix Gaming OC es una de las tarjetas gráficas RTX 3080 más rápidas que también viene con una buena refrigeración. La bien pensada unidad de refrigeración es convincente, y con la discreta iluminación RGB, también hay algo para deleitar tus ojos.
Aquellos que ya han conseguido hacerse con un modelo RTX 3080 serán recompensados con una buena cantidad de potencia gráfica. Pero esto también resulta en un alto consumo de energía, que debe ser considerado al comprar. La correcta elección de la fuente de alimentación es importante aquí, para no sufrir de feos choques del sistema bajo carga. Asus recomienda al menos una fuente de alimentación de 850 vatios para nuestra muestra de prueba.
El Asus GeForce RTX 3080 ROG Strix Gaming OC tiene actualmente un precio de 999 euros (~$1,185). Eso es 300 Euros (~$356) más que el MSRP de la Edición Fundadora; pero las pequeñas cantidades hacen que los precios sean extremadamente altos, por lo que incluso la Edición Fundadora se ofrece en parte a más de 1.000 Euros (~$1.186). Nuestro consejo es, por lo tanto, esperar y ver qué hace la competencia, para que no se arrepienta de su decisión de compra más tarde.
Todos los puntos de referencia y los valores de prueba para el RTX 3080 se pueden encontrar en el sitio de la GeForce RTX 3080 (actualizado regularmente).
