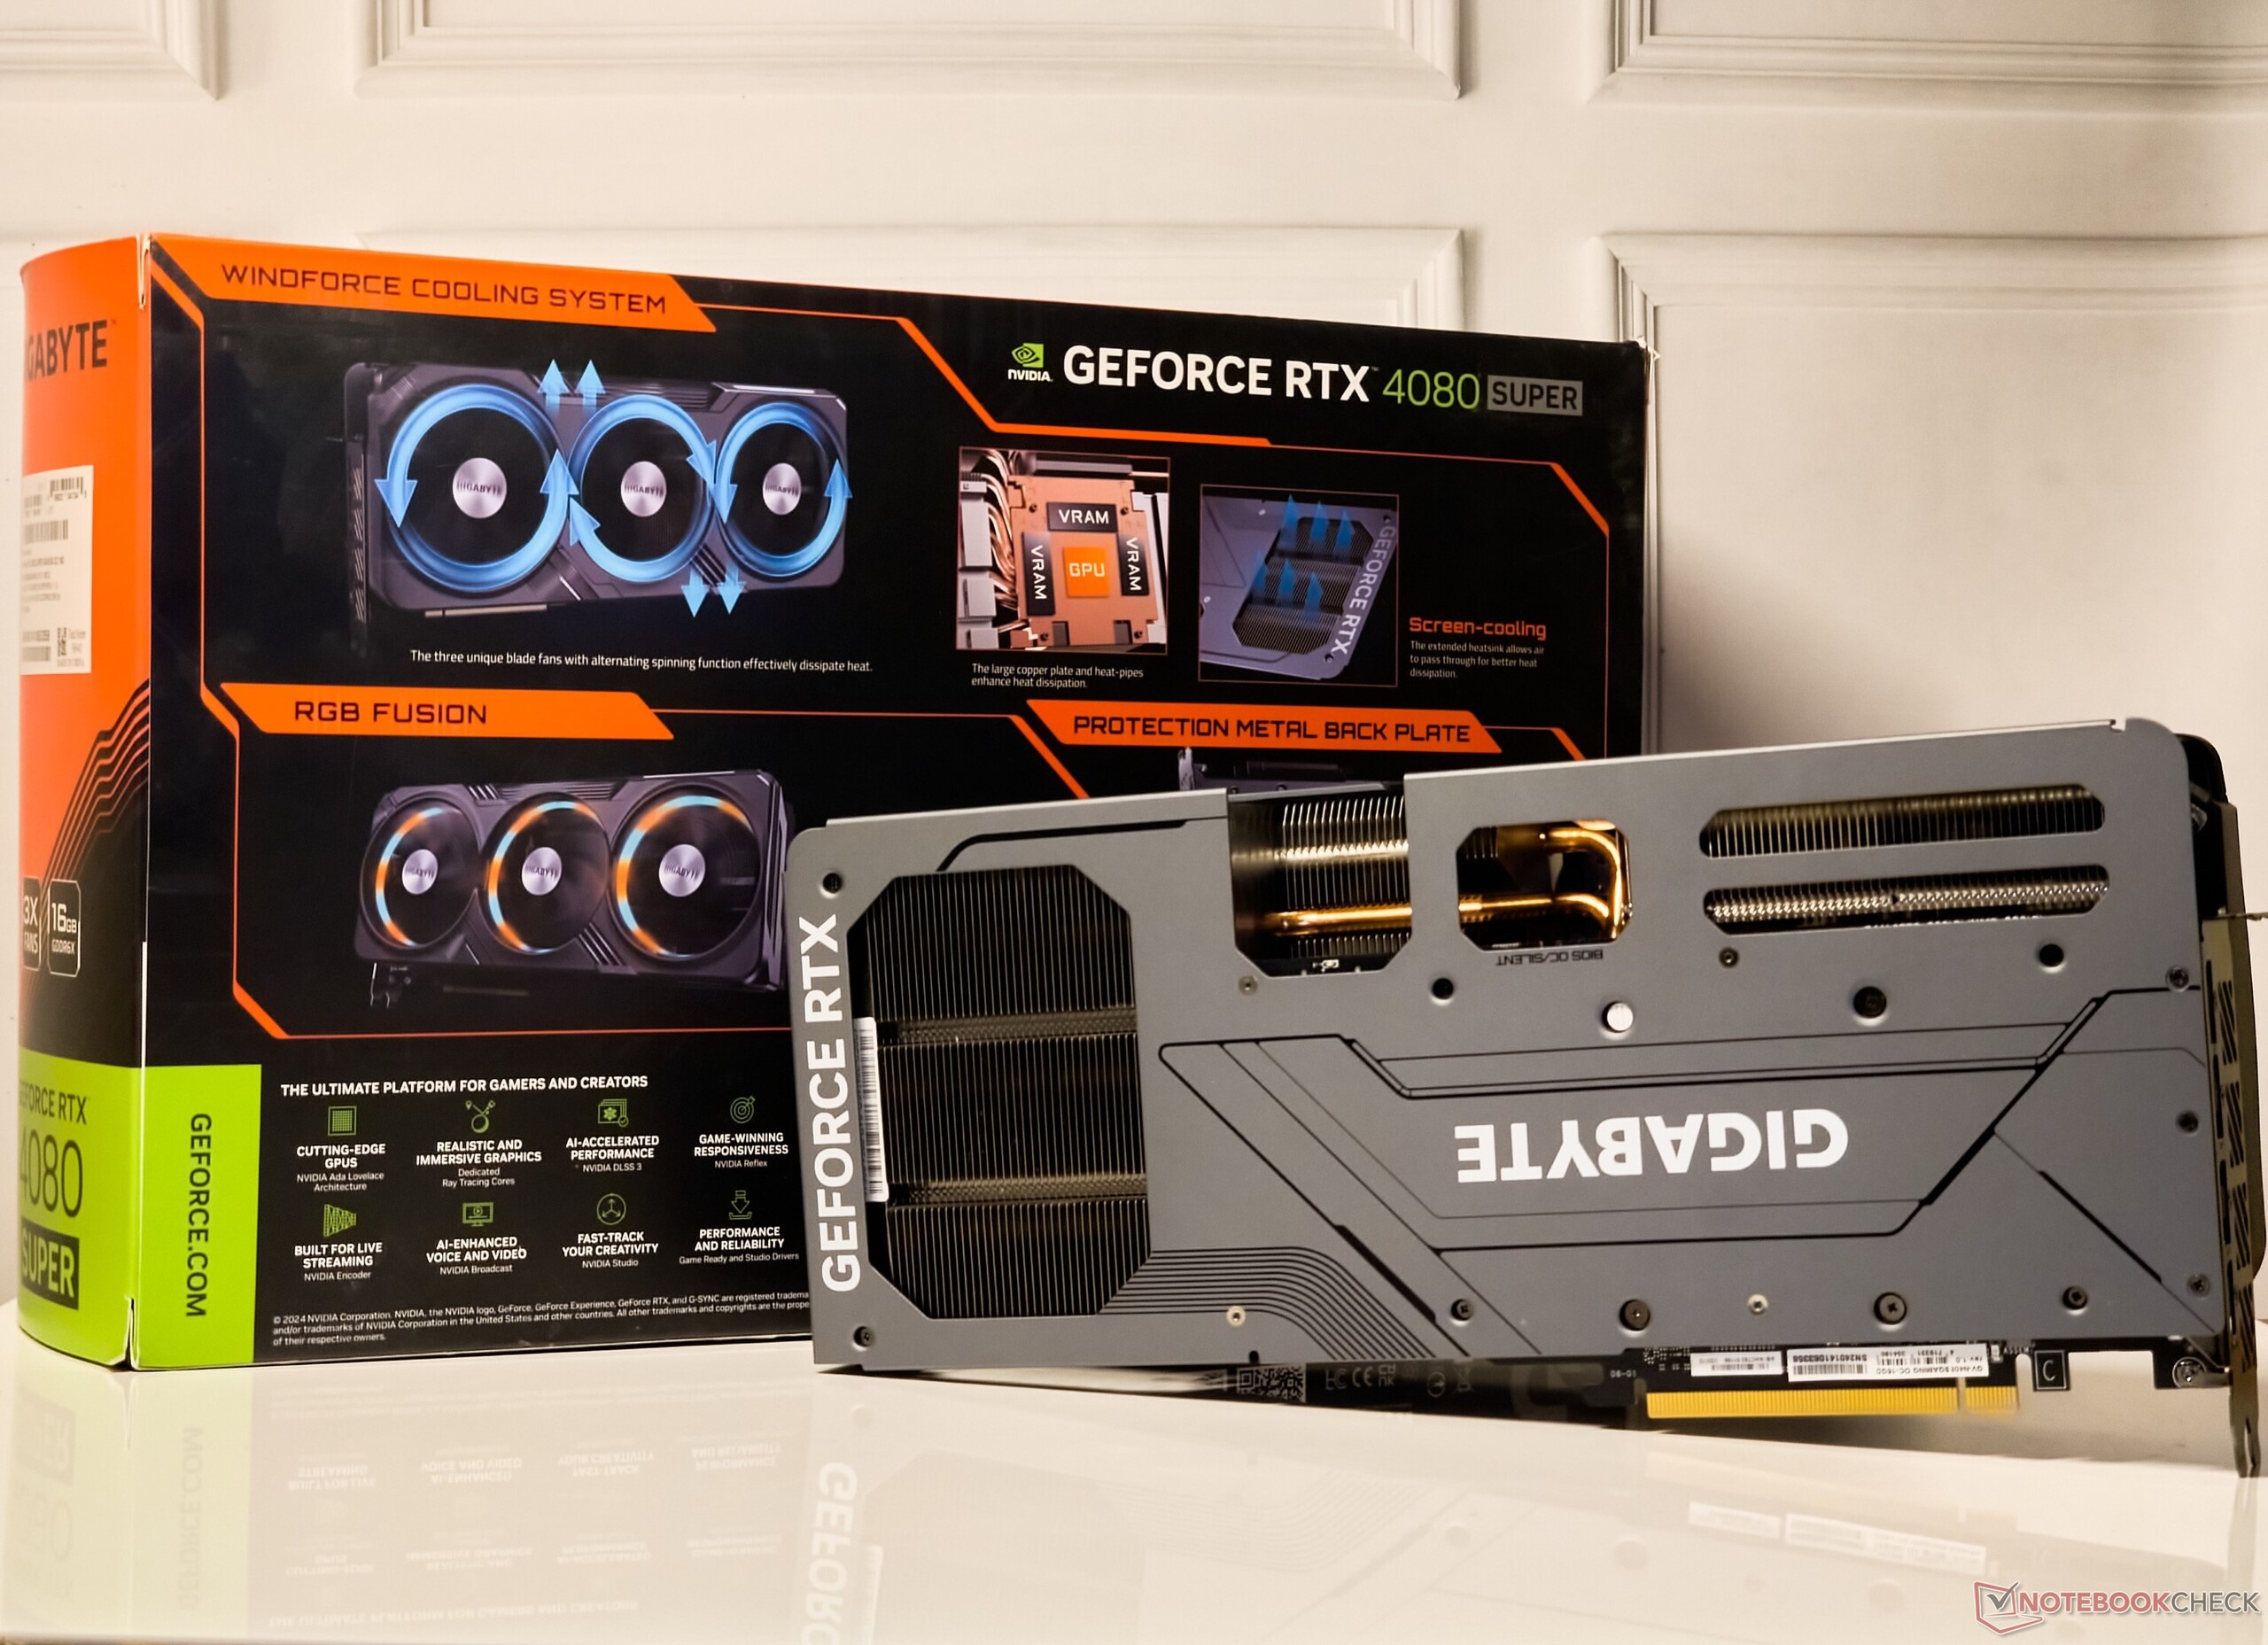
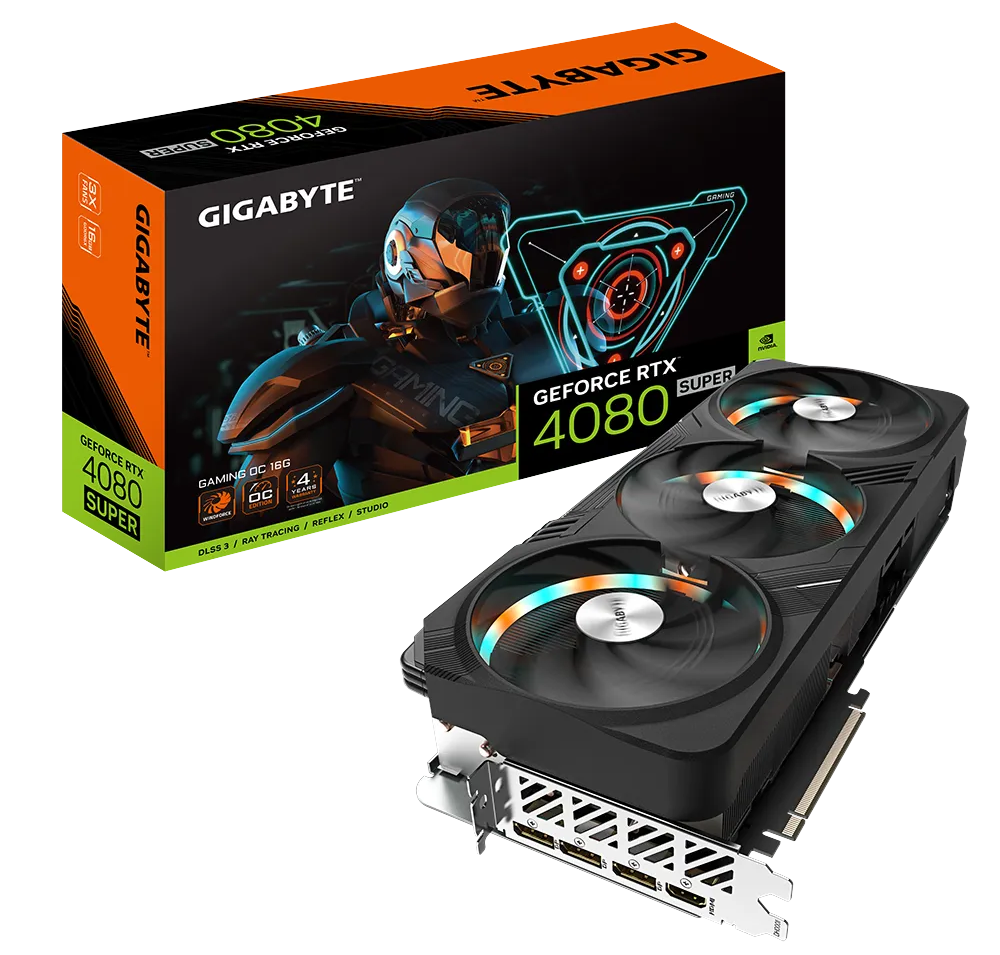
Reseña de Gigabyte GeForce RTX 4080 Super Gaming OC 16G: Intercambia golpes con la RX 7900 XTX por 200 dólares menos que la RTX 4080 no Super

Hasta ahora hemos analizado varias GPU nuevas de la serie RTX 40 Super, incluida la RTX 4070 Super Founders Edition, Gigabyte RTX 4070 Super Gaming OCy la Asus TUF Gaming RTX 4070 Ti Super.
Ahora, tenemos con nosotros la Gigabyte GeForce RTX 4080 Super Gaming OC 16G - una actualización de mitad de ciclo de vida que suplanta totalmente a la anterior RTX 4080 homóloga.
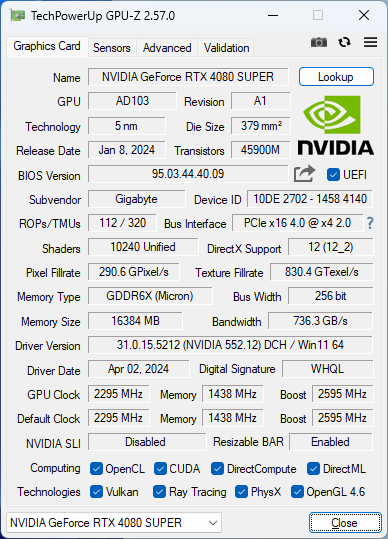
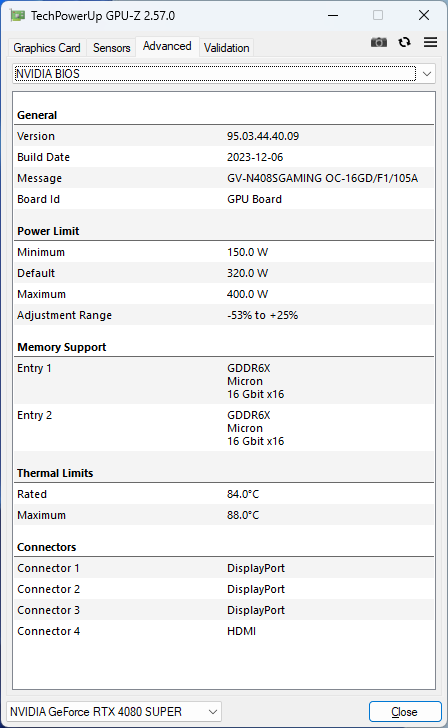
Mientras que la RTX 4080 original contaba con 9.728 núcleos CUDA, la nueva RTX 4080 Super aprovecha al máximo la matriz AD103 al tener los 10.240 núcleos CUDA disparando a pleno rendimiento. Esto supone sólo un aumento del 5% en el recuento de shaders, lo que no es muy impresionante a diferencia de la RTX 4070 Super (+21%) y la RTX 4070 Super Ti (+10%). La memoria VRAM sigue siendo la misma, de 16 GB GDDR6X, pero el ancho de banda general aumenta ligeramente hasta los 736,3 GB/s, frente a los 716,8 GB/s de la RTX 4080 no Super.
La RTX 4080 Super se vende a un PVPR de 1.000 dólares, frente a los 200 dólares que costaba la original. La versión de Gigabyte de la RTX 4080 Super añade algunas ventajas adicionales por un sobreprecio nominal de 50 dólares, a 1.050 dólares MSRP.
En la India, esta GPU se puede conseguir actualmente en el rango de ₹1.20.000 a ₹1.28.000 dependiendo del minorista y viene con una garantía estándar de tres años ampliable por un año adicional.
En este análisis, echamos un vistazo a la Gigabyte RTX 4080 Super Gaming OC y comprobamos si las supuestas mejoras de rendimiento y el precio son razonables, especialmente con el lanzamiento de Blackwell previsto para finales de este año.
Comparación de la Gigabyte GeForce RTX 4080 Super Gaming OC 16G con otras GPU Nvidia
| Especificación | RTX 4090 FE | Gigabyte RTX 4080 Super Gaming OC | RTX 4080 FE | Asus TUF RTX 4070 Ti Super | RTX 4070 Super FE | Zotac RTX 4070 AMP Airo | KFA2RTX 4060 Ti EX | RTX 3090 Ti FE | RTX 3090 FE | RTX 3080 Ti FE | RTX 3070 FE | Titan RTX |
|---|---|---|---|---|---|---|---|---|---|---|---|---|
| Chip | AD102 | AD103 | AD103 | AD103 | AD104 | AD104 | AD106 | GA102 | GA102 | GA102 | GA104 | TU102 |
| Proceso FinFET | Personalizado 4N | Personalizado 4N | Personalizado 4N | Personalizado 4N | Personalizado 4N | Personalizado 4N | Personalizado 4N | 8 nm | 8 nm | 8 nm | 8 nm | 12 nm |
| Núcleos CUDA | 16.384 | 10.240 | 9.728 | 8.448 | 7.168 | 5.888 | 4.352 | 10.752 | 10.496 | 10.240 | 5.888 | 4.608 |
| Unidades de textura | 512 | 320 | 304 | 264 | 224 | 184 | 136 | 336 | 328 | 320 | 184 | 288 |
| Núcleos Tensores | 512 4ª Gen. | 320 4ª Gen. | 304 4ª Gen. | 264 4ª Gen. | 224 4ª Gen. | 184 4ª Gen. | 136 4ª Gen. | 336 3ª Gen. | 328 3ª Gen. | 320 3ª Gen. | 184 3ª Gen. | 576 2ª Gen. |
| Núcleos RT | 128 3ª Gen. | 80 3ª Gen. | 76 3ª Gen. | 66 3ª Gen. | 56 3ª Gen. | 46 3ª Gen. | 34 3ª Gen. | 84 2ª Gen. | 82 2ª Gen. | 80 2ª Gen. | 46 2ª Gen. | 72 |
| Reloj base de la GPU | 2.235 MHz | 2.295 MHz | 2.205 MHz | 2.340 MHz | 1.980 MHz | 1.920 MHz | 2.310 MHz | 1.560 MHz | 1.395 MHz | 1.365 MHz | 1.500 MHz | 1.350 MHz |
| Reloj Boost de la GPU | 2.520 MHz | 2.595 MHz | 2.505 MHz | 2.610 MHz | 2.475 MHz | 2.535 MHz | 2.535 MHz | 1.860 MHz | 1.695 MHz | 1.665 MHz | 1.750 MHz | 1.770 MHz |
| Bus de memoria | 384 bits | 256 bits | 256 bits | 256 bits | 192 bits | 192 bits | 128 bits | 384 bits | 384 bits | 384 bits | 256 bits | 384 bits |
| Ancho de banda de memoria | 1.008 GB/s | 736,3 GB/s | 716,8 GB/s | 672 GB/s | 504 GB/s | 504 GB/s | 288 GB/s | 1.008 GB/s | 936 GB/s | 912 GB/s | 448 GB/s | 672 GB/s |
| Memoria de vídeo | 24 GB GDDR6X | 16 GB GDDR6X | 16 GB GDDR6X | 16 GB GDDR6X | 12 GB GDDR6X | 12 GB GDDR6X | 8 GB GDDR6 | 24 GB GDDR6X | 24 GB GDDR6X | 12 GB GDDR6X | 8 GB GDDR6 | 24 GB GDDR6 |
| Consumo de energía | 450 W | 320 W | 320 W | 285 W | 220 W | 215 W | 160 W | 450 W | 350 W | 350 W | 220 W | 280 W |
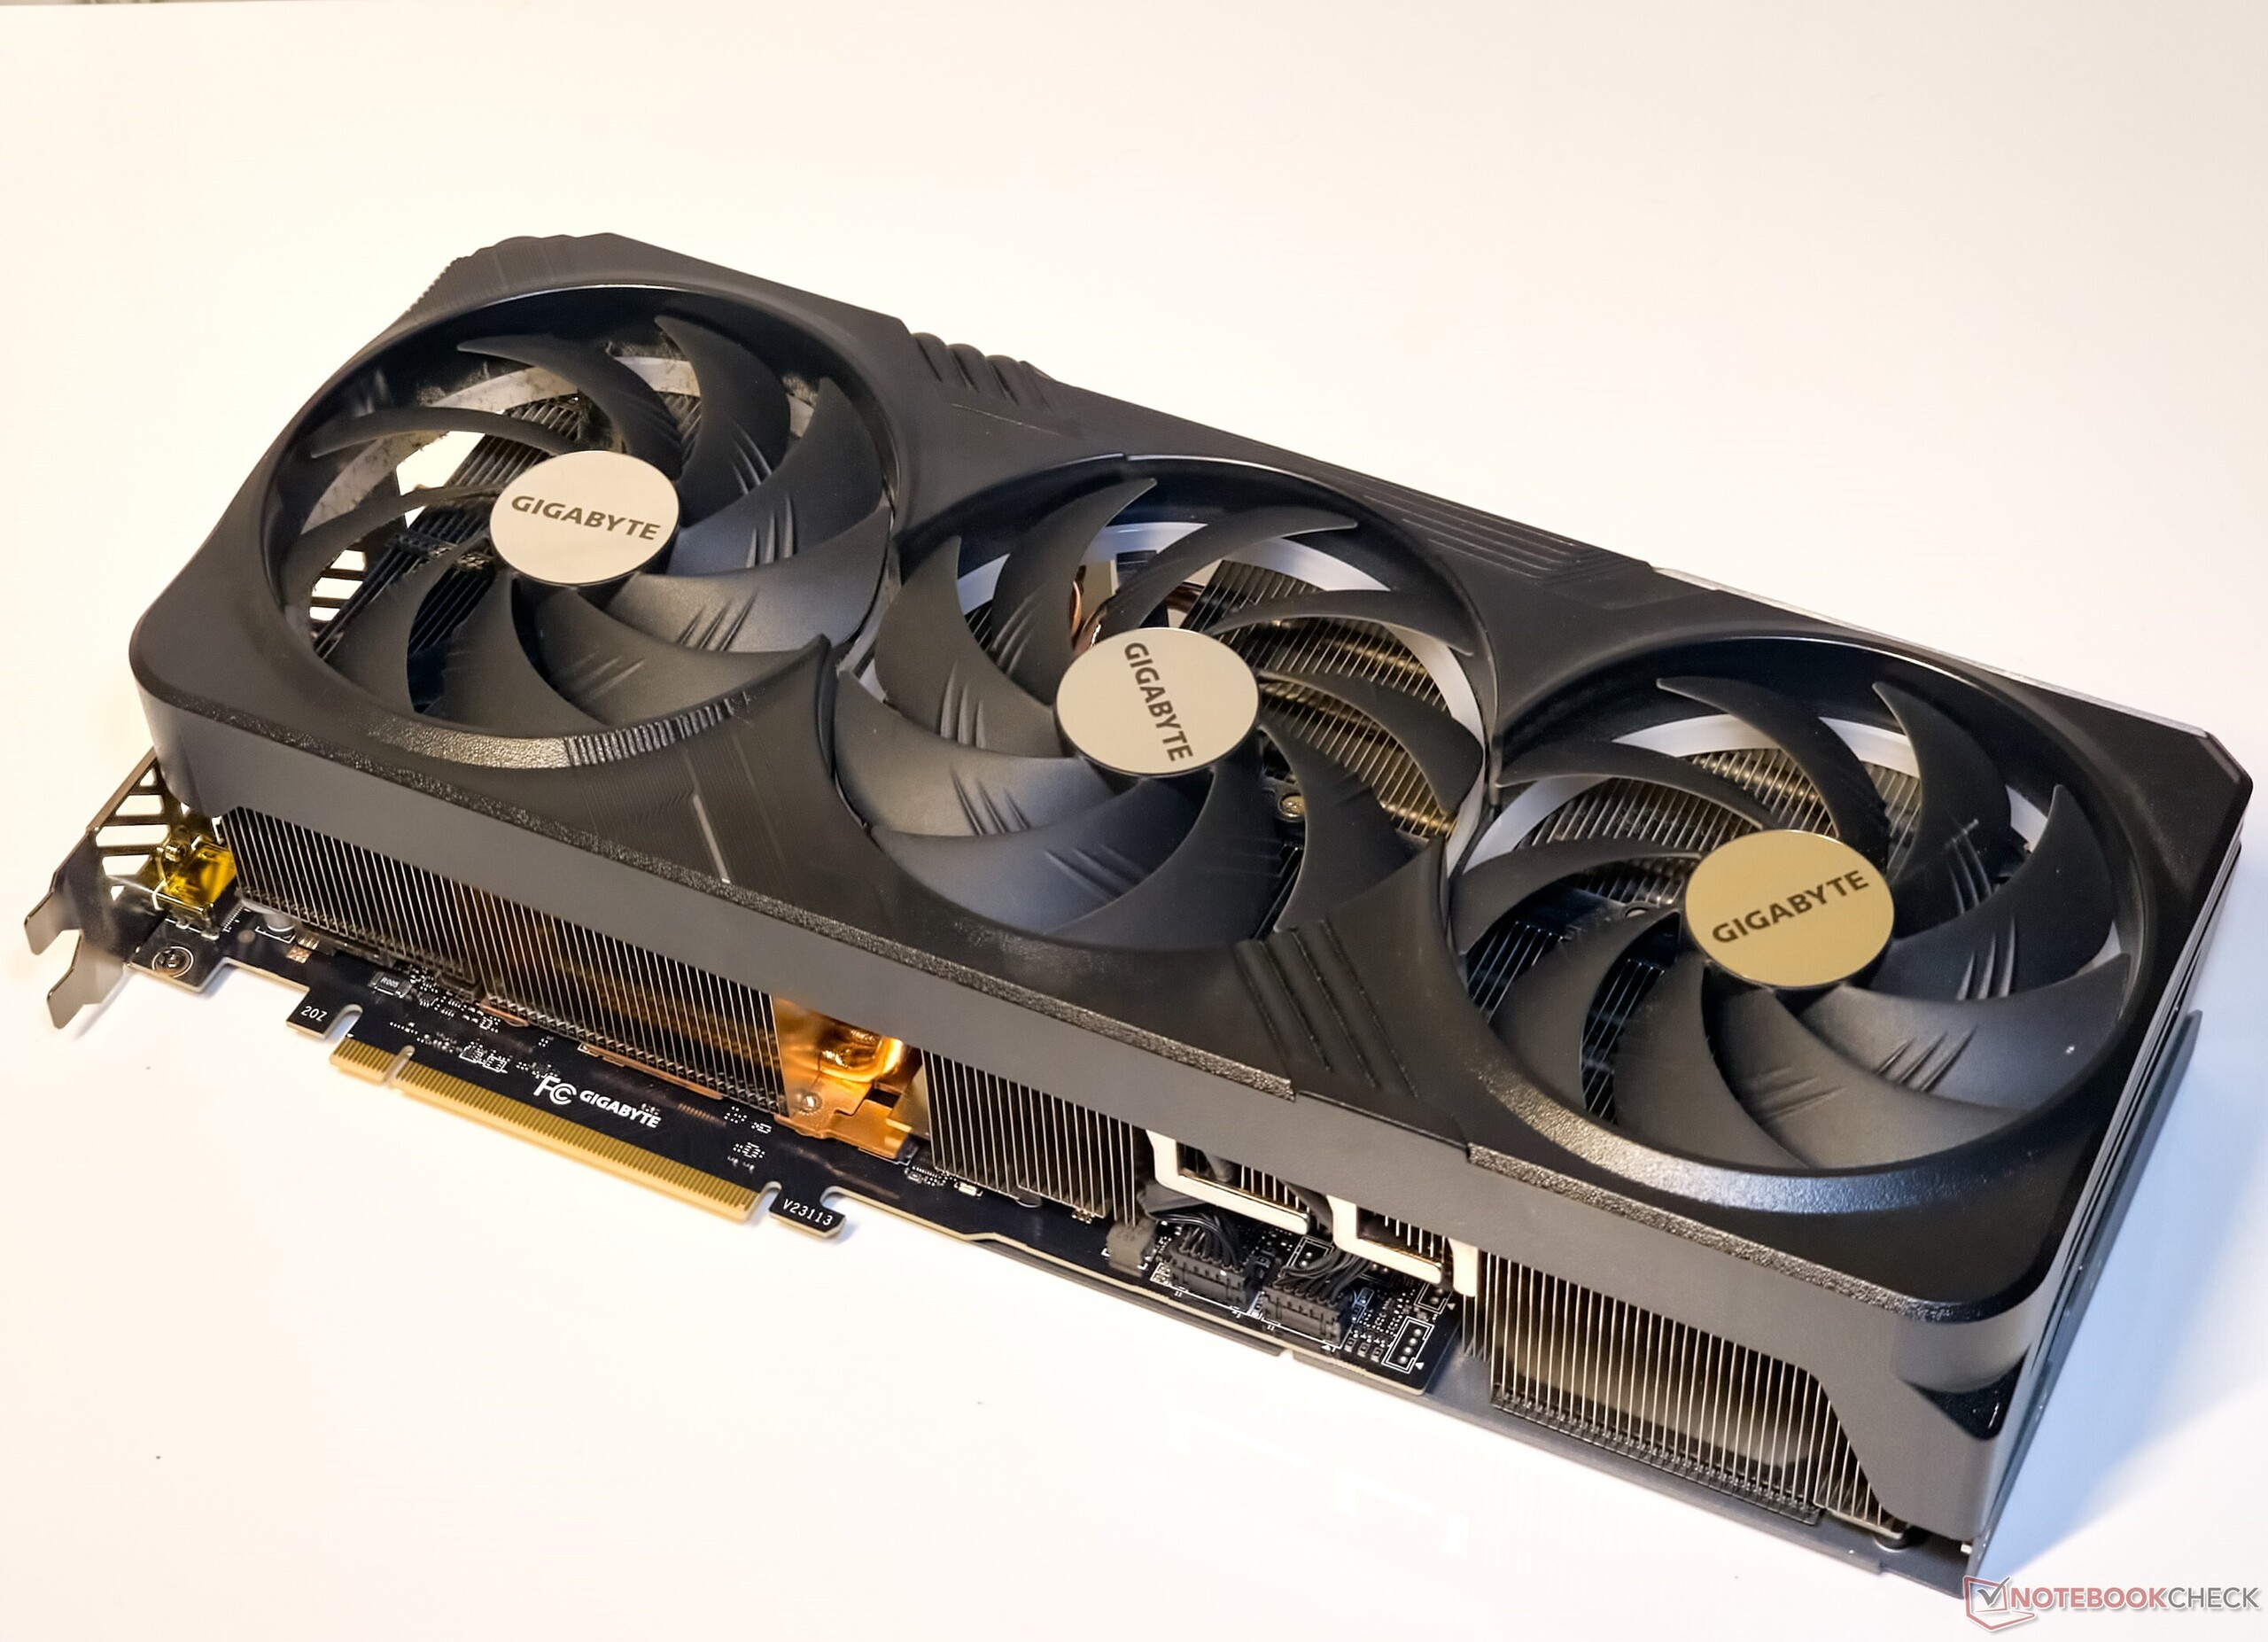
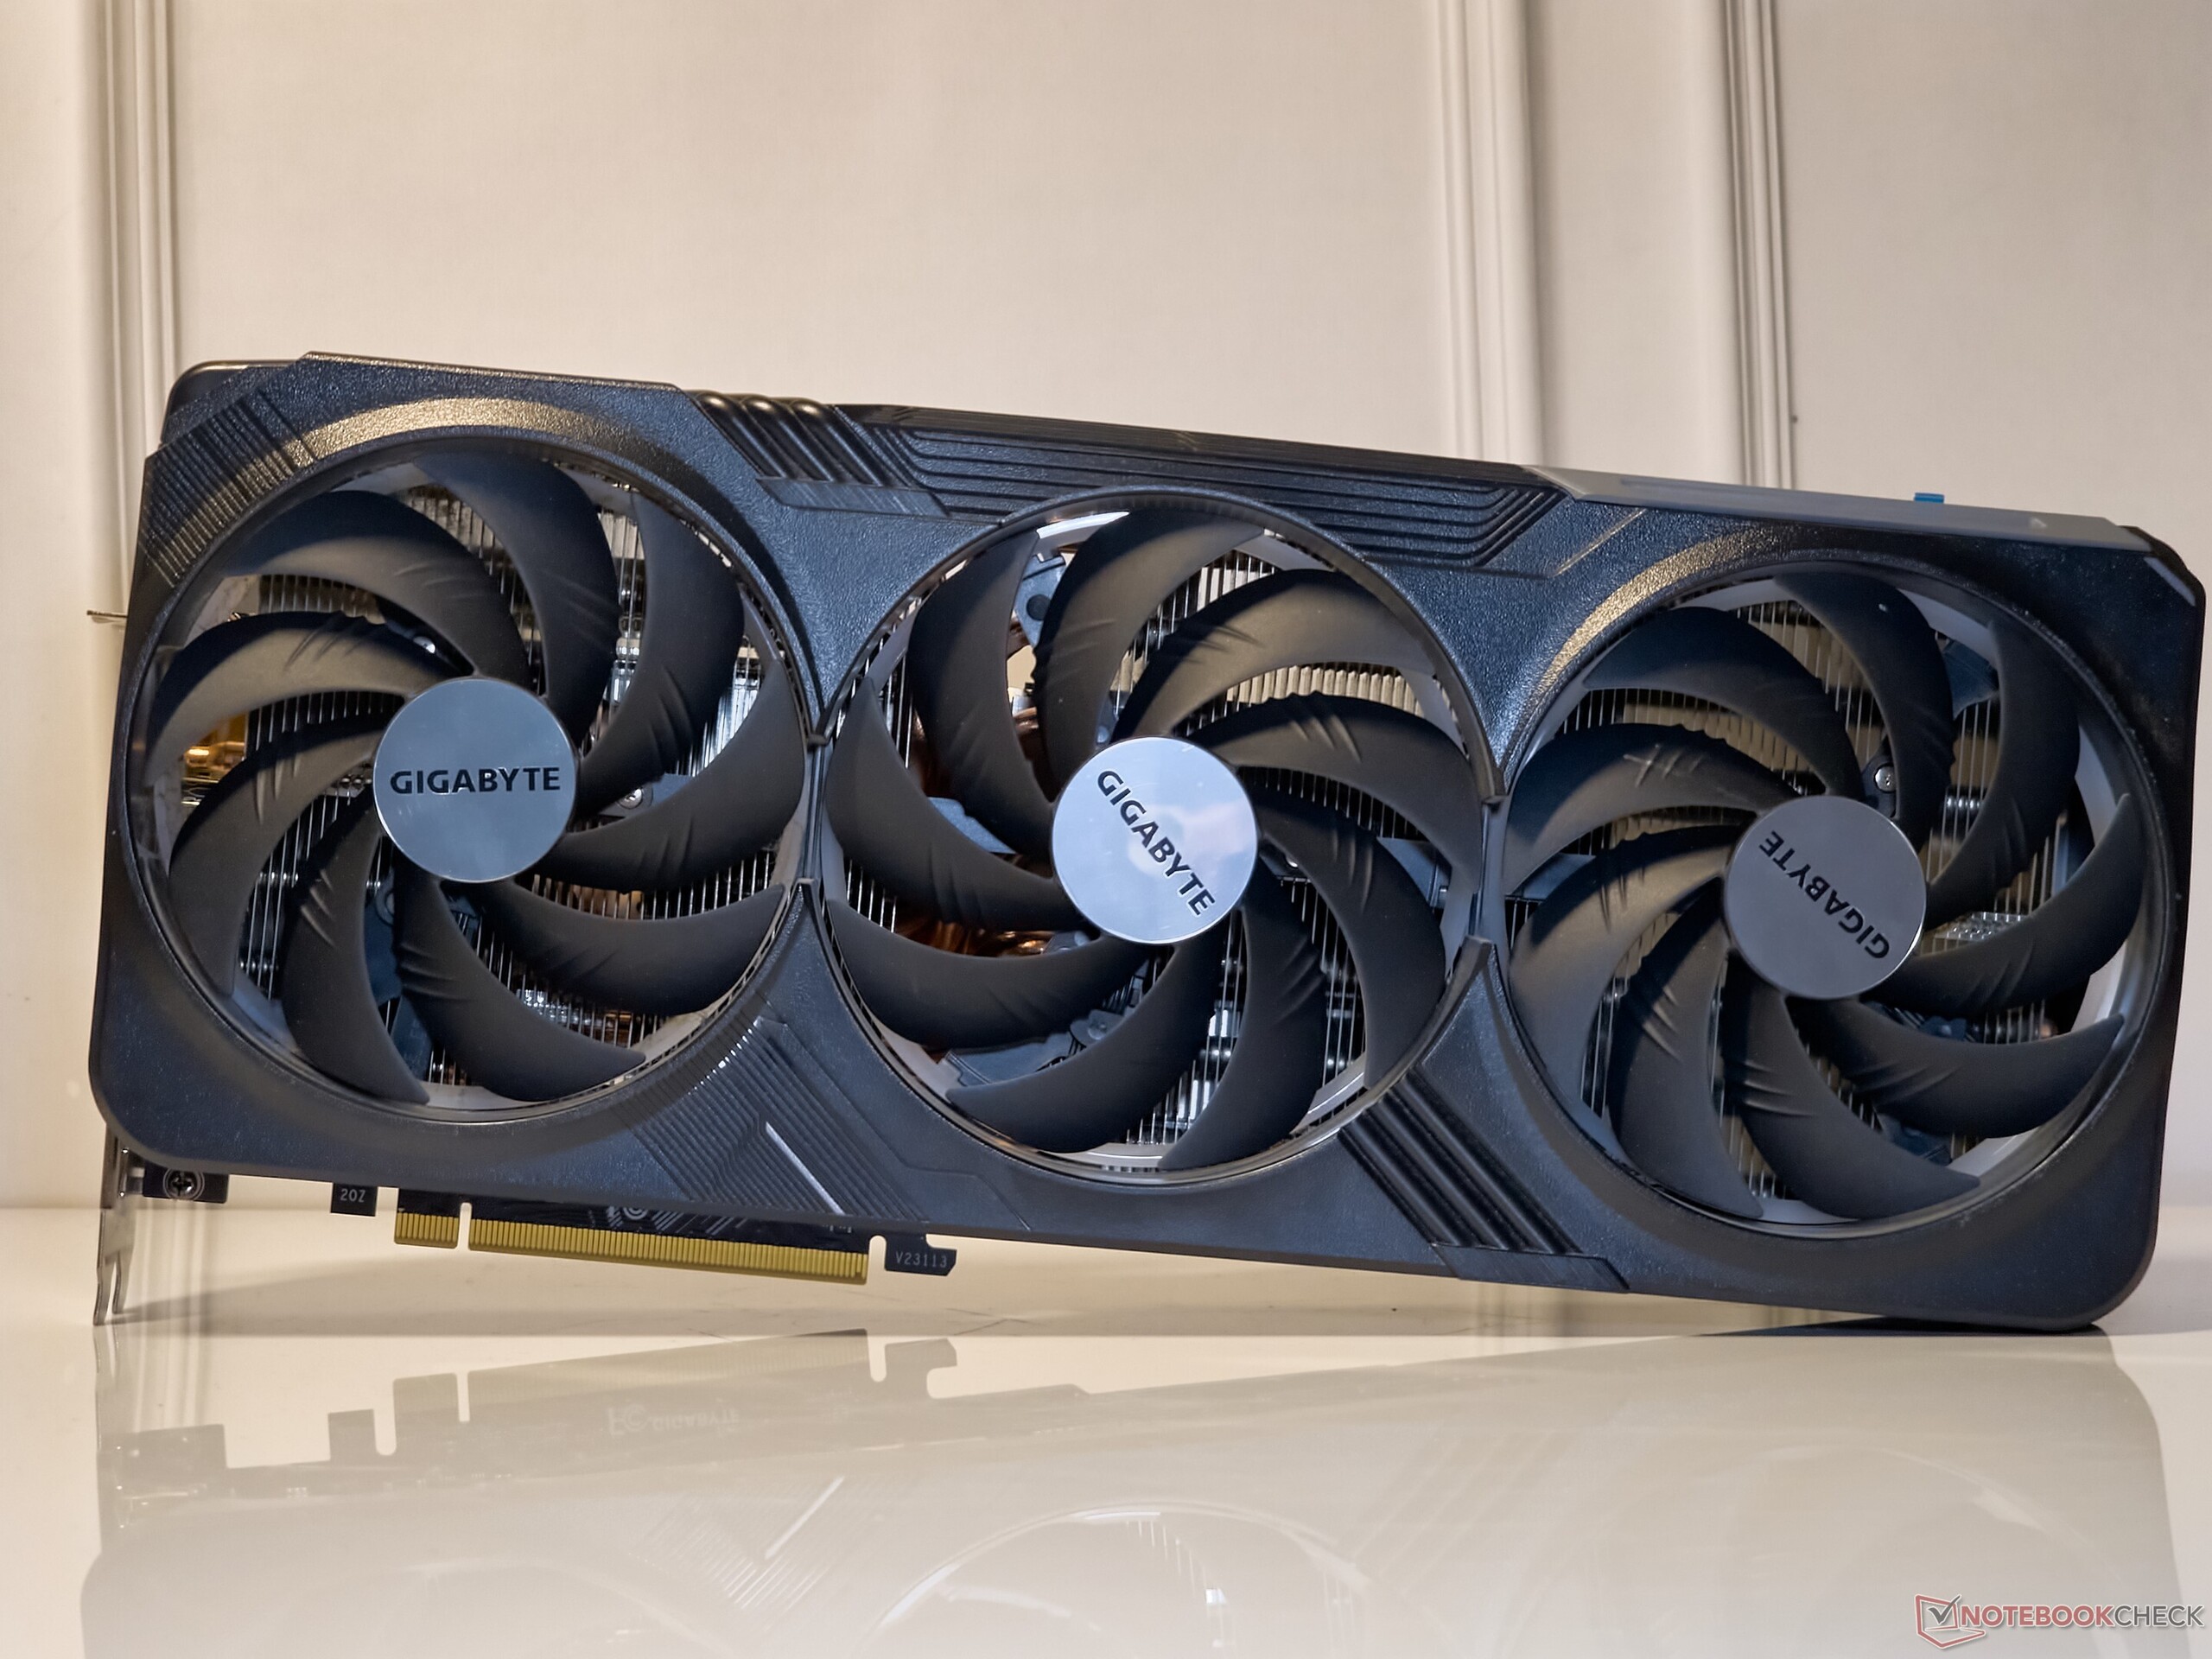
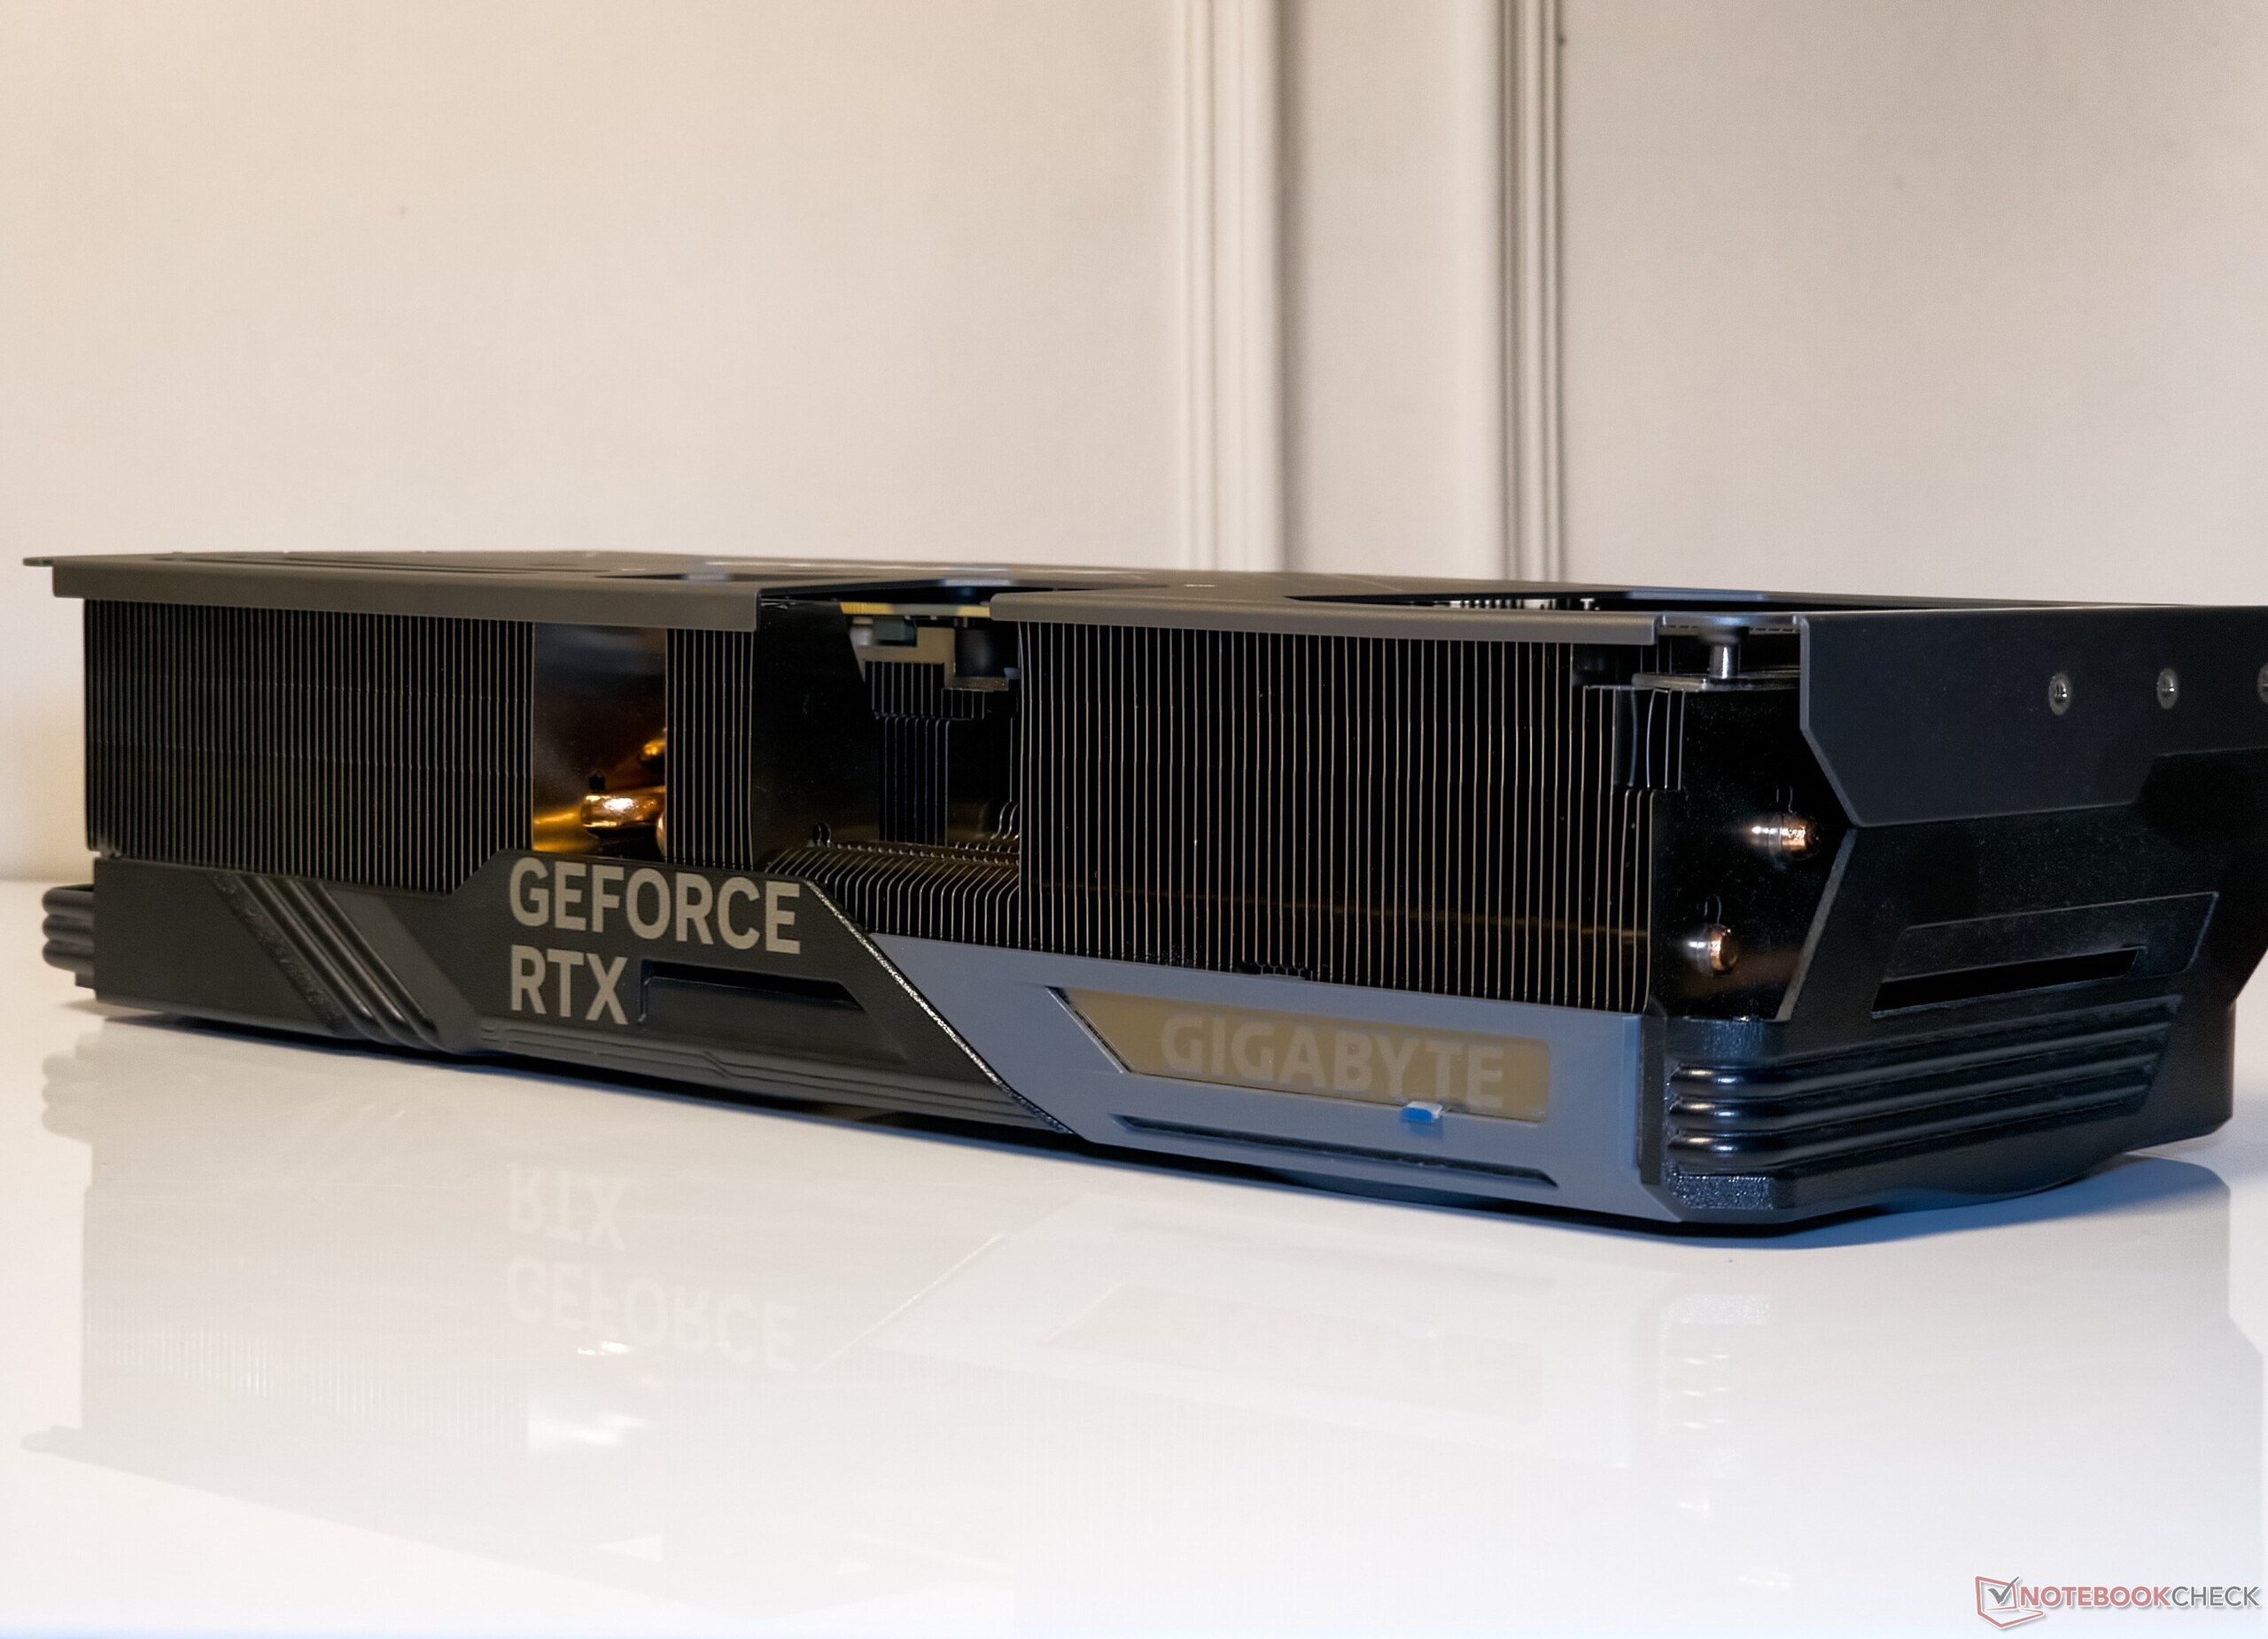
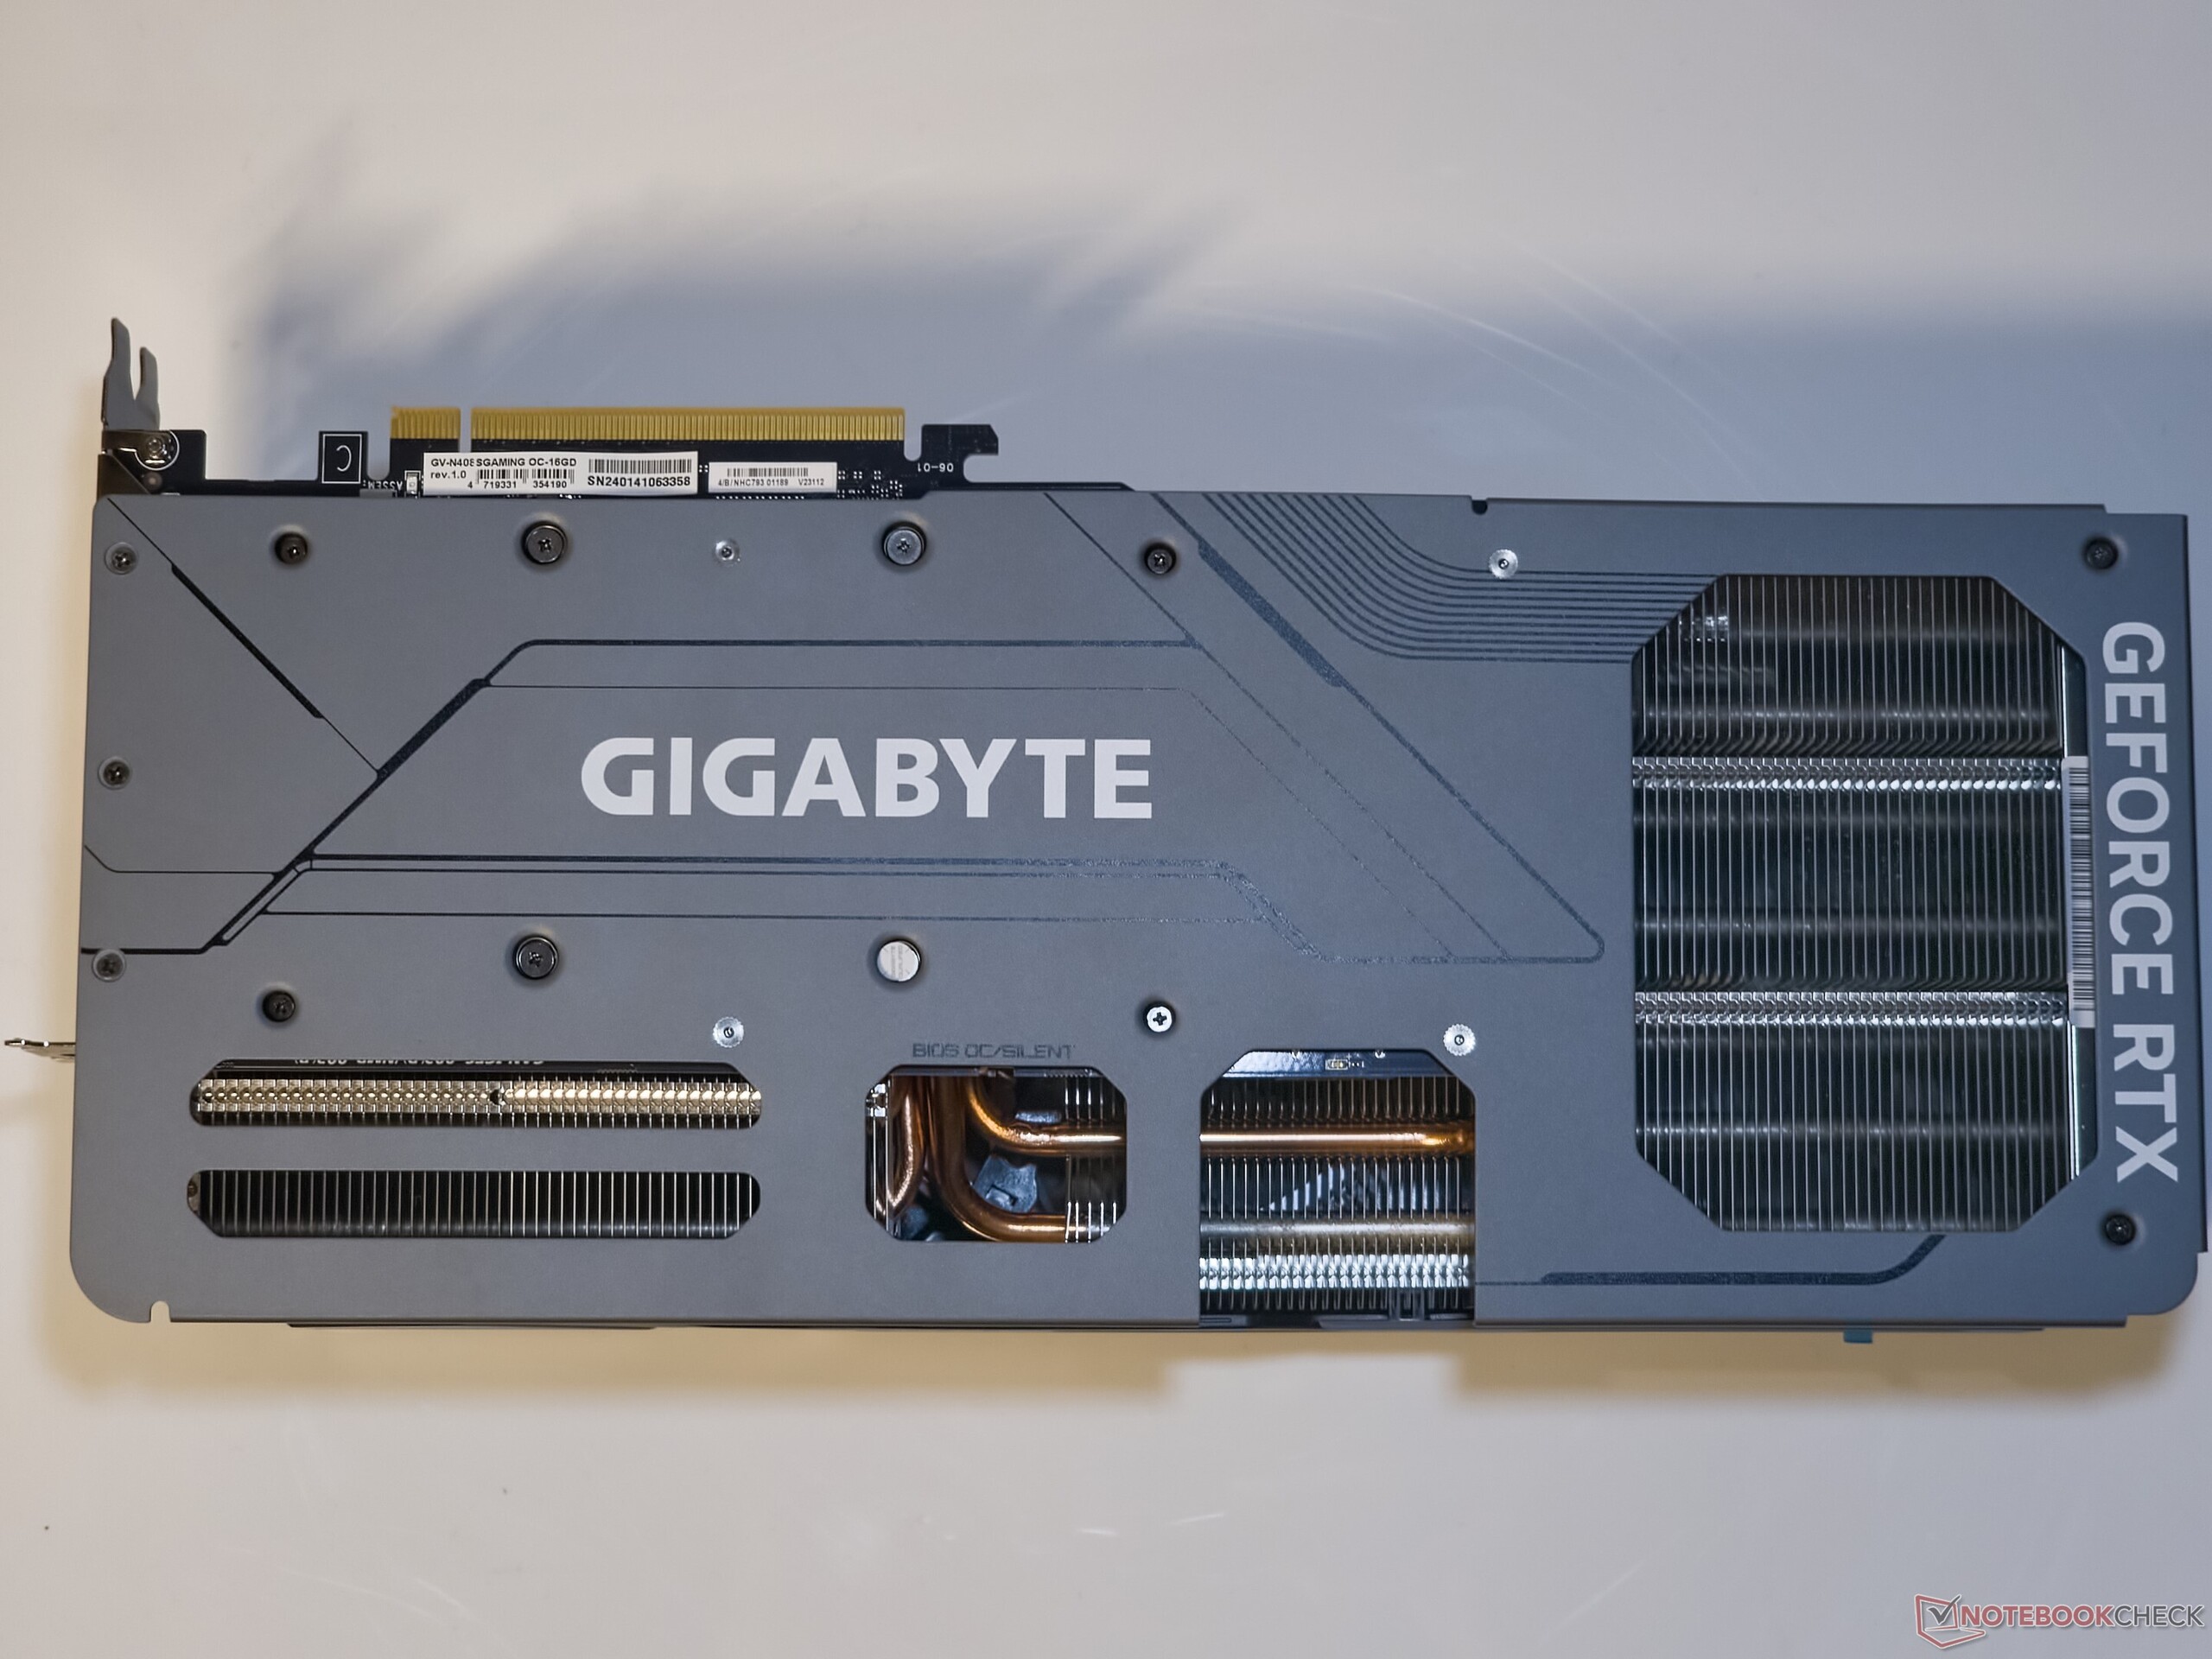
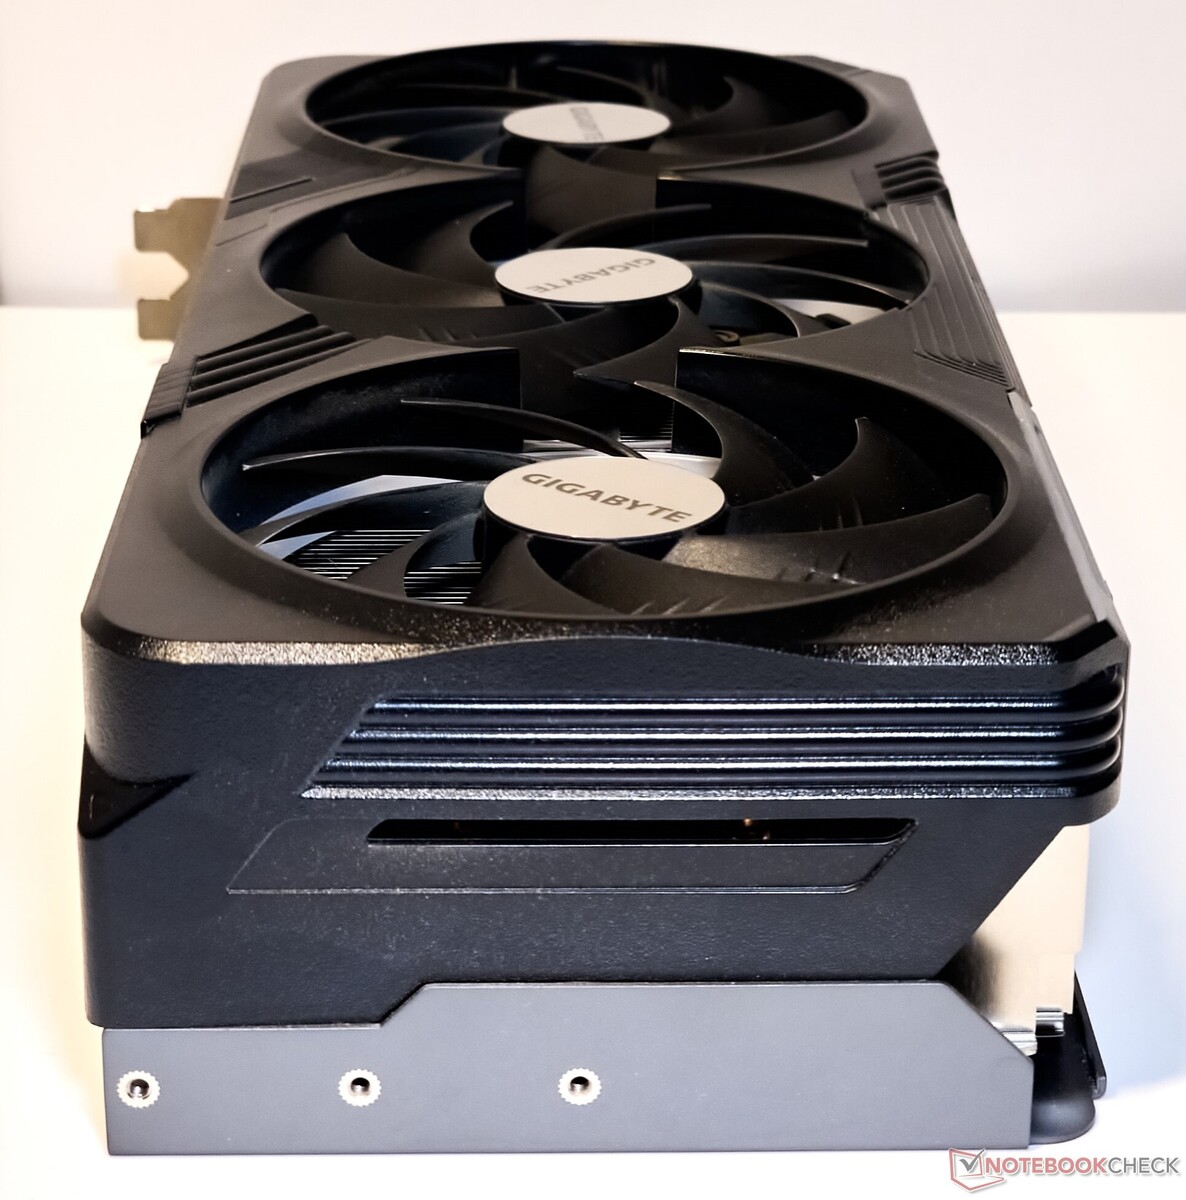
La Gigabyte GeForce RTX 4080 Super Gaming OC de cerca
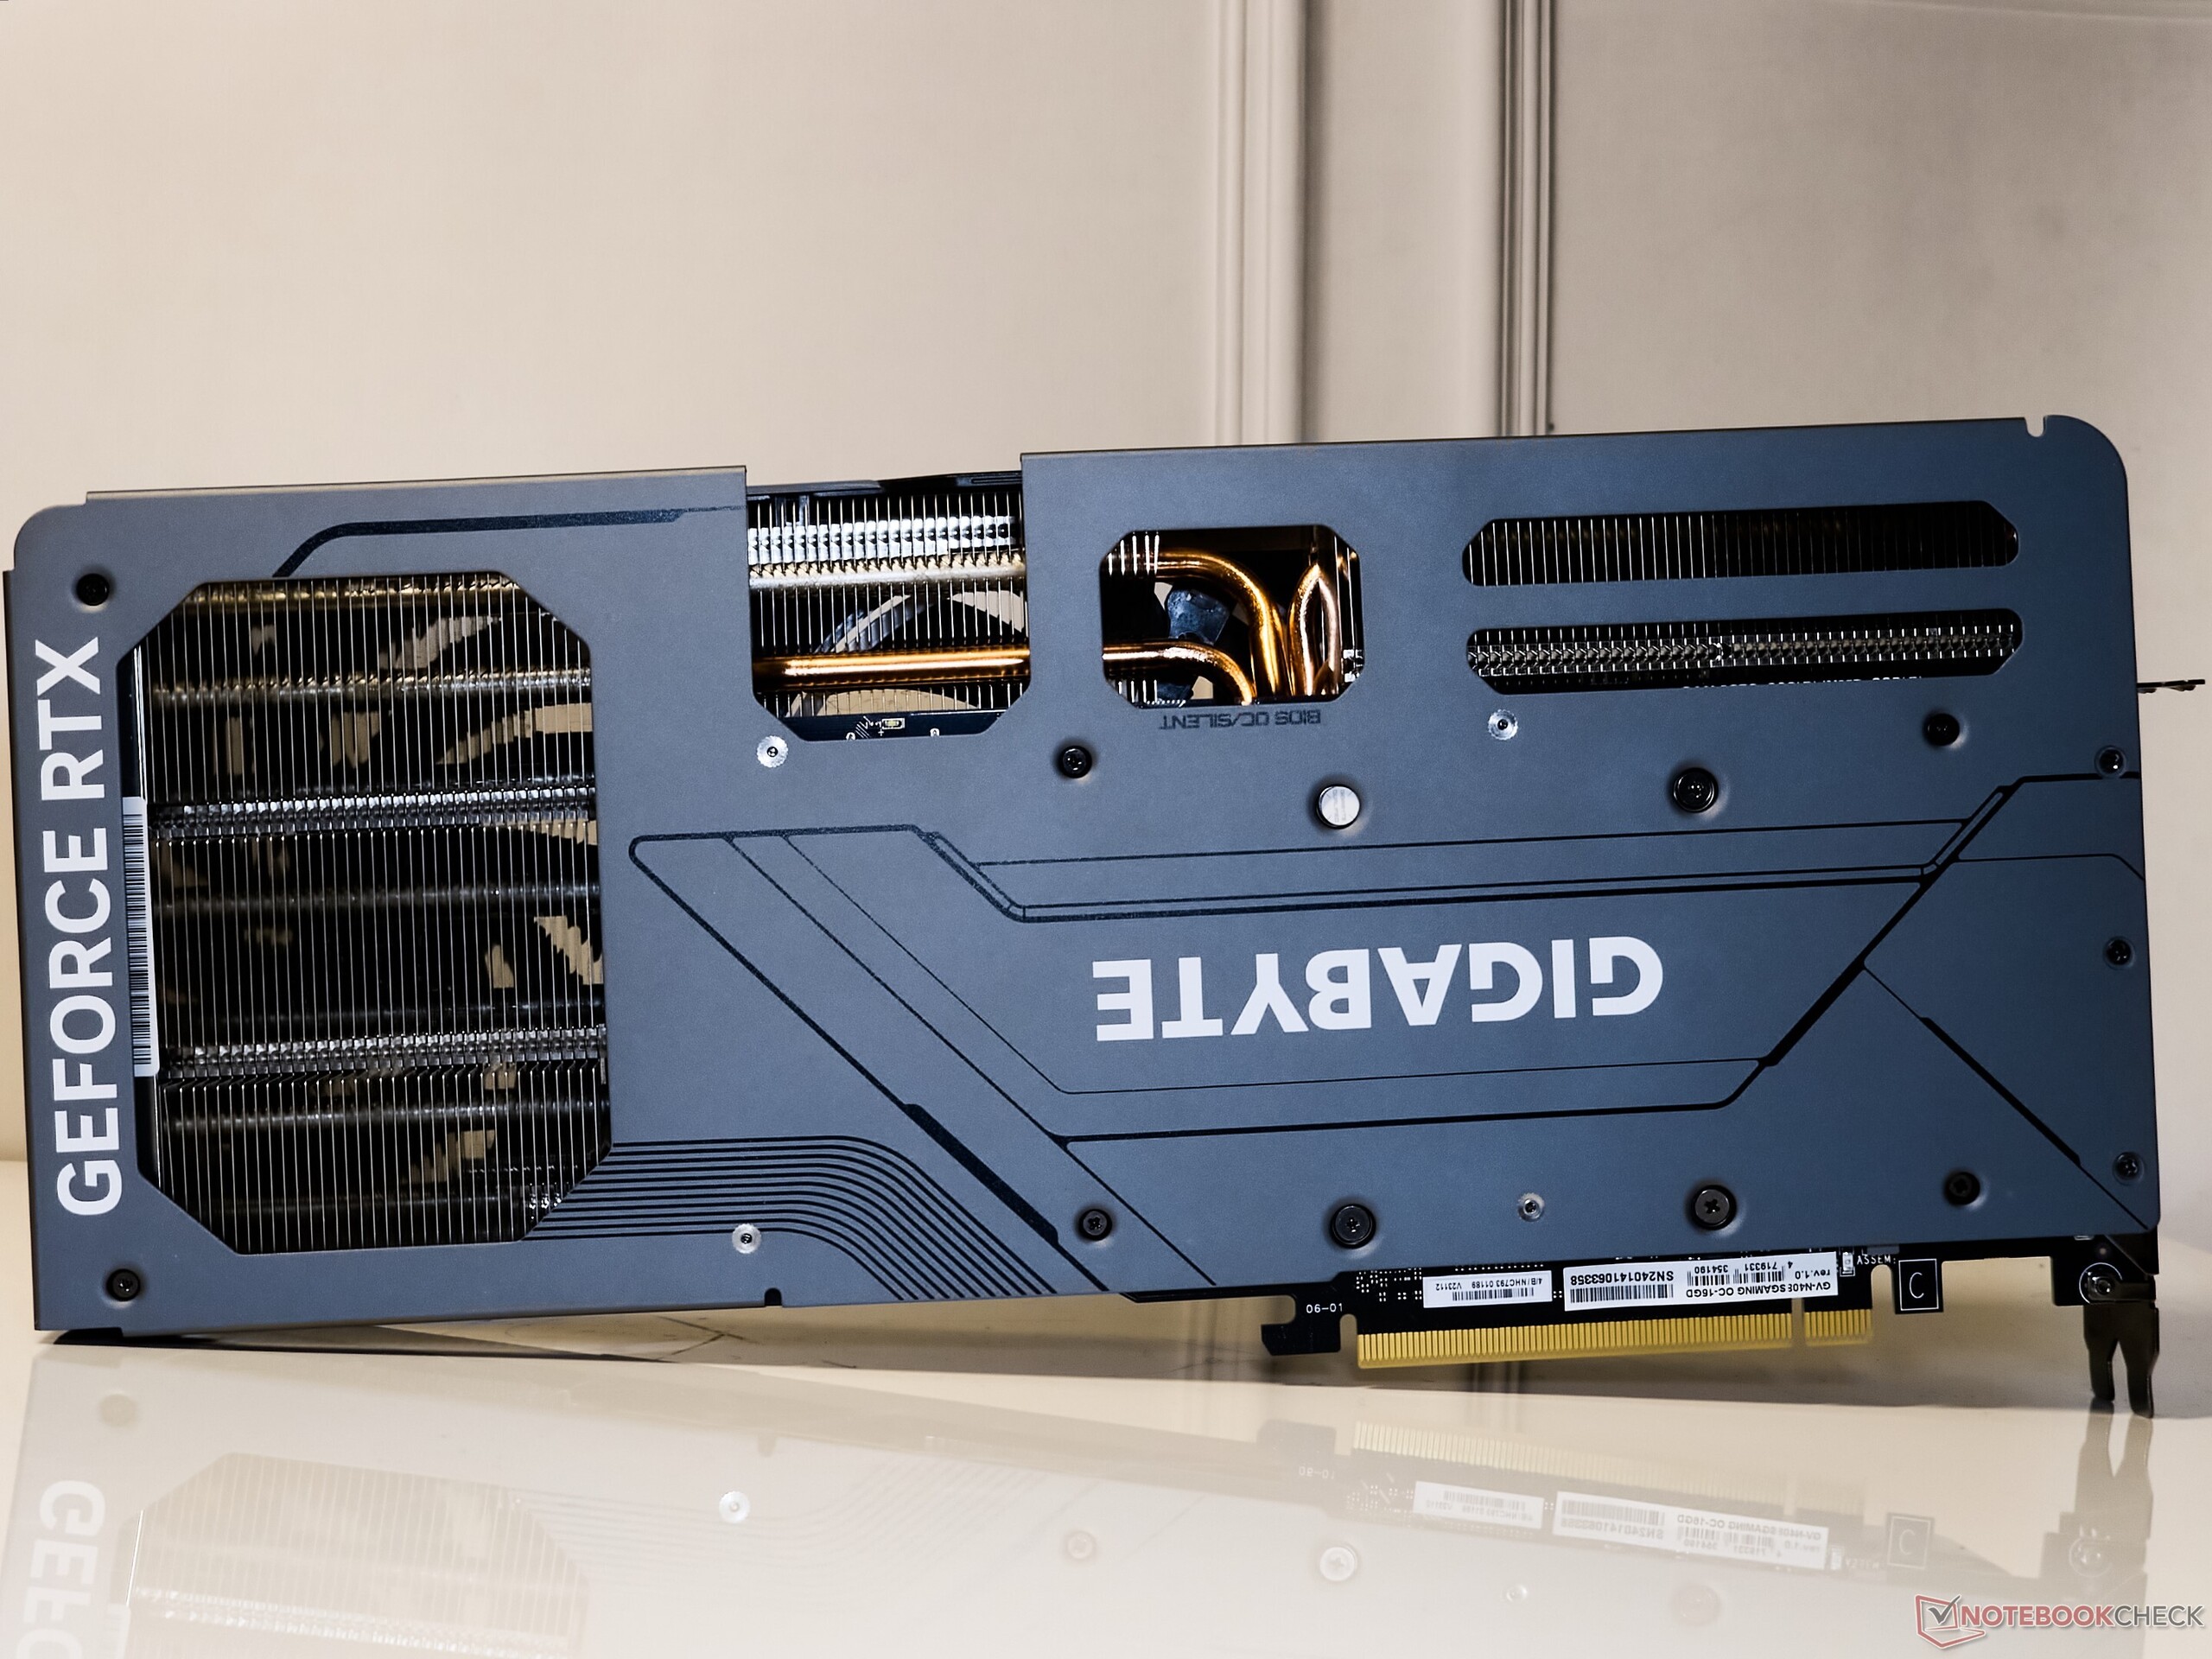
Gigabyte no ha cambiado el diseño de la RTX 4080 Super Gaming OC 16G respecto a su predecesora no Super. Con unas dimensiones de 342 x 150 x 75 mm y un peso aproximado de 1,74 kg, la RTX 4080 Super Gaming OC ocupa casi tres ranuras PCIe de la placa, por lo que lo ideal es que se beneficie de una carcasa más grande y de una placa base E-ATX.
La tarjeta luce una cubierta frontal de plástico pero resistente y una placa posterior de metal. Los efectos RGB son similares a los que hemos visto con la RTX 4070 Super Gaming OC: un logotipo de Gigabyte resplandeciente en la parte superior e iluminación en forma de anillo a lo largo de la circunferencia de cada ventilador.
El contenido de la caja incluye una guía de inicio rápido, tarjeta de garantía, conector de alimentación de 12VHPWR a 3x 8 pines, soportes de apoyo y tornillos.
La RTX 4080 Super Gaming OC ofrece el conjunto estándar de puertos, incluyendo 3x salidas DisplayPort 1.4 y 1x salida HDMI 2.1a.
Como es habitual en las tarjetas Gigabyte, está presente un interruptor de doble BIOS para alternar entre los modos OC y Silencioso de la BIOS.
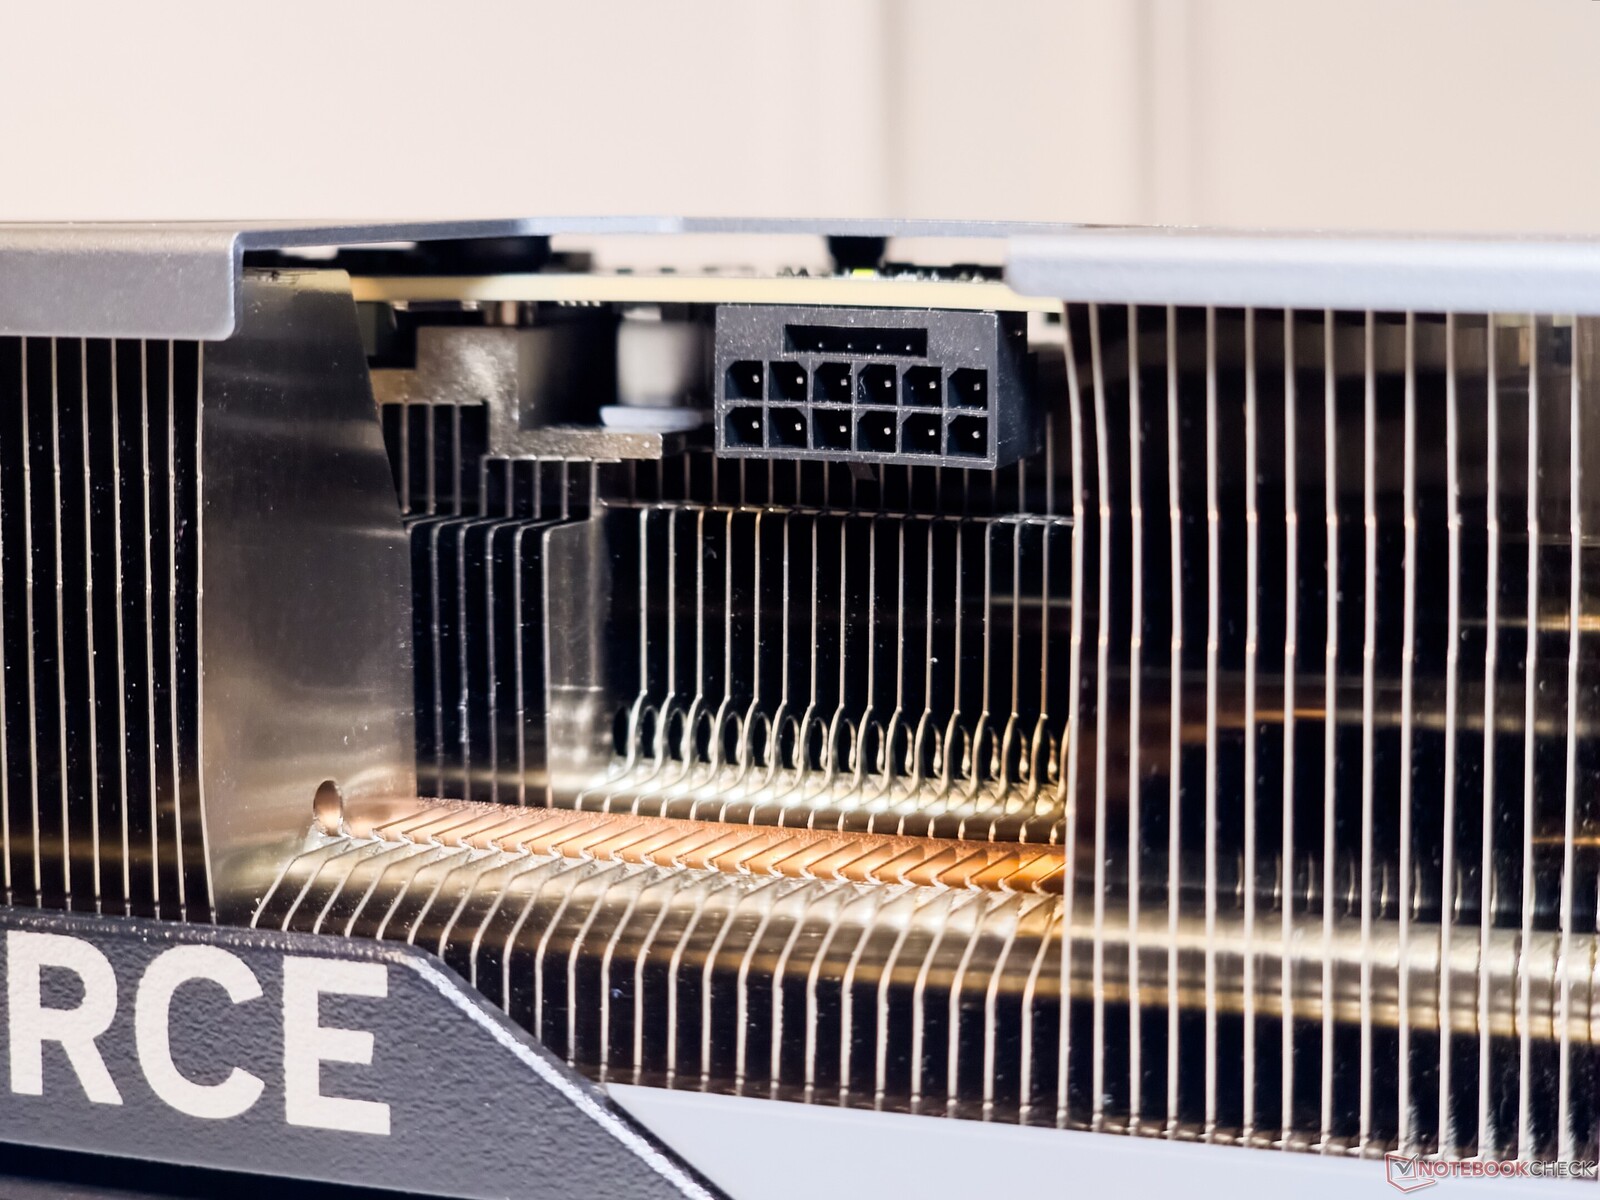
El suministro de energía a la GPU es manejado por el conector 12VHPWR ahora predeterminado. No tuvimos problemas para ajustar el conector PCIe Gen 5 de 16 patillas de la fuente de alimentación. Como medida de precaución, Gigabyte también proporciona un indicador LED que se ilumina para indicar cualquier problema de conexión.


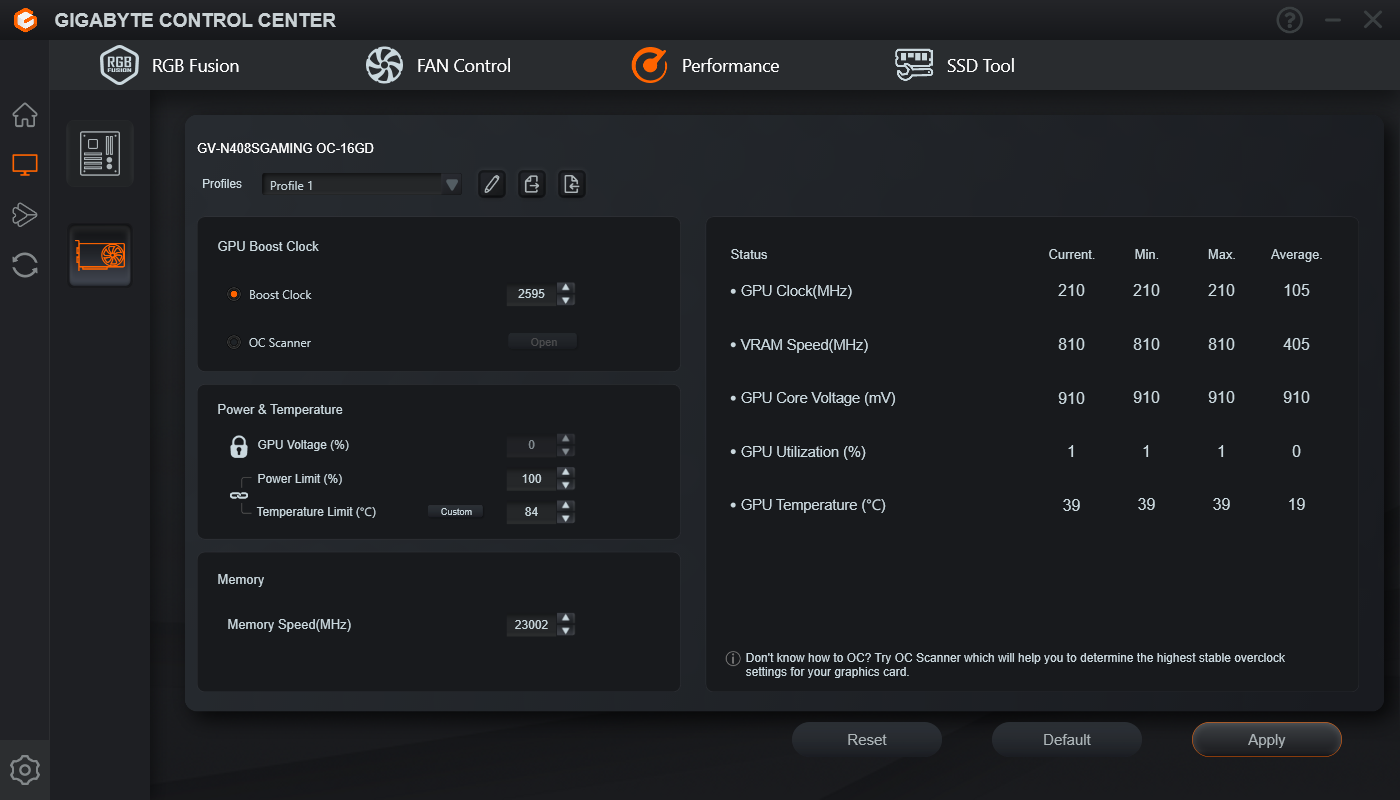
La Gigabyte GeForce RTX 4080 Super Gaming OC 16G puede aumentar hasta 2.595 MHz y tiene un 25% de margen de potencia añadido para permitir aumentos de TGP de hasta 400 W.
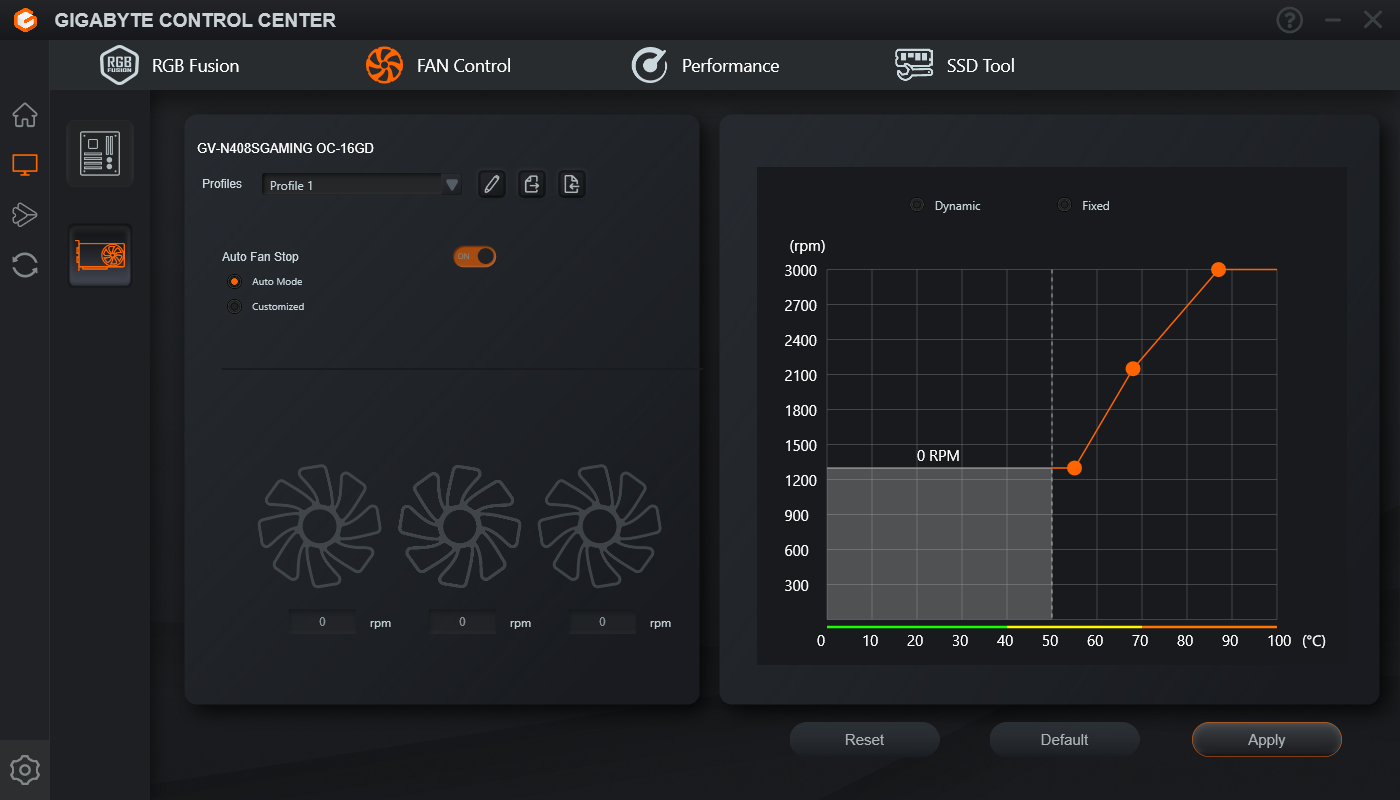
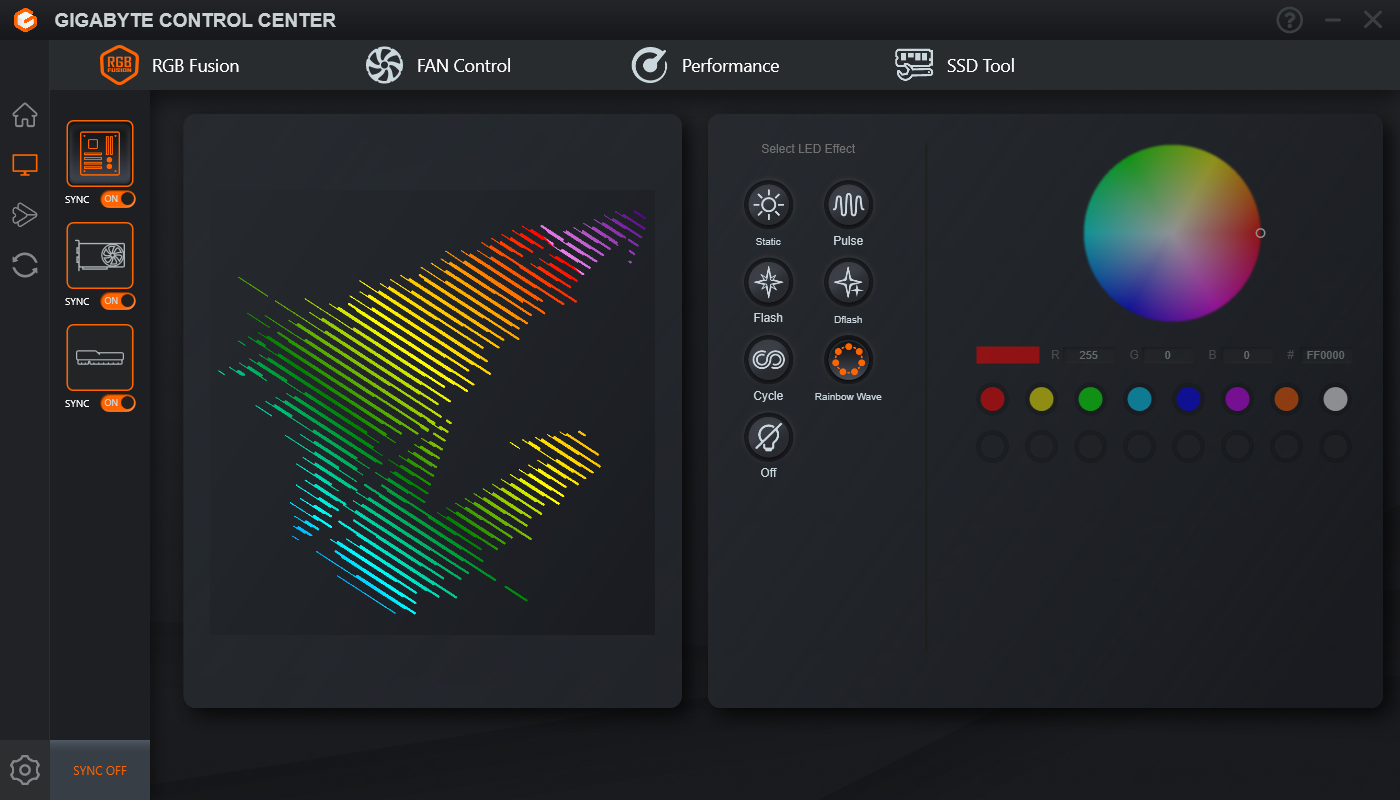
Aspectos de la GPU como el overclocking, las curvas de los ventiladores y los efectos RGB pueden controlarse a través del Centro de control de Gigabyte.
Banco de pruebas: RTX 4080 Super Gaming OC junto con el Core i9-13900K
Nuestro sistema de pruebas sigue basándose en el Intel Core i9-13900K y la plataforma Z790 para garantizar que las tarjetas no sufran cuellos de botella en la CPU. La configuración incluye:
- Banco de pruebas Cooler MasterFrame 700
- Intel Corei9-13900K con PL1=PL2
- Placa base Gigabyte Z790 Aorus Master
- Unidad SSD NVMe Gigabyte Aorus Gen4 de 2 TB
- Unidad SSD NVMe Sabrent Rocket 4 Plus Gen4 de 2 TB
- 2x 16 GB de RAM Kingston Fury Renegade DDR5-6400 con timings 32-39-39-80 a 1,40 V
- MonitorMSI MAG 274UPF 4K 144 Hz
- Refrigerador Cooler Master MasterLiquid ML360L V2 ARGB AiO
- Fuente de alimentación totalmente modular Cooler Master MVE Gold V2 1250 ATX 3.0
Se utilizó Windows 11 23H2 con los últimos parches, junto con el controlador Nvidia Game Ready versión 552.12.
Basándonos en nuestras pruebas internas, las cifras de rendimiento del Core i9-13900K y el chipset Z790 son comparables a las de un AMD Ryzen 9 7950X y una configuración X670E.
Nos gustaría dar las gracias a Cooler Master por proporcionarnos el banco de pruebas, el refrigerador y la fuente de alimentación, a Gigabyte por la placa base, la CPU y la unidad SSD, a Sabrent por la unidad SSD, a MSI por el monitor y a Kingston por la memoria.
Benchmarks sintéticos: un 5% de ganancia global en comparación con la RTX 4080
El rendimiento sintético acumulativo de las pruebas de rendimiento muestra que la RTX 4080 Super Gaming OC aventaja en un 5% a la RTX 4080 Founders Edition (FE), lo que corresponde a un aumento equivalente en núcleos CUDA. Se observaron mayores deltas entre estas dos tarjetas en 3DMark Port Royal (+7%) y 3DMark 11 Performance GPU (11%).
La RTX 4080 Super Gaming OC empata en gran medida con la AMD Radeon RX 7900 XTX en las pruebas sintéticas generales, pero esta última muestra ganancias decentes en 3DMark Fire Strike y Time Spy.
Las puntuaciones de Unigine muestran entre un 2 y un 5% de ganancia con la RTX 4080 Super Gaming OC en comparación con la RTX 4080 Founders Edition.
La RTX 4090 Founders Edition sigue siendo la tarjeta a batir con puntuaciones un 25% más altas que la RTX 4080 Super Gaming OC.
3DMark 11: 1280x720 Performance GPU
3DMark: 1920x1080 Fire Strike Graphics | 3840x2160 Fire Strike Ultra Graphics | Fire Strike Extreme Graphics | 2560x1440 Time Spy Graphics | 2560x1440 Port Royal Graphics | 2560x1440 Speed Way Score
Unigine Heaven 4.0: Extreme Preset DX11 | Extreme Preset OpenGL
Unigine Valley 1.0: 1920x1080 Extreme HD DirectX AA:x8 | 1920x1080 Extreme HD Preset OpenGL AA:x8
Unigine Superposition: 1280x720 720p Low | 1920x1080 1080p Extreme | 3840x2160 4k Optimized | 7680x4320 8k Optimized
| Performance rating | |
| NVIDIA GeForce RTX 4090 Founders Edition | |
| AMD Radeon RX 7900 XTX | |
| Gigabyte GeForce RTX 4080 Super Gaming OC | |
| NVIDIA GeForce RTX 4080 Founders Edition | |
| Media de la clase Desktop | |
| AMD Radeon RX 7900 XT | |
| Asus TUF Gaming GeForce RTX 4070 Ti Super | |
| Gigabyte Aorus GeForce RTX 4070 Ti Master | |
| Asus TUF Gaming GeForce RTX 4070 Ti | |
| Medio NVIDIA GeForce RTX 4070 Ti | |
| Gigabyte GeForce RTX 4070 Super Gaming OC 12G | |
| Medio NVIDIA GeForce RTX 3090 | |
| Medio NVIDIA GeForce RTX 3080 Ti | |
| NVIDIA GeForce RTX 4070 Super Founders Edition | |
| AMD Radeon RX 7800 XT | |
| Zotac Gaming GeForce RTX 4070 AMP Airo | |
| Medio NVIDIA GeForce RTX 3080 -1! | |
| Sapphire Pulse Radeon RX 7700 XT | |
| Medio NVIDIA Titan RTX | |
| Medio NVIDIA GeForce RTX 4060 Ti 8G | |
| KFA2 GeForce RTX 4060 Ti EX, 16GB GDDR6 | |
| XFX Speedster QICK 308 Radeon RX 7600 Black Edition | |
| KFA2 GeForce RTX 4060 1-Click-OC 2X | |
| 3DMark / Speed Way Score | |
| NVIDIA GeForce RTX 4090 Founders Edition | |
| Gigabyte GeForce RTX 4080 Super Gaming OC | |
| Media de la clase Desktop (492 - 14564, n=42, últimos 2 años) | |
| NVIDIA GeForce RTX 4080 Founders Edition | |
| Asus TUF Gaming GeForce RTX 4070 Ti Super | |
| AMD Radeon RX 7900 XTX | |
| Gigabyte Aorus GeForce RTX 4070 Ti Master | |
| Medio NVIDIA GeForce RTX 4070 Ti (5392 - 5546, n=6) | |
| Asus TUF Gaming GeForce RTX 4070 Ti | |
| Asus TUF Gaming GeForce RTX 4070 Ti (Quiet BIOS) | |
| Gigabyte GeForce RTX 4070 Super Gaming OC 12G | |
| Medio NVIDIA GeForce RTX 3090 (5173 - 5299, n=4) | |
| Medio NVIDIA GeForce RTX 3080 Ti (5195 - 5223, n=2) | |
| NVIDIA GeForce RTX 4070 Super Founders Edition | |
| AMD Radeon RX 7900 XT | |
| Zotac Gaming GeForce RTX 4070 AMP Airo | |
| AMD Radeon RX 7800 XT | |
| Medio NVIDIA Titan RTX (3182 - 3205, n=3) | |
| Medio NVIDIA GeForce RTX 4060 Ti 8G (3158 - 3206, n=3) | |
| KFA2 GeForce RTX 4060 Ti EX, 16GB GDDR6 | |
| Sapphire Pulse Radeon RX 7700 XT | |
| KFA2 GeForce RTX 4060 1-Click-OC 2X | |
| XFX Speedster QICK 308 Radeon RX 7600 Black Edition | |
| Unigine Heaven 4.0 / Extreme Preset DX11 | |
| NVIDIA GeForce RTX 4090 Founders Edition | |
| Gigabyte GeForce RTX 4080 Super Gaming OC | |
| AMD Radeon RX 7900 XTX | |
| NVIDIA GeForce RTX 4080 Founders Edition | |
| AMD Radeon RX 7900 XT | |
| Gigabyte Aorus GeForce RTX 4070 Ti Master | |
| Asus TUF Gaming GeForce RTX 4070 Ti | |
| Media de la clase Desktop (10.9 - 545, n=44, últimos 2 años) | |
| Medio NVIDIA GeForce RTX 4070 Ti (298 - 319, n=5) | |
| Asus TUF Gaming GeForce RTX 4070 Ti Super | |
| Medio NVIDIA GeForce RTX 3090 (272 - 315, n=12) | |
| Medio NVIDIA GeForce RTX 3080 Ti (290 - 312, n=4) | |
| Gigabyte GeForce RTX 4070 Super Gaming OC 12G | |
| NVIDIA GeForce RTX 4070 Super Founders Edition | |
| Zotac Gaming GeForce RTX 4070 AMP Airo | |
| Medio NVIDIA GeForce RTX 3080 (233 - 253, n=2) | |
| AMD Radeon RX 7800 XT | |
| Medio NVIDIA Titan RTX (207 - 248, n=12) | |
| Sapphire Pulse Radeon RX 7700 XT | |
| Medio NVIDIA GeForce RTX 4060 Ti 8G (170.7 - 181.6, n=4) | |
| KFA2 GeForce RTX 4060 Ti EX, 16GB GDDR6 | |
| KFA2 GeForce RTX 4060 1-Click-OC 2X | |
| XFX Speedster QICK 308 Radeon RX 7600 Black Edition | |
| Unigine Heaven 4.0 / Extreme Preset OpenGL | |
| NVIDIA GeForce RTX 4090 Founders Edition | |
| Gigabyte GeForce RTX 4080 Super Gaming OC | |
| AMD Radeon RX 7900 XTX | |
| NVIDIA GeForce RTX 4080 Founders Edition | |
| AMD Radeon RX 7900 XT | |
| Asus TUF Gaming GeForce RTX 4070 Ti Super | |
| Media de la clase Desktop (11.7 - 551, n=30, últimos 2 años) | |
| Gigabyte Aorus GeForce RTX 4070 Ti Master | |
| Medio NVIDIA GeForce RTX 4070 Ti (291 - 297, n=4) | |
| Asus TUF Gaming GeForce RTX 4070 Ti | |
| Gigabyte GeForce RTX 4070 Super Gaming OC 12G | |
| NVIDIA GeForce RTX 4070 Super Founders Edition | |
| Medio NVIDIA GeForce RTX 3080 Ti (264 - 282, n=4) | |
| Medio NVIDIA GeForce RTX 3090 (188.2 - 284, n=11) | |
| AMD Radeon RX 7800 XT | |
| Medio NVIDIA GeForce RTX 3080 (232 - 243, n=2) | |
| Zotac Gaming GeForce RTX 4070 AMP Airo | |
| Medio NVIDIA Titan RTX (203 - 299, n=12) | |
| Sapphire Pulse Radeon RX 7700 XT | |
| Medio NVIDIA GeForce RTX 4060 Ti 8G (173 - 176, n=3) | |
| KFA2 GeForce RTX 4060 Ti EX, 16GB GDDR6 | |
| XFX Speedster QICK 308 Radeon RX 7600 Black Edition | |
| KFA2 GeForce RTX 4060 1-Click-OC 2X | |
| Unigine Valley 1.0 / Extreme HD DirectX | |
| NVIDIA GeForce RTX 4090 Founders Edition | |
| Gigabyte GeForce RTX 4080 Super Gaming OC | |
| NVIDIA GeForce RTX 4080 Founders Edition | |
| AMD Radeon RX 7900 XTX | |
| AMD Radeon RX 7900 XT | |
| Asus TUF Gaming GeForce RTX 4070 Ti Super | |
| Asus TUF Gaming GeForce RTX 4070 Ti | |
| Medio NVIDIA GeForce RTX 3080 Ti (206 - 240, n=4) | |
| Medio NVIDIA GeForce RTX 3090 (184.2 - 247, n=12) | |
| Medio NVIDIA GeForce RTX 4070 Ti (208 - 230, n=5) | |
| Gigabyte GeForce RTX 4070 Super Gaming OC 12G | |
| NVIDIA GeForce RTX 4070 Super Founders Edition | |
| Gigabyte Aorus GeForce RTX 4070 Ti Master | |
| Media de la clase Desktop (9.8 - 295, n=44, últimos 2 años) | |
| Zotac Gaming GeForce RTX 4070 AMP Airo | |
| AMD Radeon RX 7800 XT | |
| Medio NVIDIA GeForce RTX 3080 (176.2 - 181.8, n=2) | |
| Medio NVIDIA Titan RTX (135 - 191.4, n=12) | |
| Sapphire Pulse Radeon RX 7700 XT | |
| Medio NVIDIA GeForce RTX 4060 Ti 8G (128.3 - 132.9, n=4) | |
| KFA2 GeForce RTX 4060 Ti EX, 16GB GDDR6 | |
| KFA2 GeForce RTX 4060 1-Click-OC 2X | |
| XFX Speedster QICK 308 Radeon RX 7600 Black Edition | |
| Unigine Valley 1.0 / Extreme HD Preset OpenGL | |
| NVIDIA GeForce RTX 4090 Founders Edition | |
| Gigabyte GeForce RTX 4080 Super Gaming OC | |
| NVIDIA GeForce RTX 4080 Founders Edition | |
| AMD Radeon RX 7900 XTX | |
| Asus TUF Gaming GeForce RTX 4070 Ti Super | |
| Gigabyte Aorus GeForce RTX 4070 Ti Master | |
| AMD Radeon RX 7900 XT | |
| Medio NVIDIA GeForce RTX 4070 Ti (197.4 - 231, n=4) | |
| Asus TUF Gaming GeForce RTX 4070 Ti | |
| Medio NVIDIA GeForce RTX 3090 (158.8 - 226, n=11) | |
| Medio NVIDIA GeForce RTX 3080 Ti (195.1 - 210, n=4) | |
| Media de la clase Desktop (9.1 - 313, n=30, últimos 2 años) | |
| NVIDIA GeForce RTX 4070 Super Founders Edition | |
| Gigabyte GeForce RTX 4070 Super Gaming OC 12G | |
| AMD Radeon RX 7800 XT | |
| Zotac Gaming GeForce RTX 4070 AMP Airo | |
| Medio NVIDIA GeForce RTX 3080 (163.8 - 172, n=2) | |
| Medio NVIDIA Titan RTX (139.2 - 181.2, n=12) | |
| Sapphire Pulse Radeon RX 7700 XT | |
| Medio NVIDIA GeForce RTX 4060 Ti 8G (116.5 - 118.8, n=3) | |
| KFA2 GeForce RTX 4060 Ti EX, 16GB GDDR6 | |
| KFA2 GeForce RTX 4060 1-Click-OC 2X | |
| XFX Speedster QICK 308 Radeon RX 7600 Black Edition | |
| Unigine Superposition / 720p Low | |
| Asus TUF Gaming GeForce RTX 4070 Ti | |
| NVIDIA GeForce RTX 4090 Founders Edition | |
| Gigabyte Aorus GeForce RTX 4070 Ti Master | |
| Medio NVIDIA GeForce RTX 4070 Ti (48835 - 56396, n=4) | |
| Zotac Gaming GeForce RTX 4070 AMP Airo | |
| Gigabyte GeForce RTX 4080 Super Gaming OC | |
| NVIDIA GeForce RTX 4080 Founders Edition | |
| NVIDIA GeForce RTX 4070 Super Founders Edition | |
| Gigabyte GeForce RTX 4070 Super Gaming OC 12G | |
| Asus TUF Gaming GeForce RTX 4070 Ti Super | |
| Media de la clase Desktop (4614 - 64541, n=27, últimos 2 años) | |
| Medio NVIDIA GeForce RTX 3090 (33329 - 63518, n=11) | |
| Medio NVIDIA GeForce RTX 3080 Ti (43163 - 50738, n=4) | |
| Medio NVIDIA GeForce RTX 4060 Ti 8G (46504 - 47695, n=3) | |
| AMD Radeon RX 7900 XTX | |
| AMD Radeon RX 7900 XT | |
| KFA2 GeForce RTX 4060 1-Click-OC 2X | |
| AMD Radeon RX 7800 XT | |
| Sapphire Pulse Radeon RX 7700 XT | |
| KFA2 GeForce RTX 4060 Ti EX, 16GB GDDR6 | |
| XFX Speedster QICK 308 Radeon RX 7600 Black Edition | |
| Medio NVIDIA Titan RTX (25622 - 50876, n=9) | |
| Medio NVIDIA GeForce RTX 3080 (30851 - 32183, n=2) | |
| Unigine Superposition / 1080p Extreme | |
| NVIDIA GeForce RTX 4090 Founders Edition | |
| AMD Radeon RX 7900 XTX | |
| Gigabyte GeForce RTX 4080 Super Gaming OC | |
| Media de la clase Desktop (280 - 28841, n=30, últimos 2 años) | |
| NVIDIA GeForce RTX 4080 Founders Edition | |
| AMD Radeon RX 7900 XT | |
| Gigabyte Aorus GeForce RTX 4070 Ti Master | |
| Asus TUF Gaming GeForce RTX 4070 Ti Super | |
| Asus TUF Gaming GeForce RTX 4070 Ti | |
| Medio NVIDIA GeForce RTX 4070 Ti (12837 - 13448, n=4) | |
| Medio NVIDIA GeForce RTX 3090 (11806 - 12694, n=12) | |
| Gigabyte GeForce RTX 4070 Super Gaming OC 12G | |
| Medio NVIDIA GeForce RTX 3080 Ti (12038 - 12347, n=4) | |
| NVIDIA GeForce RTX 4070 Super Founders Edition | |
| Medio NVIDIA GeForce RTX 3080 (10572 - 10822, n=2) | |
| AMD Radeon RX 7800 XT | |
| Zotac Gaming GeForce RTX 4070 AMP Airo | |
| Medio NVIDIA Titan RTX (8916 - 9285, n=9) | |
| Sapphire Pulse Radeon RX 7700 XT | |
| KFA2 GeForce RTX 4060 Ti EX, 16GB GDDR6 | |
| Medio NVIDIA GeForce RTX 4060 Ti 8G (7085 - 7833, n=3) | |
| XFX Speedster QICK 308 Radeon RX 7600 Black Edition | |
| KFA2 GeForce RTX 4060 1-Click-OC 2X | |
| Unigine Superposition / 4k Optimized | |
| NVIDIA GeForce RTX 4090 Founders Edition | |
| AMD Radeon RX 7900 XTX | |
| Gigabyte GeForce RTX 4080 Super Gaming OC | |
| Media de la clase Desktop (2379 - 45354, n=42, últimos 2 años) | |
| NVIDIA GeForce RTX 4080 Founders Edition | |
| Asus TUF Gaming GeForce RTX 4070 Ti Super | |
| AMD Radeon RX 7900 XT | |
| Gigabyte Aorus GeForce RTX 4070 Ti Master | |
| Asus TUF Gaming GeForce RTX 4070 Ti | |
| Medio NVIDIA GeForce RTX 4070 Ti (16889 - 17290, n=5) | |
| Medio NVIDIA GeForce RTX 3090 (15794 - 16868, n=12) | |
| Medio NVIDIA GeForce RTX 3080 Ti (16108 - 16412, n=4) | |
| Gigabyte GeForce RTX 4070 Super Gaming OC 12G | |
| NVIDIA GeForce RTX 4070 Super Founders Edition | |
| Medio NVIDIA GeForce RTX 3080 (13984 - 14243, n=2) | |
| AMD Radeon RX 7800 XT | |
| Zotac Gaming GeForce RTX 4070 AMP Airo | |
| Medio NVIDIA Titan RTX (11937 - 12644, n=9) | |
| Sapphire Pulse Radeon RX 7700 XT | |
| Medio NVIDIA GeForce RTX 4060 Ti 8G (9438 - 9722, n=4) | |
| KFA2 GeForce RTX 4060 Ti EX, 16GB GDDR6 | |
| KFA2 GeForce RTX 4060 1-Click-OC 2X | |
| XFX Speedster QICK 308 Radeon RX 7600 Black Edition | |
| Unigine Superposition / 8k Optimized | |
| NVIDIA GeForce RTX 4090 Founders Edition | |
| Media de la clase Desktop (914 - 18770, n=42, últimos 2 años) | |
| AMD Radeon RX 7900 XTX | |
| Gigabyte GeForce RTX 4080 Super Gaming OC | |
| NVIDIA GeForce RTX 4080 Founders Edition | |
| Medio NVIDIA GeForce RTX 3090 (6961 - 7521, n=12) | |
| Asus TUF Gaming GeForce RTX 4070 Ti Super | |
| Medio NVIDIA GeForce RTX 3080 Ti (6920 - 7161, n=4) | |
| AMD Radeon RX 7900 XT | |
| Gigabyte Aorus GeForce RTX 4070 Ti Master | |
| Asus TUF Gaming GeForce RTX 4070 Ti | |
| Medio NVIDIA GeForce RTX 4070 Ti (6276 - 6454, n=5) | |
| Medio NVIDIA GeForce RTX 3080 (6243 - 6346, n=2) | |
| Gigabyte GeForce RTX 4070 Super Gaming OC 12G | |
| NVIDIA GeForce RTX 4070 Super Founders Edition | |
| Medio NVIDIA Titan RTX (5255 - 5571, n=9) | |
| AMD Radeon RX 7800 XT | |
| Zotac Gaming GeForce RTX 4070 AMP Airo | |
| Sapphire Pulse Radeon RX 7700 XT | |
| Medio NVIDIA GeForce RTX 4060 Ti 8G (3477 - 3571, n=4) | |
| KFA2 GeForce RTX 4060 Ti EX, 16GB GDDR6 | |
| KFA2 GeForce RTX 4060 1-Click-OC 2X | |
| XFX Speedster QICK 308 Radeon RX 7600 Black Edition | |
3DMark 11: 1280x720 Performance GPU
3DMark: 1920x1080 Fire Strike Graphics | 3840x2160 Fire Strike Ultra Graphics | Fire Strike Extreme Graphics | 2560x1440 Time Spy Graphics | 2560x1440 Port Royal Graphics | 2560x1440 Speed Way Score
Unigine Heaven 4.0: Extreme Preset DX11 | Extreme Preset OpenGL
Unigine Valley 1.0: 1920x1080 Extreme HD DirectX AA:x8 | 1920x1080 Extreme HD Preset OpenGL AA:x8
Unigine Superposition: 1280x720 720p Low | 1920x1080 1080p Extreme | 3840x2160 4k Optimized | 7680x4320 8k Optimized
| 3DMark 11 Performance | 57532 puntos | |
| 3DMark Ice Storm Standard Score | 294683 puntos | |
| 3DMark Cloud Gate Standard Score | 80761 puntos | |
| 3DMark Fire Strike Score | 45427 puntos | |
| 3DMark Fire Strike Extreme Score | 31385 puntos | |
| 3DMark Time Spy Score | 27111 puntos | |
ayuda | ||
Rendimiento de cálculo: Mejoras significativas respecto a la RX 7900 XTX
La RTX 4080 Super Gaming OC es capaz de terminar el renderizado Blender CUDA Classroom un segundo más rápido que la RTX 4080 FE y es aproximadamente un 3% más rápida en V-Ray 5 CUDA.
Las puntuaciones de LuxMark Sala están empatadas entre estas dos GPU, y la RTX 4080 Super Gaming OC consigue una enorme ventaja del 62% sobre la RX 7900 XTX en esta prueba.
Aunque tanto la RX 7900 XT y la RX 7900 XTX obtienen buenos resultados en la mayoría de las pruebas ComputeMark, la RTX 4080 Super Gaming OC obtiene una ventaja significativa en la prueba QJuliaRayTrace que sitúa a la tarjeta de Gigabyte ligeramente por delante de los dos buques insignia de AMD en este índice de referencia.
Blender: v3.3 Classroom CUDA | v3.3 Classroom OPTIX/RTX
LuxMark v2.0 64Bit: Room GPUs-only | Sala GPUs-only
ComputeMark v2.1: 1024x600 Normal, Score | 1024x600 Normal, QJuliaRayTrace | 1024x600 Normal, Mandel Scalar | 1024x600 Normal, Mandel Vector | 1024x600 Normal, Fluid 2DTexArr | 1024x600 Normal, Fluid 3DTex
| V-Ray 5 Benchmark / GPU CUDA | |
| NVIDIA GeForce RTX 4090 Founders Edition (5.0.1) | |
| Gigabyte GeForce RTX 4080 Super Gaming OC (5.0.1) | |
| NVIDIA GeForce RTX 4080 Founders Edition | |
| Media de la clase Desktop (356 - 5824, n=40, últimos 2 años) | |
| Asus TUF Gaming GeForce RTX 4070 Ti Super (5.0.1) | |
| Gigabyte Aorus GeForce RTX 4070 Ti Master (5.0.1) | |
| Medio NVIDIA GeForce RTX 4070 Ti (2278 - 2395, n=5) | |
| Asus TUF Gaming GeForce RTX 4070 Ti (5.0.1) | |
| Gigabyte GeForce RTX 4070 Super Gaming OC 12G (5.0.1) | |
| NVIDIA GeForce RTX 4070 Super Founders Edition (5.0.1) | |
| Medio NVIDIA GeForce RTX 3080 Ti (2045 - 2070, n=3) | |
| Medio NVIDIA GeForce RTX 3090 (1616 - 2131, n=15) | |
| Zotac Gaming GeForce RTX 4070 AMP Airo (5.0.1) | |
| KFA2 GeForce RTX 4060 Ti EX, 16GB GDDR6 (5.0.1) | |
| Medio NVIDIA GeForce RTX 4060 Ti 8G (1375 - 1400, n=3) | |
| KFA2 GeForce RTX 4060 1-Click-OC 2X (5.0.1) | |
| Medio NVIDIA Titan RTX (668 - 1052, n=7) | |
| AMD Radeon RX 7800 XT (5.0.1) | |
| Sapphire Pulse Radeon RX 7700 XT (5.0.1) | |
| XFX Speedster QICK 308 Radeon RX 7600 Black Edition (5.0.1) | |
| V-Ray 5 Benchmark / GPU RTX | |
| NVIDIA GeForce RTX 4090 Founders Edition (5.0.1) | |
| Media de la clase Desktop (1408 - 7496, n=35, últimos 2 años) | |
| Gigabyte GeForce RTX 4080 Super Gaming OC (5.0.1) | |
| NVIDIA GeForce RTX 4080 Founders Edition | |
| Asus TUF Gaming GeForce RTX 4070 Ti Super (5.0.1) | |
| Gigabyte Aorus GeForce RTX 4070 Ti Master (5.0.1) | |
| Asus TUF Gaming GeForce RTX 4070 Ti (5.0.1) | |
| Medio NVIDIA GeForce RTX 4070 Ti (3054 - 3221, n=5) | |
| Gigabyte GeForce RTX 4070 Super Gaming OC 12G (5.0.1) | |
| NVIDIA GeForce RTX 4070 Super Founders Edition (5.0.1) | |
| Medio NVIDIA GeForce RTX 3090 (2551 - 2979, n=15) | |
| Medio NVIDIA GeForce RTX 3080 Ti (2727 - 2883, n=3) | |
| Zotac Gaming GeForce RTX 4070 AMP Airo (5.0.1) | |
| AMD Radeon RX 7800 XT (5.0.1) | |
| KFA2 GeForce RTX 4060 Ti EX, 16GB GDDR6 (5.0.1) | |
| Sapphire Pulse Radeon RX 7700 XT (5.0.1) | |
| Medio NVIDIA GeForce RTX 4060 Ti 8G (1860 - 2024, n=3) | |
| KFA2 GeForce RTX 4060 1-Click-OC 2X (5.0.1) | |
| Medio NVIDIA Titan RTX (1246 - 1348, n=7) | |
| Blender / v3.3 Classroom CUDA | |
| KFA2 GeForce RTX 4060 1-Click-OC 2X (3.3.3) | |
| Medio NVIDIA Titan RTX (n=1) | |
| Medio NVIDIA GeForce RTX 4060 Ti 8G (n=1) | |
| Zotac Gaming GeForce RTX 4070 AMP Airo (3.3.3) | |
| Medio NVIDIA GeForce RTX 3080 Ti (21 - 22, n=2) | |
| Medio NVIDIA GeForce RTX 3090 (20 - 22, n=13) | |
| NVIDIA GeForce RTX 4070 Super Founders Edition (3.3.3) | |
| Gigabyte GeForce RTX 4070 Super Gaming OC 12G (3.3.3) | |
| Medio NVIDIA GeForce RTX 4070 Ti (18 - 19, n=3) | |
| Media de la clase Desktop (8 - 54, n=31, últimos 2 años) | |
| Gigabyte Aorus GeForce RTX 4070 Ti Master (3.3.2) | |
| Asus TUF Gaming GeForce RTX 4070 Ti Super (3.3.3) | |
| NVIDIA GeForce RTX 4080 Founders Edition (3.3.3) | |
| Gigabyte GeForce RTX 4080 Super Gaming OC (3.3.3) | |
| Blender / v3.3 Classroom OPTIX/RTX | |
| KFA2 GeForce RTX 4060 1-Click-OC 2X (3.3.3) | |
| Medio NVIDIA Titan RTX (n=1) | |
| KFA2 GeForce RTX 4060 Ti EX, 16GB GDDR6 (3.3.3) | |
| Medio NVIDIA GeForce RTX 4060 Ti 8G (17 - 18, n=3) | |
| Medio NVIDIA GeForce RTX 3080 Ti (14 - 15, n=2) | |
| Zotac Gaming GeForce RTX 4070 AMP Airo (3.3.3) | |
| Medio NVIDIA GeForce RTX 3090 (13 - 14, n=13) | |
| Asus TUF Gaming GeForce RTX 4070 Ti (3.3.2) | |
| Medio NVIDIA GeForce RTX 4070 Ti (11 - 12, n=5) | |
| Gigabyte Aorus GeForce RTX 4070 Ti Master (3.3.2) | |
| NVIDIA GeForce RTX 4070 Super Founders Edition (3.3.3) | |
| Gigabyte GeForce RTX 4070 Super Gaming OC 12G (3.3.3) | |
| Media de la clase Desktop (5 - 19, n=30, últimos 2 años) | |
| Asus TUF Gaming GeForce RTX 4070 Ti Super (3.3.3) | |
| NVIDIA GeForce RTX 4080 Founders Edition (3.3.3) | |
| NVIDIA GeForce RTX 4090 Founders Edition (3.3.0) | |
| Gigabyte GeForce RTX 4080 Super Gaming OC (3.3.3) | |
| LuxMark v2.0 64Bit / Room GPUs-only | |
| NVIDIA GeForce RTX 4090 Founders Edition | |
| Gigabyte GeForce RTX 4080 Super Gaming OC | |
| NVIDIA GeForce RTX 4080 Founders Edition | |
| Asus TUF Gaming GeForce RTX 4070 Ti Super | |
| Media de la clase Desktop (370 - 14722, n=40, últimos 2 años) | |
| Gigabyte Aorus GeForce RTX 4070 Ti Master | |
| Asus TUF Gaming GeForce RTX 4070 Ti | |
| NVIDIA GeForce RTX 4070 Super Founders Edition | |
| Gigabyte GeForce RTX 4070 Super Gaming OC 12G | |
| Medio NVIDIA GeForce RTX 4070 Ti (7625 - 8436, n=5) | |
| Zotac Gaming GeForce RTX 4070 AMP Airo | |
| Medio NVIDIA GeForce RTX 3080 Ti (5772 - 6464, n=4) | |
| Medio NVIDIA GeForce RTX 3090 (5727 - 5985, n=10) | |
| AMD Radeon RX 7900 XTX | |
| Medio NVIDIA GeForce RTX 3080 (5112 - 5198, n=2) | |
| Medio NVIDIA GeForce RTX 4060 Ti 8G (4558 - 5058, n=4) | |
| Medio NVIDIA Titan RTX (4643 - 4703, n=2) | |
| KFA2 GeForce RTX 4060 Ti EX, 16GB GDDR6 | |
| AMD Radeon RX 7900 XT | |
| KFA2 GeForce RTX 4060 1-Click-OC 2X | |
| AMD Radeon RX 7800 XT | |
| Sapphire Pulse Radeon RX 7700 XT | |
| XFX Speedster QICK 308 Radeon RX 7600 Black Edition | |
| LuxMark v2.0 64Bit / Sala GPUs-only | |
| NVIDIA GeForce RTX 4090 Founders Edition | |
| NVIDIA GeForce RTX 4080 Founders Edition | |
| Gigabyte GeForce RTX 4080 Super Gaming OC | |
| Gigabyte Aorus GeForce RTX 4070 Ti Master | |
| Asus TUF Gaming GeForce RTX 4070 Ti | |
| Asus TUF Gaming GeForce RTX 4070 Ti Super | |
| Medio NVIDIA GeForce RTX 4070 Ti (17719 - 20305, n=5) | |
| Media de la clase Desktop (600 - 33461, n=40, últimos 2 años) | |
| Gigabyte GeForce RTX 4070 Super Gaming OC 12G | |
| NVIDIA GeForce RTX 4070 Super Founders Edition | |
| Medio NVIDIA GeForce RTX 3080 Ti (14871 - 16438, n=4) | |
| Zotac Gaming GeForce RTX 4070 AMP Airo | |
| AMD Radeon RX 7900 XTX | |
| Medio NVIDIA GeForce RTX 3090 (14590 - 15242, n=10) | |
| AMD Radeon RX 7900 XT | |
| Medio NVIDIA GeForce RTX 3080 (12797 - 12980, n=2) | |
| Medio NVIDIA GeForce RTX 4060 Ti 8G (11159 - 12428, n=4) | |
| KFA2 GeForce RTX 4060 Ti EX, 16GB GDDR6 | |
| Medio NVIDIA Titan RTX (10799 - 10996, n=2) | |
| AMD Radeon RX 7800 XT | |
| KFA2 GeForce RTX 4060 1-Click-OC 2X | |
| Sapphire Pulse Radeon RX 7700 XT | |
| XFX Speedster QICK 308 Radeon RX 7600 Black Edition | |
| ComputeMark v2.1 / Normal, Score | |
| NVIDIA GeForce RTX 4090 Founders Edition | |
| Gigabyte GeForce RTX 4080 Super Gaming OC | |
| AMD Radeon RX 7900 XTX | |
| NVIDIA GeForce RTX 4080 Founders Edition | |
| Media de la clase Desktop (1629 - 120417, n=44, últimos 2 años) | |
| AMD Radeon RX 7900 XT | |
| Asus TUF Gaming GeForce RTX 4070 Ti Super | |
| Gigabyte Aorus GeForce RTX 4070 Ti Master | |
| Asus TUF Gaming GeForce RTX 4070 Ti | |
| Medio NVIDIA GeForce RTX 4070 Ti (49909 - 52251, n=5) | |
| Medio NVIDIA GeForce RTX 3080 Ti (47377 - 48892, n=4) | |
| Gigabyte GeForce RTX 4070 Super Gaming OC 12G | |
| NVIDIA GeForce RTX 4070 Super Founders Edition | |
| Medio NVIDIA GeForce RTX 3090 (44948 - 49118, n=10) | |
| AMD Radeon RX 7800 XT | |
| Zotac Gaming GeForce RTX 4070 AMP Airo | |
| Medio NVIDIA GeForce RTX 3080 (39924 - 41594, n=2) | |
| Sapphire Pulse Radeon RX 7700 XT | |
| KFA2 GeForce RTX 4060 Ti EX, 16GB GDDR6 | |
| Medio NVIDIA GeForce RTX 4060 Ti 8G (29999 - 32410, n=4) | |
| Medio NVIDIA Titan RTX (27907 - 29830, n=3) | |
| XFX Speedster QICK 308 Radeon RX 7600 Black Edition | |
| KFA2 GeForce RTX 4060 1-Click-OC 2X | |
| ComputeMark v2.1 / Normal, QJuliaRayTrace | |
| NVIDIA GeForce RTX 4090 Founders Edition | |
| Gigabyte GeForce RTX 4080 Super Gaming OC | |
| NVIDIA GeForce RTX 4080 Founders Edition | |
| Gigabyte Aorus GeForce RTX 4070 Ti Master | |
| Asus TUF Gaming GeForce RTX 4070 Ti Super | |
| Asus TUF Gaming GeForce RTX 4070 Ti | |
| Medio NVIDIA GeForce RTX 4070 Ti (20405 - 21619, n=5) | |
| Media de la clase Desktop (403 - 40008, n=44, últimos 2 años) | |
| Gigabyte GeForce RTX 4070 Super Gaming OC 12G | |
| NVIDIA GeForce RTX 4070 Super Founders Edition | |
| AMD Radeon RX 7900 XTX | |
| Medio NVIDIA GeForce RTX 3080 Ti (17050 - 17749, n=4) | |
| Medio NVIDIA GeForce RTX 3090 (16403 - 18223, n=11) | |
| Zotac Gaming GeForce RTX 4070 AMP Airo | |
| AMD Radeon RX 7900 XT | |
| Medio NVIDIA GeForce RTX 3080 (14718 - 15508, n=2) | |
| KFA2 GeForce RTX 4060 Ti EX, 16GB GDDR6 | |
| AMD Radeon RX 7800 XT | |
| Medio NVIDIA GeForce RTX 4060 Ti 8G (12697 - 13822, n=4) | |
| Sapphire Pulse Radeon RX 7700 XT | |
| KFA2 GeForce RTX 4060 1-Click-OC 2X | |
| Medio NVIDIA Titan RTX (9418 - 10129, n=3) | |
| XFX Speedster QICK 308 Radeon RX 7600 Black Edition | |
| ComputeMark v2.1 / Normal, Mandel Scalar | |
| NVIDIA GeForce RTX 4090 Founders Edition | |
| AMD Radeon RX 7900 XTX | |
| Gigabyte GeForce RTX 4080 Super Gaming OC | |
| NVIDIA GeForce RTX 4080 Founders Edition | |
| AMD Radeon RX 7900 XT | |
| Media de la clase Desktop (490 - 28468, n=44, últimos 2 años) | |
| Asus TUF Gaming GeForce RTX 4070 Ti Super | |
| Gigabyte Aorus GeForce RTX 4070 Ti Master | |
| Asus TUF Gaming GeForce RTX 4070 Ti | |
| Medio NVIDIA GeForce RTX 4070 Ti (11924 - 12449, n=5) | |
| Gigabyte GeForce RTX 4070 Super Gaming OC 12G | |
| AMD Radeon RX 7800 XT | |
| Medio NVIDIA GeForce RTX 3080 Ti (11049 - 11318, n=4) | |
| NVIDIA GeForce RTX 4070 Super Founders Edition | |
| Medio NVIDIA GeForce RTX 3090 (10650 - 11564, n=11) | |
| Sapphire Pulse Radeon RX 7700 XT | |
| Medio NVIDIA GeForce RTX 3080 (9554 - 9938, n=2) | |
| Zotac Gaming GeForce RTX 4070 AMP Airo | |
| KFA2 GeForce RTX 4060 Ti EX, 16GB GDDR6 | |
| Medio NVIDIA GeForce RTX 4060 Ti 8G (6996 - 7511, n=4) | |
| XFX Speedster QICK 308 Radeon RX 7600 Black Edition | |
| Medio NVIDIA Titan RTX (5977 - 6406, n=3) | |
| KFA2 GeForce RTX 4060 1-Click-OC 2X | |
| ComputeMark v2.1 / Normal, Mandel Vector | |
| NVIDIA GeForce RTX 4090 Founders Edition | |
| AMD Radeon RX 7900 XTX | |
| AMD Radeon RX 7900 XT | |
| Gigabyte GeForce RTX 4080 Super Gaming OC | |
| Media de la clase Desktop (318 - 24838, n=44, últimos 2 años) | |
| NVIDIA GeForce RTX 4080 Founders Edition | |
| Gigabyte Aorus GeForce RTX 4070 Ti Master | |
| Asus TUF Gaming GeForce RTX 4070 Ti Super | |
| Asus TUF Gaming GeForce RTX 4070 Ti | |
| Medio NVIDIA GeForce RTX 4070 Ti (10424 - 10888, n=5) | |
| AMD Radeon RX 7800 XT | |
| Gigabyte GeForce RTX 4070 Super Gaming OC 12G | |
| Medio NVIDIA GeForce RTX 3080 Ti (9513 - 9860, n=4) | |
| NVIDIA GeForce RTX 4070 Super Founders Edition | |
| Sapphire Pulse Radeon RX 7700 XT | |
| Medio NVIDIA GeForce RTX 3090 (8038 - 10097, n=11) | |
| Zotac Gaming GeForce RTX 4070 AMP Airo | |
| Medio NVIDIA GeForce RTX 3080 (7148 - 7540, n=2) | |
| KFA2 GeForce RTX 4060 Ti EX, 16GB GDDR6 | |
| Medio NVIDIA GeForce RTX 4060 Ti 8G (6419 - 6929, n=4) | |
| XFX Speedster QICK 308 Radeon RX 7600 Black Edition | |
| Medio NVIDIA Titan RTX (4944 - 5440, n=3) | |
| KFA2 GeForce RTX 4060 1-Click-OC 2X | |
| ComputeMark v2.1 / Normal, Fluid 2DTexArr | |
| AMD Radeon RX 7900 XTX | |
| NVIDIA GeForce RTX 4090 Founders Edition | |
| AMD Radeon RX 7900 XT | |
| Gigabyte GeForce RTX 4080 Super Gaming OC | |
| NVIDIA GeForce RTX 4080 Founders Edition | |
| Media de la clase Desktop (188 - 8647, n=44, últimos 2 años) | |
| Asus TUF Gaming GeForce RTX 4070 Ti Super | |
| Medio NVIDIA GeForce RTX 3080 Ti (4453 - 4546, n=4) | |
| AMD Radeon RX 7800 XT | |
| Medio NVIDIA GeForce RTX 3090 (4344 - 4608, n=11) | |
| Medio NVIDIA GeForce RTX 3080 (4087 - 4159, n=2) | |
| Medio NVIDIA Titan RTX (3691 - 3828, n=3) | |
| Medio NVIDIA GeForce RTX 4070 Ti (3539 - 3724, n=5) | |
| Gigabyte GeForce RTX 4070 Super Gaming OC 12G | |
| NVIDIA GeForce RTX 4070 Super Founders Edition | |
| Gigabyte Aorus GeForce RTX 4070 Ti Master | |
| Asus TUF Gaming GeForce RTX 4070 Ti | |
| Zotac Gaming GeForce RTX 4070 AMP Airo | |
| Sapphire Pulse Radeon RX 7700 XT | |
| KFA2 GeForce RTX 4060 Ti EX, 16GB GDDR6 | |
| Medio NVIDIA GeForce RTX 4060 Ti 8G (1924 - 2060, n=4) | |
| KFA2 GeForce RTX 4060 1-Click-OC 2X | |
| XFX Speedster QICK 308 Radeon RX 7600 Black Edition | |
| ComputeMark v2.1 / Normal, Fluid 3DTex | |
| NVIDIA GeForce RTX 4090 Founders Edition | |
| AMD Radeon RX 7900 XTX | |
| Media de la clase Desktop (222 - 18731, n=44, últimos 2 años) | |
| AMD Radeon RX 7900 XT | |
| Gigabyte GeForce RTX 4080 Super Gaming OC | |
| NVIDIA GeForce RTX 4080 Founders Edition | |
| Medio NVIDIA GeForce RTX 3090 (5246 - 5520, n=11) | |
| Medio NVIDIA GeForce RTX 3080 Ti (5312 - 5422, n=4) | |
| Asus TUF Gaming GeForce RTX 4070 Ti Super | |
| AMD Radeon RX 7800 XT | |
| Medio NVIDIA GeForce RTX 3080 (4417 - 4450, n=2) | |
| Medio NVIDIA Titan RTX (3877 - 4027, n=3) | |
| Medio NVIDIA GeForce RTX 4070 Ti (3616 - 3789, n=5) | |
| Gigabyte Aorus GeForce RTX 4070 Ti Master | |
| NVIDIA GeForce RTX 4070 Super Founders Edition | |
| Asus TUF Gaming GeForce RTX 4070 Ti | |
| Gigabyte GeForce RTX 4070 Super Gaming OC 12G | |
| Zotac Gaming GeForce RTX 4070 AMP Airo | |
| Sapphire Pulse Radeon RX 7700 XT | |
| KFA2 GeForce RTX 4060 Ti EX, 16GB GDDR6 | |
| Medio NVIDIA GeForce RTX 4060 Ti 8G (1962 - 2090, n=4) | |
| KFA2 GeForce RTX 4060 1-Click-OC 2X | |
| XFX Speedster QICK 308 Radeon RX 7600 Black Edition | |
Blender: v3.3 Classroom CUDA | v3.3 Classroom OPTIX/RTX
LuxMark v2.0 64Bit: Room GPUs-only | Sala GPUs-only
ComputeMark v2.1: 1024x600 Normal, Score | 1024x600 Normal, QJuliaRayTrace | 1024x600 Normal, Mandel Scalar | 1024x600 Normal, Mandel Vector | 1024x600 Normal, Fluid 2DTexArr | 1024x600 Normal, Fluid 3DTex
* ... más pequeño es mejor
Rendimiento en juegos: La RX 7900 XTX aventaja en rasterización
Aunque la RTX 4090 sigue siendo la GPU más codiciada dos años después de su lanzamiento, la nueva RTX 4080 Super es el buque insignia de Nvidia para los jugadores.
La RTX 4080 Super Gaming OC supera en un 12% a la RTX 4080 FE en las pruebas de juego acumuladas a 1080p, 1440p y 4K Ultra, al tiempo que supera a la RTX 3090 en un 28%.
La RX 7900 XTX aún logra una ventaja del 4% sobre la RTX 4080 Super Gaming OC, a pesar de que esta última muestra buenas ganancias en F1 22, Borderlands 3y Final Fantasy XV.
La RTX 4080 Super es capaz de alcanzar los 100 fps en muchos títulos AAA a 4K Ultra. Se recomienda el uso de upscalers como DLSS, FSR y XeSS para una experiencia de juego más suave en títulos modernos con muchas texturas, incluyendo Cyberpunk 2077 2.0 Phantom Libertyalan Wake 2 y Avatar: Fronteras de Pandora.
The Witcher 3: 3840x2160 Ultra Graphics & Postprocessing (HBAO+) | 3840x2160 High Graphics & Postprocessing (Nvidia HairWorks Off) | 1920x1080 Ultra Graphics & Postprocessing (HBAO+)
Metro Exodus: 3840x2160 Ultra Quality AF:16x | 2560x1440 Ultra Quality AF:16x | 1920x1080 Ultra Quality AF:16x
Control: 3840x2160 High Quality Preset | 2560x1440 High Quality Preset | 1920x1080 High Quality Preset
Borderlands 3: 3840x2160 Badass Overall Quality (DX11) | 2560x1440 Badass Overall Quality (DX11) | 1920x1080 Badass Overall Quality (DX11)
Shadow of the Tomb Raider: 3840x2160 Highest Preset AA:T | 2560x1440 Highest Preset AA:T | 1920x1080 Highest Preset AA:T
F1 22: 3840x2160 Ultra High Preset AA:T AF:16x | 2560x1440 Ultra High Preset AA:T AF:16x | 1920x1080 Ultra High Preset AA:T AF:16x
Final Fantasy XV Benchmark: 3840x2160 High Quality | 2560x1440 High Quality | 1920x1080 High Quality
| Performance rating | |
| NVIDIA GeForce RTX 4090 Founders Edition | |
| AMD Radeon RX 7900 XTX | |
| Gigabyte GeForce RTX 4080 Super Gaming OC | |
| AMD Radeon RX 7900 XT | |
| NVIDIA GeForce RTX 4080 Founders Edition | |
| Asus TUF Gaming GeForce RTX 4070 Ti Super -1! | |
| Asus TUF Gaming GeForce RTX 4070 Ti | |
| Gigabyte Aorus GeForce RTX 4070 Ti Master | |
| Medio NVIDIA GeForce RTX 4070 Ti | |
| Gigabyte GeForce RTX 4070 Super Gaming OC 12G | |
| Medio NVIDIA GeForce RTX 3080 Ti | |
| Medio NVIDIA GeForce RTX 3090 | |
| NVIDIA GeForce RTX 4070 Super Founders Edition | |
| AMD Radeon RX 7800 XT | |
| Zotac Gaming GeForce RTX 4070 AMP Airo | |
| Medio NVIDIA GeForce RTX 3080 | |
| Sapphire Pulse Radeon RX 7700 XT | |
| Medio NVIDIA Titan RTX | |
| Medio NVIDIA GeForce RTX 4060 Ti 8G | |
| KFA2 GeForce RTX 4060 Ti EX, 16GB GDDR6 | |
| KFA2 GeForce RTX 4060 1-Click-OC 2X | |
| XFX Speedster QICK 308 Radeon RX 7600 Black Edition | |
| The Witcher 3 / Ultra Graphics & Postprocessing (HBAO+) | |
| NVIDIA GeForce RTX 4090 Founders Edition | |
| AMD Radeon RX 7900 XTX | |
| Gigabyte GeForce RTX 4080 Super Gaming OC | |
| NVIDIA GeForce RTX 4080 Founders Edition | |
| AMD Radeon RX 7900 XT | |
| Asus TUF Gaming GeForce RTX 4070 Ti Super | |
| Asus TUF Gaming GeForce RTX 4070 Ti | |
| Medio NVIDIA GeForce RTX 4070 Ti (92.4 - 98.3, n=4) | |
| Medio NVIDIA GeForce RTX 3080 Ti (93.1 - 96.4, n=4) | |
| Gigabyte Aorus GeForce RTX 4070 Ti Master | |
| Medio NVIDIA GeForce RTX 3090 (85.4 - 98.5, n=10) | |
| Gigabyte GeForce RTX 4070 Super Gaming OC 12G | |
| NVIDIA GeForce RTX 4070 Super Founders Edition | |
| Medio NVIDIA GeForce RTX 3080 (78 - 85.7, n=2) | |
| AMD Radeon RX 7800 XT | |
| Zotac Gaming GeForce RTX 4070 AMP Airo | |
| Medio NVIDIA Titan RTX (n=1) | |
| Sapphire Pulse Radeon RX 7700 XT | |
| Medio NVIDIA GeForce RTX 4060 Ti 8G (53.9 - 54.3, n=3) | |
| KFA2 GeForce RTX 4060 Ti EX, 16GB GDDR6 | |
| XFX Speedster QICK 308 Radeon RX 7600 Black Edition | |
| KFA2 GeForce RTX 4060 1-Click-OC 2X | |
| The Witcher 3 / High Graphics & Postprocessing (Nvidia HairWorks Off) | |
| NVIDIA GeForce RTX 4090 Founders Edition | |
| Gigabyte GeForce RTX 4080 Super Gaming OC | |
| NVIDIA GeForce RTX 4080 Founders Edition | |
| AMD Radeon RX 7900 XTX | |
| AMD Radeon RX 7900 XT | |
| Medio NVIDIA GeForce RTX 3080 Ti (149 - 156.8, n=4) | |
| Medio NVIDIA GeForce RTX 3090 (128 - 160.2, n=14) | |
| Asus TUF Gaming GeForce RTX 4070 Ti | |
| Gigabyte Aorus GeForce RTX 4070 Ti Master | |
| Medio NVIDIA GeForce RTX 4070 Ti (143 - 151.9, n=4) | |
| Gigabyte GeForce RTX 4070 Super Gaming OC 12G | |
| NVIDIA GeForce RTX 4070 Super Founders Edition | |
| Zotac Gaming GeForce RTX 4070 AMP Airo | |
| Medio NVIDIA GeForce RTX 3080 (114 - 115, n=2) | |
| AMD Radeon RX 7800 XT | |
| Medio NVIDIA Titan RTX (94 - 107.1, n=28) | |
| Sapphire Pulse Radeon RX 7700 XT | |
| Medio NVIDIA GeForce RTX 4060 Ti 8G (78.5 - 80.4, n=3) | |
| KFA2 GeForce RTX 4060 Ti EX, 16GB GDDR6 | |
| KFA2 GeForce RTX 4060 1-Click-OC 2X | |
| XFX Speedster QICK 308 Radeon RX 7600 Black Edition | |
| The Witcher 3 / Ultra Graphics & Postprocessing (HBAO+) | |
| NVIDIA GeForce RTX 4090 Founders Edition | |
| AMD Radeon RX 7900 XTX | |
| AMD Radeon RX 7900 XT | |
| NVIDIA GeForce RTX 4080 Founders Edition | |
| Gigabyte GeForce RTX 4080 Super Gaming OC | |
| Asus TUF Gaming GeForce RTX 4070 Ti | |
| Medio NVIDIA GeForce RTX 4070 Ti (217 - 230, n=5) | |
| Gigabyte Aorus GeForce RTX 4070 Ti Master | |
| Asus TUF Gaming GeForce RTX 4070 Ti Super | |
| Gigabyte GeForce RTX 4070 Super Gaming OC 12G | |
| NVIDIA GeForce RTX 4070 Super Founders Edition | |
| AMD Radeon RX 7800 XT | |
| Medio NVIDIA GeForce RTX 3090 (160 - 192.6, n=18) | |
| Medio NVIDIA GeForce RTX 3080 Ti (174 - 184.6, n=4) | |
| Zotac Gaming GeForce RTX 4070 AMP Airo | |
| Sapphire Pulse Radeon RX 7700 XT | |
| Medio NVIDIA GeForce RTX 3080 (145 - 152, n=2) | |
| Medio NVIDIA GeForce RTX 4060 Ti 8G (134.1 - 140.6, n=4) | |
| Medio NVIDIA Titan RTX (124 - 150, n=28) | |
| KFA2 GeForce RTX 4060 Ti EX, 16GB GDDR6 | |
| XFX Speedster QICK 308 Radeon RX 7600 Black Edition | |
| KFA2 GeForce RTX 4060 1-Click-OC 2X | |
| Metro Exodus / Ultra Quality | |
| NVIDIA GeForce RTX 4090 Founders Edition | |
| AMD Radeon RX 7900 XTX | |
| Gigabyte GeForce RTX 4080 Super Gaming OC | |
| NVIDIA GeForce RTX 4080 Founders Edition | |
| AMD Radeon RX 7900 XT | |
| Gigabyte Aorus GeForce RTX 4070 Ti Master | |
| Asus TUF Gaming GeForce RTX 4070 Ti | |
| Asus TUF Gaming GeForce RTX 4070 Ti Super | |
| Medio NVIDIA GeForce RTX 4070 Ti (81.2 - 85, n=4) | |
| Gigabyte GeForce RTX 4070 Super Gaming OC 12G | |
| Medio NVIDIA GeForce RTX 3080 Ti (74.2 - 77.1, n=4) | |
| Medio NVIDIA GeForce RTX 3090 (70.6 - 77.3, n=12) | |
| NVIDIA GeForce RTX 4070 Super Founders Edition | |
| AMD Radeon RX 7800 XT | |
| Zotac Gaming GeForce RTX 4070 AMP Airo | |
| Medio NVIDIA GeForce RTX 3080 (64.1 - 65.9, n=2) | |
| Sapphire Pulse Radeon RX 7700 XT | |
| Medio NVIDIA Titan RTX (51.3 - 57.9, n=27) | |
| Medio NVIDIA GeForce RTX 4060 Ti 8G (48.4 - 49.3, n=3) | |
| KFA2 GeForce RTX 4060 Ti EX, 16GB GDDR6 | |
| KFA2 GeForce RTX 4060 1-Click-OC 2X | |
| XFX Speedster QICK 308 Radeon RX 7600 Black Edition | |
| Metro Exodus / Ultra Quality | |
| NVIDIA GeForce RTX 4090 Founders Edition | |
| AMD Radeon RX 7900 XTX | |
| Gigabyte GeForce RTX 4080 Super Gaming OC | |
| AMD Radeon RX 7900 XT | |
| Gigabyte Aorus GeForce RTX 4070 Ti Master | |
| Asus TUF Gaming GeForce RTX 4070 Ti | |
| Asus TUF Gaming GeForce RTX 4070 Ti Super | |
| Medio NVIDIA GeForce RTX 4070 Ti (126.7 - 132.3, n=4) | |
| NVIDIA GeForce RTX 4080 Founders Edition | |
| Gigabyte GeForce RTX 4070 Super Gaming OC 12G | |
| NVIDIA GeForce RTX 4070 Super Founders Edition | |
| Medio NVIDIA GeForce RTX 3080 Ti (110 - 118, n=4) | |
| Medio NVIDIA GeForce RTX 3090 (102 - 118.2, n=12) | |
| Zotac Gaming GeForce RTX 4070 AMP Airo | |
| AMD Radeon RX 7800 XT | |
| Medio NVIDIA GeForce RTX 3080 (92.2 - 97.4, n=2) | |
| Sapphire Pulse Radeon RX 7700 XT | |
| Medio NVIDIA Titan RTX (69 - 92.9, n=26) | |
| Medio NVIDIA GeForce RTX 4060 Ti 8G (78.9 - 80.1, n=3) | |
| KFA2 GeForce RTX 4060 Ti EX, 16GB GDDR6 | |
| XFX Speedster QICK 308 Radeon RX 7600 Black Edition | |
| KFA2 GeForce RTX 4060 1-Click-OC 2X | |
| Metro Exodus / Ultra Quality | |
| NVIDIA GeForce RTX 4090 Founders Edition | |
| AMD Radeon RX 7900 XTX | |
| Gigabyte GeForce RTX 4080 Super Gaming OC | |
| AMD Radeon RX 7900 XT | |
| Asus TUF Gaming GeForce RTX 4070 Ti | |
| Gigabyte Aorus GeForce RTX 4070 Ti Master | |
| Medio NVIDIA GeForce RTX 4070 Ti (155.6 - 161.4, n=4) | |
| Asus TUF Gaming GeForce RTX 4070 Ti Super | |
| Gigabyte GeForce RTX 4070 Super Gaming OC 12G | |
| NVIDIA GeForce RTX 4080 Founders Edition | |
| NVIDIA GeForce RTX 4070 Super Founders Edition | |
| Medio NVIDIA GeForce RTX 3080 Ti (131 - 144.2, n=5) | |
| Medio NVIDIA GeForce RTX 3090 (108 - 145, n=12) | |
| Zotac Gaming GeForce RTX 4070 AMP Airo | |
| AMD Radeon RX 7800 XT | |
| Sapphire Pulse Radeon RX 7700 XT | |
| Medio NVIDIA GeForce RTX 3080 (111 - 116, n=2) | |
| Medio NVIDIA Titan RTX (73 - 116, n=27) | |
| Medio NVIDIA GeForce RTX 4060 Ti 8G (100.6 - 101.8, n=3) | |
| KFA2 GeForce RTX 4060 Ti EX, 16GB GDDR6 | |
| XFX Speedster QICK 308 Radeon RX 7600 Black Edition | |
| KFA2 GeForce RTX 4060 1-Click-OC 2X | |
| Control / High Quality Preset | |
| NVIDIA GeForce RTX 4090 Founders Edition | |
| AMD Radeon RX 7900 XTX | |
| Gigabyte GeForce RTX 4080 Super Gaming OC | |
| AMD Radeon RX 7900 XT | |
| NVIDIA GeForce RTX 4080 Founders Edition | |
| Asus TUF Gaming GeForce RTX 4070 Ti Super | |
| Medio NVIDIA GeForce RTX 4070 Ti (63.8 - 66.2, n=4) | |
| Asus TUF Gaming GeForce RTX 4070 Ti | |
| Gigabyte Aorus GeForce RTX 4070 Ti Master | |
| Medio NVIDIA GeForce RTX 3080 Ti (63.9 - 64.9, n=3) | |
| Medio NVIDIA GeForce RTX 3090 (61.3 - 66, n=5) | |
| AMD Radeon RX 7800 XT | |
| Gigabyte GeForce RTX 4070 Super Gaming OC 12G | |
| NVIDIA GeForce RTX 4070 Super Founders Edition | |
| Medio NVIDIA GeForce RTX 3080 (56.2 - 56.7, n=2) | |
| Zotac Gaming GeForce RTX 4070 AMP Airo | |
| Medio NVIDIA Titan RTX (45.2 - 47.3, n=3) | |
| Sapphire Pulse Radeon RX 7700 XT | |
| KFA2 GeForce RTX 4060 Ti EX, 16GB GDDR6 | |
| Medio NVIDIA GeForce RTX 4060 Ti 8G (34.3 - 37.3, n=3) | |
| XFX Speedster QICK 308 Radeon RX 7600 Black Edition | |
| KFA2 GeForce RTX 4060 1-Click-OC 2X | |
| Control / High Quality Preset | |
| NVIDIA GeForce RTX 4090 Founders Edition | |
| AMD Radeon RX 7900 XTX | |
| AMD Radeon RX 7900 XT | |
| Gigabyte GeForce RTX 4080 Super Gaming OC | |
| Asus TUF Gaming GeForce RTX 4070 Ti | |
| Gigabyte Aorus GeForce RTX 4070 Ti Master | |
| Asus TUF Gaming GeForce RTX 4070 Ti Super | |
| Medio NVIDIA GeForce RTX 3080 Ti (122 - 125.5, n=3) | |
| Medio NVIDIA GeForce RTX 4070 Ti (100 - 130.6, n=4) | |
| Medio NVIDIA GeForce RTX 3090 (115.8 - 123.7, n=5) | |
| AMD Radeon RX 7800 XT | |
| NVIDIA GeForce RTX 4080 Founders Edition | |
| Gigabyte GeForce RTX 4070 Super Gaming OC 12G | |
| NVIDIA GeForce RTX 4070 Super Founders Edition | |
| Medio NVIDIA GeForce RTX 3080 (105 - 106, n=2) | |
| Zotac Gaming GeForce RTX 4070 AMP Airo | |
| Sapphire Pulse Radeon RX 7700 XT | |
| Medio NVIDIA Titan RTX (89 - 93.6, n=3) | |
| Medio NVIDIA GeForce RTX 4060 Ti 8G (69.2 - 75.3, n=3) | |
| KFA2 GeForce RTX 4060 Ti EX, 16GB GDDR6 | |
| XFX Speedster QICK 308 Radeon RX 7600 Black Edition | |
| KFA2 GeForce RTX 4060 1-Click-OC 2X | |
| Control / High Quality Preset | |
| AMD Radeon RX 7900 XTX | |
| NVIDIA GeForce RTX 4090 Founders Edition | |
| AMD Radeon RX 7900 XT | |
| Gigabyte GeForce RTX 4080 Super Gaming OC | |
| Asus TUF Gaming GeForce RTX 4070 Ti | |
| Gigabyte Aorus GeForce RTX 4070 Ti Master | |
| Medio NVIDIA GeForce RTX 4070 Ti (196.6 - 202, n=4) | |
| Asus TUF Gaming GeForce RTX 4070 Ti Super | |
| AMD Radeon RX 7800 XT | |
| Medio NVIDIA GeForce RTX 3080 Ti (181 - 190.7, n=3) | |
| Gigabyte GeForce RTX 4070 Super Gaming OC 12G | |
| Medio NVIDIA GeForce RTX 3090 (172.2 - 189.2, n=5) | |
| NVIDIA GeForce RTX 4070 Super Founders Edition | |
| NVIDIA GeForce RTX 4080 Founders Edition | |
| Zotac Gaming GeForce RTX 4070 AMP Airo | |
| Sapphire Pulse Radeon RX 7700 XT | |
| Medio NVIDIA GeForce RTX 3080 (151 - 155, n=2) | |
| Medio NVIDIA Titan RTX (135 - 141.9, n=3) | |
| Medio NVIDIA GeForce RTX 4060 Ti 8G (115.7 - 120.2, n=3) | |
| KFA2 GeForce RTX 4060 Ti EX, 16GB GDDR6 | |
| XFX Speedster QICK 308 Radeon RX 7600 Black Edition | |
| KFA2 GeForce RTX 4060 1-Click-OC 2X | |
| Borderlands 3 / Badass Overall Quality (DX11) | |
| NVIDIA GeForce RTX 4090 Founders Edition | |
| Gigabyte GeForce RTX 4080 Super Gaming OC | |
| NVIDIA GeForce RTX 4080 Founders Edition | |
| AMD Radeon RX 7900 XTX | |
| Asus TUF Gaming GeForce RTX 4070 Ti Super | |
| Gigabyte Aorus GeForce RTX 4070 Ti Master | |
| AMD Radeon RX 7900 XT | |
| Asus TUF Gaming GeForce RTX 4070 Ti | |
| Medio NVIDIA GeForce RTX 4070 Ti (71.9 - 74.9, n=4) | |
| Medio NVIDIA GeForce RTX 3090 (68 - 75.3, n=13) | |
| Medio NVIDIA GeForce RTX 3080 Ti (71.2 - 74, n=4) | |
| Gigabyte GeForce RTX 4070 Super Gaming OC 12G | |
| NVIDIA GeForce RTX 4070 Super Founders Edition | |
| Medio NVIDIA GeForce RTX 3080 (61.5 - 61.9, n=2) | |
| Zotac Gaming GeForce RTX 4070 AMP Airo | |
| AMD Radeon RX 7800 XT | |
| Sapphire Pulse Radeon RX 7700 XT | |
| Medio NVIDIA Titan RTX (46 - 52.8, n=29) | |
| Medio NVIDIA GeForce RTX 4060 Ti 8G (43.1 - 43.7, n=3) | |
| KFA2 GeForce RTX 4060 Ti EX, 16GB GDDR6 | |
| XFX Speedster QICK 308 Radeon RX 7600 Black Edition | |
| KFA2 GeForce RTX 4060 1-Click-OC 2X | |
| Borderlands 3 / Badass Overall Quality (DX11) | |
| NVIDIA GeForce RTX 4090 Founders Edition | |
| Gigabyte GeForce RTX 4080 Super Gaming OC | |
| NVIDIA GeForce RTX 4080 Founders Edition | |
| AMD Radeon RX 7900 XTX | |
| Asus TUF Gaming GeForce RTX 4070 Ti Super | |
| Gigabyte Aorus GeForce RTX 4070 Ti Master | |
| Asus TUF Gaming GeForce RTX 4070 Ti | |
| Medio NVIDIA GeForce RTX 4070 Ti (134.3 - 142, n=4) | |
| AMD Radeon RX 7900 XT | |
| Gigabyte GeForce RTX 4070 Super Gaming OC 12G | |
| NVIDIA GeForce RTX 4070 Super Founders Edition | |
| Medio NVIDIA GeForce RTX 3080 Ti (114 - 130.2, n=4) | |
| Medio NVIDIA GeForce RTX 3090 (105 - 131.6, n=13) | |
| Zotac Gaming GeForce RTX 4070 AMP Airo | |
| AMD Radeon RX 7800 XT | |
| Medio NVIDIA GeForce RTX 3080 (95.7 - 103, n=2) | |
| Sapphire Pulse Radeon RX 7700 XT | |
| Medio NVIDIA Titan RTX (74 - 93.1, n=29) | |
| Medio NVIDIA GeForce RTX 4060 Ti 8G (83.9 - 85.2, n=3) | |
| KFA2 GeForce RTX 4060 Ti EX, 16GB GDDR6 | |
| XFX Speedster QICK 308 Radeon RX 7600 Black Edition | |
| KFA2 GeForce RTX 4060 1-Click-OC 2X | |
| Borderlands 3 / Badass Overall Quality (DX11) | |
| NVIDIA GeForce RTX 4090 Founders Edition | |
| Asus TUF Gaming GeForce RTX 4070 Ti | |
| Gigabyte GeForce RTX 4080 Super Gaming OC | |
| Gigabyte Aorus GeForce RTX 4070 Ti Master | |
| AMD Radeon RX 7900 XTX | |
| Medio NVIDIA GeForce RTX 4070 Ti (171.4 - 186.9, n=4) | |
| NVIDIA GeForce RTX 4080 Founders Edition | |
| Asus TUF Gaming GeForce RTX 4070 Ti Super | |
| AMD Radeon RX 7900 XT | |
| Gigabyte GeForce RTX 4070 Super Gaming OC 12G | |
| NVIDIA GeForce RTX 4070 Super Founders Edition | |
| Zotac Gaming GeForce RTX 4070 AMP Airo | |
| Medio NVIDIA GeForce RTX 3080 Ti (129 - 164.9, n=4) | |
| Medio NVIDIA GeForce RTX 3090 (117 - 170.1, n=13) | |
| AMD Radeon RX 7800 XT | |
| Sapphire Pulse Radeon RX 7700 XT | |
| Medio NVIDIA GeForce RTX 3080 (117 - 128, n=2) | |
| Medio NVIDIA GeForce RTX 4060 Ti 8G (121.5 - 123.5, n=3) | |
| KFA2 GeForce RTX 4060 Ti EX, 16GB GDDR6 | |
| Medio NVIDIA Titan RTX (77.2 - 128.7, n=29) | |
| XFX Speedster QICK 308 Radeon RX 7600 Black Edition | |
| KFA2 GeForce RTX 4060 1-Click-OC 2X | |
| Shadow of the Tomb Raider / Highest Preset | |
| NVIDIA GeForce RTX 4090 Founders Edition | |
| AMD Radeon RX 7900 XTX | |
| Gigabyte GeForce RTX 4080 Super Gaming OC | |
| NVIDIA GeForce RTX 4080 Founders Edition | |
| AMD Radeon RX 7900 XT | |
| Asus TUF Gaming GeForce RTX 4070 Ti Super | |
| Gigabyte Aorus GeForce RTX 4070 Ti Master | |
| Asus TUF Gaming GeForce RTX 4070 Ti | |
| Medio NVIDIA GeForce RTX 4070 Ti (102.7 - 104.9, n=4) | |
| Gigabyte GeForce RTX 4070 Super Gaming OC 12G | |
| Medio NVIDIA GeForce RTX 3090 (89.3 - 99.7, n=12) | |
| Medio NVIDIA GeForce RTX 3080 Ti (93 - 98.6, n=3) | |
| NVIDIA GeForce RTX 4070 Super Founders Edition | |
| Medio NVIDIA GeForce RTX 3080 (83.9 - 87.9, n=2) | |
| Zotac Gaming GeForce RTX 4070 AMP Airo | |
| AMD Radeon RX 7800 XT | |
| Medio NVIDIA Titan RTX (59 - 71.1, n=24) | |
| Sapphire Pulse Radeon RX 7700 XT | |
| KFA2 GeForce RTX 4060 Ti EX, 16GB GDDR6 | |
| Medio NVIDIA GeForce RTX 4060 Ti 8G (58.1 - 58.7, n=3) | |
| KFA2 GeForce RTX 4060 1-Click-OC 2X | |
| XFX Speedster QICK 308 Radeon RX 7600 Black Edition | |
| Shadow of the Tomb Raider / Highest Preset | |
| NVIDIA GeForce RTX 4090 Founders Edition | |
| AMD Radeon RX 7900 XTX | |
| Gigabyte GeForce RTX 4080 Super Gaming OC | |
| Asus TUF Gaming GeForce RTX 4070 Ti Super | |
| Gigabyte Aorus GeForce RTX 4070 Ti Master | |
| AMD Radeon RX 7900 XT | |
| Asus TUF Gaming GeForce RTX 4070 Ti | |
| Medio NVIDIA GeForce RTX 4070 Ti (195.9 - 204, n=4) | |
| NVIDIA GeForce RTX 4080 Founders Edition | |
| Gigabyte GeForce RTX 4070 Super Gaming OC 12G | |
| Medio NVIDIA GeForce RTX 3090 (137 - 172.3, n=12) | |
| NVIDIA GeForce RTX 4070 Super Founders Edition | |
| Medio NVIDIA GeForce RTX 3080 Ti (157 - 173.3, n=3) | |
| Zotac Gaming GeForce RTX 4070 AMP Airo | |
| AMD Radeon RX 7800 XT | |
| Medio NVIDIA GeForce RTX 3080 (147 - 152, n=2) | |
| Sapphire Pulse Radeon RX 7700 XT | |
| Medio NVIDIA GeForce RTX 4060 Ti 8G (119.3 - 121.2, n=3) | |
| KFA2 GeForce RTX 4060 Ti EX, 16GB GDDR6 | |
| Medio NVIDIA Titan RTX (98 - 128, n=23) | |
| KFA2 GeForce RTX 4060 1-Click-OC 2X | |
| XFX Speedster QICK 308 Radeon RX 7600 Black Edition | |
| Shadow of the Tomb Raider / Highest Preset | |
| NVIDIA GeForce RTX 4090 Founders Edition | |
| AMD Radeon RX 7900 XTX | |
| AMD Radeon RX 7900 XT | |
| Asus TUF Gaming GeForce RTX 4070 Ti | |
| Gigabyte Aorus GeForce RTX 4070 Ti Master | |
| Medio NVIDIA GeForce RTX 4070 Ti (263 - 280, n=4) | |
| Gigabyte GeForce RTX 4080 Super Gaming OC | |
| Asus TUF Gaming GeForce RTX 4070 Ti Super | |
| Gigabyte GeForce RTX 4070 Super Gaming OC 12G | |
| NVIDIA GeForce RTX 4070 Super Founders Edition | |
| Zotac Gaming GeForce RTX 4070 AMP Airo | |
| NVIDIA GeForce RTX 4080 Founders Edition | |
| AMD Radeon RX 7800 XT | |
| Medio NVIDIA GeForce RTX 3080 Ti (178 - 238, n=3) | |
| Medio NVIDIA GeForce RTX 3090 (145 - 240, n=14) | |
| Sapphire Pulse Radeon RX 7700 XT | |
| KFA2 GeForce RTX 4060 Ti EX, 16GB GDDR6 | |
| Medio NVIDIA GeForce RTX 4060 Ti 8G (181.6 - 184, n=3) | |
| Medio NVIDIA GeForce RTX 3080 (177 - 185, n=2) | |
| Medio NVIDIA Titan RTX (106 - 178.8, n=24) | |
| KFA2 GeForce RTX 4060 1-Click-OC 2X | |
| XFX Speedster QICK 308 Radeon RX 7600 Black Edition | |
The Witcher 3: 3840x2160 Ultra Graphics & Postprocessing (HBAO+) | 3840x2160 High Graphics & Postprocessing (Nvidia HairWorks Off) | 1920x1080 Ultra Graphics & Postprocessing (HBAO+)
Metro Exodus: 3840x2160 Ultra Quality AF:16x | 2560x1440 Ultra Quality AF:16x | 1920x1080 Ultra Quality AF:16x
Control: 3840x2160 High Quality Preset | 2560x1440 High Quality Preset | 1920x1080 High Quality Preset
Borderlands 3: 3840x2160 Badass Overall Quality (DX11) | 2560x1440 Badass Overall Quality (DX11) | 1920x1080 Badass Overall Quality (DX11)
Shadow of the Tomb Raider: 3840x2160 Highest Preset AA:T | 2560x1440 Highest Preset AA:T | 1920x1080 Highest Preset AA:T
F1 22: 3840x2160 Ultra High Preset AA:T AF:16x | 2560x1440 Ultra High Preset AA:T AF:16x | 1920x1080 Ultra High Preset AA:T AF:16x
Final Fantasy XV Benchmark: 3840x2160 High Quality | 2560x1440 High Quality | 1920x1080 High Quality
Rendimiento del trazado de rayos
Juegos como Metro Exodus (edición no mejorada), Controly Far Cry 6 vemos que la RX 7900 XTX consigue superar por poco a la RTX 4080 Super Gaming OC en trazado de rayos nativo a 1080p Ultra.
Dicho esto, la RTX 4080 Super Gaming OC consigue una ventaja de entre el 3 y el 17% sobre la RTX 4080 FE en trazado de rayos de res nativa.
| Alan Wake 2 | |
| 3840x2160 High Preset + High Ray Tracing + Quality DLSS + FG | |
| Media de la clase Desktop (26.2 - 152.7, n=18, últimos 2 años) | |
| Gigabyte GeForce RTX 4080 Super Gaming OC | |
| NVIDIA GeForce RTX 4080 Founders Edition | |
| Asus TUF Gaming GeForce RTX 4070 Ti Super | |
| Medio NVIDIA GeForce RTX 4070 Ti (n=1) | |
| Gigabyte GeForce RTX 4070 Super Gaming OC 12G | |
| NVIDIA GeForce RTX 4070 Super Founders Edition | |
| Medio NVIDIA GeForce RTX 4060 Ti 8G (n=1) | |
| 1920x1080 High Preset + High Ray Tracing | |
| Gigabyte GeForce RTX 4080 Super Gaming OC | |
| Asus TUF Gaming GeForce RTX 4070 Ti Super | |
| NVIDIA GeForce RTX 4080 Founders Edition | |
| Medio NVIDIA GeForce RTX 4070 Ti (n=1) | |
| Media de la clase Desktop (23.8 - 132.2, n=28, últimos 2 años) | |
| Gigabyte GeForce RTX 4070 Super Gaming OC 12G | |
| NVIDIA GeForce RTX 4070 Super Founders Edition | |
| Medio NVIDIA GeForce RTX 3090 (44.6 - 52, n=3) | |
| Medio NVIDIA GeForce RTX 4060 Ti 8G (n=1) | |
| Medio NVIDIA Titan RTX (n=1) | |
| Sapphire Pulse Radeon RX 7700 XT | |
| XFX Speedster QICK 308 Radeon RX 7600 Black Edition | |
| bajo | medio | alto | ultra | QHD | 4K DLSS | 4K FSR | 4K | |
|---|---|---|---|---|---|---|---|---|
| GTA V (2015) | 188.2 | 188 | 186.9 | 165.4 | 164.6 | 163.6 | ||
| The Witcher 3 (2015) | 470 | 241 | 196.2 | 186.4 | ||||
| Dota 2 Reborn (2015) | 273 | 245 | 236 | 222 | 214 | |||
| Final Fantasy XV Benchmark (2018) | 235 | 236 | 225 | 193.5 | 117.8 | |||
| X-Plane 11.11 (2018) | 236 | 207 | 154.9 | 132.2 | ||||
| Far Cry 5 (2018) | 206 | 202 | 193 | 134 | ||||
| Strange Brigade (2018) | 626 | 519 | 501 | 480 | 389 | 197.3 | ||
| Shadow of the Tomb Raider (2018) | 271 | 262 | 224 | 127.5 | ||||
| Metro Exodus (2019) | 203 | 169.4 | 144.9 | 97.7 | ||||
| Control (2019) | 221 | 206 | 145 | 86.4 | 76.5 | |||
| Borderlands 3 (2019) | 184.4 | 186.3 | 161.6 | 97.6 | ||||
| Mafia Definitive Edition (2020) | 248 | 232 | 202 | 111.4 | ||||
| Watch Dogs Legion (2020) | 149 | 144.5 | 127 | 80.5 | ||||
| Far Cry 6 (2021) | 212 | 194.4 | 179.8 | 162.8 | 99.3 | |||
| Dying Light 2 (2022) | 217 | 165.9 | 123.7 | 65 | ||||
| Cyberpunk 2077 1.6 (2022) | 209 | 208 | 198.4 | 187.8 | 127.9 | 63 | ||
| Ghostwire Tokyo (2022) | 299 | 298 | 247 | 120 | ||||
| F1 22 (2022) | 368 | 166.4 | 112.9 | 59.2 | ||||
| F1 23 (2023) | 393 | 165.4 | 108.3 | 94.5 | 54.5 | |||
| Baldur's Gate 3 (2023) | 245 | 237 | 232 | 186.8 | 160.7 | 97.6 | ||
| Cyberpunk 2077 (2023) | 197.5 | 198.3 | 186.9 | 173.8 | 121.7 | 55.6 | ||
| Assassin's Creed Mirage (2023) | 243 | 191 | 158 | 135 | 101 | |||
| Alan Wake 2 (2023) | 130.1 | 122.4 | 90.1 | 77.6 | 53.5 | |||
| Avatar Frontiers of Pandora (2023) | 158.9 | 128.8 | 90.1 | 81.1 | 48.4 | |||
| Skull & Bones (2024) | 205 | 172 | 137 | 114 | 105 | 101 | 78 |
Emisiones: Mayor ruido pero un rendimiento relativamente libre de aceleración bajo estrés
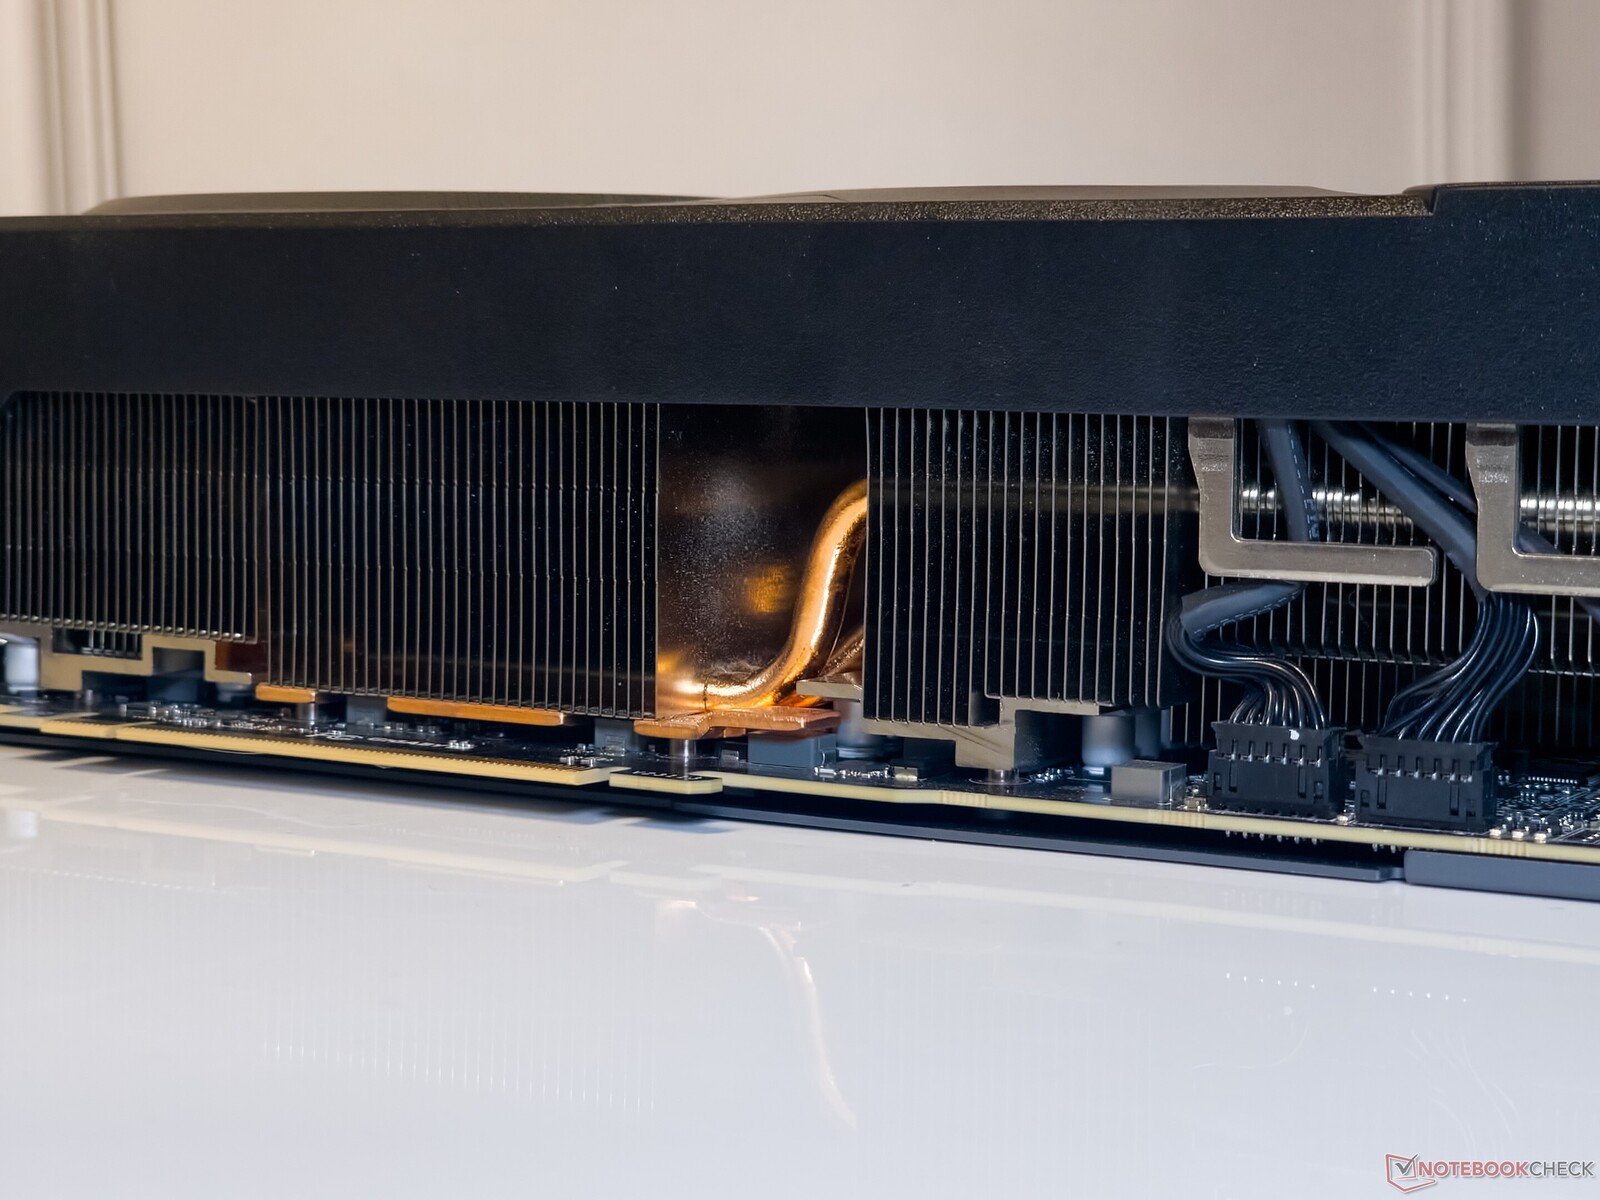
La RTX 4080 Super Gaming OC aprovecha el sistema de refrigeración WindForce de Gigabyte que consta de tres ventiladores de 110 mm de giro alternativo y nueve heatpipes junto con una placa de cobre de contacto directo.
Según Gigabyte, los ventiladores con cojinetes de manguito utilizan un nano lubricante de grafeno que supuestamente ayuda a prolongar la vida útil de forma similar a los ventiladores con cojinetes de doble bola.
La placa posterior metálica presenta un gran recorte para la salida de aire que es, de hecho, una extensión del disipador.
Pruebas de estrés
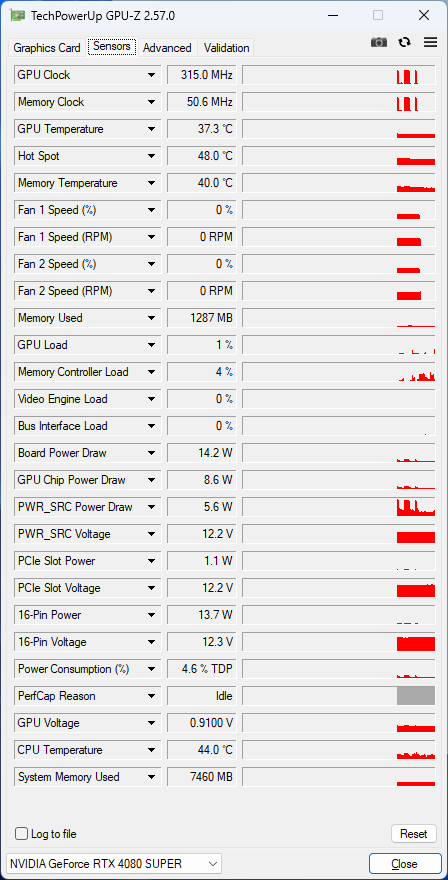
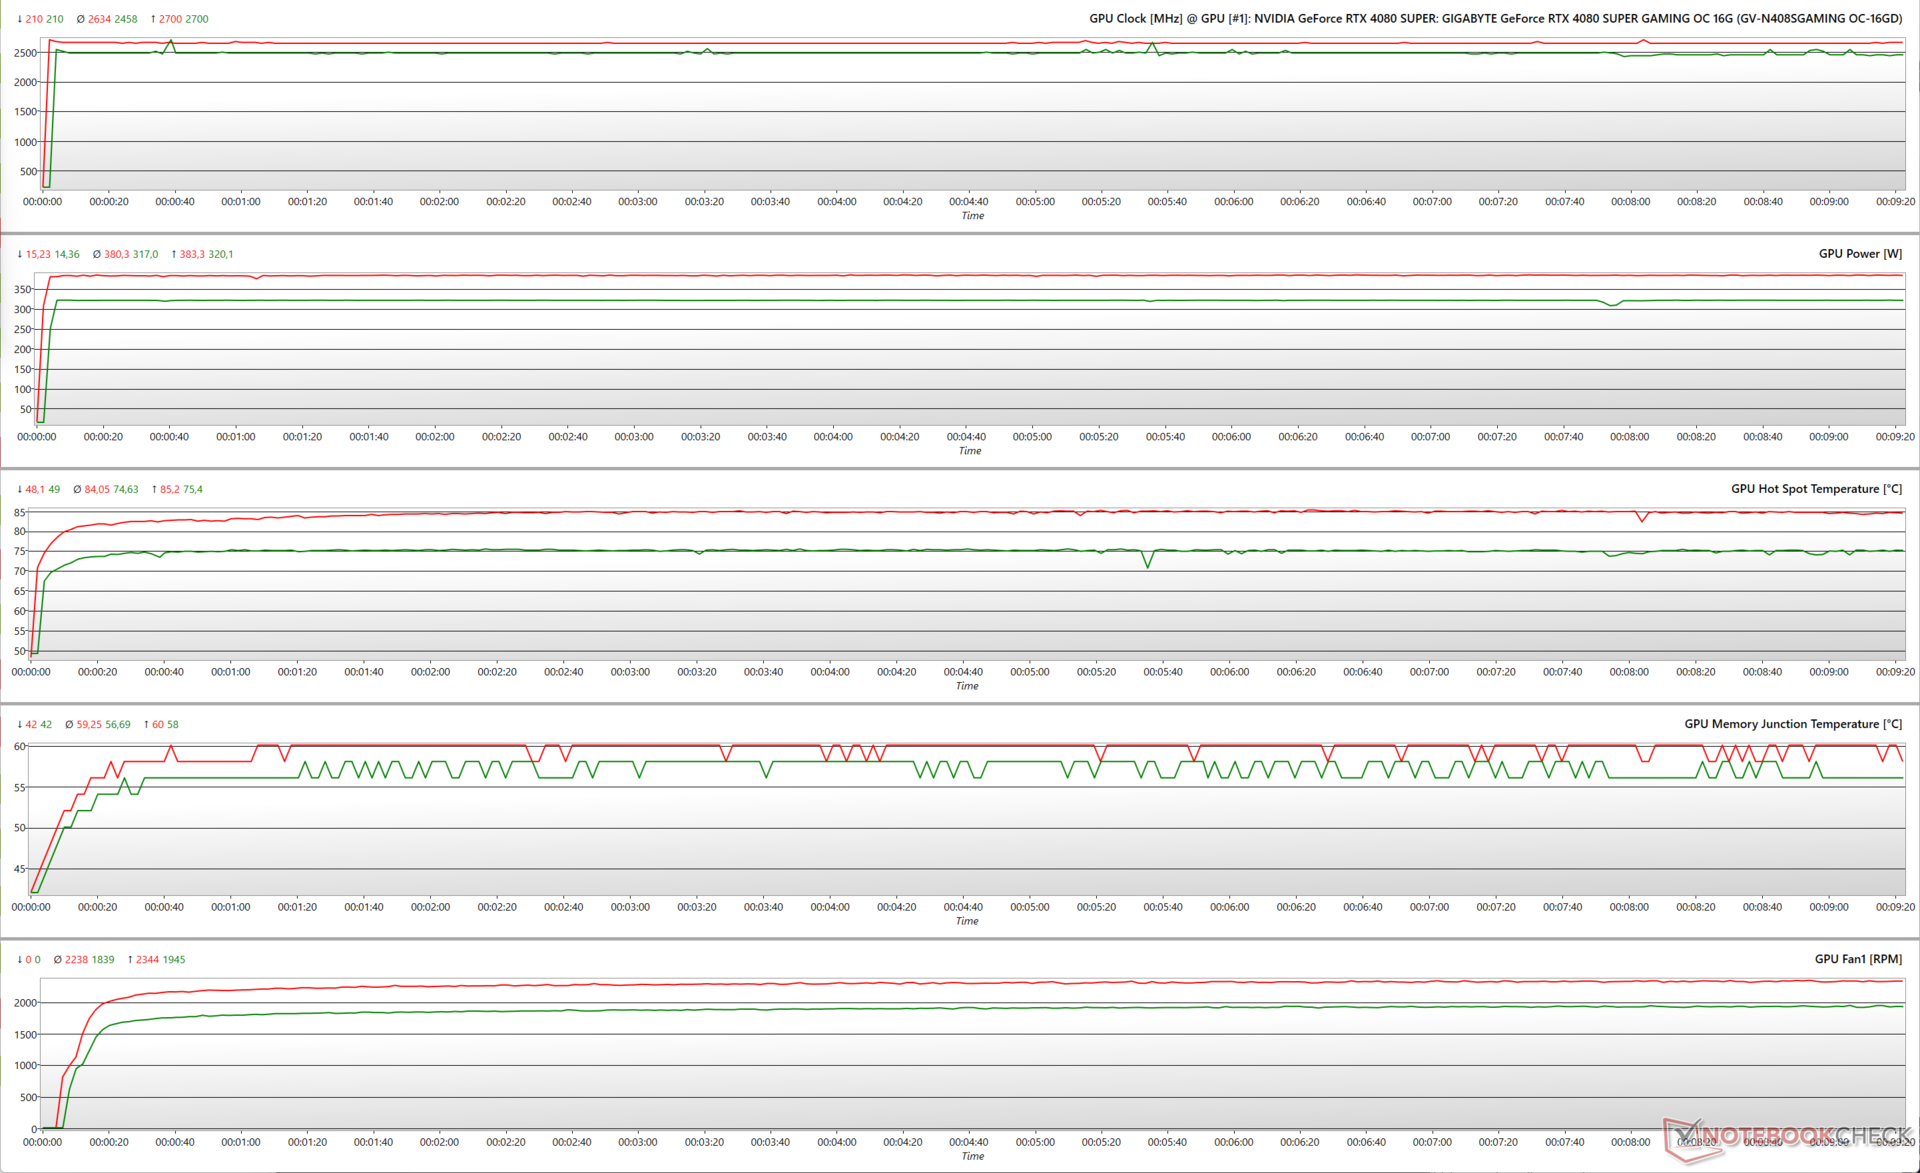
Estresando la RTX 4080 Super Gaming OC con FurMark (1.280 x 720, sin AA) se ve cómo la GPU utiliza los 320 W TGP disponibles a un objetivo de potencia (PT) del 100%. Esto da como resultado un boost clock medio de 2.458 MHz y temperaturas de hotspot cercanas a la marca de los 75 °C.
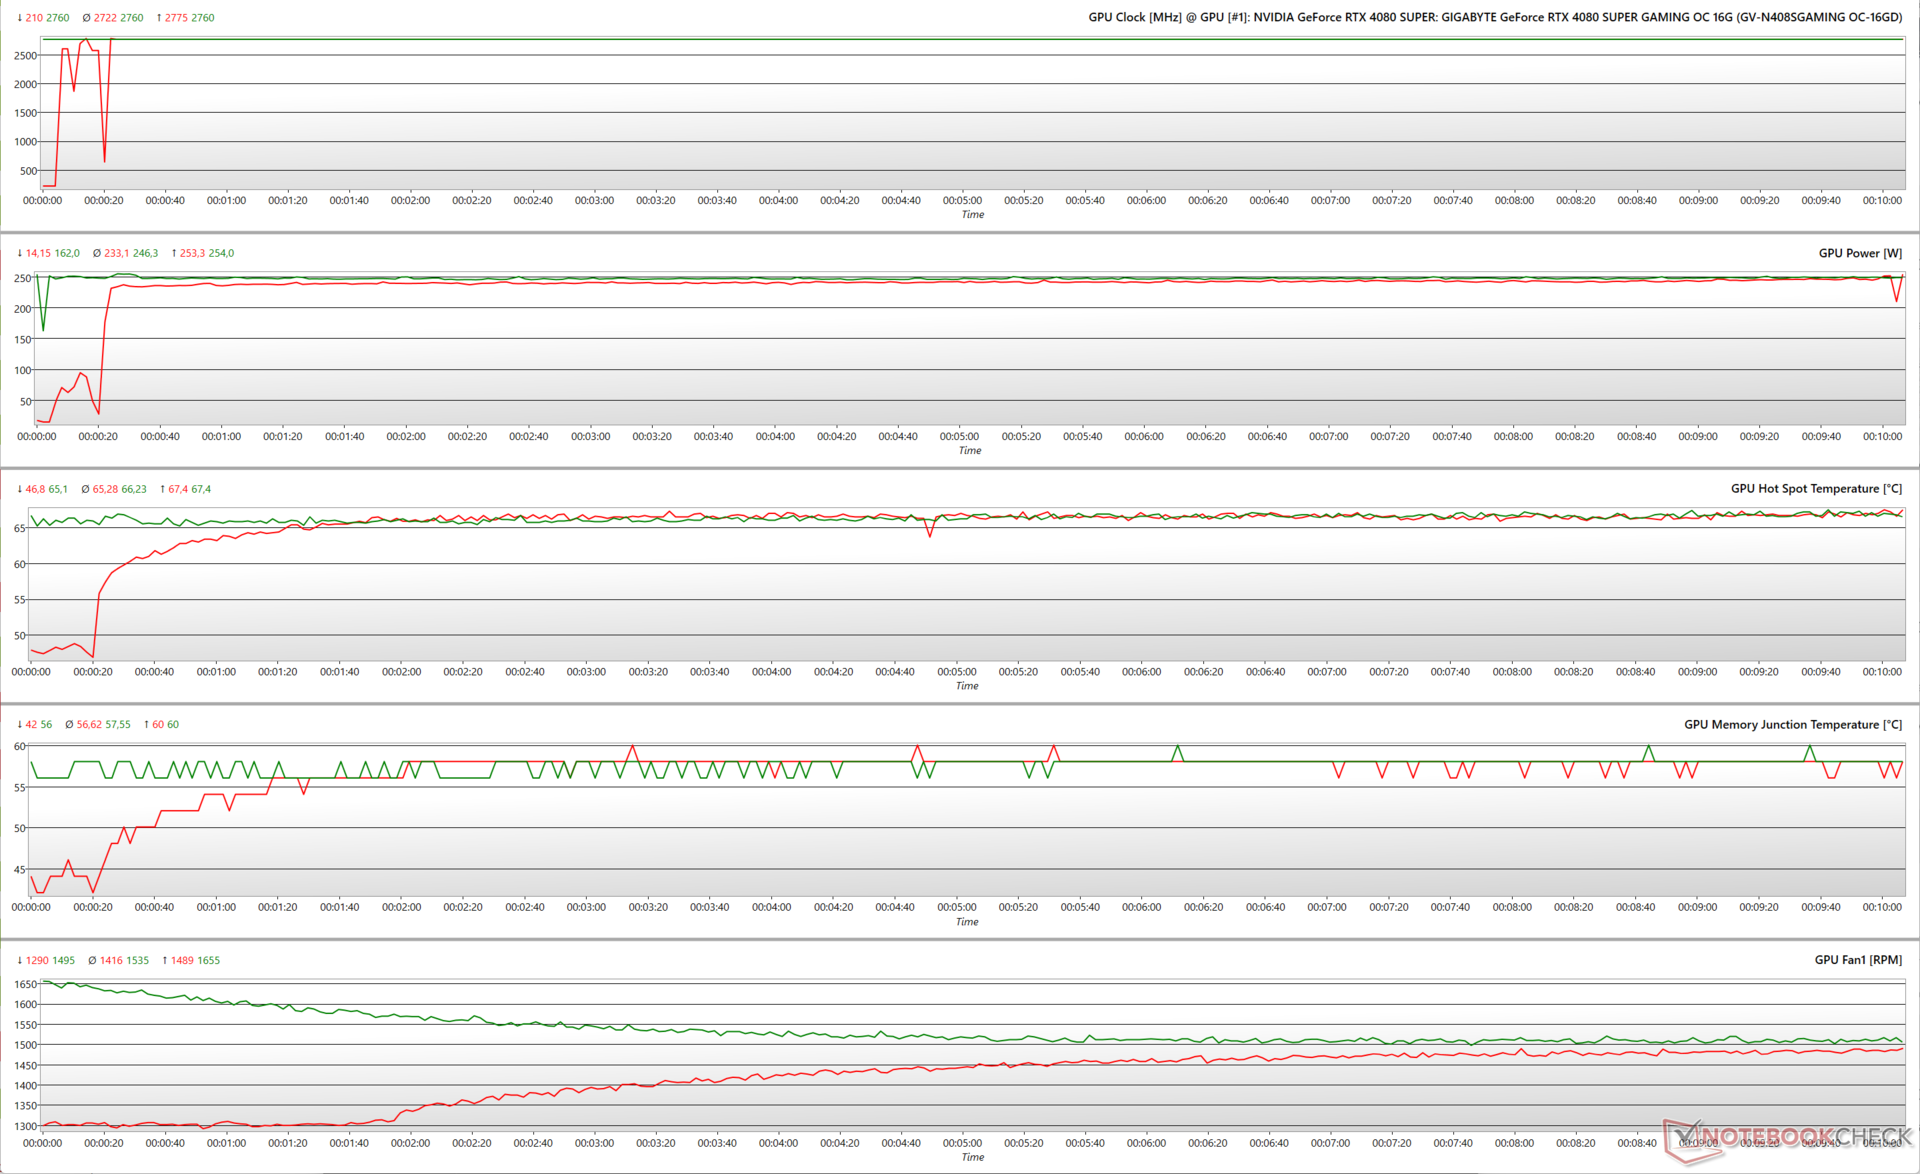
A un PT del 125%, la GPU sólo es capaz de hacer uso de 383 W de los 400 W teóricamente disponibles. Esto también se observó anteriormente con la RTX 4070 Super Gaming OC.
Vemos que la GPU alcanza frecuencias de reloj medias de 2.634 MHz, con la correspondiente subida de la temperatura del punto caliente hasta los 84 °C.
Cuando se ejecuta El Witcher 3 a 1080p Ultra, la RTX 4080 Super Gaming OC consigue mantener un reloj constante de 2.760 MHz al 100% PT mientras consume 254 W.
Como es habitual en las tarjetas Ada, aumentar el objetivo de potencia en cargas de trabajo de juego no confiere beneficios aparentes. Parámetros como la velocidad de reloj, el consumo de energía y las temperaturas de los puntos calientes son idénticos en la tensión de Witcher 3 incluso al 125% PT.
La tabla de FPS de Witcher 3
El sistema de refrigeración WindForce de Gigabyte parece funcionar bien para aliviar cualquier preocupación de ralentización. No observamos ninguna caída en los fotogramas durante las pruebas de estrés con The Witcher 3 a 1080p Ultra y 4K Ultra.
Temperaturas superficiales
Las temperaturas de la superficie bajo carga son tolerables en su mayor parte. A una temperatura ambiente de 23 °C, la cubierta de plástico frontal se mantiene relativamente fría a 28,5 °C, mientras que el panel trasero metálico roza los 48 °C.
La región cercana al conector 12VHPWR también se calienta bastante, alcanzando los 50 °C.


Niveles de ruido
La RTX 4080 Super Gaming OC tiene un perfil de ruido más alto en comparación con lo que hemos observado anteriormente con la RTX 4070 Super Gaming OC.
Dicho esto, los ventiladores se detienen por completo en ralentí y empiezan a acelerarse sólo cuando las temperaturas del núcleo rozan la marca de los 55 °C, según la curva de ventiladores predeterminada.
Los usuarios pueden seleccionar entre los modos BIOS OC y Silent VBIOS, pero no observamos diferencias significativas entre ambos durante las pruebas. En realidad, el interruptor VBIOS parece redundante, ya que puede ajustar fácilmente las curvas de los ventiladores a su gusto en la aplicación Gigabyte Control Center.
No obstante, registramos un nivel máximo de presión sonora (SPL) de 54,21 dB(A) mientras estresábamos la GPU con FurMark en el modo OC de la BIOS a un PT del 125%.
Los niveles de ruido mientras jugábamos con The Witcher 3 a 1080p Ultra se mantuvieron por debajo de 50 dB(A) SPL en todos los modos probados.
| Prueba de esfuerzo | Modo VBIOS/ Objetivo de potencia | Máx. Velocidad del ventilador (RPM) | Ruido del ventilador dB(A) |
| FurMark 1280 x 720, sin AA | BIOS OC / 100% | 1.937 | 49,37 |
| FurMark 1280 x 720, sin AA | BIOS silencioso / 100% | 1.997 | 50,09 |
| FurMark 1280 x 720, sin AA | BIOS OC / 125% | 2.326 | 54,21 |
| FurMark 1280 x 720, sin AA | BIOS silenciosa / 125% | 2.302 | 54,10 |
| El Witcher 3 1080p Ultra | BIOS OC / 100% | 1.814 | 48,24 |
| La Witcher 3 1080p Ultra | BIOS silenciosa / 100% | 1.801 | 48,66 |
| El Witcher 3 1080p Ultra | BIOS OC / 125% | 1.866 | 49,29 |
| La Witcher 3 1080p Ultra | BIOS silenciosa / 125% | 1.813 | 49,13 |
Gestión de la energía: Comparable a la RTX 4080 FE al 100% PT
La RTX 4080 Super Gaming OC no es la más frugal en lo que respecta al consumo de energía dado el potente die AD103, pero sigue siendo un 20% más económica en comparación con la RX 7900 XTX.
El consumo de energía de la tarjeta Gigabyte durante las pruebas FurMark y The Witcher 3 es comparable al de la RTX 4080 FE a un PT del 100%, aunque es un 6% menos eficiente que esta última.
El consumo de energía mientras se juega a The Witcher 3 a 1080p Ultra es sólo ligeramente superior al pasar del 100% al 125% PT, frente a un delta más perceptible del 15% en FurMark.
Power Consumption: External monitor
| 1280x720 FurMark 1.19 GPU Stress Test (external Monitor) | |
| 1920x1080 The Witcher 3 ultra (external Monitor) | |
* ... más pequeño es mejor
Pro
Contra
Veredicto: Ganancias incrementales con el AD103 completo a un PVPR reducido

La Gigabyte GeForce RTX 4080 Super Gaming OC 16G sustituye totalmente a su predecesora RTX 4080 por un precio de venta más bajo, al tiempo que ofrece un 5% más de shaders, un aumento nominal de 45 MHz y una memoria ligeramente más rápida. Gigabyte ha conservado todos los aspectos familiares de la variante de última generación: un diseño de tres ranuras, una configuración WindForce de triple ventilador con nueve heatpipes y un RGB decente.
En general, la tarjeta de Gigabyte consigue situarse por delante de la RTX 4080 Founders Edition en síntesis, en correspondencia con el aumento de los recuentos de sombreadores. Los deltas fueron sorprendentemente más amplios en las pruebas de juegos, pero las ganancias exactas, si las hay, dependerán del propio juego y de la resolución a la que se esté jugando.
La RTX 4090 Founders Edition (1.599 dólares en Best Buy) sigue liderando las listas, y Nvidia tiene pocos incentivos para lanzar una RTX 4090 Ti o Super, ya que el Equipo Rojo parece indiferente ante cualquier intento de perturbar el statu quo del buque insignia.
La Gigabyte RTX 4080 Super Gaming OC 16G ofrece un gran rendimiento en juegos 4K que sólo mejora con la compatibilidad con las nuevas tecnologías DLSS. El aumento de 50 dólares con respecto a la RTX 4080 Super FE no es del todo un desperdicio, pero la AMD Radeon RX 7900 XTX es una oferta igualmente competente si lo que busca es ahorrarse un poco más de pasta"
Nvidia parece haber jugado bien sus cartas (valga el juego de palabras) al rebajar el PVPR de la RTX 4080 FE en 200 dólares. Lo ideal habría sido que este fuera el precio en el mismo 2022, pero pasó un poco de tiempo hasta que llegó la AMD Radeon RX 7900 XTX (a partir de 926 dólares en Amazon) para ofrecer cualquier atisbo de competencia.
Ambas tarjetas son magníficas para juegos a 1440p de alta tasa de refresco y 4K nativo a 60 fps, pero la RX 7900 XTX parece ser una mejor apuesta en general en términos de relación calidad-precio en este segmento.
Sin embargo, la RTX 4080 Super Gaming OC viene con ventajas que sólo las tarjetas Nvidia pueden ofrecer en este momento. Entre ellas, un mejor rendimiento general del trazado de rayos, junto con la compatibilidad con las tecnologías de generación de fotogramas DLSS 3 y de reconstrucción de rayos DLSS 3.5, y una eficiencia energética enormemente mejorada.
Gigabyte ofrece un conjunto de características decente por el sobreprecio de 50 dólares, como un refrigerador muy capaz, doble conmutador VBIOS, buena estética, soportes para evitar el hundimiento de la GPU y una garantía de cuatro años.
Pero, ¿tiene sentido soltar mil dólares en una GPU nueva a estas alturas? Puede que no. La RTX 4070 Super (a partir de 600 dólares en Amazon) ya es capaz de jugar a 4K de forma decente con algo de ayuda en el escalado, y puede que sea prudente esperar a ver qué ofrecen las próximas GPU Nvidia Blackwell y AMD RDNA 4 a finales de este año.
La RTX 4080 original no Super está oficialmente EoL'd, pero no es mala idea buscar algunas gangas en su mercado local.
Precio y disponibilidad
La Gigabyte GeForce RTX 4080 Super Gaming OC 16G tiene un precio oficial de 1.050 dólares MSRP, pero actualmente se vende por 1.100 dólares tanto en Amazon US como en Best Buy US.
La tarjeta aún no aparece en Amazon India, pero los precios en las tiendas minoristas locales pueden oscilar entre ₹1.20.000 y ₹1.28.000.
Transparencia
La selección de los dispositivos que se van a reseñar corre a cargo de nuestro equipo editorial. La muestra de prueba fue proporcionada al autor en calidad de préstamo por el fabricante o el minorista a los efectos de esta reseña. El prestamista no tuvo ninguna influencia en esta reseña, ni el fabricante recibió una copia de la misma antes de su publicación. No había ninguna obligación de publicar esta reseña. Como empresa de medios independiente, Notebookcheck no está sujeta a la autoridad de fabricantes, minoristas o editores.
Así es como prueba Notebookcheck
Cada año, Notebookcheck revisa de forma independiente cientos de portátiles y smartphones utilizando procedimientos estandarizados para asegurar que todos los resultados son comparables. Hemos desarrollado continuamente nuestros métodos de prueba durante unos 20 años y hemos establecido los estándares de la industria en el proceso. En nuestros laboratorios de pruebas, técnicos y editores experimentados utilizan equipos de medición de alta calidad. Estas pruebas implican un proceso de validación en varias fases. Nuestro complejo sistema de clasificación se basa en cientos de mediciones y puntos de referencia bien fundamentados, lo que mantiene la objetividad.Price comparison

