Revisión del MSI WE76: La estación de trabajo móvil apuesta por el máximo rendimiento

MSI ha vendido sus portátiles para juegos con ligeras modificaciones como estaciones de trabajo móviles en el pasado. Dado que los portátiles para juegos también están diseñados para un alto rendimiento, este movimiento tiene sentido. El nuevo MSI WE76 se basa en el MSI GE76, que ya analizamos. Pero en lugar de las unidades gráficas de consumo GeForce, el WE76 utiliza las nuevas GPUs profesionales RTX A de Nvidia, proporcionando las certificaciones para el software profesional también.
Nuestra unidad de análisis es la variante de gama alta WE76 11UM-456 que cuesta 4,799 Euros (~$5,419) y está equipada con el Procesador Core i9-11980HKy la GPU profesional GPU RTX A500032 GB de RAM, un SSD PCIe 4.0 de 2 TB y un panel 4K mate con cobertura AdobeRGB completa. También está el modelo alternativo WE76 11UK-464 que viene con el Core i7-11800Hy elRTX A3000y un SSD más pequeño de 1 TB por 3.099 euros.
Possible contenders in comparison
Valoración | Fecha | Modelo | Peso | Altura | Tamaño | Resolución | Precio |
|---|---|---|---|---|---|---|---|
| 88.6 % v7 (old) | 12/2021 | MSI WE76 11UM-456 i9-11980HK, RTX A5000 Laptop GPU | 2.9 kg | 25.9 mm | 17.30" | 3840x2160 | |
| 89.8 % v7 (old) | 11/2021 | Lenovo ThinkPad P1 G4-20Y4S0KS00 i7-11850H, GeForce RTX 3070 Laptop GPU | 2 kg | 17.7 mm | 16.00" | 3840x2400 | |
| 90.3 % v7 (old) | 10/2021 | HP ZBook Fury 15 G8 i9-11950H, RTX A5000 Laptop GPU | 2.5 kg | 25.9 mm | 15.60" | 3840x2160 | |
v (old) | 12/2021 | Asus ProArt StudioBook 16 W7600H5A-2BL2 W-11955M, RTX A5000 Laptop GPU | 2.4 kg | 21.4 mm | 16.00" | 3840x2400 | |
| 87.8 % v7 (old) | 10/2021 | Lenovo ThinkPad P17 G2-20YU0025G i7-11800H, RTX A2000 Laptop GPU | 3.6 kg | 28.38 mm | 17.30" | 1920x1080 | |
| 89.8 % v7 (old) | 04/2021 | HP ZBook Fury 17 G7 119W5EA i9-10885H, Quadro RTX 4000 Max-Q | 2.9 kg | 26.9 mm | 17.30" | 3840x2160 |
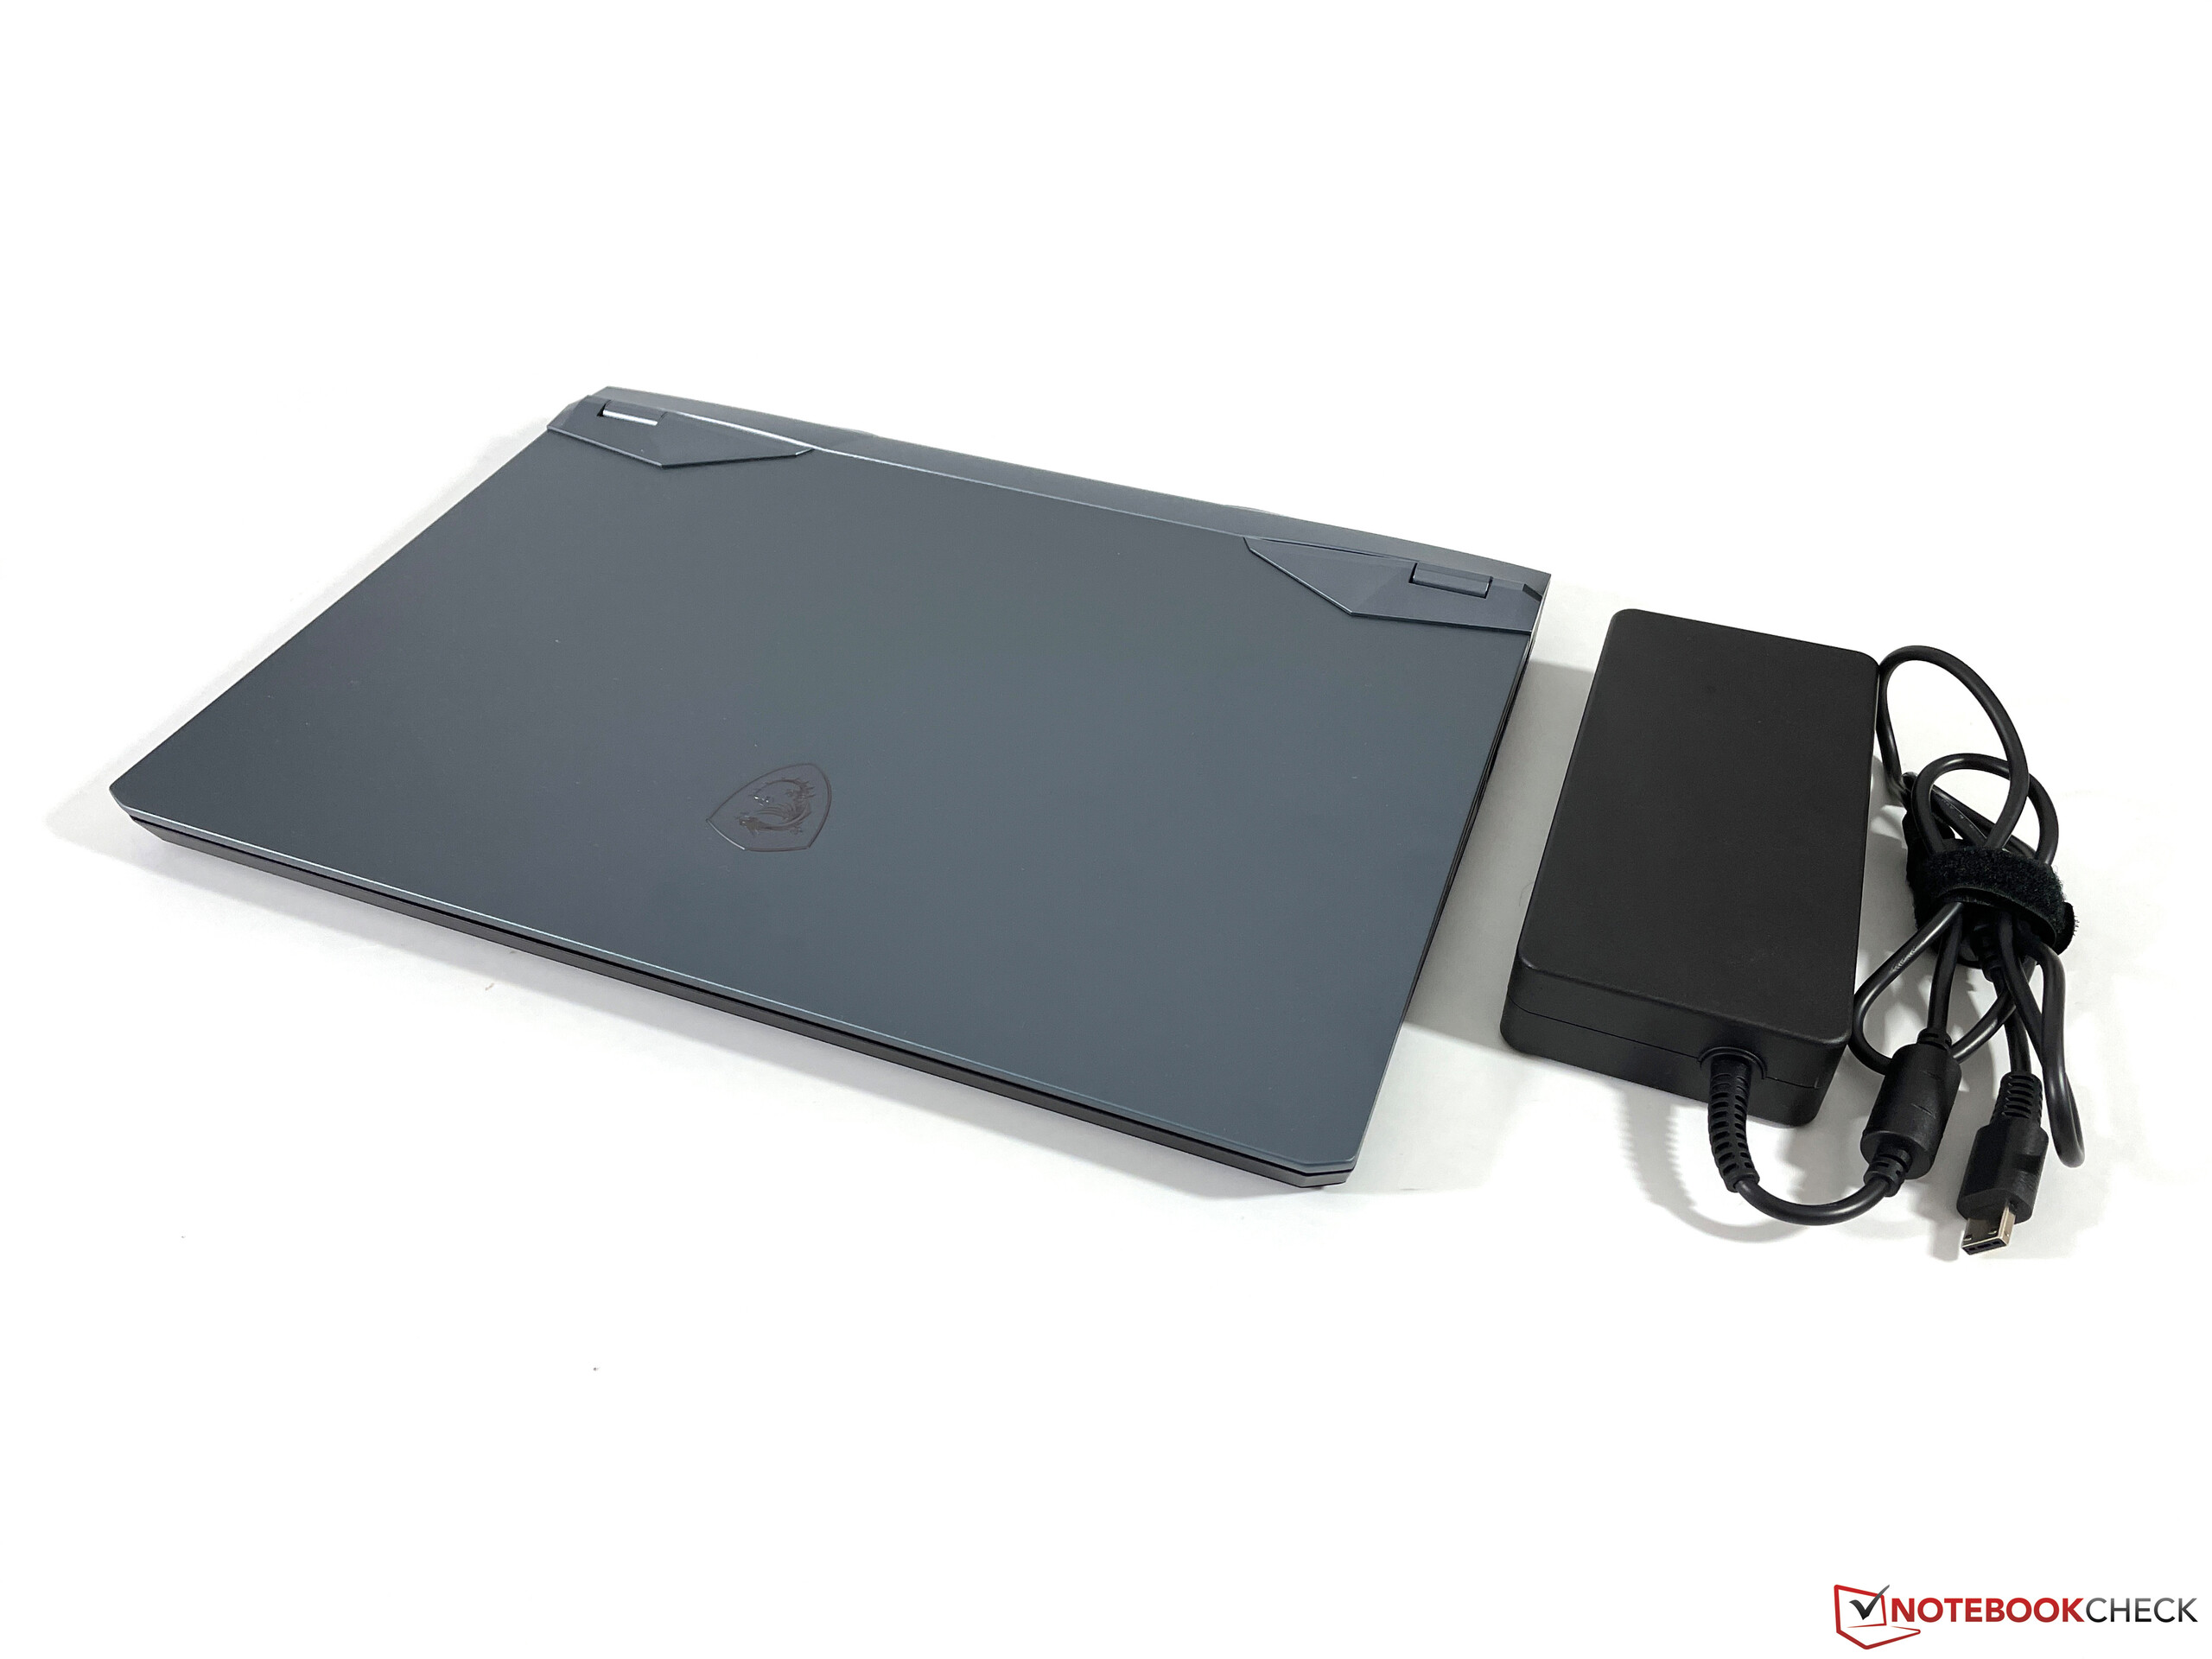
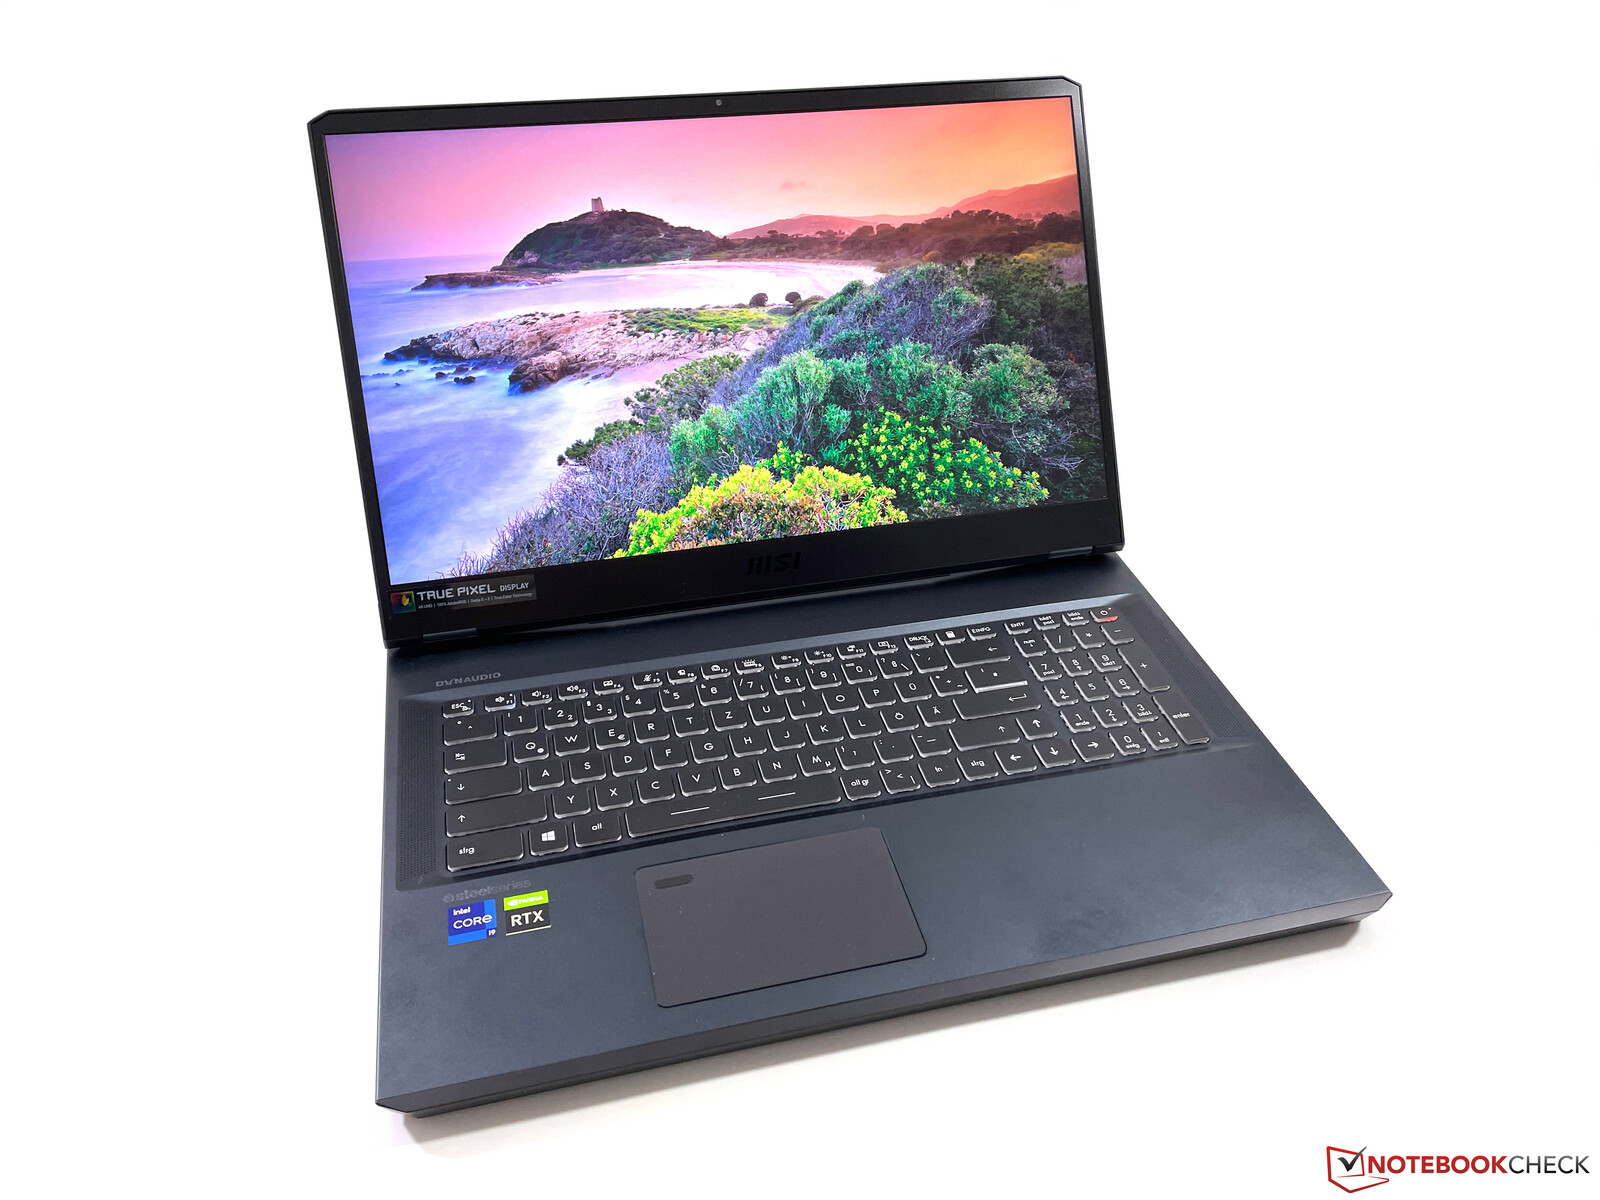
Caja - MSI prescinde de la iluminación
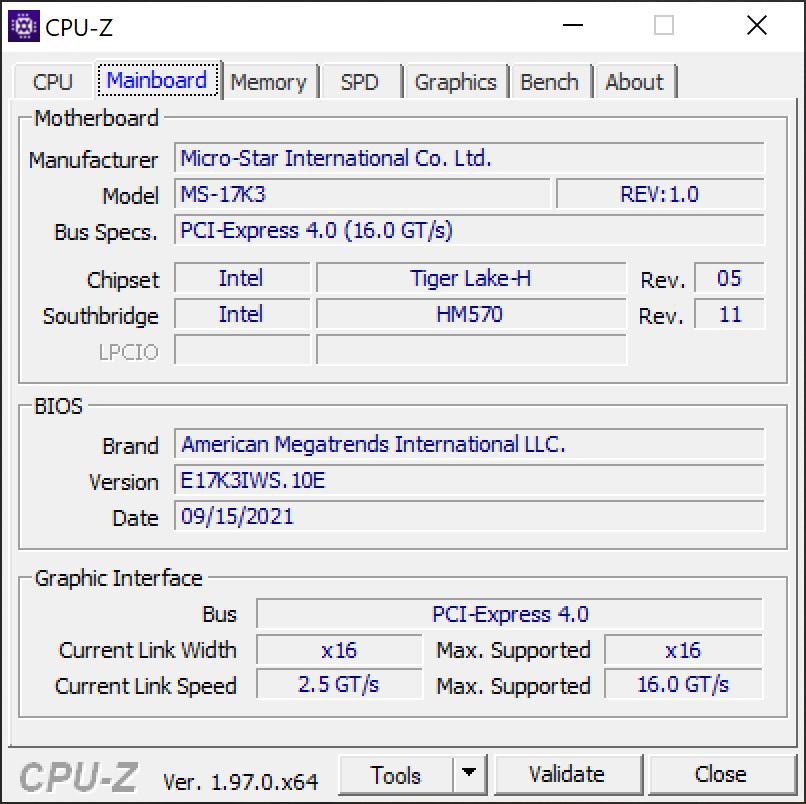
La carcasa del MSI WE76 es idéntica a la del modelo de juego GE76, pero el fabricante ha omitido la tira de LED en el borde frontal. El diseño recuerda a una central de juegos, pero las superficies negras y grises mate hacen que la estación de trabajo móvil parezca bastante discreta, lo que también debería encajar bien en un entorno de oficina. Debido al uso de una pantalla de 16:9 (que también es el caso de muchos otros modelos de 17 pulgadas), el bisel de la pantalla por debajo del display parece muy ancho, y la relación entre el display y la carcasa también es de sólo el 73%.
En términos de estabilidad y fabricación, nuestro modelo de pruebas es excelente; la unidad base en particular es extremadamente resistente a la torsión. La tapa es un poco más flexible, pero no podemos causar ninguna distorsión de imagen. Las bisagras están fundamentalmente también bien ajustadas, aunque no pueden evitar que la pantalla se tambalee hasta cierto punto. Además, este diseño de bisagra limita el ángulo máximo de apertura a 135 grados, lo que no es tan generoso como en otros competidores
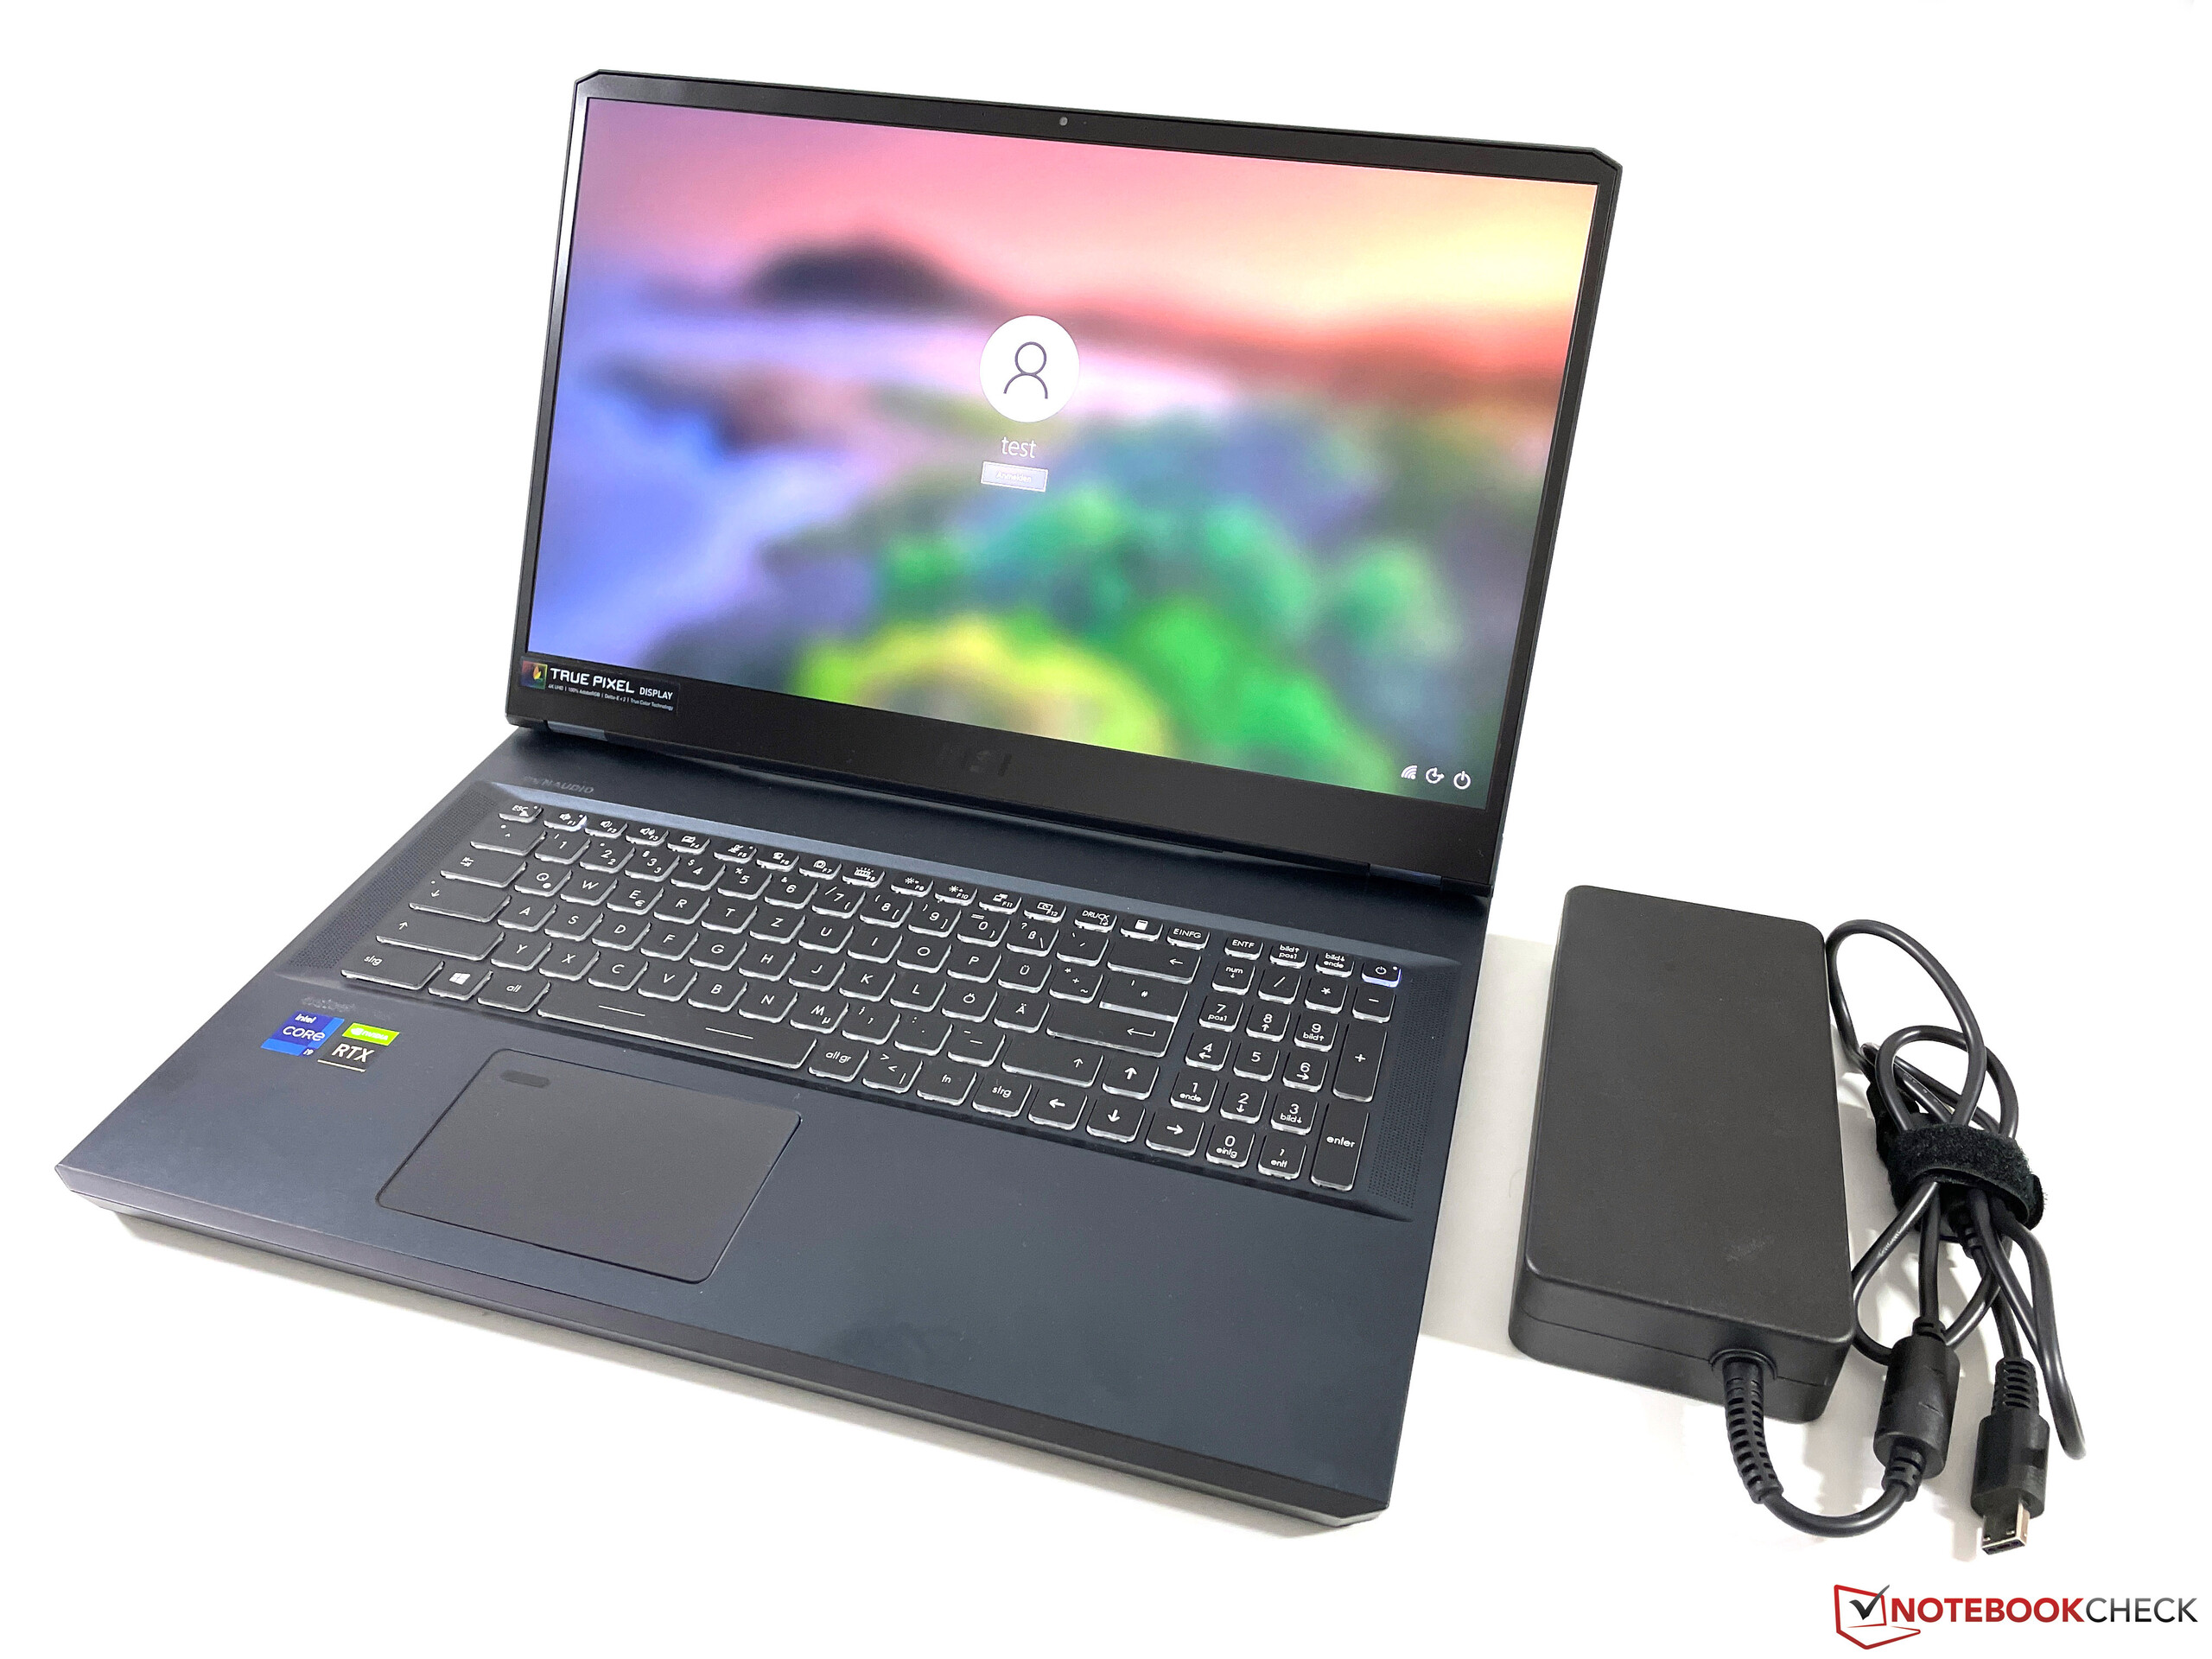
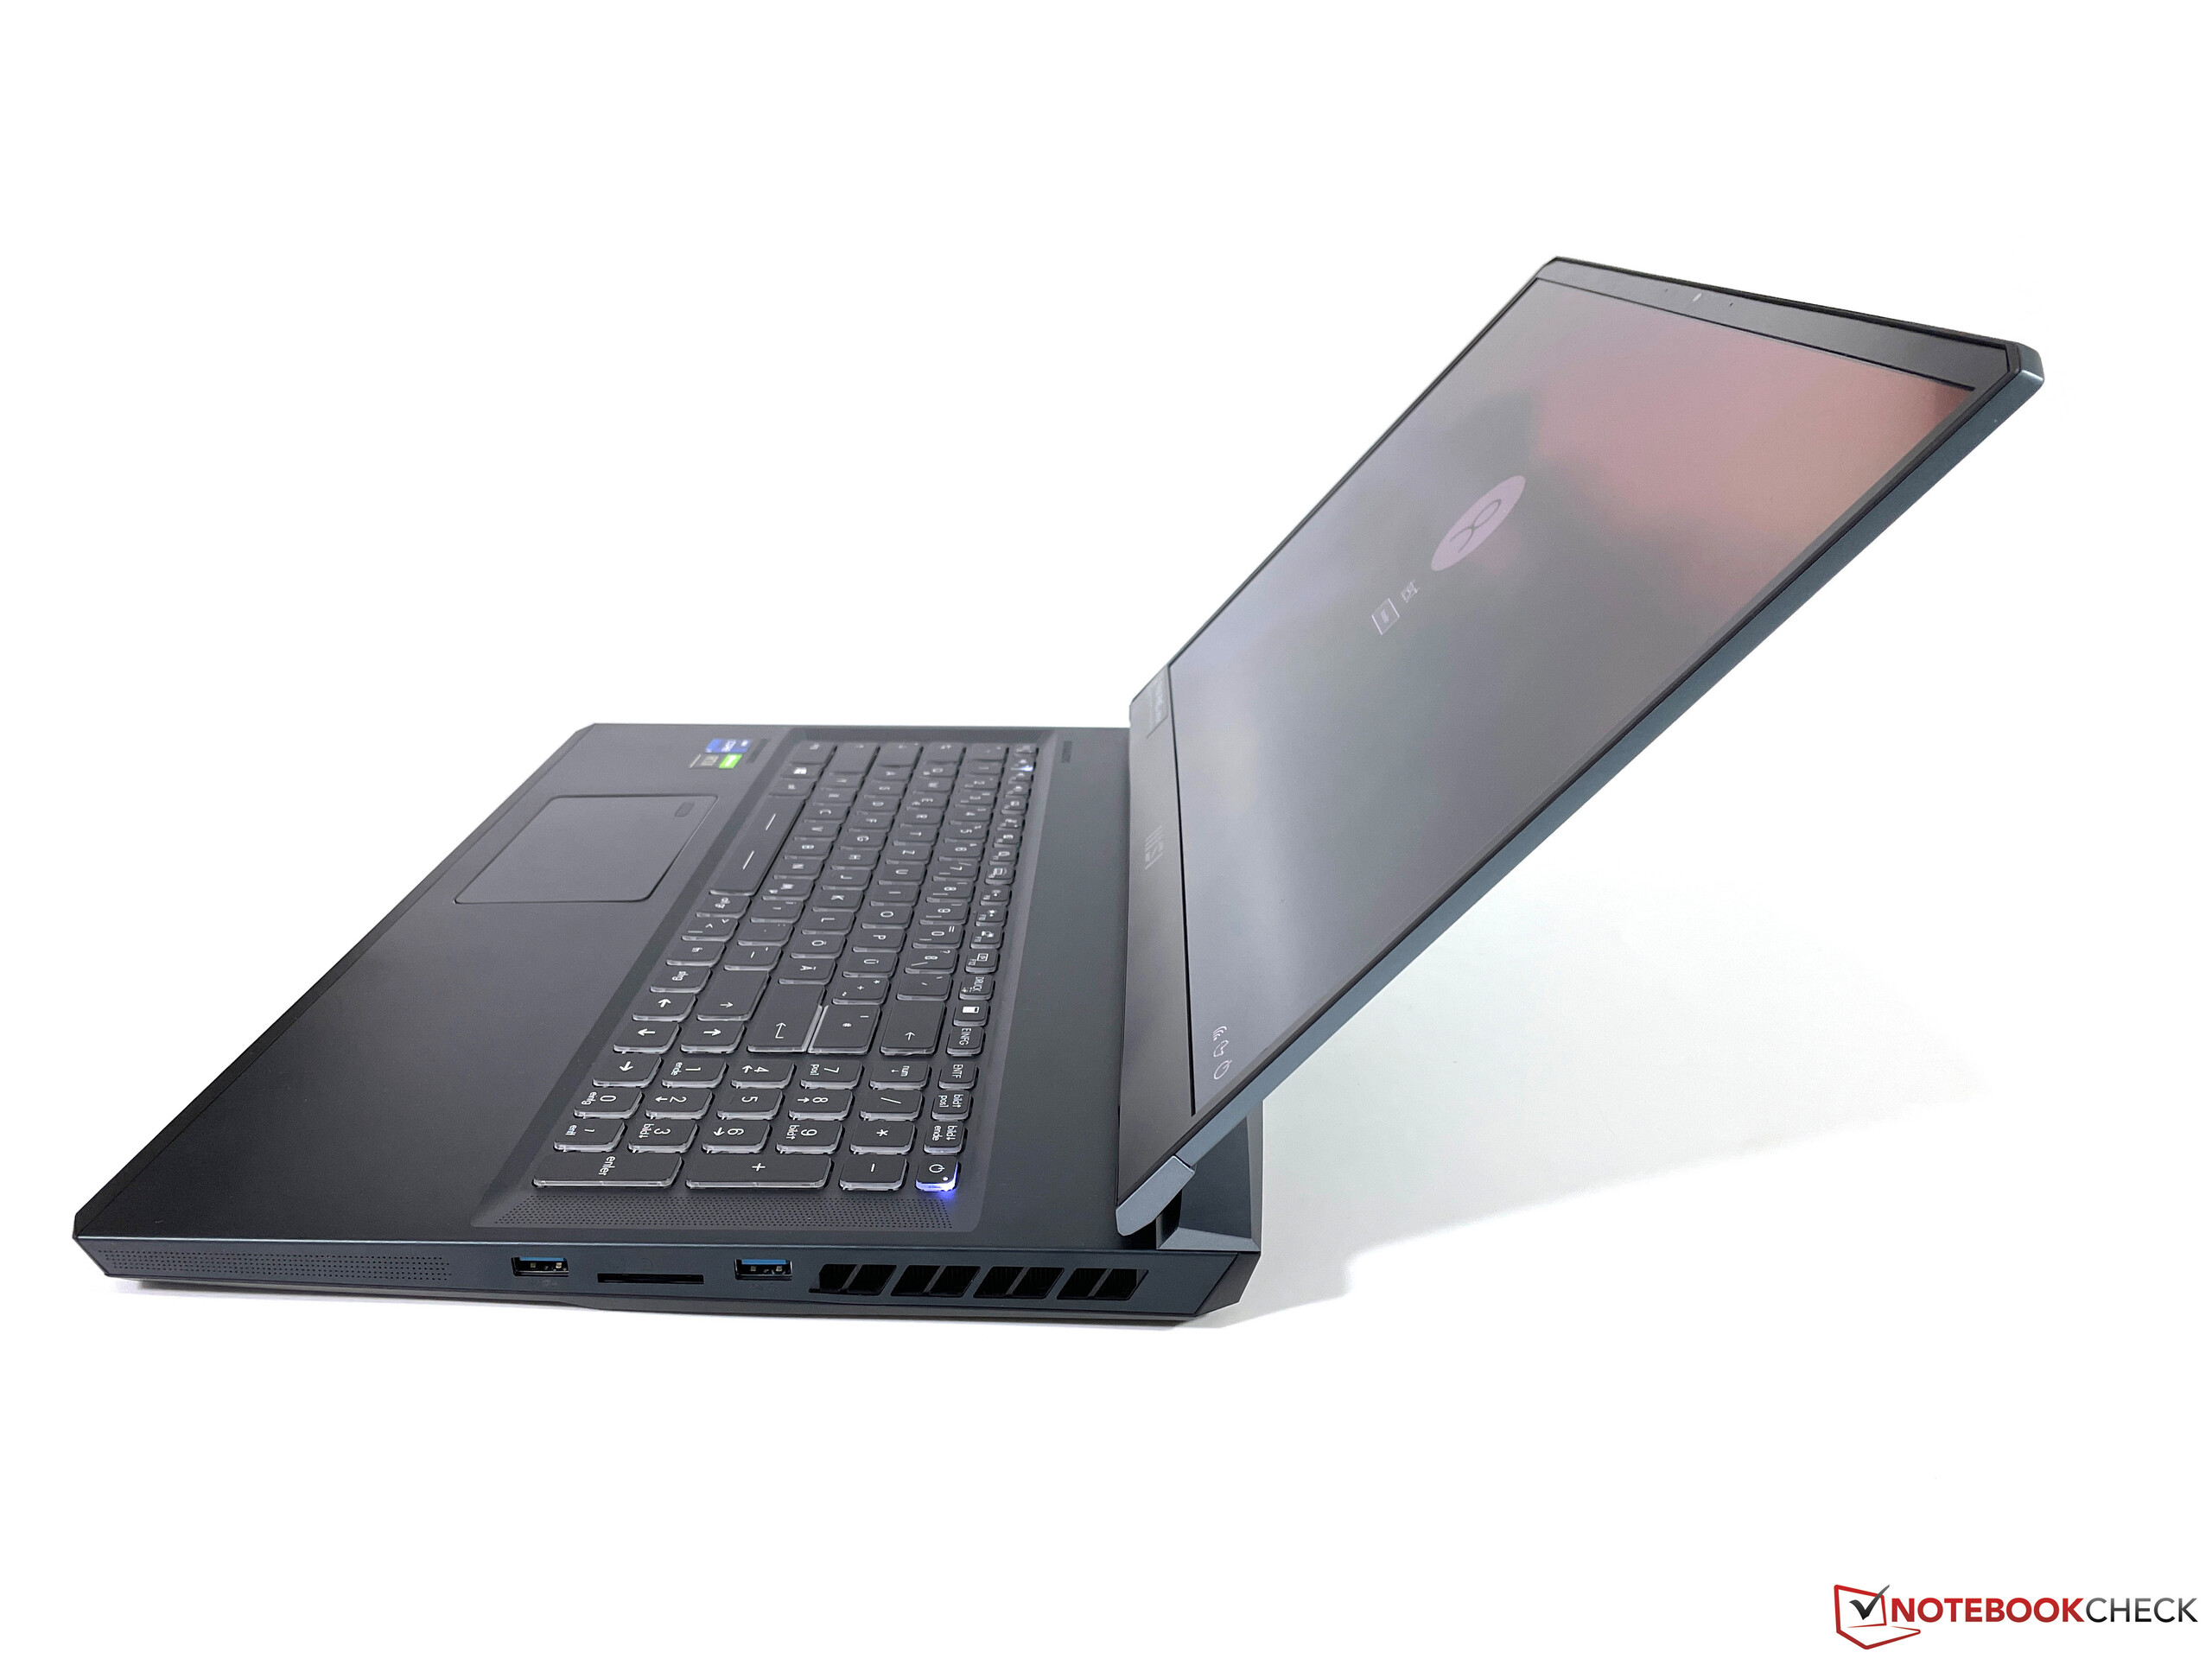
El WE76 es una estación de trabajo móvil convencional centrada en el rendimiento. Por lo tanto, no se ha centrado en hacer el dispositivo lo más fino y delgado posible. No obstante, la diferencia es bastante pequeña en comparación directa con nuestros dos competidores de 17 pulgadas, el ThinkPad P17y elZBook Fury 17. Nuestro dispositivo de pruebas pesa 2.922 gramos, pero hay que añadir otros 1.060 gramos por el voluminoso adaptador de corriente al transportar el portátil.
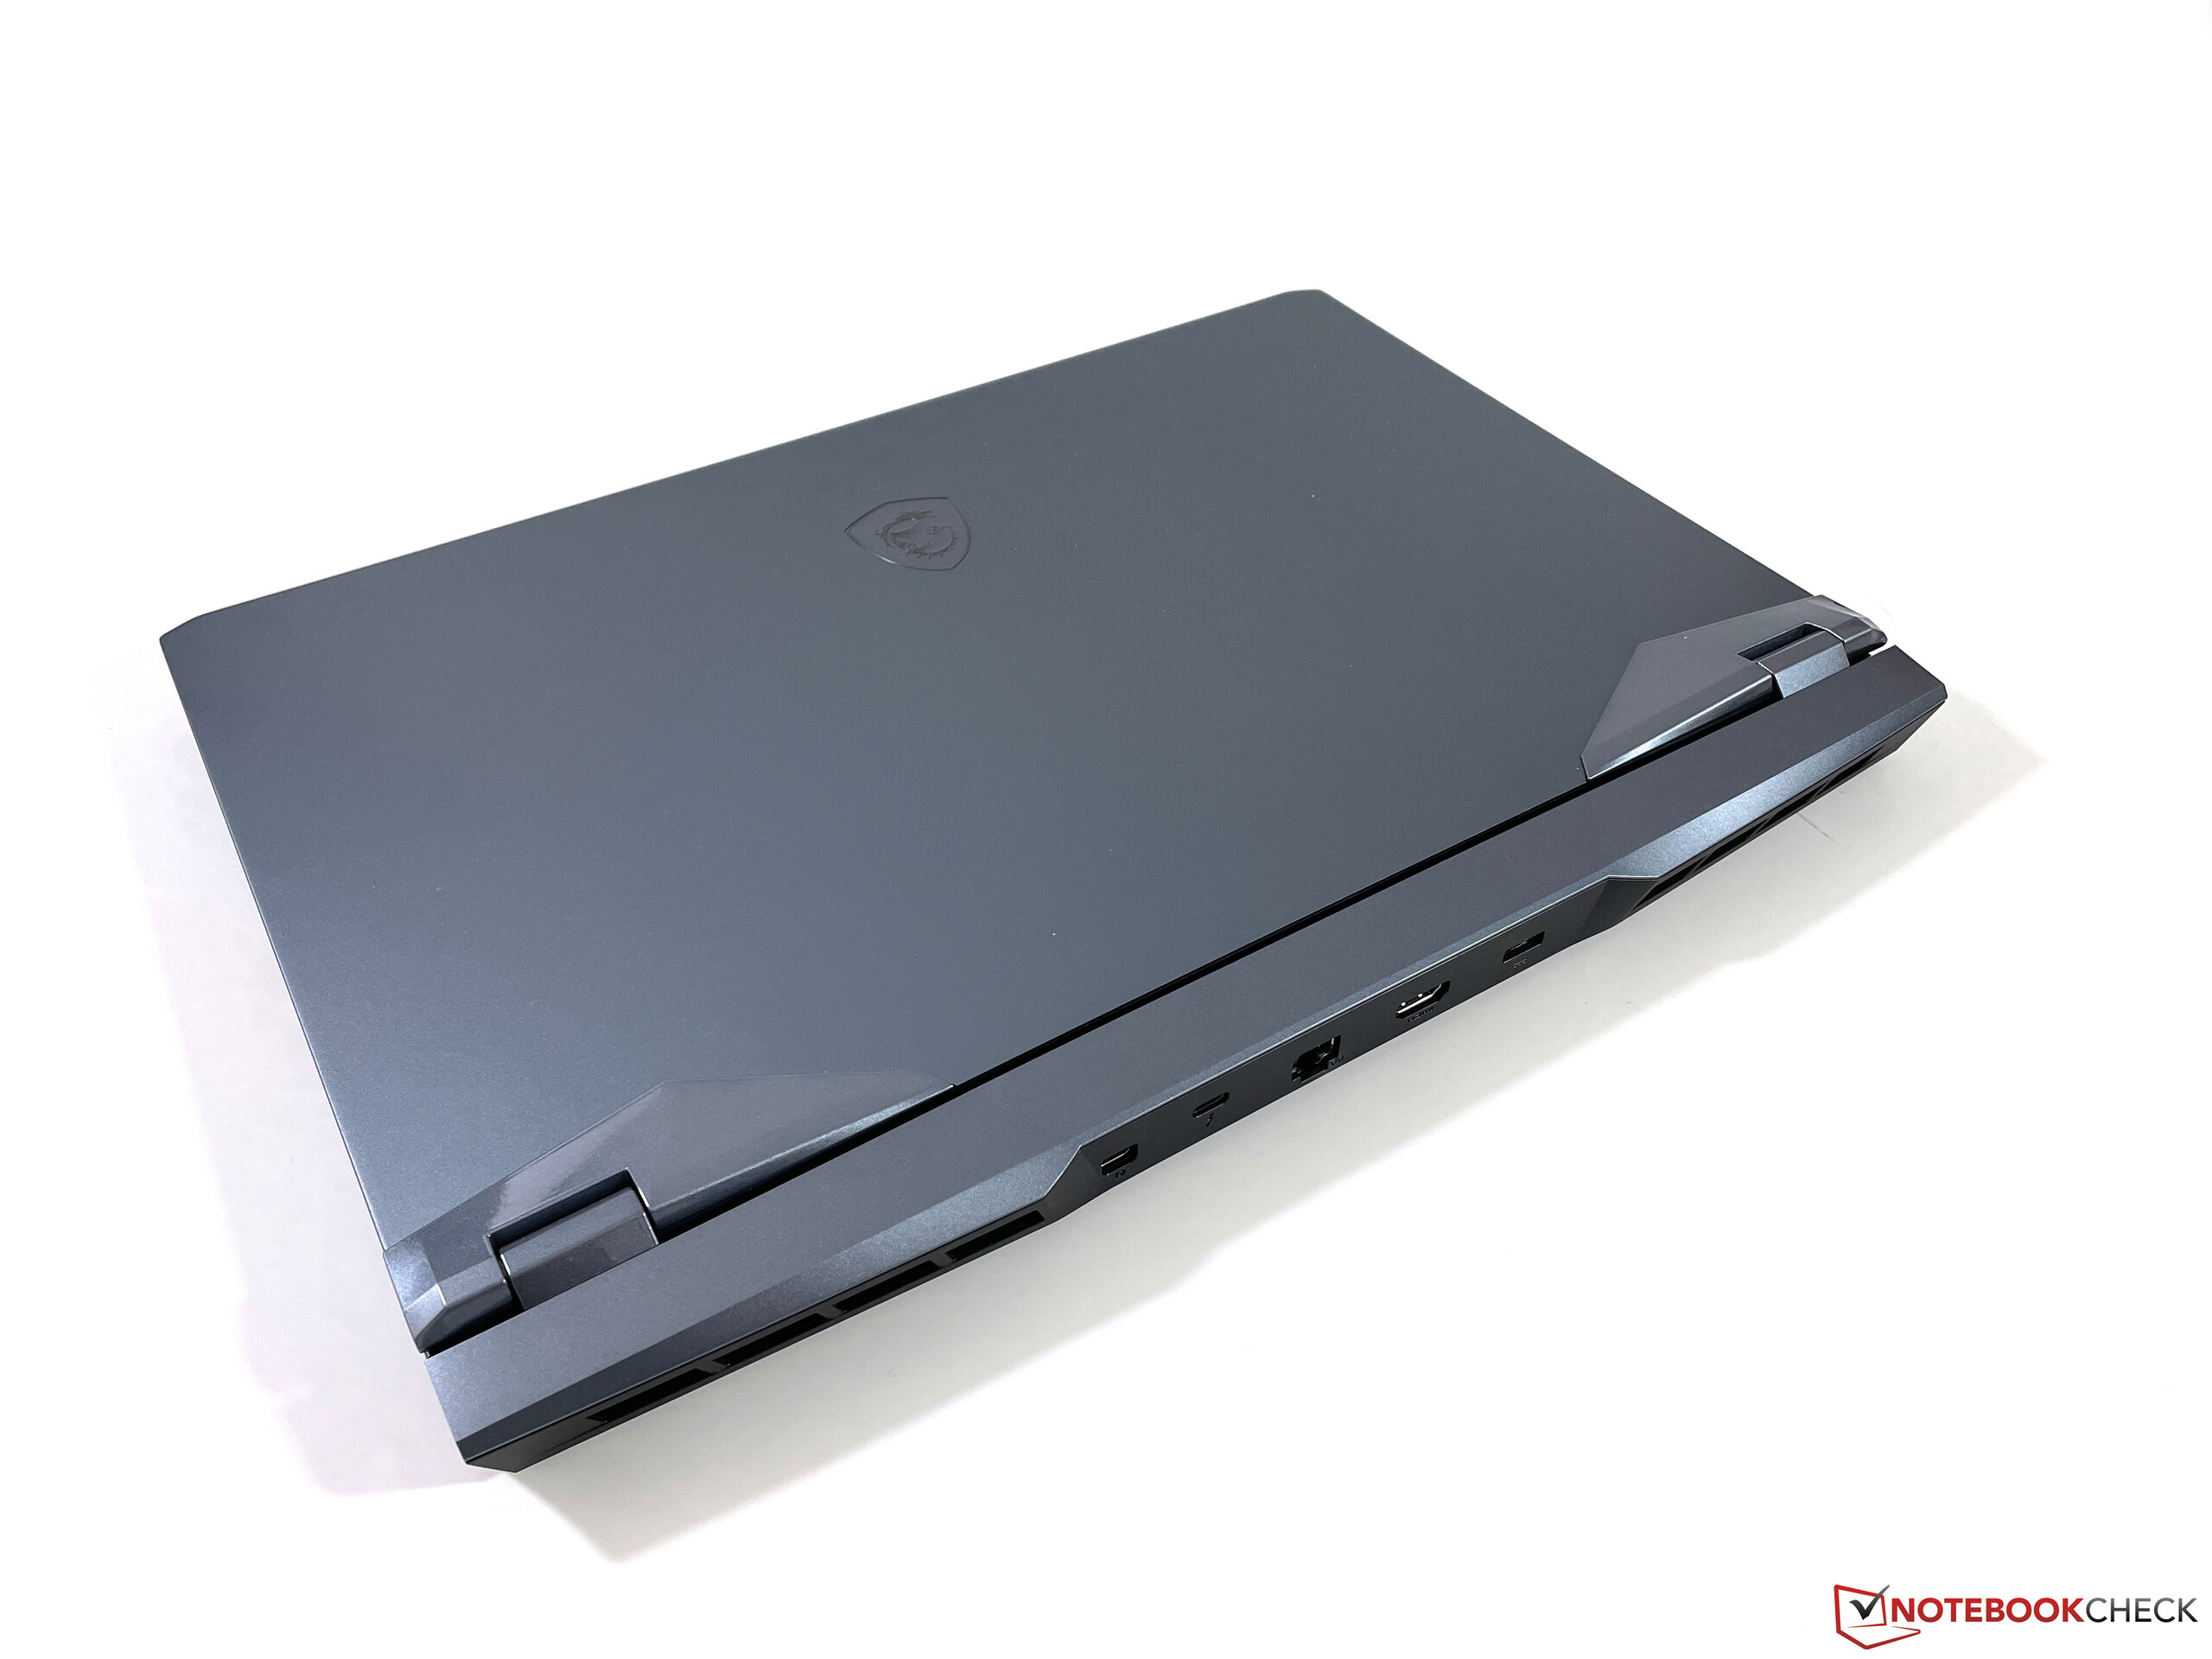
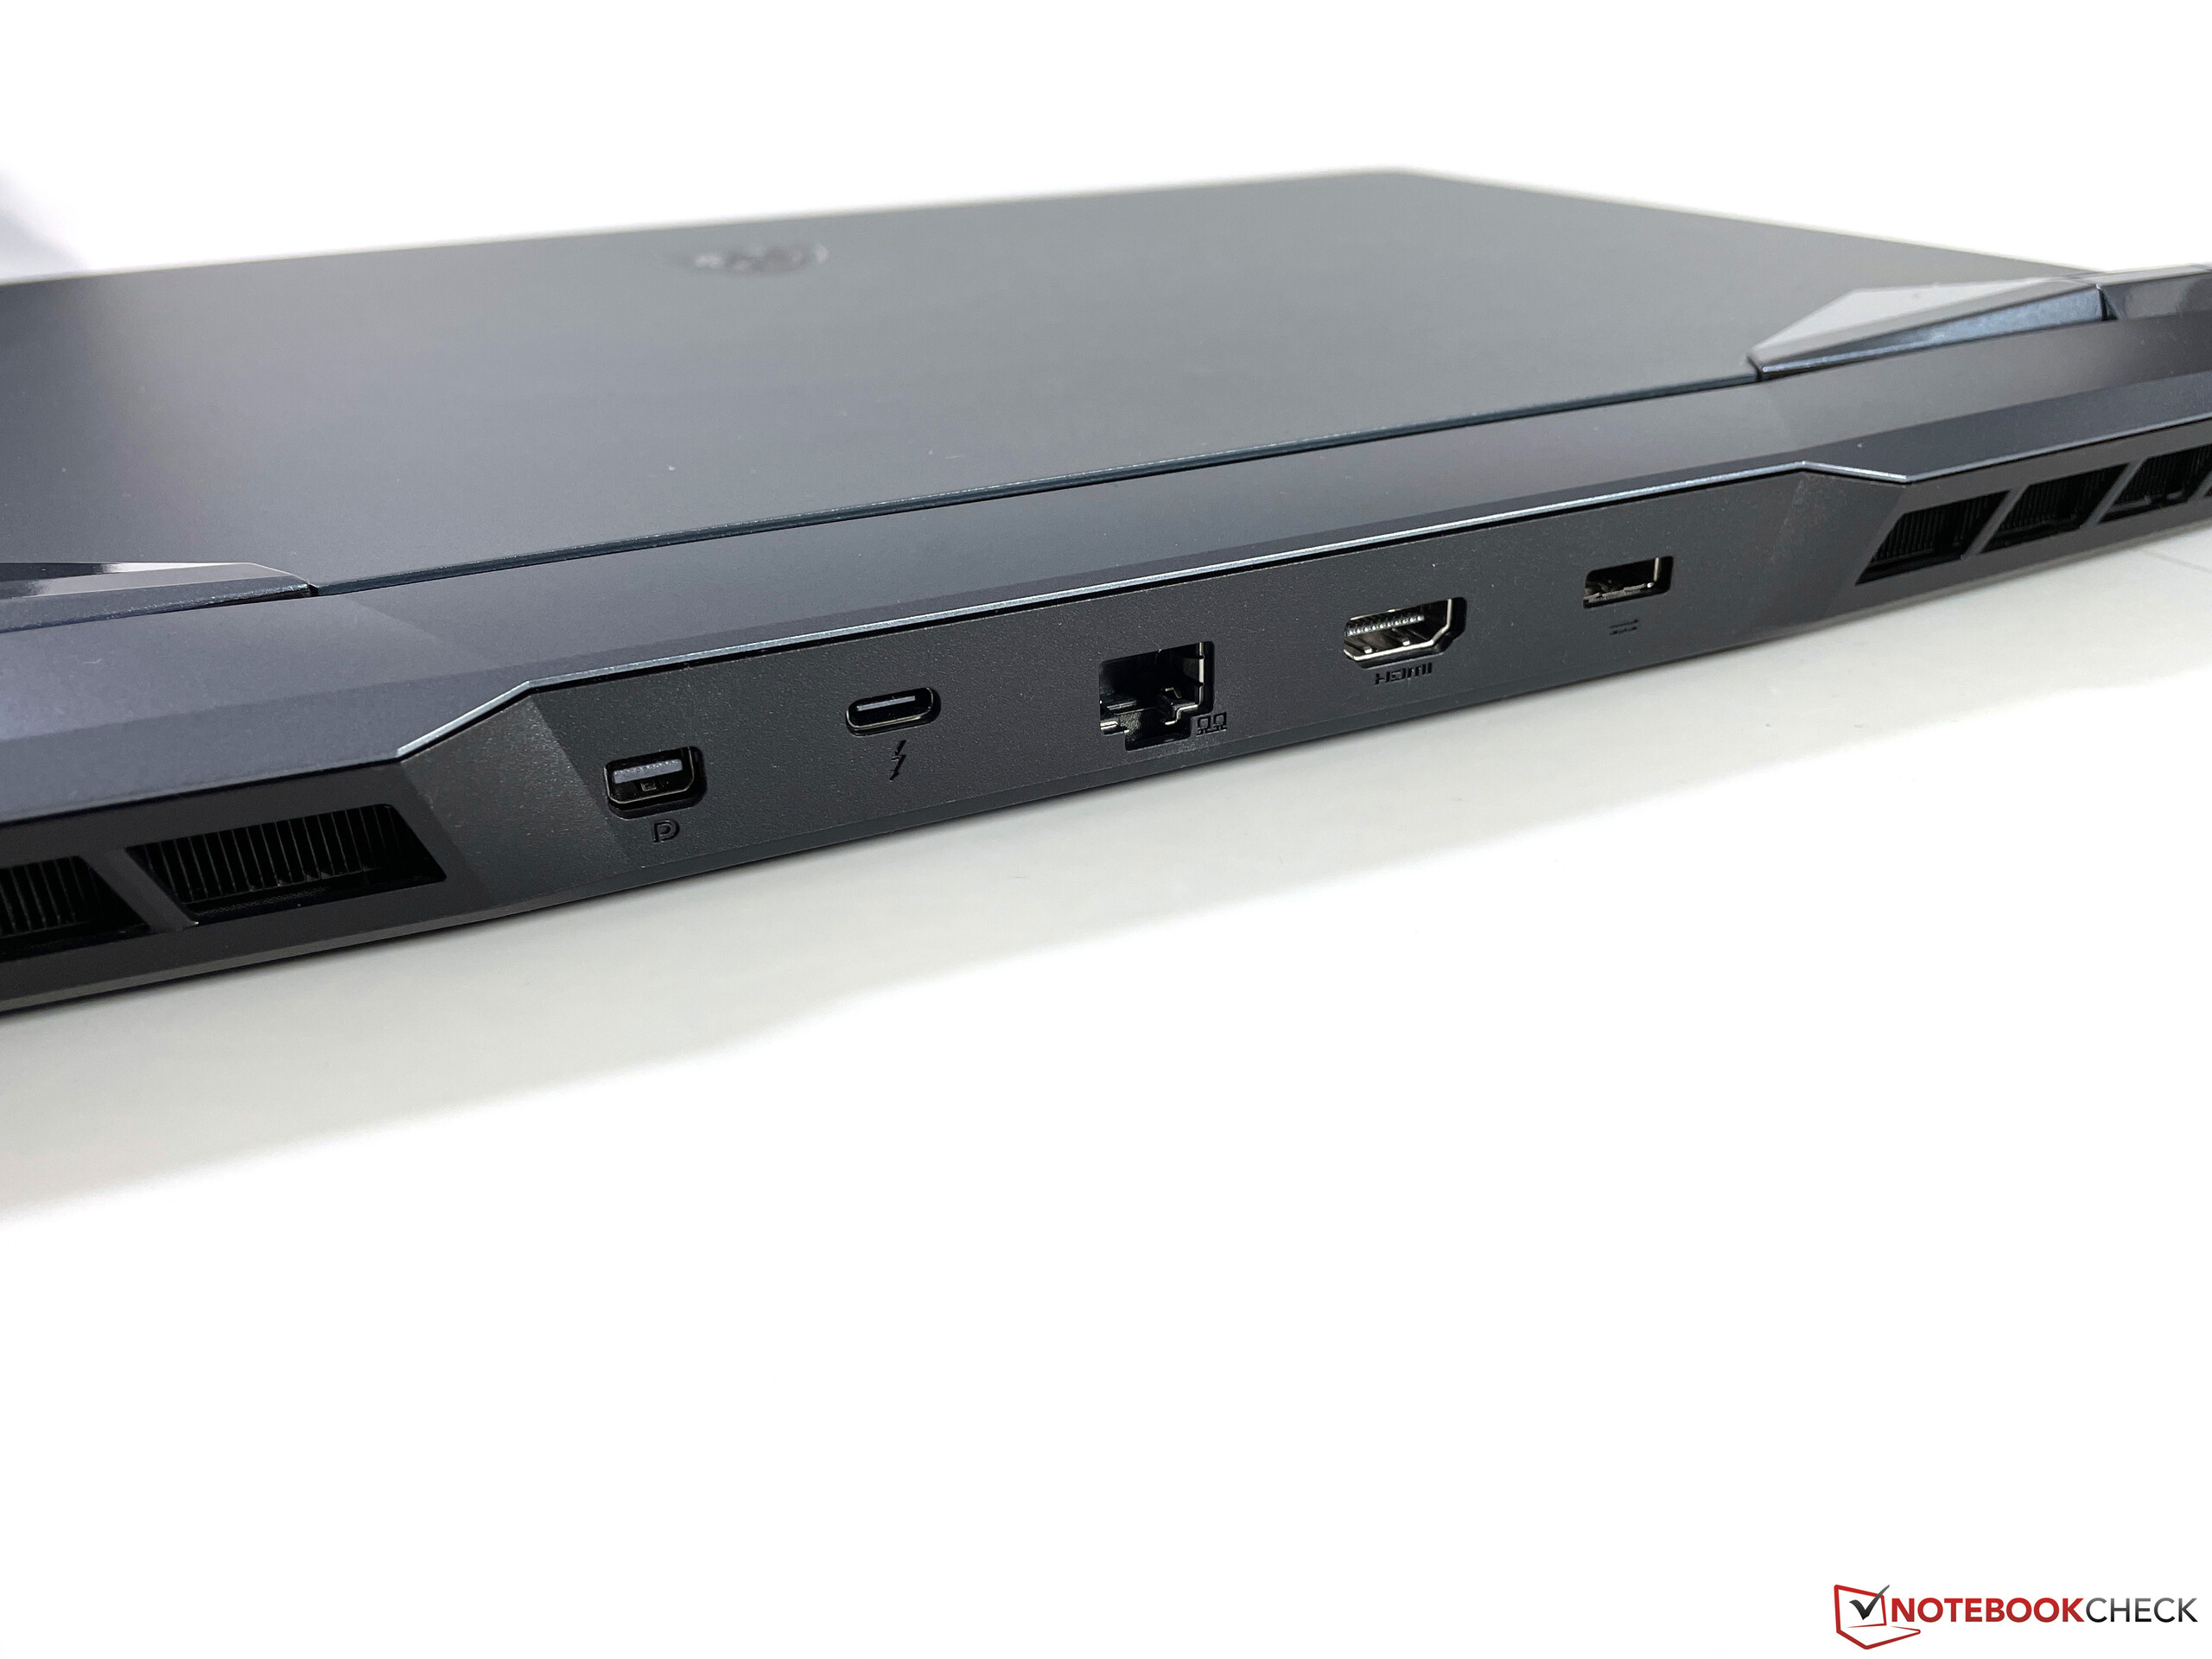
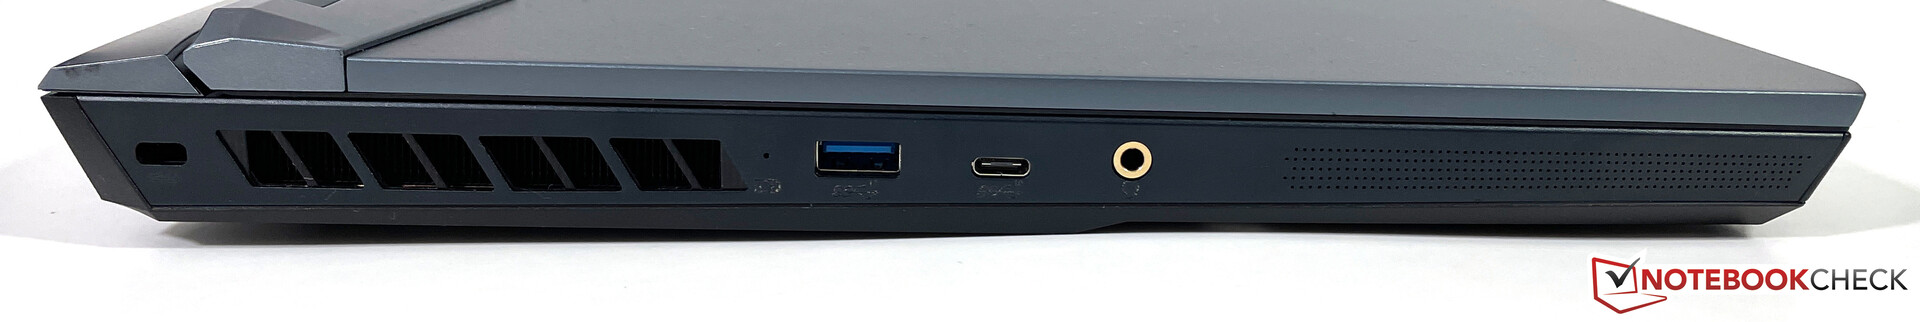
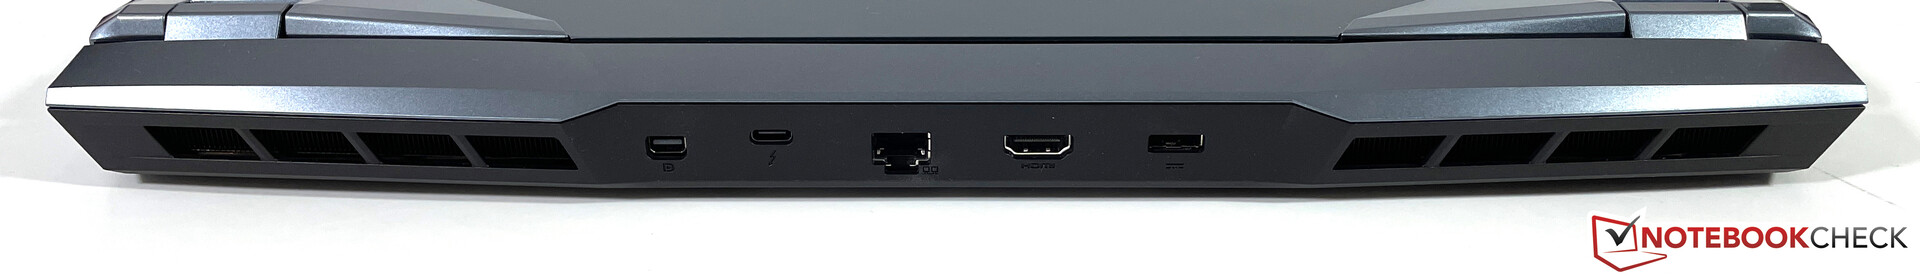
Conectividad - WE76 con Thunderbolt 4/USB 4
En cuanto a los puertos, encontrarás todo lo que deseas, incluyendo suficientes puertos USB y la moderna interfaz Thunderbolt 4. Los puertos para el adaptador de corriente, la LAN y los monitores externos (un máximo de tres) están en la parte trasera, mientras que los puertos USB y el lector de tarjetas se han colocado en los laterales para un acceso rápido. Por otro lado, no hay disponible un lector de tarjetas inteligente opcional
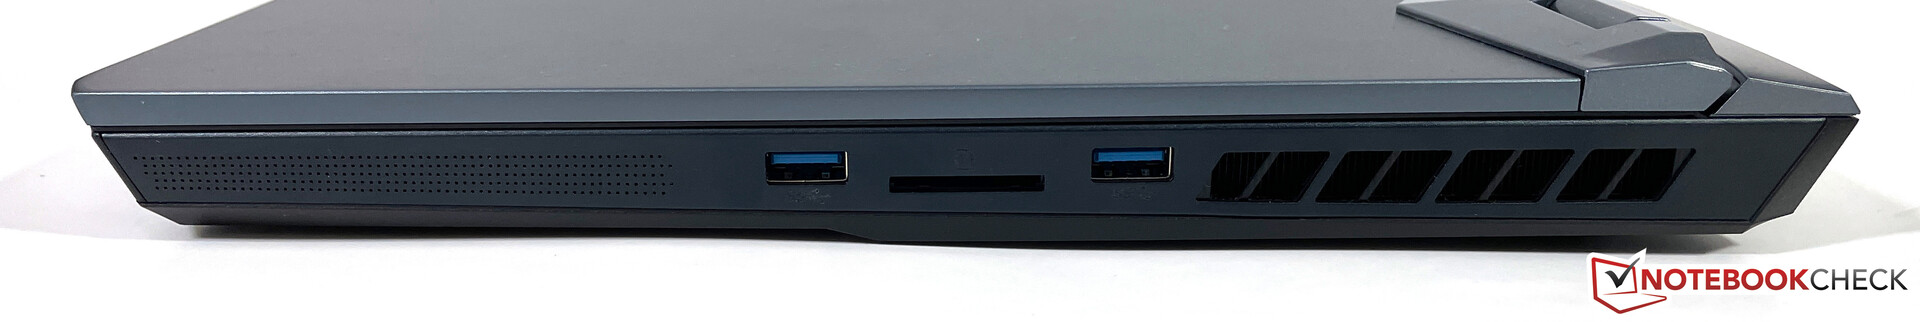
Lector de tarjetas SD
El lector de tarjetas SD de la derecha es más rápido que el del antiguo WE75. Determinamos tasas de transferencia de 80-90 MB/s con nuestra tarjeta de referencia (Angelbird AV Pro V60). Esto es aceptable, pero algunos de los competidores ofrecen módulos considerablemente más rápidos. Una tarjeta SD insertada sobresale 4 milímetros de la carcasa
| SD Card Reader | |
| average JPG Copy Test (av. of 3 runs) | |
| Lenovo ThinkPad P17 G2-20YU0025G (Toshiba Exceria Pro SDXC 64 GB UHS-II) | |
| HP ZBook Fury 17 G7 119W5EA (AV Pro 60) | |
| Media de la clase Workstation (49.6 - 681, n=14, últimos 2 años) | |
| MSI WE76 11UM-456 (AV Pro V60) | |
| HP ZBook Fury 15 G8 (AV Pro V60) | |
| Asus ProArt StudioBook 16 W7600H5A-2BL2 (AV Pro SD microSD 128 GB V60) | |
| MSI WE75 9TK (Toshiba Exceria Pro SDXC 64 GB UHS-II) | |
| maximum AS SSD Seq Read Test (1GB) | |
| Media de la clase Workstation (87.6 - 1455, n=14, últimos 2 años) | |
| Lenovo ThinkPad P17 G2-20YU0025G (Toshiba Exceria Pro SDXC 64 GB UHS-II) | |
| HP ZBook Fury 17 G7 119W5EA (AV Pro 60) | |
| MSI WE76 11UM-456 (AV Pro V60) | |
| HP ZBook Fury 15 G8 (AV Pro V60) | |
| Asus ProArt StudioBook 16 W7600H5A-2BL2 (AV Pro SD microSD 128 GB V60) | |
| MSI WE75 9TK (Toshiba Exceria Pro SDXC 64 GB UHS-II) | |
Comunicación
MSI usa el rápido módulo Killer AX1675x, que soporta el moderno estándar Wi-Fi 6E así como Bluetooth 5.2. Las tasas de transferencia son muy buenas y están en lo alto de nuestro campo de comparación en nuestro test Wi-Fi estandarizado con el router Netgear Nighthawk RAX120
Cámara web
Aunque la cámara web de 1080p situada encima de la pantalla ofrece una resolución ligeramente superior a la de los módulos habituales de 720p, la calidad de imagen sigue sin ser especialmente buena. Tuvimos que lidiar con una cantidad relativamente alta de ruido en particular durante nuestras grabaciones. Se pueden grabar vídeos Full HD a 30 FPS


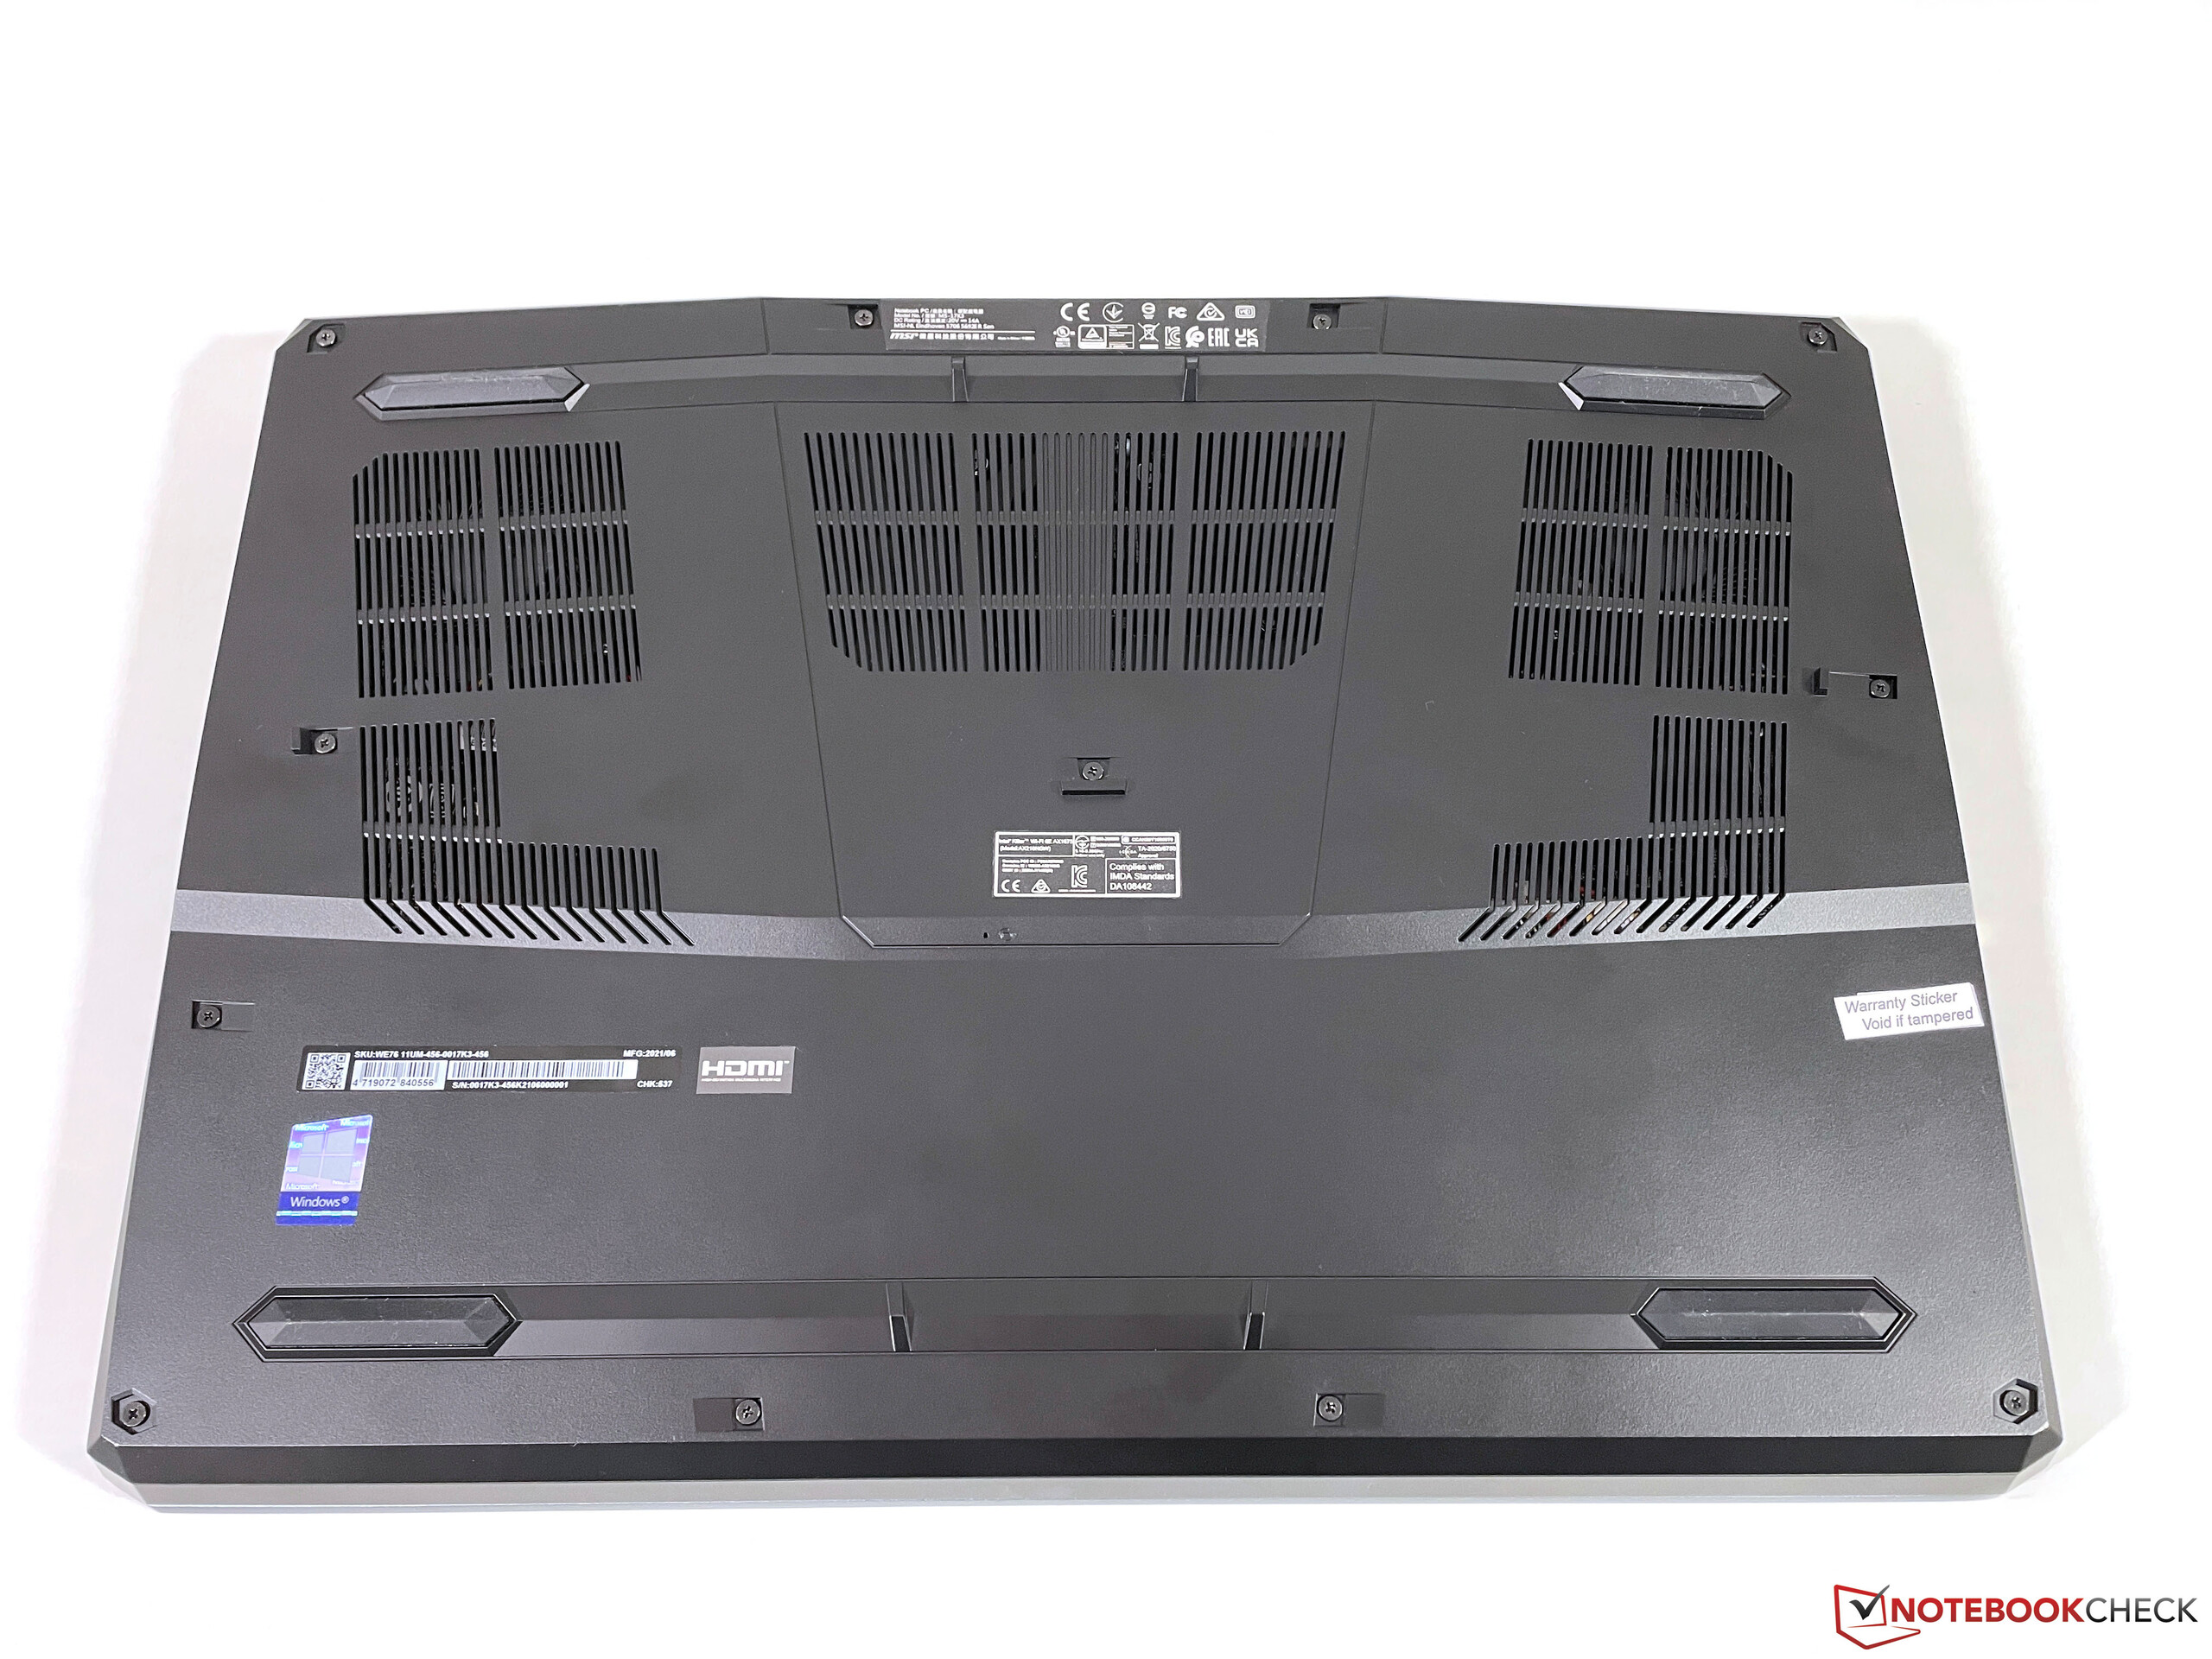
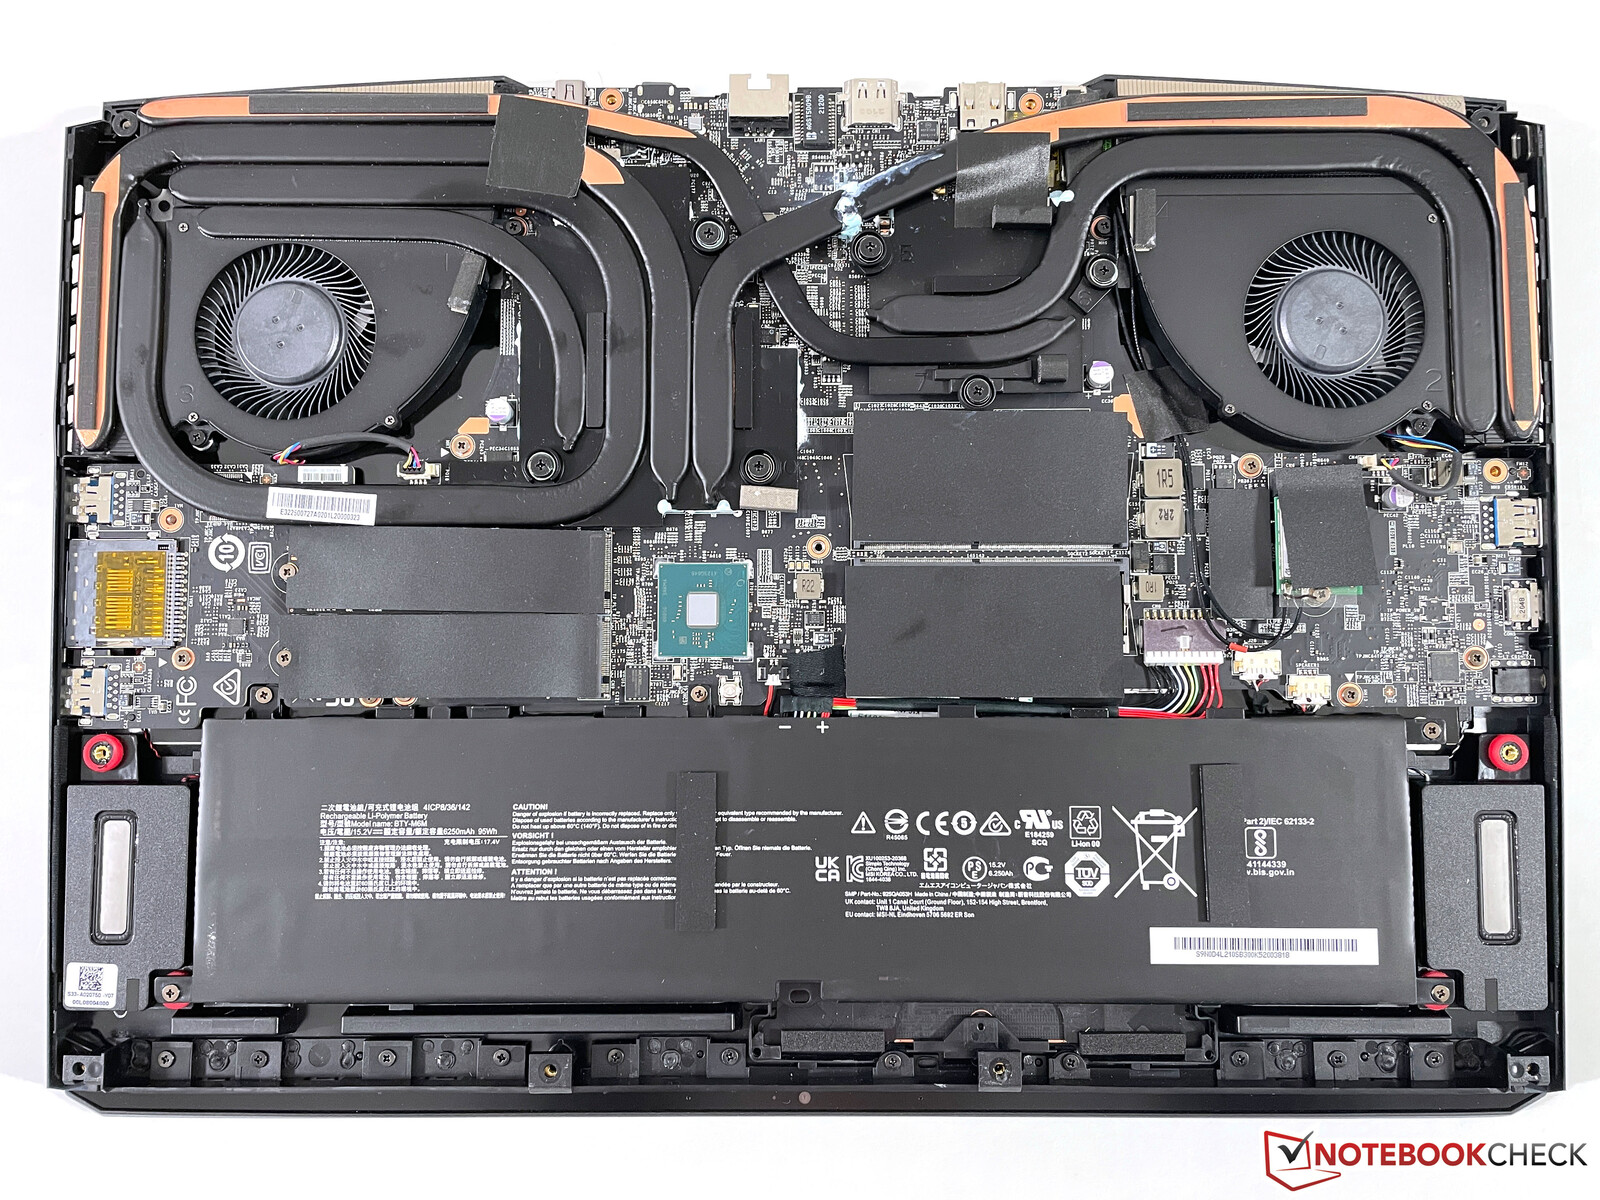
Mantenimiento
Después de aflojar todos los tornillos cruzados, se puede retirar toda la cubierta inferior. Además de las dos ranuras SODIMM, también hay dos ranuras M.2-2280 disponibles (1x PCIe 4.0 y 1x PCIe 3.0). El módulo Wi-Fi también puede ser reemplazado
Dispositivos de entrada - SteelSeries con teclado numérico
Teclado
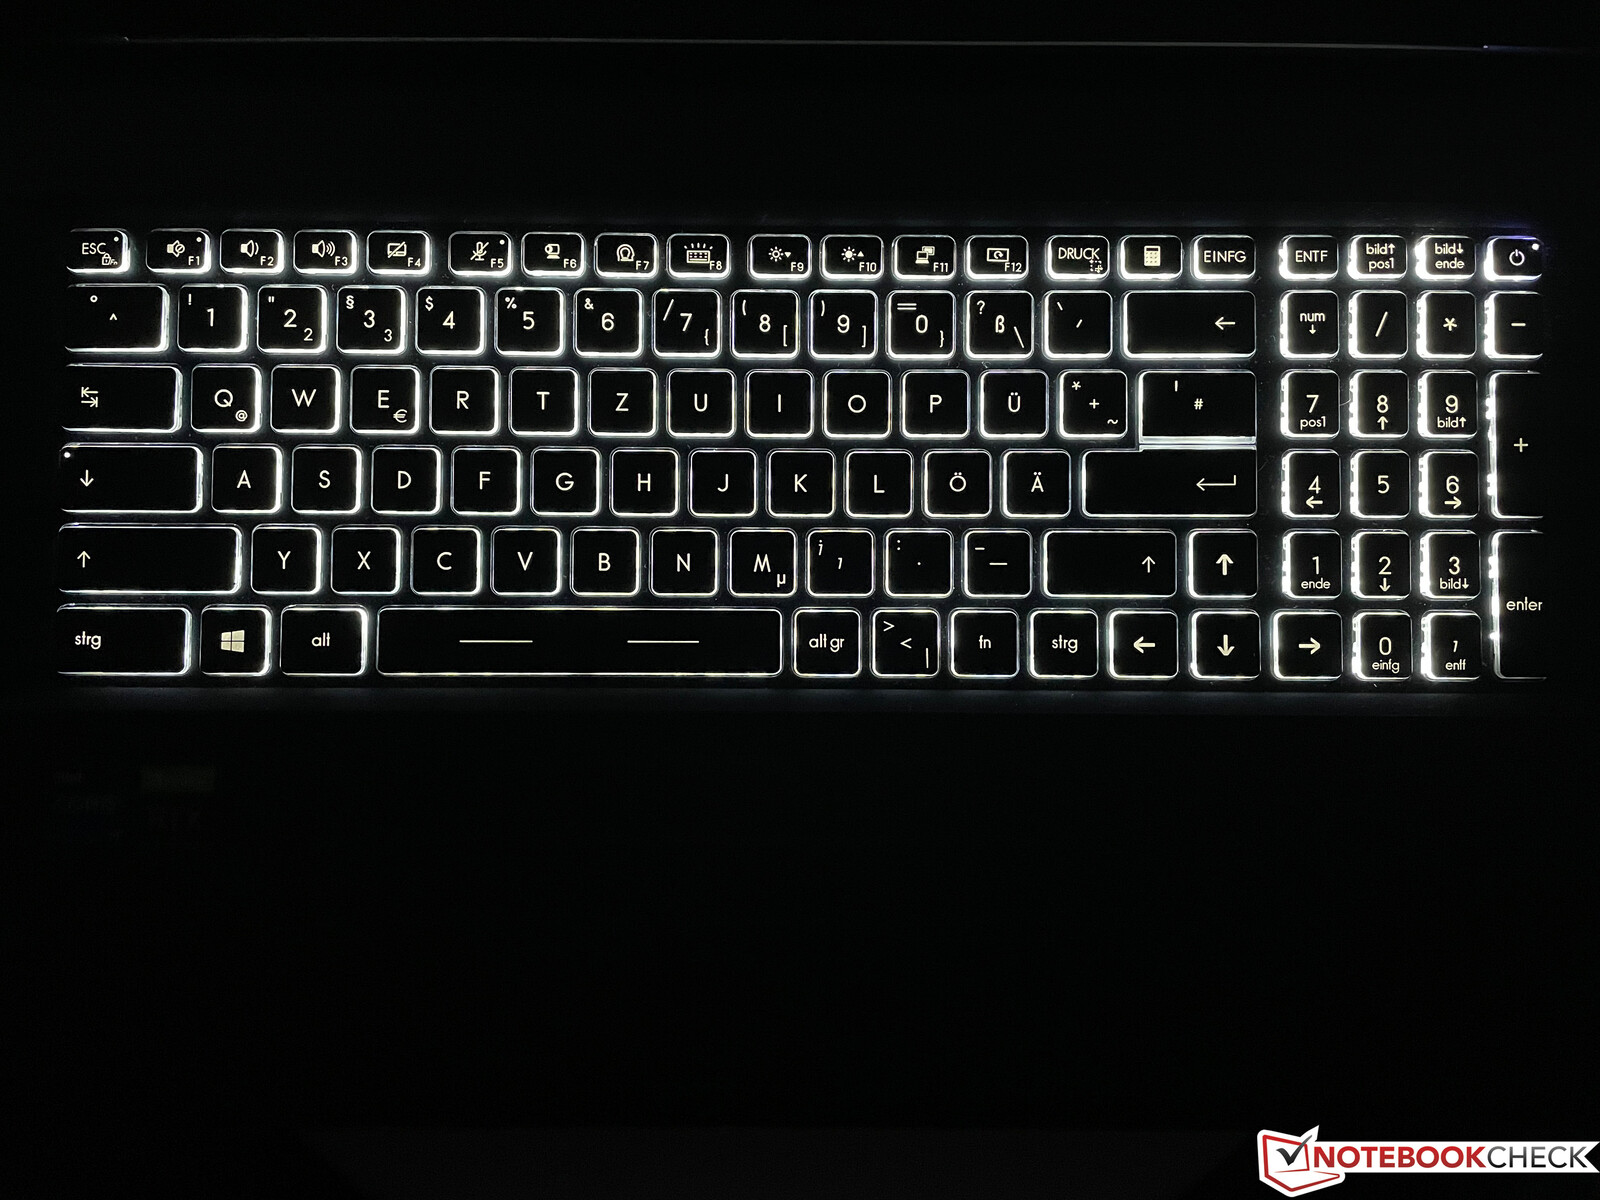
Al igual que sus hermanos de juego, la contraparte de la estación de trabajo WE76 también cuenta con un teclado SteelSeries. Sin embargo, se ha omitido la retroiluminación de color; en su lugar, sólo hay una retroiluminación blanca. Las teclas ofrecen un recorrido comparativamente largo, y la sensación de tecleo es muy buena y puede competir fácilmente con los mejores teclados de la competencia de estaciones de trabajo establecidas. Además, hay un teclado numérico completo integrado en el lado derecho. Sus teclas son un poco más estrechas, pero esto no resultó ser un problema en la práctica
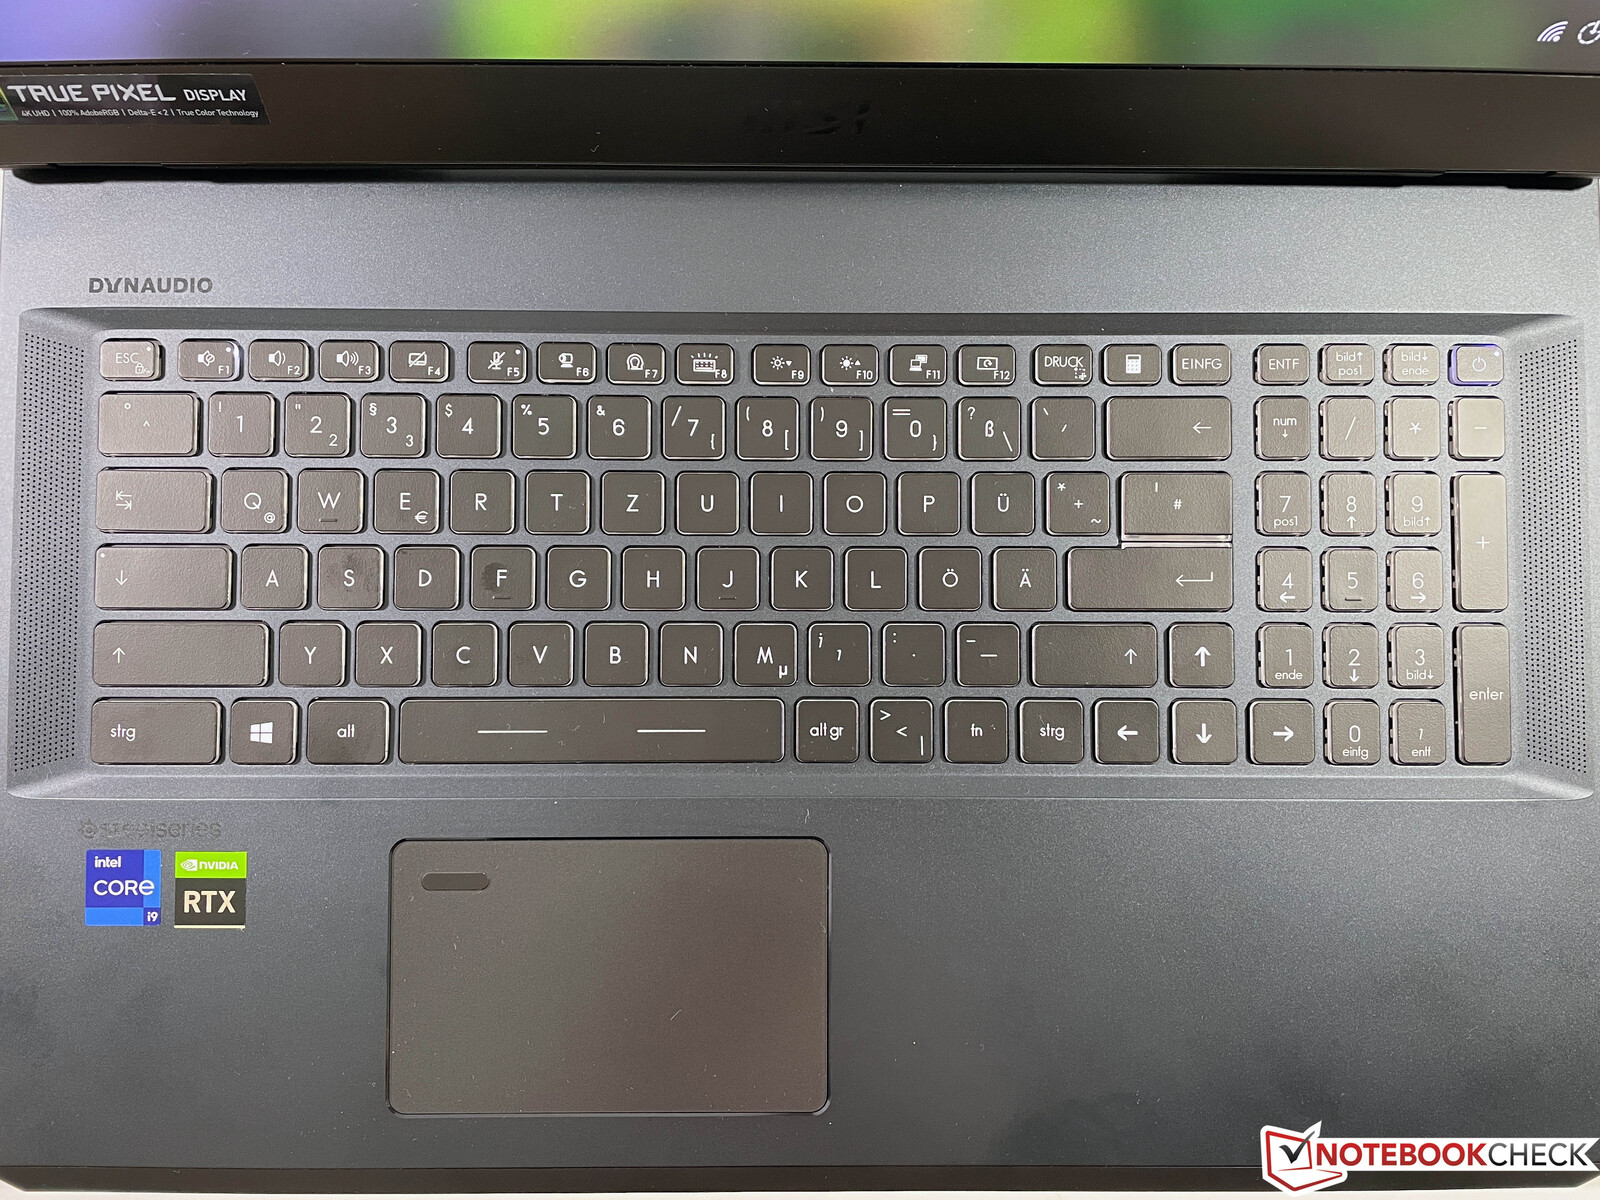
Panel táctil
Con 10,5 x 6,5 cm, el ClickPad no es especialmente grande para los estándares actuales, pero el control del ratón funciona sin problemas. La superficie lisa ofrece buenas propiedades de deslizamiento, y el escáner de huellas dactilares integrado situado en la esquina superior izquierda no estorba. Sin embargo, el touchpad parece un poco ruidoso, porque hay un ligero hueco antes de llegar al mecanismo de clic. Esto significa que la mitad inferior puede ser presionada notablemente sin que se produzca un clic. Además, el clic real es demasiado fuerte, lo que hace que parezca barato.
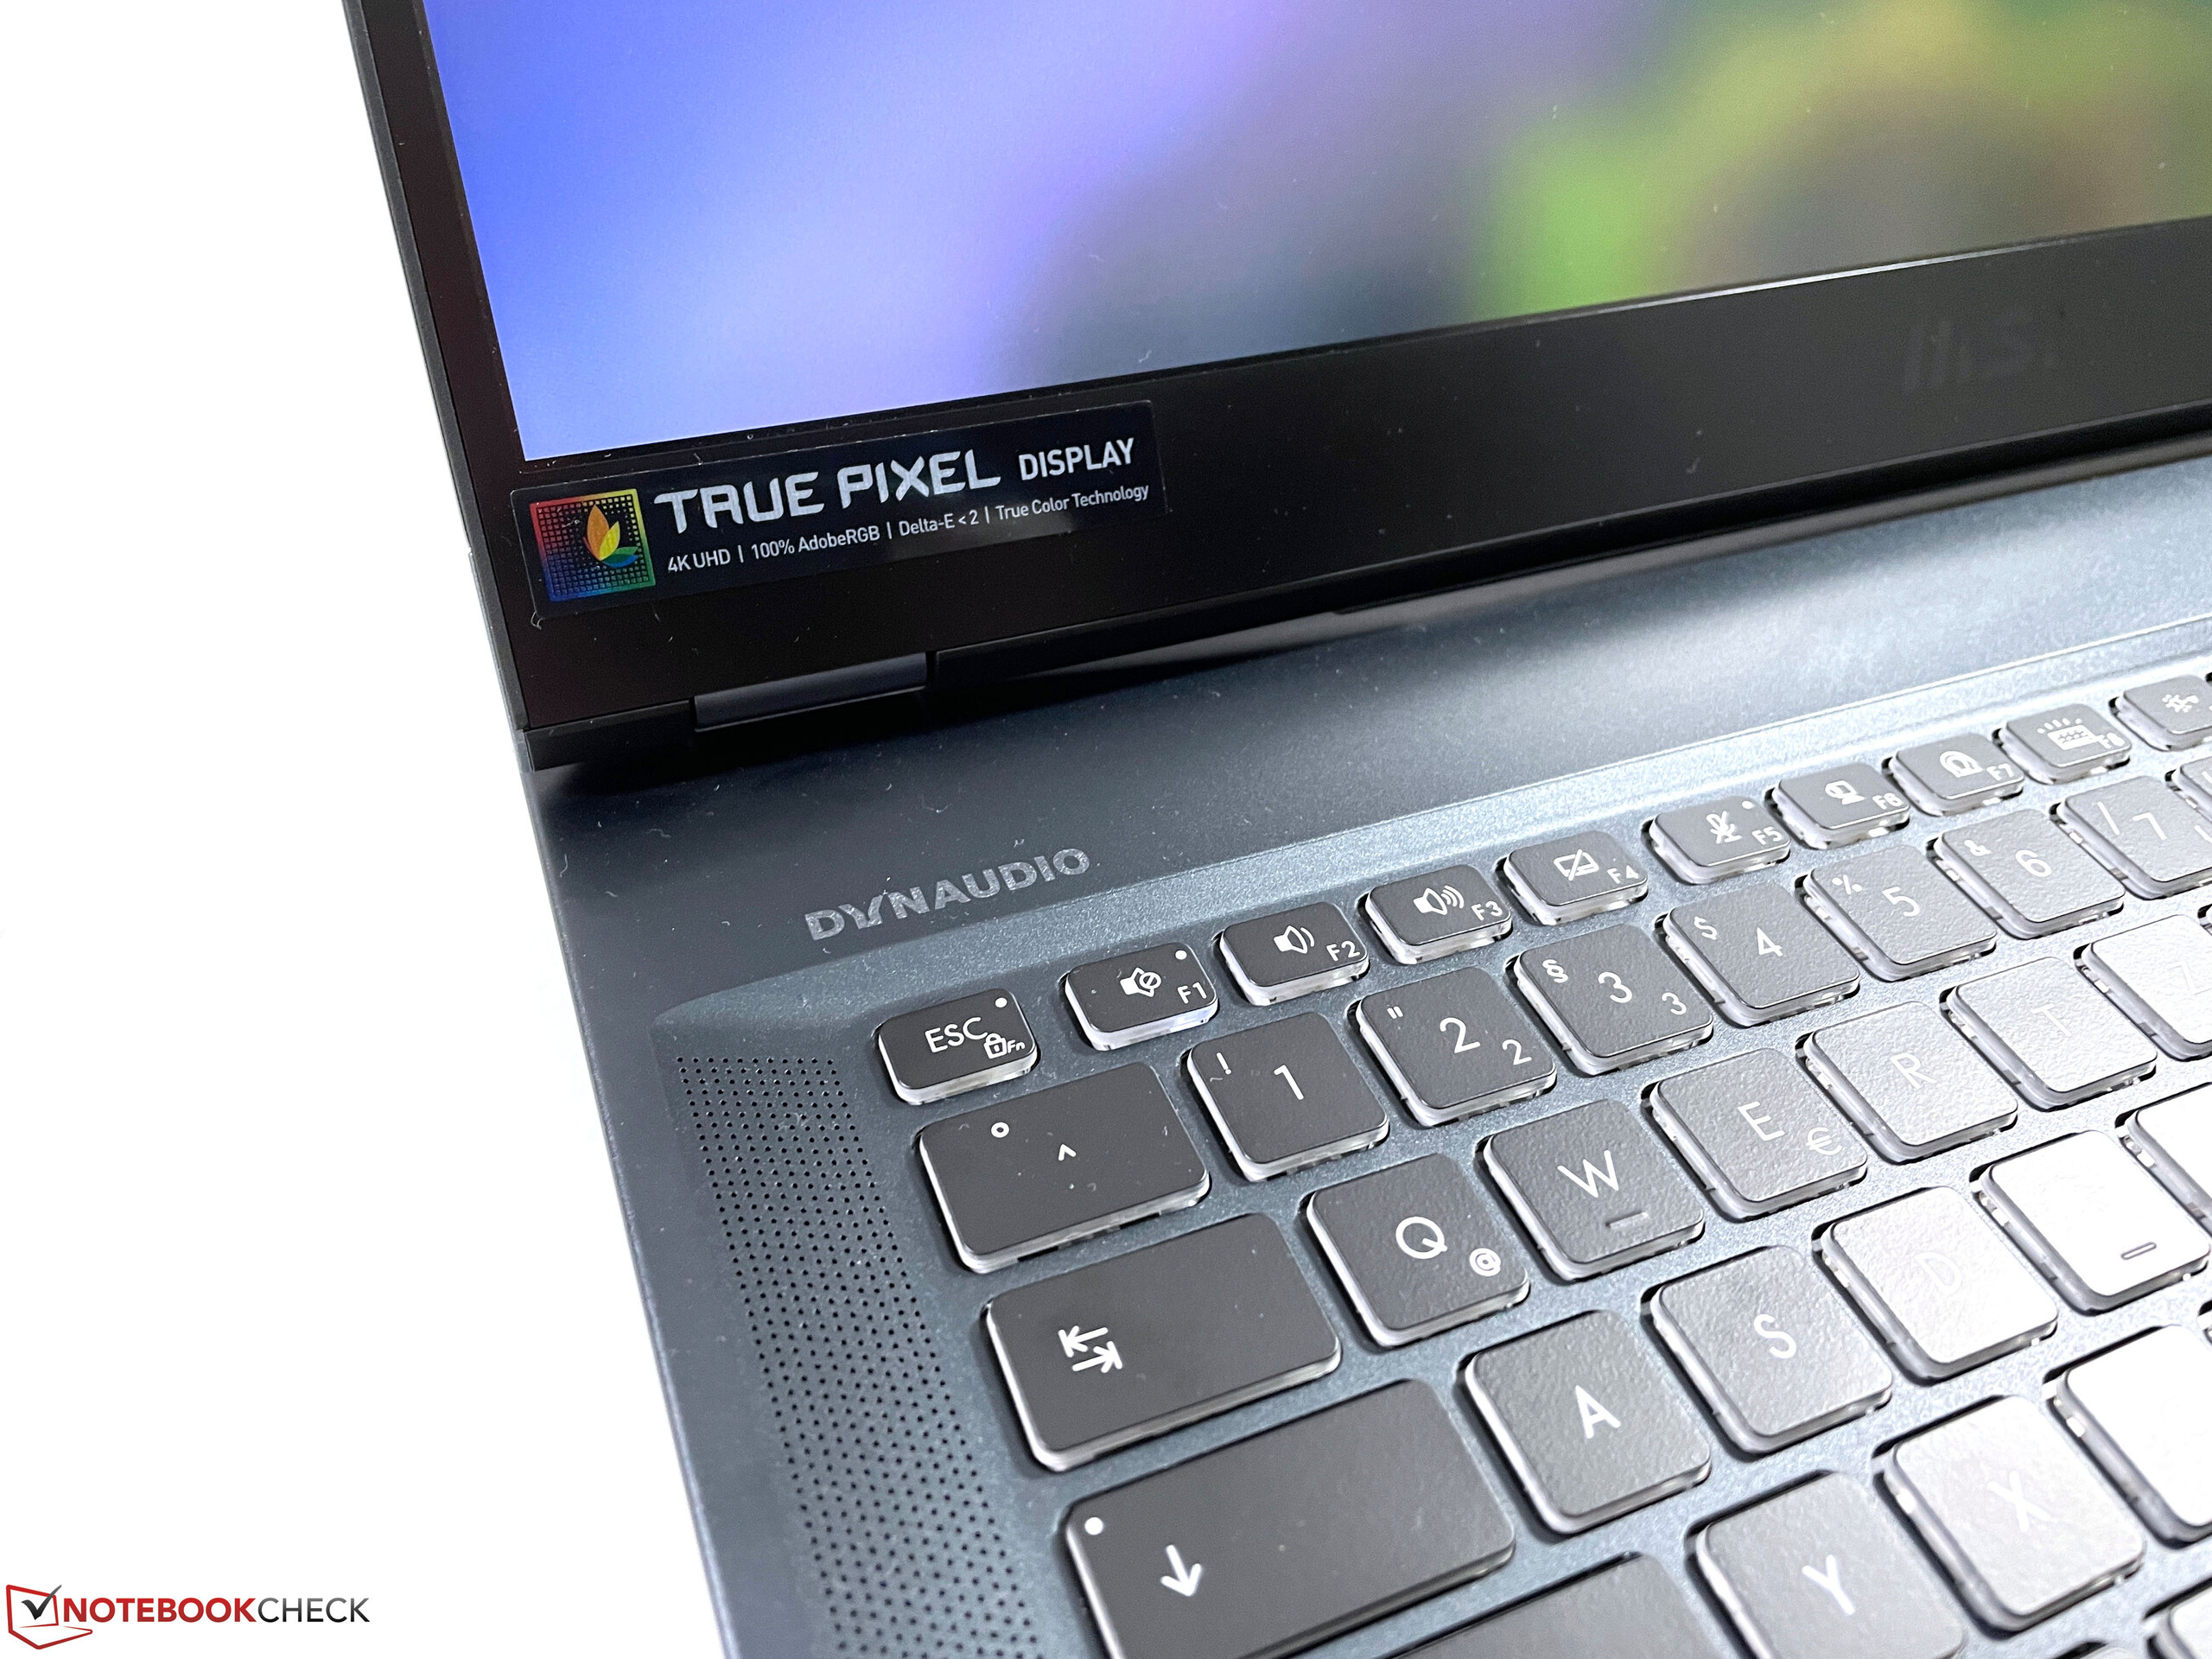
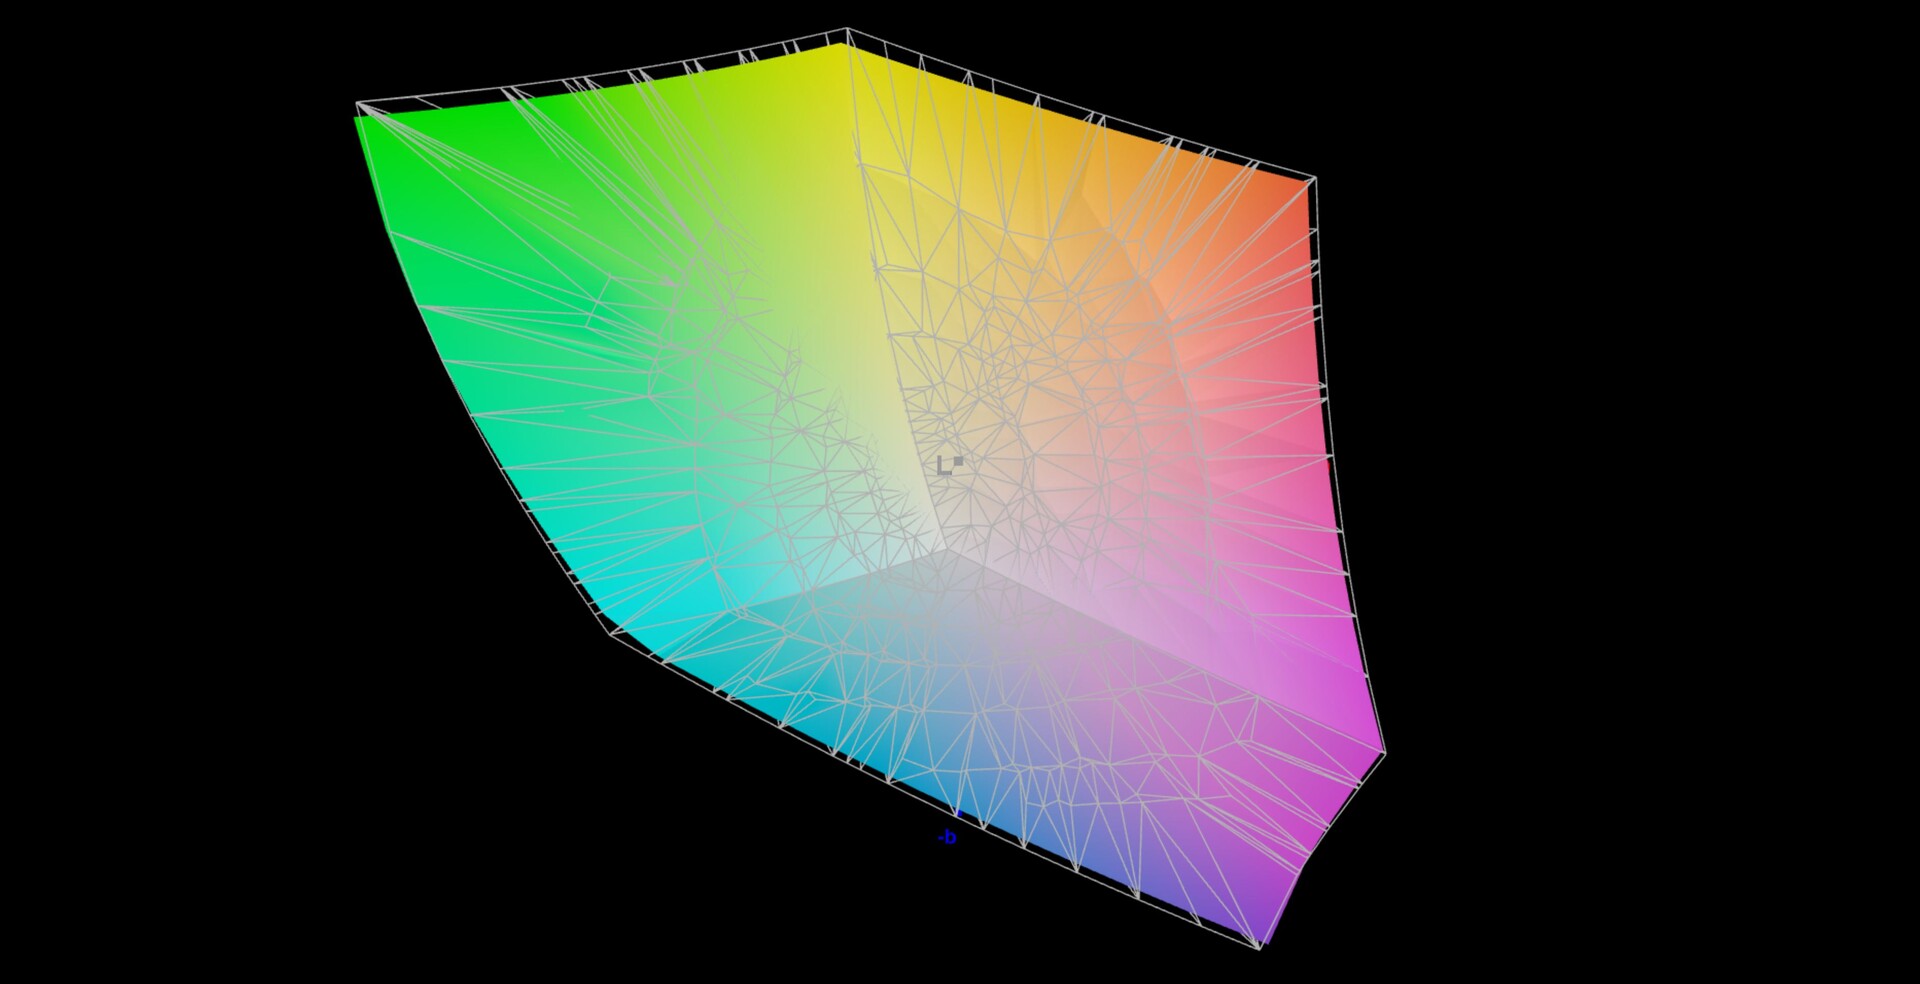
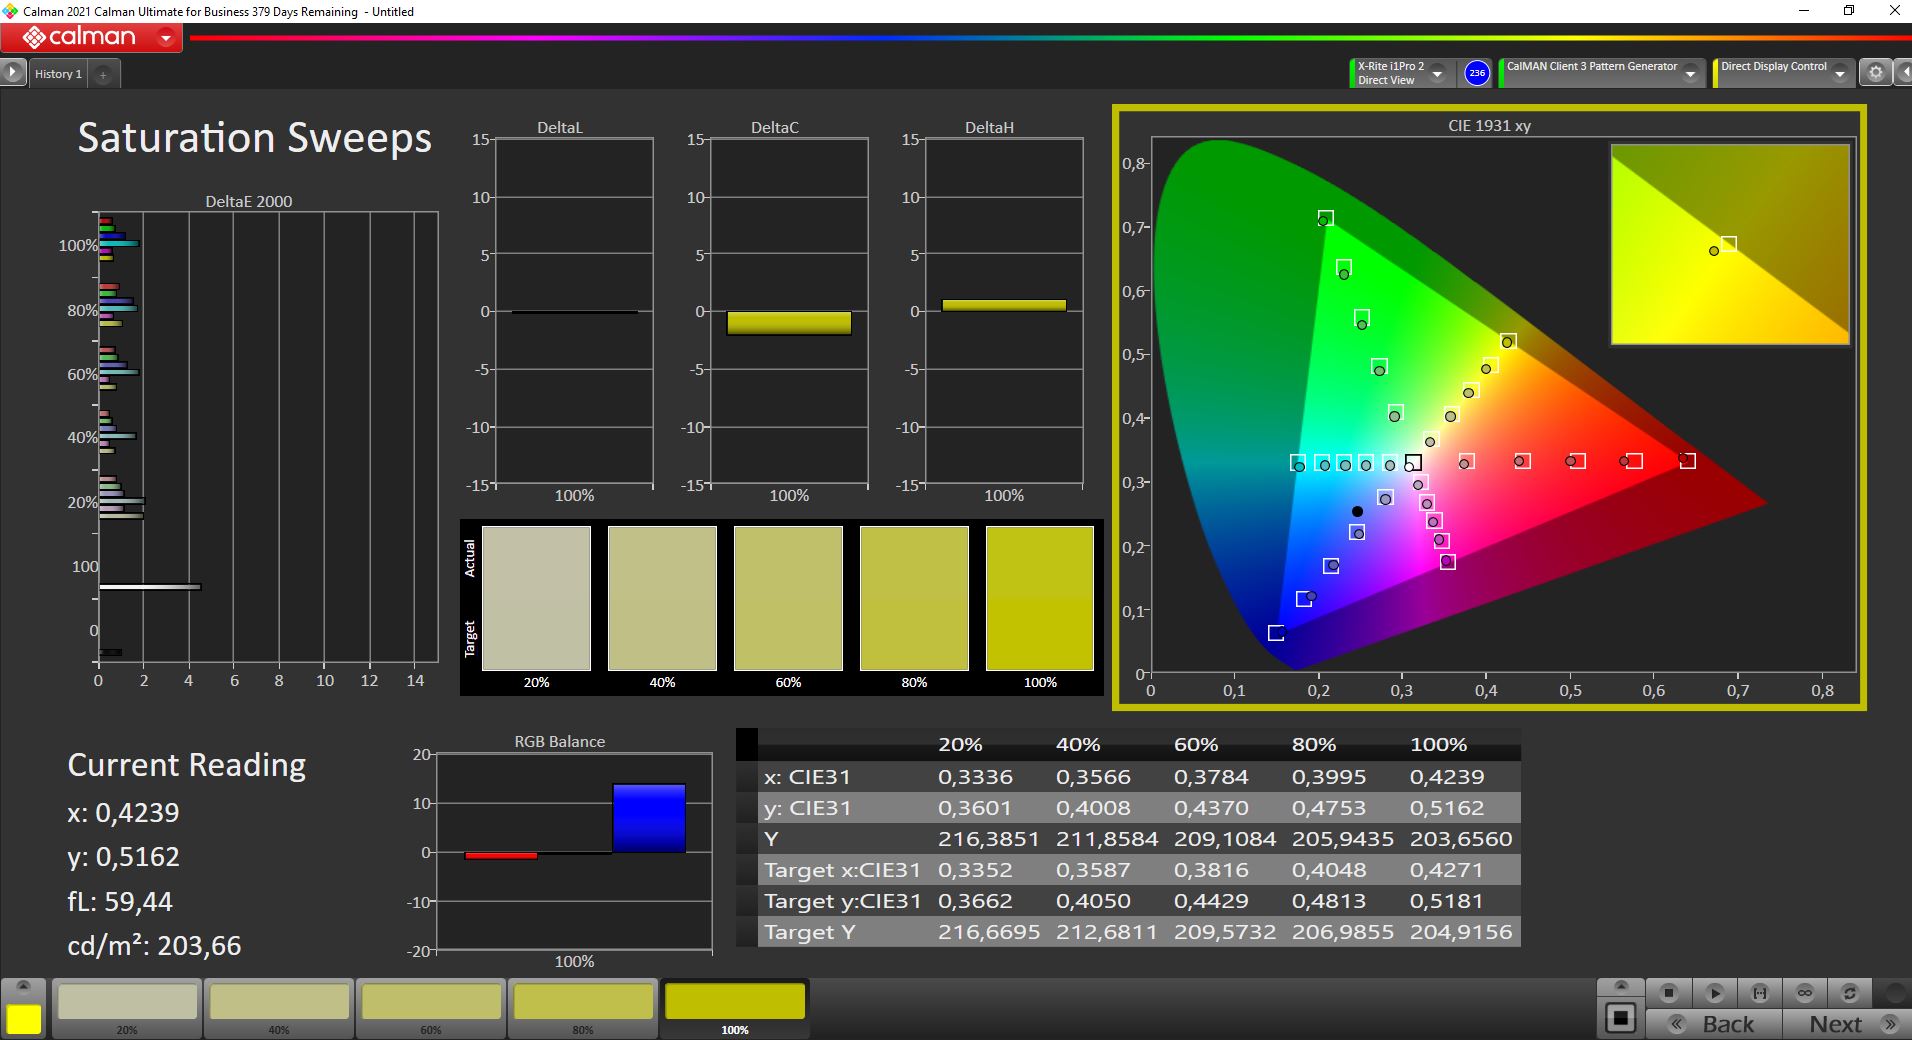
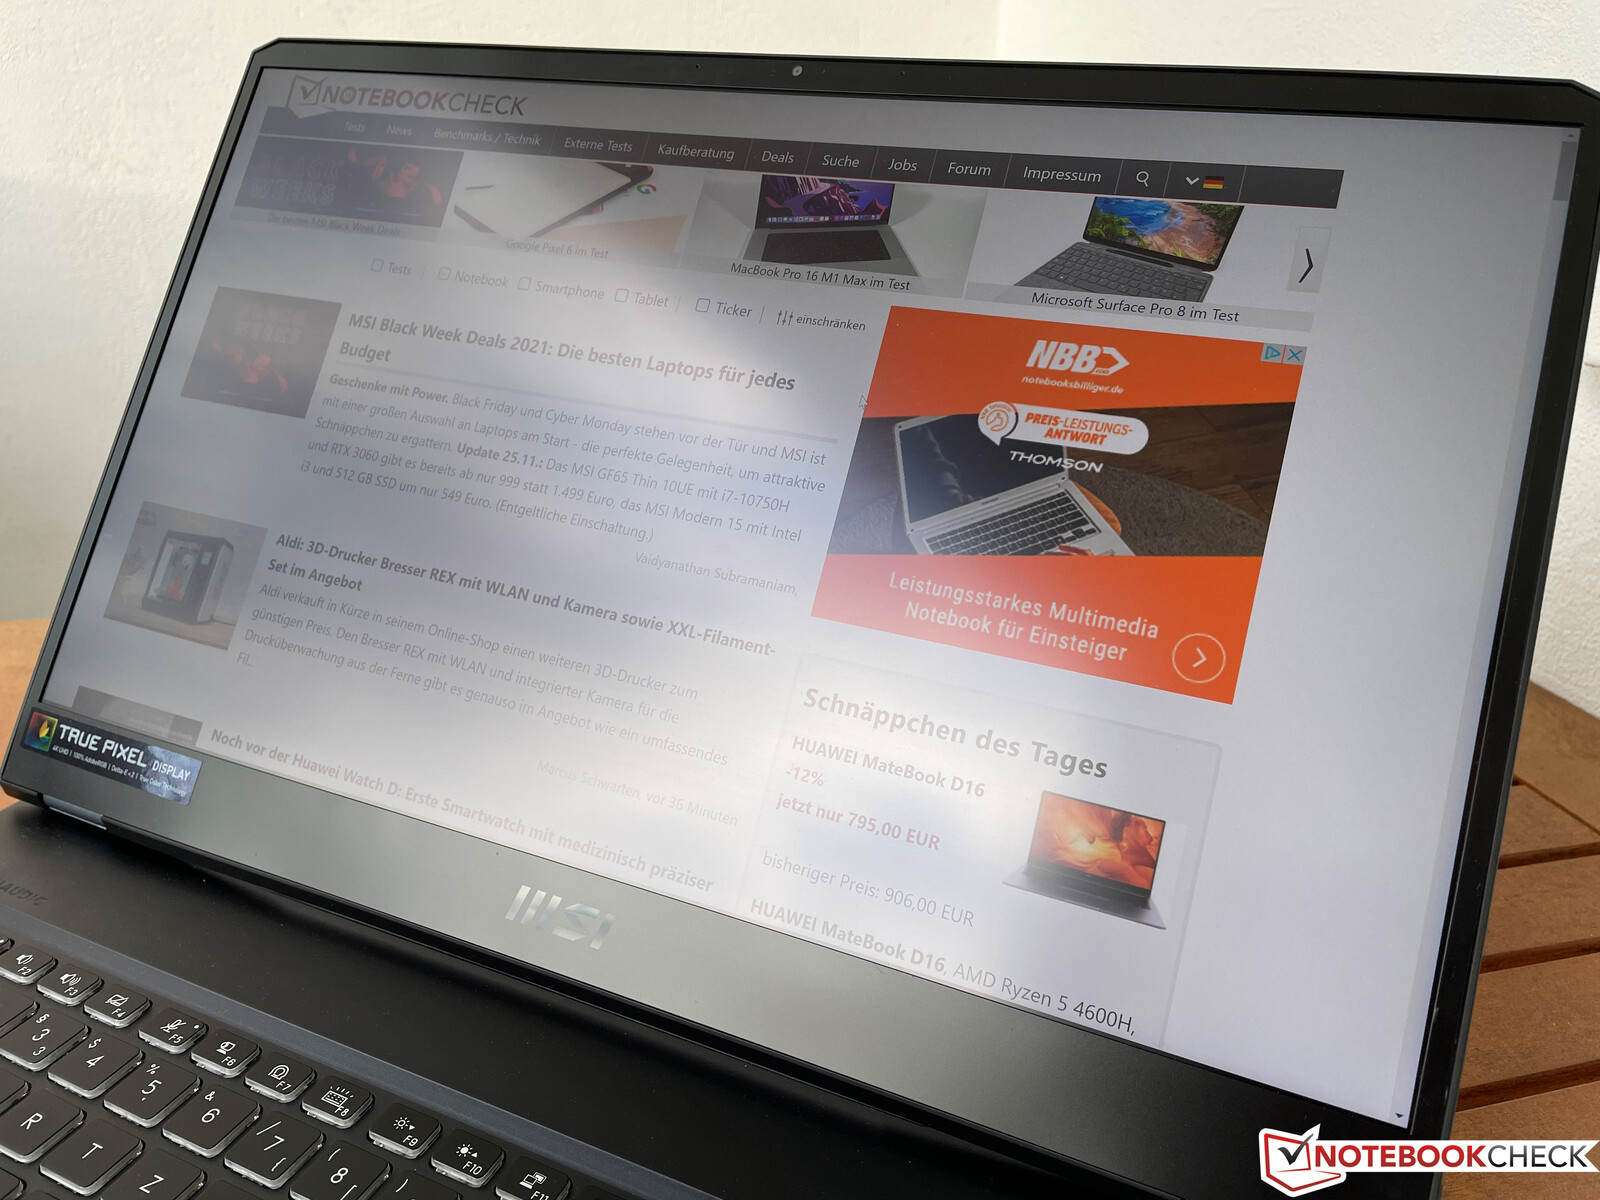
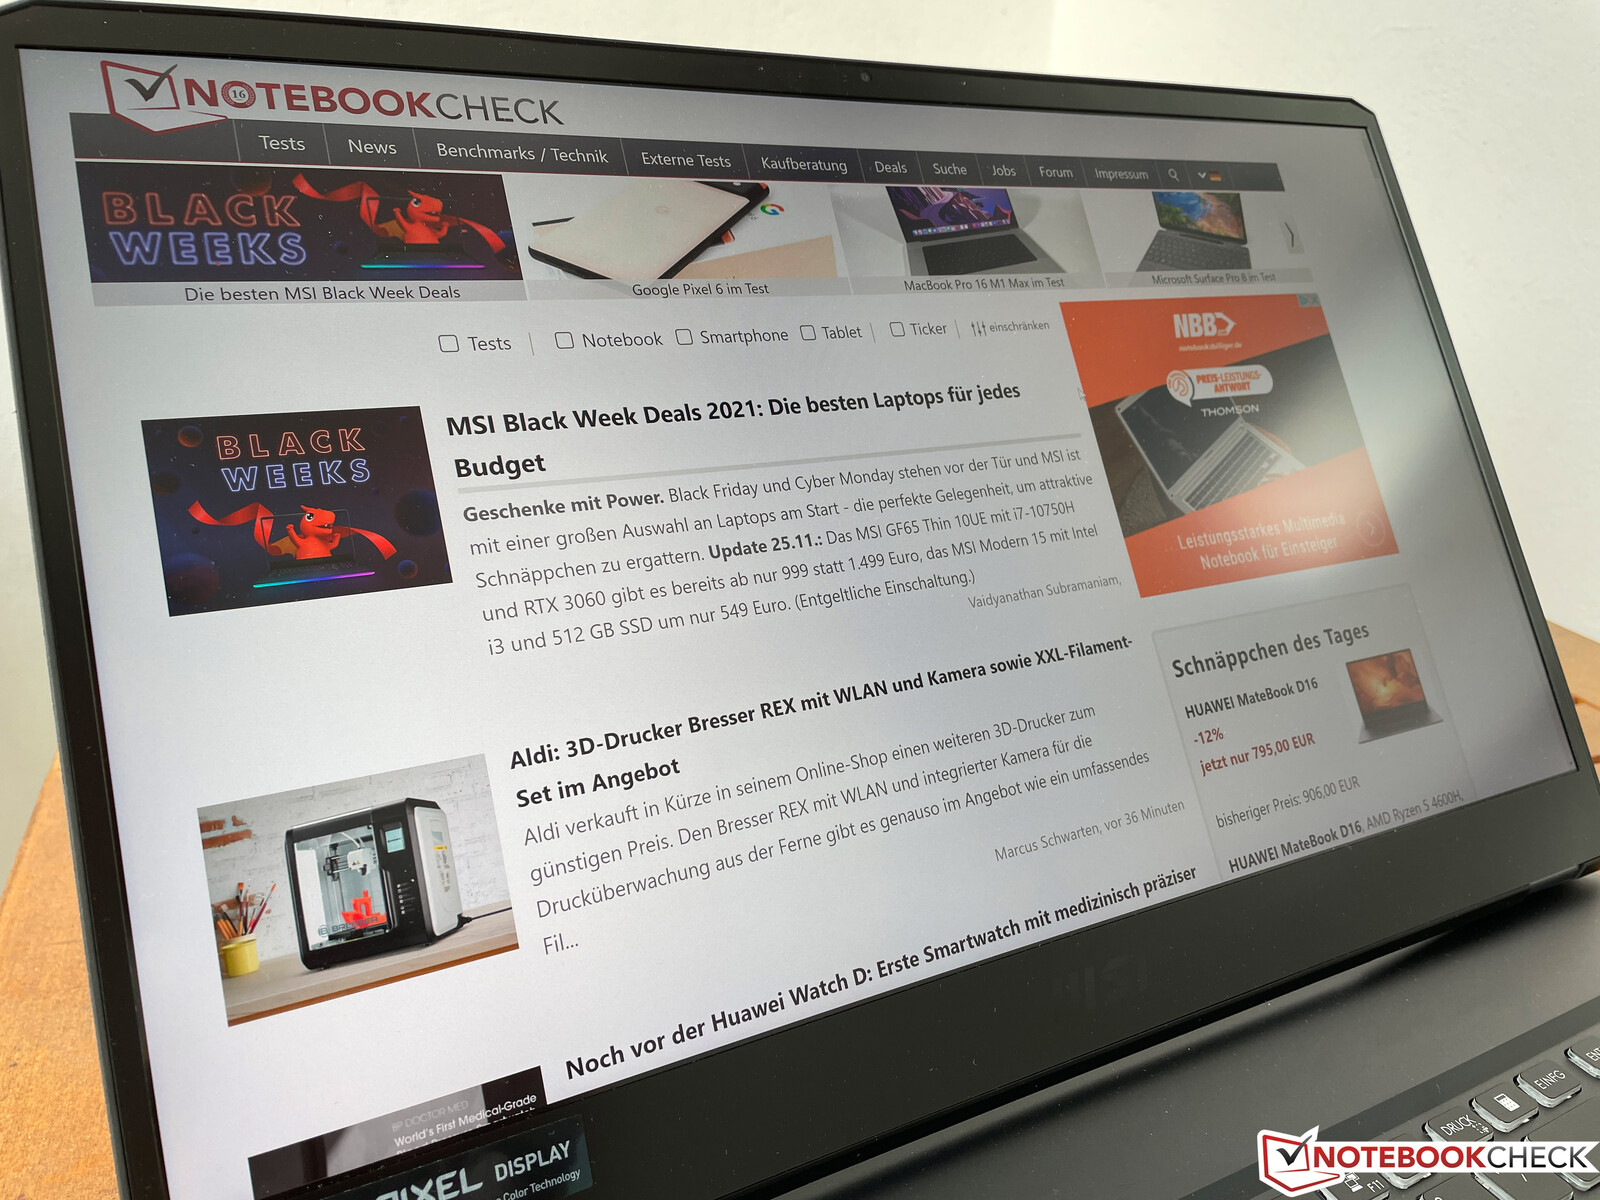
Pantalla - Panel 4K mate con AdobeRGB y 120 Hz

El WE76 está disponible exclusivamente con un panel 4K mate en una relación de aspecto 16:9. Según MSI, el display también cubre el espacio de color AdobeRGB en su totalidad, y una tasa de refresco de 120 Hz asegura una imagen fluida, que también viene activada por defecto. MSI se abstiene de usar los paneles aún más rápidos de sus versiones gaming aquí, lo que tiene sentido, empero.
La impresión subjetiva de imagen del panel es excelente. Las imágenes son extremadamente nítidas, e incluso las áreas brillantes no parecen granuladas. Sin embargo, los colores no son tan vibrantes en comparación con los paneles OLED o mini LED de alta calidad. El brillo medio es de algo más de 400 cd/m², y la relación de contraste supera los 1.200:1. En general, es una mejora notable con respecto a la pantalla 1080p del antiguo MSI WE75pero algunos paneles de alta resolución de la competencia ofrecen mejores resultados.
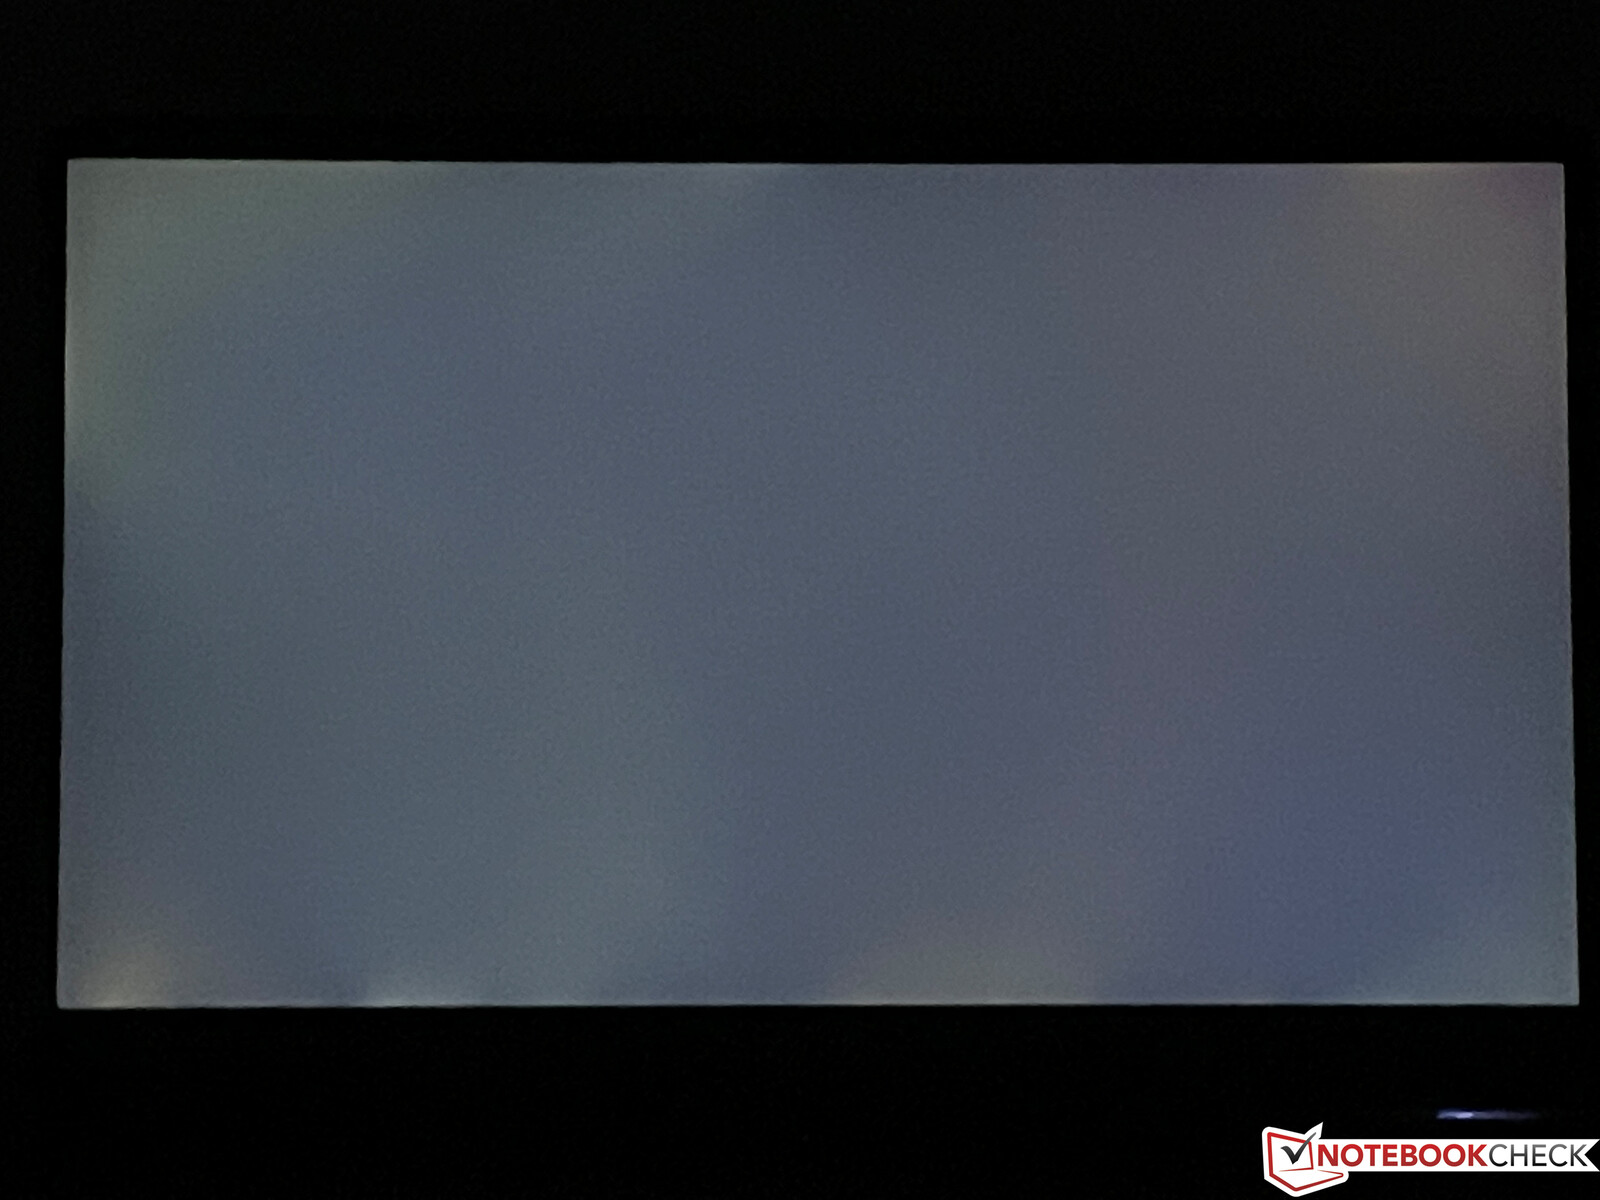
No se usa PWM, y los tiempos de respuesta son muy rápidos, lo que significa que no hay efectos fantasma. Con el brillo máximo, se puede notar un ligero sangrado de pantalla en los bordes cuando se usa un fondo oscuro, pero no se nota en la práctica.
| |||||||||||||||||||||||||
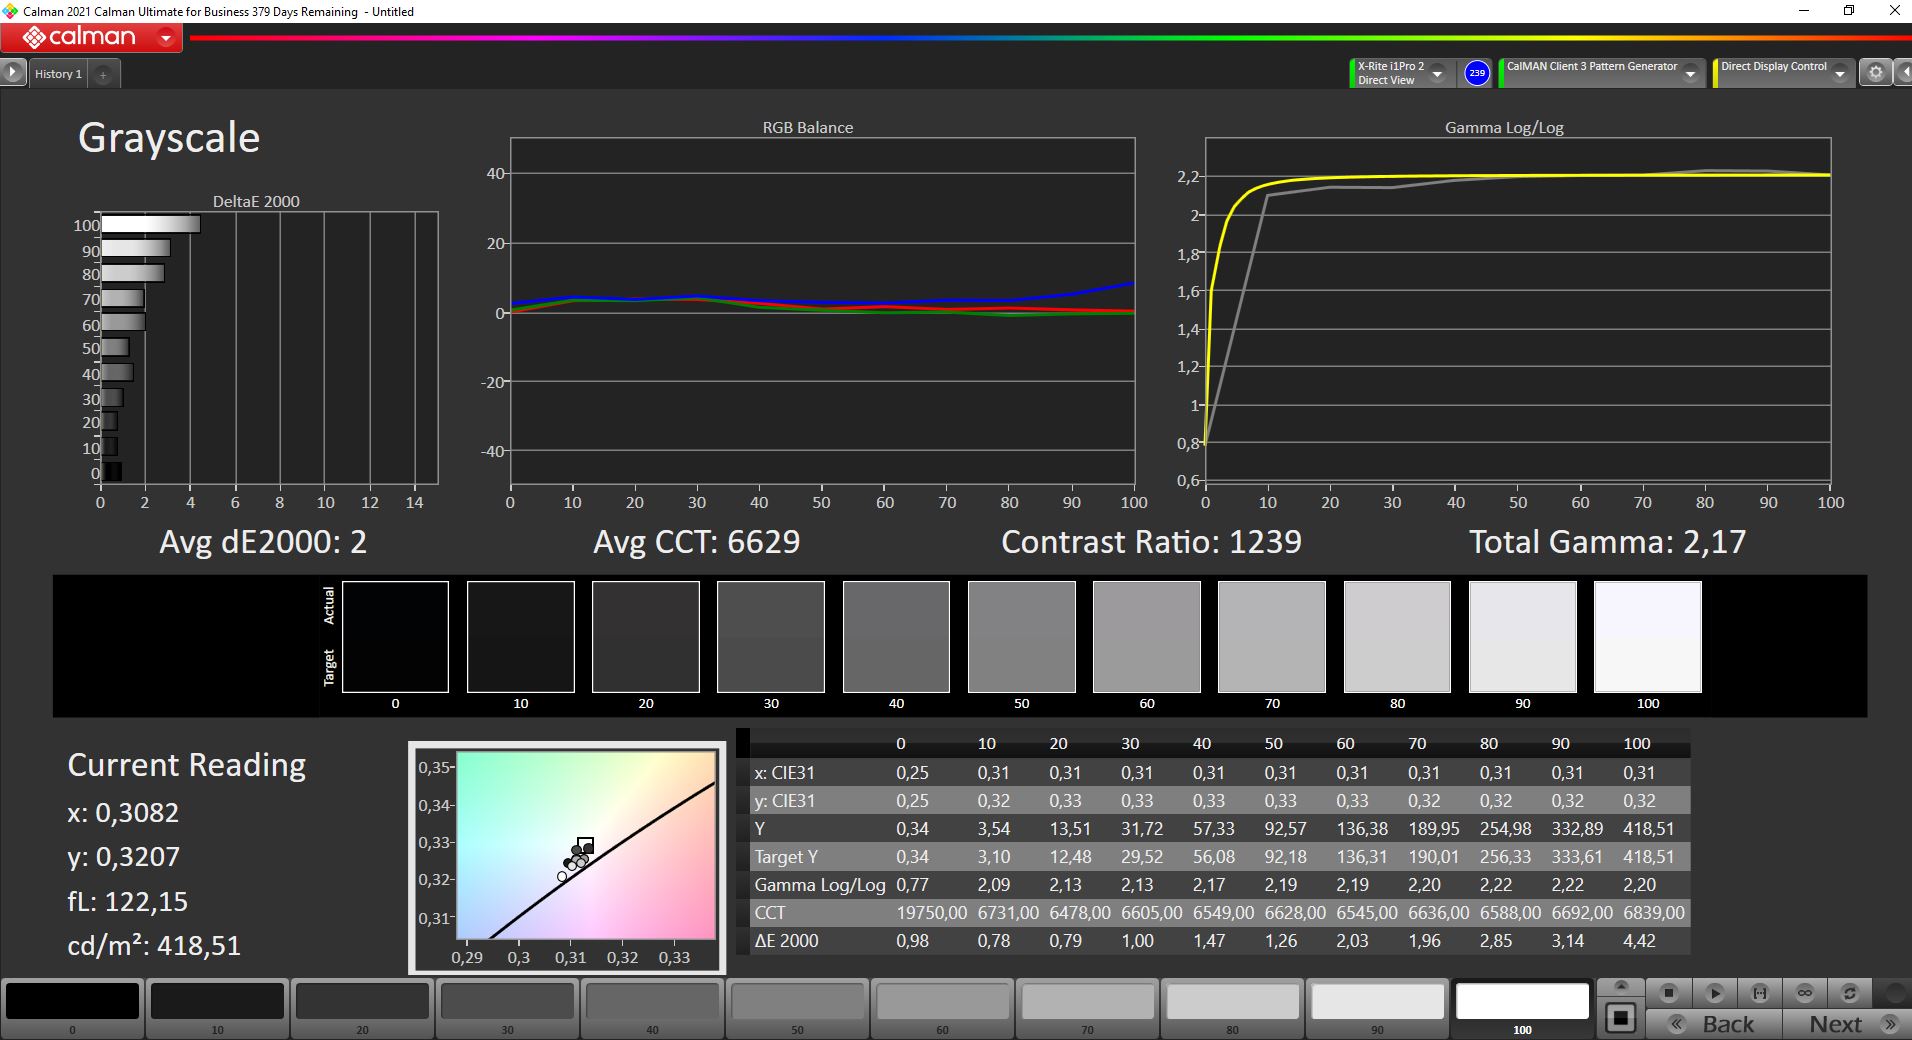
iluminación: 93 %
Brillo con batería: 420 cd/m²
Contraste: 1232:1 (Negro: 0.34 cd/m²)
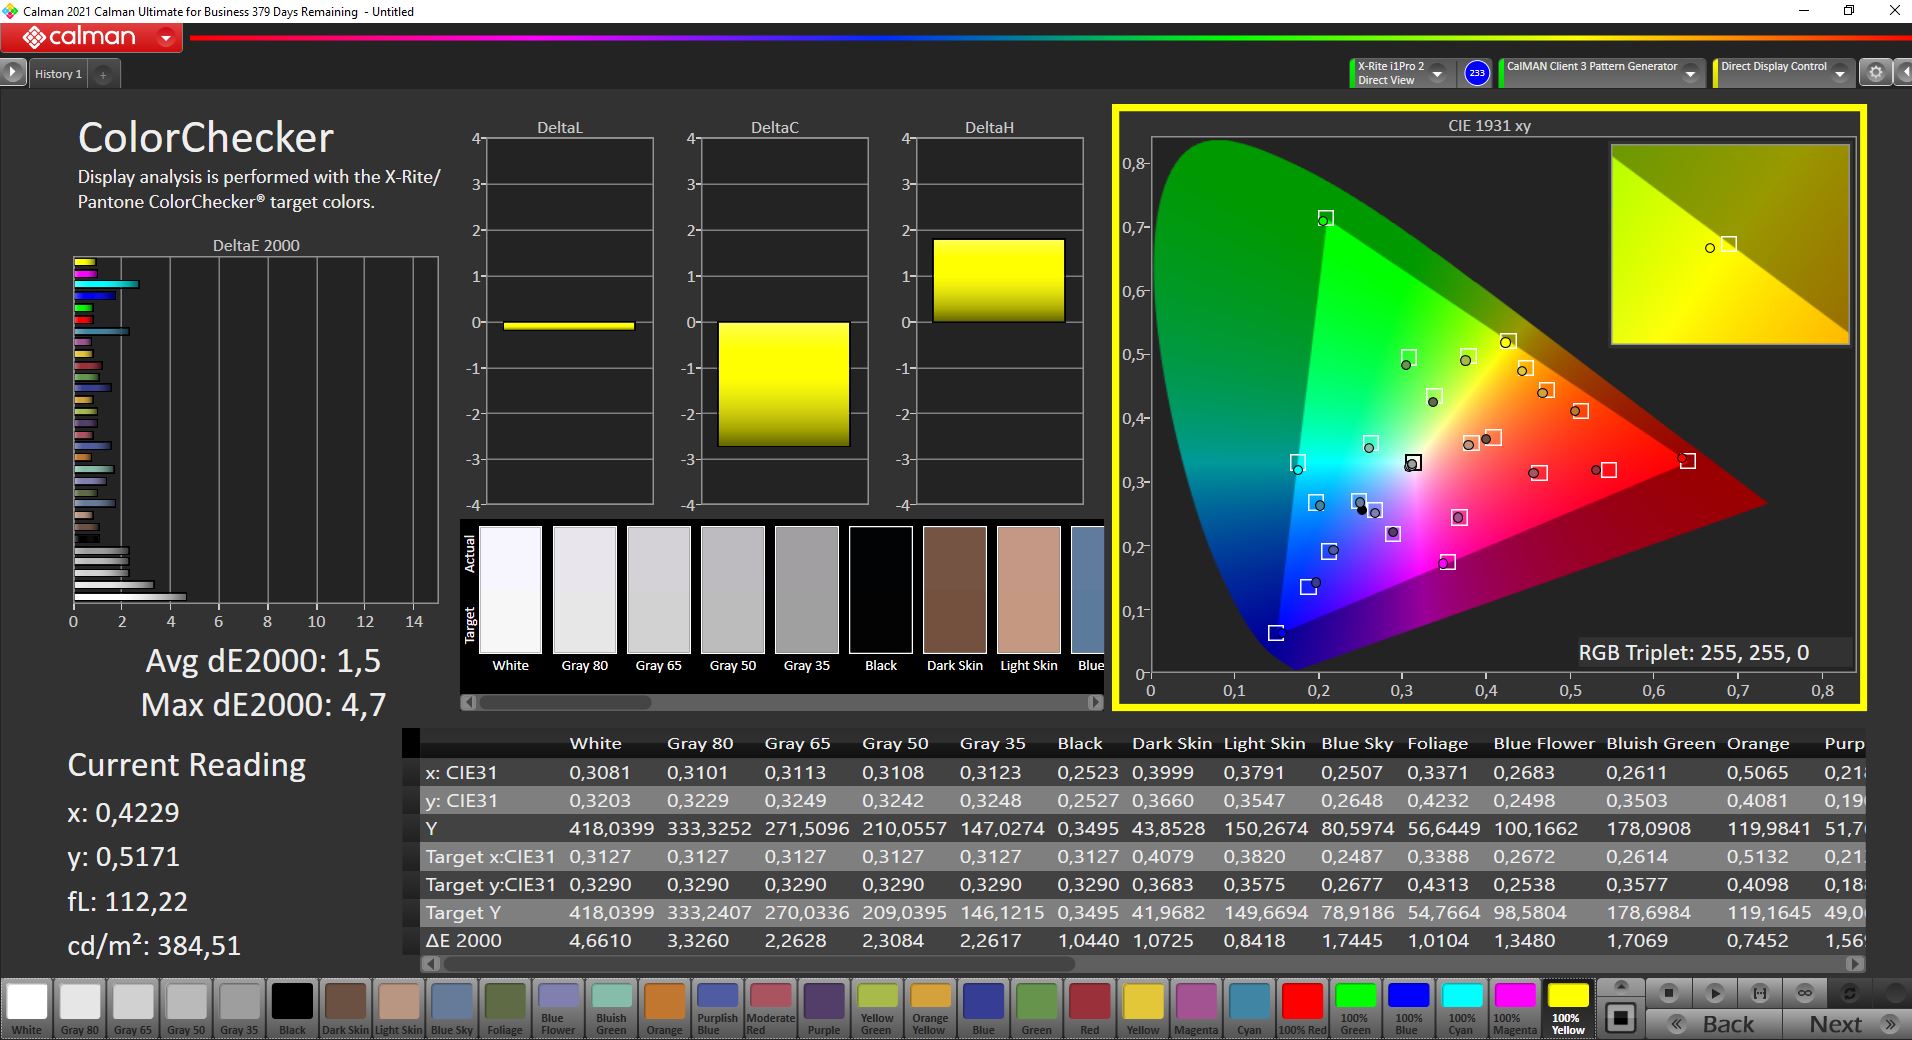
ΔE ColorChecker Calman: 1.5 | ∀{0.5-29.43 Ø4.73}
calibrated: 0.9
ΔE Greyscale Calman: 2 | ∀{0.09-98 Ø4.97}
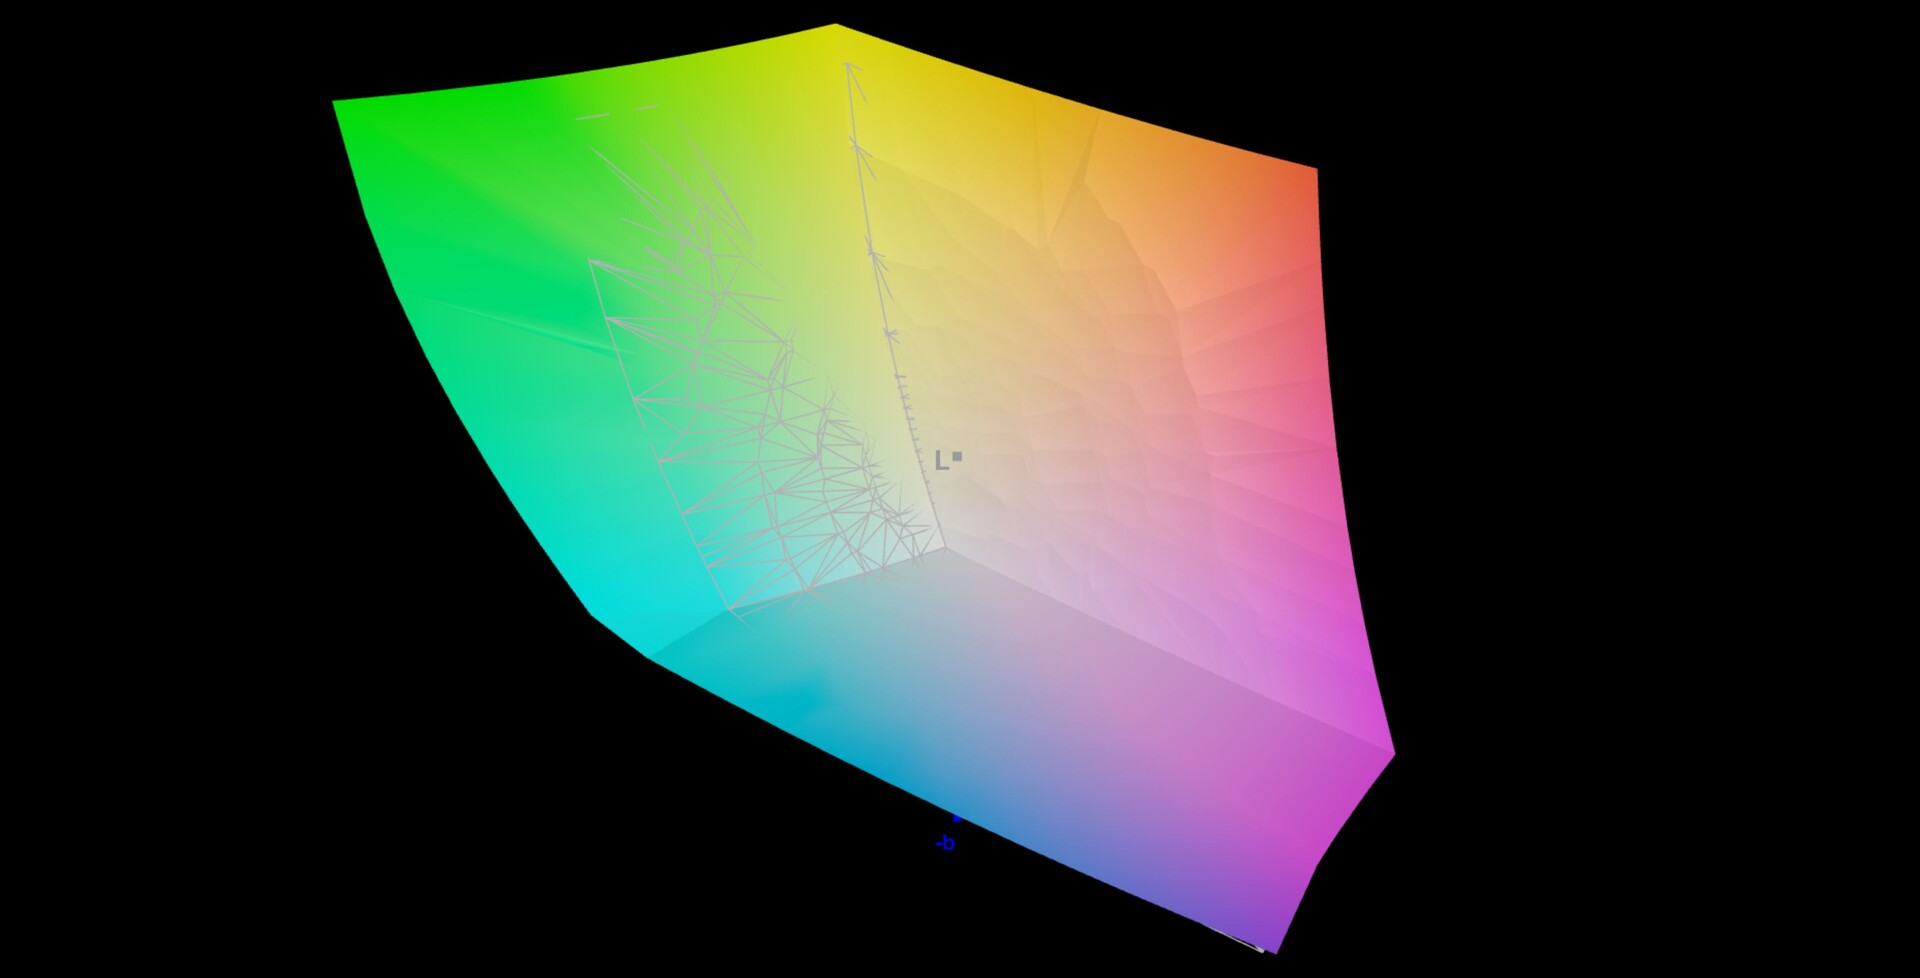
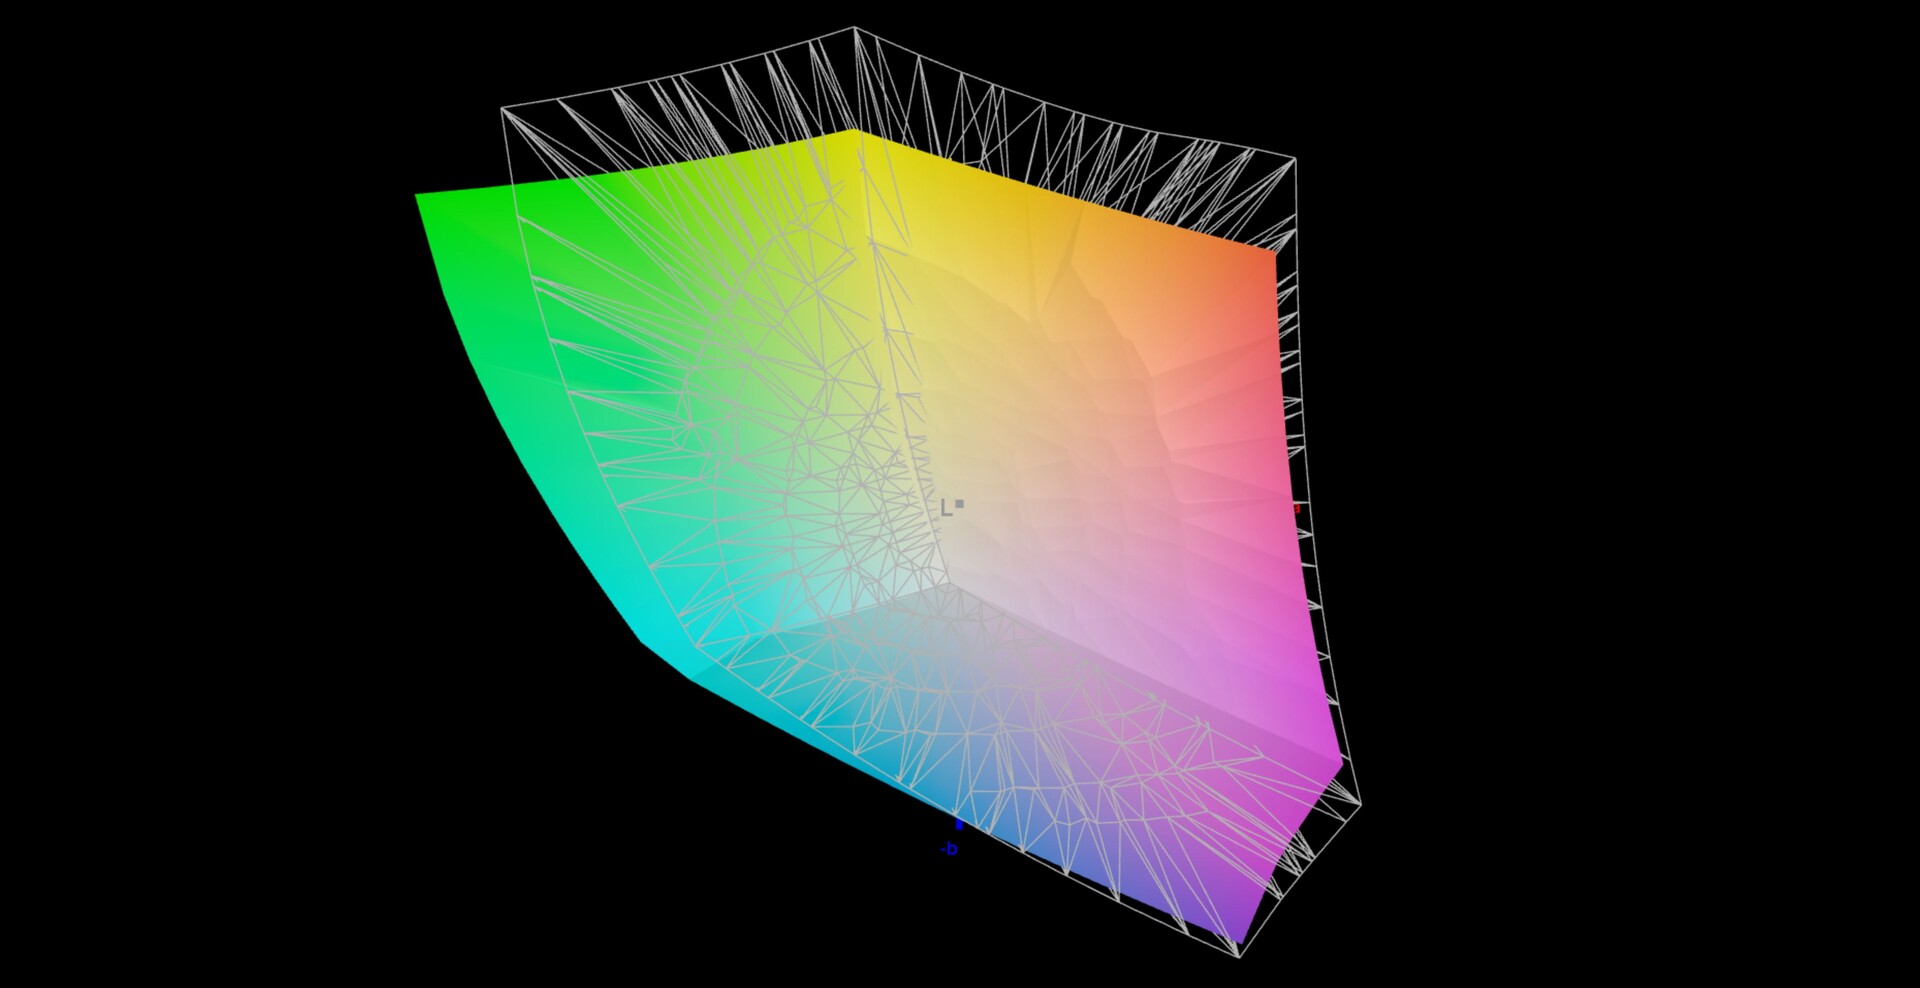
96% AdobeRGB 1998 (Argyll 3D)
99.3% sRGB (Argyll 3D)
82.1% Display P3 (Argyll 3D)
Gamma: 2.17
CCT: 6629 K
| MSI WE76 11UM-456 B173ZAN03.3, IPS, 3840x2160, 17.3" | Lenovo ThinkPad P1 G4-20Y4S0KS00 LP160UQ1-SPB1, IPS LED, 3840x2400, 16" | HP ZBook Fury 15 G8 BOE0969, IPS, 3840x2160, 15.6" | Asus ProArt StudioBook 16 W7600H5A-2BL2 ATNA60YV02-0, OLED, 3840x2400, 16" | Lenovo ThinkPad P17 G2-20YU0025G LP173WF4-SPF7, IPS LED, 1920x1080, 17.3" | HP ZBook Fury 17 G7 119W5EA AUOCD8C, , 3840x2160, 17.3" | MSI WE75 9TK AU Optronics B173HAN04.2, IPS, 1920x1080, 17.3" | |
|---|---|---|---|---|---|---|---|
| Display | 2% | 3% | 9% | -21% | 4% | -22% | |
| Display P3 Coverage (%) | 82.1 | 85.7 4% | 95.9 17% | 99.9 22% | 67.9 -17% | 99.3 21% | 63.2 -23% |
| sRGB Coverage (%) | 99.3 | 99.4 0% | 100 1% | 100 1% | 87.3 -12% | 99.9 1% | 89.9 -9% |
| AdobeRGB 1998 Coverage (%) | 96 | 98.9 3% | 87.3 -9% | 98.6 3% | 63.9 -33% | 86.9 -9% | 64.3 -33% |
| Response Times | -202% | 7% | 85% | -115% | -244% | -132% | |
| Response Time Grey 50% / Grey 80% * (ms) | 17.6 ? | 55.2 ? -214% | 14.8 ? 16% | 2 ? 89% | 39.2 ? -123% | 56 ? -218% | 30.8 ? -75% |
| Response Time Black / White * (ms) | 10.8 ? | 31.2 ? -189% | 11 ? -2% | 2 ? 81% | 22.4 ? -107% | 40 ? -270% | 31.2 ? -189% |
| PWM Frequency (Hz) | 240 ? | ||||||
| Screen | 0% | -59% | -39% | -101% | 5% | -50% | |
| Brightness middle (cd/m²) | 419 | 630 50% | 626 49% | 353 -16% | 361 -14% | 573 37% | 287.3 -31% |
| Brightness (cd/m²) | 416 | 622 50% | 589 42% | 360 -13% | 334 -20% | 586 41% | 280 -33% |
| Brightness Distribution (%) | 93 | 90 -3% | 87 -6% | 96 3% | 87 -6% | 91 -2% | 89 -4% |
| Black Level * (cd/m²) | 0.34 | 0.41 -21% | 0.58 -71% | 0.35 -3% | 0.38 -12% | 0.26 24% | |
| Contrast (:1) | 1232 | 1537 25% | 1079 -12% | 1031 -16% | 1508 22% | 1105 -10% | |
| Colorchecker dE 2000 * | 1.5 | 2.2 -47% | 5.41 -261% | 2.45 -63% | 5.4 -260% | 1.9 -27% | 2.98 -99% |
| Colorchecker dE 2000 max. * | 4.7 | 5 -6% | 9.05 -93% | 3.75 20% | 9.9 -111% | 4.2 11% | 5.08 -8% |
| Colorchecker dE 2000 calibrated * | 0.9 | 1 -11% | 0.6 33% | 2.77 -208% | 3.2 -256% | 0.7 22% | 3.06 -240% |
| Greyscale dE 2000 * | 2 | 2.7 -35% | 6.2 -210% | 1.88 6% | 6.5 -225% | 2.9 -45% | 3 -50% |
| Gamma | 2.17 101% | 2.26 97% | 2.66 83% | 2.31 95% | 2.23 99% | 2.1 105% | 2.28 96% |
| CCT | 6629 98% | 6886 94% | 6101 107% | 6441 101% | 7351 88% | 6217 105% | 6993 93% |
| Color Space (Percent of AdobeRGB 1998) (%) | 77.6 | 58.1 | |||||
| Color Space (Percent of sRGB) (%) | 100 | 89.5 | |||||
| Media total (Programa/Opciones) | -67% /
-28% | -16% /
-36% | 18% /
-6% | -79% /
-86% | -78% /
-31% | -68% /
-56% |
* ... más pequeño es mejor
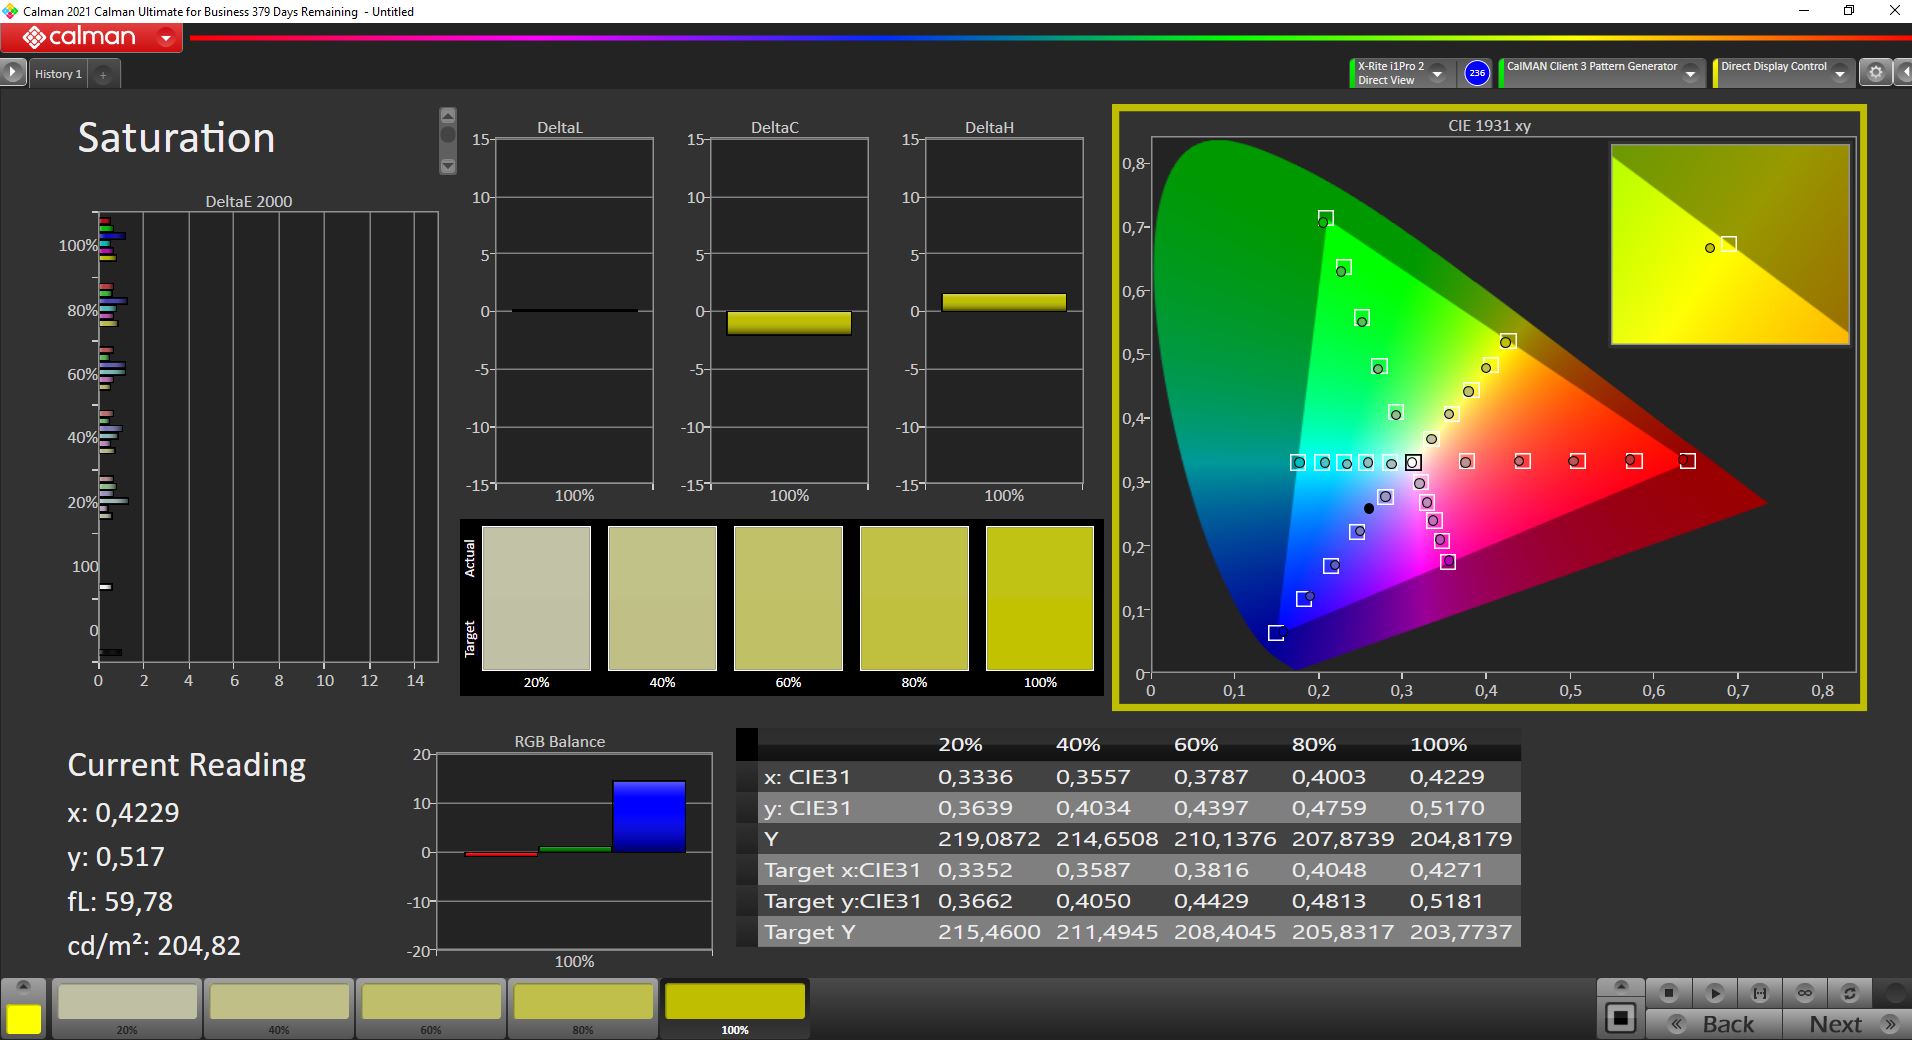
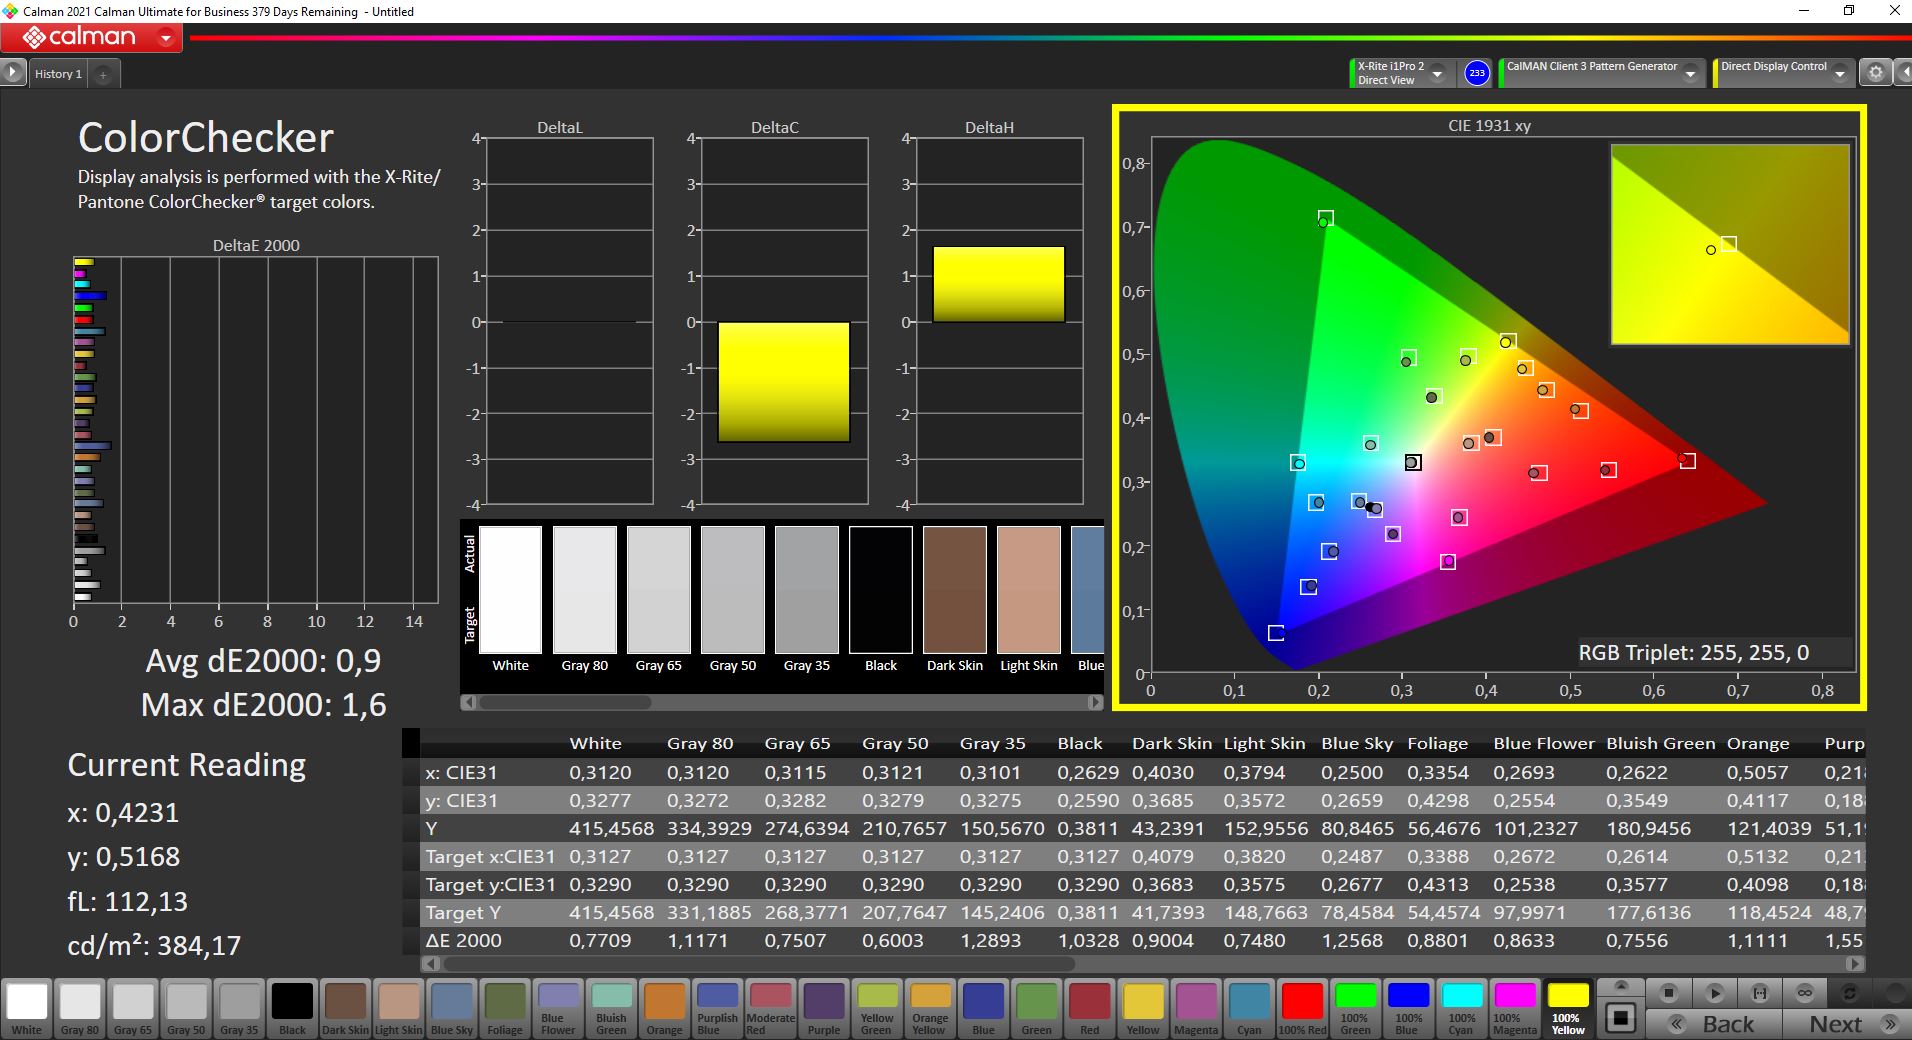
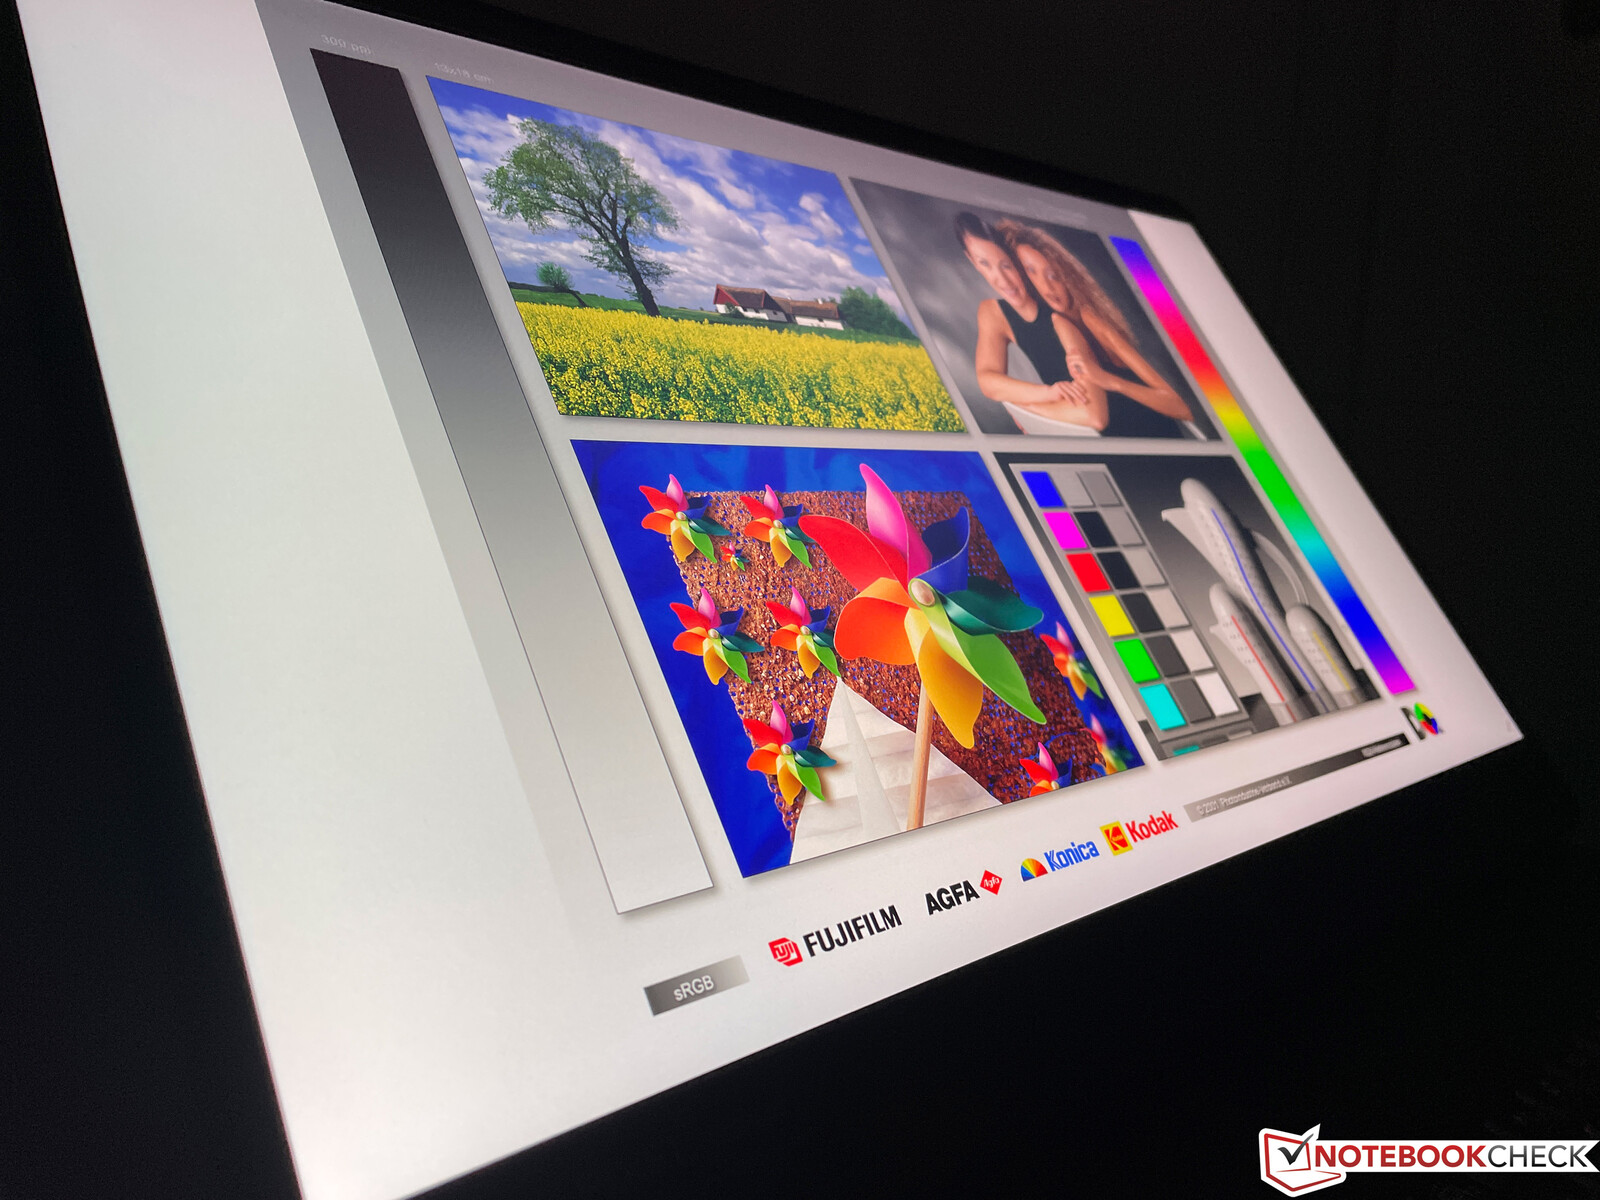
Según el fabricante, el display 4K cubre el espacio de color AdobeRGB en su totalidad; medimos un índice del 96%. MSI ha instalado el software TrueColor, que puede usarse para cambiar el espacio de color. Usamos el modo AdobeRGB por defecto
Nuestro análisis (CalMAN y X-Rite i1 Pro 2) muestra que todos los colores están por debajo de la desviación importante de 3 incluso fuera de la caja. Sin embargo, aún pudimos mejorar un poco la reproducción de la escala de grises con nuestro calibrado (el perfil correspondiente se puede descargar arriba). Por lo tanto, el panel 4K es adecuado para editar imágenes/vídeos sin problemas, pero el contenido HDR no es compatible

Tiempos de respuesta del display
| ↔ Tiempo de respuesta de Negro a Blanco | ||
|---|---|---|
| 10.8 ms ... subida ↗ y bajada ↘ combinada | ↗ 5.6 ms subida | 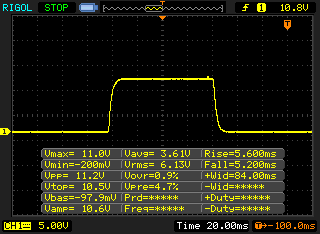 |
| ↘ 5.2 ms bajada | ||
| La pantalla mostró buenos tiempos de respuesta en nuestros tests pero podría ser demasiado lenta para los jugones competitivos. En comparación, todos los dispositivos de prueba van de ##min### (mínimo) a 240 (máximo) ms. » 29 % de todos los dispositivos son mejores. Esto quiere decir que el tiempo de respuesta medido es mejor que la media (19.9 ms) de todos los dispositivos testados. | ||
| ↔ Tiempo de respuesta 50% Gris a 80% Gris | ||
| 17.6 ms ... subida ↗ y bajada ↘ combinada | ↗ 8.4 ms subida | 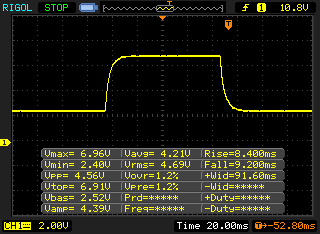 |
| ↘ 9.2 ms bajada | ||
| La pantalla mostró buenos tiempos de respuesta en nuestros tests pero podría ser demasiado lenta para los jugones competitivos. En comparación, todos los dispositivos de prueba van de ##min### (mínimo) a 636 (máximo) ms. » 31 % de todos los dispositivos son mejores. Esto quiere decir que el tiempo de respuesta medido es mejor que la media (31.1 ms) de todos los dispositivos testados. | ||
Parpadeo de Pantalla / PWM (Pulse-Width Modulation)
| Parpadeo de Pantalla / PWM no detectado | 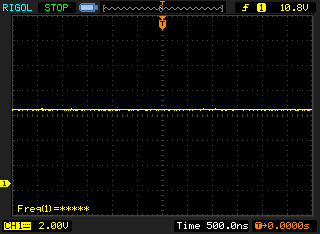 | ||
Comparación: 52 % de todos los dispositivos testados no usaron PWM para atenuar el display. Si se usó, medimos una media de 7791 (mínimo: 5 - máxmo: 343500) Hz. | |||
El WE76 no es ciertamente un dispositivo que se vaya a utilizar a menudo sobre la marcha, pero la superficie mate del panel es naturalmente beneficiosa en exteriores, y es muy cómodo utilizarlo al menos en días nublados. La estabilidad del ángulo de visión de la pantalla IPS no deja lugar a críticas
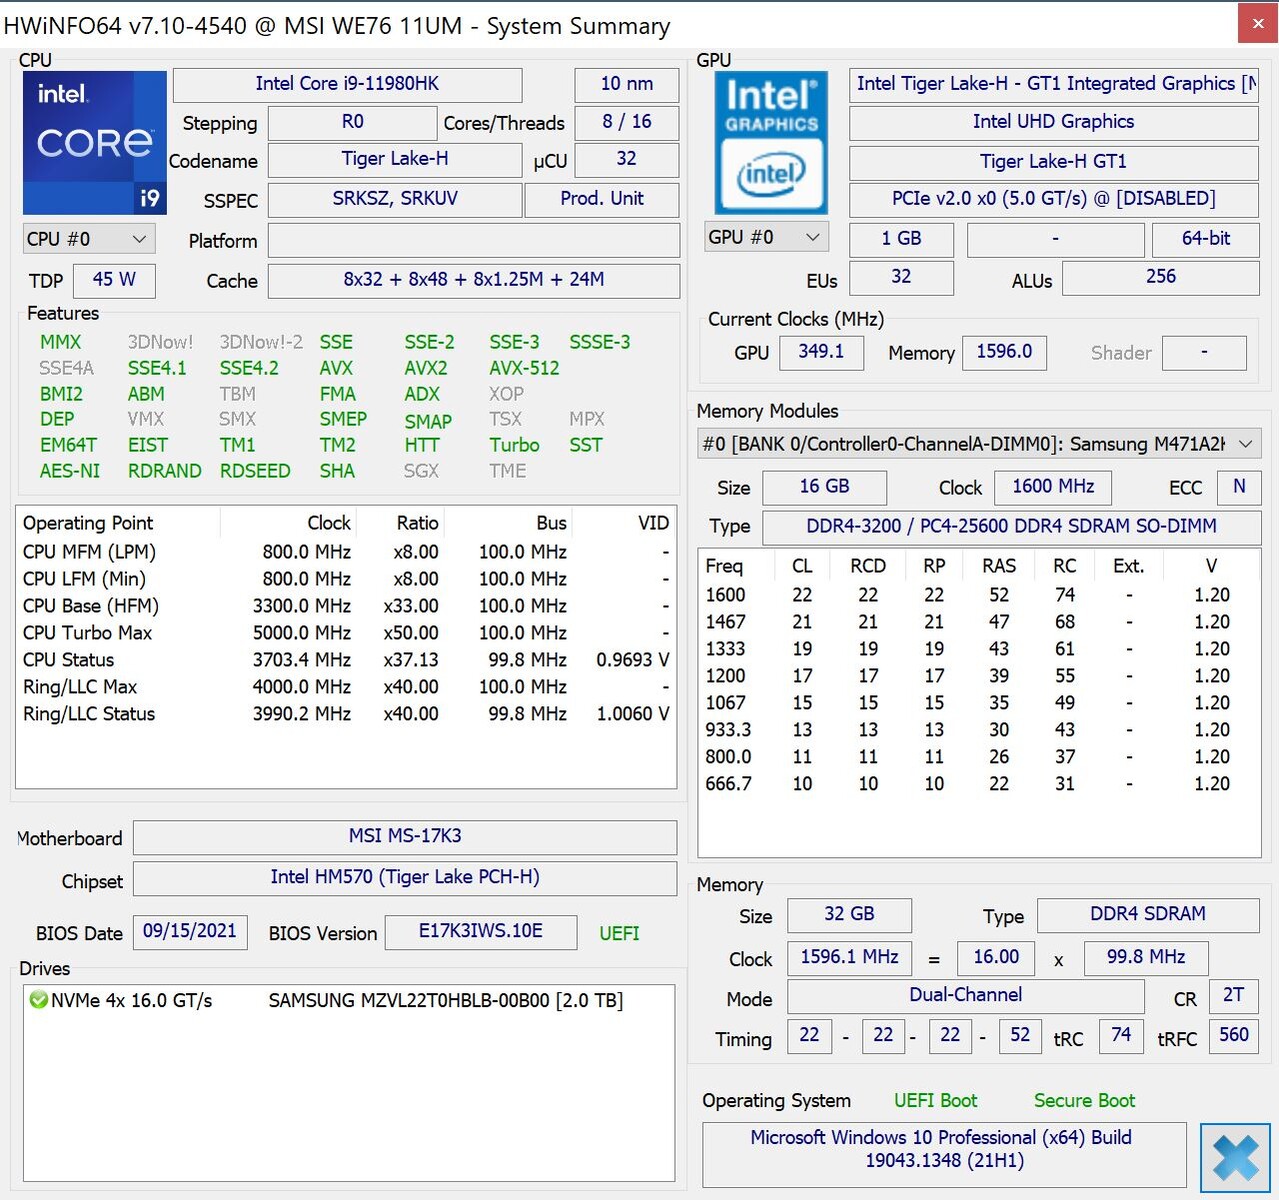
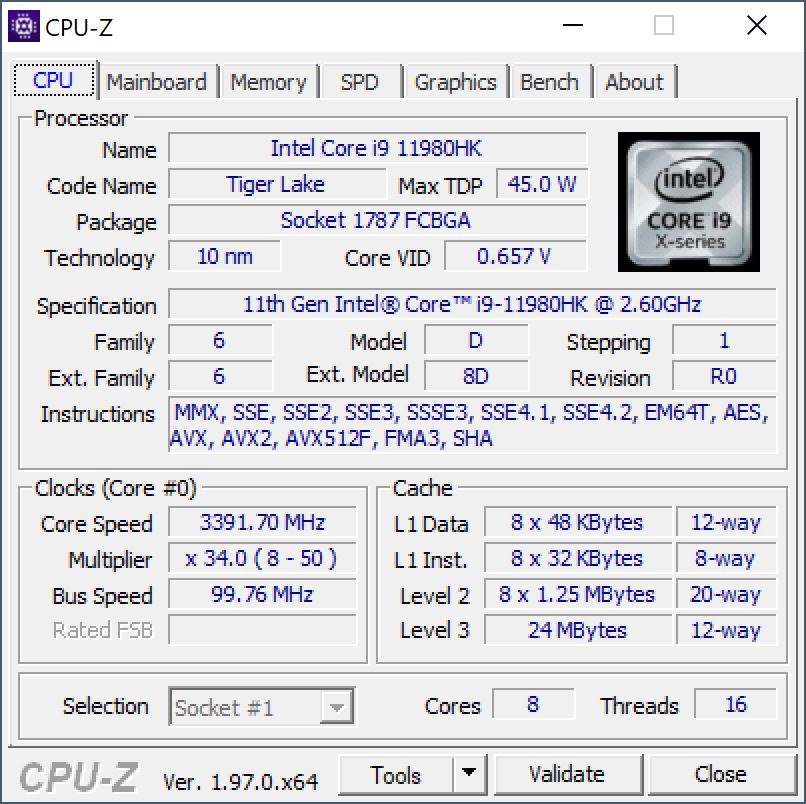
Rendimiento - WE76 con Core i9 y RTX A5000
Condiciones de la prueba
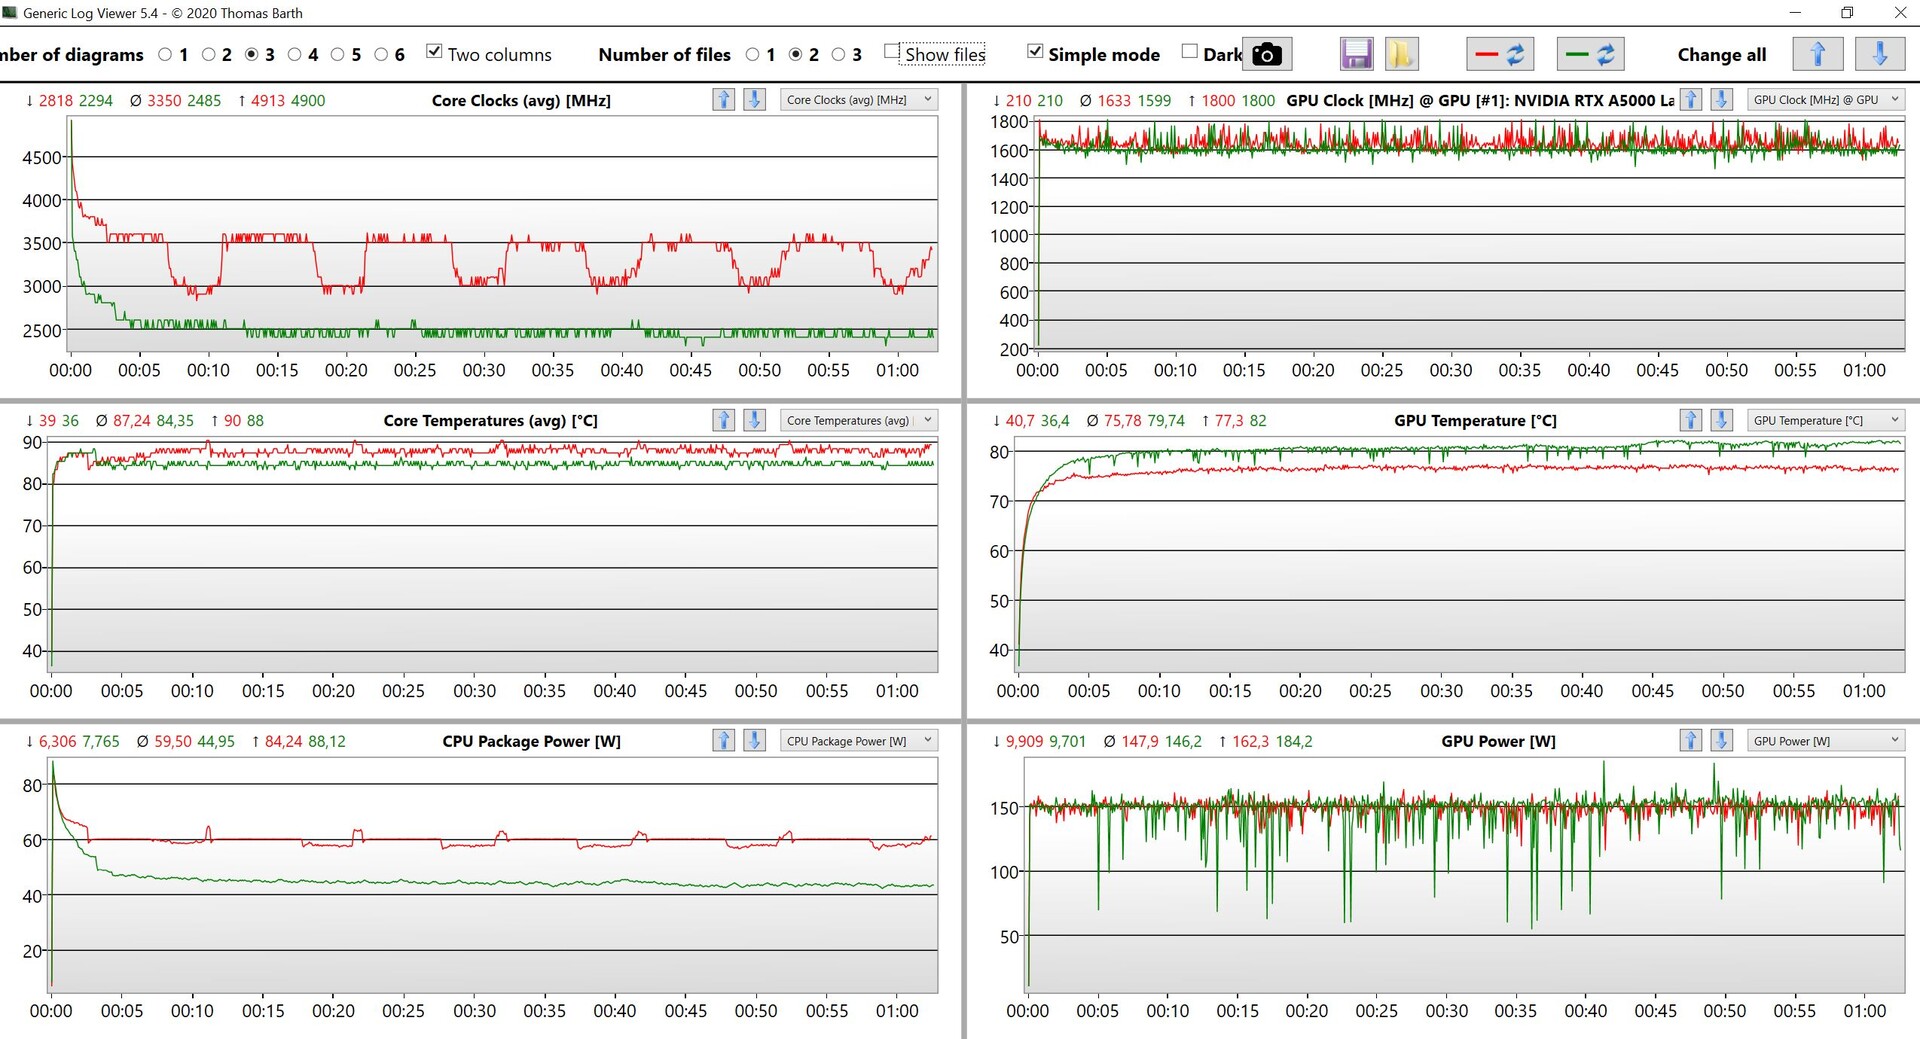
Además de los ajustes normales de Windows, MSI ofrece diferentes ajustes de rendimiento con el MSI Center Pro preinstalado. Ejecutamos las siguientes pruebas usando la configuración equilibrada, pero en algunos aspectos, también echaremos un vistazo a los efectos de los otros modos de rendimiento. El modo de Alto Rendimiento afecta principalmente al rendimiento en el test de estrés, que es cuando se estresa tanto la CPU como la GPU
Procesador
MSI ha optado por el IntelCore i9-11980HK que rinde muy bien en nuestras pruebas y suele situarse en lo más alto de la comparación. El procesador puede consumir un máximo de 84 vatios, pero se estabiliza rápidamente en 70 vatios y más tarde en ~62 vatios. Esto también sería posible con unCore i7-11800H como podemos ver en el ThinkPad P17 Gen 2. Sin embargo, el AMDRyzen 9 5900HX es un poco más rápido bajo una configuración TDP comparable (~64 vatios en el caso del Asus ROG Zephyrus Duo 15).
El rendimiento de la CPU se reduce notablemente en batería, ya que el TDP cae rápidamente a sólo 45 vatios y luego a 35 vatios. Por tanto, deberías esperar un déficit de alrededor del 30%-40% cuando se usan todos los núcleos. Puedes encontrar más comparaciones en nuestro Artículo de Benchmarks de CPU.
Cinebench R15 Multi endurance test
Cinebench R23: Multi Core | Single Core
Cinebench R20: CPU (Multi Core) | CPU (Single Core)
Cinebench R15: CPU Multi 64Bit | CPU Single 64Bit
Blender: v2.79 BMW27 CPU
7-Zip 18.03: 7z b 4 | 7z b 4 -mmt1
Geekbench 5.5: Multi-Core | Single-Core
HWBOT x265 Benchmark v2.2: 4k Preset
LibreOffice : 20 Documents To PDF
R Benchmark 2.5: Overall mean
| CPU Performance rating | |
| Media de la clase Workstation | |
| MSI WE76 11UM-456 -1! | |
| Lenovo ThinkPad P1 G4-20Y4S0KS00 | |
| Medio Intel Core i9-11980HK | |
| Asus ProArt StudioBook 16 W7600H5A-2BL2 | |
| Lenovo ThinkPad P17 G2-20YU0025G | |
| HP ZBook Fury 15 G8 -2! | |
| MSI WE75 9TK -10! | |
| HP ZBook Fury 17 G7 119W5EA | |
| Cinebench R23 / Multi Core | |
| Media de la clase Workstation (14055 - 38520, n=25, últimos 2 años) | |
| MSI WE76 11UM-456 | |
| Lenovo ThinkPad P17 G2-20YU0025G | |
| HP ZBook Fury 15 G8 | |
| Lenovo ThinkPad P1 G4-20Y4S0KS00 | |
| Medio Intel Core i9-11980HK (8459 - 13387, n=2) | |
| Asus ProArt StudioBook 16 W7600H5A-2BL2 | |
| HP ZBook Fury 17 G7 119W5EA | |
| Cinebench R23 / Single Core | |
| Media de la clase Workstation (1712 - 2228, n=25, últimos 2 años) | |
| MSI WE76 11UM-456 | |
| HP ZBook Fury 15 G8 | |
| Medio Intel Core i9-11980HK (1505 - 1613, n=2) | |
| Lenovo ThinkPad P1 G4-20Y4S0KS00 | |
| Lenovo ThinkPad P17 G2-20YU0025G | |
| Asus ProArt StudioBook 16 W7600H5A-2BL2 | |
| HP ZBook Fury 17 G7 119W5EA | |
| Cinebench R20 / CPU (Multi Core) | |
| Media de la clase Workstation (5471 - 15043, n=25, últimos 2 años) | |
| Lenovo ThinkPad P17 G2-20YU0025G | |
| HP ZBook Fury 15 G8 | |
| Lenovo ThinkPad P1 G4-20Y4S0KS00 | |
| Medio Intel Core i9-11980HK (3779 - 5256, n=8) | |
| MSI WE76 11UM-456 | |
| Asus ProArt StudioBook 16 W7600H5A-2BL2 | |
| HP ZBook Fury 17 G7 119W5EA | |
| MSI WE75 9TK | |
| Cinebench R20 / CPU (Single Core) | |
| Media de la clase Workstation (671 - 857, n=25, últimos 2 años) | |
| MSI WE76 11UM-456 | |
| HP ZBook Fury 15 G8 | |
| Lenovo ThinkPad P1 G4-20Y4S0KS00 | |
| Medio Intel Core i9-11980HK (572 - 622, n=7) | |
| Lenovo ThinkPad P17 G2-20YU0025G | |
| Asus ProArt StudioBook 16 W7600H5A-2BL2 | |
| HP ZBook Fury 17 G7 119W5EA | |
| MSI WE75 9TK | |
| Cinebench R15 / CPU Multi 64Bit | |
| Media de la clase Workstation (2489 - 5810, n=25, últimos 2 años) | |
| MSI WE76 11UM-456 | |
| Lenovo ThinkPad P17 G2-20YU0025G | |
| Medio Intel Core i9-11980HK (1696 - 2287, n=7) | |
| Lenovo ThinkPad P1 G4-20Y4S0KS00 | |
| Asus ProArt StudioBook 16 W7600H5A-2BL2 | |
| HP ZBook Fury 15 G8 | |
| HP ZBook Fury 17 G7 119W5EA | |
| MSI WE75 9TK | |
| Cinebench R15 / CPU Single 64Bit | |
| Media de la clase Workstation (191.4 - 328, n=25, últimos 2 años) | |
| MSI WE76 11UM-456 | |
| HP ZBook Fury 15 G8 | |
| Lenovo ThinkPad P1 G4-20Y4S0KS00 | |
| Lenovo ThinkPad P17 G2-20YU0025G | |
| Medio Intel Core i9-11980HK (224 - 244, n=6) | |
| Asus ProArt StudioBook 16 W7600H5A-2BL2 | |
| HP ZBook Fury 17 G7 119W5EA | |
| MSI WE75 9TK | |
| Blender / v2.79 BMW27 CPU | |
| HP ZBook Fury 17 G7 119W5EA | |
| Asus ProArt StudioBook 16 W7600H5A-2BL2 | |
| HP ZBook Fury 15 G8 | |
| Lenovo ThinkPad P1 G4-20Y4S0KS00 | |
| Medio Intel Core i9-11980HK (231 - 284, n=4) | |
| Lenovo ThinkPad P17 G2-20YU0025G | |
| Media de la clase Workstation (91 - 261, n=25, últimos 2 años) | |
| 7-Zip 18.03 / 7z b 4 | |
| Media de la clase Workstation (54741 - 116969, n=25, últimos 2 años) | |
| MSI WE76 11UM-456 | |
| Medio Intel Core i9-11980HK (45226 - 56759, n=5) | |
| Lenovo ThinkPad P1 G4-20Y4S0KS00 | |
| HP ZBook Fury 15 G8 | |
| Lenovo ThinkPad P17 G2-20YU0025G | |
| Asus ProArt StudioBook 16 W7600H5A-2BL2 | |
| HP ZBook Fury 17 G7 119W5EA | |
| 7-Zip 18.03 / 7z b 4 -mmt1 | |
| Media de la clase Workstation (5126 - 6960, n=25, últimos 2 años) | |
| Lenovo ThinkPad P1 G4-20Y4S0KS00 | |
| HP ZBook Fury 15 G8 | |
| MSI WE76 11UM-456 | |
| Medio Intel Core i9-11980HK (5428 - 5735, n=5) | |
| HP ZBook Fury 17 G7 119W5EA | |
| Lenovo ThinkPad P17 G2-20YU0025G | |
| Asus ProArt StudioBook 16 W7600H5A-2BL2 | |
| Geekbench 5.5 / Multi-Core | |
| Media de la clase Workstation (11542 - 25554, n=25, últimos 2 años) | |
| MSI WE76 11UM-456 | |
| Medio Intel Core i9-11980HK (8786 - 10081, n=5) | |
| Lenovo ThinkPad P1 G4-20Y4S0KS00 | |
| Asus ProArt StudioBook 16 W7600H5A-2BL2 | |
| Lenovo ThinkPad P17 G2-20YU0025G | |
| HP ZBook Fury 17 G7 119W5EA | |
| Geekbench 5.5 / Single-Core | |
| Media de la clase Workstation (1781 - 2183, n=25, últimos 2 años) | |
| MSI WE76 11UM-456 | |
| Lenovo ThinkPad P1 G4-20Y4S0KS00 | |
| Medio Intel Core i9-11980HK (1561 - 1679, n=5) | |
| Lenovo ThinkPad P17 G2-20YU0025G | |
| Asus ProArt StudioBook 16 W7600H5A-2BL2 | |
| HP ZBook Fury 17 G7 119W5EA | |
| HWBOT x265 Benchmark v2.2 / 4k Preset | |
| Media de la clase Workstation (14.4 - 40.5, n=25, últimos 2 años) | |
| MSI WE76 11UM-456 | |
| Medio Intel Core i9-11980HK (13.1 - 16.3, n=5) | |
| Lenovo ThinkPad P17 G2-20YU0025G | |
| Lenovo ThinkPad P1 G4-20Y4S0KS00 | |
| HP ZBook Fury 15 G8 | |
| Asus ProArt StudioBook 16 W7600H5A-2BL2 | |
| HP ZBook Fury 17 G7 119W5EA | |
| LibreOffice / 20 Documents To PDF | |
| HP ZBook Fury 17 G7 119W5EA | |
| HP ZBook Fury 15 G8 | |
| Lenovo ThinkPad P17 G2-20YU0025G | |
| Media de la clase Workstation (37.1 - 74.7, n=25, últimos 2 años) | |
| MSI WE76 11UM-456 | |
| Lenovo ThinkPad P1 G4-20Y4S0KS00 | |
| Medio Intel Core i9-11980HK (40.6 - 47.7, n=5) | |
| Asus ProArt StudioBook 16 W7600H5A-2BL2 | |
| R Benchmark 2.5 / Overall mean | |
| HP ZBook Fury 17 G7 119W5EA | |
| Asus ProArt StudioBook 16 W7600H5A-2BL2 | |
| Lenovo ThinkPad P17 G2-20YU0025G | |
| Medio Intel Core i9-11980HK (0.545 - 0.565, n=5) | |
| MSI WE76 11UM-456 | |
| HP ZBook Fury 15 G8 | |
| Lenovo ThinkPad P1 G4-20Y4S0KS00 | |
| Media de la clase Workstation (0.3825 - 0.603, n=25, últimos 2 años) | |
* ... más pequeño es mejor
AIDA64: FP32 Ray-Trace | FPU Julia | CPU SHA3 | CPU Queen | FPU SinJulia | FPU Mandel | CPU AES | CPU ZLib | FP64 Ray-Trace | CPU PhotoWorxx
| Performance rating | |
| Media de la clase Workstation | |
| MSI WE76 11UM-456 | |
| HP ZBook Fury 15 G8 | |
| Medio Intel Core i9-11980HK | |
| HP ZBook Fury 17 G7 119W5EA | |
| Lenovo ThinkPad P1 G4-20Y4S0KS00 -9! | |
| Asus ProArt StudioBook 16 W7600H5A-2BL2 -9! | |
| Lenovo ThinkPad P17 G2-20YU0025G -9! | |
| AIDA64 / FP32 Ray-Trace | |
| Media de la clase Workstation (10658 - 61611, n=25, últimos 2 años) | |
| MSI WE76 11UM-456 | |
| Medio Intel Core i9-11980HK (14180 - 15661, n=2) | |
| HP ZBook Fury 15 G8 | |
| HP ZBook Fury 17 G7 119W5EA | |
| AIDA64 / FPU Julia | |
| Media de la clase Workstation (56664 - 186971, n=25, últimos 2 años) | |
| MSI WE76 11UM-456 | |
| Medio Intel Core i9-11980HK (59177 - 64043, n=2) | |
| HP ZBook Fury 15 G8 | |
| HP ZBook Fury 17 G7 119W5EA | |
| AIDA64 / CPU SHA3 | |
| Media de la clase Workstation (2608 - 8975, n=25, últimos 2 años) | |
| MSI WE76 11UM-456 | |
| Medio Intel Core i9-11980HK (3928 - 4220, n=2) | |
| HP ZBook Fury 15 G8 | |
| HP ZBook Fury 17 G7 119W5EA | |
| AIDA64 / CPU Queen | |
| Media de la clase Workstation (60778 - 144411, n=25, últimos 2 años) | |
| MSI WE76 11UM-456 | |
| Medio Intel Core i9-11980HK (97901 - 98443, n=2) | |
| HP ZBook Fury 15 G8 | |
| HP ZBook Fury 17 G7 119W5EA | |
| AIDA64 / FPU SinJulia | |
| Media de la clase Workstation (8165 - 29343, n=25, últimos 2 años) | |
| MSI WE76 11UM-456 | |
| Medio Intel Core i9-11980HK (10028 - 10494, n=2) | |
| HP ZBook Fury 17 G7 119W5EA | |
| HP ZBook Fury 15 G8 | |
| AIDA64 / FPU Mandel | |
| Media de la clase Workstation (27301 - 98153, n=25, últimos 2 años) | |
| MSI WE76 11UM-456 | |
| Medio Intel Core i9-11980HK (35500 - 38635, n=2) | |
| HP ZBook Fury 15 G8 | |
| HP ZBook Fury 17 G7 119W5EA | |
| AIDA64 / CPU AES | |
| Medio Intel Core i9-11980HK (90742 - 141352, n=2) | |
| Media de la clase Workstation (56077 - 187841, n=25, últimos 2 años) | |
| MSI WE76 11UM-456 | |
| HP ZBook Fury 15 G8 | |
| HP ZBook Fury 17 G7 119W5EA | |
| AIDA64 / CPU ZLib | |
| Media de la clase Workstation (742 - 2148, n=25, últimos 2 años) | |
| MSI WE76 11UM-456 | |
| HP ZBook Fury 15 G8 | |
| HP ZBook Fury 17 G7 119W5EA | |
| Medio Intel Core i9-11980HK (769 - 839, n=5) | |
| Lenovo ThinkPad P17 G2-20YU0025G | |
| Asus ProArt StudioBook 16 W7600H5A-2BL2 | |
| Asus ProArt StudioBook 16 W7600H5A-2BL2 | |
| Lenovo ThinkPad P1 G4-20Y4S0KS00 | |
| AIDA64 / FP64 Ray-Trace | |
| Media de la clase Workstation (5580 - 32891, n=25, últimos 2 años) | |
| MSI WE76 11UM-456 | |
| Medio Intel Core i9-11980HK (7662 - 8566, n=2) | |
| HP ZBook Fury 15 G8 | |
| HP ZBook Fury 17 G7 119W5EA | |
| AIDA64 / CPU PhotoWorxx | |
| Media de la clase Workstation (37151 - 93684, n=25, últimos 2 años) | |
| HP ZBook Fury 15 G8 | |
| MSI WE76 11UM-456 | |
| Medio Intel Core i9-11980HK (23047 - 25908, n=2) | |
| HP ZBook Fury 17 G7 119W5EA | |
Rendimiento del sistema
Como se esperaba, el rendimiento general del sistema es extremadamente alto. Esto se puede confirmar tanto por la impresión subjetiva del rendimiento como por los resultados de los benchmarks. No habrá ningún cuello de botella en los próximos años
| PCMark 10 / Score | |
| Media de la clase Workstation (6436 - 10409, n=21, últimos 2 años) | |
| Lenovo ThinkPad P1 G4-20Y4S0KS00 | |
| MSI WE76 11UM-456 | |
| Medio Intel Core i9-11980HK, NVIDIA RTX A5000 Laptop GPU (n=1) | |
| Asus ProArt StudioBook 16 W7600H5A-2BL2 | |
| HP ZBook Fury 15 G8 | |
| Lenovo ThinkPad P17 G2-20YU0025G | |
| MSI WE75 9TK | |
| HP ZBook Fury 17 G7 119W5EA | |
| PCMark 10 / Essentials | |
| Lenovo ThinkPad P1 G4-20Y4S0KS00 | |
| Media de la clase Workstation (9622 - 11157, n=21, últimos 2 años) | |
| Asus ProArt StudioBook 16 W7600H5A-2BL2 | |
| Lenovo ThinkPad P17 G2-20YU0025G | |
| HP ZBook Fury 15 G8 | |
| MSI WE75 9TK | |
| MSI WE76 11UM-456 | |
| Medio Intel Core i9-11980HK, NVIDIA RTX A5000 Laptop GPU (n=1) | |
| HP ZBook Fury 17 G7 119W5EA | |
| PCMark 10 / Productivity | |
| Media de la clase Workstation (8789 - 20616, n=21, últimos 2 años) | |
| MSI WE76 11UM-456 | |
| Medio Intel Core i9-11980HK, NVIDIA RTX A5000 Laptop GPU (n=1) | |
| Asus ProArt StudioBook 16 W7600H5A-2BL2 | |
| Lenovo ThinkPad P1 G4-20Y4S0KS00 | |
| HP ZBook Fury 15 G8 | |
| Lenovo ThinkPad P17 G2-20YU0025G | |
| MSI WE75 9TK | |
| HP ZBook Fury 17 G7 119W5EA | |
| PCMark 10 / Digital Content Creation | |
| Media de la clase Workstation (7744 - 15631, n=21, últimos 2 años) | |
| Lenovo ThinkPad P1 G4-20Y4S0KS00 | |
| MSI WE76 11UM-456 | |
| Medio Intel Core i9-11980HK, NVIDIA RTX A5000 Laptop GPU (n=1) | |
| Asus ProArt StudioBook 16 W7600H5A-2BL2 | |
| HP ZBook Fury 15 G8 | |
| Lenovo ThinkPad P17 G2-20YU0025G | |
| HP ZBook Fury 17 G7 119W5EA | |
| MSI WE75 9TK | |
| PCMark 10 Score | 7023 puntos | |
ayuda | ||
| AIDA64 / Memory Copy | |
| Media de la clase Workstation (56003 - 164795, n=25, últimos 2 años) | |
| MSI WE76 11UM-456 | |
| Medio Intel Core i9-11980HK (42653 - 47204, n=2) | |
| AIDA64 / Memory Read | |
| Media de la clase Workstation (55795 - 121563, n=25, últimos 2 años) | |
| Medio Intel Core i9-11980HK (46298 - 47729, n=2) | |
| MSI WE76 11UM-456 | |
| AIDA64 / Memory Write | |
| Media de la clase Workstation (55663 - 214520, n=25, últimos 2 años) | |
| MSI WE76 11UM-456 | |
| Medio Intel Core i9-11980HK (45456 - 45563, n=2) | |
| AIDA64 / Memory Latency | |
| Media de la clase Workstation (84.5 - 165.2, n=25, últimos 2 años) | |
| MSI WE76 11UM-456 | |
| Medio Intel Core i9-11980HK (91.1 - 98.1, n=5) | |
* ... más pequeño es mejor
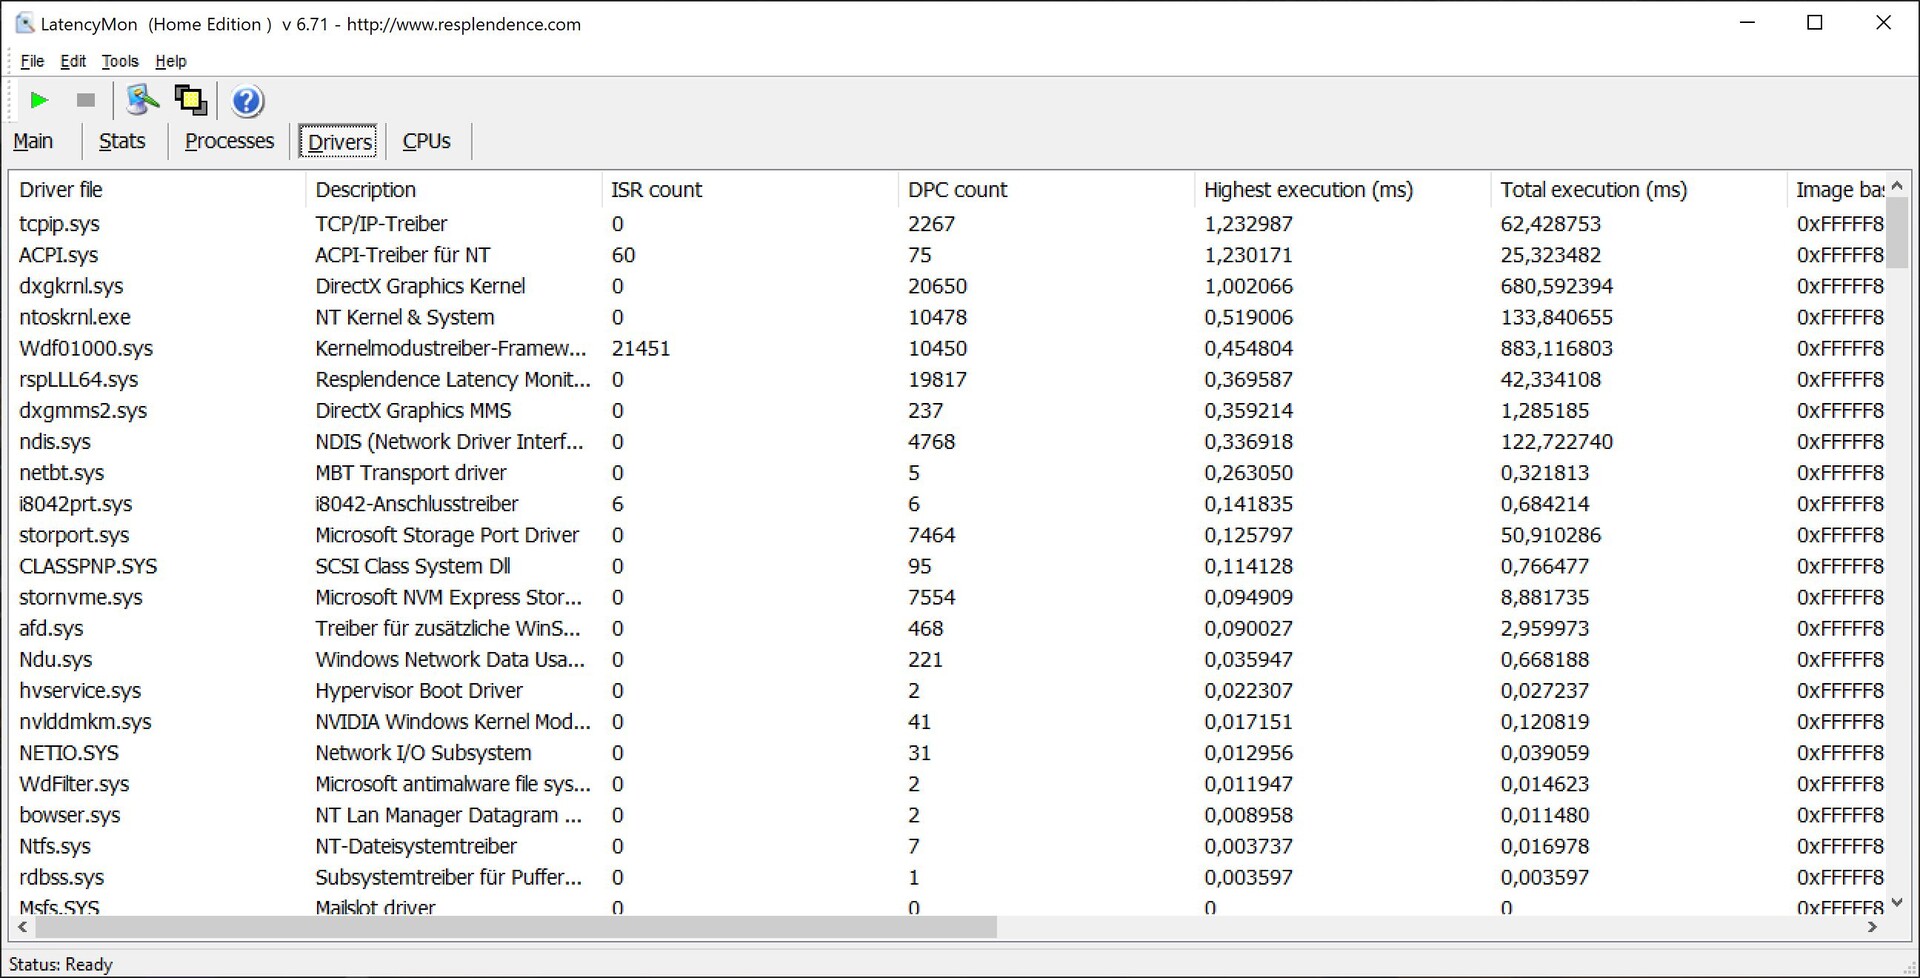
Latencias del CPD
Nuestra muestra de revisión del WE76 muestra latencias ligeramente elevadas en nuestras pruebas con la versión actual de la BIOS, y también hubo algunas caídas de frames (fotogramas saltados) al reproducir un vídeo de YouTube en 4K. Esto significa que el dispositivo no es ideal para aplicaciones de audio en tiempo real, pero futuras actualizaciones podrían mejorar la situación
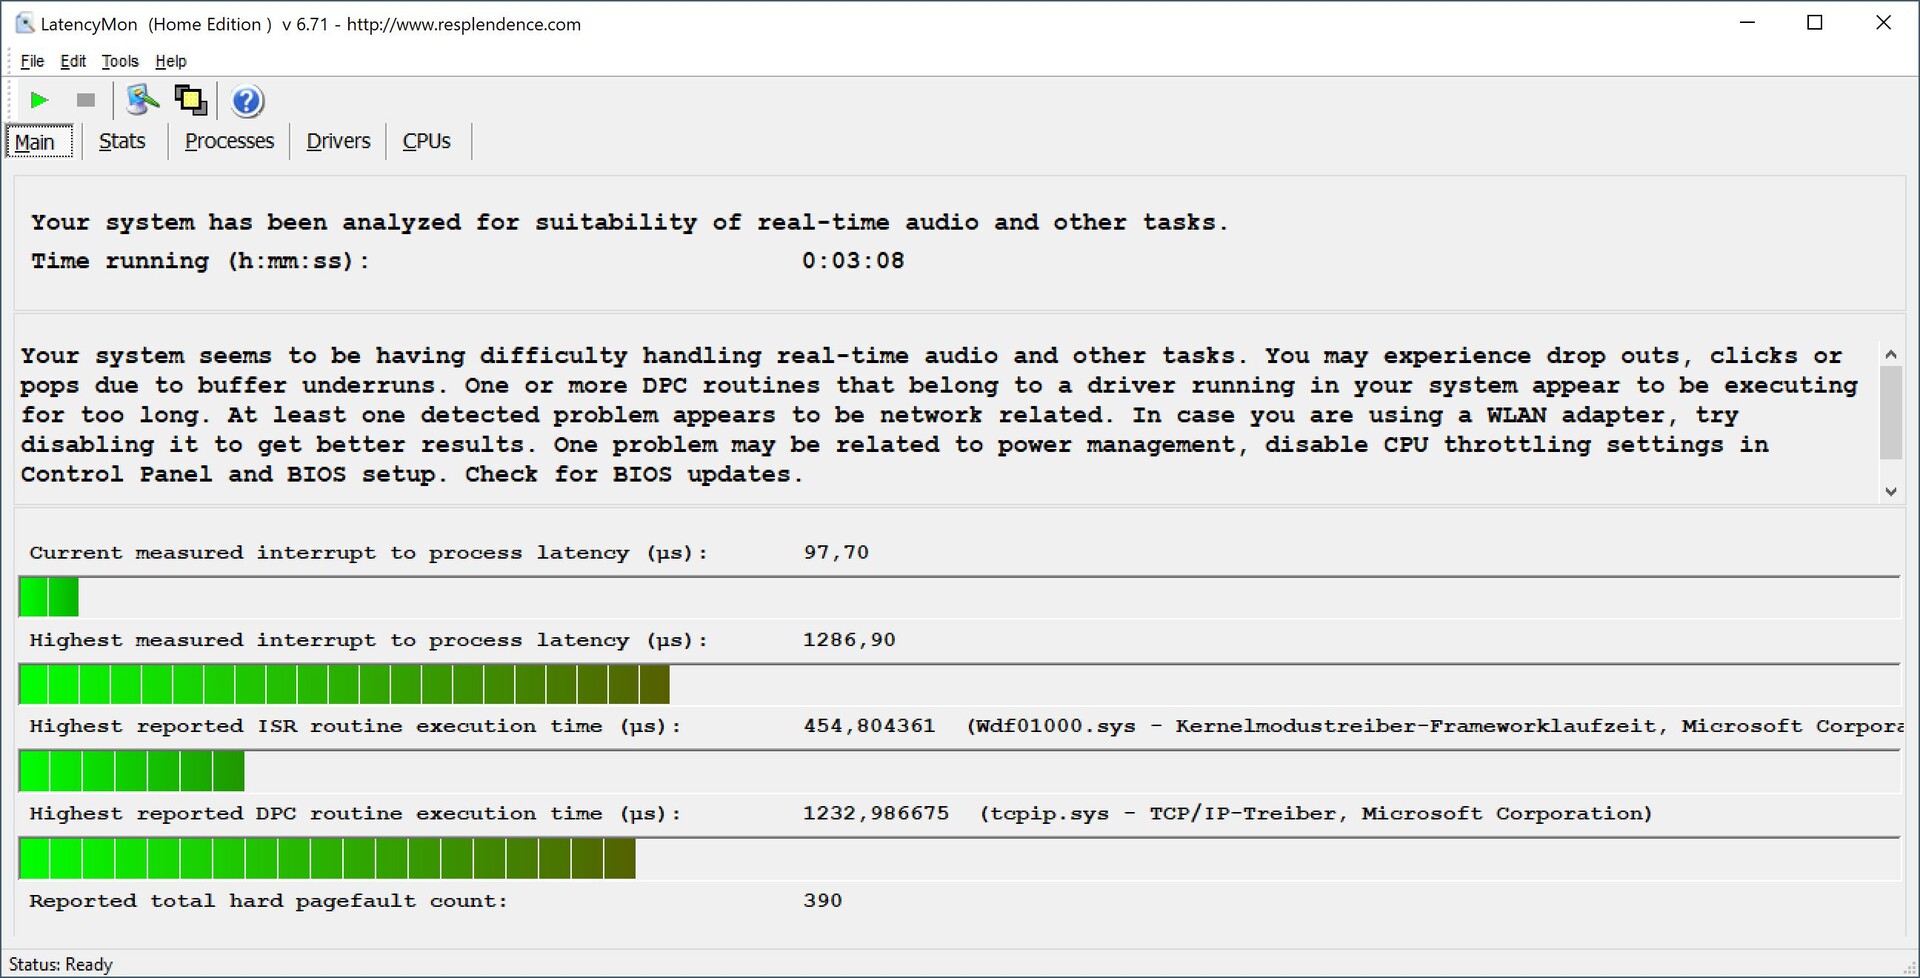
| DPC Latencies / LatencyMon - interrupt to process latency (max), Web, Youtube, Prime95 | |
| Lenovo ThinkPad P17 G2-20YU0025G | |
| HP ZBook Fury 17 G7 119W5EA | |
| Asus ProArt StudioBook 16 W7600H5A-2BL2 | |
| MSI WE76 11UM-456 | |
| Lenovo ThinkPad P1 G4-20Y4S0KS00 | |
| HP ZBook Fury 15 G8 | |
* ... más pequeño es mejor
Almacenamiento
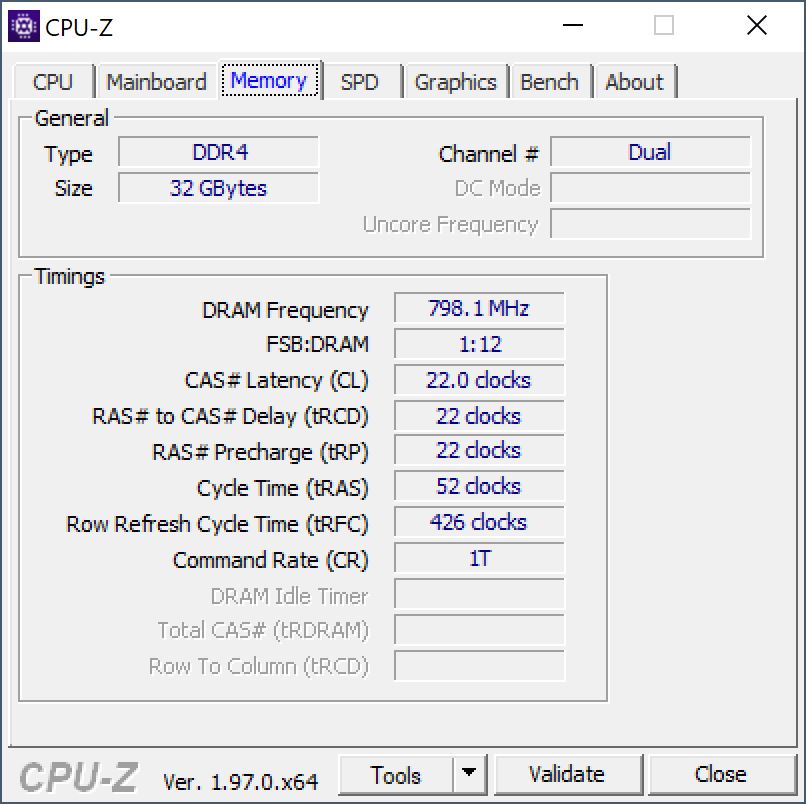
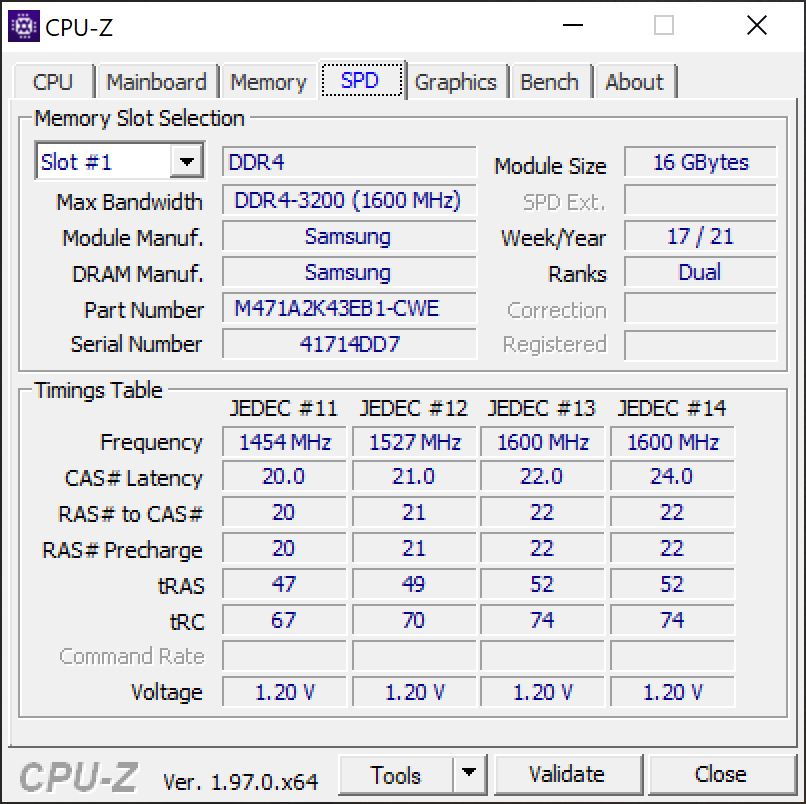
Nuestro dispositivo de pruebas está equipado con un Samsung PM9A1 con una capacidad de almacenamiento de 2 TB, de los cuales 1,78 TB están aún disponibles tras el primer arranque. Se trata de una unidad PCIe 4.0 muy rápida que también puede ser aprovechada adecuadamente por el WE76, ya que impresiona con muy buenas tasas de transferencia en los benchmarks. Además, el WE76 ofrece otra ranura M.2-2280 para ampliar fácilmente el almacenamiento, pero la segunda ranura "sólo" utiliza la interfaz PCIe 3.0 x4. Puedes encontrar más pruebas de SSD aquí

* ... más pequeño es mejor
Continuous load read: DiskSpd Read Loop, Queue Depth 8
Tarjeta gráfica
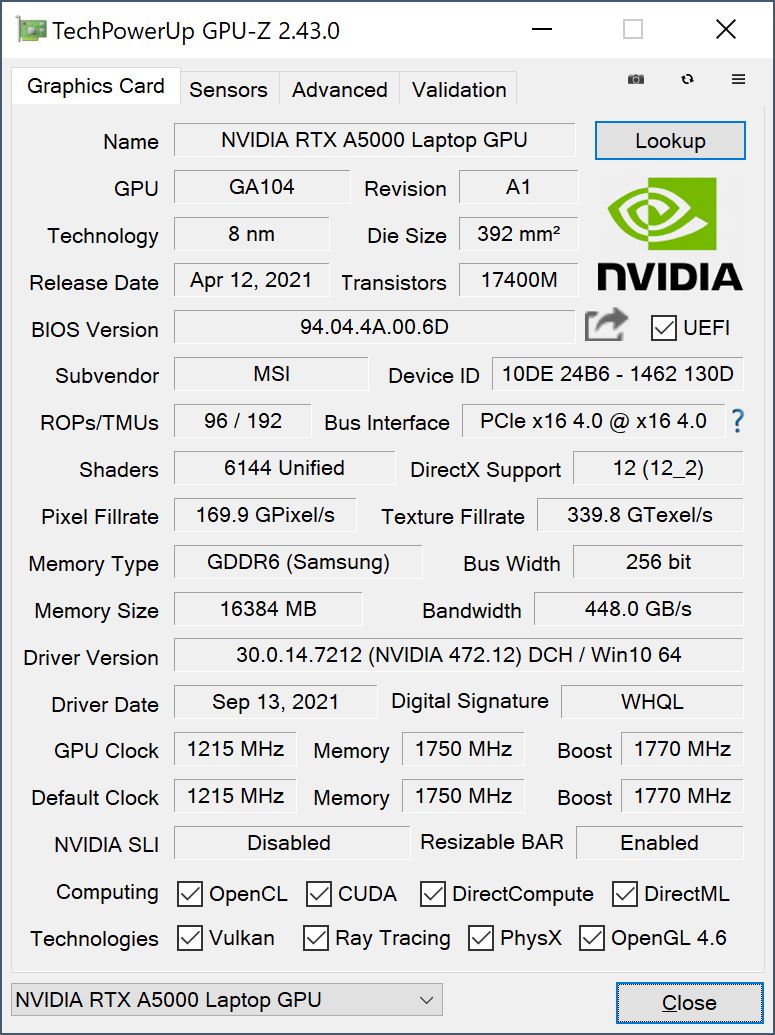
Con laNvidia RTX A5000 (Nvidia ha eliminado "Quadro" de los nombres mientras tanto), MSI ha instalado la GPU móvil profesional más potente que existe actualmente en el mercado. Con 16 GB de RAM y los controladores profesionales que incluyen las certificaciones para el software profesional, el WE76 es especialmente adecuado para aplicaciones CAD/CAM complejas o grandes proyectos gráficos que incluyan trazado de rayos. Con un TDP máximo de 155 vatios (aunque a veces hemos visto picos de hasta 180 vatios), la GPU es claramente uno de los modelos más rápidos del mercado. Soporta la solución de conmutación de gráficos Optimus de Nvidia, lo que significa que la iGPU del procesador se utiliza para tareas sencillas.
También podemos ver esto en los benchmarks, donde el WE76 consigue situarse por delante de la competencia. La RTX A5000 del HP ZBook Fury 15 Gpor ejemplo, es entre un 10% y un 30% más lenta, dependiendo de la prueba. El modo opcional de alto rendimiento no afecta directamente al rendimiento de la GPU, y el rendimiento es estable en ambos modos. Sin embargo, el consumo de energía está limitado a 55 vatios en batería, lo que lleva a una pérdida de rendimiento de alrededor del 50%. Consulta nuestro Artículo sobre pruebas de rendimiento de la GPUpara ver más comparaciones.
| 3DMark 11 Performance | 32211 puntos | |
| 3DMark Cloud Gate Standard Score | 35295 puntos | |
| 3DMark Fire Strike Score | 24155 puntos | |
| 3DMark Time Spy Score | 11185 puntos | |
ayuda | ||
Rendimiento de los juegos
El rendimiento en juegos del WE76 también es sobresaliente, y no experimentamos ningún problema con los drivers profesionales durante nuestras pruebas. La mayoría de títulos pueden jugarse con fluidez incluso a 4K y detalles máximos. Sólo los títulos muy exigentes, como Cyberpunk 2077, requieren una reducción de la resolución o de los detalles para poder funcionar con fluidez. El rendimiento de los juegos es menor con la batería; en The Witcher 3 (configuración Ultra), por ejemplo, el rendimiento baja de 98 a 67 FPS. Hay más pruebas de juego disponibles aquí
| Cyberpunk 2077 1.0 | |
| 1920x1080 Ultra Preset | |
| MSI WE76 11UM-456 | |
| Medio NVIDIA RTX A5000 Laptop GPU (58.6 - 78, n=2) | |
| Asus ProArt StudioBook 16 W7600H5A-2BL2 | |
| 1920x1080 High Preset | |
| MSI WE76 11UM-456 | |
| Medio NVIDIA RTX A5000 Laptop GPU (68.1 - 90, n=2) | |
| Asus ProArt StudioBook 16 W7600H5A-2BL2 | |
| F1 2021 | |
| 1920x1080 High Preset AA:T AF:16x | |
| MSI WE76 11UM-456 | |
| Asus ProArt StudioBook 16 W7600H5A-2BL2 | |
| Medio NVIDIA RTX A5000 Laptop GPU (122 - 161, n=3) | |
| HP ZBook Fury 15 G8 | |
| Lenovo ThinkPad P17 G2-20YU0025G | |
| 1920x1080 Ultra High Preset + Raytracing AA:T AF:16x | |
| MSI WE76 11UM-456 | |
| Asus ProArt StudioBook 16 W7600H5A-2BL2 | |
| Medio NVIDIA RTX A5000 Laptop GPU (85 - 109, n=3) | |
| HP ZBook Fury 15 G8 | |
| Lenovo ThinkPad P17 G2-20YU0025G | |
| Far Cry 6 | |
| 1920x1080 High Graphics Quality AA:T | |
| MSI WE76 11UM-456 | |
| Medio NVIDIA RTX A5000 Laptop GPU (n=1) | |
| Media de la clase Workstation (n=1últimos 2 años) | |
| 1920x1080 Ultra Graphics Quality + HD Textures AA:T | |
| MSI WE76 11UM-456 | |
| Medio NVIDIA RTX A5000 Laptop GPU (n=1) | |
The Witcher 3 FPS diagram
| bajo | medio | alto | ultra | QHD | 4K | |
|---|---|---|---|---|---|---|
| GTA V (2015) | 181 | 175 | 161 | 94.6 | 84.3 | 92.5 |
| The Witcher 3 (2015) | 354 | 271 | 179 | 98.3 | 74 | |
| Final Fantasy XV Benchmark (2018) | 184 | 144 | 108 | 83.6 | 51.1 | |
| X-Plane 11.11 (2018) | 136 | 114 | 90.5 | 65.3 | ||
| Far Cry 5 (2018) | 121 | 113 | 103 | 92 | 50 | |
| Strange Brigade (2018) | 412 | 251 | 213 | 191 | 146 | 86.8 |
| Cyberpunk 2077 1.0 (2020) | 118 | 104 | 90 | 78 | 51 | 25 |
| F1 2021 (2021) | 257 | 187 | 161 | 109 | 88.2 | 53.6 |
| Far Cry 6 (2021) | 120 | 103 | 95 | 89 | 79 | 51 |
Emisiones - WE76 con potente refrigeración
Emisiones acústicas
El control del ventilador es definitivamente uno de los puntos débiles del WE76. Incluso con poca carga, los ventiladores se aceleran de forma audible de vez en cuando, por lo que siempre recomendamos usar el modo Silencioso para las tareas diarias, ya que los ventiladores suelen estar desactivados entonces. Si necesitas más rendimiento (especialmente en términos de GPU), puedes ajustar el modo Rendimiento. En general, sin embargo, la estación de trabajo móvil de MSI no es más ruidosa o es sólo marginalmente más ruidosa bajo carga que la competencia, que suele estar equipada con componentes más débiles. El perfil de Alto Rendimiento aumenta el ruido máximo del ventilador de algo menos de 48 a unos 54 dB(A), lo que puede describirse como molesto. Con el modo CoolerBooster, también se puede activar la máxima velocidad del ventilador, que lleva a 58,9 dB(A). Recomendaríamos comprobar el rendimiento en modo Silencioso cuando se juega, ya que sólo pudimos medir 38,6 dB(A) en The Witcher 3, por ejemplo, lo que significa que no hay que recurrir a los auriculares. Sin embargo, no pudimos detectar ningún otro ruido electrónico
Ruido
| Ocioso |
| 24.7 / 24.7 / 27.5 dB(A) |
| Carga |
| 43.7 / 47.7 dB(A) |
 | ||
30 dB silencioso 40 dB(A) audible 50 dB(A) ruidosamente alto |
||
min: | ||
| MSI WE76 11UM-456 RTX A5000 Laptop GPU, i9-11980HK, Samsung PM9A1 MZVL22T0HBLB | Lenovo ThinkPad P1 G4-20Y4S0KS00 GeForce RTX 3070 Laptop GPU, i7-11850H, Samsung PM9A1 MZVL21T0HCLR | HP ZBook Fury 15 G8 RTX A5000 Laptop GPU, i9-11950H, Samsung PM981a MZVLB1T0HBLR | Asus ProArt StudioBook 16 W7600H5A-2BL2 RTX A5000 Laptop GPU, W-11955M, 2x Micron 2300 2TB MTFDHBA2T0TDV (RAID 0) | Lenovo ThinkPad P17 G2-20YU0025G RTX A2000 Laptop GPU, i7-11800H, Kioxia XG7 KXG7AZNV512G | HP ZBook Fury 17 G7 119W5EA Quadro RTX 4000 Max-Q, i9-10885H, WDC PC SN730 SDBPNTY-1T00 | MSI WE75 9TK Quadro RTX 3000 (Laptop), i7-9750H, Samsung SSD PM981 MZVLB512HAJQ | |
|---|---|---|---|---|---|---|---|
| Noise | 3% | 6% | 1% | 3% | -1% | -7% | |
| apagado / medio ambiente * (dB) | 24.7 | 23.8 4% | 24.1 2% | 26 -5% | 26.4 -7% | 24.4 1% | 28.5 -15% |
| Idle Minimum * (dB) | 24.7 | 23.8 4% | 24.1 2% | 26 -5% | 26.4 -7% | 24.4 1% | 29 -17% |
| Idle Average * (dB) | 24.7 | 23.8 4% | 24.1 2% | 26 -5% | 26.4 -7% | 26.6 -8% | 29 -17% |
| Idle Maximum * (dB) | 27.5 | 28.3 -3% | 24.8 10% | 26.5 4% | 26.4 4% | 29 -5% | 31.5 -15% |
| Load Average * (dB) | 43.7 | 38.6 12% | 37.8 14% | 42 4% | 38.1 13% | 40.2 8% | 32 27% |
| Witcher 3 ultra * (dB) | 46.6 | 47.4 -2% | 44.2 5% | 38.1 18% | 48 -3% | 44.7 4% | |
| Load Maximum * (dB) | 47.7 | 47.4 1% | 44.2 7% | 43 10% | 45 6% | 48 -1% | 56.5 -18% |
* ... más pequeño es mejor
Temperatura
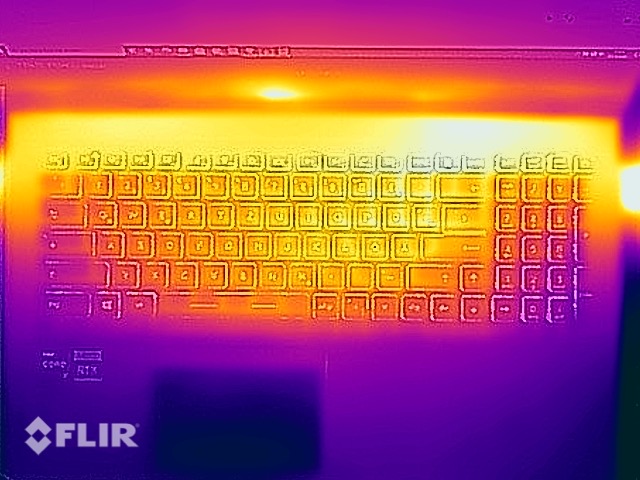
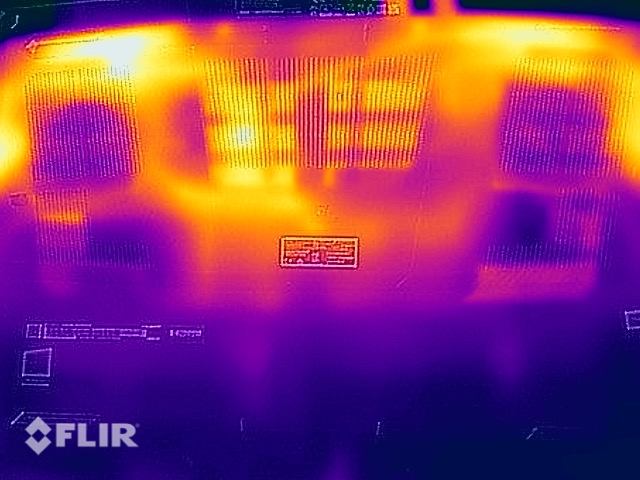
El WE76 no tiene problemas de temperatura, ya que toda la carcasa permanece muy fresca durante las tareas sencillas. Aunque hay una zona en la parte trasera izquierda de la parte inferior bajo carga donde podemos medir más de 55 °C, no vemos esto como un problema ya que casi nunca usarás esta estación de trabajo móvil en tu regazo. El teclado también se calienta notablemente bajo carga, pero el tecleo no se ve afectado.
Puedes ver la diferencia entre los modos de rendimiento en el test de estrés, ya que el modo opcional de Alto Rendimiento aumenta el consumo de energía de la CPU de ~42 a 60 vatios. El consumo de la GPU se mantiene constante en ~150 vatios, sin embargo, y los resultados son muy buenos en general.
(-) La temperatura máxima en la parte superior es de 48.4 °C / 119 F, frente a la media de 38.2 °C / 101 F, que oscila entre 22.2 y 69.8 °C para la clase Workstation.
(-) El fondo se calienta hasta un máximo de 56.2 °C / 133 F, frente a la media de 41.1 °C / 106 F
(+) En reposo, la temperatura media de la parte superior es de 26 °C / 79# F, frente a la media del dispositivo de 32 °C / 90 F.
(±) Jugando a The Witcher 3, la temperatura media de la parte superior es de 37.6 °C / 100 F, frente a la media del dispositivo de 32 °C / 90 F.
(+) El reposamanos y el panel táctil están a una temperatura inferior a la de la piel, con un máximo de 27.5 °C / 81.5 F y, por tanto, son fríos al tacto.
(±) La temperatura media de la zona del reposamanos de dispositivos similares fue de 27.8 °C / 82 F (+0.3 °C / 0.5 F).
| MSI WE76 11UM-456 Intel Core i9-11980HK, NVIDIA RTX A5000 Laptop GPU | Lenovo ThinkPad P1 G4-20Y4S0KS00 Intel Core i7-11850H, NVIDIA GeForce RTX 3070 Laptop GPU | HP ZBook Fury 15 G8 Intel Core i9-11950H, NVIDIA RTX A5000 Laptop GPU | Asus ProArt StudioBook 16 W7600H5A-2BL2 Intel Xeon W-11955M, NVIDIA RTX A5000 Laptop GPU | Lenovo ThinkPad P17 G2-20YU0025G Intel Core i7-11800H, NVIDIA RTX A2000 Laptop GPU | HP ZBook Fury 17 G7 119W5EA Intel Core i9-10885H, NVIDIA Quadro RTX 4000 Max-Q | MSI WE75 9TK Intel Core i7-9750H, NVIDIA Quadro RTX 3000 (Laptop) | |
|---|---|---|---|---|---|---|---|
| Heat | 2% | 6% | -3% | 7% | 12% | 8% | |
| Maximum Upper Side * (°C) | 48.4 | 51 -5% | 45.6 6% | 45.7 6% | 49.6 -2% | 46.1 5% | 40.6 16% |
| Maximum Bottom * (°C) | 56.2 | 53.5 5% | 57.6 -2% | 48.3 14% | 52.1 7% | 57.6 -2% | 46 18% |
| Idle Upper Side * (°C) | 28.6 | 28.8 -1% | 26 9% | 35.3 -23% | 26 9% | 23.4 18% | 29.2 -2% |
| Idle Bottom * (°C) | 31.8 | 29.3 8% | 28.8 9% | 34.4 -8% | 27.6 13% | 23.4 26% | 32.4 -2% |
* ... más pequeño es mejor
Altavoces
MSI ha instalado un sistema de sonido estéreo con un rendimiento aceptable. Sin embargo, el ruido del ventilador predomina sobre todo cuando los componentes están bajo alta carga (independientemente de si se utilizan aplicaciones profesionales o juegos), por lo que no se oyen muy bien los altavoces. Por ello, se recomienda utilizar auriculares en este caso
MSI WE76 11UM-456 análisis de audio
(+) | los altavoces pueden reproducir a un volumen relativamente alto (#84.6 dB)
Graves 100 - 315 Hz
(±) | lubina reducida - en promedio 14.7% inferior a la mediana
(±) | la linealidad de los graves es media (7.8% delta a frecuencia anterior)
Medios 400 - 2000 Hz
(±) | medias más altas - de media 5% más altas que la mediana
(+) | los medios son lineales (3.9% delta a la frecuencia anterior)
Altos 2 - 16 kHz
(±) | máximos más altos - de media 5.6% más altos que la mediana
(±) | la linealidad de los máximos es media (9.1% delta a frecuencia anterior)
Total 100 - 16.000 Hz
(±) | la linealidad del sonido global es media (16.3% de diferencia con la mediana)
En comparación con la misma clase
» 44% de todos los dispositivos probados de esta clase eran mejores, 9% similares, 47% peores
» El mejor tuvo un delta de 7%, la media fue 17%, el peor fue ###max##%
En comparación con todos los dispositivos probados
» 27% de todos los dispositivos probados eran mejores, 6% similares, 68% peores
» El mejor tuvo un delta de 4%, la media fue 24%, el peor fue ###max##%
HP ZBook Fury 17 G7 119W5EA análisis de audio
(±) | la sonoridad del altavoz es media pero buena (78.6 dB)
Graves 100 - 315 Hz
(±) | lubina reducida - en promedio 7.9% inferior a la mediana
(±) | la linealidad de los graves es media (11.1% delta a frecuencia anterior)
Medios 400 - 2000 Hz
(+) | medios equilibrados - a sólo 2.8% de la mediana
(+) | los medios son lineales (3.9% delta a la frecuencia anterior)
Altos 2 - 16 kHz
(+) | máximos equilibrados - a sólo 2.7% de la mediana
(+) | los máximos son lineales (4.8% delta a la frecuencia anterior)
Total 100 - 16.000 Hz
(+) | el sonido global es lineal (10.9% de diferencia con la mediana)
En comparación con la misma clase
» 11% de todos los dispositivos probados de esta clase eran mejores, 4% similares, 85% peores
» El mejor tuvo un delta de 7%, la media fue 17%, el peor fue ###max##%
En comparación con todos los dispositivos probados
» 6% de todos los dispositivos probados eran mejores, 2% similares, 92% peores
» El mejor tuvo un delta de 4%, la media fue 24%, el peor fue ###max##%
Lenovo ThinkPad P17 G2-20YU0025G análisis de audio
(±) | la sonoridad del altavoz es media pero buena (76.6 dB)
Graves 100 - 315 Hz
(±) | lubina reducida - en promedio 14.5% inferior a la mediana
(±) | la linealidad de los graves es media (9.6% delta a frecuencia anterior)
Medios 400 - 2000 Hz
(±) | medias más altas - de media 6.9% más altas que la mediana
(±) | la linealidad de los medios es media (7.7% delta respecto a la frecuencia anterior)
Altos 2 - 16 kHz
(+) | máximos equilibrados - a sólo 2.6% de la mediana
(+) | los máximos son lineales (6.6% delta a la frecuencia anterior)
Total 100 - 16.000 Hz
(±) | la linealidad del sonido global es media (20.1% de diferencia con la mediana)
En comparación con la misma clase
» 71% de todos los dispositivos probados de esta clase eran mejores, 6% similares, 23% peores
» El mejor tuvo un delta de 7%, la media fue 17%, el peor fue ###max##%
En comparación con todos los dispositivos probados
» 52% de todos los dispositivos probados eran mejores, 8% similares, 40% peores
» El mejor tuvo un delta de 4%, la media fue 24%, el peor fue ###max##%
Gestión de la energía - Alto consumo de energía
Consumo de energía
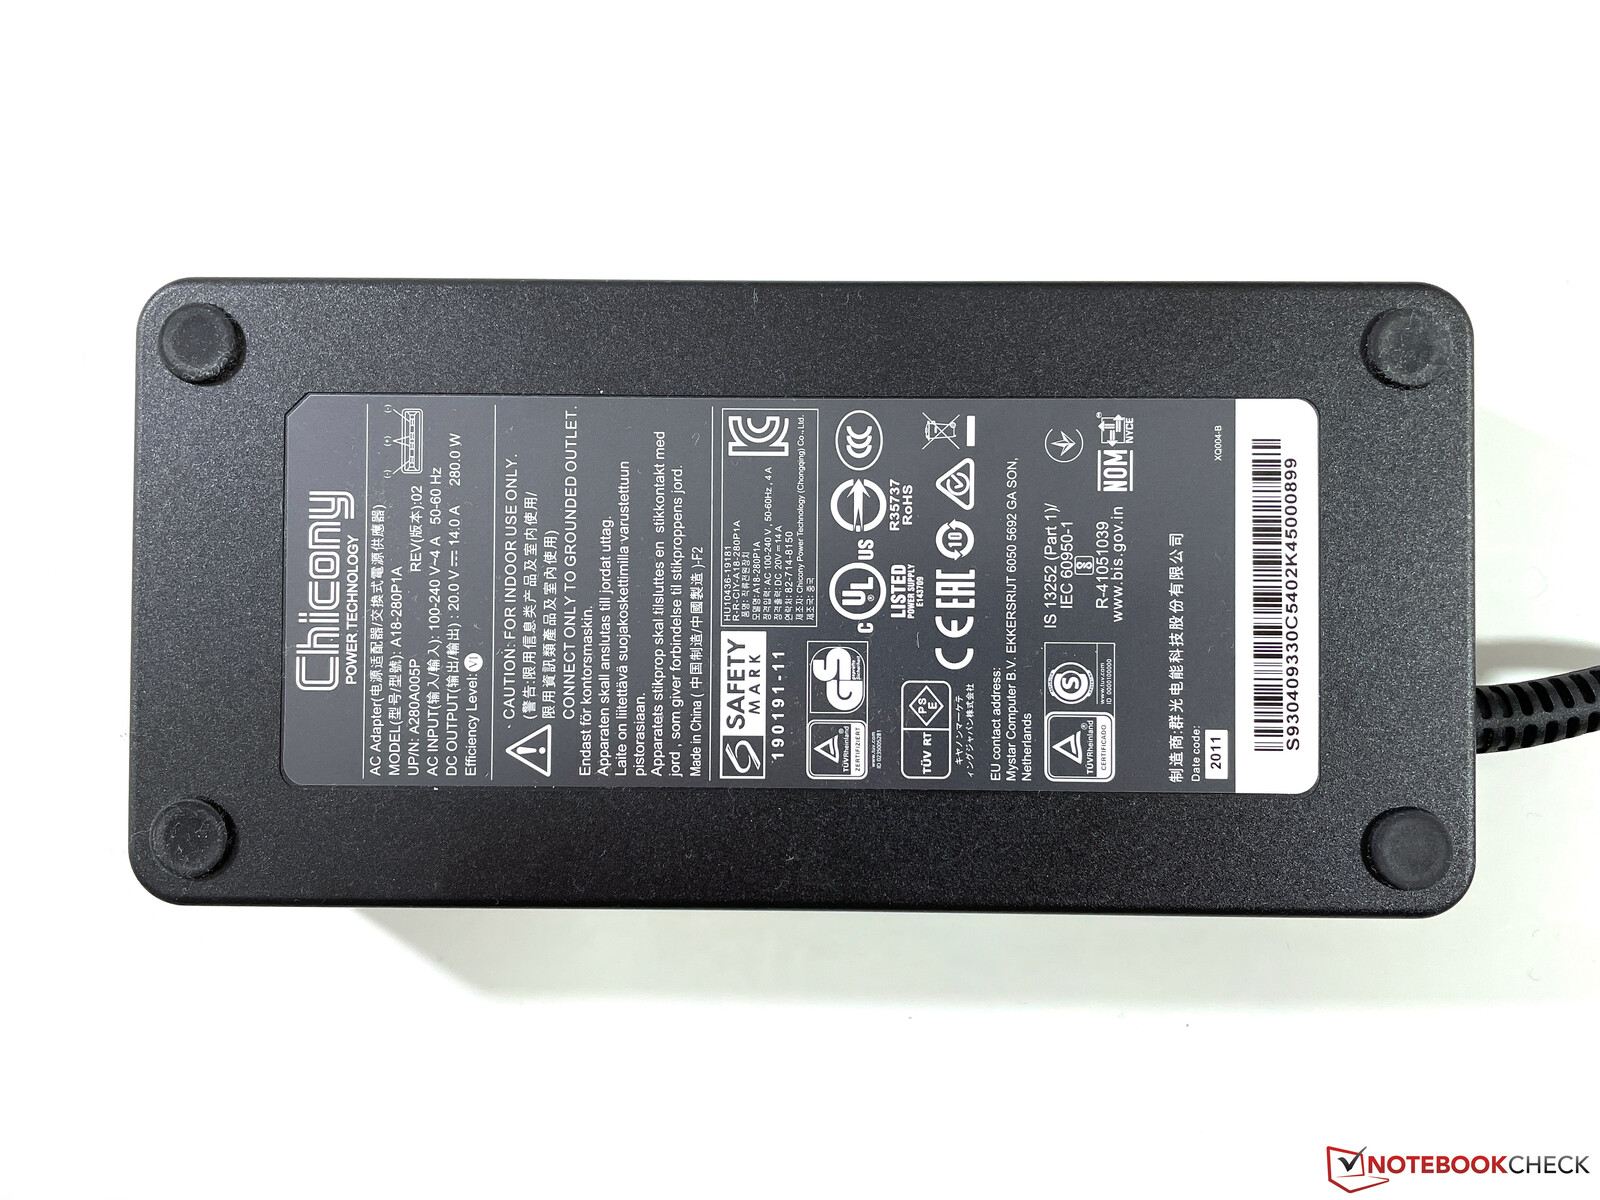
No es de extrañar que la estación de trabajo móvil requiera mucha energía. Gracias a la conmutación automática de la gráfica, los índices de inactividad siguen estando dentro de los límites con un máximo de 20 vatios, pero bajo carga, se alcanzan hasta 281 vatios, que luego se asientan bastante rápido en 245 vatios (~260 vatios en modo de Alto Rendimiento). Puedes esperar unos 230 vatios cuando juegas. Esto significa que el adaptador de corriente de 280 vatios incluido tiene una capacidad adecuada
| Off / Standby | |
| Ocioso | |
| Carga |
|
Clave:
min: | |
| MSI WE76 11UM-456 i9-11980HK, RTX A5000 Laptop GPU, Samsung PM9A1 MZVL22T0HBLB, IPS, 3840x2160, 17.3" | Lenovo ThinkPad P1 G4-20Y4S0KS00 i7-11850H, GeForce RTX 3070 Laptop GPU, Samsung PM9A1 MZVL21T0HCLR, IPS LED, 3840x2400, 16" | HP ZBook Fury 15 G8 i9-11950H, RTX A5000 Laptop GPU, Samsung PM981a MZVLB1T0HBLR, IPS, 3840x2160, 15.6" | Asus ProArt StudioBook 16 W7600H5A-2BL2 W-11955M, RTX A5000 Laptop GPU, 2x Micron 2300 2TB MTFDHBA2T0TDV (RAID 0), OLED, 3840x2400, 16" | Lenovo ThinkPad P17 G2-20YU0025G i7-11800H, RTX A2000 Laptop GPU, Kioxia XG7 KXG7AZNV512G, IPS LED, 1920x1080, 17.3" | HP ZBook Fury 17 G7 119W5EA i9-10885H, Quadro RTX 4000 Max-Q, WDC PC SN730 SDBPNTY-1T00, , 3840x2160, 17.3" | MSI WE75 9TK i7-9750H, Quadro RTX 3000 (Laptop), Samsung SSD PM981 MZVLB512HAJQ, IPS, 1920x1080, 17.3" | Medio NVIDIA RTX A5000 Laptop GPU | Media de la clase Workstation | |
|---|---|---|---|---|---|---|---|---|---|
| Power Consumption | 19% | 15% | 11% | 38% | 24% | 15% | 5% | 24% | |
| Idle Minimum * (Watt) | 10.5 | 8.1 23% | 8.3 21% | 12.4 -18% | 6.1 42% | 5.8 45% | 12.1 -15% | 10.4 ? 1% | 8.94 ? 15% |
| Idle Average * (Watt) | 18.6 | 20.2 -9% | 19.9 -7% | 16.5 11% | 10.9 41% | 14.8 20% | 18.4 1% | 18.3 ? 2% | 13.8 ? 26% |
| Idle Maximum * (Watt) | 20 | 21.9 -10% | 21.8 -9% | 25 -25% | 12.3 38% | 17 15% | 18.8 6% | 22.3 ? -12% | 17.5 ? 12% |
| Load Average * (Watt) | 132.4 | 88.2 33% | 110.9 16% | 132 -0% | 106.3 20% | 120.4 9% | 95.1 28% | 125.1 ? 6% | 95 ? 28% |
| Witcher 3 ultra * (Watt) | 232 | 149 36% | 165 29% | 132 43% | 124 47% | 168.4 27% | 135.5 42% | ||
| Load Maximum * (Watt) | 281.6 | 170.6 39% | 171.8 39% | 134 52% | 168.9 40% | 199.8 29% | 203.7 28% | 195.8 ? 30% | 175.2 ? 38% |
* ... más pequeño es mejor
Energy consumption during our The Witcher 3 test / stress test
Energy consumption with an external monitor
Duración de la batería
La batería de 99,9 Wh es la máxima capacidad que se puede seguir llevando en los aviones. La duración de la batería es adecuada para el rendimiento y los componentes. Con algo más de 6 horas en el test Wi-Fi a 150 cd/m² (o 4:30 horas a pleno brillo) y algo menos de 7 horas en el test de vídeo, definitivamente puedes sobrevivir a reuniones algo más largas sin necesitar una toma de corriente. Algo menos de 80 minutos es posible bajo carga, pero esto sólo es factible debido al rendimiento significativamente reducido
| MSI WE76 11UM-456 i9-11980HK, RTX A5000 Laptop GPU, 99.9 Wh | Lenovo ThinkPad P1 G4-20Y4S0KS00 i7-11850H, GeForce RTX 3070 Laptop GPU, 90 Wh | HP ZBook Fury 15 G8 i9-11950H, RTX A5000 Laptop GPU, 94 Wh | Asus ProArt StudioBook 16 W7600H5A-2BL2 W-11955M, RTX A5000 Laptop GPU, 90 Wh | Lenovo ThinkPad P17 G2-20YU0025G i7-11800H, RTX A2000 Laptop GPU, 94 Wh | HP ZBook Fury 17 G7 119W5EA i9-10885H, Quadro RTX 4000 Max-Q, 94 Wh | MSI WE75 9TK i7-9750H, Quadro RTX 3000 (Laptop), 65 Wh | Media de la clase Workstation | |
|---|---|---|---|---|---|---|---|---|
| Duración de Batería | 2% | -2% | -48% | 34% | 34% | -23% | 28% | |
| H.264 (h) | 6.9 | 7.2 4% | 1.8 -74% | 9.5 38% | 10.3 49% | 9.51 ? 38% | ||
| WiFi v1.3 (h) | 6.3 | 7 11% | 6.2 -2% | 5 -21% | 9.8 56% | 7.6 21% | 4.9 -22% | 8.53 ? 35% |
| Load (h) | 1.3 | 1.2 -8% | 1.4 8% | 1.7 31% | 1 -23% | 1.429 ? 10% | ||
| Witcher 3 ultra (h) | 1.6 | |||||||
| Reader / Idle (h) | 11 | 26.1 ? |
Pro
Contra
Veredicto - MSI ofrece mucho rendimiento
Con el WE76, MSI ofrece claramente una estación de trabajo móvil tradicional que ofrece mucho rendimiento y compite directamente con modelos como el Dell Precision 7770, el HP ZBook Fury 17y el Lenovo ThinkPad P17 Gen 2. La movilidad sólo juega un papel secundario en estos dispositivos, y el foco está en el rendimiento, que es donde la estación de trabajo MSI sobresale.
El hecho de que el fabricante haya utilizado un portátil para juegos (GE76) como referencia no es un problema para nosotros. Se ha omitido la extensa iluminación, y tampoco hay modelos de pantalla de 360 Hz, que no encajarían en absoluto dado el grupo objetivo. En su lugar, hay un panel 4K mate con colores precisos, una cobertura AdobeRGB casi completa, y 120 Hz, que también resultan en una impresión de imagen notablemente más suave en el uso diario. Además, hay un teclado muy bueno que incluye un teclado numérico dedicado.
En particular, el rendimiento de laNvidia RTX A5000 (antes Quadro) es muy convincente. El rendimiento del procesador también es muy bueno, aunque hay que decir aquí que las CPUs móviles de AMD son actualmente mejores, pero aún no se han implementado en las estaciones de trabajo (esto es cierto para todos los fabricantes).
Tarjeta gráfica extremadamente rápida, alto rendimiento del sistema, pantalla mate 4K, y gran teclado: El MSI WE76 es una estación de trabajo móvil que se centra principalmente en el rendimiento.
El comportamiento de los ventiladores es uno de los pocos puntos débiles, ya que suelen entrar en acción incluso durante el uso diario normal, lo que los hace parecer un poco erráticos. El modo Silencioso opcional se recomienda aquí, ya que mantiene el dispositivo mucho más silencioso. Bajo carga, sin embargo, el volumen máximo del ventilador es perfectamente competitivo y no es excesivamente ruidoso.
Los usuarios que necesiten el máximo rendimiento no se equivocarán con el WE76, y MSI también tiene ventajas sobre los contendientes mencionados aquí. Los modelos de 16 pulgadas ligeramente más pequeños (el ThinkPad P1 Gen 4o elAsus ProArt StudioBook 16por ejemplo) son ciertamente más compactos y más móviles, pero también ofrecen menos rendimiento a cambio.
Precio y disponibilidad
En el momento de escribir este artículo, puedes encontrar el MSI WE76 con el Core i9-11980HK, la Quadro RTX A5000, 64 GB de RAM, un SSD NVME de 1 TB y Windows 10 Pro en Amazon a partir de unos 4.300 dólares.
MSI WE76 11UM-456
- 12/06/2021 v7 (old)
Andreas Osthoff
Price comparison

