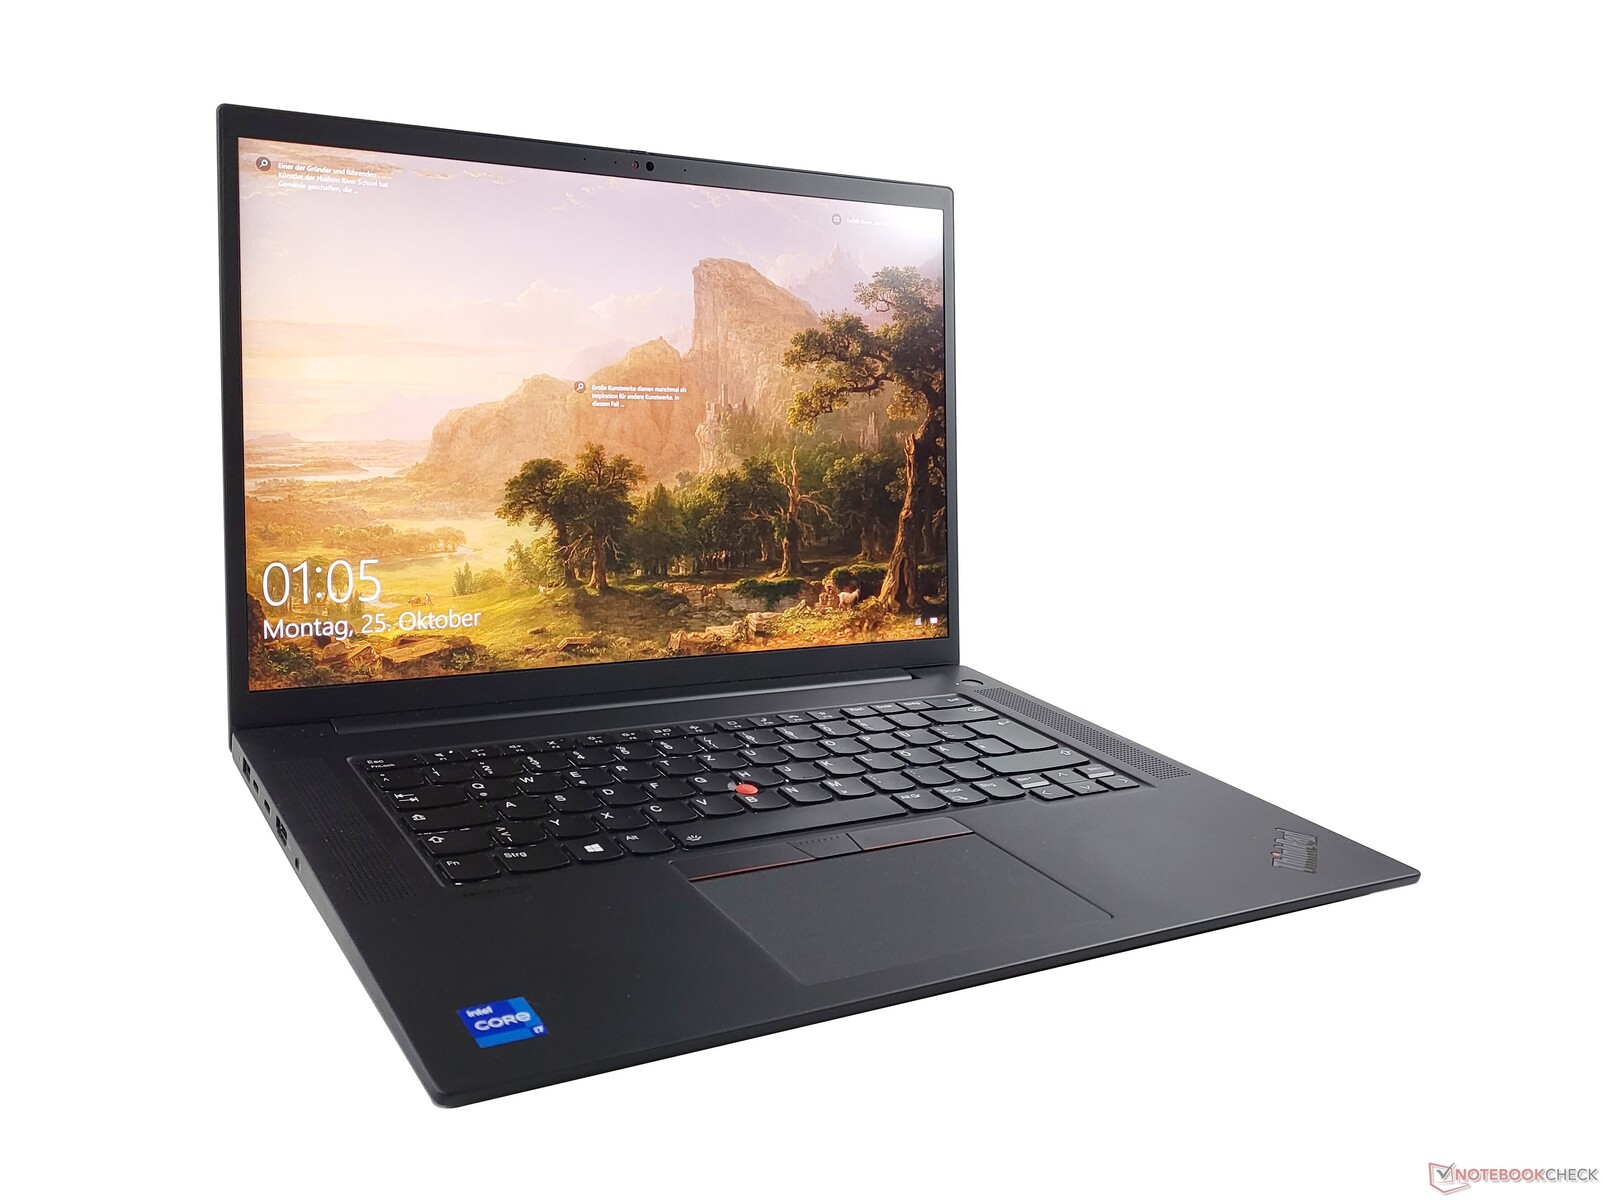
Análisis del portátil Lenovo ThinkPad P1 G4: Éxito con Vapor-Chamber y GeForce RTX 3070
Cuando Lenovo lanzó el ThinkPad P1 en 2018, el reparto de papeles en la línea de estaciones de trabajo estaba claro: el nuevo modelo premium debía recoger a los compradores que necesitaban una estación de trabajo móvil especialmente delgada y ligera y que podían sacrificar algo de rendimiento por ello. El modelo clásico de estación de trabajo Lenovo ThinkPad P52 por otro lado, ofrecía más rendimiento con menos movilidad.
El nuevo Lenovo ThinkPad P1 G4 sigue teniendo su ventaja de movilidad en comparación con el ThinkPad P15 G2la actual estación de trabajo ThinkPad de tamaño completo. Sin embargo, los clientes ya no tienen que sacrificar necesariamente el rendimiento, al menos sobre el papel. Lenovo ha actualizado significativamente el ThinkPad P1 y ha equipado nuestro modelo de pruebas con una Nvidia GeForce RTX 3070 y una resolución 4K UHD+ que corresponde a una de las variantes de configuración más potentes. Dado que recientemente probamos el ThinkPad P1 2021 en una configuración de gama baja, nos remitimos al análisis delThinkPad P1 Gen 4 con Nvidia T1200 para conocer los detalles de la configuración, los dispositivos de entrada y el diseño
Possible competitors in comparison
Valoración | Fecha | Modelo | Peso | Altura | Tamaño | Resolución | Precio |
|---|---|---|---|---|---|---|---|
| 89.8 % v7 (old) | 11/2021 | Lenovo ThinkPad P1 G4-20Y4S0KS00 i7-11850H, GeForce RTX 3070 Laptop GPU | 2 kg | 17.7 mm | 16.00" | 3840x2400 | |
| 89.4 % v7 (old) | 10/2021 | Lenovo ThinkPad P1 G4-20Y30017GE i7-11800H, T1200 Laptop GPU | 1.8 kg | 17.7 mm | 16.00" | 2560x1600 | |
| 88.3 % v7 (old) | 10/2021 | Dell Precision 5000 5560 i7-11850H, RTX A2000 Laptop GPU | 2 kg | 18 mm | 15.60" | 3840x2400 | |
| 89.7 % v7 (old) | 11/2019 | Apple MacBook Pro 16 2019 i9 5500M i9-9880H, Radeon Pro 5500M | 2 kg | 16.2 mm | 16.00" | 3072x1920 | |
| 87.8 % v7 (old) | 08/2021 | HP ZBook Studio 15 G8 i9-11950H, GeForce RTX 3070 Laptop GPU | 1.9 kg | 18 mm | 15.60" | 3840x2160 | |
| 90.1 % v7 (old) | 01/2021 | Lenovo ThinkPad X1 Extreme Gen3-20TLS0UV00 i7-10750H, GeForce GTX 1650 Ti Max-Q | 1.7 kg | 18.7 mm | 15.60" | 1920x1080 |
| SD Card Reader | |
| average JPG Copy Test (av. of 3 runs) | |
| Lenovo ThinkPad P1 G4-20Y30017GE (AV PRO V60) | |
| Dell Precision 5000 5560 (AV Pro V60) | |
| Media de la clase Workstation (49.6 - 681, n=14, últimos 2 años) | |
| Lenovo ThinkPad X1 Extreme Gen3-20TLS0UV00 (Toshiba Exceria Pro SDXC 64 GB UHS-II) | |
| HP ZBook Studio 15 G8 (AV Pro V60) | |
| maximum AS SSD Seq Read Test (1GB) | |
| Media de la clase Workstation (87.6 - 1455, n=14, últimos 2 años) | |
| Lenovo ThinkPad X1 Extreme Gen3-20TLS0UV00 (Toshiba Exceria Pro SDXC 64 GB UHS-II) | |
| Dell Precision 5000 5560 (AV Pro V60) | |
| Lenovo ThinkPad P1 G4-20Y30017GE (AV PRO V60) | |
| HP ZBook Studio 15 G8 (AV Pro V60) | |


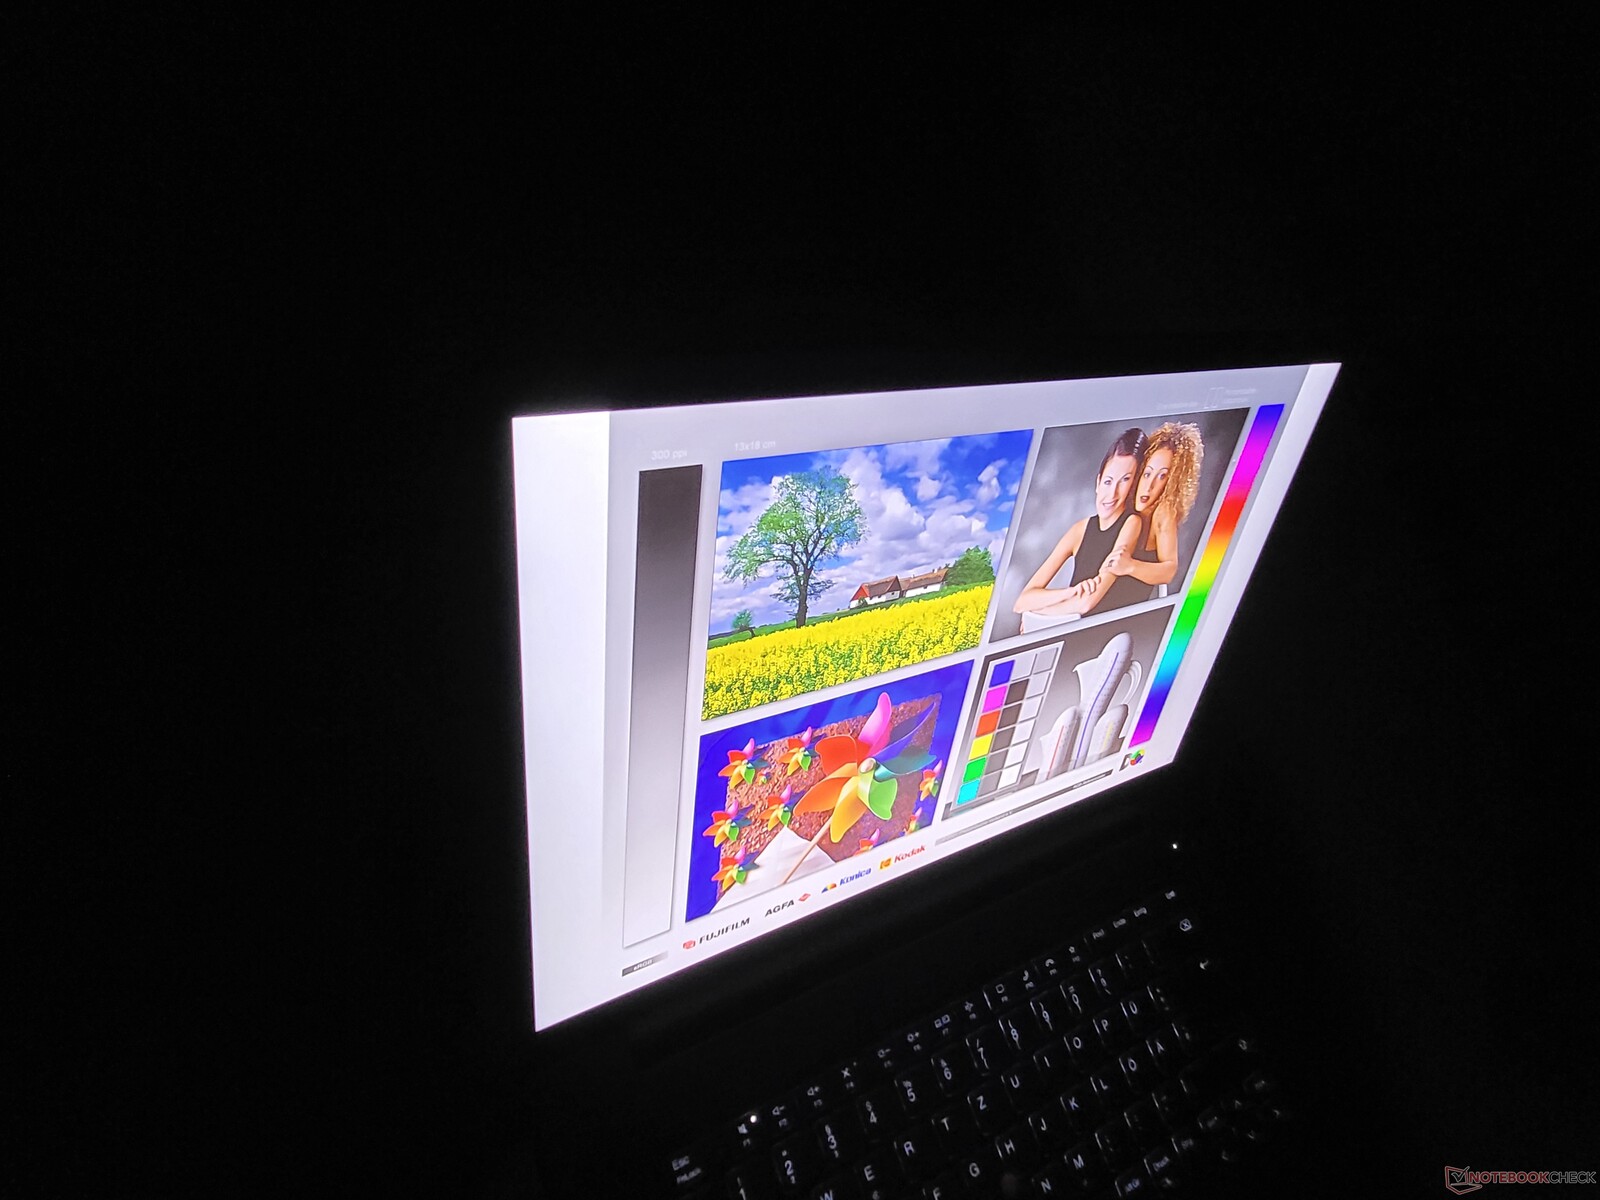
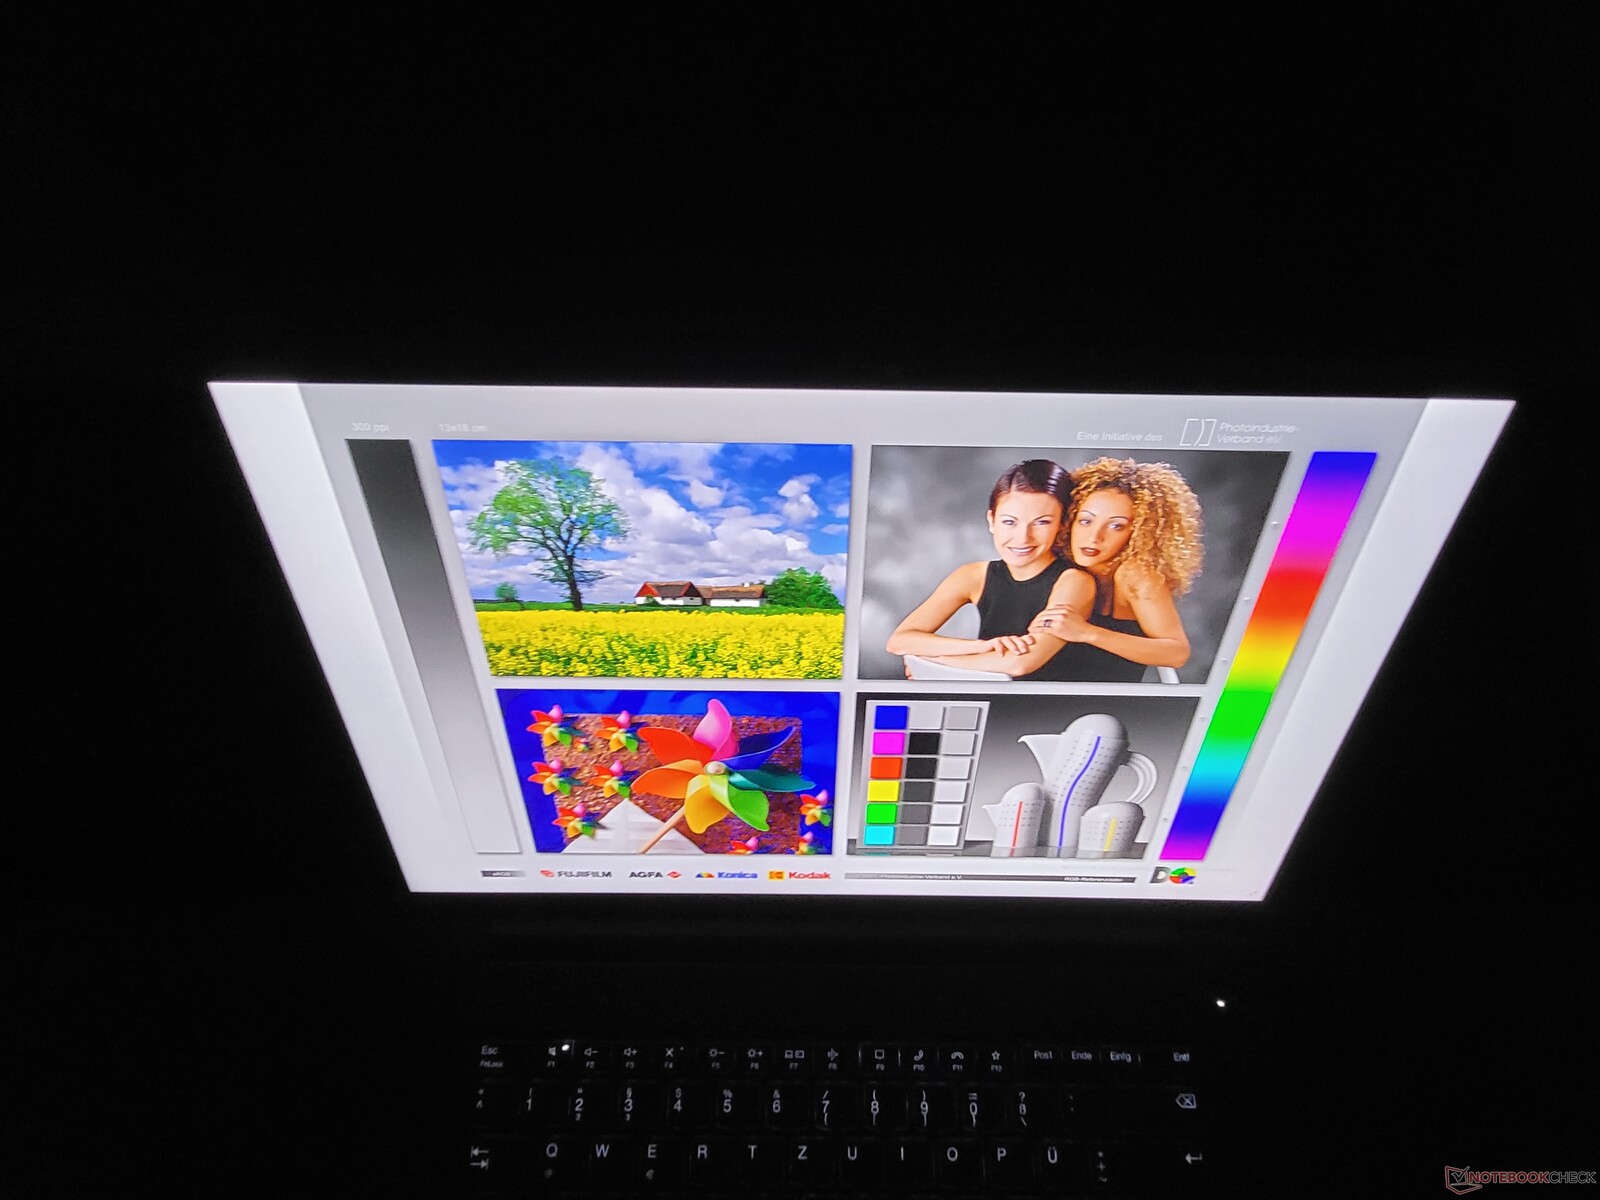
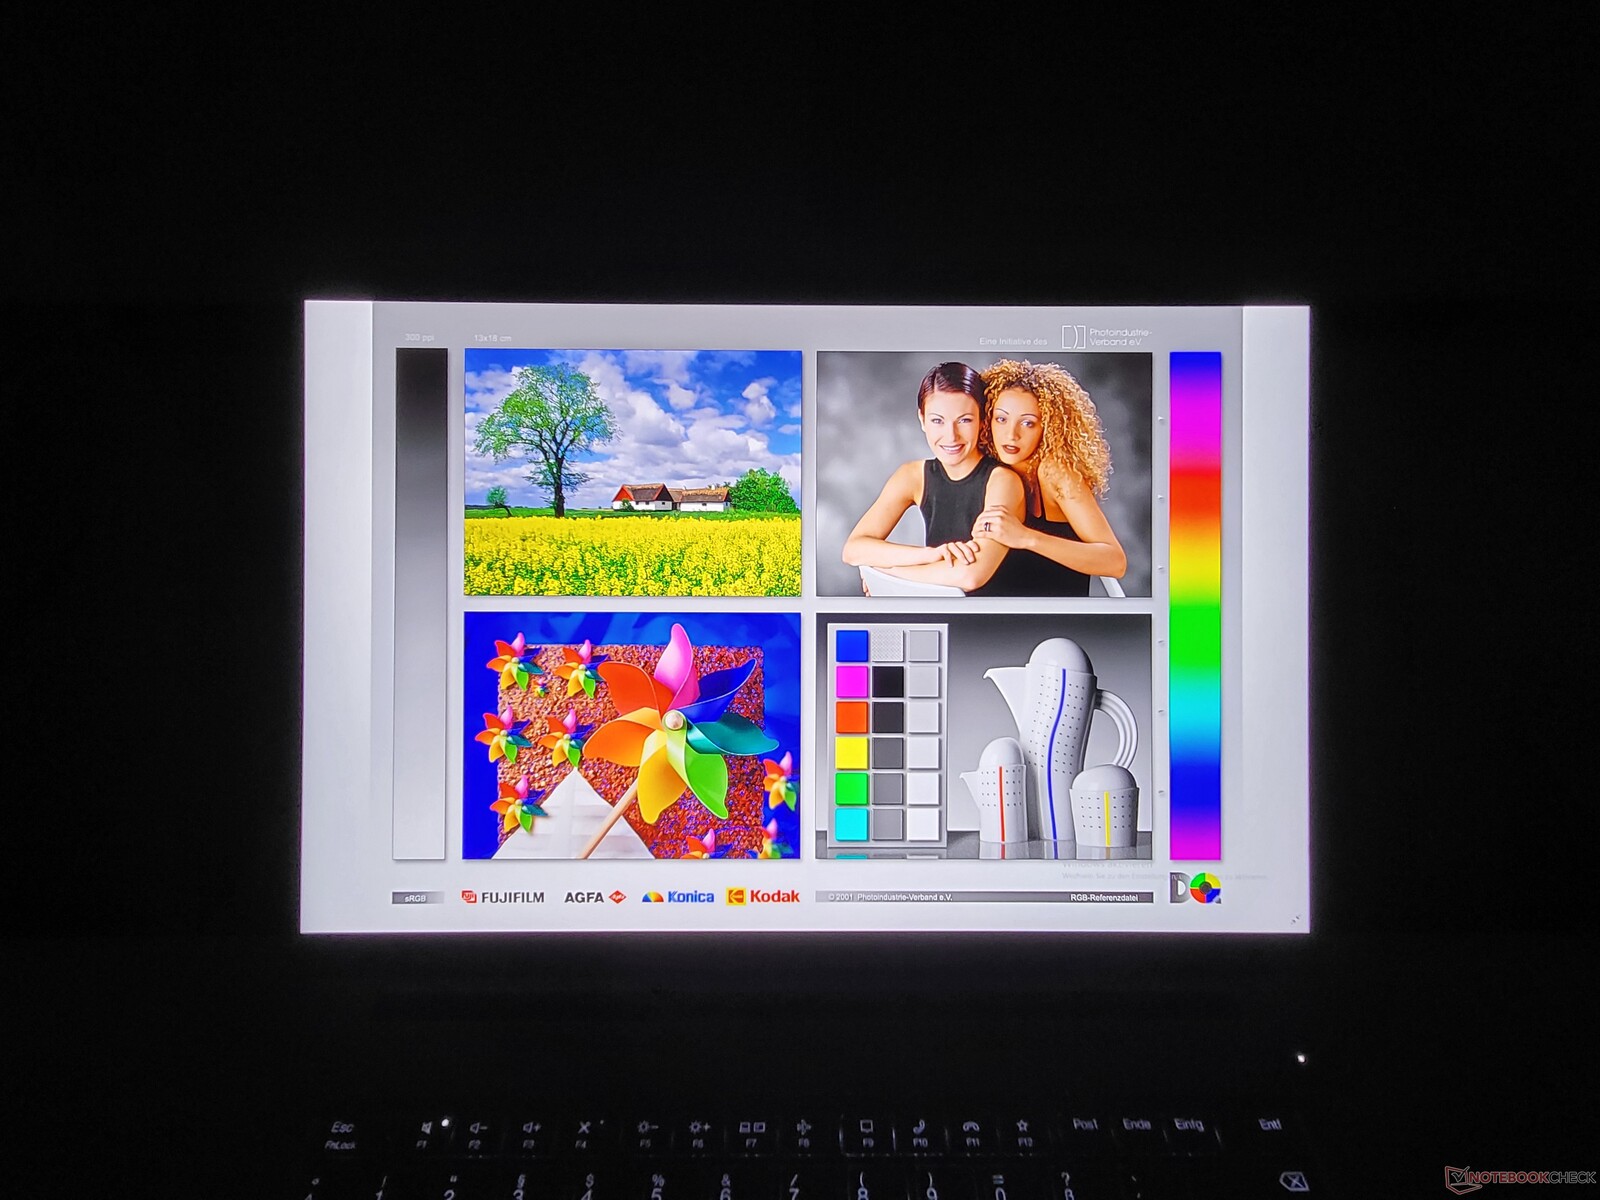
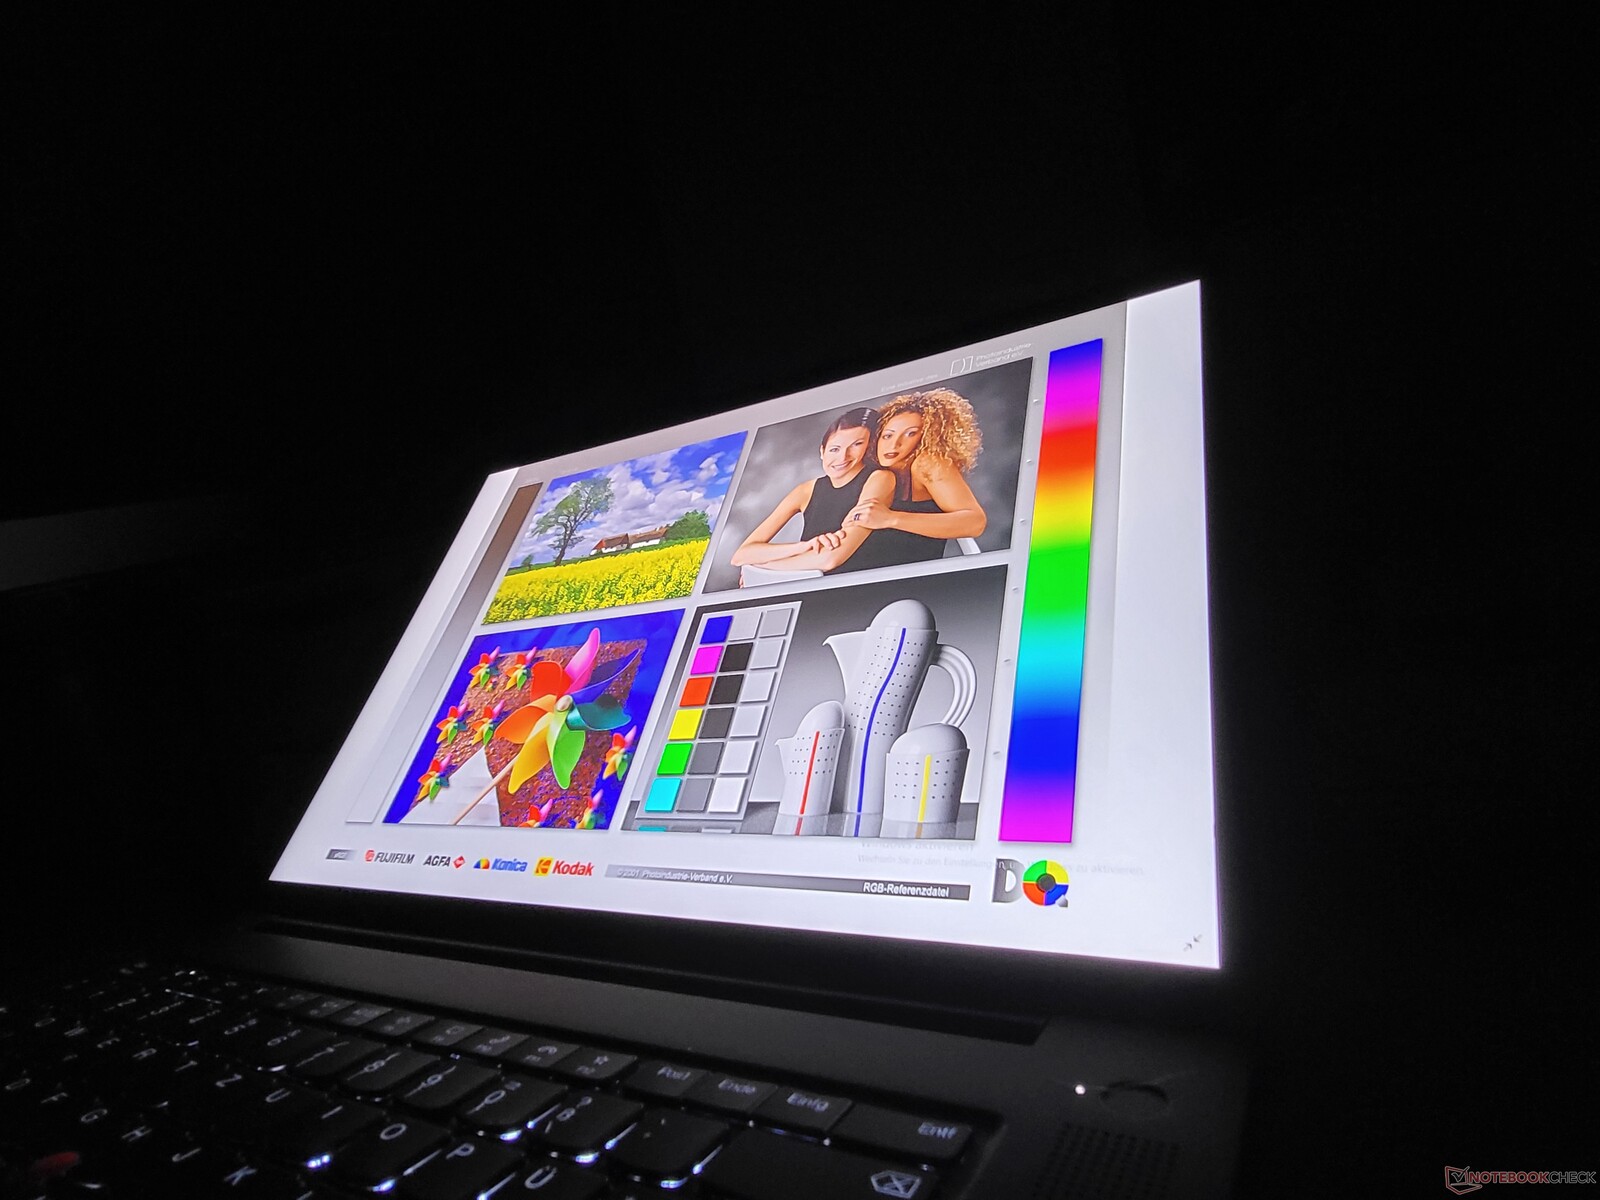
La pantalla mate 4K UHD+ del Lenovo ThinkPad P1 G4 es excelente


El Lenovo ThinkPad P1 Gen 4 está disponible con tres pantallas diferentes de 16 pulgadas en formato 16:10. La opción básica, una pantalla LCD WQXGA (2.560 x 1.600),que ya hemos probado. Nuestra unidad de análisis incluye la pantalla mate 4K UHD+/WQUXGA sin tacto - la tercera opción es la misma pantalla, en brillante, con tacto y digitalizador Wacom.
El valor de brillo de 600 cd/m² declarado por Lenovo es superado por el panel LG con una media de 610 cd/m². En el campo de pruebas de portátiles premium en el formato de 15 a 16 pulgadas, la pantalla del ThinkPad P1 G4 de Lenovo es claramente la más brillante.
Los tiempos de respuesta no son particularmente buenos - la opción WQXGA es mejor en este aspecto. La diferencia es particularmente notoria comparada con la pantalla OLED del HP ZBook Studio 15 G8la variante OLED del ThinkPad P1 G3 lamentablemente ya no está disponible en el ThinkPad P1 2021.
| |||||||||||||||||||||||||
iluminación: 90 %
Brillo con batería: 629 cd/m²
Contraste: 1537:1 (Negro: 0.41 cd/m²)
ΔE ColorChecker Calman: 2.2 | ∀{0.5-29.43 Ø4.71}
calibrated: 1
ΔE Greyscale Calman: 2.7 | ∀{0.09-98 Ø4.96}
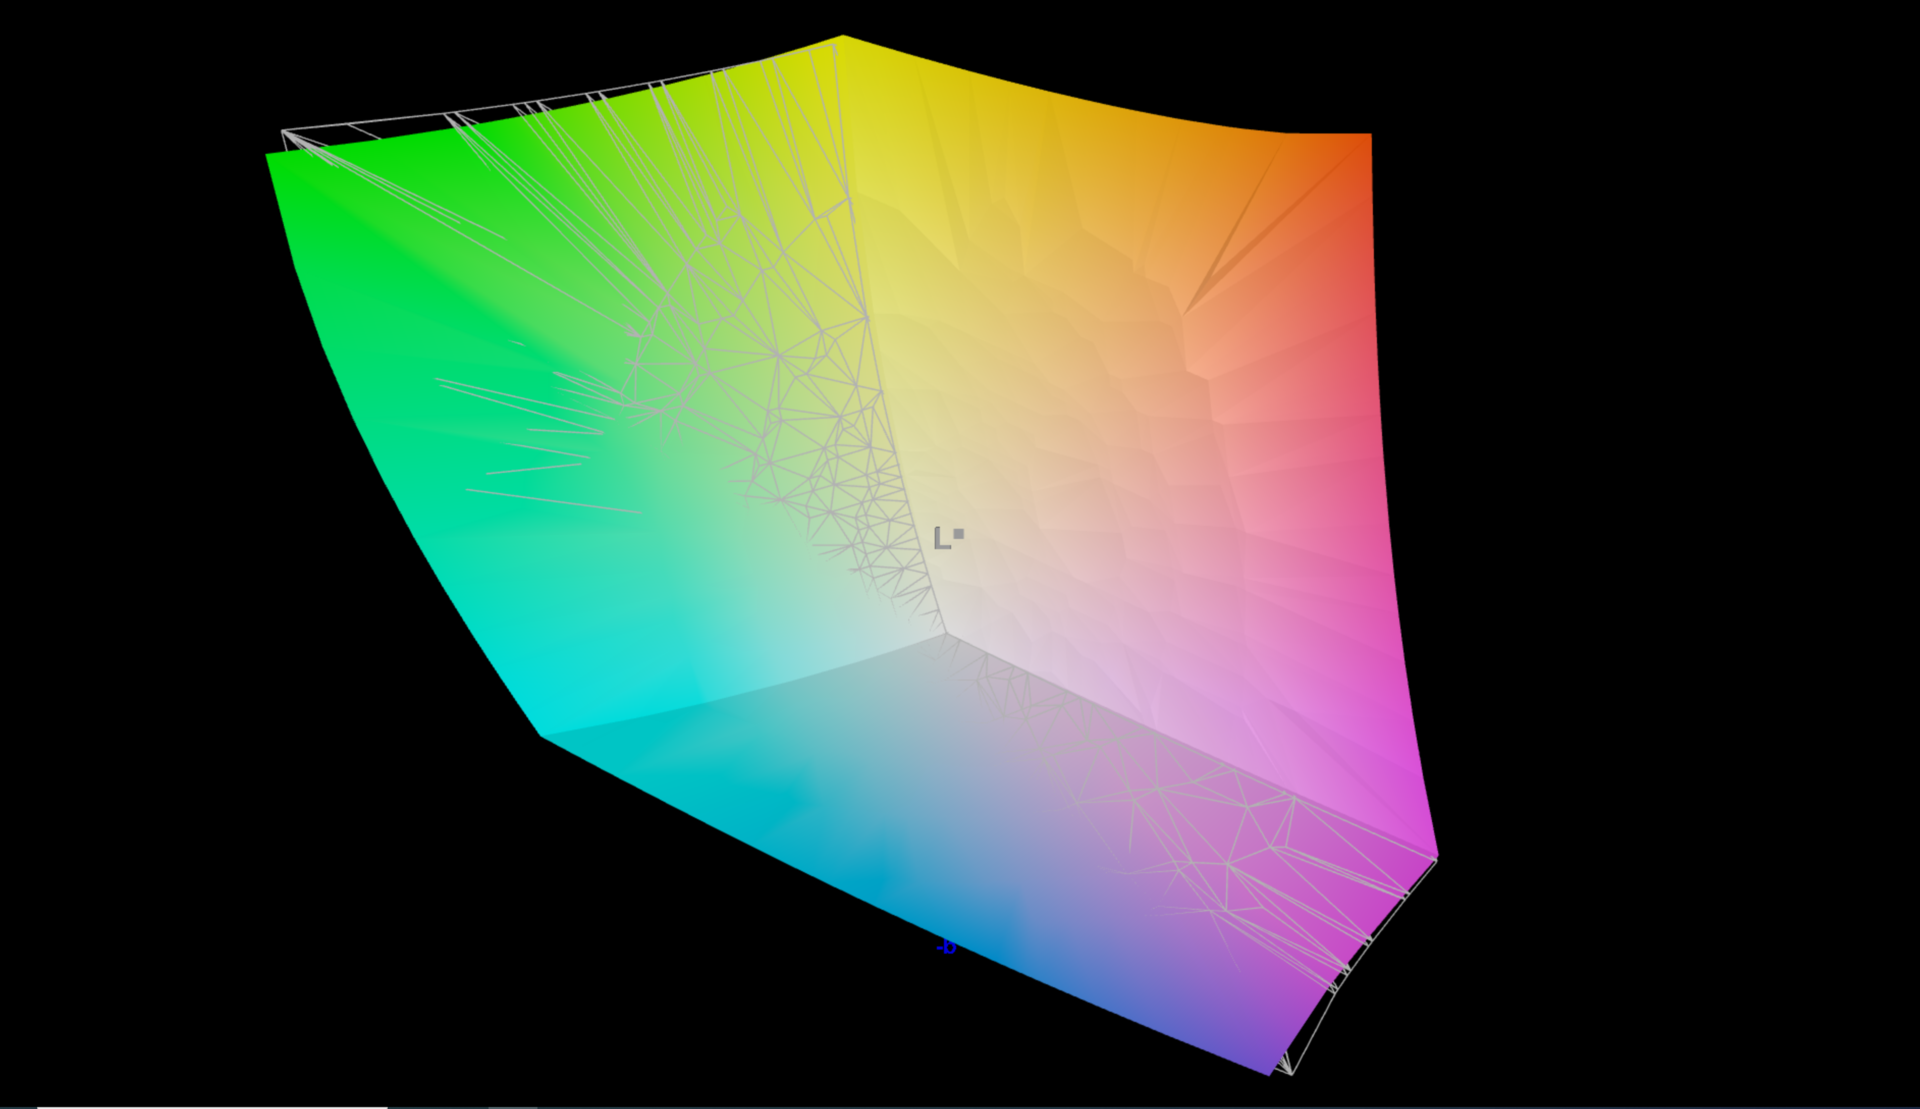
98.9% AdobeRGB 1998 (Argyll 3D)
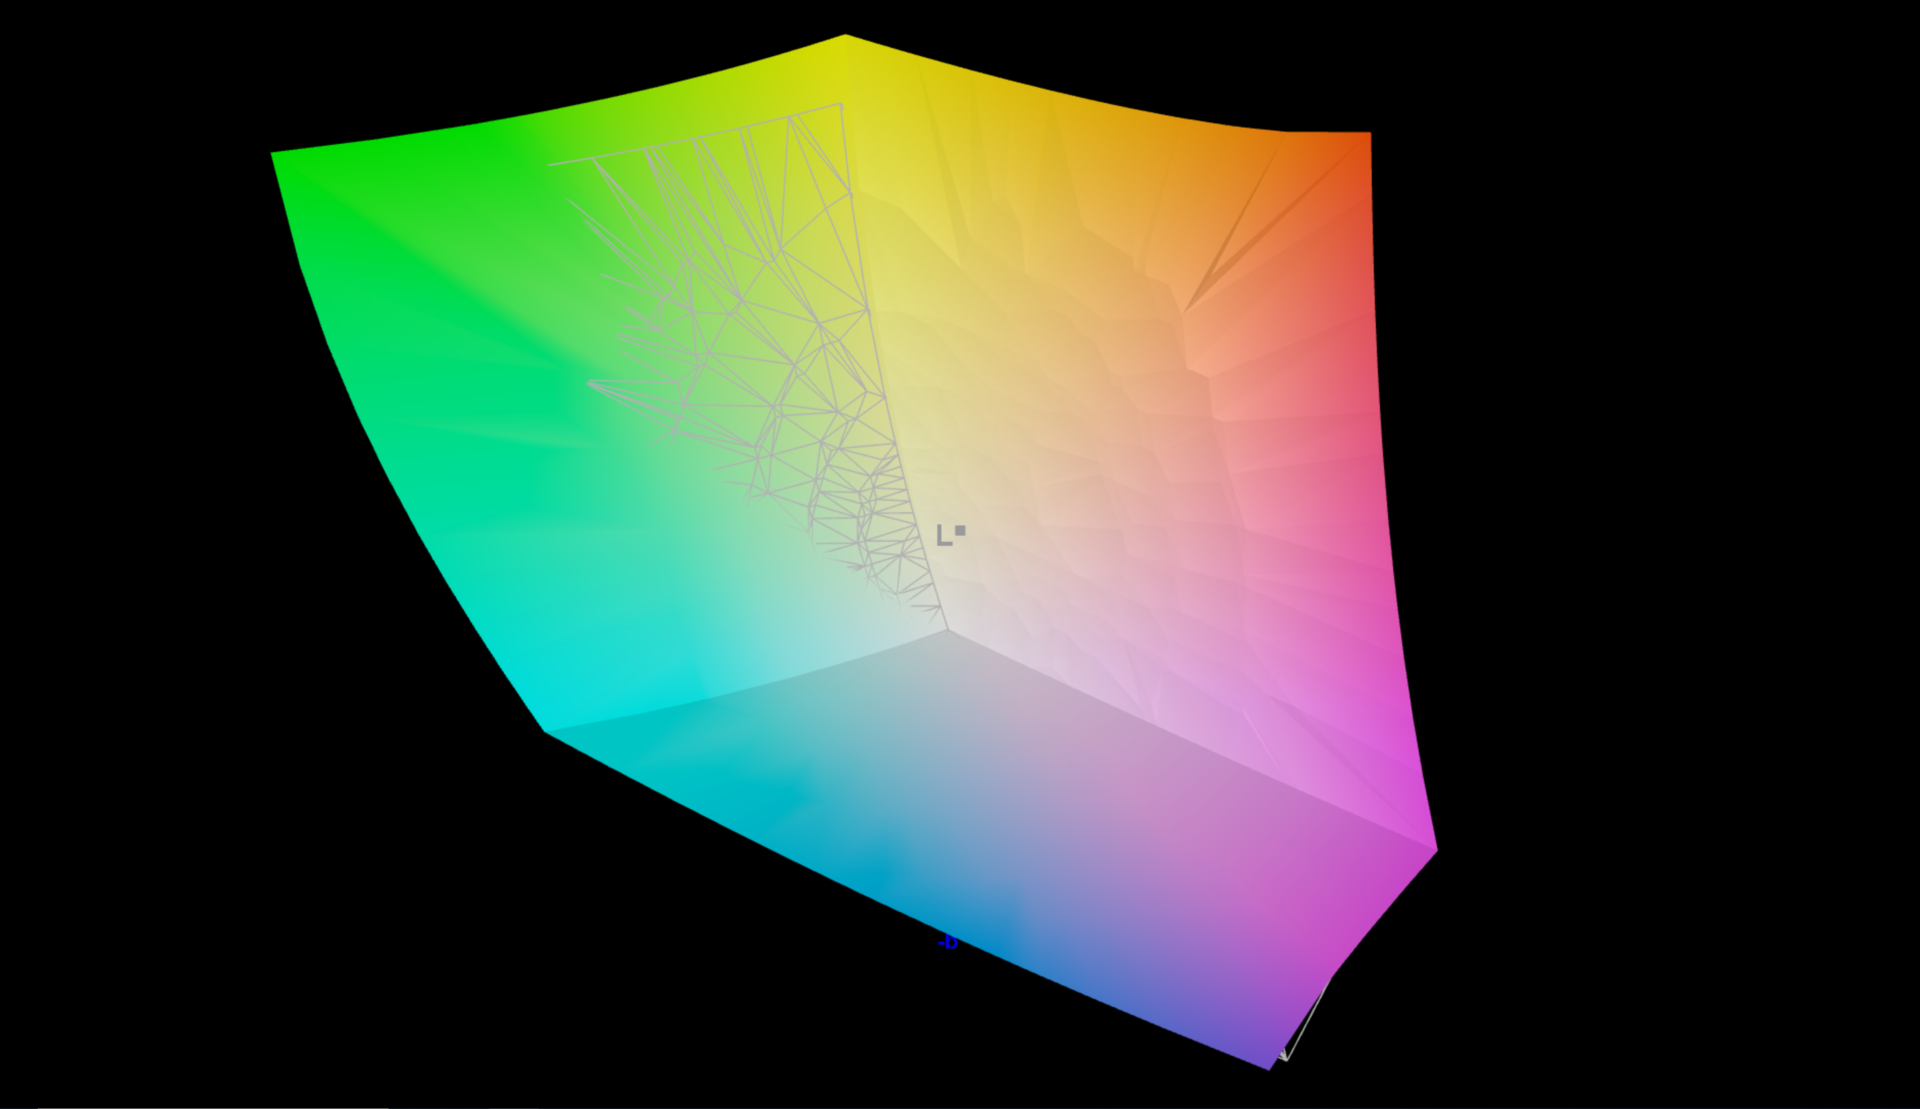
99.4% sRGB (Argyll 3D)
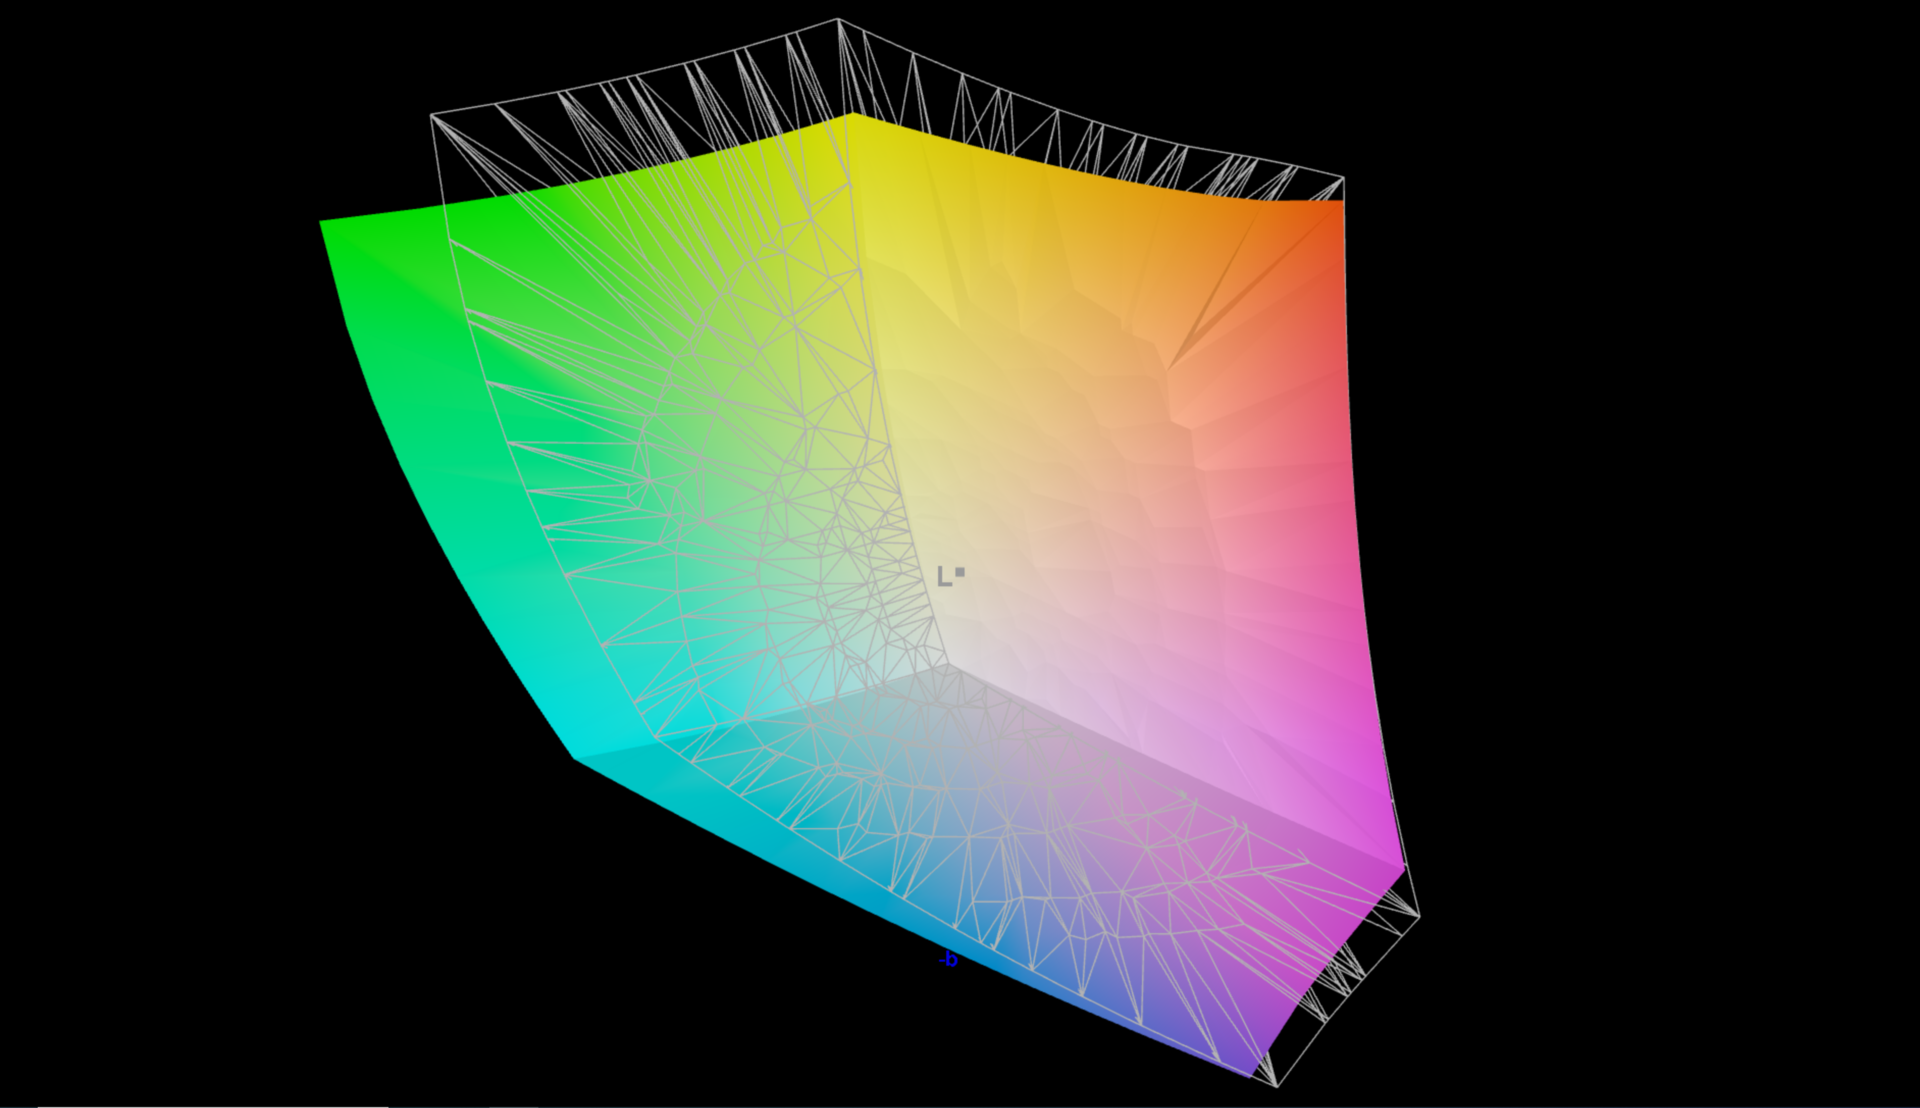
85.7% Display P3 (Argyll 3D)
Gamma: 2.26
CCT: 6886 K
| Lenovo ThinkPad P1 G4-20Y4S0KS00 LP160UQ1-SPB1, IPS LED, 3840x2400, 16" | Lenovo ThinkPad P1 G4-20Y30017GE B160QAN02.M, IPS, 2560x1600, 16" | Dell Precision 5000 5560 Sharp LQ156R1, IPS, 3840x2400, 15.6" | Apple MacBook Pro 16 2019 i9 5500M APPA044, IPS, 3072x1920, 16" | HP ZBook Studio 15 G8 SDC4145, OLED, 3840x2160, 15.6" | Lenovo ThinkPad X1 Extreme Gen3-20TLS0UV00 N156HCE-GN1, IPS, 1920x1080, 15.6" | |
|---|---|---|---|---|---|---|
| Display | -10% | 4% | 5% | -25% | ||
| Display P3 Coverage (%) | 85.7 | 77.3 -10% | 94.9 11% | 99.9 17% | 61 -29% | |
| sRGB Coverage (%) | 99.4 | 99.9 1% | 100 1% | 100 1% | 89.9 -10% | |
| AdobeRGB 1998 Coverage (%) | 98.9 | 78.1 -21% | 100 1% | 95.3 -4% | 62.2 -37% | |
| Response Times | 21% | 9% | -4% | 94% | 34% | |
| Response Time Grey 50% / Grey 80% * (ms) | 55.2 ? | 40.8 ? 26% | 47.2 ? 14% | 52.4 ? 5% | 2.4 ? 96% | 33.6 ? 39% |
| Response Time Black / White * (ms) | 31.2 ? | 26.4 ? 15% | 30.4 ? 3% | 34.9 ? -12% | 2.4 ? 92% | 22.4 ? 28% |
| PWM Frequency (Hz) | 131700 | 240.4 ? | 26040 ? | |||
| Screen | -17% | -28% | -1% | -67% | -6% | |
| Brightness middle (cd/m²) | 630 | 420 -33% | 501.5 -20% | 519 -18% | 379.6 -40% | 518 -18% |
| Brightness (cd/m²) | 622 | 401 -36% | 467 -25% | 477 -23% | 380 -39% | 513 -18% |
| Brightness Distribution (%) | 90 | 90 0% | 83 -8% | 86 -4% | 95 6% | 88 -2% |
| Black Level * (cd/m²) | 0.41 | 0.3 27% | 0.44 -7% | 0.39 5% | 0.38 7% | |
| Contrast (:1) | 1537 | 1400 -9% | 1140 -26% | 1331 -13% | 1363 -11% | |
| Colorchecker dE 2000 * | 2.2 | 2.5 -14% | 4.73 -115% | 2.28 -4% | 5.15 -134% | 2.1 5% |
| Colorchecker dE 2000 max. * | 5 | 4.9 2% | 8.45 -69% | 6.54 -31% | 7.79 -56% | 4.5 10% |
| Colorchecker dE 2000 calibrated * | 1 | 1.6 -60% | 0.51 49% | 0.86 14% | 3.1 -210% | 1.3 -30% |
| Greyscale dE 2000 * | 2.7 | 3.4 -26% | 3.6 -33% | 0.9 67% | 2.6 4% | 2.7 -0% |
| Gamma | 2.26 97% | 2.24 98% | 2.08 106% | 2145 0% | 1.99 111% | 2.35 94% |
| CCT | 6886 94% | 6479 100% | 6447 101% | 6572 99% | 6166 105% | 7042 92% |
| Color Space (Percent of AdobeRGB 1998) (%) | 78 | 57.7 | ||||
| Color Space (Percent of sRGB) (%) | 90.4 | |||||
| Media total (Programa/Opciones) | -2% /
-10% | -5% /
-16% | -3% /
-1% | 11% /
-22% | 1% /
-5% |
* ... más pequeño es mejor
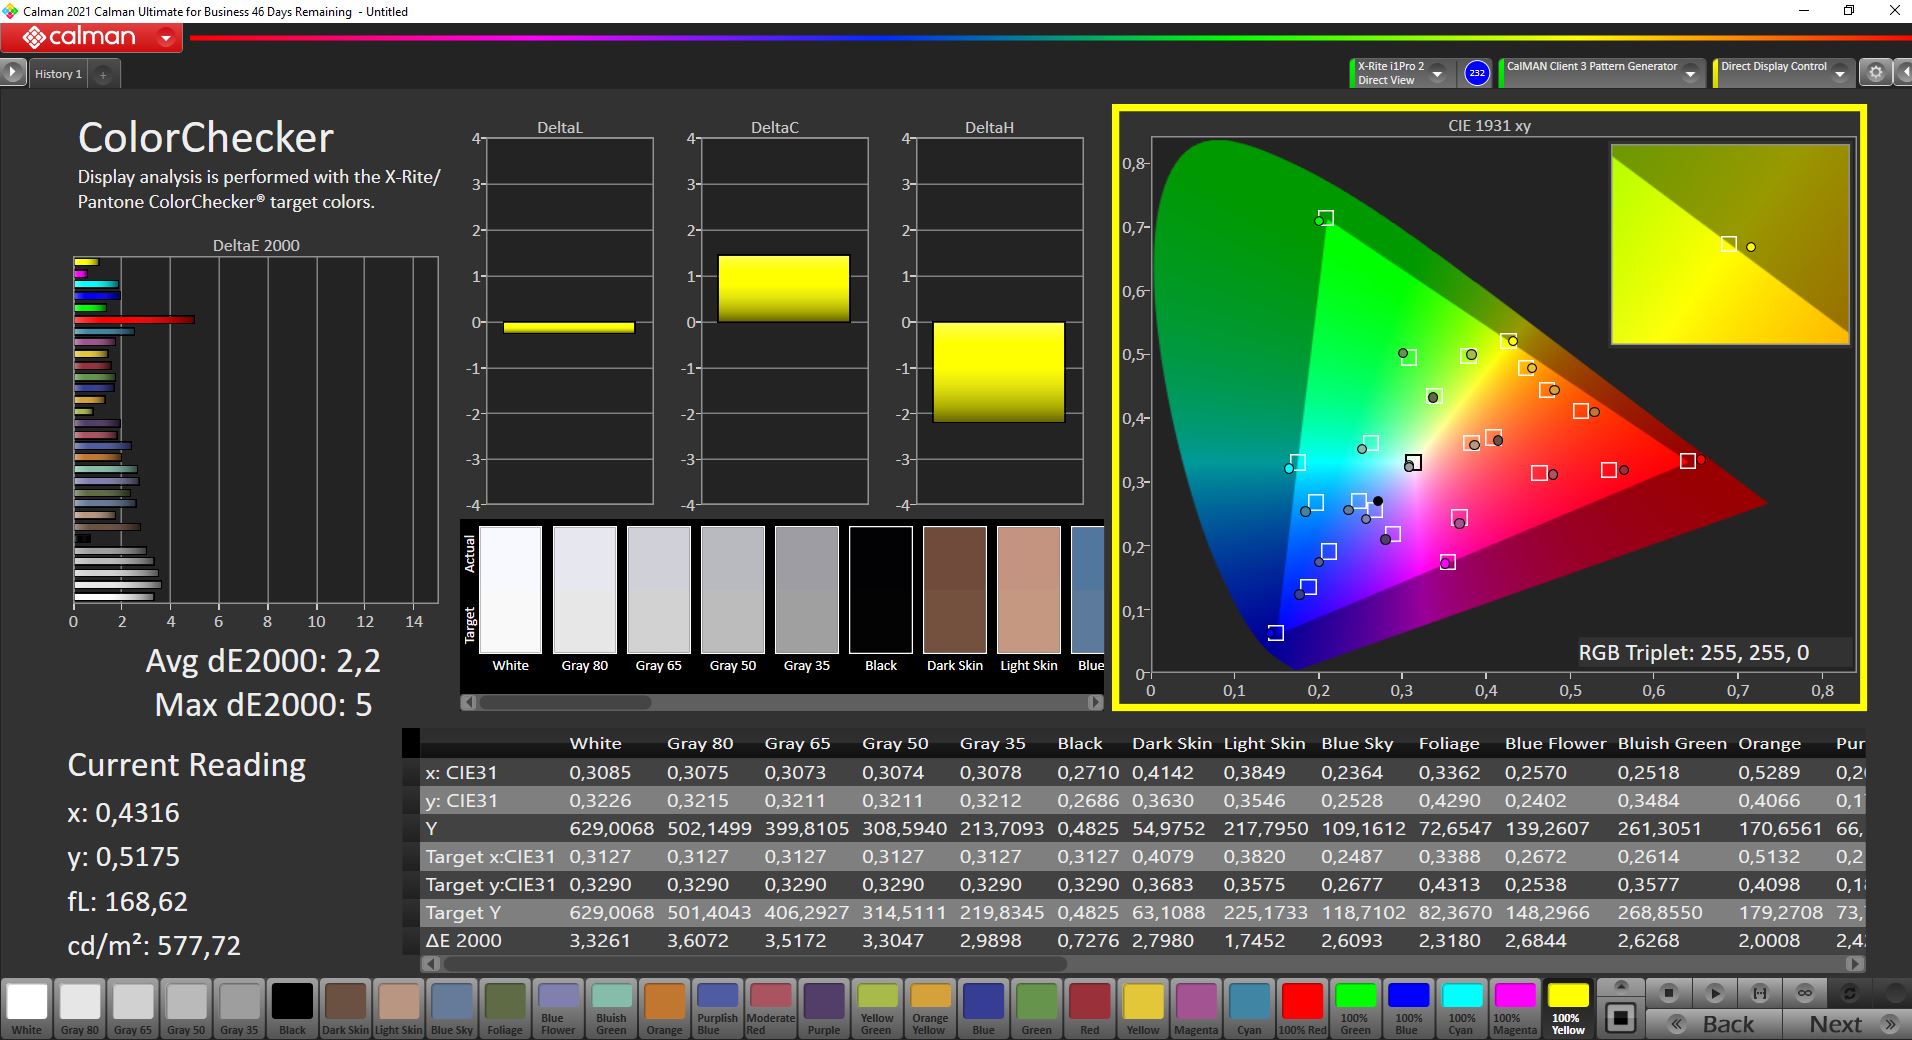
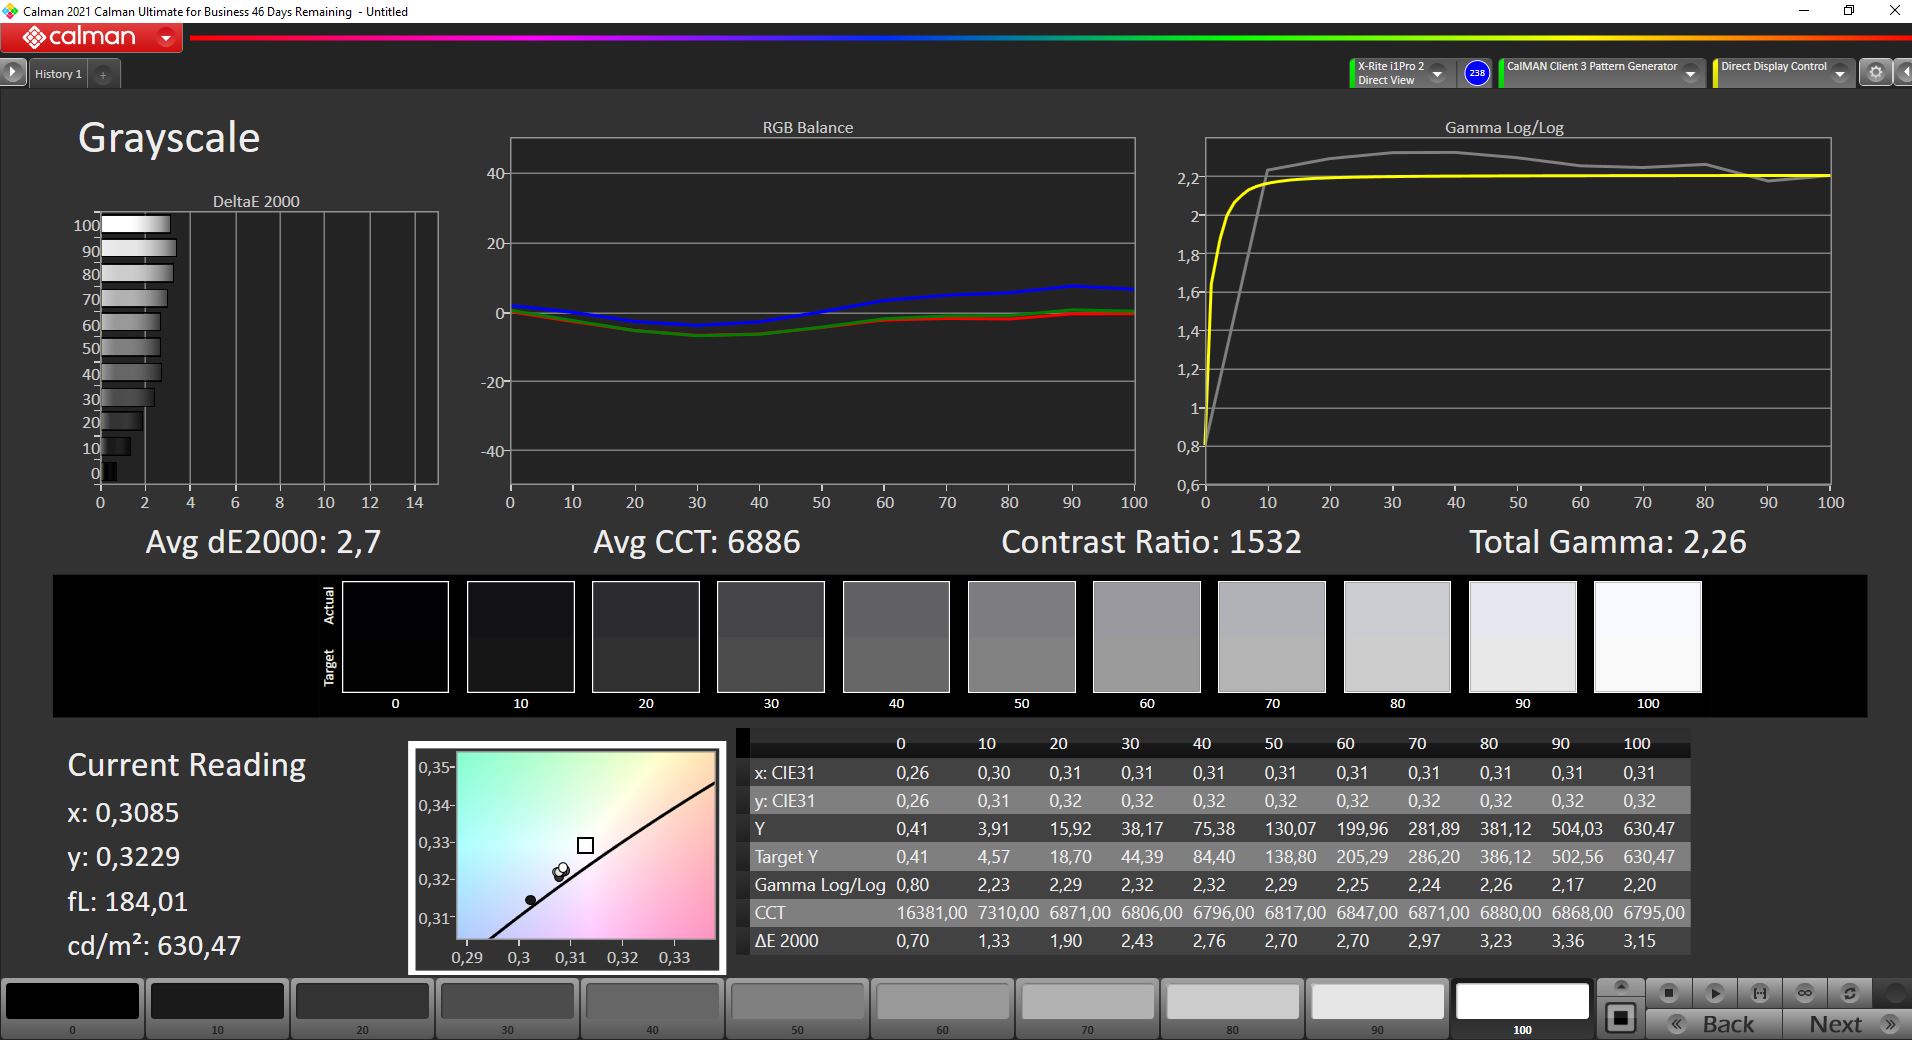
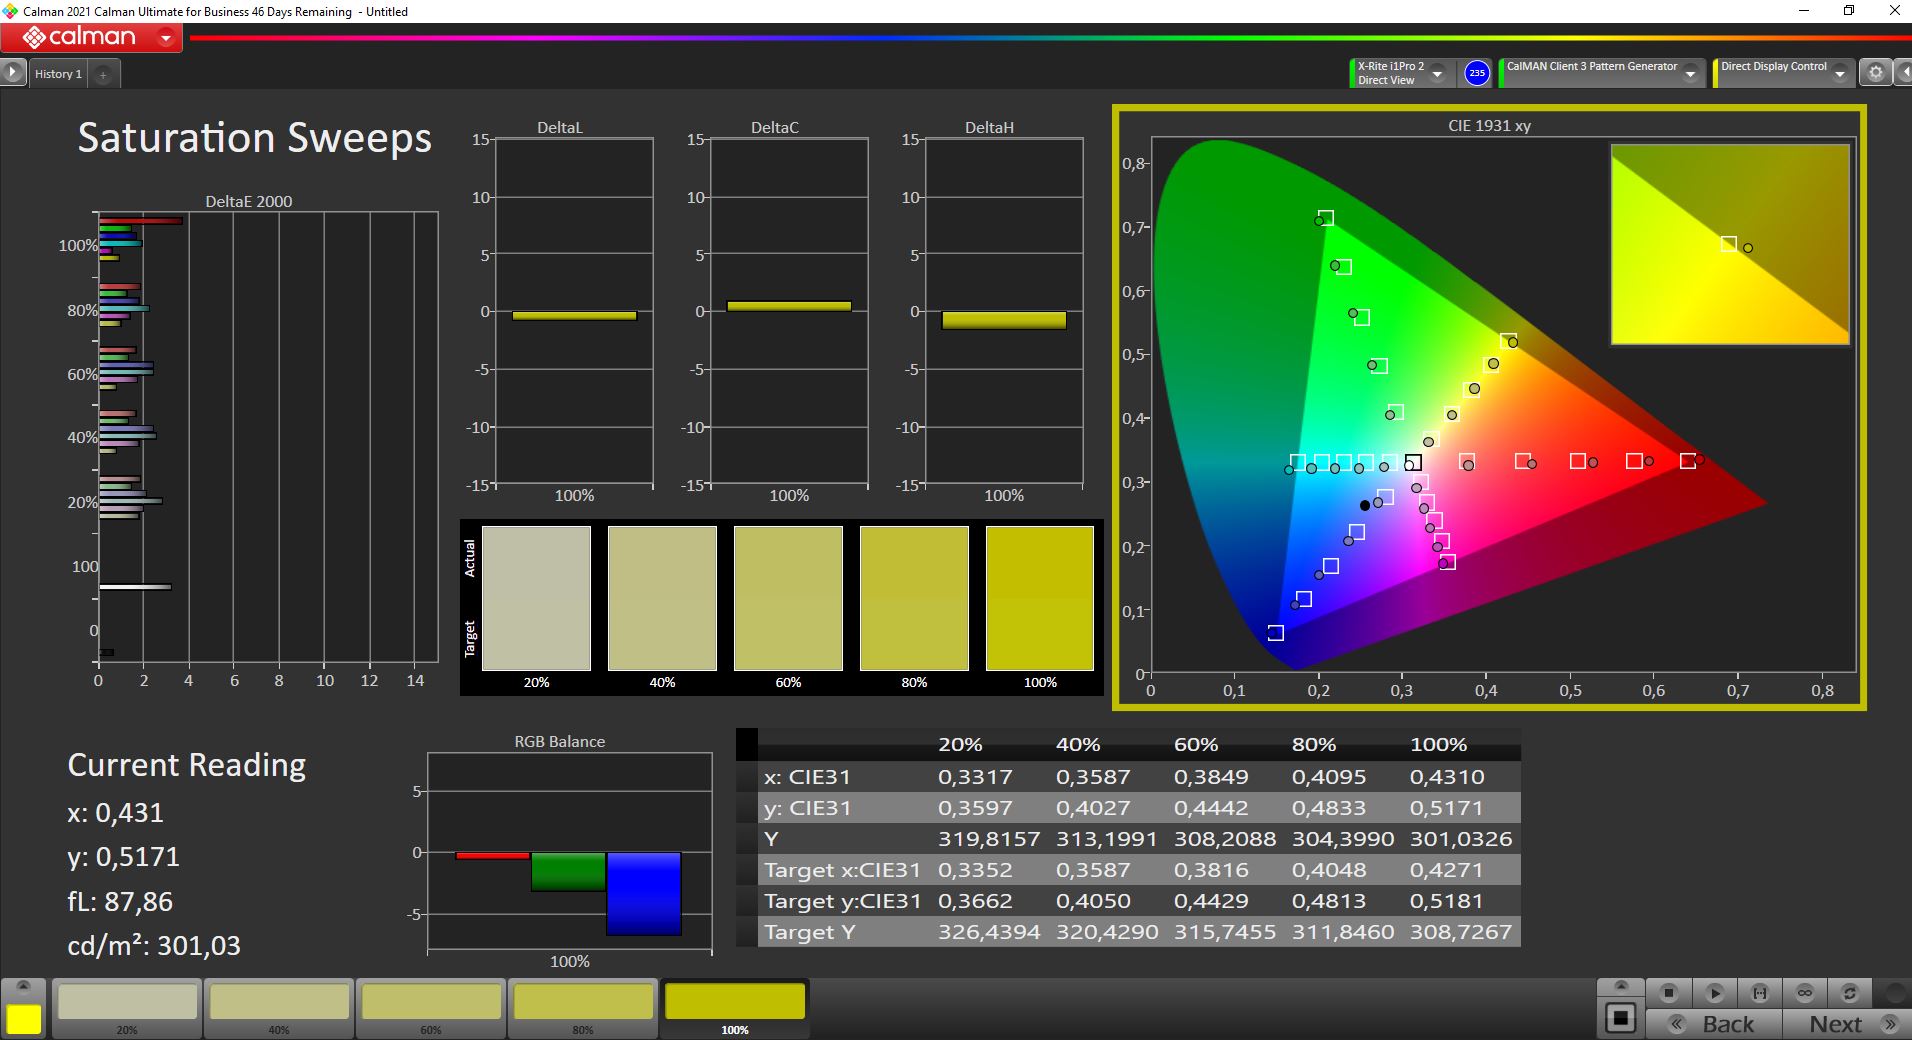
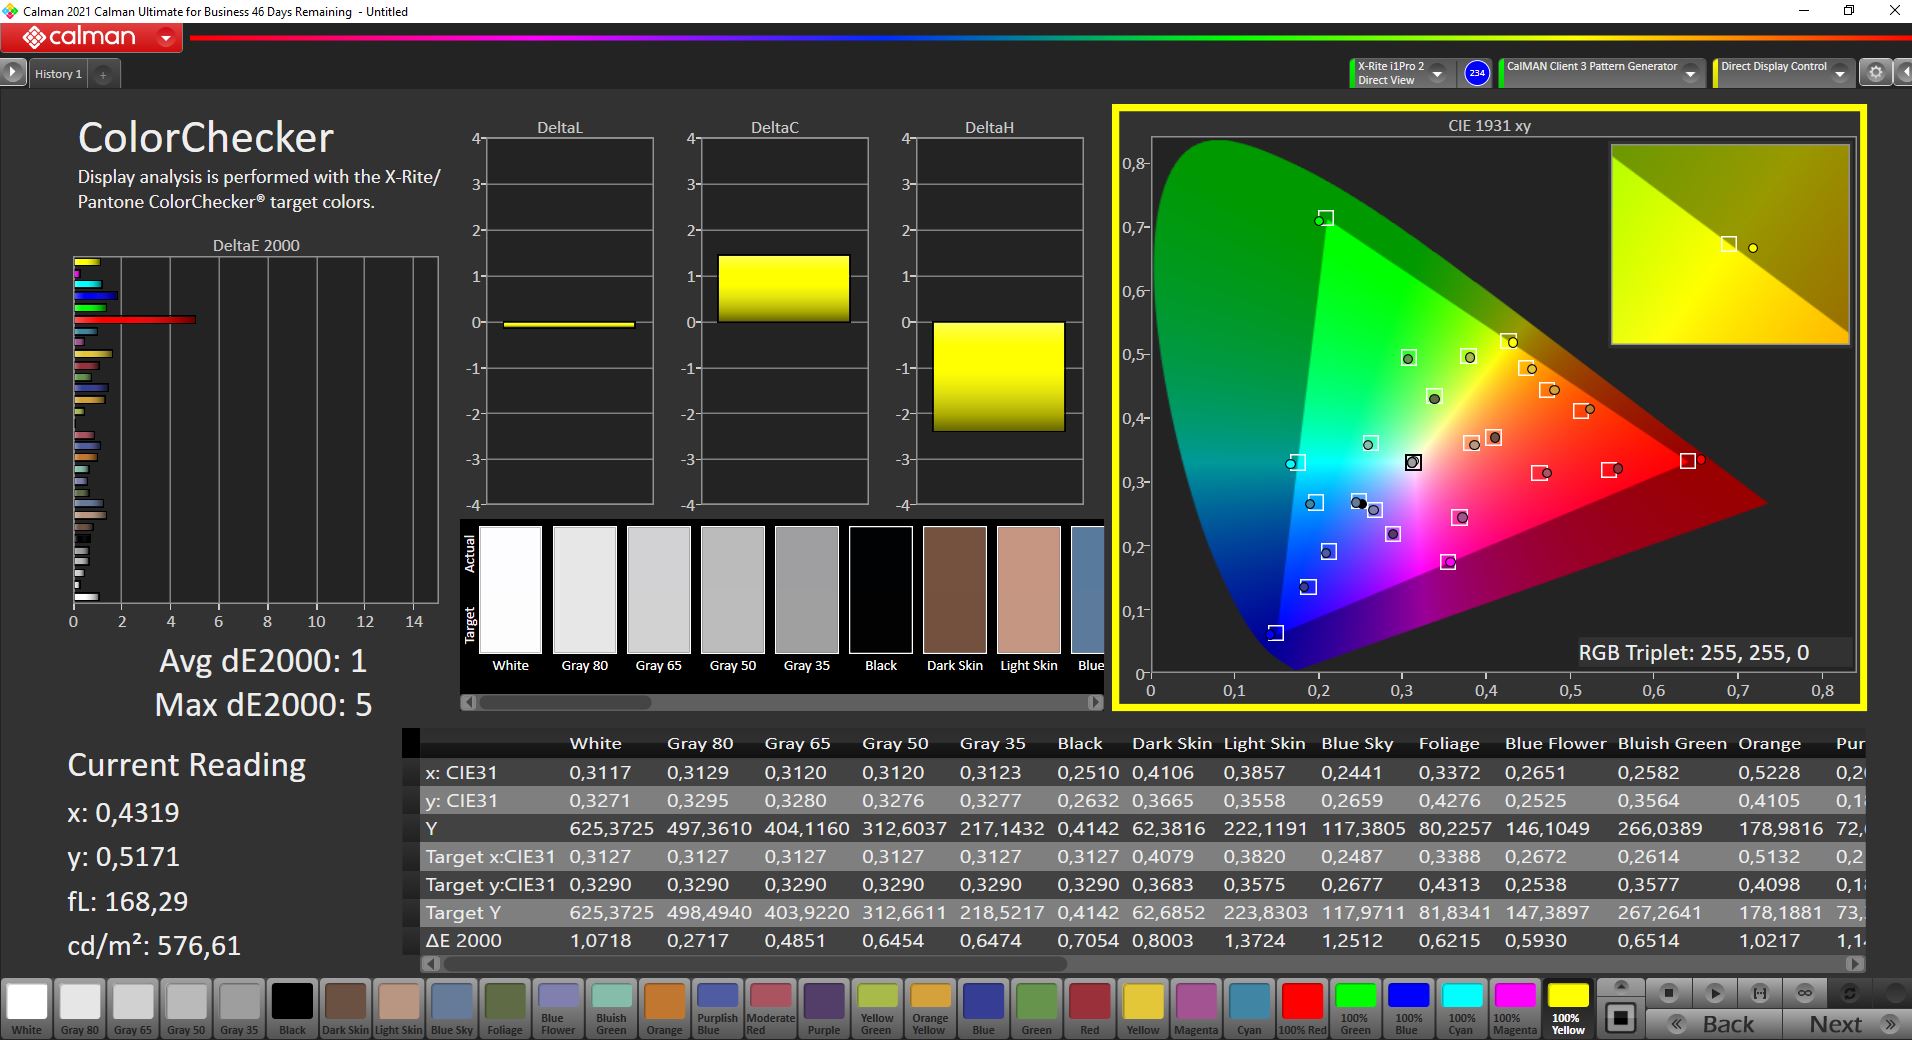
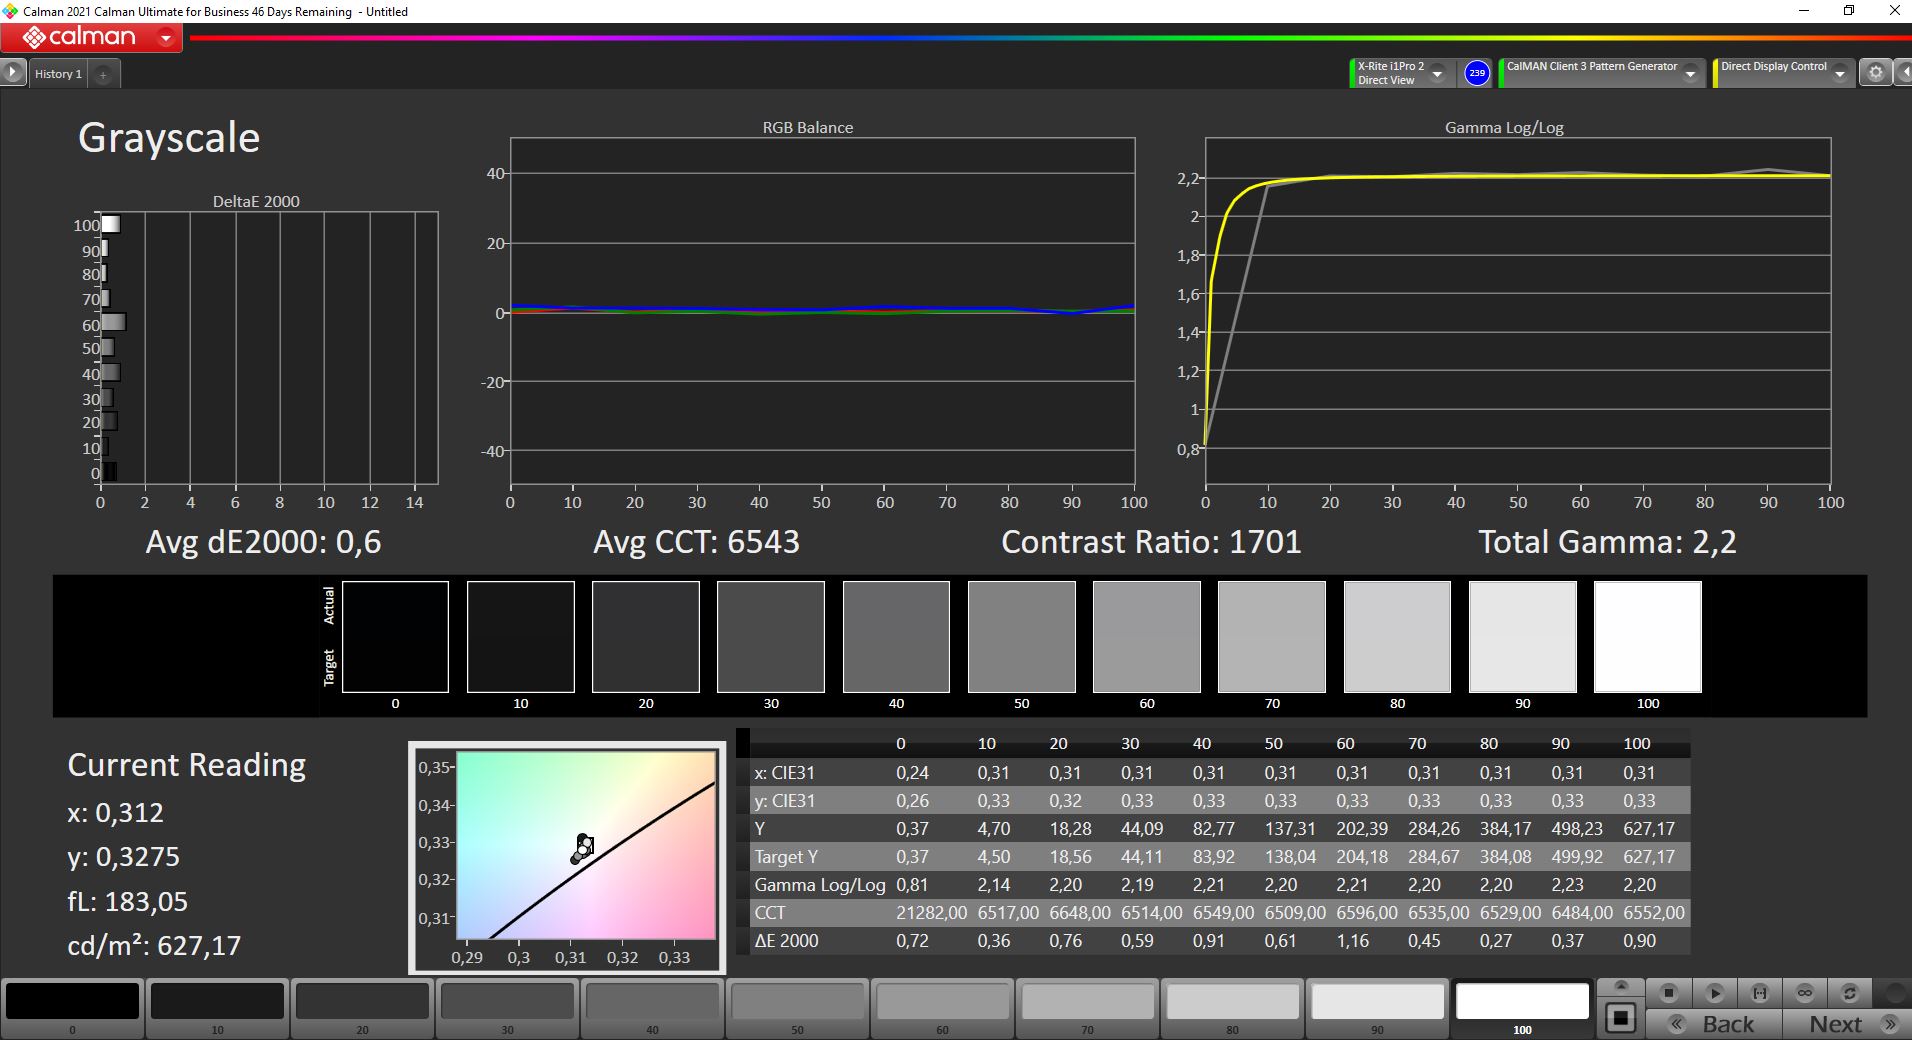

Lenovo anuncia la pantalla WQUXGA instalada aquí con una calibración de fábrica. De hecho, medimos valores bastante buenos de fábrica con Calman y el X-Rite i1Pro 2. Un valor DeltaE de 2,2 para los valores de color significa que las desviaciones son menores. Sin embargo, todavía hay margen de mejora. Tras la calibración con el X-Rite i1Profiler, el DeltaE bajó a 1,0. Como siempre, proporcionamos el perfil de color correspondiente para su descarga gratuita.
El valor de negro de 0.41 cd/m² no es particularmente sobresaliente para una pantalla IPS LED, pero el alto brillo aún asegura un buen contraste de 1537:1. Junto con la alta cobertura del espacio de color del 98.9% del amplio espacio de color AdobeRGB (Lenovo anuncia 100% AdobeRGB), la calidad de imagen del Lenovo ThinkPad P1 Gen 4 es excelente, y el panel de 8 bits es muy adecuado para la edición de imágenes
El Lenovo ThinkPad P1 2021 domina fácilmente el uso en exteriores. La superficie mate ayuda a la brillante pantalla 4K UHD+ a eclipsar fácilmente la luz del día en días nublados. Sin embargo, la luz solar directa puede ser un reto incluso con 600 cd/m²
Tiempos de respuesta del display
| ↔ Tiempo de respuesta de Negro a Blanco | ||
|---|---|---|
| 31.2 ms ... subida ↗ y bajada ↘ combinada | ↗ 16.4 ms subida | 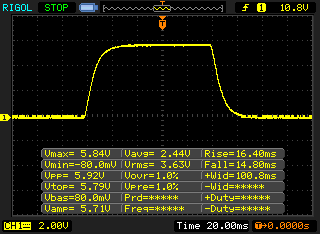 |
| ↘ 14.8 ms bajada | ||
| La pantalla mostró tiempos de respuesta lentos en nuestros tests y podría ser demasiado lenta para los jugones. En comparación, todos los dispositivos de prueba van de ##min### (mínimo) a 240 (máximo) ms. » 84 % de todos los dispositivos son mejores. Eso quiere decir que el tiempo de respuesta es peor que la media (19.8 ms) de todos los dispositivos testados. | ||
| ↔ Tiempo de respuesta 50% Gris a 80% Gris | ||
| 55.2 ms ... subida ↗ y bajada ↘ combinada | ↗ 26.8 ms subida | 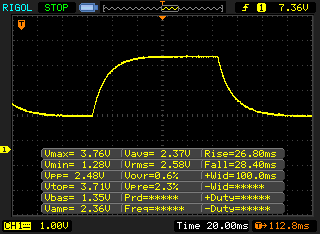 |
| ↘ 28.4 ms bajada | ||
| La pantalla mostró tiempos de respuesta lentos en nuestros tests y podría ser demasiado lenta para los jugones. En comparación, todos los dispositivos de prueba van de ##min### (mínimo) a 636 (máximo) ms. » 92 % de todos los dispositivos son mejores. Eso quiere decir que el tiempo de respuesta es peor que la media (31 ms) de todos los dispositivos testados. | ||
Parpadeo de Pantalla / PWM (Pulse-Width Modulation)
| Parpadeo de Pantalla / PWM no detectado | 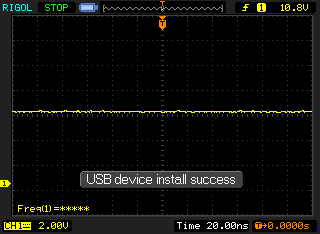 | ||
Comparación: 52 % de todos los dispositivos testados no usaron PWM para atenuar el display. Si se usó, medimos una media de 7757 (mínimo: 5 - máxmo: 343500) Hz. | |||
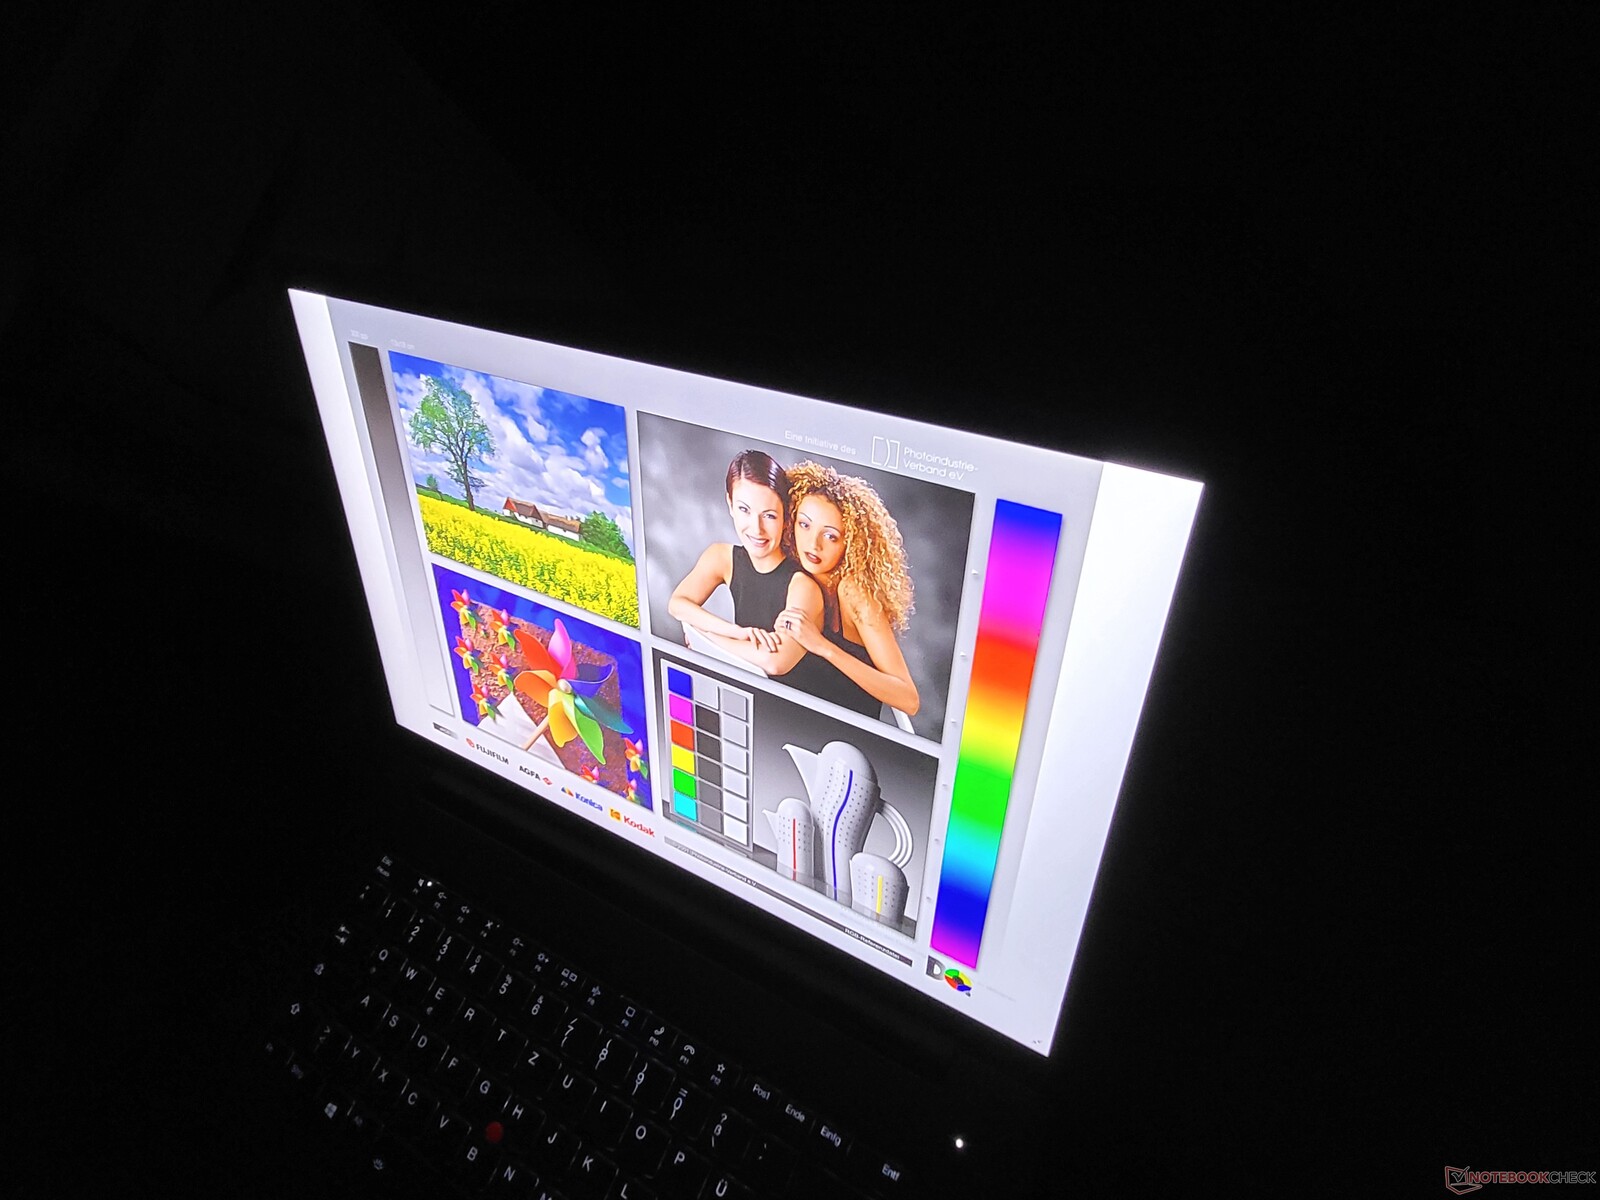
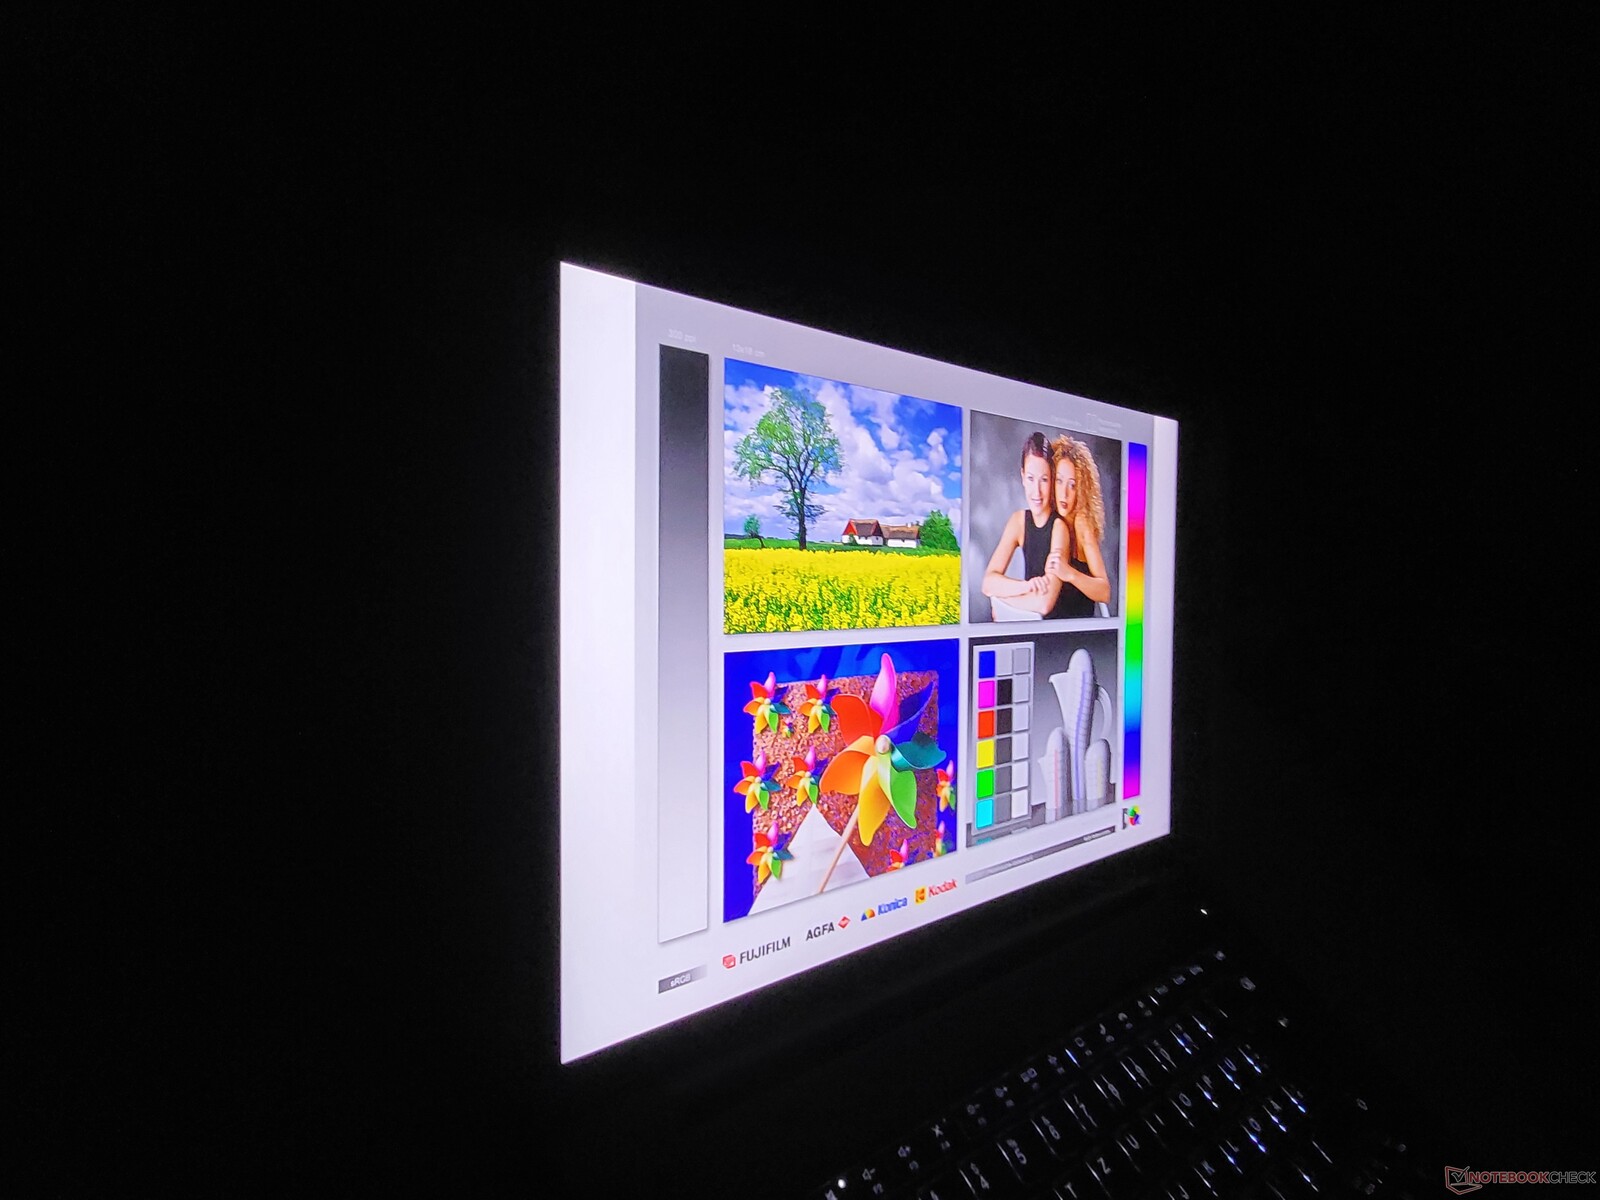
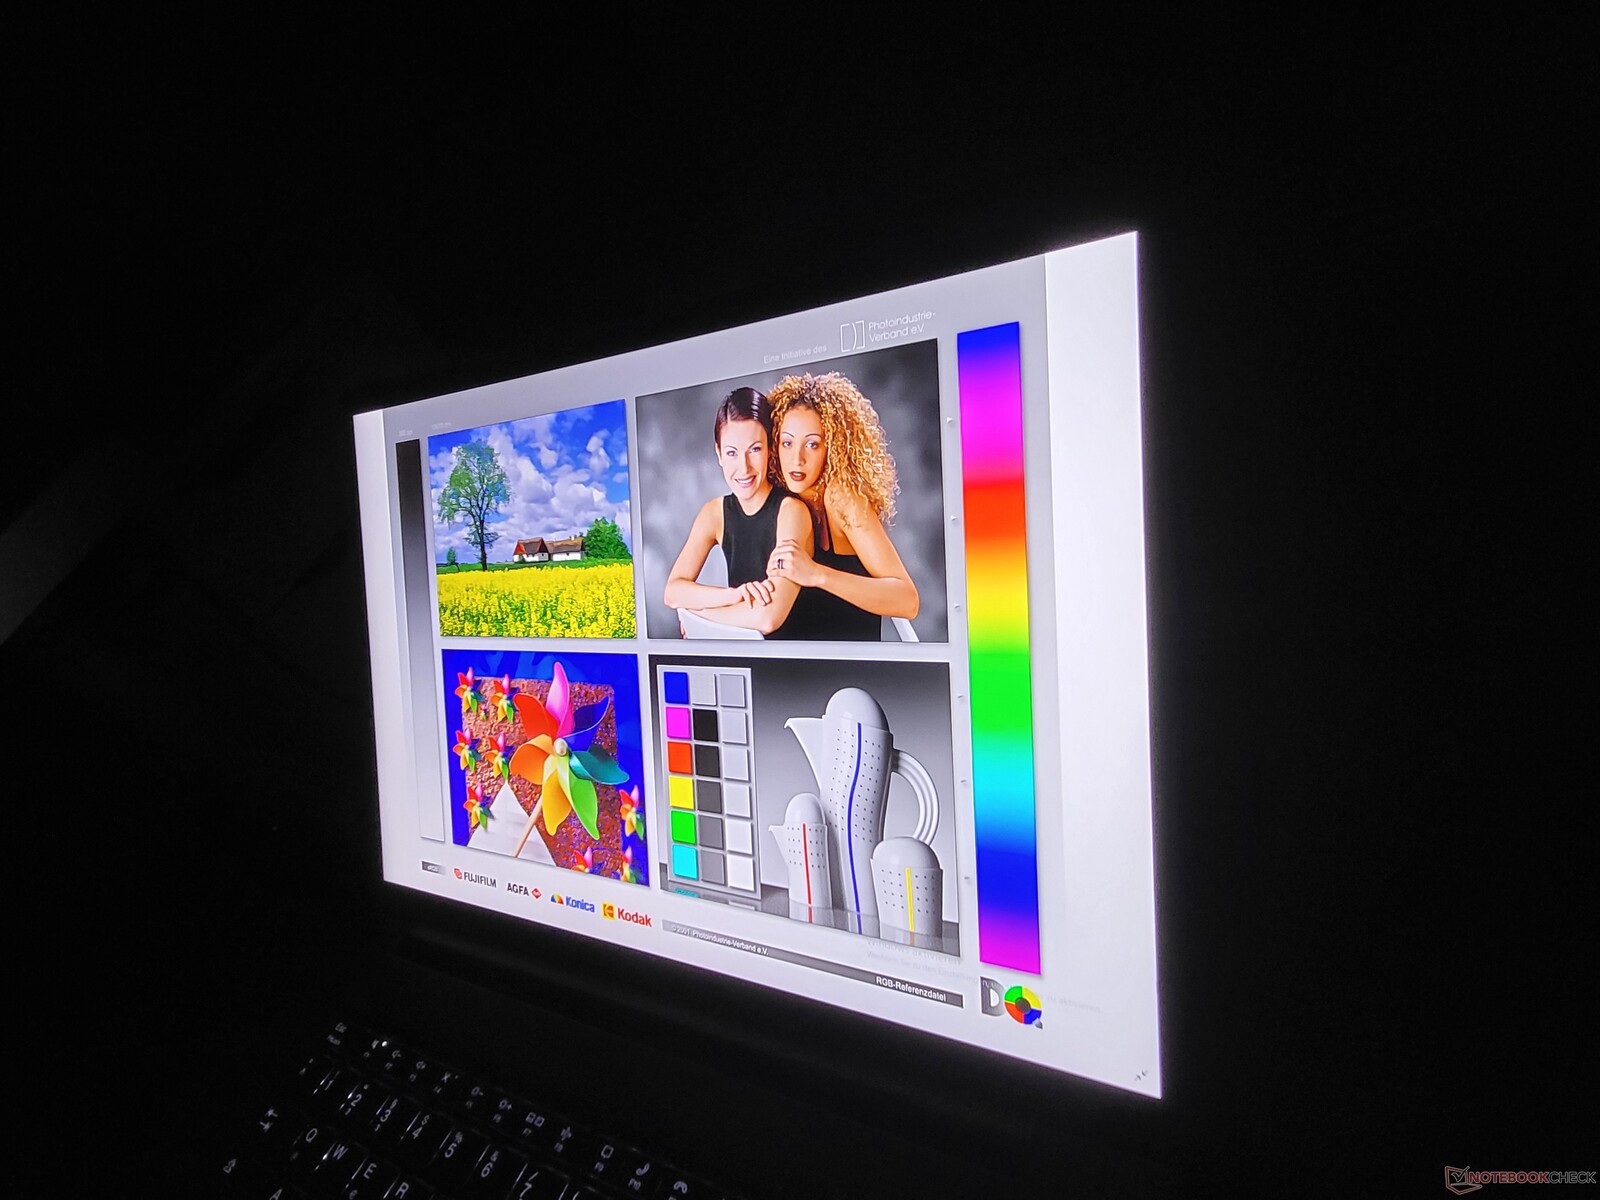
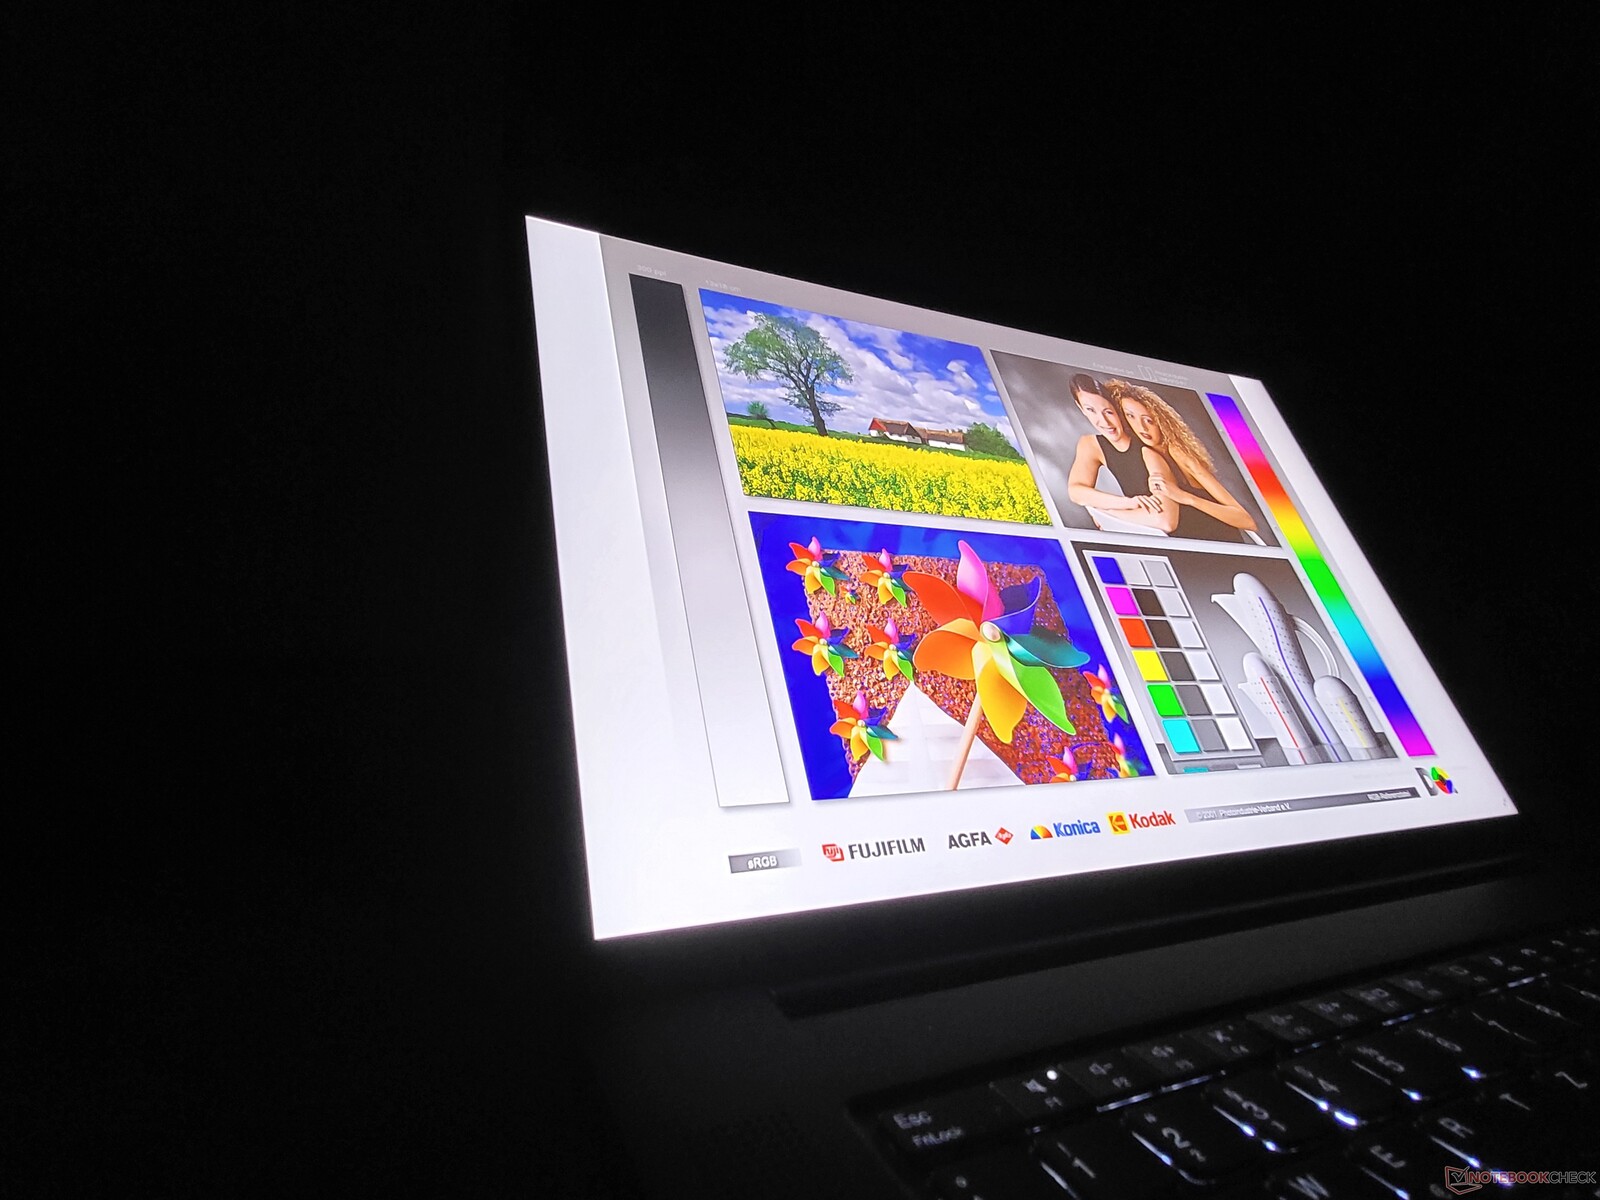
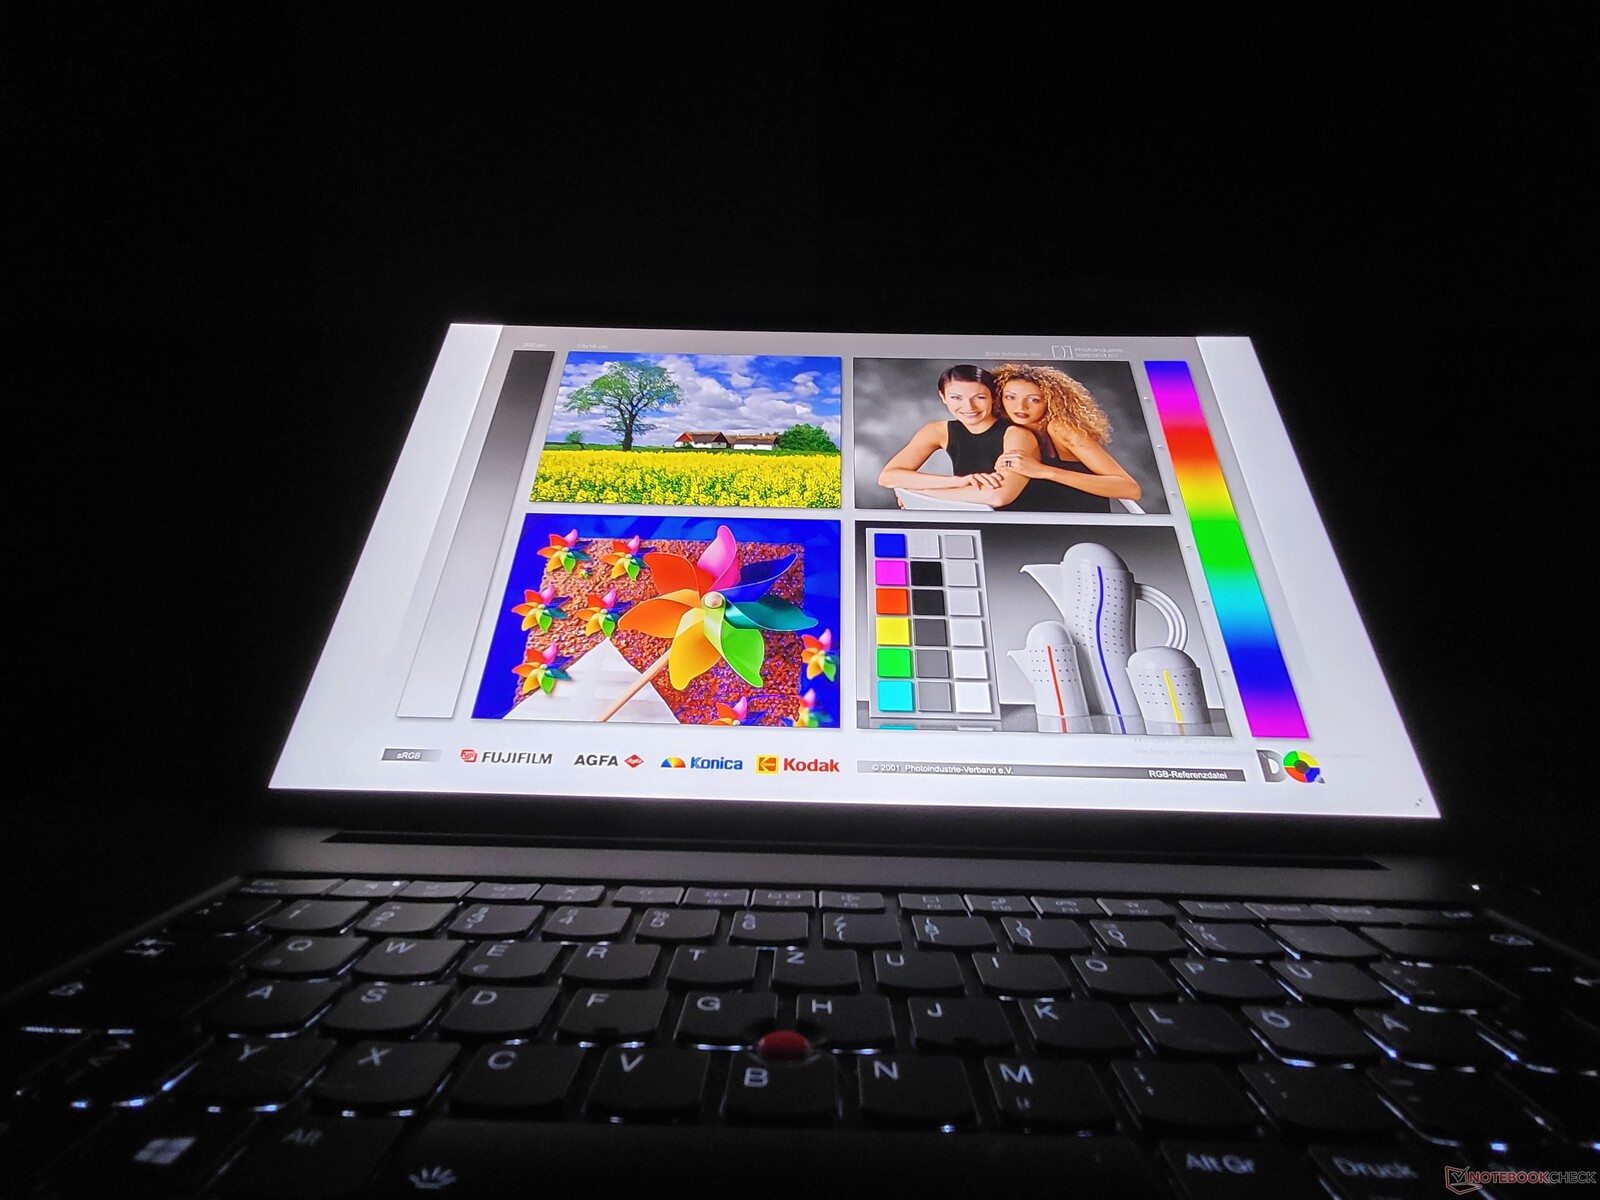
La calidad de la tecnología IPS se refleja en su excelente estabilidad de ángulos de visión, que también es impecable en el ThinkPad P1 2021 de Lenovo.
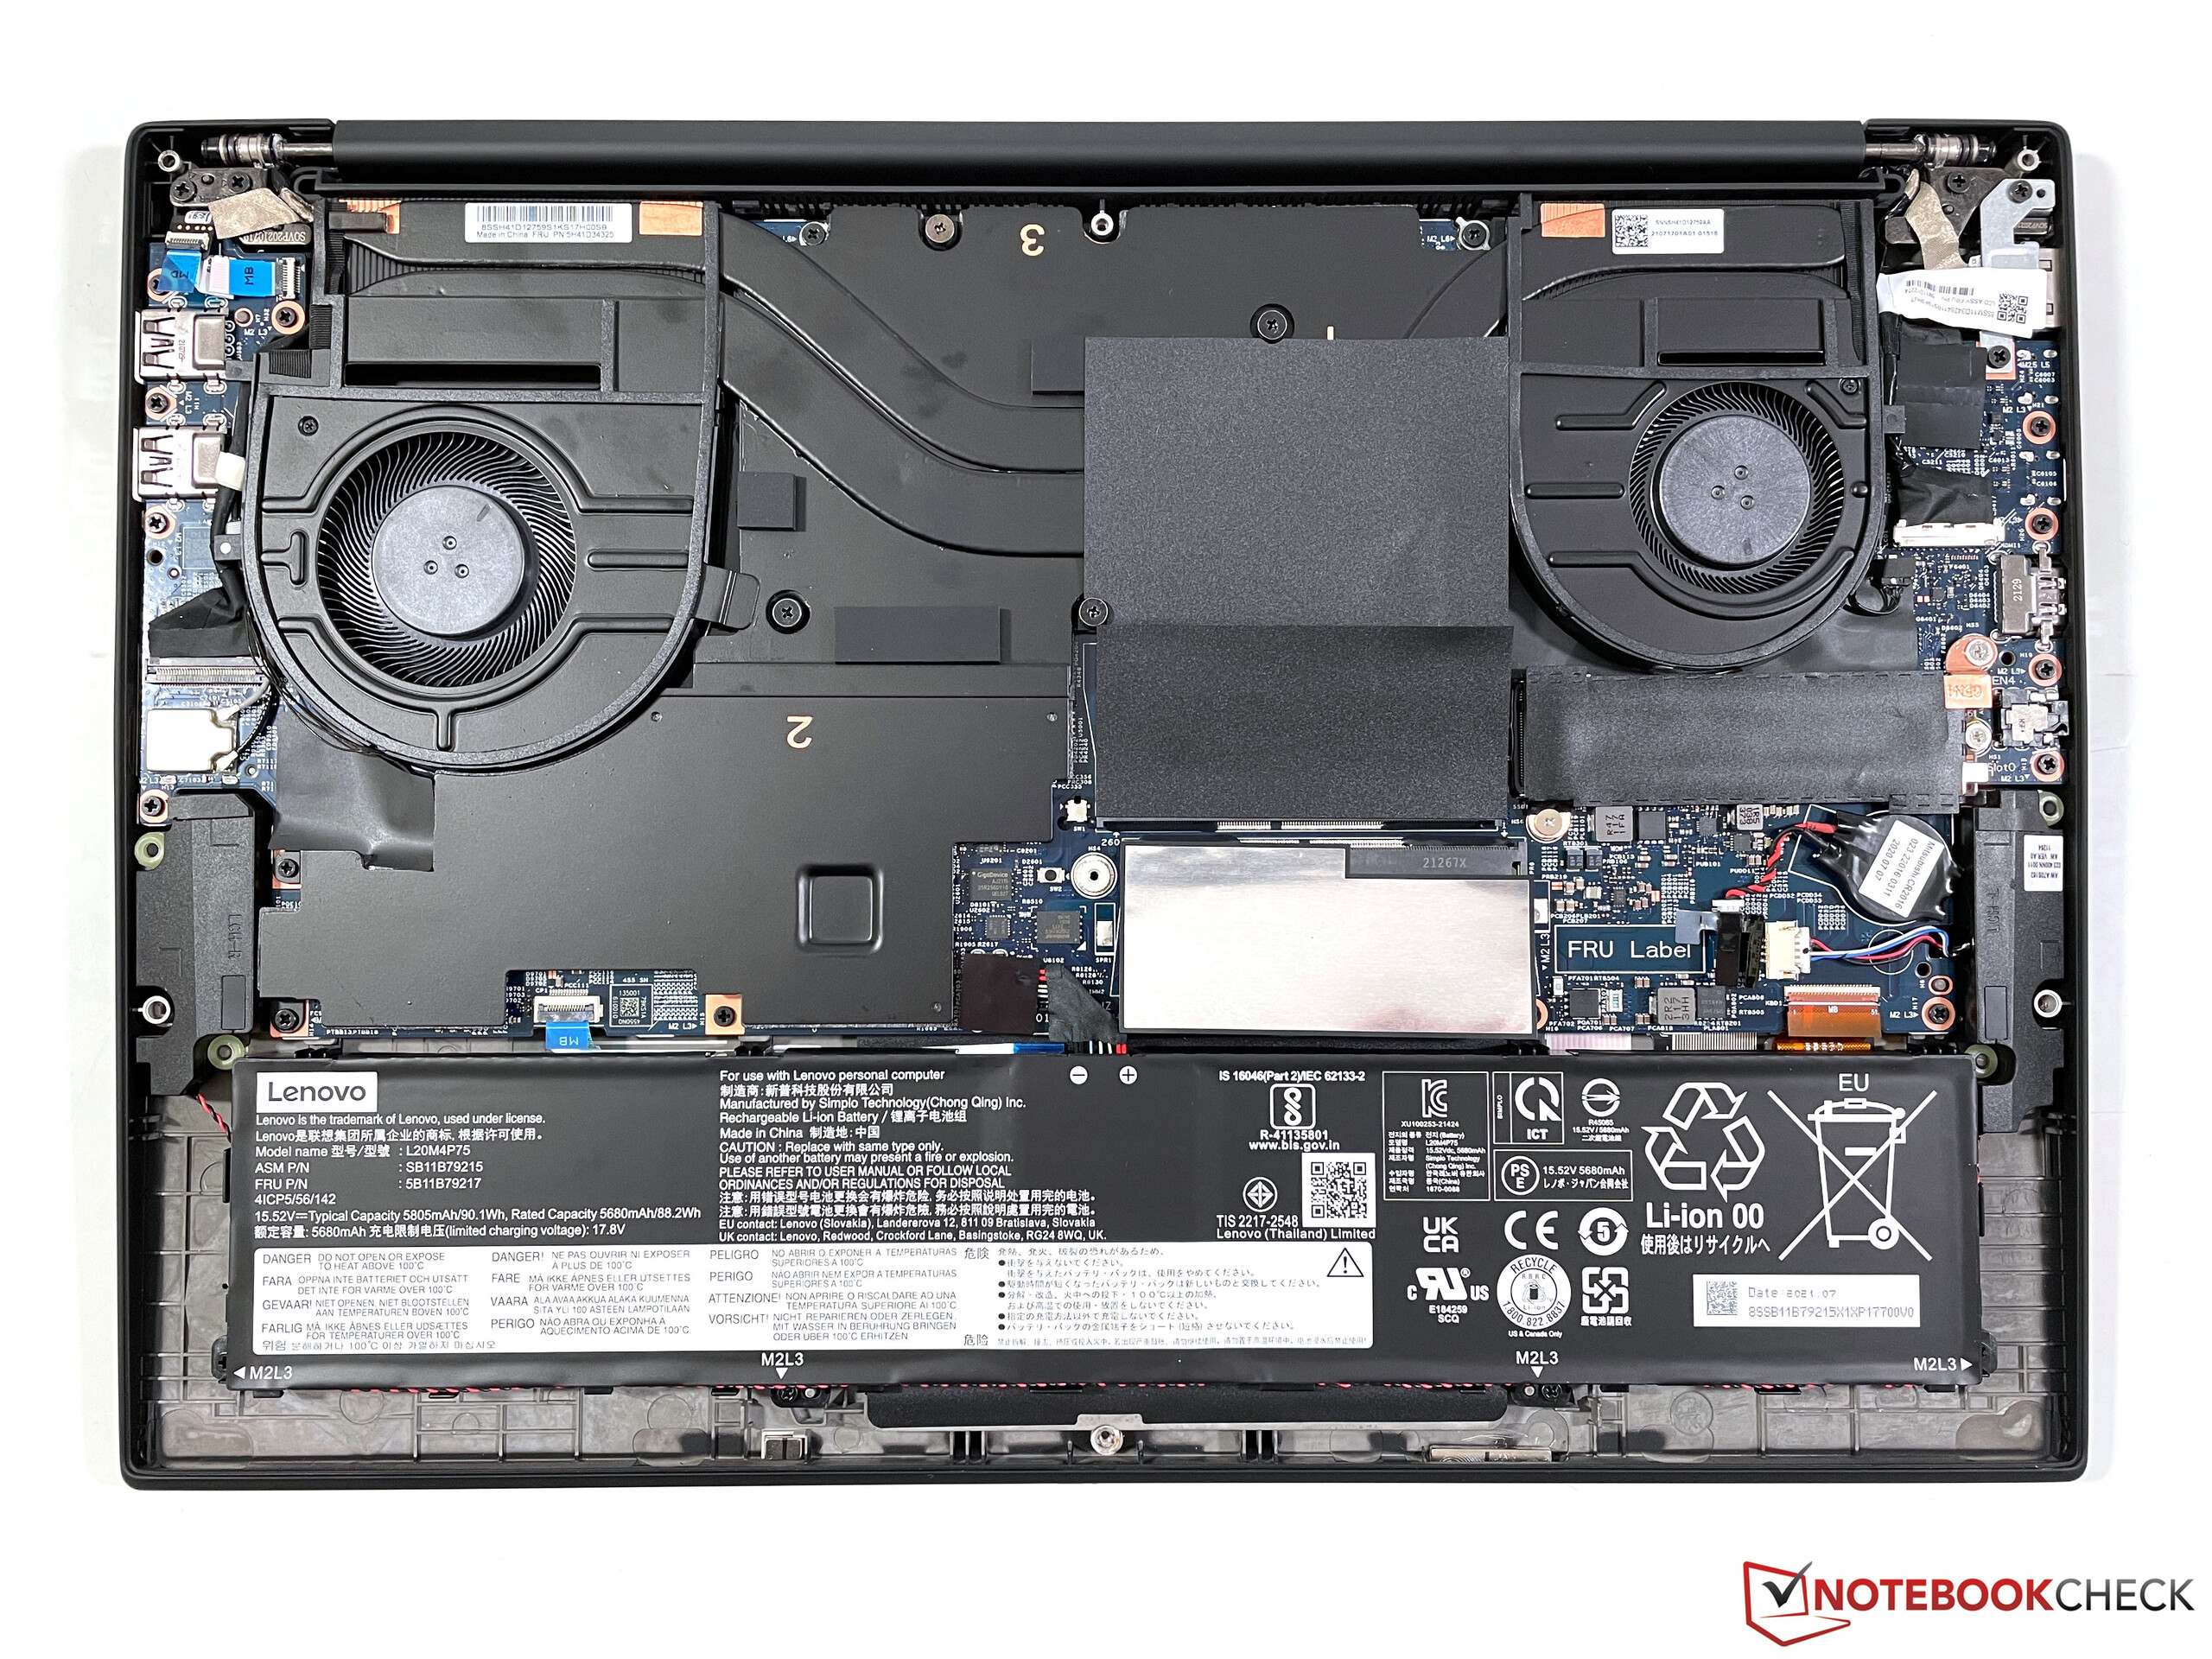
El rendimiento de las estaciones de trabajo Lenovo mejora significativamente con VaporChamber
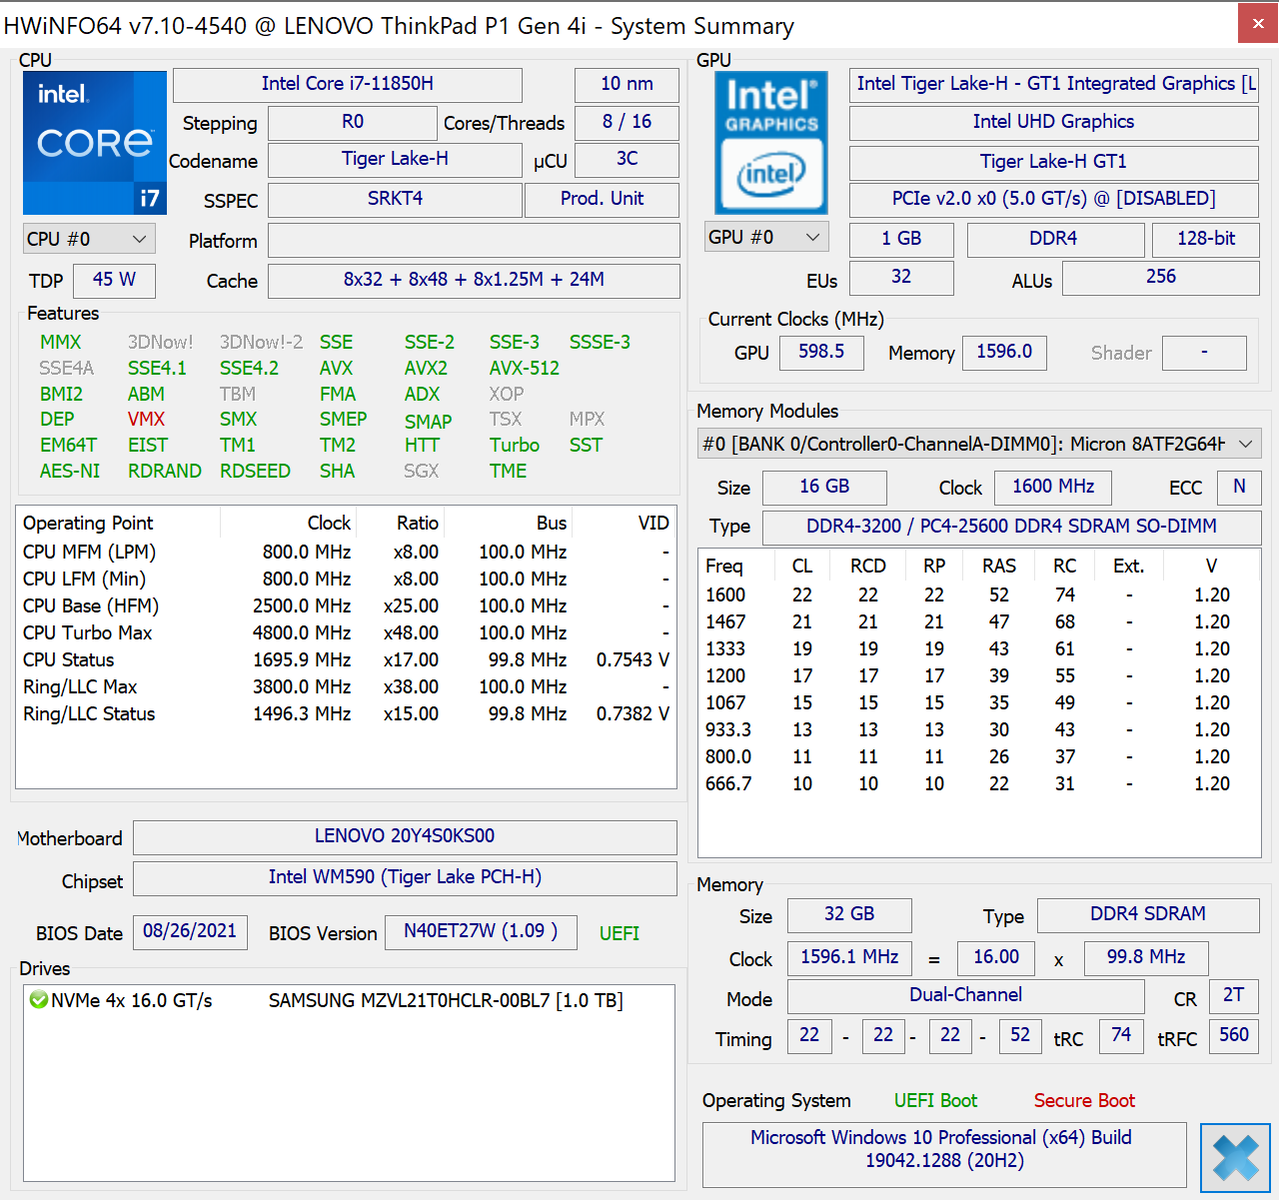
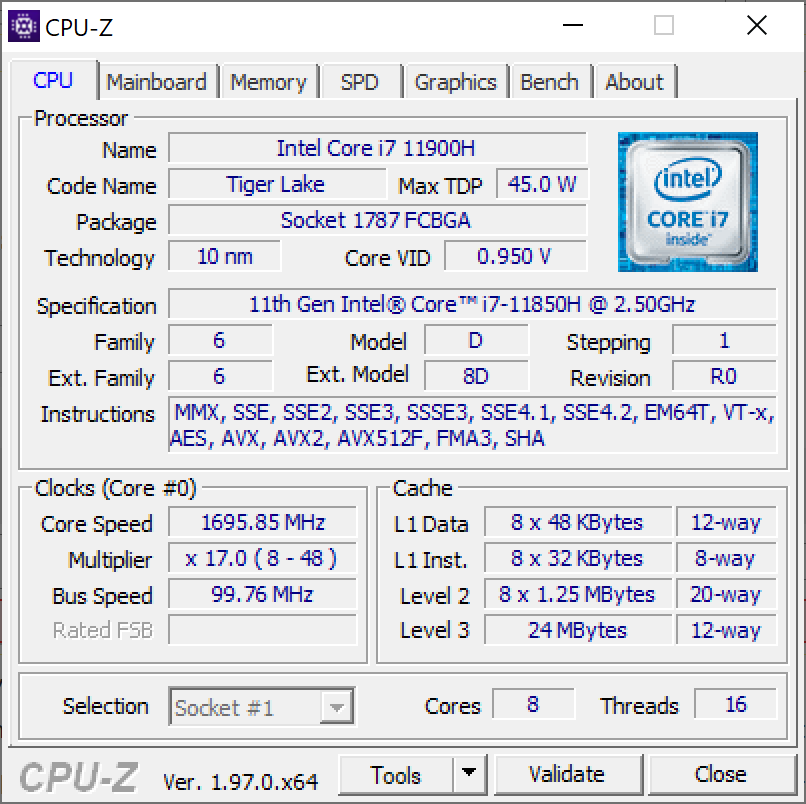
Lenovo confía en los componentes más recientes y potentes que ofrecen actualmente Intel y Nvidia. En el caso de Intel, se trata de procesadores de la serie Tiger-Lake H. Las tres CPUs Core (i7-11800H, i7-11850H, i9-11950H) tienen ocho núcleos, el también ofrecido Xeon W-11855M es de seis núcleos.
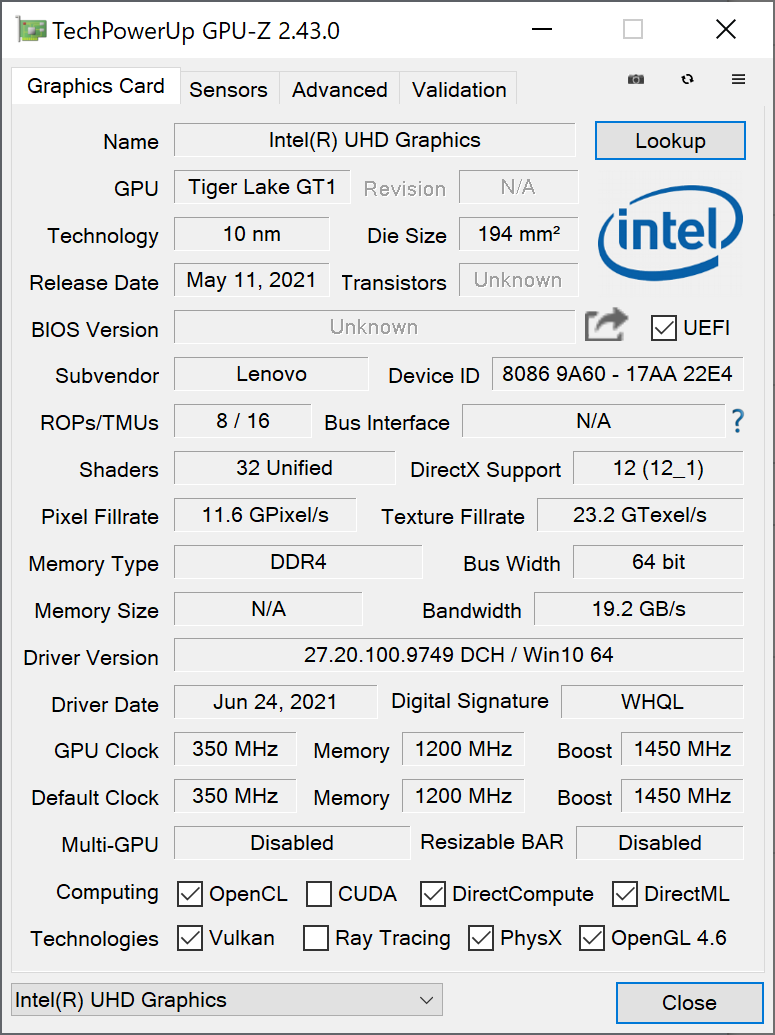
La selección de chips gráficos disponibles es mucho mayor. Como opción básica absoluta, el P1 G4 está disponible sin una GPU dedicada, es decir, sólo con los gráficos integrados de Intel. Hay siete chips gráficos dedicados;Nvidia T1200, RTX A2000, RTX A3000, RTX A4000, RTX 5000 y por primera vez en el P1 GeForce RTX 3070 y RTX 3080.
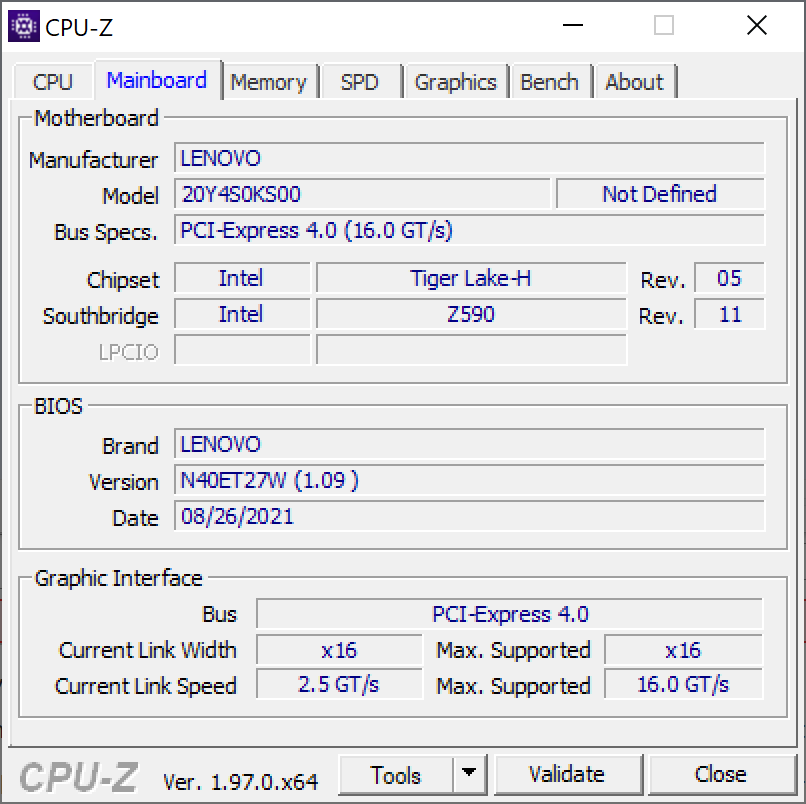
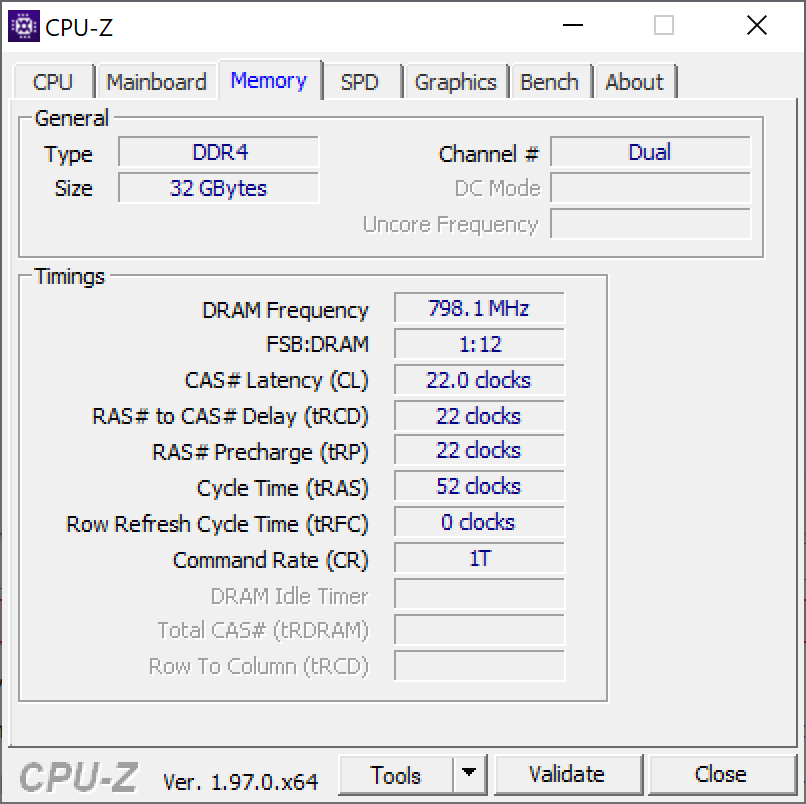
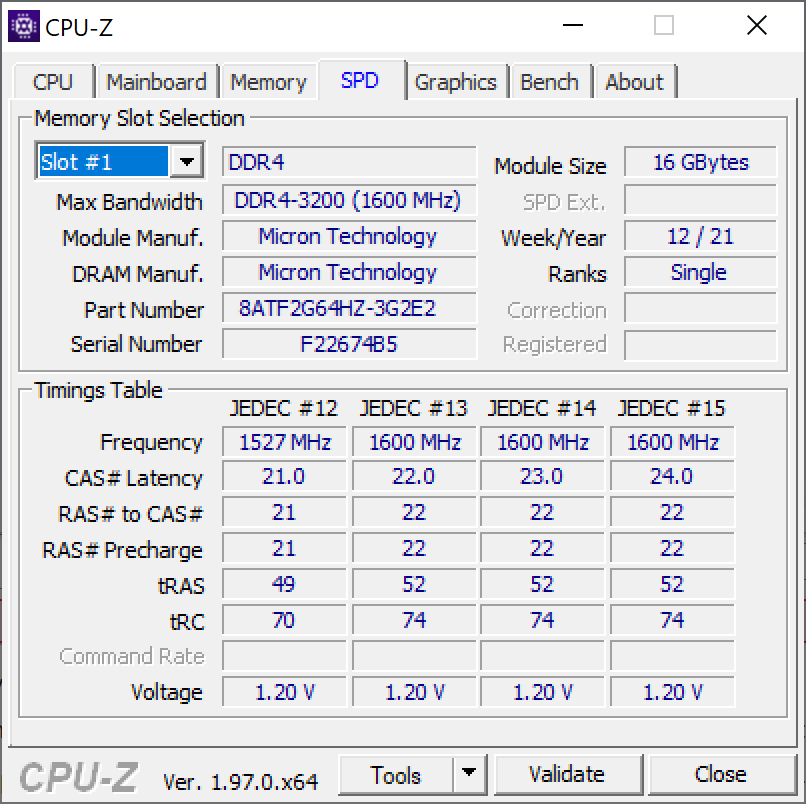
En cualquier caso, el Lenovo ThinkPad P1 Gen 4 tiene dos ranuras SO-DIMM para un máximo de 64 GB de memoria. También puede ser RAM ECC cuando el portátil ThinkPad está configurado con Xeon. Dependiendo de la variante del modelo, el portátil Lenovo tiene uno o dos puertos M.2 2280 - las variantes del modelo con GPU Intel, T1200 o RTX A2000 tienen dos, todos los demás sólo una ranura de almacenamiento masivo
Procesador
El Intel Core i7-11850H es un procesador actual de la serie "Tiger-Lake" con ocho núcleos y 16 hilos. Nominalmente, el TDP de esta CPU es de 45 vatios; sin embargo, este consumo no es suficiente para alcanzar las velocidades de reloj máximas de 4,8 GHz en todos los núcleos. Con nuestra Lista de CPUs el procesador de Intel puede compararse con otras CPUs.
En realidad, el i7-11850H es prácticamente tan rápido como el i7-11800H, la diferencia se debe principalmente al soporte vPro del 11850H - pero en el ThinkPad P1 G4, la diferencia entre ambos es grande. La razón no es el procesador, sino el sistema de refrigeración: El modelo con GeForce RTX 3070 probado aquí contiene refrigeración por cámara de vapor. Por tanto, el procesador puede consumir permanentemente unos 60 vatios bajo carga pura de CPU, mientras que la CPU del modelo menos equipado ThinkPad P1 Gen 4 con Nvidia T1200 estaba limitada a unos 40 vatios. En la prueba multi-núcleo Cinebench R23, el Vapor-Chamber P1 es un 27% más rápido que el modelo más barato, está más o menos a la par con el HP ZBook Studio 15 G8.
No pudimos determinar una limitación de rendimiento de la CPU en modo batería
Cinebench R15 Multi Endurance test
Cinebench R23: Multi Core | Single Core
Cinebench R20: CPU (Multi Core) | CPU (Single Core)
Cinebench R15: CPU Multi 64Bit | CPU Single 64Bit
Blender: v2.79 BMW27 CPU
7-Zip 18.03: 7z b 4 | 7z b 4 -mmt1
Geekbench 5.5: Multi-Core | Single-Core
HWBOT x265 Benchmark v2.2: 4k Preset
LibreOffice : 20 Documents To PDF
R Benchmark 2.5: Overall mean
| CPU Performance rating | |
| Media de la clase Workstation | |
| Lenovo ThinkPad P1 G4-20Y4S0KS00 | |
| HP ZBook Studio 15 G8 | |
| Medio Intel Core i7-11850H | |
| Huawei MateBook 16 R7 5800H | |
| Apple MacBook Pro 13 Late 2020 M1 Entry (8 / 256 GB) -6! | |
| Dell Precision 5000 5560 -2! | |
| Lenovo ThinkPad P1 G4-20Y30017GE | |
| Apple MacBook Pro 16 2019 i9 5500M | |
| Lenovo ThinkPad X1 Extreme Gen3-20TLS0UV00 | |
| Cinebench R23 / Multi Core | |
| Media de la clase Workstation (14621 - 38520, n=23, últimos 2 años) | |
| HP ZBook Studio 15 G8 | |
| Lenovo ThinkPad P1 G4-20Y4S0KS00 | |
| Medio Intel Core i7-11850H (9779 - 11935, n=2) | |
| Huawei MateBook 16 R7 5800H | |
| Dell Precision 5000 5560 | |
| Lenovo ThinkPad P1 G4-20Y30017GE | |
| Apple MacBook Pro 16 2019 i9 5500M | |
| Apple MacBook Pro 16 2019 i9 5500M | |
| Apple MacBook Pro 13 Late 2020 M1 Entry (8 / 256 GB) | |
| Lenovo ThinkPad X1 Extreme Gen3-20TLS0UV00 | |
| Cinebench R23 / Single Core | |
| Media de la clase Workstation (1712 - 2228, n=23, últimos 2 años) | |
| HP ZBook Studio 15 G8 | |
| Lenovo ThinkPad P1 G4-20Y4S0KS00 | |
| Medio Intel Core i7-11850H (1513 - 1552, n=2) | |
| Apple MacBook Pro 13 Late 2020 M1 Entry (8 / 256 GB) | |
| Dell Precision 5000 5560 | |
| Lenovo ThinkPad P1 G4-20Y30017GE | |
| Huawei MateBook 16 R7 5800H | |
| Lenovo ThinkPad X1 Extreme Gen3-20TLS0UV00 | |
| Apple MacBook Pro 16 2019 i9 5500M | |
| Cinebench R20 / CPU (Multi Core) | |
| Media de la clase Workstation (5760 - 15043, n=23, últimos 2 años) | |
| Lenovo ThinkPad P1 G4-20Y4S0KS00 | |
| HP ZBook Studio 15 G8 | |
| Medio Intel Core i7-11850H (3826 - 4663, n=2) | |
| Huawei MateBook 16 R7 5800H | |
| Dell Precision 5000 5560 | |
| Lenovo ThinkPad P1 G4-20Y30017GE | |
| Apple MacBook Pro 16 2019 i9 5500M | |
| Apple MacBook Pro 16 2019 i9 5500M | |
| Lenovo ThinkPad X1 Extreme Gen3-20TLS0UV00 | |
| Apple MacBook Pro 13 Late 2020 M1 Entry (8 / 256 GB) | |
| Cinebench R20 / CPU (Single Core) | |
| Media de la clase Workstation (671 - 857, n=23, últimos 2 años) | |
| HP ZBook Studio 15 G8 | |
| Lenovo ThinkPad P1 G4-20Y4S0KS00 | |
| Medio Intel Core i7-11850H (583 - 607, n=2) | |
| Dell Precision 5000 5560 | |
| Lenovo ThinkPad P1 G4-20Y30017GE | |
| Huawei MateBook 16 R7 5800H | |
| Lenovo ThinkPad X1 Extreme Gen3-20TLS0UV00 | |
| Apple MacBook Pro 16 2019 i9 5500M | |
| Apple MacBook Pro 16 2019 i9 5500M | |
| Apple MacBook Pro 13 Late 2020 M1 Entry (8 / 256 GB) | |
| Cinebench R15 / CPU Multi 64Bit | |
| Media de la clase Workstation (2489 - 5810, n=23, últimos 2 años) | |
| Huawei MateBook 16 R7 5800H | |
| Lenovo ThinkPad P1 G4-20Y4S0KS00 | |
| HP ZBook Studio 15 G8 | |
| Medio Intel Core i7-11850H (1547 - 1988, n=2) | |
| Lenovo ThinkPad P1 G4-20Y30017GE | |
| Dell Precision 5000 5560 | |
| Apple MacBook Pro 16 2019 i9 5500M | |
| Apple MacBook Pro 16 2019 i9 5500M | |
| Lenovo ThinkPad X1 Extreme Gen3-20TLS0UV00 | |
| Apple MacBook Pro 13 Late 2020 M1 Entry (8 / 256 GB) | |
| Cinebench R15 / CPU Single 64Bit | |
| Media de la clase Workstation (191.4 - 328, n=23, últimos 2 años) | |
| HP ZBook Studio 15 G8 | |
| Lenovo ThinkPad P1 G4-20Y4S0KS00 | |
| Medio Intel Core i7-11850H (232 - 233, n=2) | |
| Huawei MateBook 16 R7 5800H | |
| Dell Precision 5000 5560 | |
| Lenovo ThinkPad P1 G4-20Y30017GE | |
| Apple MacBook Pro 13 Late 2020 M1 Entry (8 / 256 GB) | |
| Lenovo ThinkPad X1 Extreme Gen3-20TLS0UV00 | |
| Apple MacBook Pro 16 2019 i9 5500M | |
| Apple MacBook Pro 16 2019 i9 5500M | |
| Blender / v2.79 BMW27 CPU | |
| Lenovo ThinkPad X1 Extreme Gen3-20TLS0UV00 | |
| Apple MacBook Pro 16 2019 i9 5500M | |
| Lenovo ThinkPad P1 G4-20Y30017GE | |
| Dell Precision 5000 5560 | |
| Medio Intel Core i7-11850H (257 - 313, n=2) | |
| Lenovo ThinkPad P1 G4-20Y4S0KS00 | |
| HP ZBook Studio 15 G8 | |
| Huawei MateBook 16 R7 5800H | |
| Media de la clase Workstation (91 - 222, n=23, últimos 2 años) | |
| 7-Zip 18.03 / 7z b 4 | |
| Media de la clase Workstation (60489 - 116969, n=23, últimos 2 años) | |
| Huawei MateBook 16 R7 5800H | |
| Lenovo ThinkPad P1 G4-20Y4S0KS00 | |
| HP ZBook Studio 15 G8 | |
| Medio Intel Core i7-11850H (44890 - 50552, n=2) | |
| Dell Precision 5000 5560 | |
| Apple MacBook Pro 16 2019 i9 5500M | |
| Lenovo ThinkPad P1 G4-20Y30017GE | |
| Lenovo ThinkPad X1 Extreme Gen3-20TLS0UV00 | |
| 7-Zip 18.03 / 7z b 4 -mmt1 | |
| Media de la clase Workstation (5126 - 6960, n=23, últimos 2 años) | |
| HP ZBook Studio 15 G8 | |
| Lenovo ThinkPad P1 G4-20Y4S0KS00 | |
| Medio Intel Core i7-11850H (5727 - 5762, n=2) | |
| Dell Precision 5000 5560 | |
| Huawei MateBook 16 R7 5800H | |
| Lenovo ThinkPad P1 G4-20Y30017GE | |
| Lenovo ThinkPad X1 Extreme Gen3-20TLS0UV00 | |
| Apple MacBook Pro 16 2019 i9 5500M | |
| Geekbench 5.5 / Multi-Core | |
| Media de la clase Workstation (11542 - 25554, n=23, últimos 2 años) | |
| Lenovo ThinkPad P1 G4-20Y4S0KS00 | |
| Medio Intel Core i7-11850H (9049 - 9451, n=2) | |
| Huawei MateBook 16 R7 5800H | |
| Apple MacBook Pro 13 Late 2020 M1 Entry (8 / 256 GB) | |
| HP ZBook Studio 15 G8 | |
| Apple MacBook Pro 16 2019 i9 5500M | |
| Lenovo ThinkPad P1 G4-20Y30017GE | |
| Lenovo ThinkPad X1 Extreme Gen3-20TLS0UV00 | |
| Geekbench 5.5 / Single-Core | |
| Media de la clase Workstation (1783 - 2183, n=23, últimos 2 años) | |
| Apple MacBook Pro 13 Late 2020 M1 Entry (8 / 256 GB) | |
| HP ZBook Studio 15 G8 | |
| Medio Intel Core i7-11850H (1659 - 1686, n=2) | |
| Lenovo ThinkPad P1 G4-20Y4S0KS00 | |
| Lenovo ThinkPad P1 G4-20Y30017GE | |
| Huawei MateBook 16 R7 5800H | |
| Lenovo ThinkPad X1 Extreme Gen3-20TLS0UV00 | |
| Apple MacBook Pro 16 2019 i9 5500M | |
| HWBOT x265 Benchmark v2.2 / 4k Preset | |
| Media de la clase Workstation (17.8 - 40.5, n=23, últimos 2 años) | |
| HP ZBook Studio 15 G8 | |
| Huawei MateBook 16 R7 5800H | |
| Lenovo ThinkPad P1 G4-20Y4S0KS00 | |
| Medio Intel Core i7-11850H (12.6 - 14.4, n=2) | |
| Dell Precision 5000 5560 | |
| Lenovo ThinkPad P1 G4-20Y30017GE | |
| Apple MacBook Pro 16 2019 i9 5500M | |
| Lenovo ThinkPad X1 Extreme Gen3-20TLS0UV00 | |
| LibreOffice / 20 Documents To PDF | |
| Apple MacBook Pro 16 2019 i9 5500M | |
| Apple MacBook Pro 16 2019 i9 5500M | |
| Huawei MateBook 16 R7 5800H | |
| Lenovo ThinkPad X1 Extreme Gen3-20TLS0UV00 | |
| Lenovo ThinkPad P1 G4-20Y30017GE | |
| HP ZBook Studio 15 G8 | |
| Dell Precision 5000 5560 | |
| Media de la clase Workstation (37.1 - 74.7, n=23, últimos 2 años) | |
| Medio Intel Core i7-11850H (45.8 - 48, n=2) | |
| Lenovo ThinkPad P1 G4-20Y4S0KS00 | |
| R Benchmark 2.5 / Overall mean | |
| Apple MacBook Pro 16 2019 i9 5500M | |
| Apple MacBook Pro 16 2019 i9 5500M | |
| Lenovo ThinkPad X1 Extreme Gen3-20TLS0UV00 | |
| Lenovo ThinkPad P1 G4-20Y30017GE | |
| HP ZBook Studio 15 G8 | |
| Dell Precision 5000 5560 | |
| Medio Intel Core i7-11850H (0.541 - 0.543, n=2) | |
| Lenovo ThinkPad P1 G4-20Y4S0KS00 | |
| Huawei MateBook 16 R7 5800H | |
| Media de la clase Workstation (0.3825 - 0.603, n=23, últimos 2 años) | |
* ... más pequeño es mejor
Rendimiento del sistema
El Lenovo ThinkPad P1 G4 es muy rápido en el uso diario. En PCMark10, está en general en la primera posición en el campo de la comparación, lo que también habla del muy buen rendimiento del sistema.
Por muy bueno que sea el rendimiento: Tuvimos que reiniciar el portátil ThinkPad muy a menudo. La razón fueron los errores gráficos que a veces ocurrían tras el modo de espera; toda la imagen se cubría entonces con rayas blancas y negras. Dado que este error no ocurrió en el primer modelo de prueba, suponemos que es un problema singular de este dispositivo de prueba
| PCMark 10 / Score | |
| Media de la clase Workstation (6563 - 10409, n=19, últimos 2 años) | |
| Lenovo ThinkPad P1 G4-20Y4S0KS00 | |
| Medio Intel Core i7-11850H, NVIDIA GeForce RTX 3070 Laptop GPU (n=1) | |
| HP ZBook Studio 15 G8 | |
| Dell Precision 5000 5560 | |
| Lenovo ThinkPad P1 G4-20Y30017GE | |
| Apple MacBook Pro 16 2019 i9 5500M | |
| Lenovo ThinkPad X1 Extreme Gen3-20TLS0UV00 | |
| PCMark 10 / Essentials | |
| Lenovo ThinkPad P1 G4-20Y4S0KS00 | |
| Medio Intel Core i7-11850H, NVIDIA GeForce RTX 3070 Laptop GPU (n=1) | |
| Dell Precision 5000 5560 | |
| Media de la clase Workstation (9622 - 11157, n=19, últimos 2 años) | |
| HP ZBook Studio 15 G8 | |
| Lenovo ThinkPad P1 G4-20Y30017GE | |
| Lenovo ThinkPad X1 Extreme Gen3-20TLS0UV00 | |
| PCMark 10 / Productivity | |
| Media de la clase Workstation (8789 - 20616, n=19, últimos 2 años) | |
| Dell Precision 5000 5560 | |
| Lenovo ThinkPad P1 G4-20Y4S0KS00 | |
| Medio Intel Core i7-11850H, NVIDIA GeForce RTX 3070 Laptop GPU (n=1) | |
| HP ZBook Studio 15 G8 | |
| Lenovo ThinkPad P1 G4-20Y30017GE | |
| Lenovo ThinkPad X1 Extreme Gen3-20TLS0UV00 | |
| PCMark 10 / Digital Content Creation | |
| Media de la clase Workstation (8108 - 15631, n=19, últimos 2 años) | |
| Lenovo ThinkPad P1 G4-20Y4S0KS00 | |
| Medio Intel Core i7-11850H, NVIDIA GeForce RTX 3070 Laptop GPU (n=1) | |
| HP ZBook Studio 15 G8 | |
| Dell Precision 5000 5560 | |
| Lenovo ThinkPad P1 G4-20Y30017GE | |
| Lenovo ThinkPad X1 Extreme Gen3-20TLS0UV00 | |
| PCMark 10 Score | 7156 puntos | |
ayuda | ||
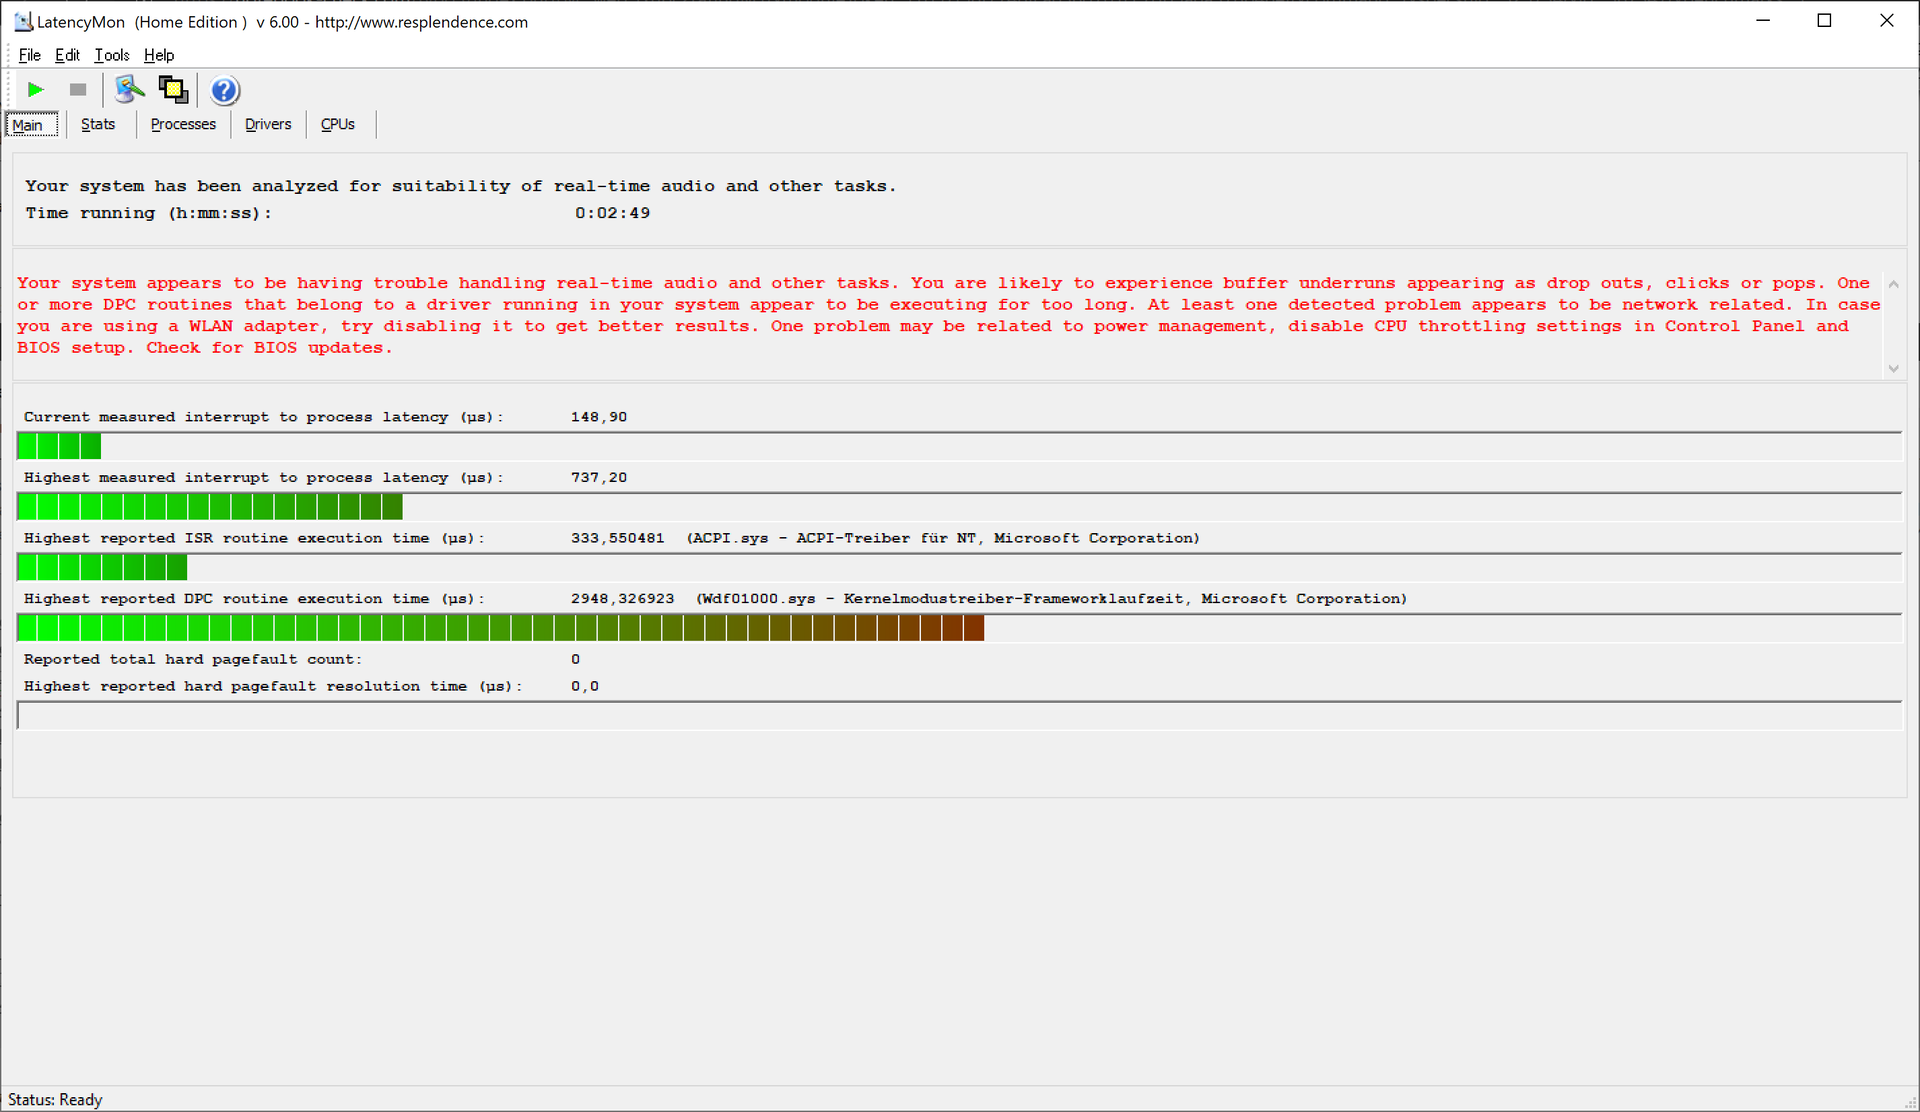
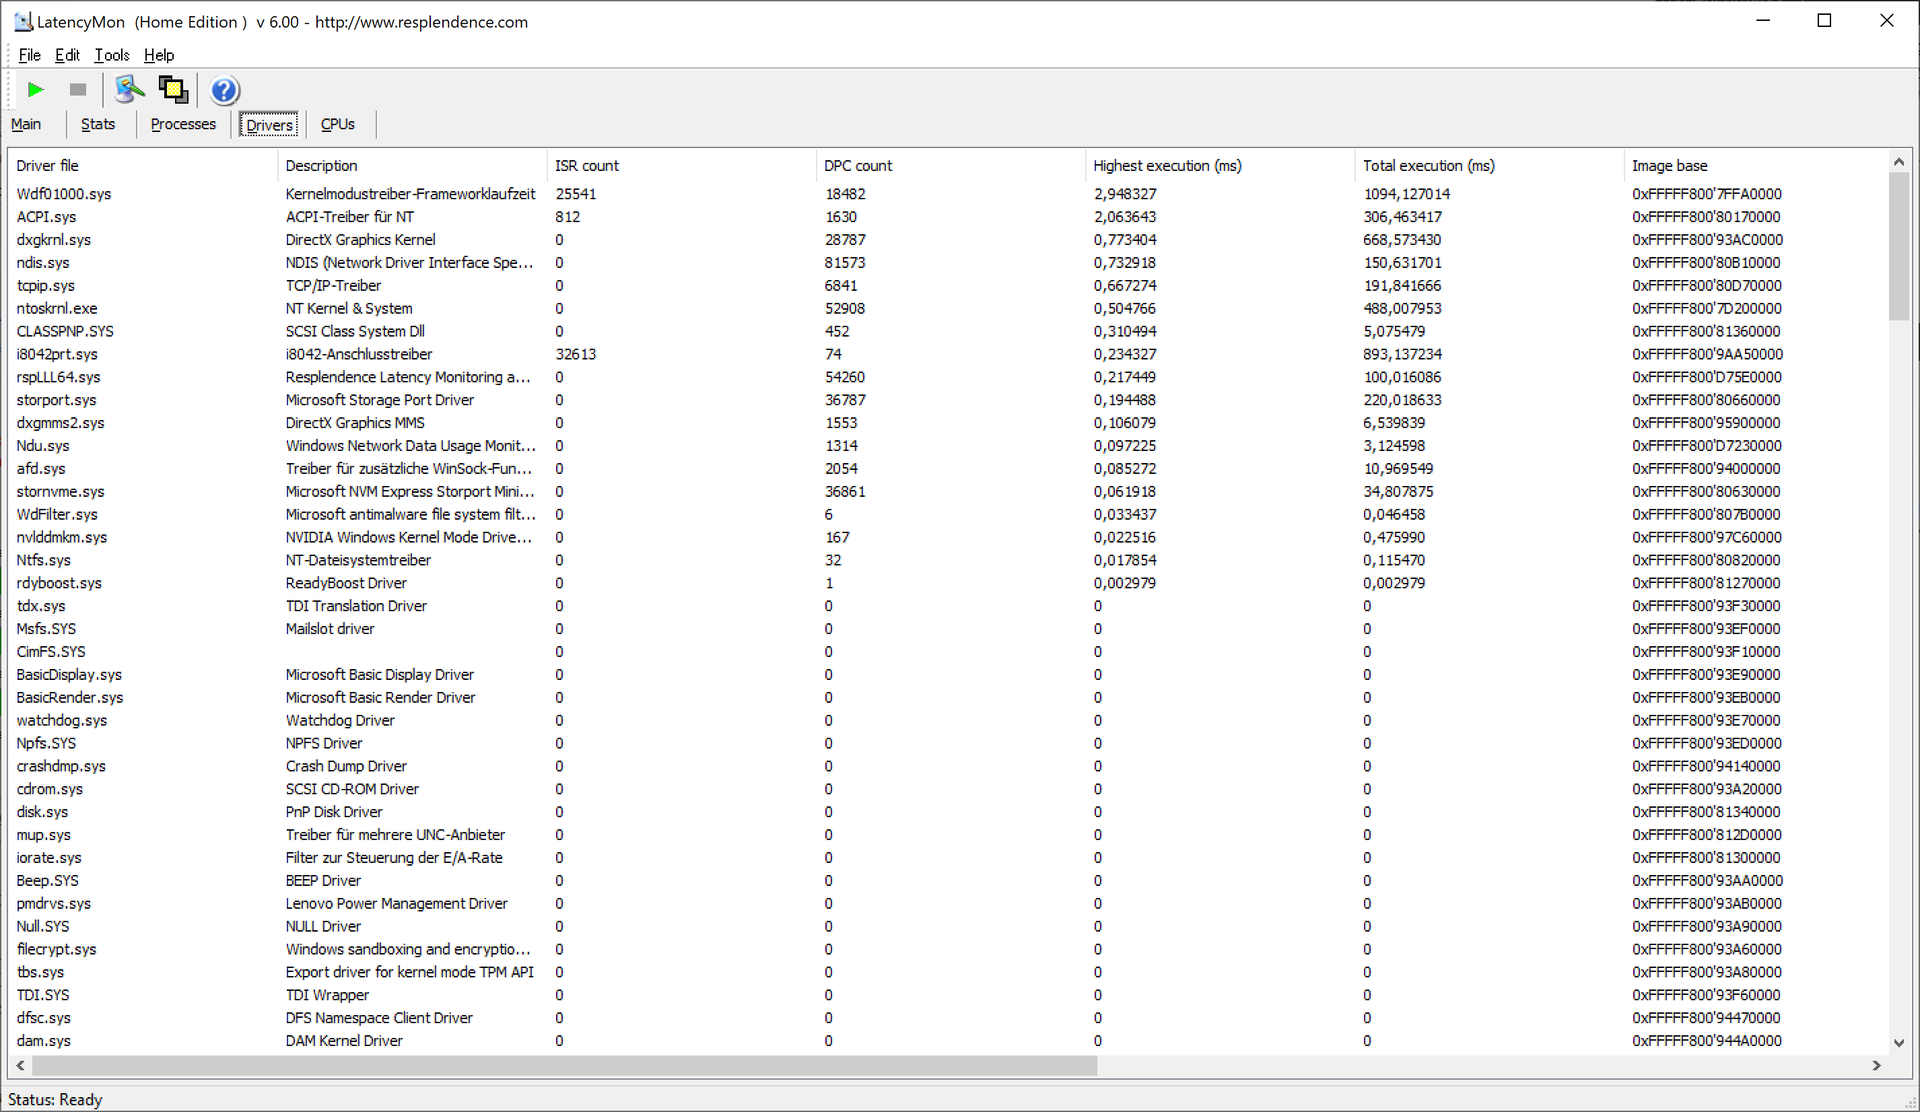
Latencias del CPD
Trabajar con archivos de audio y vídeo es uno de los posibles usos de un portátil como el ThinkPad P1 Gen 4. Aquí, las latencias del CPD podrían causar problemas, ya que las altas tasas también provocaron caídas en nuestra prueba de vídeo de YouTube
| DPC Latencies / LatencyMon - interrupt to process latency (max), Web, Youtube, Prime95 | |
| Lenovo ThinkPad P1 G4-20Y30017GE | |
| HP ZBook Studio 15 G8 | |
| Dell Precision 5000 5560 | |
| Lenovo ThinkPad P1 G4-20Y4S0KS00 | |
| Lenovo ThinkPad X1 Extreme Gen3-20TLS0UV00 | |
* ... más pequeño es mejor
Almacenamiento masivo
En esta configuración, el Lenovo ThinkPad P1 G4 sólo tiene una ranura M.2-2280. Al menos ésta está muy bien equipada con un Samsung PM9A1 de 1 TB. Este SSD NMVe PCIe 4.0 rinde extremadamente bien en nuestras pruebas
* ... más pequeño es mejor

Continuous load read: DiskSpd Read Loop, Queue Depth 8
Rendimiento de la GPU
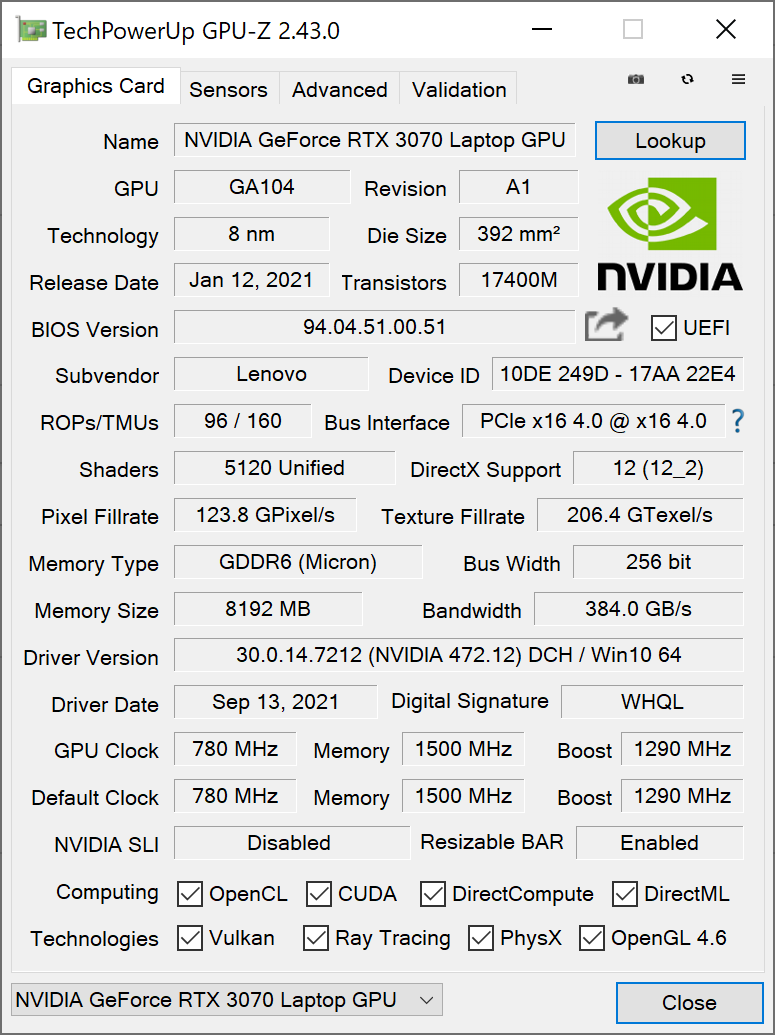
La página web Nvidia GeForce RTX 3070 es una de las GPUs móviles más potentes de la actual generación "Ampere" de Nvidia. En el caso del ThinkPad P1 G4 de Lenovo, sin embargo, las unidades de sombreado 5120 están lejos de su máximo rendimiento porque Lenovo ajusta la GPU a un TGP de 80 vatios - en el pasado, esta variante se habría llamado "Max-Q".
Así, no es de extrañar que la RTX 3070 sea un 10% más rápida de media en todos los portátiles que aquí en el Lenovo ThinkPad P1 2021. No obstante, la diferencia con el ThinkPad X1 Extreme G3 con GeForce GTX 1650 Ti Max-Q es enorme (+148%), incluso comparado con la variante Nvidia T1200 del P1, la GeForce RTX 3070 es más del doble de rápida en las pruebas 3DMark (+118%). En este caso, el GeForce merece sin duda la pena. La conclusión para el conjunto de pruebas profesionales SPECviewperf es más mixta: Aquí, el GeForce-P1 logra resultados en parte buenos, pero también en parte pobres. Un ThinkPad P1 con una GPU Nvidia certificada por ISV debería ser elegido para CAD.
El rendimiento de la GPU está claramente limitado en modo batería. El resultado de 3DMark 11 es aproximadamente un 56% más bajo sin una fuente de alimentación (13,508 puntos en la puntuación de la GPU de 3DMark 11)
| 3DMark 11 Performance | 24753 puntos | |
| 3DMark Fire Strike Score | 17860 puntos | |
| 3DMark Time Spy Score | 8430 puntos | |
ayuda | ||
Rendimiento de los juegos
El Lenovo ThinkPad P1 G4 no es explícitamente un portátil para juegos. Al mismo tiempo, la Nvidia GeForce 3070 permite usar el portátil Lenovo para jugar. Incluso para jugar en 4K, la GPU puede ser suficientemente rápida, dependiendo del título. En nuestra Witcher 3 prueba, el ThinkPad P1 2021 también puede llamar su rendimiento de forma consistente - con pequeñas fluctuaciones
| The Witcher 3 - 1920x1080 Ultra Graphics & Postprocessing (HBAO+) | |
| Medio NVIDIA GeForce RTX 3070 Laptop GPU (34.9 - 109, n=52) | |
| Media de la clase Workstation (n=1últimos 2 años) | |
| Lenovo ThinkPad P1 G4-20Y4S0KS00 | |
| HP ZBook Studio 15 G8 | |
| Dell Precision 5000 5560 | |
| Apple MacBook Pro 16 2019 i9 5500M | |
| Lenovo ThinkPad P1 G4-20Y30017GE | |
| Lenovo ThinkPad X1 Extreme Gen3-20TLS0UV00 | |
Witcher 3 FPS-Diagram
| bajo | medio | alto | ultra | QHD | 4K | |
|---|---|---|---|---|---|---|
| GTA V (2015) | 185 | 179 | 164 | 88.1 | 74.5 | 74.3 |
| The Witcher 3 (2015) | 345 | 243 | 158 | 86.8 | 56.5 | |
| Dota 2 Reborn (2015) | 171 | 148 | 124 | 106 | 109 | |
| X-Plane 11.11 (2018) | 105 | 102 | 76.8 | 52.4 | ||
| Strange Brigade (2018) | 408 | 206 | 171 | 151 | 113 | 61.1 |
Emisiones: Los fuertes componentes hacen que el ThinkPad P1 G4 se caliente
Ruido del ventilador
Lenovo tradicionalmente ejerce moderación cuando se trata del volumen del ventilador de los ThinkPads. Sin embargo, esto no se aplica al modelo de estación de trabajo ThinkPad P1. Los dos ventiladores funcionan a un máximo de 47.4 dB(a), que es claramente audible. Al menos no es siempre el caso, también hay un nivel más bajo con 38.6 dB(a) y la refrigeración activa a menudo permanece desactivada en inactivo.
El silbido de la bobina sigue siendo, por desgracia, un problema demasiado frecuente, pero el Lenovo ThinkPad P1 Gen 4 no se ve afectado por ello
| Lenovo ThinkPad P1 G4-20Y4S0KS00 GeForce RTX 3070 Laptop GPU, i7-11850H, Samsung PM9A1 MZVL21T0HCLR | Lenovo ThinkPad P1 G4-20Y30017GE T1200 Laptop GPU, i7-11800H, Samsung PM9A1 MZVL2512HCJQ | Dell Precision 5000 5560 RTX A2000 Laptop GPU, i7-11850H, Samsung PM9A1 MZVL22T0HBLB | Apple MacBook Pro 16 2019 i9 5500M Radeon Pro 5500M, i9-9880H, Apple SSD AP1024 7171 | HP ZBook Studio 15 G8 GeForce RTX 3070 Laptop GPU, i9-11950H, Samsung PM981a MZVLB2T0HALB | Lenovo ThinkPad X1 Extreme Gen3-20TLS0UV00 GeForce GTX 1650 Ti Max-Q, i7-10750H, Toshiba XG6 KXG6AZNV1T02 | |
|---|---|---|---|---|---|---|
| Noise | -3% | 12% | -12% | -2% | -9% | |
| apagado / medio ambiente * (dB) | 23.8 | 24.3 -2% | 23.4 2% | 29.8 -25% | 23.5 1% | 29.5 -24% |
| Idle Minimum * (dB) | 23.8 | 24.3 -2% | 23.6 1% | 29.9 -26% | 25.3 -6% | 29.5 -24% |
| Idle Average * (dB) | 23.8 | 24.3 -2% | 23.6 1% | 29.9 -26% | 25.3 -6% | 29.5 -24% |
| Idle Maximum * (dB) | 28.3 | 26.6 6% | 23.6 17% | 29.9 -6% | 25.3 11% | 29.9 -6% |
| Load Average * (dB) | 38.6 | 46.8 -21% | 25.8 33% | 43 -11% | 41.2 -7% | 44.2 -15% |
| Witcher 3 ultra * (dB) | 47.4 | 46.8 1% | 40.1 15% | 45.4 4% | 49.4 -4% | 36.1 24% |
| Load Maximum * (dB) | 47.4 | 46.8 1% | 41.4 13% | 46.1 3% | 49.4 -4% | 44.2 7% |
* ... más pequeño es mejor
Ruido
| Ocioso |
| 23.8 / 23.8 / 28.3 dB(A) |
| Carga |
| 38.6 / 47.4 dB(A) |
 | ||
30 dB silencioso 40 dB(A) audible 50 dB(A) ruidosamente alto |
||
min: | ||
Temperatura
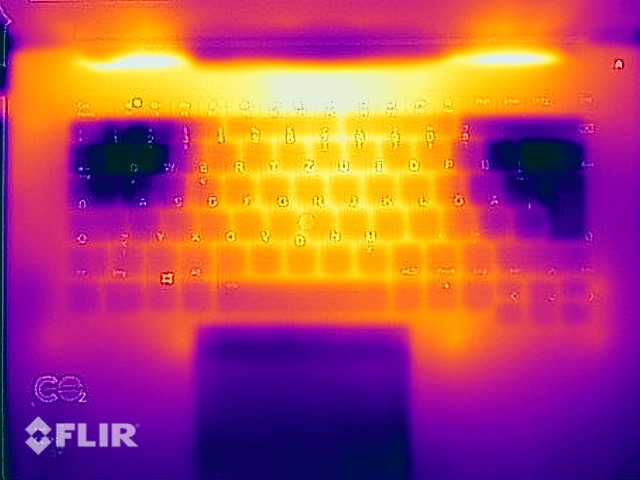
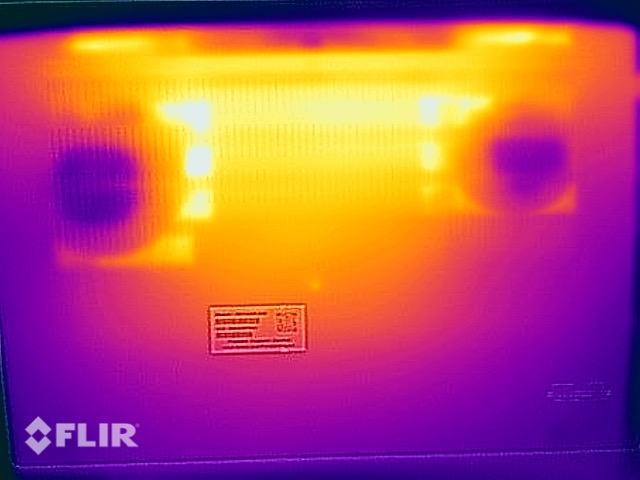
Lenovo ha diseñado el ThinkPad P1 Gen 4 al límite térmico. Como era de esperar, el portátil Lenovo se mantiene fresco en modo inactivo, pero el calentamiento bajo carga se muestra claramente: Los límites de lo posible con las actuales CPUs Intel y GPUs Nvidia se han agotado. Con 53,8 grados Celsius en la parte inferior, no es tanto la temperatura máxima como el calentamiento uniforme de la carcasa lo que lo demuestra. Incluso el reposamanos se calienta notablemente hasta los 40 grados Celsius (104 gradosFahrenheit), y las temperaturas son sólo ligeramente inferiores en la Witcher 3 prueba
(-) La temperatura máxima en la parte superior es de 51 °C / 124 F, frente a la media de 38.2 °C / 101 F, que oscila entre 22.2 y 69.8 °C para la clase Workstation.
(-) El fondo se calienta hasta un máximo de 53.5 °C / 128 F, frente a la media de 41.1 °C / 106 F
(+) En reposo, la temperatura media de la parte superior es de 26.7 °C / 80# F, frente a la media del dispositivo de 32 °C / 90 F.
(-) Jugando a The Witcher 3, la temperatura media de la parte superior es de 43 °C / 109 F, frente a la media del dispositivo de 32 °C / 90 F.
(-) El reposamanos y el touchpad pueden calentarse mucho al tacto con un máximo de 40 °C / 104 F.
(-) La temperatura media de la zona del reposamanos de dispositivos similares fue de 27.8 °C / 82 F (-12.2 °C / -22 F).
Prueba de esfuerzo
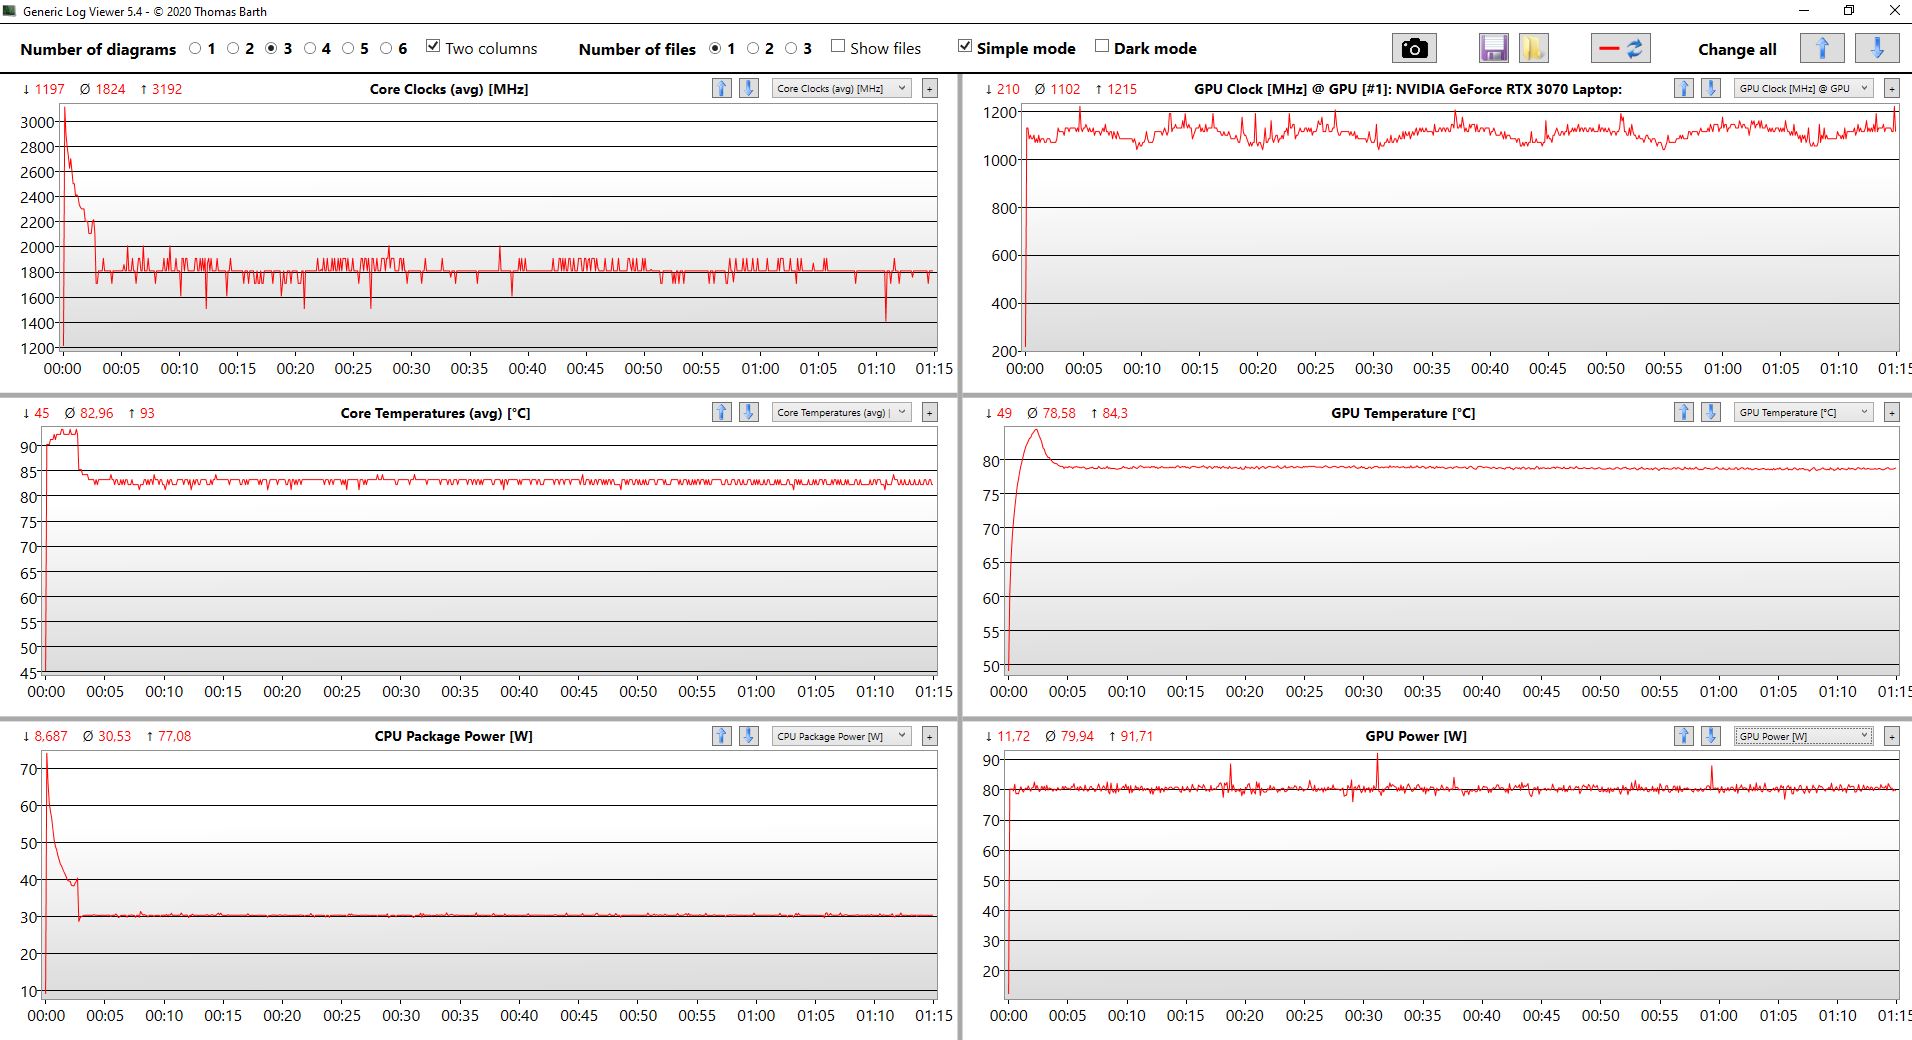
Con las mediciones de temperatura, ya quedó claro que Lenovo no puede hacer funcionar su ThinkPad a un rendimiento desenfrenado en la prueba de estrés. De hecho, el procesador se limita rápidamente a 30 vatios cuando la GPU y la CPU están completamente cargadas al mismo tiempo, mientras que el rendimiento de la GPU se mantiene estable a 80 vatios.
La clara ralentización en la prueba de estrés de escenario extremo no debería reflejarse en el uso diario, sin embargo, porque 3DMark 11 tras la prueba de estrés produjo un resultado normal.
Altavoz
Se puede encontrar un análisis de la calidad de los altavoces en el análisis del modelo QHD del Lenovo ThinkPad P1 Gen 4.
Lenovo ThinkPad P1 G4-20Y30017GE análisis de audio
(+) | los altavoces pueden reproducir a un volumen relativamente alto (#84.3 dB)
Graves 100 - 315 Hz
(±) | lubina reducida - en promedio 12.2% inferior a la mediana
(±) | la linealidad de los graves es media (9.8% delta a frecuencia anterior)
Medios 400 - 2000 Hz
(+) | medios equilibrados - a sólo 3.4% de la mediana
(+) | los medios son lineales (3.4% delta a la frecuencia anterior)
Altos 2 - 16 kHz
(+) | máximos equilibrados - a sólo 2.9% de la mediana
(+) | los máximos son lineales (5% delta a la frecuencia anterior)
Total 100 - 16.000 Hz
(+) | el sonido global es lineal (11.8% de diferencia con la mediana)
En comparación con la misma clase
» 16% de todos los dispositivos probados de esta clase eran mejores, 3% similares, 81% peores
» El mejor tuvo un delta de 7%, la media fue 17%, el peor fue ###max##%
En comparación con todos los dispositivos probados
» 9% de todos los dispositivos probados eran mejores, 3% similares, 89% peores
» El mejor tuvo un delta de 4%, la media fue 23%, el peor fue ###max##%
Apple MacBook Pro 16 2019 i9 5500M análisis de audio
(+) | los altavoces pueden reproducir a un volumen relativamente alto (#82.3 dB)
Graves 100 - 315 Hz
(+) | buen bajo - sólo 2.3% lejos de la mediana
(+) | el bajo es lineal (5% delta a la frecuencia anterior)
Medios 400 - 2000 Hz
(+) | medios equilibrados - a sólo 2.7% de la mediana
(+) | los medios son lineales (3.4% delta a la frecuencia anterior)
Altos 2 - 16 kHz
(+) | máximos equilibrados - a sólo 2.1% de la mediana
(+) | los máximos son lineales (2.6% delta a la frecuencia anterior)
Total 100 - 16.000 Hz
(+) | el sonido global es lineal (6.9% de diferencia con la mediana)
En comparación con la misma clase
» 5% de todos los dispositivos probados de esta clase eran mejores, 1% similares, 94% peores
» El mejor tuvo un delta de 5%, la media fue 17%, el peor fue ###max##%
En comparación con todos los dispositivos probados
» 1% de todos los dispositivos probados eran mejores, 0% similares, 99% peores
» El mejor tuvo un delta de 4%, la media fue 23%, el peor fue ###max##%
Consumo de energía: La pantalla LCD WQUXGA se come la batería del portátil Lenovo
Curiosamente, el consumo mínimo de esta versión del ThinkPad P1 Gen 4 apenas es notablemente mayor que el ya probado con LCD QHD. La diferencia es notable en la media de inactividad con el brillo del LCD maximizado: El consumo de 20.2 vatios es extremadamente alto aquí. Ninguno de los otros portátiles de estación de trabajo o multimedia tiene un consumo comparable a esta tasa.
Esta variante del ThinkPad P1 2021 de Lenovo se envía con una fuente de alimentación de 230 vatios. Esto ni siquiera sería necesario; una fuente de alimentación de 170 vatios también bastaría para el consumo máximo
| Off / Standby | |
| Ocioso | |
| Carga |
|
Clave:
min: | |
| Lenovo ThinkPad P1 G4-20Y4S0KS00 i7-11850H, GeForce RTX 3070 Laptop GPU, Samsung PM9A1 MZVL21T0HCLR, IPS LED, 3840x2400, 16" | Lenovo ThinkPad P1 G4-20Y30017GE i7-11800H, T1200 Laptop GPU, Samsung PM9A1 MZVL2512HCJQ, IPS, 2560x1600, 16" | Dell Precision 5000 5560 i7-11850H, RTX A2000 Laptop GPU, Samsung PM9A1 MZVL22T0HBLB, IPS, 3840x2400, 15.6" | Apple MacBook Pro 16 2019 i9 5500M i9-9880H, Radeon Pro 5500M, Apple SSD AP1024 7171, IPS, 3072x1920, 16" | HP ZBook Studio 15 G8 i9-11950H, GeForce RTX 3070 Laptop GPU, Samsung PM981a MZVLB2T0HALB, OLED, 3840x2160, 15.6" | Lenovo ThinkPad X1 Extreme Gen3-20TLS0UV00 i7-10750H, GeForce GTX 1650 Ti Max-Q, Toshiba XG6 KXG6AZNV1T02, IPS, 1920x1080, 15.6" | Medio NVIDIA GeForce RTX 3070 Laptop GPU | Media de la clase Workstation | |
|---|---|---|---|---|---|---|---|---|
| Power Consumption | 23% | 17% | 31% | -16% | 32% | -36% | 5% | |
| Idle Minimum * (Watt) | 8.1 | 7.7 5% | 6.2 23% | 3.7 54% | 11 -36% | 5 38% | 15.6 ? -93% | 9.11 ? -12% |
| Idle Average * (Watt) | 20.2 | 11.8 42% | 13.9 31% | 12.1 40% | 18.8 7% | 9 55% | 20.1 ? -0% | 13.8 ? 32% |
| Idle Maximum * (Watt) | 21.9 | 12.4 43% | 23.8 -9% | 17 22% | 31.7 -45% | 12.2 44% | 29.4 ? -34% | 17.9 ? 18% |
| Load Average * (Watt) | 88.2 | 94.6 -7% | 95.7 -9% | 91.5 -4% | 105.2 -19% | 94.4 -7% | 110.8 ? -26% | 96 ? -9% |
| Witcher 3 ultra * (Watt) | 149 | 99.6 33% | 87 42% | 103 31% | 148 1% | 89 40% | ||
| Load Maximum * (Watt) | 170.6 | 134 21% | 132.6 22% | 102.3 40% | 171.8 -1% | 133.9 22% | 214 ? -25% | 180.3 ? -6% |
* ... más pequeño es mejor
Energy consumption Witcher 3 / Stress test
Duración de la batería
La batería más grande, comparada con la generación predecesora, con una capacidad de 90 vatios hora se vacía bastante rápido por el consumo de la pantalla 4K. El Lenovo ThinkPad P1 G4 dura unas siete horas en el test Wi-Fi cuando la pantalla se pone a 150 cd/m². Con el brillo máximo, la duración de la batería disminuye a cuatro horas. El modelo con monitor QHD es claramente más adecuado para el uso móvil - después de todo, el ThinkPad 4K logra vencer a los rivales directos de la estación de trabajo Dell Precision 5560 y HP ZBook Studio 15 G8
| Lenovo ThinkPad P1 G4-20Y4S0KS00 i7-11850H, GeForce RTX 3070 Laptop GPU, 90 Wh | Lenovo ThinkPad P1 G4-20Y30017GE i7-11800H, T1200 Laptop GPU, 90 Wh | Dell Precision 5000 5560 i7-11850H, RTX A2000 Laptop GPU, 86 Wh | Apple MacBook Pro 16 2019 i9 5500M i9-9880H, Radeon Pro 5500M, 99.8 Wh | HP ZBook Studio 15 G8 i9-11950H, GeForce RTX 3070 Laptop GPU, 83 Wh | Lenovo ThinkPad X1 Extreme Gen3-20TLS0UV00 i7-10750H, GeForce GTX 1650 Ti Max-Q, 80 Wh | Media de la clase Workstation | |
|---|---|---|---|---|---|---|---|
| Duración de Batería | 26% | 20% | 30% | 20% | 51% | 27% | |
| H.264 (h) | 7.2 | 9 25% | 9.7 35% | 12.2 69% | 10.1 ? 40% | ||
| WiFi v1.3 (h) | 7 | 9 29% | 6.3 -10% | 12 71% | 6.2 -11% | 11.6 66% | 8.55 ? 22% |
| Load (h) | 1.2 | 1.5 25% | 1.8 50% | 1 -17% | 1.8 50% | 1.4 17% | 1.441 ? 20% |
| Witcher 3 ultra (h) | 0.9 |
Pro
Contra
Veredicto: El ThinkPad P1 Gen 4 es mejor con un sistema de refrigeración más potente

Una vez con Vapor-Chamber, una vez sin (ThinkPad P1 con T1200 aquí en la revisión): El Lenovo ThinkPad P1 G4 pasó por nuestro curso de pruebas dos veces. Rápidamente queda claro cuál de las dos versiones es mejor: la que tiene Vapor-Chamber.
Hoy en día, una buena refrigeración es probablemente la característica más importante de todos los portátiles con procesadores de la serie H de Intel. El modelo con Vapor-Chamber probado aquí da a la CPU un consumo significativamente mayor que su modelo hermano con refrigeración convencional. La diferencia de rendimiento es significativa, por lo que la conclusión tiene que basarse en esta única diferencia: Si el Lenovo ThinkPad P1 Gen 4, entonces con Vapor-Chamber - aunque se pierdan las opciones de un segundo SSD M.2-2280 o un módem WWAN. Sólo las variantes con GeForce RTX 3070, RTX 3080 así como Nvidia RTX A3000, A4000 y A5000 incluyen el mejor sistema de refrigeración.
Nuestra conclusión es menos clara en relación con el segundo gran diferenciador del dispositivo probado: La pantalla LCD WQUXGA cumple lo que promete en términos de calidad; es una de las mejores pantallas LC de todos los portátiles actuales - pero a costa de la duración de la batería. Dependiendo de las prioridades del usuario, la pantalla QHD puede ser la mejor opción si se desea un funcionamiento prolongado sin una fuente de alimentación conectada.
Cámara de vapor, sí, por favor: El sistema de refrigeración de este Lenovo ThinkPad P1 G4 es mucho mejor que el de la variante con tubo de calor.
En general, el Lenovo ThinkPad P1 G4 se gana claramente nuestra recomendación como portátil de 16 pulgadas de gama alta. El precio es correspondientemente elevado, y si el comprador está dispuesto a gastar tanto dinero, debería ser definitivamente el modelo Vapor-Chamber.
Los rivales directos de la estación de trabajo son sobre todo el Dell Precision 5560 y el HP ZBook Studio 15 G8 por lo que ambos tienen puntos débiles - el más compacto Precision tiene menos puertos y ofrece menos rendimiento, mientras que el 16:9 y la RAM soldada no hablan necesariamente a favor del ZBook. Fuera del ámbito de Windows, el Apple MacBook Pro 16 debe ser mencionado, por lo que una comparación con el nuevo modelo con M1 Max será de particular interés aquí.
Precio y disponibilidad
El Lenovo ThinkPad P1 2021 probado cuesta 2.850 euros (~3.266 dólares)en Campuspoint. Es un modelo especial que está disponible exclusivamente en el Programa Campus de Lenovo para estudiantes, aprendices y otras personas elegibles. La misma configuración cuesta 3.982 euros (~4.564 dólares) en la Lenovo Store
Lenovo ThinkPad P1 G4-20Y4S0KS00
- 10/25/2021 v7 (old)
Benjamin Herzig
Price comparison
