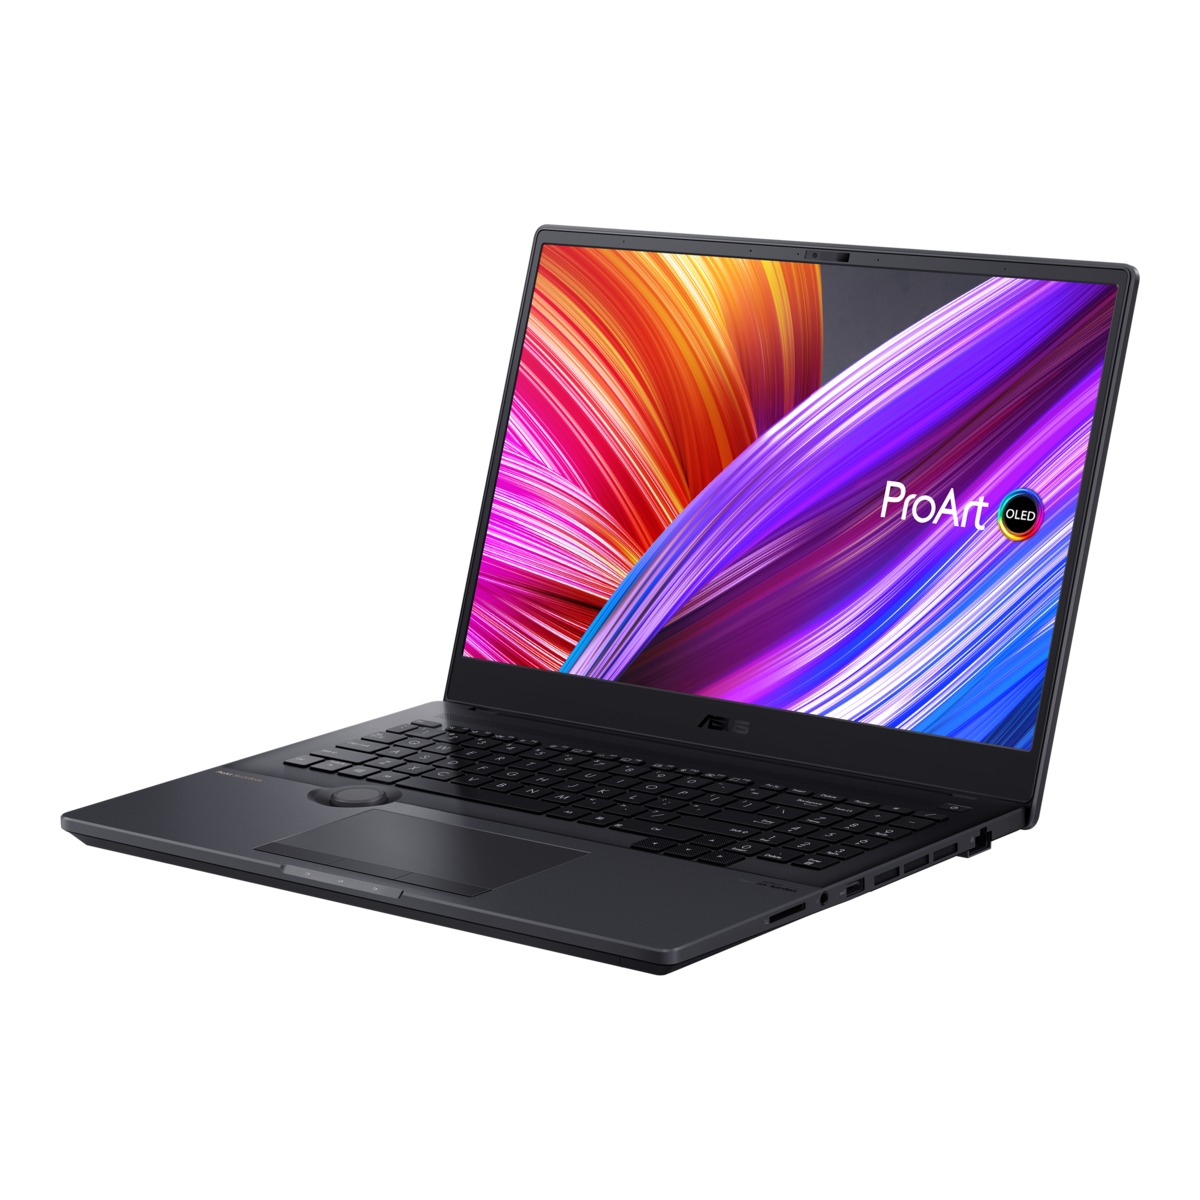
Análisis del portátil Asus ProArt StudioBook Pro 16 W7600: Estación de trabajo potente y ligera
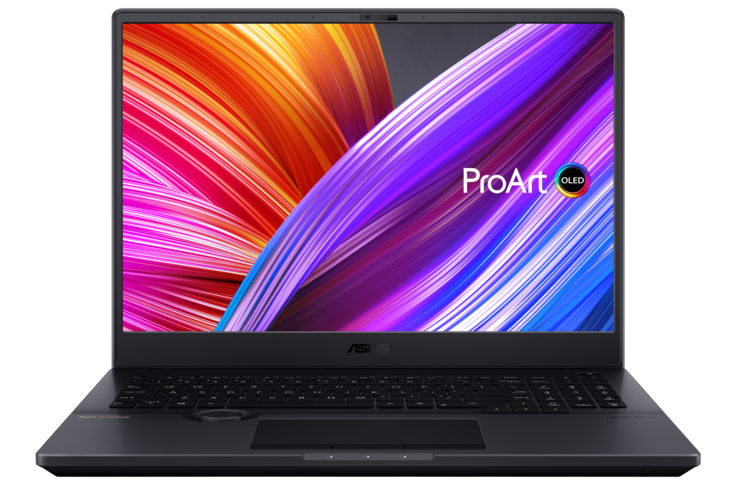
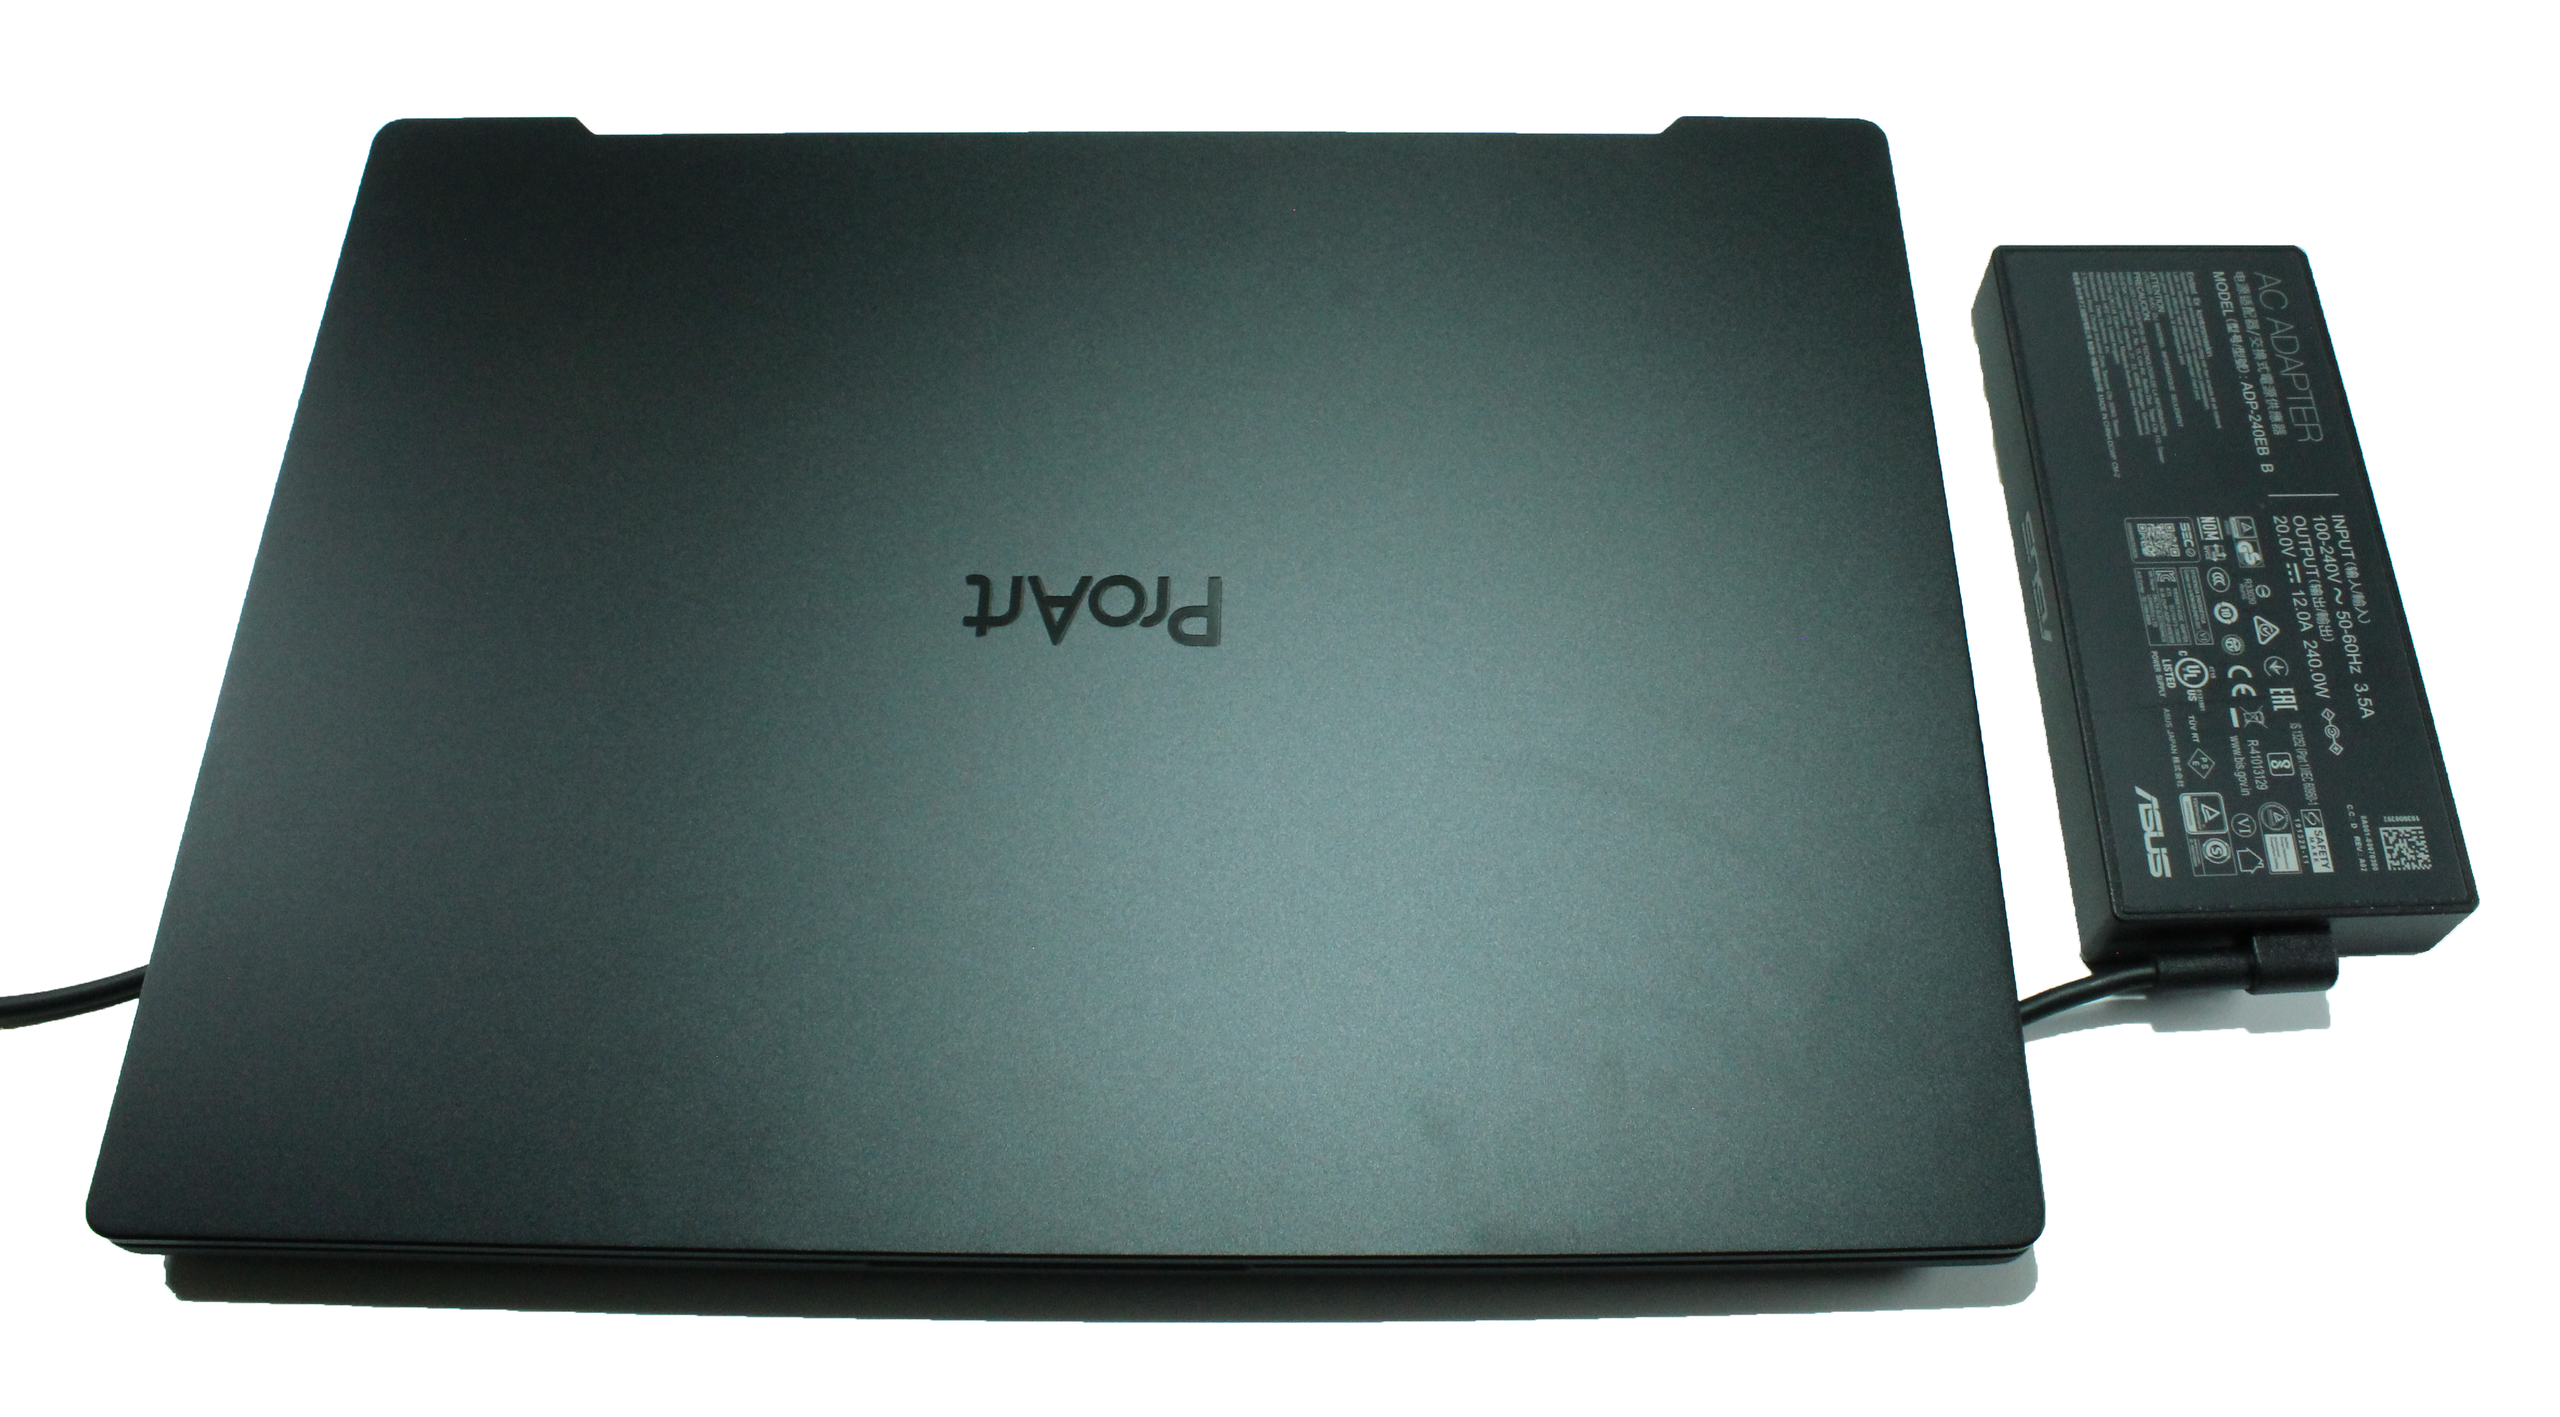
Con el ProArt Studiobook Pro 16, Asus presenta una nueva serie de portátiles para profesionales creativos. El portátil para creadores cuenta con una pantalla 4K OLED HDR con relación de aspecto 16:10, que ofrece así una mayor superficie de trabajo. Además, cuenta con el Asus Dial, con el que se pueden controlar diversas herramientas creativas, por lo que se supone que simplifica el trabajo de los diseñadores. El fabricante saca la artillería pesada en cuanto a equipamiento, ya que no solo la CPU Xeon de tercera generación de Intel está a bordo, sino también la GPU para estaciones de trabajo Nvidia RTX A5000. La serie está, por tanto, dirigida a usuarios profesionales y se supone que puede manejar tareas complejas como el renderizado 3D o la edición de vídeo de alta resolución. Dado que la unidad de prueba que nos ha proporcionado Asus Alemania es una pre-muestra, el dispositivo no recibe aún una valoración por nuestra parte.
Los competidores incluyen el HP ZBook Fury 15 G8, que es una estación de trabajo con idéntico equipamiento, así como el HP ZBook Studio 15 G8 y el Dell Precision 5560
Possible competitors in comparison
Valoración | Fecha | Modelo | Peso | Altura | Tamaño | Resolución | Precio |
|---|---|---|---|---|---|---|---|
v (old) | 12/2021 | Asus ProArt StudioBook 16 W7600H5A-2BL2 W-11955M, RTX A5000 Laptop GPU | 2.4 kg | 21.4 mm | 16.00" | 3840x2400 | |
| 90.3 % v7 (old) | 10/2021 | HP ZBook Fury 15 G8 i9-11950H, RTX A5000 Laptop GPU | 2.5 kg | 25.9 mm | 15.60" | 3840x2160 | |
| 87.8 % v7 (old) | 08/2021 | HP ZBook Studio 15 G8 i9-11950H, GeForce RTX 3070 Laptop GPU | 1.9 kg | 18 mm | 15.60" | 3840x2160 | |
| 88.3 % v7 (old) | 10/2021 | Dell Precision 5000 5560 i7-11850H, RTX A2000 Laptop GPU | 2 kg | 18 mm | 15.60" | 3840x2400 |
Caso
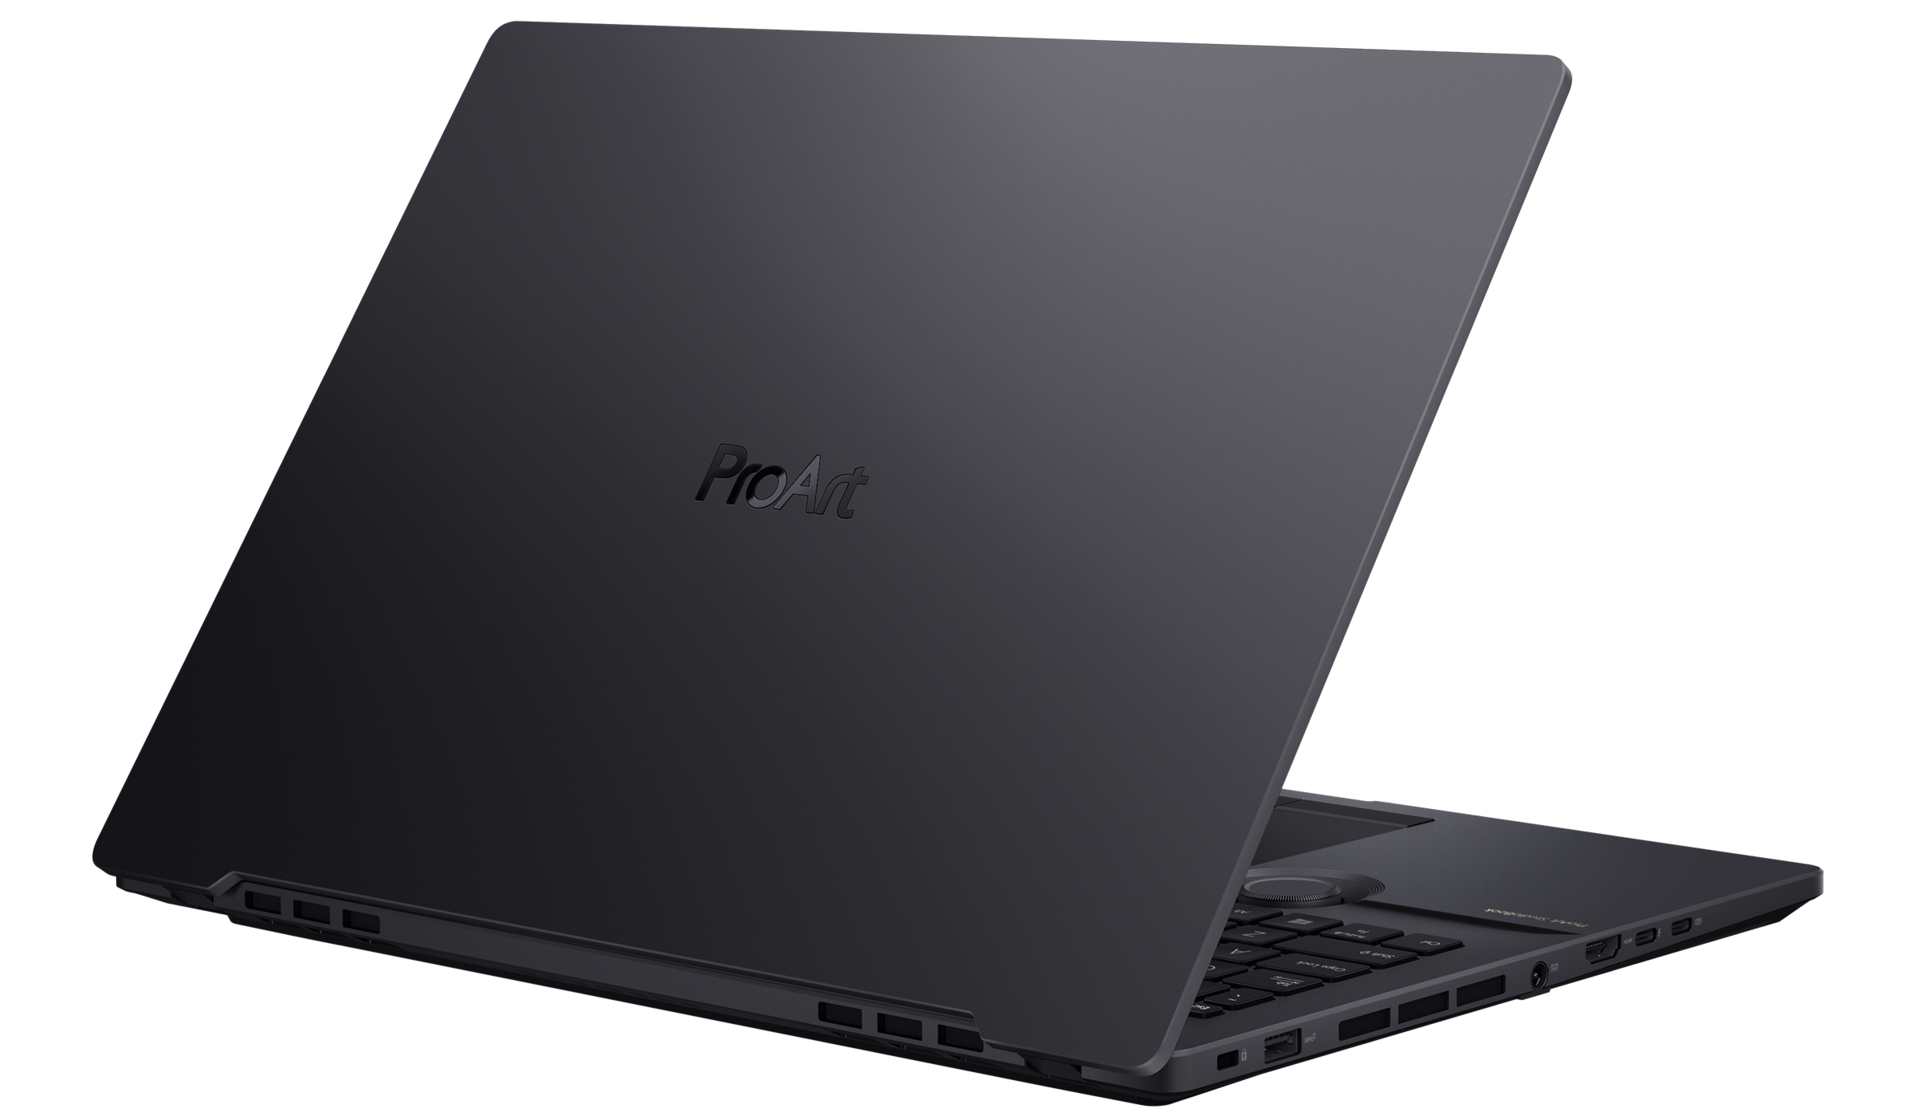
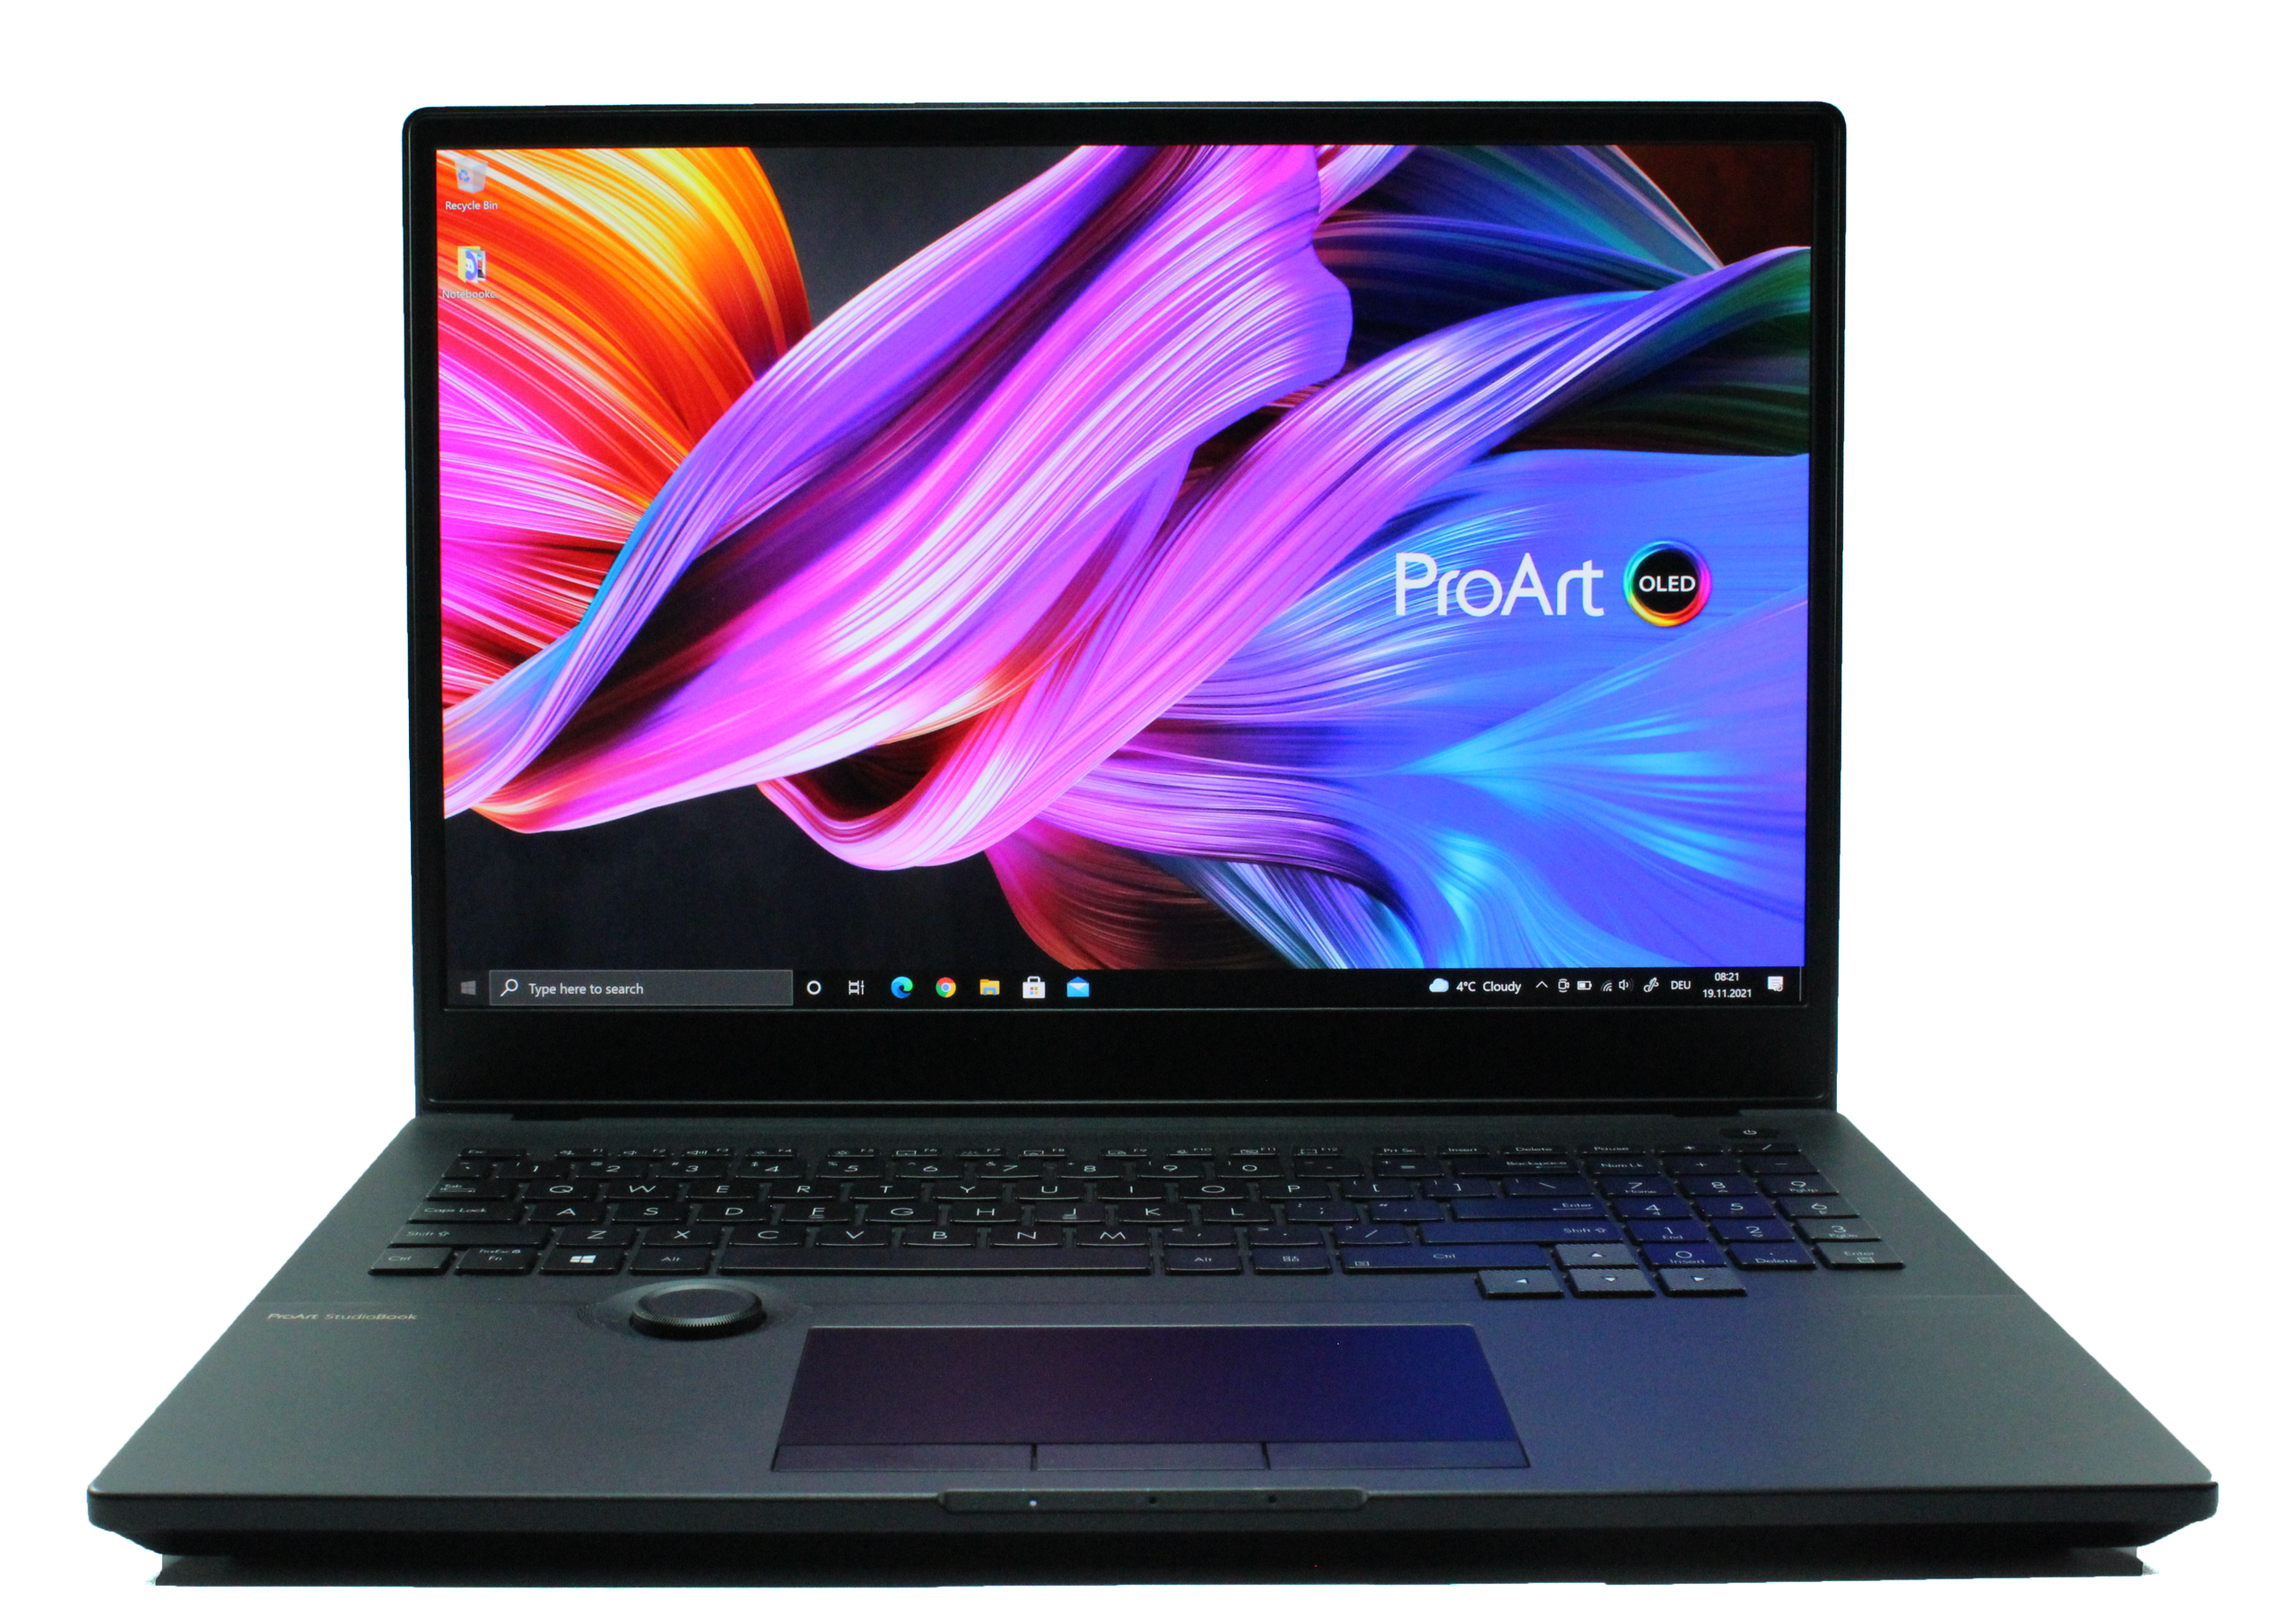
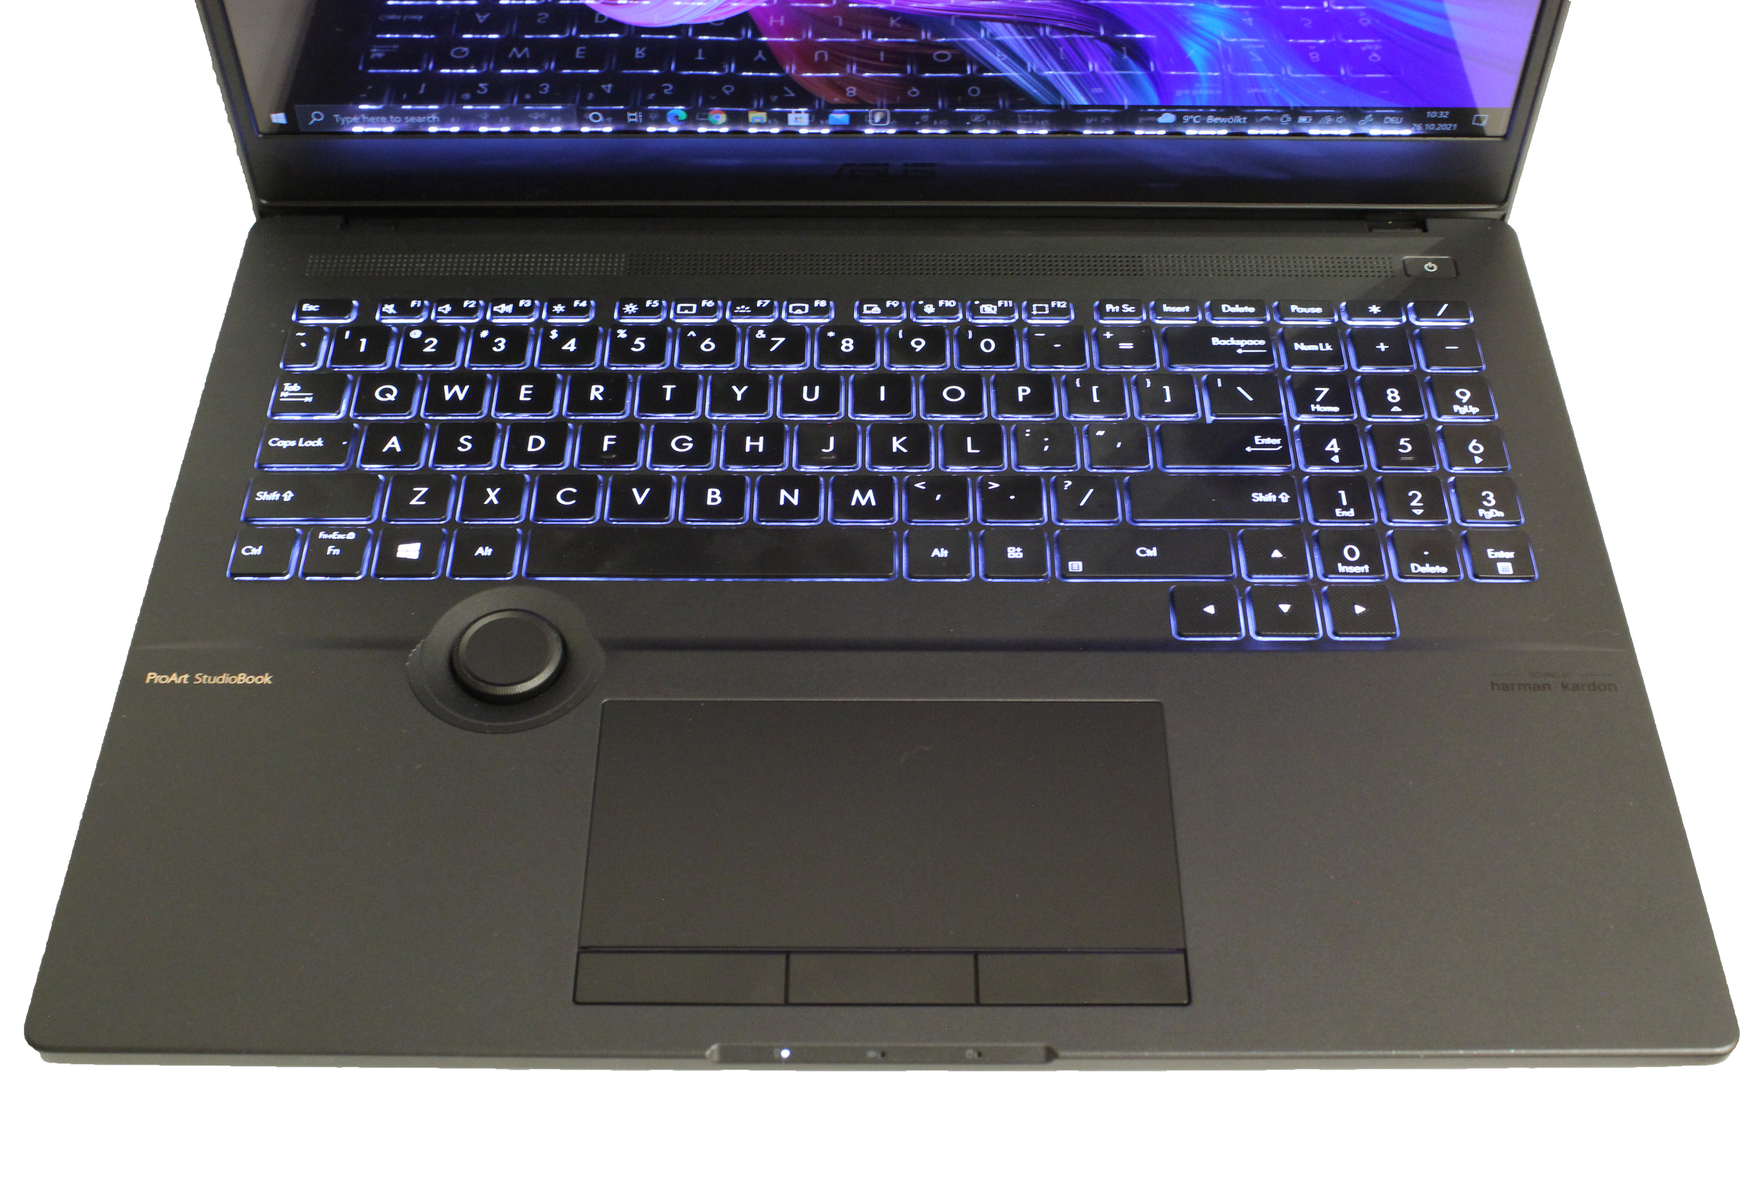
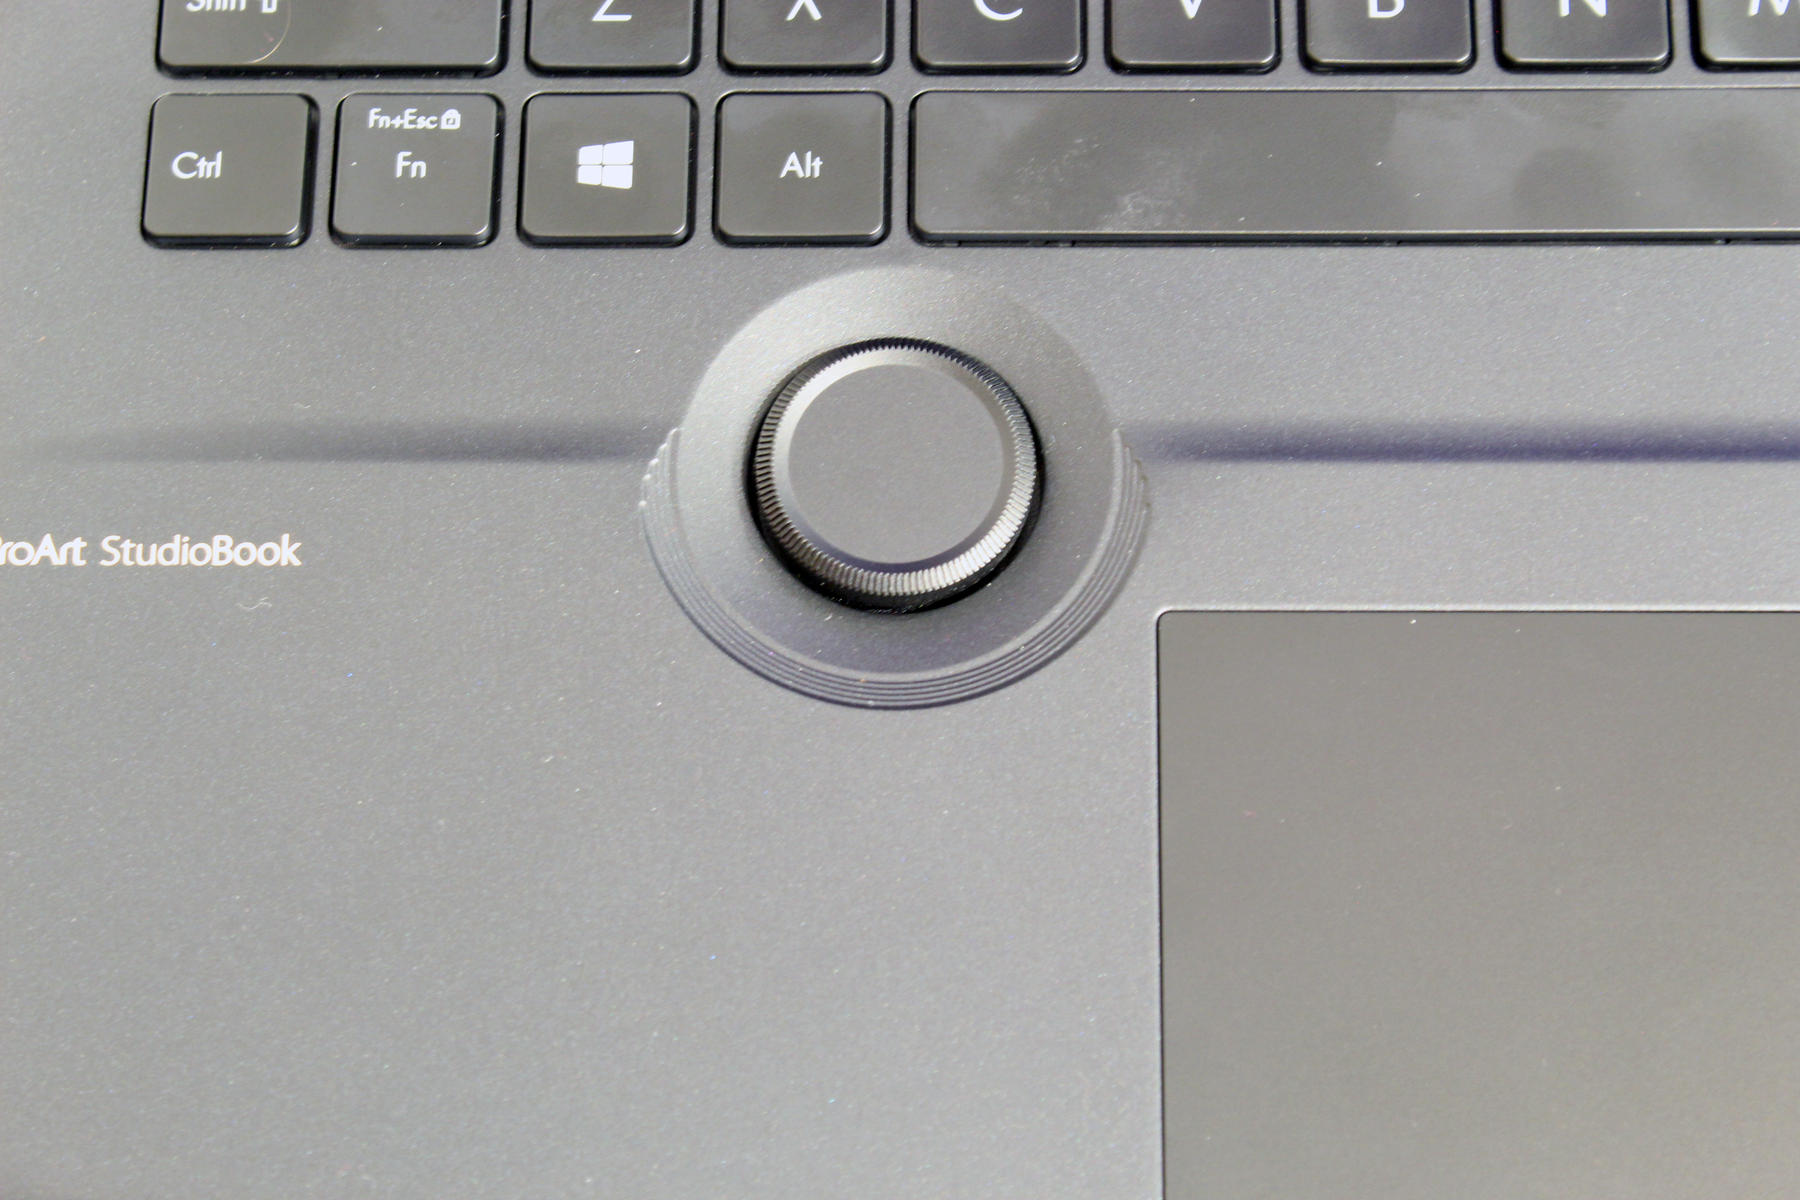
La carcasa del Asus ProArt StudioBook 16 es muy robusta y con 2,4 kg es relativamente ligera para su tamaño. La carcasa está hecha de metal con una aleación de magnesio recubierta, lo que le da una superficie mate, brillante y también más rugosa. Una característica especial del dispositivo es el Asus Dial Controller, que está integrado junto al trackpad y puede, por ejemplo, hacer que el control de algunas funciones en programas de edición de imágenes y vídeos sea especialmente preciso. Además, el Asus Dial Controller puede utilizarse para ajustar más rápidamente el brillo o el volumen del sistema. El diseño del Asus ProArt StudioBook 16 es decente y tiene un aspecto muy cuidado con la disposición del teclado, el trackpad y el Asus Dial. Lo que también destaca de la carcasa son los pies altos, que se supone que proporcionan al usuario más comodidad al escribir. Estos pies altos hacen que el teclado esté más alto que el reposamanos. Asus también ha hecho un hueco en el centro trasero del soporte que permite que pase más aire fresco para optimizar la refrigeración del dispositivo.
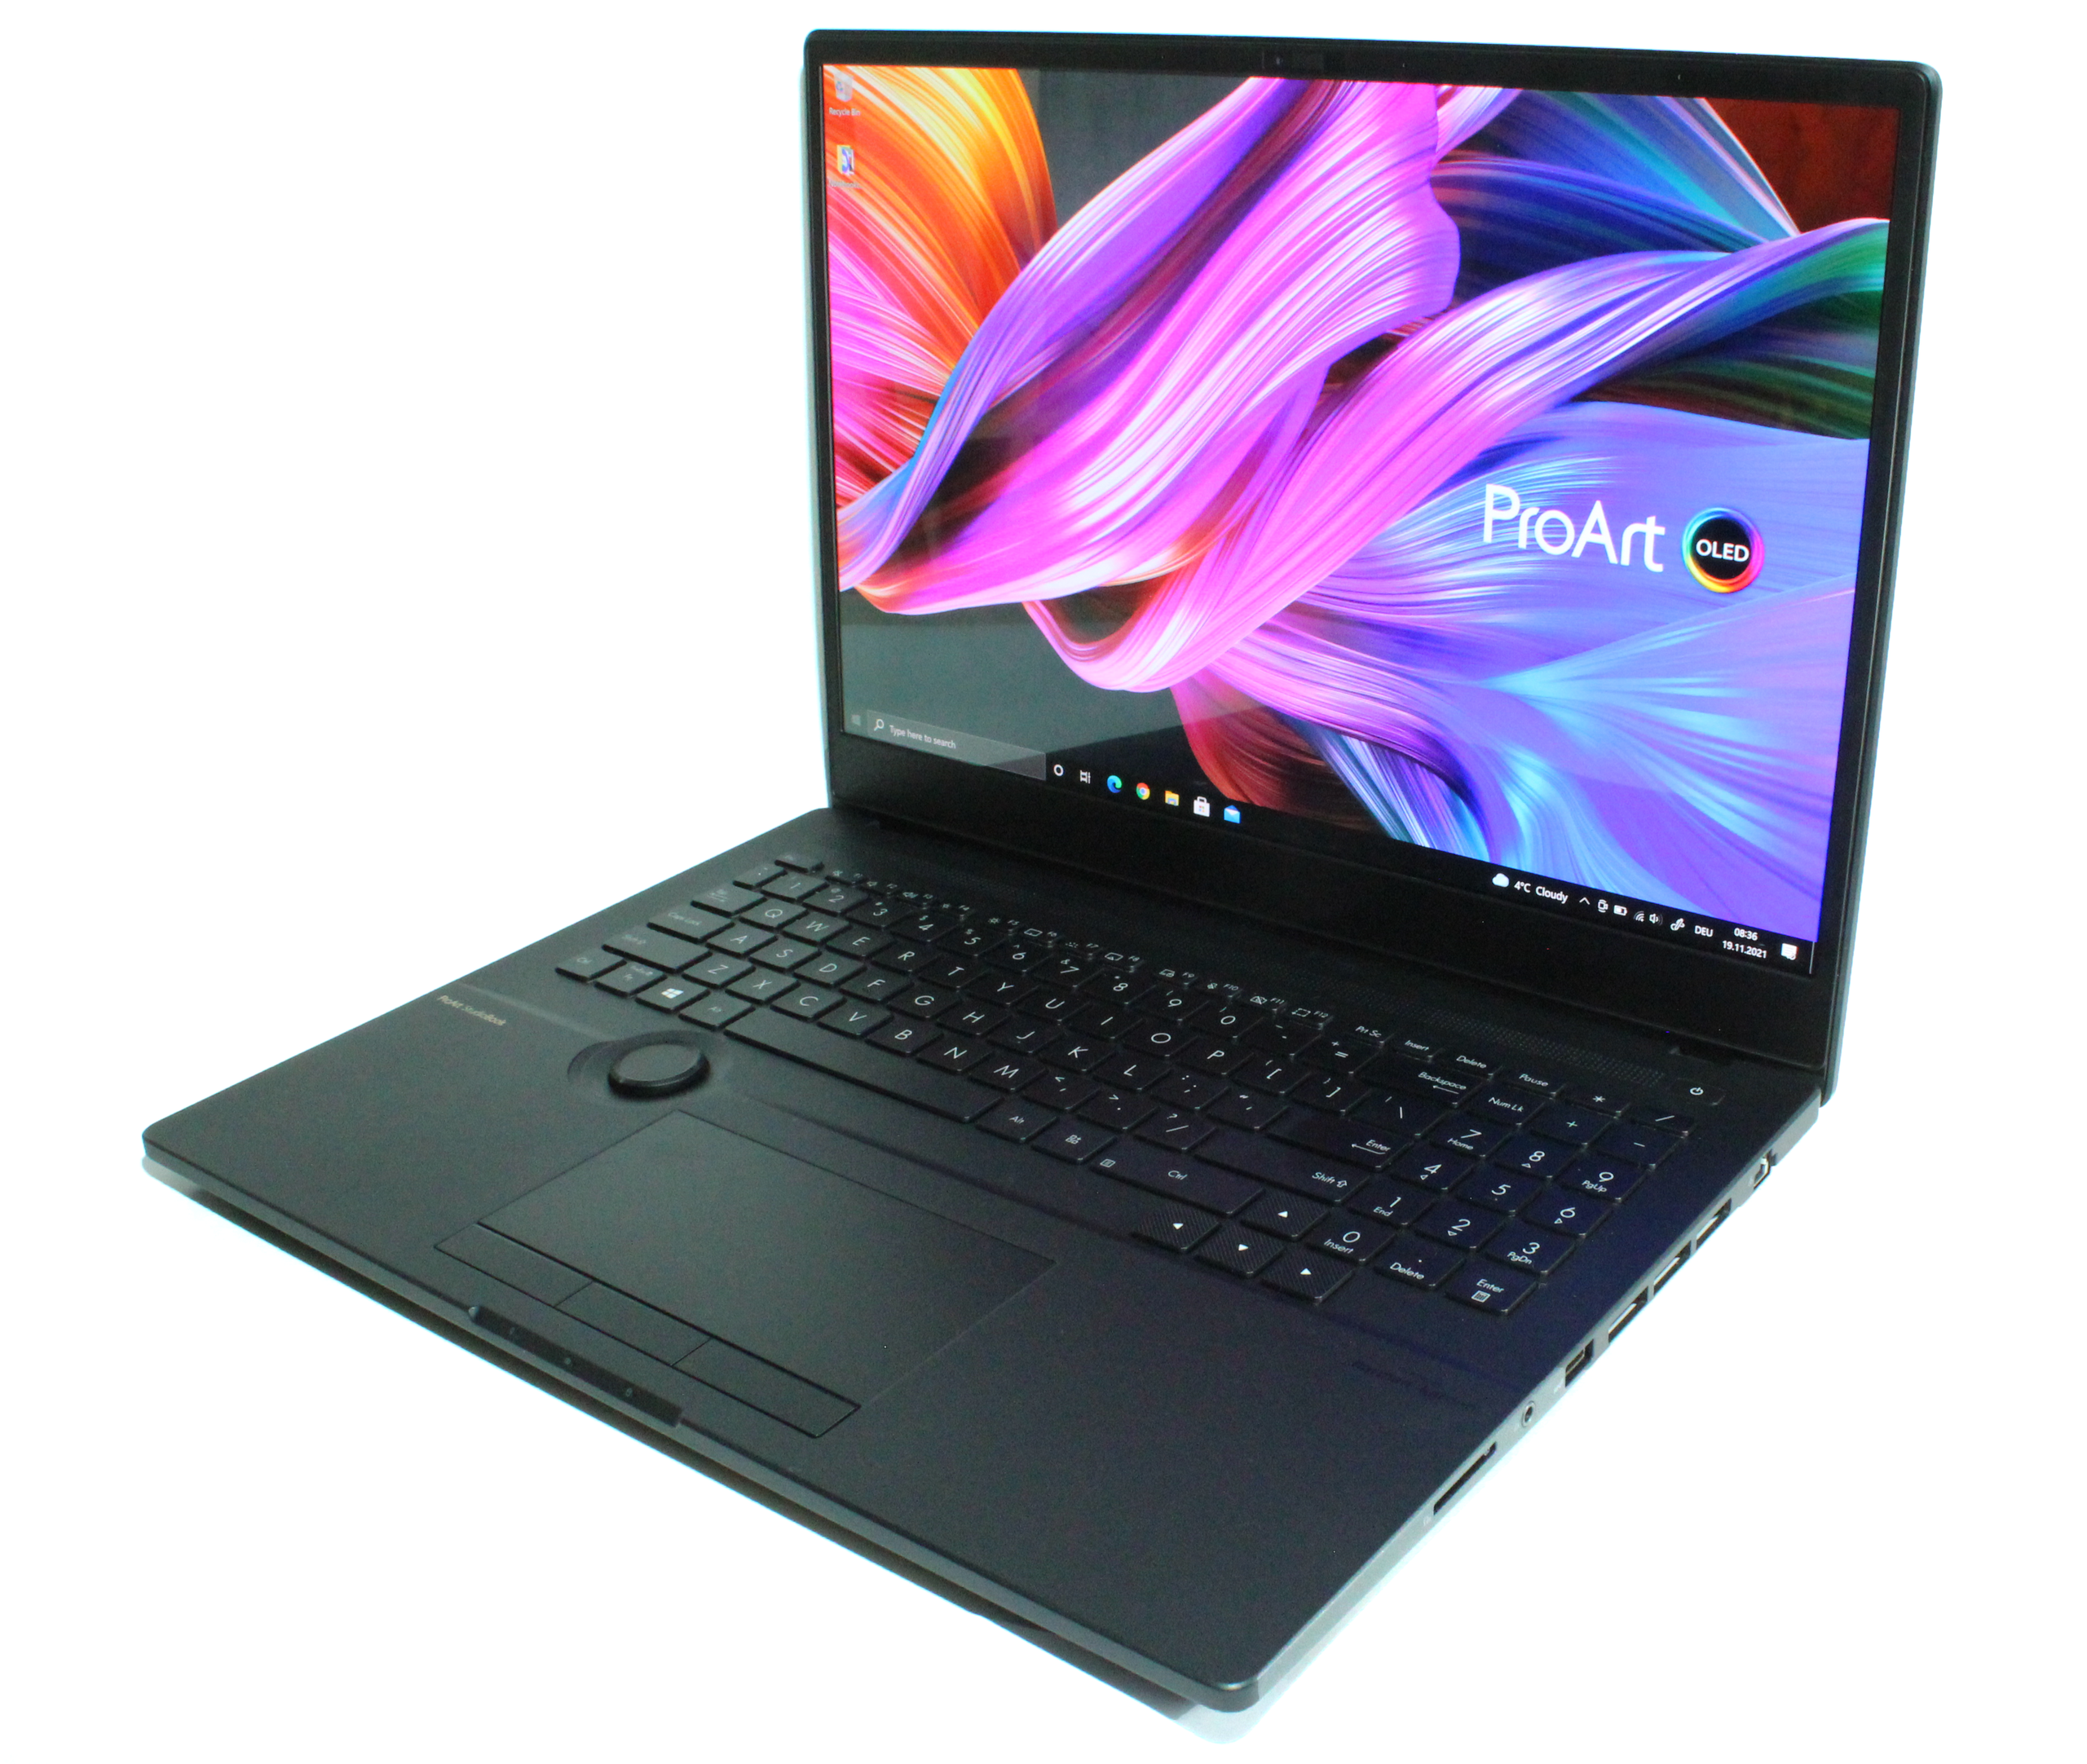
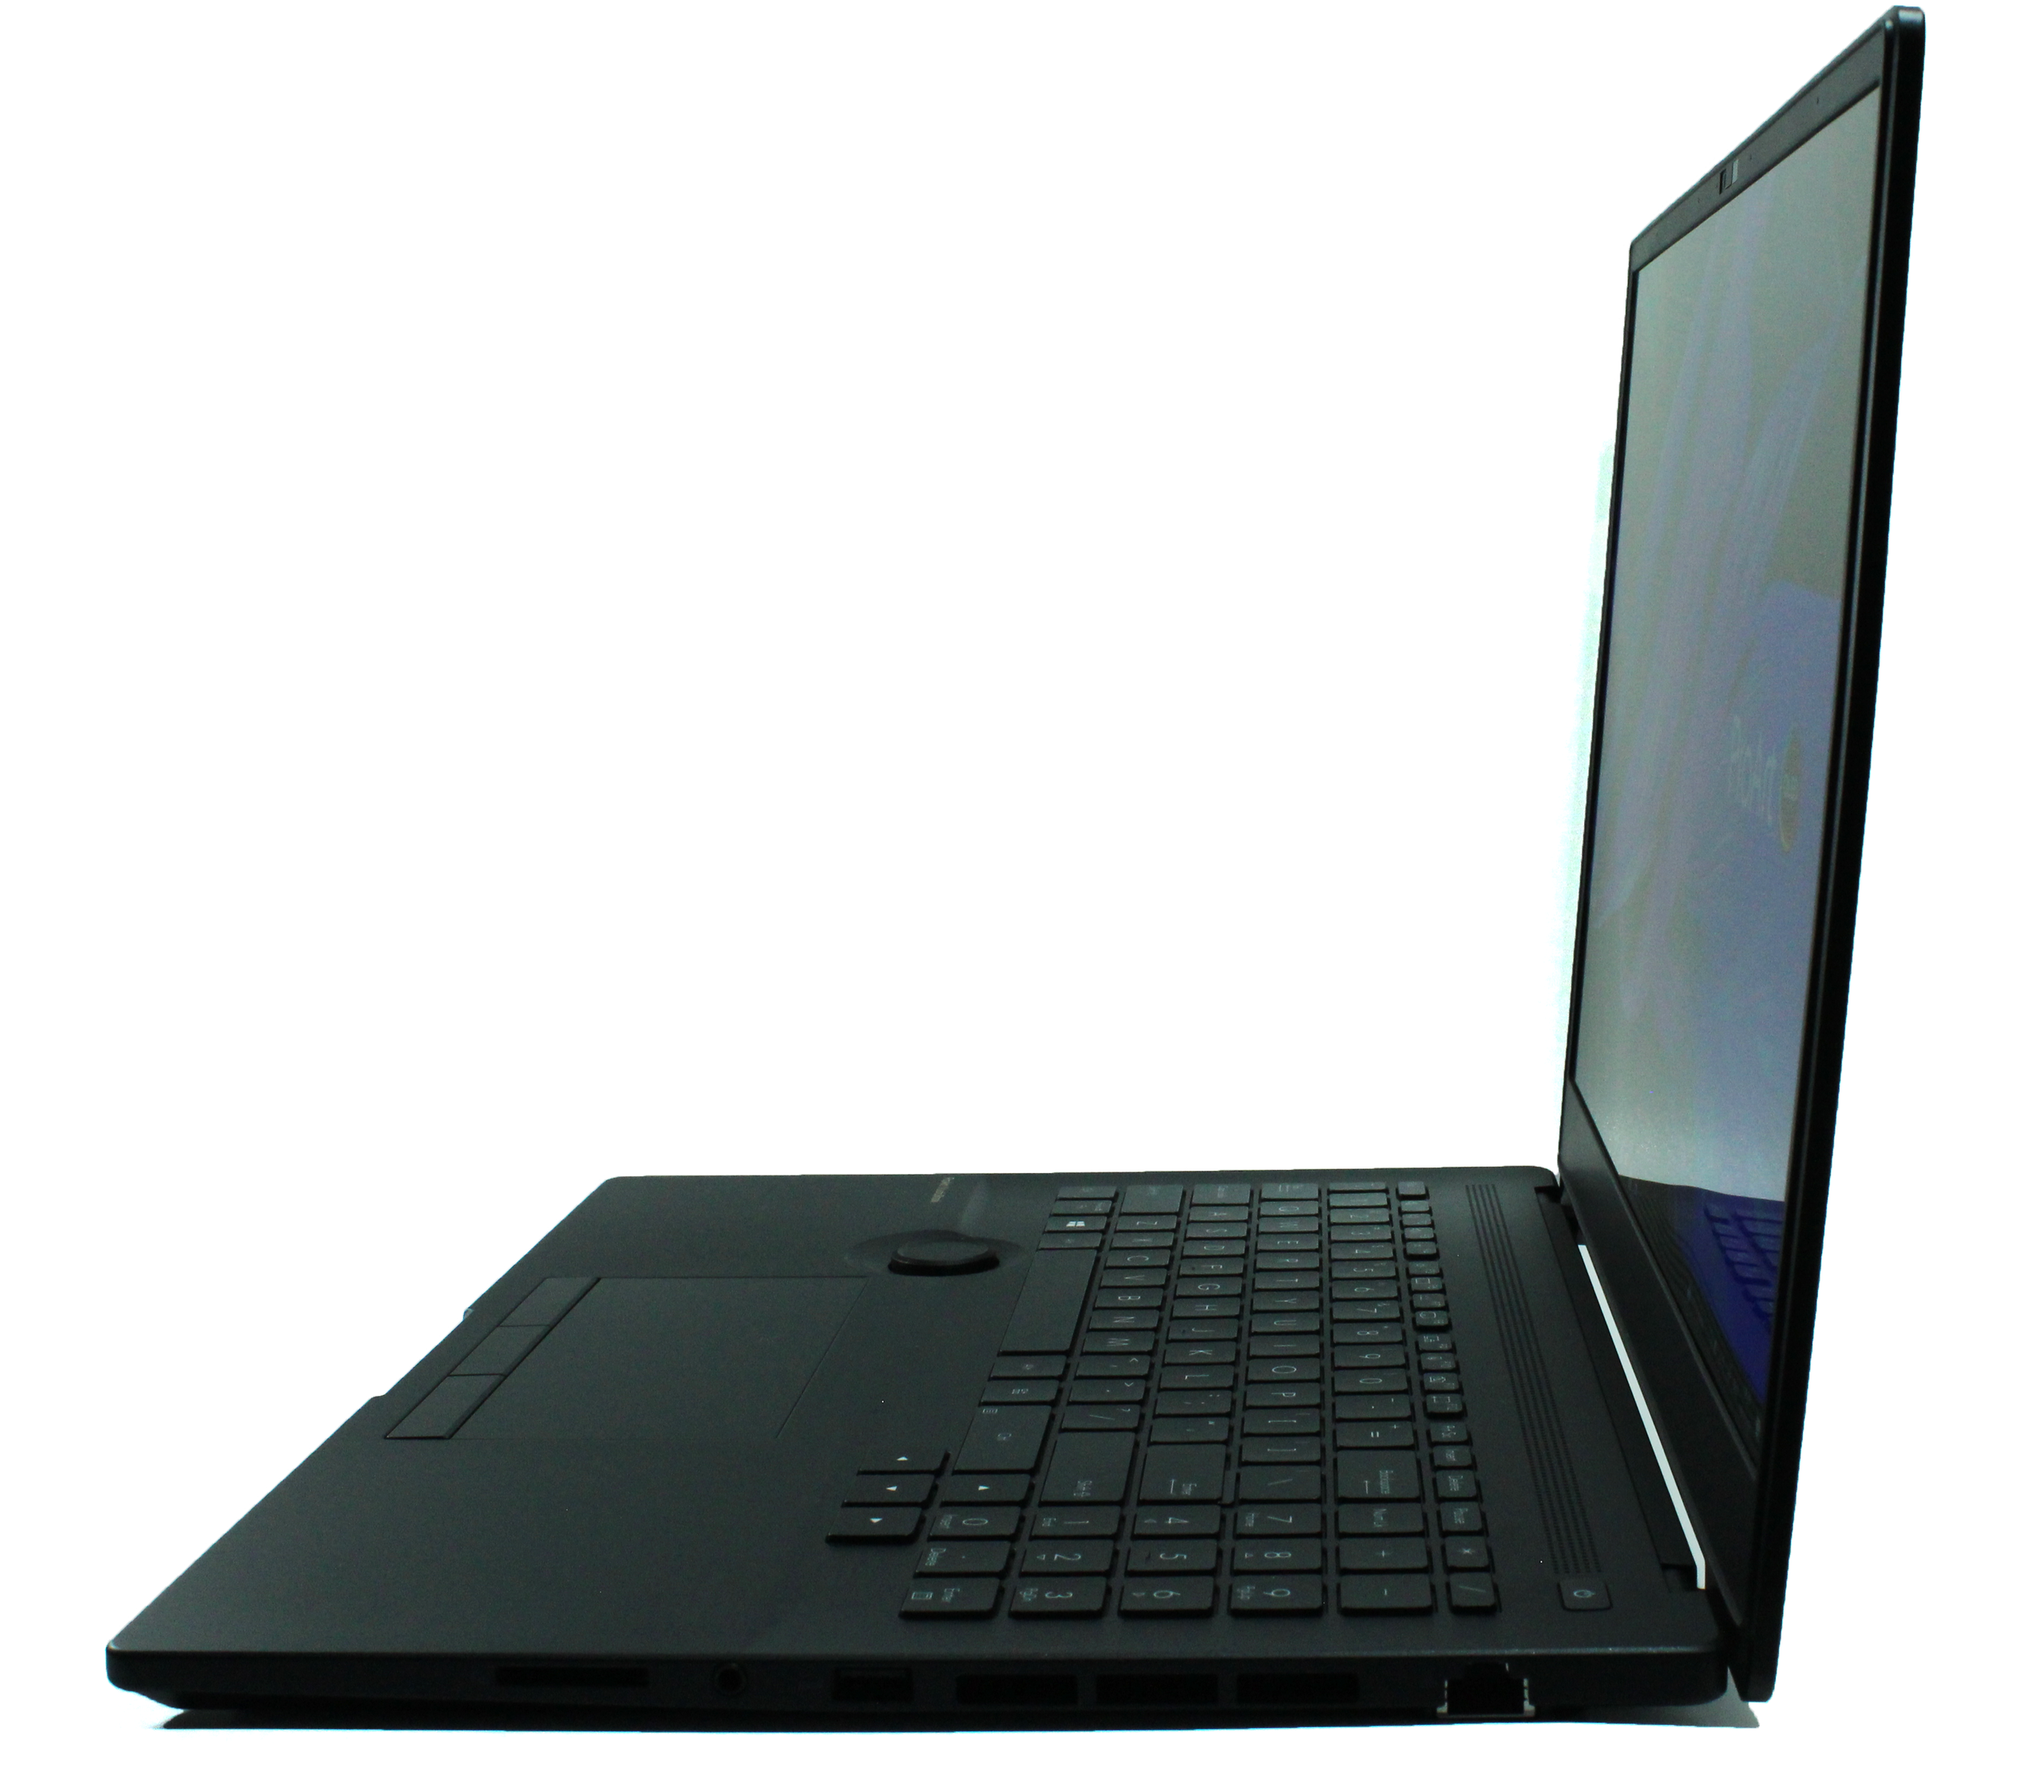
Con su pantalla de 16 pulgadas y una altura total de sólo 2,1 centímetros, el Asus ProArt StudioBook es sorprendentemente delgado. Mientras que el HP ZBook Fury con su pantalla más pequeña es ligeramente más estrecha por fuera, es casi medio centímetro más alta que nuestro dispositivo. Aparte del ZBook Fury, todos los rivales están claramente por delante en términos de peso.
Equipo
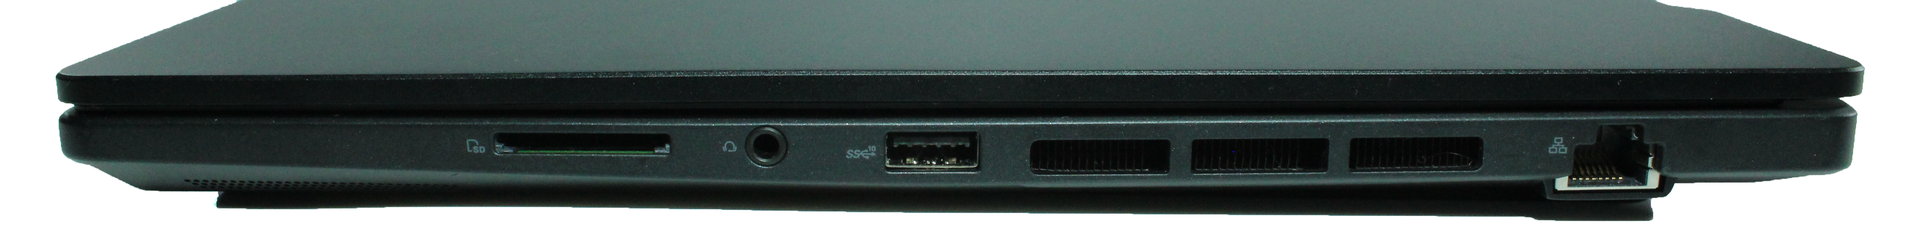
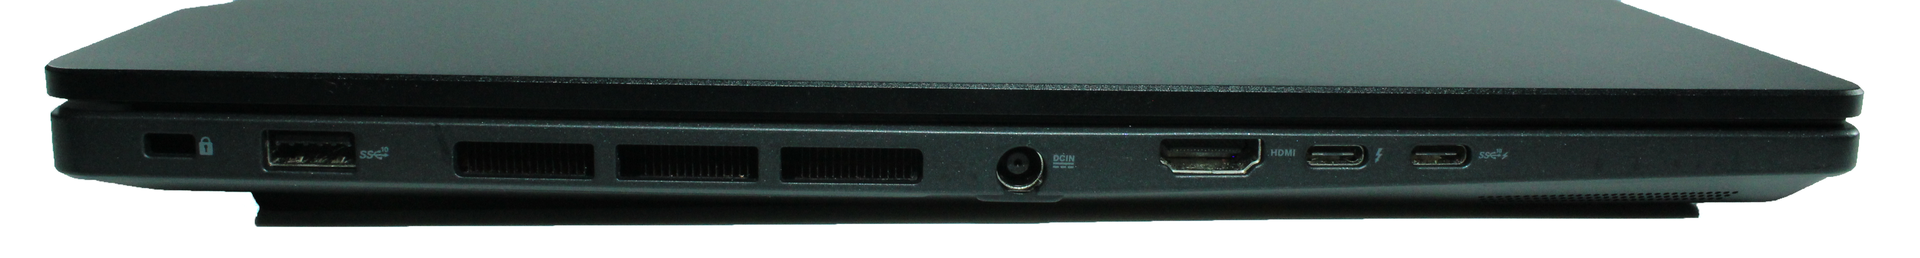
Los puertos del portátil se distribuyen en dos lados: en el lado izquierdo, hay bloqueo Kensington, USB-A 3.2 Gen.2, el conector de alimentación, HDMI 2.1, Thunderbolt 4, y un puerto USB-C 3.2 Gen 2 además de las salidas de aire del sistema de refrigeración. Las salidas de aire se extienden por el lado derecho al igual que en el izquierdo. También hay un lector de tarjetas SD de tamaño completo, una toma combinada de 3,5 mm, USB-A 3.2 Gen.2 y Gigabit LAN en el lado derecho. Tanto Thunderbolt 4 como el puerto USB-C soportan Power Delivery y permiten conectar una pantalla cada uno. Los puertos están suficientemente separados y no afectan a la comodidad del usuario cuando todos los puertos están ocupados. Sólo hay salidas de aire del sistema de refrigeración en la parte trasera del portátil.
Lector de tarjetas SD
La velocidad de transferencia del lector de tarjetas SD integrado es inferior en nuestro dispositivo de preproducción. Ni siquiera el rendimiento medio de los datos se alcanza con nuestra tarjeta de memoria de referencia AV PRO 128 GB V60.
| SD Card Reader | |
| average JPG Copy Test (av. of 3 runs) | |
| Dell Precision 5000 5560 (AV Pro V60) | |
| Media de la clase Workstation (49.6 - 681, n=14, últimos 2 años) | |
| HP ZBook Fury 15 G8 (AV Pro V60) | |
| HP ZBook Studio 15 G8 (AV Pro V60) | |
| Asus ProArt StudioBook 16 W7600H5A-2BL2 (AV Pro SD microSD 128 GB V60) | |
| maximum AS SSD Seq Read Test (1GB) | |
| Media de la clase Workstation (87.6 - 1455, n=14, últimos 2 años) | |
| Dell Precision 5000 5560 (AV Pro V60) | |
| HP ZBook Studio 15 G8 (AV Pro V60) | |
| HP ZBook Fury 15 G8 (AV Pro V60) | |
| Asus ProArt StudioBook 16 W7600H5A-2BL2 (AV Pro SD microSD 128 GB V60) | |
Comunicación
El Intel Wi-Fi AX201 instalado en nuestro dispositivo de preproducción no puede explotar su potencial de rendimiento en nuestra prueba de rendimiento y acaba entre un 20 y un 60 por ciento por detrás de la media.
Cámara web
La calidad de la cámara web de 720p de nuestro dispositivo de prueba es muy pobre. Como la mayoría de los competidores, le falta nitidez de imagen y precisión de color

")
")


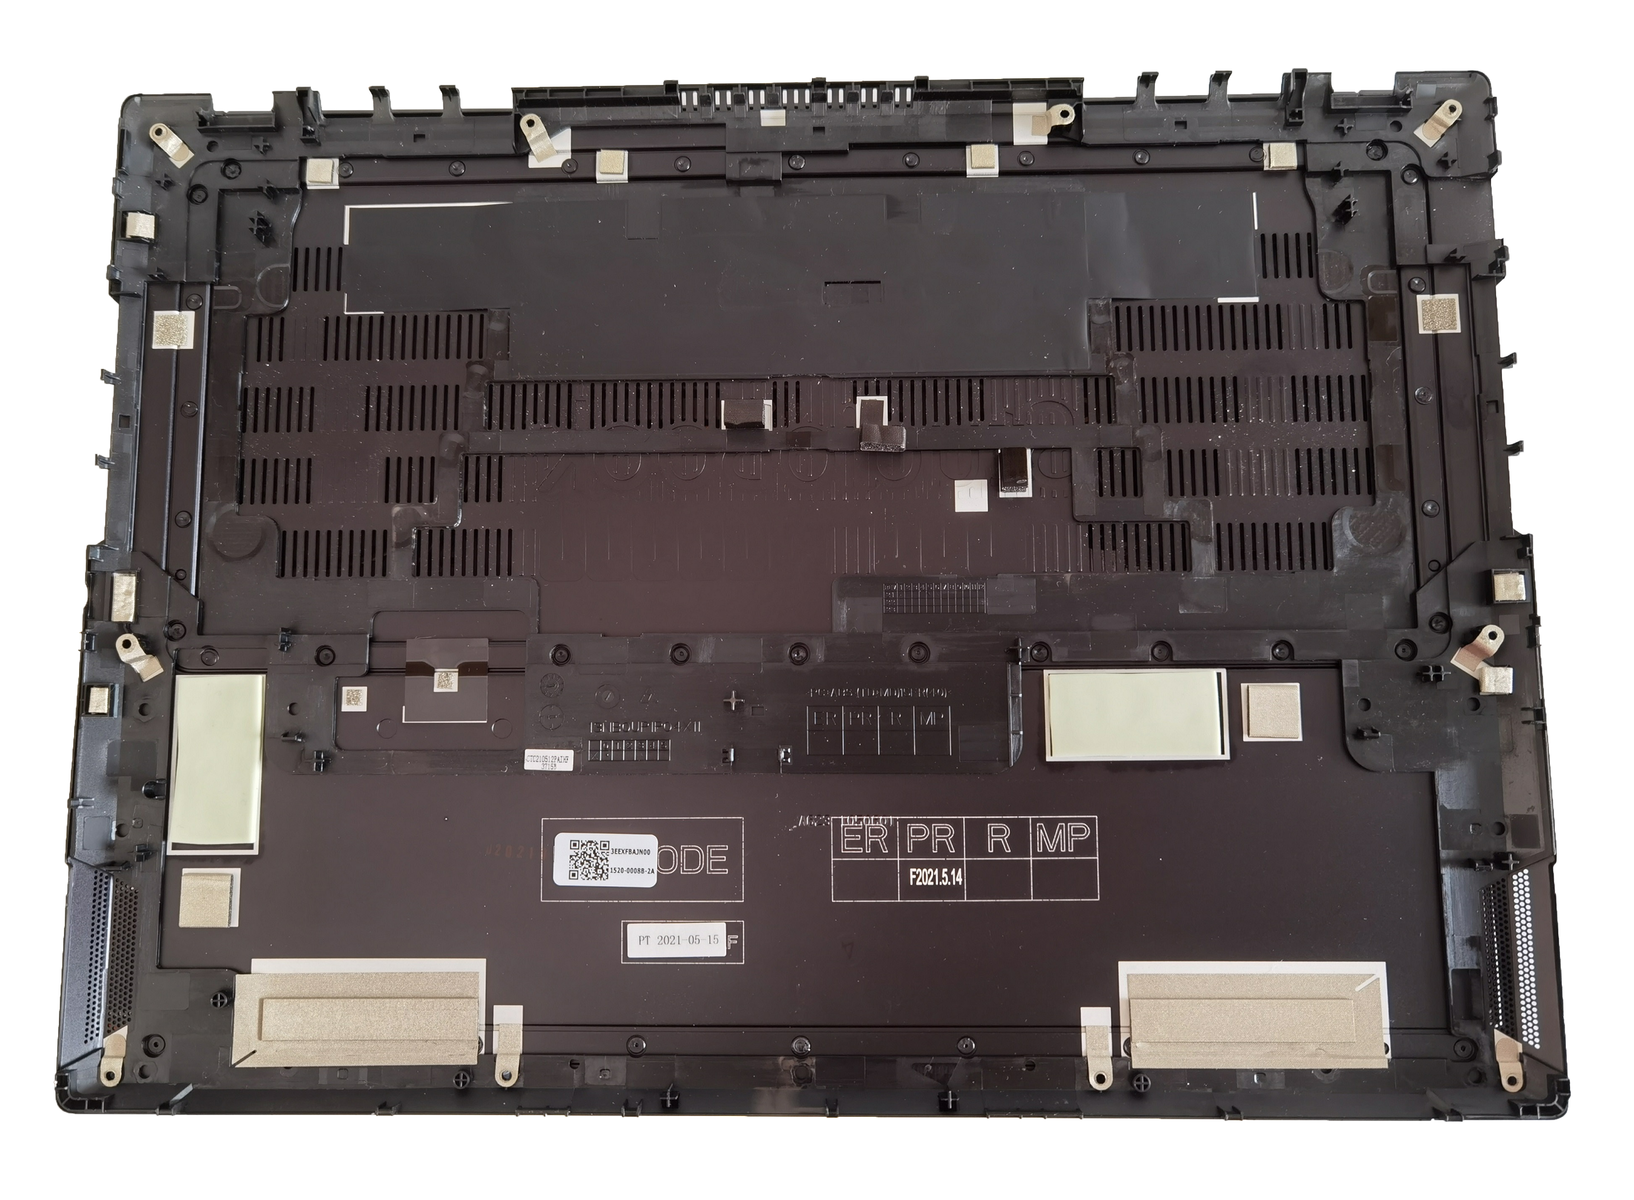
Mantenimiento
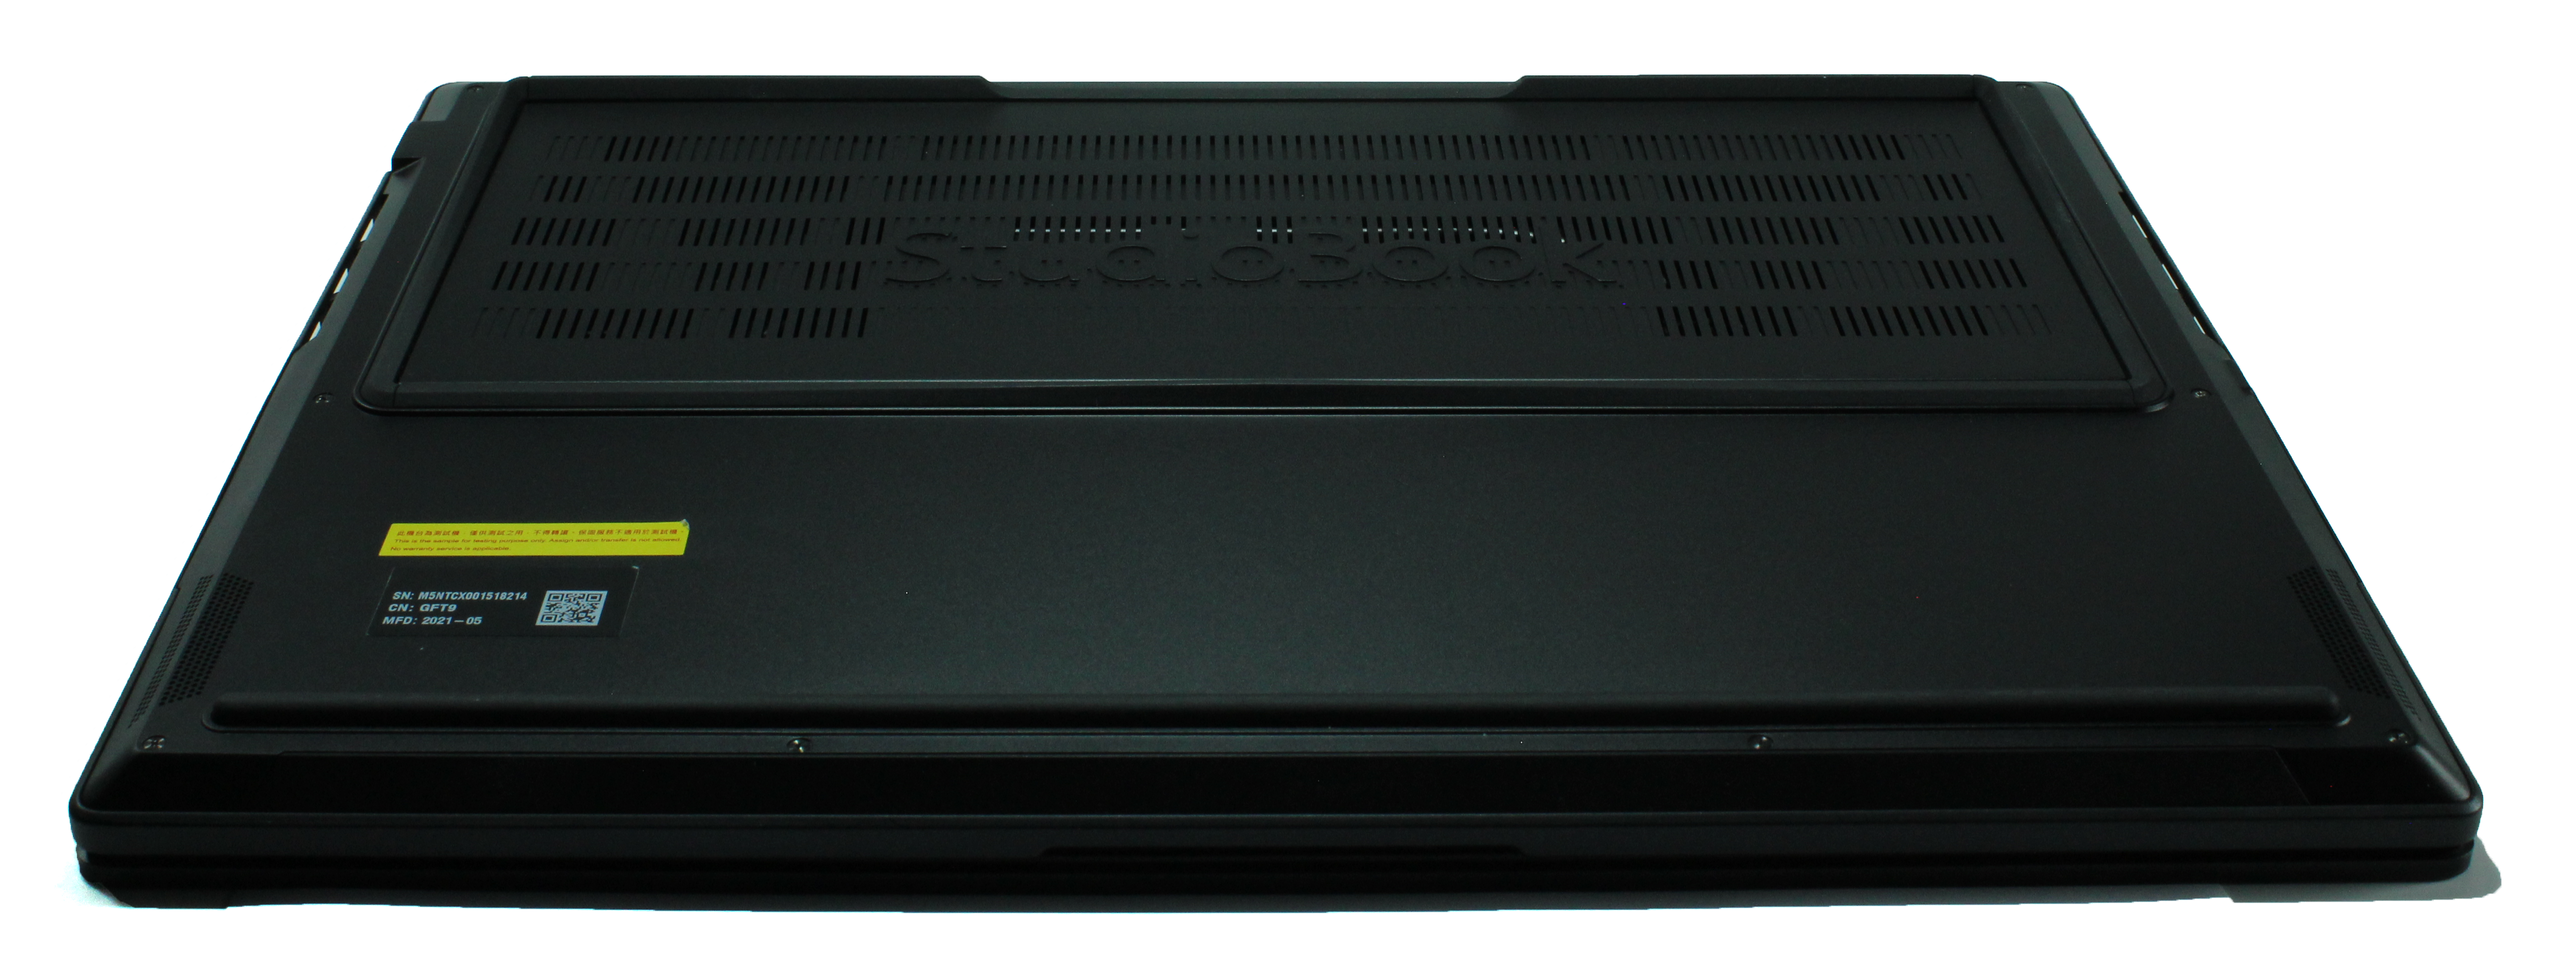
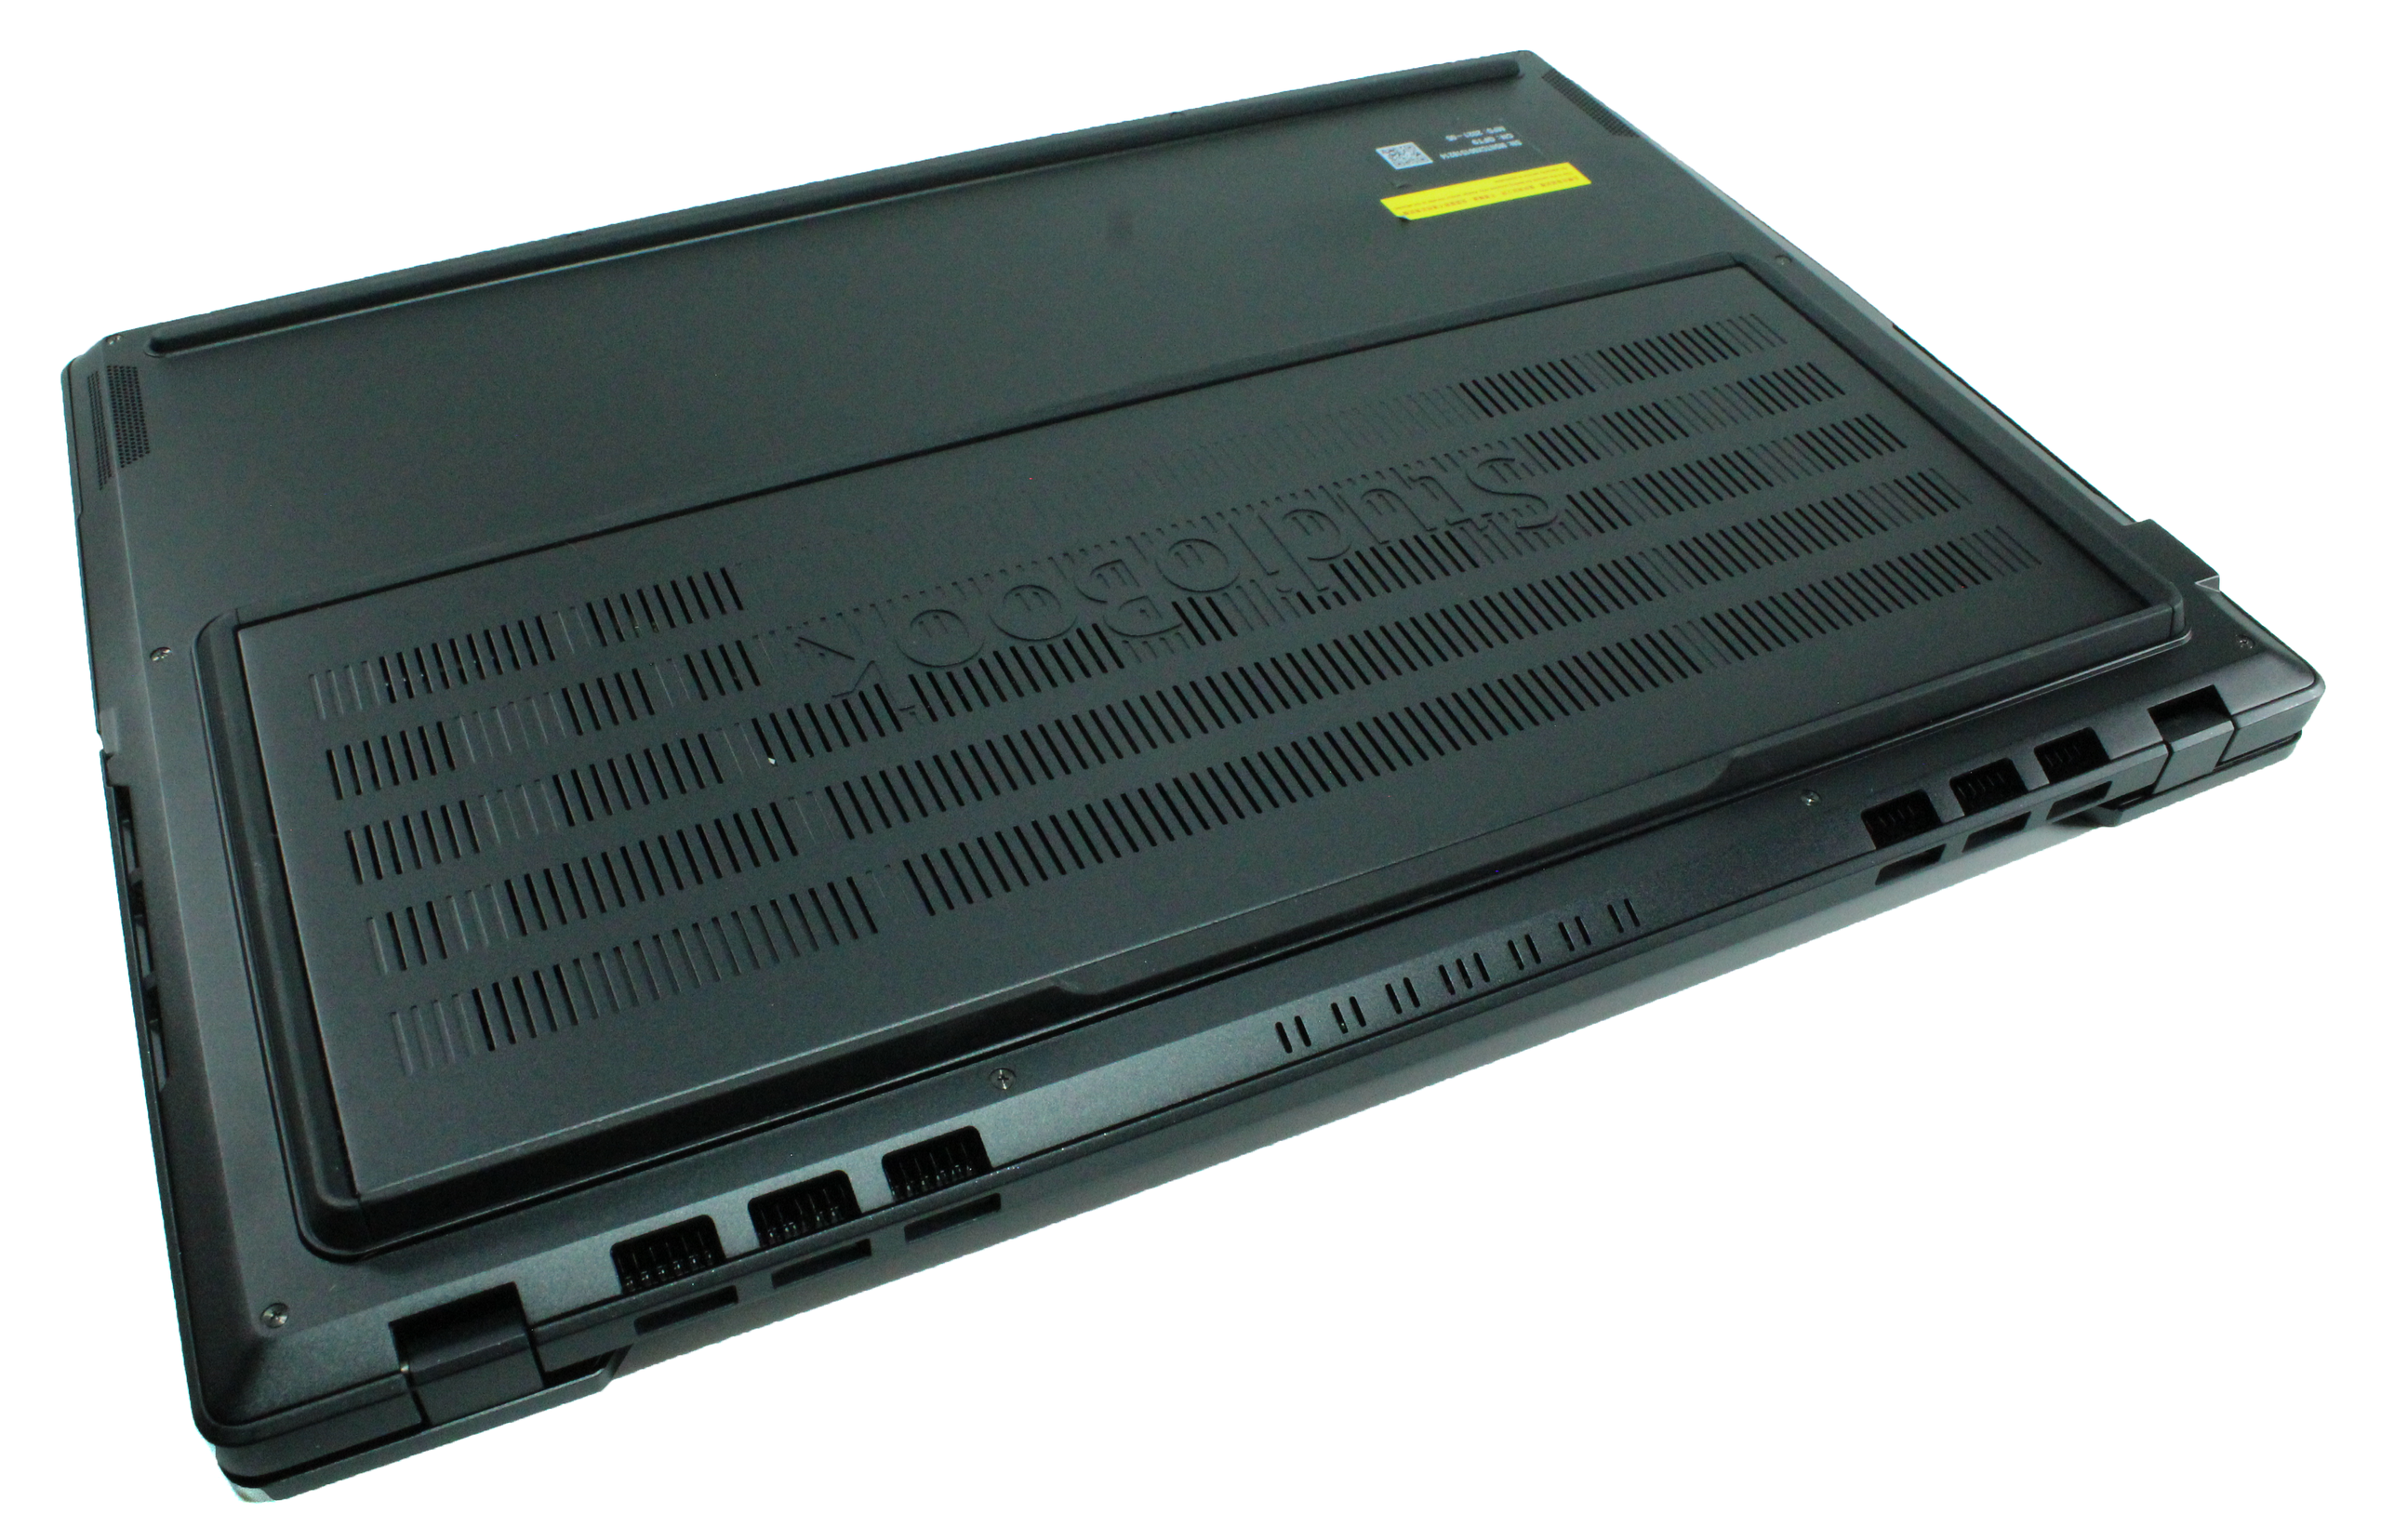
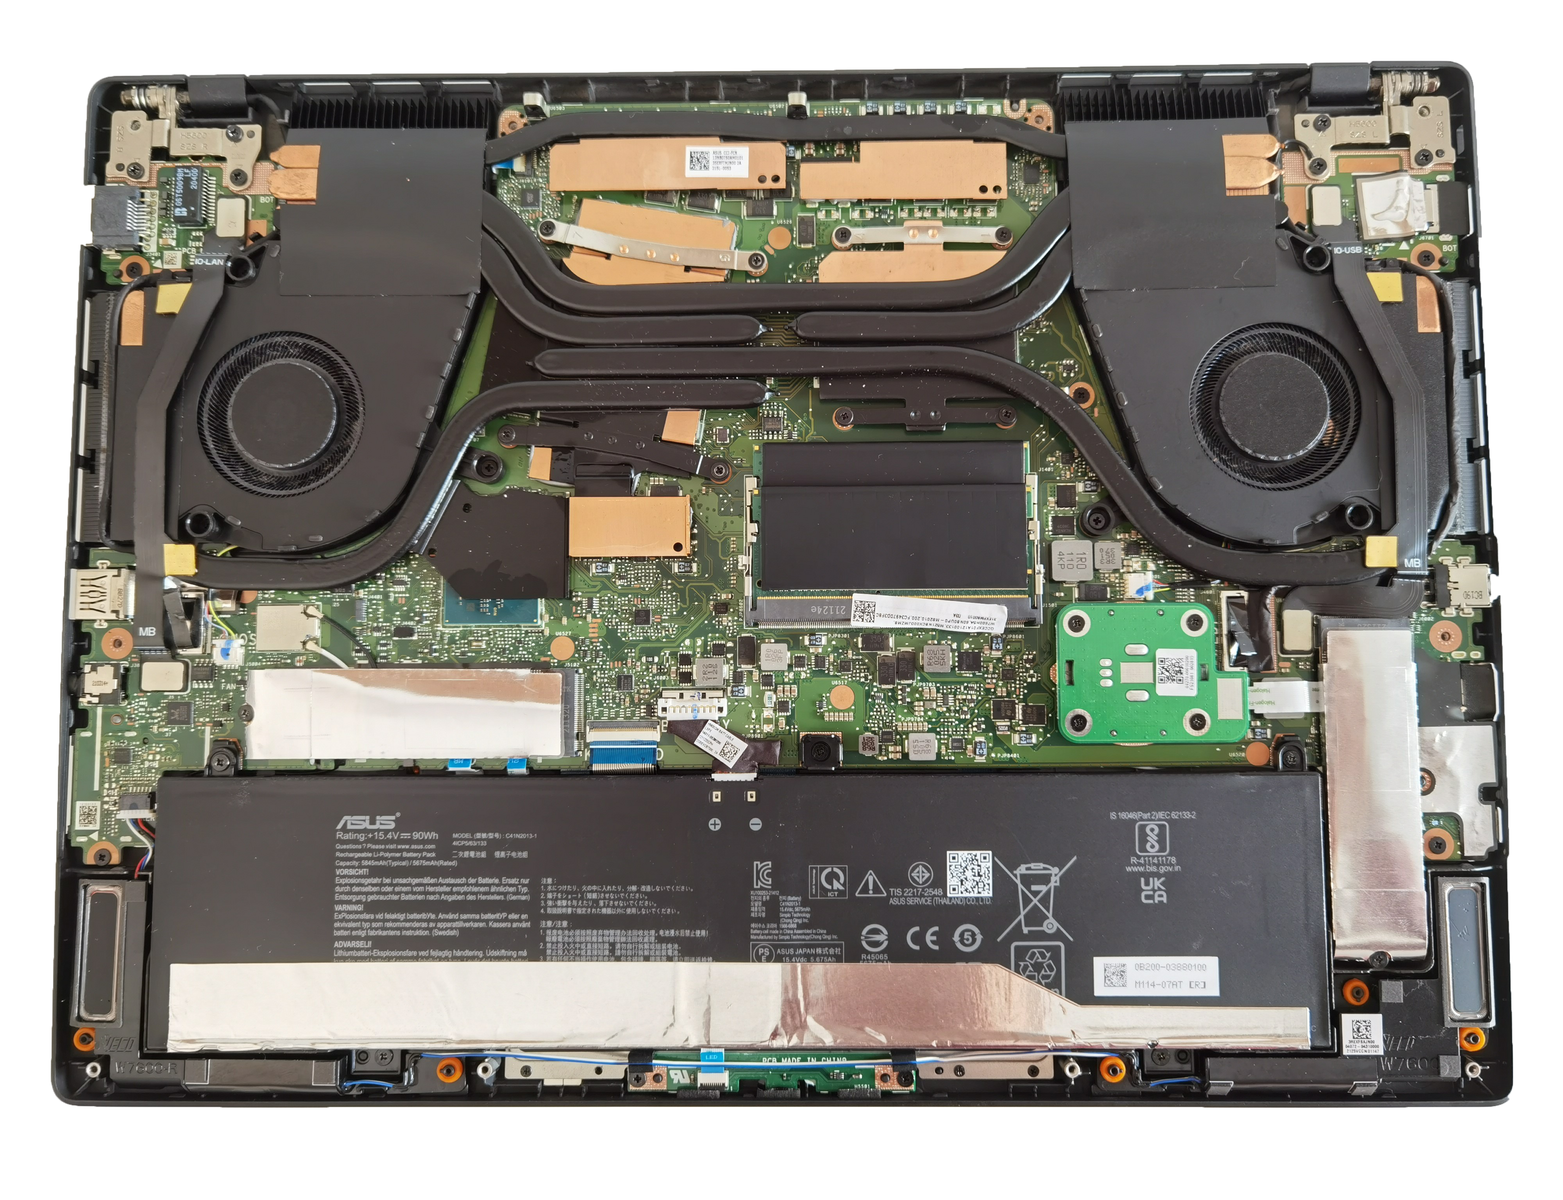
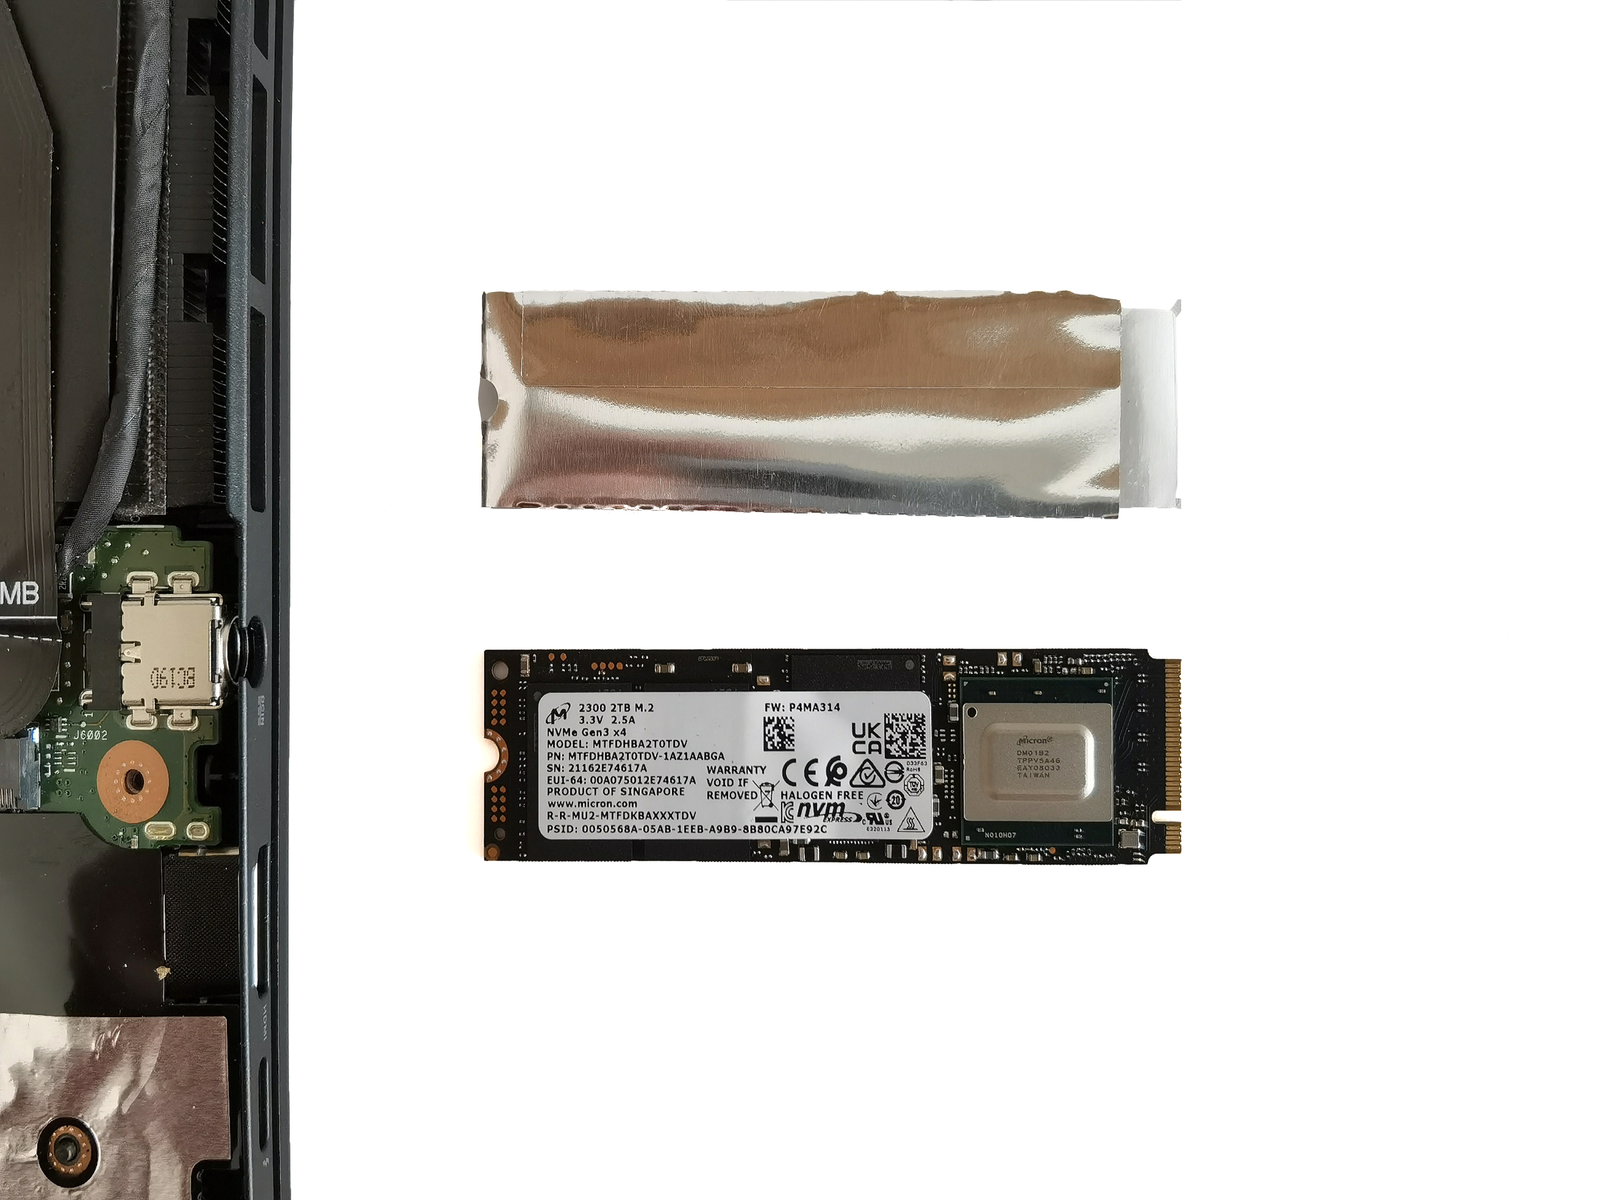
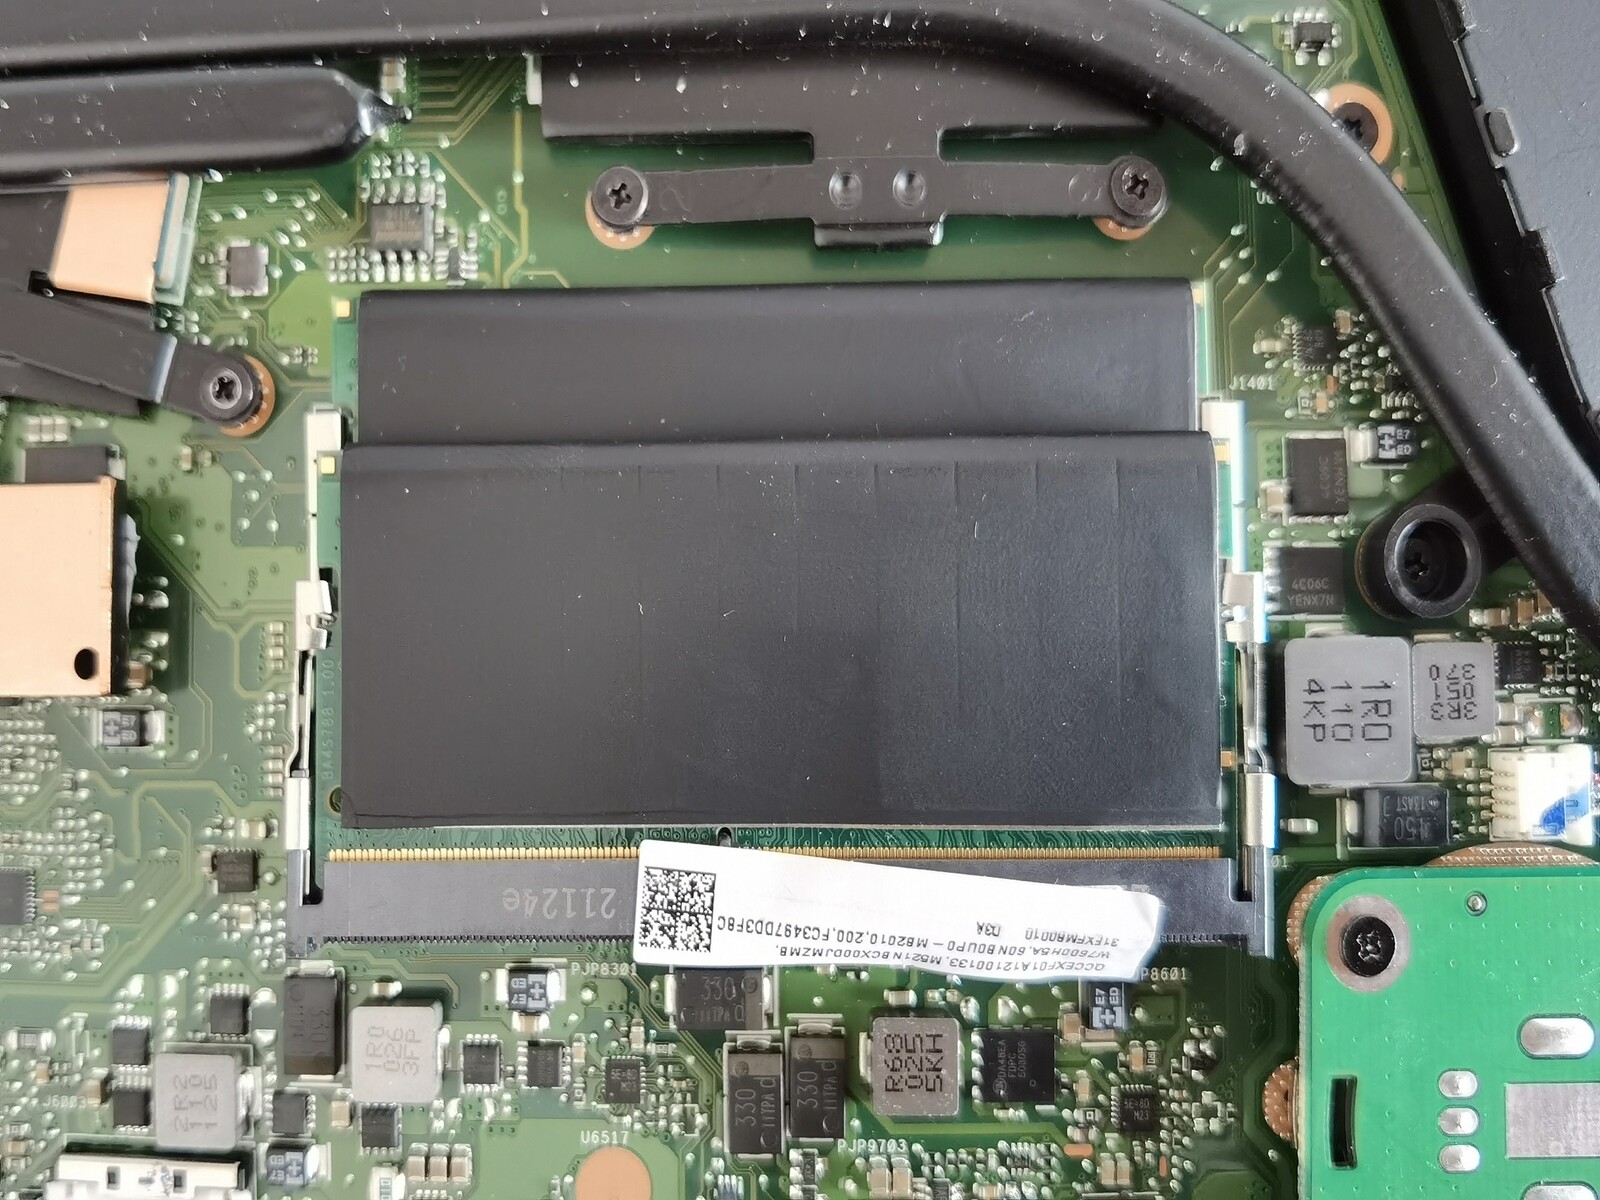
La placa base se puede retirar fácilmente aflojando diez tornillos en cruz. Dentro, los usuarios tendrán acceso directo a las ranuras de RAM y SSD, que están totalmente ocupadas en nuestra unidad de pruebas. En consecuencia, los ventiladores también pueden limpiarse de este modo. Cabe mencionar que el circuito de refrigeración también cubre el chipset e incluso la RAM y los SSD tienen refrigeración pasiva. Para estos últimos, hay almohadillas de conducción de calor adicionales en la placa base
Dispositivos de entrada: Trabajo profesional con Asus Dial
Teclado
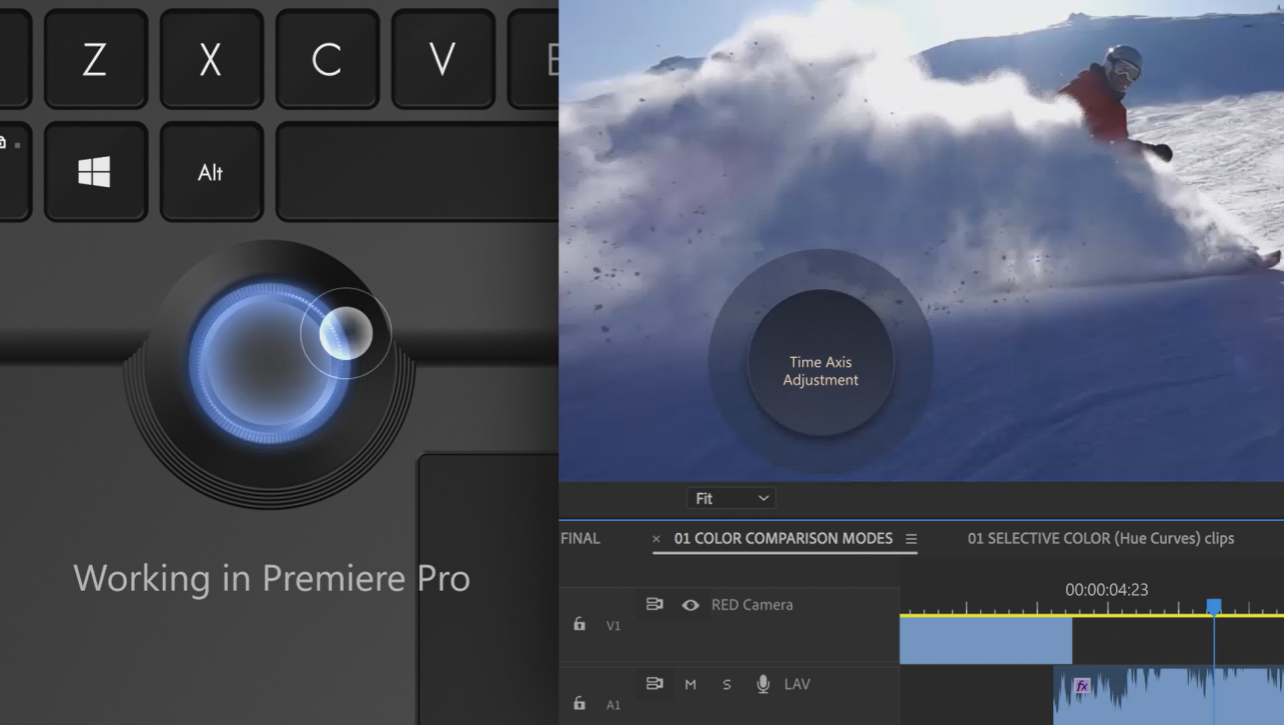
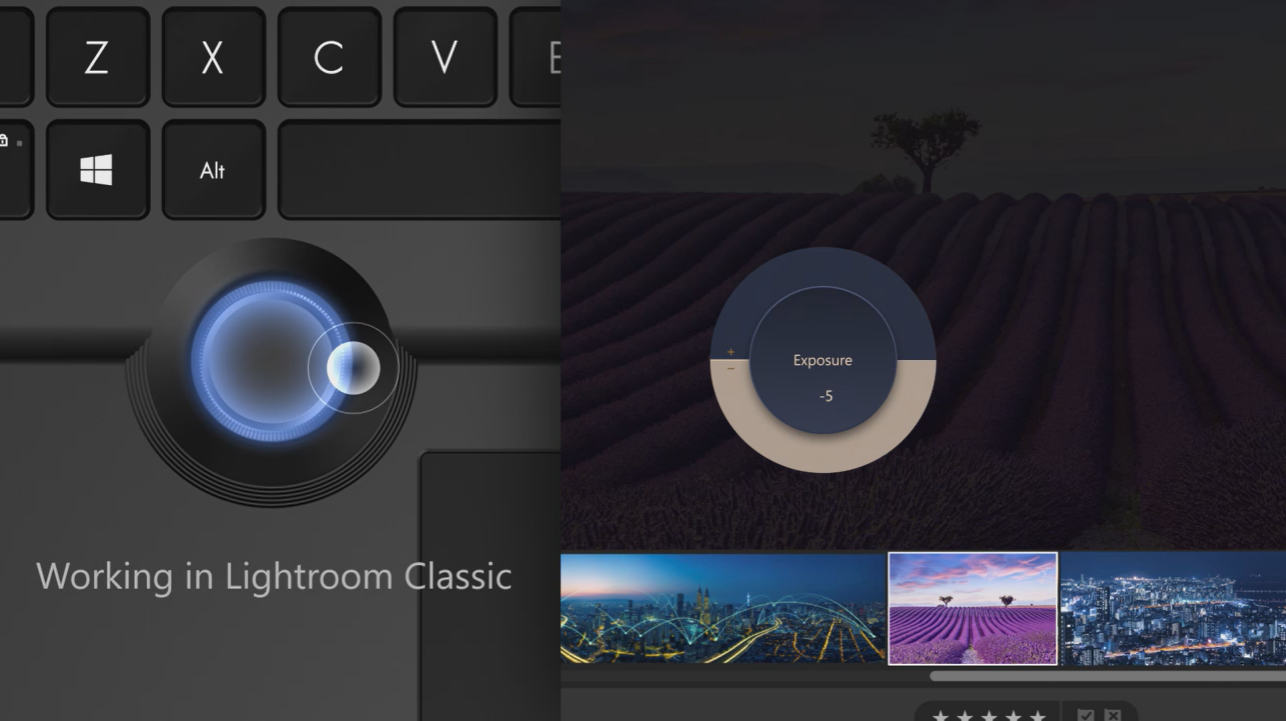
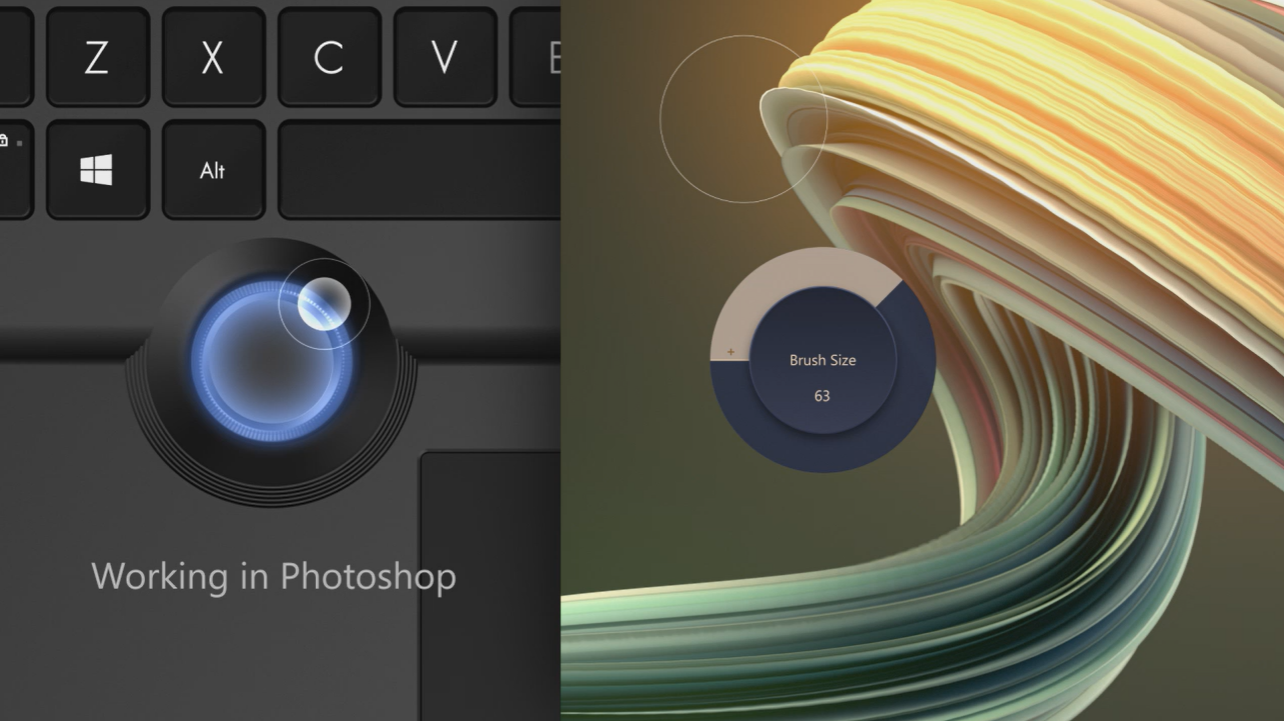
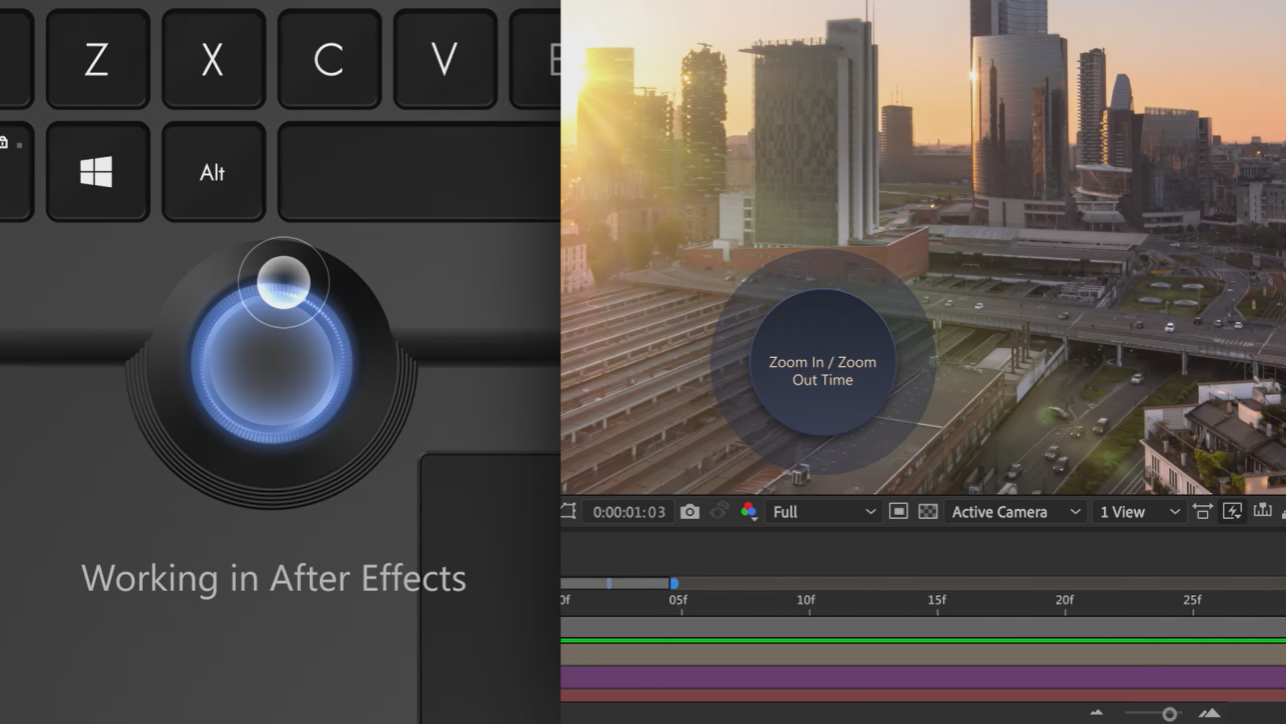
El teclado del Asus ProArt Studiobook 16 se caracteriza por un buen punto de presión. Las teclas tienen un tamaño normal y se sienten muy cómodas al teclear a pesar de la superficie rugosa. El traqueteo de las teclas es bastante discreto y no se percibe como molesto. La iluminación del teclado se puede ajustar en tres niveles. Además, está el Asus Dial Controller: gracias a los bordes ergonómicos del mando redondo, se pueden realizar ajustes de forma muy precisa y también muy silenciosa. Por ejemplo, se puede controlar intuitivamente el pincel en Photoshop o cambiar fácilmente la capa a través del dial. Hacer zoom, navegar o ajustar el balance de color o el tono debería ser fácil con el controlador de dial. Nuestra galería de imágenes muestra algunos ejemplos de uso del Dial Controller
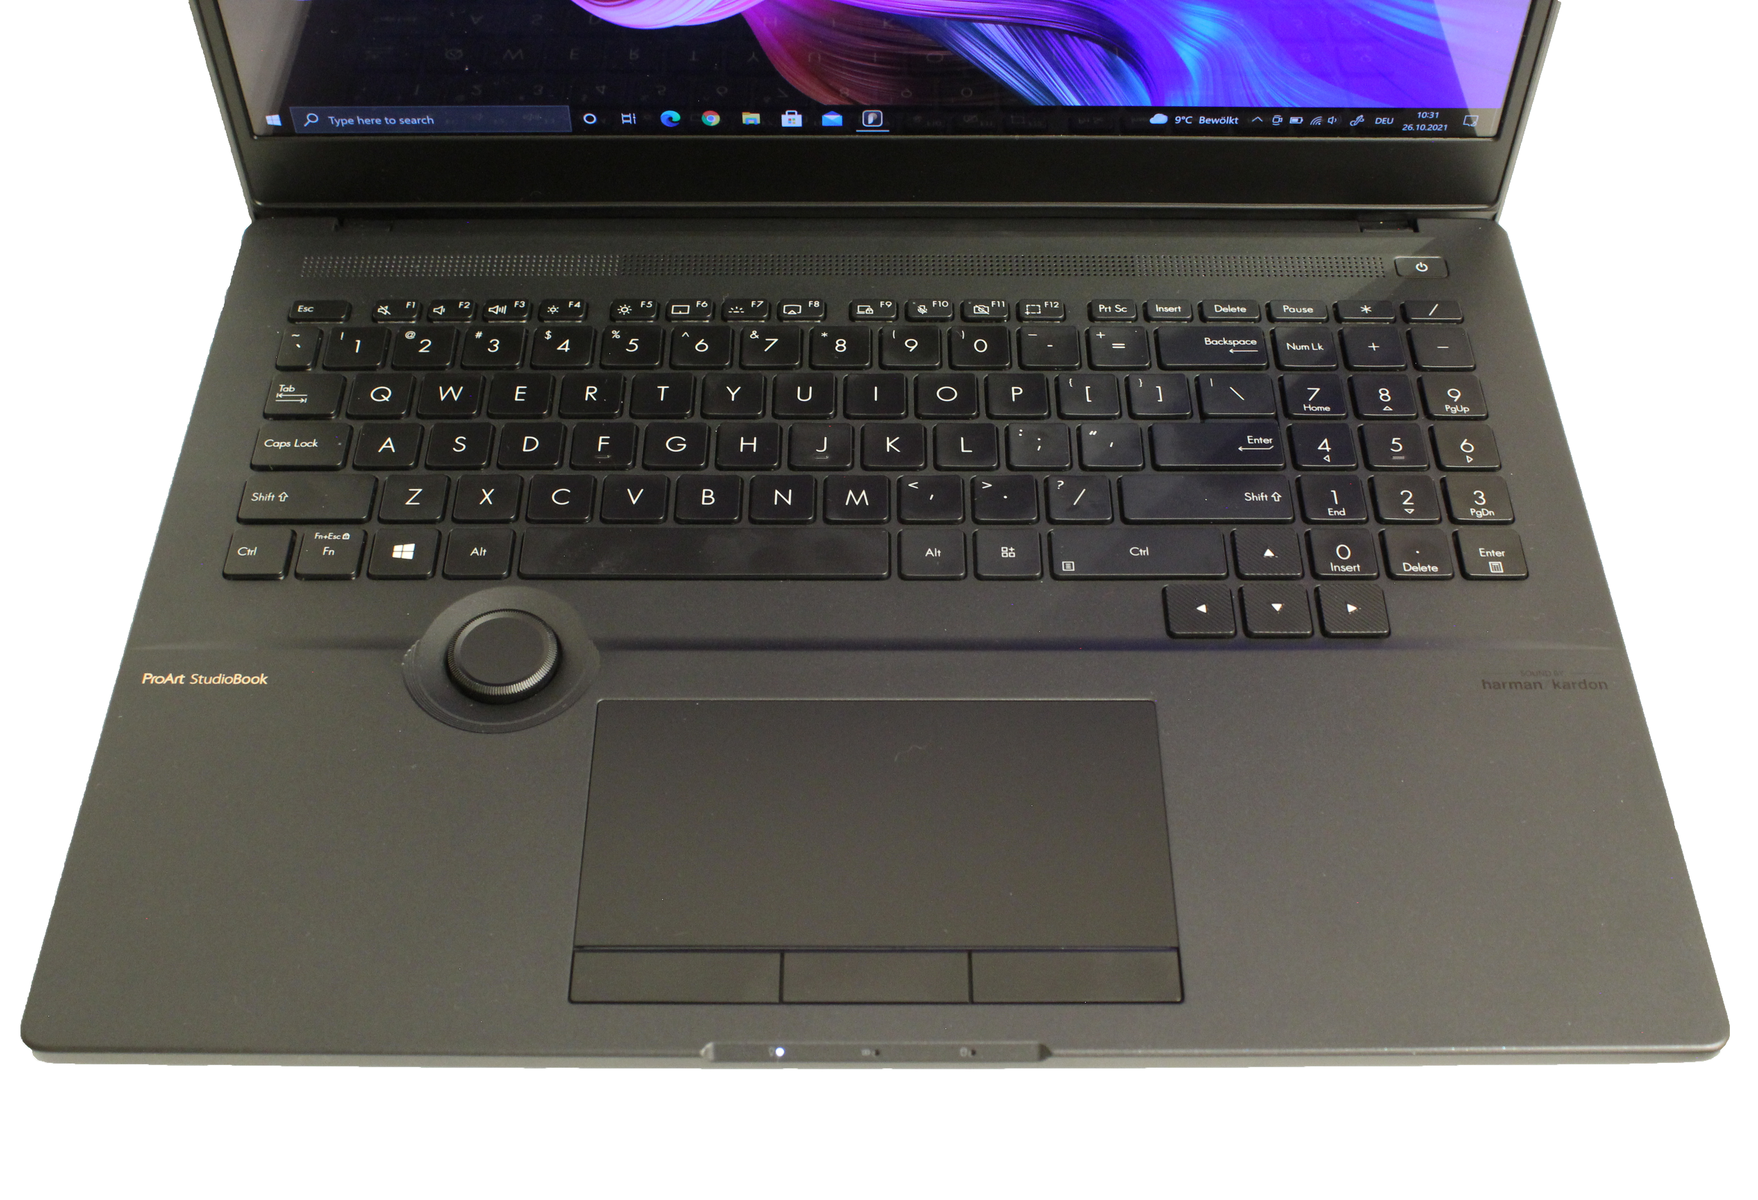
Panel táctil
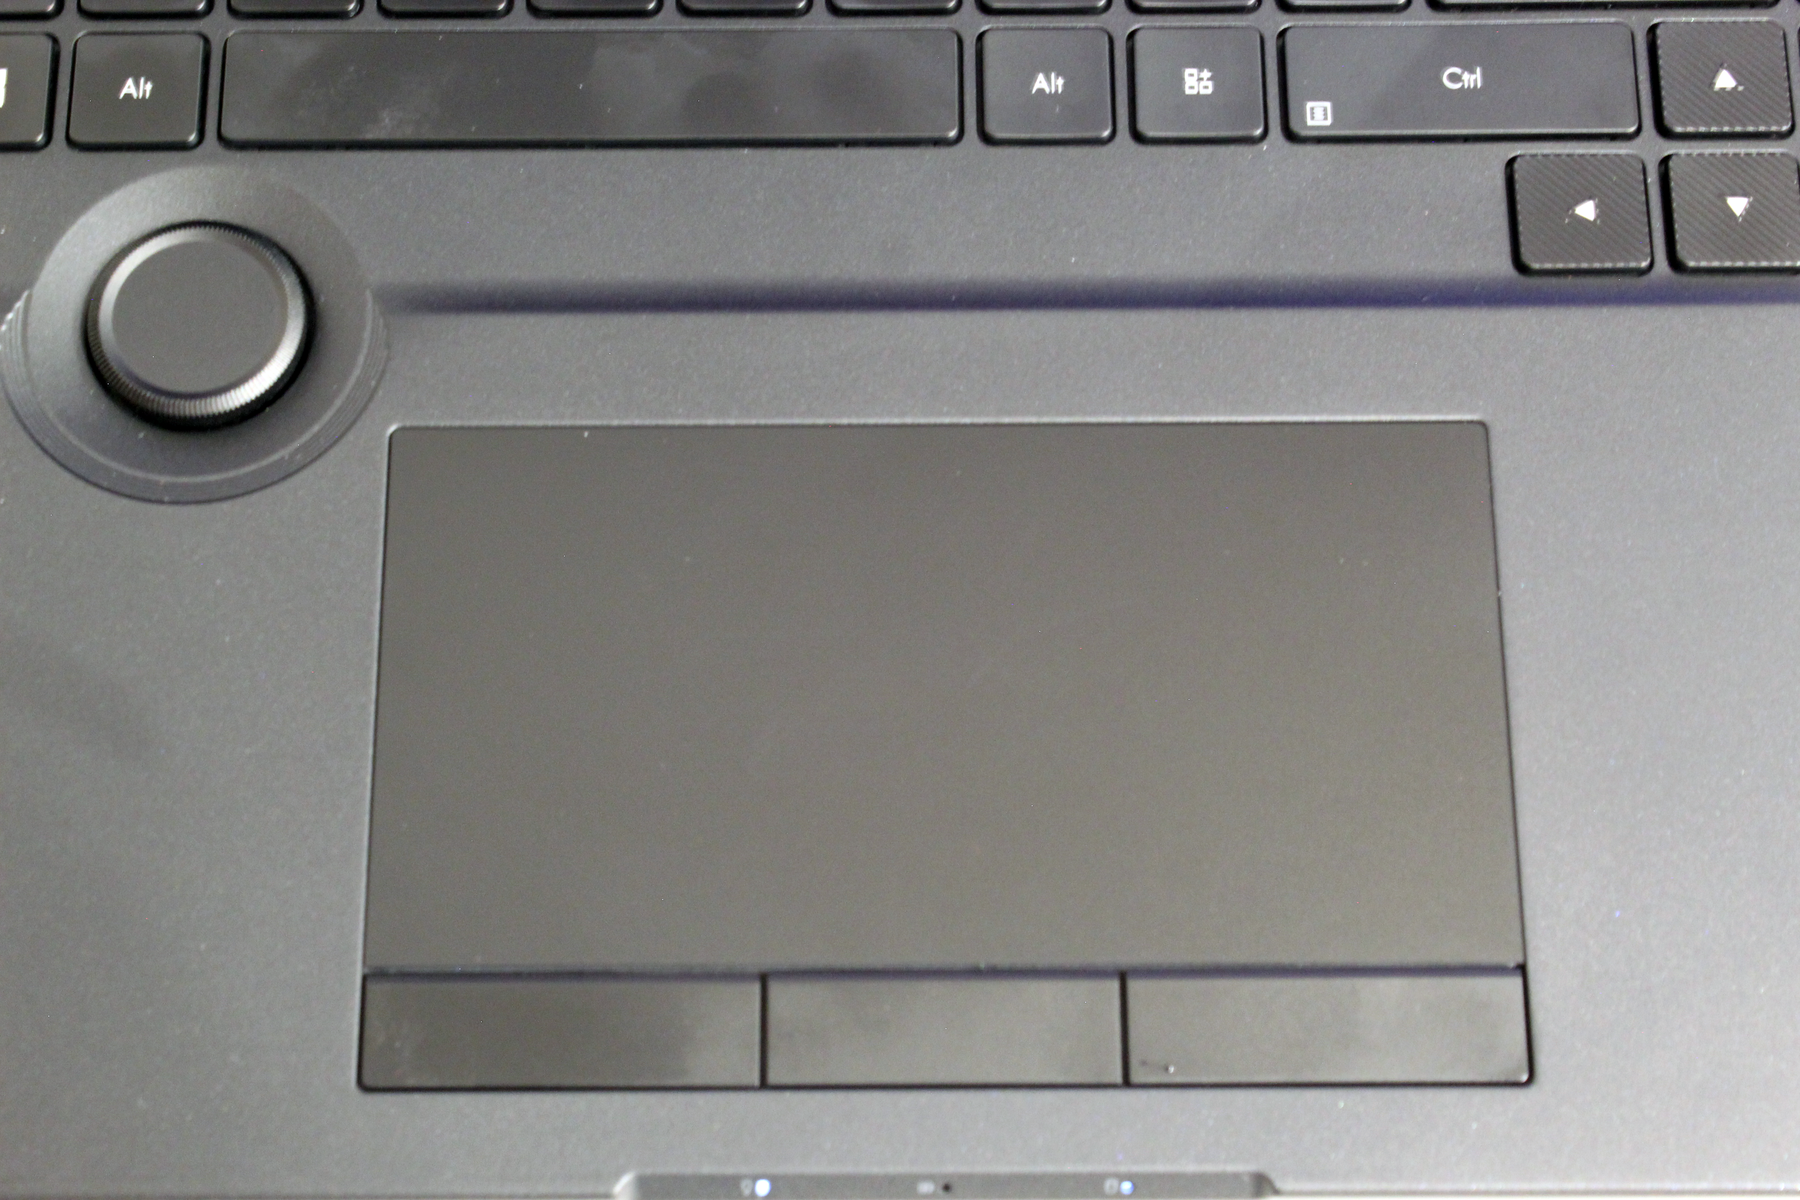
El touchpad de nuestra muestra de preproducción ofrece al usuario una gran superficie así como muy buenas propiedades de deslizamiento. Asimismo, las funciones multitáctiles, como el desplazamiento o el cambio de pestañas, funcionan aquí sin problemas. El touchpad especial de 3 botones es adecuado para los diseñadores de 3D que necesitan un control centrado para las funciones de la aplicación, como el desplazamiento, la rotación o los círculos. Combinadas con el Asus Dial, estas dos características son un verdadero equipo de ensueño para los profesionales creativos.
Pantalla: Primer panel OLED HDR 4K del mundo en formato 16:10

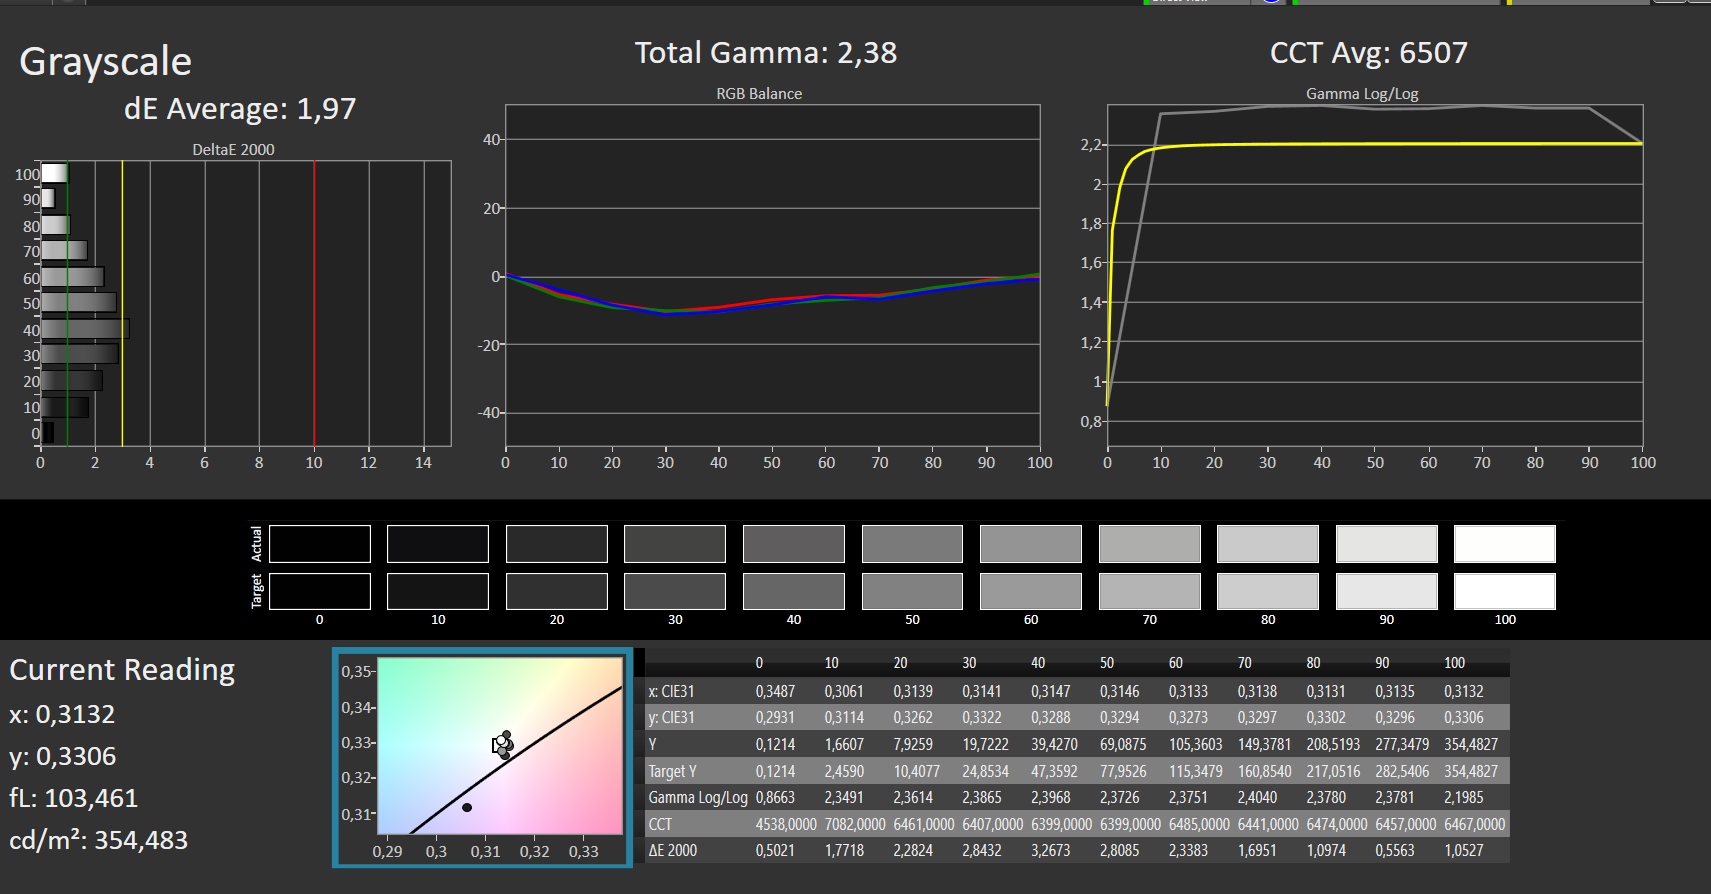
Nuestro modelo de pruebas tiene un panel OLED HDR 4K con una diagonal de pantalla de 16 pulgadas y una relación de aspecto de 16:10. Causa una buena impresión a primera vista y ofrece las ventajas típicas de los paneles OLED. Además, tiene una muy buena calibración de fábrica gracias a la certificación Pantone y, por tanto, es perfectamente adecuado para la edición de imágenes y vídeos. La iluminación del 96 por ciento es muy buena, sólo el brillo máximo podría ser mejor. Aparte de eso, pudimos detectar PWM con atenuación de CC a una frecuencia de 240 Hz a partir de un nivel de brillo del 80 por ciento e inferior en la prueba. La competencia también puede ganar algunos puntos: por ejemplo, El HP ZBook Fury está equipado con una pantalla no reflectante de 120 Hz y un panel mucho más brillante. Sin embargo, también tiene algunos inconvenientes, como una impresión de imagen granulada, más halos y un calibrado más pobre
Como nuestro ejemplar de preproducción tiene un panel OLED, no hay sangrado de pantalla
| |||||||||||||||||||||||||
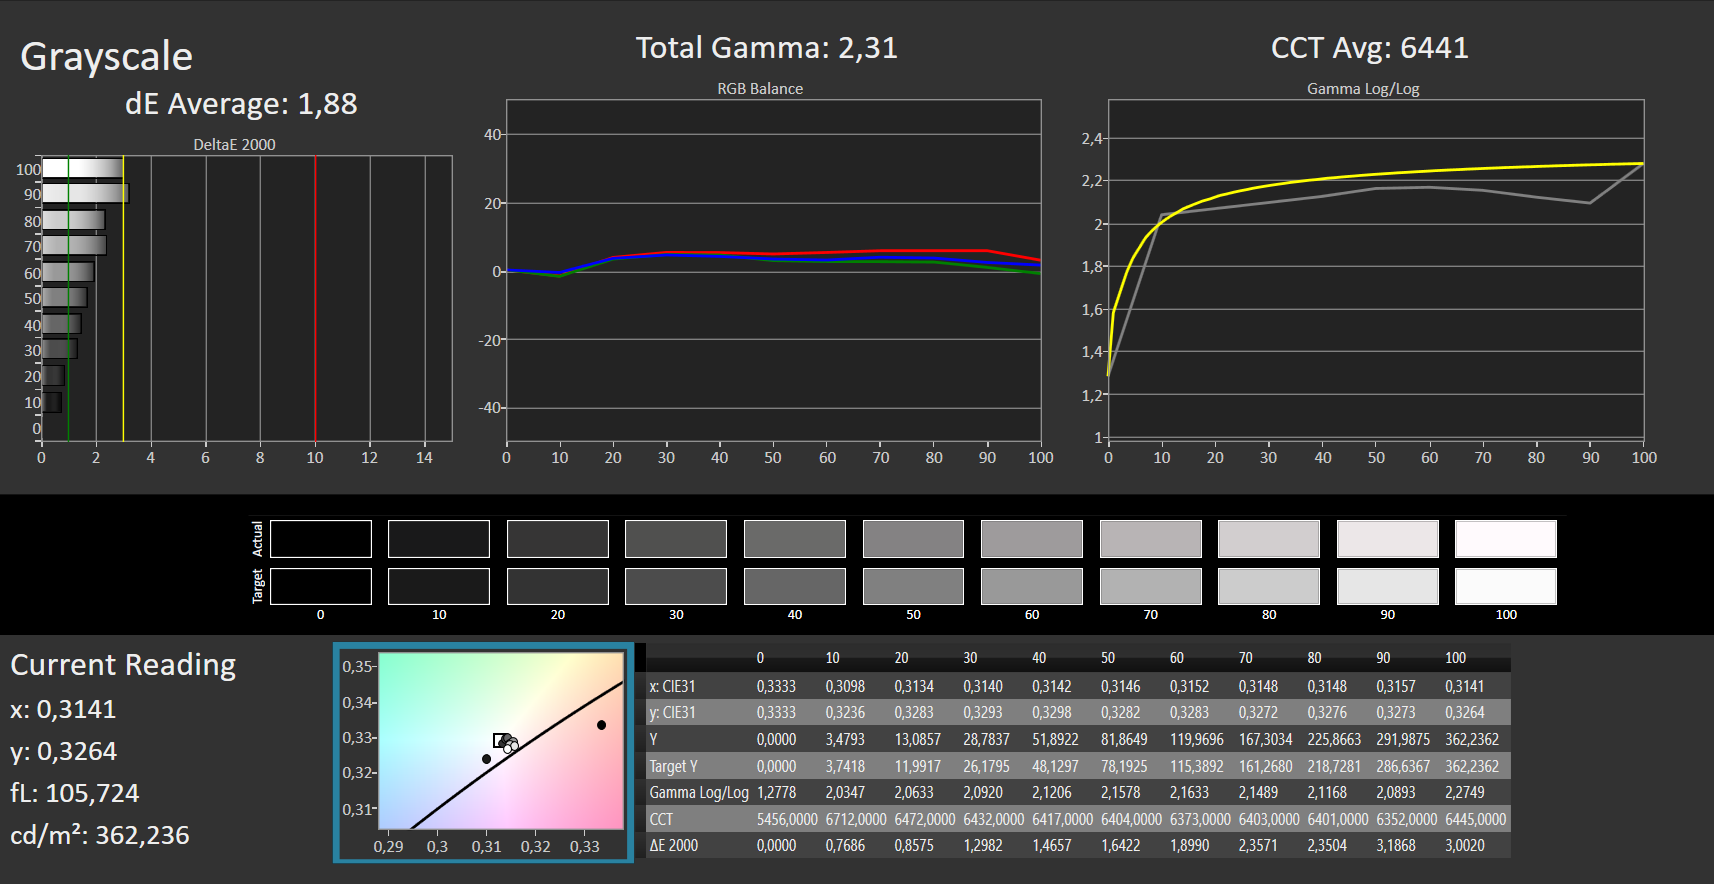
iluminación: 96 %
Brillo con batería: 354 cd/m²
Contraste: ∞:1 (Negro: 0 cd/m²)
ΔE ColorChecker Calman: 2.45 | ∀{0.5-29.43 Ø4.71}
calibrated: 2.77
ΔE Greyscale Calman: 1.88 | ∀{0.09-98 Ø4.96}
98.6% AdobeRGB 1998 (Argyll 3D)
100% sRGB (Argyll 3D)
99.9% Display P3 (Argyll 3D)
Gamma: 2.31
CCT: 6441 K
| Asus ProArt StudioBook 16 W7600H5A-2BL2 ATNA60YV02-0, OLED, 3840x2400, 16" | HP ZBook Fury 15 G8 BOE0969, IPS, 3840x2160, 15.6" | HP ZBook Studio 15 G8 SDC4145, OLED, 3840x2160, 15.6" | Dell Precision 5000 5560 Sharp LQ156R1, IPS, 3840x2400, 15.6" | |
|---|---|---|---|---|
| Display | -5% | -1% | -1% | |
| Display P3 Coverage (%) | 99.9 | 95.9 -4% | 99.9 0% | 94.9 -5% |
| sRGB Coverage (%) | 100 | 100 0% | 100 0% | 100 0% |
| AdobeRGB 1998 Coverage (%) | 98.6 | 87.3 -11% | 95.3 -3% | 100 1% |
| Response Times | -545% | -20% | -1840% | |
| Response Time Grey 50% / Grey 80% * (ms) | 2 ? | 14.8 ? -640% | 2.4 ? -20% | 47.2 ? -2260% |
| Response Time Black / White * (ms) | 2 ? | 11 ? -450% | 2.4 ? -20% | 30.4 ? -1420% |
| PWM Frequency (Hz) | 240 ? | 240.4 ? | ||
| Screen | -40% | -36% | -24% | |
| Brightness middle (cd/m²) | 353 | 626 77% | 379.6 8% | 501.5 42% |
| Brightness (cd/m²) | 360 | 589 64% | 380 6% | 467 30% |
| Brightness Distribution (%) | 96 | 87 -9% | 95 -1% | 83 -14% |
| Black Level * (cd/m²) | 0.58 | 0.44 | ||
| Colorchecker dE 2000 * | 2.45 | 5.41 -121% | 5.15 -110% | 4.73 -93% |
| Colorchecker dE 2000 max. * | 3.75 | 9.05 -141% | 7.79 -108% | 8.45 -125% |
| Colorchecker dE 2000 calibrated * | 2.77 | 0.6 78% | 3.1 -12% | 0.51 82% |
| Greyscale dE 2000 * | 1.88 | 6.2 -230% | 2.6 -38% | 3.6 -91% |
| Gamma | 2.31 95% | 2.66 83% | 1.99 111% | 2.08 106% |
| CCT | 6441 101% | 6101 107% | 6166 105% | 6447 101% |
| Contrast (:1) | 1079 | 1140 | ||
| Media total (Programa/Opciones) | -197% /
-116% | -19% /
-25% | -622% /
-321% |
* ... más pequeño es mejor
Gracias a la pantalla 4K OLED HDR, nuestra muestra de preproducción ofrece un contraste extremadamente alto y unos negros ricos y profundos. El panel cubre completamente los espacios de color DCI-P3 y sRGB y también ofrece muy buenos valores en el espacio de color AdobeRGB 1998 con un 98,6%. Además, la nitidez de la imagen es muy alta y ofrece una imagen muy buena, lo que significa que la pantalla cumple los requisitos para la edición de gráficos profesionales


Nuestra muestra de prueba de preproducción sólo es adecuada para el uso en exteriores de forma limitada. Con un brillo de 350 cd/m² y la pantalla brillante, ya tiene una visión pobre incluso en la sombra. Entre la competenciaEl HP ZBook Fury puede hacerlo mejor gracias al panel IPS instalado con un brillo de más de 600 cd/m².
Tiempos de respuesta del display
| ↔ Tiempo de respuesta de Negro a Blanco | ||
|---|---|---|
| 2 ms ... subida ↗ y bajada ↘ combinada | ↗ 1 ms subida |  |
| ↘ 1 ms bajada | ||
| La pantalla mostró tiempos de respuesta muy rápidos en nuestros tests y debería ser adecuada para juegos frenéticos. En comparación, todos los dispositivos de prueba van de ##min### (mínimo) a 240 (máximo) ms. » 11 % de todos los dispositivos son mejores. Esto quiere decir que el tiempo de respuesta medido es mejor que la media (19.8 ms) de todos los dispositivos testados. | ||
| ↔ Tiempo de respuesta 50% Gris a 80% Gris | ||
| 2 ms ... subida ↗ y bajada ↘ combinada | ↗ 1 ms subida |  |
| ↘ 1 ms bajada | ||
| La pantalla mostró tiempos de respuesta muy rápidos en nuestros tests y debería ser adecuada para juegos frenéticos. En comparación, todos los dispositivos de prueba van de ##min### (mínimo) a 636 (máximo) ms. » 10 % de todos los dispositivos son mejores. Esto quiere decir que el tiempo de respuesta medido es mejor que la media (31 ms) de todos los dispositivos testados. | ||
Parpadeo de Pantalla / PWM (Pulse-Width Modulation)
| Parpadeo de Pantalla / PWM detectado | 240 Hz | ≤ 80 % de brillo |  |
La retroiluminación del display parpadea a 240 Hz (seguramente usa PWM - Pulse-Width Modulation) a un brillo del 80 % e inferior. Sobre este nivel de brillo no debería darse parpadeo / PWM. La frecuencia de 240 Hz es relativamente baja, por lo que la gente sensible debería ver parpadeos y padecer fatiga visual por la pantalla (usado al brillo indicado a continuación). Comparación: 52 % de todos los dispositivos testados no usaron PWM para atenuar el display. Si se usó, medimos una media de 7754 (mínimo: 5 - máxmo: 343500) Hz. | |||
Gracias al panel OLED HDR incorporado, los ángulos de visión del Asus ProArt Studiobook Pro 16 OLED son estables incluso en ángulos muy oblicuos.
Rendimiento: Rendimiento de clase superior con refrigeración sofisticada
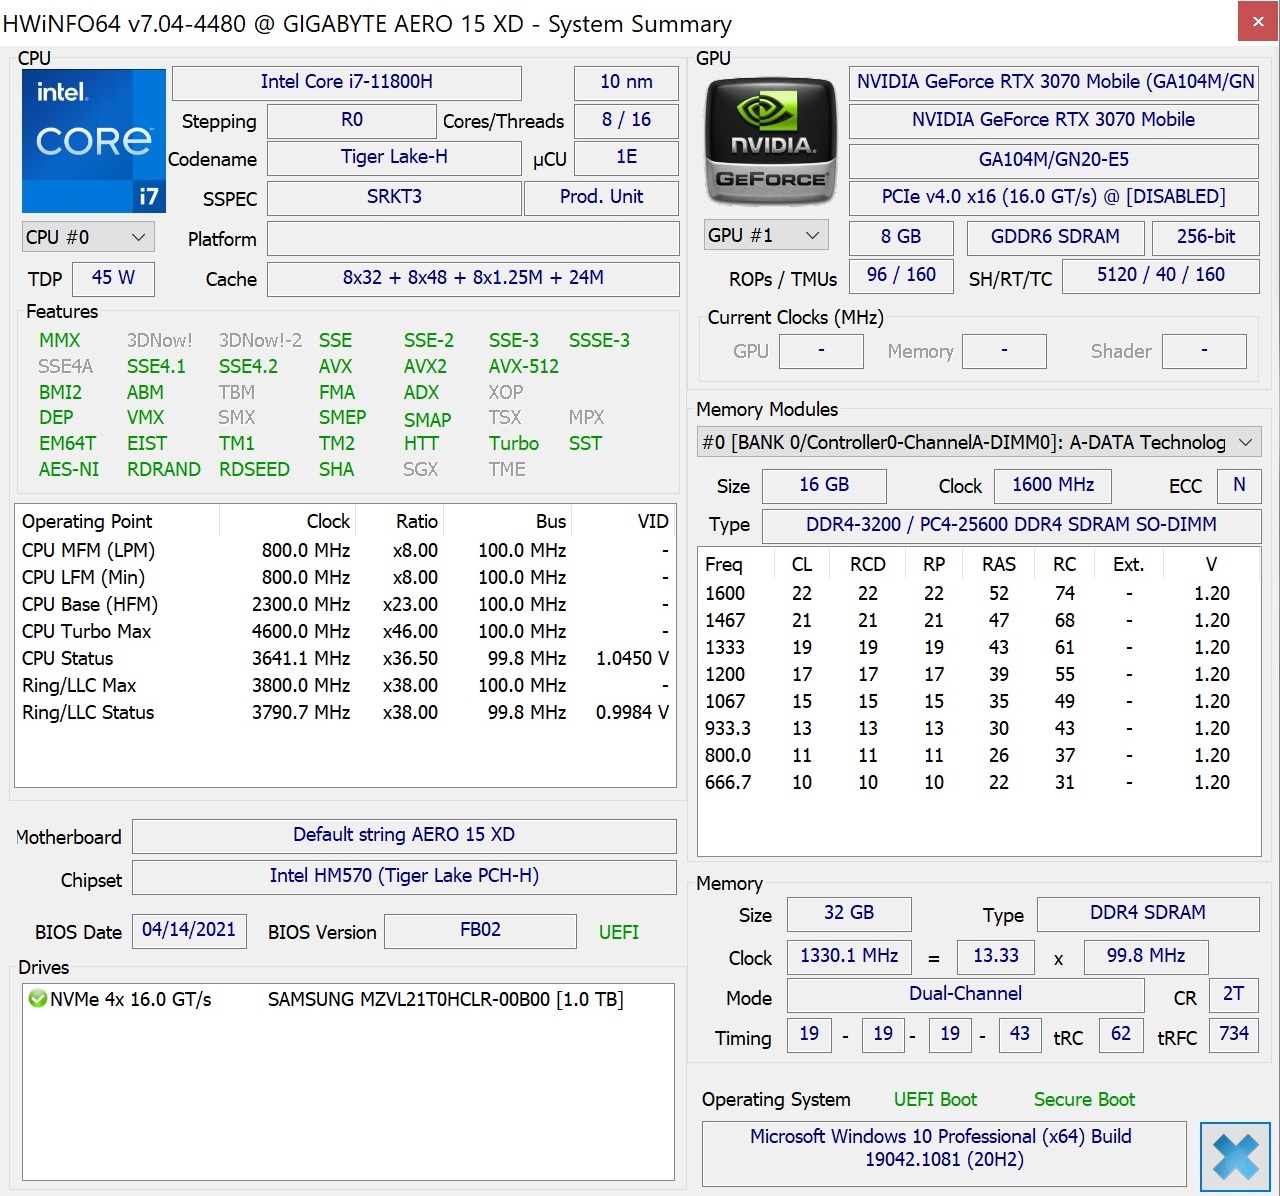
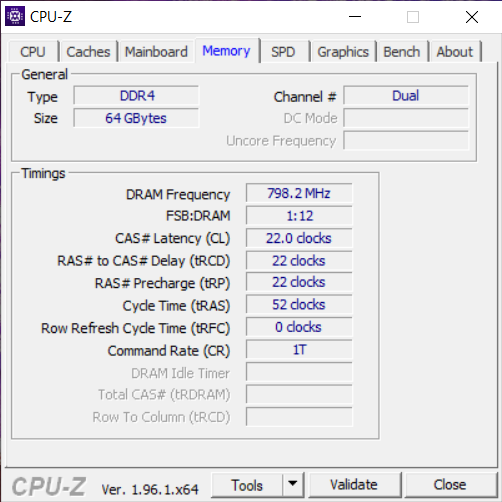
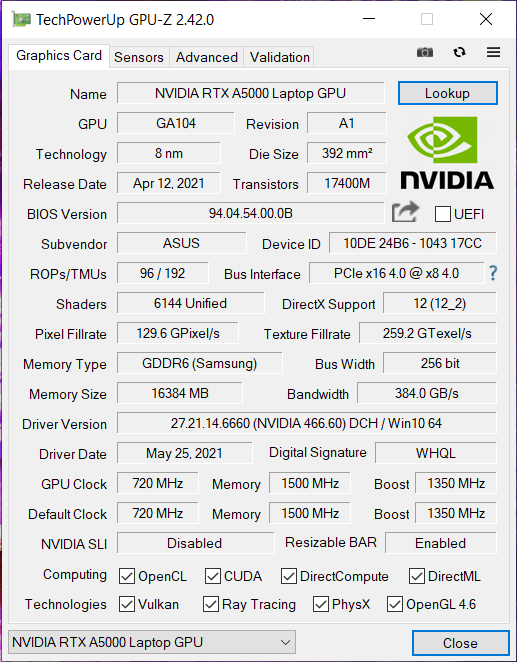
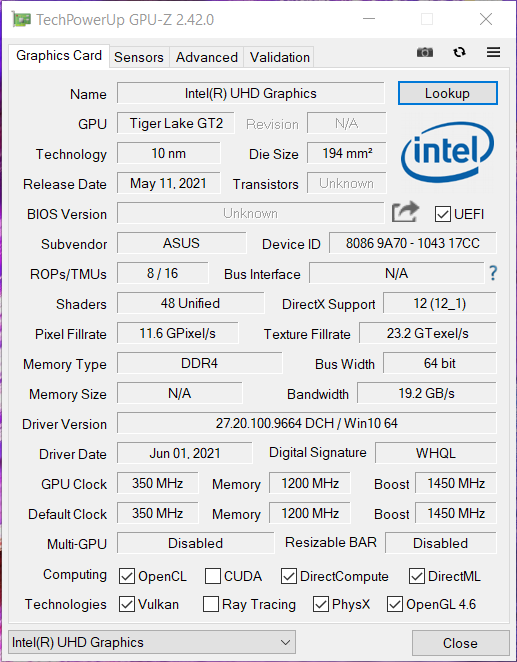
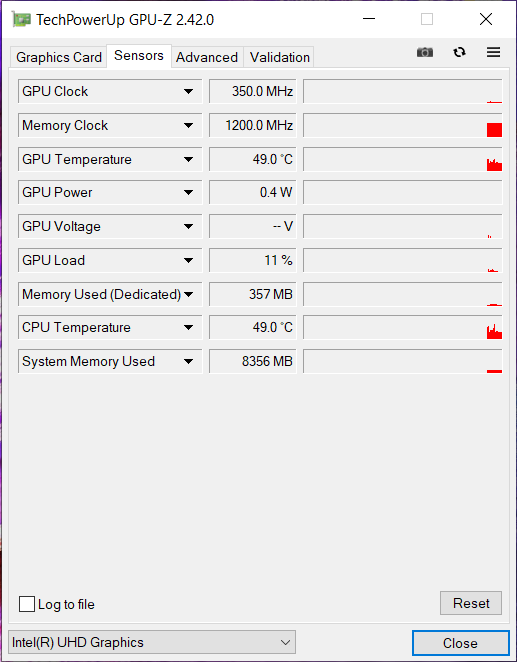
Asus no hace concesiones y apuesta por los últimos y más potentes componentes que Intel y Nvidia ofrecen actualmente para las estaciones de trabajo. Por lo tanto, un Intel Xeon W-11955 está trabajando en su interior en combinación con 64 GB de RAM DDR4 y una matriz de SSD NVMe Raid 0 de 2 TB. La carga gráfica se distribuye entreNvidia RTX A5000 y la Intel UHD Graphics basada en la arquitectura XE. La memoria de trabajo instalada en nuestro dispositivo es una memoria RAM ECC que funciona a 3200 MHz. Por desgracia, las ranuras SSD sólo admiten SSDs NVMe que usan PCIe Gen.3. A la vista del resto de la configuración, PCIe Gen.4 podría haber sido más apropiado. Es cuestionable si habrá otras configuraciones disponibles, pero eso está por ver
Procesador
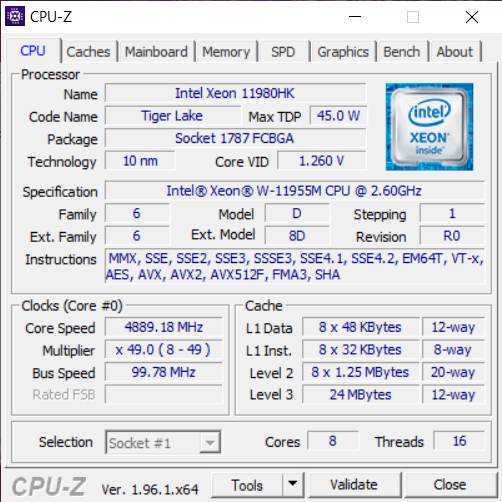
Hablemos ahora de la CPU octa-core Tiger-Lake, que fue presentada en el segundo trimestre de 2021. El Intel Xeon W11955Mque está diseñado para estaciones de trabajo móviles, está fabricado en el nuevo proceso SuperFin de 10 nm y, en comparación con el Intel Core i9-11950H ofrece además soporte para memoria ECC. El chip tiene un TDP de 45 vatios, que sin embargo se configuró más alto en nuestra muestra de prueba y aumenta a un permanente 54 vatios dependiendo del escenario de aplicación. Los núcleos del procesador pueden funcionar a una frecuencia de entre 2,6 y 5 GHz y son compatibles con la memoria DDR4-3200
En nuestro test de resistencia Cinebench Multi, el rendimiento está en el nivel esperado y supera fácilmente al HP ZBook Fury's Intel Core i9-11950H instalado. Por un lado, esto también se debe al sistema de refrigeración instalado, que también está diseñado para un TDP combinado de 140W. Probamos el dispositivo en el modo de rendimiento, que está disponible en Asus ProArt Creator Hub y adapta dinámicamente la refrigeración a las tareas requeridas. Para las tareas cotidianas está el modo estándar, y la app también permite poner los ventiladores a máxima velocidad. Sin embargo, esto no representó mucho valor añadido en las pruebas, aparte de la necesidad de llevar los auriculares cuando los ventiladores funcionan a 5.600 RPM permanentemente. En el modo de batería, el sistema reduce la velocidad de nuestro dispositivo de 54 a 15 vatios, lo que también se nota en el rendimiento. Se pueden encontrar más detalles sobre el procesador en nuestra Sección de la CPU
Cinebench R15 Multi endurance test
Cinebench R20: CPU (Multi Core) | CPU (Single Core)
Cinebench R15: CPU Multi 64Bit | CPU Single 64Bit
Blender: v2.79 BMW27 CPU
7-Zip 18.03: 7z b 4 | 7z b 4 -mmt1
Geekbench 5.5: Multi-Core | Single-Core
HWBOT x265 Benchmark v2.2: 4k Preset
LibreOffice : 20 Documents To PDF
R Benchmark 2.5: Overall mean
SPECviewperf 2020: 1920x1080 Solidworks (solidworks-05) | 1920x1080 Siemens NX (snx-04) | 1920x1080 Medical (medical-03) | 1920x1080 Maya (maya-06) | 1920x1080 Energy (energy-03) | 1920x1080 Creo (creo-03) | 1920x1080 CATIA (catia-06) | 1920x1080 3ds Max (3dsmax-07) | 3840x2160 Solidworks (solidworks-05) | 3840x2160 Siemens NX (snx-04) | 3840x2160 Medical (medical-03) | 3840x2160 Maya (maya-06) | 3840x2160 Energy (energy-03) | 3840x2160 Creo (creo-03) | 3840x2160 CATIA (catia-06) | 3840x2160 3ds Max (3dsmax-07)
| Cinebench R23 / Multi Core | |
| Media de la clase Workstation (14621 - 38520, n=23, últimos 2 años) | |
| Schenker XMG Ultra 17 Rocket Lake | |
| MSI GS76 Stealth 11UH | |
| HP ZBook Fury 15 G8 | |
| HP ZBook Studio 15 G8 | |
| Medio Intel Xeon W-11955M (10862 - 12412, n=2) | |
| Asus ProArt StudioBook 16 W7600H5A-2BL2 | |
| Dell Precision 5000 5560 | |
| Cinebench R23 / Single Core | |
| Media de la clase Workstation (1712 - 2228, n=23, últimos 2 años) | |
| Schenker XMG Ultra 17 Rocket Lake | |
| HP ZBook Fury 15 G8 | |
| MSI GS76 Stealth 11UH | |
| HP ZBook Studio 15 G8 | |
| Medio Intel Xeon W-11955M (1480 - 1621, n=2) | |
| Dell Precision 5000 5560 | |
| Asus ProArt StudioBook 16 W7600H5A-2BL2 | |
| Cinebench R20 / CPU (Multi Core) | |
| Media de la clase Workstation (5760 - 15043, n=23, últimos 2 años) | |
| Schenker XMG Ultra 17 Rocket Lake | |
| MSI GS76 Stealth 11UH | |
| HP ZBook Fury 15 G8 | |
| HP ZBook Studio 15 G8 | |
| Asus ProArt StudioBook 16 W7600H5A-2BL2 | |
| Medio Intel Xeon W-11955M (n=1) | |
| Dell Precision 5000 5560 | |
| Cinebench R20 / CPU (Single Core) | |
| Media de la clase Workstation (671 - 857, n=23, últimos 2 años) | |
| Schenker XMG Ultra 17 Rocket Lake | |
| HP ZBook Fury 15 G8 | |
| HP ZBook Studio 15 G8 | |
| MSI GS76 Stealth 11UH | |
| Dell Precision 5000 5560 | |
| Asus ProArt StudioBook 16 W7600H5A-2BL2 | |
| Medio Intel Xeon W-11955M (n=1) | |
| Cinebench R15 / CPU Multi 64Bit | |
| Media de la clase Workstation (2489 - 5810, n=23, últimos 2 años) | |
| Schenker XMG Ultra 17 Rocket Lake | |
| MSI GS76 Stealth 11UH | |
| Asus ProArt StudioBook 16 W7600H5A-2BL2 | |
| Medio Intel Xeon W-11955M (n=1) | |
| HP ZBook Studio 15 G8 | |
| HP ZBook Fury 15 G8 | |
| Dell Precision 5000 5560 | |
| Cinebench R15 / CPU Single 64Bit | |
| Media de la clase Workstation (191.4 - 328, n=23, últimos 2 años) | |
| Schenker XMG Ultra 17 Rocket Lake | |
| HP ZBook Fury 15 G8 | |
| MSI GS76 Stealth 11UH | |
| HP ZBook Studio 15 G8 | |
| Dell Precision 5000 5560 | |
| Asus ProArt StudioBook 16 W7600H5A-2BL2 | |
| Medio Intel Xeon W-11955M (n=1) | |
| Blender / v2.79 BMW27 CPU | |
| Dell Precision 5000 5560 | |
| Asus ProArt StudioBook 16 W7600H5A-2BL2 | |
| Medio Intel Xeon W-11955M (n=1) | |
| HP ZBook Fury 15 G8 | |
| HP ZBook Studio 15 G8 | |
| MSI GS76 Stealth 11UH | |
| Schenker XMG Ultra 17 Rocket Lake | |
| Media de la clase Workstation (91 - 222, n=23, últimos 2 años) | |
| 7-Zip 18.03 / 7z b 4 | |
| Media de la clase Workstation (60489 - 116969, n=23, últimos 2 años) | |
| Schenker XMG Ultra 17 Rocket Lake | |
| MSI GS76 Stealth 11UH | |
| HP ZBook Fury 15 G8 | |
| HP ZBook Studio 15 G8 | |
| Asus ProArt StudioBook 16 W7600H5A-2BL2 | |
| Medio Intel Xeon W-11955M (n=1) | |
| Dell Precision 5000 5560 | |
| 7-Zip 18.03 / 7z b 4 -mmt1 | |
| Media de la clase Workstation (5126 - 6960, n=23, últimos 2 años) | |
| Schenker XMG Ultra 17 Rocket Lake | |
| HP ZBook Studio 15 G8 | |
| HP ZBook Fury 15 G8 | |
| Dell Precision 5000 5560 | |
| MSI GS76 Stealth 11UH | |
| Asus ProArt StudioBook 16 W7600H5A-2BL2 | |
| Medio Intel Xeon W-11955M (n=1) | |
| Geekbench 5.5 / Multi-Core | |
| Media de la clase Workstation (11542 - 25554, n=23, últimos 2 años) | |
| Schenker XMG Ultra 17 Rocket Lake | |
| MSI GS76 Stealth 11UH | |
| Medio Intel Xeon W-11955M (8349 - 9766, n=2) | |
| Asus ProArt StudioBook 16 W7600H5A-2BL2 | |
| HP ZBook Studio 15 G8 | |
| Geekbench 5.5 / Single-Core | |
| Media de la clase Workstation (1783 - 2183, n=23, últimos 2 años) | |
| Schenker XMG Ultra 17 Rocket Lake | |
| HP ZBook Studio 15 G8 | |
| MSI GS76 Stealth 11UH | |
| Medio Intel Xeon W-11955M (1487 - 1686, n=2) | |
| Asus ProArt StudioBook 16 W7600H5A-2BL2 | |
| HWBOT x265 Benchmark v2.2 / 4k Preset | |
| Media de la clase Workstation (17.8 - 40.5, n=23, últimos 2 años) | |
| Schenker XMG Ultra 17 Rocket Lake | |
| MSI GS76 Stealth 11UH | |
| HP ZBook Studio 15 G8 | |
| HP ZBook Fury 15 G8 | |
| Asus ProArt StudioBook 16 W7600H5A-2BL2 | |
| Medio Intel Xeon W-11955M (n=1) | |
| Dell Precision 5000 5560 | |
| LibreOffice / 20 Documents To PDF | |
| HP ZBook Fury 15 G8 | |
| MSI GS76 Stealth 11UH | |
| HP ZBook Studio 15 G8 | |
| Dell Precision 5000 5560 | |
| Media de la clase Workstation (37.1 - 74.7, n=23, últimos 2 años) | |
| Schenker XMG Ultra 17 Rocket Lake | |
| Asus ProArt StudioBook 16 W7600H5A-2BL2 | |
| Medio Intel Xeon W-11955M (n=1) | |
| R Benchmark 2.5 / Overall mean | |
| Asus ProArt StudioBook 16 W7600H5A-2BL2 | |
| Medio Intel Xeon W-11955M (n=1) | |
| HP ZBook Studio 15 G8 | |
| HP ZBook Fury 15 G8 | |
| Dell Precision 5000 5560 | |
| MSI GS76 Stealth 11UH | |
| Schenker XMG Ultra 17 Rocket Lake | |
| Media de la clase Workstation (0.3825 - 0.603, n=23, últimos 2 años) | |
| SPECviewperf 2020 / Solidworks (solidworks-05) | |
| Asus ProArt StudioBook 16 W7600H5A-2BL2 | |
| Medio Intel Xeon W-11955M (n=1) | |
| Media de la clase Workstation (50.6 - 542, n=9, últimos 2 años) | |
| HP ZBook Fury 15 G8 | |
| Dell Precision 5000 5560 | |
| SPECviewperf 2020 / Siemens NX (snx-04) | |
| Media de la clase Workstation (22.3 - 903, n=23, últimos 2 años) | |
| Asus ProArt StudioBook 16 W7600H5A-2BL2 | |
| Medio Intel Xeon W-11955M (n=1) | |
| HP ZBook Fury 15 G8 | |
| Dell Precision 5000 5560 | |
| SPECviewperf 2020 / Medical (medical-03) | |
| Media de la clase Workstation (28.8 - 227, n=23, últimos 2 años) | |
| Asus ProArt StudioBook 16 W7600H5A-2BL2 | |
| Medio Intel Xeon W-11955M (n=1) | |
| HP ZBook Fury 15 G8 | |
| Dell Precision 5000 5560 | |
| SPECviewperf 2020 / Maya (maya-06) | |
| Media de la clase Workstation (117.8 - 724, n=22, últimos 2 años) | |
| Asus ProArt StudioBook 16 W7600H5A-2BL2 | |
| Medio Intel Xeon W-11955M (n=1) | |
| HP ZBook Fury 15 G8 | |
| Dell Precision 5000 5560 | |
| SPECviewperf 2020 / Energy (energy-03) | |
| Media de la clase Workstation (17.3 - 176.7, n=23, últimos 2 años) | |
| Asus ProArt StudioBook 16 W7600H5A-2BL2 | |
| Medio Intel Xeon W-11955M (n=1) | |
| HP ZBook Fury 15 G8 | |
| Dell Precision 5000 5560 | |
| SPECviewperf 2020 / Creo (creo-03) | |
| Asus ProArt StudioBook 16 W7600H5A-2BL2 | |
| Medio Intel Xeon W-11955M (n=1) | |
| Media de la clase Workstation (49.2 - 261, n=23, últimos 2 años) | |
| HP ZBook Fury 15 G8 | |
| Dell Precision 5000 5560 | |
| SPECviewperf 2020 / CATIA (catia-06) | |
| Asus ProArt StudioBook 16 W7600H5A-2BL2 | |
| Medio Intel Xeon W-11955M (n=1) | |
| HP ZBook Fury 15 G8 | |
| Media de la clase Workstation (27.1 - 182.2, n=23, últimos 2 años) | |
| Dell Precision 5000 5560 | |
| SPECviewperf 2020 / 3ds Max (3dsmax-07) | |
| Asus ProArt StudioBook 16 W7600H5A-2BL2 | |
| Medio Intel Xeon W-11955M (n=1) | |
| Media de la clase Workstation (24.7 - 251, n=23, últimos 2 años) | |
| HP ZBook Fury 15 G8 | |
| Dell Precision 5000 5560 | |
| SPECviewperf 2020 / Solidworks (solidworks-05) | |
| Asus ProArt StudioBook 16 W7600H5A-2BL2 | |
| Medio Intel Xeon W-11955M (n=1) | |
| HP ZBook Fury 15 G8 | |
| Dell Precision 5000 5560 | |
| SPECviewperf 2020 / Siemens NX (snx-04) | |
| Media de la clase Workstation (30.6 - 561, n=11, últimos 2 años) | |
| Asus ProArt StudioBook 16 W7600H5A-2BL2 | |
| Medio Intel Xeon W-11955M (n=1) | |
| HP ZBook Fury 15 G8 | |
| Dell Precision 5000 5560 | |
| SPECviewperf 2020 / Medical (medical-03) | |
| Media de la clase Workstation (20.3 - 96.8, n=12, últimos 2 años) | |
| Medio Intel Xeon W-11955M (n=1) | |
| Asus ProArt StudioBook 16 W7600H5A-2BL2 | |
| HP ZBook Fury 15 G8 | |
| Dell Precision 5000 5560 | |
| SPECviewperf 2020 / Maya (maya-06) | |
| Media de la clase Workstation (132 - 380, n=12, últimos 2 años) | |
| Asus ProArt StudioBook 16 W7600H5A-2BL2 | |
| Medio Intel Xeon W-11955M (n=1) | |
| HP ZBook Fury 15 G8 | |
| Dell Precision 5000 5560 | |
| SPECviewperf 2020 / Energy (energy-03) | |
| Asus ProArt StudioBook 16 W7600H5A-2BL2 | |
| Medio Intel Xeon W-11955M (n=1) | |
| Media de la clase Workstation (15.8 - 74.3, n=12, últimos 2 años) | |
| HP ZBook Fury 15 G8 | |
| Dell Precision 5000 5560 | |
| SPECviewperf 2020 / Creo (creo-03) | |
| Media de la clase Workstation (47.2 - 185.7, n=12, últimos 2 años) | |
| HP ZBook Fury 15 G8 | |
| Asus ProArt StudioBook 16 W7600H5A-2BL2 | |
| Medio Intel Xeon W-11955M (n=1) | |
| Dell Precision 5000 5560 | |
| SPECviewperf 2020 / CATIA (catia-06) | |
| Media de la clase Workstation (44 - 106, n=12, últimos 2 años) | |
| Asus ProArt StudioBook 16 W7600H5A-2BL2 | |
| Medio Intel Xeon W-11955M (n=1) | |
| HP ZBook Fury 15 G8 | |
| Dell Precision 5000 5560 | |
| SPECviewperf 2020 / 3ds Max (3dsmax-07) | |
| Media de la clase Workstation (47.4 - 154.7, n=12, últimos 2 años) | |
| Asus ProArt StudioBook 16 W7600H5A-2BL2 | |
| Medio Intel Xeon W-11955M (n=1) | |
| HP ZBook Fury 15 G8 | |
| Dell Precision 5000 5560 | |
* ... más pequeño es mejor
Rendimiento del sistema
El rendimiento del sistema también está -según las expectativas- por encima de todos los rivales. El Asus ProArt Studiobook 16 sólo tiene que admitir la derrota ante su homólogo de sobremesa Schenker XMG Ultra 17 con elIntel Core i9 11900K y el Lenovo Thinkpad P1. No pudimos determinar ningún problema con el sistema en el uso diario y todas las tareas se ejecutaron sin retrasos. Sólo la ligera diferencia entre el funcionamiento de la red y el de la batería se nota al abrir y cerrar programas
| PCMark 10 / Score | |
| Media de la clase Workstation (6563 - 10409, n=19, últimos 2 años) | |
| Schenker XMG Ultra 17 Rocket Lake | |
| Lenovo ThinkPad P1 G4-20Y4S0KS00 | |
| Asus ProArt StudioBook 16 W7600H5A-2BL2 | |
| Medio Intel Xeon W-11955M, NVIDIA RTX A5000 Laptop GPU (n=1) | |
| HP ZBook Fury 15 G8 | |
| HP ZBook Studio 15 G8 | |
| Dell Precision 5000 5560 | |
| PCMark 10 / Essentials | |
| Schenker XMG Ultra 17 Rocket Lake | |
| Lenovo ThinkPad P1 G4-20Y4S0KS00 | |
| Dell Precision 5000 5560 | |
| Media de la clase Workstation (9622 - 11157, n=19, últimos 2 años) | |
| Asus ProArt StudioBook 16 W7600H5A-2BL2 | |
| Medio Intel Xeon W-11955M, NVIDIA RTX A5000 Laptop GPU (n=1) | |
| HP ZBook Fury 15 G8 | |
| HP ZBook Studio 15 G8 | |
| PCMark 10 / Productivity | |
| Media de la clase Workstation (8789 - 20616, n=19, últimos 2 años) | |
| Schenker XMG Ultra 17 Rocket Lake | |
| Dell Precision 5000 5560 | |
| Asus ProArt StudioBook 16 W7600H5A-2BL2 | |
| Medio Intel Xeon W-11955M, NVIDIA RTX A5000 Laptop GPU (n=1) | |
| Lenovo ThinkPad P1 G4-20Y4S0KS00 | |
| HP ZBook Fury 15 G8 | |
| HP ZBook Studio 15 G8 | |
| PCMark 10 / Digital Content Creation | |
| Media de la clase Workstation (8108 - 15631, n=19, últimos 2 años) | |
| Schenker XMG Ultra 17 Rocket Lake | |
| Lenovo ThinkPad P1 G4-20Y4S0KS00 | |
| Asus ProArt StudioBook 16 W7600H5A-2BL2 | |
| Medio Intel Xeon W-11955M, NVIDIA RTX A5000 Laptop GPU (n=1) | |
| HP ZBook Fury 15 G8 | |
| HP ZBook Studio 15 G8 | |
| Dell Precision 5000 5560 | |
| PCMark 10 Score | 6951 puntos | |
ayuda | ||
Latencias del CPD
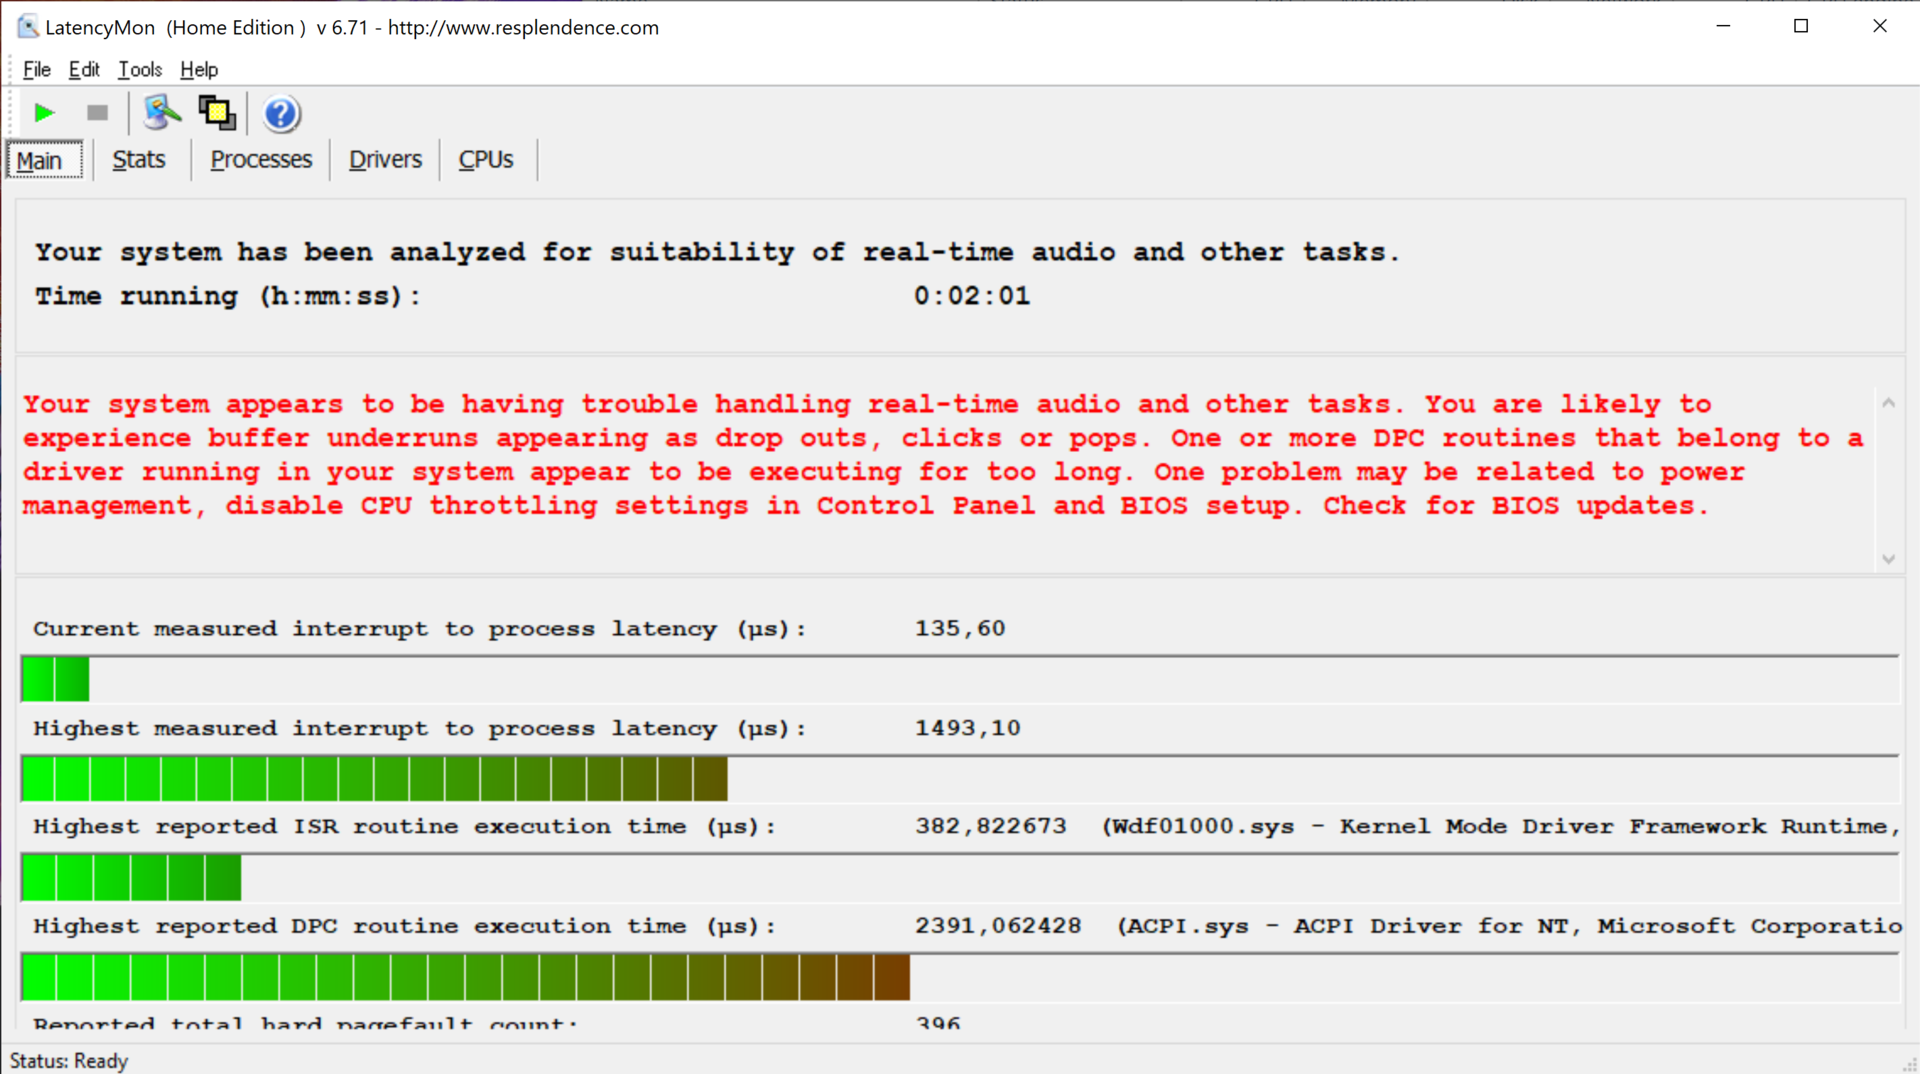
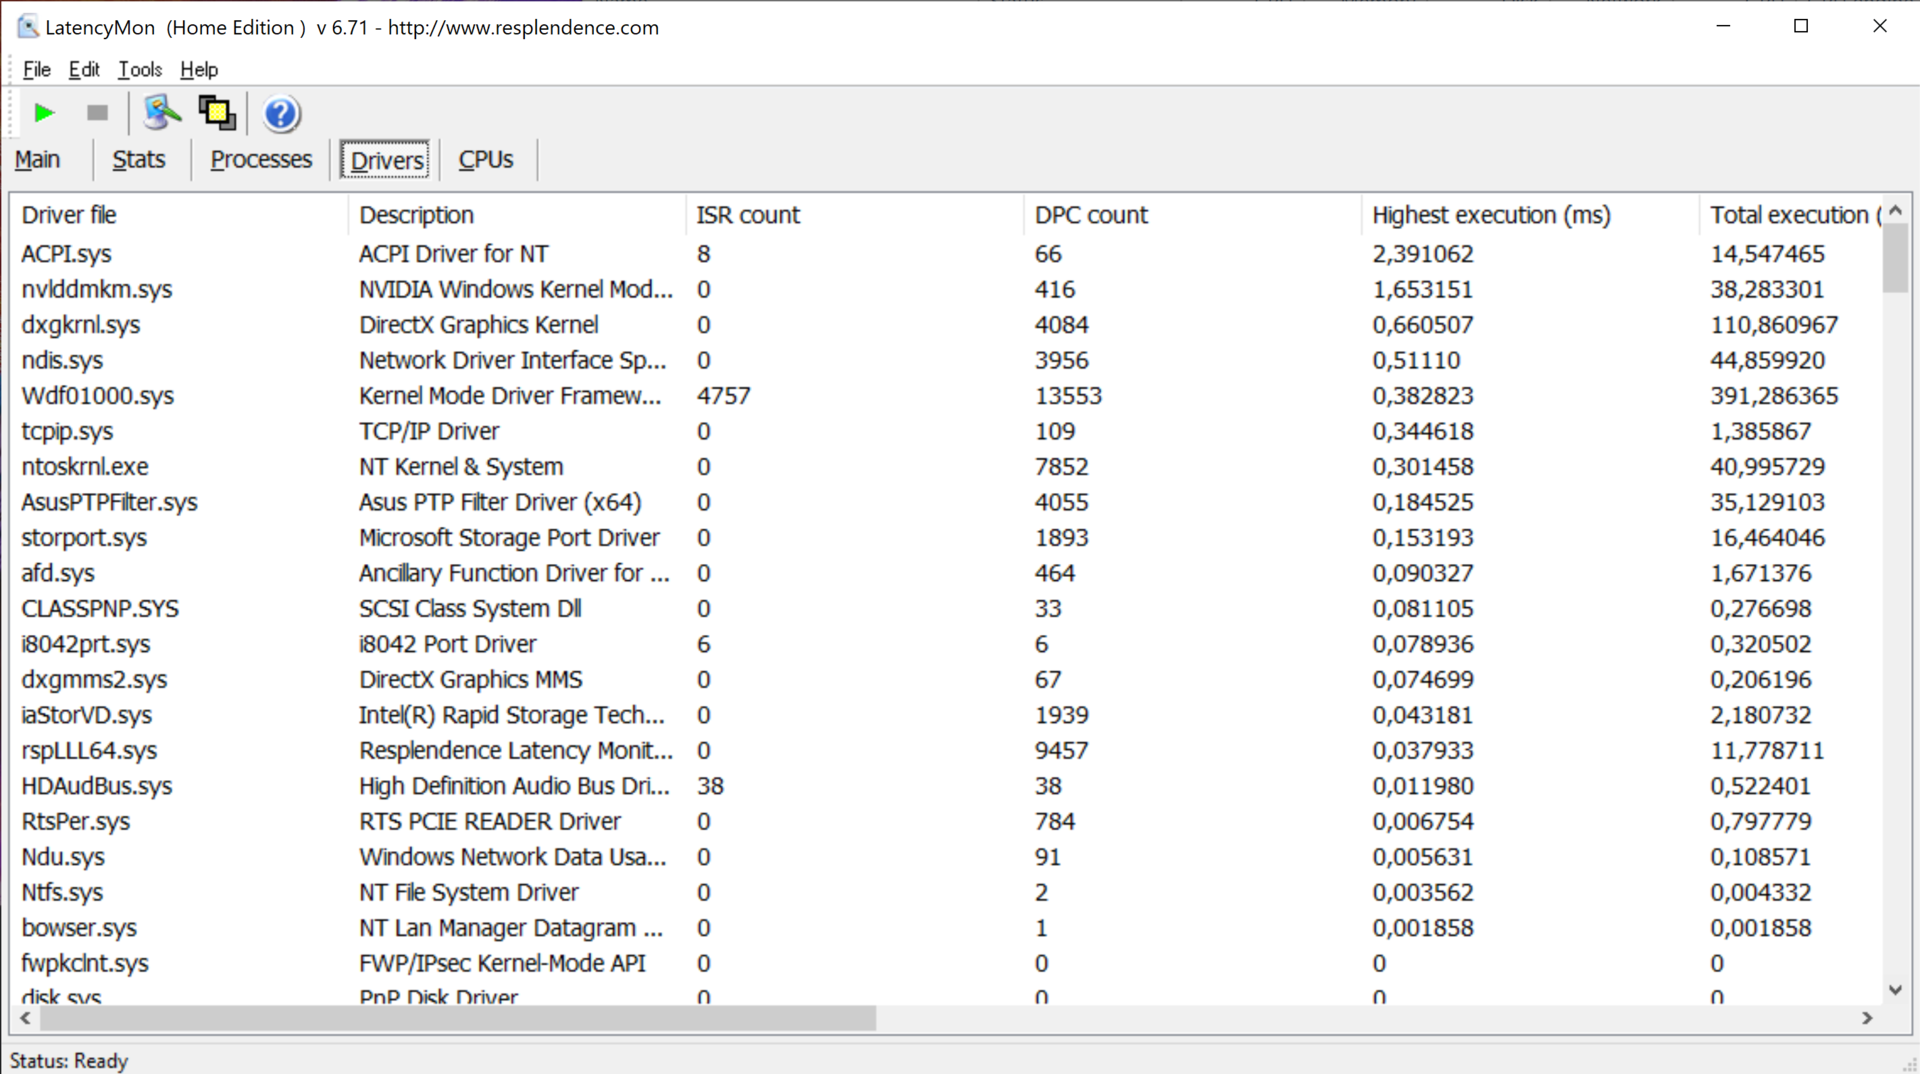
Dado que el uso previsto de nuestro dispositivo de prueba incluye el trabajo con archivos de audio y vídeo, las latencias DPC podrían causar problemas. La prueba mostró la necesidad de optimizar las latencias, y nuestro dispositivo tuvo caídas de fotogramas durante nuestra prueba de vídeo en Youtube.
| DPC Latencies / LatencyMon - interrupt to process latency (max), Web, Youtube, Prime95 | |
| HP ZBook Studio 15 G8 | |
| Asus ProArt StudioBook 16 W7600H5A-2BL2 | |
| Dell Precision 5000 5560 | |
| HP ZBook Fury 15 G8 | |
* ... más pequeño es mejor
Almacenamiento
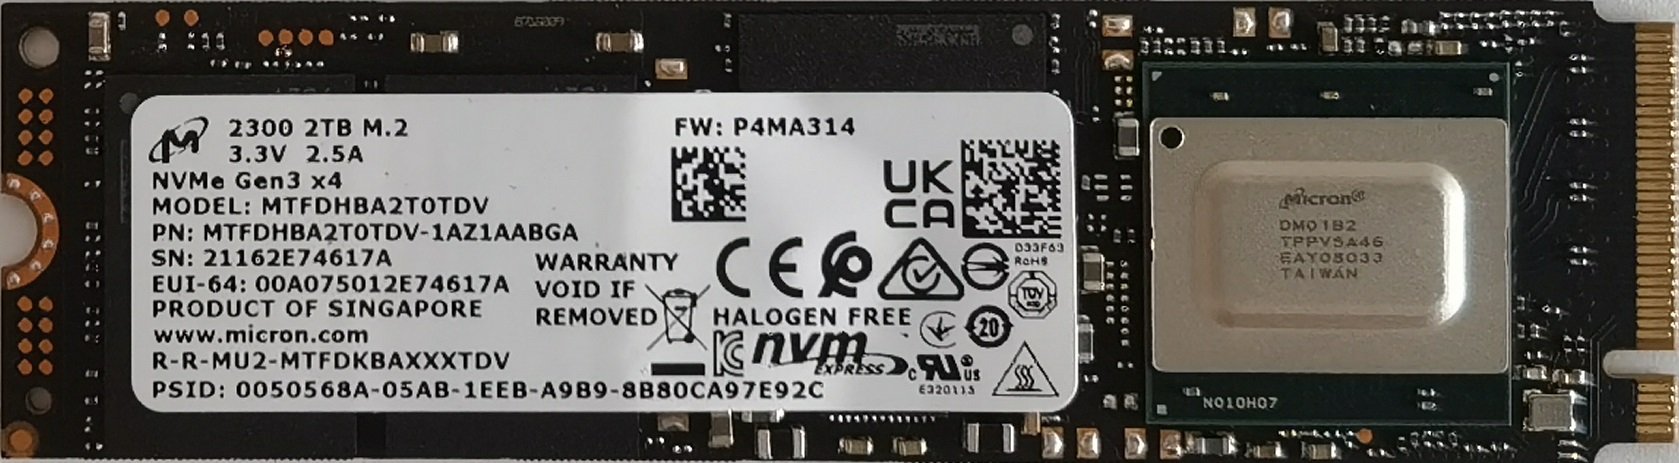
El dispositivo de preproducción soporta teóricamente 2x un SSD M.2 NVMe con PCIe 4.0, por lo que es cuestionable por qué Asus instala dos SSDs con PCIe 3.0 en una configuración RAID 0 aquí. Estos rinden de forma bastante mediocre en el AS SSD benchmark y Crystal DiskMark, e incluso el único SSD PCIe 3.0 en HP Zbook Fury queda por detrás de nuestra configuración en algunas secciones del benchmark. Aquí también vemos la necesidad de optimización: Asus podría confiar en una unidad de almacenamiento PCIe 4.0 o debería optimizar los drivers
| Asus ProArt StudioBook 16 W7600H5A-2BL2 2x Micron 2300 2TB MTFDHBA2T0TDV (RAID 0) | HP ZBook Fury 15 G8 Samsung PM981a MZVLB1T0HBLR | Schenker XMG Ultra 17 Rocket Lake Samsung SSD 980 Pro 2TB MZ-V8P2T0 | HP ZBook Studio 15 G8 Samsung PM981a MZVLB2T0HALB | Dell Precision 5000 5560 Samsung PM9A1 MZVL22T0HBLB | Lenovo ThinkPad P1 G4-20Y4S0KS00 Samsung PM9A1 MZVL21T0HCLR | Medio 2x Micron 2300 2TB MTFDHBA2T0TDV (RAID 0) | |
|---|---|---|---|---|---|---|---|
| CrystalDiskMark 5.2 / 6 | 38% | 174% | 44% | 110% | 0% | ||
| Write 4K (MB/s) | 105.6 | 96.3 -9% | 240 127% | 110.5 5% | 172.4 63% | 105.6 ? 0% | |
| Read 4K (MB/s) | 50.2 | 51.5 3% | 87.8 75% | 51.8 3% | 78.8 57% | 50.2 ? 0% | |
| Write Seq (MB/s) | 445.6 | 1942 336% | 4281 861% | 2071 365% | 2991 571% | 446 ? 0% | |
| Read Seq (MB/s) | 753 | 2504 233% | 4228 461% | 2505 233% | 3351 345% | 753 ? 0% | |
| Write 4K Q32T1 (MB/s) | 2713 | 346.6 -87% | 696 -74% | 429.8 -84% | 459.2 -83% | 2713 ? 0% | |
| Read 4K Q32T1 (MB/s) | 2399 | 408 -83% | 778 -68% | 418.3 -83% | 484.3 -80% | 2399 ? 0% | |
| Write Seq Q32T1 (MB/s) | 5378 | 3019 -44% | 5195 -3% | 3060 -43% | 4761 -11% | 5378 ? 0% | |
| Read Seq Q32T1 (MB/s) | 6189 | 3514 -43% | 7099 15% | 3539 -43% | 7071 14% | 6189 ? 0% | |
| AS SSD | -21% | 80% | 14% | 35% | 85% | 0% | |
| Seq Read (MB/s) | 4317 | 2937 -32% | 5010 16% | 2953 -32% | 5169 20% | 4526 5% | 4317 ? 0% |
| Seq Write (MB/s) | 2037 | 1688 -17% | 3974 95% | 1691 -17% | 1986 -3% | 3988 96% | 2037 ? 0% |
| 4K Read (MB/s) | 48.97 | 44.27 -10% | 51.9 6% | 43.98 -10% | 78 59% | 82.9 69% | 49 ? 0% |
| 4K Write (MB/s) | 112.4 | 105.8 -6% | 156.8 40% | 105.4 -6% | 214.6 91% | 207.5 85% | 112.4 ? 0% |
| 4K-64 Read (MB/s) | 1253 | 873 -30% | 2611 108% | 1065 -15% | 1232 -2% | 2751 120% | 1253 ? 0% |
| 4K-64 Write (MB/s) | 1473 | 1996 36% | 3859 162% | 1957 33% | 2719 85% | 3270 122% | 1473 ? 0% |
| Access Time Read * (ms) | 0.045 | 0.048 -7% | 0.072 -60% | 0.04 11% | 0.024 47% | 0.024 47% | 0.045 ? -0% |
| Access Time Write * (ms) | 0.083 | 0.107 -29% | 0.026 69% | 0.105 -27% | 0.059 29% | 0.021 75% | 0.083 ? -0% |
| Score Read (Points) | 1765 | 1211 -31% | 3164 79% | 1404 -20% | 1827 4% | 3287 86% | 1765 ? 0% |
| Score Write (Points) | 1722 | 2271 32% | 4414 156% | 2232 30% | 3133 82% | 3876 125% | 1722 ? 0% |
| Score Total (Points) | 4256 | 4046 -5% | 9134 115% | 4297 1% | 5753 35% | 8821 107% | 4256 ? 0% |
| Copy ISO MB/s (MB/s) | 2441 | 901 -63% | 3424 40% | 2474 1% | 3201 31% | 2441 ? 0% | |
| Copy Program MB/s (MB/s) | 395.7 | 118.7 -70% | 1091 176% | 1074 171% | 415.8 5% | 396 ? 0% | |
| Copy Game MB/s (MB/s) | 1115 | 372 -67% | 2365 112% | 1929 73% | 1212 9% | 1115 ? 0% | |
| Media total (Programa/Opciones) | 9% /
0% | 127% /
114% | 29% /
25% | 73% /
62% | 85% /
85% | 0% /
0% |
* ... más pequeño es mejor

Constant Performance Reading: DiskSpd Read Loop, Queue Depth 8
Tarjeta gráfica
Gracias al sistema de refrigeración instalado y a un TDP de hasta 110 vatios, la RTX A5000 con sus 16 GB de VRAM convence en términos de rendimiento gráfico puro y se sitúa así entre un 15 y un 20 por ciento por delante del HP ZBook Fury en las pruebas sintéticas.
| 3DMark Fire Strike Score | 22819 puntos | |
| 3DMark Fire Strike Extreme Score | 12825 puntos | |
| 3DMark Time Spy Score | 10157 puntos | |
ayuda | ||
Rendimiento de los juegos
Aunque nuestro dispositivo de preproducción no está optimizado para los juegos, sigue manejando la mayoría de títulos en QHD. Sin embargo, la pantalla está limitada a los 60 Hz. Entre los competidores, sólo los auténticos potentes para juegos - como el Schenker XMG Ultra - pueden superar claramente a nuestro modelo de pruebas. En general, el rendimiento de juego del Asus ProArt Studiobook Pro 16 está en el nivel inferior de una RTX 3080
Como era de esperar, el rendimiento de juego está muy limitado por la energía de la batería.
| The Witcher 3 | |
| 1920x1080 High Graphics & Postprocessing (Nvidia HairWorks Off) | |
| Schenker XMG Ultra 17 Rocket Lake | |
| MSI GS76 Stealth 11UH | |
| Media de la clase Workstation (n=1últimos 2 años) | |
| HP ZBook Studio 15 G8 | |
| Medio NVIDIA RTX A5000 Laptop GPU (124 - 179, n=3) | |
| HP ZBook Fury 15 G8 | |
| Asus ProArt StudioBook 16 W7600H5A-2BL2 | |
| Dell Precision 5000 5560 | |
| 1920x1080 Ultra Graphics & Postprocessing (HBAO+) | |
| Schenker XMG Ultra 17 Rocket Lake | |
| MSI GS76 Stealth 11UH | |
| Media de la clase Workstation (n=1últimos 2 años) | |
| Medio NVIDIA RTX A5000 Laptop GPU (81.7 - 98.3, n=3) | |
| Asus ProArt StudioBook 16 W7600H5A-2BL2 | |
| HP ZBook Fury 15 G8 | |
| HP ZBook Studio 15 G8 | |
| Dell Precision 5000 5560 | |
| Metro Exodus | |
| 3840x2160 Ultra Quality AF:16x | |
| HP ZBook Fury 15 G8 | |
| Medio NVIDIA RTX A5000 Laptop GPU (24 - 28.5, n=2) | |
| Asus ProArt StudioBook 16 W7600H5A-2BL2 | |
| 2560x1440 Ultra Quality AF:16x | |
| HP ZBook Fury 15 G8 | |
| Medio NVIDIA RTX A5000 Laptop GPU (41 - 46.3, n=2) | |
| Asus ProArt StudioBook 16 W7600H5A-2BL2 | |
| Dell Precision 5000 5560 | |
| 1920x1080 Ultra Quality AF:16x | |
| HP ZBook Fury 15 G8 | |
| Medio NVIDIA RTX A5000 Laptop GPU (55 - 59.8, n=2) | |
| Asus ProArt StudioBook 16 W7600H5A-2BL2 | |
| Dell Precision 5000 5560 | |
| 1920x1080 High Quality AF:16x | |
| HP ZBook Fury 15 G8 | |
| Medio NVIDIA RTX A5000 Laptop GPU (69 - 74.5, n=2) | |
| Asus ProArt StudioBook 16 W7600H5A-2BL2 | |
| Dell Precision 5000 5560 | |
| F1 2020 | |
| 3840x2160 Ultra High Preset AA:T AF:16x | |
| Asus ProArt StudioBook 16 W7600H5A-2BL2 | |
| Medio NVIDIA RTX A5000 Laptop GPU (n=1) | |
| 1920x1080 Ultra High Preset AA:T AF:16x | |
| Asus ProArt StudioBook 16 W7600H5A-2BL2 | |
| Medio NVIDIA RTX A5000 Laptop GPU (n=1) | |
| 1920x1080 High Preset AA:T AF:16x | |
| Asus ProArt StudioBook 16 W7600H5A-2BL2 | |
| Medio NVIDIA RTX A5000 Laptop GPU (n=1) | |
| F1 2021 | |
| 3840x2160 Ultra High Preset + Raytracing AA:T AF:16x | |
| Asus ProArt StudioBook 16 W7600H5A-2BL2 | |
| MSI GS76 Stealth 11UH | |
| Medio NVIDIA RTX A5000 Laptop GPU (38 - 53.6, n=3) | |
| HP ZBook Fury 15 G8 | |
| 2560x1440 Ultra High Preset + Raytracing AA:T AF:16x | |
| MSI GS76 Stealth 11UH | |
| Asus ProArt StudioBook 16 W7600H5A-2BL2 | |
| Medio NVIDIA RTX A5000 Laptop GPU (59 - 88.2, n=3) | |
| HP ZBook Fury 15 G8 | |
| Dell Precision 5000 5560 | |
| 1920x1080 Ultra High Preset + Raytracing AA:T AF:16x | |
| MSI GS76 Stealth 11UH | |
| Asus ProArt StudioBook 16 W7600H5A-2BL2 | |
| Medio NVIDIA RTX A5000 Laptop GPU (85 - 109, n=3) | |
| HP ZBook Fury 15 G8 | |
| Dell Precision 5000 5560 | |
| 1920x1080 High Preset AA:T AF:16x | |
| MSI GS76 Stealth 11UH | |
| Asus ProArt StudioBook 16 W7600H5A-2BL2 | |
| Medio NVIDIA RTX A5000 Laptop GPU (122 - 161, n=3) | |
| HP ZBook Fury 15 G8 | |
| Dell Precision 5000 5560 | |
| Cyberpunk 2077 1.0 | |
| 3840x2160 Ultra Preset | |
| Medio NVIDIA RTX A5000 Laptop GPU (16.7 - 25, n=2) | |
| Asus ProArt StudioBook 16 W7600H5A-2BL2 | |
| 2560x1440 Ultra Preset | |
| Medio NVIDIA RTX A5000 Laptop GPU (37.1 - 51, n=2) | |
| Asus ProArt StudioBook 16 W7600H5A-2BL2 | |
| 1920x1080 Ultra Preset | |
| Schenker XMG Ultra 17 Rocket Lake | |
| Medio NVIDIA RTX A5000 Laptop GPU (58.6 - 78, n=2) | |
| Asus ProArt StudioBook 16 W7600H5A-2BL2 | |
| 1920x1080 High Preset | |
| Schenker XMG Ultra 17 Rocket Lake | |
| Medio NVIDIA RTX A5000 Laptop GPU (68.1 - 90, n=2) | |
| Asus ProArt StudioBook 16 W7600H5A-2BL2 | |
En nuestra prueba de 60 minutos con The Witcher 3 (FHD/Ultra), el rendimiento se mantiene relativamente constante durante toda la prueba.
Witcher 3 FPS Diagramm
| bajo | medio | alto | ultra | QHD | 4K | |
|---|---|---|---|---|---|---|
| GTA V (2015) | 180 | 175 | 158 | 85.8 | 82.2 | 76.3 |
| The Witcher 3 (2015) | 321 | 217.9 | 124 | 89.9 | 54.8 | |
| Dota 2 Reborn (2015) | 144 | 136 | 124 | 117 | 118 | |
| Final Fantasy XV Benchmark (2018) | 184 | 123 | 91.8 | 70.6 | 41 | |
| X-Plane 11.11 (2018) | 117 | 102 | 81.6 | 52 | ||
| Far Cry 5 (2018) | 76 | 69 | 62 | 60 | 58 | 36 |
| Strange Brigade (2018) | 419 | 231 | 192 | 160 | 129 | |
| Metro Exodus (2019) | 148 | 126 | 69 | 55 | 41 | 24 |
| F1 2020 (2020) | 253 | 181 | 164 | 133 | 63.1 | |
| Cyberpunk 2077 1.0 (2020) | 114.6 | 83.1 | 68.1 | 58.6 | 37.1 | 16.7 |
| F1 2021 (2021) | 269 | 171 | 159 | 104 | 82.8 | 48.7 |
Emisiones: Las altas prestaciones pasan factura
Emisiones acústicas
Incluso en ralentí, los ventiladores tienen la palabra y casi nunca se quedan quietos. Bajo carga, los ventiladores son claramente audibles y se adaptan al rendimiento requerido. En el ProArt Creator Hub se pueden realizar varios ajustes de la velocidad de los ventiladores. Los usuarios pueden elegir entre tres modos: Modo estándar, Modo de rendimiento y Velocidad máxima del ventilador. En la prueba, resultó que las ventajas con la velocidad máxima del ventilador son muy marginales.
Ruido
| Ocioso |
| 26 / 26 / 26.5 dB(A) |
| Carga |
| 42 / 43 dB(A) |
 | ||
30 dB silencioso 40 dB(A) audible 50 dB(A) ruidosamente alto |
||
min: | ||
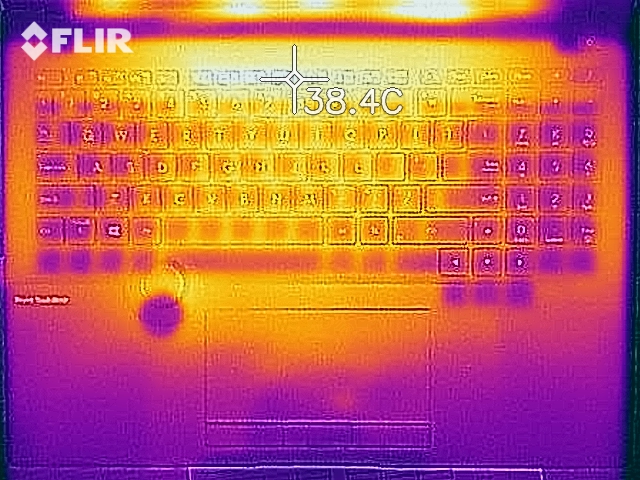
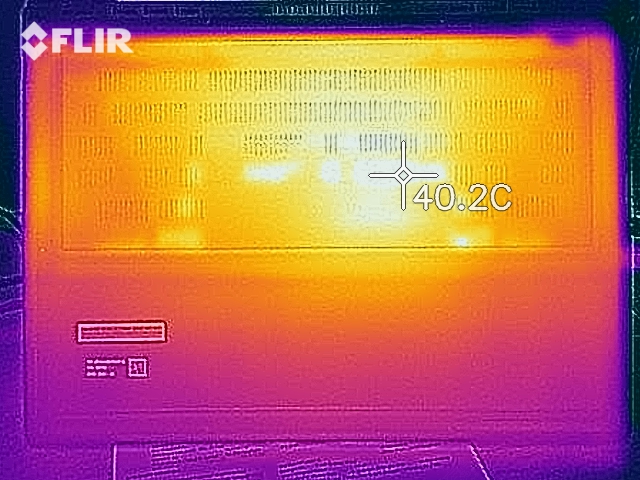
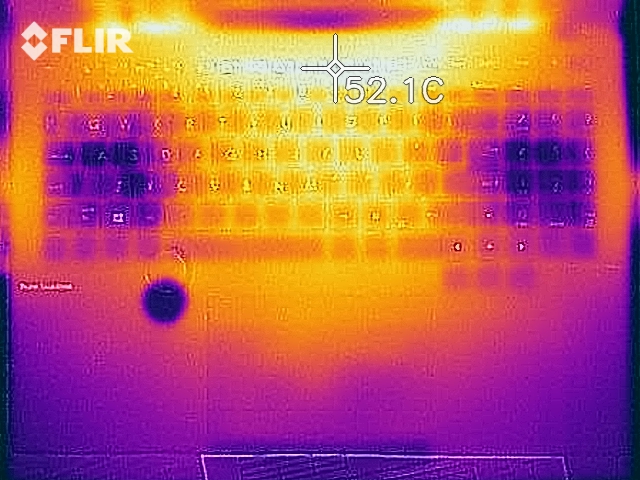
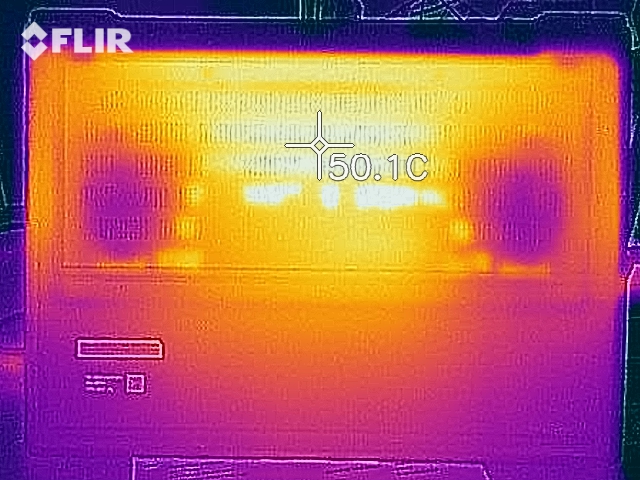
Temperatura
Mucha potencia genera mucho calor residual. Este es también el caso de nuestra muestra de preproducción, porque el dispositivo nunca se mantiene realmente fresco. Con mucha carga en la CPU, las temperaturas superan rápidamente los 100 °C. La GPU, por otro lado, lo hace un poco mejor y sólo alcanza algo más de 80 °C. Las temperaturas superficiales son correspondientemente moderadas.
(-) La temperatura máxima en la parte superior es de 45.7 °C / 114 F, frente a la media de 38.2 °C / 101 F, que oscila entre 22.2 y 69.8 °C para la clase Workstation.
(-) El fondo se calienta hasta un máximo de 48.3 °C / 119 F, frente a la media de 41.1 °C / 106 F
(+) En reposo, la temperatura media de la parte superior es de 31.6 °C / 89# F, frente a la media del dispositivo de 32 °C / 90 F.
(+) Los reposamanos y el panel táctil alcanzan como máximo la temperatura de la piel (35.2 °C / 95.4 F) y, por tanto, no están calientes.
(-) La temperatura media de la zona del reposamanos de dispositivos similares fue de 27.8 °C / 82 F (-7.4 °C / -13.4 F).
Altavoces
La calidad de audio del ProArt Studiobook Pro 16 es muy buena y muy equilibrada. Destaca el sonido bueno, limpio y completo a volúmenes más bajos y más altos, así como la riqueza de los graves
Asus ProArt StudioBook 16 W7600H5A-2BL2 análisis de audio
(±) | la sonoridad del altavoz es media pero buena (76 dB)
Graves 100 - 315 Hz
(-) | casi sin bajos - de media 17% inferior a la mediana
(±) | la linealidad de los graves es media (10.4% delta a frecuencia anterior)
Medios 400 - 2000 Hz
(+) | medios equilibrados - a sólo 1.2% de la mediana
(+) | los medios son lineales (5.1% delta a la frecuencia anterior)
Altos 2 - 16 kHz
(±) | máximos más altos - de media 5.1% más altos que la mediana
(+) | los máximos son lineales (4.9% delta a la frecuencia anterior)
Total 100 - 16.000 Hz
(±) | la linealidad del sonido global es media (16.5% de diferencia con la mediana)
En comparación con la misma clase
» 46% de todos los dispositivos probados de esta clase eran mejores, 7% similares, 47% peores
» El mejor tuvo un delta de 7%, la media fue 17%, el peor fue ###max##%
En comparación con todos los dispositivos probados
» 28% de todos los dispositivos probados eran mejores, 6% similares, 66% peores
» El mejor tuvo un delta de 4%, la media fue 23%, el peor fue ###max##%
HP ZBook Fury 15 G8 análisis de audio
(±) | la sonoridad del altavoz es media pero buena (79.8 dB)
Graves 100 - 315 Hz
(±) | lubina reducida - en promedio 10.6% inferior a la mediana
(±) | la linealidad de los graves es media (8.8% delta a frecuencia anterior)
Medios 400 - 2000 Hz
(+) | medios equilibrados - a sólo 3.9% de la mediana
(+) | los medios son lineales (4.8% delta a la frecuencia anterior)
Altos 2 - 16 kHz
(+) | máximos equilibrados - a sólo 2.9% de la mediana
(+) | los máximos son lineales (5.3% delta a la frecuencia anterior)
Total 100 - 16.000 Hz
(+) | el sonido global es lineal (11.9% de diferencia con la mediana)
En comparación con la misma clase
» 17% de todos los dispositivos probados de esta clase eran mejores, 4% similares, 79% peores
» El mejor tuvo un delta de 7%, la media fue 17%, el peor fue ###max##%
En comparación con todos los dispositivos probados
» 9% de todos los dispositivos probados eran mejores, 2% similares, 89% peores
» El mejor tuvo un delta de 4%, la media fue 23%, el peor fue ###max##%
Gestión de la energía: Poca duración de la batería del Studiobook
Consumo de energía
El consumo de energía en reposo, con un mínimo de 12,4 y un máximo de 25 vatios, es ligeramente superior al del HP ZBook Fury.
La fuente de alimentación tiene un tamaño más que adecuado con 240 vatios, pero el consumo máximo de energía es de sólo 134 vatios. Esto se vuelve aún más obvio con el Witcher 3, donde el consumo de energía se mantiene en 132 watts. Dado que se trata de una muestra de preproducción, suponemos que el consumo máximo de energía aún se ajustará en favor del rendimiento.
| Off / Standby | |
| Ocioso | |
| Carga |
|
Clave:
min: | |
| Asus ProArt StudioBook 16 W7600H5A-2BL2 W-11955M, RTX A5000 Laptop GPU, 2x Micron 2300 2TB MTFDHBA2T0TDV (RAID 0), OLED, 3840x2400, 16" | HP ZBook Fury 15 G8 i9-11950H, RTX A5000 Laptop GPU, Samsung PM981a MZVLB1T0HBLR, IPS, 3840x2160, 15.6" | HP ZBook Studio 15 G8 i9-11950H, GeForce RTX 3070 Laptop GPU, Samsung PM981a MZVLB2T0HALB, OLED, 3840x2160, 15.6" | Dell Precision 5000 5560 i7-11850H, RTX A2000 Laptop GPU, Samsung PM9A1 MZVL22T0HBLB, IPS, 3840x2400, 15.6" | Lenovo ThinkPad P1 G4-20Y4S0KS00 i7-11850H, GeForce RTX 3070 Laptop GPU, Samsung PM9A1 MZVL21T0HCLR, IPS LED, 3840x2400, 16" | Schenker XMG Ultra 17 Rocket Lake i9-11900K, GeForce RTX 3080 Laptop GPU, Samsung SSD 980 Pro 2TB MZ-V8P2T0, IPS, 1920x1080, 17.3" | Medio NVIDIA RTX A5000 Laptop GPU | Media de la clase Workstation | |
|---|---|---|---|---|---|---|---|---|
| Power Consumption | -2% | -8% | 22% | 3% | -201% | -5% | 13% | |
| Idle Minimum * (Watt) | 12.4 | 8.3 33% | 11 11% | 6.2 50% | 8.1 35% | 62 -400% | 10.4 ? 16% | 9.11 ? 27% |
| Idle Average * (Watt) | 16.5 | 19.9 -21% | 18.8 -14% | 13.9 16% | 20.2 -22% | 64 -288% | 18.3 ? -11% | 13.8 ? 16% |
| Idle Maximum * (Watt) | 25 | 21.8 13% | 31.7 -27% | 23.8 5% | 21.9 12% | 69 -176% | 22.3 ? 11% | 17.9 ? 28% |
| Load Average * (Watt) | 132 | 110.9 16% | 105.2 20% | 95.7 27% | 88.2 33% | 183 -39% | 125.1 ? 5% | 96 ? 27% |
| Witcher 3 ultra * (Watt) | 132 | 165 -25% | 148 -12% | 87 34% | 149 -13% | 297 -125% | ||
| Load Maximum * (Watt) | 134 | 171.8 -28% | 171.8 -28% | 132.6 1% | 170.6 -27% | 368 -175% | 195.8 ? -46% | 180.3 ? -35% |
* ... más pequeño es mejor
Energy consumption during The Witcher 3 / stress test
Duración de la batería
La duración de la batería en nuestro dispositivo de preproducción es mixta y está por detrás de toda la competencia. En nuestra prueba estandarizada de WLAN, el dispositivo de prueba se queda sin aliento después de 300 minutos.
| Asus ProArt StudioBook 16 W7600H5A-2BL2 W-11955M, RTX A5000 Laptop GPU, 90 Wh | HP ZBook Fury 15 G8 i9-11950H, RTX A5000 Laptop GPU, 94 Wh | HP ZBook Studio 15 G8 i9-11950H, GeForce RTX 3070 Laptop GPU, 83 Wh | Dell Precision 5000 5560 i7-11850H, RTX A2000 Laptop GPU, 86 Wh | Lenovo ThinkPad P1 G4-20Y4S0KS00 i7-11850H, GeForce RTX 3070 Laptop GPU, 90 Wh | Media de la clase Workstation | |
|---|---|---|---|---|---|---|
| Duración de Batería | 24% | 24% | 26% | 170% | 266% | |
| H.264 (h) | 1.8 | 7.2 300% | 10.1 ? 461% | |||
| WiFi v1.3 (h) | 5 | 6.2 24% | 6.2 24% | 6.3 26% | 7 40% | 8.55 ? 71% |
| Witcher 3 ultra (h) | 1.6 | |||||
| Load (h) | 1.8 | 1.8 | 1.2 | 1.441 ? | ||
| Reader / Idle (h) | 12.9 | 12 | 26.1 ? |
Veredicto
La primera impresión del Asus ProArt Studiobook Pro 16 es bastante sólida. La carcasa ligera y elegante convence con su aleación de magnesio. Una característica especial aquí es el Asus Dial Controller integrado, que permite al usuario ejecutar algunas funciones particulares en programas de edición de imagen y vídeo de forma muy precisa. El teclado no sólo puede mantenerse con un buen punto de presión, sino también con la cómoda escritura que se proporciona en general. El touchpad ofrece buenas propiedades de deslizamiento y tiene una superficie suficiente, aunque no sea demasiado grande. Los puertos están bien situados y cumplen con los requisitos modernos.
Las primeras pruebas de rendimiento de la muestra de preproducción dejan algunas preguntas sin responder, pero nos dan una imagen clara del rendimiento esperado. El rendimiento gráfico está a la par con una RTX 3080 de bajo TDP. El rendimiento del sistema es consistentemente bueno y no nos dio ningún motivo de crítica en el uso diario. No obstante, creemos que Asus aún tiene algunas cosas que optimizar hasta el lanzamiento del producto. Llama la atención el consumo máximo de energía de unos 134 vatios, que no hace justicia a la fuente de alimentación de 240 vatios.
El Asus ProArt Studiobook Pro 16 establece nuevos estándares para las estaciones de trabajo móviles en términos de calidad de imagen y cobertura del espacio de color. Impresionan especialmente la carcasa ligera y de alta calidad, el panel OLED HDR 4K en formato 16:10, así como características como el Asus Dial Controller.
Por otro lado, la pantalla OLED es de primera clase y cuenta con varias certificaciones y un formato 16:10. La muy buena calibración de fábrica también destaca positivamente aquí y hace que este panel sea adecuado para la edición profesional de imágenes y vídeos. La calidad de audio del Asus ProArt Studiobook Pro 16 también es sorprendente: es muy buena y destaca por su sonido limpio y sus ricos graves. La característica del ventilador es bastante impulsiva en nuestra unidad de preproducción: los ventiladores casi nunca se quedan quietos y se comportan de forma adaptativa al rendimiento demandado. No obstante, son claramente audibles y producen un ruido de fondo alto, pero aceptable para el rendimiento y el tamaño del dispositivo.
Precio y disponibilidad
Dado que se trata de un dispositivo de preserie, no damos una calificación para esta prueba. Nos gustaría señalar que muchas de las especificaciones aún pueden ser ajustadas por el fabricante hasta el lanzamiento de la serie. Todavía no se conoce la fecha de entrega prevista ni el precio
Price comparison
