Revisión del portátil Dell Inspiron 15 5518: La CPU se ralentiza

Dell tiene un todoterreno de 15,6 pulgadas en su línea con el Inspiron 15 5518, que está impulsado por un Core i5-11300H-Y un GeForce-MX450-GPU. Entre los competidores se encuentran dispositivos como el Xiaomi RedmiBook Pro 15y el HP Pavilion 15, el Lenovo IdeaPad 5 Pro 16IHU6y el Asus VivoBook S15 D533UA
Possible competitors in comparison
Valoración | Fecha | Modelo | Peso | Altura | Tamaño | Resolución | Precio |
|---|---|---|---|---|---|---|---|
| 82.3 % v7 (old) | 09/2021 | Dell Inspiron 15 5518-2X3JR i5-11300H, GeForce MX450 | 1.8 kg | 18 mm | 15.60" | 1920x1080 | |
| 81.2 % v7 (old) | 06/2021 | HP Pavilion 15-eg i7-1165G7, GeForce MX450 | 1.7 kg | 17.9 mm | 15.60" | 1920x1080 | |
| 83.2 % v7 (old) | 06/2021 | Xiaomi RedmiBook Pro 15 i7-11370H, GeForce MX450 | 1.7 kg | 16 mm | 15.60" | 3200x2000 | |
| 86 % v7 (old) | 08/2021 | Lenovo IdeaPad 5 Pro 16IHU6 i5-11300H, GeForce MX450 | 1.9 kg | 18.4 mm | 16.00" | 2560x1600 | |
| 82.1 % v7 (old) | 07/2021 | Asus VivoBook S15 D533UA R7 5700U, Vega 8 | 1.8 kg | 16.1 mm | 15.60" | 1920x1080 | |
| 83.5 % v7 (old) | 08/2021 | Lenovo IdeaPad 5 15ALC05 R5 5500U, Vega 7 | 1.7 kg | 19.1 mm | 15.60" | 1920x1080 |
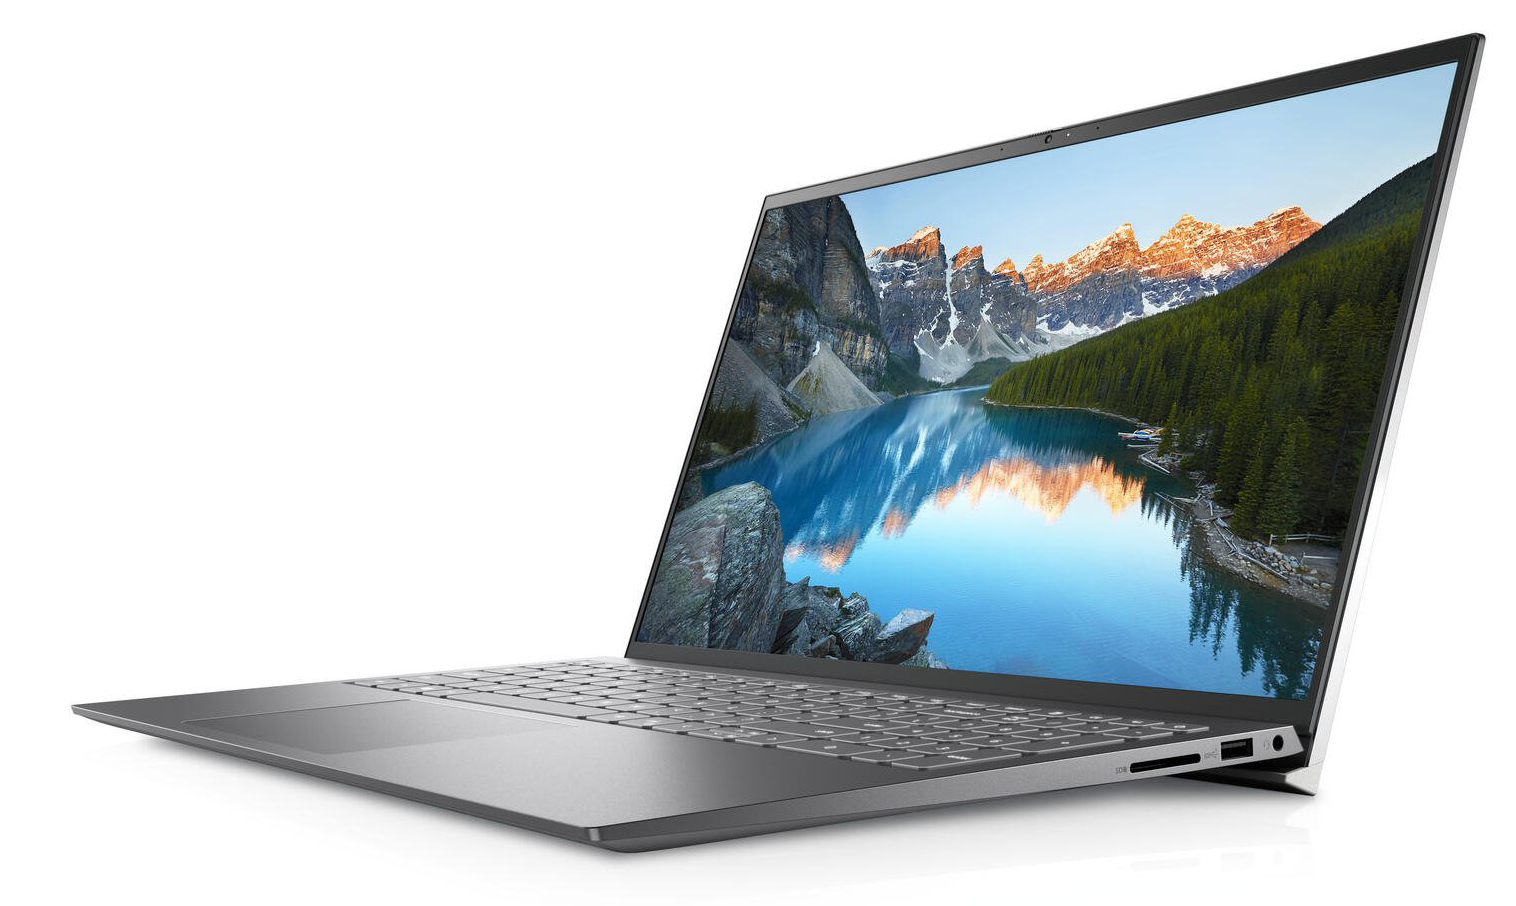
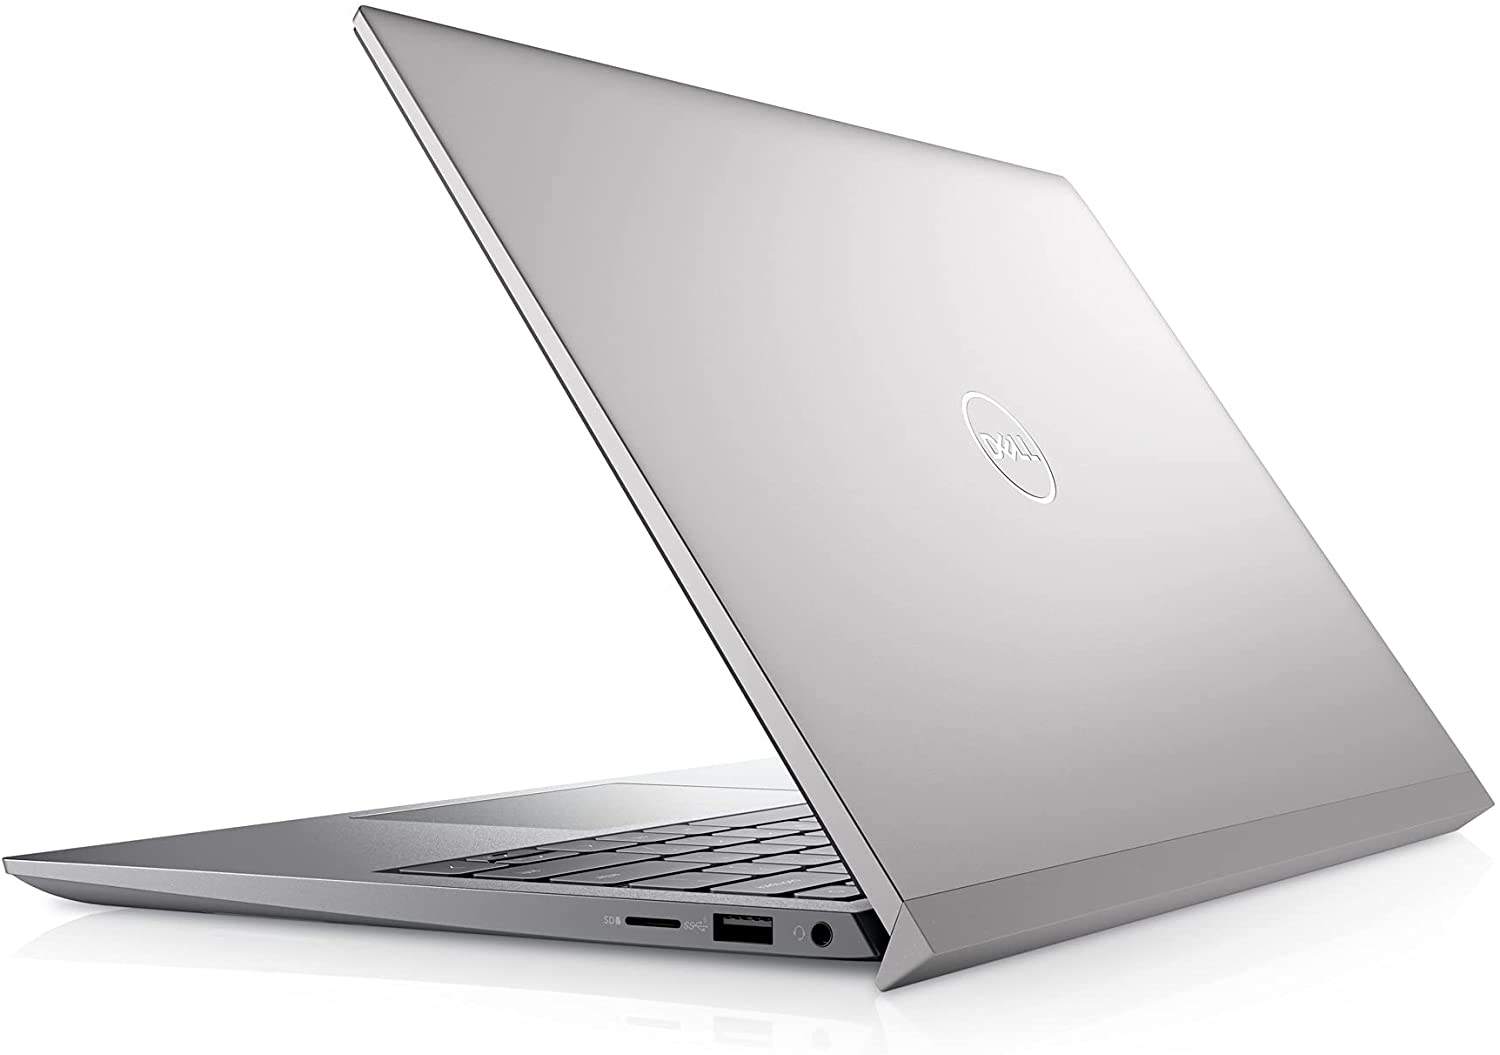
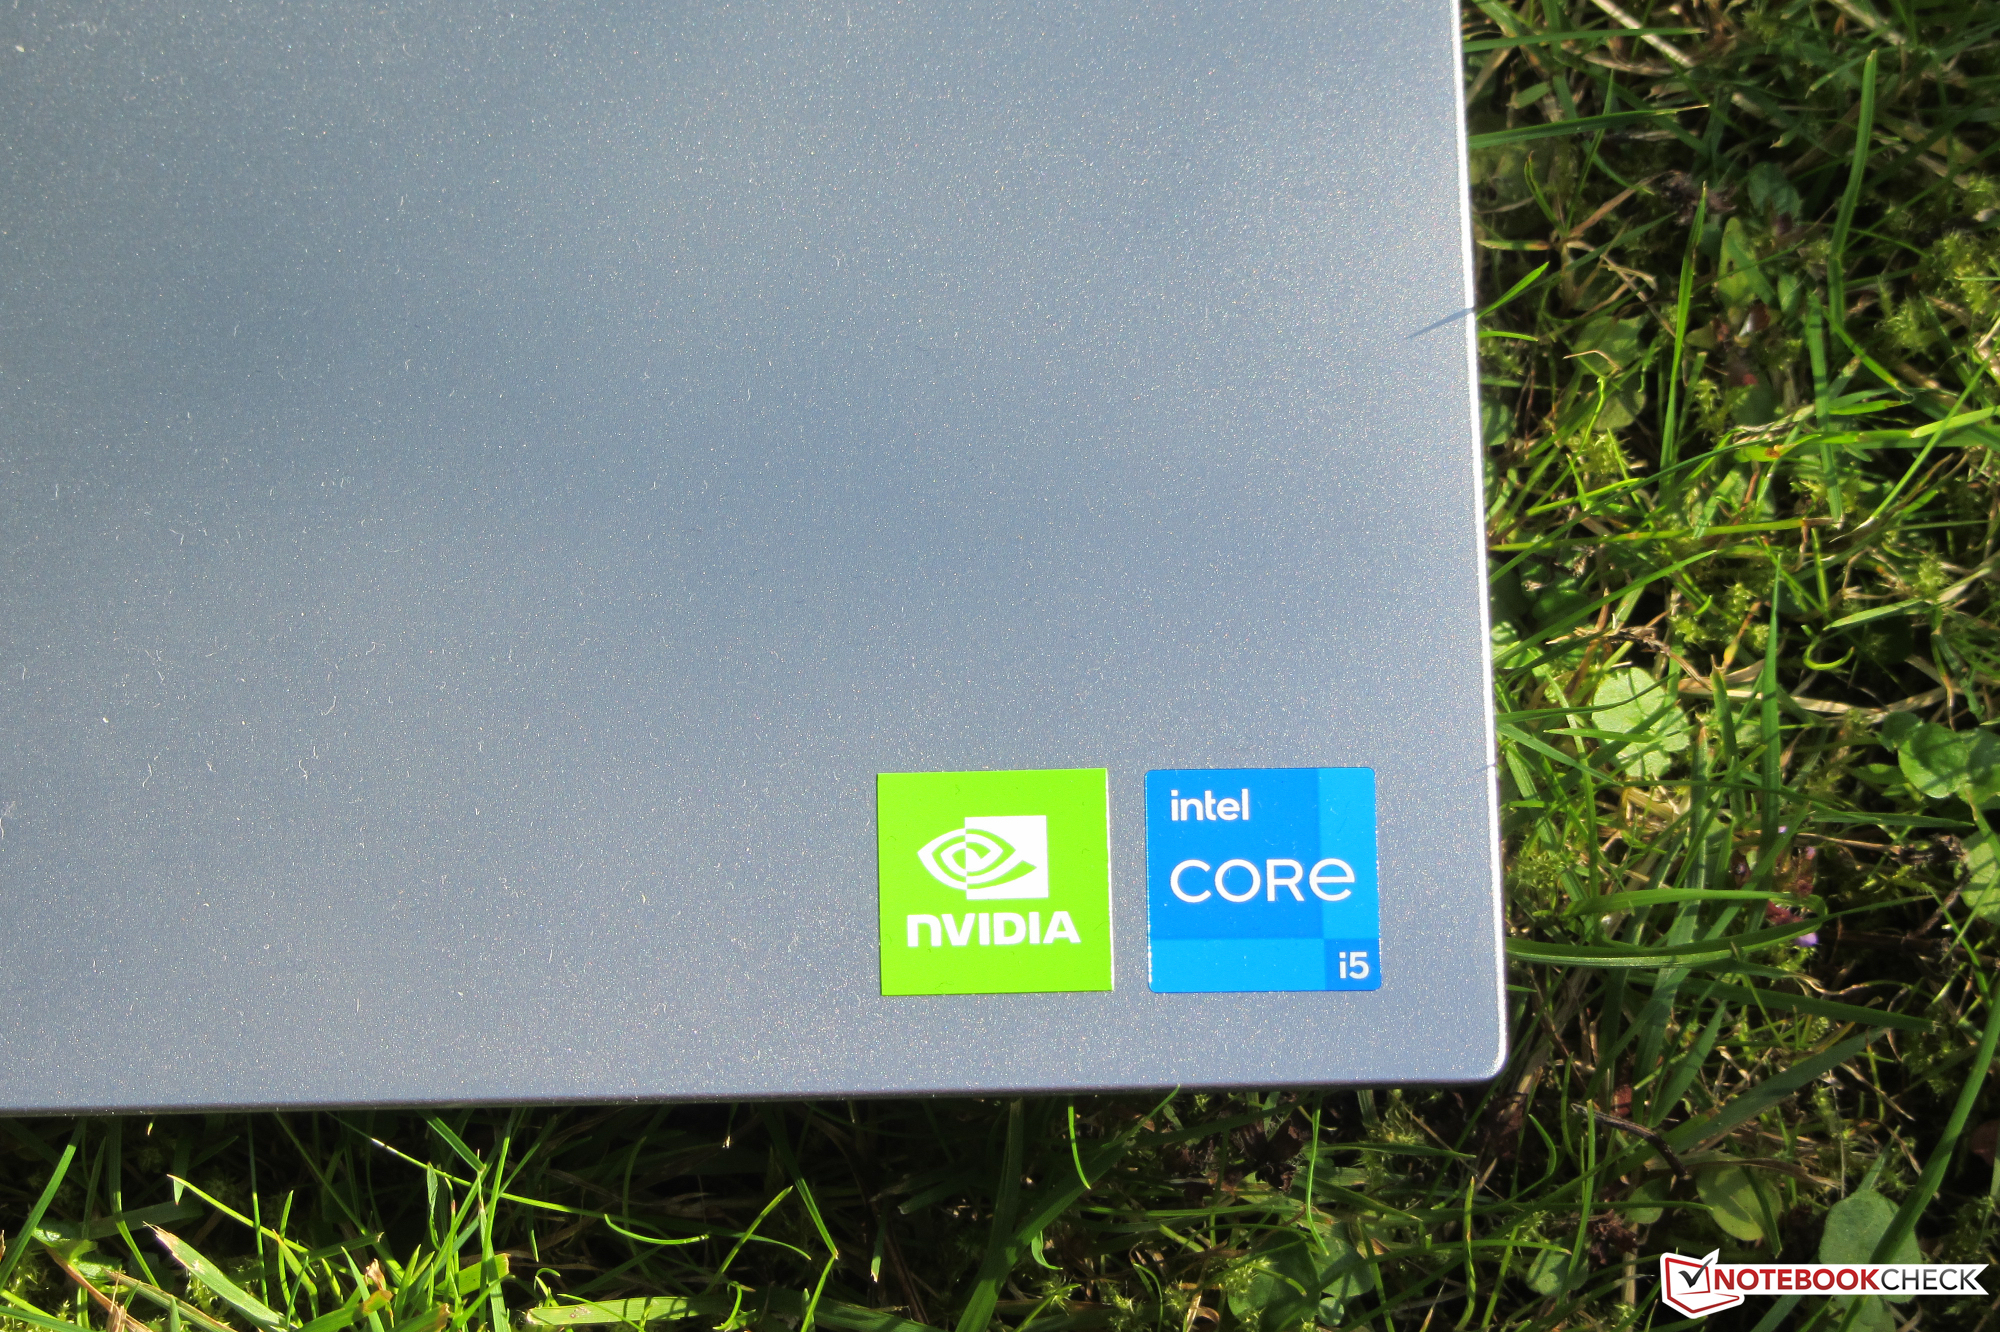
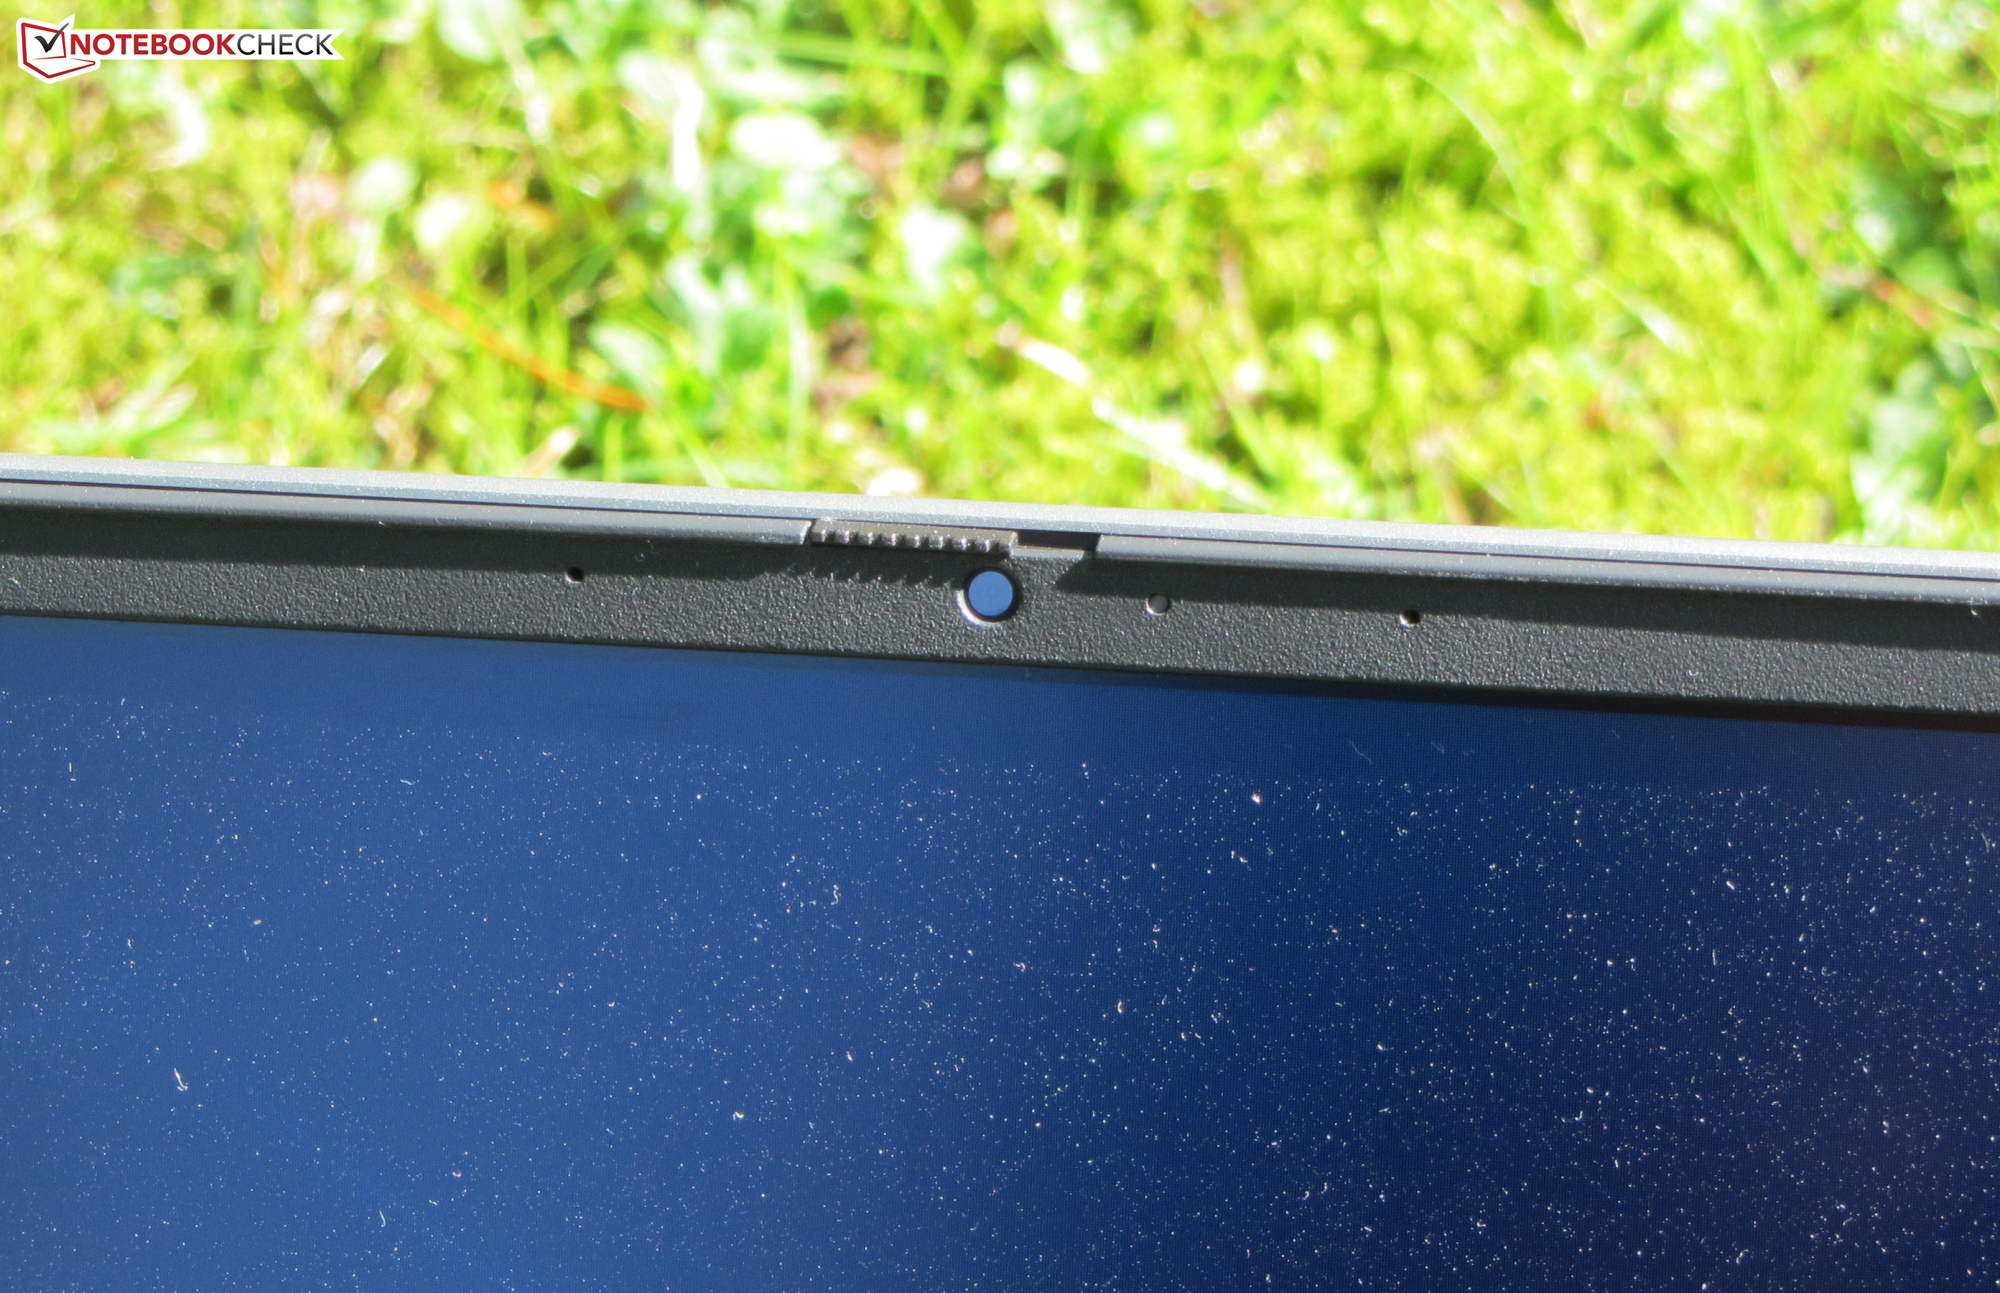
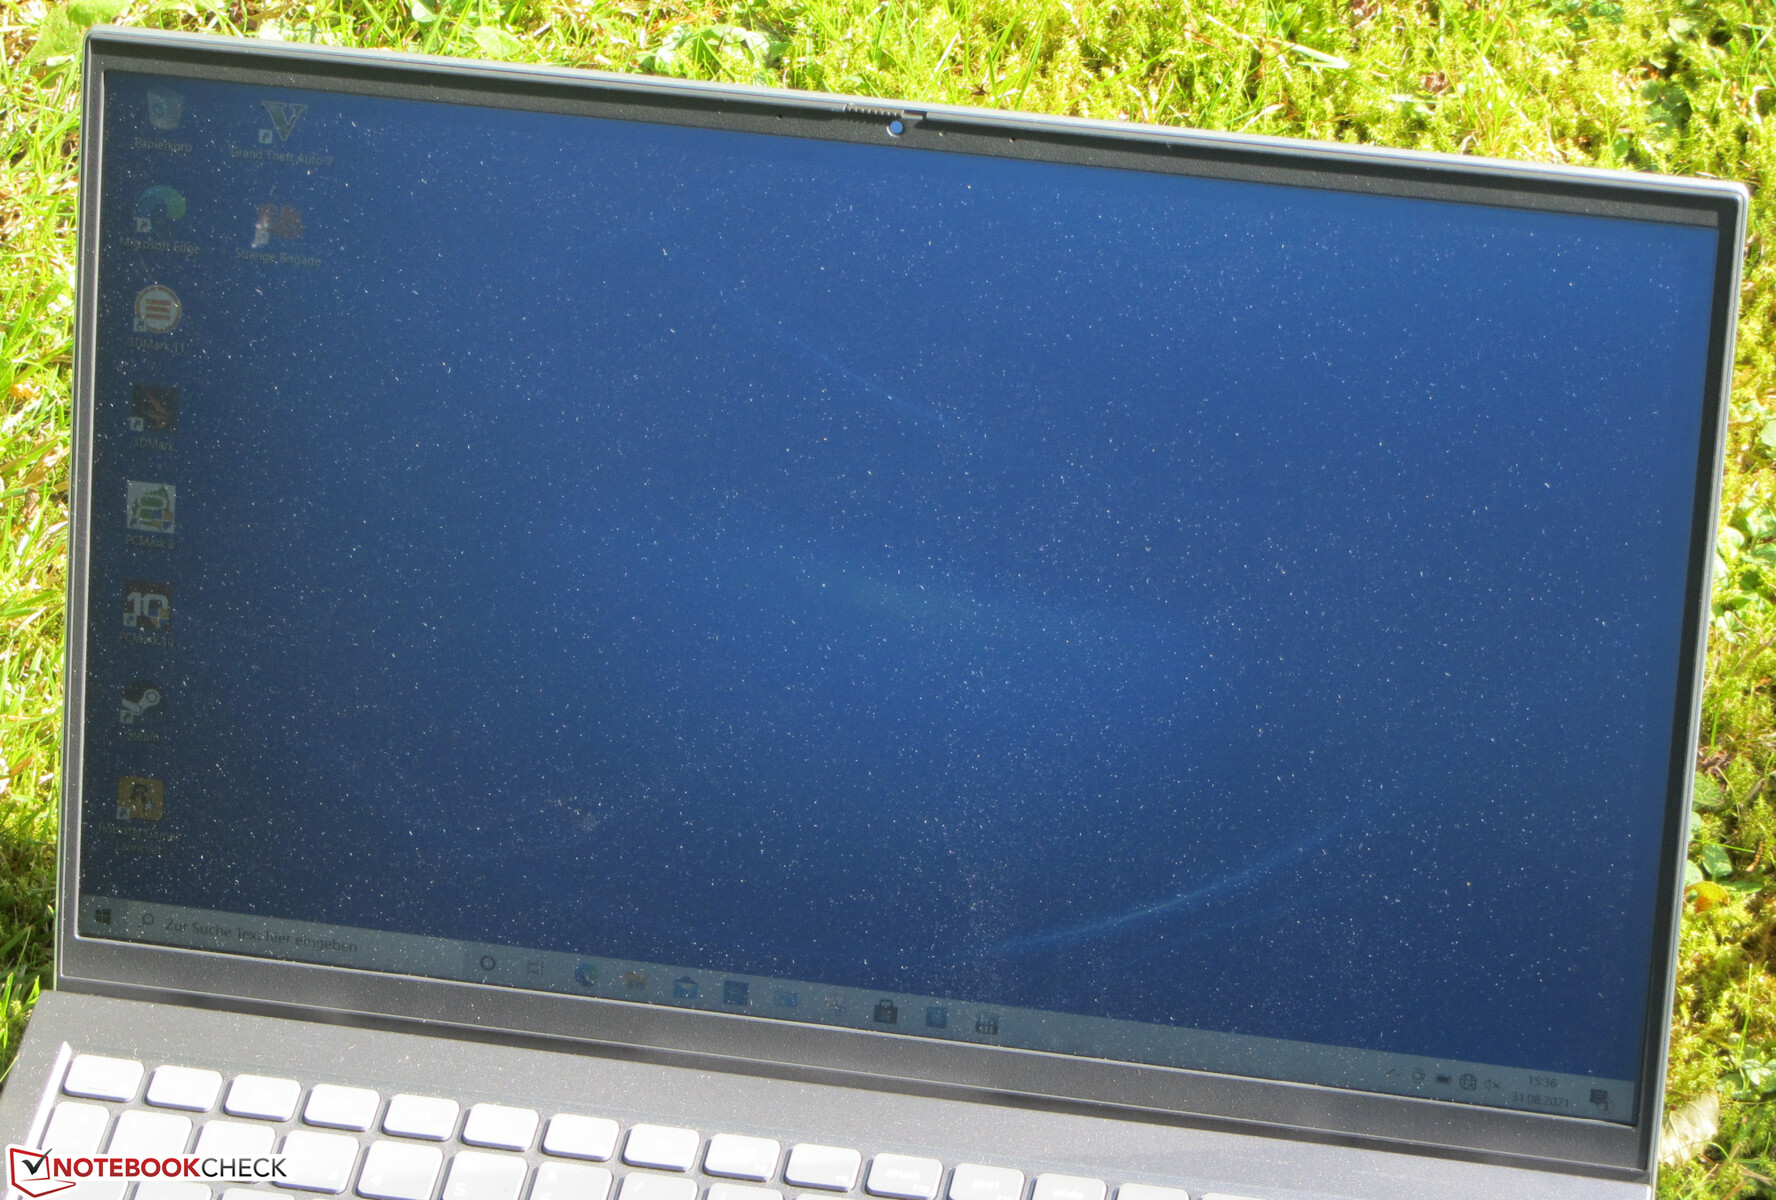
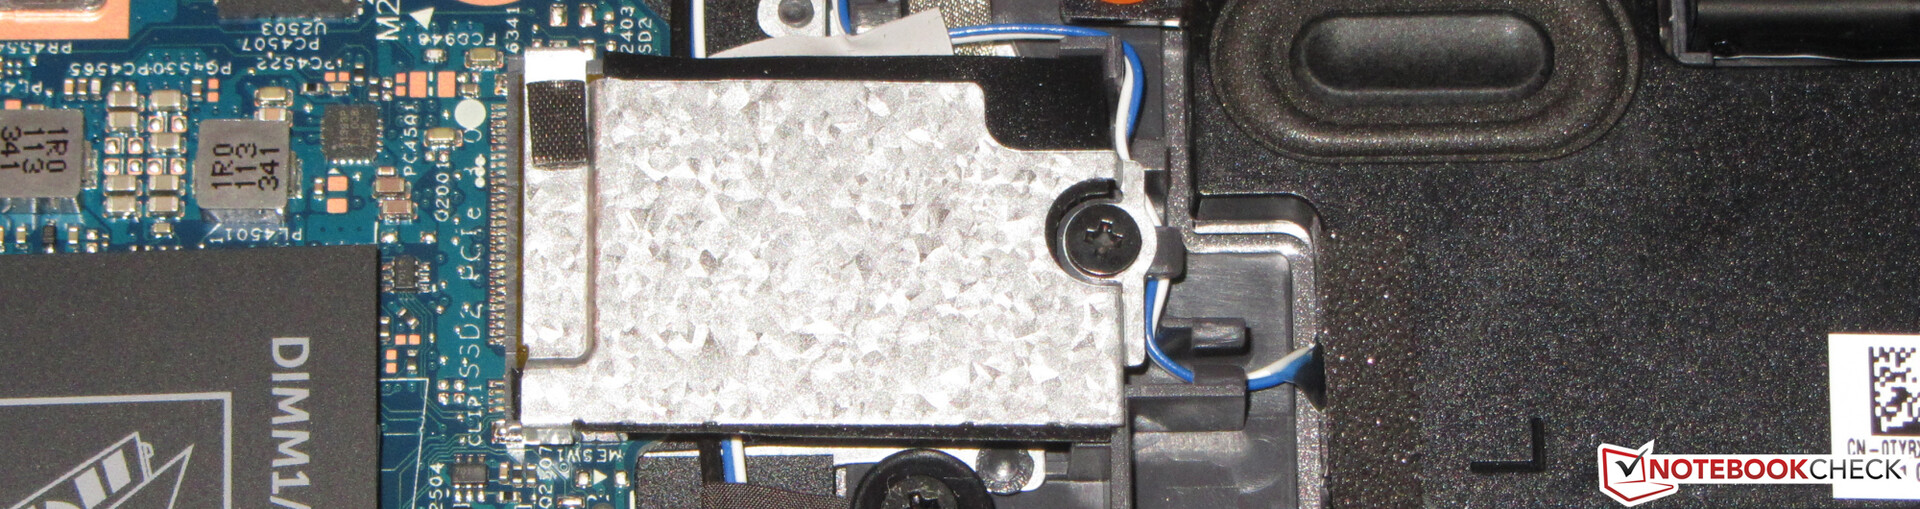
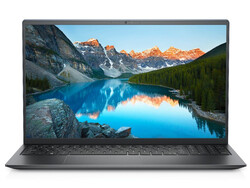
Carcasa y características - El Inspiron viene con una elegante carcasa metálica
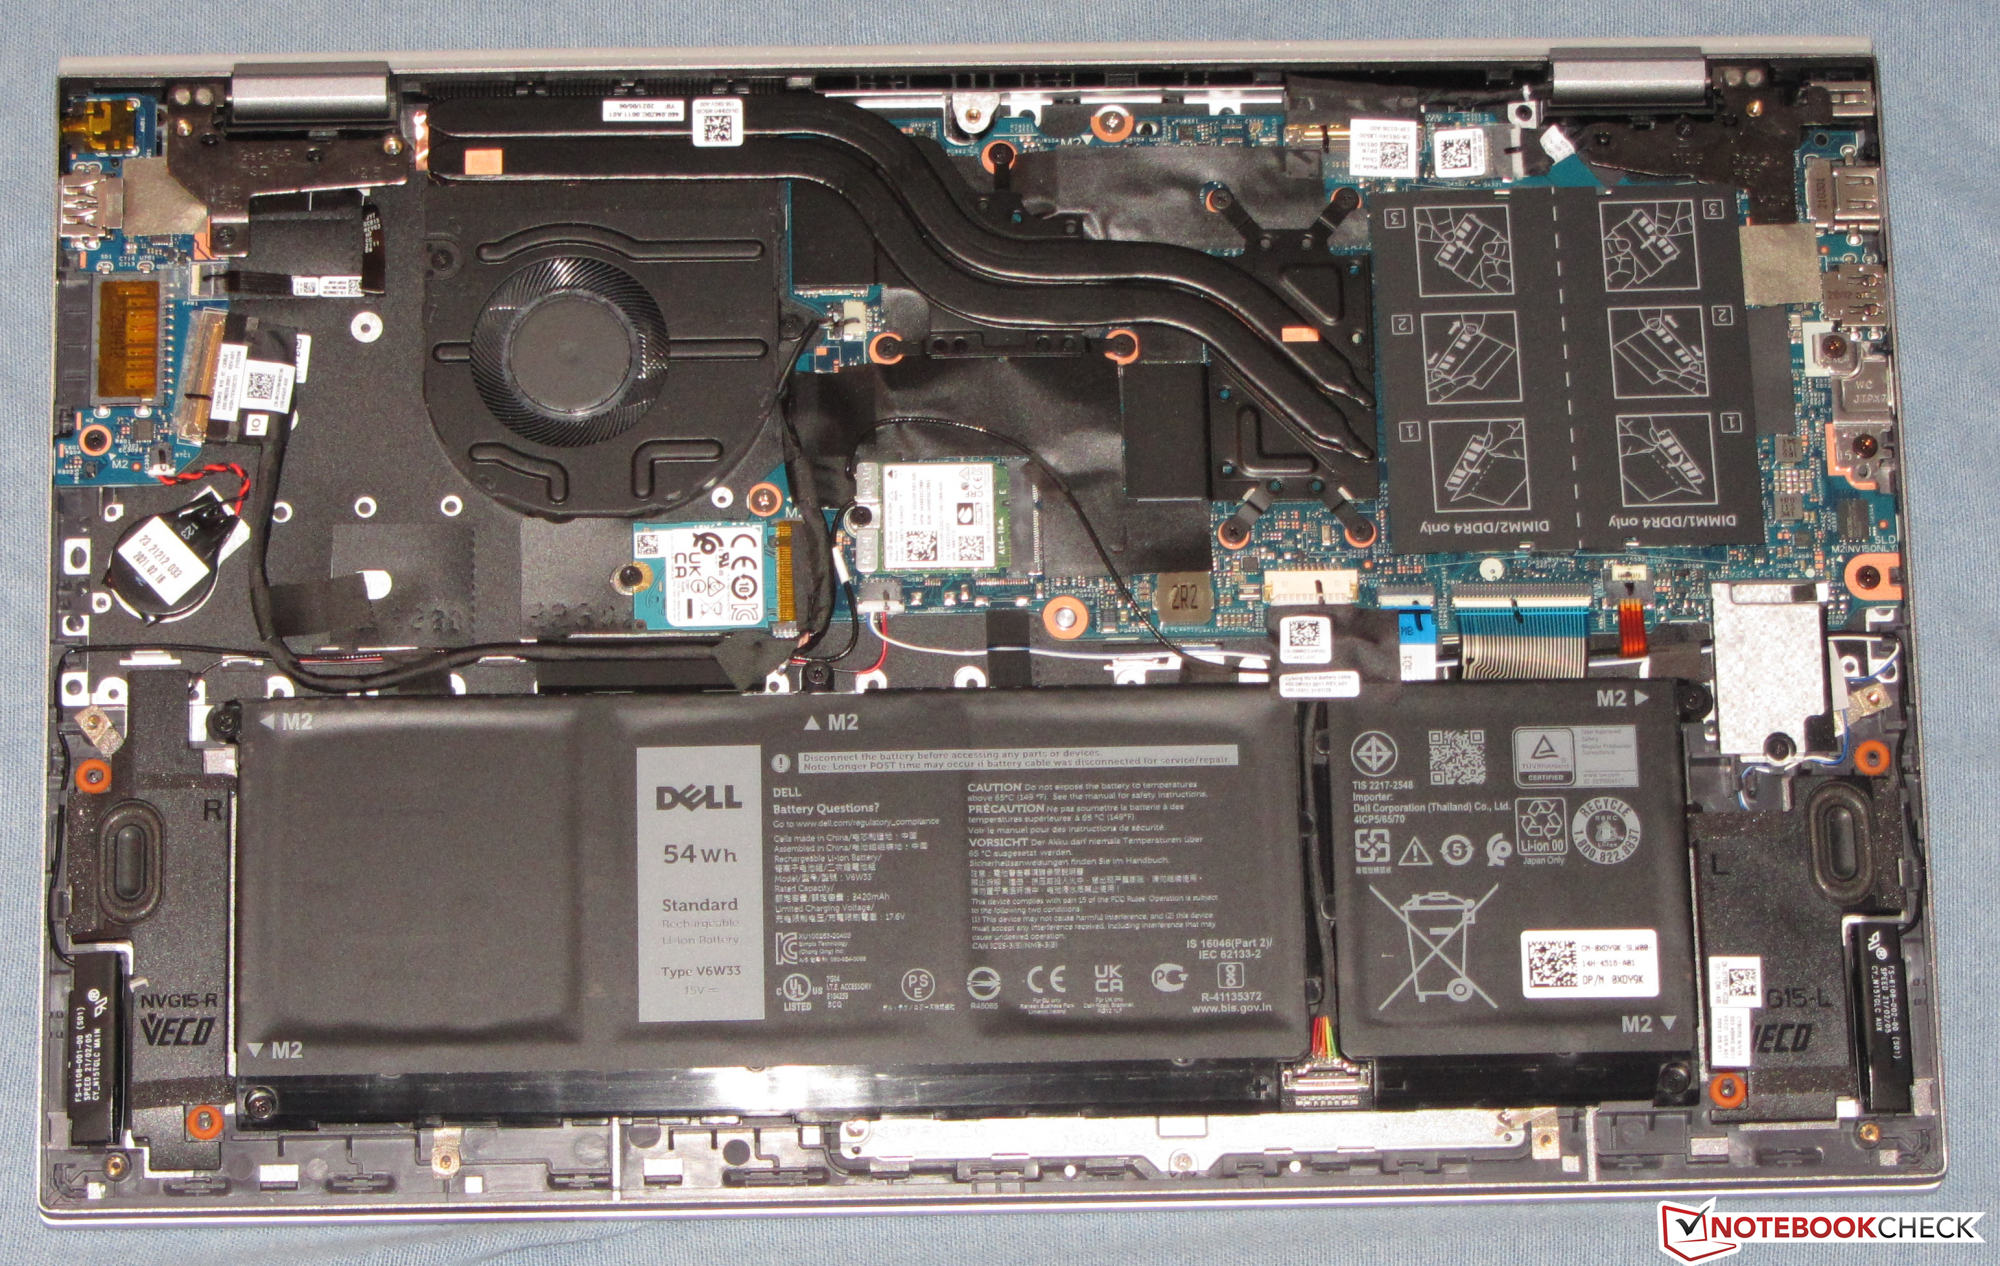
Dell apuesta por undiseñoelegante ychic con superficies lisaspara la delgada carcasa metálica de color gris plata mate del Inspiron.El portátil no revela ningún defecto de fabricación, pero debería ser más rígido en general.La unidad base y la tapa se pueden retorcer demasiado. La batería está firmemente instalada. Las entrañas son accesibles tras retirar la carcasa inferior.
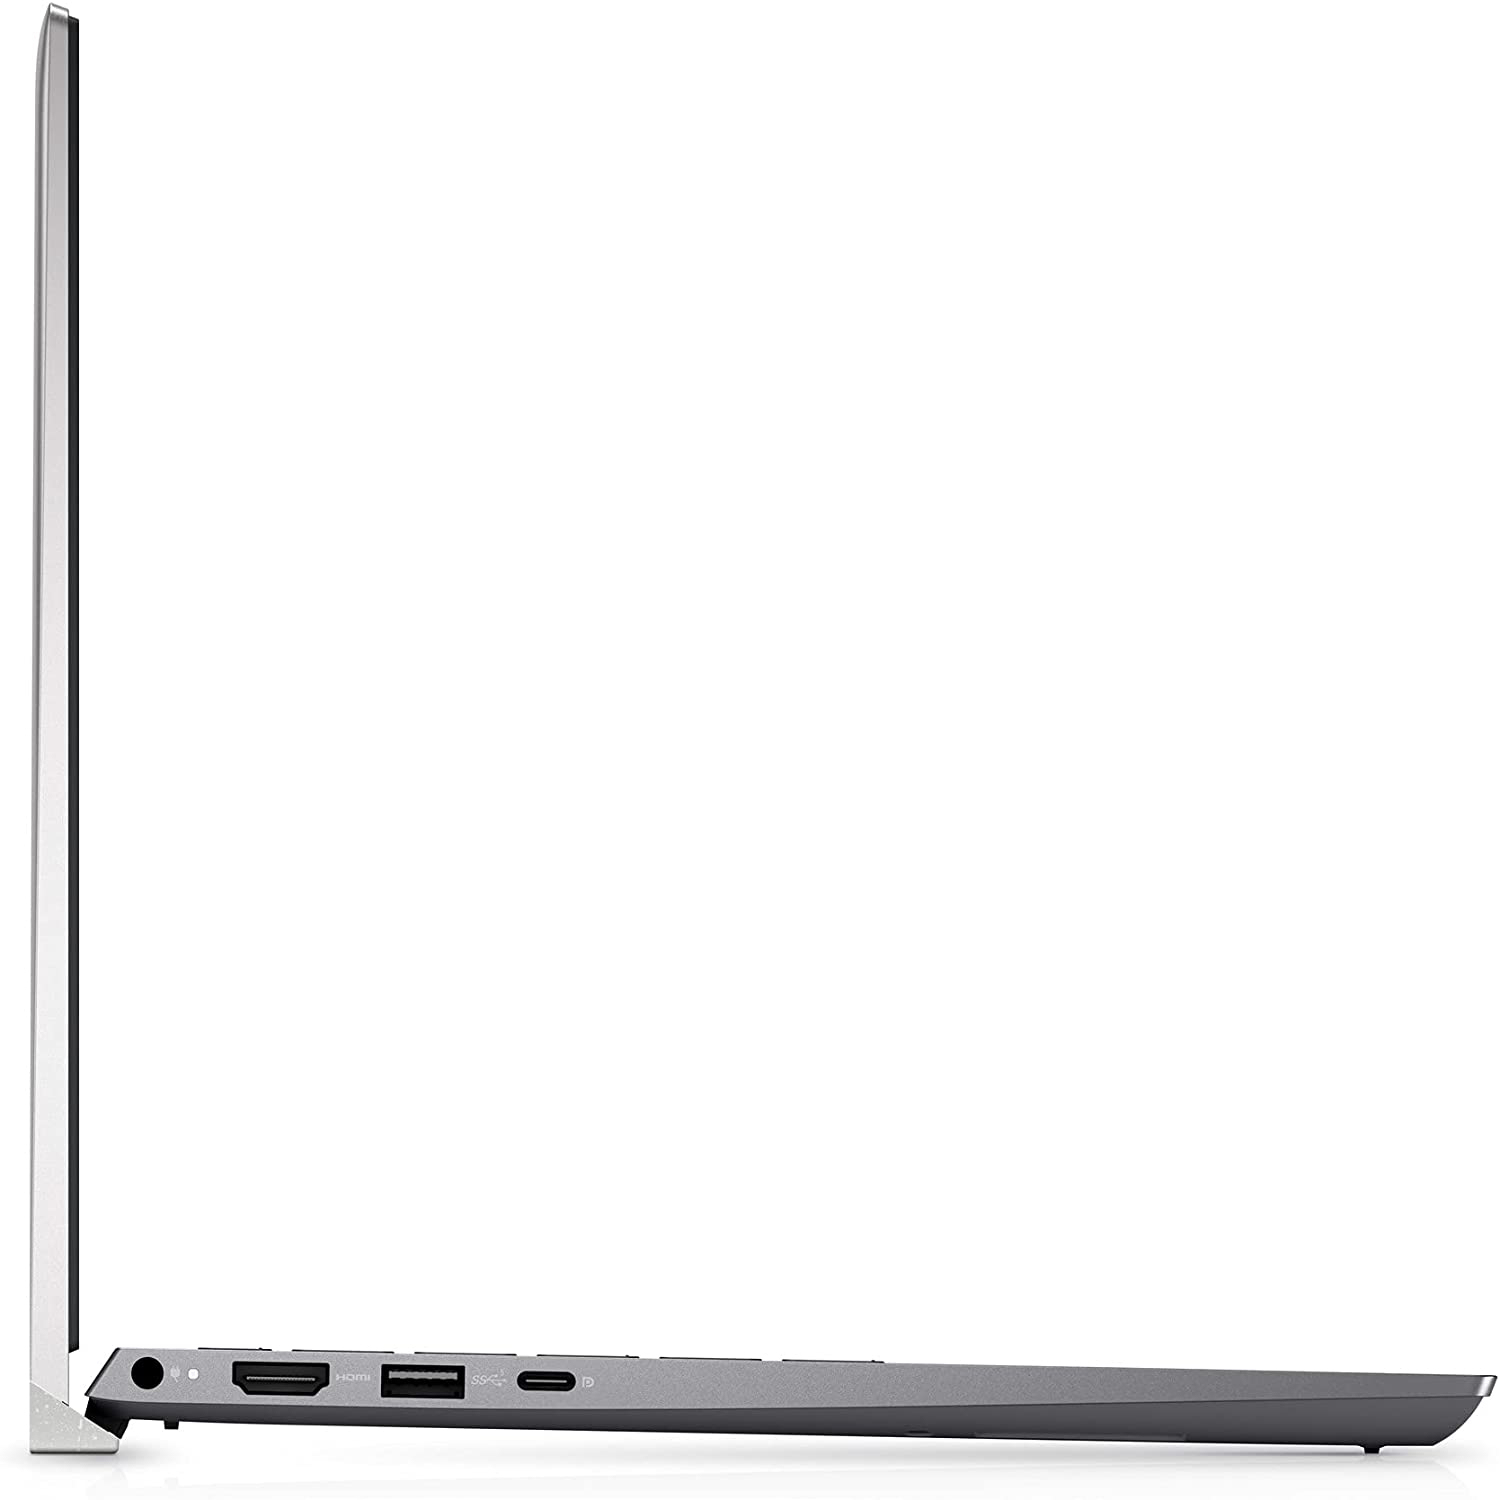
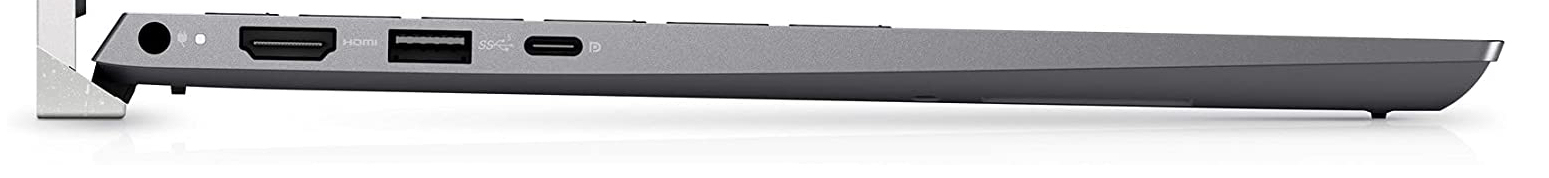
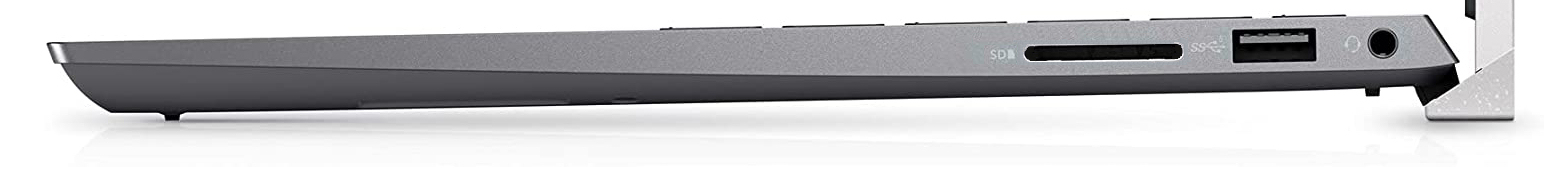
El Inspiron tiene dos puertos USB-A (USB 3.2 Gen 1) y un puerto USB-C (USB 3.2 Gen 2x2; modelos Core i7: Thunderbolt 4). Este último soporta Power Delivery y Displayport-por-USB-C. Así, el 5518 tiene dos salidas de vídeo junto con la ranura HDMI. El lector de tarjetas de memoria SD (tarjeta de referencia: AV PRO SD 128 GB V60) pertenece a los modelos lentos.
Las tasas de datos WLAN se determinaron en condiciones óptimas (sin otros dispositivos WLAN en las cercanías, corta distancia entre el portátil y el PC servidor; router: Netgear Nighthawk AX12) resultan bien, pero siguen estando ligeramente por debajo de las capacidades del chip Intel AX201 instalado.

Equipo de conexión
| SD Card Reader | |
| average JPG Copy Test (av. of 3 runs) | |
| HP Pavilion 15-eg (AV PRO microSD 128 GB V60) | |
| Media de la clase Office (19.8 - 198.5, n=22, últimos 2 años) | |
| Asus VivoBook S15 D533UA (AV PRO microSD 128 GB V60) | |
| Lenovo IdeaPad 5 15ALC05 (Toshiba Exceria Pro SDXC 64 GB UHS-II) | |
| Dell Inspiron 15 5518-2X3JR (AV Pro SD 128 GB V60) | |
| maximum AS SSD Seq Read Test (1GB) | |
| Lenovo IdeaPad 5 Pro 16IHU6 (AV PRO microSD 128 GB V60) | |
| Media de la clase Office (27.4 - 249, n=21, últimos 2 años) | |
| HP Pavilion 15-eg (AV PRO microSD 128 GB V60) | |
| Asus VivoBook S15 D533UA (AV PRO microSD 128 GB V60) | |
| Lenovo IdeaPad 5 15ALC05 (Toshiba Exceria Pro SDXC 64 GB UHS-II) | |
| Dell Inspiron 15 5518-2X3JR (AV Pro SD 128 GB V60) | |


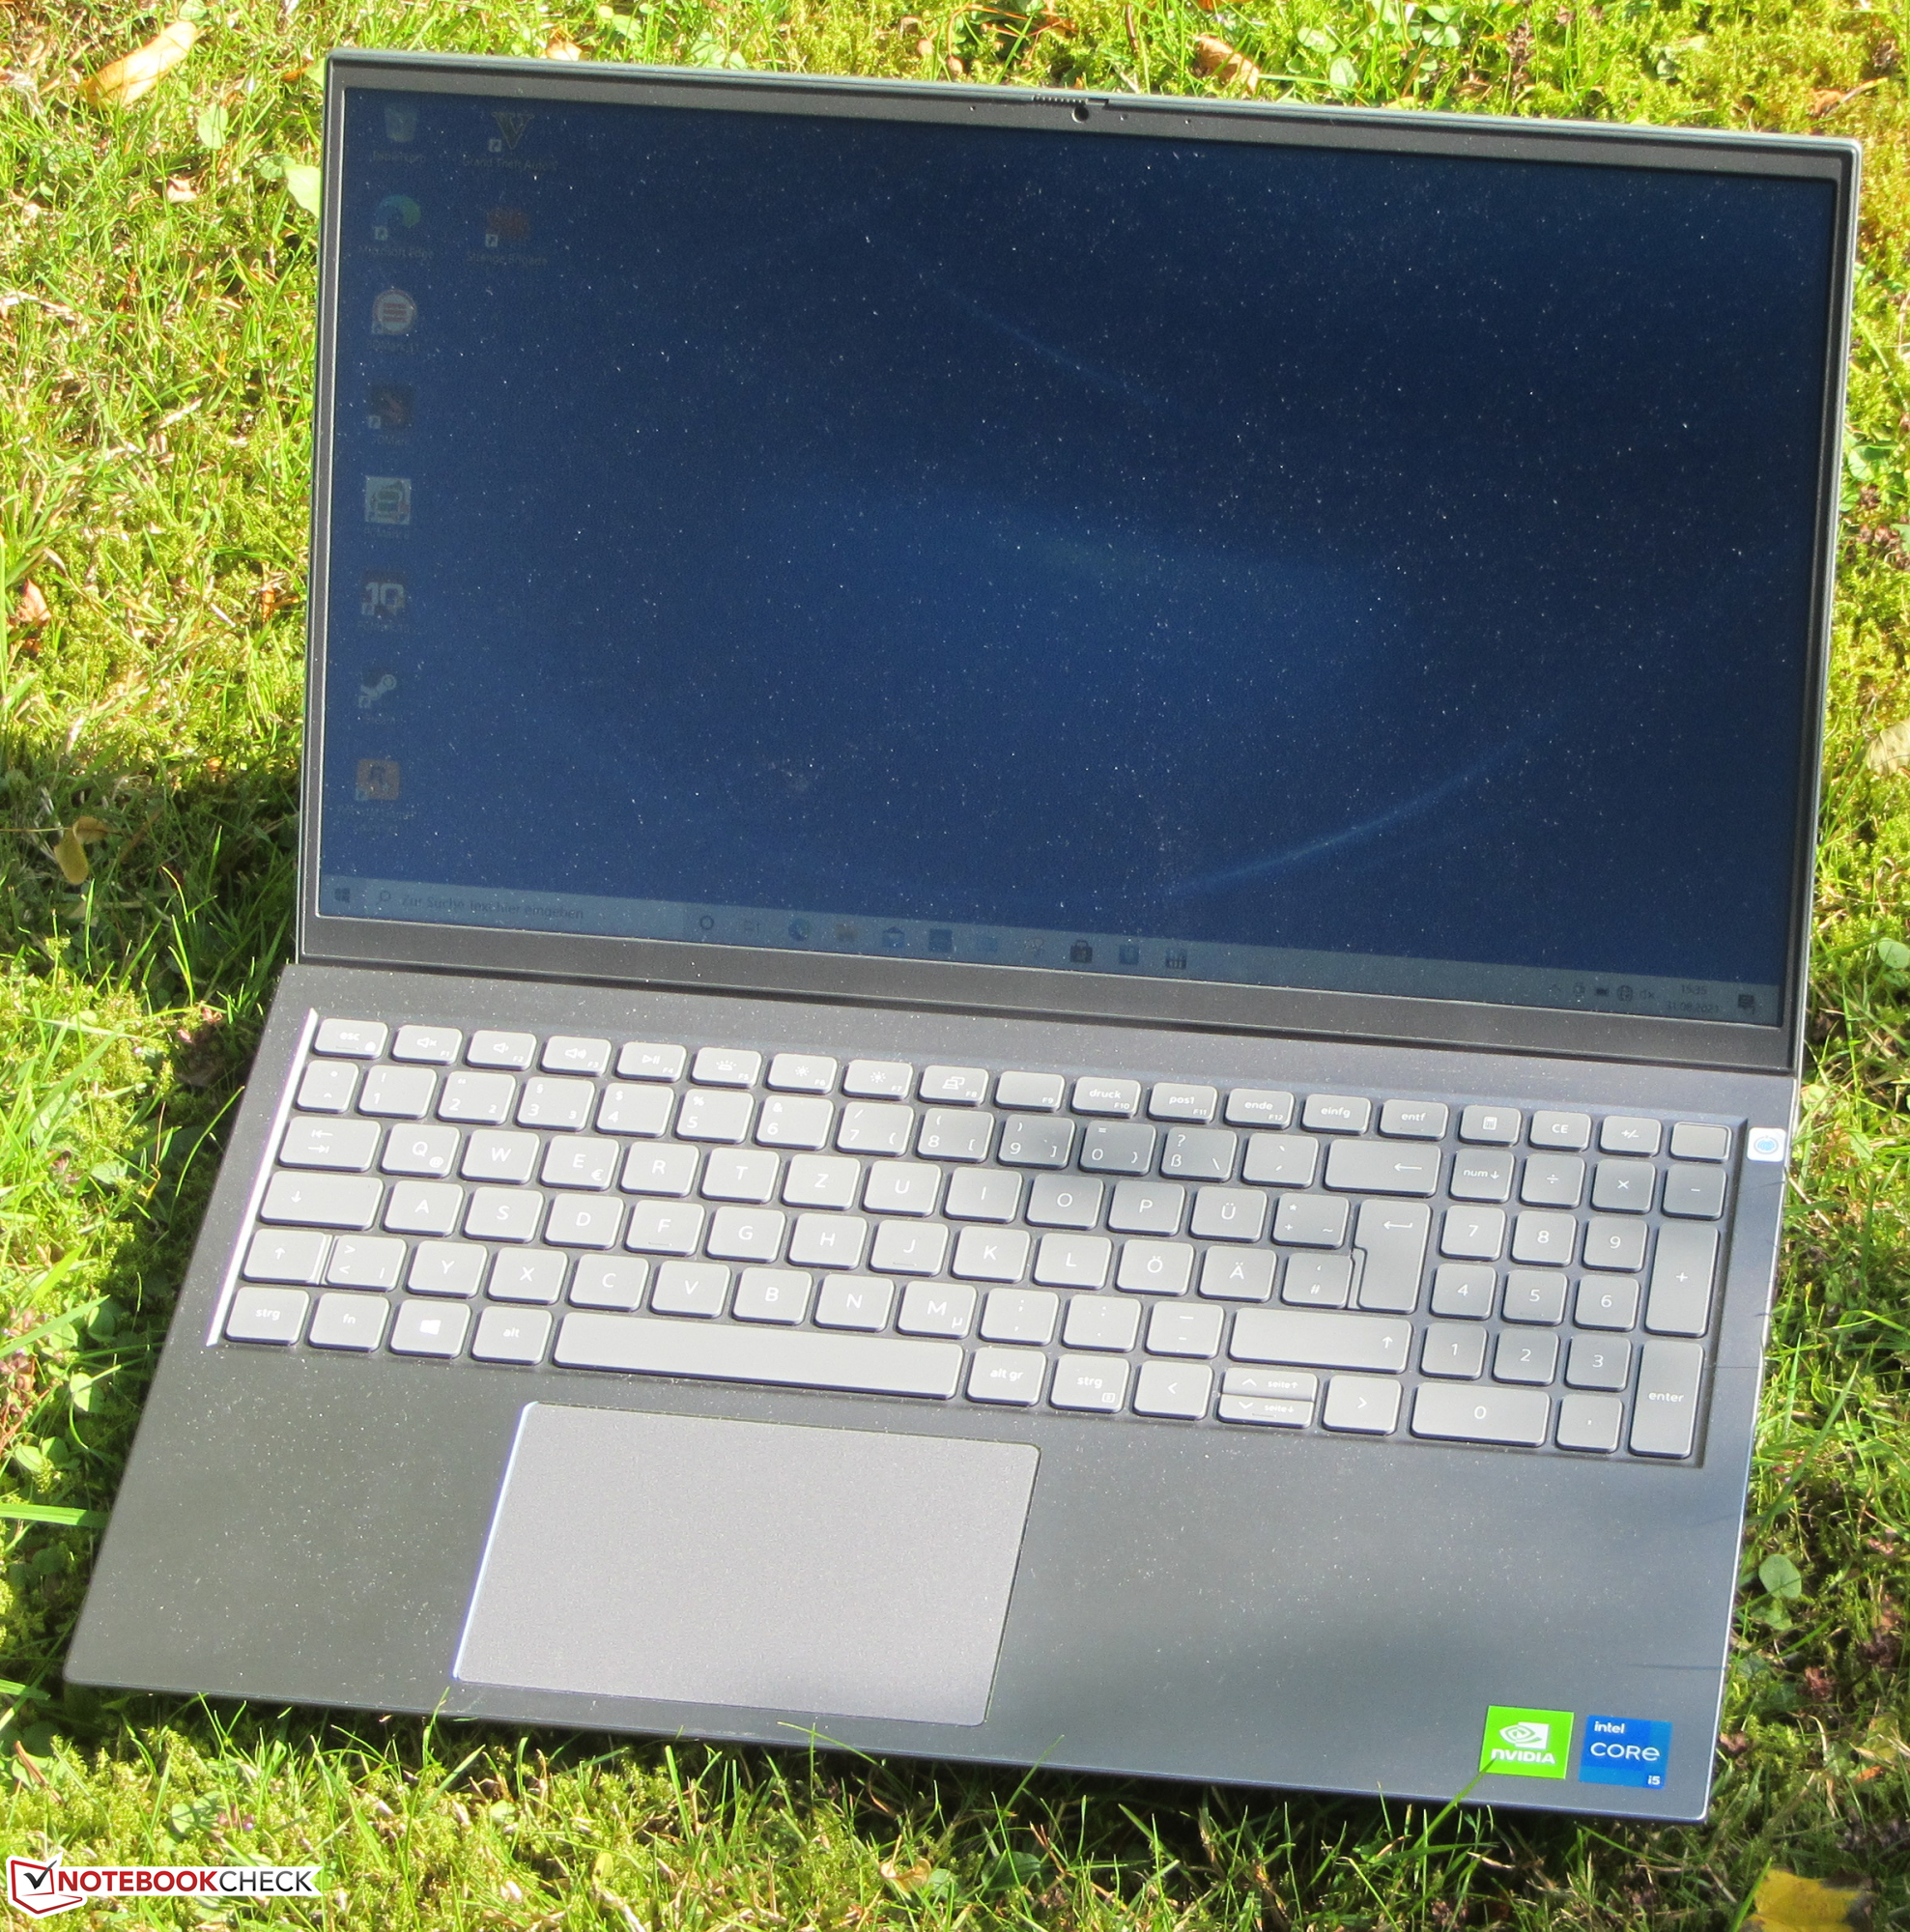
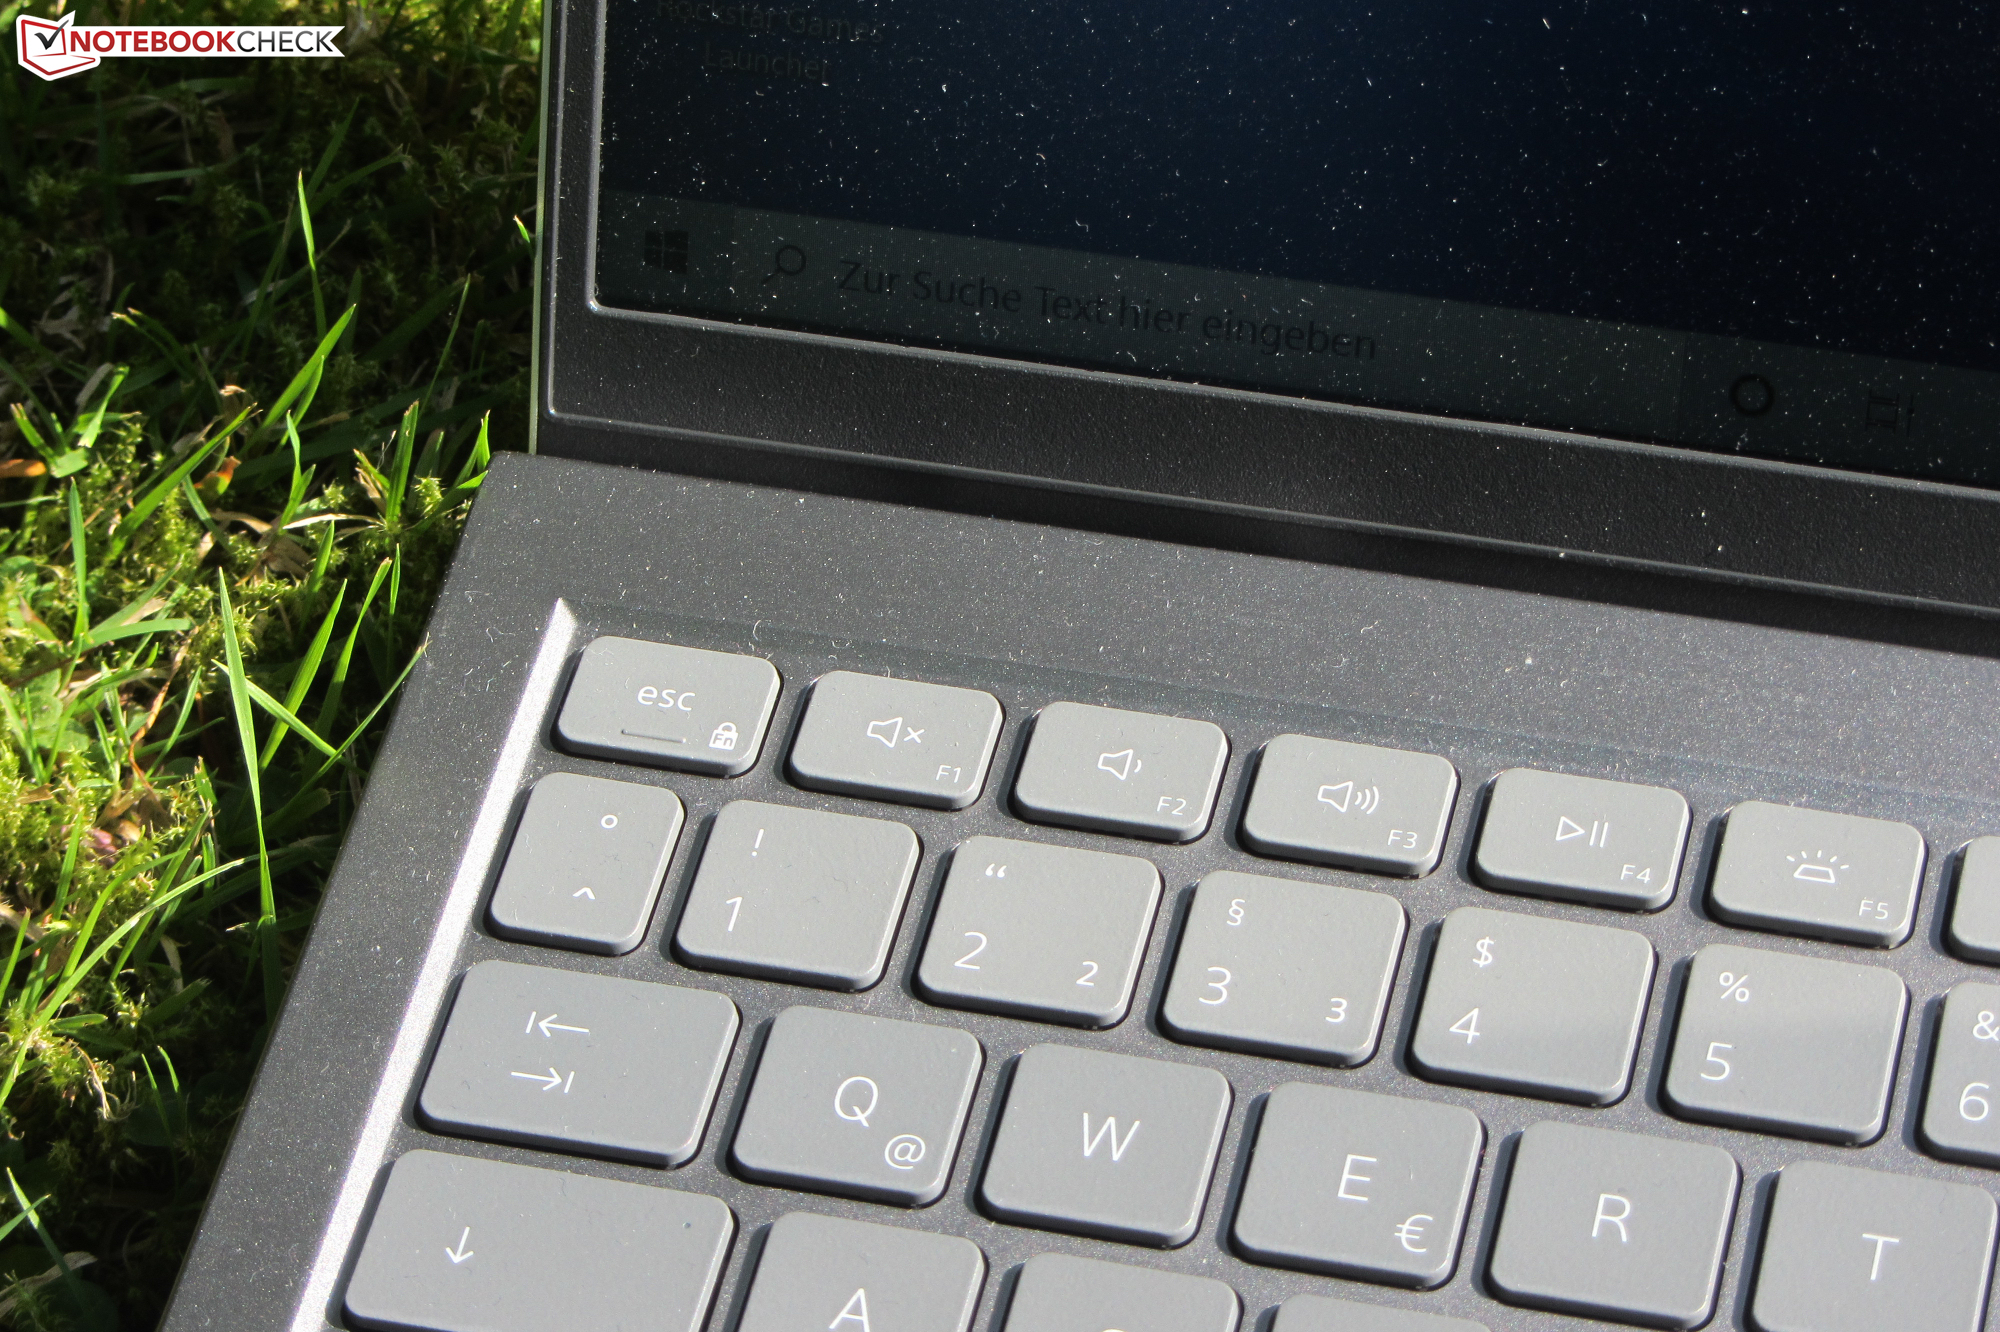
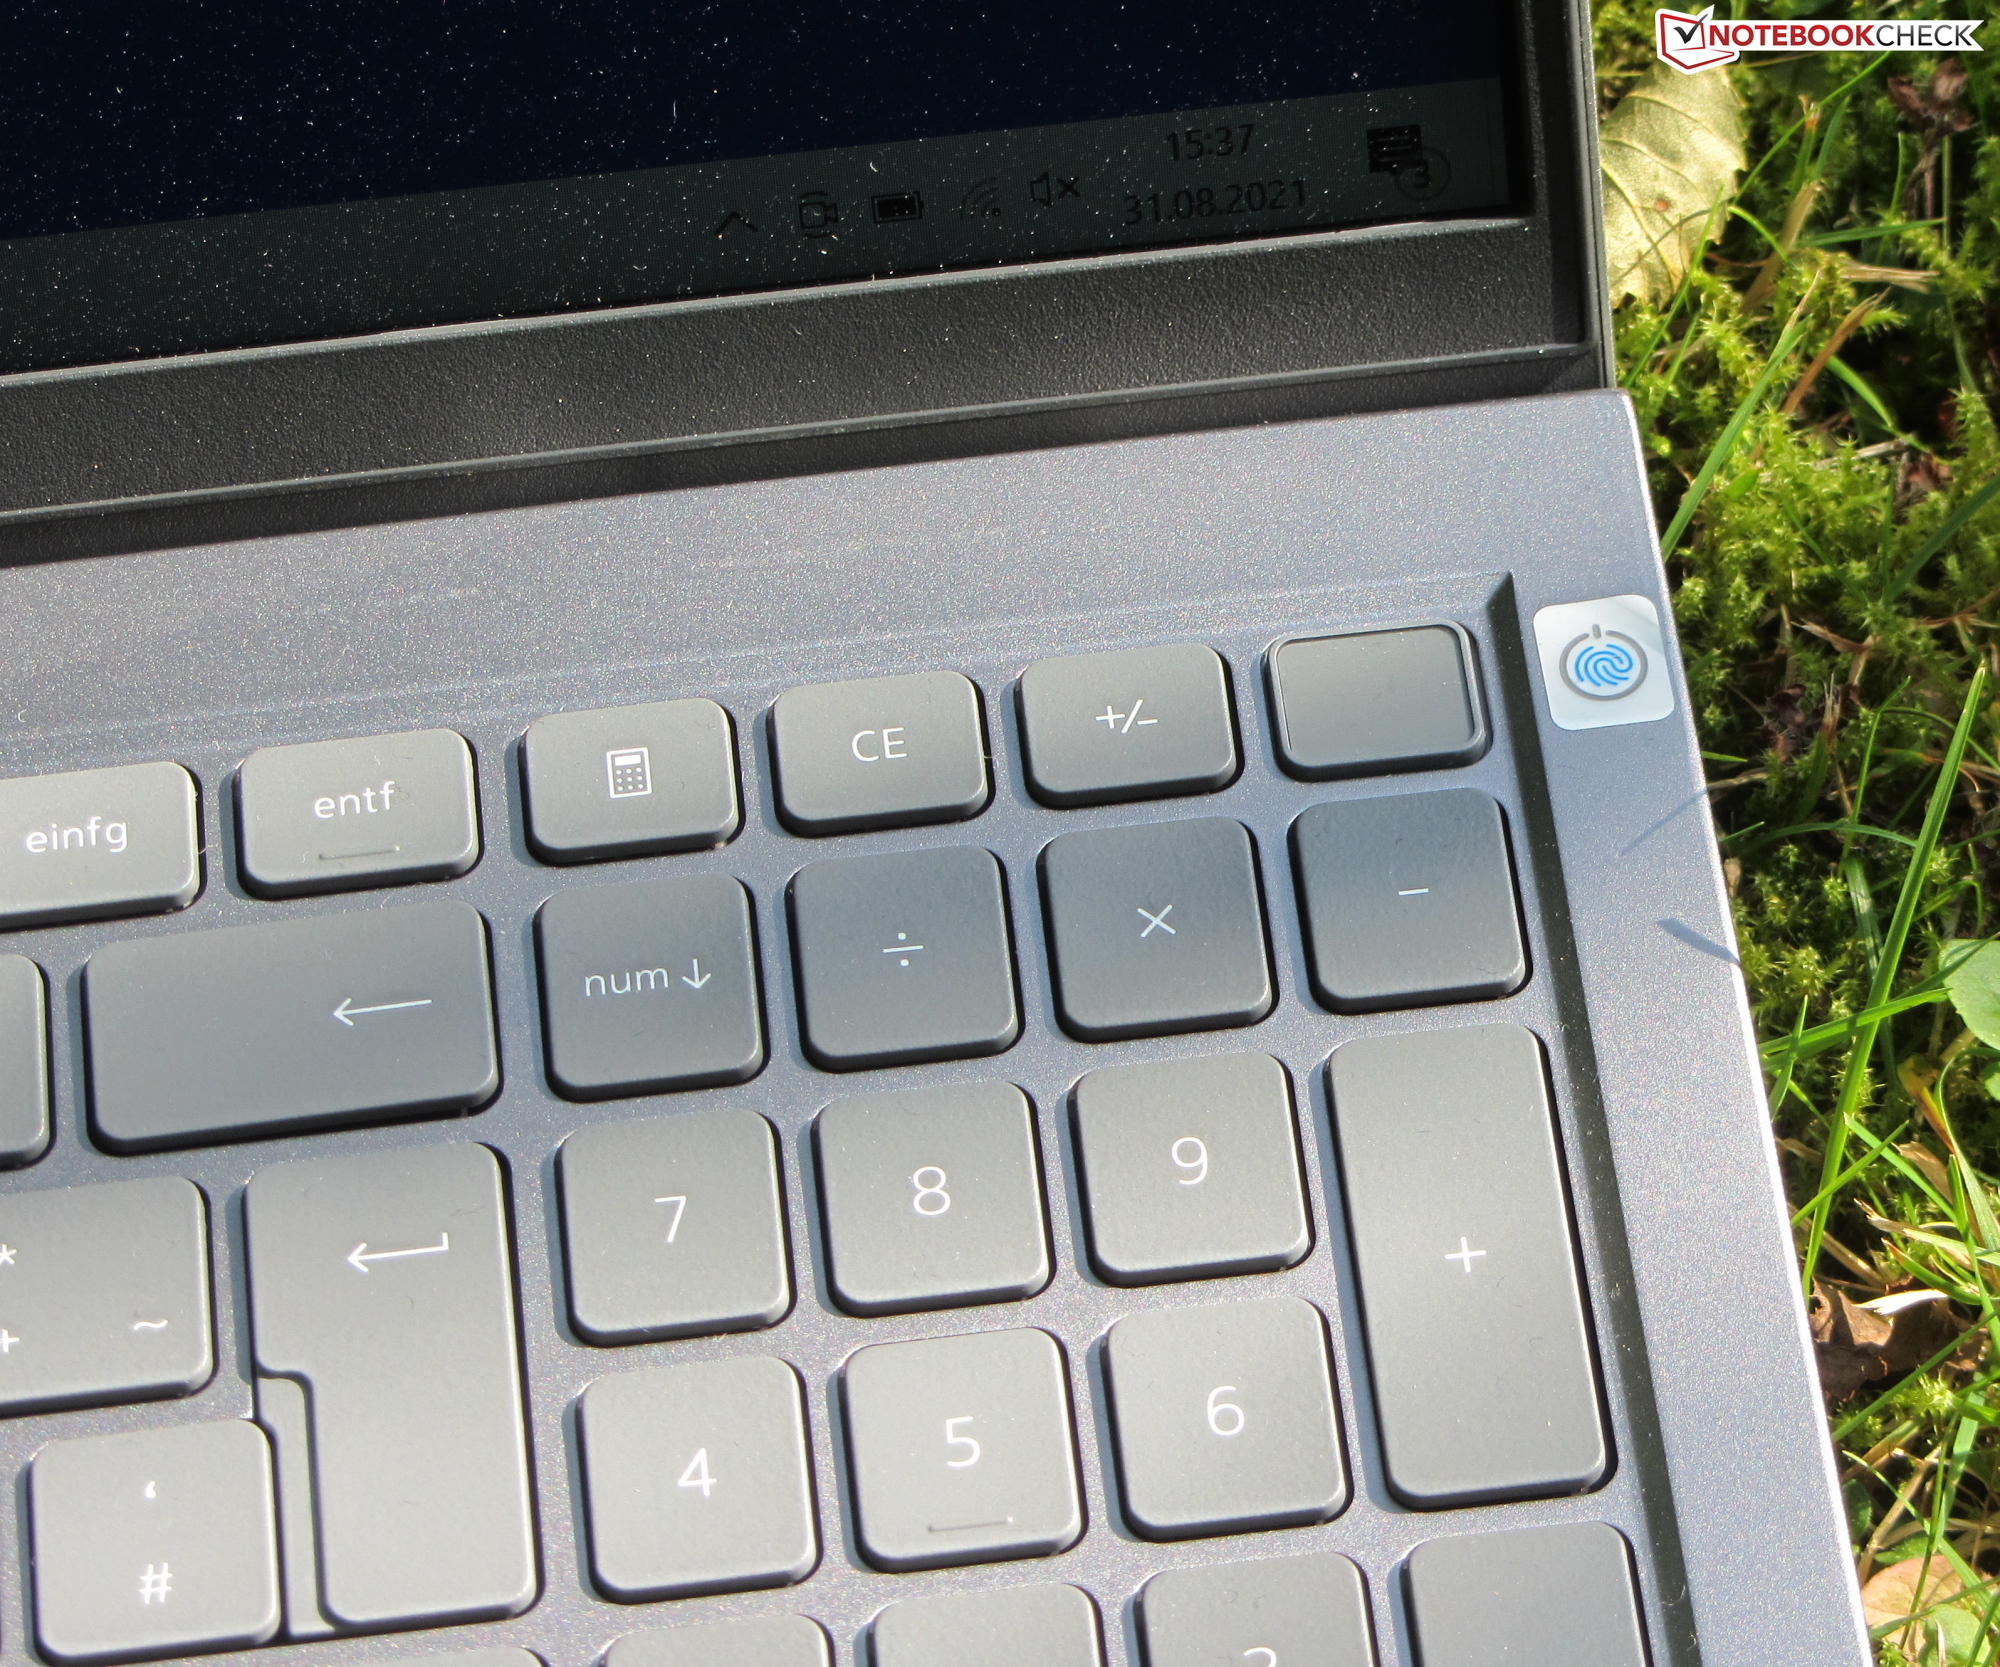
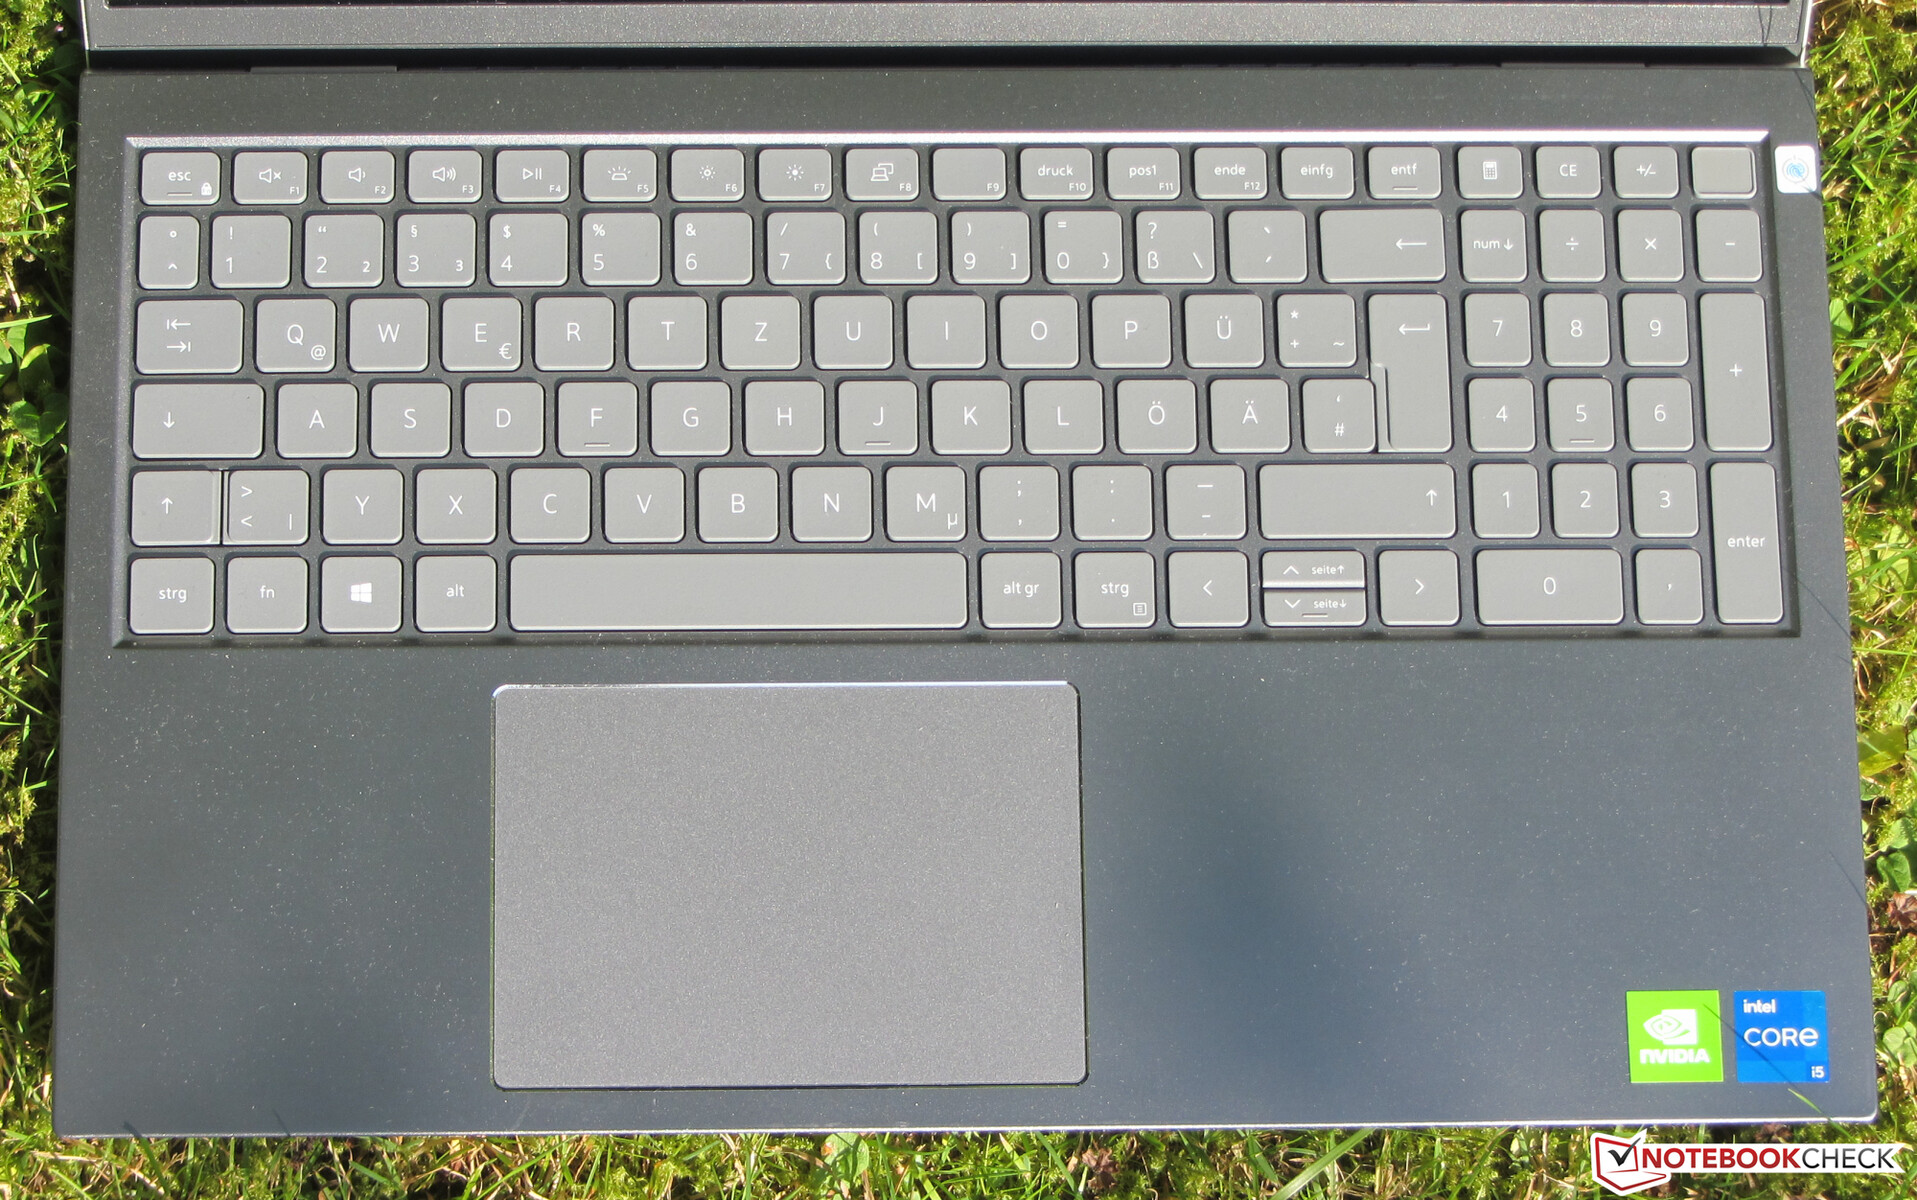
Dispositivos de entrada: el Dell 5518 ofrece iluminación de las teclas
Las teclas ligeramente rugosas del teclado chiclet iluminado tienen un recorrido corto y un punto de presión claro. La resistencia de las teclas es agradable. El teclado cede un poco al escribir, más en el centro que en los bordes. La iluminación (dos niveles de brillo) se controla mediante una tecla de función. En general, Dell ofrece un teclado adecuado para el uso diario.
El ClickPad multitáctil (aprox. 11,5 x 8 cm) responde a las entradas incluso en las esquinas. La superficie lisa facilita el deslizamiento de los dedos. El pad tiene un recorrido corto y un punto de presión claro.
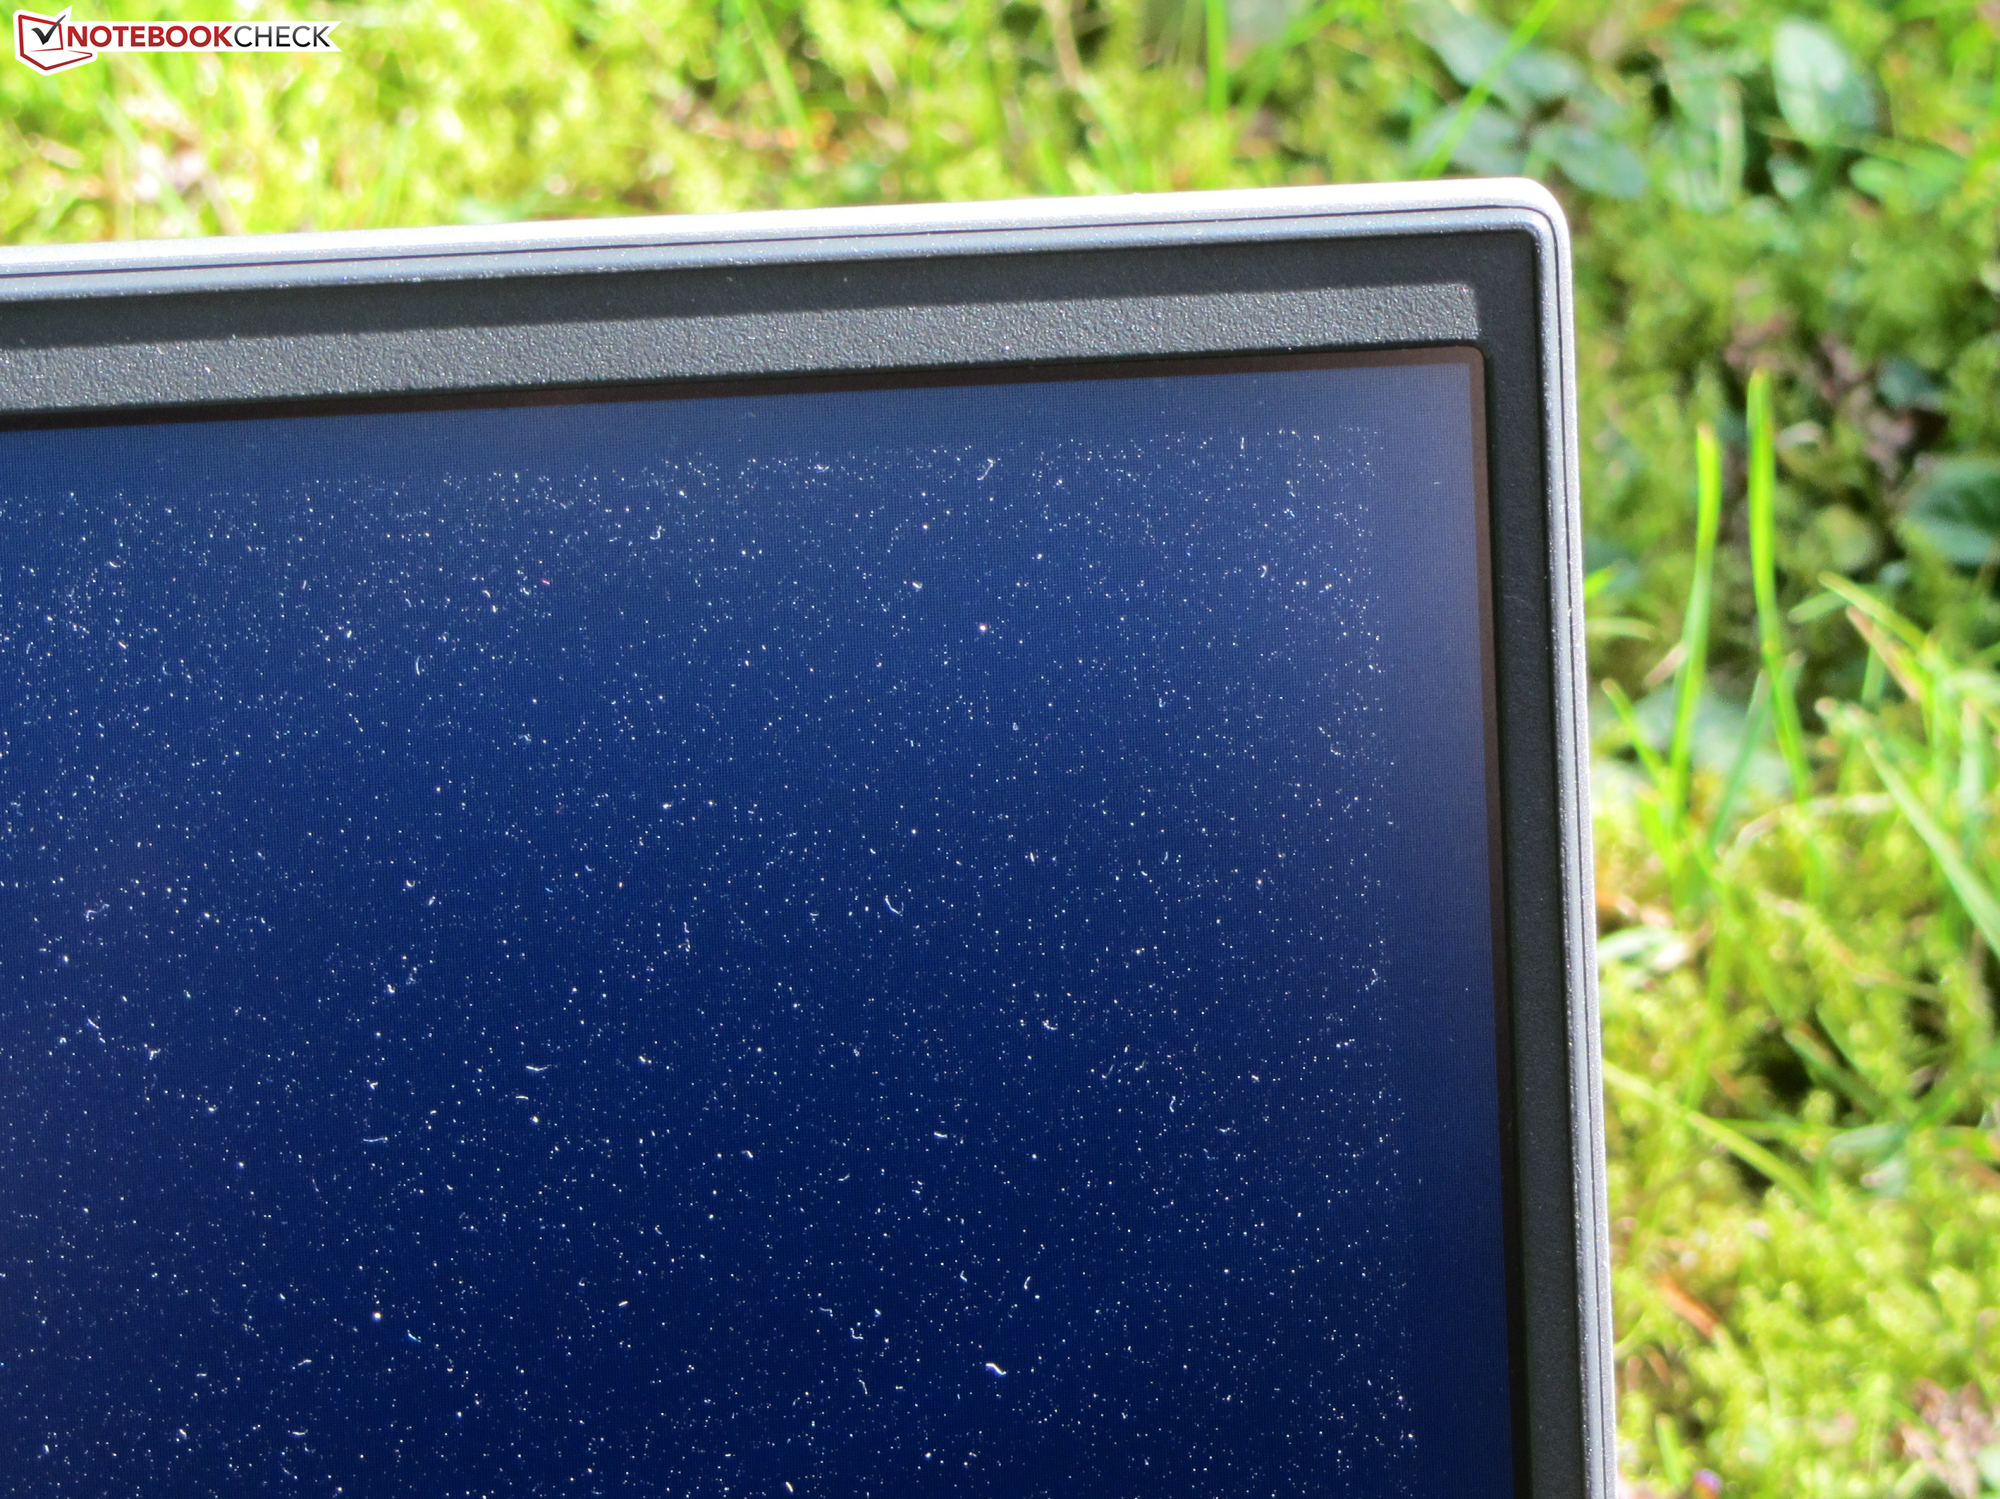
Pantalla - IPS a bordo
Mientras que la pantalla mate de 15,6 pulgadas (1.920 x 1.080 píxeles) ofrece un buen contraste (1.040:1), el brillo (267,8 cd/m²) es demasiado bajo. El valor cae un poco más en modo batería. Consideramos que los valores superiores a 300 cd/m² son buenos.
La pantalla muestra parpadeos con una frecuencia de 1.000 Hz a niveles de brillo del 90 por ciento e inferiores. Debido a la frecuencia bastante alta, las personas sensibles deberían librarse de dolores de cabeza y/o problemas oculares.
| |||||||||||||||||||||||||
iluminación: 87 %
Brillo con batería: 257 cd/m²
Contraste: 1040:1 (Negro: 0.275 cd/m²)
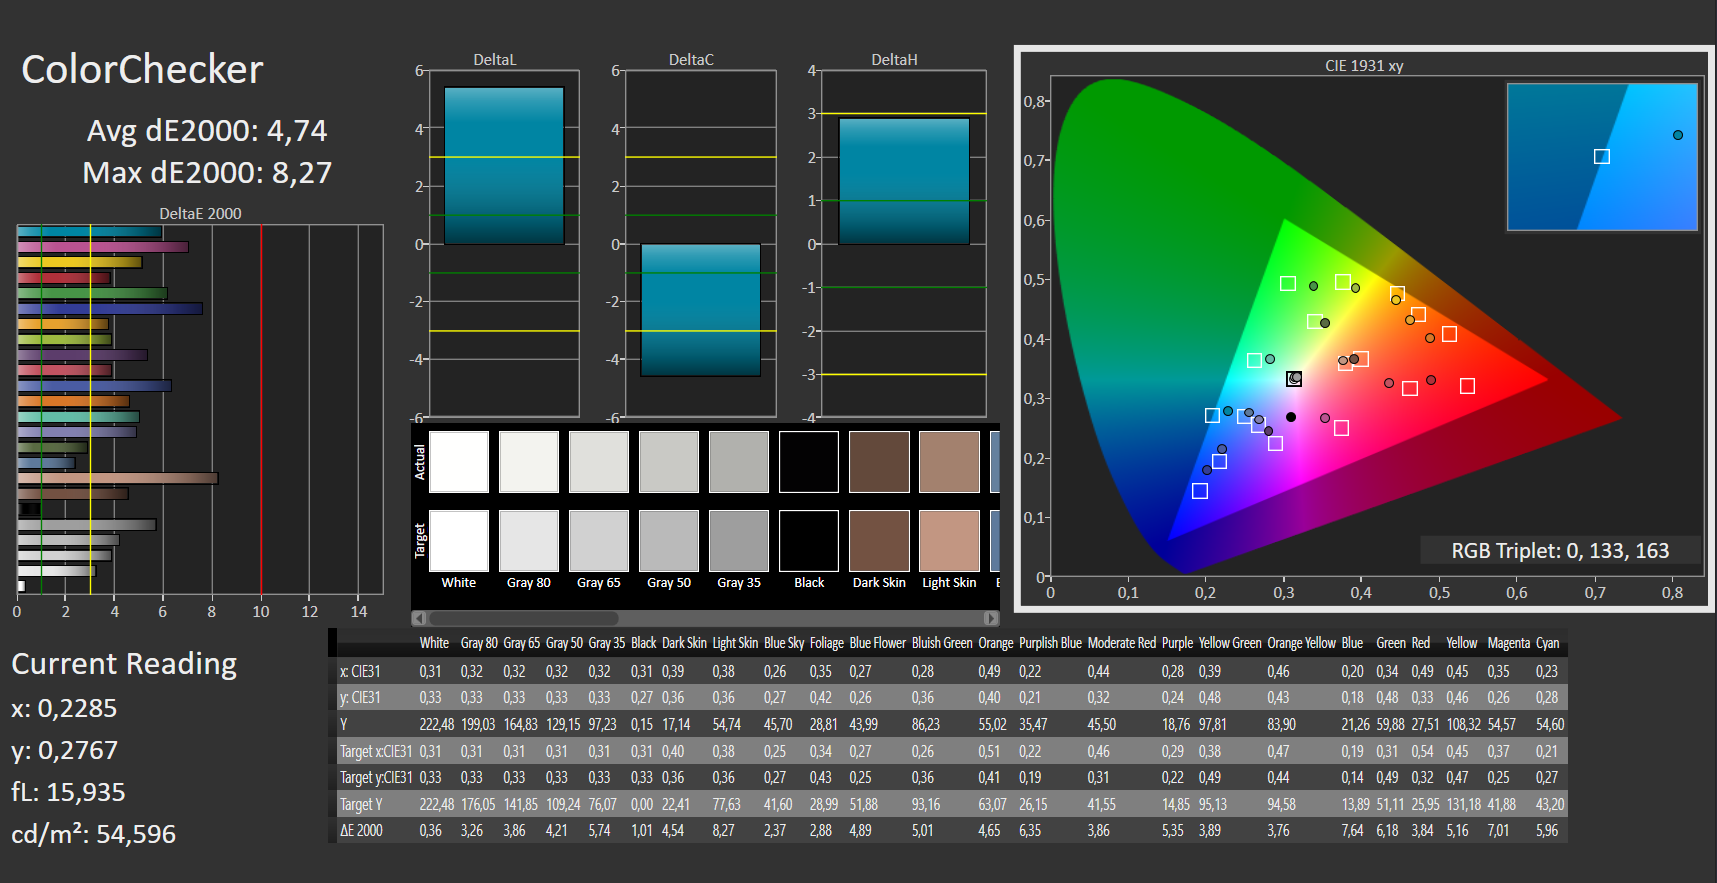
ΔE ColorChecker Calman: 4.74 | ∀{0.5-29.43 Ø4.71}
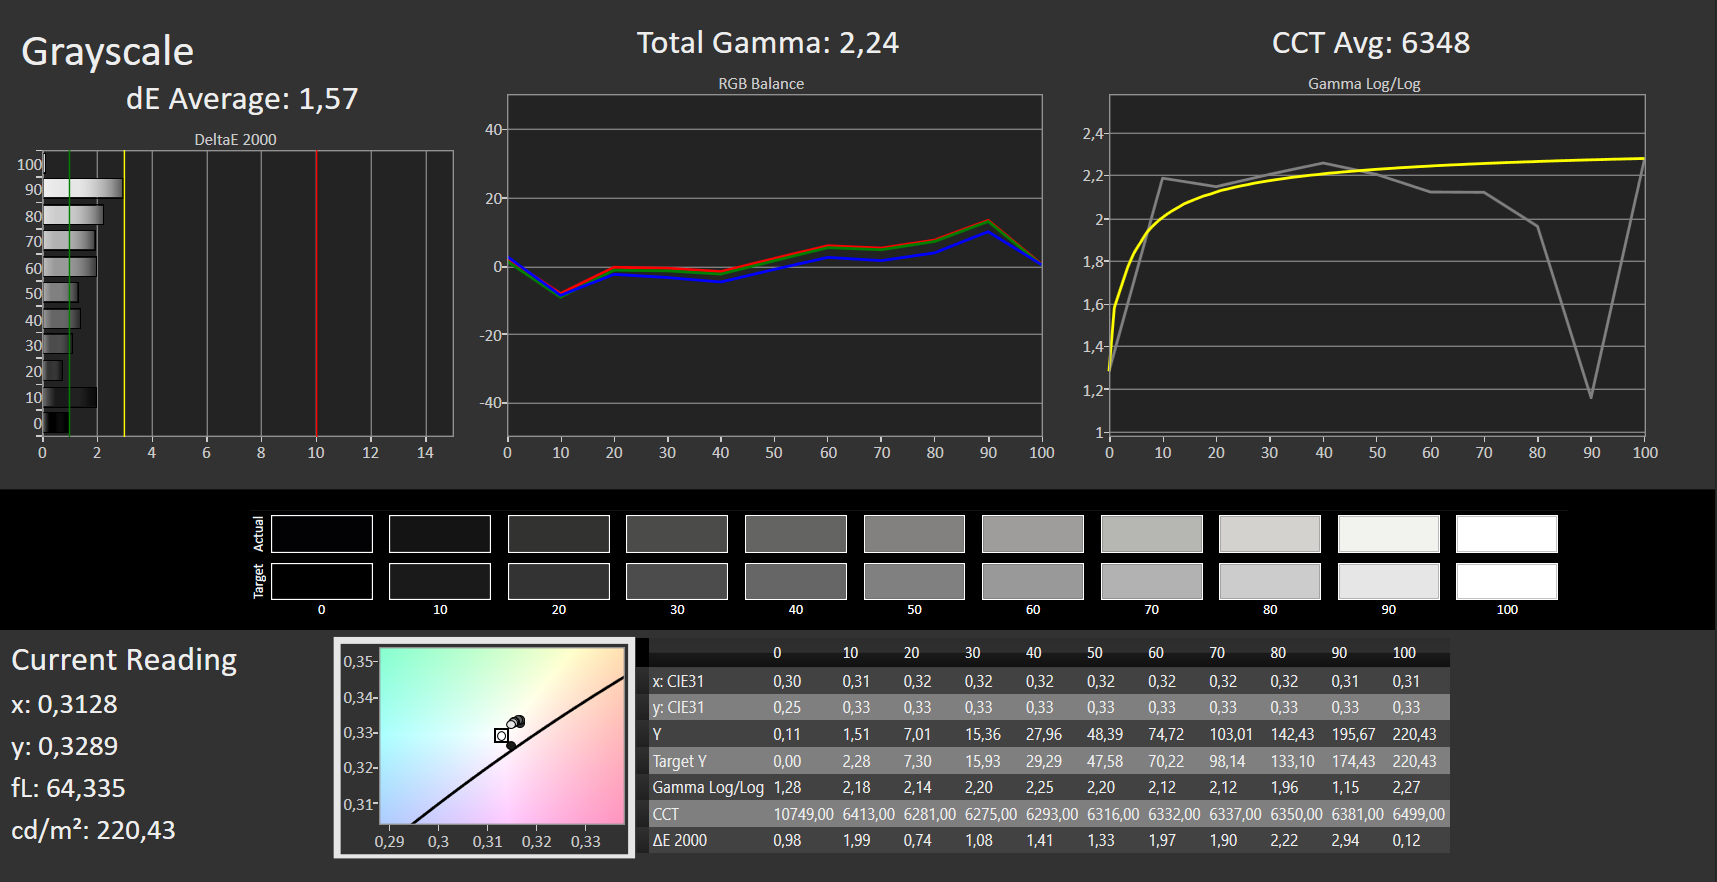
ΔE Greyscale Calman: 1.57 | ∀{0.09-98 Ø4.96}
41.24% AdobeRGB 1998 (Argyll 3D)
58.8% sRGB (Argyll 3D)
39.92% Display P3 (Argyll 3D)
Gamma: 2.24
CCT: 6348 K
| Dell Inspiron 15 5518-2X3JR BOE NV15N4V, IPS, 1920x1080, 15.6" | HP Pavilion 15-eg Chi Mei CMN1523, IPS, 1920x1080, 15.6" | Xiaomi RedmiBook Pro 15 IPS, 3200x2000, 15.6" | Lenovo IdeaPad 5 Pro 16IHU6 Lenovo LEN160WQXGA, IPS, 2560x1600, 16" | Asus VivoBook S15 D533UA Chi Mei N156HCA-EAB, IPS, 1920x1080, 15.6" | Lenovo IdeaPad 5 15ALC05 Lenovo LEN156FHD, IPS, 1920x1080, 15.6" | |
|---|---|---|---|---|---|---|
| Display | 8% | 66% | 78% | 10% | -4% | |
| Display P3 Coverage (%) | 39.92 | 42.9 7% | 66.7 67% | 74 85% | 43.6 9% | |
| sRGB Coverage (%) | 58.8 | 64 9% | 96.3 64% | 98.7 68% | 65.2 11% | 59 0% |
| AdobeRGB 1998 Coverage (%) | 41.24 | 44.4 8% | 68.5 66% | 74.5 81% | 45 9% | 38 -8% |
| Response Times | 34% | 19% | 71% | 48% | 36% | |
| Response Time Grey 50% / Grey 80% * (ms) | 41 ? | 22.8 ? 44% | 34.8 ? 15% | 13 ? 68% | 18 ? 56% | 29 ? 29% |
| Response Time Black / White * (ms) | 31 ? | 23.6 ? 24% | 24 ? 23% | 8 ? 74% | 19 ? 39% | 18 ? 42% |
| PWM Frequency (Hz) | 1000 ? | 26320 ? | ||||
| Screen | -27% | -27% | 10% | -30% | -64% | |
| Brightness middle (cd/m²) | 286 | 294.3 3% | 312 9% | 356 24% | 289 1% | 376 31% |
| Brightness (cd/m²) | 268 | 251 -6% | 298 11% | 322 20% | 267 0% | 341 27% |
| Brightness Distribution (%) | 87 | 76 -13% | 87 0% | 80 -8% | 85 -2% | 78 -10% |
| Black Level * (cd/m²) | 0.275 | 0.26 5% | 0.18 35% | 0.27 2% | 0.56 -104% | 0.66 -140% |
| Contrast (:1) | 1040 | 1132 9% | 1733 67% | 1319 27% | 516 -50% | 570 -45% |
| Colorchecker dE 2000 * | 4.74 | 4.08 14% | 5.39 -14% | 2.4 49% | 3.96 16% | 6.4 -35% |
| Colorchecker dE 2000 max. * | 8.27 | 19.49 -136% | 9.95 -20% | 4.42 47% | 6.76 18% | 20.45 -147% |
| Greyscale dE 2000 * | 1.57 | 3 -91% | 6.3 -301% | 2.81 -79% | 3.43 -118% | 4.59 -192% |
| Gamma | 2.24 98% | 2.21 100% | 2.192 100% | 2.4 92% | 2.28 96% | 2.26 97% |
| CCT | 6348 102% | 6616 98% | 7473 87% | 6294 103% | 7191 90% | 6819 95% |
| Colorchecker dE 2000 calibrated * | 3.7 | 3.15 | ||||
| Color Space (Percent of AdobeRGB 1998) (%) | 69 | 42 | 38 | |||
| Color Space (Percent of sRGB) (%) | 96 | 65 | 59 | |||
| Media total (Programa/Opciones) | 5% /
-9% | 19% /
2% | 53% /
35% | 9% /
-9% | -11% /
-37% |
* ... más pequeño es mejor
Tiempos de respuesta del display
| ↔ Tiempo de respuesta de Negro a Blanco | ||
|---|---|---|
| 31 ms ... subida ↗ y bajada ↘ combinada | ↗ 17 ms subida |  |
| ↘ 14 ms bajada | ||
| La pantalla mostró tiempos de respuesta lentos en nuestros tests y podría ser demasiado lenta para los jugones. En comparación, todos los dispositivos de prueba van de ##min### (mínimo) a 240 (máximo) ms. » 84 % de todos los dispositivos son mejores. Eso quiere decir que el tiempo de respuesta es peor que la media (19.8 ms) de todos los dispositivos testados. | ||
| ↔ Tiempo de respuesta 50% Gris a 80% Gris | ||
| 41 ms ... subida ↗ y bajada ↘ combinada | ↗ 21 ms subida |  |
| ↘ 20 ms bajada | ||
| La pantalla mostró tiempos de respuesta lentos en nuestros tests y podría ser demasiado lenta para los jugones. En comparación, todos los dispositivos de prueba van de ##min### (mínimo) a 636 (máximo) ms. » 65 % de todos los dispositivos son mejores. Eso quiere decir que el tiempo de respuesta es peor que la media (31 ms) de todos los dispositivos testados. | ||
Parpadeo de Pantalla / PWM (Pulse-Width Modulation)
| Parpadeo de Pantalla / PWM detectado | 1000 Hz | ≤ 90 % de brillo |  |
La retroiluminación del display parpadea a 1000 Hz (seguramente usa PWM - Pulse-Width Modulation) a un brillo del 90 % e inferior. Sobre este nivel de brillo no debería darse parpadeo / PWM. La frecuencia de 1000 Hz es bastante alta, por lo que la mayoría de gente sensible al parpadeo no debería ver parpadeo o tener fatiga visual. Comparación: 52 % de todos los dispositivos testados no usaron PWM para atenuar el display. Si se usó, medimos una media de 7757 (mínimo: 5 - máxmo: 343500) Hz. | |||
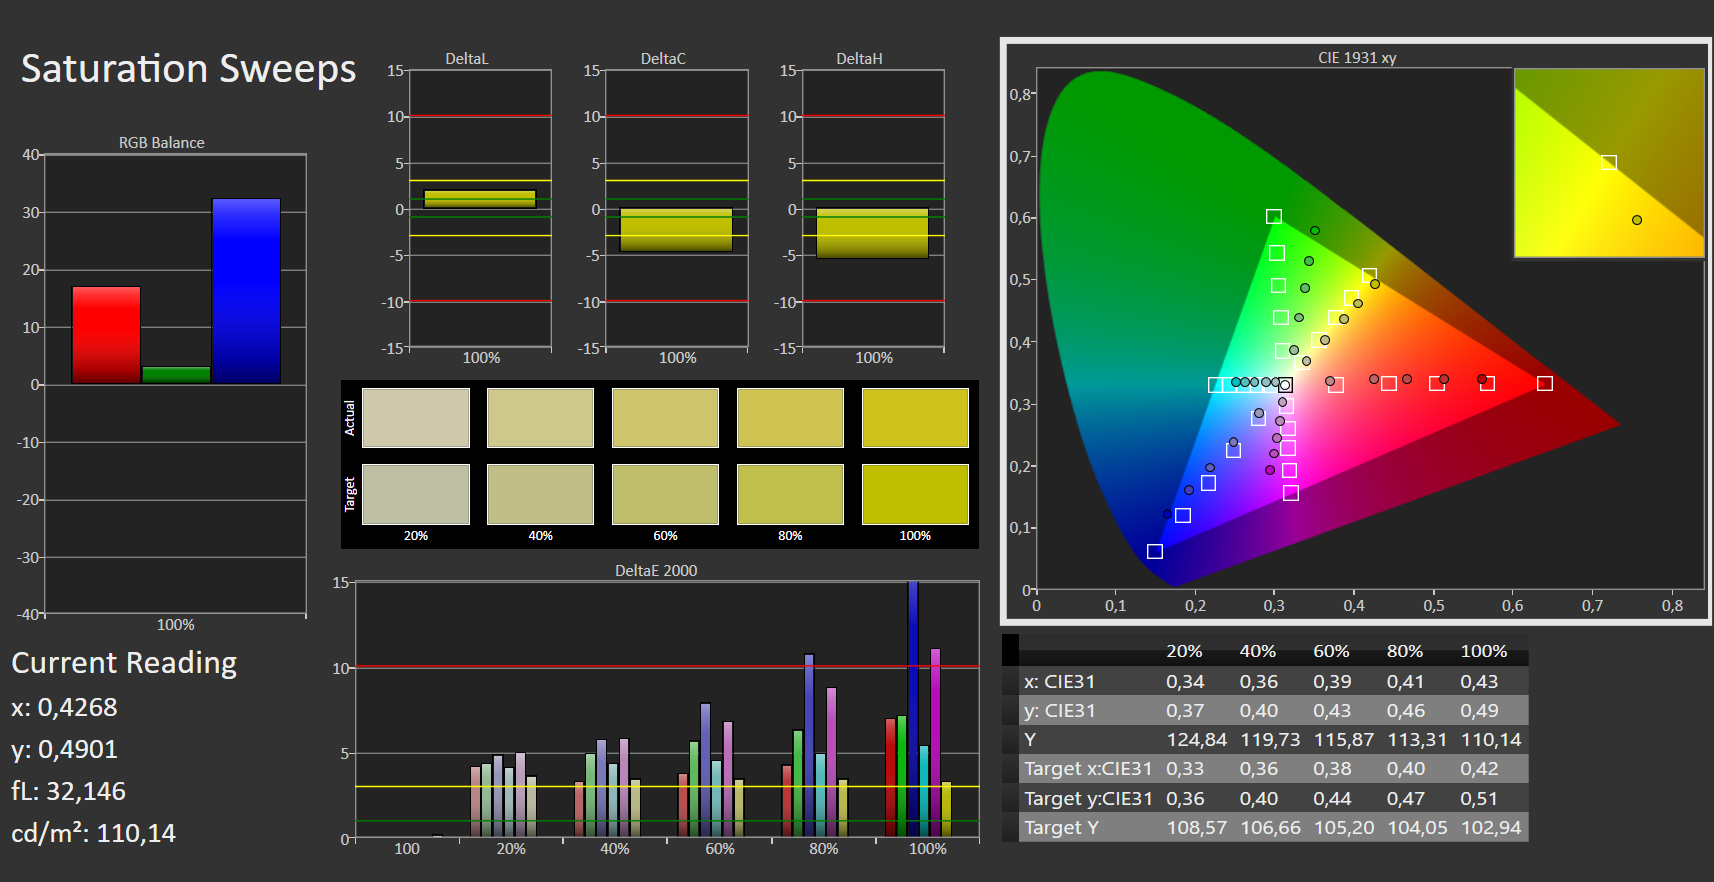
La pantalla tiene una reproducción del color decente en su estado de entrega, pero los colores se desvían un poco del objetivo - el conjunto sigue estando dentro de una gama aceptable. No sufre de un tinte azul. La pantalla no puede reproducir los espacios de color AdobeRGB (41%), sRGB (59%) y DCI-P3 (40%).
El panel IPS de ángulo de visión estable puede leerse desde cualquier posición. La lectura de la pantalla en exteriores es posible cuando el sol no brilla demasiado.
Rendimiento - La CPU del ordenador Dell queda por debajo de sus capacidades
El todoterreno de 15,6 pulgadas de Dell ofrece un rendimiento suficiente para las aplicaciones ofimáticas y de Internet y permite utilizar juegos de ordenador.
Condiciones de la prueba
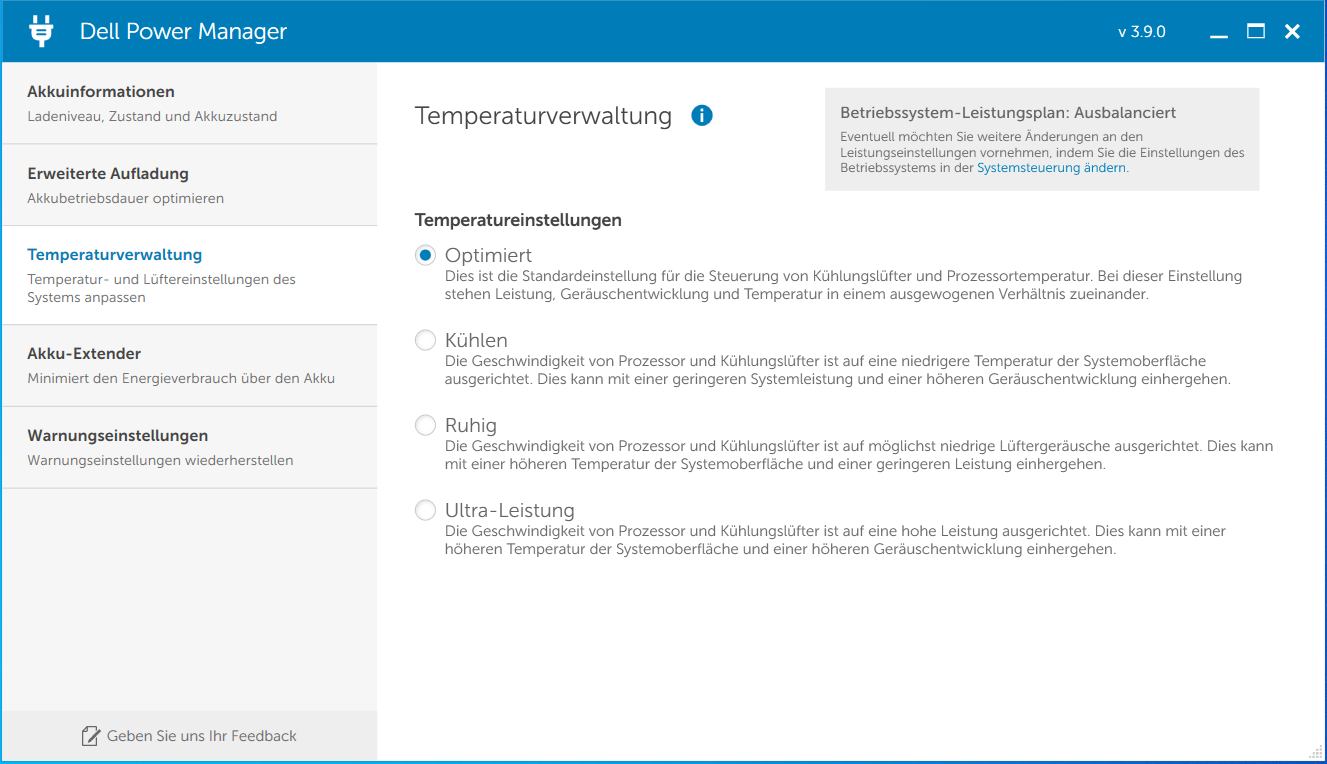
Dell Power Manager proporciona perfiles que afectan a la temperatura del portátil y al desarrollo de la energía. Usamos el perfil "Optimizado". Algunas pruebas se ejecutaron adicionalmente con el perfil "Ultra Performance" activo.
| Optimizado | Frío | Silencioso | Rendimiento extra | |
|---|---|---|---|---|
| PL1 | 25 vatios | 15 vatios | 30 vatios | |
| PL2 | 51 vatios | 51 vatios | 51 vatios |
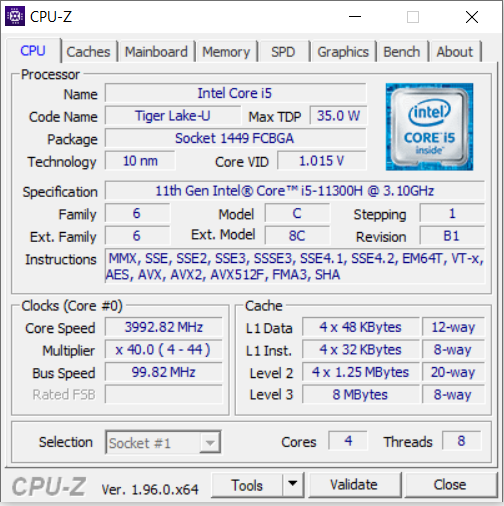
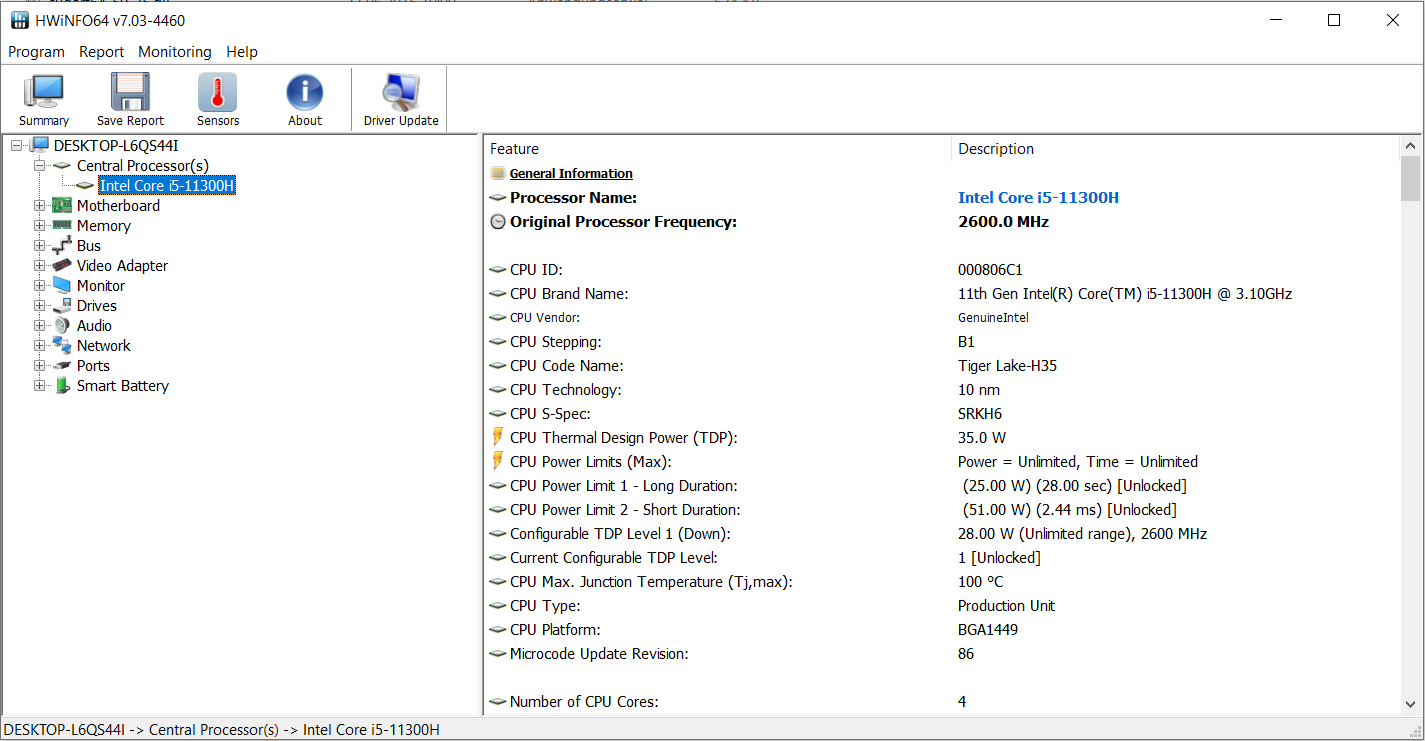
Procesador
El Core i7-11300H-Procesador de cuatro núcleos (Tiger Lake) funciona con un reloj base de 3,1 GHz. Es posible aumentar a 4 GHz (cuatro núcleos) hasta 4,4 GHz (un núcleo) mediante Turbo. Soporta Hyperthreading (dos hilos por núcleo).
La prueba multihilo del benchmark Cinebench R15 se ejecuta a 3.3 a 4 GHz durante un corto periodo de tiempo, luego el reloj fluctúa entre 600 MHz y 3 GHz. La prueba monohilo se ejecuta con 1,6 a 4,4 GHz. Las velocidades de reloj son más bajas en el modo de batería.
Dell ha elegido límites de potencia relativamente bajos para la CPU. Como resultado, el 11300H queda por debajo de sus capacidades, como una comparación con los resultados del benchmark del Ideapad 5 Pro 16IHU6 muestra. La diferencia es significativamente mayor en las pruebas multihilo que en las de un solo hilo
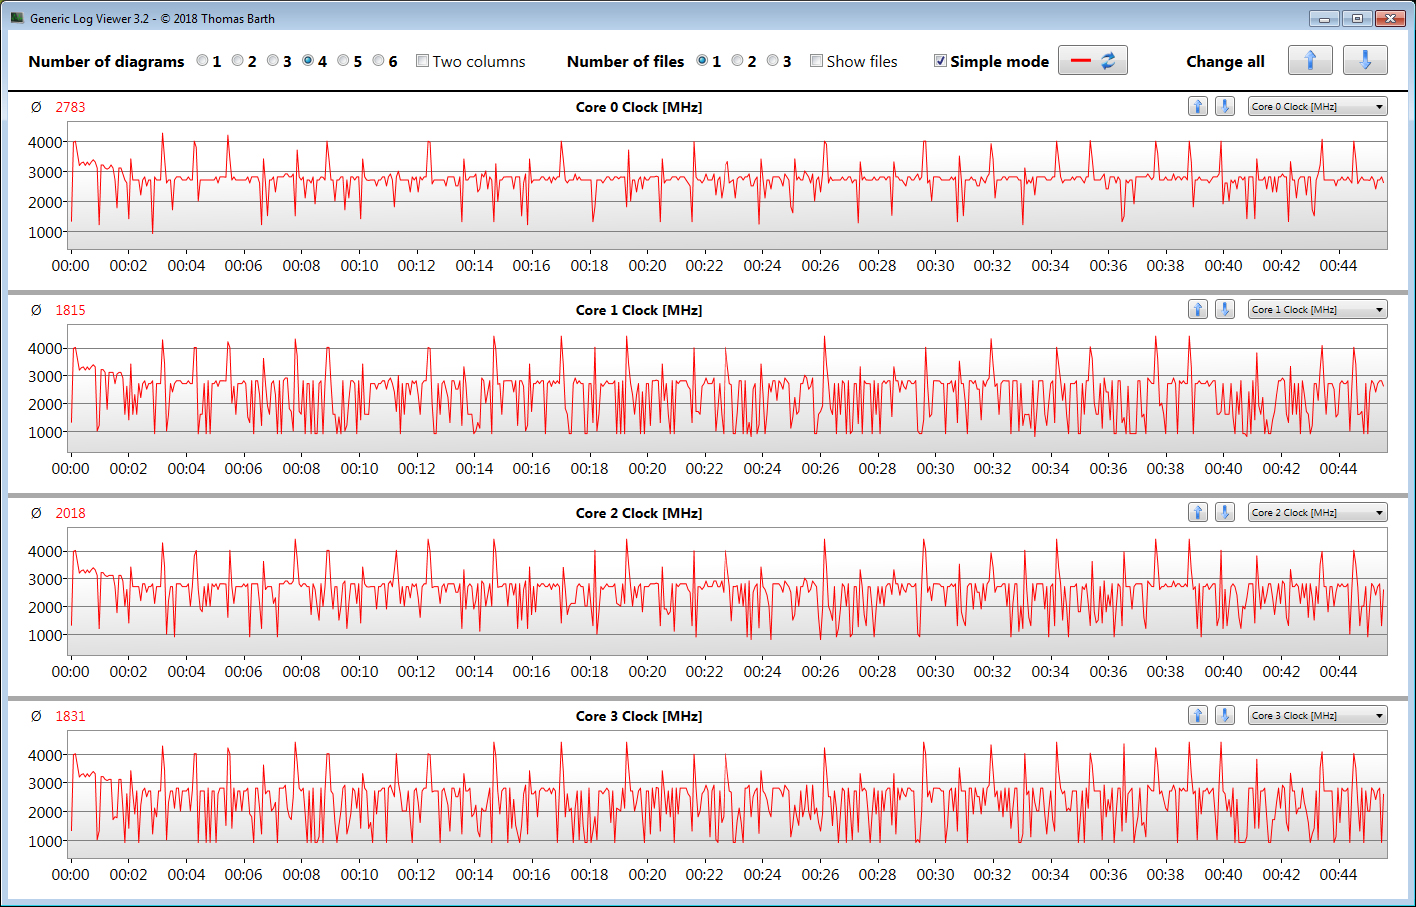
Comprobamos si el Turbo de la CPU también se utiliza permanentemente en el funcionamiento de la red ejecutando la prueba multihilo del benchmark Cinebench R15 en un bucle durante al menos 30 minutos. El Turbo sólo se utiliza al principio, normalmente el reloj base se reduce. El perfil "Ultra Performance" permite que la CPU funcione a velocidades más altas.
Cinebench R15 Multi Endurance test

| Cinebench R23 | |
| Single Core | |
| Media de la clase Office (708 - 2130, n=76, últimos 2 años) | |
| Xiaomi RedmiBook Pro 15 | |
| HP Pavilion 15-eg | |
| Lenovo IdeaPad 5 Pro 16IHU6 | |
| Dell Inspiron 15 5518-2X3JR (Ultra-Leistung) | |
| Medio Intel Core i5-11300H (1218 - 1431, n=11) | |
| Dell Inspiron 15 5518-2X3JR | |
| Asus VivoBook S15 D533UA | |
| Lenovo IdeaPad 5 15ALC05 | |
| Multi Core | |
| Media de la clase Office (1673 - 22808, n=76, últimos 2 años) | |
| Asus VivoBook S15 D533UA | |
| Lenovo IdeaPad 5 15ALC05 | |
| Lenovo IdeaPad 5 Pro 16IHU6 | |
| Xiaomi RedmiBook Pro 15 | |
| Xiaomi RedmiBook Pro 15 | |
| Medio Intel Core i5-11300H (3313 - 6581, n=10) | |
| HP Pavilion 15-eg | |
| Dell Inspiron 15 5518-2X3JR (Ultra-Leistung) | |
| Dell Inspiron 15 5518-2X3JR | |
| Cinebench R20 | |
| CPU (Single Core) | |
| Media de la clase Office (345 - 816, n=75, últimos 2 años) | |
| Xiaomi RedmiBook Pro 15 | |
| HP Pavilion 15-eg | |
| Lenovo IdeaPad 5 Pro 16IHU6 | |
| Dell Inspiron 15 5518-2X3JR (Ultra-Leistung) | |
| Dell Inspiron 15 5518-2X3JR | |
| Medio Intel Core i5-11300H (431 - 548, n=11) | |
| Asus VivoBook S15 D533UA | |
| Lenovo IdeaPad 5 15ALC05 | |
| CPU (Multi Core) | |
| Media de la clase Office (648 - 8840, n=75, últimos 2 años) | |
| Asus VivoBook S15 D533UA | |
| Lenovo IdeaPad 5 15ALC05 | |
| Lenovo IdeaPad 5 Pro 16IHU6 | |
| Xiaomi RedmiBook Pro 15 | |
| Medio Intel Core i5-11300H (1300 - 2533, n=10) | |
| Dell Inspiron 15 5518-2X3JR | |
| HP Pavilion 15-eg | |
| Dell Inspiron 15 5518-2X3JR (Ultra-Leistung) | |
| Cinebench R15 | |
| CPU Single 64Bit | |
| Media de la clase Office (99.5 - 316, n=77, últimos 2 años) | |
| Xiaomi RedmiBook Pro 15 | |
| Xiaomi RedmiBook Pro 15 | |
| HP Pavilion 15-eg | |
| Asus VivoBook S15 D533UA | |
| Lenovo IdeaPad 5 15ALC05 | |
| Lenovo IdeaPad 5 Pro 16IHU6 | |
| Medio Intel Core i5-11300H (123 - 211, n=8) | |
| Dell Inspiron 15 5518-2X3JR | |
| CPU Multi 64Bit | |
| Media de la clase Office (250 - 3380, n=77, últimos 2 años) | |
| Asus VivoBook S15 D533UA | |
| Lenovo IdeaPad 5 15ALC05 | |
| Xiaomi RedmiBook Pro 15 (Variable PL1 ) | |
| Xiaomi RedmiBook Pro 15 (Pl1 @ 25W) | |
| Xiaomi RedmiBook Pro 15 (PL1 fixed @ 28W) | |
| Lenovo IdeaPad 5 Pro 16IHU6 | |
| Medio Intel Core i5-11300H (632 - 990, n=11) | |
| Dell Inspiron 15 5518-2X3JR (Ultra-Leistung) | |
| Dell Inspiron 15 5518-2X3JR | |
| HP Pavilion 15-eg | |
| Blender - v2.79 BMW27 CPU | |
| Dell Inspiron 15 5518-2X3JR | |
| Dell Inspiron 15 5518-2X3JR (Ultra-Leistung) | |
| HP Pavilion 15-eg | |
| Medio Intel Core i5-11300H (466 - 862, n=10) | |
| Lenovo IdeaPad 5 Pro 16IHU6 | |
| Xiaomi RedmiBook Pro 15 | |
| Lenovo IdeaPad 5 15ALC05 | |
| Media de la clase Office (158 - 1940, n=76, últimos 2 años) | |
| Asus VivoBook S15 D533UA | |
| 7-Zip 18.03 | |
| 7z b 4 -mmt1 | |
| Media de la clase Office (3387 - 6469, n=77, últimos 2 años) | |
| HP Pavilion 15-eg | |
| Xiaomi RedmiBook Pro 15 | |
| Lenovo IdeaPad 5 Pro 16IHU6 | |
| Dell Inspiron 15 5518-2X3JR | |
| Dell Inspiron 15 5518-2X3JR (Ultra-Leistung) | |
| Medio Intel Core i5-11300H (4603 - 4969, n=10) | |
| Asus VivoBook S15 D533UA | |
| Lenovo IdeaPad 5 15ALC05 | |
| 7z b 4 | |
| Media de la clase Office (7098 - 76886, n=77, últimos 2 años) | |
| Asus VivoBook S15 D533UA | |
| Lenovo IdeaPad 5 15ALC05 | |
| Xiaomi RedmiBook Pro 15 | |
| Lenovo IdeaPad 5 Pro 16IHU6 | |
| Medio Intel Core i5-11300H (17573 - 26001, n=10) | |
| HP Pavilion 15-eg | |
| Dell Inspiron 15 5518-2X3JR (Ultra-Leistung) | |
| Dell Inspiron 15 5518-2X3JR | |
| Geekbench 5.5 | |
| Single-Core | |
| Media de la clase Office (811 - 2175, n=73, últimos 2 años) | |
| Xiaomi RedmiBook Pro 15 | |
| Lenovo IdeaPad 5 Pro 16IHU6 | |
| Medio Intel Core i5-11300H (1342 - 1462, n=10) | |
| Dell Inspiron 15 5518-2X3JR (Ultra-Leistung) | |
| Dell Inspiron 15 5518-2X3JR | |
| Asus VivoBook S15 D533UA | |
| Lenovo IdeaPad 5 15ALC05 | |
| Multi-Core | |
| Media de la clase Office (1483 - 16999, n=73, últimos 2 años) | |
| Asus VivoBook S15 D533UA | |
| Lenovo IdeaPad 5 15ALC05 | |
| Xiaomi RedmiBook Pro 15 | |
| Lenovo IdeaPad 5 Pro 16IHU6 | |
| Medio Intel Core i5-11300H (3631 - 5499, n=10) | |
| Dell Inspiron 15 5518-2X3JR (Ultra-Leistung) | |
| Dell Inspiron 15 5518-2X3JR | |
| HWBOT x265 Benchmark v2.2 - 4k Preset | |
| Media de la clase Office (2.21 - 26, n=76, últimos 2 años) | |
| Asus VivoBook S15 D533UA | |
| Lenovo IdeaPad 5 15ALC05 | |
| Lenovo IdeaPad 5 Pro 16IHU6 | |
| Medio Intel Core i5-11300H (4.32 - 8.38, n=10) | |
| Xiaomi RedmiBook Pro 15 | |
| HP Pavilion 15-eg | |
| Dell Inspiron 15 5518-2X3JR (Ultra-Leistung) | |
| Dell Inspiron 15 5518-2X3JR | |
| LibreOffice - 20 Documents To PDF | |
| Lenovo IdeaPad 5 15ALC05 | |
| Asus VivoBook S15 D533UA | |
| Media de la clase Office (39.9 - 102.3, n=76, últimos 2 años) | |
| Lenovo IdeaPad 5 Pro 16IHU6 | |
| Medio Intel Core i5-11300H (43.6 - 59.4, n=10) | |
| Xiaomi RedmiBook Pro 15 | |
| Dell Inspiron 15 5518-2X3JR | |
| HP Pavilion 15-eg | |
| Dell Inspiron 15 5518-2X3JR (Ultra-Leistung) | |
| R Benchmark 2.5 - Overall mean | |
| Lenovo IdeaPad 5 15ALC05 | |
| Dell Inspiron 15 5518-2X3JR (Ultra-Leistung) | |
| Dell Inspiron 15 5518-2X3JR | |
| Medio Intel Core i5-11300H (0.6 - 0.644, n=10) | |
| Lenovo IdeaPad 5 Pro 16IHU6 | |
| Asus VivoBook S15 D533UA | |
| HP Pavilion 15-eg | |
| Xiaomi RedmiBook Pro 15 | |
| Media de la clase Office (0.393 - 0.888, n=76, últimos 2 años) | |
* ... más pequeño es mejor
Rendimiento del sistema
El sistema ágil y de funcionamiento fluidoproporciona suficiente rendimiento para todas las áreas de aplicación habituales. Los resultados básicamente buenos de PCMark están un poco por detrás de la competencia.
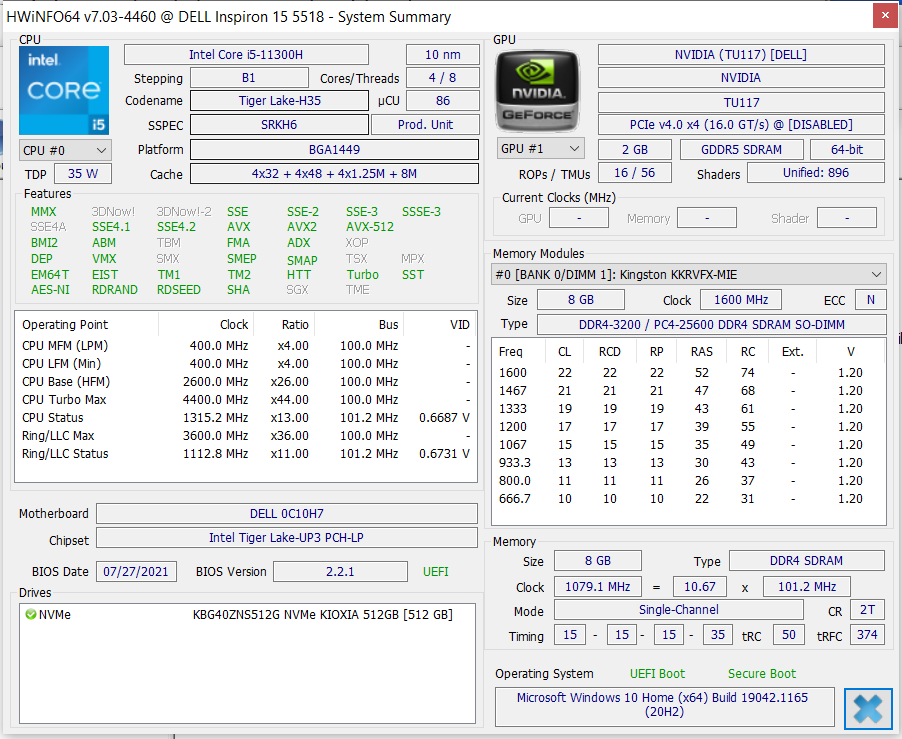
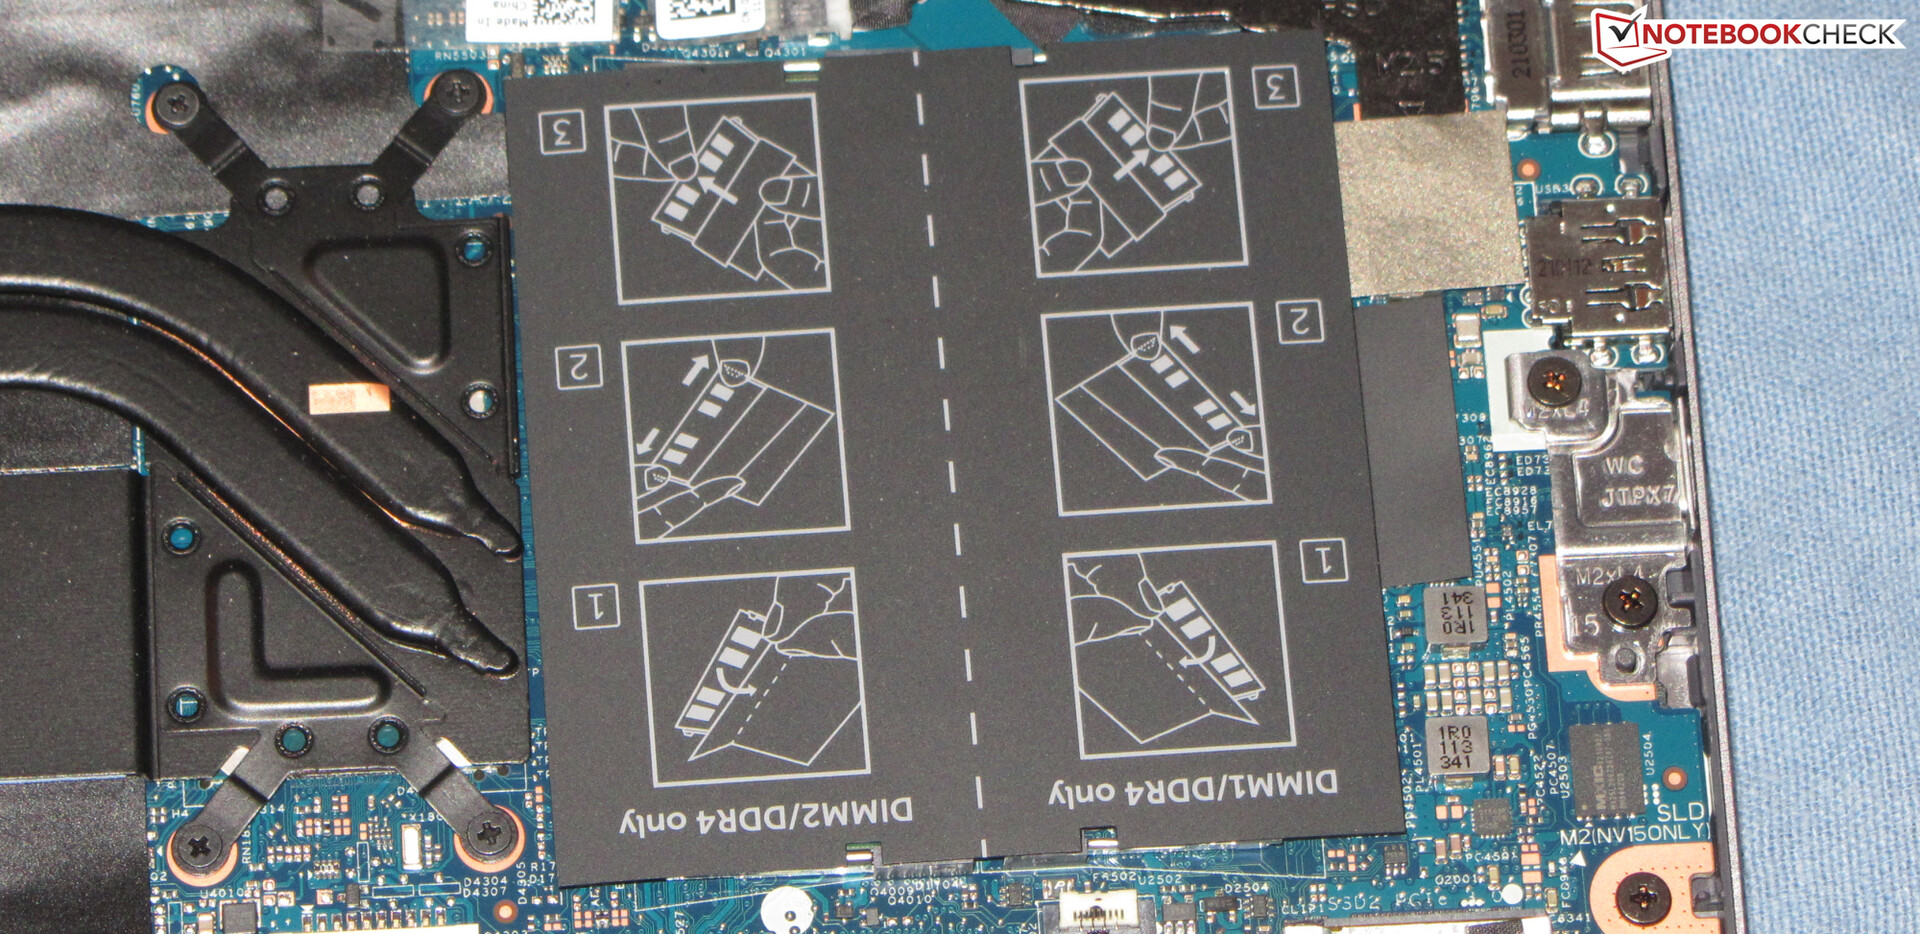
Partedel rendimientoqueda sin utilizardebido a que lamemoria de trabajo funciona en modo monocanal.El modo de doble canal podría activarse instalando un segundo módulo de memoria.
| PCMark 10 Score | 4899 puntos | |
ayuda | ||
| PCMark 10 / Score | |
| Media de la clase Office (2601 - 9298, n=67, últimos 2 años) | |
| HP Pavilion 15-eg | |
| Xiaomi RedmiBook Pro 15 | |
| Asus VivoBook S15 D533UA | |
| Lenovo IdeaPad 5 Pro 16IHU6 | |
| Lenovo IdeaPad 5 15ALC05 | |
| Medio Intel Core i5-11300H, NVIDIA GeForce MX450 (4899 - 5391, n=3) | |
| Dell Inspiron 15 5518-2X3JR | |
| PCMark 10 / Essentials | |
| Media de la clase Office (3245 - 11594, n=67, últimos 2 años) | |
| HP Pavilion 15-eg | |
| Asus VivoBook S15 D533UA | |
| Lenovo IdeaPad 5 15ALC05 | |
| Lenovo IdeaPad 5 Pro 16IHU6 | |
| Medio Intel Core i5-11300H, NVIDIA GeForce MX450 (8366 - 8931, n=3) | |
| Xiaomi RedmiBook Pro 15 | |
| Dell Inspiron 15 5518-2X3JR | |
| PCMark 10 / Productivity | |
| Media de la clase Office (5336 - 17243, n=67, últimos 2 años) | |
| Xiaomi RedmiBook Pro 15 | |
| HP Pavilion 15-eg | |
| Medio Intel Core i5-11300H, NVIDIA GeForce MX450 (8292 - 9188, n=3) | |
| Lenovo IdeaPad 5 Pro 16IHU6 | |
| Dell Inspiron 15 5518-2X3JR | |
| Asus VivoBook S15 D533UA | |
| Lenovo IdeaPad 5 15ALC05 | |
| PCMark 10 / Digital Content Creation | |
| Media de la clase Office (2049 - 13541, n=67, últimos 2 años) | |
| Xiaomi RedmiBook Pro 15 | |
| HP Pavilion 15-eg | |
| Asus VivoBook S15 D533UA | |
| Lenovo IdeaPad 5 Pro 16IHU6 | |
| Lenovo IdeaPad 5 15ALC05 | |
| Medio Intel Core i5-11300H, NVIDIA GeForce MX450 (4600 - 5388, n=3) | |
| Dell Inspiron 15 5518-2X3JR | |
Latencias del CPD
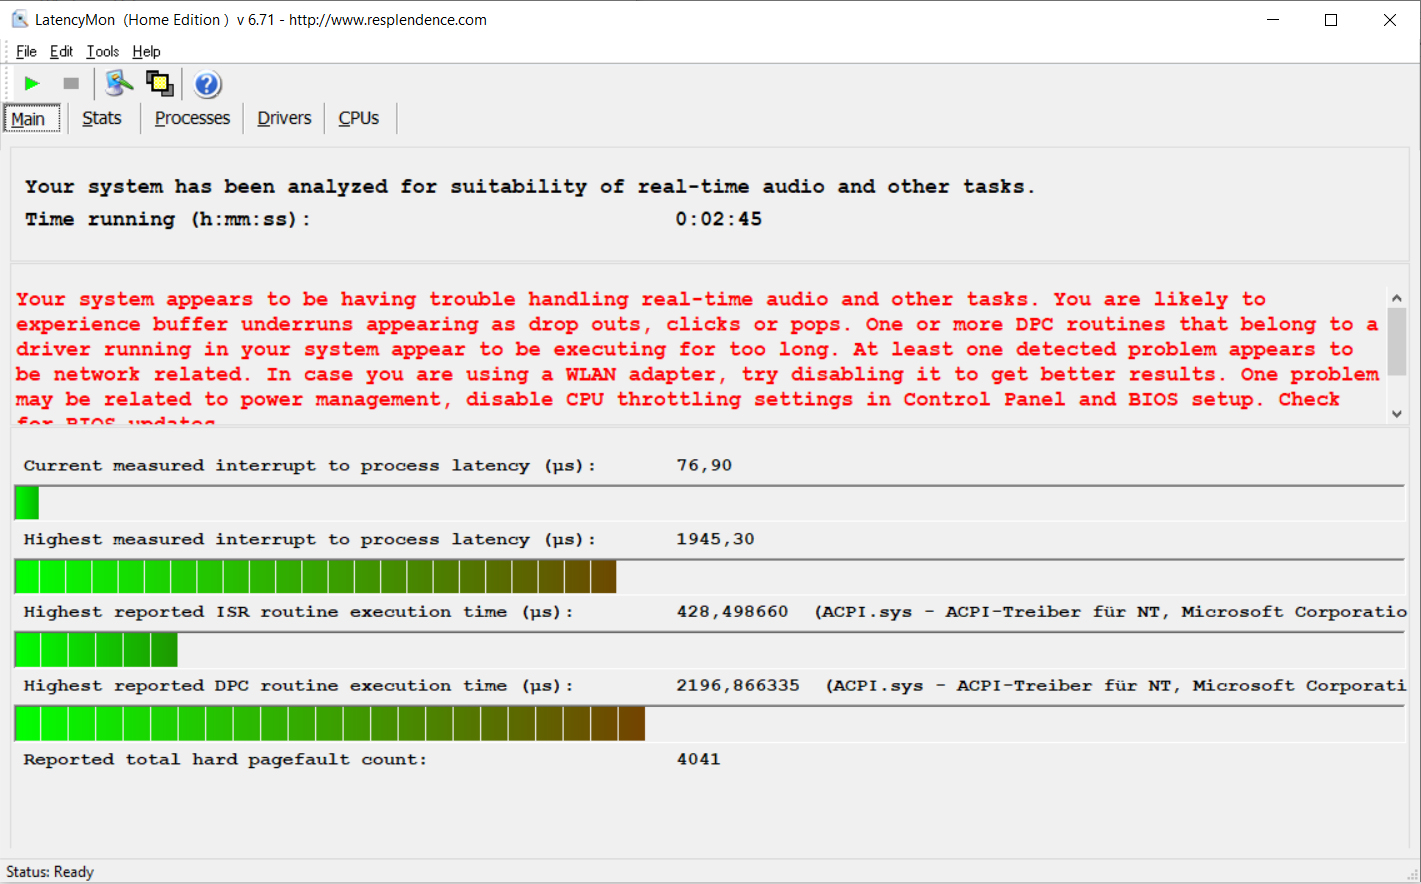
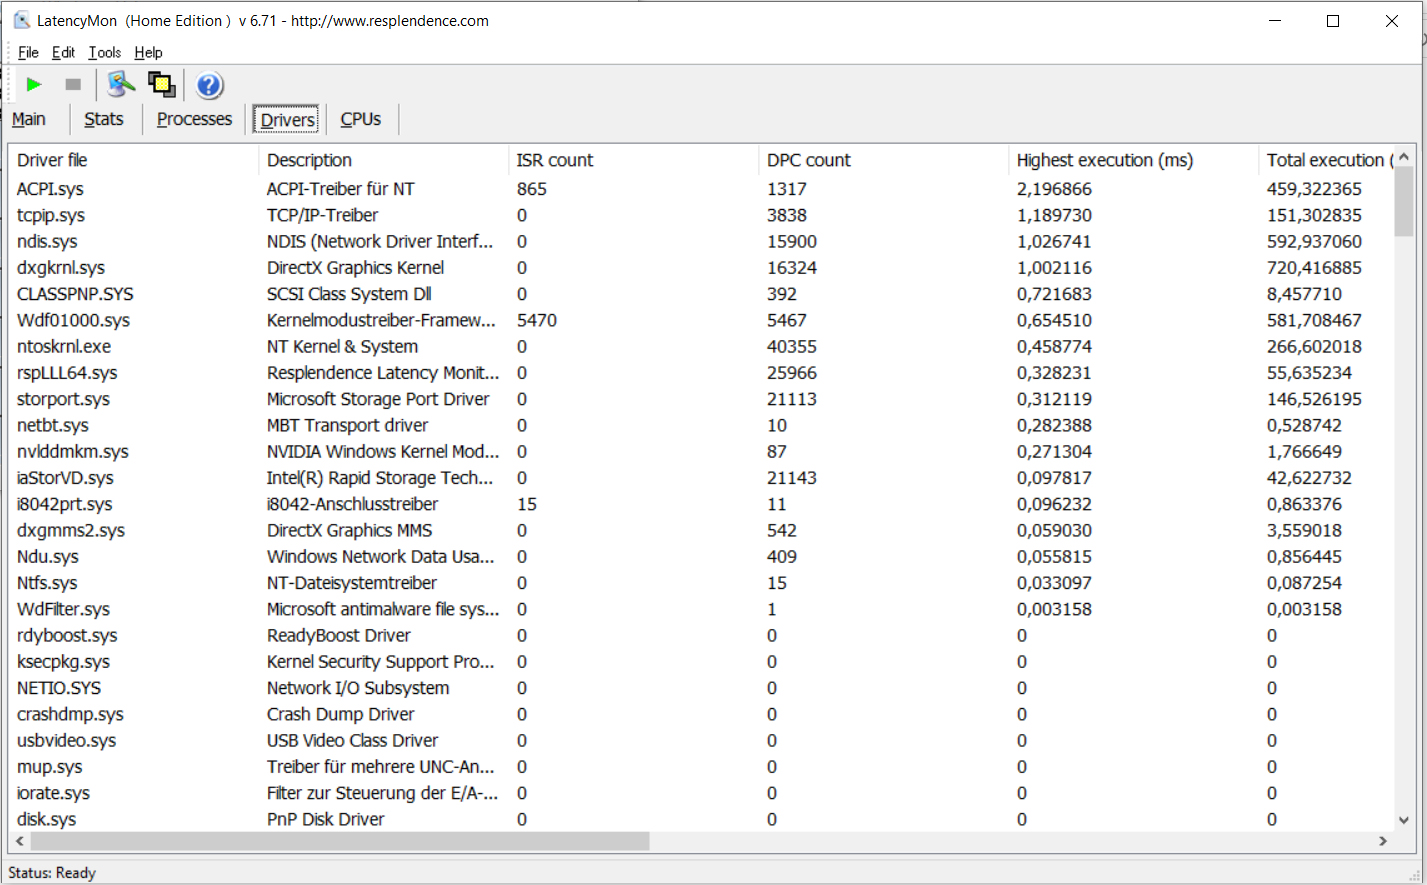
| DPC Latencies / LatencyMon - interrupt to process latency (max), Web, Youtube, Prime95 | |
| Xiaomi RedmiBook Pro 15 | |
| HP Pavilion 15-eg | |
| Dell Inspiron 15 5518-2X3JR | |
| Lenovo IdeaPad 5 15ALC05 | |
| Lenovo IdeaPad 5 Pro 16IHU6 | |
| Asus VivoBook S15 D533UA | |
* ... más pequeño es mejor
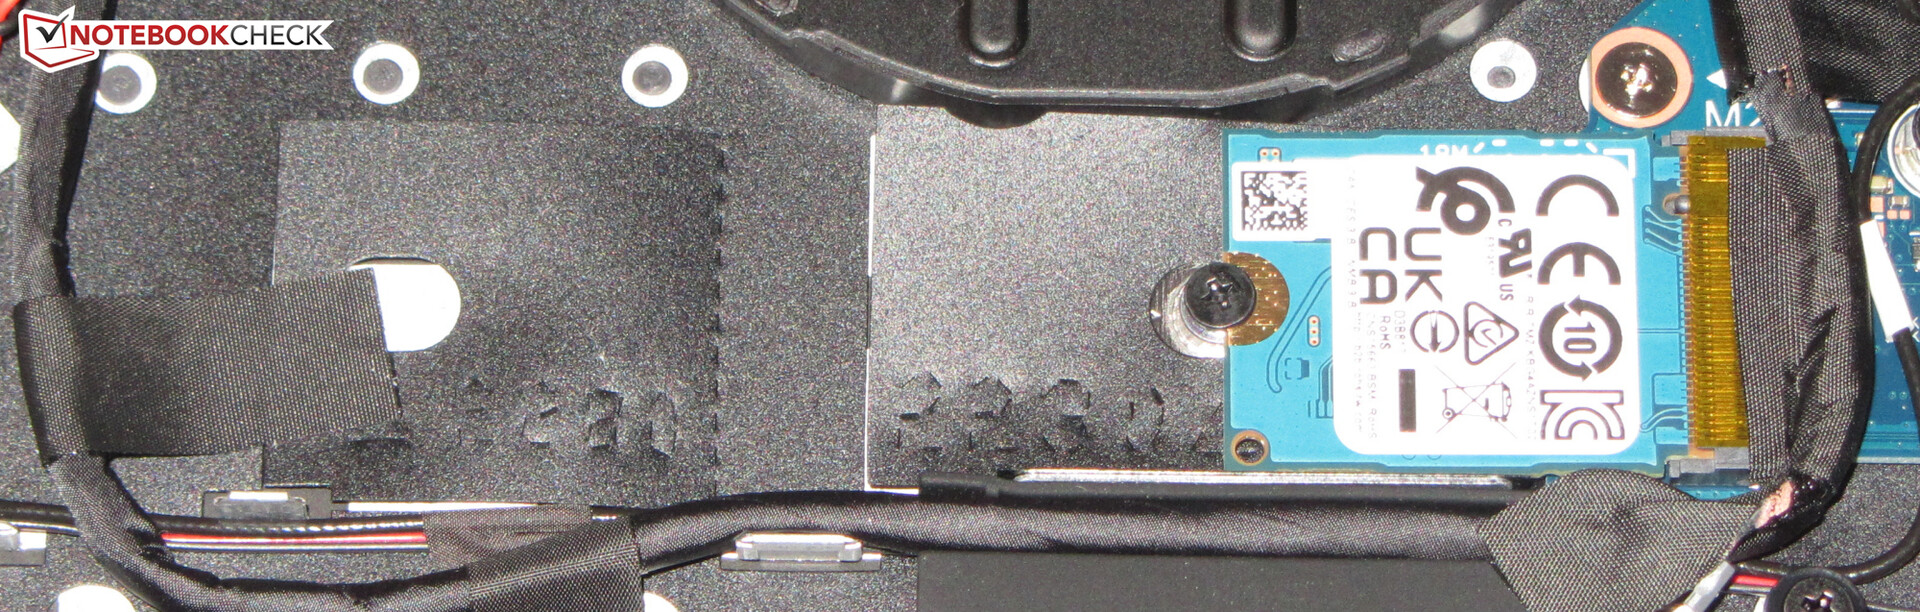
Almacenamiento masivo
Las tasas de transferencia del SSDNVMe de 512GB (M.2-2230) son buenas, pero no es uno de los mejores SSD. El uso de un SSD en formato 2280 requiere reubicar el soporte de montaje. La sa segunda ranura M.2 sólo puede albergar modelos en formato 2230.

| Dell Inspiron 15 5518-2X3JR Toshiba KBG40ZNS512G NVMe | HP Pavilion 15-eg Samsung PM991 MZVLQ1T0HALB | Xiaomi RedmiBook Pro 15 Toshiba KBG40ZNV512G | Lenovo IdeaPad 5 Pro 16IHU6 Samsung SSD PM981a MZVLB512HBJQ | Asus VivoBook S15 D533UA WDC PC SN530 SDBPNPZ-1T00 | Lenovo IdeaPad 5 15ALC05 | Medio Toshiba KBG40ZNS512G NVMe | Media de la clase Office | |
|---|---|---|---|---|---|---|---|---|
| CrystalDiskMark 5.2 / 6 | -16% | -12% | 27% | -5% | -21% | -23% | 55% | |
| Write 4K (MB/s) | 207.3 | 141.6 -32% | 136 -34% | 203 -2% | 116.8 -44% | 82.7 -60% | 126.4 ? -39% | 153.2 ? -26% |
| Read 4K (MB/s) | 61.3 | 42.61 -30% | 60.4 -1% | 52.3 -15% | 43.92 -28% | 39.96 -35% | 50 ? -18% | 73.4 ? 20% |
| Write Seq (MB/s) | 1499 | 1337 -11% | 1447 -3% | 2138 43% | 1990 33% | 1273 -15% | 1207 ? -19% | 2531 ? 69% |
| Read Seq (MB/s) | 1858 | 1575 -15% | 1507 -19% | 1974 6% | 1959 5% | 1601 -14% | 1567 ? -16% | 3292 ? 77% |
| Write 4K Q32T1 (MB/s) | 510 | 397.8 -22% | 235.6 -54% | 640 25% | 373.3 -27% | 360.4 -29% | 347 ? -32% | 431 ? -15% |
| Read 4K Q32T1 (MB/s) | 640 | 454.2 -29% | 737 15% | 707 10% | 524 -18% | 410.4 -36% | 425 ? -34% | 516 ? -19% |
| Write Seq Q32T1 (MB/s) | 1521 | 1648 8% | 1529 1% | 2973 95% | 1985 31% | 1589 4% | 1224 ? -20% | 4178 ? 175% |
| Read Seq Q32T1 (MB/s) | 2316 | 2388 3% | 2357 2% | 3559 54% | 2456 6% | 2652 15% | 2278 ? -2% | 6043 ? 161% |
| AS SSD | 35% | -7% | 86% | 43% | 30% | -10% | 85% | |
| Seq Read (MB/s) | 2086 | 2030 -3% | 1972 -5% | 2541 22% | 2082 0% | 2549 22% | 1871 ? -10% | 4326 ? 107% |
| Seq Write (MB/s) | 1124 | 1003 -11% | 981 -13% | 2555 127% | 1844 64% | 1571 40% | 810 ? -28% | 2771 ? 147% |
| 4K Read (MB/s) | 54.1 | 46.74 -14% | 55.8 3% | 56 4% | 44.33 -18% | 41.92 -23% | 45.8 ? -15% | 58.1 ? 7% |
| 4K Write (MB/s) | 138.1 | 164.2 19% | 133.5 -3% | 129.6 -6% | 157.5 14% | 110.3 -20% | 110.9 ? -20% | 162.6 ? 18% |
| 4K-64 Read (MB/s) | 1295 | 1098 -15% | 1277 -1% | 1633 26% | 1039 -20% | 1086 -16% | 997 ? -23% | 958 ? -26% |
| 4K-64 Write (MB/s) | 750 | 891 19% | 313.9 -58% | 1863 148% | 1556 107% | 1083 44% | 452 ? -40% | 1643 ? 119% |
| Access Time Read * (ms) | 0.141 | 0.053 62% | 0.15 -6% | 0.077 45% | 0.05 65% | 0.119 16% | 0.1024 ? 27% | 0.08448 ? 40% |
| Access Time Write * (ms) | 0.169 | 0.062 63% | 0.513 -204% | 0.029 83% | 0.065 62% | 0.034 80% | 0.4026 ? -138% | 0.05931 ? 65% |
| Score Read (Points) | 1558 | 1348 -13% | 1530 -2% | 1944 25% | 1292 -17% | 1383 -11% | 1232 ? -21% | 1449 ? -7% |
| Score Write (Points) | 1001 | 1155 15% | 546 -45% | 2248 125% | 1898 90% | 1351 35% | 644 ? -36% | 2083 ? 108% |
| Score Total (Points) | 3316 | 3149 -5% | 2819 -15% | 5192 57% | 3845 16% | 3398 2% | 2461 ? -26% | 4207 ? 27% |
| Copy ISO MB/s (MB/s) | 678 | 1583 133% | 1105 63% | 2246 231% | 1441 113% | 1286 90% | 1785 ? 163% | 2541 ? 275% |
| Copy Program MB/s (MB/s) | 364.8 | 682 87% | 799 119% | 861 136% | 484.9 33% | 574 57% | 388 ? 6% | 790 ? 117% |
| Copy Game MB/s (MB/s) | 557 | 1428 156% | 957 72% | 1552 179% | 1098 97% | 1133 103% | 715 ? 28% | 1648 ? 196% |
| Media total (Programa/Opciones) | 10% /
17% | -10% /
-9% | 57% /
64% | 19% /
26% | 5% /
11% | -17% /
-14% | 70% /
74% |
* ... más pequeño es mejor
Continuous load read: DiskSpd Read Loop, Queue Depth 8
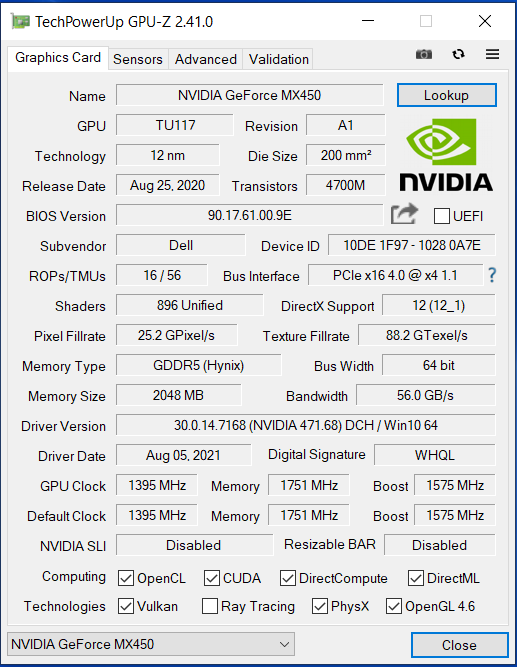
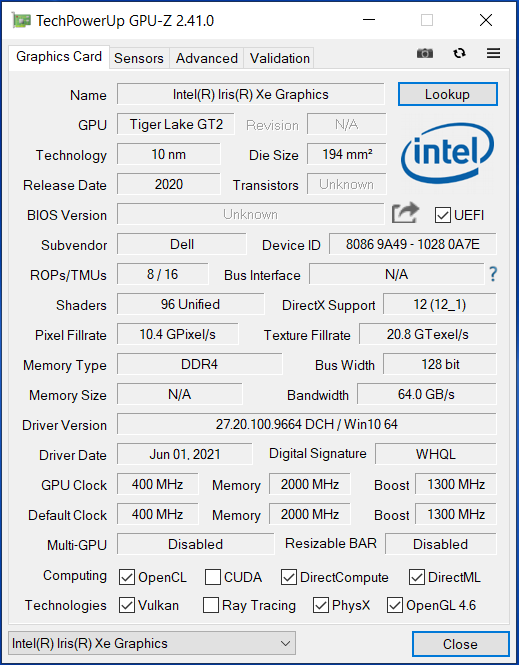
Tarjeta gráfica
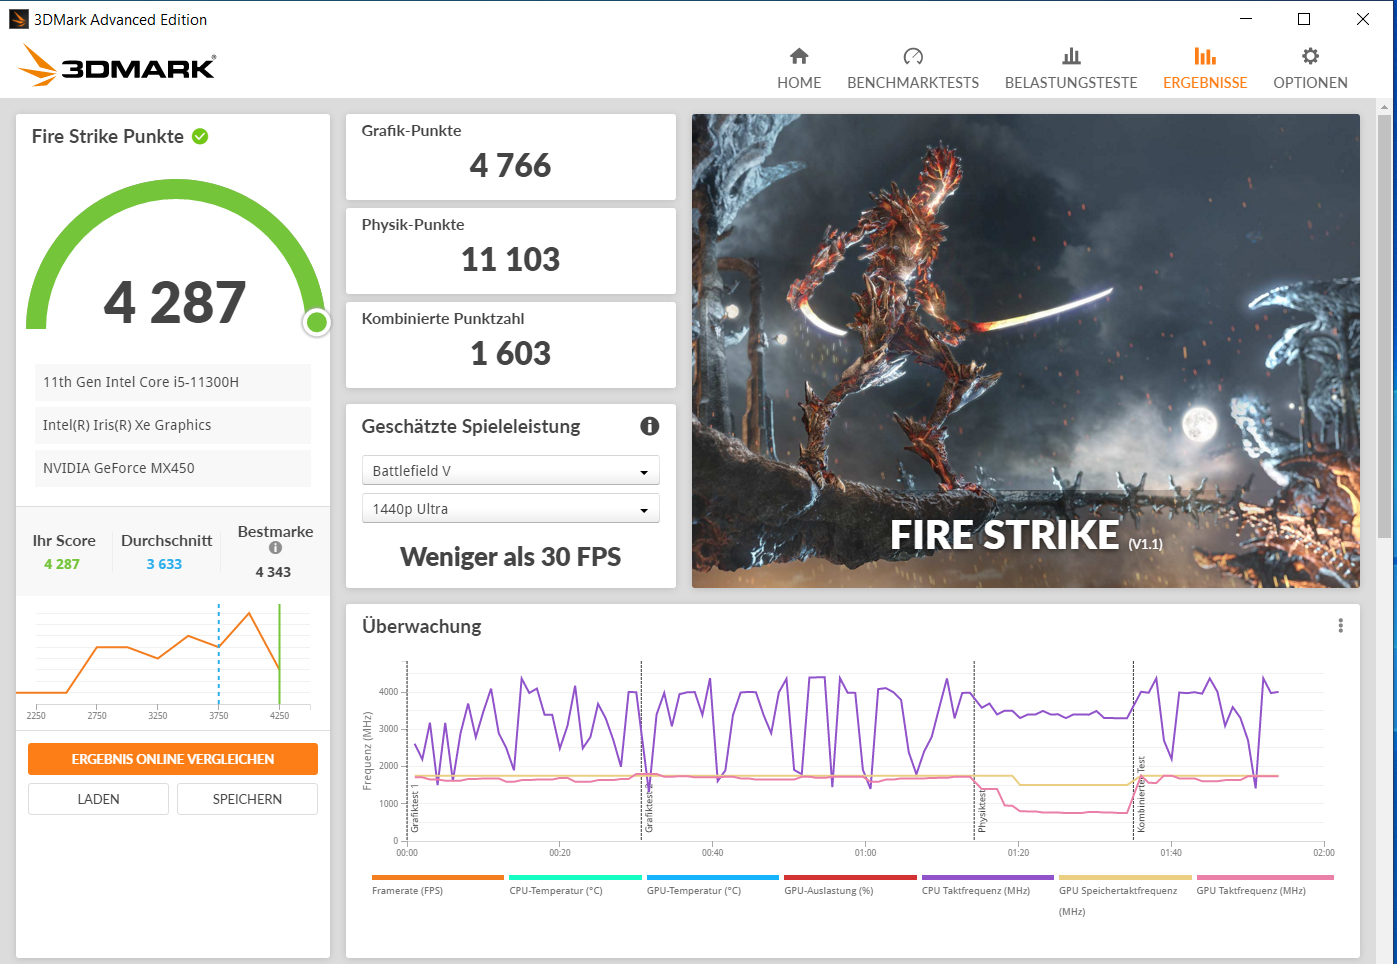
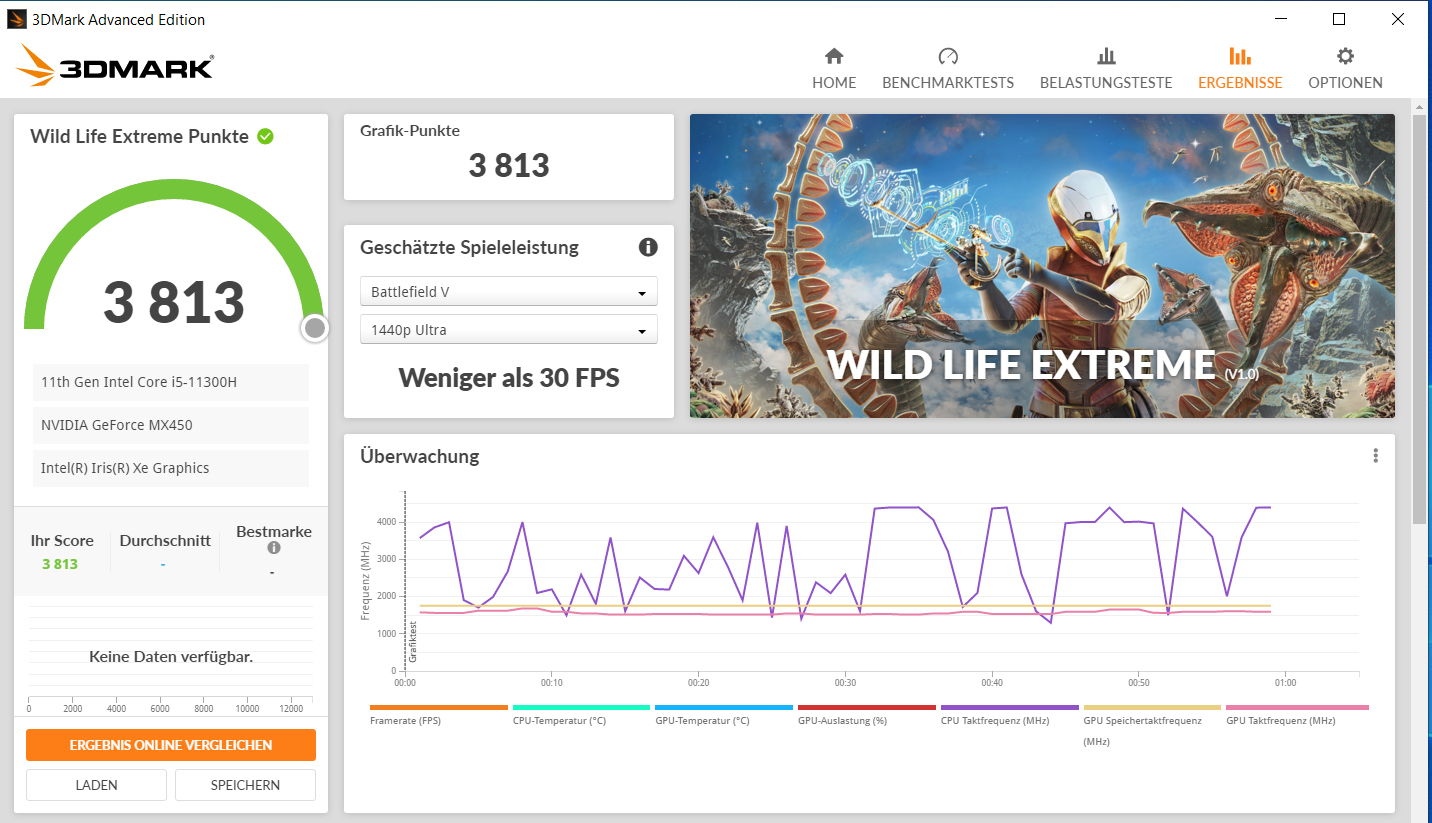
ElGeForce-MX450(Turing) es el actual modelo de gama media de Nvidia. Se apoya en la rápida memoria GDDR5 (2.048 MB) que se conecta a través de una línea de 64 bits. Los resultados de 3DMark están a la par de la media del MX450 que hemos determinado hasta ahora. El perfil "Ultra Performance" no afecta al rendimiento gráfico
| 3DMark 11 Performance | 7524 puntos | |
| 3DMark Ice Storm Standard Score | 55566 puntos | |
| 3DMark Cloud Gate Standard Score | 14683 puntos | |
| 3DMark Fire Strike Score | 4287 puntos | |
| 3DMark Time Spy Score | 2030 puntos | |
ayuda | ||
| 3DMark 11 - 1280x720 Performance GPU | |
| Lenovo IdeaPad 5 Pro 16IHU6 | |
| Dell Inspiron 15 5518-2X3JR (Ultra-Leistung) | |
| Dell Inspiron 15 5518-2X3JR | |
| Media de la clase Office (2551 - 18313, n=72, últimos 2 años) | |
| HP Pavilion 15-eg | |
| Medio NVIDIA GeForce MX450 (6341 - 9580, n=16) | |
| Xiaomi RedmiBook Pro 15 | |
| Asus VivoBook S15 D533UA | |
| Lenovo IdeaPad 5 15ALC05 | |
| 3DMark | |
| 1920x1080 Fire Strike Graphics | |
| Media de la clase Office (736 - 21871, n=75, últimos 2 años) | |
| Lenovo IdeaPad 5 Pro 16IHU6 | |
| Medio NVIDIA GeForce MX450 (4336 - 5753, n=17) | |
| Dell Inspiron 15 5518-2X3JR | |
| HP Pavilion 15-eg | |
| Dell Inspiron 15 5518-2X3JR (Ultra-Leistung) | |
| Xiaomi RedmiBook Pro 15 | |
| Asus VivoBook S15 D533UA | |
| Lenovo IdeaPad 5 15ALC05 | |
| 1280x720 Cloud Gate Standard Graphics | |
| Media de la clase Office (11640 - 118515, n=38, últimos 2 años) | |
| Lenovo IdeaPad 5 Pro 16IHU6 | |
| Medio NVIDIA GeForce MX450 (25467 - 33806, n=13) | |
| Dell Inspiron 15 5518-2X3JR (Ultra-Leistung) | |
| HP Pavilion 15-eg | |
| Dell Inspiron 15 5518-2X3JR | |
| Xiaomi RedmiBook Pro 15 | |
| Lenovo IdeaPad 5 15ALC05 | |
| 2560x1440 Time Spy Graphics | |
| Media de la clase Office (493 - 6679, n=70, últimos 2 años) | |
| Lenovo IdeaPad 5 Pro 16IHU6 | |
| Dell Inspiron 15 5518-2X3JR (Ultra-Leistung) | |
| HP Pavilion 15-eg | |
| Dell Inspiron 15 5518-2X3JR | |
| Medio NVIDIA GeForce MX450 (1086 - 2300, n=16) | |
| Lenovo IdeaPad 5 15ALC05 | |
| Asus VivoBook S15 D533UA | |
Rendimiento de los juegos
La mayoría de los juegos de nuestra base de datos alcanzan frecuencias de cuadro jugables con resoluciones bajas y niveles de calidad bajos o medios. Los títulos con requisitos de hardware moderados permiten más. Las tasas de fotogramasestán ligeramente por debajo de la media del MX450. El Inspiron no puedeseguir el ritmo de lasexcelentes tasas delLenovo Ideapad 5 Pro 16IHU6.
| Dota 2 Reborn - 1920x1080 ultra (3/3) best looking | |
| Lenovo IdeaPad 5 Pro 16IHU6 | |
| HP Pavilion 15-eg | |
| MSI Modern 14 B11SB-085 | |
| Medio NVIDIA GeForce MX450 (34.9 - 104.6, n=20) | |
| Xiaomi RedmiBook Pro 15 | |
| Dell Inspiron 15 5518-2X3JR (Ultra-Leistung) | |
| Dell Inspiron 15 5518-2X3JR | |
| Media de la clase Office (14.6 - 135, n=77, últimos 2 años) | |
| Asus VivoBook S15 D533UA | |
| Lenovo IdeaPad 5 15ALC05 | |
| X-Plane 11.11 - 1920x1080 high (fps_test=3) | |
| HP Pavilion 15-eg | |
| Lenovo IdeaPad 5 Pro 16IHU6 | |
| Xiaomi RedmiBook Pro 15 | |
| MSI Modern 14 B11SB-085 | |
| Medio NVIDIA GeForce MX450 (35.4 - 71.4, n=20) | |
| Dell Inspiron 15 5518-2X3JR | |
| Dell Inspiron 15 5518-2X3JR (Ultra-Leistung) | |
| Media de la clase Office (12 - 82.4, n=69, últimos 2 años) | |
| Lenovo IdeaPad 5 15ALC05 | |
| Asus VivoBook S15 D533UA | |
| Final Fantasy XV Benchmark - 1280x720 Lite Quality | |
| Lenovo IdeaPad 5 Pro 16IHU6 (1.3) | |
| Media de la clase Office (16.5 - 171.2, n=73, últimos 2 años) | |
| Medio NVIDIA GeForce MX450 (27.6 - 72.2, n=16) | |
| MSI Modern 14 B11SB-085 (1.3) | |
| Dell Inspiron 15 5518-2X3JR (1.3, Ultra-Leistung) | |
| Xiaomi RedmiBook Pro 15 (1.3) | |
| Dell Inspiron 15 5518-2X3JR (1.3) | |
| HP Pavilion 15-eg (1.3) | |
| Asus VivoBook S15 D533UA (1.3) | |
| GTA V - 1920x1080 High/On (Advanced Graphics Off) AA:2xMSAA + FX AF:8x | |
| Lenovo IdeaPad 5 Pro 16IHU6 | |
| Medio NVIDIA GeForce MX450 (30.6 - 68.3, n=11) | |
| Dell Inspiron 15 5518-2X3JR (Ultra-Leistung) | |
| Dell Inspiron 15 5518-2X3JR | |
| MSI Modern 14 B11SB-085 | |
| HP Pavilion 15-eg | |
| Media de la clase Office (11.4 - 163.1, n=70, últimos 2 años) | |
| Asus VivoBook S15 D533UA | |
| Strange Brigade - 1280x720 lowest AF:1 | |
| Media de la clase Office (19.4 - 388, n=53, últimos 2 años) | |
| Lenovo IdeaPad 5 Pro 16IHU6 (1.47.22.14 D3D12) | |
| Medio NVIDIA GeForce MX450 (61.4 - 137.7, n=12) | |
| MSI Modern 14 B11SB-085 (1.47.22.14 D3D12) | |
| Dell Inspiron 15 5518-2X3JR (1.47.22.14 D3D12) | |
| Dell Inspiron 15 5518-2X3JR (1.47.22.14 D3D12, Ultra-Leistung) | |
| Xiaomi RedmiBook Pro 15 (1.47.22.14 D3D12) | |
| Asus VivoBook S15 D533UA (1.47.22.14 D3D12) | |
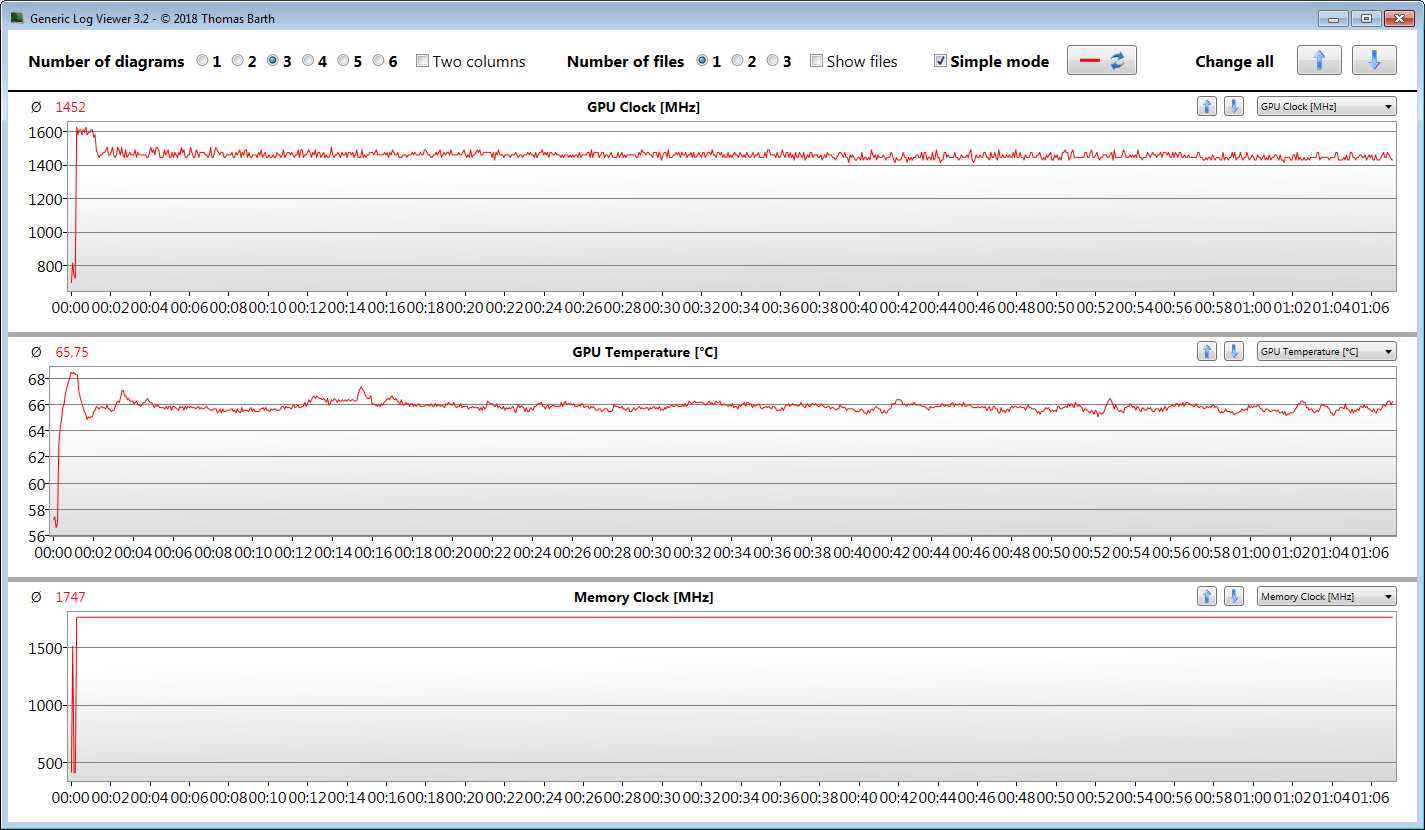
Para comprobar si la velocidad de fotogramas se mantiene prácticamente constante durante un periodo más largo, ejecutamos el juego"The Witcher 3" durante unos 60 minutos con resolución Full HD y ajustes de máxima calidad. El personaje del juego no se mueve. El reloj de la GPU se reduce ligeramente después de algo menos de dos minutos, pero esto no afecta a las velocidades de fotogramas
Witcher 3 FPS-Diagram
| bajo | medio | alto | ultra | |
|---|---|---|---|---|
| GTA V (2015) | 115 | 95.8 | 51.8 | 23.8 |
| The Witcher 3 (2015) | 99.3 | 57.8 | 30.7 | 17.7 |
| Dota 2 Reborn (2015) | 104 | 90.5 | 80.7 | 75.3 |
| Final Fantasy XV Benchmark (2018) | 54.1 | 25.3 | 13.8 | |
| X-Plane 11.11 (2018) | 68.8 | 53.7 | 47 | |
| Strange Brigade (2018) | 106 | 40.6 | 35.4 | 25 |
| Control (2019) | 74.8 | 24.7 | 15.7 | |
| Flight Simulator 2020 (2020) | 61 | 22.7 | 14.8 | 7.86 |
| Deathloop (2021) | 27.7 | 13.5 | 11 | |
| Alan Wake Remastered (2021) | 25.5 | 16.2 | 13.4 | |
| Back 4 Blood (2021) | 128.3 | 46.9 | 29.4 | 26.7 |
| Riders Republic (2021) | 62 | 28 | 23 | 20 |
| Forza Horizon 5 (2021) | 72 | 28 | 23 | 13 |
| Halo Infinite (2021) | 8.6 | |||
| God of War (2022) | 25.8 | 18.4 | 8.66 | 3.09 |
| Rainbow Six Extraction (2022) | 54 | 28 | 26 | 16 |
| Dying Light 2 (2022) | 22 | 16.7 | 11.8 | |
| GRID Legends (2022) | 67.7 | 45.8 | 39.7 | 24.9 |
| Elden Ring (2022) | 31 | 19 | 17.2 | 15.1 |
| Elex 2 (2022) | 23.1 | 10.7 | 6.62 | |
| Ghostwire Tokyo (2022) | 38.2 | 25.8 | 25.8 | 24.9 |
| Tiny Tina's Wonderlands (2022) | 37.2 | 22.7 | 14 | 10.5 |
| Vampire Bloodhunt (2022) | 96.5 | 59.3 | 50.7 | 33.4 |
| F1 22 (2022) | 54.7 | 49.2 | 36 | 22.2 |
| The Quarry (2022) | 30 | 21.1 | 14.9 | 9.31 |
| FIFA 23 (2022) | 57.4 | 42.1 | 37.8 | 33.9 |
| A Plague Tale Requiem (2022) | 22.6 | 18.3 | 12.4 | 8.51 |
| Uncharted Legacy of Thieves Collection (2022) | 9.73 | 8.41 | 5.83 | 5.51 |
| Call of Duty Modern Warfare 2 2022 (2022) | 37 | 33 | 15 | 17 |
| Spider-Man Miles Morales (2022) | 22.9 | 21 | 17.6 | 11.2 |
| The Callisto Protocol (2022) | 34.2 | 15 | 8 | 7.4 |
| Need for Speed Unbound (2022) | 28.7 | 21.4 | 13.5 | |
| High On Life (2023) | 29.4 | 15.8 | 14 | 12.4 |
| The Witcher 3 v4 (2023) | 45.8 | 32.4 | 24.9 | 14.1 |
| Dead Space Remake (2023) | 17.1 | 15.7 | 6.37 | |
| Baldur's Gate 3 (2023) | 11.3 | 5.94 | ||
| Cyberpunk 2077 (2023) | 22.6 | 14 | 8.12 | 7.09 |
| Counter-Strike 2 (2023) | 87.5 | 67 | 34.8 | 21.7 |
| EA Sports FC 24 (2023) | 58 | 57.3 | 56.4 | 55.9 |
| Assassin's Creed Mirage (2023) | 18 | 15 | ||
| Skull & Bones (2024) | 21 | 21 | 13 | |
| Horizon Forbidden West (2024) | 11.6 | |||
| F1 24 (2024) | 31.9 | 25.7 | 20.4 | 13.4 |
Emissions & energy - Dell laptop with good battery runtimes
Emisiones acústicas
En el uso diario (oficina, Internet), el portátil produce poco o ningún ruido - el ventilador suele quedarse parado. Bajo una carga mayor,se alcanzan niveles de presión sonora más altos que en portátiles equipados de forma comparable como elRedmiBook Pro 15 y elIdeapad 5 Pro 16IHU6.Se puede conseguir un menor nivel de ruido utilizando el perfil "Quiet" - a costa del rendimiento informático
Ruido
| Ocioso |
| 26 / 26 / 26 dB(A) |
| Carga |
| 47.4 / 48.4 dB(A) |
 | ||
30 dB silencioso 40 dB(A) audible 50 dB(A) ruidosamente alto |
||
min: | ||
| Dell Inspiron 15 5518-2X3JR Intel Core i5-11300H, NVIDIA GeForce MX450 | HP Pavilion 15-eg Intel Core i7-1165G7, NVIDIA GeForce MX450 | Xiaomi RedmiBook Pro 15 Intel Core i7-11370H, NVIDIA GeForce MX450 | Lenovo IdeaPad 5 Pro 16IHU6 Intel Core i5-11300H, NVIDIA GeForce MX450 | Asus VivoBook S15 D533UA AMD Ryzen 7 5700U, AMD Radeon RX Vega 8 (Ryzen 4000/5000) | Lenovo IdeaPad 5 15ALC05 AMD Ryzen 5 5500U, AMD Radeon RX Vega 7 | |
|---|---|---|---|---|---|---|
| Noise | 7% | 4% | 8% | 0% | 6% | |
| apagado / medio ambiente * (dB) | 26 | 25.4 2% | 25 4% | 25 4% | 26 -0% | 26 -0% |
| Idle Minimum * (dB) | 26 | 25.6 2% | 25 4% | 25 4% | 26 -0% | 26 -0% |
| Idle Average * (dB) | 26 | 25.6 2% | 26 -0% | 25 4% | 26 -0% | 26 -0% |
| Idle Maximum * (dB) | 26 | 25.6 2% | 27 -4% | 25 4% | 28.8 -11% | 26 -0% |
| Load Average * (dB) | 47.4 | 39.2 17% | 43 9% | 44.5 6% | 45 5% | 42.6 10% |
| Load Maximum * (dB) | 48.4 | 41.5 14% | 44 9% | 36.5 25% | 45 7% | 37.4 23% |
| Witcher 3 ultra * (dB) | 39.1 | 42 |
* ... más pequeño es mejor
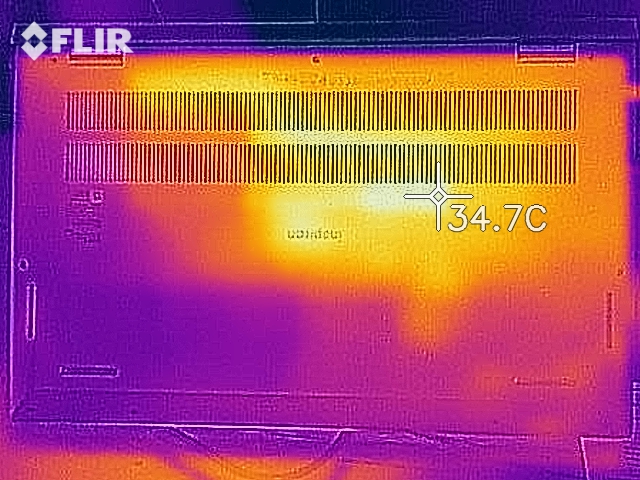
Temperatura
Las temperaturas de la carcasa están dentro de la zona verde en el uso diario (oficina, Internet).En la zona del disipador de calor se alcanzan valores superiores a 50 o 60 °C durante la carga completa del hardware. La competencia suele calentarse menos selectivamente,pero en total se calientan más.
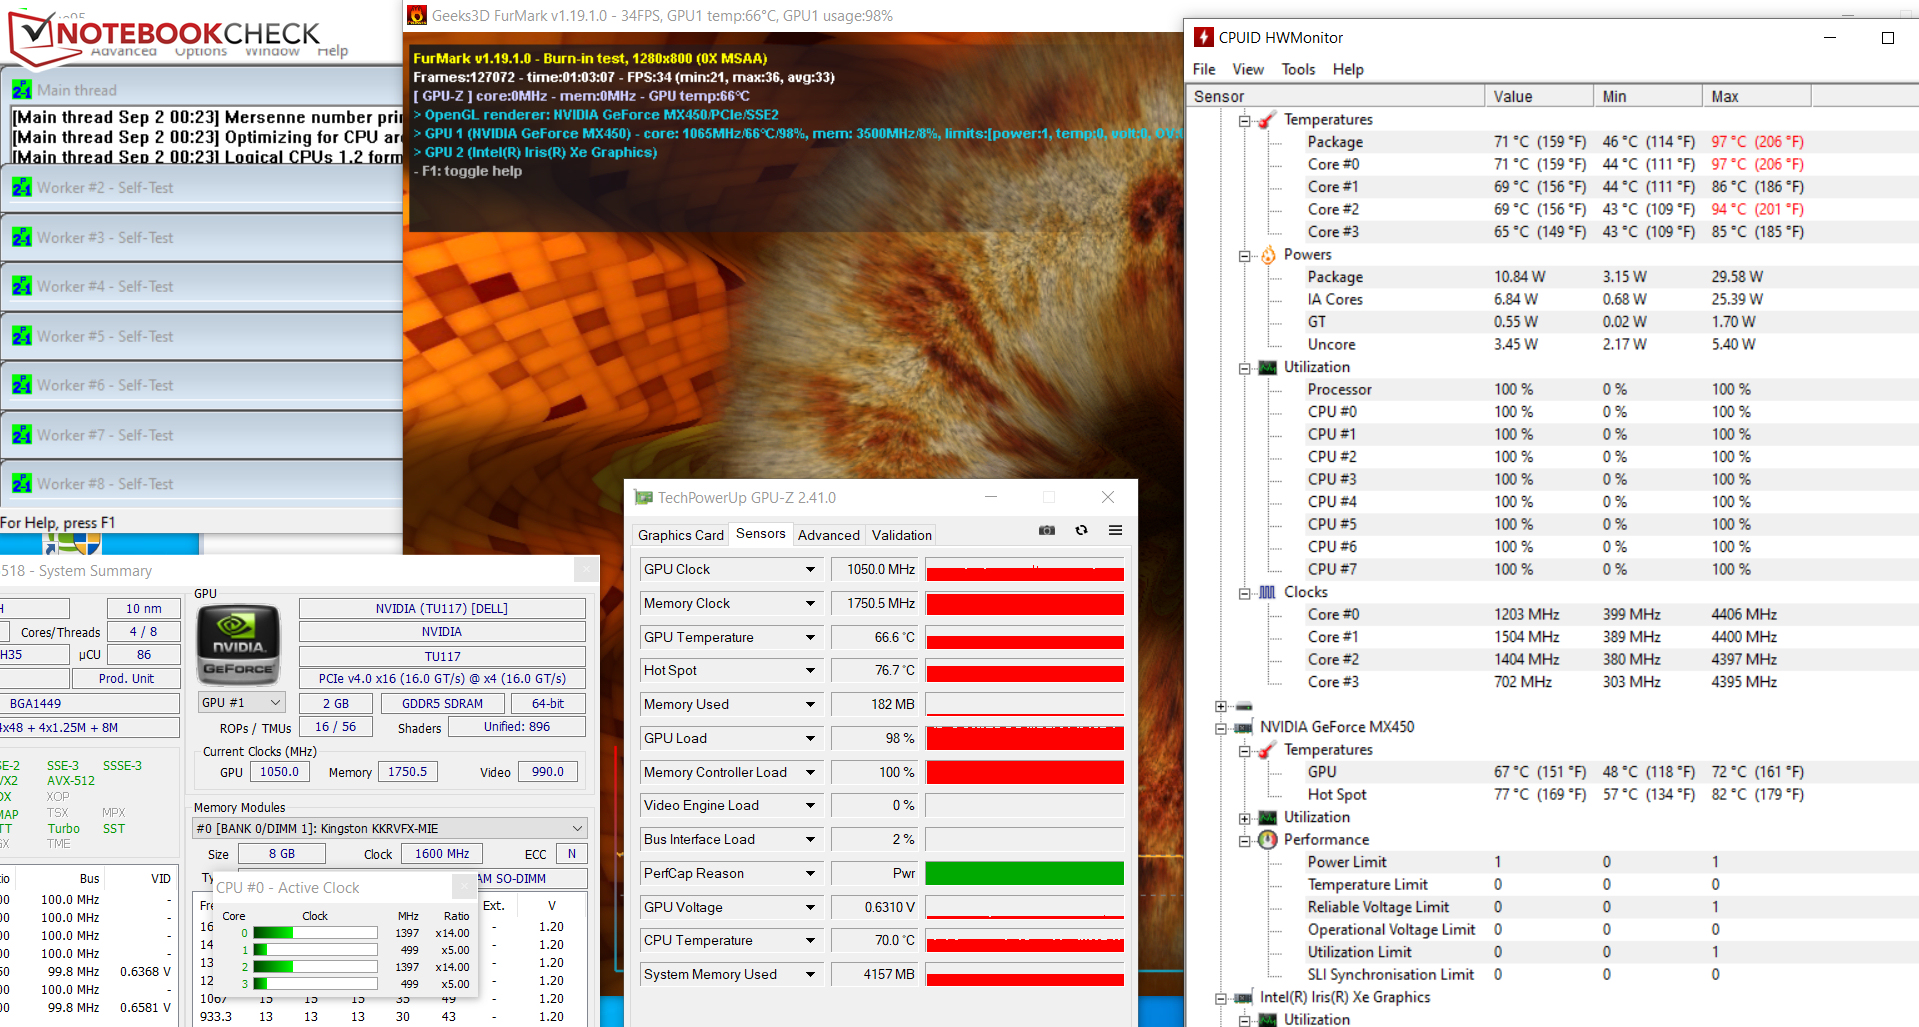
La CPU y la GPU comienzan la prueba de estrés (Prime95 y FurMark se ejecutan durante al menos una hora) con velocidades relativamente altas. Más allá de este periodo, las velocidades caen a 400 MHz hasta 1,4 GHz o unos 1.050 MHz. La prueba de estrés representa un escenario extremo. Utilizamos esta prueba para comprobar si el sistema funciona de forma estable a plena carga.
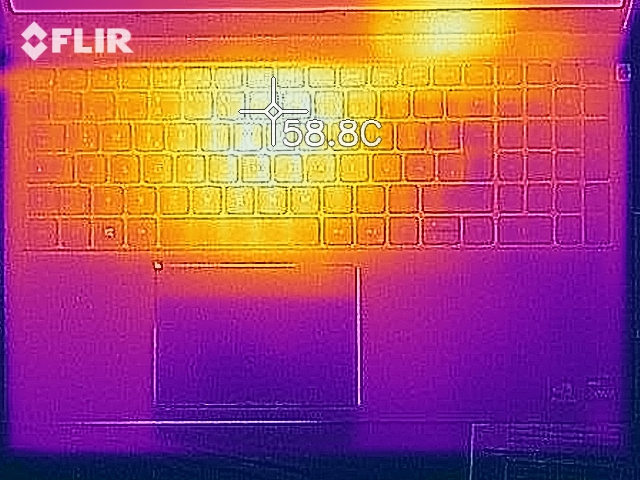
(-) La temperatura máxima en la parte superior es de 55.1 °C / 131 F, frente a la media de 34.3 °C / 94 F, que oscila entre 21.2 y 62.5 °C para la clase Office.
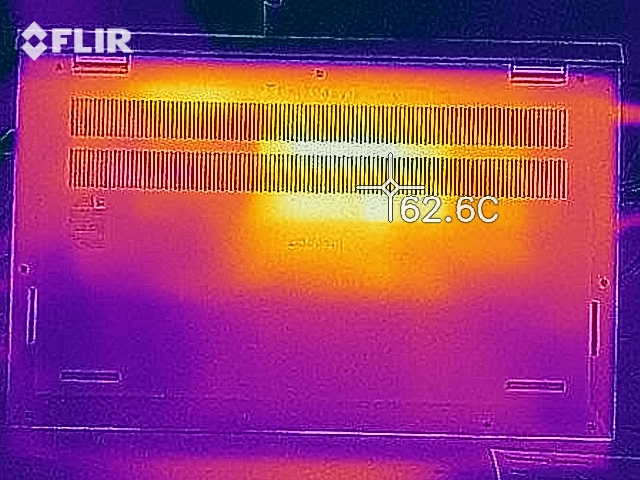
(-) El fondo se calienta hasta un máximo de 62.4 °C / 144 F, frente a la media de 36.8 °C / 98 F
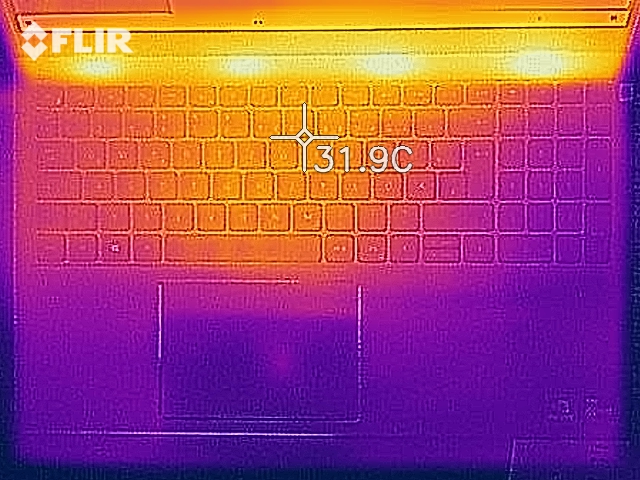
(+) En reposo, la temperatura media de la parte superior es de 26.3 °C / 79# F, frente a la media del dispositivo de 29.5 °C / 85 F.
(+) El reposamanos y el panel táctil están a una temperatura inferior a la de la piel, con un máximo de 28.3 °C / 82.9 F y, por tanto, son fríos al tacto.
(±) La temperatura media de la zona del reposamanos de dispositivos similares fue de 27.5 °C / 81.5 F (-0.8 °C / -1.4 F).
| Dell Inspiron 15 5518-2X3JR Intel Core i5-11300H, NVIDIA GeForce MX450 | HP Pavilion 15-eg Intel Core i7-1165G7, NVIDIA GeForce MX450 | Xiaomi RedmiBook Pro 15 Intel Core i7-11370H, NVIDIA GeForce MX450 | Lenovo IdeaPad 5 Pro 16IHU6 Intel Core i5-11300H, NVIDIA GeForce MX450 | Asus VivoBook S15 D533UA AMD Ryzen 7 5700U, AMD Radeon RX Vega 8 (Ryzen 4000/5000) | Lenovo IdeaPad 5 15ALC05 AMD Ryzen 5 5500U, AMD Radeon RX Vega 7 | |
|---|---|---|---|---|---|---|
| Heat | 13% | 6% | 6% | 16% | 20% | |
| Maximum Upper Side * (°C) | 55.1 | 44 20% | 54 2% | 65.3 -19% | 46.1 16% | 40.5 26% |
| Maximum Bottom * (°C) | 62.4 | 53.4 14% | 52 17% | 55.4 11% | 46.6 25% | 42 33% |
| Idle Upper Side * (°C) | 29.8 | 27.4 8% | 33 -11% | 25.4 15% | 27.4 8% | 26.5 11% |
| Idle Bottom * (°C) | 32.5 | 28.8 11% | 28 14% | 26.8 18% | 28.2 13% | 29 11% |
* ... más pequeño es mejor
Altavoz
Los altavoces estéreo producen un sonido decente, que apenas tiene bajos.
Dell Inspiron 15 5518-2X3JR análisis de audio
(+) | los altavoces pueden reproducir a un volumen relativamente alto (#88.4 dB)
Graves 100 - 315 Hz
(-) | casi sin bajos - de media 21.3% inferior a la mediana
(+) | el bajo es lineal (5.8% delta a la frecuencia anterior)
Medios 400 - 2000 Hz
(+) | medios equilibrados - a sólo 3.1% de la mediana
(+) | los medios son lineales (4.2% delta a la frecuencia anterior)
Altos 2 - 16 kHz
(±) | máximos más altos - de media 5.5% más altos que la mediana
(+) | los máximos son lineales (6.4% delta a la frecuencia anterior)
Total 100 - 16.000 Hz
(±) | la linealidad del sonido global es media (17% de diferencia con la mediana)
En comparación con la misma clase
» 24% de todos los dispositivos probados de esta clase eran mejores, 7% similares, 68% peores
» El mejor tuvo un delta de 7%, la media fue 21%, el peor fue ###max##%
En comparación con todos los dispositivos probados
» 31% de todos los dispositivos probados eran mejores, 8% similares, 61% peores
» El mejor tuvo un delta de 4%, la media fue 23%, el peor fue ###max##%
HP Pavilion 15-eg análisis de audio
(±) | la sonoridad del altavoz es media pero buena (81.3 dB)
Graves 100 - 315 Hz
(-) | casi sin bajos - de media 18% inferior a la mediana
(±) | la linealidad de los graves es media (12.8% delta a frecuencia anterior)
Medios 400 - 2000 Hz
(+) | medios equilibrados - a sólo 2.8% de la mediana
(+) | los medios son lineales (4% delta a la frecuencia anterior)
Altos 2 - 16 kHz
(+) | máximos equilibrados - a sólo 1% de la mediana
(+) | los máximos son lineales (3% delta a la frecuencia anterior)
Total 100 - 16.000 Hz
(+) | el sonido global es lineal (13.2% de diferencia con la mediana)
En comparación con la misma clase
» 27% de todos los dispositivos probados de esta clase eran mejores, 5% similares, 68% peores
» El mejor tuvo un delta de 5%, la media fue 17%, el peor fue ###max##%
En comparación con todos los dispositivos probados
» 13% de todos los dispositivos probados eran mejores, 3% similares, 84% peores
» El mejor tuvo un delta de 4%, la media fue 23%, el peor fue ###max##%
Consumo de energía
En reposo y con poca carga, el consumo de energía del ordenador Dell está más o menos a la par con los valores delIdeapad 5 Proy delRedmiBook Pro 15. Consume bastante menos energía bajo alta carga. Por un lado, los bajos límites de potencia de la CPU se notan aquí, y por otro, Dell sólo incluye una fuente de alimentación de 65 vatios (Lenovo: 95 vatios, Xiaomi: 100 vatios). En consecuencia, el Inspiron no puede seguir el ritmo de la competencia en términos de potencia de cálculo.
El gráfico del consumo de energía de la CPU y la GPU durante la prueba de estrés y la Witcher 3 prueba describe bien su comportamiento: Las velocidades de reloj caen en el transcurso de las pruebas.
| Off / Standby | |
| Ocioso | |
| Carga |
|
Clave:
min: | |
Power consumption Witcher 3 / Stress test
| Dell Inspiron 15 5518-2X3JR Intel Core i5-11300H, NVIDIA GeForce MX450 | HP Pavilion 15-eg Intel Core i7-1165G7, NVIDIA GeForce MX450 | Xiaomi RedmiBook Pro 15 Intel Core i7-11370H, NVIDIA GeForce MX450 | Lenovo IdeaPad 5 Pro 16IHU6 Intel Core i5-11300H, NVIDIA GeForce MX450 | Asus VivoBook S15 D533UA AMD Ryzen 7 5700U, AMD Radeon RX Vega 8 (Ryzen 4000/5000) | Lenovo IdeaPad 5 15ALC05 AMD Ryzen 5 5500U, AMD Radeon RX Vega 7 | |
|---|---|---|---|---|---|---|
| Power Consumption | -19% | -37% | -30% | -3% | 11% | |
| Idle Minimum * (Watt) | 4 | 4.9 -23% | 6 -50% | 5 -25% | 5 -25% | 3.7 7% |
| Idle Average * (Watt) | 7.6 | 7.9 -4% | 9 -18% | 9 -18% | 7.7 -1% | 7.9 -4% |
| Idle Maximum * (Watt) | 10.2 | 14.2 -39% | 12 -18% | 9.4 8% | 12.2 -20% | 9.3 9% |
| Load Average * (Watt) | 49.4 | 64.3 -30% | 74 -50% | 71 -44% | 41 17% | 41 17% |
| Witcher 3 ultra * (Watt) | 49.4 | 55.6 -13% | 70.7 -43% | 72.4 -47% | 43 13% | 41 17% |
| Load Maximum * (Watt) | 63.4 | 65.4 -3% | 91 -44% | 99 -56% | 65 -3% | 52.2 18% |
* ... más pequeño es mejor
Duración de la batería
El Inspiron 5518 logra un tiempo de ejecución de 9:24 h en nuestra prueba práctica de WLAN. La carga durante la carga de páginas web se asigna mediante un script
Pro
Contra
Veredicto - El Inspiron 15 5518 ofrece potencial de mejora
La instalación del Core i5-11300Hofrece suficiente rendimiento para aplicaciones de oficina e Internet, el GeForce-MX450permite el uso de juegos de ordenador o aplicaciones que requieran una GPU. El hardware está alojado en una elegante carcasa de aluminio.
Thunderbolt 4 está reservado para el modelo Core i7 del Inspiron.
Una autonomía de casi 9,5 horas debería permitirte pasar el día sin necesidad de un adaptador de corriente. La energía puede recargarse a través del adaptador de corriente propietario de Dell incluido o a través de un adaptador de corriente USB-C - el puerto USB-C del 5518 funciona según el estándar USB 3.2 Gen 2x2.
El portátil no produce mucho ruido en el uso diario (oficina, internet), y el desarrollo de calor está en un nivel aceptable. La pantalla mate (FHD, IPS) ofrece ángulos de visión estables, buen contraste y una decente reproducción del color. El brillo y la cobertura del espacio de color son demasiado bajos.
El procesador se queda corto debido a los bajos límites de potencia. La memoria de trabajo (1x 8 GB, DDR4-3200) funcionando en modo monocanal cuesta más rendimiento. Esto podría mejorarse instalando un segundo módulo de memoria. La carcasa de aluminio carece de rigidez.
Una alternativa al Inspiron en el segmento de los 800 euros (~939 dólares) sería el Lenovo IdeaPad 5 15ALC05. Puntúa con mucho rendimiento multihilo de la CPU, una pantalla brillante, bajas emisiones así como una excelente duración de la batería. Los puntos débiles: La memoria de trabajo está soldada y la pantalla ofrece un bajo contraste.
Precio y disponibilidad
El Inspiron 15 5518 de Dell (Core i5-11300H, GeForce MX450, 8 GB de RAM, 512 GB de SSD) está actualmente disponible en Cyberport.de a un precio de poco menos de 800 euros (~939 dólares)
Dell Inspiron 15 5518-2X3JR
- 09/14/2021 v7 (old)
Sascha Mölck
Price comparison
