Veredicto - El ThinkPad T16g Gen 3 está repleto de funciones pero su rendimiento es deficiente
Cuando se trata de estaciones de trabajo móviles de gran tamaño, es lógico esperar un rendimiento excelente. Sin embargo, Lenovo se ha puesto las cosas innecesariamente difíciles con sus nuevos ThinkPad T16g Gen 3 y ThinkPad P16 Gen 3 al utilizar únicamente una débil fuente de alimentación de 180 vatios. Aunque el rendimiento de la CPU es muy bueno, es la GeForce RTX 5080 (TGP de 105 vatios) más lenta que hemos probado hasta ahora. Incluso los competidores equipados con la RTX 5070 Ti suelen ser más rápidos y, naturalmente, estas limitaciones también se aplican a las GPU RTX PRO del ThinkPad P16 Gen 3. Además, en cuanto pone los componentes a funcionar, la batería se agota repetidamente porque la fuente de alimentación es simplemente insuficiente, y los ventiladores hacen un ruido molesto.
En términos de características, opciones de mantenimiento y funcionalidad general, el ThinkPad T16g Gen 3 obtiene una puntuación alta, lo que lo convierte en una "buena" estación de trabajo en general. La pantalla OLED mate en tándem también proporciona una buena calidad de imagen, aunque la pantalla táctil mate hace que las imágenes mostradas aparezcan ligeramente granuladas.
Aunque el nuevo chasis ha mejorado la portabilidad, hay que preguntarse si se ha sacrificado demasiado el rendimiento.
Pro
Contra
Precio y disponibilidad
El ThinkPad T16g Gen 3 no aparece actualmente en la lista de Lenovo, pero el modelo ThinkPad P16 Gen 3, estructuralmente idéntico, puede ser suyo por unos 2.399 dólares.
Índice
- Veredicto - El ThinkPad T16g Gen 3 está repleto de funciones pero su rendimiento es deficiente
- Especificaciones
- Caja y características
- Dispositivos de entrada - Un teclado estándar
- Pantalla - Tandem OLED
- Rendimiento - Arrow Lake HX y Blackwell cocinando a fuego lento
- Emisiones y energía
- Valoración general de Notebookcheck
- Posibles alternativas comparadas
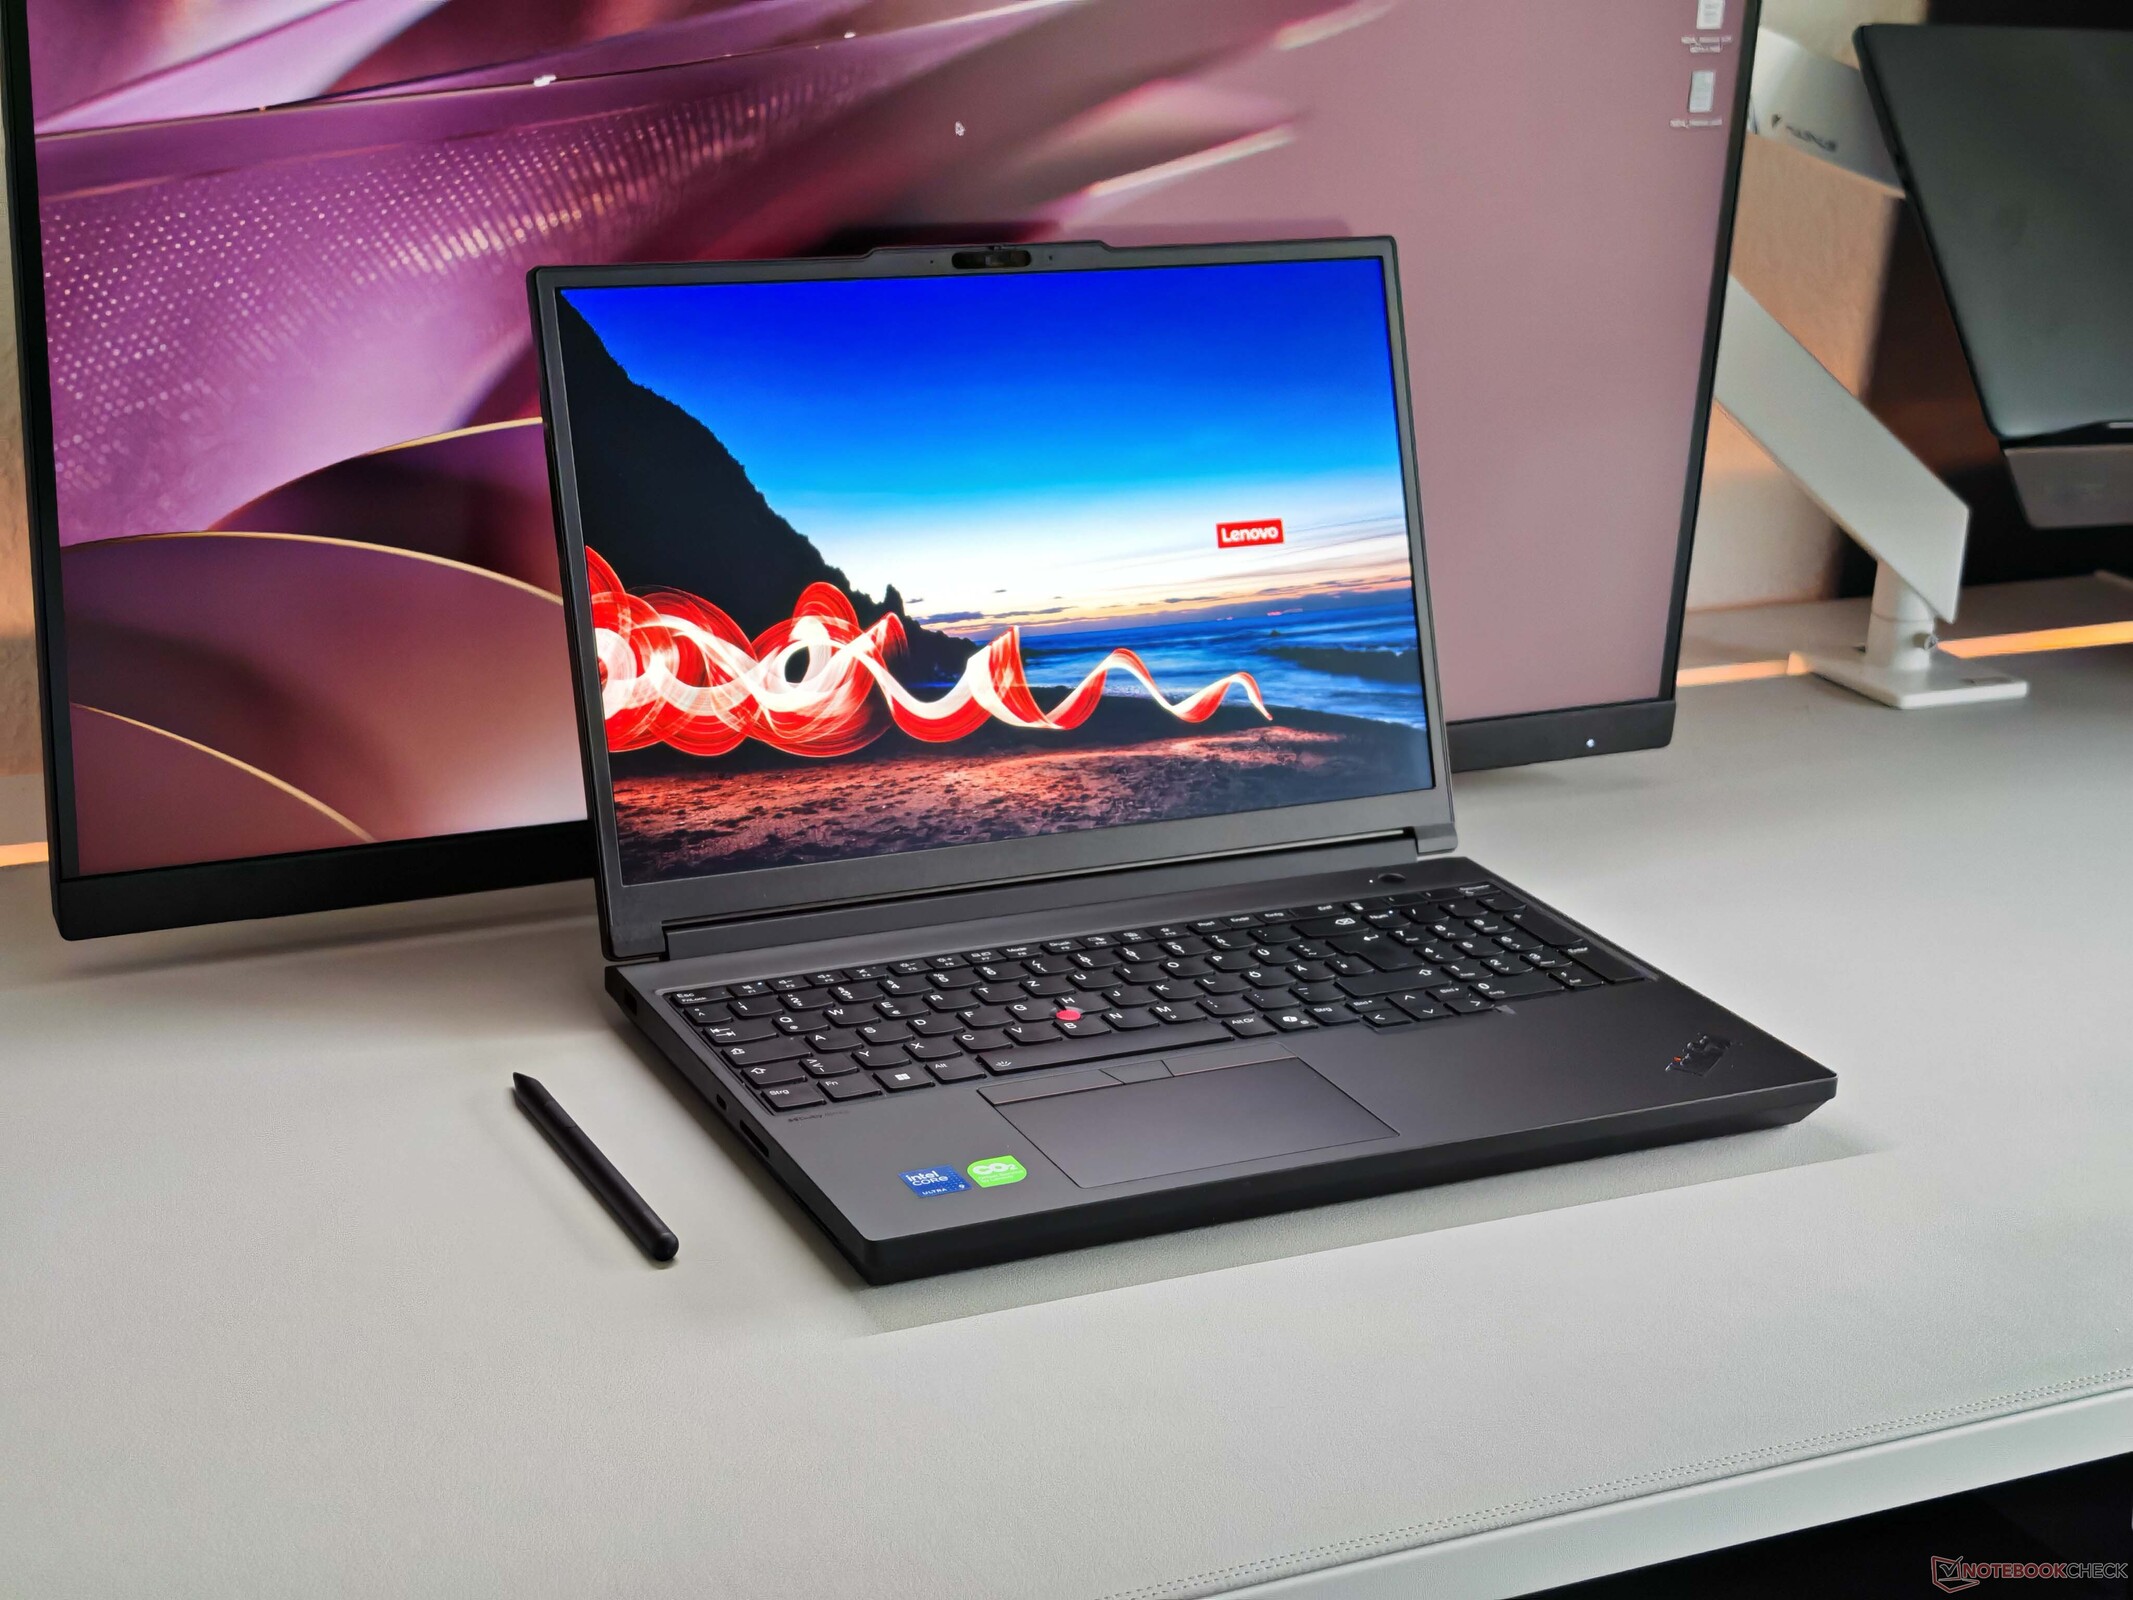
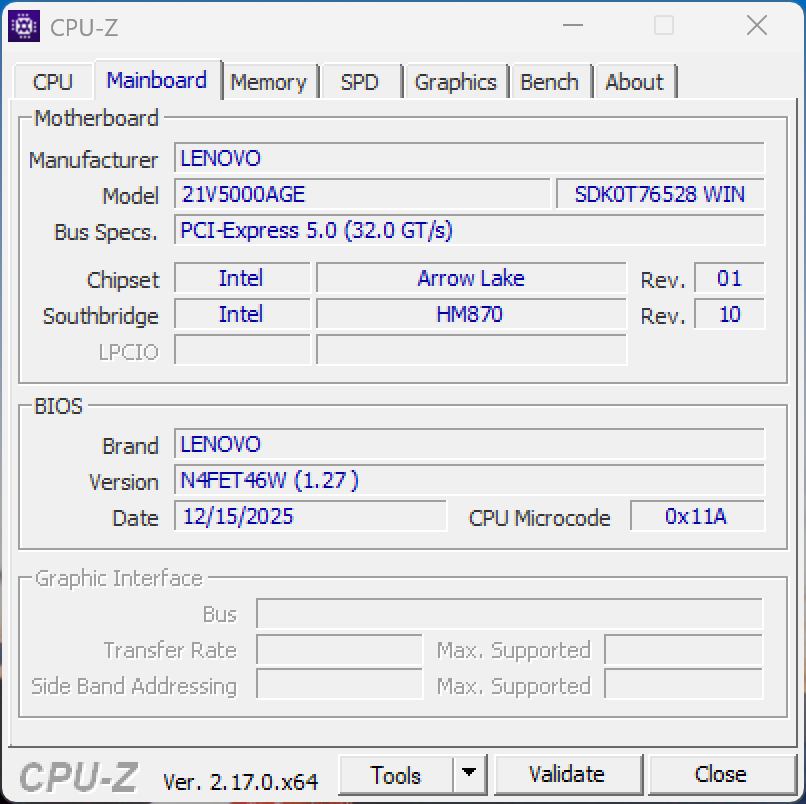
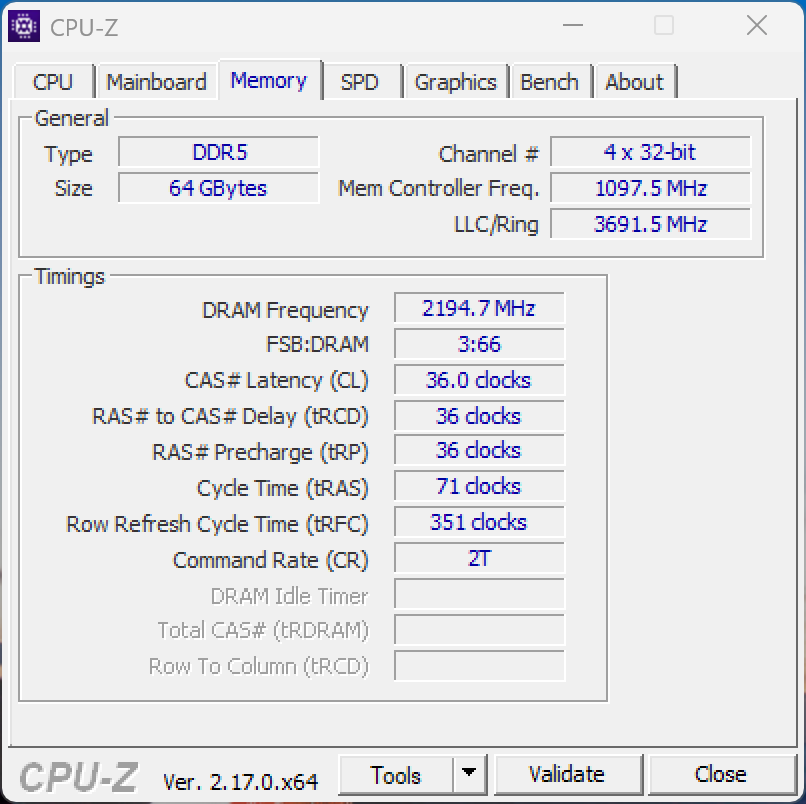
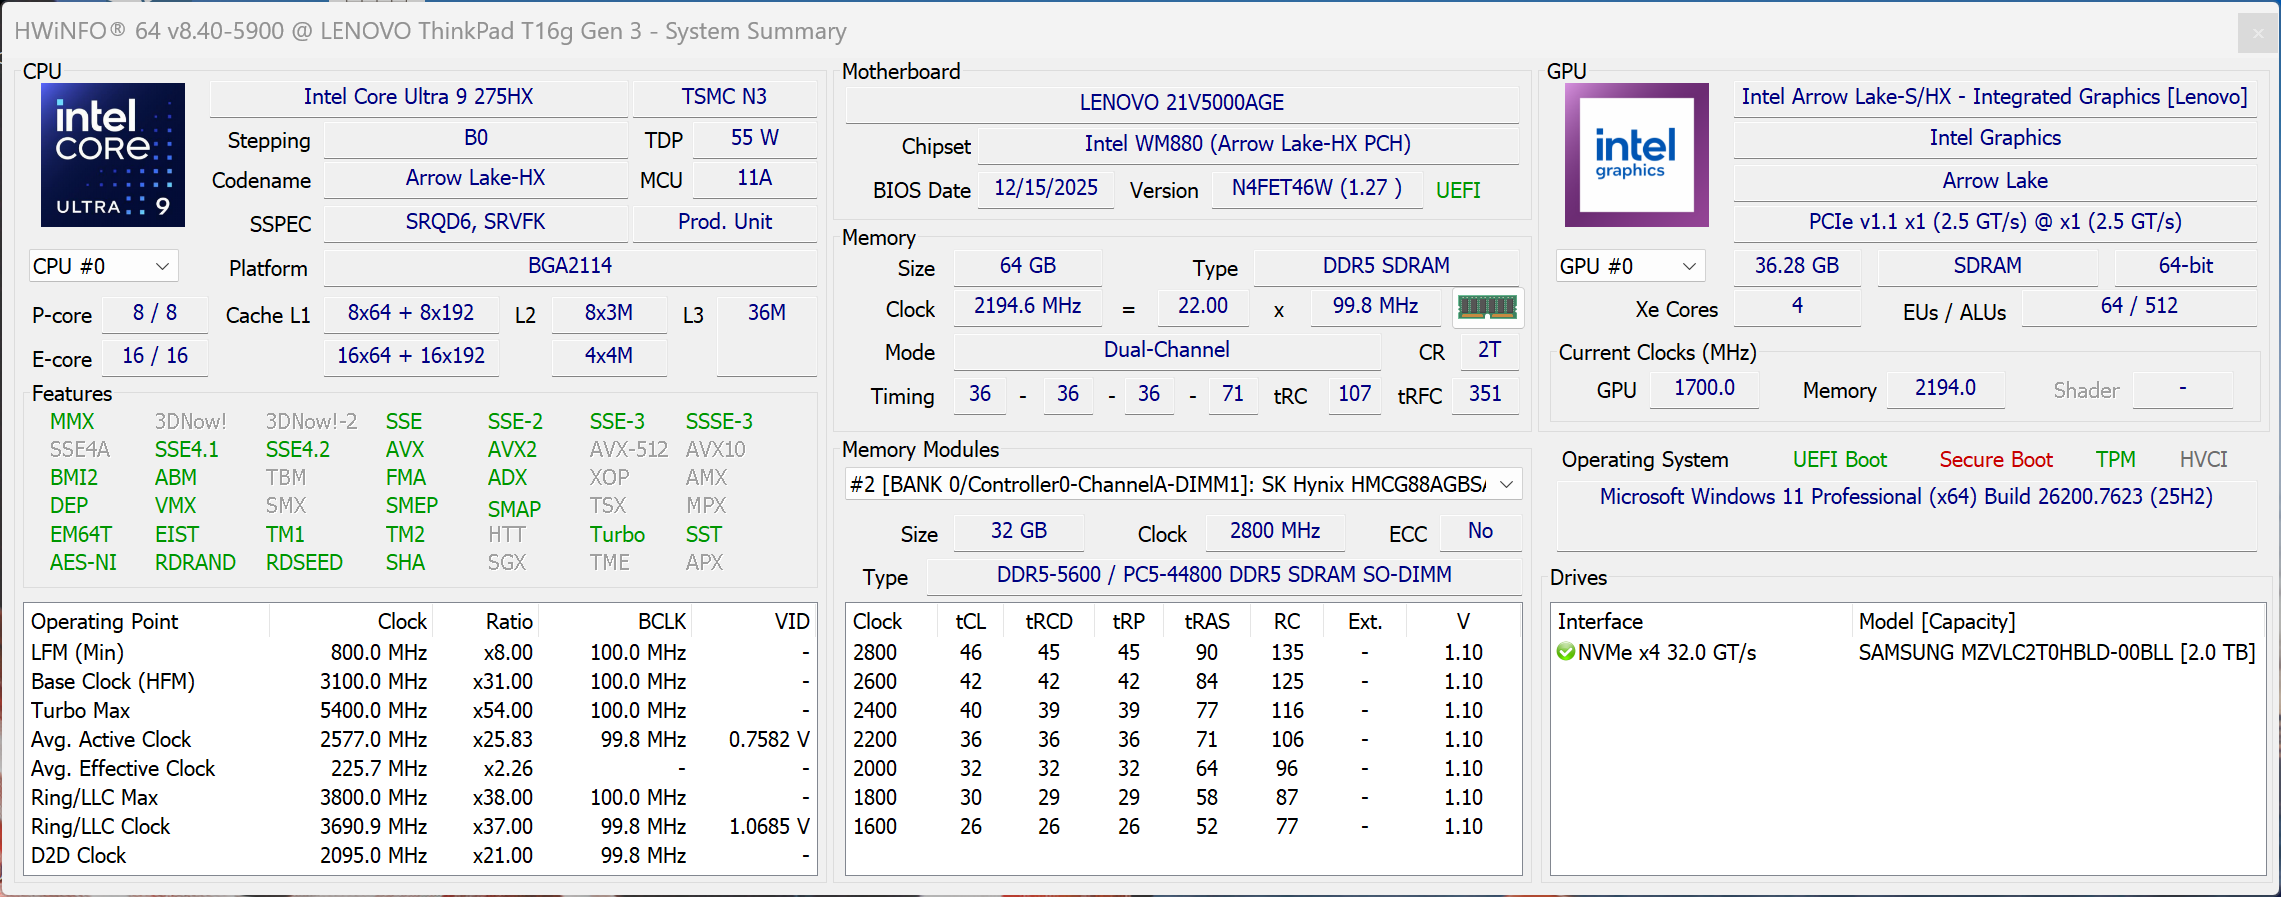
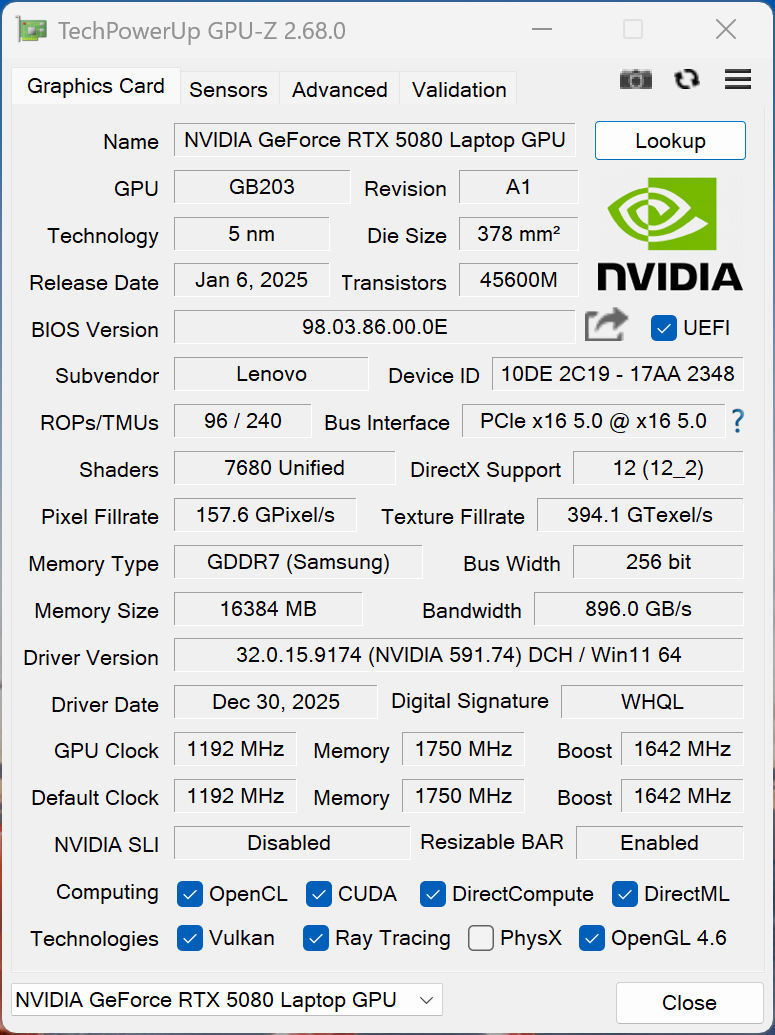
Este año, Lenovo ha rediseñado por completo su gran ThinkPad P16 Gen 3 estación de trabajo, y el fabricante también ofrece la ThinkPad T16g Gen 3 prácticamente idéntica, que sustituye la GPU RTX PRO por una GPU normal GeForce. Hemos analizado la variante de gama alta con el Core Ultra 9 275HX, la tarjeta gráfica para portátiles GeForce RTX 5080, 64 GB de RAM y la pantalla táctil OLED en tándem mate, con un precio aproximado de 5.600 dólares.
Especificaciones
Caja y características
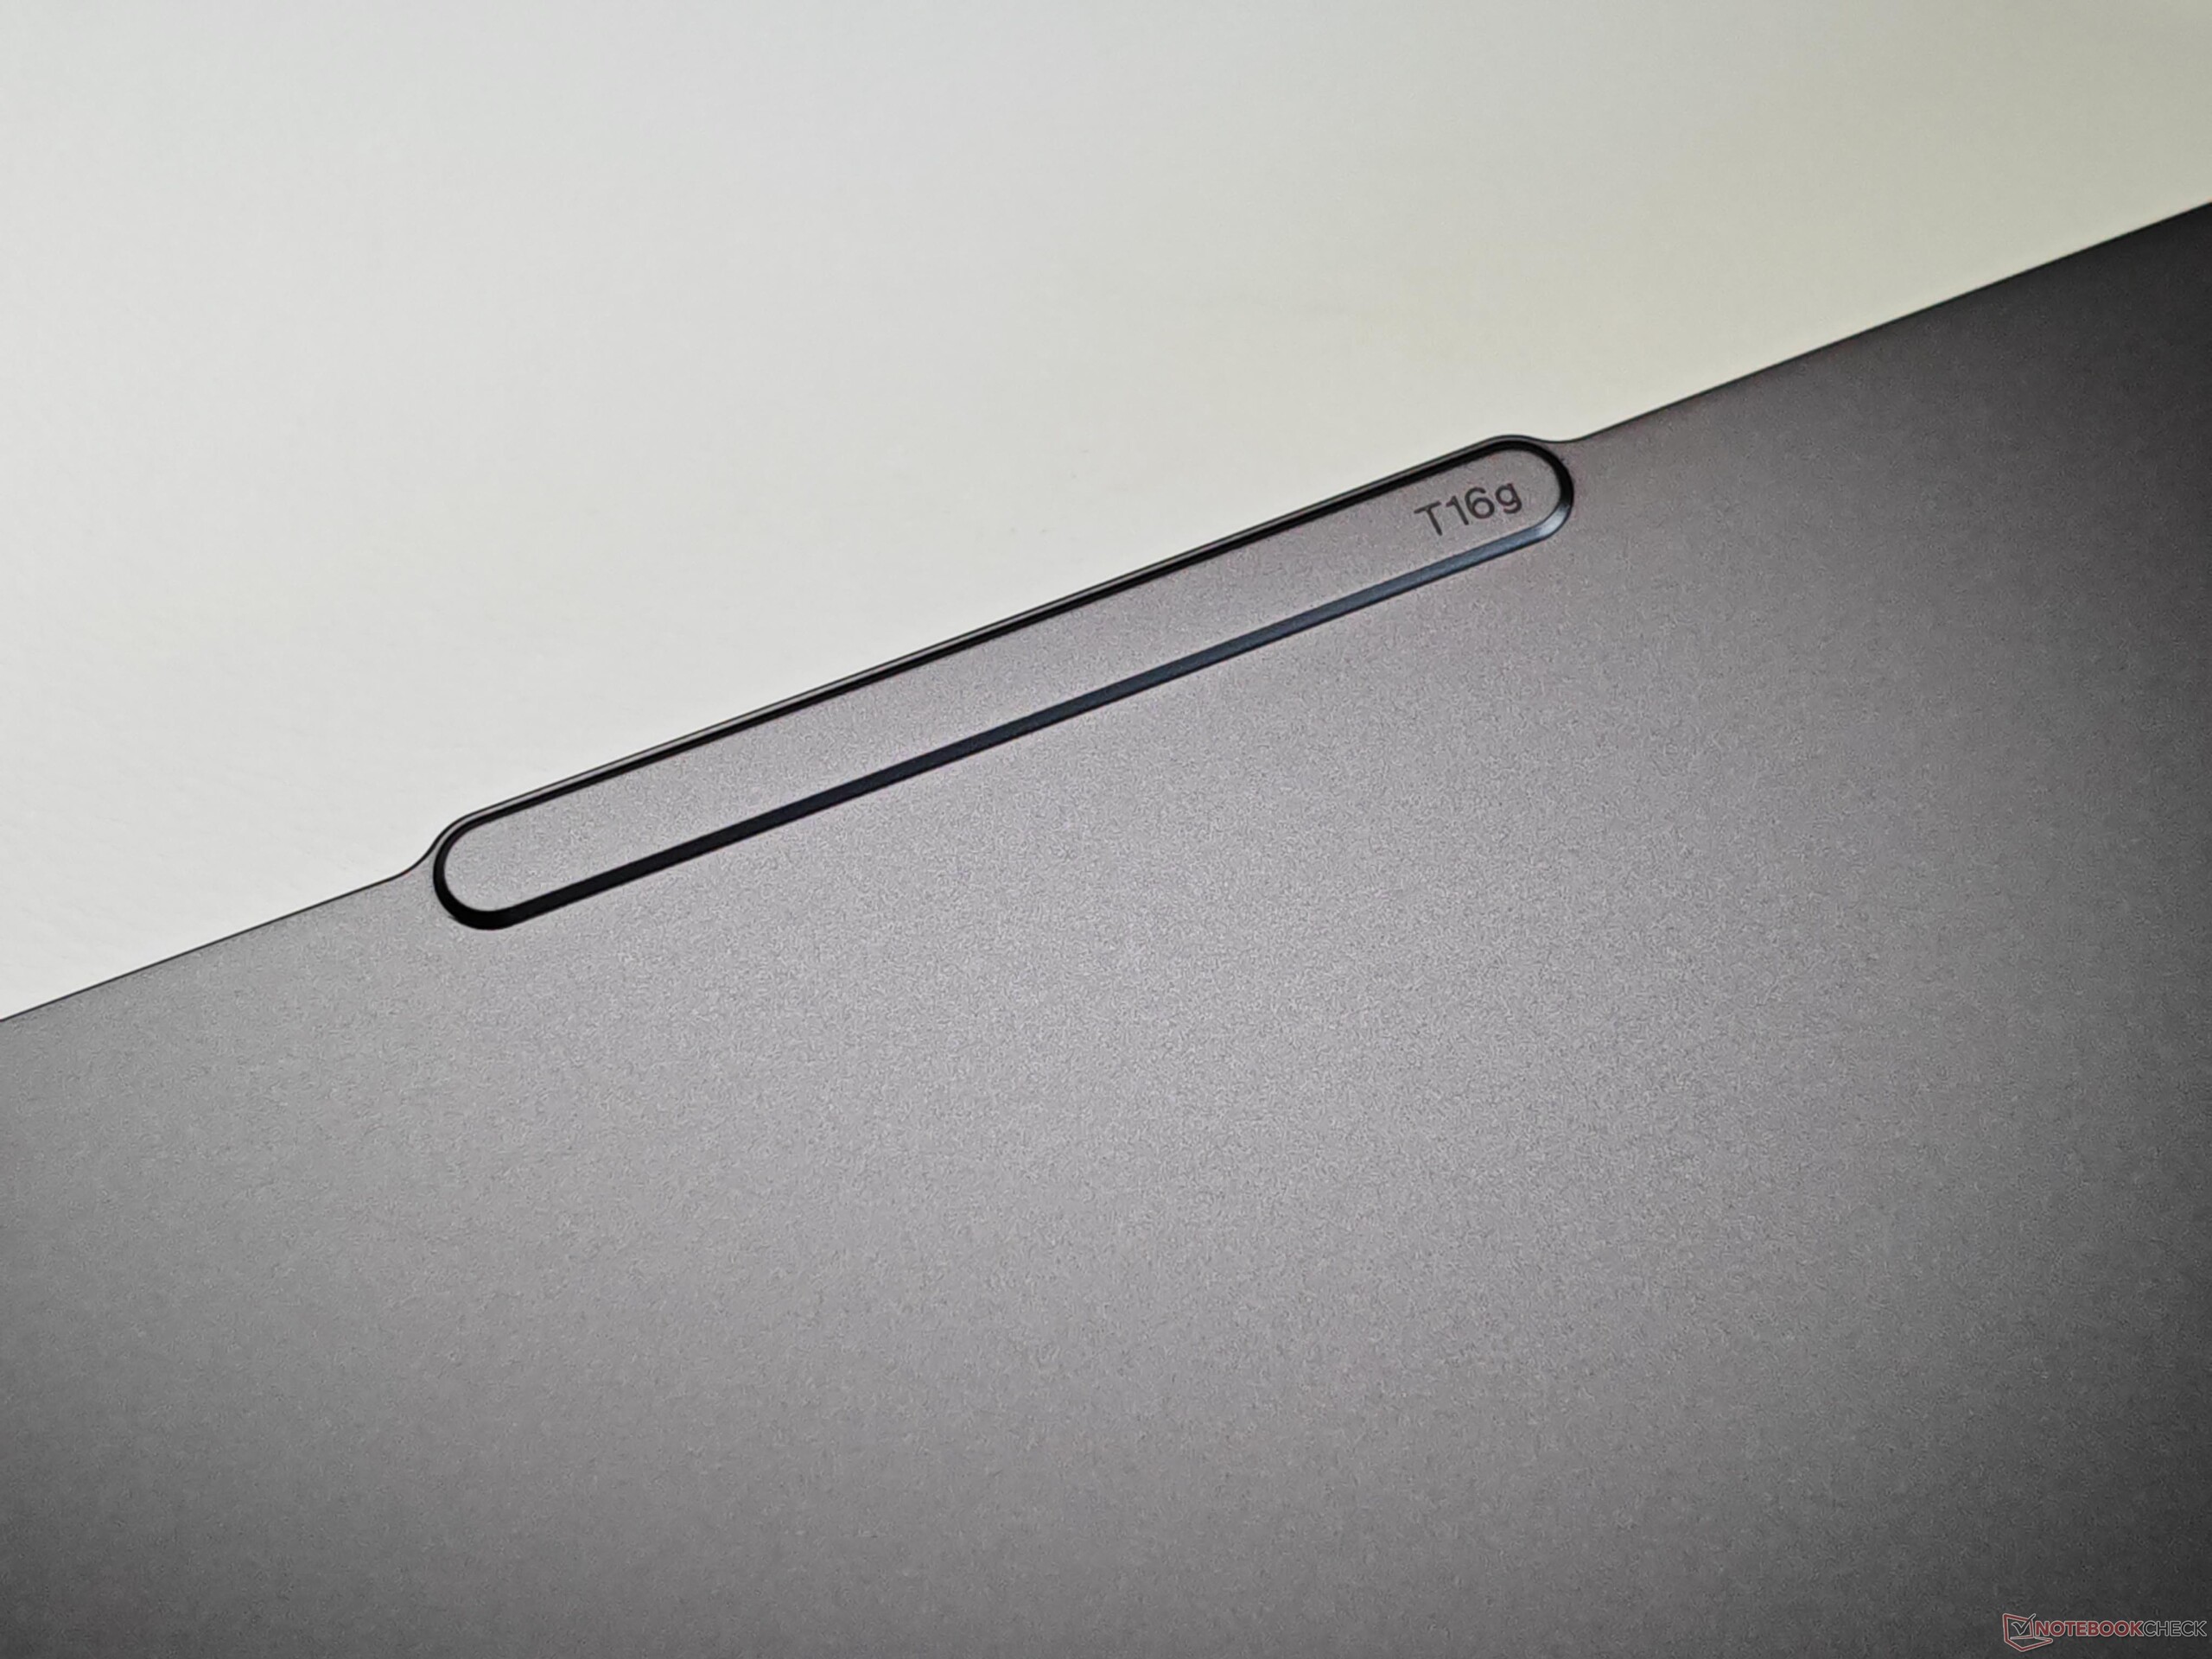
En comparación con el antiguo ThinkPad P16 Gen 2, Lenovo ha revisado completamente la carcasa, poniendo un mayor énfasis en la movilidad y la mejora de la facilidad de mantenimiento. Con un peso aproximado de 2,6 kg, el nuevo modelo es casi 500 gramos más ligero que su predecesor, pero la altura sólo se ha reducido marginalmente (30,2 mm frente a 29,8 mm). Esta reducción de peso no ha comprometido la estabilidad, y tanto la unidad base como la tapa de la pantalla son muy robustas. La tapa de aluminio de la pantalla puede ser bastante propensa a las huellas dactilares, pero la parte superior de plástico reforzado con fibra de carbono de la unidad base se defiende mejor en este terreno. Desde un punto de vista visual, el T16g Gen 3 se adhiere al diseño actual del ThinkPad, que incluye la prominente protuberancia de la cámara.
En términos de características, el T16g ofrece todo lo que se puede desear (Thunderbolt 5, Ethernet de 2,5 Gbps, Wi-Fi 7), y tanto un lector de SmartCard como un módem 5G también están disponibles como opciones, aunque deben pedirse al mismo tiempo (no pueden instalarse posteriormente). El lector de tarjetas ya es compatible con SD Express 8.0, y utilizando una tarjeta compatible, pudimos alcanzar velocidades de transferencia de más de 1,4 GB/s. La cámara de 5 MP (con su apertura mecánica e IR para la detección de rostros) toma fotos decentes. Se ha eliminado el puerto de carga SlimTip, y la T16g se carga exclusivamente a través de USB-C.


| SD Card Reader | |
| average JPG Copy Test (av. of 3 runs) | |
| Lenovo ThinkPad T16g Gen 3 RTX 5080 (ADATA SD8.0 Express 512 GB) | |
| Lenovo ThinkPad T16g Gen 3 RTX 5080 (Angelbird AV Pro V60) | |
| Media de la clase Workstation (49.6 - 681, n=14, últimos 2 años) | |
| Schenker XMG Pro 16 (E25) (Angelbird AV Pro V60) | |
| HP ZBook Fury 16 G11 (Toshiba Exceria Pro SDXC 64 GB UHS-II) | |
| Lenovo ThinkPad P16 Gen 2 (Toshiba Exceria Pro SDXC 64 GB UHS-II) | |
| Dell Pro Max 16 Plus (Toshiba Exceria Pro SDXC 64 GB UHS-II) | |
| maximum AS SSD Seq Read Test (1GB) | |
| Lenovo ThinkPad T16g Gen 3 RTX 5080 (ADATA SD8.0 Express 512 GB) | |
| Lenovo ThinkPad T16g Gen 3 RTX 5080 (Angelbird AV Pro V60) | |
| Schenker XMG Pro 16 (E25) (Angelbird AV Pro V60) | |
| Media de la clase Workstation (87.6 - 1455, n=14, últimos 2 años) | |
| HP ZBook Fury 16 G11 (Toshiba Exceria Pro SDXC 64 GB UHS-II) | |
| Dell Pro Max 16 Plus (Toshiba Exceria Pro SDXC 64 GB UHS-II) | |
| Lenovo ThinkPad P16 Gen 2 (Toshiba Exceria Pro SDXC 64 GB UHS-II) | |
| Networking | |
| Lenovo ThinkPad T16g Gen 3 RTX 5080 | |
| iperf3 transmit AXE11000 | |
| iperf3 receive AXE11000 | |
| HP ZBook Studio 16 G11 | |
| iperf3 transmit AXE11000 | |
| iperf3 receive AXE11000 | |
| iperf3 transmit AXE11000 6GHz | |
| iperf3 receive AXE11000 6GHz | |
| Dell Pro Max 16 Plus | |
| iperf3 transmit AXE11000 | |
| iperf3 receive AXE11000 | |
| iperf3 transmit AXE11000 6GHz | |
| iperf3 receive AXE11000 6GHz | |
| Lenovo ThinkPad P16 Gen 2 | |
| iperf3 transmit AXE11000 | |
| iperf3 receive AXE11000 | |
| iperf3 transmit AXE11000 6GHz | |
| iperf3 receive AXE11000 6GHz | |
| HP ZBook Fury 16 G11 | |
| iperf3 transmit AXE11000 | |
| iperf3 receive AXE11000 | |
| iperf3 transmit AXE11000 6GHz | |
| iperf3 receive AXE11000 6GHz | |
| Schenker XMG Pro 16 (E25) | |
| iperf3 transmit AXE11000 | |
| iperf3 receive AXE11000 | |


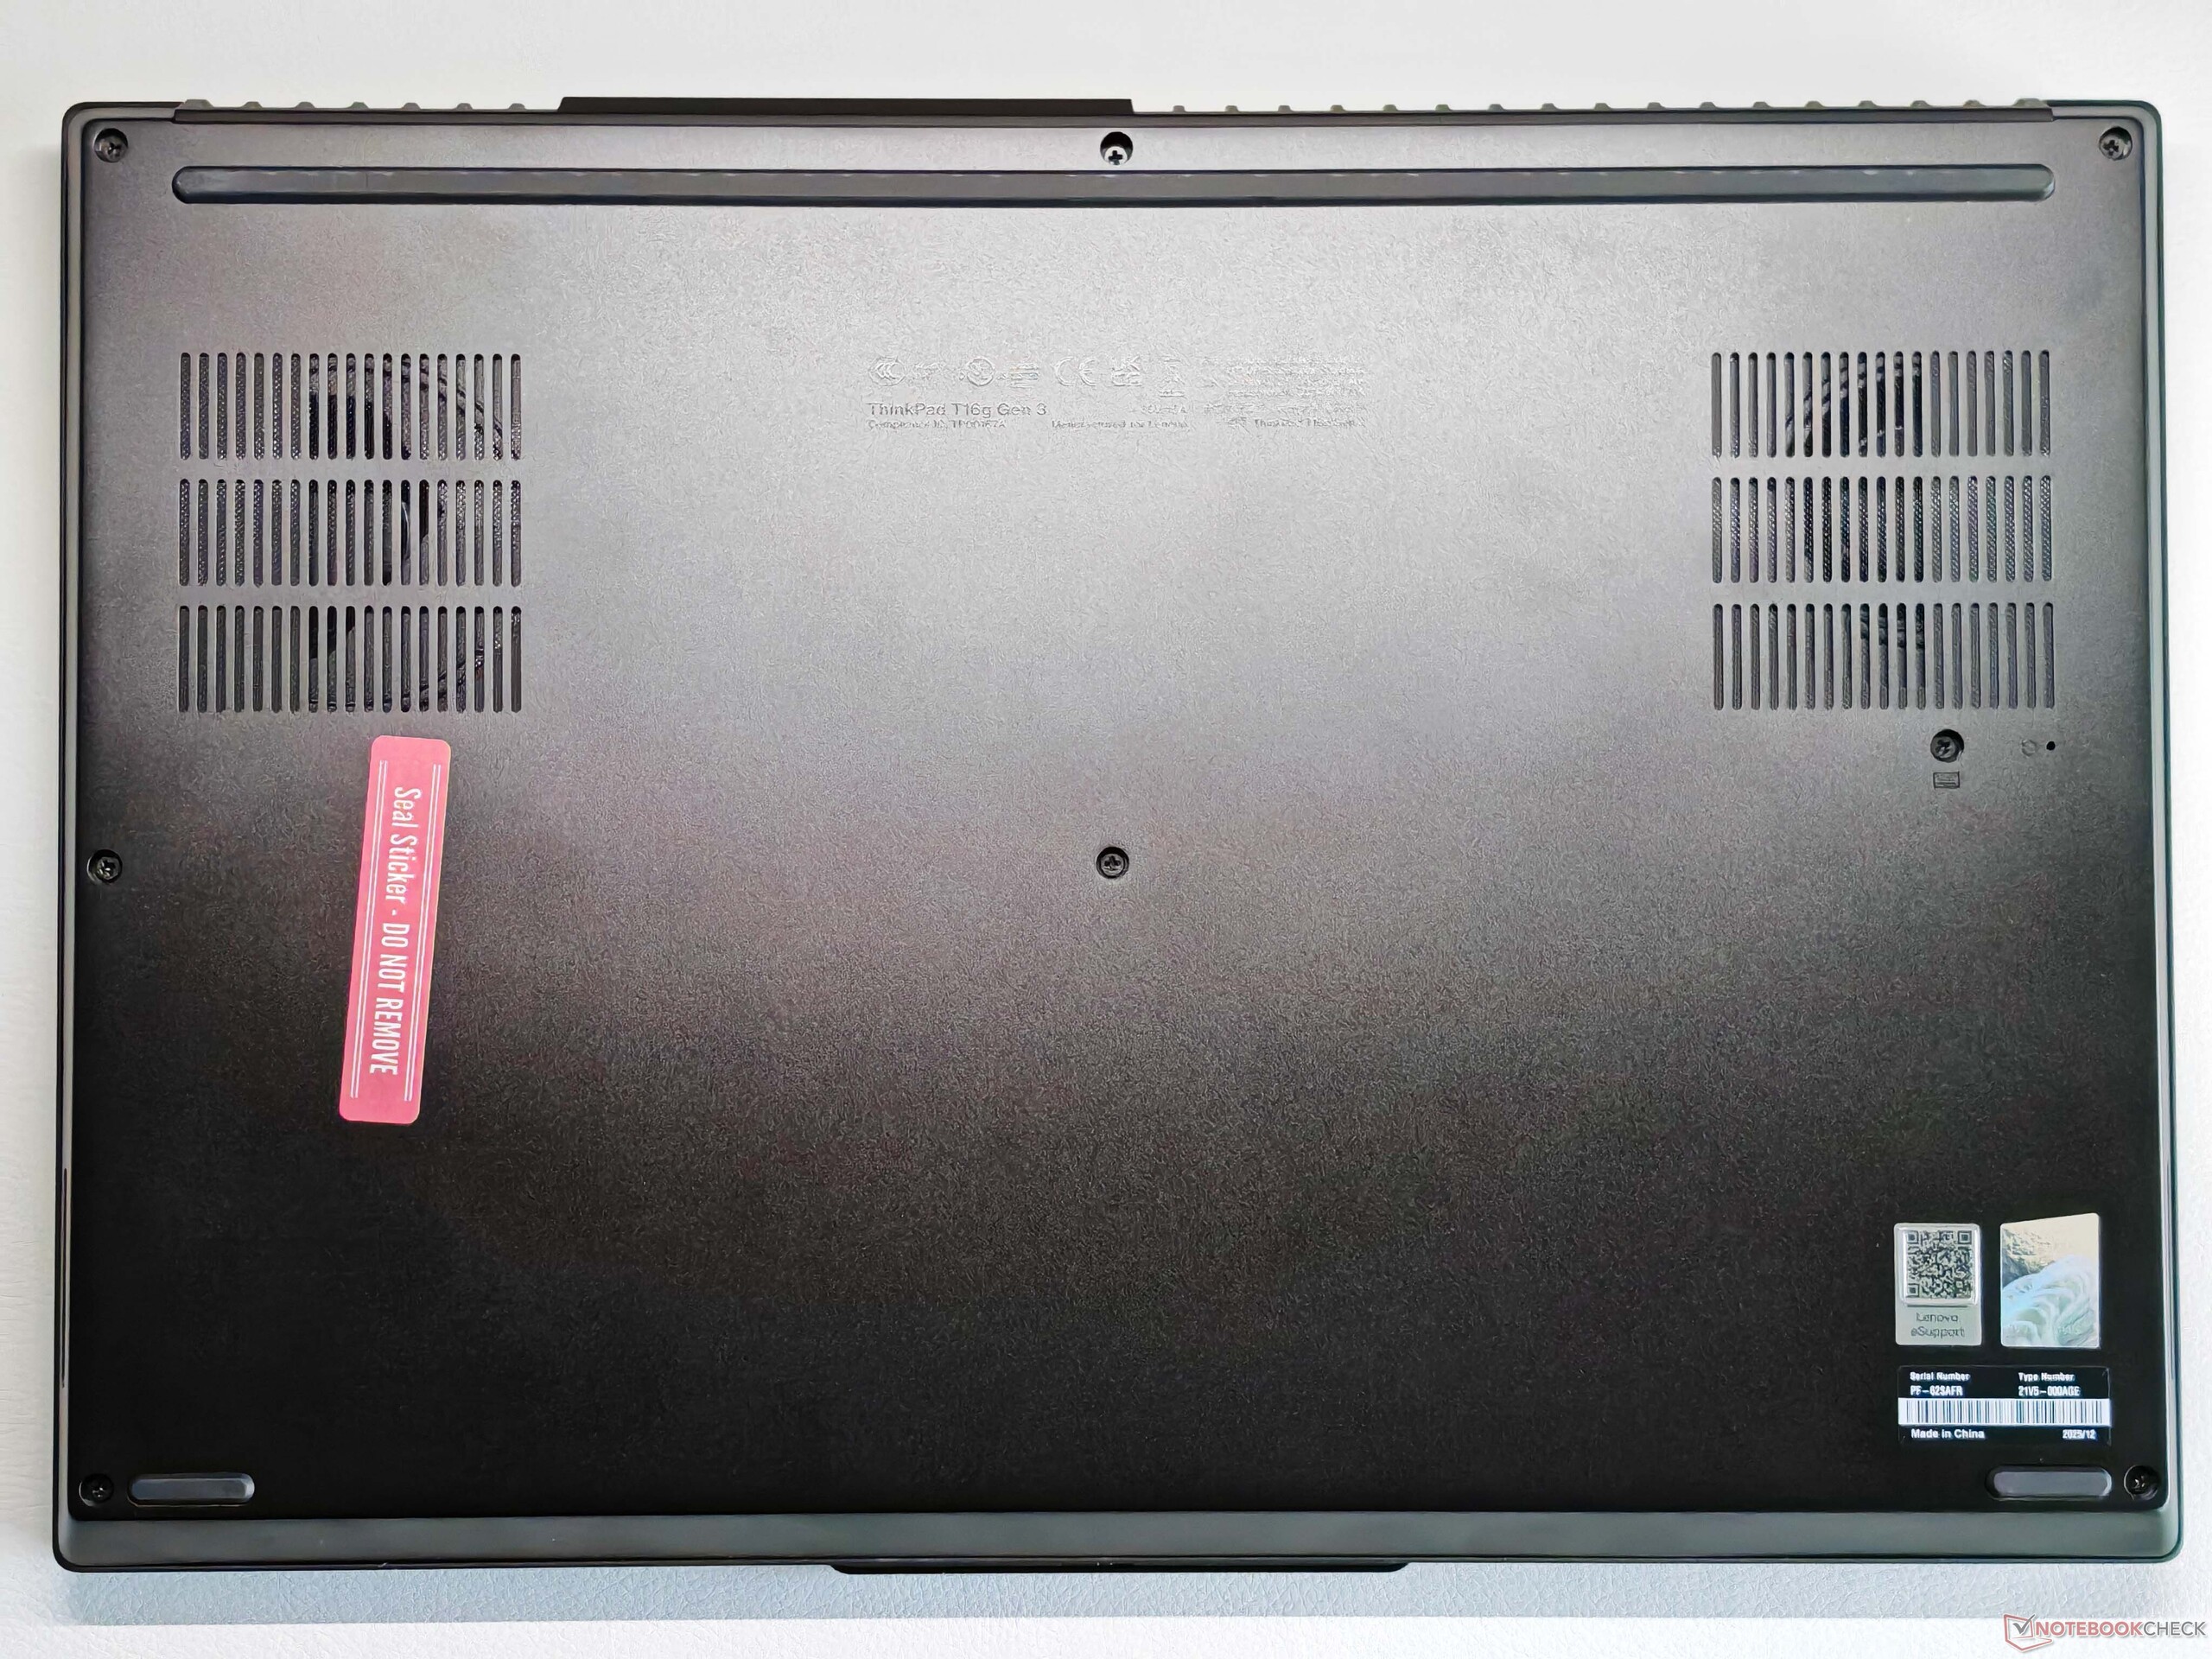
Mantenimiento
Aunque el T16g Gen 3 carece de la pequeña escotilla de mantenimiento del modelo anterior, las opciones generales de mantenimiento siguen siendo excelentes. La cubierta inferior se puede retirar fácilmente, dejando al descubierto el módulo Wi-Fi, la unidad SSD primaria y las cuatro ranuras de RAM. Para retirar el teclado sólo tendrá que aflojar dos tornillos de la parte inferior. Esto le permitirá acceder a las dos ranuras SSD adicionales.


Sostenibilidad


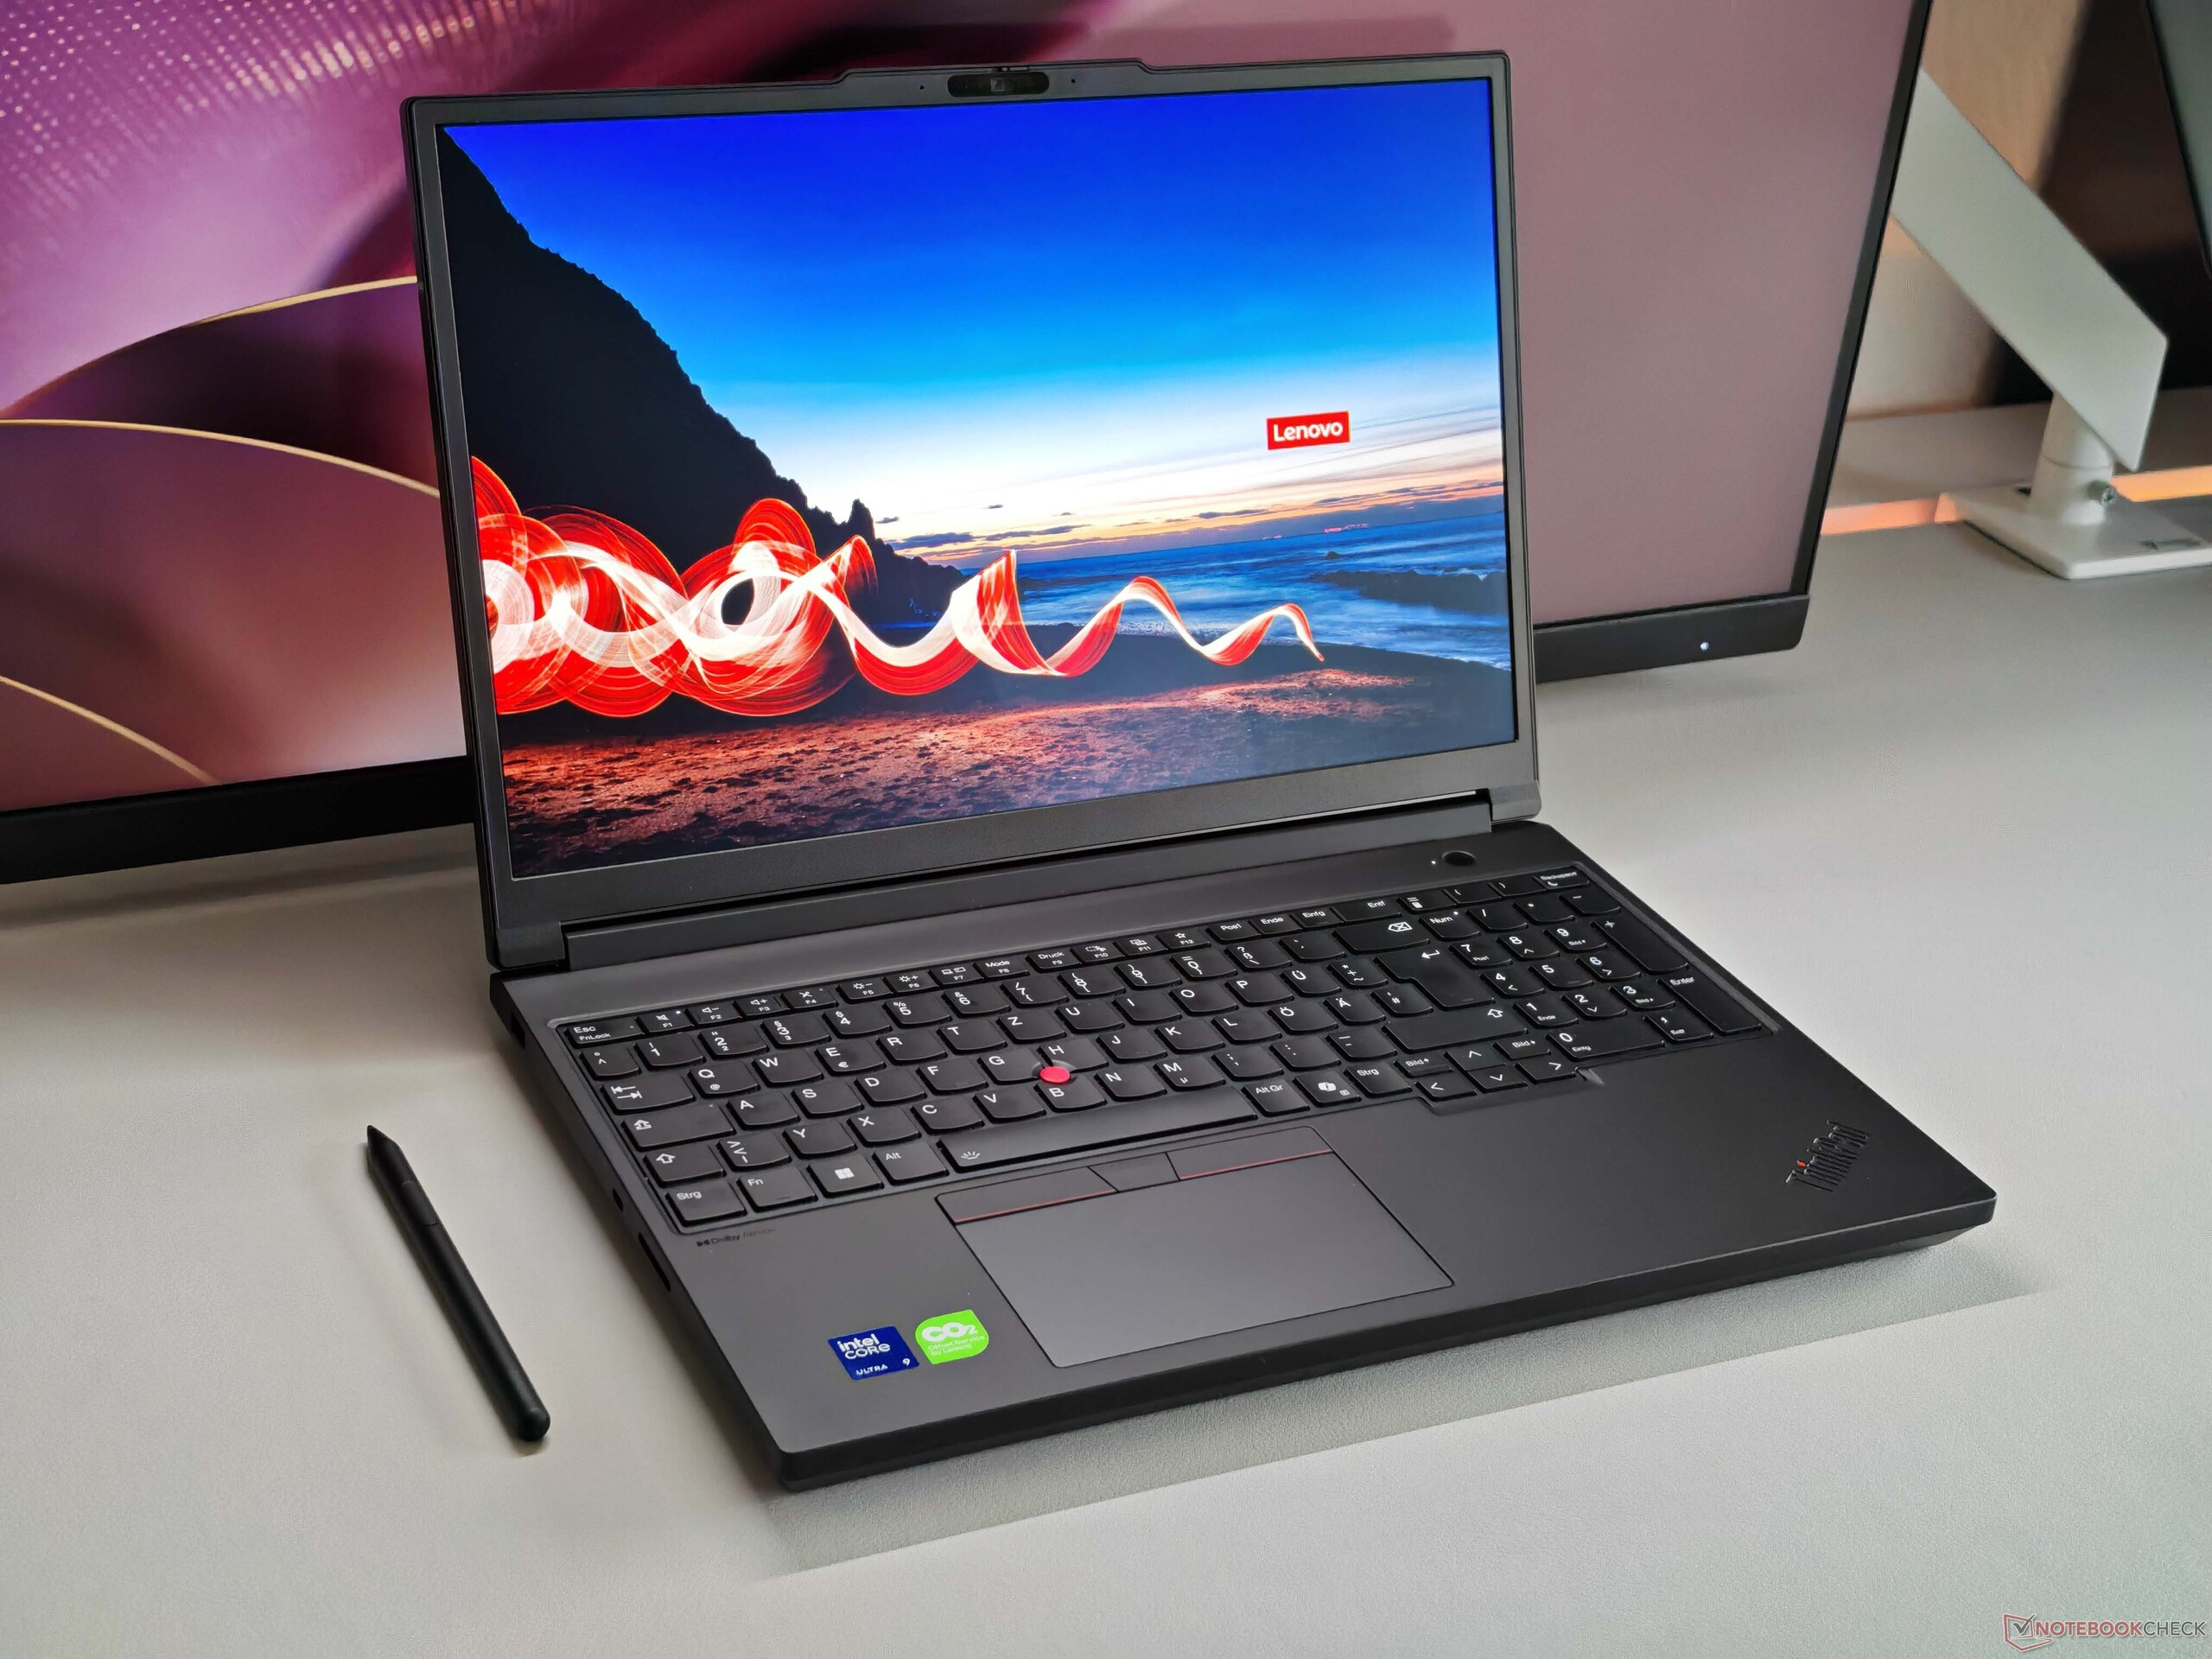
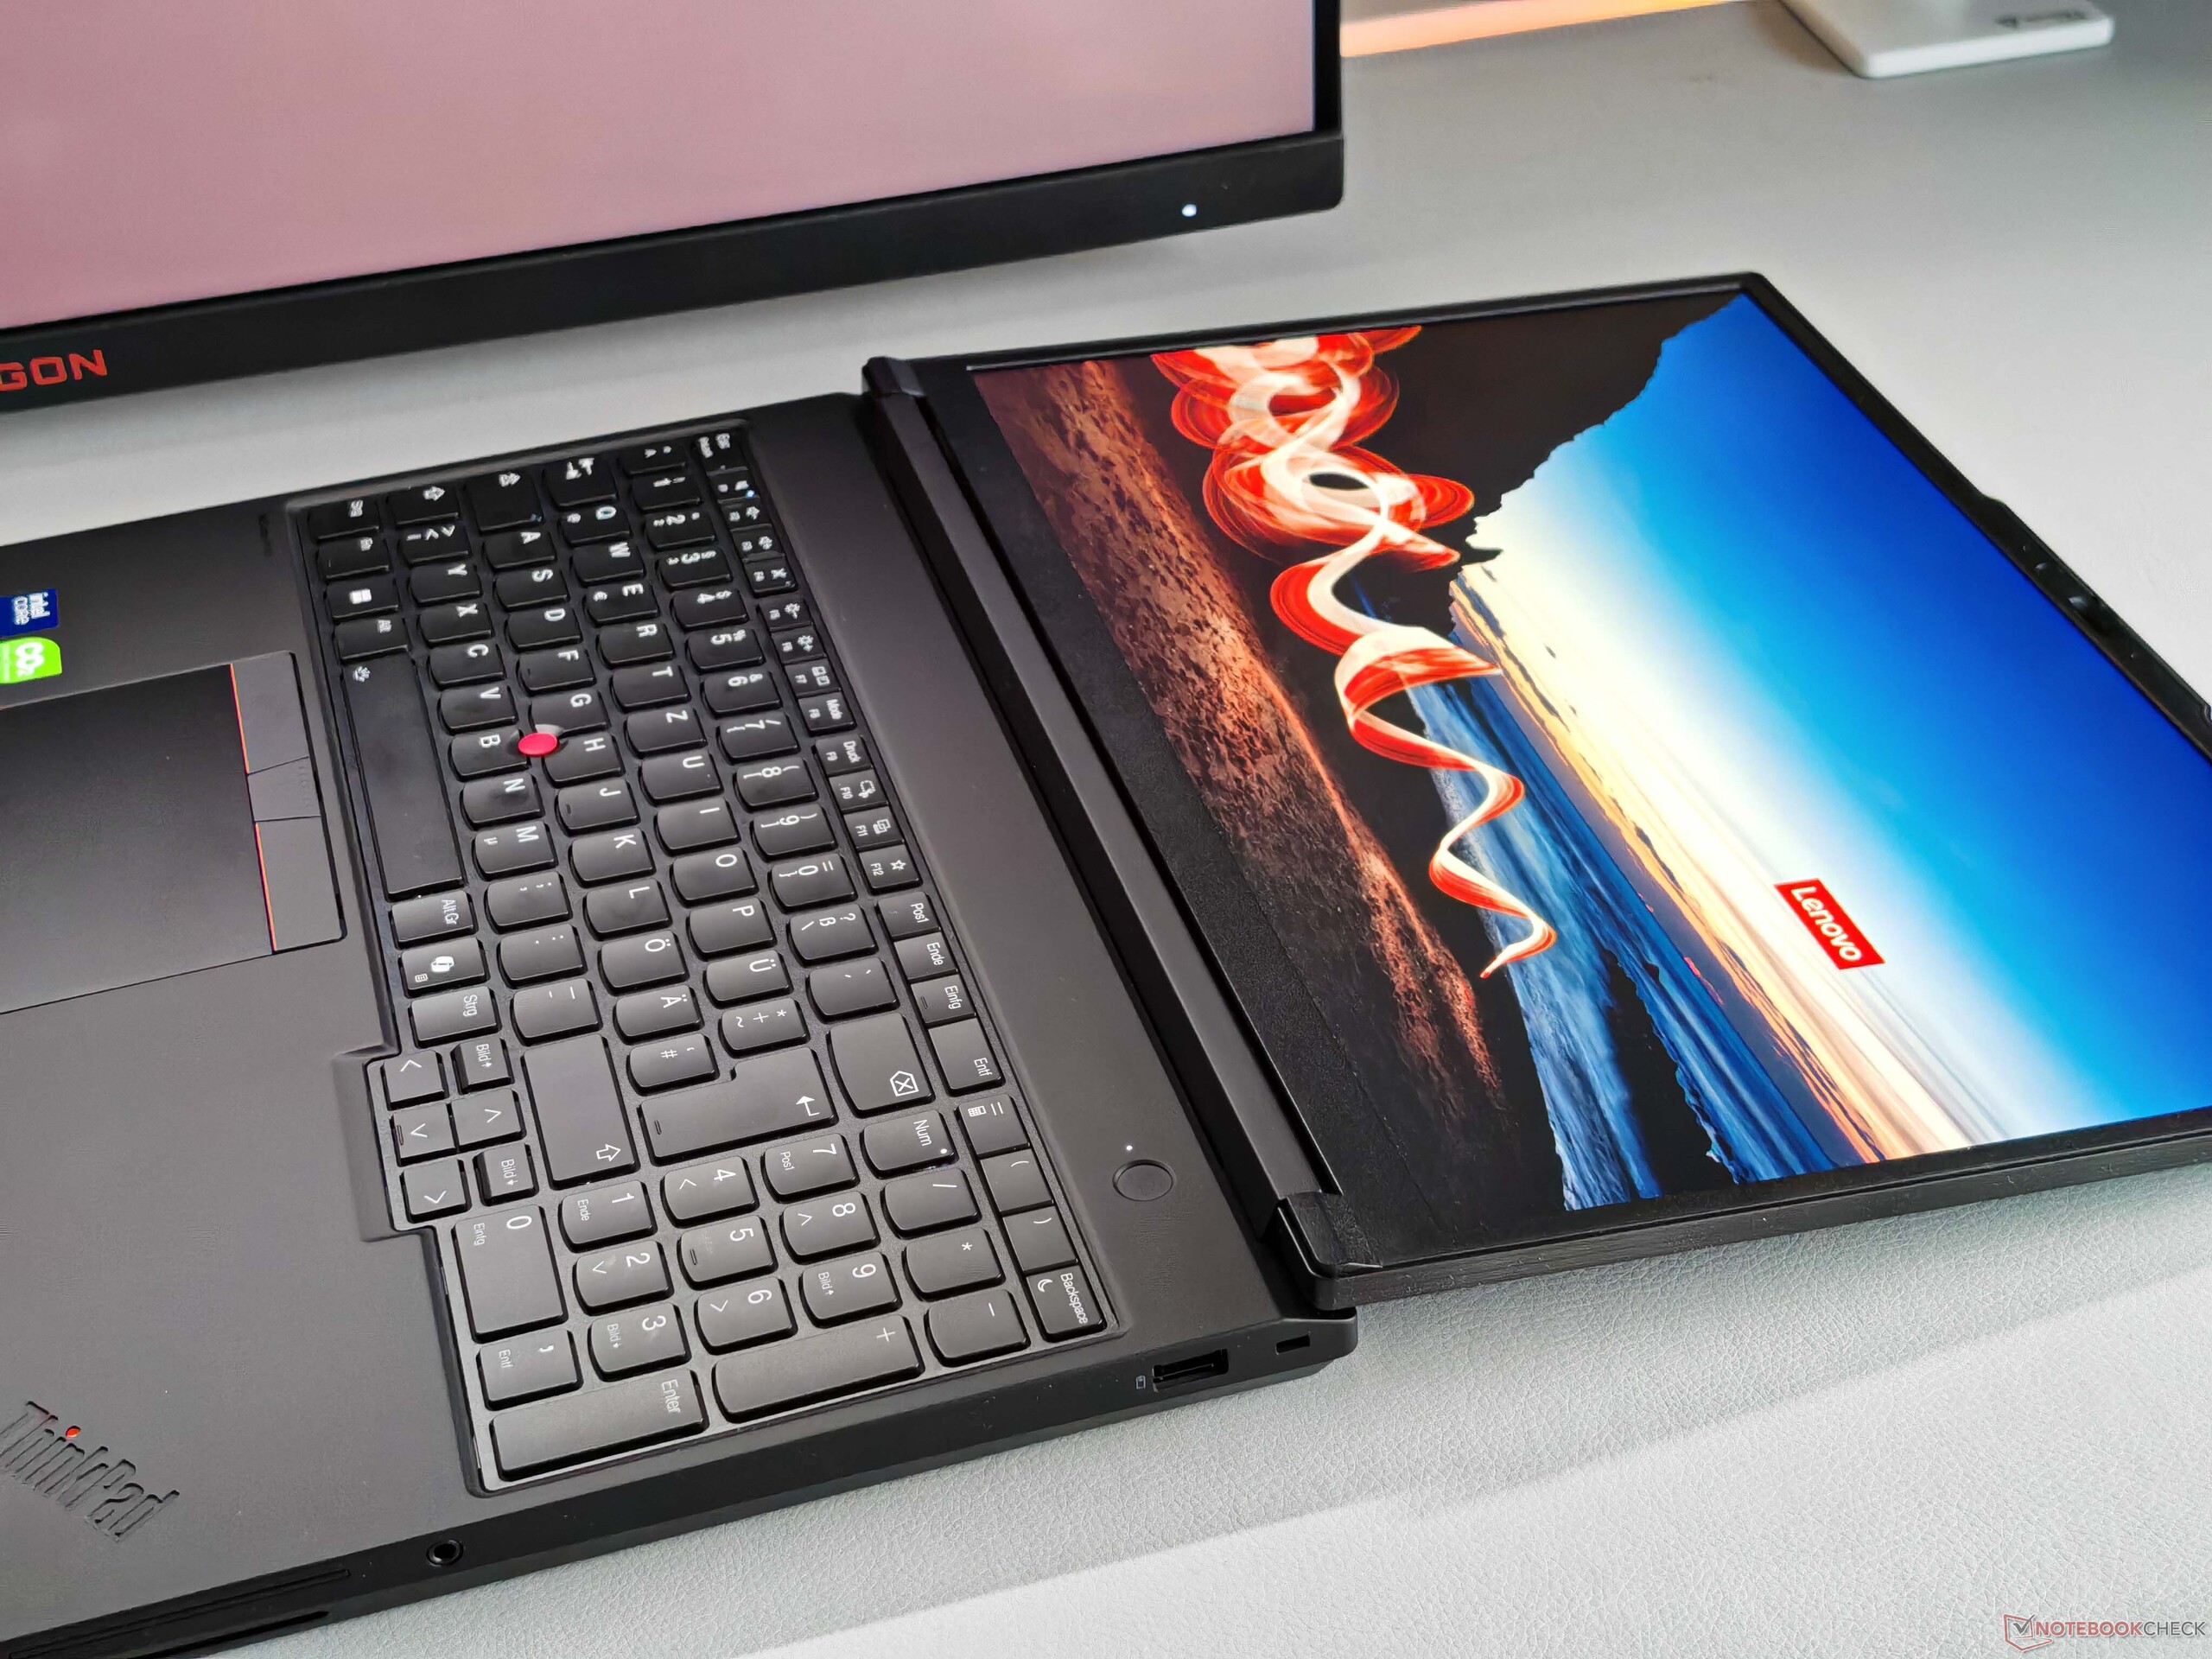
Dispositivos de entrada - Un teclado estándar
El teclado está retroiluminado y viene con un teclado numérico dedicado. La cómoda háptica de escritura (1,5 mm de recorrido de las teclas) no está a la altura del excelente ThinkPad T1g Gen 8 y es prácticamente idéntica a la del ThinkPad P16v en una comparación directa. Dado que Lenovo utiliza diferentes proveedores de teclados, puede haber ligeras variaciones en función de la unidad concreta.
El ClickPad y el TrackPoint (incluidos los botones dedicados) funcionan a la perfección, y el mecanismo de las teclas se siente sustancial y de alta calidad. Los sonidos de clic también son agradablemente silenciosos, y la pantalla táctil (que incluye soporte para lápiz óptico) también funciona sin problemas.


Pantalla - Tandem OLED
Las opciones de pantalla son las mismas que en el recientemente analizado ThinkPad t1g Gen 8. Esto significa dos paneles IPS con una frecuencia de actualización de 60 Hz (1080p a 500 cd/m² o 4K a 800 cd/m²), o la pantalla táctil OLED mate en tándem, que ofrece una frecuencia de actualización de 120 Hz y también se encuentra en nuestra unidad de revisión. La calidad de imagen es en general muy buena, y el brillo es particularmente impresionante. A pesar de ello, las imágenes aparecen ligeramente más granuladas de lo que cabría esperar de un panel brillante. El PWM está presente, pero la frecuencia es muy alta, de 1,2 kHz. La amplitud también es muy baja, por lo que no debería haber mayores problemas aquí.
En modo SDR, el panel alcanzó un brillo muy bueno de casi 600 cd/m², y en modo HDR, llegó a más de 1.500 cd/m². Hay varios perfiles de color disponibles, y la calibración de fábrica ya obtuvo muy buenos resultados en nuestro análisis con el software profesional CalMAN. No pudimos mejorar más la pantalla utilizando nuestra propia calibración.
| |||||||||||||||||||||||||
iluminación: 98 %
Brillo con batería: 585 cd/m²
Contraste: ∞:1 (Negro: 0 cd/m²)
ΔE ColorChecker Calman: 0.9 | ∀{0.5-29.43 Ø4.73}
ΔE Greyscale Calman: 1.4 | ∀{0.09-98 Ø4.97}
88.9% AdobeRGB 1998 (Argyll 3D)
100% sRGB (Argyll 3D)
98.8% Display P3 (Argyll 3D)
Gamma: 2.18
CCT: 6442 K
| Lenovo ThinkPad T16g Gen 3 RTX 5080 ATNA60KA02-0, OLED, 3200x2000, 16", 120 Hz | HP ZBook Studio 16 G11 AUO87A8, IPS, 3840x2400, 16", 120 Hz | Dell Pro Max 16 Plus Samsung 160HC01, OLED, 3840x2400, 16", 120 Hz | Lenovo ThinkPad P16 Gen 2 NE160QDM-NY1, IPS, 2560x1600, 16", 165 Hz | HP ZBook Fury 16 G11 AUO87A8, IPS, 3840x2400, 16", 120 Hz | Schenker XMG Pro 16 (E25) NE160QDM-NZL, IPS, 2560x1600, 16", 300 Hz | |
|---|---|---|---|---|---|---|
| Display | -2% | -1% | -18% | -1% | -13% | |
| Display P3 Coverage (%) | 98.8 | 97.7 -1% | 97.3 -2% | 68.4 -31% | 98.4 0% | 74.7 -24% |
| sRGB Coverage (%) | 100 | 99.9 0% | 100 0% | 96.9 -3% | 99.9 0% | 99.8 0% |
| AdobeRGB 1998 Coverage (%) | 88.9 | 85.7 -4% | 88.8 0% | 70.6 -21% | 86 -3% | 75.4 -15% |
| Response Times | -1575% | -24% | -1492% | -1232% | -861% | |
| Response Time Grey 50% / Grey 80% * (ms) | 1.51 ? | 14.2 ? -840% | 0.63 ? 58% | 14.1 ? -834% | 11.4 ? -655% | 10.5 ? -595% |
| Response Time Black / White * (ms) | 0.44 ? | 10.6 ? -2309% | 0.89 ? -102% | 9.9 ? -2150% | 8.4 ? -1809% | 5.4 ? -1127% |
| PWM Frequency (Hz) | 1200 ? | 479.9 ? | ||||
| PWM Amplitude * (%) | 22 | 28 -27% | ||||
| Screen | -63% | -43% | -29% | -69% | -47% | |
| Brightness middle (cd/m²) | 585 | 404.3 -31% | 530.9 -9% | 531.5 -9% | 457.6 -22% | 538 -8% |
| Brightness (cd/m²) | 590 | 405 -31% | 540 -8% | 499 -15% | 466 -21% | 508 -14% |
| Brightness Distribution (%) | 98 | 92 -6% | 95 -3% | 89 -9% | 83 -15% | 88 -10% |
| Black Level * (cd/m²) | 0.28 | 0.38 | 0.43 | 0.47 | ||
| Colorchecker dE 2000 * | 0.9 | 2.63 -192% | 2.42 -169% | 1.82 -102% | 2.78 -209% | 1.9 -111% |
| Colorchecker dE 2000 max. * | 2.7 | 4.48 -66% | 5.76 -113% | 4.1 -52% | 5.53 -105% | 4 -48% |
| Greyscale dE 2000 * | 1.4 | 2.1 -50% | 0.8 43% | 1.2 14% | 2 -43% | 2.7 -93% |
| Gamma | 2.18 101% | 2.3 96% | 2.23 99% | 2.15 102% | 2.28 96% | 2.24 98% |
| CCT | 6442 101% | 6810 95% | 6488 100% | 6484 100% | 6806 96% | 7027 93% |
| Contrast (:1) | 1444 | 1399 | 1064 | 1145 | ||
| Colorchecker dE 2000 calibrated * | 1.46 | 0.7 | 0.63 | 1.37 | ||
| Media total (Programa/Opciones) | -547% /
-321% | -23% /
-28% | -513% /
-292% | -434% /
-262% | -307% /
-186% |
* ... más pequeño es mejor


Tiempos de respuesta del display
| ↔ Tiempo de respuesta de Negro a Blanco | ||
|---|---|---|
| 0.44 ms ... subida ↗ y bajada ↘ combinada | ↗ 0.24 ms subida | 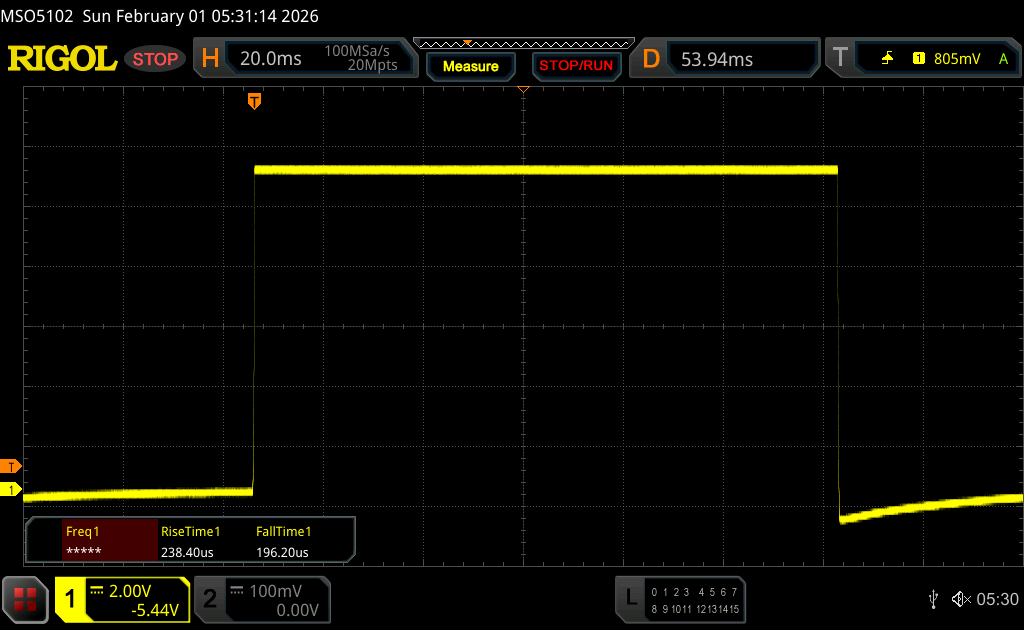 |
| ↘ 0.2 ms bajada | ||
| La pantalla mostró tiempos de respuesta muy rápidos en nuestros tests y debería ser adecuada para juegos frenéticos. En comparación, todos los dispositivos de prueba van de ##min### (mínimo) a 240 (máximo) ms. » 1 % de todos los dispositivos son mejores. Esto quiere decir que el tiempo de respuesta medido es mejor que la media (19.9 ms) de todos los dispositivos testados. | ||
| ↔ Tiempo de respuesta 50% Gris a 80% Gris | ||
| 1.51 ms ... subida ↗ y bajada ↘ combinada | ↗ 0.73 ms subida | 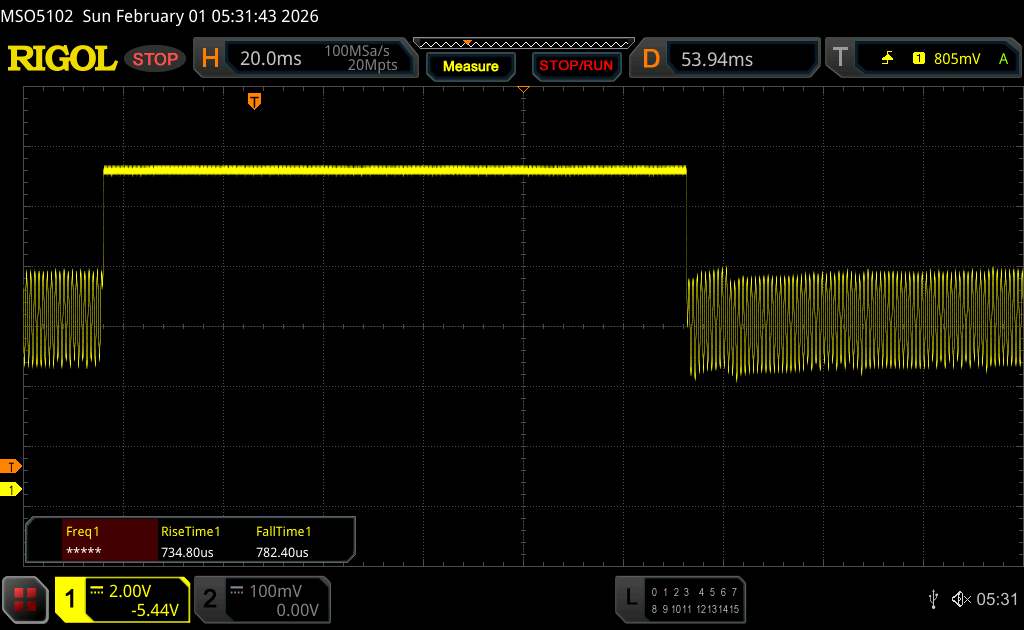 |
| ↘ 0.78 ms bajada | ||
| La pantalla mostró tiempos de respuesta muy rápidos en nuestros tests y debería ser adecuada para juegos frenéticos. En comparación, todos los dispositivos de prueba van de ##min### (mínimo) a 636 (máximo) ms. » 7 % de todos los dispositivos son mejores. Esto quiere decir que el tiempo de respuesta medido es mejor que la media (31.1 ms) de todos los dispositivos testados. | ||
Parpadeo de Pantalla / PWM (Pulse-Width Modulation)
| Parpadeo de Pantalla / PWM detectado | 1200 Hz Amplitude: 22 % | ≤ 70 % de brillo |  |
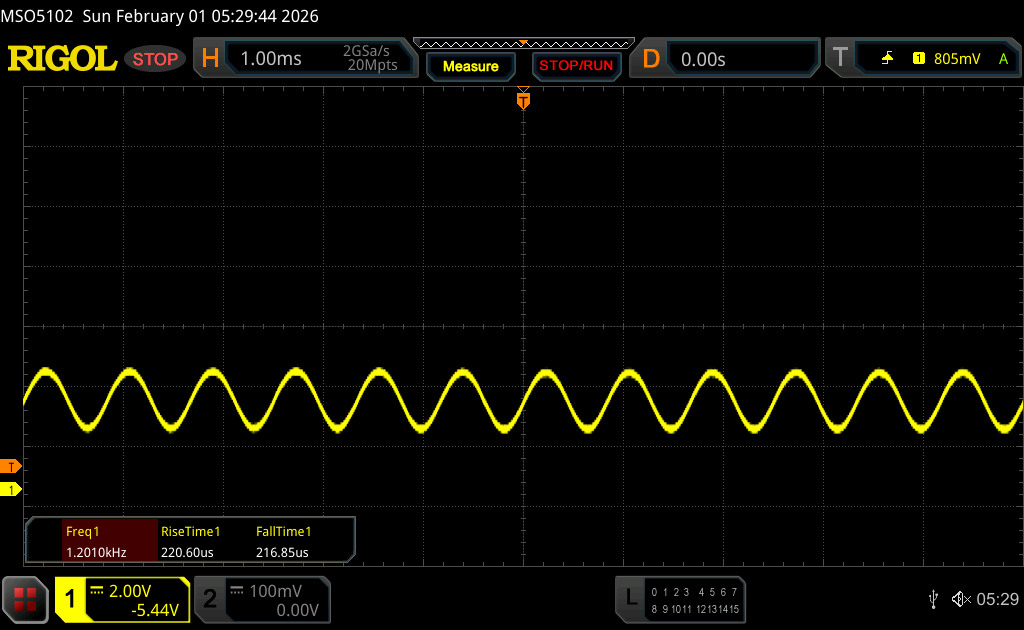
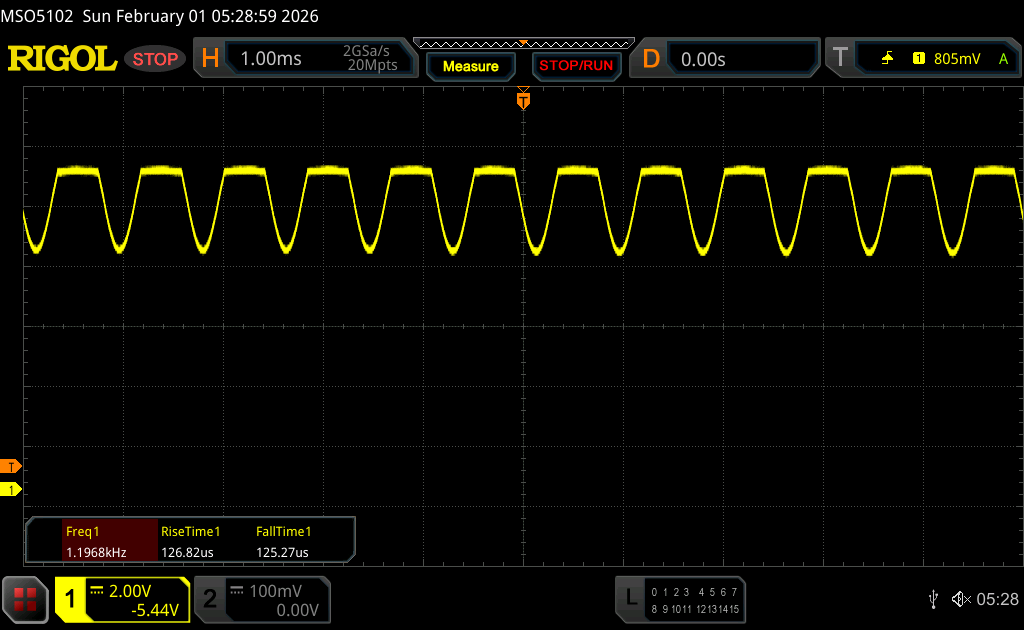
La retroiluminación del display parpadea a 1200 Hz (seguramente usa PWM - Pulse-Width Modulation) a un brillo del 70 % e inferior. Sobre este nivel de brillo no debería darse parpadeo / PWM. La frecuencia de 1200 Hz es bastante alta, por lo que la mayoría de gente sensible al parpadeo no debería ver parpadeo o tener fatiga visual. Comparación: 52 % de todos los dispositivos testados no usaron PWM para atenuar el display. Si se usó, medimos una media de 7798 (mínimo: 5 - máxmo: 343500) Hz. | |||


Rendimiento - Arrow Lake HX y Blackwell cocinando a fuego lento
Condiciones de la prueba
Los perfiles de energía de Lenovo están vinculados a la configuración de Windows. Realizamos las pruebas comparativas utilizando el modo de mejor rendimiento.
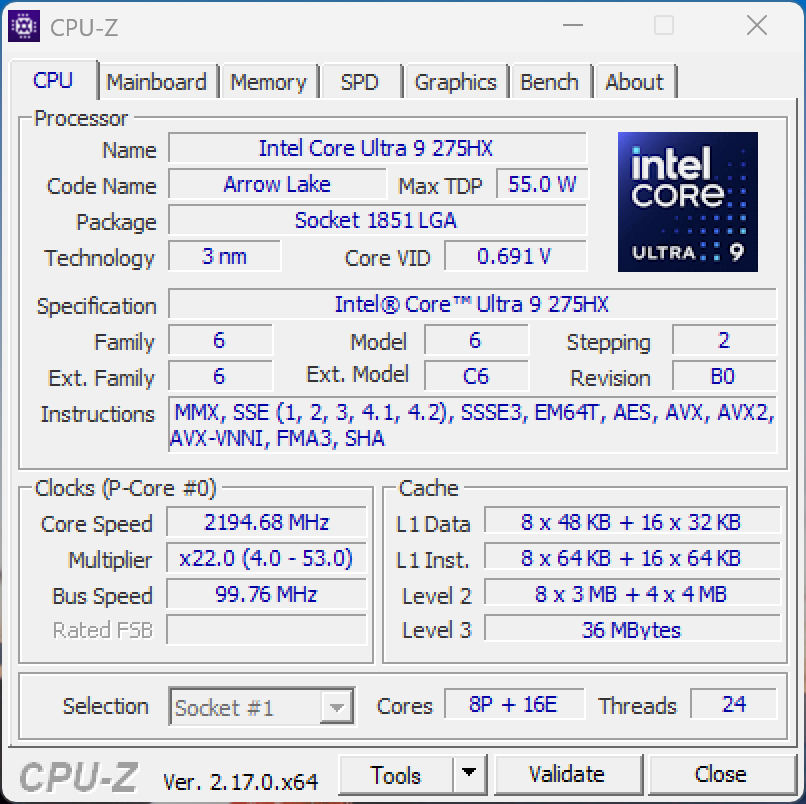
Procesador

Nuestro dispositivo de revisión está equipado con el rápido Intel Core Ultra 9 275HX (Arrow Lake HX), pero su rendimiento deja mucho que desear. El procesador puede consumir brevemente 160 vatios, luego unos 110 vatios, pero después de aproximadamente un minuto, el valor baja a sólo 65 vatios y posteriormente fluctúa entre 65 y un máximo de 90 vatios. Esto significa que el rendimiento a corto plazo (y por tanto el rendimiento en muchos puntos de referencia) es bueno, pero el rendimiento es cualquier cosa menos estable. En general, el resultado es decepcionante, especialmente teniendo en cuenta el gran chasis. Cuando funciona con batería, la CPU puede consumir un máximo de 62 vatios (-14% multinúcleo).
Prueba multi sostenida Cinebench R15
Cinebench 2024: CPU Multi Core | CPU Single Core
Cinebench R23: Multi Core | Single Core
Cinebench R20: CPU (Multi Core) | CPU (Single Core)
Cinebench R15: CPU Multi 64Bit | CPU Single 64Bit
Blender: v2.79 BMW27 CPU
7-Zip 18.03: 7z b 4 | 7z b 4 -mmt1
Geekbench 6.7: Multi-Core | Single-Core
Geekbench 5.5: Multi-Core | Single-Core
HWBOT x265 Benchmark v2.2: 4k Preset
LibreOffice : 20 Documents To PDF
R Benchmark 2.5: Overall mean
| CPU Performance rating | |
| Schenker XMG Pro 16 (E25) | |
| Medio Intel Core Ultra 9 275HX | |
| Lenovo ThinkPad T16g Gen 3 RTX 5080 | |
| Dell Pro Max 16 Plus | |
| HP ZBook Fury 16 G11 | |
| Lenovo ThinkPad P16 Gen 2 | |
| Media de la clase Workstation | |
| HP ZBook Studio 16 G11 | |
| Cinebench 2024 / CPU Multi Core | |
| Schenker XMG Pro 16 (E25) | |
| Medio Intel Core Ultra 9 275HX (1547 - 2288, n=27) | |
| Dell Pro Max 16 Plus | |
| Lenovo ThinkPad T16g Gen 3 RTX 5080 | |
| Media de la clase Workstation (616 - 2049, n=18, últimos 2 años) | |
| Lenovo ThinkPad P16 Gen 2 | |
| HP ZBook Fury 16 G11 | |
| HP ZBook Studio 16 G11 | |
| Cinebench 2024 / CPU Single Core | |
| Schenker XMG Pro 16 (E25) | |
| Medio Intel Core Ultra 9 275HX (123.1 - 138.2, n=27) | |
| Lenovo ThinkPad T16g Gen 3 RTX 5080 | |
| Dell Pro Max 16 Plus | |
| HP ZBook Fury 16 G11 | |
| Lenovo ThinkPad P16 Gen 2 | |
| Media de la clase Workstation (101.6 - 132.2, n=17, últimos 2 años) | |
| HP ZBook Studio 16 G11 | |
| Cinebench R23 / Multi Core | |
| Lenovo ThinkPad T16g Gen 3 RTX 5080 | |
| Schenker XMG Pro 16 (E25) | |
| Medio Intel Core Ultra 9 275HX (30712 - 40970, n=31) | |
| Dell Pro Max 16 Plus | |
| HP ZBook Fury 16 G11 | |
| Lenovo ThinkPad P16 Gen 2 | |
| Media de la clase Workstation (14055 - 38520, n=25, últimos 2 años) | |
| HP ZBook Studio 16 G11 | |
| Cinebench R23 / Single Core | |
| Schenker XMG Pro 16 (E25) | |
| Lenovo ThinkPad T16g Gen 3 RTX 5080 | |
| Medio Intel Core Ultra 9 275HX (2009 - 2267, n=31) | |
| HP ZBook Fury 16 G11 | |
| Lenovo ThinkPad P16 Gen 2 | |
| Dell Pro Max 16 Plus | |
| Media de la clase Workstation (1712 - 2228, n=25, últimos 2 años) | |
| HP ZBook Studio 16 G11 | |
| Cinebench R20 / CPU (Multi Core) | |
| Lenovo ThinkPad T16g Gen 3 RTX 5080 | |
| Schenker XMG Pro 16 (E25) | |
| Medio Intel Core Ultra 9 275HX (12026 - 16108, n=30) | |
| Dell Pro Max 16 Plus | |
| HP ZBook Fury 16 G11 | |
| Lenovo ThinkPad P16 Gen 2 | |
| Media de la clase Workstation (5471 - 15043, n=25, últimos 2 años) | |
| HP ZBook Studio 16 G11 | |
| Cinebench R20 / CPU (Single Core) | |
| Schenker XMG Pro 16 (E25) | |
| Lenovo ThinkPad T16g Gen 3 RTX 5080 | |
| Medio Intel Core Ultra 9 275HX (774 - 870, n=30) | |
| HP ZBook Fury 16 G11 | |
| Dell Pro Max 16 Plus | |
| Lenovo ThinkPad P16 Gen 2 | |
| Media de la clase Workstation (671 - 857, n=25, últimos 2 años) | |
| HP ZBook Studio 16 G11 | |
| Cinebench R15 / CPU Multi 64Bit | |
| Lenovo ThinkPad T16g Gen 3 RTX 5080 | |
| Schenker XMG Pro 16 (E25) | |
| Medio Intel Core Ultra 9 275HX (4737 - 6271, n=30) | |
| Dell Pro Max 16 Plus | |
| HP ZBook Fury 16 G11 | |
| Lenovo ThinkPad P16 Gen 2 | |
| Media de la clase Workstation (2489 - 5810, n=25, últimos 2 años) | |
| HP ZBook Studio 16 G11 | |
| Cinebench R15 / CPU Single 64Bit | |
| Schenker XMG Pro 16 (E25) | |
| Medio Intel Core Ultra 9 275HX (306 - 343, n=31) | |
| Lenovo ThinkPad T16g Gen 3 RTX 5080 | |
| Dell Pro Max 16 Plus | |
| HP ZBook Fury 16 G11 | |
| Media de la clase Workstation (191.4 - 328, n=25, últimos 2 años) | |
| Lenovo ThinkPad P16 Gen 2 | |
| HP ZBook Studio 16 G11 | |
| Blender / v2.79 BMW27 CPU | |
| HP ZBook Studio 16 G11 | |
| Media de la clase Workstation (91 - 261, n=25, últimos 2 años) | |
| Lenovo ThinkPad P16 Gen 2 | |
| HP ZBook Fury 16 G11 | |
| Dell Pro Max 16 Plus | |
| Medio Intel Core Ultra 9 275HX (82 - 116, n=29) | |
| Lenovo ThinkPad T16g Gen 3 RTX 5080 | |
| Schenker XMG Pro 16 (E25) | |
| 7-Zip 18.03 / 7z b 4 | |
| Schenker XMG Pro 16 (E25) | |
| Medio Intel Core Ultra 9 275HX (98236 - 124155, n=30) | |
| Dell Pro Max 16 Plus | |
| Lenovo ThinkPad T16g Gen 3 RTX 5080 | |
| HP ZBook Fury 16 G11 | |
| Lenovo ThinkPad P16 Gen 2 | |
| Media de la clase Workstation (54741 - 116969, n=25, últimos 2 años) | |
| HP ZBook Studio 16 G11 | |
| 7-Zip 18.03 / 7z b 4 -mmt1 | |
| Schenker XMG Pro 16 (E25) | |
| HP ZBook Fury 16 G11 | |
| Lenovo ThinkPad P16 Gen 2 | |
| Lenovo ThinkPad T16g Gen 3 RTX 5080 | |
| Medio Intel Core Ultra 9 275HX (6026 - 7149, n=30) | |
| Dell Pro Max 16 Plus | |
| Media de la clase Workstation (5126 - 6960, n=25, últimos 2 años) | |
| HP ZBook Studio 16 G11 | |
| Geekbench 6.7 / Multi-Core | |
| Dell Pro Max 16 Plus | |
| Schenker XMG Pro 16 (E25) | |
| Medio Intel Core Ultra 9 275HX (16033 - 21668, n=33) | |
| Lenovo ThinkPad T16g Gen 3 RTX 5080 | |
| Lenovo ThinkPad P16 Gen 2 | |
| Media de la clase Workstation (12196 - 20887, n=25, últimos 2 años) | |
| HP ZBook Fury 16 G11 | |
| HP ZBook Studio 16 G11 | |
| Geekbench 6.7 / Single-Core | |
| Schenker XMG Pro 16 (E25) | |
| Lenovo ThinkPad T16g Gen 3 RTX 5080 | |
| Medio Intel Core Ultra 9 275HX (2843 - 3160, n=33) | |
| HP ZBook Fury 16 G11 | |
| Dell Pro Max 16 Plus | |
| Lenovo ThinkPad P16 Gen 2 | |
| Media de la clase Workstation (2389 - 3065, n=25, últimos 2 años) | |
| HP ZBook Studio 16 G11 | |
| Geekbench 5.5 / Multi-Core | |
| Dell Pro Max 16 Plus | |
| Schenker XMG Pro 16 (E25) | |
| Medio Intel Core Ultra 9 275HX (19105 - 25855, n=31) | |
| Lenovo ThinkPad T16g Gen 3 RTX 5080 | |
| HP ZBook Fury 16 G11 | |
| Lenovo ThinkPad P16 Gen 2 | |
| Media de la clase Workstation (11542 - 25554, n=25, últimos 2 años) | |
| HP ZBook Studio 16 G11 | |
| Geekbench 5.5 / Single-Core | |
| Schenker XMG Pro 16 (E25) | |
| Medio Intel Core Ultra 9 275HX (2033 - 2292, n=31) | |
| Lenovo ThinkPad T16g Gen 3 RTX 5080 | |
| Dell Pro Max 16 Plus | |
| HP ZBook Fury 16 G11 | |
| Media de la clase Workstation (1781 - 2183, n=25, últimos 2 años) | |
| Lenovo ThinkPad P16 Gen 2 | |
| HP ZBook Studio 16 G11 | |
| HWBOT x265 Benchmark v2.2 / 4k Preset | |
| Schenker XMG Pro 16 (E25) | |
| Medio Intel Core Ultra 9 275HX (30.7 - 43.8, n=30) | |
| Lenovo ThinkPad T16g Gen 3 RTX 5080 | |
| Dell Pro Max 16 Plus | |
| HP ZBook Fury 16 G11 | |
| Media de la clase Workstation (14.4 - 40.5, n=25, últimos 2 años) | |
| Lenovo ThinkPad P16 Gen 2 | |
| HP ZBook Studio 16 G11 | |
| LibreOffice / 20 Documents To PDF | |
| Schenker XMG Pro 16 (E25) | |
| HP ZBook Fury 16 G11 | |
| Media de la clase Workstation (37.1 - 74.7, n=25, últimos 2 años) | |
| Lenovo ThinkPad P16 Gen 2 | |
| Lenovo ThinkPad T16g Gen 3 RTX 5080 | |
| HP ZBook Studio 16 G11 | |
| Dell Pro Max 16 Plus | |
| Medio Intel Core Ultra 9 275HX (33.2 - 62.1, n=30) | |
| R Benchmark 2.5 / Overall mean | |
| HP ZBook Studio 16 G11 | |
| Media de la clase Workstation (0.3825 - 0.603, n=25, últimos 2 años) | |
| Dell Pro Max 16 Plus | |
| Lenovo ThinkPad T16g Gen 3 RTX 5080 | |
| Medio Intel Core Ultra 9 275HX (0.3943 - 0.4568, n=30) | |
| Schenker XMG Pro 16 (E25) | |
| Lenovo ThinkPad P16 Gen 2 | |
| HP ZBook Fury 16 G11 | |
* ... más pequeño es mejor
AIDA64: FP32 Ray-Trace | FPU Julia | CPU SHA3 | CPU Queen | FPU SinJulia | FPU Mandel | CPU AES | CPU ZLib | FP64 Ray-Trace | CPU PhotoWorxx
| Performance rating | |
| Medio Intel Core Ultra 9 275HX | |
| Schenker XMG Pro 16 (E25) | |
| Lenovo ThinkPad T16g Gen 3 RTX 5080 | |
| Dell Pro Max 16 Plus | |
| Media de la clase Workstation | |
| Lenovo ThinkPad P16 Gen 2 | |
| HP ZBook Fury 16 G11 | |
| HP ZBook Studio 16 G11 | |
| AIDA64 / FP32 Ray-Trace | |
| Medio Intel Core Ultra 9 275HX (28039 - 39895, n=30) | |
| Lenovo ThinkPad T16g Gen 3 RTX 5080 | |
| Schenker XMG Pro 16 (E25) | |
| Dell Pro Max 16 Plus | |
| Media de la clase Workstation (10658 - 61611, n=25, últimos 2 años) | |
| Lenovo ThinkPad P16 Gen 2 | |
| HP ZBook Fury 16 G11 | |
| HP ZBook Studio 16 G11 | |
| AIDA64 / FPU Julia | |
| Medio Intel Core Ultra 9 275HX (140254 - 200744, n=30) | |
| Lenovo ThinkPad T16g Gen 3 RTX 5080 | |
| Schenker XMG Pro 16 (E25) | |
| Dell Pro Max 16 Plus | |
| Media de la clase Workstation (56664 - 186971, n=25, últimos 2 años) | |
| Lenovo ThinkPad P16 Gen 2 | |
| HP ZBook Fury 16 G11 | |
| HP ZBook Studio 16 G11 | |
| AIDA64 / CPU SHA3 | |
| Medio Intel Core Ultra 9 275HX (6710 - 9817, n=30) | |
| Lenovo ThinkPad T16g Gen 3 RTX 5080 | |
| Schenker XMG Pro 16 (E25) | |
| Dell Pro Max 16 Plus | |
| Media de la clase Workstation (2608 - 8975, n=25, últimos 2 años) | |
| Lenovo ThinkPad P16 Gen 2 | |
| HP ZBook Fury 16 G11 | |
| HP ZBook Studio 16 G11 | |
| AIDA64 / CPU Queen | |
| Lenovo ThinkPad P16 Gen 2 | |
| Lenovo ThinkPad T16g Gen 3 RTX 5080 | |
| HP ZBook Fury 16 G11 | |
| Dell Pro Max 16 Plus | |
| Medio Intel Core Ultra 9 275HX (113887 - 140937, n=30) | |
| Schenker XMG Pro 16 (E25) | |
| Media de la clase Workstation (60778 - 144411, n=25, últimos 2 años) | |
| HP ZBook Studio 16 G11 | |
| AIDA64 / FPU SinJulia | |
| Schenker XMG Pro 16 (E25) | |
| Medio Intel Core Ultra 9 275HX (11172 - 14425, n=30) | |
| Lenovo ThinkPad T16g Gen 3 RTX 5080 | |
| Lenovo ThinkPad P16 Gen 2 | |
| HP ZBook Fury 16 G11 | |
| Media de la clase Workstation (8165 - 29343, n=25, últimos 2 años) | |
| Dell Pro Max 16 Plus | |
| HP ZBook Studio 16 G11 | |
| AIDA64 / FPU Mandel | |
| Medio Intel Core Ultra 9 275HX (72596 - 104508, n=30) | |
| Lenovo ThinkPad T16g Gen 3 RTX 5080 | |
| Schenker XMG Pro 16 (E25) | |
| Dell Pro Max 16 Plus | |
| Media de la clase Workstation (27301 - 98153, n=25, últimos 2 años) | |
| Lenovo ThinkPad P16 Gen 2 | |
| HP ZBook Fury 16 G11 | |
| HP ZBook Studio 16 G11 | |
| AIDA64 / CPU AES | |
| Lenovo ThinkPad T16g Gen 3 RTX 5080 | |
| Medio Intel Core Ultra 9 275HX (105608 - 247074, n=30) | |
| Schenker XMG Pro 16 (E25) | |
| Dell Pro Max 16 Plus | |
| Media de la clase Workstation (56077 - 187841, n=25, últimos 2 años) | |
| Lenovo ThinkPad P16 Gen 2 | |
| HP ZBook Fury 16 G11 | |
| HP ZBook Studio 16 G11 | |
| AIDA64 / CPU ZLib | |
| Lenovo ThinkPad T16g Gen 3 RTX 5080 | |
| Medio Intel Core Ultra 9 275HX (1582 - 2263, n=30) | |
| Schenker XMG Pro 16 (E25) | |
| Dell Pro Max 16 Plus | |
| Lenovo ThinkPad P16 Gen 2 | |
| Media de la clase Workstation (742 - 2148, n=25, últimos 2 años) | |
| HP ZBook Fury 16 G11 | |
| HP ZBook Studio 16 G11 | |
| AIDA64 / FP64 Ray-Trace | |
| Lenovo ThinkPad T16g Gen 3 RTX 5080 | |
| Medio Intel Core Ultra 9 275HX (14847 - 21854, n=30) | |
| Schenker XMG Pro 16 (E25) | |
| Dell Pro Max 16 Plus | |
| Media de la clase Workstation (5580 - 32891, n=25, últimos 2 años) | |
| Lenovo ThinkPad P16 Gen 2 | |
| HP ZBook Fury 16 G11 | |
| HP ZBook Studio 16 G11 | |
| AIDA64 / CPU PhotoWorxx | |
| Dell Pro Max 16 Plus | |
| Schenker XMG Pro 16 (E25) | |
| HP ZBook Studio 16 G11 | |
| Media de la clase Workstation (37151 - 93684, n=25, últimos 2 años) | |
| Medio Intel Core Ultra 9 275HX (37482 - 62916, n=30) | |
| Lenovo ThinkPad P16 Gen 2 | |
| Lenovo ThinkPad T16g Gen 3 RTX 5080 | |
| HP ZBook Fury 16 G11 | |
Rendimiento del sistema
El rendimiento del sistema y las impresiones subjetivas de rendimiento son excelentes, y los resultados de las pruebas comparativas también pueden considerarse muy buenos.
PCMark 10: Score | Essentials | Productivity | Digital Content Creation
CrossMark: Overall | Productivity | Creativity | Responsiveness
WebXPRT 3: Overall
WebXPRT 4: Overall
Mozilla Kraken 1.1: Total
| Performance rating | |
| Lenovo ThinkPad T16g Gen 3 RTX 5080 | |
| Schenker XMG Pro 16 (E25) | |
| Dell Pro Max 16 Plus -4! | |
| Medio Intel Core Ultra 9 275HX, NVIDIA GeForce RTX 5080 Laptop | |
| Lenovo ThinkPad P16 Gen 2 | |
| HP ZBook Fury 16 G11 | |
| Media de la clase Workstation | |
| HP ZBook Studio 16 G11 | |
| PCMark 10 / Score | |
| Lenovo ThinkPad T16g Gen 3 RTX 5080 | |
| Medio Intel Core Ultra 9 275HX, NVIDIA GeForce RTX 5080 Laptop (7805 - 10409, n=9) | |
| Schenker XMG Pro 16 (E25) | |
| Lenovo ThinkPad P16 Gen 2 | |
| Media de la clase Workstation (6436 - 10409, n=21, últimos 2 años) | |
| HP ZBook Fury 16 G11 | |
| HP ZBook Studio 16 G11 | |
| PCMark 10 / Essentials | |
| Schenker XMG Pro 16 (E25) | |
| Lenovo ThinkPad P16 Gen 2 | |
| Medio Intel Core Ultra 9 275HX, NVIDIA GeForce RTX 5080 Laptop (10206 - 11472, n=9) | |
| HP ZBook Studio 16 G11 | |
| Media de la clase Workstation (9622 - 11157, n=21, últimos 2 años) | |
| Lenovo ThinkPad T16g Gen 3 RTX 5080 | |
| HP ZBook Fury 16 G11 | |
| PCMark 10 / Productivity | |
| Lenovo ThinkPad T16g Gen 3 RTX 5080 | |
| Media de la clase Workstation (8789 - 20616, n=21, últimos 2 años) | |
| Medio Intel Core Ultra 9 275HX, NVIDIA GeForce RTX 5080 Laptop (8319 - 20616, n=9) | |
| Lenovo ThinkPad P16 Gen 2 | |
| Schenker XMG Pro 16 (E25) | |
| HP ZBook Fury 16 G11 | |
| HP ZBook Studio 16 G11 | |
| PCMark 10 / Digital Content Creation | |
| Medio Intel Core Ultra 9 275HX, NVIDIA GeForce RTX 5080 Laptop (10505 - 19351, n=9) | |
| Schenker XMG Pro 16 (E25) | |
| Lenovo ThinkPad P16 Gen 2 | |
| Lenovo ThinkPad T16g Gen 3 RTX 5080 | |
| HP ZBook Fury 16 G11 | |
| Media de la clase Workstation (7744 - 15631, n=21, últimos 2 años) | |
| HP ZBook Studio 16 G11 | |
| CrossMark / Overall | |
| Lenovo ThinkPad T16g Gen 3 RTX 5080 | |
| Dell Pro Max 16 Plus | |
| Schenker XMG Pro 16 (E25) | |
| Medio Intel Core Ultra 9 275HX, NVIDIA GeForce RTX 5080 Laptop (1857 - 2244, n=9) | |
| HP ZBook Fury 16 G11 | |
| Lenovo ThinkPad P16 Gen 2 | |
| Media de la clase Workstation (1307 - 2267, n=24, últimos 2 años) | |
| HP ZBook Studio 16 G11 | |
| CrossMark / Productivity | |
| Lenovo ThinkPad T16g Gen 3 RTX 5080 | |
| Schenker XMG Pro 16 (E25) | |
| Dell Pro Max 16 Plus | |
| Medio Intel Core Ultra 9 275HX, NVIDIA GeForce RTX 5080 Laptop (1764 - 2122, n=9) | |
| HP ZBook Fury 16 G11 | |
| Lenovo ThinkPad P16 Gen 2 | |
| Media de la clase Workstation (1130 - 2122, n=24, últimos 2 años) | |
| HP ZBook Studio 16 G11 | |
| CrossMark / Creativity | |
| Dell Pro Max 16 Plus | |
| Schenker XMG Pro 16 (E25) | |
| Lenovo ThinkPad T16g Gen 3 RTX 5080 | |
| Medio Intel Core Ultra 9 275HX, NVIDIA GeForce RTX 5080 Laptop (2115 - 2498, n=9) | |
| Lenovo ThinkPad P16 Gen 2 | |
| HP ZBook Fury 16 G11 | |
| Media de la clase Workstation (1657 - 2725, n=24, últimos 2 años) | |
| HP ZBook Studio 16 G11 | |
| CrossMark / Responsiveness | |
| Lenovo ThinkPad T16g Gen 3 RTX 5080 | |
| Medio Intel Core Ultra 9 275HX, NVIDIA GeForce RTX 5080 Laptop (1466 - 2096, n=9) | |
| Dell Pro Max 16 Plus | |
| Schenker XMG Pro 16 (E25) | |
| HP ZBook Fury 16 G11 | |
| Lenovo ThinkPad P16 Gen 2 | |
| Media de la clase Workstation (993 - 2096, n=24, últimos 2 años) | |
| HP ZBook Studio 16 G11 | |
| WebXPRT 3 / Overall | |
| Schenker XMG Pro 16 (E25) | |
| Medio Intel Core Ultra 9 275HX, NVIDIA GeForce RTX 5080 Laptop (306 - 378, n=9) | |
| Lenovo ThinkPad P16 Gen 2 | |
| Lenovo ThinkPad T16g Gen 3 RTX 5080 | |
| Dell Pro Max 16 Plus | |
| HP ZBook Fury 16 G11 | |
| Media de la clase Workstation (260 - 360, n=25, últimos 2 años) | |
| HP ZBook Studio 16 G11 | |
| WebXPRT 4 / Overall | |
| Schenker XMG Pro 16 (E25) | |
| Medio Intel Core Ultra 9 275HX, NVIDIA GeForce RTX 5080 Laptop (285 - 336, n=9) | |
| Lenovo ThinkPad T16g Gen 3 RTX 5080 | |
| Dell Pro Max 16 Plus | |
| HP ZBook Fury 16 G11 | |
| Lenovo ThinkPad P16 Gen 2 | |
| Media de la clase Workstation (189.2 - 326, n=25, últimos 2 años) | |
| HP ZBook Studio 16 G11 | |
| Mozilla Kraken 1.1 / Total | |
| HP ZBook Studio 16 G11 | |
| Media de la clase Workstation (411 - 538, n=25, últimos 2 años) | |
| Lenovo ThinkPad P16 Gen 2 | |
| HP ZBook Fury 16 G11 | |
| Dell Pro Max 16 Plus | |
| Lenovo ThinkPad T16g Gen 3 RTX 5080 | |
| Medio Intel Core Ultra 9 275HX, NVIDIA GeForce RTX 5080 Laptop (405 - 432, n=9) | |
| Schenker XMG Pro 16 (E25) | |
* ... más pequeño es mejor
| PCMark 10 Score | 10409 puntos | |
ayuda | ||
| AIDA64 / Memory Copy | |
| Dell Pro Max 16 Plus | |
| Schenker XMG Pro 16 (E25) | |
| Media de la clase Workstation (56003 - 164795, n=25, últimos 2 años) | |
| Medio Intel Core Ultra 9 275HX (56003 - 94460, n=30) | |
| HP ZBook Studio 16 G11 | |
| Lenovo ThinkPad T16g Gen 3 RTX 5080 | |
| Lenovo ThinkPad P16 Gen 2 | |
| HP ZBook Fury 16 G11 | |
| AIDA64 / Memory Read | |
| Dell Pro Max 16 Plus | |
| Schenker XMG Pro 16 (E25) | |
| Medio Intel Core Ultra 9 275HX (55795 - 97151, n=30) | |
| HP ZBook Studio 16 G11 | |
| Media de la clase Workstation (55795 - 121563, n=25, últimos 2 años) | |
| Lenovo ThinkPad P16 Gen 2 | |
| Lenovo ThinkPad T16g Gen 3 RTX 5080 | |
| HP ZBook Fury 16 G11 | |
| AIDA64 / Memory Write | |
| Dell Pro Max 16 Plus | |
| Schenker XMG Pro 16 (E25) | |
| Media de la clase Workstation (55663 - 214520, n=25, últimos 2 años) | |
| Medio Intel Core Ultra 9 275HX (55663 - 116129, n=30) | |
| HP ZBook Studio 16 G11 | |
| Lenovo ThinkPad T16g Gen 3 RTX 5080 | |
| Lenovo ThinkPad P16 Gen 2 | |
| HP ZBook Fury 16 G11 | |
| AIDA64 / Memory Latency | |
| Lenovo ThinkPad T16g Gen 3 RTX 5080 | |
| HP ZBook Studio 16 G11 | |
| Media de la clase Workstation (84.5 - 165.2, n=25, últimos 2 años) | |
| Medio Intel Core Ultra 9 275HX (105.8 - 161.6, n=30) | |
| Dell Pro Max 16 Plus | |
| Schenker XMG Pro 16 (E25) | |
| HP ZBook Fury 16 G11 | |
| Lenovo ThinkPad P16 Gen 2 | |
* ... más pequeño es mejor
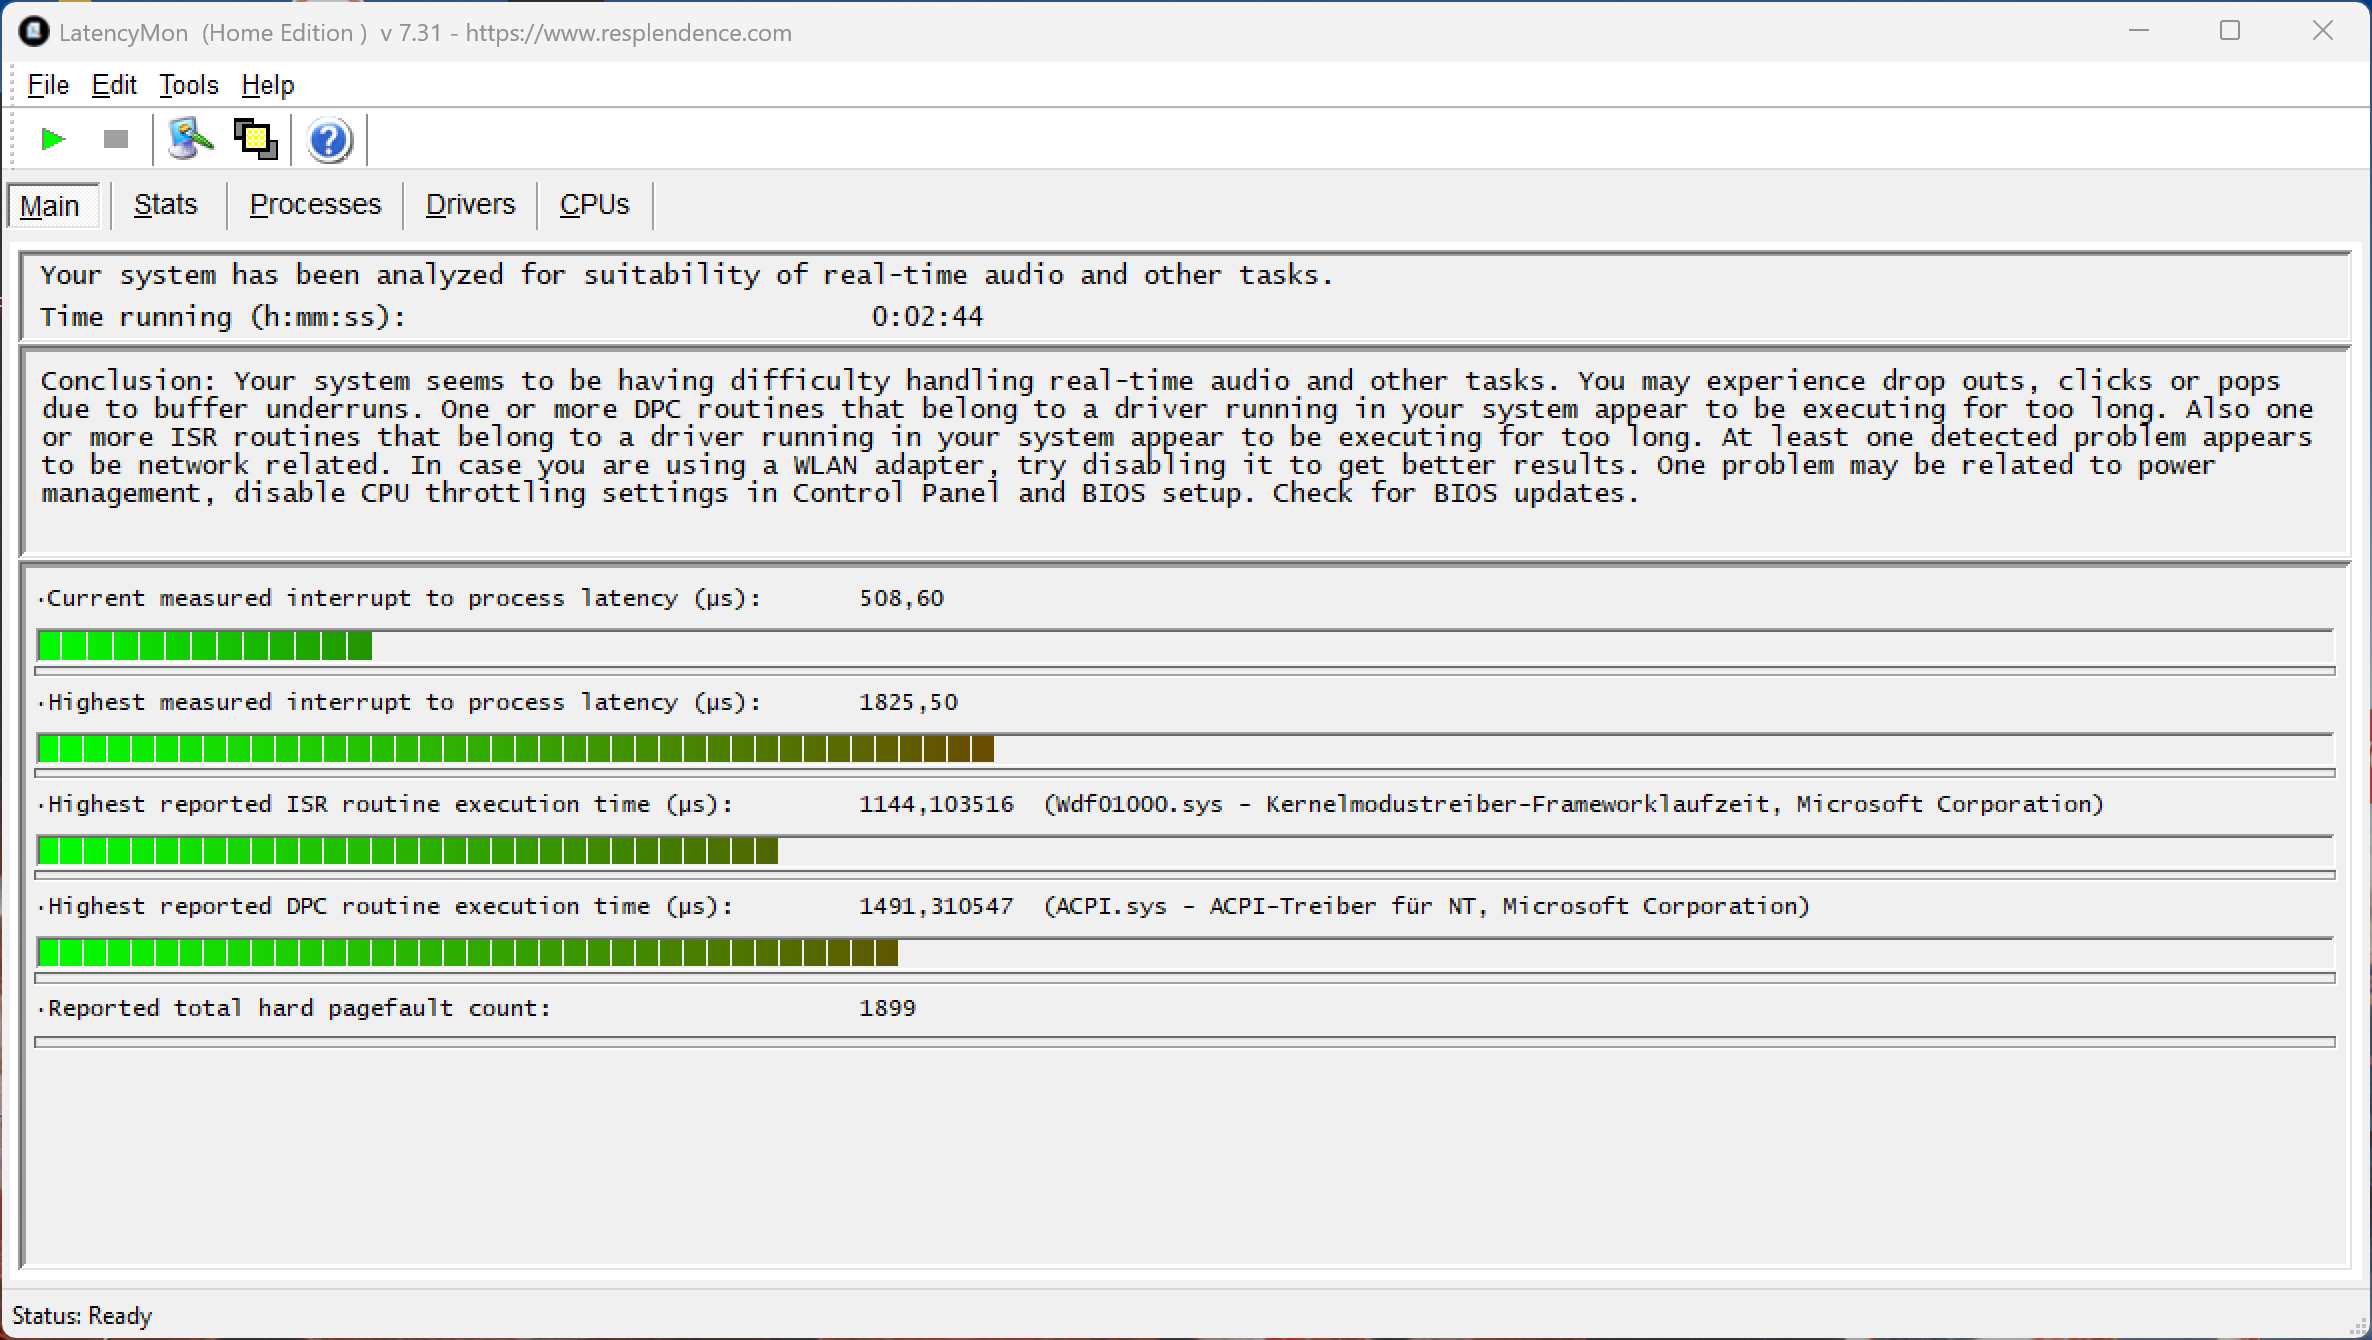
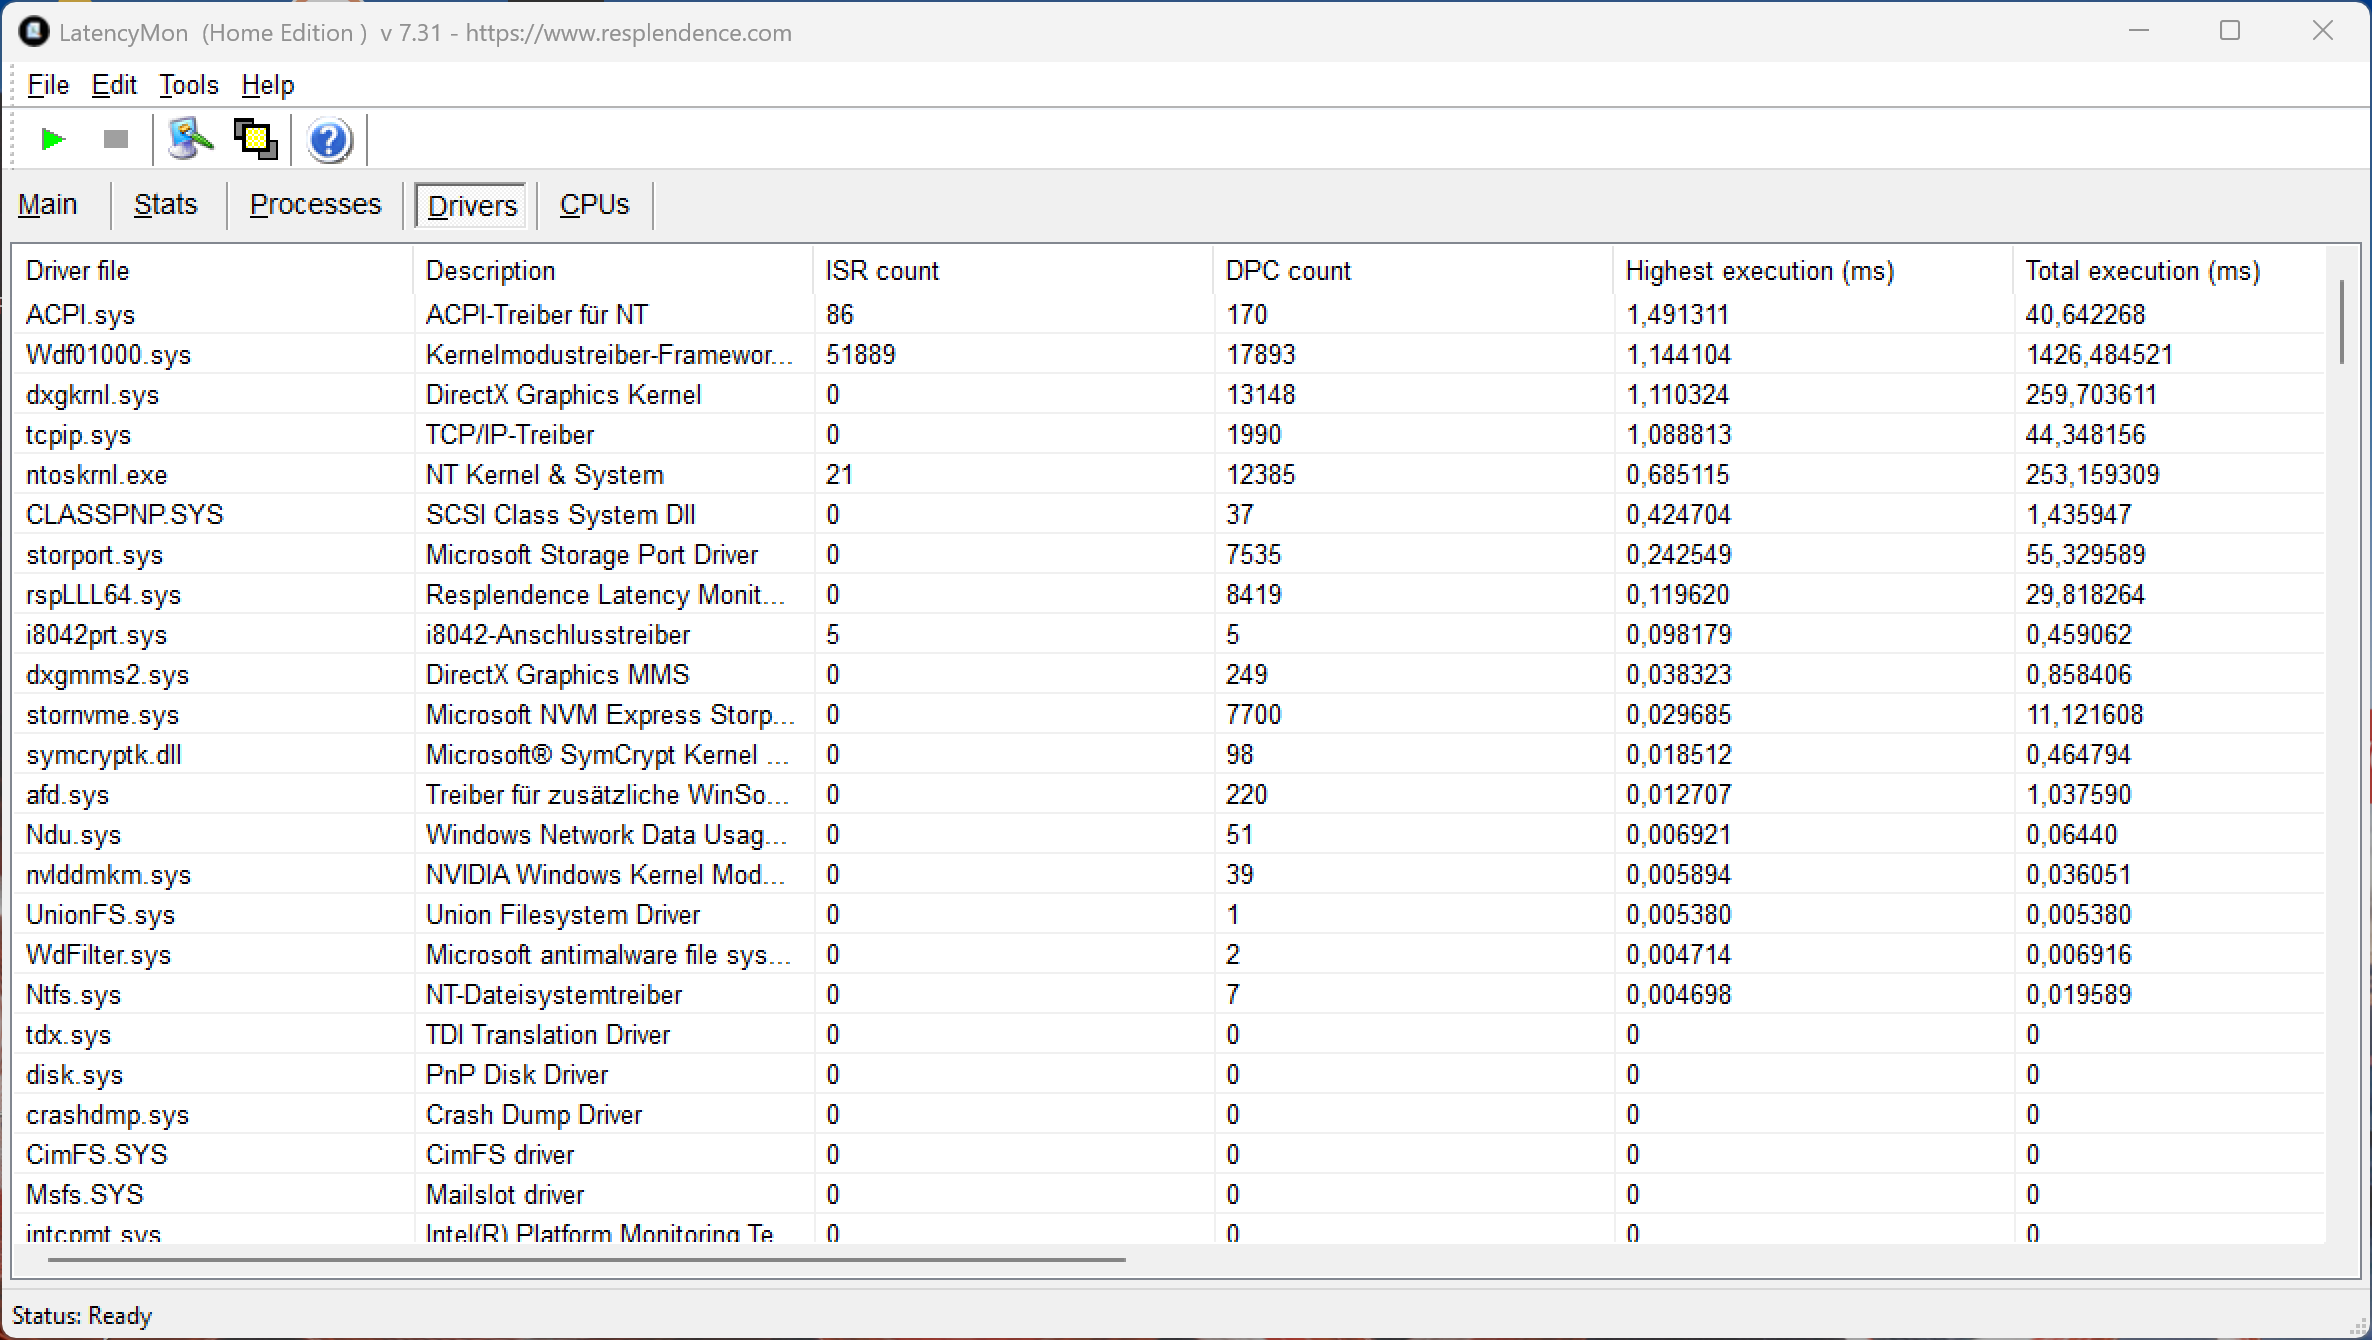
Latencias del CPD
En nuestra prueba de latencia estandarizada, el T16g con la versión actual de la BIOS mostró ligeras limitaciones durante el uso de aplicaciones de audio en tiempo real.
| DPC Latencies / LatencyMon - interrupt to process latency (max), Web, Youtube, Prime95 | |
| HP ZBook Fury 16 G11 | |
| Dell Pro Max 16 Plus | |
| Lenovo ThinkPad T16g Gen 3 RTX 5080 | |
| Schenker XMG Pro 16 (E25) | |
| HP ZBook Studio 16 G11 | |
| Lenovo ThinkPad P16 Gen 2 | |
* ... más pequeño es mejor
Almacenamiento masivo
El ThinkPad T16g incorpora una rápida ranura PCIe 5.0, en la que nuestra unidad de análisis estaba ocupada por la correspondiente unidad SSD Samsung de 2 TB (1,75 TB libres). Con velocidades de transferencia de hasta 13 GB/s, el rendimiento es generalmente alto, pero este nivel no puede mantenerse bajo carga sostenida, y el rendimiento cae alrededor de un 50%. Dispone de dos ranuras SSD adicionales (PCIe 4.0) para espacio de almacenamiento adicional.

* ... más pequeño es mejor
Rendimiento sostenido Lectura: Bucle de lectura DiskSpd, profundidad de cola 8
Rendimiento de la GPU
Lenovo ha equipado el móvil GeForce RTX 5080 con un TGP de sólo 105 vatios, lo que la convierte en una de las implementaciones más lentas que hemos probado hasta ahora (para comparar, incluso la compacta Asus ROG Zephyrus G14 permite que la 5080 consuma 110 vatios), e incluso la RTX 5070 Ti en el XMG Pro 16 es más rápida. Además, en este ámbito, la 5080 es incluso más lenta que la RTX 4000 de la antigua ThinkPad P16 Gen 2, que a su vez se basaba en la RTX 4080.
Sin embargo, el rendimiento gráfico se mantiene estable, y los 16 GB de VRAM pueden ser ciertamente beneficiosos dependiendo de la aplicación. Incluso en las pruebas profesionales SPECviewperf, la 5080 rinde muy bien en algunas subpruebas, por lo que estas aplicaciones también son posibles. El rendimiento en juegos es considerablemente inferior al de otros sistemas con la RTX 5080. Cuando funciona con batería, la GPU está limitada a un consumo máximo de 60 vatios, lo que se traduce en una reducción del rendimiento de aproximadamente el 35%.
| 3DMark 11 Performance | 42195 puntos | |
| 3DMark Fire Strike Score | 33297 puntos | |
| 3DMark Time Spy Score | 15900 puntos | |
| 3DMark Steel Nomad Score | 4022 puntos | |
| 3DMark Steel Nomad Light Score | 17002 puntos | |
ayuda | ||
SPECviewperf 2020: 3840x2160 Solidworks (solidworks-07) 4k | 1920x1080 Solidworks (solidworks-07) | 1920x1080 Solidworks (solidworks-05) | 1920x1080 Siemens NX (snx-04) | 1920x1080 Medical (medical-03) | 1920x1080 Maya (maya-06) | 1920x1080 Energy (energy-03) | 1920x1080 Creo (creo-03) | 1920x1080 CATIA (catia-06) | 1920x1080 3ds Max (3dsmax-07) | 3840x2160 Solidworks (solidworks-05) | 3840x2160 Siemens NX (snx-04) | 3840x2160 Medical (medical-03) | 3840x2160 Maya (maya-06) | 3840x2160 Energy (energy-03) | 3840x2160 Creo (creo-03) | 3840x2160 CATIA (catia-06) | 3840x2160 3ds Max (3dsmax-07)
| SPECviewperf 15 / Siemens NX 2406 (snx-05) | |
| Lenovo ThinkPad P16v G3 21RS000DGE | |
| Razer Blade 16 Early 2023 | |
| Lenovo ThinkPad T16g Gen 3 RTX 5080 | |
| SPECviewperf 15 / Unreal Engine 5.4.2 (unreal_engine-01) | |
| Razer Blade 16 Early 2023 | |
| Lenovo ThinkPad T16g Gen 3 RTX 5080 | |
| Lenovo ThinkPad P1 Gen 8 | |
| Lenovo ThinkPad P16v G3 21RS000DGE | |
| SPECviewperf 15 / Solidworks 2024 (solidworks-08) | |
| Lenovo ThinkPad P1 Gen 8 | |
| Lenovo ThinkPad P16v G3 21RS000DGE | |
| Razer Blade 16 Early 2023 | |
| Lenovo ThinkPad T16g Gen 3 RTX 5080 | |
| SPECviewperf 15 / Tuvok (medical-04) | |
| Lenovo ThinkPad P1 Gen 8 | |
| Lenovo ThinkPad P16v G3 21RS000DGE | |
| Razer Blade 16 Early 2023 | |
| Lenovo ThinkPad T16g Gen 3 RTX 5080 | |
| SPECviewperf 15 / Maya 2025 (maya-07) | |
| Lenovo ThinkPad T16g Gen 3 RTX 5080 | |
| Razer Blade 16 Early 2023 | |
| Lenovo ThinkPad P1 Gen 8 | |
| Lenovo ThinkPad P16v G3 21RS000DGE | |
| SPECviewperf 15 / Enscape 4.0 (enscape-01) | |
| Lenovo ThinkPad T16g Gen 3 RTX 5080 | |
| Razer Blade 16 Early 2023 | |
| Lenovo ThinkPad P1 Gen 8 | |
| Lenovo ThinkPad P16v G3 21RS000DGE | |
| SPECviewperf 15 / OpendTect (energy-04) | |
| Razer Blade 16 Early 2023 | |
| Lenovo ThinkPad T16g Gen 3 RTX 5080 | |
| Lenovo ThinkPad P1 Gen 8 | |
| Lenovo ThinkPad P16v G3 21RS000DGE | |
| SPECviewperf 15 / Creo 9 (creo-04) | |
| Razer Blade 16 Early 2023 | |
| Lenovo ThinkPad P1 Gen 8 | |
| Lenovo ThinkPad T16g Gen 3 RTX 5080 | |
| Lenovo ThinkPad P16v G3 21RS000DGE | |
| SPECviewperf 15 / Catia V5 (catia-07) | |
| Lenovo ThinkPad T16g Gen 3 RTX 5080 | |
| Razer Blade 16 Early 2023 | |
| SPECviewperf 15 / Blender 3.6 (blender-01) | |
| Lenovo ThinkPad T16g Gen 3 RTX 5080 | |
| Razer Blade 16 Early 2023 | |
| Lenovo ThinkPad P1 Gen 8 | |
| Lenovo ThinkPad P16v G3 21RS000DGE | |
| SPECviewperf 15 / 3ds Max 2023 (3dsmax-08) | |
| Lenovo ThinkPad T16g Gen 3 RTX 5080 | |
| Razer Blade 16 Early 2023 | |
| Lenovo ThinkPad P1 Gen 8 | |
| Lenovo ThinkPad P16v G3 21RS000DGE | |
| SPECviewperf 2020 / Solidworks (solidworks-07) 4k | |
| Dell Pro Max 16 Plus | |
| Lenovo ThinkPad T16g Gen 3 RTX 5080 | |
| Lenovo ThinkPad P16 Gen 2 | |
| Lenovo ThinkPad P1 Gen 8 | |
| HP ZBook Fury 16 G11 | |
| Lenovo ThinkPad P16v G3 21RS000DGE | |
| HP ZBook Studio 16 G11 | |
| SPECviewperf 2020 / Solidworks (solidworks-05) | |
| Razer Blade 16 Early 2023 | |
| SPECviewperf 2020 / Solidworks (solidworks-05) | |
| Razer Blade 16 Early 2023 | |
| Blender / v3.3 Classroom OPTIX/RTX | |
| Media de la clase Workstation (10 - 95, n=19, últimos 2 años) | |
| HP ZBook Studio 16 G11 | |
| HP ZBook Fury 16 G11 | |
| Lenovo ThinkPad T16g Gen 3 RTX 5080 | |
| Lenovo ThinkPad P16 Gen 2 | |
| Schenker XMG Pro 16 (E25) | |
| Medio NVIDIA GeForce RTX 5080 Laptop (11 - 17, n=14) | |
| Dell Pro Max 16 Plus | |
| Blender / v3.3 Classroom CUDA | |
| Media de la clase Workstation (16 - 142, n=19, últimos 2 años) | |
| HP ZBook Studio 16 G11 | |
| HP ZBook Fury 16 G11 | |
| Schenker XMG Pro 16 (E25) | |
| Lenovo ThinkPad T16g Gen 3 RTX 5080 | |
| Medio NVIDIA GeForce RTX 5080 Laptop (18 - 49, n=16) | |
| Lenovo ThinkPad P16 Gen 2 | |
| Dell Pro Max 16 Plus | |
| Blender / v3.3 Classroom CPU | |
| HP ZBook Studio 16 G11 | |
| Media de la clase Workstation (148 - 464, n=25, últimos 2 años) | |
| HP ZBook Fury 16 G11 | |
| Lenovo ThinkPad P16 Gen 2 | |
| Lenovo ThinkPad T16g Gen 3 RTX 5080 | |
| Dell Pro Max 16 Plus | |
| Medio NVIDIA GeForce RTX 5080 Laptop (123 - 243, n=15) | |
| Schenker XMG Pro 16 (E25) | |
* ... más pequeño es mejor
| Cyberpunk 2077 - 1920x1080 Ultra Preset (FSR off) | |
| Schenker XMG Pro 16 (E25) | |
| Dell Pro Max 16 Plus | |
| Lenovo ThinkPad T16g Gen 3 RTX 5080 | |
| Lenovo ThinkPad P16 Gen 2 | |
| HP ZBook Fury 16 G11 | |
| Media de la clase Workstation (19.6 - 152.4, n=25, últimos 2 años) | |
| HP ZBook Studio 16 G11 | |
| Final Fantasy XV Benchmark - 1920x1080 High Quality | |
| Dell Pro Max 16 Plus | |
| Lenovo ThinkPad T16g Gen 3 RTX 5080 | |
| Lenovo ThinkPad P16 Gen 2 | |
| Schenker XMG Pro 16 (E25) | |
| HP ZBook Fury 16 G11 | |
| Media de la clase Workstation (26.4 - 197.6, n=25, últimos 2 años) | |
| HP ZBook Studio 16 G11 | |
| Strange Brigade - 1920x1080 ultra AA:ultra AF:16 | |
| Lenovo ThinkPad T16g Gen 3 RTX 5080 | |
| Lenovo ThinkPad P16 Gen 2 | |
| Dell Pro Max 16 Plus | |
| Media de la clase Workstation (54.5 - 418, n=19, últimos 2 años) | |
| HP ZBook Fury 16 G11 | |
| HP ZBook Studio 16 G11 | |
| Schenker XMG Pro 16 (E25) | |
| Dota 2 Reborn - 1920x1080 ultra (3/3) best looking | |
| Schenker XMG Pro 16 (E25) | |
| Dell Pro Max 16 Plus | |
| Lenovo ThinkPad T16g Gen 3 RTX 5080 | |
| Lenovo ThinkPad P16 Gen 2 | |
| HP ZBook Fury 16 G11 | |
| HP ZBook Studio 16 G11 | |
| Media de la clase Workstation (50.7 - 178.4, n=25, últimos 2 años) | |
| F1 24 - 2560x1440 Ultra High Preset AA:T AF:16x | |
| Dell Pro Max 16 Plus | |
| Medio NVIDIA GeForce RTX 5080 Laptop (60.6 - 92.6, n=12) | |
| Schenker XMG Pro 16 (E25) | |
| Media de la clase Workstation (22 - 101.8, n=9, últimos 2 años) | |
| Lenovo ThinkPad T16g Gen 3 RTX 5080 | |
Cyberpunk 2077 ultra FPS diagrama
| bajo | medio | alto | ultra | QHD DLSS | QHD | 4K DLSS | 4K | |
|---|---|---|---|---|---|---|---|---|
| GTA V (2015) | 141.3 | 128.1 | ||||||
| Dota 2 Reborn (2015) | 210 | 184.4 | 176.6 | 164.8 | 148.3 | |||
| Final Fantasy XV Benchmark (2018) | 220 | 196.9 | 152.1 | 121.1 | 71.3 | |||
| X-Plane 11.11 (2018) | 154.1 | 117.8 | 110.4 | 88 | ||||
| Strange Brigade (2018) | 505 | 350 | 343 | 311 | 181.6 | 125.7 | ||
| Baldur's Gate 3 (2023) | 189.7 | 163 | 148.2 | 145.9 | 107 | 57.3 | ||
| Cyberpunk 2077 (2023) | 135.8 | 131.2 | 119 | 107.6 | 84.5 | 74.4 | 41.9 | 34.6 |
| F1 24 (2024) | 274 | 239 | 96.5 | 97.7 | 60.6 | 52.2 | 31 | |
| F1 25 (2025) | 213 | 198.3 | 179.2 | 38.6 | 42.6 | 23.6 | 21.2 | 11.2 |
Emisiones y energía
Emisiones sonoras

Los ventiladores poseen aspectos positivos y negativos. En los dos modos de potencia, Equilibrado y Mejor Rendimiento, los ventiladores funcionan constantemente a baja velocidad, lo que significa que rara vez hacen ruido, incluso durante breves ráfagas de carga o en el uso diario. Sin embargo, cuando se requiere la máxima potencia, los dos ventiladores alcanzan un ruido molesto de 57 dB(A)(Equilibrado: 50,3 dB(A), Mejor rendimiento energético: 42,7 dB(A), Batería: máx. 57.7 dB(A)). Teniendo en cuenta las prestaciones ofrecidas, se trata de un volumen excesivo y también más alto que el de los modelos de la competencia. No se detectaron ruidos electrónicos adicionales.
Ruido
| Ocioso |
| 24.7 / 28.9 / 28.9 dB(A) |
| Carga |
| 30.4 / 57.7 dB(A) |
 | ||
30 dB silencioso 40 dB(A) audible 50 dB(A) ruidosamente alto |
||
min: | ||
| Lenovo ThinkPad T16g Gen 3 RTX 5080 Ultra 9 275HX, GeForce RTX 5080 Laptop | HP ZBook Studio 16 G11 Ultra 9 185H, RTX 3000 Ada Generation Laptop | Dell Pro Max 16 Plus Ultra 9 285HX, RTX PRO 5000 Blackwell Generation Laptop | Lenovo ThinkPad P16 Gen 2 i7-14700HX, RTX 4000 Ada Generation Laptop | HP ZBook Fury 16 G11 i9-14900HX, RTX 3500 Ada Generation Laptop | Schenker XMG Pro 16 (E25) Ultra 9 275HX, GeForce RTX 5070 Ti Laptop | |
|---|---|---|---|---|---|---|
| Noise | 6% | -6% | -5% | 3% | -0% | |
| apagado / medio ambiente * (dB) | 24.7 | 23.8 4% | 23.2 6% | 23.9 3% | 23.2 6% | 23.3 6% |
| Idle Minimum * (dB) | 24.7 | 23.8 4% | 26.7 -8% | 29.1 -18% | 23.2 6% | 25 -1% |
| Idle Average * (dB) | 28.9 | 26.4 9% | 30.5 -6% | 29.1 -1% | 23.2 20% | 25 13% |
| Idle Maximum * (dB) | 28.9 | 26.4 9% | 34 -18% | 29.1 -1% | 29.5 -2% | 25 13% |
| Load Average * (dB) | 30.4 | 33.7 -11% | 39.8 -31% | 41 -35% | 43 -41% | 45.5 -50% |
| Cyberpunk 2077 ultra * (dB) | 57.7 | 46.1 20% | 54.3 6% | 52.8 8% | 48.2 16% | 53.3 8% |
| Load Maximum * (dB) | 57.7 | 53.2 8% | 54.3 6% | 52.9 8% | 48.2 16% | 53.3 8% |
* ... más pequeño es mejor
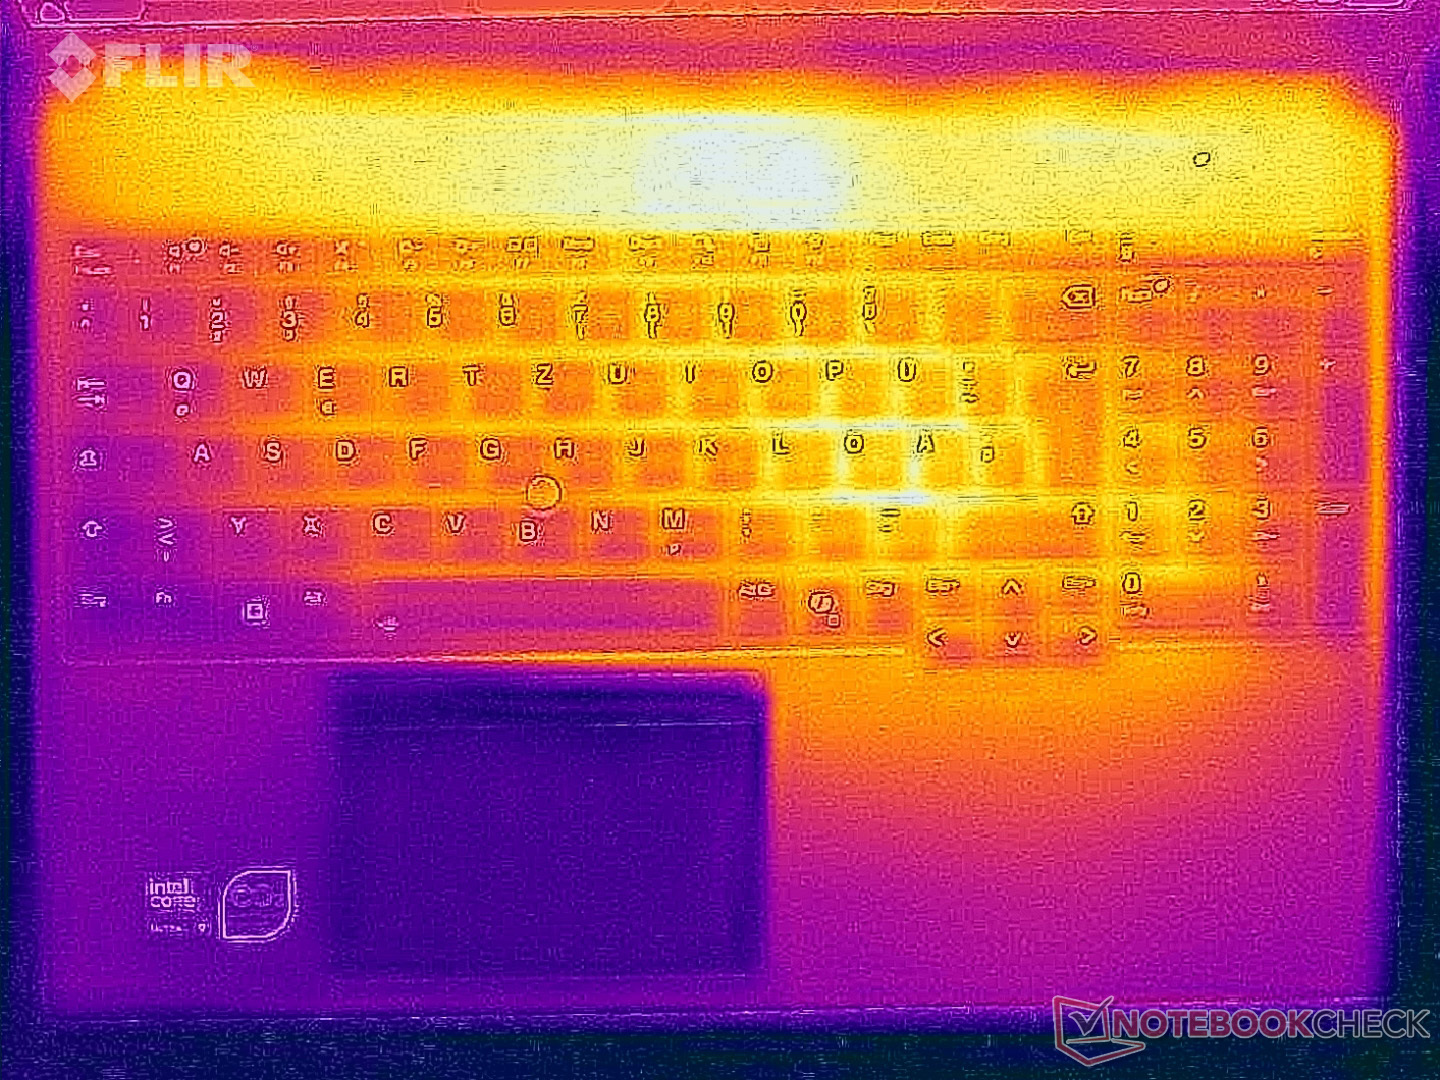
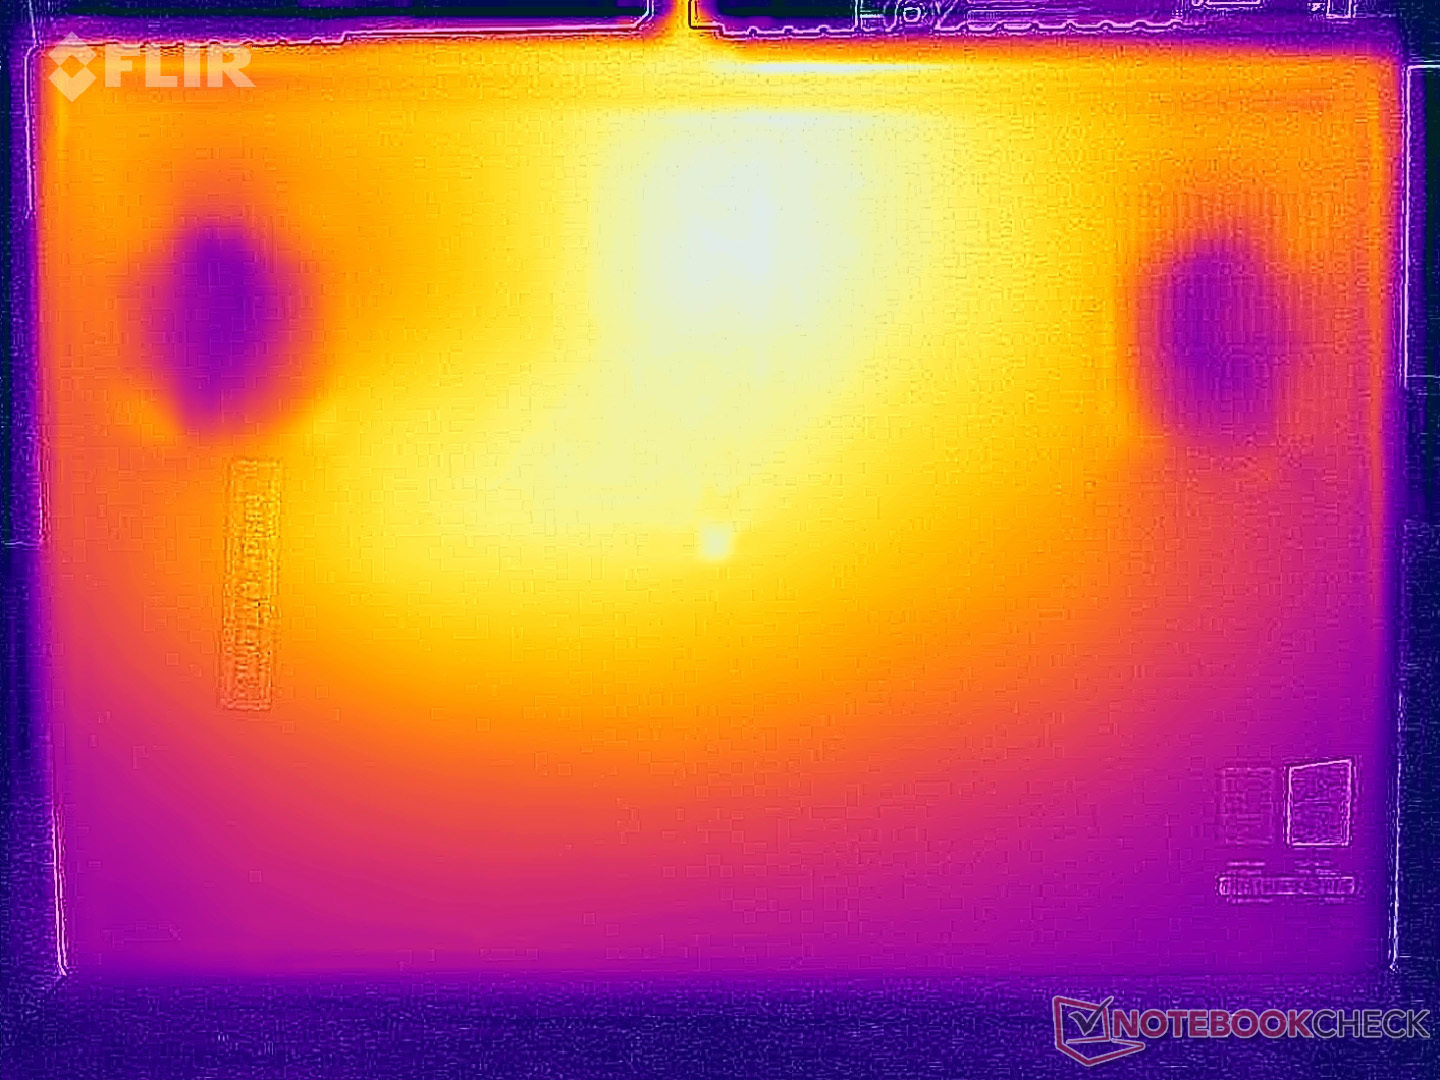
Temperatura
Una ventaja de la elevada actividad de los ventiladores son las bajas temperaturas de la superficie, aunque esto no es exactamente lo que se llamaría sorprendente, dado el consumo total de energía de 130 vatios en una carcasa tan gruesa. En la prueba de estrés, la tarjeta gráfica se mantiene a sus 105 vatios (78 °C), mientras que el procesador se ralentiza a sólo 25 vatios (73 °C).

(±) La temperatura máxima en la parte superior es de 43.9 °C / 111 F, frente a la media de 38.2 °C / 101 F, que oscila entre 22.2 y 69.8 °C para la clase Workstation.
(-) El fondo se calienta hasta un máximo de 45.4 °C / 114 F, frente a la media de 41.1 °C / 106 F
(+) En reposo, la temperatura media de la parte superior es de 27.1 °C / 81# F, frente a la media del dispositivo de 32 °C / 90 F.
(-) 3: The average temperature for the upper side is 39.4 °C / 103 F, compared to the average of 32 °C / 90 F for the class Workstation.
(±) El reposamanos y el touchpad pueden calentarse mucho al tacto con un máximo de 38 °C / 100.4 F.
(-) La temperatura media de la zona del reposamanos de dispositivos similares fue de 27.8 °C / 82 F (-10.2 °C / -18.4 F).
| Lenovo ThinkPad T16g Gen 3 RTX 5080 Ultra 9 275HX, GeForce RTX 5080 Laptop | HP ZBook Studio 16 G11 Ultra 9 185H, RTX 3000 Ada Generation Laptop | Dell Pro Max 16 Plus Ultra 9 285HX, RTX PRO 5000 Blackwell Generation Laptop | Lenovo ThinkPad P16 Gen 2 i7-14700HX, RTX 4000 Ada Generation Laptop | HP ZBook Fury 16 G11 i9-14900HX, RTX 3500 Ada Generation Laptop | Schenker XMG Pro 16 (E25) Ultra 9 275HX, GeForce RTX 5070 Ti Laptop | |
|---|---|---|---|---|---|---|
| Heat | -6% | -6% | 1% | -16% | -206% | |
| Maximum Upper Side * (°C) | 43.9 | 36.6 17% | 40.4 8% | 46.6 -6% | 42.2 4% | 43.2 2% |
| Maximum Bottom * (°C) | 45.4 | 47.8 -5% | 45.6 -0% | 51 -12% | 48 -6% | 46 -1% |
| Idle Upper Side * (°C) | 27.7 | 31.4 -13% | 32.8 -18% | 24.8 10% | 37 -34% | 27.7 -0% |
| Idle Bottom * (°C) | 28.6 | 35.6 -24% | 33 -15% | 25.6 10% | 36.8 -29% | 264 -823% |
* ... más pequeño es mejor
Altavoces
En general, los altavoces son muy buenos y significativamente mejores que los de los dispositivos de la competencia.
Lenovo ThinkPad T16g Gen 3 RTX 5080 análisis de audio
(+) | los altavoces pueden reproducir a un volumen relativamente alto (#84.2 dB)
Graves 100 - 315 Hz
(±) | lubina reducida - en promedio 11.5% inferior a la mediana
(±) | la linealidad de los graves es media (13.2% delta a frecuencia anterior)
Medios 400 - 2000 Hz
(+) | medios equilibrados - a sólo 2.9% de la mediana
(+) | los medios son lineales (3% delta a la frecuencia anterior)
Altos 2 - 16 kHz
(+) | máximos equilibrados - a sólo 1.4% de la mediana
(+) | los máximos son lineales (3.6% delta a la frecuencia anterior)
Total 100 - 16.000 Hz
(+) | el sonido global es lineal (10.2% de diferencia con la mediana)
En comparación con la misma clase
» 6% de todos los dispositivos probados de esta clase eran mejores, 5% similares, 89% peores
» El mejor tuvo un delta de 7%, la media fue 17%, el peor fue ###max##%
En comparación con todos los dispositivos probados
» 5% de todos los dispositivos probados eran mejores, 1% similares, 94% peores
» El mejor tuvo un delta de 4%, la media fue 24%, el peor fue ###max##%
HP ZBook Studio 16 G11 análisis de audio
(+) | los altavoces pueden reproducir a un volumen relativamente alto (#82.7 dB)
Graves 100 - 315 Hz
(-) | casi sin bajos - de media 17.4% inferior a la mediana
(±) | la linealidad de los graves es media (11.8% delta a frecuencia anterior)
Medios 400 - 2000 Hz
(+) | medios equilibrados - a sólo 3.4% de la mediana
(±) | la linealidad de los medios es media (7% delta respecto a la frecuencia anterior)
Altos 2 - 16 kHz
(+) | máximos equilibrados - a sólo 2.4% de la mediana
(+) | los máximos son lineales (2.6% delta a la frecuencia anterior)
Total 100 - 16.000 Hz
(±) | la linealidad del sonido global es media (15.2% de diferencia con la mediana)
En comparación con la misma clase
» 33% de todos los dispositivos probados de esta clase eran mejores, 10% similares, 57% peores
» El mejor tuvo un delta de 7%, la media fue 17%, el peor fue ###max##%
En comparación con todos los dispositivos probados
» 21% de todos los dispositivos probados eran mejores, 4% similares, 74% peores
» El mejor tuvo un delta de 4%, la media fue 24%, el peor fue ###max##%
Dell Pro Max 16 Plus análisis de audio
(+) | los altavoces pueden reproducir a un volumen relativamente alto (#91.6 dB)
Graves 100 - 315 Hz
(-) | casi sin bajos - de media 20.9% inferior a la mediana
(+) | el bajo es lineal (5.9% delta a la frecuencia anterior)
Medios 400 - 2000 Hz
(+) | medios equilibrados - a sólo 4.5% de la mediana
(+) | los medios son lineales (4% delta a la frecuencia anterior)
Altos 2 - 16 kHz
(+) | máximos equilibrados - a sólo 3.7% de la mediana
(+) | los máximos son lineales (2.9% delta a la frecuencia anterior)
Total 100 - 16.000 Hz
(+) | el sonido global es lineal (14.3% de diferencia con la mediana)
En comparación con la misma clase
» 30% de todos los dispositivos probados de esta clase eran mejores, 4% similares, 67% peores
» El mejor tuvo un delta de 7%, la media fue 17%, el peor fue ###max##%
En comparación con todos los dispositivos probados
» 17% de todos los dispositivos probados eran mejores, 4% similares, 79% peores
» El mejor tuvo un delta de 4%, la media fue 24%, el peor fue ###max##%
Lenovo ThinkPad P16 Gen 2 análisis de audio
(±) | la sonoridad del altavoz es media pero buena (80.7 dB)
Graves 100 - 315 Hz
(±) | lubina reducida - en promedio 10.8% inferior a la mediana
(±) | la linealidad de los graves es media (8% delta a frecuencia anterior)
Medios 400 - 2000 Hz
(±) | medias más altas - de media 5.4% más altas que la mediana
(+) | los medios son lineales (6.2% delta a la frecuencia anterior)
Altos 2 - 16 kHz
(+) | máximos equilibrados - a sólo 3.3% de la mediana
(+) | los máximos son lineales (5.5% delta a la frecuencia anterior)
Total 100 - 16.000 Hz
(±) | la linealidad del sonido global es media (15.6% de diferencia con la mediana)
En comparación con la misma clase
» 35% de todos los dispositivos probados de esta clase eran mejores, 11% similares, 54% peores
» El mejor tuvo un delta de 7%, la media fue 17%, el peor fue ###max##%
En comparación con todos los dispositivos probados
» 23% de todos los dispositivos probados eran mejores, 5% similares, 72% peores
» El mejor tuvo un delta de 4%, la media fue 24%, el peor fue ###max##%
HP ZBook Fury 16 G11 análisis de audio
(+) | los altavoces pueden reproducir a un volumen relativamente alto (#88.9 dB)
Graves 100 - 315 Hz
(±) | lubina reducida - en promedio 13.3% inferior a la mediana
(±) | la linealidad de los graves es media (11.2% delta a frecuencia anterior)
Medios 400 - 2000 Hz
(+) | medios equilibrados - a sólo 2.2% de la mediana
(+) | los medios son lineales (3.2% delta a la frecuencia anterior)
Altos 2 - 16 kHz
(+) | máximos equilibrados - a sólo 3.7% de la mediana
(+) | los máximos son lineales (4.6% delta a la frecuencia anterior)
Total 100 - 16.000 Hz
(+) | el sonido global es lineal (12.9% de diferencia con la mediana)
En comparación con la misma clase
» 21% de todos los dispositivos probados de esta clase eran mejores, 6% similares, 72% peores
» El mejor tuvo un delta de 7%, la media fue 17%, el peor fue ###max##%
En comparación con todos los dispositivos probados
» 12% de todos los dispositivos probados eran mejores, 3% similares, 85% peores
» El mejor tuvo un delta de 4%, la media fue 24%, el peor fue ###max##%
Schenker XMG Pro 16 (E25) análisis de audio
(±) | la sonoridad del altavoz es media pero buena (79.2 dB)
Graves 100 - 315 Hz
(±) | lubina reducida - en promedio 14.2% inferior a la mediana
(±) | la linealidad de los graves es media (10.6% delta a frecuencia anterior)
Medios 400 - 2000 Hz
(±) | medias más altas - de media 8.2% más altas que la mediana
(±) | la linealidad de los medios es media (9.9% delta respecto a la frecuencia anterior)
Altos 2 - 16 kHz
(+) | máximos equilibrados - a sólo 3.8% de la mediana
(+) | los máximos son lineales (5.9% delta a la frecuencia anterior)
Total 100 - 16.000 Hz
(±) | la linealidad del sonido global es media (18.5% de diferencia con la mediana)
En comparación con la misma clase
» 60% de todos los dispositivos probados de esta clase eran mejores, 8% similares, 32% peores
» El mejor tuvo un delta de 6%, la media fue 18%, el peor fue ###max##%
En comparación con todos los dispositivos probados
» 41% de todos los dispositivos probados eran mejores, 8% similares, 51% peores
» El mejor tuvo un delta de 4%, la media fue 24%, el peor fue ###max##%
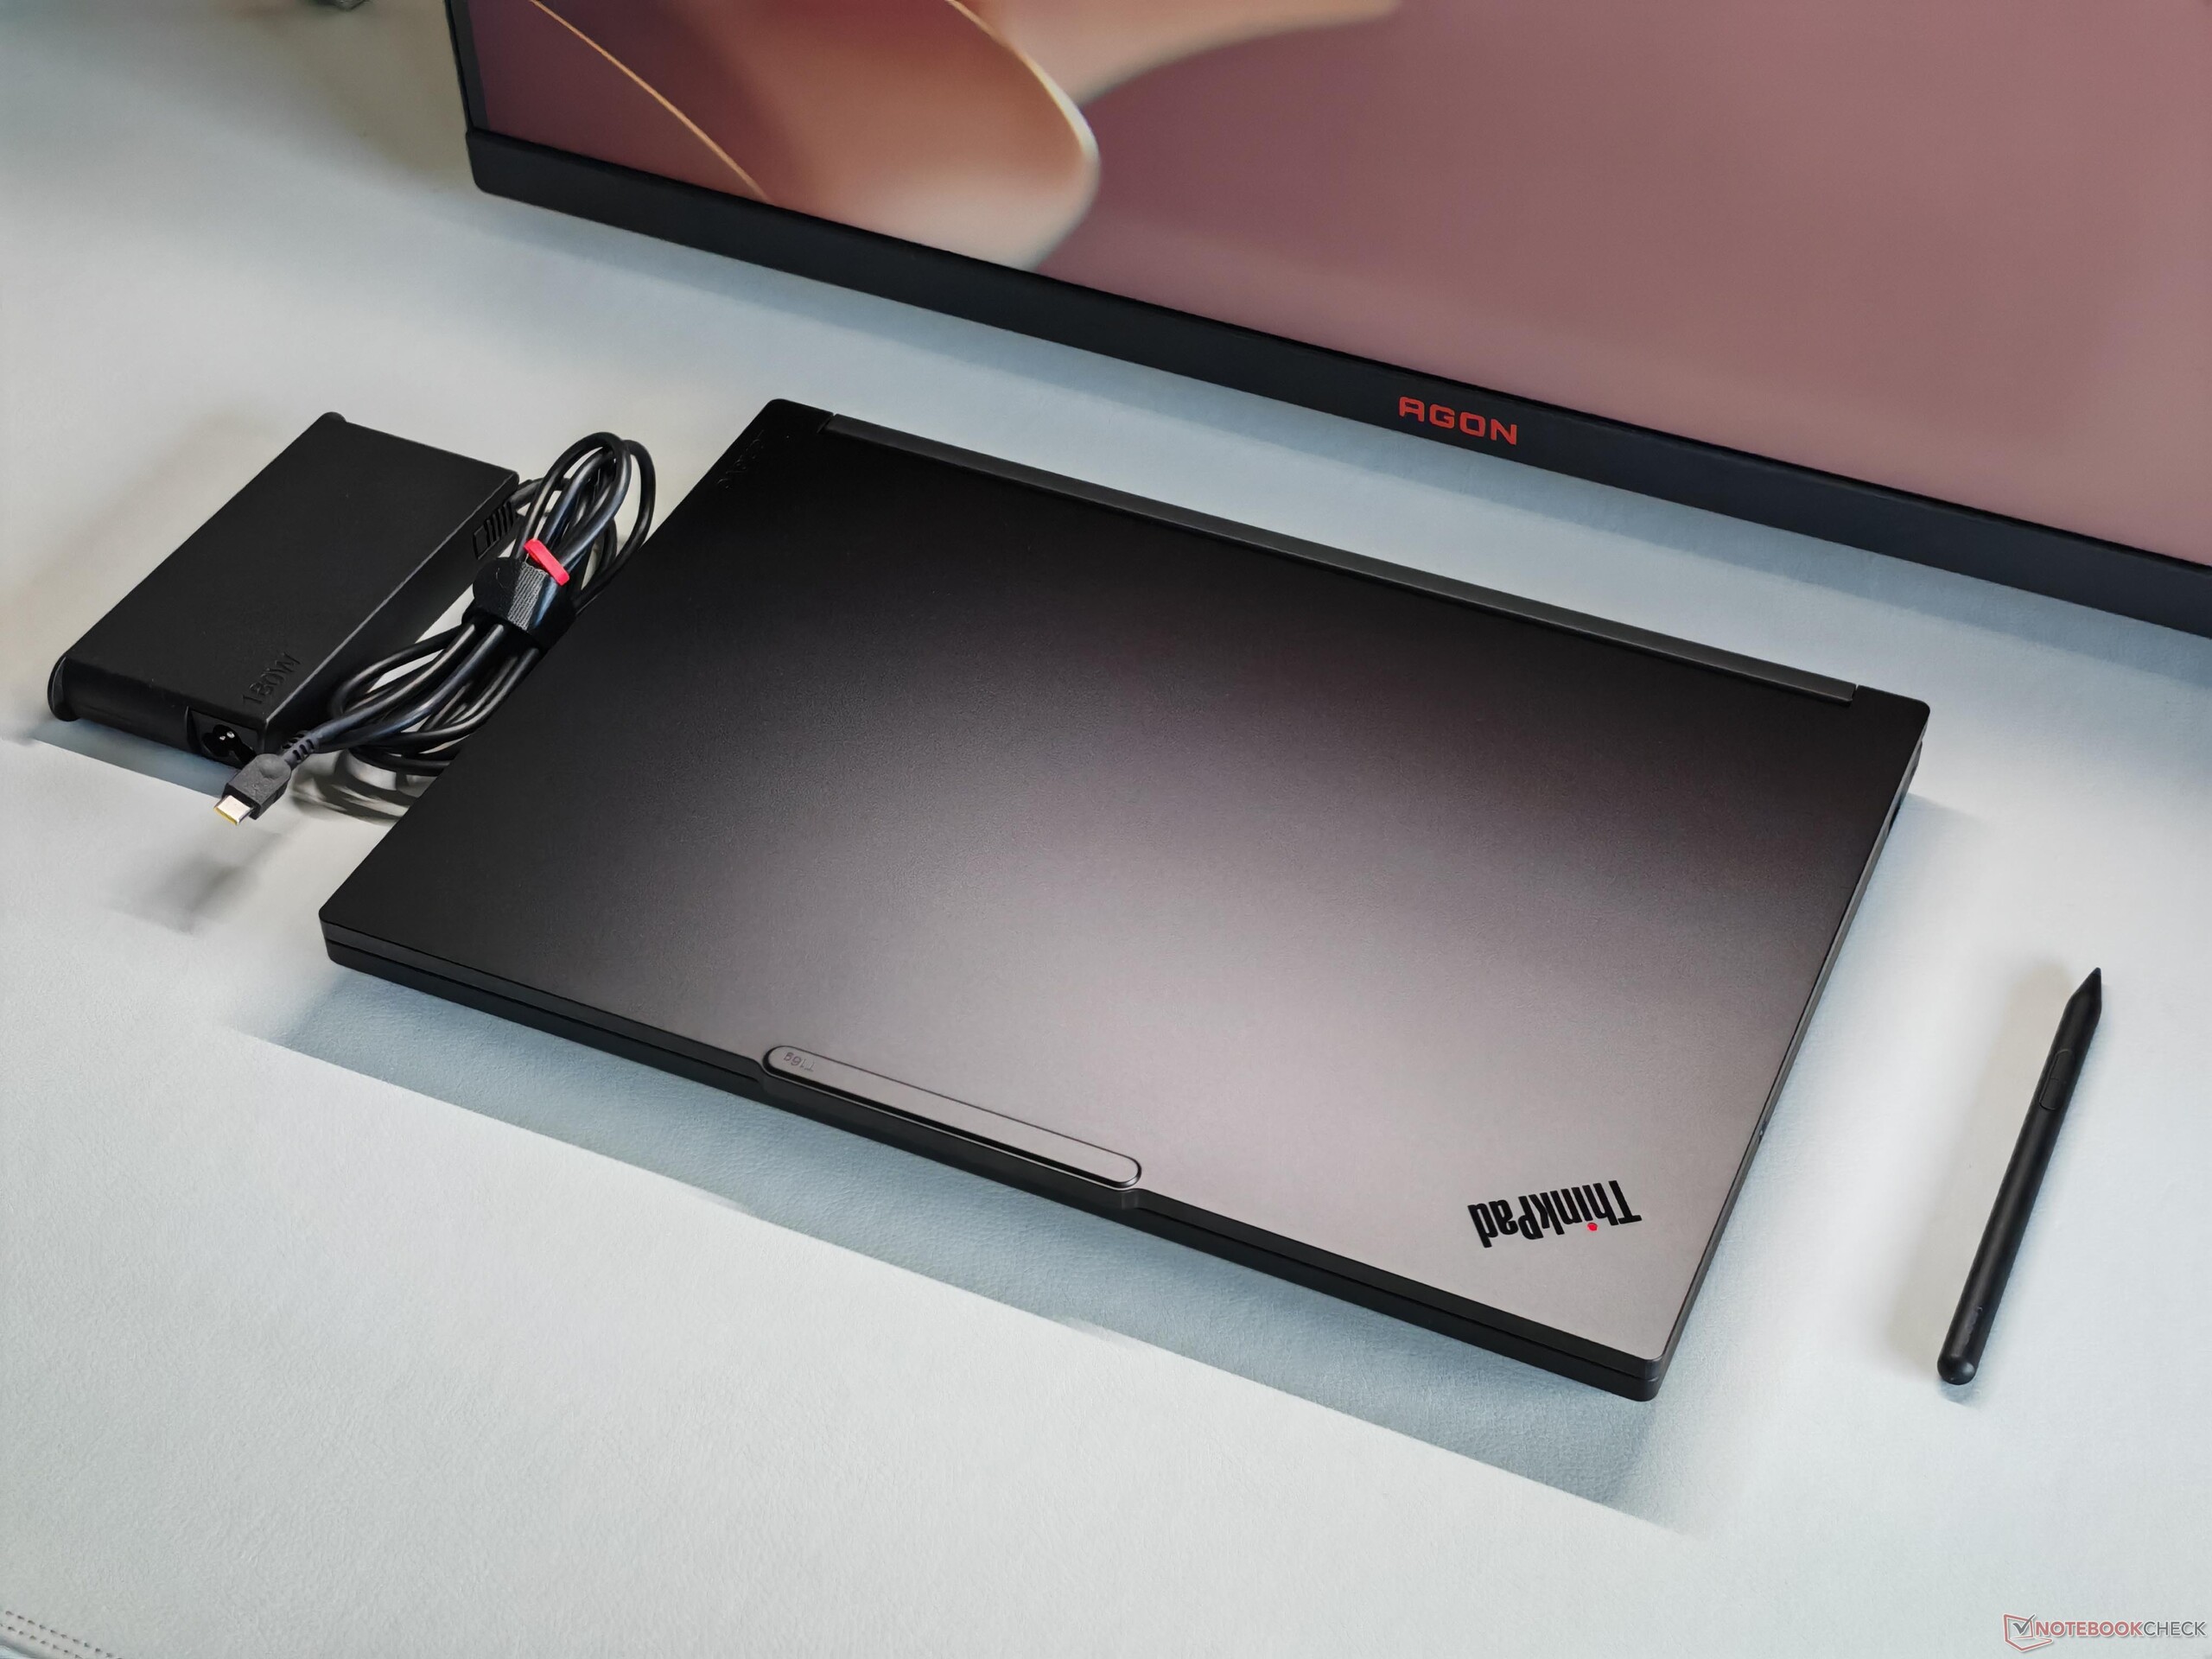
Consumo de energía

Como se describió al principio, la T16g Gen 3 se carga exclusivamente a través de USB-C, y los puertos pueden manejar un máximo de 180 vatios, que es la razón por la que se incluye un adaptador de corriente bastante compacto de 180 vatios. Cuando los componentes están bajo carga (no sólo durante nuestra prueba de estrés), la energía de la batería se extrae regularmente durante un corto período de tiempo, y esto definitivamente no es bueno para la salud de la batería. En los momentos de máxima carga, el HWiNFO muestra un consumo total de energía de más de 280 vatios al inicio de la carga combinada.
| Off / Standby | |
| Ocioso | |
| Carga |
|
Clave:
min: | |
| Lenovo ThinkPad T16g Gen 3 RTX 5080 Ultra 9 275HX, GeForce RTX 5080 Laptop, Samsung PM9E1 MZVLC2T0HBLD, OLED, 3200x2000, 16" | HP ZBook Studio 16 G11 Ultra 9 185H, RTX 3000 Ada Generation Laptop, Kioxia XG8 KXG80ZNV1T02, IPS, 3840x2400, 16" | Dell Pro Max 16 Plus Ultra 9 285HX, RTX PRO 5000 Blackwell Generation Laptop, SK hynix PCB01 HFS001TFM9X186N, OLED, 3840x2400, 16" | Lenovo ThinkPad P16 Gen 2 i7-14700HX, RTX 4000 Ada Generation Laptop, SK hynix PC801 HFS001TEJ9X162N, IPS, 2560x1600, 16" | HP ZBook Fury 16 G11 i9-14900HX, RTX 3500 Ada Generation Laptop, SK hynix PC801 HFS001TEJ9X101N, IPS, 3840x2400, 16" | Schenker XMG Pro 16 (E25) Ultra 9 275HX, GeForce RTX 5070 Ti Laptop, Samsung 9100 Pro 1 TB, IPS, 2560x1600, 16" | Medio NVIDIA GeForce RTX 5080 Laptop | Media de la clase Workstation | |
|---|---|---|---|---|---|---|---|---|
| Power Consumption | -2% | -104% | -15% | -5% | -24% | -57% | 12% | |
| Idle Minimum * (Watt) | 9.9 | 14 -41% | 35.1 -255% | 7.9 20% | 8.6 13% | 11.7 -18% | 19.1 ? -93% | 8.94 ? 10% |
| Idle Average * (Watt) | 17.1 | 22.4 -31% | 39.2 -129% | 13.1 23% | 14.8 13% | 16.6 3% | 25.3 ? -48% | 13.8 ? 19% |
| Idle Maximum * (Watt) | 17.7 | 25.7 -45% | 56 -216% | 24.2 -37% | 15.7 11% | 17.1 3% | 30.4 ? -72% | 17.5 ? 1% |
| Load Average * (Watt) | 125.6 | 90.2 28% | 130.2 -4% | 127.4 -1% | 129.4 -3% | 122.4 3% | 128.5 ? -2% | 95 ? 24% |
| Cyberpunk 2077 ultra external monitor * (Watt) | 166.8 | 120.3 28% | 213 -28% | 219 -31% | 192.6 -15% | 241 -44% | ||
| Cyberpunk 2077 ultra * (Watt) | 160.5 | 125.4 22% | 229 -43% | 225 -40% | 199.4 -24% | 245 -53% | ||
| Load Maximum * (Watt) | 182.8 | 142 22% | 285.2 -56% | 248.5 -36% | 236.1 -29% | 291.5 -59% | 314 ? -72% | 175.2 ? 4% |
* ... más pequeño es mejor
Consumo de energía Cyberpunk / prueba de estrés
Consumo de energía con un monitor externo
Duración de las pilas
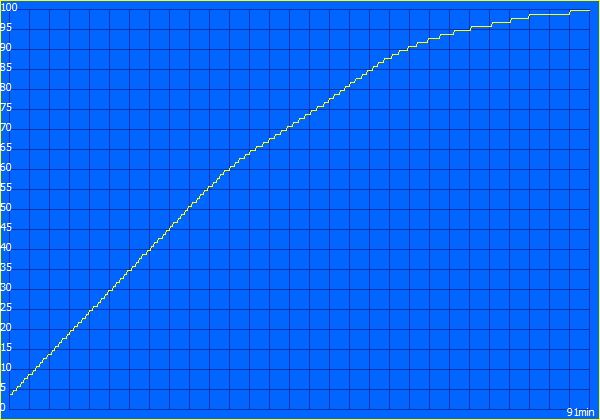
Lenovo ha instalado una batería de 99,9 Wh, y la duración de la batería medida es muy buena para esta clase de dispositivo. En nuestra prueba Wi-Fi a 150 cd/m² y 60 Hz, aguantó unas 9,5 horas, e incluso con el brillo al máximo, aguantó un total de 6 horas.
Valoración general de Notebookcheck
Lenovo ThinkPad T16g Gen 3 RTX 5080
- 02/04/2026 v8
Andreas Osthoff
 Total Sustainability Score:
 Posibles alternativas comparadas
Imagen | Modelo | Precio | Peso | Altura | Pantalla |
|---|---|---|---|---|---|
1. 87.3%  | Lenovo ThinkPad T16g Gen 3 RTX 5080 Intel Core Ultra 9 275HX ⎘ NVIDIA GeForce RTX 5080 Laptop ⎘ 64 GB Memoría, 2048 GB SSD | Amazon: 1. $1,999.00 Lenovo ThinkPad E16 Gen 3 La... 2. $1,349.99 Lenovo ThinkPad E16 Gen 3 Bu... 3. $909.99 Lenovo ThinkPad E16 Gen 3 Bu... Precio de catálogo: 4800€ | 2.6 kg | 29.8 mm | 16.00" 3200x2000 236 PPI OLED |
2. 84.2%  | HP ZBook Studio 16 G11 Intel Core Ultra 9 185H ⎘ NVIDIA RTX 3000 Ada Generation Laptop ⎘ 64 GB Memoría, 1024 GB SSD | Amazon: Precio de catálogo: 4300 USD | 1.8 kg | 19 mm | 16.00" 3840x2400 283 PPI IPS |
3. 88.4%  | Dell Pro Max 16 Plus Intel Core Ultra 9 285HX ⎘ NVIDIA RTX PRO 5000 Blackwell Generation Laptop ⎘ 128 GB Memoría, SSD | Amazon: Precio de catálogo: 5000 USD | 2.8 kg | 30.9 mm | 16.00" 3840x2400 283 PPI OLED |
4. 85.9%  | Lenovo ThinkPad P16 Gen 2 Intel Core i7-14700HX ⎘ NVIDIA RTX 4000 Ada Generation Laptop ⎘ 32 GB Memoría, 1024 GB SSD | Amazon: Precio de catálogo: 3500 USD | 3.1 kg | 30.23 mm | 16.00" 2560x1600 189 PPI IPS |
5. 85.9%  | HP ZBook Fury 16 G11 Intel Core i9-14900HX ⎘ NVIDIA RTX 3500 Ada Generation Laptop ⎘ 64 GB Memoría, 1024 GB SSD | Amazon: Precio de catálogo: 3300 USD | 2.6 kg | 28.5 mm | 16.00" 3840x2400 283 PPI IPS |
6. 87.4%  | Schenker XMG Pro 16 (E25) Intel Core Ultra 9 275HX ⎘ NVIDIA GeForce RTX 5070 Ti Laptop ⎘ 32 GB Memoría, 1024 GB SSD | Amazon: 1. $22.78 Very Best of Michael Schenke... Precio de catálogo: 2480€ | 2.5 kg | 26.5 mm | 16.00" 2560x1600 189 PPI IPS |
Transparencia
La selección de los dispositivos que se van a reseñar corre a cargo de nuestro equipo editorial. La muestra de prueba fue proporcionada al autor en calidad de préstamo por el fabricante o el minorista a los efectos de esta reseña. El prestamista no tuvo ninguna influencia en esta reseña, ni el fabricante recibió una copia de la misma antes de su publicación. No había ninguna obligación de publicar esta reseña. Como empresa de medios independiente, Notebookcheck no está sujeta a la autoridad de fabricantes, minoristas o editores.
Así es como prueba Notebookcheck
Cada año, Notebookcheck revisa de forma independiente cientos de portátiles y smartphones utilizando procedimientos estandarizados para asegurar que todos los resultados son comparables. Hemos desarrollado continuamente nuestros métodos de prueba durante unos 20 años y hemos establecido los estándares de la industria en el proceso. En nuestros laboratorios de pruebas, técnicos y editores experimentados utilizan equipos de medición de alta calidad. Estas pruebas implican un proceso de validación en varias fases. Nuestro complejo sistema de clasificación se basa en cientos de mediciones y puntos de referencia bien fundamentados, lo que mantiene la objetividad.
