
Veredicto - El ThinkPad P16v Gen 3 es una buena estación de trabajo móvil
En la prueba, el ThinkPad P16v Gen 3 resulta bastante convincente como estación de trabajo móvil y recibe una buena calificación general. Además de la larga duración de la batería, ofrece un buen rendimiento del sistema, numerosas conexiones y muy buenas opciones de mantenimiento. El TouchPad y las teclas TrackPoint son de muy alta calidad, pero el teclado es sólo mediocre y definitivamente hay margen de mejora aquí (especialmente en comparación con el ThinkPad P1 16 Gen 8).
La clasificación como estación de trabajo relativamente asequible se aprecia sobre todo en la carcasa, ya que aquí sólo se utiliza plástico y también hay puntos criticables en cuanto a la estabilidad (especialmente la zona central del teclado) y las bisagras (balanceo notable). Sólo hay disponibles paneles de 60 Hz para las pantallas (incluidas las OLED), mientras que el modelo IPS estándar hace un trabajo razonable con más de 500 cd/m² de brillo, colores precisos y cobertura sRGB completa.
Nos hubiera gustado un poco más de rendimiento, especialmente de la tarjeta gráfica. La Nvidia RTX PRO 2000 (Blackwell, comparable a la GeForce RTX 5060) sólo funciona con un máximo de 60 vatios y está, por tanto, muy lejos del máximo de 115 vatios (proporcionaría alrededor de un 30% más de rendimiento). En vista de la gran carcasa de 16 pulgadas, esto es relativamente débil.
Pro
Contra
Precio y disponibilidad
El dispositivo de prueba está disponible en nuestro préstamo Campuspoint por 2.825 euros (~3277 dólares)(o 2.529 euros/~2933 dólares en el programa Campus) y el P16v G3 puede configurarse en Lenovo a partir de 2.469 euros (~2864 dólares).
Índice
- Veredicto - El ThinkPad P16v Gen 3 es una buena estación de trabajo móvil
- Especificaciones
- Maletín y equipamiento
- Dispositivos de entrada - Teclado medio
- Pantalla - IPS con 500 cd/m
- Rendimiento - Arrow Lake y RTX PRO 2000
- Emisiones y energía
- Valoración general de Notebookcheck
- Posibles alternativas en comparación
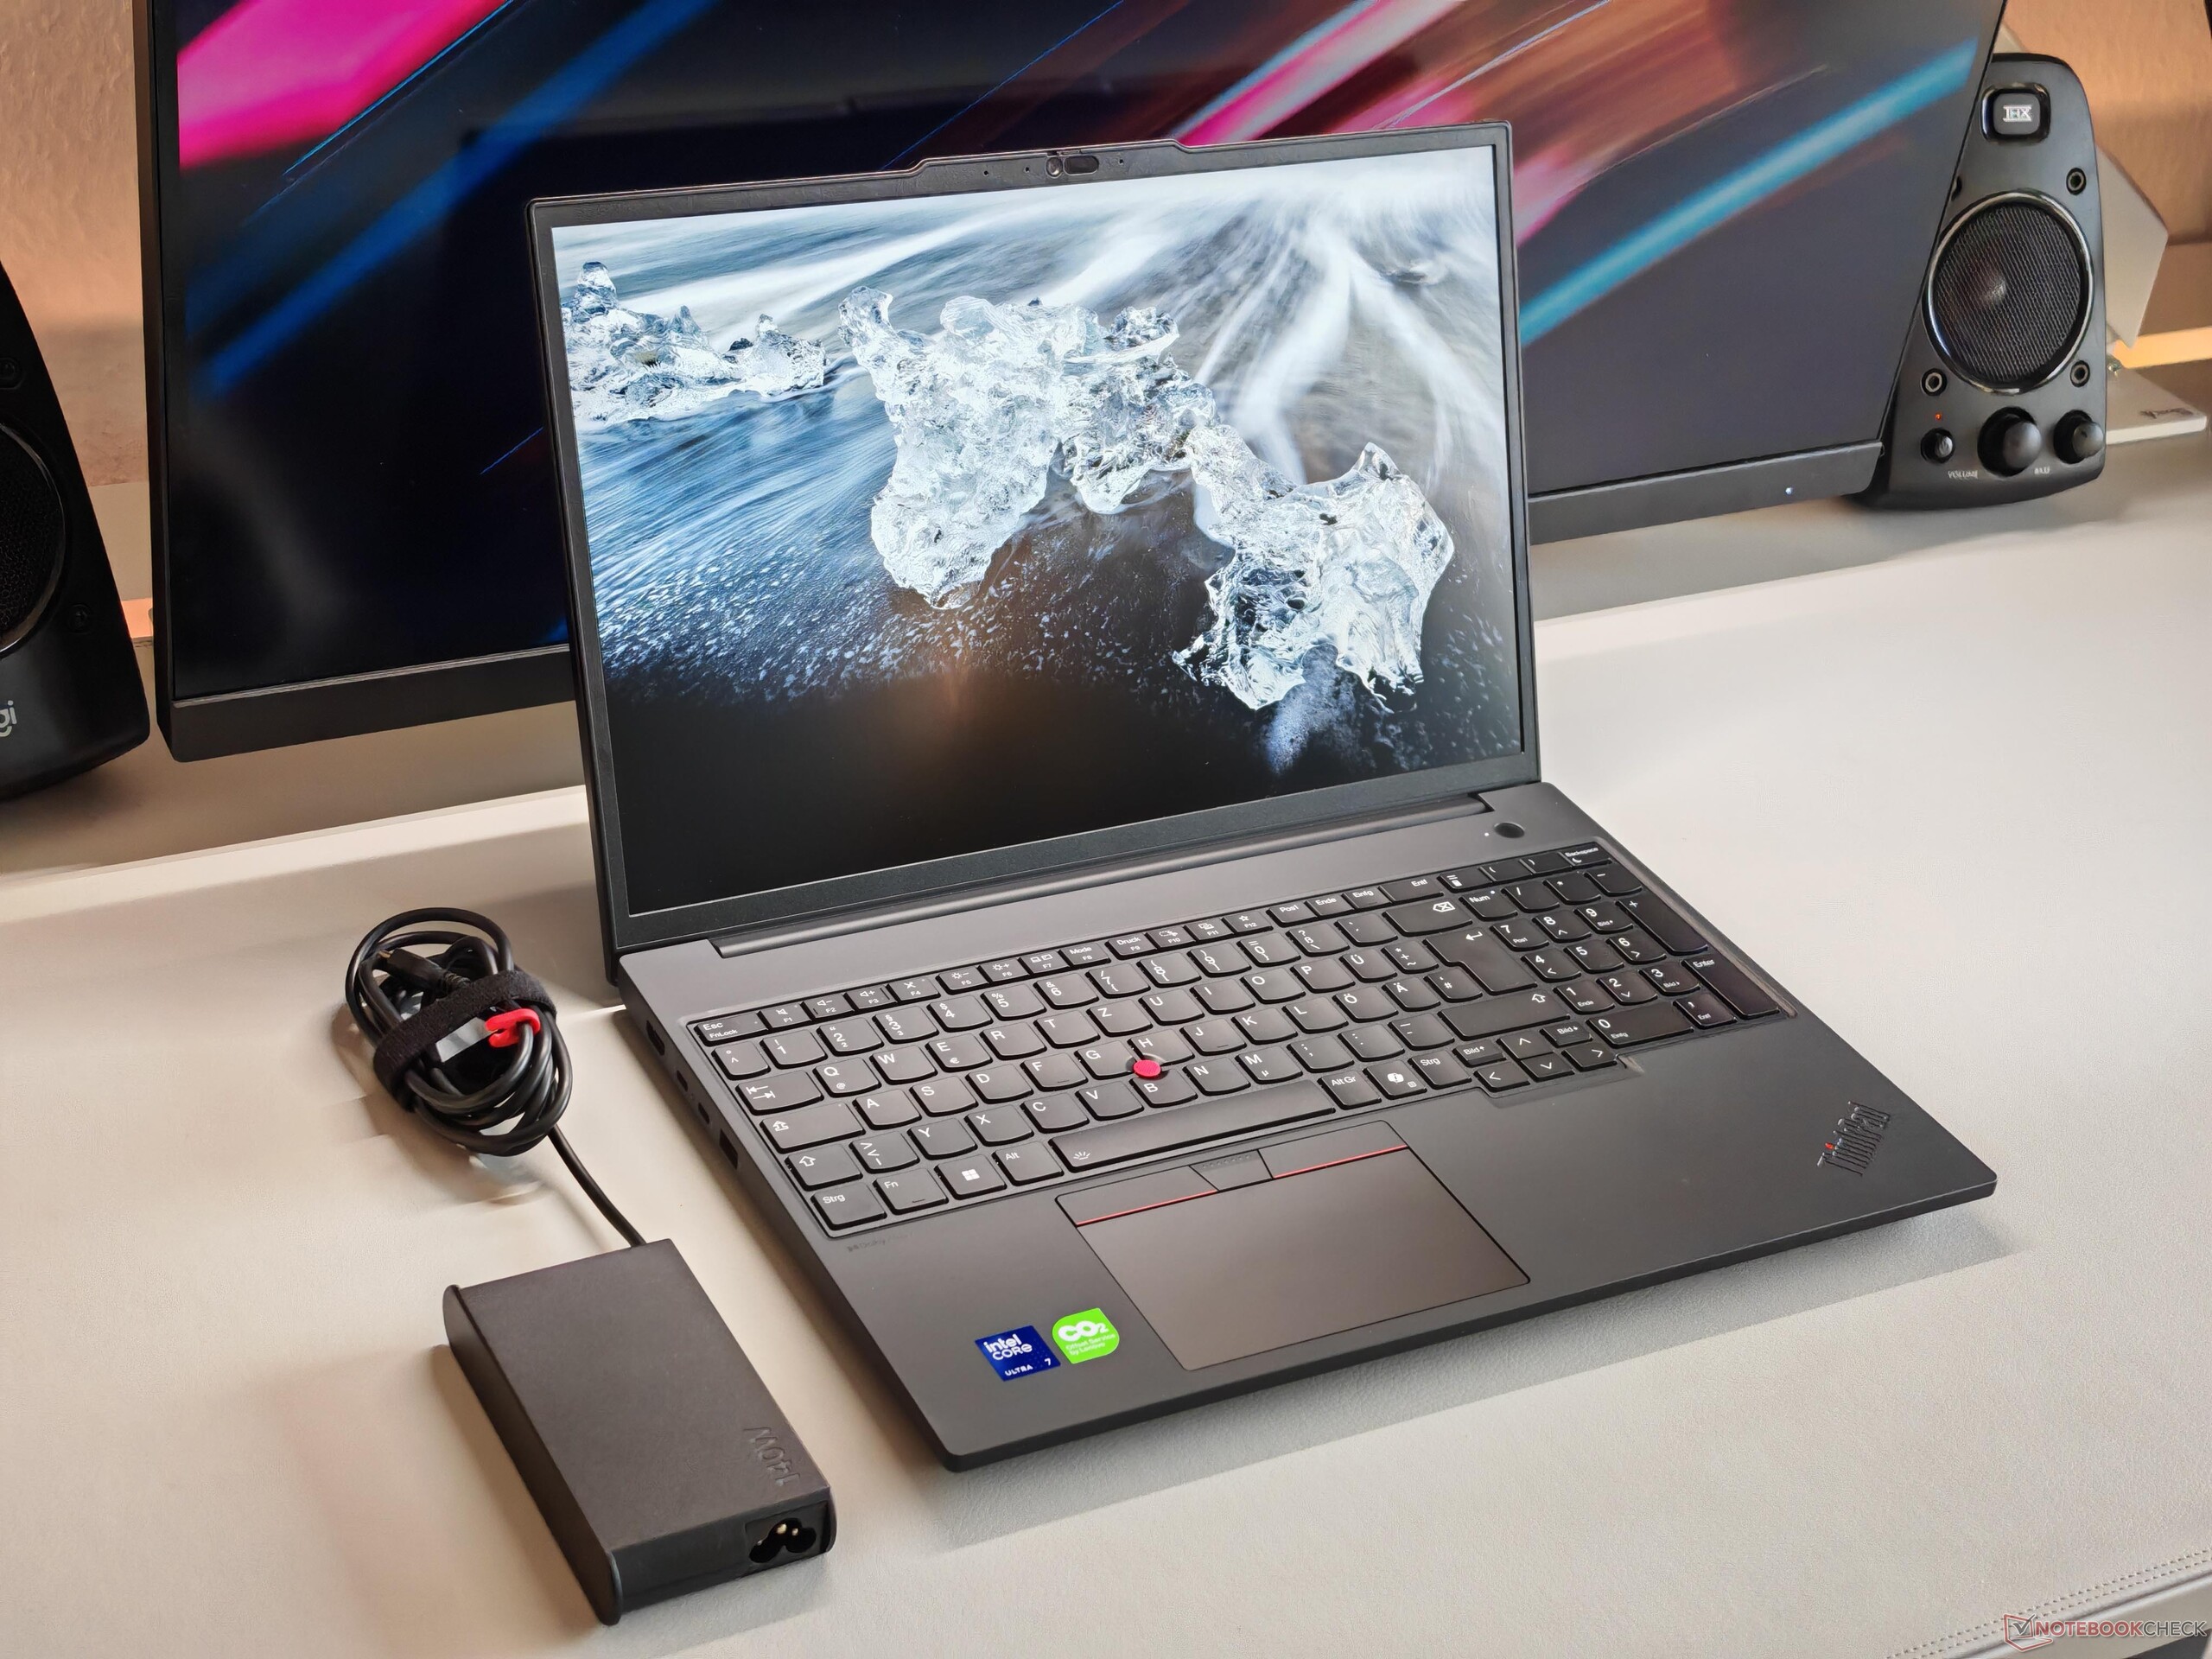
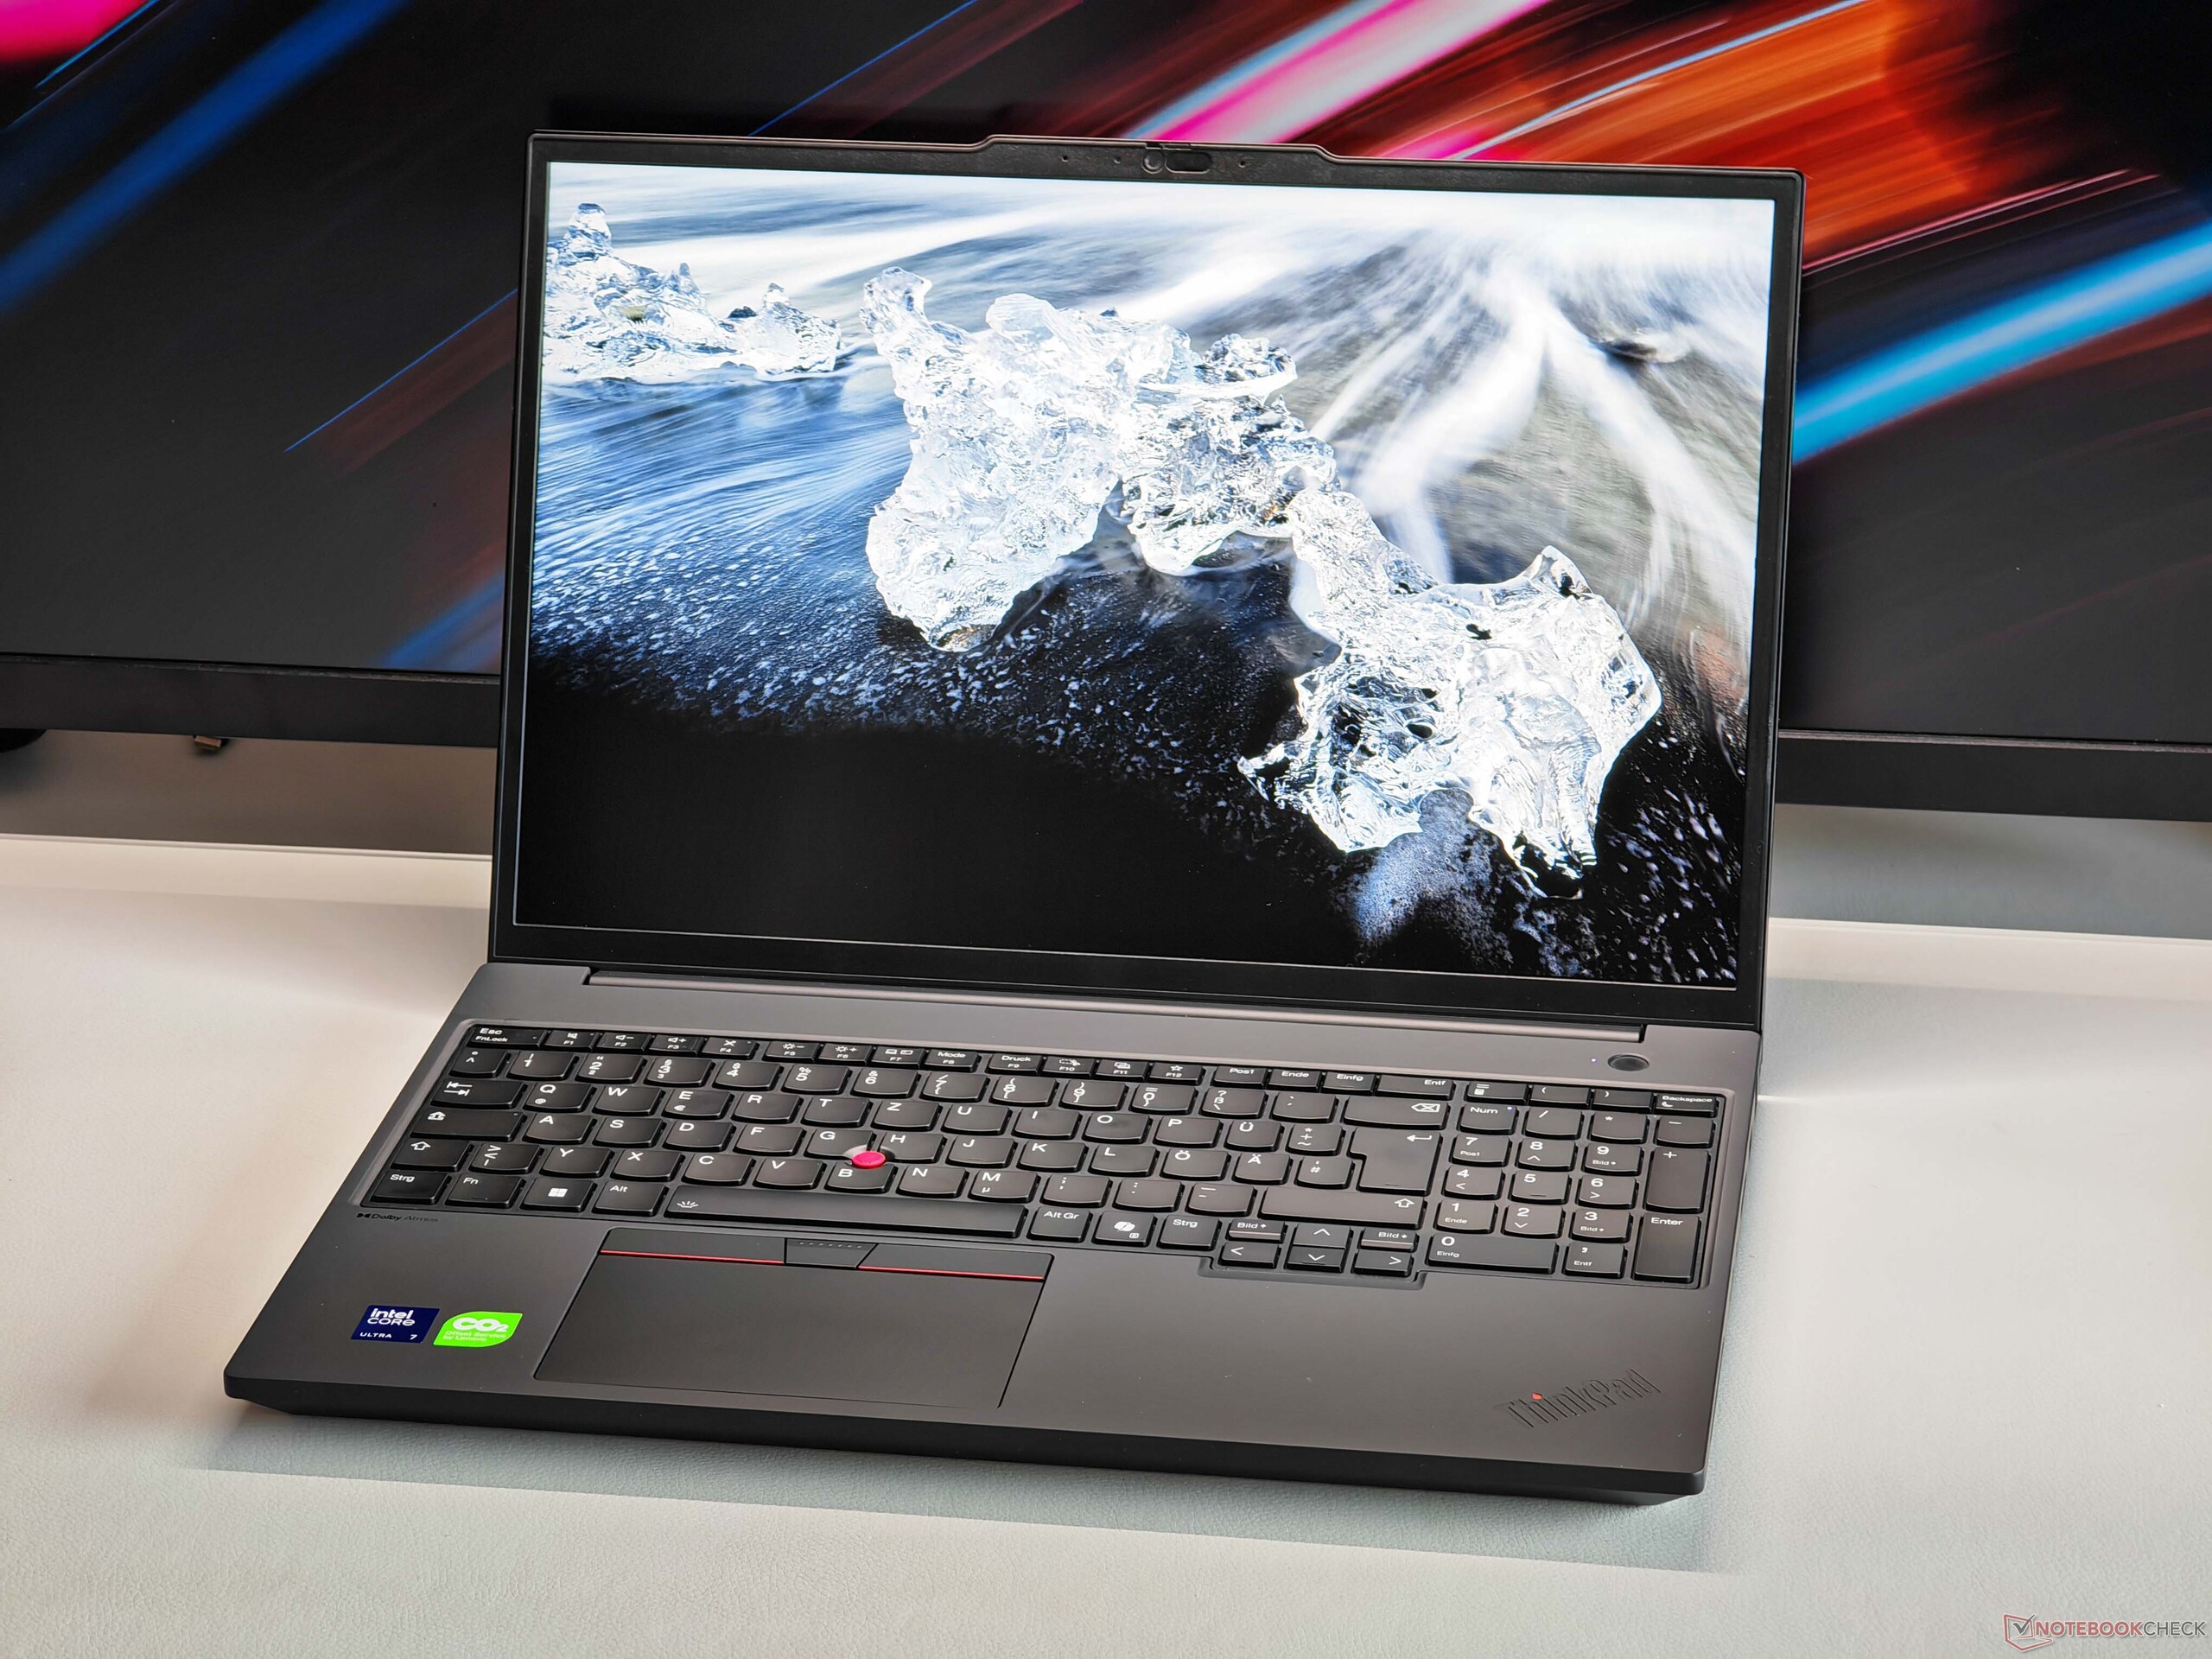
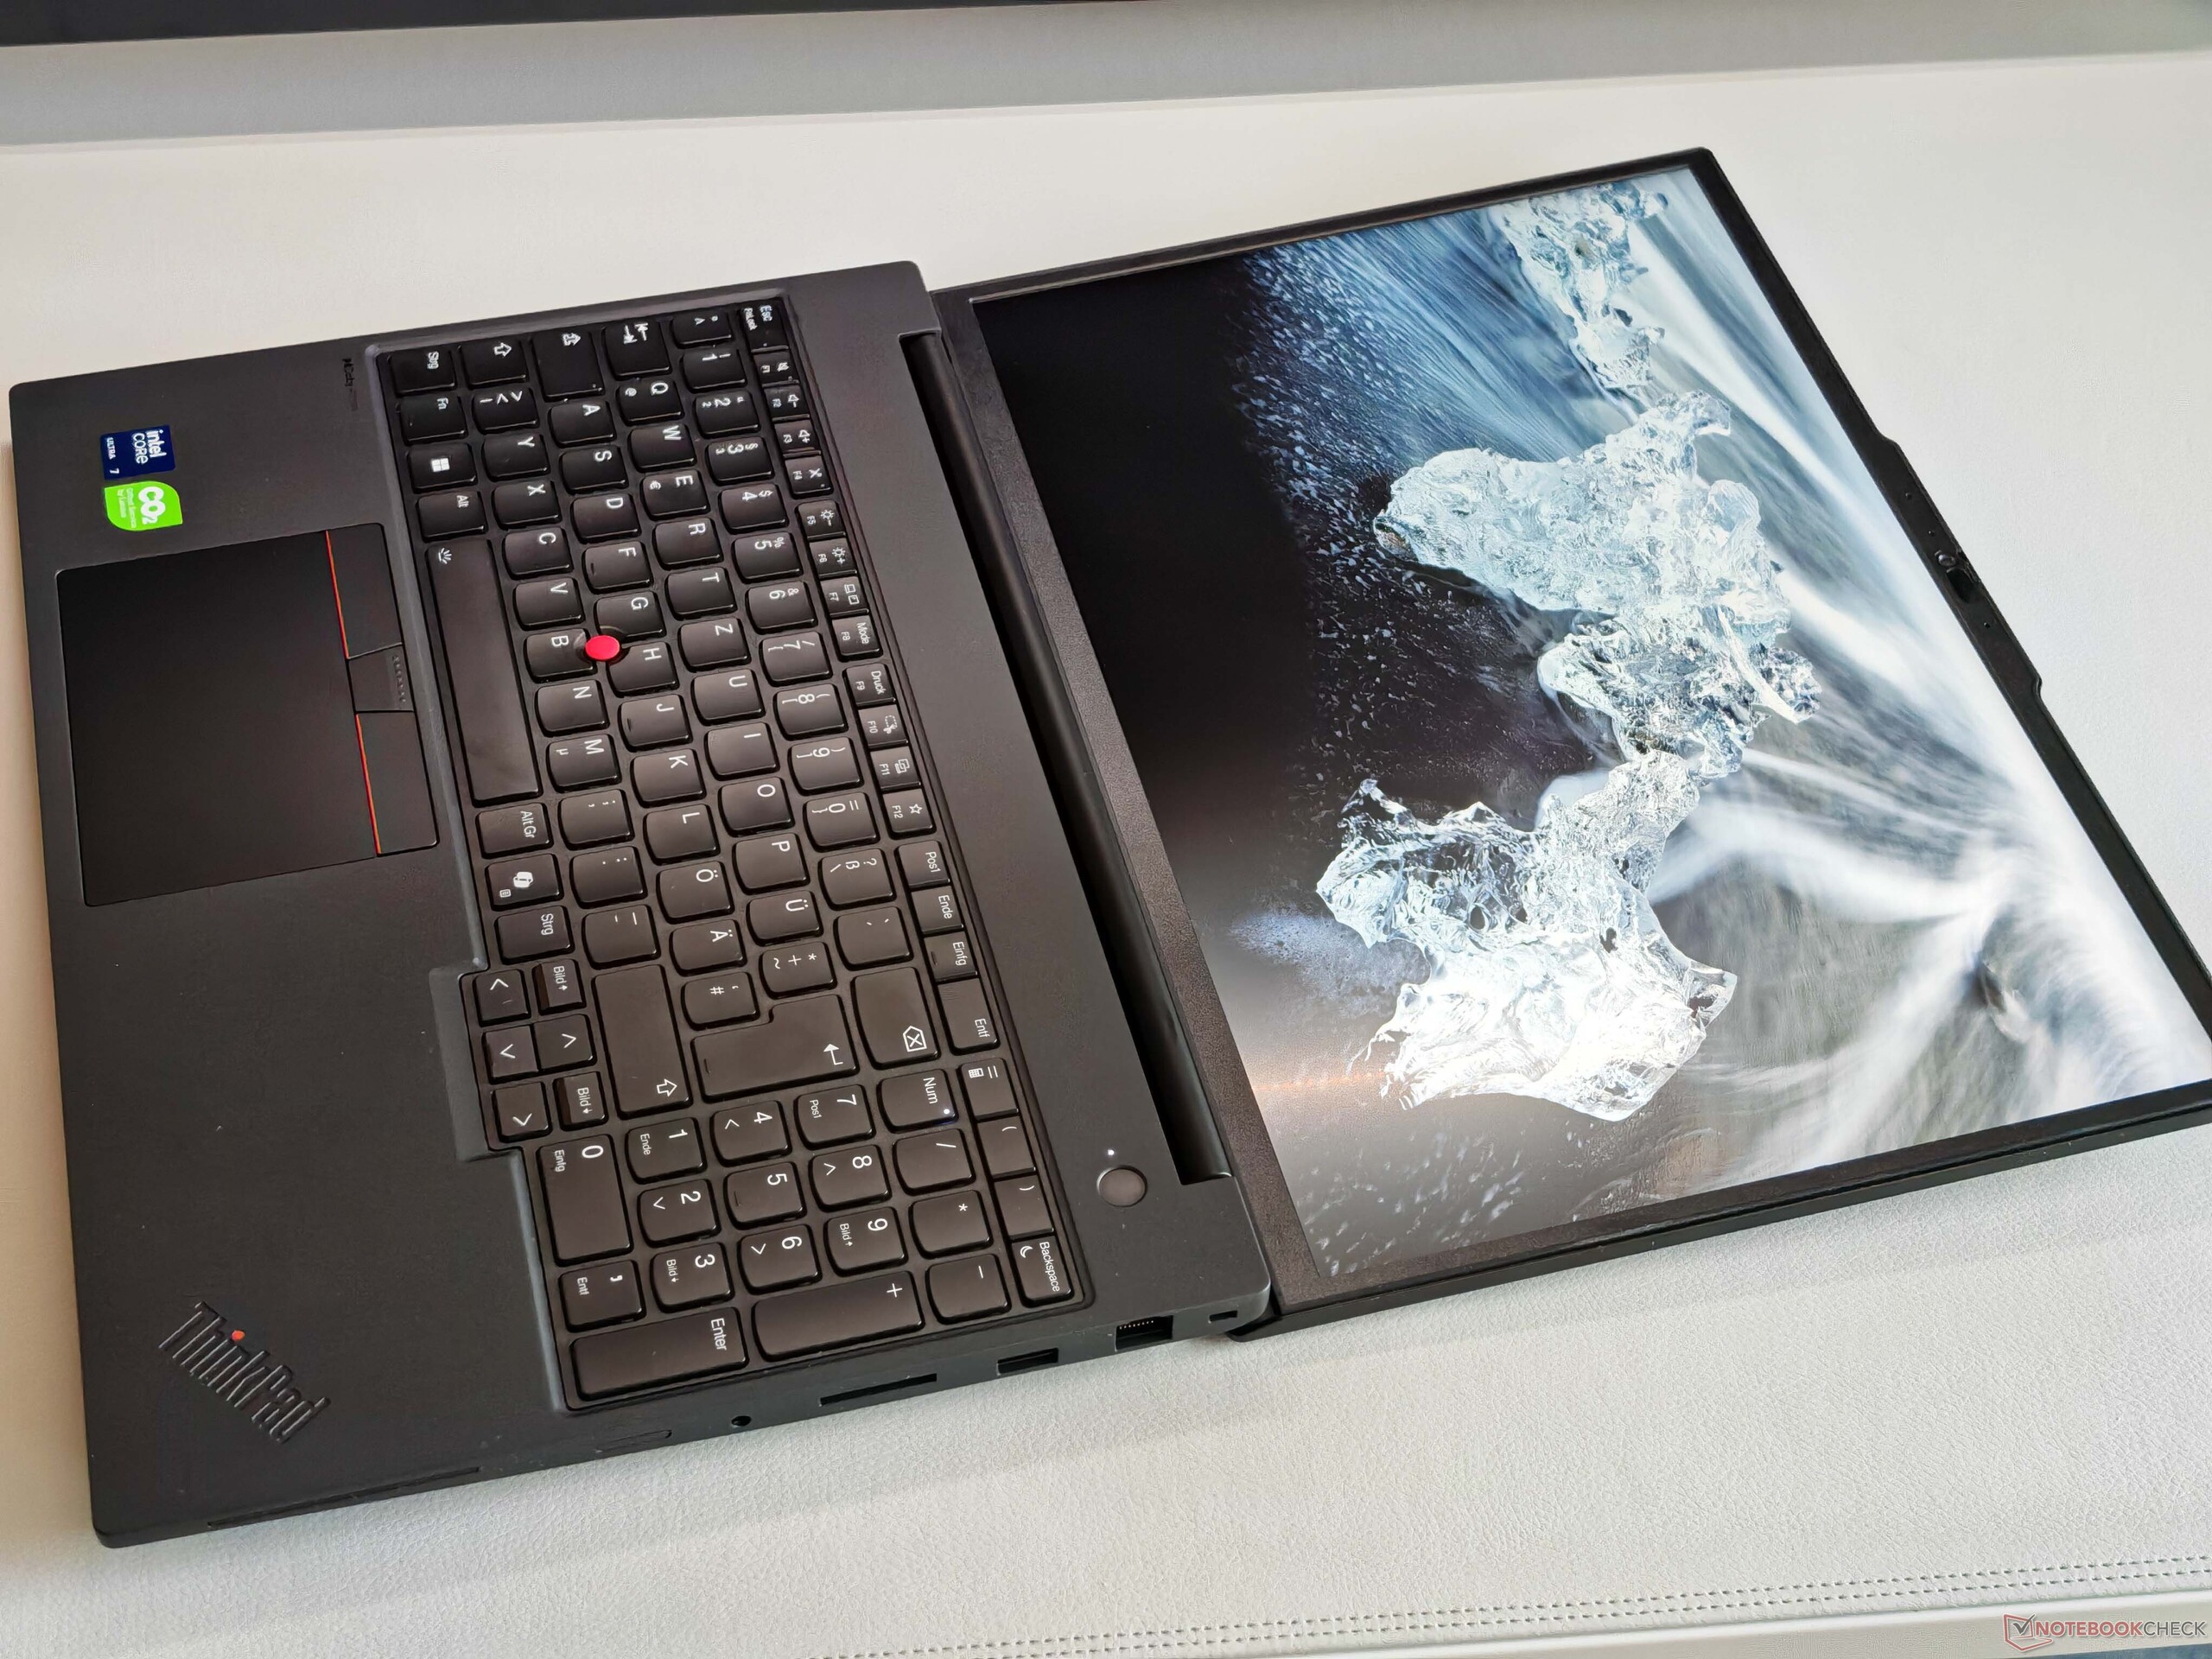
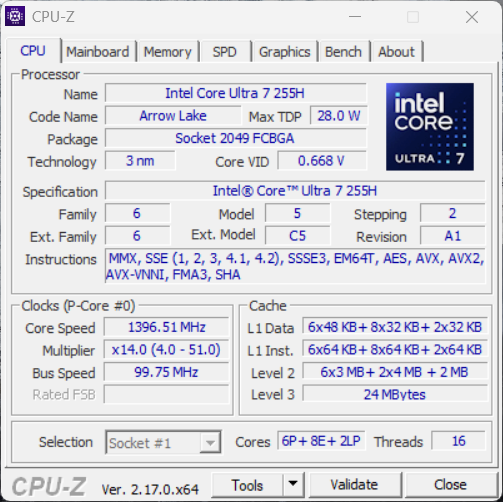
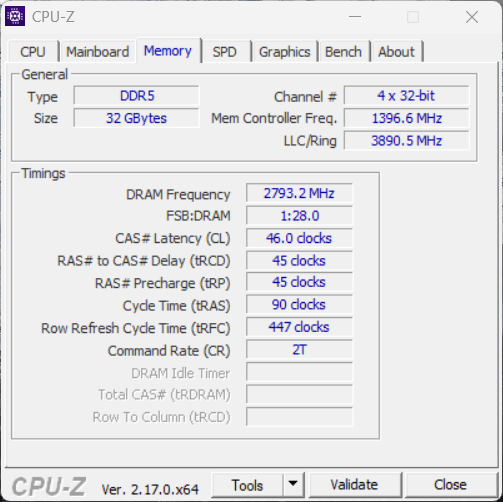
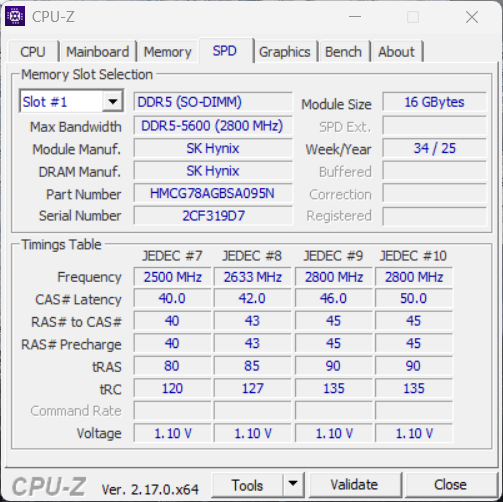
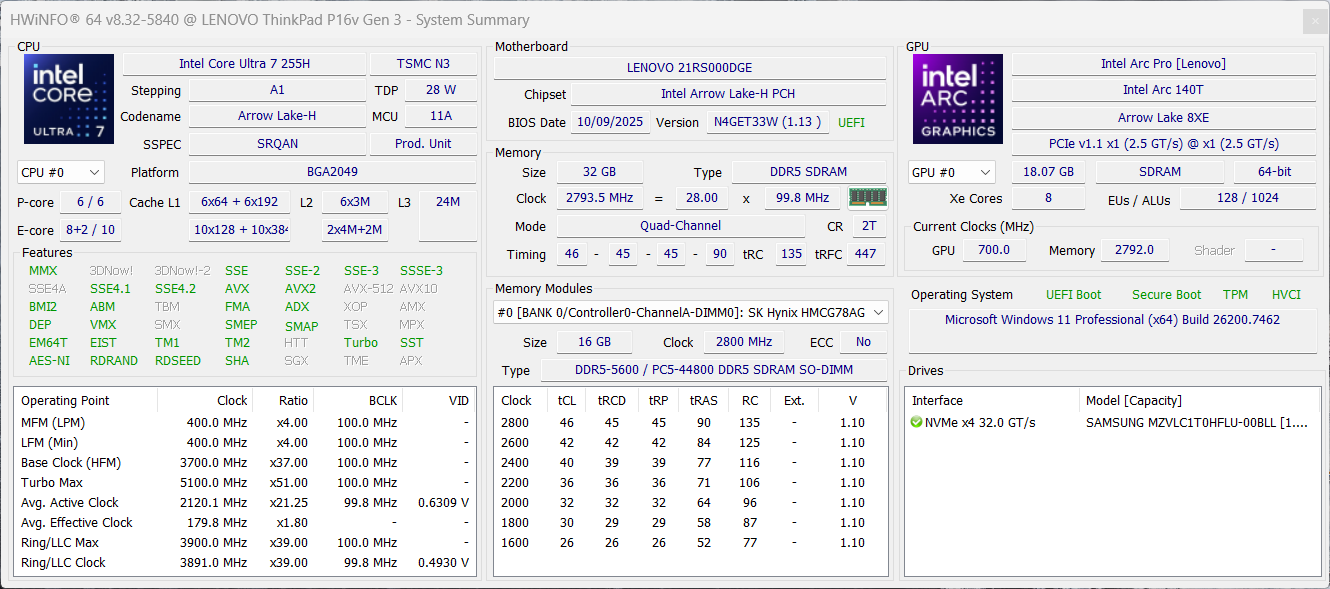
El ThinkPad P16v Gen3 es el modelo básico actual de Lenovo en lo que se refiere a estaciones de trabajo portátiles completas. Probamos el modelo 21RS000DGE con el Core Ultra 7 255H32 GB de RAM, la Nvidia RTX PRO 2000, una unidad SSD de 1 TB y la pantalla Full HD con un brillo de 500 cd/m² por 2.825 euros (~3277 dólares).
Especificaciones
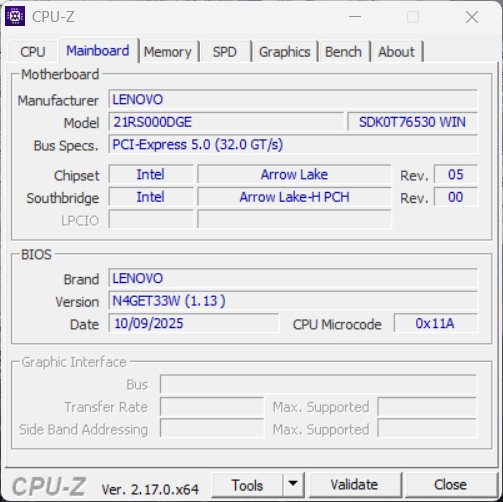
Maletín y equipamiento
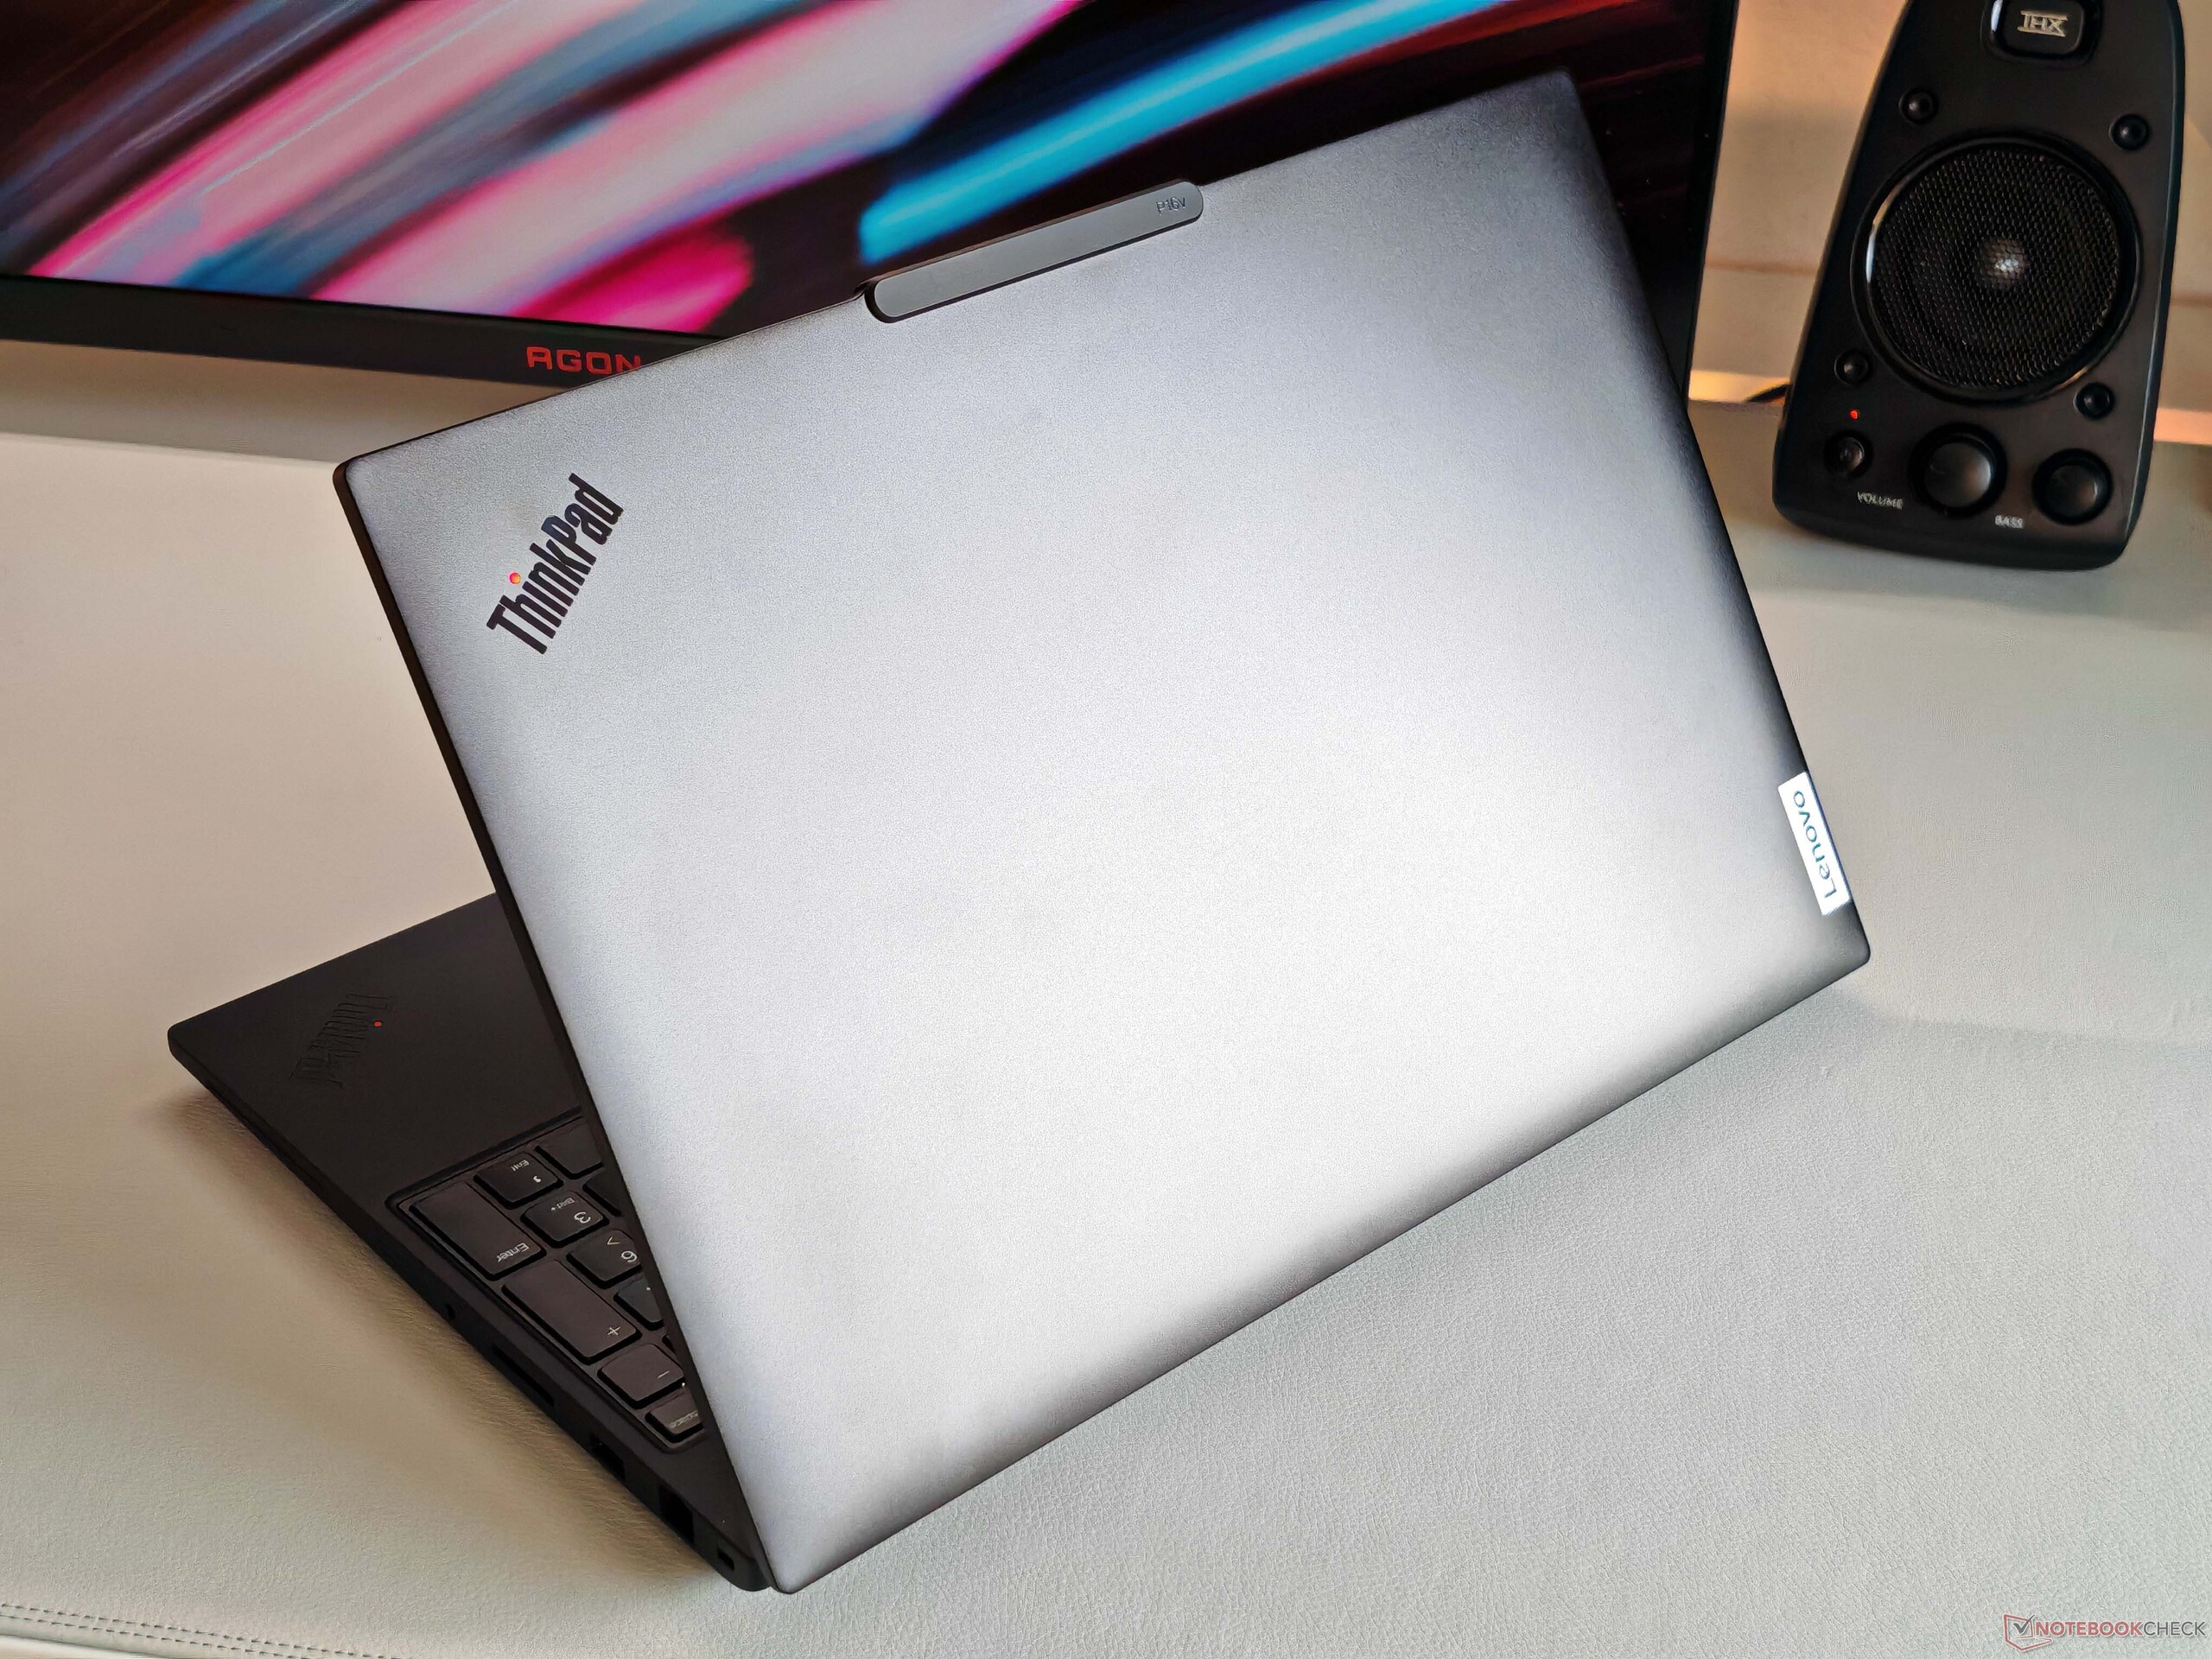
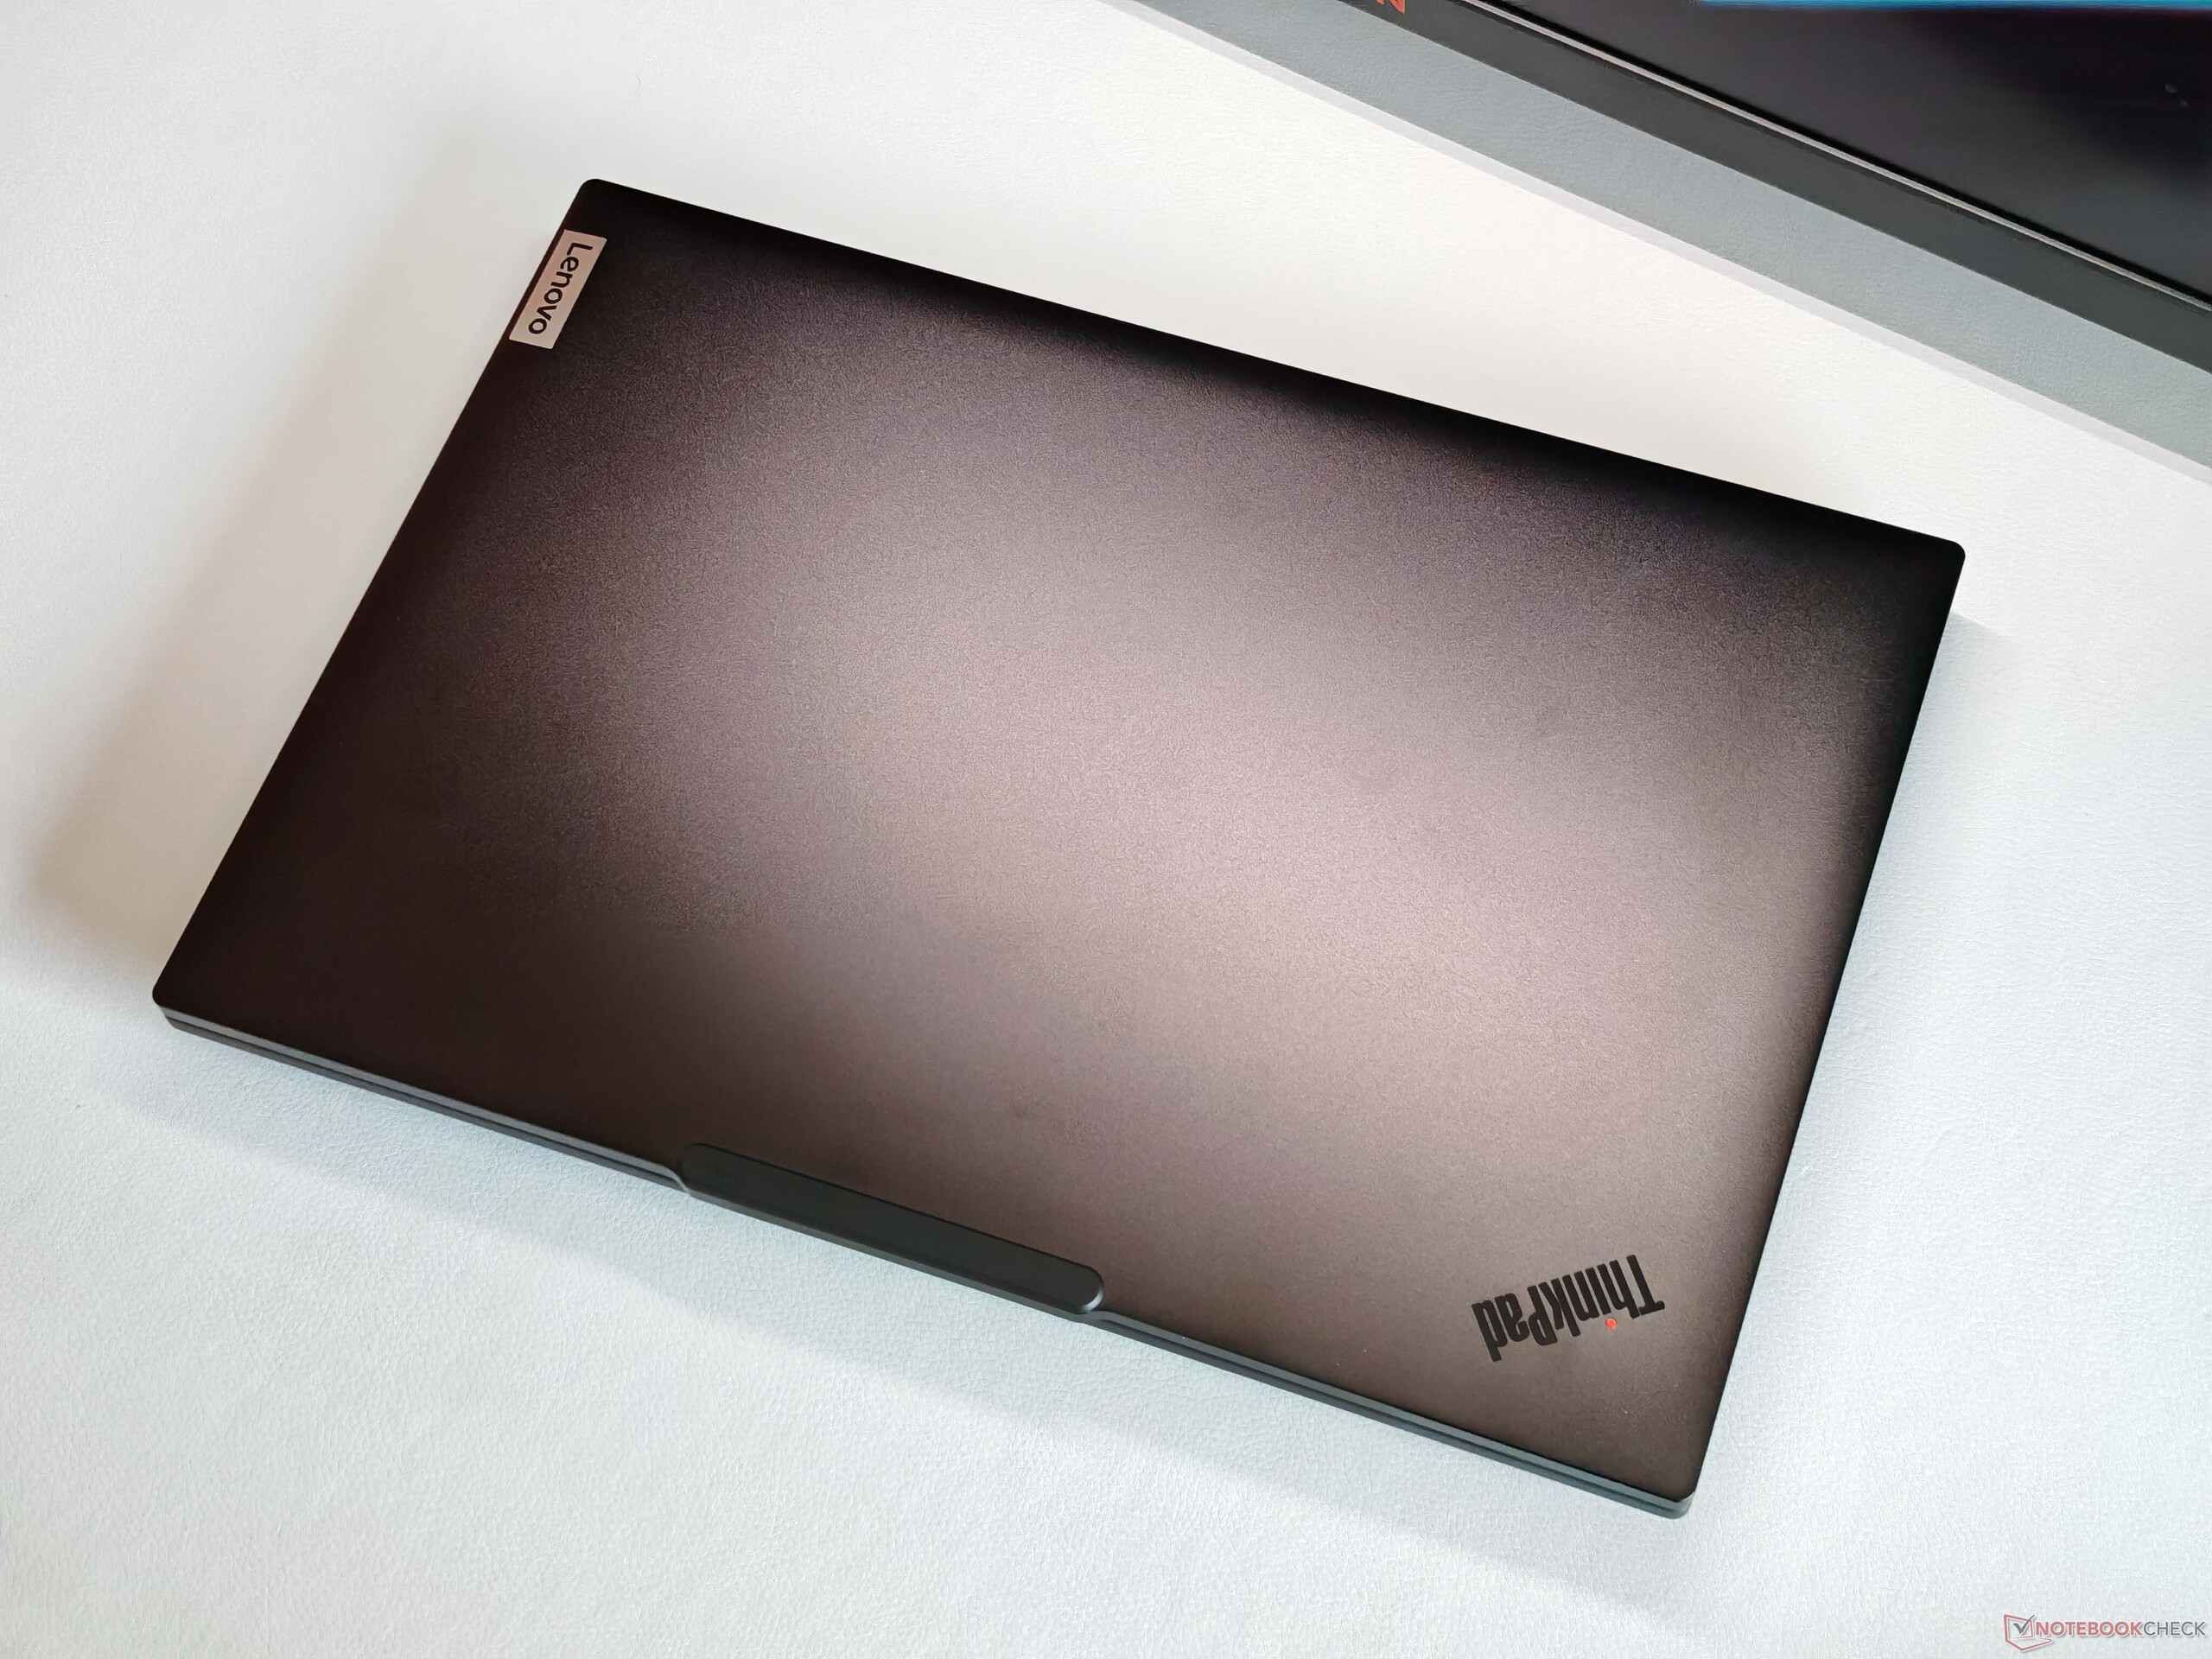
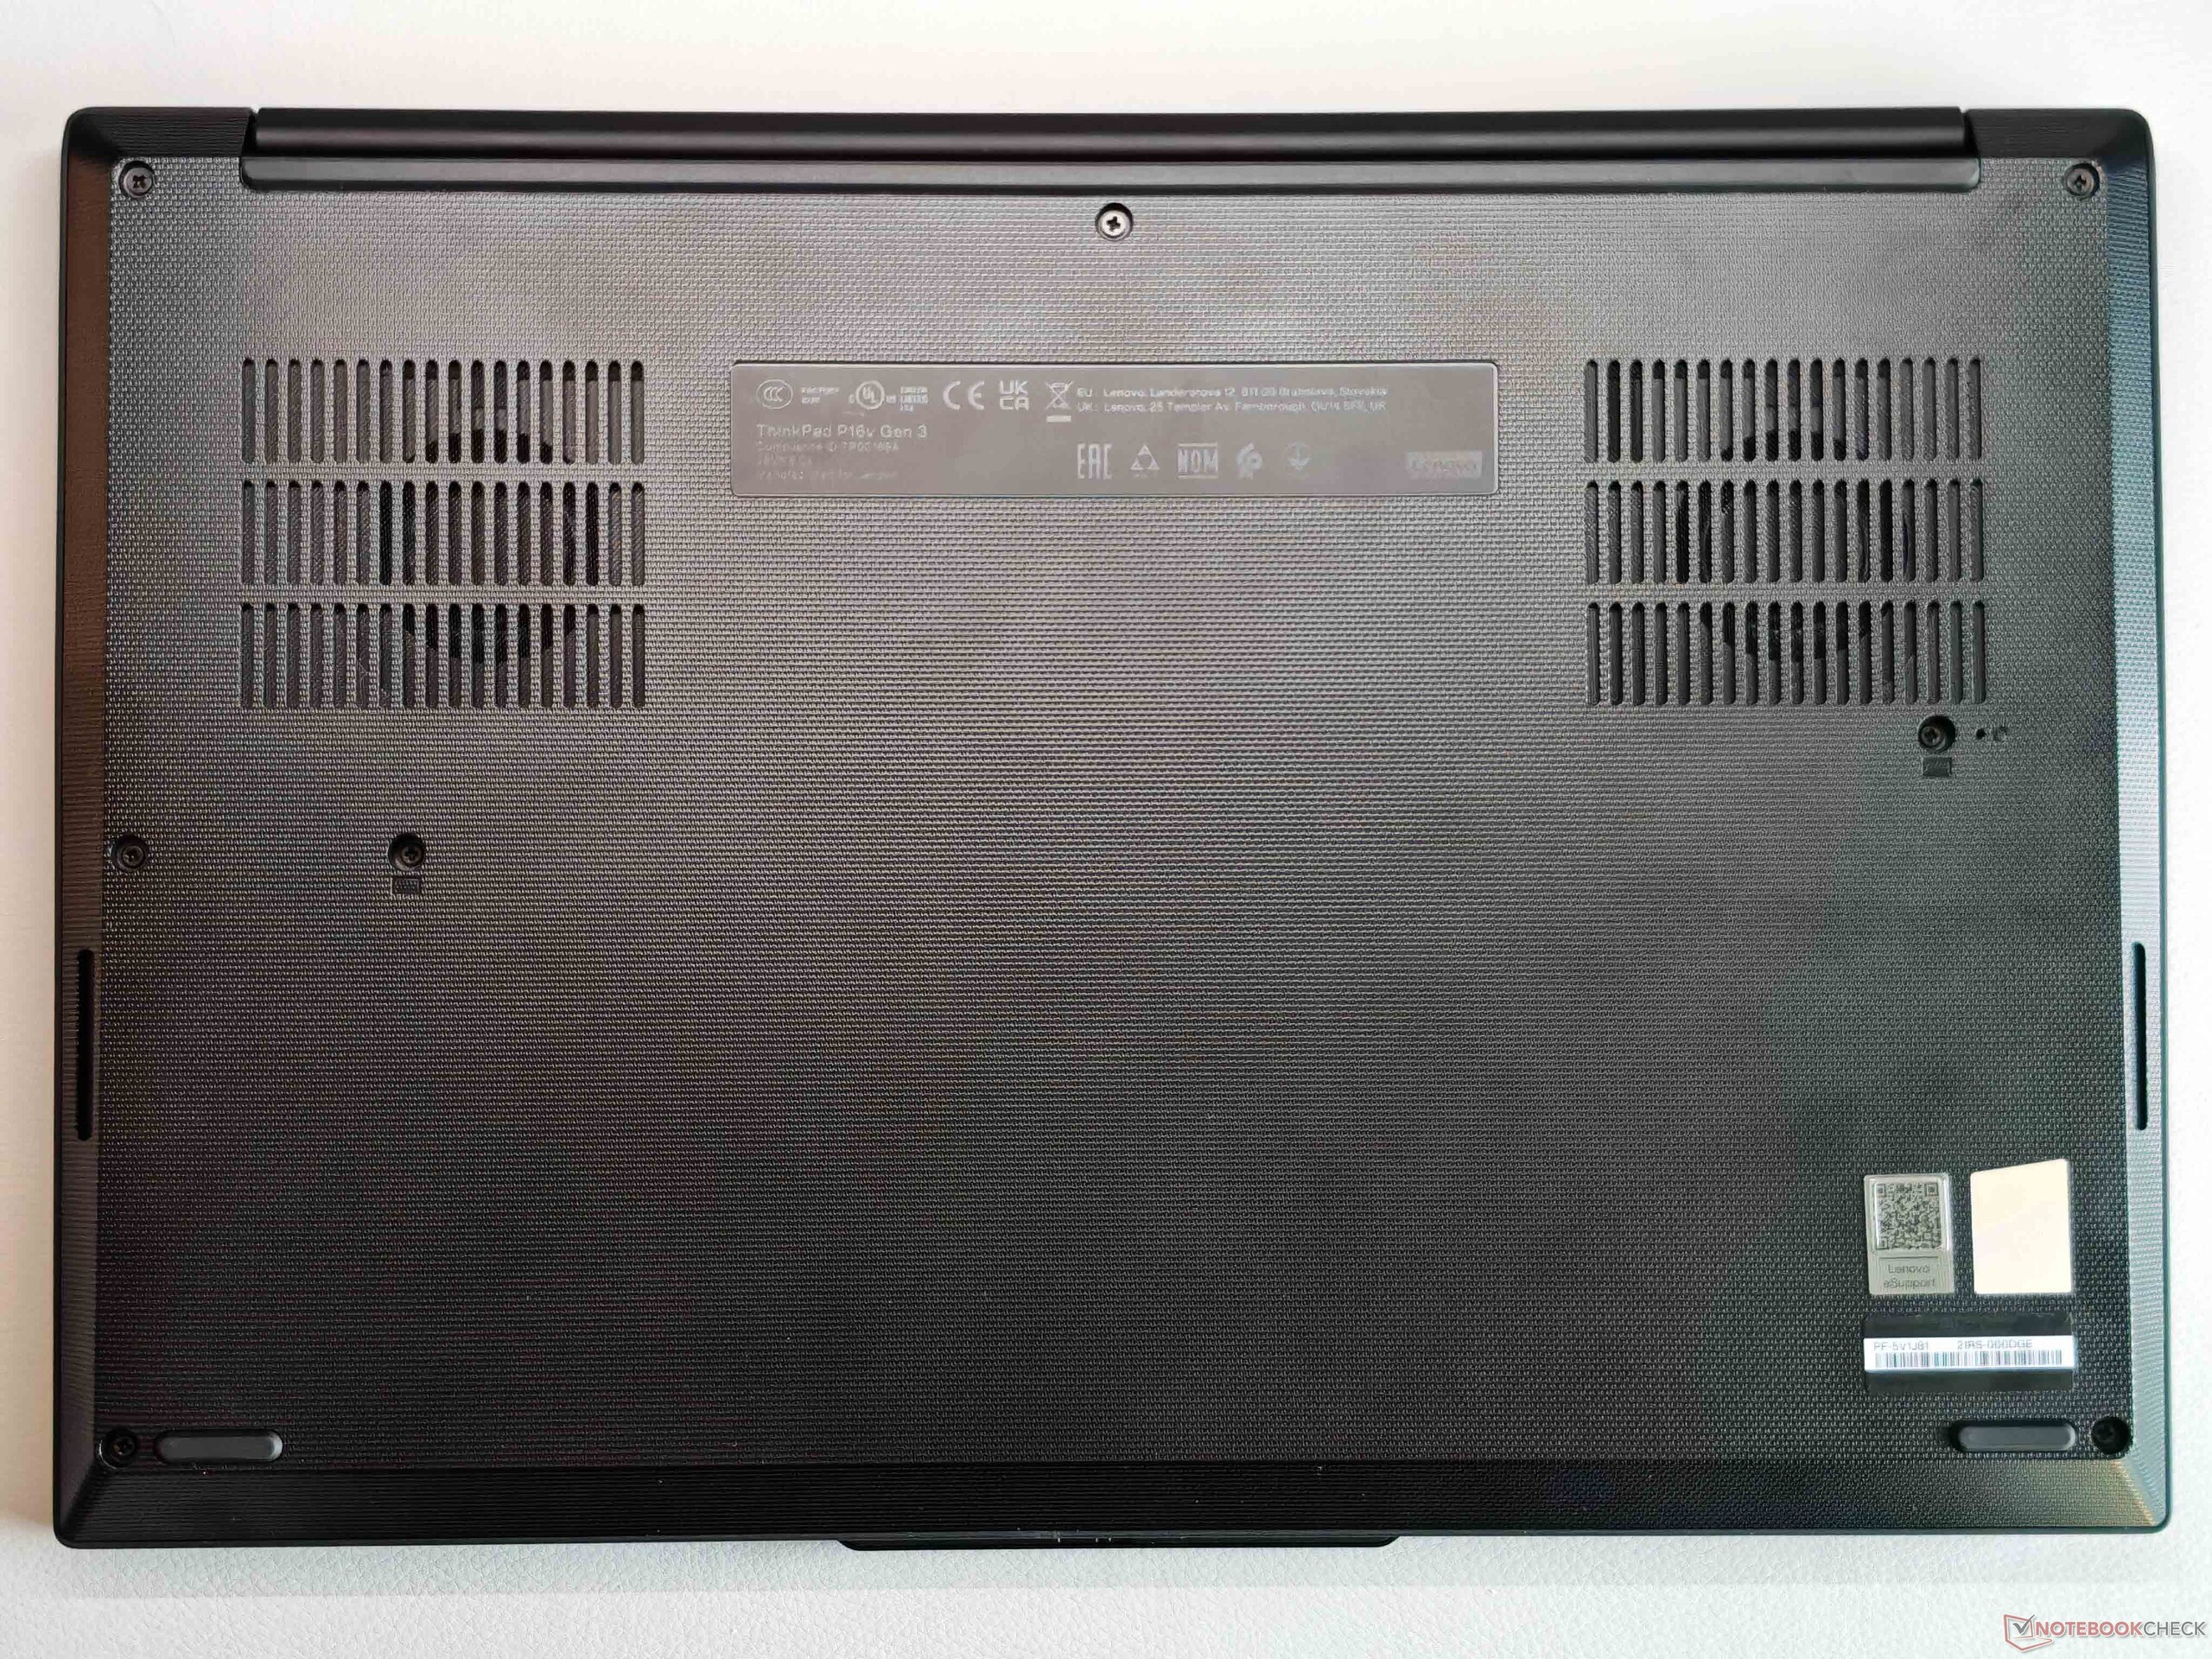
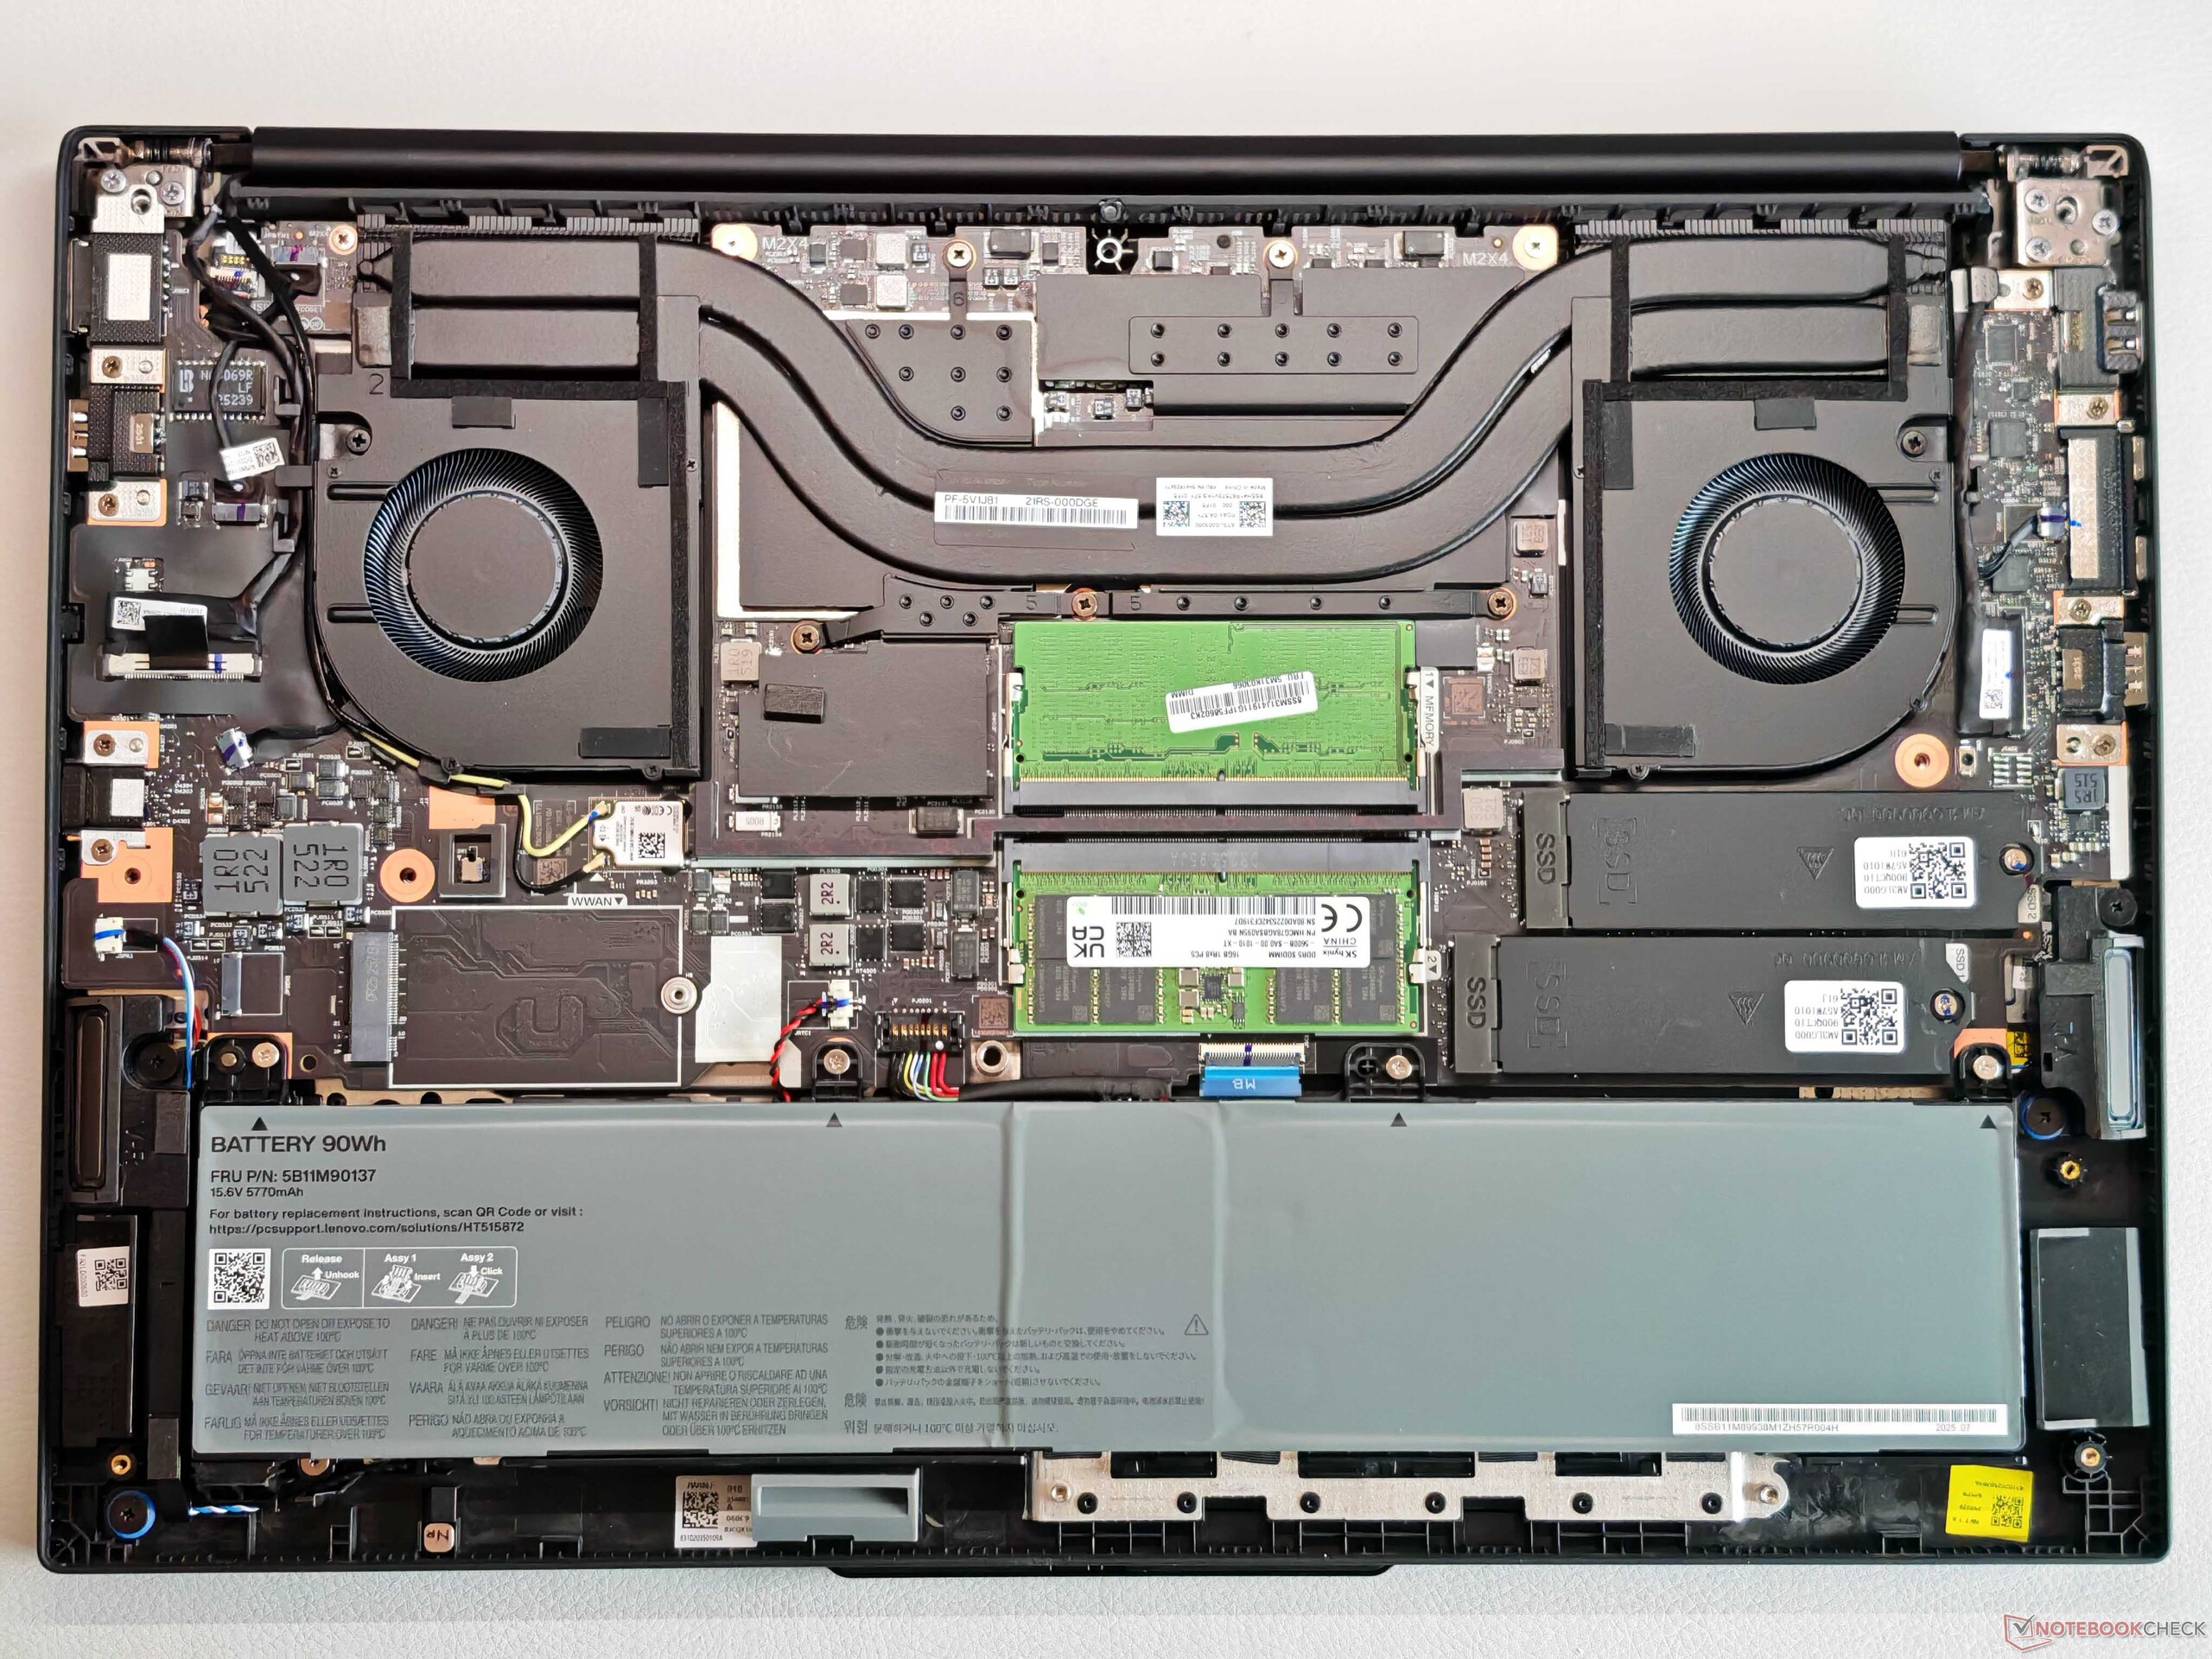
A pesar del elevado precio, en la carcasa se aprecia la clasificación como estación de trabajo de nivel básico, ya que aquí sólo se utiliza plástico. El diseño es típico de los ThinkPad actuales, incluida la antiestética joroba de la cámara. La mano de obra es básicamente buena, pero la estabilidad es decepcionante, especialmente teniendo en cuenta la unidad base bastante gruesa. La zona central del teclado, en particular, puede abollarse visiblemente, pero no pudimos provocar ningún crujido. La tapa de la pantalla se comporta mejor, pero las bisagras rebotan un poco (ángulo máximo de apertura 180 grados). La tapa lisa en particular es muy susceptible a las huellas dactilares y también es difícil de limpiar. Las opciones de mantenimiento son muy buenas en general (2x RAM, 2x SSD).
No hay mucho de lo que quejarse en términos de conexiones, pero uno de los dos puertos Thunderbolt 4 está siempre ocupado por la fuente de alimentación. El módulo Wi-Fi 7 alcanza tasas de transferencia buenas y estables, y también hay un puerto Ethernet disponible. También hay espacio para un módulo WWAN, pero las antenas no están preenrutadas (no está preparado para WWAN). El lector de tarjetas alcanza velocidades de transferencia medias y la webcam de 5 MP (con obturador + IR) hace fotos utilizables.


| SD Card Reader | |
| average JPG Copy Test (av. of 3 runs) | |
| HP ZBook X G1i 16 (Toshiba Exceria Pro SDXC 64 GB UHS-II) | |
| HP ZBook Power 16 G11 A (Toshiba Exceria Pro SDXC 64 GB UHS-II) | |
| Media de la clase Workstation (49.6 - 681, n=14, últimos 2 años) | |
| Lenovo ThinkPad P1 Gen 8 (Toshiba Exceria Pro SDXC 64 GB UHS-II) | |
| Lenovo ThinkPad P16v G3 21RS000DGE (Angelbird AV Pro V60) | |
| maximum AS SSD Seq Read Test (1GB) | |
| HP ZBook Power 16 G11 A (Toshiba Exceria Pro SDXC 64 GB UHS-II) | |
| HP ZBook X G1i 16 (Toshiba Exceria Pro SDXC 64 GB UHS-II) | |
| Media de la clase Workstation (87.6 - 1455, n=14, últimos 2 años) | |
| Lenovo ThinkPad P16v G3 21RS000DGE (Angelbird AV Pro V60) | |
| Lenovo ThinkPad P1 Gen 8 (Toshiba Exceria Pro SDXC 64 GB UHS-II) | |
| Networking | |
| Lenovo ThinkPad P16v G3 21RS000DGE | |
| iperf3 transmit AXE11000 | |
| iperf3 receive AXE11000 | |
| Lenovo ThinkPad P1 Gen 8 | |
| iperf3 transmit AXE11000 | |
| iperf3 receive AXE11000 | |
| iperf3 transmit AXE11000 6GHz | |
| iperf3 receive AXE11000 6GHz | |
| HP ZBook X G1i 16 | |
| iperf3 transmit AXE11000 | |
| iperf3 receive AXE11000 | |
| iperf3 transmit AXE11000 6GHz | |
| iperf3 receive AXE11000 6GHz | |
| HP ZBook Power 16 G11 A | |
| iperf3 transmit AXE11000 | |
| iperf3 receive AXE11000 | |
| iperf3 transmit AXE11000 6GHz | |
| iperf3 receive AXE11000 6GHz | |
| Lenovo ThinkPad P16s Gen 4 21RX000YGE | |
| iperf3 transmit AXE11000 | |
| iperf3 receive AXE11000 | |
| iperf3 transmit AXE11000 6GHz | |
| iperf3 receive AXE11000 6GHz | |


Sostenibilidad
Lenovo proporciona amplia información sobre el balance deCO2 y el uso de materiales reciclados.


Dispositivos de entrada - Teclado medio
El teclado retroiluminado, incluido el teclado numérico, también cumple el estándar actual de ThinkPad, aunque hay modelos significativamente mejores en la gama actual (por ejemplo ThinkPad P1 16 G8). En general, describiríamos la sensación de tecleo como cómoda y precisa, pero la competencia puede hacerlo al menos igual de bien. El ClickPad (11,5 x 6,7 cm/~4,5 x ~2,6 pulgadas) es bastante pequeño para los estándares modernos debido a los botones TrackPoint dedicados, pero el funcionamiento es excelente y los clics mecánicos de la zona inferior también son de gran calidad. Esto también se aplica a los botones TrackPoint.


Pantalla - IPS con 500 cd/m

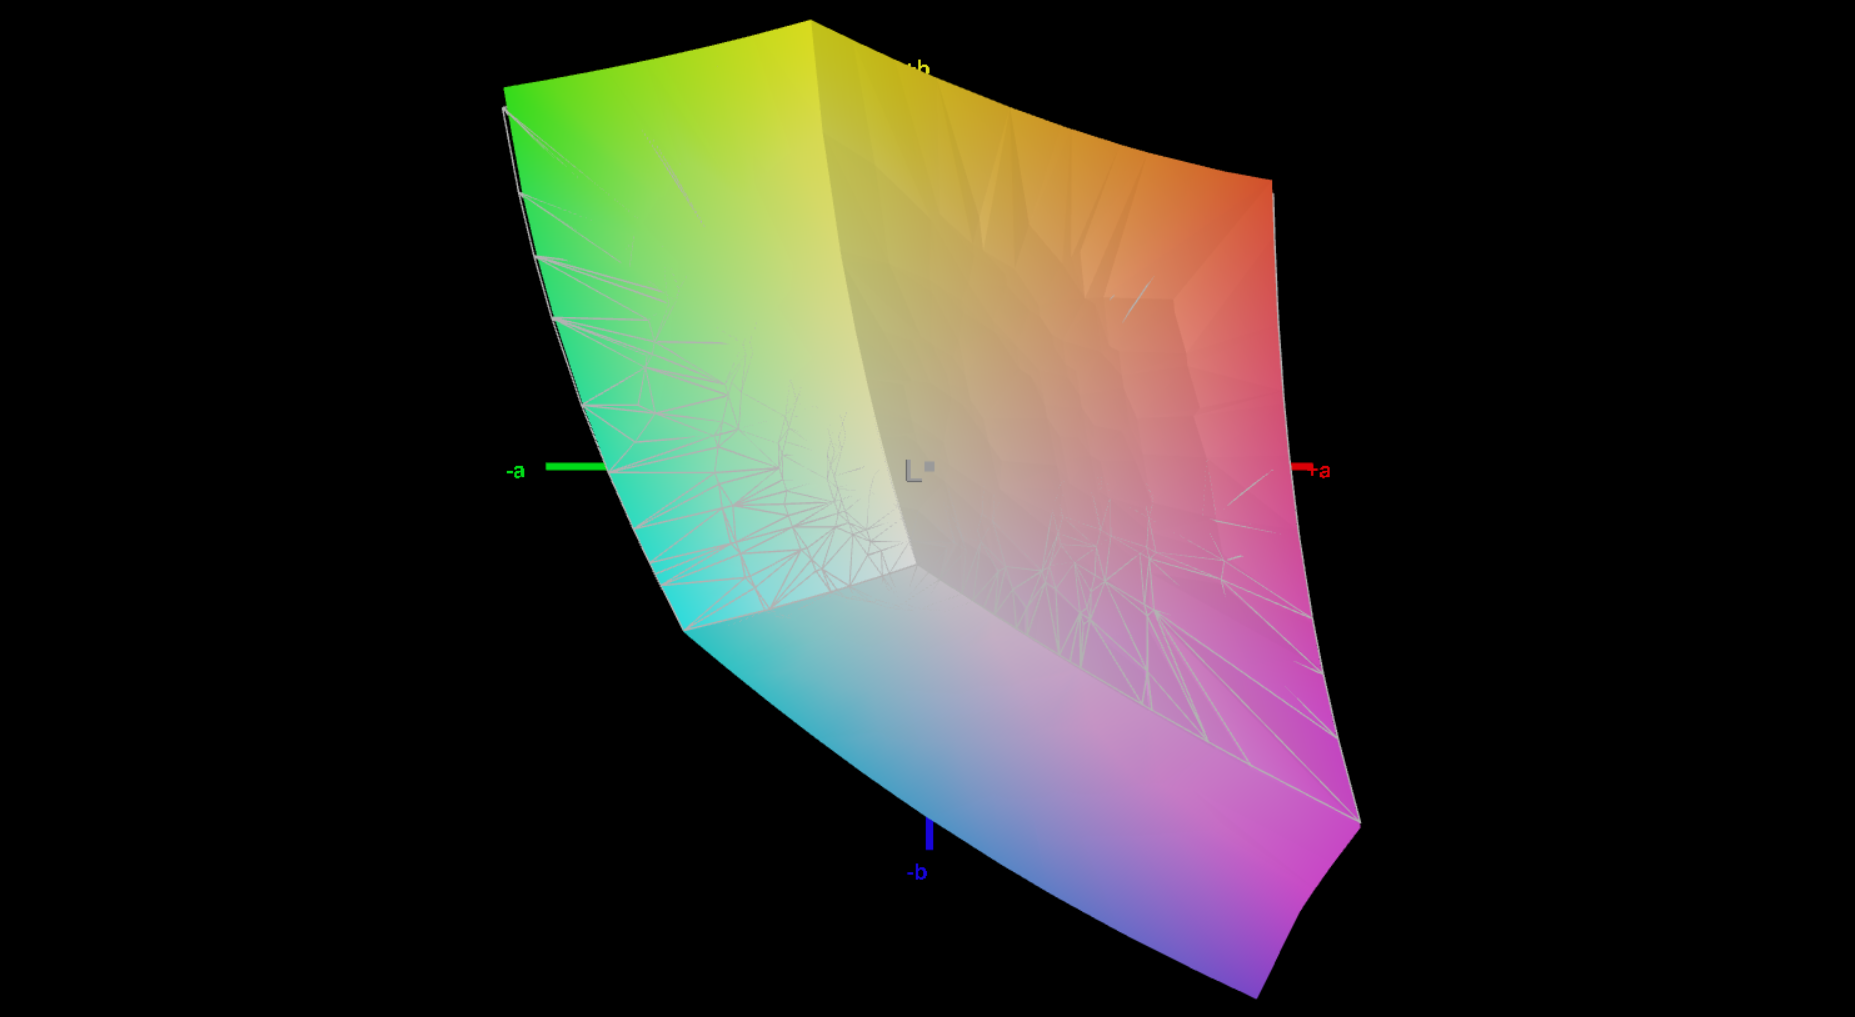
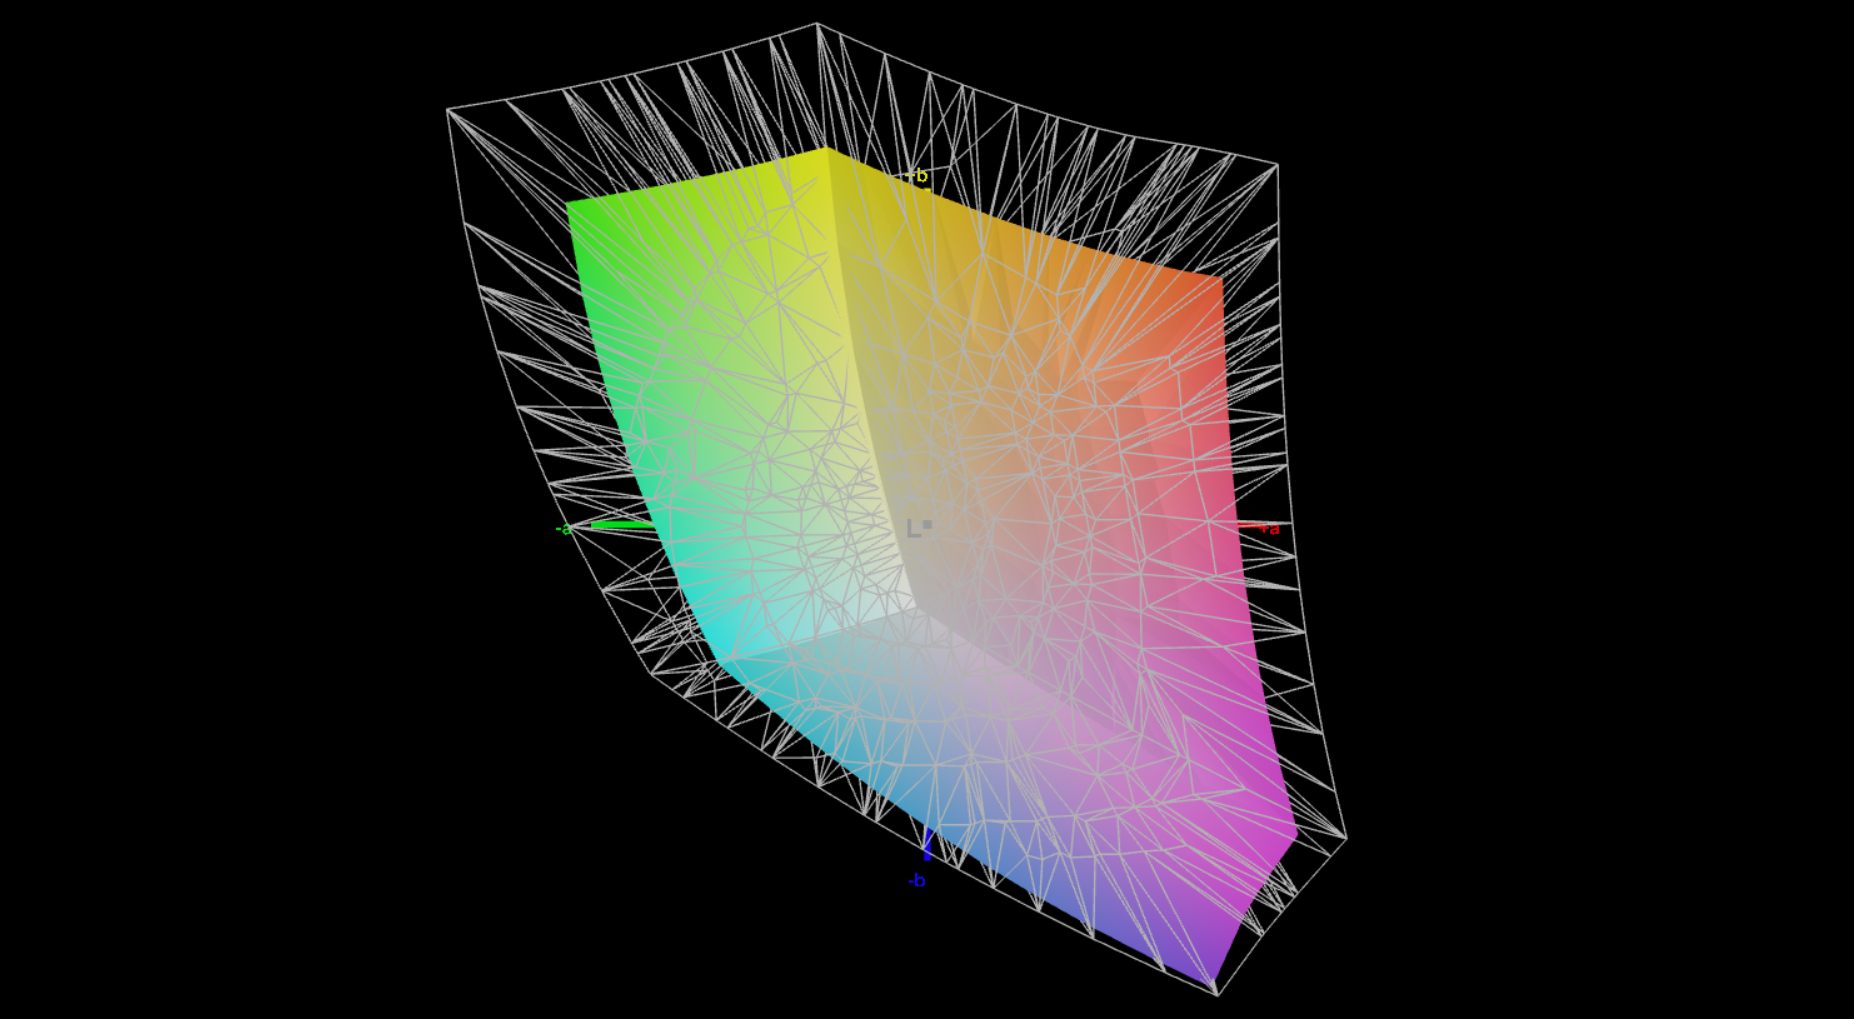
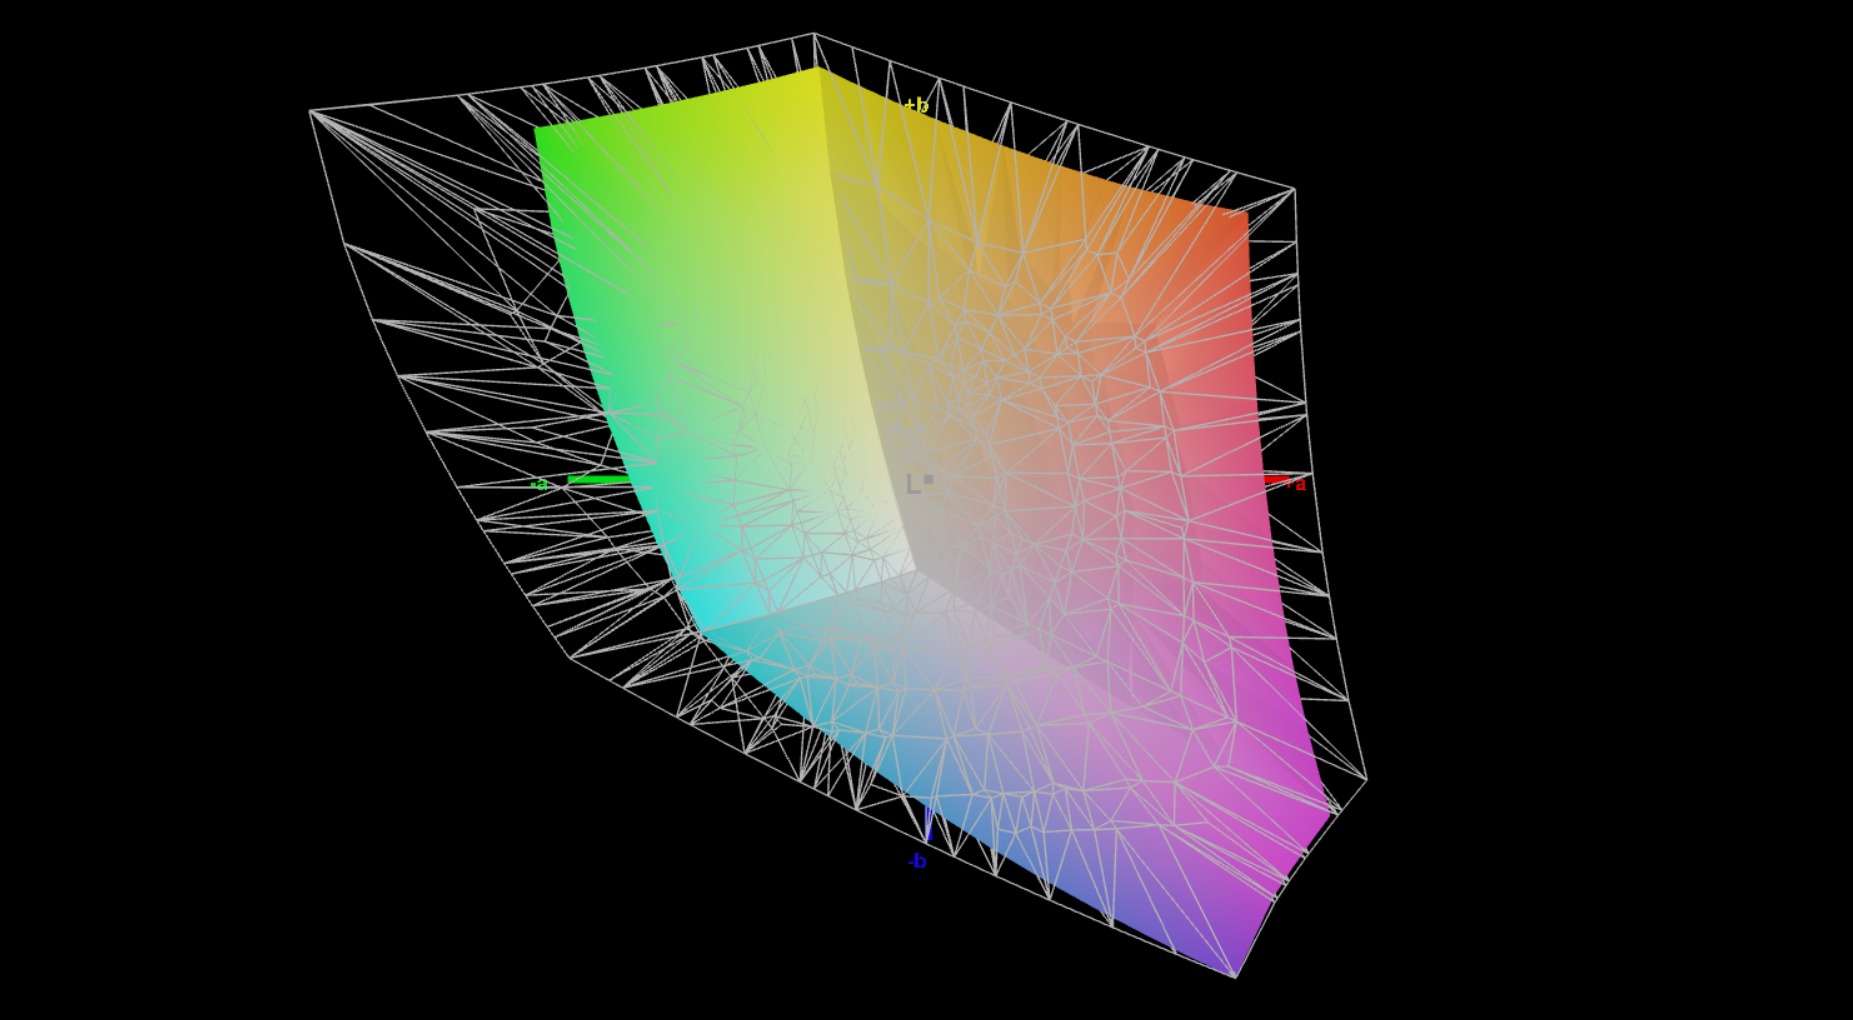
Lenovo sólo ofrece pantallas de 60 Hz (IPS y OLED) para el P16v Gen 3, lo que resulta algo sorprendente teniendo en cuenta su elevado precio. El modelo estándar Full HD IPS (1.920 x 1.200 píxeles, 16:10) con superficie mate está instalado en nuestro dispositivo de prueba. La impresión subjetiva de la imagen es buena en general, pero las zonas brillantes aparecen ligeramente granuladas en una inspección más cercana. No hay parpadeo PWM y los tiempos de respuesta son en general poco destacables.
El brillo medio es de unos muy buenos ~554 cd/m² y, junto con el nivel de negro de 0,33 cd/m², da como resultado una elevada relación de contraste (~1.700:1). El perfil de color de fábrica ya muestra un buen rendimiento en nuestro análisis con el software profesional CalMAN, pero pudimos mejorar aún más la pantalla con nuestra propia calibración.
| |||||||||||||||||||||||||
iluminación: 90 %
Brillo con batería: 565 cd/m²
Contraste: 1712:1 (Negro: 0.33 cd/m²)
ΔE ColorChecker Calman: 1.8 | ∀{0.5-29.43 Ø4.72}
calibrated: 0.7
ΔE Greyscale Calman: 2.9 | ∀{0.09-98 Ø4.97}
70.6% AdobeRGB 1998 (Argyll 3D)
99.7% sRGB (Argyll 3D)
68.4% Display P3 (Argyll 3D)
Gamma: 2.23
CCT: 6534 K
| Lenovo ThinkPad P16v G3 21RS000DGE M160NW49 R0, IPS, 1920x1200, 16", 60 Hz | Lenovo ThinkPad P1 Gen 8 Samsung ATNA60KA02-0, Tandem OLED, 3200x2000, 16", 120 Hz | HP ZBook X G1i 16 LG Philips LGD07B3, IPS, 2560x1600, 16", 120 Hz | HP ZBook Power 16 G11 A AUOA0A9, IPS, 2560x1600, 16", 120 Hz | Lenovo ThinkPad P16s Gen 4 21RX000YGE N160JCA-GT1, IPS LED, 1920x1200, 16", 60 Hz | |
|---|---|---|---|---|---|
| Display | 27% | 28% | 0% | -4% | |
| Display P3 Coverage (%) | 68.4 | 98.8 44% | 97.2 42% | 69.1 1% | 65.8 -4% |
| sRGB Coverage (%) | 99.7 | 100 0% | 100 0% | 97.7 -2% | 96.8 -3% |
| AdobeRGB 1998 Coverage (%) | 70.6 | 97.5 38% | 99.9 42% | 71 1% | 67.8 -4% |
| Response Times | 97% | -51% | 53% | -17% | |
| Response Time Grey 50% / Grey 80% * (ms) | 39.2 ? | 0.57 ? 99% | 45.5 ? -16% | 13.6 ? 65% | 29.4 ? 25% |
| Response Time Black / White * (ms) | 14.1 ? | 0.73 ? 95% | 26.1 ? -85% | 8.4 ? 40% | 22.4 ? -59% |
| PWM Frequency (Hz) | 1199 | 26536 ? | |||
| PWM Amplitude * (%) | 18 | 47 | |||
| Screen | 15% | -41% | -35% | -27% | |
| Brightness middle (cd/m²) | 565 | 561.8 -1% | 461.8 -18% | 470.7 -17% | 540 -4% |
| Brightness (cd/m²) | 554 | 566 2% | 427 -23% | 431 -22% | 516 -7% |
| Brightness Distribution (%) | 90 | 99 10% | 88 -2% | 88 -2% | 93 3% |
| Black Level * (cd/m²) | 0.33 | 0.46 -39% | 0.57 -73% | 0.37 -12% | |
| Contrast (:1) | 1712 | 1004 -41% | 826 -52% | 1459 -15% | |
| Colorchecker dE 2000 * | 1.8 | 1.29 28% | 4.08 -127% | 2.16 -20% | 3.4 -89% |
| Colorchecker dE 2000 max. * | 4.2 | 2.96 30% | 8.1 -93% | 4.39 -5% | 5.6 -33% |
| Colorchecker dE 2000 calibrated * | 0.7 | 0.81 -16% | 0.75 -7% | 1.37 -96% | 0.9 -29% |
| Greyscale dE 2000 * | 2.9 | 1.4 52% | 3.5 -21% | 3.7 -28% | 4.5 -55% |
| Gamma | 2.23 99% | 2.23 99% | 2.15 102% | 2.38 92% | 2.51 88% |
| CCT | 6534 99% | 6319 103% | 6715 97% | 6765 96% | 6294 103% |
| Media total (Programa/Opciones) | 46% /
32% | -21% /
-28% | 6% /
-15% | -16% /
-20% |
* ... más pequeño es mejor


Tiempos de respuesta del display
| ↔ Tiempo de respuesta de Negro a Blanco | ||
|---|---|---|
| 14.1 ms ... subida ↗ y bajada ↘ combinada | ↗ 4.6 ms subida | 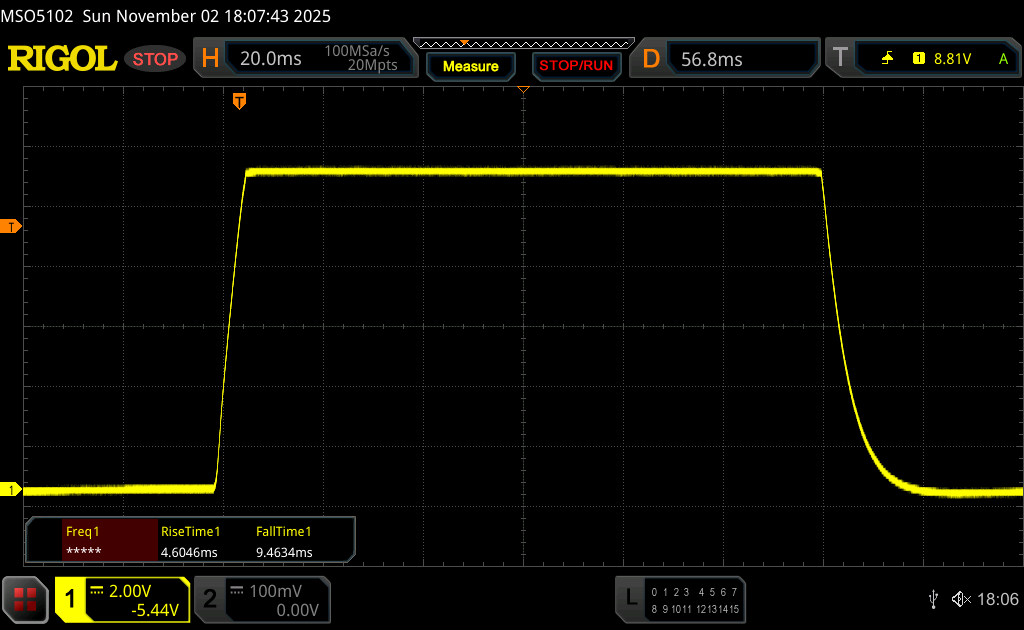 |
| ↘ 9.5 ms bajada | ||
| La pantalla mostró buenos tiempos de respuesta en nuestros tests pero podría ser demasiado lenta para los jugones competitivos. En comparación, todos los dispositivos de prueba van de ##min### (mínimo) a 240 (máximo) ms. » 35 % de todos los dispositivos son mejores. Esto quiere decir que el tiempo de respuesta medido es mejor que la media (19.8 ms) de todos los dispositivos testados. | ||
| ↔ Tiempo de respuesta 50% Gris a 80% Gris | ||
| 39.2 ms ... subida ↗ y bajada ↘ combinada | ↗ 17.5 ms subida | 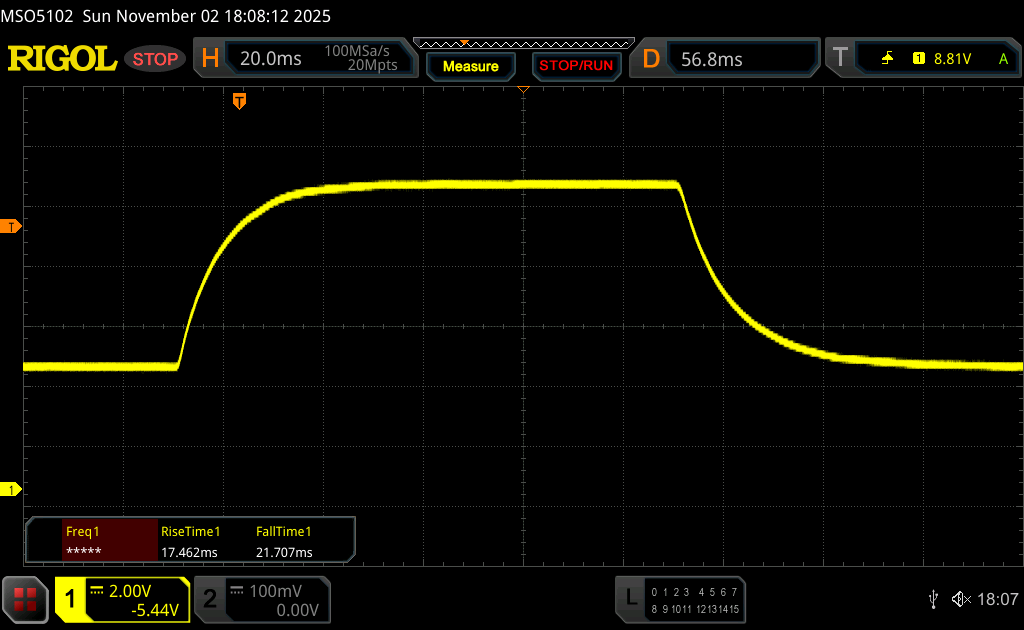 |
| ↘ 21.7 ms bajada | ||
| La pantalla mostró tiempos de respuesta lentos en nuestros tests y podría ser demasiado lenta para los jugones. En comparación, todos los dispositivos de prueba van de ##min### (mínimo) a 636 (máximo) ms. » 60 % de todos los dispositivos son mejores. Eso quiere decir que el tiempo de respuesta es peor que la media (31 ms) de todos los dispositivos testados. | ||
Parpadeo de Pantalla / PWM (Pulse-Width Modulation)
| Parpadeo de Pantalla / PWM no detectado | 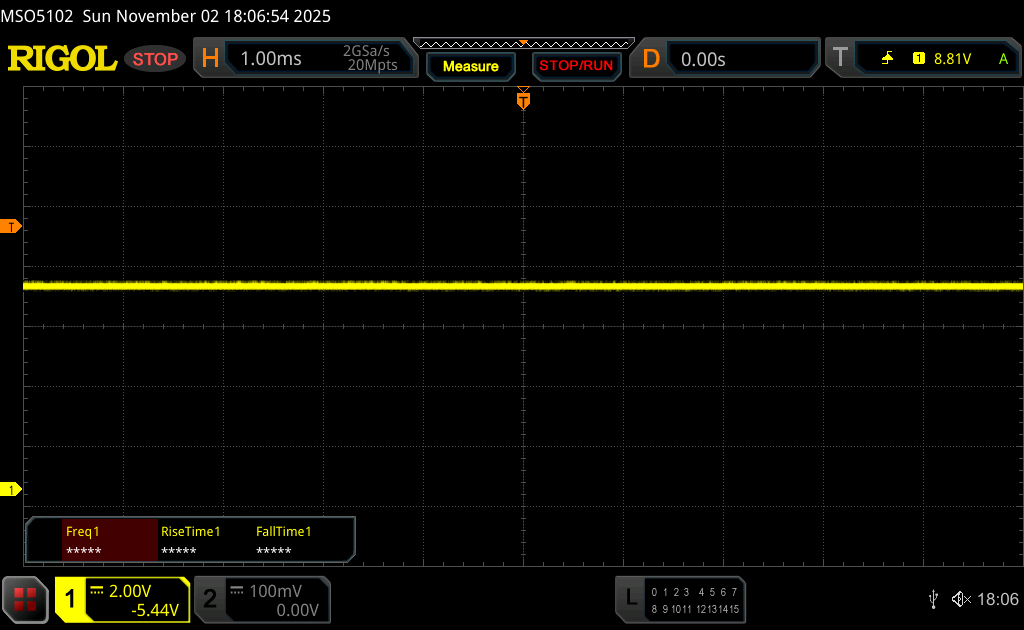 | ||
Comparación: 52 % de todos los dispositivos testados no usaron PWM para atenuar el display. Si se usó, medimos una media de 7747 (mínimo: 5 - máxmo: 343500) Hz. | |||


Rendimiento - Arrow Lake y RTX PRO 2000
Condiciones de la prueba
Los perfiles de energía de Lenovo están directamente vinculados a la configuración de Windows en los ThinkPad. Realizamos los puntos de referencia y las mediciones en el modo de mejor rendimiento.
Procesador
El dispositivo de prueba contiene el Intel Core Ultra 7 255H (Arrow Lake), que puede consumir hasta 115 vatios durante periodos cortos y 70 vatios de forma continua. El rendimiento de la CPU es bueno en general, aunque algunos de los competidores son incluso ligeramente más rápidos. En modo batería, el procesador puede consumir un máximo de 40 vatios, por lo que el rendimiento multinúcleo es aquí alrededor de un 14% inferior.
Cinebench R15 Prueba de resistencia múltiple
Cinebench R23: Multi Core | Single Core
Cinebench R20: CPU (Multi Core) | CPU (Single Core)
Cinebench R15: CPU Multi 64Bit | CPU Single 64Bit
Blender: v2.79 BMW27 CPU
7-Zip 18.03: 7z b 4 | 7z b 4 -mmt1
Geekbench 6.7: Multi-Core | Single-Core
Geekbench 5.5: Multi-Core | Single-Core
HWBOT x265 Benchmark v2.2: 4k Preset
LibreOffice : 20 Documents To PDF
R Benchmark 2.5: Overall mean
| CPU Performance rating | |
| Media de la clase Workstation | |
| HP ZBook X G1i 16 | |
| Lenovo ThinkPad P16v G3 21RS000DGE | |
| Lenovo ThinkPad P1 Gen 8 | |
| Medio Intel Core Ultra 7 255H | |
| Lenovo ThinkPad P16s Gen 4 21RX000YGE | |
| HP ZBook Power 16 G11 A | |
| Cinebench R23 / Multi Core | |
| Media de la clase Workstation (14621 - 38520, n=23, últimos 2 años) | |
| Lenovo ThinkPad P1 Gen 8 | |
| HP ZBook X G1i 16 | |
| Lenovo ThinkPad P16v G3 21RS000DGE | |
| Medio Intel Core Ultra 7 255H (16105 - 22578, n=20) | |
| Lenovo ThinkPad P16s Gen 4 21RX000YGE | |
| HP ZBook Power 16 G11 A | |
| Cinebench R23 / Single Core | |
| Lenovo ThinkPad P16v G3 21RS000DGE | |
| Medio Intel Core Ultra 7 255H (1874 - 2152, n=20) | |
| Media de la clase Workstation (1712 - 2228, n=23, últimos 2 años) | |
| HP ZBook X G1i 16 | |
| Lenovo ThinkPad P1 Gen 8 | |
| Lenovo ThinkPad P16s Gen 4 21RX000YGE | |
| HP ZBook Power 16 G11 A | |
| Cinebench R20 / CPU (Multi Core) | |
| Media de la clase Workstation (5760 - 15043, n=23, últimos 2 años) | |
| Lenovo ThinkPad P1 Gen 8 | |
| HP ZBook X G1i 16 | |
| Lenovo ThinkPad P16v G3 21RS000DGE | |
| Medio Intel Core Ultra 7 255H (6356 - 8860, n=19) | |
| Lenovo ThinkPad P16s Gen 4 21RX000YGE | |
| HP ZBook Power 16 G11 A | |
| Cinebench R20 / CPU (Single Core) | |
| Lenovo ThinkPad P16v G3 21RS000DGE | |
| Lenovo ThinkPad P16s Gen 4 21RX000YGE | |
| Medio Intel Core Ultra 7 255H (743 - 826, n=19) | |
| Media de la clase Workstation (671 - 857, n=23, últimos 2 años) | |
| HP ZBook X G1i 16 | |
| Lenovo ThinkPad P1 Gen 8 | |
| HP ZBook Power 16 G11 A | |
| Cinebench R15 / CPU Multi 64Bit | |
| Media de la clase Workstation (2489 - 5810, n=23, últimos 2 años) | |
| HP ZBook X G1i 16 | |
| Lenovo ThinkPad P1 Gen 8 | |
| Lenovo ThinkPad P16v G3 21RS000DGE | |
| Lenovo ThinkPad P16s Gen 4 21RX000YGE | |
| Medio Intel Core Ultra 7 255H (2414 - 3444, n=19) | |
| HP ZBook Power 16 G11 A | |
| Cinebench R15 / CPU Single 64Bit | |
| Lenovo ThinkPad P16s Gen 4 21RX000YGE | |
| HP ZBook X G1i 16 | |
| Medio Intel Core Ultra 7 255H (258 - 322, n=20) | |
| Lenovo ThinkPad P1 Gen 8 | |
| Lenovo ThinkPad P16v G3 21RS000DGE | |
| Media de la clase Workstation (191.4 - 328, n=23, últimos 2 años) | |
| HP ZBook Power 16 G11 A | |
| Blender / v2.79 BMW27 CPU | |
| HP ZBook Power 16 G11 A | |
| Medio Intel Core Ultra 7 255H (156 - 293, n=19) | |
| Lenovo ThinkPad P16s Gen 4 21RX000YGE | |
| Lenovo ThinkPad P16v G3 21RS000DGE | |
| Lenovo ThinkPad P1 Gen 8 | |
| HP ZBook X G1i 16 | |
| Media de la clase Workstation (91 - 222, n=23, últimos 2 años) | |
| 7-Zip 18.03 / 7z b 4 | |
| Media de la clase Workstation (60489 - 116969, n=23, últimos 2 años) | |
| Lenovo ThinkPad P16s Gen 4 21RX000YGE | |
| HP ZBook X G1i 16 | |
| Lenovo ThinkPad P16v G3 21RS000DGE | |
| HP ZBook Power 16 G11 A | |
| Lenovo ThinkPad P1 Gen 8 | |
| Medio Intel Core Ultra 7 255H (42155 - 70397, n=20) | |
| 7-Zip 18.03 / 7z b 4 -mmt1 | |
| HP ZBook Power 16 G11 A | |
| Lenovo ThinkPad P16s Gen 4 21RX000YGE | |
| Lenovo ThinkPad P16v G3 21RS000DGE | |
| Media de la clase Workstation (5126 - 6960, n=23, últimos 2 años) | |
| HP ZBook X G1i 16 | |
| Medio Intel Core Ultra 7 255H (4589 - 6385, n=20) | |
| Lenovo ThinkPad P1 Gen 8 | |
| Geekbench 6.7 / Multi-Core | |
| HP ZBook X G1i 16 | |
| Lenovo ThinkPad P1 Gen 8 | |
| Lenovo ThinkPad P16v G3 21RS000DGE | |
| Media de la clase Workstation (12721 - 20887, n=23, últimos 2 años) | |
| Medio Intel Core Ultra 7 255H (11979 - 17489, n=20) | |
| Lenovo ThinkPad P16s Gen 4 21RX000YGE | |
| HP ZBook Power 16 G11 A | |
| Geekbench 6.7 / Single-Core | |
| Lenovo ThinkPad P16s Gen 4 21RX000YGE | |
| Lenovo ThinkPad P16v G3 21RS000DGE | |
| HP ZBook X G1i 16 | |
| Medio Intel Core Ultra 7 255H (2712 - 2939, n=20) | |
| Media de la clase Workstation (2389 - 3065, n=23, últimos 2 años) | |
| Lenovo ThinkPad P1 Gen 8 | |
| HP ZBook Power 16 G11 A | |
| Geekbench 5.5 / Multi-Core | |
| Media de la clase Workstation (11542 - 25554, n=23, últimos 2 años) | |
| Lenovo ThinkPad P1 Gen 8 | |
| HP ZBook X G1i 16 | |
| Lenovo ThinkPad P16v G3 21RS000DGE | |
| Lenovo ThinkPad P16s Gen 4 21RX000YGE | |
| Medio Intel Core Ultra 7 255H (11348 - 17218, n=19) | |
| HP ZBook Power 16 G11 A | |
| Geekbench 5.5 / Single-Core | |
| Lenovo ThinkPad P16s Gen 4 21RX000YGE | |
| Lenovo ThinkPad P16v G3 21RS000DGE | |
| HP ZBook X G1i 16 | |
| Medio Intel Core Ultra 7 255H (1938 - 2121, n=19) | |
| Media de la clase Workstation (1783 - 2183, n=23, últimos 2 años) | |
| Lenovo ThinkPad P1 Gen 8 | |
| HP ZBook Power 16 G11 A | |
| HWBOT x265 Benchmark v2.2 / 4k Preset | |
| Media de la clase Workstation (17.8 - 40.5, n=23, últimos 2 años) | |
| Lenovo ThinkPad P1 Gen 8 | |
| HP ZBook X G1i 16 | |
| Lenovo ThinkPad P16v G3 21RS000DGE | |
| Lenovo ThinkPad P16s Gen 4 21RX000YGE | |
| Medio Intel Core Ultra 7 255H (13.7 - 26.5, n=19) | |
| HP ZBook Power 16 G11 A | |
| LibreOffice / 20 Documents To PDF | |
| Lenovo ThinkPad P16s Gen 4 21RX000YGE | |
| HP ZBook Power 16 G11 A | |
| Medio Intel Core Ultra 7 255H (41.1 - 61.6, n=19) | |
| Media de la clase Workstation (37.1 - 74.7, n=23, últimos 2 años) | |
| HP ZBook X G1i 16 | |
| Lenovo ThinkPad P1 Gen 8 | |
| Lenovo ThinkPad P16v G3 21RS000DGE | |
| R Benchmark 2.5 / Overall mean | |
| Lenovo ThinkPad P16s Gen 4 21RX000YGE | |
| HP ZBook Power 16 G11 A | |
| Medio Intel Core Ultra 7 255H (0.4233 - 0.515, n=19) | |
| Lenovo ThinkPad P16v G3 21RS000DGE | |
| Lenovo ThinkPad P1 Gen 8 | |
| Media de la clase Workstation (0.3825 - 0.603, n=23, últimos 2 años) | |
| HP ZBook X G1i 16 | |
* ... más pequeño es mejor
AIDA64: FP32 Ray-Trace | FPU Julia | CPU SHA3 | CPU Queen | FPU SinJulia | FPU Mandel | CPU AES | CPU ZLib | FP64 Ray-Trace | CPU PhotoWorxx
| Performance rating | |
| Media de la clase Workstation | |
| Lenovo ThinkPad P16s Gen 4 21RX000YGE | |
| HP ZBook Power 16 G11 A | |
| Lenovo ThinkPad P1 Gen 8 | |
| Lenovo ThinkPad P16v G3 21RS000DGE | |
| Medio Intel Core Ultra 7 255H | |
| AIDA64 / FP32 Ray-Trace | |
| Lenovo ThinkPad P16s Gen 4 21RX000YGE | |
| Media de la clase Workstation (16730 - 61611, n=23, últimos 2 años) | |
| HP ZBook Power 16 G11 A | |
| Lenovo ThinkPad P1 Gen 8 | |
| Lenovo ThinkPad P16v G3 21RS000DGE | |
| Medio Intel Core Ultra 7 255H (13863 - 24741, n=17) | |
| AIDA64 / FPU Julia | |
| Media de la clase Workstation (89597 - 186971, n=23, últimos 2 años) | |
| Lenovo ThinkPad P1 Gen 8 | |
| HP ZBook Power 16 G11 A | |
| Lenovo ThinkPad P16s Gen 4 21RX000YGE | |
| Lenovo ThinkPad P16v G3 21RS000DGE | |
| Medio Intel Core Ultra 7 255H (71030 - 119222, n=17) | |
| AIDA64 / CPU SHA3 | |
| Media de la clase Workstation (4178 - 8975, n=23, últimos 2 años) | |
| Lenovo ThinkPad P1 Gen 8 | |
| Lenovo ThinkPad P16s Gen 4 21RX000YGE | |
| Lenovo ThinkPad P16v G3 21RS000DGE | |
| HP ZBook Power 16 G11 A | |
| Medio Intel Core Ultra 7 255H (3408 - 5548, n=17) | |
| AIDA64 / CPU Queen | |
| HP ZBook Power 16 G11 A | |
| Media de la clase Workstation (60778 - 144411, n=23, últimos 2 años) | |
| Lenovo ThinkPad P16s Gen 4 21RX000YGE | |
| Lenovo ThinkPad P1 Gen 8 | |
| Lenovo ThinkPad P16v G3 21RS000DGE | |
| Medio Intel Core Ultra 7 255H (59098 - 68460, n=16) | |
| AIDA64 / FPU SinJulia | |
| Lenovo ThinkPad P16s Gen 4 21RX000YGE | |
| HP ZBook Power 16 G11 A | |
| Media de la clase Workstation (8165 - 29343, n=23, últimos 2 años) | |
| Lenovo ThinkPad P1 Gen 8 | |
| Lenovo ThinkPad P16v G3 21RS000DGE | |
| Medio Intel Core Ultra 7 255H (6716 - 9006, n=17) | |
| AIDA64 / FPU Mandel | |
| Media de la clase Workstation (44497 - 98153, n=23, últimos 2 años) | |
| Lenovo ThinkPad P1 Gen 8 | |
| Lenovo ThinkPad P16s Gen 4 21RX000YGE | |
| Lenovo ThinkPad P16v G3 21RS000DGE | |
| HP ZBook Power 16 G11 A | |
| Medio Intel Core Ultra 7 255H (37031 - 63347, n=17) | |
| AIDA64 / CPU AES | |
| Media de la clase Workstation (73133 - 187841, n=23, últimos 2 años) | |
| Lenovo ThinkPad P16s Gen 4 21RX000YGE | |
| Lenovo ThinkPad P1 Gen 8 | |
| HP ZBook Power 16 G11 A | |
| Lenovo ThinkPad P16v G3 21RS000DGE | |
| Medio Intel Core Ultra 7 255H (58402 - 83568, n=17) | |
| AIDA64 / CPU ZLib | |
| Media de la clase Workstation (929 - 2148, n=23, últimos 2 años) | |
| Lenovo ThinkPad P1 Gen 8 | |
| Lenovo ThinkPad P16s Gen 4 21RX000YGE | |
| Lenovo ThinkPad P16v G3 21RS000DGE | |
| Medio Intel Core Ultra 7 255H (822 - 1316, n=17) | |
| HP ZBook Power 16 G11 A | |
| AIDA64 / FP64 Ray-Trace | |
| Lenovo ThinkPad P16s Gen 4 21RX000YGE | |
| Media de la clase Workstation (8545 - 32891, n=23, últimos 2 años) | |
| Lenovo ThinkPad P1 Gen 8 | |
| HP ZBook Power 16 G11 A | |
| Lenovo ThinkPad P16v G3 21RS000DGE | |
| Medio Intel Core Ultra 7 255H (7384 - 13231, n=17) | |
| AIDA64 / CPU PhotoWorxx | |
| Lenovo ThinkPad P1 Gen 8 | |
| Medio Intel Core Ultra 7 255H (23836 - 65787, n=17) | |
| Media de la clase Workstation (37151 - 93684, n=23, últimos 2 años) | |
| Lenovo ThinkPad P16s Gen 4 21RX000YGE | |
| Lenovo ThinkPad P16v G3 21RS000DGE | |
| HP ZBook Power 16 G11 A | |
Rendimiento del sistema
En el uso diario, el ThinkPad P16v Gen 3 es un ordenador con una gran capacidad de respuesta y los resultados de los benchmarks son muy buenos. No hubo problemas de estabilidad durante la prueba.
PCMark 10: Score | Essentials | Productivity | Digital Content Creation
CrossMark: Overall | Productivity | Creativity | Responsiveness
WebXPRT 3: Overall
WebXPRT 4: Overall
Mozilla Kraken 1.1: Total
| Performance rating | |
| Lenovo ThinkPad P16v G3 21RS000DGE | |
| Medio Intel Core Ultra 7 255H, NVIDIA RTX PRO 2000 Blackwell Generation Laptop | |
| Lenovo ThinkPad P1 Gen 8 | |
| HP ZBook X G1i 16 -4! | |
| Media de la clase Workstation | |
| HP ZBook Power 16 G11 A | |
| Lenovo ThinkPad P16s Gen 4 21RX000YGE | |
| PCMark 10 / Score | |
| Lenovo ThinkPad P16v G3 21RS000DGE | |
| Medio Intel Core Ultra 7 255H, NVIDIA RTX PRO 2000 Blackwell Generation Laptop (9625 - 9723, n=2) | |
| Lenovo ThinkPad P1 Gen 8 | |
| Media de la clase Workstation (6563 - 10409, n=19, últimos 2 años) | |
| Lenovo ThinkPad P16s Gen 4 21RX000YGE | |
| HP ZBook Power 16 G11 A | |
| PCMark 10 / Essentials | |
| Lenovo ThinkPad P16v G3 21RS000DGE | |
| Medio Intel Core Ultra 7 255H, NVIDIA RTX PRO 2000 Blackwell Generation Laptop (10650 - 10921, n=2) | |
| Lenovo ThinkPad P16s Gen 4 21RX000YGE | |
| Lenovo ThinkPad P1 Gen 8 | |
| Media de la clase Workstation (9622 - 11157, n=19, últimos 2 años) | |
| HP ZBook Power 16 G11 A | |
| PCMark 10 / Productivity | |
| Lenovo ThinkPad P1 Gen 8 | |
| Medio Intel Core Ultra 7 255H, NVIDIA RTX PRO 2000 Blackwell Generation Laptop (18083 - 18261, n=2) | |
| Lenovo ThinkPad P16v G3 21RS000DGE | |
| Media de la clase Workstation (8789 - 20616, n=19, últimos 2 años) | |
| Lenovo ThinkPad P16s Gen 4 21RX000YGE | |
| HP ZBook Power 16 G11 A | |
| PCMark 10 / Digital Content Creation | |
| Lenovo ThinkPad P16v G3 21RS000DGE | |
| Medio Intel Core Ultra 7 255H, NVIDIA RTX PRO 2000 Blackwell Generation Laptop (12443 - 12631, n=2) | |
| Media de la clase Workstation (8108 - 15631, n=19, últimos 2 años) | |
| Lenovo ThinkPad P1 Gen 8 | |
| HP ZBook Power 16 G11 A | |
| Lenovo ThinkPad P16s Gen 4 21RX000YGE | |
| CrossMark / Overall | |
| HP ZBook X G1i 16 | |
| Lenovo ThinkPad P1 Gen 8 | |
| Medio Intel Core Ultra 7 255H, NVIDIA RTX PRO 2000 Blackwell Generation Laptop (1942 - 1953, n=2) | |
| Lenovo ThinkPad P16v G3 21RS000DGE | |
| Media de la clase Workstation (1307 - 2267, n=22, últimos 2 años) | |
| HP ZBook Power 16 G11 A | |
| Lenovo ThinkPad P16s Gen 4 21RX000YGE | |
| CrossMark / Productivity | |
| HP ZBook X G1i 16 | |
| Lenovo ThinkPad P1 Gen 8 | |
| Medio Intel Core Ultra 7 255H, NVIDIA RTX PRO 2000 Blackwell Generation Laptop (1834 - 1836, n=2) | |
| Lenovo ThinkPad P16v G3 21RS000DGE | |
| Media de la clase Workstation (1130 - 2122, n=22, últimos 2 años) | |
| HP ZBook Power 16 G11 A | |
| Lenovo ThinkPad P16s Gen 4 21RX000YGE | |
| CrossMark / Creativity | |
| HP ZBook X G1i 16 | |
| Lenovo ThinkPad P16v G3 21RS000DGE | |
| Medio Intel Core Ultra 7 255H, NVIDIA RTX PRO 2000 Blackwell Generation Laptop (2211 - 2232, n=2) | |
| Media de la clase Workstation (1657 - 2725, n=22, últimos 2 años) | |
| Lenovo ThinkPad P1 Gen 8 | |
| HP ZBook Power 16 G11 A | |
| Lenovo ThinkPad P16s Gen 4 21RX000YGE | |
| CrossMark / Responsiveness | |
| Lenovo ThinkPad P1 Gen 8 | |
| Media de la clase Workstation (993 - 2096, n=22, últimos 2 años) | |
| Medio Intel Core Ultra 7 255H, NVIDIA RTX PRO 2000 Blackwell Generation Laptop (1520 - 1622, n=2) | |
| HP ZBook X G1i 16 | |
| Lenovo ThinkPad P16v G3 21RS000DGE | |
| HP ZBook Power 16 G11 A | |
| Lenovo ThinkPad P16s Gen 4 21RX000YGE | |
| WebXPRT 3 / Overall | |
| Lenovo ThinkPad P1 Gen 8 | |
| Medio Intel Core Ultra 7 255H, NVIDIA RTX PRO 2000 Blackwell Generation Laptop (322 - 330, n=2) | |
| Lenovo ThinkPad P16v G3 21RS000DGE | |
| HP ZBook X G1i 16 | |
| Media de la clase Workstation (260 - 360, n=23, últimos 2 años) | |
| Lenovo ThinkPad P16s Gen 4 21RX000YGE | |
| HP ZBook Power 16 G11 A | |
| WebXPRT 4 / Overall | |
| Lenovo ThinkPad P16v G3 21RS000DGE | |
| Medio Intel Core Ultra 7 255H, NVIDIA RTX PRO 2000 Blackwell Generation Laptop (298 - 307, n=2) | |
| HP ZBook X G1i 16 | |
| Lenovo ThinkPad P1 Gen 8 | |
| Media de la clase Workstation (189.2 - 326, n=23, últimos 2 años) | |
| HP ZBook Power 16 G11 A | |
| Lenovo ThinkPad P16s Gen 4 21RX000YGE | |
| Mozilla Kraken 1.1 / Total | |
| HP ZBook Power 16 G11 A | |
| Lenovo ThinkPad P16s Gen 4 21RX000YGE | |
| Lenovo ThinkPad P1 Gen 8 | |
| HP ZBook X G1i 16 | |
| Media de la clase Workstation (411 - 538, n=23, últimos 2 años) | |
| Medio Intel Core Ultra 7 255H, NVIDIA RTX PRO 2000 Blackwell Generation Laptop (448 - 461, n=2) | |
| Lenovo ThinkPad P16v G3 21RS000DGE | |
* ... más pequeño es mejor
| PCMark 10 Score | 9723 puntos | |
ayuda | ||
| AIDA64 / Memory Copy | |
| Lenovo ThinkPad P1 Gen 8 | |
| Medio Intel Core Ultra 7 255H (39188 - 110930, n=17) | |
| Media de la clase Workstation (56003 - 164795, n=23, últimos 2 años) | |
| Lenovo ThinkPad P16v G3 21RS000DGE | |
| Lenovo ThinkPad P16s Gen 4 21RX000YGE | |
| HP ZBook Power 16 G11 A | |
| AIDA64 / Memory Read | |
| Lenovo ThinkPad P16s Gen 4 21RX000YGE | |
| Lenovo ThinkPad P16v G3 21RS000DGE | |
| Medio Intel Core Ultra 7 255H (43703 - 90552, n=17) | |
| Media de la clase Workstation (55795 - 121563, n=23, últimos 2 años) | |
| Lenovo ThinkPad P1 Gen 8 | |
| HP ZBook Power 16 G11 A | |
| AIDA64 / Memory Write | |
| Media de la clase Workstation (55663 - 214520, n=23, últimos 2 años) | |
| HP ZBook Power 16 G11 A | |
| Lenovo ThinkPad P16s Gen 4 21RX000YGE | |
| Lenovo ThinkPad P16v G3 21RS000DGE | |
| Medio Intel Core Ultra 7 255H (36438 - 87199, n=17) | |
| Lenovo ThinkPad P1 Gen 8 | |
| AIDA64 / Memory Latency | |
| Lenovo ThinkPad P1 Gen 8 | |
| Media de la clase Workstation (84.5 - 165.2, n=23, últimos 2 años) | |
| Medio Intel Core Ultra 7 255H (107.6 - 147.2, n=17) | |
| Lenovo ThinkPad P16v G3 21RS000DGE | |
| Lenovo ThinkPad P16s Gen 4 21RX000YGE | |
| HP ZBook Power 16 G11 A | |
* ... más pequeño es mejor
Latencias del CPD
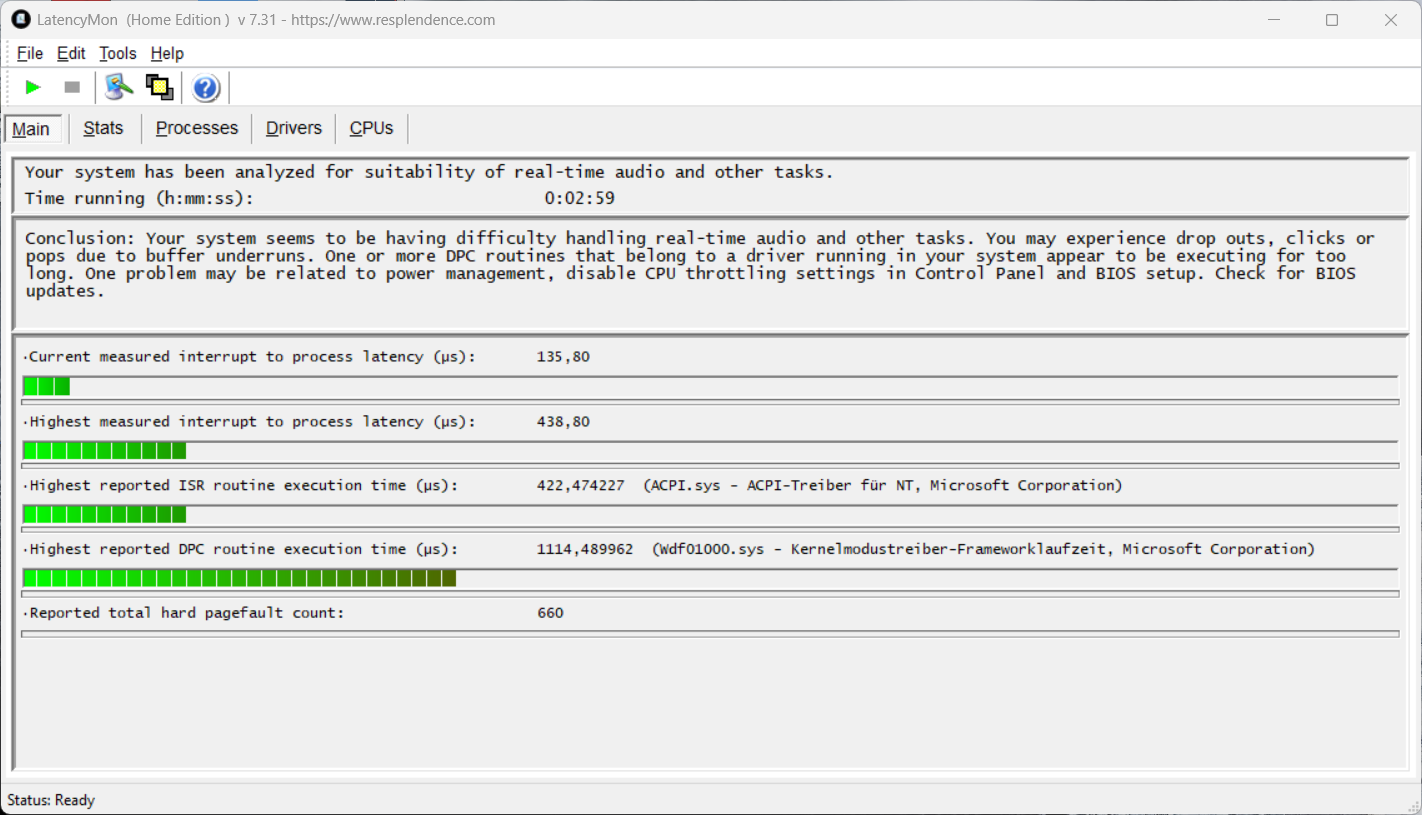
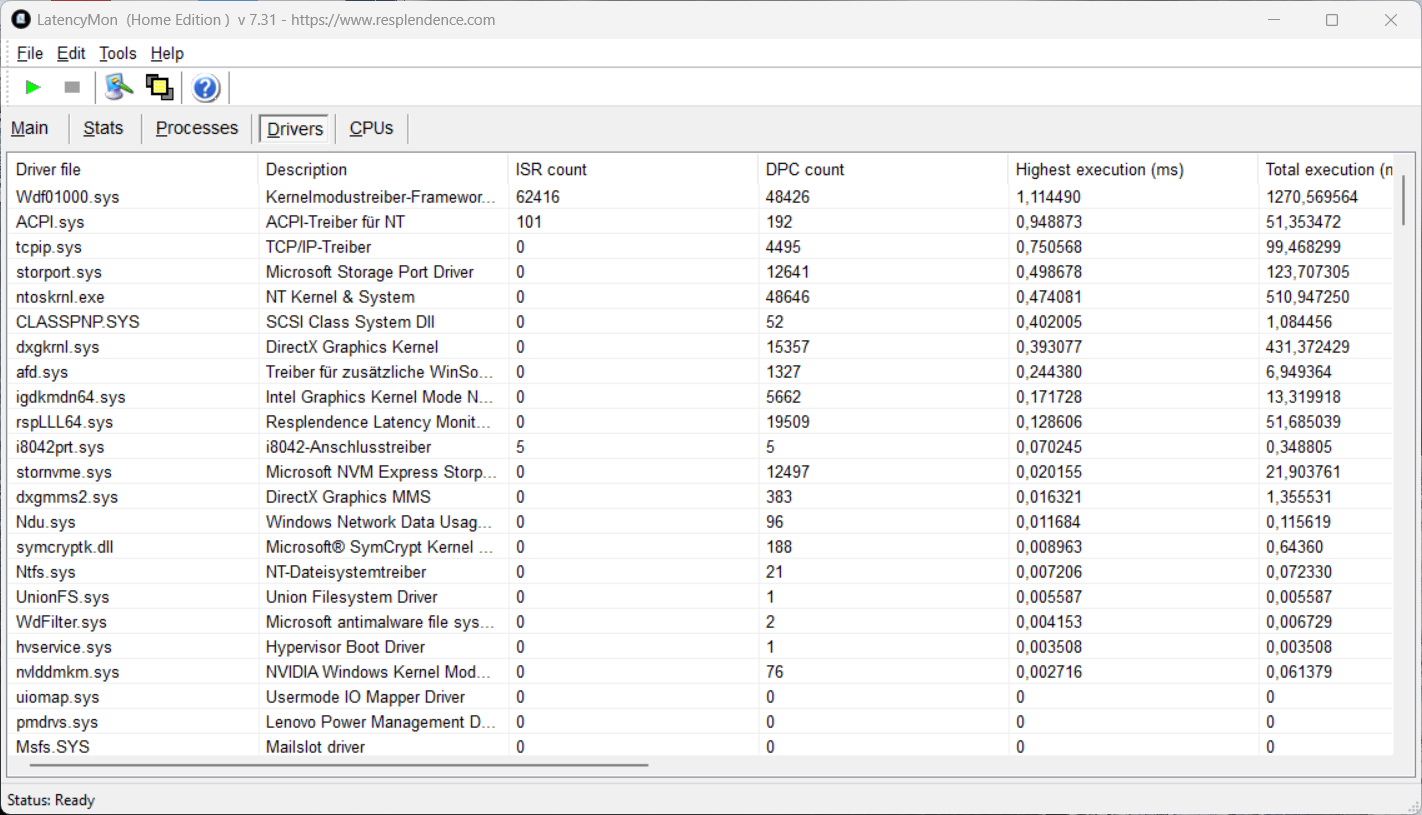
En nuestra prueba de latencia estandarizada (navegación por Internet, reproducción 4K de YouTube, carga de la CPU), el dispositivo de prueba con la versión actual de la BIOS muestra ligeras limitaciones al utilizar aplicaciones de audio en tiempo real.
| DPC Latencies / LatencyMon - interrupt to process latency (max), Web, Youtube, Prime95 | |
| HP ZBook Power 16 G11 A | |
| Lenovo ThinkPad P1 Gen 8 | |
| Lenovo ThinkPad P16s Gen 4 21RX000YGE | |
| HP ZBook X G1i 16 | |
| Lenovo ThinkPad P16v G3 21RS000DGE | |
* ... más pequeño es mejor
Dispositivos de almacenamiento
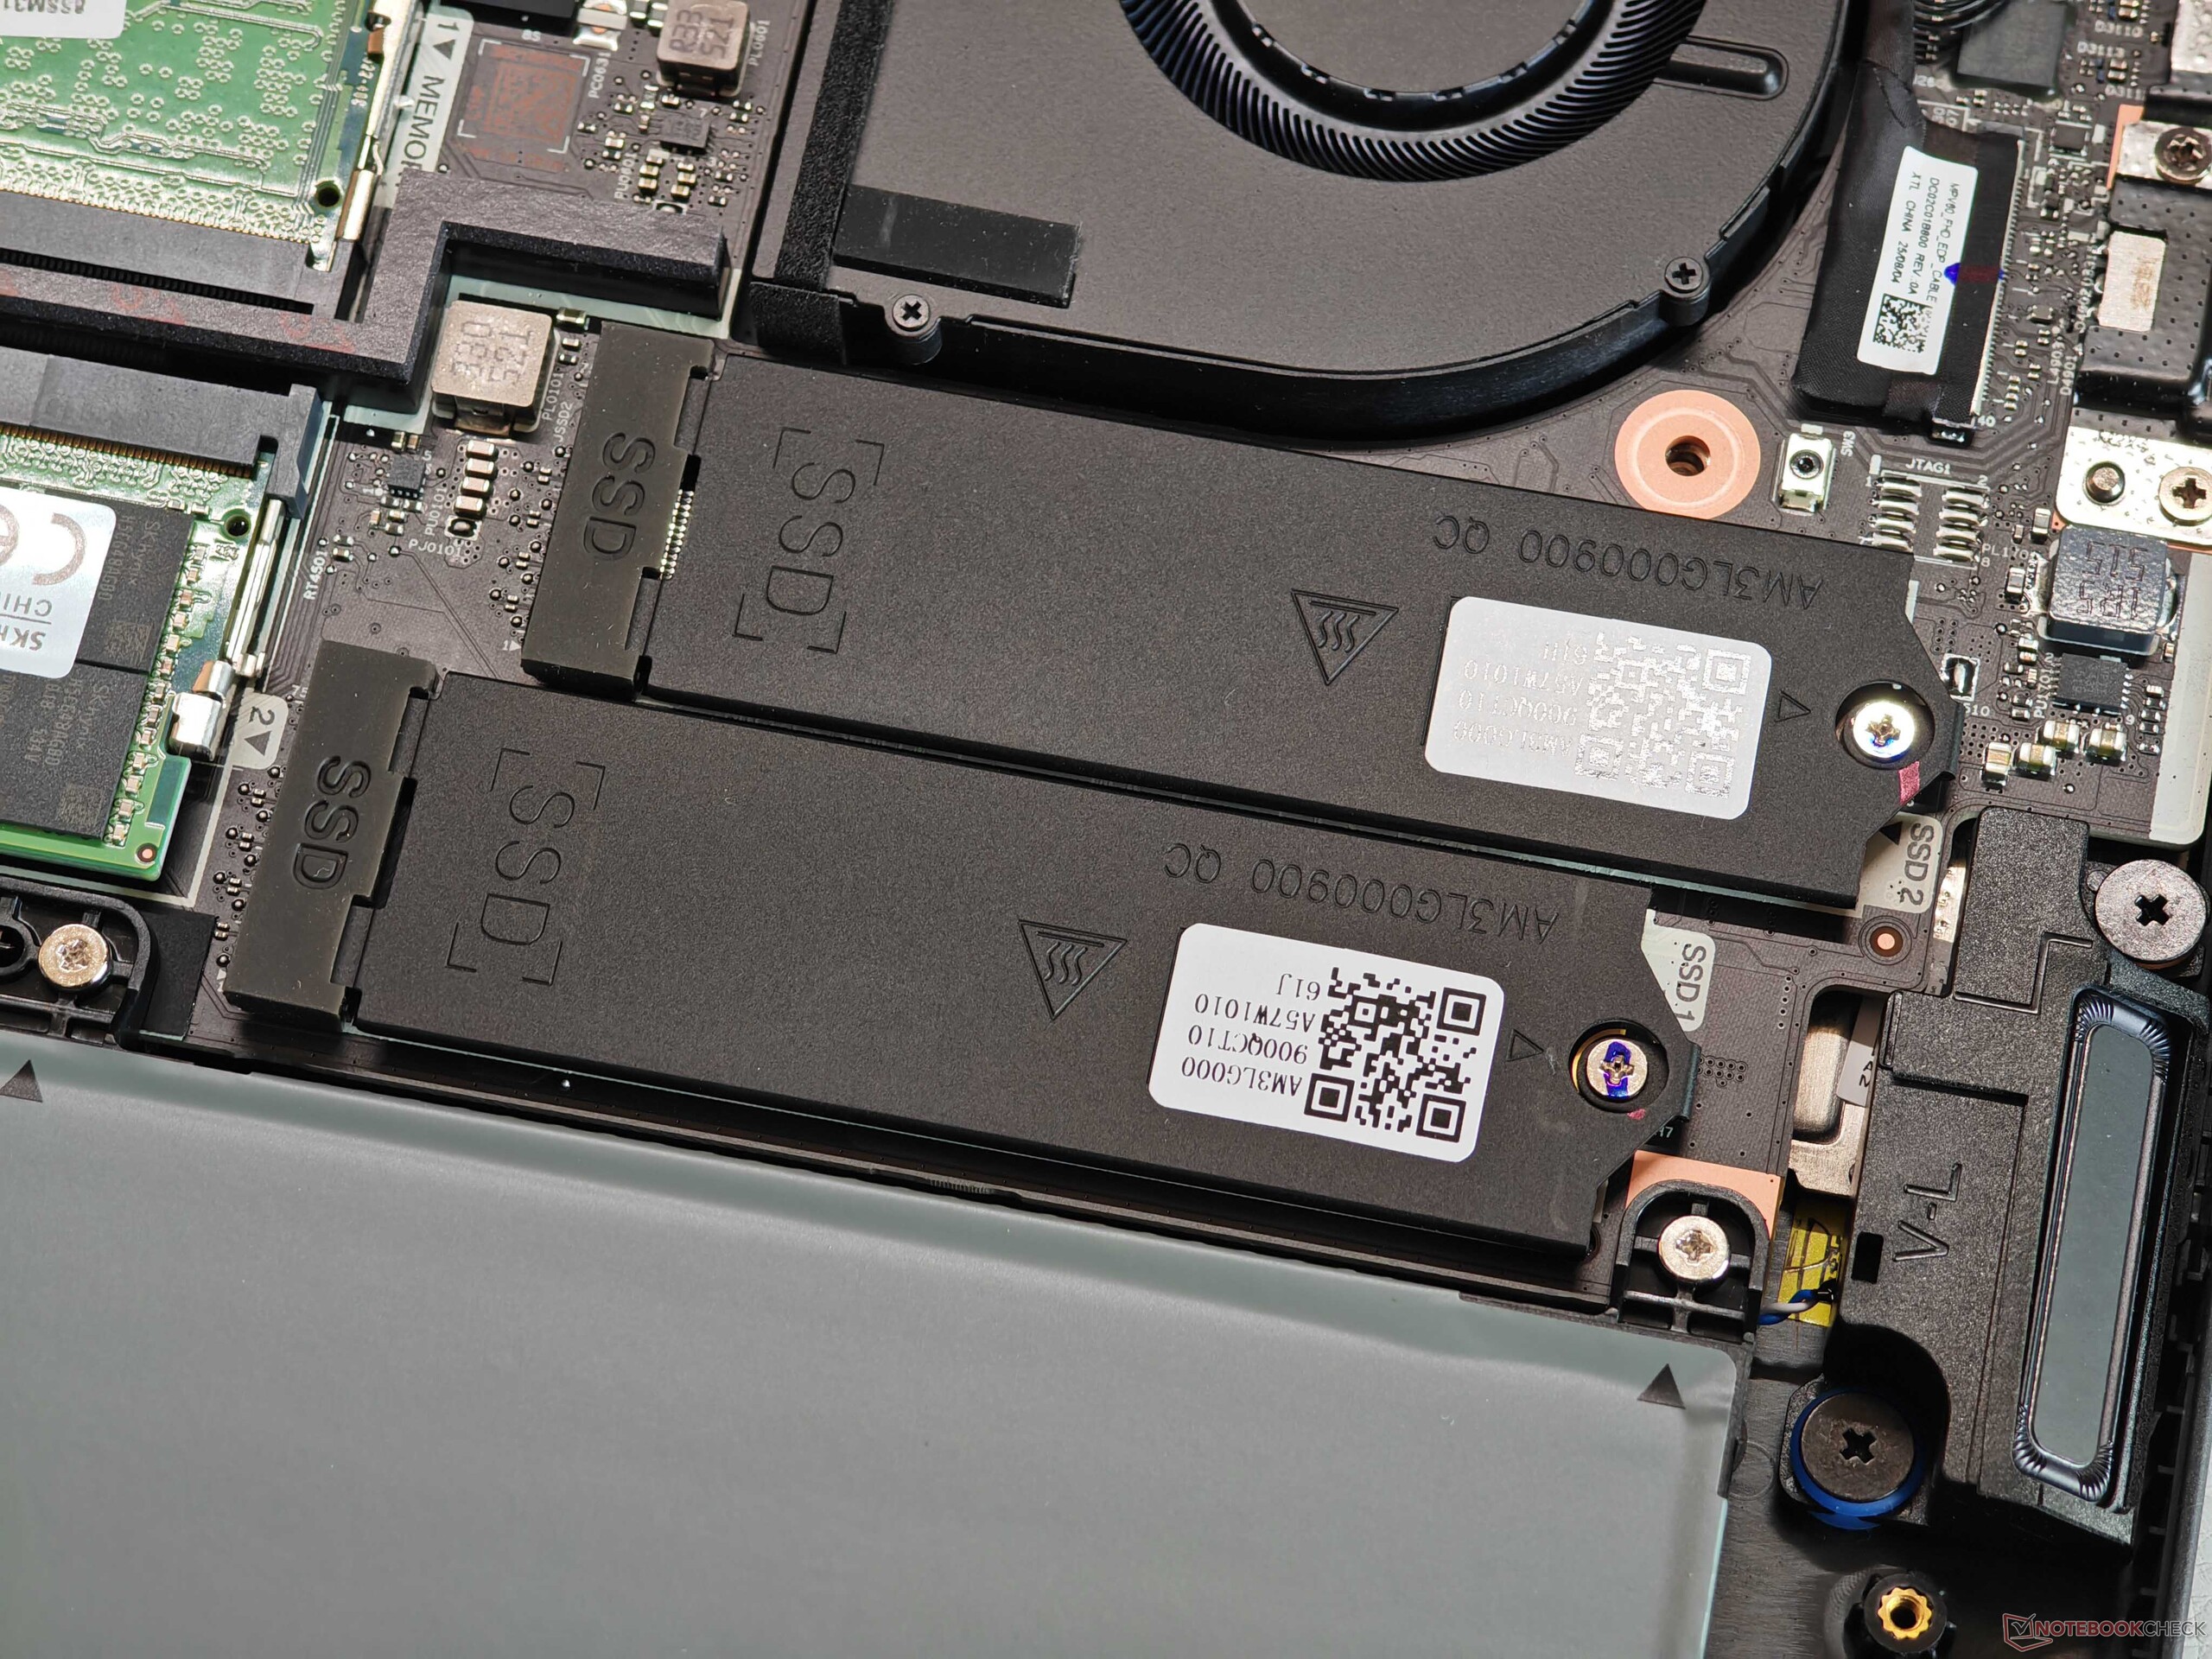
La Samsung PM9E1 (1 TB, 879 GB libres), una SSD PCIe 5.0, ya está instalada en nuestro dispositivo de pruebas, pero las dos ranuras M.2-2280 sólo están conectadas a través de PCIe 4.0. En consecuencia, las velocidades de transferencia son también como máximo de unos 7 GB/s en lugar de 13-14 GB/s. Sin embargo, el rendimiento sigue siendo bueno y se mantiene estable incluso bajo una carga prolongada.

* ... más pequeño es mejor
Rendimiento continuo de lectura: Bucle de lectura DiskSpd, profundidad de cola 8
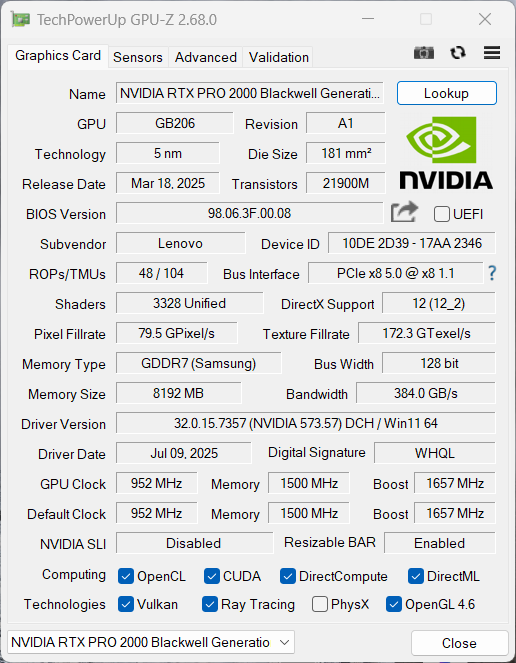
Rendimiento de la GPU
La GPU es la profesional Nvidia RTX PRO 2000 (Blackwell, 8 GB de VRAM), que se activa mediante la tecnología Optimus. El chip en sí es idéntico a la GeForce RTX 5060pero en el caso del P16v Gen 3, sólo se implementa la versión de 60 vatios (sería posible un máximo de 115 vatios), lo que resulta algo decepcionante dada la gran carcasa. Sin embargo, esto es similar para las otras estaciones de trabajo móviles de este segmento (máx. 75 vatios), por lo que el rendimiento gráfico aquí también es comparable. También hemos incluido en la comparación la versión de 115 vatios del portátil RTX 5060, que funciona un 31% más rápido. El rendimiento gráfico se mantiene completamente estable bajo carga continua, pero la GPU sólo puede consumir 25 vatios en modo batería (-56 % de rendimiento).
| 3DMark 11 Performance | 29308 puntos | |
| 3DMark Fire Strike Score | 23134 puntos | |
| 3DMark Time Spy Score | 9371 puntos | |
| 3DMark Steel Nomad Score | 1932 puntos | |
| 3DMark Steel Nomad Light Score | 9029 puntos | |
ayuda | ||
| Blender / v3.3 Classroom OPTIX/RTX | |
| HP ZBook Power 16 G11 A | |
| HP ZBook X G1i 16 | |
| Medio NVIDIA RTX PRO 2000 Blackwell Generation Laptop (22 - 25, n=3) | |
| Lenovo ThinkPad P1 Gen 8 | |
| Lenovo ThinkPad P16v G3 21RS000DGE | |
| Media de la clase Workstation (10 - 43, n=17, últimos 2 años) | |
| Blender / v3.3 Classroom CUDA | |
| HP ZBook Power 16 G11 A | |
| HP ZBook X G1i 16 | |
| Medio NVIDIA RTX PRO 2000 Blackwell Generation Laptop (42 - 45, n=3) | |
| Lenovo ThinkPad P1 Gen 8 | |
| Lenovo ThinkPad P16v G3 21RS000DGE | |
| Media de la clase Workstation (16 - 74, n=17, últimos 2 años) | |
| Blender / v3.3 Classroom CPU | |
| HP ZBook Power 16 G11 A | |
| Lenovo ThinkPad P1 Gen 8 | |
| Lenovo ThinkPad P16v G3 21RS000DGE | |
| Medio NVIDIA RTX PRO 2000 Blackwell Generation Laptop (266 - 273, n=3) | |
| Lenovo ThinkPad P16s Gen 4 21RX000YGE | |
| HP ZBook X G1i 16 | |
| Media de la clase Workstation (148 - 364, n=23, últimos 2 años) | |
* ... más pequeño es mejor
| SPECviewperf 15 | |
| 3840x2160 Siemens NX 2406 (snx-05) | |
| Lenovo ThinkPad P16v G3 21RS000DGE | |
| 3840x2160 Unreal Engine 5.4.2 (unreal_engine-01) | |
| Lenovo ThinkPad P1 Gen 8 | |
| Lenovo ThinkPad P16v G3 21RS000DGE | |
| 3840x2160 Solidworks 2024 (solidworks-08) | |
| Lenovo ThinkPad P1 Gen 8 | |
| Lenovo ThinkPad P16v G3 21RS000DGE | |
| 3840x2160 Tuvok (medical-04) | |
| Lenovo ThinkPad P1 Gen 8 | |
| Lenovo ThinkPad P16v G3 21RS000DGE | |
| 3840x2160 Maya 2025 (maya-07) | |
| Lenovo ThinkPad P1 Gen 8 | |
| Lenovo ThinkPad P16v G3 21RS000DGE | |
| 3840x2160 Enscape 4.0 (enscape-01) | |
| Lenovo ThinkPad P1 Gen 8 | |
| Lenovo ThinkPad P16v G3 21RS000DGE | |
| 3840x2160 OpendTect (energy-04) | |
| Lenovo ThinkPad P1 Gen 8 | |
| Lenovo ThinkPad P16v G3 21RS000DGE | |
| 3840x2160 Creo 9 (creo-04) | |
| Lenovo ThinkPad P1 Gen 8 | |
| Lenovo ThinkPad P16v G3 21RS000DGE | |
| 3840x2160 Blender 3.6 (blender-01) | |
| Lenovo ThinkPad P1 Gen 8 | |
| Lenovo ThinkPad P16v G3 21RS000DGE | |
| 3840x2160 3ds Max 2023 (3dsmax-08) | |
| Lenovo ThinkPad P1 Gen 8 | |
| Lenovo ThinkPad P16v G3 21RS000DGE | |
Rendimiento en juegos
La RTX PRO 2000 es perfectamente capaz de manejar los juegos y los controladores profesionales no supusieron ningún problema. En principio, se puede jugar a la mayoría de títulos modernos en la resolución nativa y detalles altos/máximos sin problemas. Hace poco escribimos sobre las limitaciones de la VRAM de 8 GB en un artículo aparte.
| Performance rating - Percent | |
| Media de la clase Workstation | |
| Lenovo ThinkPad P1 Gen 8 | |
| HP ZBook X G1i 16 | |
| Lenovo ThinkPad P16v G3 21RS000DGE | |
| HP ZBook Power 16 G11 A | |
| Lenovo ThinkPad P16s Gen 4 21RX000YGE -1! | |
| Cyberpunk 2077 - 1920x1080 Ultra Preset (FSR off) | |
| Media de la clase Workstation (21.5 - 152.4, n=23, últimos 2 años) | |
| Lenovo ThinkPad P1 Gen 8 | |
| HP ZBook X G1i 16 | |
| Lenovo ThinkPad P16v G3 21RS000DGE | |
| HP ZBook Power 16 G11 A | |
| Lenovo ThinkPad P16s Gen 4 21RX000YGE | |
| Baldur's Gate 3 - 1920x1080 Ultra Preset AA:T | |
| Lenovo ThinkPad P1 Gen 8 | |
| Media de la clase Workstation (23.7 - 205, n=24, últimos 2 años) | |
| HP ZBook X G1i 16 | |
| Lenovo ThinkPad P16v G3 21RS000DGE | |
| HP ZBook Power 16 G11 A | |
| Lenovo ThinkPad P16s Gen 4 21RX000YGE | |
| GTA V - 1920x1080 Highest AA:4xMSAA + FX AF:16x | |
| Lenovo ThinkPad P1 Gen 8 | |
| Lenovo ThinkPad P16v G3 21RS000DGE | |
| HP ZBook X G1i 16 | |
| Media de la clase Workstation (18.1 - 156.1, n=23, últimos 2 años) | |
| HP ZBook Power 16 G11 A | |
| Lenovo ThinkPad P16s Gen 4 21RX000YGE | |
| Final Fantasy XV Benchmark - 1920x1080 High Quality | |
| Lenovo ThinkPad P1 Gen 8 | |
| Media de la clase Workstation (26.4 - 197.6, n=23, últimos 2 años) | |
| HP ZBook X G1i 16 | |
| Lenovo ThinkPad P16v G3 21RS000DGE | |
| HP ZBook Power 16 G11 A | |
| Lenovo ThinkPad P16s Gen 4 21RX000YGE | |
| Strange Brigade - 1920x1080 ultra AA:ultra AF:16 | |
| Media de la clase Workstation (93.2 - 418, n=17, últimos 2 años) | |
| Lenovo ThinkPad P1 Gen 8 | |
| HP ZBook X G1i 16 | |
| Lenovo ThinkPad P16v G3 21RS000DGE | |
| HP ZBook Power 16 G11 A | |
| Dota 2 Reborn - 1920x1080 ultra (3/3) best looking | |
| Lenovo ThinkPad P16v G3 21RS000DGE | |
| HP ZBook X G1i 16 | |
| Media de la clase Workstation (50.7 - 178.4, n=23, últimos 2 años) | |
| Lenovo ThinkPad P1 Gen 8 | |
| HP ZBook Power 16 G11 A | |
| Lenovo ThinkPad P16s Gen 4 21RX000YGE | |
Cyberpunk 2077 ultra FPS gráfico
| bajo | medio | alto | ultra | |
|---|---|---|---|---|
| GTA V (2015) | 174.7 | 117.7 | ||
| Dota 2 Reborn (2015) | 174.2 | 159.8 | 151.6 | 142.8 |
| Final Fantasy XV Benchmark (2018) | 199.5 | 127.3 | 98.1 | |
| X-Plane 11.11 (2018) | 105.4 | 95.2 | 78.8 | |
| Strange Brigade (2018) | 469 | 241 | 194.1 | 167.8 |
| Baldur's Gate 3 (2023) | 121.3 | 96 | 81.4 | 81.2 |
| Cyberpunk 2077 (2023) | 119.5 | 93.5 | 79.1 | 70.1 |
| F1 24 (2024) | 200 | 194.8 | 165.5 | 53.3 |
Emisiones y energía
Emisiones sonoras

La unidad de refrigeración permanece muy silenciosa durante las tareas cotidianas (máx. 29,2 dB(A)), pero se vuelve notablemente más ruidosa cuando los componentes se someten a un mayor esfuerzo. En el modo de mejor rendimiento, medimos 47,1 dB(A) durante los juegos y la prueba de estrés(equilibrado: 43,2 dB(A), mejor eficiencia energética: 39,9 dB(A), batería: 37 dB(A)). no se produjo ningún quejido de la bobina en el dispositivo de prueba.
Ruido
| Ocioso |
| 25.9 / 25.9 / 29.2 dB(A) |
| Carga |
| 37.5 / 47.1 dB(A) |
 | ||
30 dB silencioso 40 dB(A) audible 50 dB(A) ruidosamente alto |
||
min: | ||
| Lenovo ThinkPad P16v G3 21RS000DGE Ultra 7 255H, RTX PRO 2000 Blackwell Generation Laptop | Lenovo ThinkPad P1 Gen 8 Ultra 7 255H, RTX PRO 2000 Blackwell Generation Laptop | HP ZBook X G1i 16 Ultra 7 265H, RTX PRO 2000 Blackwell Generation Laptop | HP ZBook Power 16 G11 A R7 8845HS, RTX 2000 Ada Generation Laptop | Lenovo ThinkPad P16s Gen 4 21RX000YGE Ryzen AI 9 HX PRO 370, Radeon 890M | |
|---|---|---|---|---|---|
| Noise | 13% | 7% | 12% | -3% | |
| apagado / medio ambiente * (dB) | 25.9 | 23.1 11% | 23.7 8% | 23.5 9% | 25.9 -0% |
| Idle Minimum * (dB) | 25.9 | 23.1 11% | 23.7 8% | 23.8 8% | 25.9 -0% |
| Idle Average * (dB) | 25.9 | 23.1 11% | 23.7 8% | 24.2 7% | 25.9 -0% |
| Idle Maximum * (dB) | 29.2 | 23.1 21% | 23.7 19% | 24.2 17% | 28.5 2% |
| Load Average * (dB) | 37.5 | 27.3 27% | 32.7 13% | 25.4 32% | 42.9 -14% |
| Cyberpunk 2077 ultra * (dB) | 47.1 | 50.9 -8% | 43 9% | 48.7 -3% | |
| Load Maximum * (dB) | 47.1 | 47.9 -2% | 48 -2% | 45 4% | 48.5 -3% |
* ... más pequeño es mejor
Temperatura
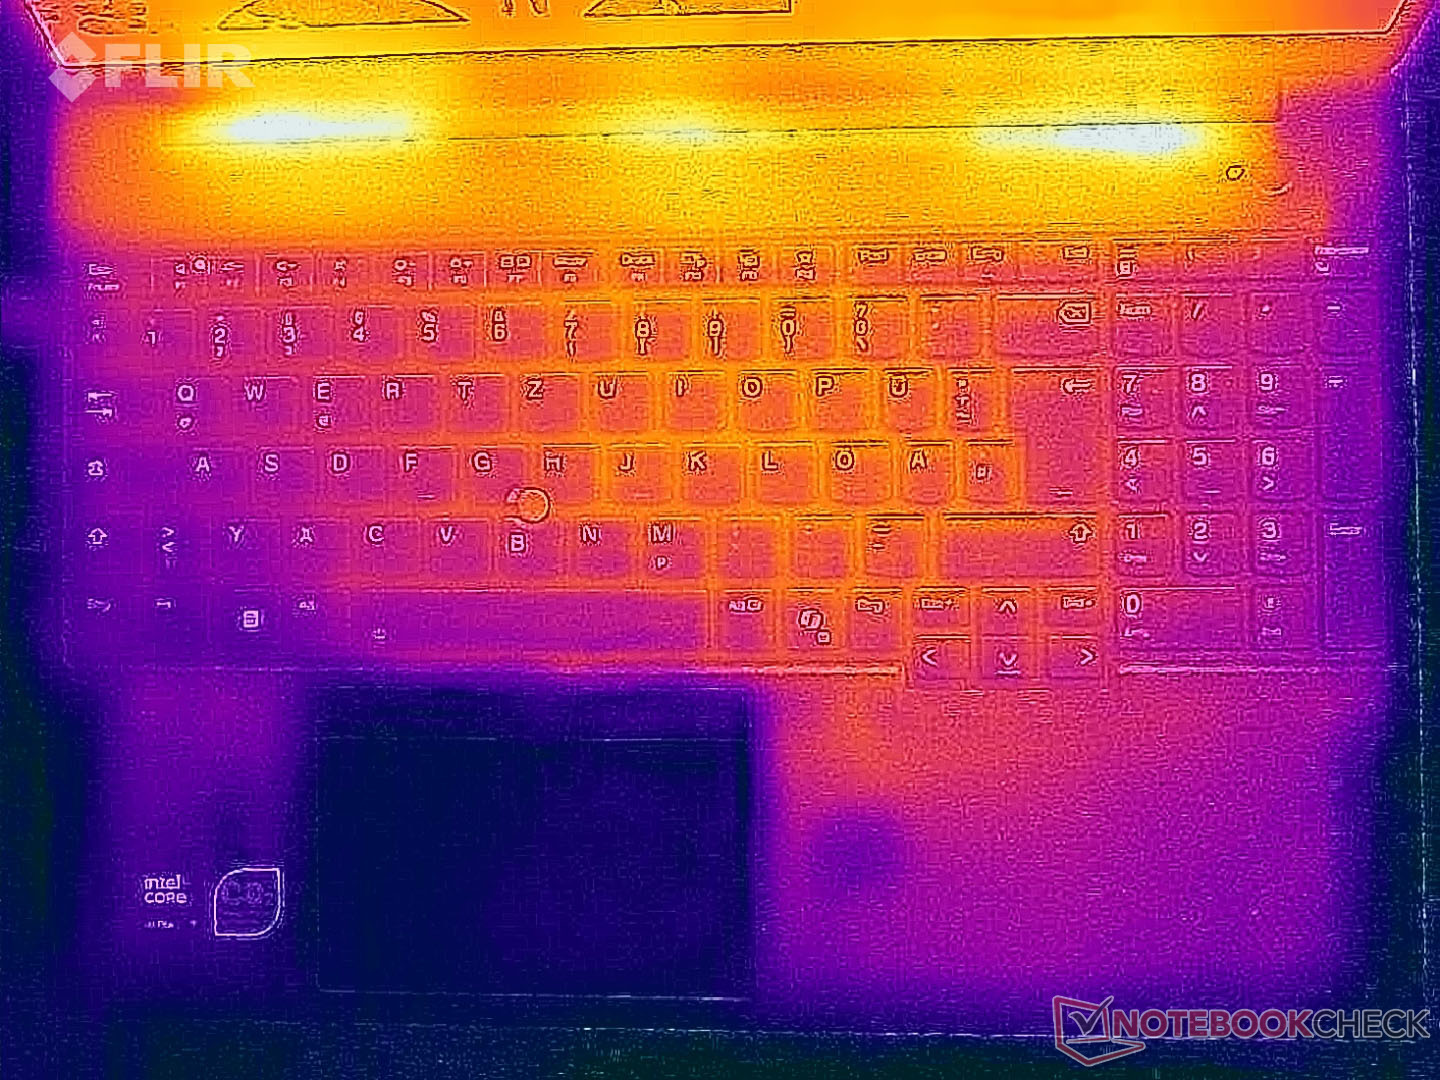
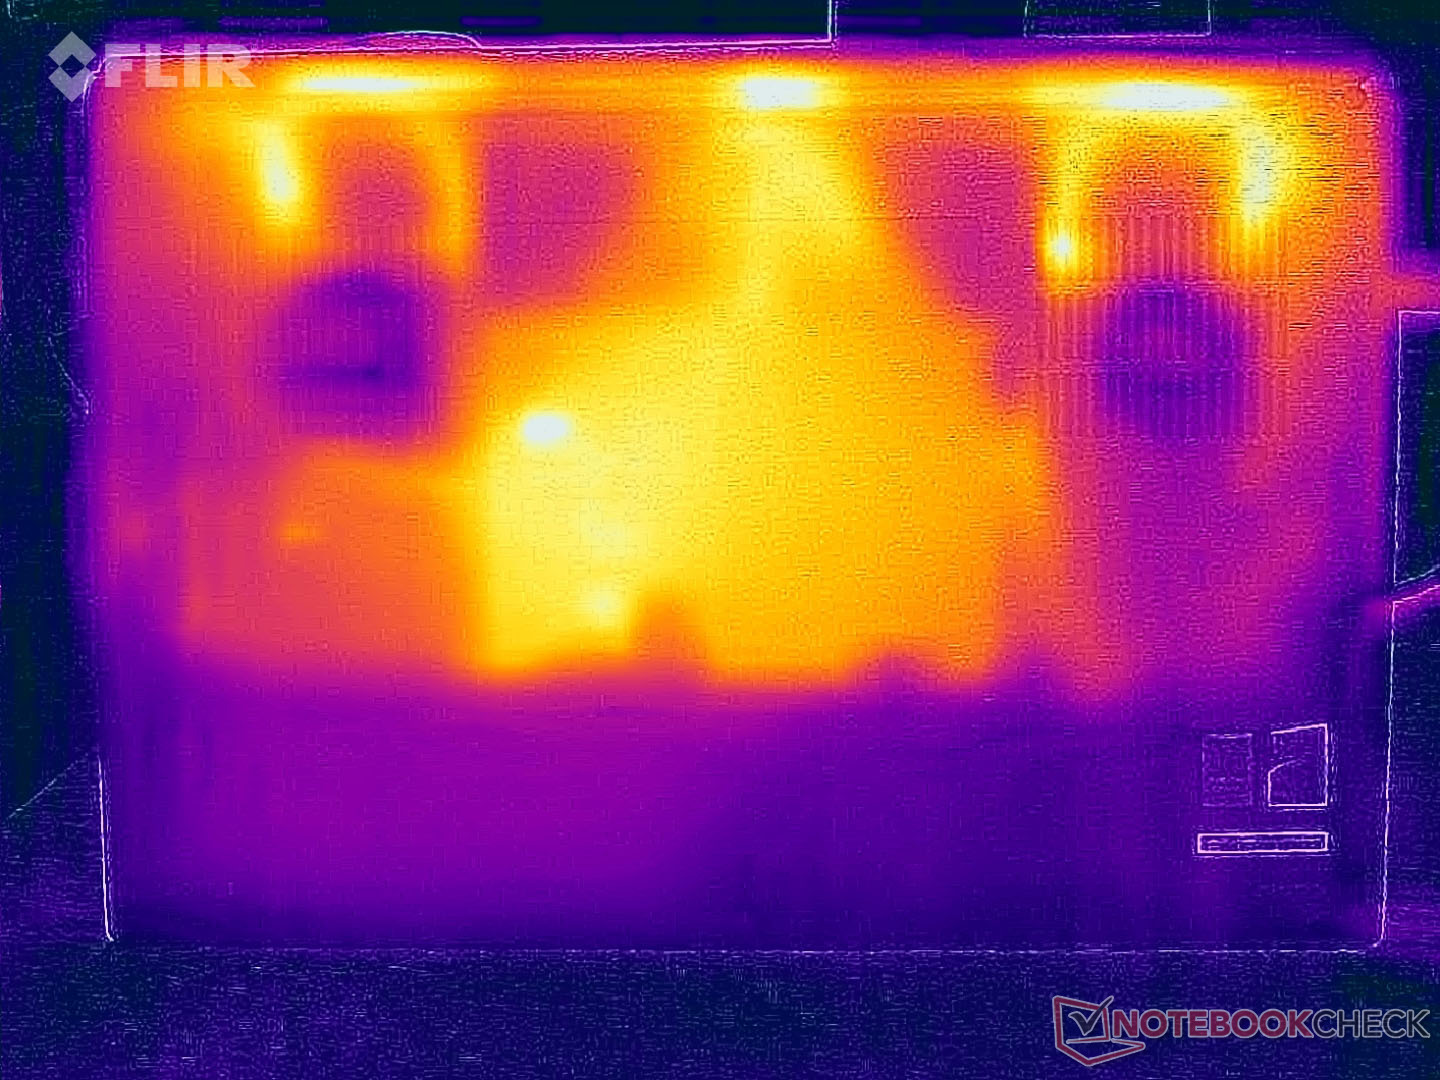
Las temperaturas de la superficie siguen siendo completamente inofensivas incluso en la prueba de estrés, ya que sólo medimos algo menos de 45 °C (113 °F) en un punto de la parte inferior; los demás puntos de medición permanecen notablemente más fríos. En la prueba de estrés, el procesador se estabilizó en ~34 vatios (81 °C/177,8 °F) y la GPU en ~55 vatios (76 °C/168,8 °F). Esto no es particularmente alto teniendo en cuenta la gran carcasa.

(+) La temperatura máxima en la parte superior es de 39.9 °C / 104 F, frente a la media de 38.2 °C / 101 F, que oscila entre 22.2 y 69.8 °C para la clase Workstation.
(±) El fondo se calienta hasta un máximo de 44.8 °C / 113 F, frente a la media de 41.1 °C / 106 F
(+) En reposo, la temperatura media de la parte superior es de 23.5 °C / 74# F, frente a la media del dispositivo de 32 °C / 90 F.
(±) 3: The average temperature for the upper side is 33 °C / 91 F, compared to the average of 32 °C / 90 F for the class Workstation.
(+) Los reposamanos y el panel táctil alcanzan como máximo la temperatura de la piel (32.1 °C / 89.8 F) y, por tanto, no están calientes.
(-) La temperatura media de la zona del reposamanos de dispositivos similares fue de 27.8 °C / 82 F (-4.3 °C / -7.8 F).
| Lenovo ThinkPad P16v G3 21RS000DGE Ultra 7 255H, RTX PRO 2000 Blackwell Generation Laptop | Lenovo ThinkPad P1 Gen 8 Ultra 7 255H, RTX PRO 2000 Blackwell Generation Laptop | HP ZBook X G1i 16 Ultra 7 265H, RTX PRO 2000 Blackwell Generation Laptop | HP ZBook Power 16 G11 A R7 8845HS, RTX 2000 Ada Generation Laptop | Lenovo ThinkPad P16s Gen 4 21RX000YGE Ryzen AI 9 HX PRO 370, Radeon 890M | |
|---|---|---|---|---|---|
| Heat | -10% | -8% | -2% | -37% | |
| Maximum Upper Side * (°C) | 39.9 | 45 -13% | 36 10% | 40.6 -2% | 50.6 -27% |
| Maximum Bottom * (°C) | 44.8 | 33 26% | 39.4 12% | 40.6 9% | 54.3 -21% |
| Idle Upper Side * (°C) | 24 | 30.6 -28% | 30.4 -27% | 26 -8% | 35.3 -47% |
| Idle Bottom * (°C) | 25 | 31.6 -26% | 31.8 -27% | 26.6 -6% | 38.5 -54% |
* ... más pequeño es mejor
Altavoces
Los altavoces estéreo apenas convencen; el ThinkPad P1 16 G8 tiene una clara ventaja.
Lenovo ThinkPad P16v G3 21RS000DGE análisis de audio
(±) | la sonoridad del altavoz es media pero buena (78.2 dB)
Graves 100 - 315 Hz
(±) | lubina reducida - en promedio 10.7% inferior a la mediana
(±) | la linealidad de los graves es media (10% delta a frecuencia anterior)
Medios 400 - 2000 Hz
(±) | medias más altas - de media 7.2% más altas que la mediana
(+) | los medios son lineales (5.3% delta a la frecuencia anterior)
Altos 2 - 16 kHz
(+) | máximos equilibrados - a sólo 1.3% de la mediana
(+) | los máximos son lineales (3.8% delta a la frecuencia anterior)
Total 100 - 16.000 Hz
(±) | la linealidad del sonido global es media (15.6% de diferencia con la mediana)
En comparación con la misma clase
» 35% de todos los dispositivos probados de esta clase eran mejores, 11% similares, 54% peores
» El mejor tuvo un delta de 7%, la media fue 17%, el peor fue ###max##%
En comparación con todos los dispositivos probados
» 23% de todos los dispositivos probados eran mejores, 5% similares, 72% peores
» El mejor tuvo un delta de 4%, la media fue 23%, el peor fue ###max##%
Lenovo ThinkPad P1 Gen 8 análisis de audio
(+) | los altavoces pueden reproducir a un volumen relativamente alto (#87.5 dB)
Graves 100 - 315 Hz
(±) | lubina reducida - en promedio 9.8% inferior a la mediana
(±) | la linealidad de los graves es media (11.2% delta a frecuencia anterior)
Medios 400 - 2000 Hz
(+) | medios equilibrados - a sólo 2.9% de la mediana
(+) | los medios son lineales (2.8% delta a la frecuencia anterior)
Altos 2 - 16 kHz
(+) | máximos equilibrados - a sólo 3% de la mediana
(+) | los máximos son lineales (4.7% delta a la frecuencia anterior)
Total 100 - 16.000 Hz
(+) | el sonido global es lineal (8.3% de diferencia con la mediana)
En comparación con la misma clase
» 1% de todos los dispositivos probados de esta clase eran mejores, 1% similares, 97% peores
» El mejor tuvo un delta de 7%, la media fue 17%, el peor fue ###max##%
En comparación con todos los dispositivos probados
» 2% de todos los dispositivos probados eran mejores, 1% similares, 97% peores
» El mejor tuvo un delta de 4%, la media fue 23%, el peor fue ###max##%
HP ZBook X G1i 16 análisis de audio
(+) | los altavoces pueden reproducir a un volumen relativamente alto (#84 dB)
Graves 100 - 315 Hz
(-) | casi sin bajos - de media 28% inferior a la mediana
(±) | la linealidad de los graves es media (8.8% delta a frecuencia anterior)
Medios 400 - 2000 Hz
(+) | medios equilibrados - a sólo 1.9% de la mediana
(+) | los medios son lineales (6.1% delta a la frecuencia anterior)
Altos 2 - 16 kHz
(+) | máximos equilibrados - a sólo 2.9% de la mediana
(+) | los máximos son lineales (5.1% delta a la frecuencia anterior)
Total 100 - 16.000 Hz
(±) | la linealidad del sonido global es media (15.6% de diferencia con la mediana)
En comparación con la misma clase
» 35% de todos los dispositivos probados de esta clase eran mejores, 11% similares, 54% peores
» El mejor tuvo un delta de 7%, la media fue 17%, el peor fue ###max##%
En comparación con todos los dispositivos probados
» 23% de todos los dispositivos probados eran mejores, 5% similares, 72% peores
» El mejor tuvo un delta de 4%, la media fue 23%, el peor fue ###max##%
HP ZBook Power 16 G11 A análisis de audio
(+) | los altavoces pueden reproducir a un volumen relativamente alto (#87.9 dB)
Graves 100 - 315 Hz
(-) | casi sin bajos - de media 28.1% inferior a la mediana
(±) | la linealidad de los graves es media (9% delta a frecuencia anterior)
Medios 400 - 2000 Hz
(+) | medios equilibrados - a sólo 1.9% de la mediana
(+) | los medios son lineales (4.8% delta a la frecuencia anterior)
Altos 2 - 16 kHz
(+) | máximos equilibrados - a sólo 3.6% de la mediana
(+) | los máximos son lineales (2.4% delta a la frecuencia anterior)
Total 100 - 16.000 Hz
(±) | la linealidad del sonido global es media (15.1% de diferencia con la mediana)
En comparación con la misma clase
» 33% de todos los dispositivos probados de esta clase eran mejores, 7% similares, 60% peores
» El mejor tuvo un delta de 7%, la media fue 17%, el peor fue ###max##%
En comparación con todos los dispositivos probados
» 21% de todos los dispositivos probados eran mejores, 4% similares, 75% peores
» El mejor tuvo un delta de 4%, la media fue 23%, el peor fue ###max##%
Lenovo ThinkPad P16s Gen 4 21RX000YGE análisis de audio
(±) | la sonoridad del altavoz es media pero buena (79.6 dB)
Graves 100 - 315 Hz
(-) | casi sin bajos - de media 15.7% inferior a la mediana
(±) | la linealidad de los graves es media (11.9% delta a frecuencia anterior)
Medios 400 - 2000 Hz
(±) | medias más altas - de media 5.8% más altas que la mediana
(+) | los medios son lineales (5.9% delta a la frecuencia anterior)
Altos 2 - 16 kHz
(+) | máximos equilibrados - a sólo 1.5% de la mediana
(+) | los máximos son lineales (4.6% delta a la frecuencia anterior)
Total 100 - 16.000 Hz
(±) | la linealidad del sonido global es media (16.2% de diferencia con la mediana)
En comparación con la misma clase
» 43% de todos los dispositivos probados de esta clase eran mejores, 7% similares, 50% peores
» El mejor tuvo un delta de 7%, la media fue 17%, el peor fue ###max##%
En comparación con todos los dispositivos probados
» 26% de todos los dispositivos probados eran mejores, 6% similares, 68% peores
» El mejor tuvo un delta de 4%, la media fue 23%, el peor fue ###max##%
Consumo de energía

El consumo máximo en modo inactivo es de 12,7 vatios, que es relativamente alto teniendo en cuenta la baja resolución de la pantalla. Medimos brevemente ~140 vatios en la prueba de estrés, pero se estabilizó rápidamente en ~120 vatios. Por tanto, la fuente de alimentación de 140 vatios está suficientemente dimensionada.
| Off / Standby | |
| Ocioso | |
| Carga |
|
Clave:
min: | |
| Lenovo ThinkPad P16v G3 21RS000DGE Ultra 7 255H, RTX PRO 2000 Blackwell Generation Laptop, Samsung PM9E1 1 TB MZVLC1T0HFLU, IPS, 1920x1200, 16" | Lenovo ThinkPad P1 Gen 8 Ultra 7 255H, RTX PRO 2000 Blackwell Generation Laptop, Samsung PM9E1 1 TB MZVLC1T0HFLU, Tandem OLED, 3200x2000, 16" | HP ZBook X G1i 16 Ultra 7 265H, RTX PRO 2000 Blackwell Generation Laptop, Samsung PM9A1 MZVL22T0HBLB, IPS, 2560x1600, 16" | HP ZBook Power 16 G11 A R7 8845HS, RTX 2000 Ada Generation Laptop, Samsung PM9A1 MZVL22T0HBLB, IPS, 2560x1600, 16" | Lenovo ThinkPad P16s Gen 4 21RX000YGE Ryzen AI 9 HX PRO 370, Radeon 890M, Micron 3500 1TB MTFDKBA1T0TGD, IPS LED, 1920x1200, 16" | Medio NVIDIA RTX PRO 2000 Blackwell Generation Laptop | Media de la clase Workstation | |
|---|---|---|---|---|---|---|---|
| Power Consumption | -50% | 12% | 14% | 41% | -18% | -36% | |
| Idle Minimum * (Watt) | 4.8 | 15.4 -221% | 4.1 15% | 4.6 4% | 3.9 19% | 8.1 ? -69% | 9.11 ? -90% |
| Idle Average * (Watt) | 12.3 | 16.5 -34% | 9 27% | 10 19% | 8.3 33% | 12.6 ? -2% | 13.8 ? -12% |
| Idle Maximum * (Watt) | 12.7 | 23.1 -82% | 9.4 26% | 10.6 17% | 8.7 31% | 15.1 ? -19% | 17.9 ? -41% |
| Load Average * (Watt) | 89.6 | 86.6 3% | 86.7 3% | 60.9 32% | 51.6 42% | 87.6 ? 2% | 96 ? -7% |
| Cyberpunk 2077 ultra external monitor * (Watt) | 115.8 | 121.8 -5% | 102 12% | 92.8 20% | 54.6 53% | ||
| Cyberpunk 2077 ultra * (Watt) | 115.1 | 123.1 -7% | 106.1 8% | 96.8 16% | 55.4 52% | ||
| Load Maximum * (Watt) | 139.5 | 143.6 -3% | 152.9 -10% | 154.8 -11% | 63.7 54% | 145.3 ? -4% | 180.3 ? -29% |
* ... más pequeño es mejor
Consumo de energía Cyberpunk / Prueba de estrés
Consumo de energía con monitor externo
Duración de las pilas
Con la batería de 90 Wh, medimos 14:11 horas (150 cd/m²) y 8:51 horas (brillo máximo) en la prueba WLAN, que son buenos resultados.

| Lenovo ThinkPad P16v G3 21RS000DGE Ultra 7 255H, RTX PRO 2000 Blackwell Generation Laptop, 90 Wh | Lenovo ThinkPad P1 Gen 8 Ultra 7 255H, RTX PRO 2000 Blackwell Generation Laptop, 90 Wh | HP ZBook X G1i 16 Ultra 7 265H, RTX PRO 2000 Blackwell Generation Laptop, 83 Wh | HP ZBook Power 16 G11 A R7 8845HS, RTX 2000 Ada Generation Laptop, 83 Wh | Lenovo ThinkPad P16s Gen 4 21RX000YGE Ryzen AI 9 HX PRO 370, Radeon 890M, 86 Wh | Media de la clase Workstation | |
|---|---|---|---|---|---|---|
| Battery Runtime | -61% | -12% | -32% | -2% | -30% | |
| WiFi Websurfing (h) | 14.2 | 5.5 -61% | 12.5 -12% | 9.7 -32% | 13.9 -2% | 8.55 ? -40% |
| WiFi Websurfing max. Brightness (h) | 8.9 | 7.17 ? -19% |
Valoración general de Notebookcheck
Lenovo ThinkPad P16v G3 21RS000DGE
- 01/14/2026 v8
Andreas Osthoff
 Total Sustainability Score:
 Posibles alternativas en comparación
Imagen | Modelo | Precio | Peso | Altura | Pantalla |
|---|---|---|---|---|---|
1. 87.3%  | Lenovo ThinkPad P16v G3 21RS000DGE Intel Core Ultra 7 255H ⎘ NVIDIA RTX PRO 2000 Blackwell Generation Laptop ⎘ 32 GB Memoría, 1024 GB SSD | Amazon: Precio de catálogo: 2825€ | 2.2 kg | 19.6 mm | 16.00" 1920x1200 IPS |
2. 91.6%  | Lenovo ThinkPad P1 Gen 8 Intel Core Ultra 7 255H ⎘ NVIDIA RTX PRO 2000 Blackwell Generation Laptop ⎘ 32 GB Memoría, 1024 GB SSD | Amazon: Precio de catálogo: 2000 USD | 1.9 kg | 20.6 mm | 16.00" 3200x2000 236 PPI Tandem OLED |
3. 87.4%  | HP ZBook X G1i 16 Intel Core Ultra 7 265H ⎘ NVIDIA RTX PRO 2000 Blackwell Generation Laptop ⎘ 64 GB Memoría, 2048 GB SSD | Amazon: Precio de catálogo: 2700 USD | 2.2 kg | 23 mm | 16.00" 2560x1600 189 PPI IPS |
4. 85.4%  | HP ZBook Power 16 G11 A AMD Ryzen 7 8845HS ⎘ NVIDIA RTX 2000 Ada Generation Laptop ⎘ 64 GB Memoría, 2048 GB SSD | Amazon: Precio de catálogo: 2100 USD | 2.2 kg | 22.9 mm | 16.00" 2560x1600 189 PPI IPS |
5. 82%  | Lenovo ThinkPad P16s Gen 4 21RX000YGE AMD Ryzen AI 9 HX PRO 370 ⎘ AMD Radeon 890M ⎘ 64 GB Memoría, 1024 GB SSD | Amazon: Precio de catálogo: 2440 Euro | 2 kg | 23 mm | 16.00" 1920x1200 142 PPI IPS LED |
Transparencia
La selección de los dispositivos que se van a reseñar corre a cargo de nuestro equipo editorial. La muestra de prueba fue proporcionada al autor en calidad de préstamo por el fabricante o el minorista a los efectos de esta reseña. El prestamista no tuvo ninguna influencia en esta reseña, ni el fabricante recibió una copia de la misma antes de su publicación. No había ninguna obligación de publicar esta reseña. Como empresa de medios independiente, Notebookcheck no está sujeta a la autoridad de fabricantes, minoristas o editores.
Así es como prueba Notebookcheck
Cada año, Notebookcheck revisa de forma independiente cientos de portátiles y smartphones utilizando procedimientos estandarizados para asegurar que todos los resultados son comparables. Hemos desarrollado continuamente nuestros métodos de prueba durante unos 20 años y hemos establecido los estándares de la industria en el proceso. En nuestros laboratorios de pruebas, técnicos y editores experimentados utilizan equipos de medición de alta calidad. Estas pruebas implican un proceso de validación en varias fases. Nuestro complejo sistema de clasificación se basa en cientos de mediciones y puntos de referencia bien fundamentados, lo que mantiene la objetividad.