 Deutsch
 English
 Español
 Français
 Italiano
 Nederlands
 Polski
 Português
 Русский
 Türkçe
 Svenska
 Chinese
 Magyar
Análisis del portátil Alienware x15 R2: El ultrabook UFO se dispara con el Core i9-12900H y la RTX 3080 Ti de 140 W

Hace tiempo que Dell ha sustituido el Alienware m15 con el x15. La serie x15 básicamente tiene el mismo lenguaje de diseño que el chasis Legend del m15 pero ahora es más delgado. Este año, tenemos el Alienware x15 R2 y el Alienware x17 R2 compitiendo por un trozo del pastel que tanto te ha costado ganar.
Ya hemos analizado el Alienware x15 R1 y el Alienware x17 R2, así que ahora es el momento de revisar el Alienware x15 R2 también y ver lo que la actualización de Alder Lake-H de este año tiene para nosotros.
El Alienware x15 R2 de este año es más o menos un refrito de la última generación x15 R1. Sin embargo, vemos algunas mejoras internas muy necesarias, incluyendo las actualizaciones de Intel 12th gen Alder Lake-H, gráficos Nvidia RTX 30 Ti, pantallas Dolby Vision, y más
Nuestro Alienware x15 R2 de prueba está equipado con un Intel Core i9-12900H, GPU Nvidia GeForce RTX 3080 Ti para portátiles, una pantalla 1080p de 360 Hz, 32 GB de RAM LPDDR5-4800 y un SSD NVMe Samsung PM9A1 de 1 TB. Esta configuración costará ₹3.68.190 (~4.500 dólares o 4.583 euros) si se pide online a través de Dell India.
En este análisis, ponemos el Alienware x15 R2 a prueba y vemos si las nuevas mejoras se suman a una gran experiencia por el precio que tiene.
Posibles contendientes en la comparación
Valoración | Fecha | Modelo | Peso | Altura | Tamaño | Resolución | Best Price |
|---|---|---|---|---|---|---|---|
| 87.7 % | 10/2022 | Alienware x15 R2 P111F i9-12900H, GeForce RTX 3080 Ti Laptop GPU | 2.4 kg | 15.9 mm | 15.60" | 1920x1080 | |
| 86.3 % | 06/2022 | Asus ROG Strix Scar 15 G533ZW-LN106WS i9-12900H, GeForce RTX 3070 Ti Laptop GPU | 2.3 kg | 27.2 mm | 15.60" | 2560x1440 | |
| 88.2 % | 05/2022 | Asus ROG Zephyrus Duo 16 GX650RX R9 6900HX, GeForce RTX 3080 Ti Laptop GPU | 2.6 kg | 20.5 mm | 16.00" | 3840x2400 | |
| 87.4 % | 06/2022 | MSI Raider GE66 12UHS i9-12900HK, GeForce RTX 3080 Ti Laptop GPU | 2.4 kg | 23.4 mm | 15.60" | 3840x2160 | |
| 88.3 % | 08/2022 | MSI Titan GT77 12UHS i9-12900HX, GeForce RTX 3080 Ti Laptop GPU | 3.3 kg | 23 mm | 17.30" | 1920x1080 | |
| 86.9 % | 03/2022 | MSI Vector GP66 12UGS i9-12900H, GeForce RTX 3070 Ti Laptop GPU | 2.3 kg | 23.4 mm | 15.60" | 1920x1080 | |
| 88.3 % | 05/2022 | Razer Blade 15 Advanced Model Early 2022 i7-12800H, GeForce RTX 3080 Ti Laptop GPU | 2.1 kg | 16.99 mm | 15.60" | 1920x1080 |
Caja: Cada pulgada de Alienware en un chasis casi ultrabook
El chasis Legend 2.0 no ha cambiado mucho con respecto al x15 R1 y es igual de llamativo. El x15 R2 parece bastante delgado para el hardware que ofrece, y Alienware ha conseguido la mezcla de clase y estética de juego justa.
El trabajo de pintura en dos tonos, con un chasis blanco y una cubierta de teclado negra, resulta atractivo y suave al tacto. El logotipo de la cabeza de alienígena en la parte trasera de la tapa y el botón de encendido brillan en RGB prístino, al igual que las luces RGB del estadio trasero, compuestas por 90 micro-LED, que se pueden personalizar completamente o apagar en el Centro de Comando de Alienware
Las rejillas de ventilación traseras tienen un patrón de panal de abeja para añadir un poco de suavidad. El panel inferior también tiene una construcción de plástico y cuenta con rejillas de ventilación estampadas
Aunque la construcción de la cubierta del teclado es en gran parte de plástico, se siente bastante premium y uniforme sin bordes afilados o flexión gratuita - algo que la generación anterior de Alienwares era notoriamente famosa. Hay algo de
flexión, pero eso se observa sólo cuando se aplica deliberadamente la presión. La tapa de la pantalla está hecha de una aleación de magnesio para mayor rigidez con el número "15" claramente grabado.
En general, el Alienware x15 R2 da buenas vibraciones a primera vista con su factor de forma similar a un ultrabook, mientras que conserva las características de la firma Alienware.


Conectividad: Todos los puertos del lado de la popa
La disposición de los puertos en el Alienware x15 R2 es similar a la que hemos visto en el x15 R1
Hacia la izquierda, tenemos un puerto para el adaptador de corriente mientras que la derecha alberga sólo el conector de audio combinado de 3,5 mm. La toma de audio está situada más hacia la parte trasera, lo que puede ser molesto si tus auriculares con cable utilizan cables más cortos
La parte trasera alberga un puerto USB 3.2 Gen 1 Tipo-A con PowerShare, un puerto USB 3.2 Gen 2 Tipo-C y un puerto Thunderbolt 4. Los puertos USB Tipo-C y Thunderbolt 4 admiten Power Delivery. Un lector de tarjetas microSD y un puerto de salida HDMI 2.1 completan la selección de puertos. No hay ranura de bloqueo Kensington ni toma RJ-45. Sin embargo, Dell incluye un dongle USB Type-C a RJ-45 en la caja que ofrece conectividad LAN 2.5 GbE
La ubicación de los puertos no es un obstáculo para conectar múltiples periféricos. Dicho esto, la ubicación unilateral de todos los puertos principales en la trasera puede hacer que el acceso a ellos sea un poco incómodo especialmente si cambias mucho de periféricos.


Lector de tarjetas SD
El lector de tarjetas microSD se comporta de forma admirable en nuestras pruebas. El rendimiento parece un poco más lento que lo que habíamos visto anteriormente con el x15 R1, pero está en la misma liga que el del Asus ROG Zephyrus Duo 16 y el Razer Blade 15 Advanced.
| SD Card Reader | |
| average JPG Copy Test (av. of 3 runs) | |
| Alienware x15 RTX 3070 P111F (AV Pro V60) | |
| Razer Blade 15 Advanced Model Early 2022 (AV PRO microSD 128 GB V60) | |
| Asus ROG Zephyrus Duo 16 GX650RX (AV PRO microSD 128 GB V60) | |
| Alienware x15 R2 P111F (AV PRO microSD 128 GB V60) | |
| Average of class Gaming (19 - 202, n=96, last 2 years) | |
| MSI Raider GE66 12UHS (AV PRO microSD 128 GB V60) | |
| MSI Titan GT77 12UHS (AV PRO microSD 128 GB V60) | |
| maximum AS SSD Seq Read Test (1GB) | |
| Alienware x15 RTX 3070 P111F (AV Pro V60) | |
| Alienware x15 R2 P111F (AV PRO microSD 128 GB V60) | |
| Asus ROG Zephyrus Duo 16 GX650RX (AV PRO microSD 128 GB V60) | |
| Average of class Gaming (25.8 - 269, n=91, last 2 years) | |
| MSI Titan GT77 12UHS (AV PRO microSD 128 GB V60) | |
Comunicación

El x15 R2 está equipado con una tarjeta WLAN Killer Wi-Fi 6E AX1675i. El rendimiento es decente, pero hemos visto un rendimiento más rápido de esta tarjeta en otros portátiles. Observamos algunas caídas en la prueba de transmisión a 5 GHz, pero la conexión en general fue bastante estable durante las pruebas con nuestro router de referencia Asus ROG Rapture GT-AXE11000.
No notamos ningún beneficio tangible al cambiar a la banda de 6 GHz, salvo una velocidad media de recepción ligeramente superior y unos valores de rendimiento máximos más altos.
Cámara web
En la era de las cámaras web FHD, Dell incluye una mísera cámara de 720p en el Alienware x15 R2. La webcam es apenas utilizable para la videollamada ocasional. Los colores muestran grandes desviaciones y las áreas oscuras resultan ser bastante ruidosas. La nitidez de la imagen y los detalles son inferiores incluso en condiciones de iluminación ambiental adecuadas. No hay obturador físico para la webcam.


Seguridad
El x15 R2 lleva una cámara IR integrada que admite la autenticación biométrica basada en Windows Hello. No hay lector de huellas dactilares disponible
La cámara IR es fácil de registrar y es bastante sensible. También hay un módulo TPM 2.0.
Accesorios
Además del adaptador de corriente de 240 W y el papeleo habitual, Dell también incluye en la caja un dongle Ethernet USB Type-C a RJ-45 de 2,5 Gb.
Mantenimiento
Se puede acceder a los componentes internos simplemente retirando los seis tornillos Philips del panel inferior. Se necesita un poco de esfuerzo para abrir completamente el panel inferior del chasis. No hay una escotilla de mantenimiento
La disposición interna no ha cambiado desde el año pasado, lo que también significa que una vez más hay que aguantar la RAM soldada. El SSD NVMe, la tarjeta Wi-Fi Killer, y la batería de 87 WHr pueden reemplazarse si es necesario.

Garantía
El Alienware x15 R2 incluye de serie el servicio de asistencia Premium Plus y el servicio in situ de Dell durante un año. Se pueden añadir opciones adicionales de garantía y soporte durante el proceso de compra en Dell.com.
Dispositivos de entrada: Las teclas secundarias permanecen apagadas
Teclado
El teclado permanece sin cambios desde el x15 R1. Dell emplea un teclado delgado de la Serie X de Alienware con un recorrido de tecla de 1.5 mm, rollover de tecla N, y tecnología anti-ghosting. No hay teclas mecánicas debido al chasis delgado.
Escribir en el teclado del x15 R2 es generalmente una experiencia agradable debido a la buena respuesta táctil. Las teclas de flecha de tamaño completo también se mantienen desde el x15 R1 y son una adición bienvenida. Sin embargo, los símbolos secundarios de las teclas de función siguen sin estar iluminados, lo que hace que sea molesto utilizarlos en la oscuridad.
Teclado táctil
El touchpad de 10,5 cm x 6 cm parece un poco más pequeño en comparación con la competencia, pero ofrece una experiencia de deslizamiento suave. Soporta los gestos de Windows Precision. Hacer clic requiere un poco de esfuerzo a veces y también puede beneficiarse de un poco de retroalimentación adicional
A diferencia del x15 R1, el esquema de color del touchpad del x15 R2 coincide con el resto de la cubierta del teclado, pero sigue siendo un imán para las huellas dactilares y la suciedad.

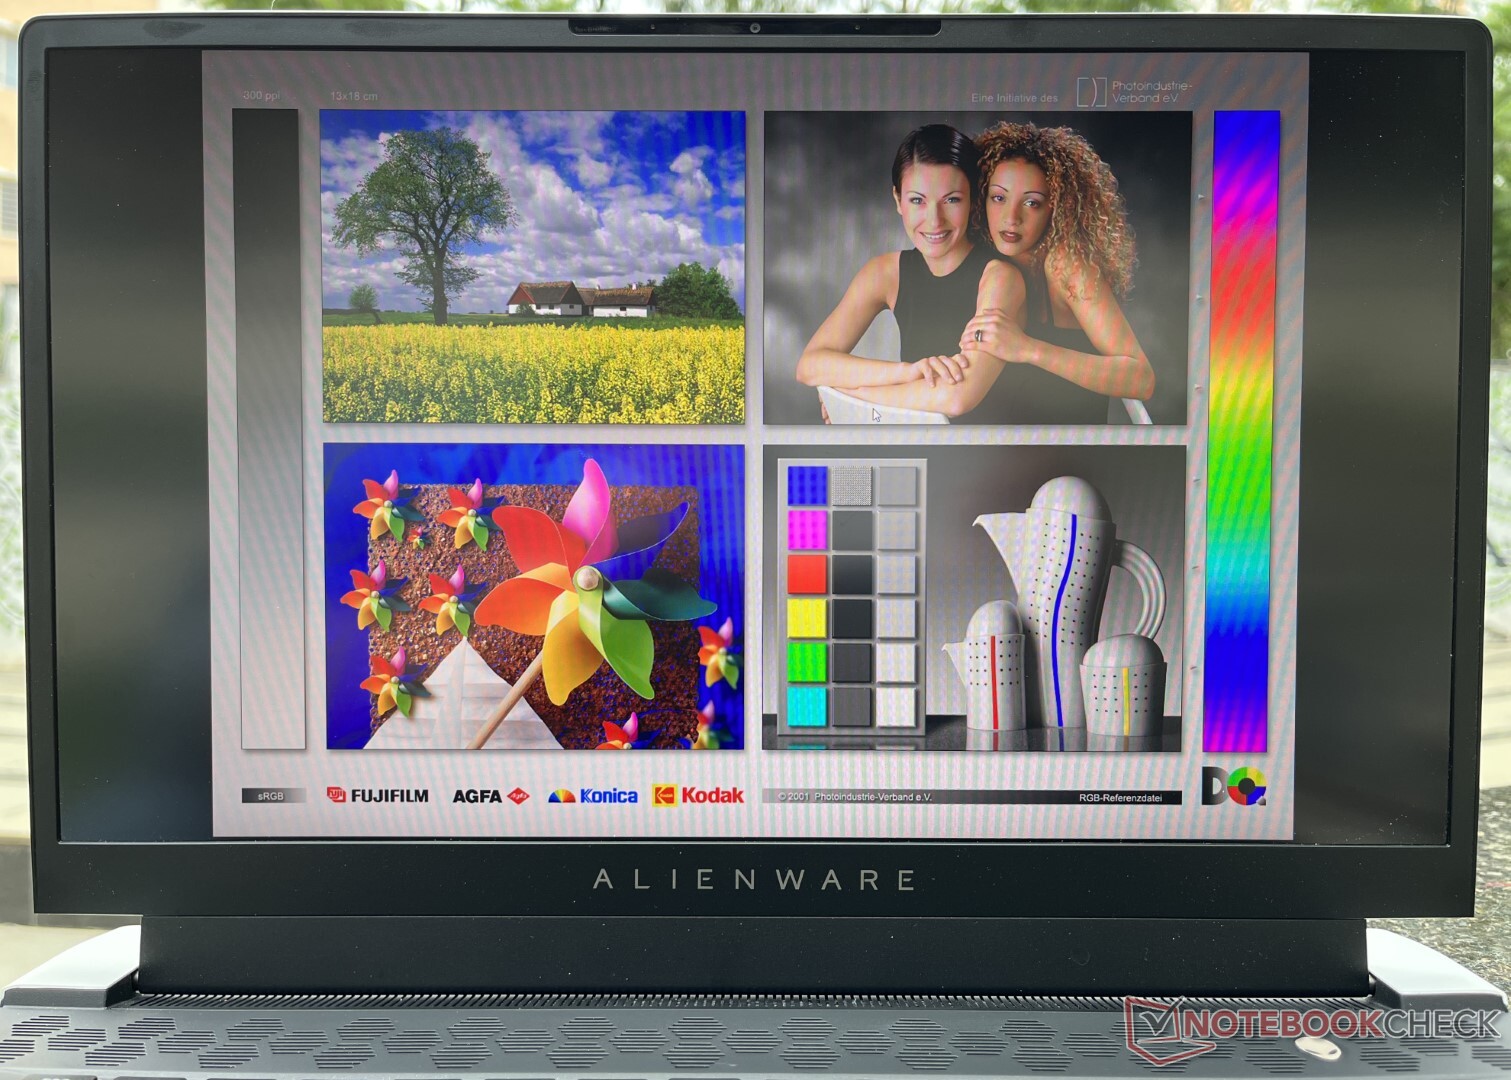
Pantalla: panel G-Sync de 360 Hz con Dolby Vision y sin PWM
Nuestro Alienware x15 R2 está equipado con un panel 1080p 360 Hz. Se trata de un panel Nvidia G-Sync con soporte para Dolby Vision HDR. Los usuarios también pueden configurar el x15 R2 con opciones de panel FHD 165 Hz y QHD 240 Hz con soporte G-Sync y Dolby Vision.
La resolución 1080p resulta en un mayor tamaño de píxel con una densidad general de 141 PPI. Observamos un sangrado significativo de la luz de fondo en las cuatro esquinas bajo exposición prolongada.
Las características de la pantalla del x15 R2 son similares a las que habíamos visto antes con el 2020 Alienware m15 R3que también tiene el mismo panel. La distribución del brillo es decente con un 82%, y la relación de contraste medida de 1033:1 ofrece una buena experiencia visual subjetiva.


| |||||||||||||||||||||||||
iluminación: 82 %
Brillo con batería: 341 cd/m²
Contraste: 1033:1 (Negro: 0.33 cd/m²)
ΔE Color 2.96 | 0.5-29.43 Ø5, calibrated: 1.46
ΔE Greyscale 3.7 | 0.57-98 Ø5.3
75.7% AdobeRGB 1998 (Argyll 2.2.0 3D)
100% sRGB (Argyll 2.2.0 3D)
74.7% Display P3 (Argyll 2.2.0 3D)
Gamma: 2.15
| Alienware x15 R2 P111F AU Optronics B156HAN (AUO8092), IPS, 1920x1080, 15.60 | Alienware x15 RTX 3070 P111F LG Philips 156QHG, IPS, 2560x1440, 15.60 | Asus ROG Strix Scar 15 G533ZW-LN106WS BOE CQ NE156QHM-NZ2, IPS-level, 2560x1440, 15.60 | MSI Titan GT77 12UHS Sharp SHP1544 LQ173M1JW08, IPS-Level, 1920x1080, 17.30 | MSI Vector GP66 12UGS BOE NE156FHM-NZ3, IPS, 1920x1080, 15.60 | Razer Blade 15 Advanced Model Early 2022 TL156VDXP02-0, IPS, 1920x1080, 15.60 | |
|---|---|---|---|---|---|---|
| Display | 16% | 14% | -3% | -4% | -13% | |
| Display P3 Coverage | 74.7 | 97.8 31% | 96.2 29% | 70.8 -5% | 70.1 -6% | 65.3 -13% |
| sRGB Coverage | 100 | 99.9 0% | 99.9 0% | 98.9 -1% | 99.5 0% | 85.1 -15% |
| AdobeRGB 1998 Coverage | 75.7 | 84.5 12% | 73 -4% | 72.1 -5% | 67.4 -11% | |
| Response Times | -429% | -232% | -64% | -209% | -168% | |
| Response Time Grey 50% / Grey 80% * | 1.47 ? | 12 ? -716% | 7.86 ? -435% 4.21 ? -186% | 3.03 ? -106% | 5.8 ? -295% | 4.3 ? -193% |
| Response Time Black / White * | 4.32 ? | 10.4 ? -141% | 7.5 ? -74% | 5.28 ? -22% | 9.6 ? -122% | 10.5 ? -143% |
| PWM Frequency | ||||||
| Screen | -4% | -24% | -7% | 4% | 30% | |
| Brightness middle | 341 | 409.5 20% | 346 1% | 280 -18% | 353.1 4% | 330 -3% |
| Brightness | 316 | 390 23% | 329 4% | 275 -13% | 325 3% | 315 0% |
| Brightness Distribution | 82 | 88 7% | 91 11% | 79 -4% | 85 4% | 89 9% |
| Black Level * | 0.33 | 0.47 -42% | 0.59 -79% | 0.4 -21% | 0.38 -15% | 0.24 27% |
| Contrast | 1033 | 871 -16% | 586 -43% | 700 -32% | 929 -10% | 1375 33% |
| Colorchecker dE 2000 * | 2.96 | 3.48 -18% | 3.06 -3% | 2.1 29% | 2.24 24% | 1.47 50% |
| Colorchecker dE 2000 max. * | 5.33 | 6.31 -18% | 5.81 -9% | 5.83 -9% | 5 6% | 2.73 49% |
| Colorchecker dE 2000 calibrated * | 1.46 | 0.89 39% | 2.57 -76% | 1.58 -8% | 1.02 30% | 0.63 57% |
| Greyscale dE 2000 * | 3.7 | 5 -35% | 3.3 11% | 4 -8% | 1.8 51% | |
| Gamma | 2.15 102% | 2.16 102% | 2.12 104% | 2.13 103% | 2.24 98% | 2.282 96% |
| CCT | 6351 102% | 6591 99% | 7021 93% | 7060 92% | 6864 95% | 6499 100% |
| Media total (Programa/Opciones) | -139% /
-67% | -81% /
-61% | -25% /
-15% | -70% /
-28% | -50% /
-7% |
* ... más pequeño es mejor
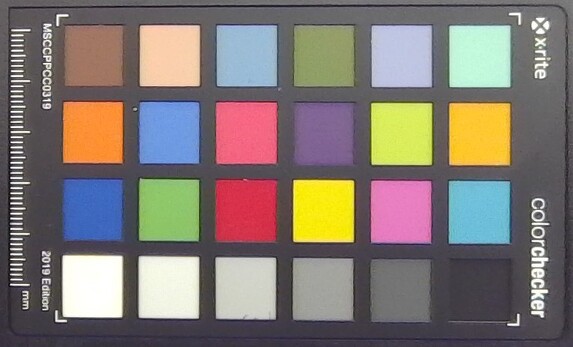
La cobertura del espacio de color del Alienware x15 R2 es buena teniendo en cuenta que se trata principalmente de un portátil para juegos. La gama de colores sRGB está completamente cubierta, y la cobertura del 75,7% de AdobeRGB debería seguir siendo adecuada para la creación de contenido no profesional. La cobertura Display P3 también es decente con un 74,7%.


La precisión del color no es nada del otro mundo, pero sí es aceptable, con un promedio de Delta E en escala de grises de 3,7 y un promedio de Delta E en ColorChecker de 2,96
Nuestra rutina de calibración estandarizada utilizando el espectrofotómetro X-rite i1Basic Pro 3 y el software de calibración de color Calman Ultimate de Portrait Displays ayuda a percibir mejoras en la precisión del color reduciendo el Delta E medio de la escala de grises a 0,7 y el Delta E medio de ColorChecker a 1,46. Seguimos notando mayores desviaciones en el color rojo
El archivo ICC calibrado puede descargarse en el enlace anterior.


Tiempos de respuesta del display
| ↔ Tiempo de respuesta de Negro a Blanco | ||
|---|---|---|
| 4.32 ms ... subida ↗ y bajada ↘ combinada | ↗ 2.17 ms subida |  |
| ↘ 2.15 ms bajada | ||
| La pantalla mostró tiempos de respuesta muy rápidos en nuestros tests y debería ser adecuada para juegos frenéticos. En comparación, todos los dispositivos de prueba van de ##min### (mínimo) a 240 (máximo) ms. » 12 % de todos los dispositivos son mejores. Esto quiere decir que el tiempo de respuesta medido es mejor que la media (21.4 ms) de todos los dispositivos testados. | ||
| ↔ Tiempo de respuesta 50% Gris a 80% Gris | ||
| 1.47 ms ... subida ↗ y bajada ↘ combinada | ↗ 0.49 ms subida |  |
| ↘ 0.98 ms bajada | ||
| La pantalla mostró tiempos de respuesta muy rápidos en nuestros tests y debería ser adecuada para juegos frenéticos. En comparación, todos los dispositivos de prueba van de ##min### (mínimo) a 636 (máximo) ms. » 4 % de todos los dispositivos son mejores. Esto quiere decir que el tiempo de respuesta medido es mejor que la media (33.7 ms) de todos los dispositivos testados. | ||

El panel del Alienware x15 R2 usa la sobremarcha por defecto, y esto se ve como un "cuerno" en el gráfico de tiempo de respuesta del 50% de gris al 80% de gris. En consecuencia, vemos un tiempo de respuesta combinado muy rápido de 1,47 ms; no está al nivel de los OLED pero debería ser un buen augurio para los juegos de ritmo rápido. El tiempo de respuesta combinado del 100% de negro al 100% de blanco también es decente, con 4,32 ms.
La sobrecarga del panel se desactiva a 60 Hz de refresco y el tiempo de respuesta combinado de 50% de gris a 80% de gris aumenta a 7,3 ms.
Parpadeo de Pantalla / PWM (Pulse-Width Modulation)
| Parpadeo de Pantalla / PWM no detectado |  | ||
Comparación: 53 % de todos los dispositivos testados no usaron PWM para atenuar el display. Si se usó, medimos una media de 17803 (mínimo: 5 - máxmo: 3846000) Hz. | |||
No se observó ningún parpadeo PWM en todos los niveles de brillo probados, lo que debería ser un buen augurio para reducir la fatiga ocular mientras se juega
Para más información, consulta nuestro artículo "Por qué la modulación por ancho de pulso (PWM) es un dolor de cabeza", y también echa un vistazo a nuestraTabla de clasificación PWMpara comparar la frecuencia PWM de todos los dispositivos analizados
A pesar del brillo máximo algo menor, la pantalla del Alienware x15 R2 es bastante apta para la visualización en exteriores siempre que no haya luz solar intensa que caiga directamente sobre la pantalla
No observamos ninguna pérdida significativa de brillo o información de color en ángulos de visión extremos.


Rendimiento: El Core i9-12900H ofrece un buen rendimiento sostenido
Nuestro Alienware x15 R2 está equipado con un Intel Core i9-12900H y una GPU de 140 W GPU Nvidia GeForce RTX 3080 Ti para portátiles. Los compradores también pueden configurar el x15 R2 con un Core i7-12700H y una GPU RTX 3060 o RTX 3070 Ti para portátiles junto con 16 GB o 32 GB de RAM LPDDR5-5200.


Condiciones de la prueba
El rendimiento del portátil se puede ajustar con Alienware Command Center. Tuvimos que instalar la aplicación manualmente ya que no estaba presente en la imagen de fábrica por alguna razón. Realizamos todas las pruebas en el perfil térmico Full Speed. Esto da como resultado una potencia base del procesador desbloqueada (PL1) y una potencia turbo máxima (PL2) de 140 W
La mayoría de los perfiles térmicos, incluido el equilibrado, utilizan un PL1/PL2 de 140 W, mientras que los modos Battery Saver y Quiet utilizan un PL1 de 65 W y un PL2 de 140 W. La elección del perfil térmico tiene principalmente un impacto en el ruido del ventilador, al que llegaremos en breve.
El Alienware x15 R2 soporta Advanced Optimus. Todas las pruebas gráficas fueron ejecutadas en el modo MSHybrid, pero es posible cambiar el enrutamiento de la GPU a través del BIOS o a través del Panel de Control de Nvidia.

Procesador

El Core i9-12900H es un procesador Alder Lake-H de 14 núcleos y 20 hilos, con potencias de hasta 5 GHz. De los 14 núcleos, ocho son núcleos de rendimiento Golden Cove (P) mientras que los seis restantes son de eficiencia Gracemont (E). Los núcleos P admiten hyperthreading.
La implementación por parte de Dell de un material de interfaz térmica (TIM) de galio-silicona Element 31 (que, por cierto, denota galio en la tabla periódica) parece funcionar como se anuncia. Observamos un rendimiento bien sostenido en la prueba de bucle multinúcleo Cinebench R15 durante toda la duración de la ejecución
Dicho esto, el Alienware x15 R2 parece ser cerca de 9% más lento en esta prueba comparado con el Asus ROG Strix Scar 15, que también usa el mismo procesador a 135 W.
Cinebench R15 Multi Loop
El rendimiento de un solo núcleo está a la altura de otros chips Alder Lake-H e incluso del Alder Lake-HXCore i9-12900HXen elMSI Titan GT77. Vemos entre un 1% y un 21% de ventaja en single core para el Core i9-12900H en comparación con elAMD Ryzen 9 6900HXen elAsus ROG Zephyrus Duo 16dependiendo del benchmark. El Scar 15 es capaz de superar al X15 R2 en la mayoría de las pruebas multinúcleo.

Notamos una caída del 11% en el rendimiento multi-núcleo de Cinebench R20 en la energía de la batería, probablemente debido a que el PL1 bajó a 65 W
En general, el Alienware x15 R2 no arroja ninguna sorpresa en nuestro conjunto de pruebas de CPU y ofrece un 33% más de rendimiento de CPU en comparación con el x15 R1. El chasis delgado puede haber contribuido a las puntuaciones ligeramente inferiores, pero la gestión térmica de Dell es capaz de asegurar un buen rendimiento sostenido.
Cinebench R23: Multi Core | Single Core
Cinebench R20: CPU (Multi Core) | CPU (Single Core)
Cinebench R15: CPU Multi 64Bit | CPU Single 64Bit
Blender: v2.79 BMW27 CPU
7-Zip 18.03: 7z b 4 | 7z b 4 -mmt1
Geekbench 5.5: Multi-Core | Single-Core
HWBOT x265 Benchmark v2.2: 4k Preset
LibreOffice : 20 Documents To PDF
R Benchmark 2.5: Overall mean
| CPU Performance Rating | |
| MSI Titan GT77 12UHS | |
| Asus ROG Strix Scar 15 G533ZW-LN106WS | |
| Average of class Gaming | |
| Alienware x15 R2 P111F | |
| MSI Raider GE66 12UHS | |
| MSI Vector GP66 12UGS | |
| Average Intel Core i9-12900H | |
| Asus ROG Zephyrus Duo 16 GX650RX | |
| Razer Blade 15 Advanced Model Early 2022 | |
| Alienware x15 RTX 3070 P111F -2! | |
| Cinebench R23 / Multi Core | |
| MSI Titan GT77 12UHS | |
| Average of class Gaming (2435 - 34613, n=222, last 2 years) | |
| Asus ROG Strix Scar 15 G533ZW-LN106WS | |
| MSI Vector GP66 12UGS | |
| Alienware x15 R2 P111F | |
| MSI Raider GE66 12UHS | |
| Average Intel Core i9-12900H (7359 - 19648, n=26) | |
| Asus ROG Zephyrus Duo 16 GX650RX | |
| Alienware x15 RTX 3070 P111F | |
| Razer Blade 15 Advanced Model Early 2022 | |
| Cinebench R23 / Single Core | |
| Asus ROG Strix Scar 15 G533ZW-LN106WS | |
| MSI Titan GT77 12UHS | |
| Alienware x15 R2 P111F | |
| MSI Vector GP66 12UGS | |
| MSI Raider GE66 12UHS | |
| Average of class Gaming (527 - 2235, n=220, last 2 years) | |
| Average Intel Core i9-12900H (1634 - 1921, n=26) | |
| Razer Blade 15 Advanced Model Early 2022 | |
| Asus ROG Zephyrus Duo 16 GX650RX | |
| Alienware x15 RTX 3070 P111F | |
| Cinebench R20 / CPU (Multi Core) | |
| MSI Titan GT77 12UHS | |
| Average of class Gaming (930 - 13769, n=220, last 2 years) | |
| Asus ROG Strix Scar 15 G533ZW-LN106WS | |
| Alienware x15 R2 P111F | |
| MSI Vector GP66 12UGS | |
| MSI Raider GE66 12UHS | |
| Average Intel Core i9-12900H (2681 - 7471, n=26) | |
| Asus ROG Zephyrus Duo 16 GX650RX | |
| Alienware x15 RTX 3070 P111F | |
| Razer Blade 15 Advanced Model Early 2022 | |
| Cinebench R20 / CPU (Single Core) | |
| MSI Titan GT77 12UHS | |
| Alienware x15 R2 P111F | |
| MSI Vector GP66 12UGS | |
| Asus ROG Strix Scar 15 G533ZW-LN106WS | |
| MSI Raider GE66 12UHS | |
| Average Intel Core i9-12900H (624 - 738, n=26) | |
| Average of class Gaming (169 - 855, n=220, last 2 years) | |
| Razer Blade 15 Advanced Model Early 2022 | |
| Asus ROG Zephyrus Duo 16 GX650RX | |
| Alienware x15 RTX 3070 P111F | |
| Cinebench R15 / CPU Multi 64Bit | |
| MSI Titan GT77 12UHS | |
| Average of class Gaming (400 - 5663, n=225, last 2 years) | |
| Asus ROG Strix Scar 15 G533ZW-LN106WS | |
| Alienware x15 R2 P111F | |
| MSI Raider GE66 12UHS | |
| Average Intel Core i9-12900H (1395 - 3077, n=26) | |
| MSI Vector GP66 12UGS | |
| Asus ROG Zephyrus Duo 16 GX650RX | |
| Alienware x15 RTX 3070 P111F | |
| Razer Blade 15 Advanced Model Early 2022 | |
| Cinebench R15 / CPU Single 64Bit | |
| MSI Titan GT77 12UHS | |
| Asus ROG Strix Scar 15 G533ZW-LN106WS | |
| Alienware x15 R2 P111F | |
| MSI Vector GP66 12UGS | |
| Average of class Gaming (79.2 - 318, n=224, last 2 years) | |
| MSI Raider GE66 12UHS | |
| Average Intel Core i9-12900H (235 - 277, n=27) | |
| Asus ROG Zephyrus Duo 16 GX650RX | |
| Razer Blade 15 Advanced Model Early 2022 | |
| Alienware x15 RTX 3070 P111F | |
| Blender / v2.79 BMW27 CPU | |
| Razer Blade 15 Advanced Model Early 2022 | |
| Average Intel Core i9-12900H (160 - 451, n=26) | |
| Alienware x15 RTX 3070 P111F | |
| Asus ROG Zephyrus Duo 16 GX650RX | |
| Average of class Gaming (87 - 1259, n=217, last 2 years) | |
| MSI Vector GP66 12UGS | |
| MSI Raider GE66 12UHS | |
| Alienware x15 R2 P111F | |
| Asus ROG Strix Scar 15 G533ZW-LN106WS | |
| MSI Titan GT77 12UHS | |
| 7-Zip 18.03 / 7z b 4 | |
| MSI Titan GT77 12UHS | |
| Average of class Gaming (11386 - 140932, n=219, last 2 years) | |
| Alienware x15 R2 P111F | |
| MSI Raider GE66 12UHS | |
| Asus ROG Strix Scar 15 G533ZW-LN106WS | |
| MSI Vector GP66 12UGS | |
| Asus ROG Zephyrus Duo 16 GX650RX | |
| Average Intel Core i9-12900H (34684 - 76677, n=26) | |
| Alienware x15 RTX 3070 P111F | |
| Razer Blade 15 Advanced Model Early 2022 | |
| 7-Zip 18.03 / 7z b 4 -mmt1 | |
| MSI Titan GT77 12UHS | |
| Average of class Gaming (2685 - 7581, n=219, last 2 years) | |
| MSI Vector GP66 12UGS | |
| MSI Raider GE66 12UHS | |
| Razer Blade 15 Advanced Model Early 2022 | |
| Asus ROG Strix Scar 15 G533ZW-LN106WS | |
| Alienware x15 R2 P111F | |
| Average Intel Core i9-12900H (5302 - 6289, n=26) | |
| Asus ROG Zephyrus Duo 16 GX650RX | |
| Alienware x15 RTX 3070 P111F | |
| Geekbench 5.5 / Multi-Core | |
| MSI Titan GT77 12UHS | |
| Asus ROG Strix Scar 15 G533ZW-LN106WS | |
| Average of class Gaming (1946 - 22200, n=224, last 2 years) | |
| Alienware x15 R2 P111F | |
| MSI Raider GE66 12UHS | |
| MSI Vector GP66 12UGS | |
| Average Intel Core i9-12900H (8519 - 14376, n=29) | |
| Asus ROG Zephyrus Duo 16 GX650RX | |
| Razer Blade 15 Advanced Model Early 2022 | |
| Geekbench 5.5 / Single-Core | |
| MSI Titan GT77 12UHS | |
| MSI Vector GP66 12UGS | |
| Alienware x15 R2 P111F | |
| MSI Raider GE66 12UHS | |
| Asus ROG Strix Scar 15 G533ZW-LN106WS | |
| Razer Blade 15 Advanced Model Early 2022 | |
| Average of class Gaming (158 - 2210, n=224, last 2 years) | |
| Average Intel Core i9-12900H (1631 - 1892, n=29) | |
| Asus ROG Zephyrus Duo 16 GX650RX | |
| HWBOT x265 Benchmark v2.2 / 4k Preset | |
| MSI Titan GT77 12UHS | |
| Average of class Gaming (3 - 37.6, n=220, last 2 years) | |
| Asus ROG Strix Scar 15 G533ZW-LN106WS | |
| Alienware x15 R2 P111F | |
| MSI Vector GP66 12UGS | |
| MSI Raider GE66 12UHS | |
| Asus ROG Zephyrus Duo 16 GX650RX | |
| Average Intel Core i9-12900H (8.05 - 22.5, n=26) | |
| Alienware x15 RTX 3070 P111F | |
| Razer Blade 15 Advanced Model Early 2022 | |
| LibreOffice / 20 Documents To PDF | |
| Average of class Gaming (32.8 - 332, n=216, last 2 years) | |
| Alienware x15 RTX 3070 P111F | |
| Alienware x15 R2 P111F | |
| Asus ROG Zephyrus Duo 16 GX650RX | |
| Razer Blade 15 Advanced Model Early 2022 | |
| Average Intel Core i9-12900H (36.8 - 59.8, n=26) | |
| MSI Vector GP66 12UGS | |
| Asus ROG Strix Scar 15 G533ZW-LN106WS | |
| MSI Titan GT77 12UHS | |
| MSI Raider GE66 12UHS | |
| R Benchmark 2.5 / Overall mean | |
| Alienware x15 RTX 3070 P111F | |
| Asus ROG Zephyrus Duo 16 GX650RX | |
| Average of class Gaming (0.3609 - 4.47, n=219, last 2 years) | |
| Average Intel Core i9-12900H (0.4218 - 0.506, n=26) | |
| Razer Blade 15 Advanced Model Early 2022 | |
| MSI Raider GE66 12UHS | |
| Alienware x15 R2 P111F | |
| Asus ROG Strix Scar 15 G533ZW-LN106WS | |
| MSI Vector GP66 12UGS | |
| MSI Titan GT77 12UHS | |
* ... más pequeño es mejor
AIDA64: FP32 Ray-Trace | FPU Julia | CPU SHA3 | CPU Queen | FPU SinJulia | FPU Mandel | CPU AES | CPU ZLib | FP64 Ray-Trace | CPU PhotoWorxx
| Performance Rating | |
| MSI Titan GT77 12UHS | |
| Average of class Gaming | |
| Asus ROG Zephyrus Duo 16 GX650RX | |
| Alienware x15 R2 P111F | |
| Asus ROG Strix Scar 15 G533ZW-LN106WS | |
| Average Intel Core i9-12900H | |
| MSI Raider GE66 12UHS | |
| MSI Vector GP66 12UGS | |
| Razer Blade 15 Advanced Model Early 2022 | |
| Alienware x15 RTX 3070 P111F -9! | |
| AIDA64 / FP32 Ray-Trace | |
| MSI Titan GT77 12UHS | |
| Average of class Gaming (3069 - 60169, n=215, last 2 years) | |
| Asus ROG Zephyrus Duo 16 GX650RX | |
| Alienware x15 R2 P111F | |
| Average Intel Core i9-12900H (4074 - 18289, n=26) | |
| Asus ROG Strix Scar 15 G533ZW-LN106WS | |
| MSI Raider GE66 12UHS | |
| MSI Vector GP66 12UGS | |
| Razer Blade 15 Advanced Model Early 2022 | |
| AIDA64 / FPU Julia | |
| MSI Titan GT77 12UHS | |
| Asus ROG Zephyrus Duo 16 GX650RX | |
| Average of class Gaming (18567 - 252486, n=215, last 2 years) | |
| Alienware x15 R2 P111F | |
| Average Intel Core i9-12900H (22307 - 93236, n=26) | |
| Asus ROG Strix Scar 15 G533ZW-LN106WS | |
| MSI Raider GE66 12UHS | |
| MSI Vector GP66 12UGS | |
| Razer Blade 15 Advanced Model Early 2022 | |
| AIDA64 / CPU SHA3 | |
| MSI Titan GT77 12UHS | |
| Average of class Gaming (629 - 10389, n=215, last 2 years) | |
| Alienware x15 R2 P111F | |
| Asus ROG Zephyrus Duo 16 GX650RX | |
| Asus ROG Strix Scar 15 G533ZW-LN106WS | |
| Average Intel Core i9-12900H (1378 - 4215, n=26) | |
| MSI Vector GP66 12UGS | |
| MSI Raider GE66 12UHS | |
| Razer Blade 15 Advanced Model Early 2022 | |
| AIDA64 / CPU Queen | |
| Alienware x15 R2 P111F | |
| Average of class Gaming (15371 - 200651, n=215, last 2 years) | |
| MSI Vector GP66 12UGS | |
| MSI Raider GE66 12UHS | |
| Asus ROG Zephyrus Duo 16 GX650RX | |
| Asus ROG Strix Scar 15 G533ZW-LN106WS | |
| MSI Titan GT77 12UHS | |
| Average Intel Core i9-12900H (78172 - 111241, n=26) | |
| Razer Blade 15 Advanced Model Early 2022 | |
| AIDA64 / FPU SinJulia | |
| MSI Titan GT77 12UHS | |
| Asus ROG Zephyrus Duo 16 GX650RX | |
| Average of class Gaming (2137 - 32988, n=215, last 2 years) | |
| Asus ROG Strix Scar 15 G533ZW-LN106WS | |
| Alienware x15 R2 P111F | |
| MSI Vector GP66 12UGS | |
| MSI Raider GE66 12UHS | |
| Average Intel Core i9-12900H (5709 - 10410, n=26) | |
| Razer Blade 15 Advanced Model Early 2022 | |
| AIDA64 / FPU Mandel | |
| Asus ROG Zephyrus Duo 16 GX650RX | |
| MSI Titan GT77 12UHS | |
| Average of class Gaming (10291 - 134044, n=215, last 2 years) | |
| Alienware x15 R2 P111F | |
| Average Intel Core i9-12900H (11257 - 45581, n=26) | |
| Asus ROG Strix Scar 15 G533ZW-LN106WS | |
| MSI Raider GE66 12UHS | |
| MSI Vector GP66 12UGS | |
| Razer Blade 15 Advanced Model Early 2022 | |
| AIDA64 / CPU AES | |
| MSI Titan GT77 12UHS | |
| Alienware x15 R2 P111F | |
| Asus ROG Zephyrus Duo 16 GX650RX | |
| Average of class Gaming (19065 - 328679, n=215, last 2 years) | |
| Asus ROG Strix Scar 15 G533ZW-LN106WS | |
| MSI Vector GP66 12UGS | |
| MSI Raider GE66 12UHS | |
| Average Intel Core i9-12900H (31935 - 151546, n=26) | |
| Razer Blade 15 Advanced Model Early 2022 | |
| AIDA64 / CPU ZLib | |
| MSI Titan GT77 12UHS | |
| Average of class Gaming (150.9 - 2409, n=215, last 2 years) | |
| Asus ROG Strix Scar 15 G533ZW-LN106WS | |
| Alienware x15 R2 P111F | |
| MSI Vector GP66 12UGS | |
| MSI Raider GE66 12UHS | |
| Average Intel Core i9-12900H (449 - 1193, n=26) | |
| Asus ROG Zephyrus Duo 16 GX650RX | |
| Razer Blade 15 Advanced Model Early 2022 | |
| Alienware x15 RTX 3070 P111F | |
| AIDA64 / FP64 Ray-Trace | |
| MSI Titan GT77 12UHS | |
| Average of class Gaming (1518 - 31796, n=215, last 2 years) | |
| Asus ROG Zephyrus Duo 16 GX650RX | |
| Alienware x15 R2 P111F | |
| Average Intel Core i9-12900H (2235 - 10511, n=26) | |
| Asus ROG Strix Scar 15 G533ZW-LN106WS | |
| MSI Raider GE66 12UHS | |
| MSI Vector GP66 12UGS | |
| Razer Blade 15 Advanced Model Early 2022 | |
| AIDA64 / CPU PhotoWorxx | |
| MSI Titan GT77 12UHS | |
| MSI Raider GE66 12UHS | |
| Asus ROG Strix Scar 15 G533ZW-LN106WS | |
| Alienware x15 R2 P111F | |
| Razer Blade 15 Advanced Model Early 2022 | |
| Average of class Gaming (10805 - 60161, n=216, last 2 years) | |
| Average Intel Core i9-12900H (20960 - 48269, n=27) | |
| Asus ROG Zephyrus Duo 16 GX650RX | |
| MSI Vector GP66 12UGS | |
Consulte nuestra página web dedicada al Intel Core i9-12900H para ver más pruebas de rendimiento y comparaciones.
Rendimiento del sistema
El Alienware x15 R2 está sólo un 9% por detrás del MSI Titan GT77 en el rendimiento general de PCMark 10, siendo el mayor déficit el que se observa en el componente de Creación de Contenido Digital del benchmark. Las puntuaciones de CrossMark son comparables a las del Scar 15 y son aproximadamente un 15% más altas que el Zephyrus Duo 16 con Ryzen 9 6900HX.
Subjetivamente, no experimentamos ningún contratiempo en las tareas diarias de productividad y navegación web.
CrossMark: Overall | Productivity | Creativity | Responsiveness
| PCMark 10 / Score | |
| MSI Titan GT77 12UHS | |
| MSI Raider GE66 12UHS | |
| MSI Vector GP66 12UGS | |
| Asus ROG Strix Scar 15 G533ZW-LN106WS | |
| Average Intel Core i9-12900H, NVIDIA GeForce RTX 3080 Ti Laptop GPU (7139 - 8083, n=6) | |
| Average of class Gaming (5235 - 9852, n=191, last 2 years) | |
| Alienware x15 R2 P111F | |
| Razer Blade 15 Advanced Model Early 2022 | |
| Alienware x15 RTX 3070 P111F | |
| Asus ROG Zephyrus Duo 16 GX650RX | |
| PCMark 10 / Essentials | |
| Alienware x15 R2 P111F | |
| MSI Titan GT77 12UHS | |
| MSI Raider GE66 12UHS | |
| MSI Vector GP66 12UGS | |
| Average Intel Core i9-12900H, NVIDIA GeForce RTX 3080 Ti Laptop GPU (10254 - 11178, n=6) | |
| Average of class Gaming (8300 - 12334, n=190, last 2 years) | |
| Asus ROG Strix Scar 15 G533ZW-LN106WS | |
| Razer Blade 15 Advanced Model Early 2022 | |
| Alienware x15 RTX 3070 P111F | |
| Asus ROG Zephyrus Duo 16 GX650RX | |
| PCMark 10 / Productivity | |
| Asus ROG Strix Scar 15 G533ZW-LN106WS | |
| MSI Raider GE66 12UHS | |
| Alienware x15 R2 P111F | |
| MSI Titan GT77 12UHS | |
| MSI Vector GP66 12UGS | |
| Average Intel Core i9-12900H, NVIDIA GeForce RTX 3080 Ti Laptop GPU (9102 - 11186, n=6) | |
| Average of class Gaming (6662 - 11833, n=190, last 2 years) | |
| Razer Blade 15 Advanced Model Early 2022 | |
| Alienware x15 RTX 3070 P111F | |
| Asus ROG Zephyrus Duo 16 GX650RX | |
| PCMark 10 / Digital Content Creation | |
| MSI Titan GT77 12UHS | |
| MSI Raider GE66 12UHS | |
| MSI Vector GP66 12UGS | |
| Asus ROG Strix Scar 15 G533ZW-LN106WS | |
| Average of class Gaming (6462 - 18475, n=190, last 2 years) | |
| Average Intel Core i9-12900H, NVIDIA GeForce RTX 3080 Ti Laptop GPU (9847 - 12627, n=6) | |
| Alienware x15 RTX 3070 P111F | |
| Razer Blade 15 Advanced Model Early 2022 | |
| Alienware x15 R2 P111F | |
| Asus ROG Zephyrus Duo 16 GX650RX | |
| CrossMark / Overall | |
| MSI Titan GT77 12UHS | |
| Asus ROG Strix Scar 15 G533ZW-LN106WS | |
| Alienware x15 R2 P111F | |
| Average of class Gaming (1247 - 2334, n=164, last 2 years) | |
| Average Intel Core i9-12900H, NVIDIA GeForce RTX 3080 Ti Laptop GPU (1696 - 1965, n=3) | |
| Razer Blade 15 Advanced Model Early 2022 | |
| Asus ROG Zephyrus Duo 16 GX650RX | |
| CrossMark / Productivity | |
| MSI Titan GT77 12UHS | |
| Asus ROG Strix Scar 15 G533ZW-LN106WS | |
| Alienware x15 R2 P111F | |
| Average of class Gaming (1299 - 2204, n=164, last 2 years) | |
| Average Intel Core i9-12900H, NVIDIA GeForce RTX 3080 Ti Laptop GPU (1622 - 1870, n=3) | |
| Razer Blade 15 Advanced Model Early 2022 | |
| Asus ROG Zephyrus Duo 16 GX650RX | |
| CrossMark / Creativity | |
| MSI Titan GT77 12UHS | |
| Alienware x15 R2 P111F | |
| Asus ROG Strix Scar 15 G533ZW-LN106WS | |
| Average of class Gaming (1275 - 2514, n=164, last 2 years) | |
| Average Intel Core i9-12900H, NVIDIA GeForce RTX 3080 Ti Laptop GPU (1855 - 2135, n=3) | |
| Razer Blade 15 Advanced Model Early 2022 | |
| Asus ROG Zephyrus Duo 16 GX650RX | |
| CrossMark / Responsiveness | |
| Asus ROG Strix Scar 15 G533ZW-LN106WS | |
| MSI Titan GT77 12UHS | |
| Alienware x15 R2 P111F | |
| Asus ROG Zephyrus Duo 16 GX650RX | |
| Average of class Gaming (1030 - 2330, n=164, last 2 years) | |
| Average Intel Core i9-12900H, NVIDIA GeForce RTX 3080 Ti Laptop GPU (1483 - 1777, n=3) | |
| Razer Blade 15 Advanced Model Early 2022 | |
| PCMark 8 Home Score Accelerated v2 | 6653 puntos | |
| PCMark 8 Creative Score Accelerated v2 | 10574 puntos | |
| PCMark 8 Work Score Accelerated v2 | 6944 puntos | |
| PCMark 10 Score | 7496 puntos | |
ayuda | ||
| AIDA64 / Memory Copy | |
| Alienware x15 R2 P111F | |
| MSI Titan GT77 12UHS | |
| MSI Raider GE66 12UHS | |
| Razer Blade 15 Advanced Model Early 2022 | |
| Asus ROG Strix Scar 15 G533ZW-LN106WS | |
| Average of class Gaming (21842 - 92565, n=215, last 2 years) | |
| Average Intel Core i9-12900H (34438 - 74264, n=26) | |
| Asus ROG Zephyrus Duo 16 GX650RX | |
| MSI Vector GP66 12UGS | |
| AIDA64 / Memory Read | |
| MSI Raider GE66 12UHS | |
| Razer Blade 15 Advanced Model Early 2022 | |
| Alienware x15 R2 P111F | |
| Asus ROG Strix Scar 15 G533ZW-LN106WS | |
| Average of class Gaming (24879 - 90647, n=215, last 2 years) | |
| MSI Titan GT77 12UHS | |
| Average Intel Core i9-12900H (36365 - 74642, n=26) | |
| Asus ROG Zephyrus Duo 16 GX650RX | |
| MSI Vector GP66 12UGS | |
| AIDA64 / Memory Write | |
| Razer Blade 15 Advanced Model Early 2022 | |
| MSI Raider GE66 12UHS | |
| Asus ROG Strix Scar 15 G533ZW-LN106WS | |
| Average of class Gaming (21619 - 103259, n=215, last 2 years) | |
| Alienware x15 R2 P111F | |
| MSI Titan GT77 12UHS | |
| Average Intel Core i9-12900H (32276 - 67858, n=26) | |
| Asus ROG Zephyrus Duo 16 GX650RX | |
| MSI Vector GP66 12UGS | |
| AIDA64 / Memory Latency | |
| Alienware x15 R2 P111F | |
| Asus ROG Strix Scar 15 G533ZW-LN106WS | |
| Razer Blade 15 Advanced Model Early 2022 | |
| MSI Raider GE66 12UHS | |
| Asus ROG Zephyrus Duo 16 GX650RX | |
| MSI Vector GP66 12UGS | |
| MSI Titan GT77 12UHS | |
| Average of class Gaming (59.5 - 152.5, n=211, last 2 years) | |
| Average Intel Core i9-12900H (74.7 - 118.1, n=25) | |
| Alienware x15 RTX 3070 P111F | |
* ... más pequeño es mejor
Latencia del CPD
La latencia DPC del Alienware x15 R2 es un poco más alta, pero nuestras pruebas de LatencyMon indican que aún debería ser adecuada para flujos de trabajo de audio y video en tiempo real. El controlador ACPI.sys de Windows parece contribuir a la latencia observada.


| DPC Latencies / LatencyMon - interrupt to process latency (max), Web, Youtube, Prime95 | |
| MSI Raider GE66 12UHS | |
| Razer Blade 15 Advanced Model Early 2022 | |
| MSI Vector GP66 12UGS | |
| MSI Titan GT77 12UHS | |
| MSI Titan GT77 12UHS | |
| Alienware x15 RTX 3070 P111F | |
| Asus ROG Strix Scar 15 G533ZW-LN106WS | |
| Alienware x15 R2 P111F | |
| Asus ROG Zephyrus Duo 16 GX650RX | |
* ... más pequeño es mejor
Puede encontrar más comparaciones entre los dispositivos revisados en nuestro Clasificación de la latencia del CPD página.
Dispositivos de almacenamiento

El subsistema de almacenamiento es un área en la que el x15 R2 se queda corto - ya hemos visto un mejor rendimiento con la unidad Samsung PM9A1. Dicho esto, las velocidades de lectura y escritura secuenciales del Q32T1 se acercan a los valores anunciados para esta unidad. El x15 R2 de este año ofrece un rendimiento de disco mejorado en un 40% en comparación con el SSD Western Digital SN730 del x15 R1.
Se observó un estrangulamiento del disco hacia la 43ª ejecución de la prueba de bucle de lectura DiskSpd a una profundidad de cola de 8. No hay solución térmica ni en el SSD ni en el panel inferior.
Dado el delgado chasis, Dell no ofrece espacio para una unidad SATA de 2,5 pulgadas. Sin embargo, hay una disposición para añadir otro SSD M.2 NVMe.

* ... más pequeño es mejor
Disk Throttling: DiskSpd Read Loop, Queue Depth 8
Nuestras pruebasBenchmarks de SSD y HDDofrece más comparaciones de rendimiento de dispositivos de almacenamiento.
Rendimiento de la GPU

Nuestra unidad Alienware x15 R2 cuenta con una GPU Nvidia GeForce RTX 3080 Ti para portátiles con 16 GB de VRAM GDDR6 y una potencia gráfica total (TGP) de 140 W. Dell no especifica el vataje de Dynamic Boost para esta GPU.
El rendimiento general en 3DMark de la RTX 3080 Ti en el x15 R2 es comparable al de la MSI Raider GE66 (150 W) y la MSI Titan GT77 (175 W). La puntuación algo más baja se debe al menor vataje necesario para el delgado chasis. La RTX 3080 Ti del Razer Blade 15 Advanced se queda atrás debido a su baja potencia de 110 W.


| 3DMark 11 Performance | 33756 puntos | |
| 3DMark Ice Storm Standard Score | 265376 puntos | |
| 3DMark Cloud Gate Standard Score | 62500 puntos | |
| 3DMark Fire Strike Score | 24365 puntos | |
| 3DMark Fire Strike Extreme Score | 14539 puntos | |
| 3DMark Time Spy Score | 12393 puntos | |
ayuda | ||

En cuanto a la energía de la batería, vemos una caída significativa en las puntuaciones de 3DMark Time Spy. La puntuación general cae un 58% mientras que el rendimiento gráfico sufre un enorme golpe del 60%
La tasa de refresco de la pantalla cambia automáticamente de 360 Hz a 60 Hz cuando se desconecta de la red eléctrica.
Rendimiento de los juegos
El rendimiento de juego del Alienware x15 R2 está en las líneas esperadas para el hardware ofrecido y está generalmente a la par con otros portátiles con RTX 3080 Ti. Los ajustes de muy baja calidad ven al Asus ROG Strix Scar 15 liderar con sus 150 W GPU RTX 3070 Ti para portátiles en juegos como F1 2021, The Witcher 3 , y Cyberpunk 2077, pero el x15 R2 gana terreno perdido una vez que se elevan los ajustes gráficos.
| Watch Dogs Legion | |
| 1920x1080 Ultra Preset (DX12) | |
| MSI Titan GT77 12UHS | |
| Average NVIDIA GeForce RTX 3080 Ti Laptop GPU (78.2 - 87, n=4) | |
| Alienware x15 R2 P111F | |
| Average of class Gaming (18 - 127, n=14, last 2 years) | |
| 1920x1080 Ultra Preset + Ultra Ray Tracing (DX12) | |
| Average NVIDIA GeForce RTX 3080 Ti Laptop GPU (50 - 70, n=3) | |
| MSI Titan GT77 12UHS | |
| Alienware x15 R2 P111F | |
| Average of class Gaming (9 - 90, n=10, last 2 years) | |
| Tiny Tina's Wonderlands | |
| 1920x1080 High Preset (DX12) | |
| Average of class Gaming (8.5 - 233, n=46, last 2 years) | |
| Average NVIDIA GeForce RTX 3080 Ti Laptop GPU (123.5 - 137.1, n=4) | |
| Asus ROG Zephyrus Duo 16 GX650RX | |
| Alienware x15 R2 P111F | |
| 1920x1080 Badass Preset (DX12) | |
| Average of class Gaming (9.7 - 189.4, n=55, last 2 years) | |
| Average NVIDIA GeForce RTX 3080 Ti Laptop GPU (100.7 - 110.5, n=4) | |
| Asus ROG Zephyrus Duo 16 GX650RX | |
| Alienware x15 R2 P111F | |
La tabla de FPS de Witcher 3
El rendimiento sostenido en The Witcher 3 a 1080p Ultra es decente, aunque se observan fluctuaciones en la velocidad de fotogramas. Hay una ligera caída de fps hacia el final de la carrera, pero el x15 R2 es capaz de recuperarse rápidamente.
| bajo | medio | alto | ultra | |
| The Witcher 3 (2015) | 391 | 345 | 229 | 116 |
| Dota 2 Reborn (2015) | 174.7 | 162.2 | 151.6 | 145.7 |
| Final Fantasy XV Benchmark (2018) | 209 | 156.4 | 120.5 | |
| X-Plane 11.11 (2018) | 146.9 | 137.7 | 105.5 | |
| Far Cry 5 (2018) | 172 | 152 | 143 | 135 |
| Strange Brigade (2018) | 458 | 246 | 200 | 180.5 |
| Watch Dogs Legion (2020) | 133.2 | 122.4 | 107.4 | 78.2 |
| F1 2021 (2021) | 361 | 319 | 248 | 146.9 |
| Cyberpunk 2077 1.6 (2022) | 133.7 | 124.6 | 102.6 | 86.1 |
| Tiny Tina's Wonderlands (2022) | 209 | 178.2 | 126.6 | 100.7 |
| Call of Duty Modern Warfare 2 2022 (2022) | 96 |
Echa un vistazo a nuestro GPU Nvidia GeForce RTX 3080 Ti para portátiles para obtener más información y comparaciones.
Emisiones: Este bólido corre caliente
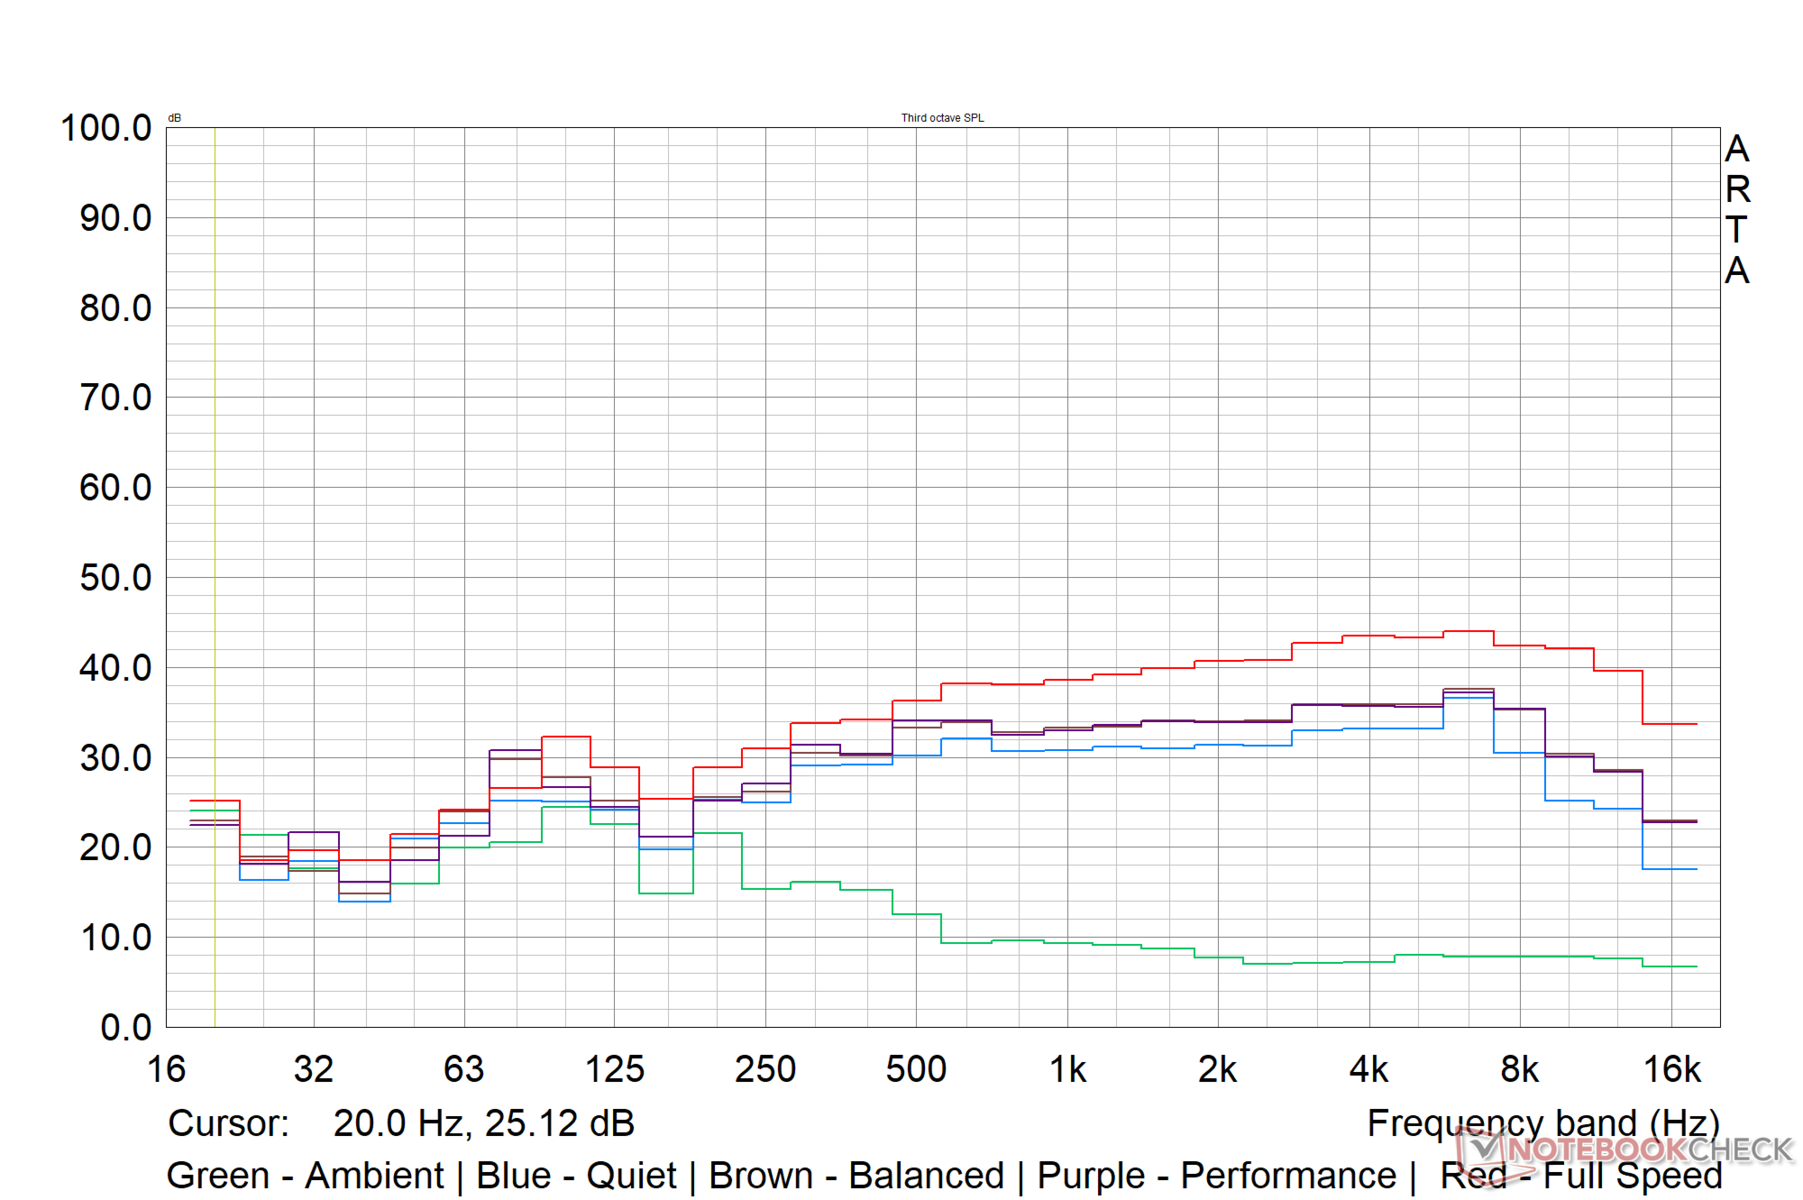
Ruido del sistema

Como ya hemos comentado, Dell ofrece cuatro perfiles térmicos para elegir. Para la mayoría de propósitos, los modos Equilibrado y Rendimiento hacen bien el trabajo. El modo Full Speed sólo es necesario si quieres una refrigeración absolutamente sin obstáculos.
En el modo silencioso, Dell limita el ruido del ventilador a 45 dB(A) sin importar la carga. Registramos cerca de 47 db(A) de ruido del ventilador mientras ejecutábamos The Witcher 3 en 1080p Ultra en los modos Equilibrado y Rendimiento.
Medimos los niveles de ruido del ventilador en el modo equilibrado. Dell parece haber fijado el nivel de ruido del ventilador en la marca de 53 db(A) en el modo Full Speed independientemente de la carga e incluso durante el ralentí.
Ruido
| Ocioso |
| 21.94 / 21.94 / 21.94 dB(A) |
| Carga |
| 45.1 / 45.58 dB(A) |
 | ||
30 dB silencioso 40 dB(A) audible 50 dB(A) ruidosamente alto |
||
min: | ||


| Alienware x15 R2 P111F Intel Core i9-12900H, NVIDIA GeForce RTX 3080 Ti Laptop GPU | Asus ROG Strix Scar 15 G533ZW-LN106WS Intel Core i9-12900H, NVIDIA GeForce RTX 3070 Ti Laptop GPU | Asus ROG Zephyrus Duo 16 GX650RX AMD Ryzen 9 6900HX, NVIDIA GeForce RTX 3080 Ti Laptop GPU | MSI Vector GP66 12UGS Intel Core i9-12900H, NVIDIA GeForce RTX 3070 Ti Laptop GPU | Razer Blade 15 Advanced Model Early 2022 Intel Core i7-12800H, NVIDIA GeForce RTX 3080 Ti Laptop GPU | |
|---|---|---|---|---|---|
| Noise | -46% | -14% | -11% | -10% | |
| off / environment * | 21.79 | 26.86 -23% | 26 -19% | 22.9 -5% | 26 -19% |
| Idle Minimum * | 21.94 | 39.07 -78% | 26 -19% | 23.4 -7% | 26 -19% |
| Idle Average * | 21.94 | 39.07 -78% | 27 -23% | 23.4 -7% | 27 -23% |
| Idle Maximum * | 21.94 | 39.07 -78% | 29 -32% | 27.4 -25% | 29 -32% |
| Load Average * | 45.1 | 53.34 -18% | 41 9% | 36 20% | 37 18% |
| Witcher 3 ultra * | 46.56 | 56.6 -22% | 48 -3% | 58.2 -25% | 44 5% |
| Load Maximum * | 45.58 | 56.6 -24% | 50 -10% | 58 -27% | 45 1% |
* ... más pequeño es mejor
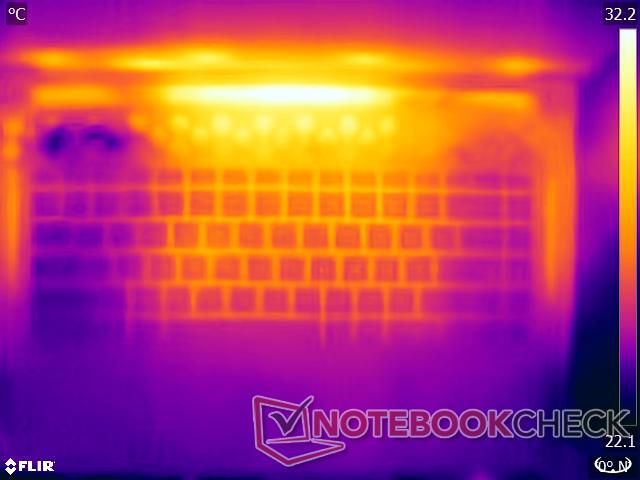
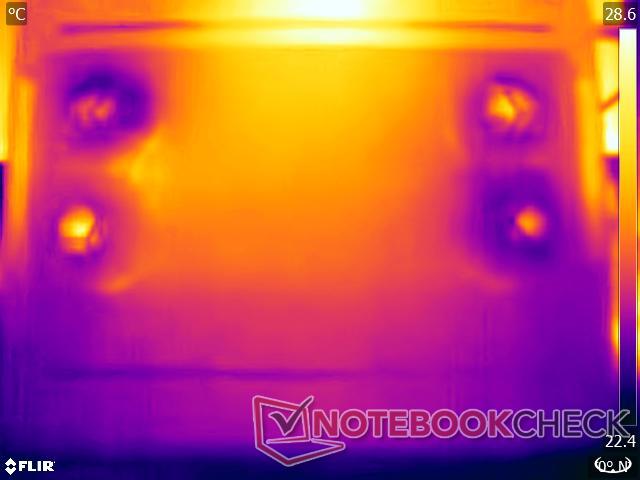
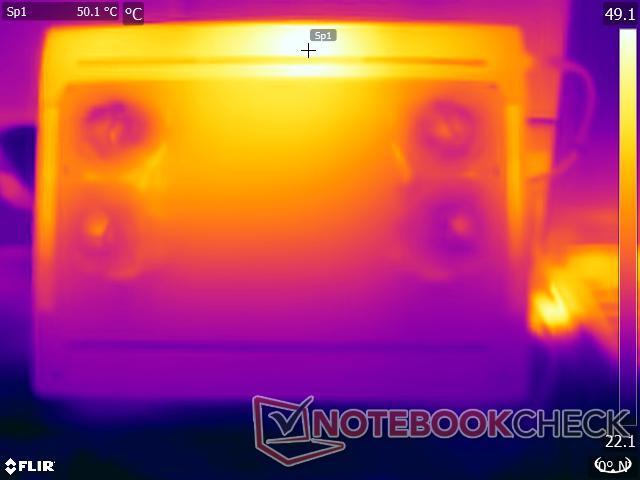
Temperatura
Incluso con cuatro ventiladores controlados independientemente y cuatro heatpipes funcionando en el perfil Full Speed, observamos que las temperaturas de la superficie alcanzaban hasta 66.2 °C durante la prueba de estrés de The Witcher 3. Dicho esto, las zonas de reposo de las palmas están relativamente frescas incluso bajo carga.
(-) The maximum temperature on the upper side is 58.6 °C / 137 F, compared to the average of 40.4 °C / 105 F, ranging from 21.2 to 68.8 °C for the class Gaming.
(-) The bottom heats up to a maximum of 51.8 °C / 125 F, compared to the average of 43.2 °C / 110 F
(+) In idle usage, the average temperature for the upper side is 31.4 °C / 89 F, compared to the device average of 33.8 °C / 93 F.
(-) Playing The Witcher 3, the average temperature for the upper side is 46.9 °C / 116 F, compared to the device average of 33.8 °C / 93 F.
(+) The palmrests and touchpad are reaching skin temperature as a maximum (33.4 °C / 92.1 F) and are therefore not hot.
(-) The average temperature of the palmrest area of similar devices was 28.9 °C / 84 F (-4.5 °C / -8.1 F).
Nuestras pruebas de estrés representan escenarios extremos, pero recomendamos utilizar el x15 R2 en el regazo sólo cuando se ejecuta en los perfiles térmicos Silencio o Equilibrado sin mucho estrés para asegurar temperaturas de superficie tolerables.


| Alienware x15 R2 P111F Intel Core i9-12900H, NVIDIA GeForce RTX 3080 Ti Laptop GPU | Asus ROG Strix Scar 15 G533ZW-LN106WS Intel Core i9-12900H, NVIDIA GeForce RTX 3070 Ti Laptop GPU | Asus ROG Zephyrus Duo 16 GX650RX AMD Ryzen 9 6900HX, NVIDIA GeForce RTX 3080 Ti Laptop GPU | MSI Vector GP66 12UGS Intel Core i9-12900H, NVIDIA GeForce RTX 3070 Ti Laptop GPU | Razer Blade 15 Advanced Model Early 2022 Intel Core i7-12800H, NVIDIA GeForce RTX 3080 Ti Laptop GPU | |
|---|---|---|---|---|---|
| Heat | 0% | 7% | 8% | -4% | |
| Maximum Upper Side * | 58.6 | 42.6 27% | 45 23% | 40.2 31% | 53 10% |
| Maximum Bottom * | 51.8 | 50.2 3% | 50 3% | 43.8 15% | 53 -2% |
| Idle Upper Side * | 36.4 | 36.2 1% | 33 9% | 34.8 4% | 36 1% |
| Idle Bottom * | 31 | 40.2 -30% | 33 -6% | 37 -19% | 38 -23% |
* ... más pequeño es mejor
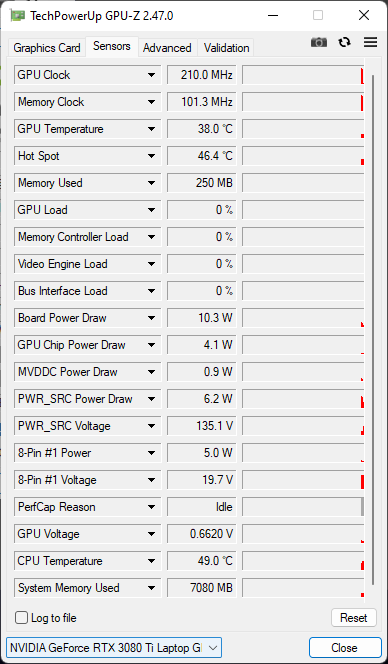
Prueba de esfuerzo
Las pruebas de estrés del Alienware x15 R2 nos indican cómo varían varios parámetros de la CPU y la GPU bajo diferentes cargas
Sólo con los FFT de Prime95, el Core i9-12900H alcanza inicialmente un pico de reloj cercano a los 3,7 GHz mientras consume 131 W. Posteriormente, los relojes oscilan entre 2,6 GHz y 3 GHz, lo que corresponde a 75 W y 80 W PL1.

| Prueba de esfuerzo | Relojdela CPU (GHz) | Reloj de la GPU (MHz) | Temperaturamediadela CPU (°C) | Temperatura media de la GPU (°C) |
| Sistema en reposo | 3,2 | - | 40 | - |
| Prime95 | 2,69 | - | 95 | 57,2 |
| Prime95+ FurMark | 1,83 | 1,275 | 79 | 76 |
| El Witcher 3 | 3,35 | 1.672 | 74 | 83 |
Al añadir FurMark a la mezcla, vemos que el Core i9-12900H es capaz de alcanzar 130 W, pero rápidamente baja a 60 W y luego gradualmente a 30 W. Esto es para acomodar el requisito de energía de 120 W de la RTX 3080 Ti que ocasionalmente llega a 150 W
Al estresarse con Witcher 3 se presenta un escenario más real, y encontramos que los relojes de la CPU alcanzan un pico de 4 GHz y pronto se asientan cerca de la marca de 2,5 GHz, mientras que la RTX 3080 Ti cae desde un máximo inicial de 1.702 MHz y se estabiliza en torno a los 1.500 MHz. La RTX 3080 Ti consume cerca de 130 W inicialmente, pero pronto baja a 120 W. El Core i9-12900H baja de unos 75 W a 20 W durante la ejecución.


Altavoces
Para un chasis delgado, el audio integrado del Alienware x15 R2 es bastante decente. Los 2 altavoces de 2 W producen un volumen de 80,2 db(A), que debería ser perceptible en una habitación de tamaño medio. Todos los lanzamientos de Alienware 2022 cuentan con la certificación Dolby Atmos.
La respuesta de los graves está estrictamente bien, pero los medios y los agudos están más claramente definidos. No hay distorsión perceptible a volúmenes más altos. Subjetivamente, el audio integrado puede hacer el trabajo para la mayoría de trabajos habituales.
Los jugadores pueden conectar un par de auriculares mejores a través de Bluetooth 5.2 o del conector de audio combinado de 3,5 mm.


Alienware x15 R2 P111F audio analysis
(±) | speaker loudness is average but good (80.2 dB)
Bass 100 - 315 Hz
(±) | reduced bass - on average 13.5% lower than median
(±) | linearity of bass is average (9.9% delta to prev. frequency)
Mids 400 - 2000 Hz
(+) | balanced mids - only 1.7% away from median
(+) | mids are linear (2.4% delta to prev. frequency)
Highs 2 - 16 kHz
(±) | higher highs - on average 5% higher than median
(+) | highs are linear (4.3% delta to prev. frequency)
Overall 100 - 16.000 Hz
(+) | overall sound is linear (12.6% difference to median)
Compared to same class
» 14% of all tested devices in this class were better, 3% similar, 82% worse
» The best had a delta of 6%, average was 18%, worst was 132%
Compared to all devices tested
» 9% of all tested devices were better, 2% similar, 89% worse
» The best had a delta of 4%, average was 25%, worst was 134%
Apple MacBook Pro 16 2021 M1 Pro audio analysis
(+) | speakers can play relatively loud (84.7 dB)
Bass 100 - 315 Hz
(+) | good bass - only 3.8% away from median
(+) | bass is linear (5.2% delta to prev. frequency)
Mids 400 - 2000 Hz
(+) | balanced mids - only 1.3% away from median
(+) | mids are linear (2.1% delta to prev. frequency)
Highs 2 - 16 kHz
(+) | balanced highs - only 1.9% away from median
(+) | highs are linear (2.7% delta to prev. frequency)
Overall 100 - 16.000 Hz
(+) | overall sound is linear (4.6% difference to median)
Compared to same class
» 0% of all tested devices in this class were better, 0% similar, 100% worse
» The best had a delta of 5%, average was 18%, worst was 45%
Compared to all devices tested
» 0% of all tested devices were better, 0% similar, 100% worse
» The best had a delta of 4%, average was 25%, worst was 134%
Gestión de la energía: Económico a carga máxima
Consumo de energía
El adaptador de corriente de 240 W suministrado es suficiente para alimentar el 15 R2 en varias cargas de trabajo. El consumo de energía es más alto, pero está en las líneas esperadas dadas las internas. Notamos que el consumo de energía de carga máxima puede llegar a casi 242 W antes de establecerse cerca de la marca de 180 W
No obstante, el consumo de energía del x15 R2 sigue siendo económico en comparación con la competencia, especialmente a carga máxima. El Razer Blade 15 Advanced tiene un menor requerimiento de energía en general, probablemente debido a la RTX 3080 Ti de 110 W.
| Off / Standby | |
| Ocioso | |
| Carga |
|
| Alienware x15 R2 P111F i9-12900H, GeForce RTX 3080 Ti Laptop GPU, IPS, 1920x1080 | Asus ROG Strix Scar 15 G533ZW-LN106WS i9-12900H, GeForce RTX 3070 Ti Laptop GPU, IPS-level, 2560x1440 | Asus ROG Zephyrus Duo 16 GX650RX R9 6900HX, GeForce RTX 3080 Ti Laptop GPU, IPS-Level, 3840x2400 | MSI Vector GP66 12UGS i9-12900H, GeForce RTX 3070 Ti Laptop GPU, IPS, 1920x1080 | Razer Blade 15 Advanced Model Early 2022 i7-12800H, GeForce RTX 3080 Ti Laptop GPU, IPS, 1920x1080 | Average NVIDIA GeForce RTX 3080 Ti Laptop GPU | Average of class Gaming | |
|---|---|---|---|---|---|---|---|
| Power Consumption | 15% | -11% | -24% | 8% | -16% | -1% | |
| Idle Minimum * | 16.2 | 7.56 53% | 19 -17% | 17.5 -8% | 17 -5% | 17.2 ? -6% | 13.9 ? 14% |
| Idle Average * | 20 | 13.5 32% | 24 -20% | 20.1 -1% | 19 5% | 23.3 ? -17% | 19.3 ? 3% |
| Idle Maximum * | 21.2 | 16.87 20% | 31 -46% | 47.3 -123% | 25 -18% | 30.8 ? -45% | 27.2 ? -28% |
| Load Average * | 122.1 | 128.9 -6% | 104 15% | 107.3 12% | 108 12% | 121.2 ? 1% | 110.6 ? 9% |
| Witcher 3 ultra * | 207 | 196.2 5% | 186.5 10% | 225 -9% | 150 28% | ||
| Load Maximum * | 241.9 | 274.86 -14% | 256 -6% | 277.7 -15% | 179 26% | 276 ? -14% | 251 ? -4% |
* ... más pequeño es mejor
Power Consumption - The Witcher 3 / Stress test
Power Consumption - External monitor
Duración de la batería
Usamos nuestro script estandarizado de la página web para evaluar la duración de la batería tanto en la configuración de brillo completo como en la de 150 cd/m2. Las pruebas de duración de la batería se realizaron en el modo MSHybrid con una frecuencia de refresco de pantalla de 60 Hz.
La batería de 87 WHr del x15 R2 pudo reunir un poco más de seis horas a 150 cd/m2. También se observaron tiempos de ejecución similares a pleno brillo. En el modo dGPU, pudimos lograr sólo 3 horas y 36 minutos de duración de la batería a 150 cd/m2 de brillo.

| Alienware x15 R2 P111F i9-12900H, GeForce RTX 3080 Ti Laptop GPU, 87 Wh | Alienware x15 RTX 3070 P111F i7-11800H, GeForce RTX 3070 Laptop GPU, 87 Wh | Asus ROG Strix Scar 15 G533ZW-LN106WS i9-12900H, GeForce RTX 3070 Ti Laptop GPU, 90 Wh | Asus ROG Zephyrus Duo 16 GX650RX R9 6900HX, GeForce RTX 3080 Ti Laptop GPU, 90 Wh | Razer Blade 15 Advanced Model Early 2022 i7-12800H, GeForce RTX 3080 Ti Laptop GPU, 80 Wh | Average of class Gaming | |
|---|---|---|---|---|---|---|
| Duración de Batería | 1% | 38% | 29% | -19% | 2% | |
| WiFi v1.3 | 362.5 | 366 1% | 501.4 38% | 469 29% | 293 -19% | 369 ? 2% |
| Reader / Idle | 582 | 749 | 484 | 545 ? | ||
| Load | 53 | 52 | 62 | 122 | 84.8 ? | |
| H.264 | 510 | 559 | 356 | 397 ? | ||
| Witcher 3 ultra | 70 | 78.9 ? |
Pro
Contra
Veredicto: Este alienígena cumple con la mayoría de los requisitos

El Alienware x15 R2 es una evolución del x15 R1 del año pasado y no aporta ningún cambio revolucionario. Hay algunas características estándar en todas las configuraciones de Alienware de este año, como las certificaciones Dolby Vision y Dolby Atmos, Element 31 TIM y Advanced Optimus, por nombrar algunas
El chasis tipo ultrabook se presenta como algo distintivo de Alienware con todas las insignias relevantes. La ubicación de los puertos no es la más ideal, pero lo esencial está cubierto. La calidad de la webcam sigue siendo una idea tardía. El teclado ofrece una buena respuesta táctil, pero las funciones secundarias siguen sin iluminarse.
La calidad de la pantalla es buena para su aplicación principal como portátil de juegos. Sin embargo, la mayoría de los compradores querrán optar por la variante QHD dada la potencia interna. No hay PWM, y los tiempos de respuesta son buenos cuando se activa el overdrive a 360 Hz.
El Alienware x15 R2 debería estar en lo alto de tu lista de méritos si estás buscando un portátil de juegos que combine de forma efectiva un factor de forma similar al de un ultrabook con un hardware moderno de gama alta, siempre que las mayores emisiones de calor y ruido no sean una preocupación grave."
A pesar de la delgadez del chasis, Dell ha hecho un buen trabajo con los componentes térmicos para garantizar que no se produzca una ralentización significativa bajo carga. Otros competidores como el MSI Vector GP66 y el Asus ROG Strix Scar 15 con el Core i9-12900H obtienen puntuaciones algo más altas, pero el x15 R2 se mantiene bien. El aumento de rendimiento comparado con el x15 R1 del año pasado es bastante significativo
Quizás el mayor problema del Alienware x15 R2 es su alta emisión de calor y ruido. Mientras que los niveles de ruido del ventilador pueden ser controlados hasta cierto punto mediante la elección del perfil térmico adecuado, las temperaturas superficiales definitivamente parecen estar en el lado más alto. El consumo de energía y la duración de la batería están en las líneas esperadas para esta configuración, aunque el Scar 15 y el Razer Blade 15 Advanced son consumidores de energía más económicos
El Alienware x15 R2 ofrece una combinación única de estética y rendimiento insignia a la que aspiran muchos otros portátiles. Sin embargo, a un precio de ₹3.68.190 (~4.500 dólares o 4.583 euros), el Alienware x15 R2 no tiene un precio competitivo en el mercado indio, especialmente cuando existen opciones como el Asus ROG Strix Scar 15 G533.
Precio y disponibilidad
La configuración revisada del Alienware x15 R2 está disponible por ~4.137 dólares en Amazon India, Amazon USy Dell.com. Una variante del x15 R2 con Core i7-12700H y RTX 3070 Ti está disponible en Best Buy por 2.700 dólares.
Alienware x15 R2 P111F
-
10/04/2022 v7
Vaidyanathan Subramaniam
Pricecompare

