Análisis del portátil Alienware x15 R1: El OVNI más delgado de Dell ha aterrizado
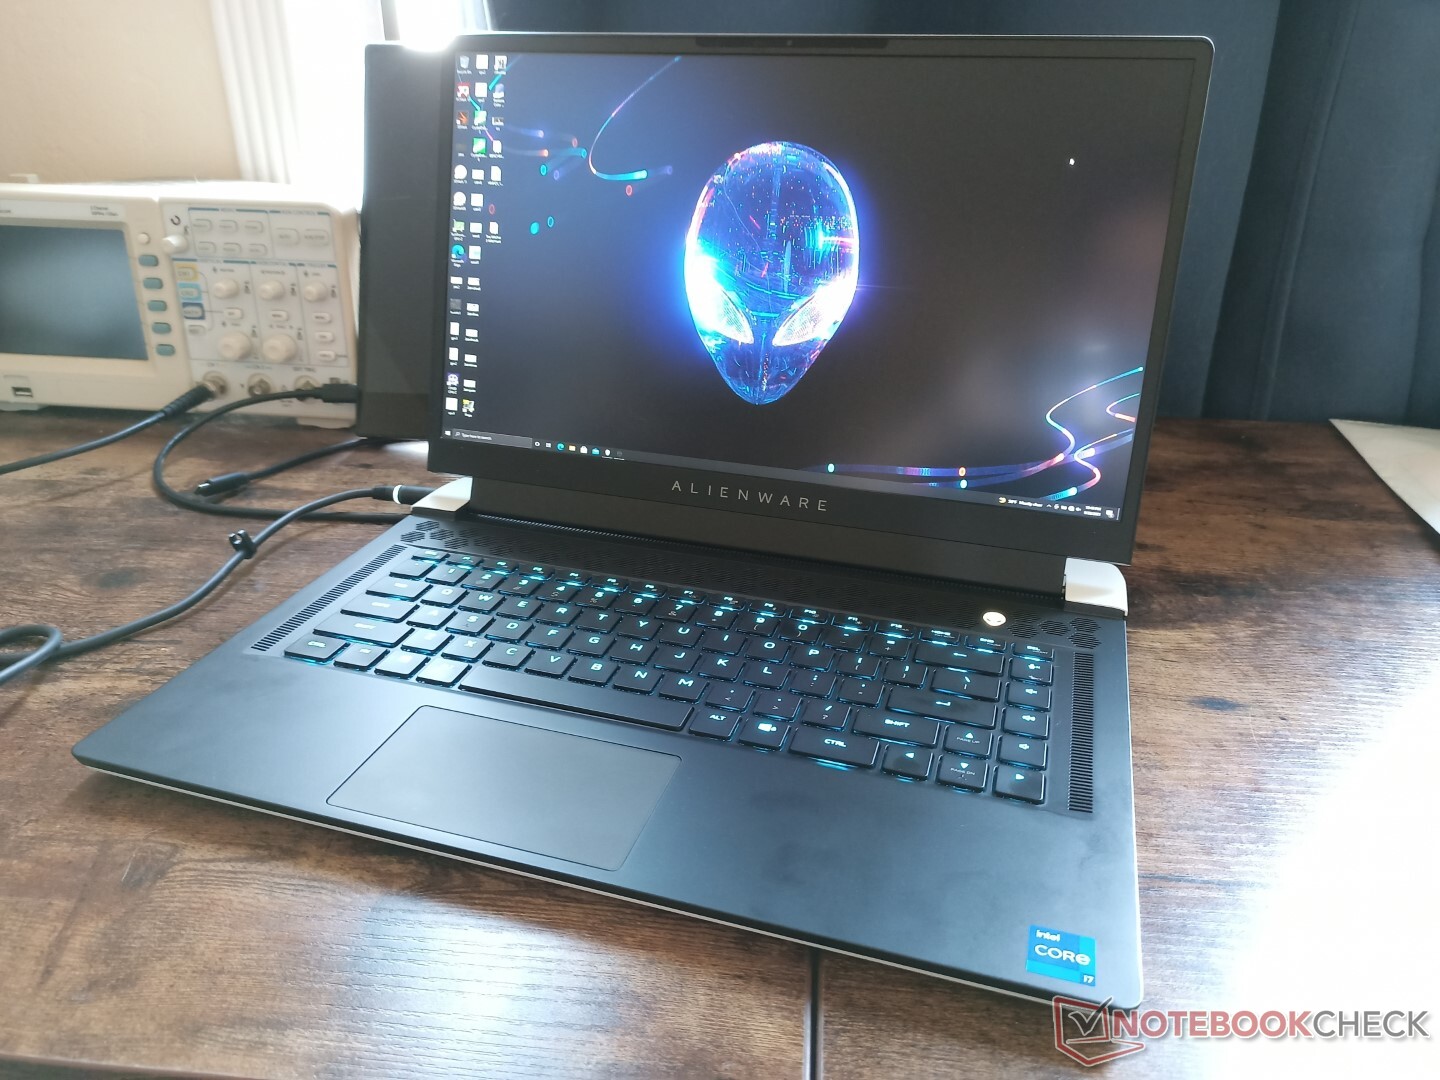
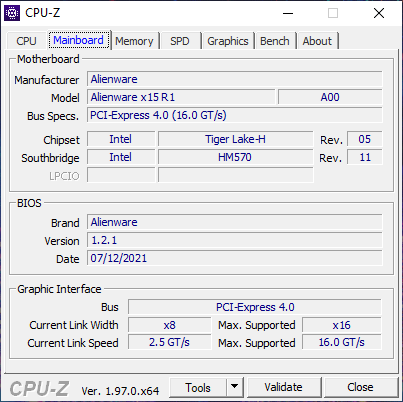
El Alienware x15 R1 inicia una nueva generación de portátiles Alienware de 15,6 pulgadas que sustituye a la antigua serie Alienware m15. Como se detalló en el anuncio originalel último modelo renueva completamente el diseño del chasis Legend introducido en el Alienware m15 R2 para conseguir un aspecto más fino y elegante.
Los modelos actuales van desde la CPU Core i7-11800H de 11ª generación con gráficos GeForce RTX 3060 y pantalla FHD de 165 Hz por unos 2000 dólares hasta el Core i9-11900H con RTX 3070 y pantalla FHD de 360 Hz por unos 3000 dólares. Dell planea lanzar opciones RTX 3080 en los próximos meses. Nuestra configuración en revisión es un SKU medio con el i7-11800H, RTX 3070, y pantalla QHD de 240 Hz por unos $2700 USD.
Los competidores del Alienware x15 R1 incluyen otros portátiles de juego ultrafinos de 15,6 pulgadas como el Razer Blade 15, MSI GS66, Asus Zephyrus S15, Acer Predator Triton 700, o Aorus 15G. Existe una versión más grande de 17,3 pulgadas del x15 R1 llamada Alienware x17 R1.
Más opiniones de Dell:
potential competitors in comparison
Valoración | Fecha | Modelo | Peso | Altura | Tamaño | Resolución | Precio |
|---|---|---|---|---|---|---|---|
| 87.2 % v7 (old) | 09/2021 | Alienware x15 RTX 3070 P111F i7-11800H, GeForce RTX 3070 Laptop GPU | 2.4 kg | 15.9 mm | 15.60" | 2560x1440 | |
| 86.1 % v7 (old) | 06/2021 | Alienware m15 R4 RTX 3080 i9-10980HK, GeForce RTX 3080 Laptop GPU | 2.4 kg | 20 mm | 15.60" | 1920x1080 | |
| 84 % v7 (old) | 02/2021 | MSI GS66 Stealth 10UG i7-10870H, GeForce RTX 3070 Laptop GPU | 2.1 kg | 19.8 mm | 15.60" | 1920x1080 | |
| 88.9 % v7 (old) | 07/2021 | Razer Blade 15 Advanced (Mid 2021) i7-11800H, GeForce RTX 3080 Laptop GPU | 2 kg | 16.99 mm | 15.60" | 1920x1080 | |
| 82.9 % v7 (old) | 09/2020 | Asus Zephyrus S15 GX502L i7-10875H, GeForce RTX 2070 Super Mobile | 2.1 kg | 19 mm | 15.60" | 1920x1080 | |
| 83.8 % v7 (old) | 07/2021 | Acer Predator Helios 300 PH315-53-786B i7-10750H, GeForce RTX 3070 Laptop GPU | 2.2 kg | 22.9 mm | 15.60" | 1920x1080 |
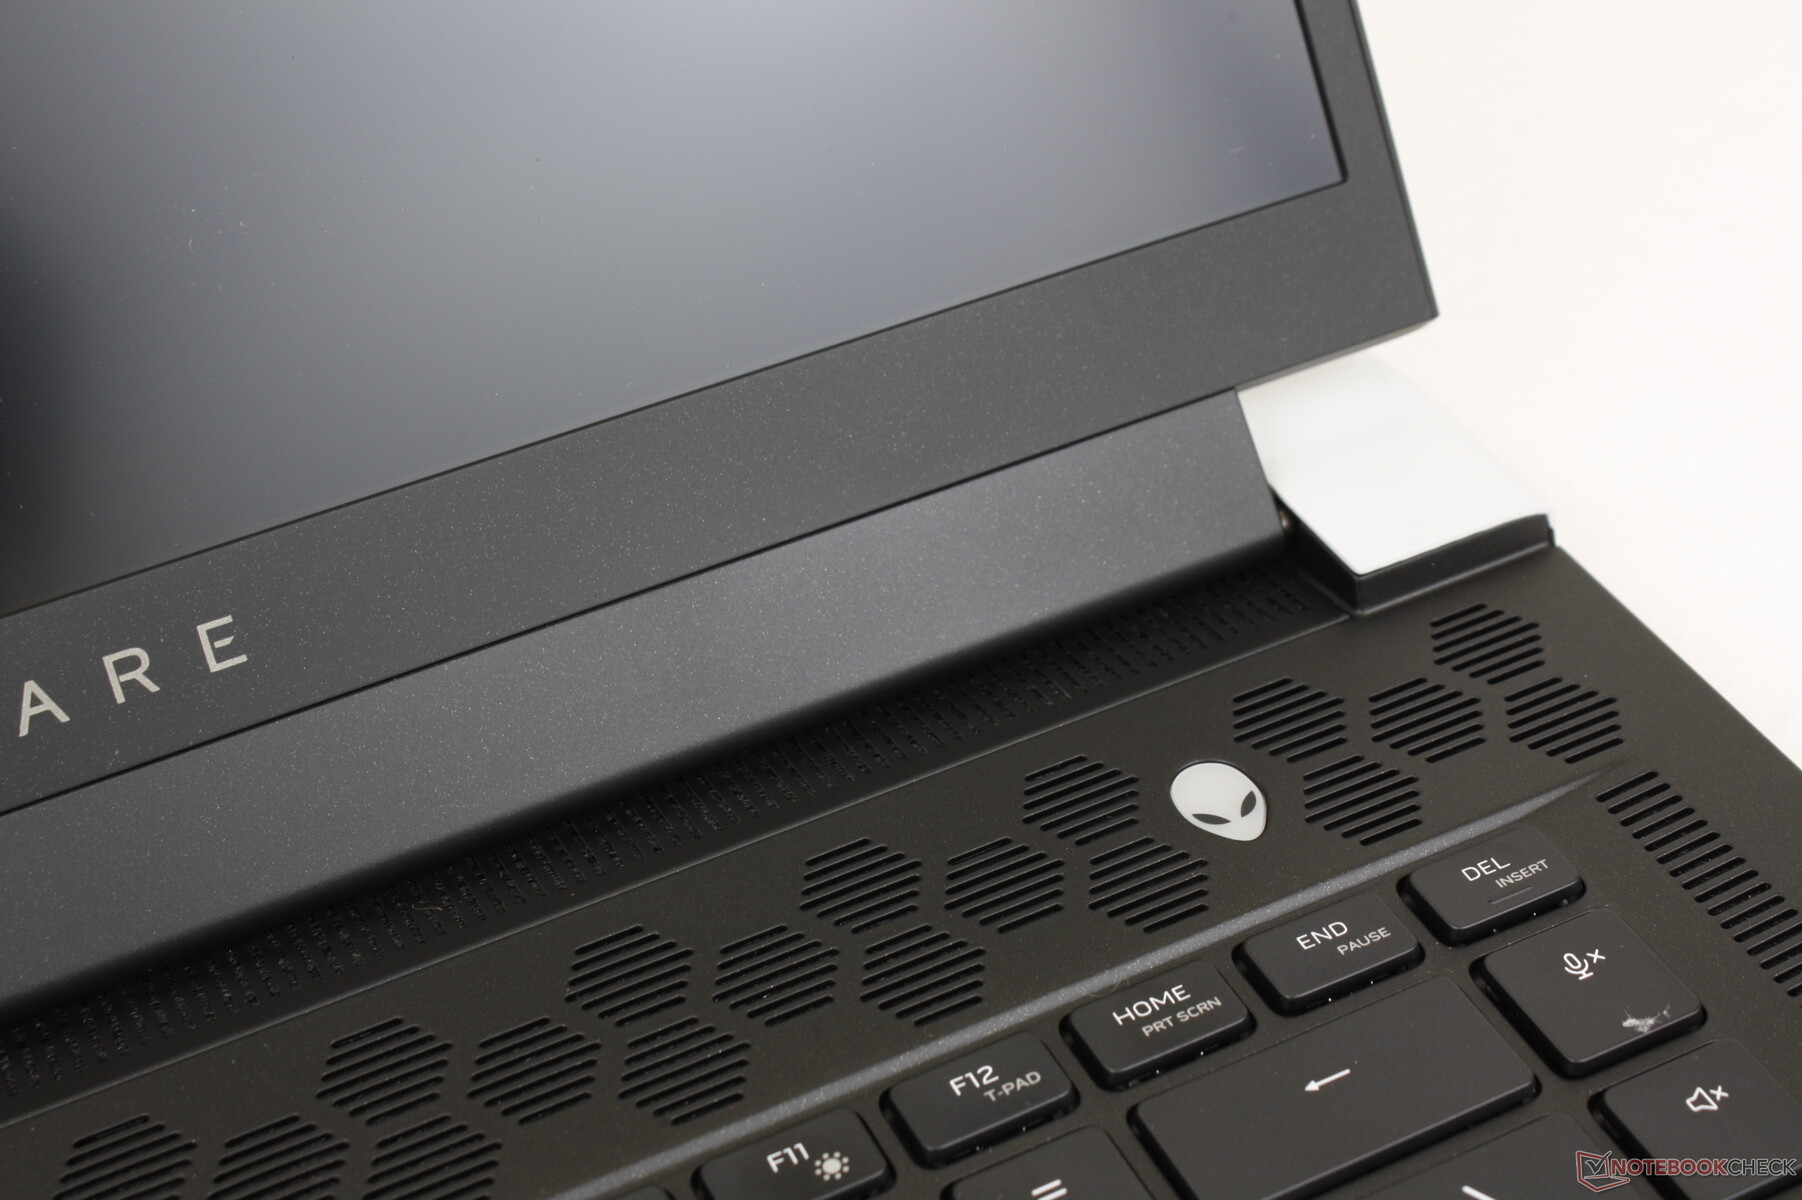
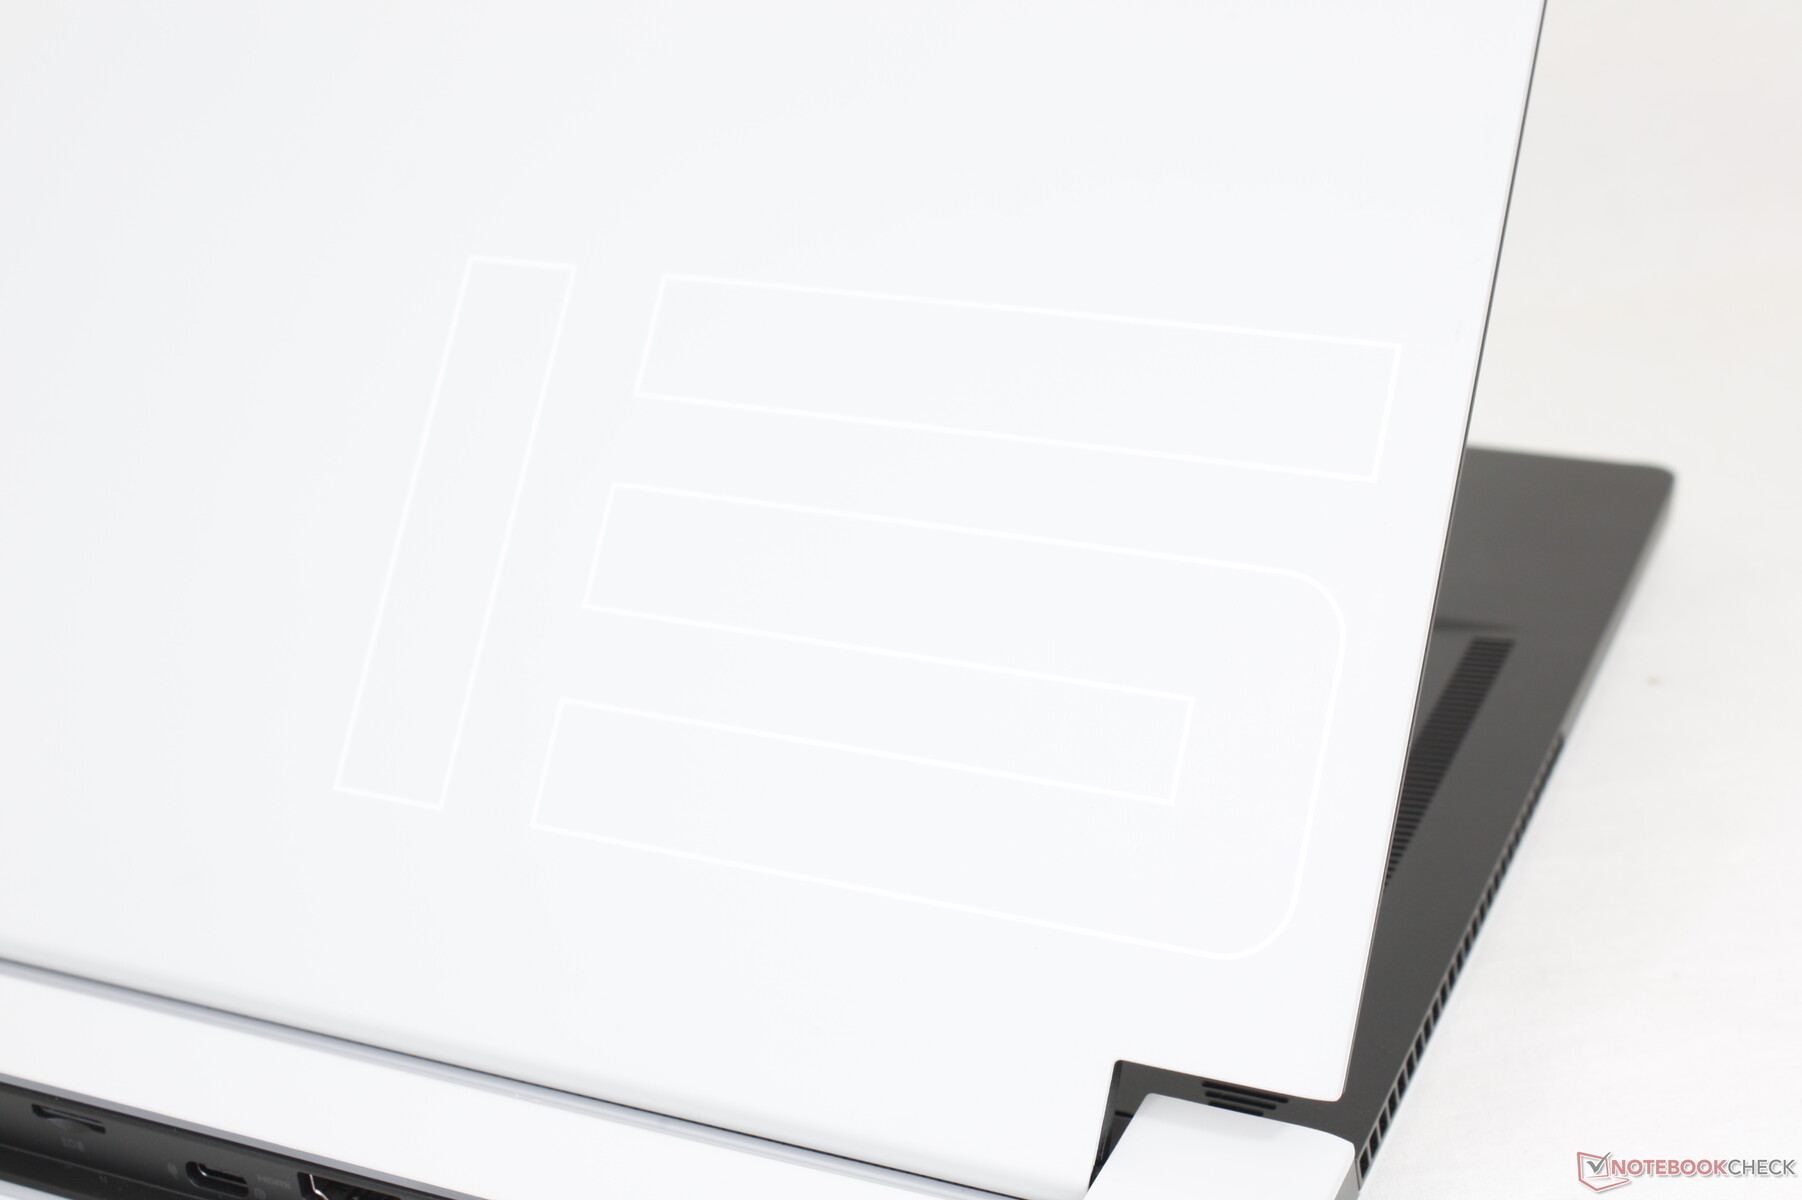
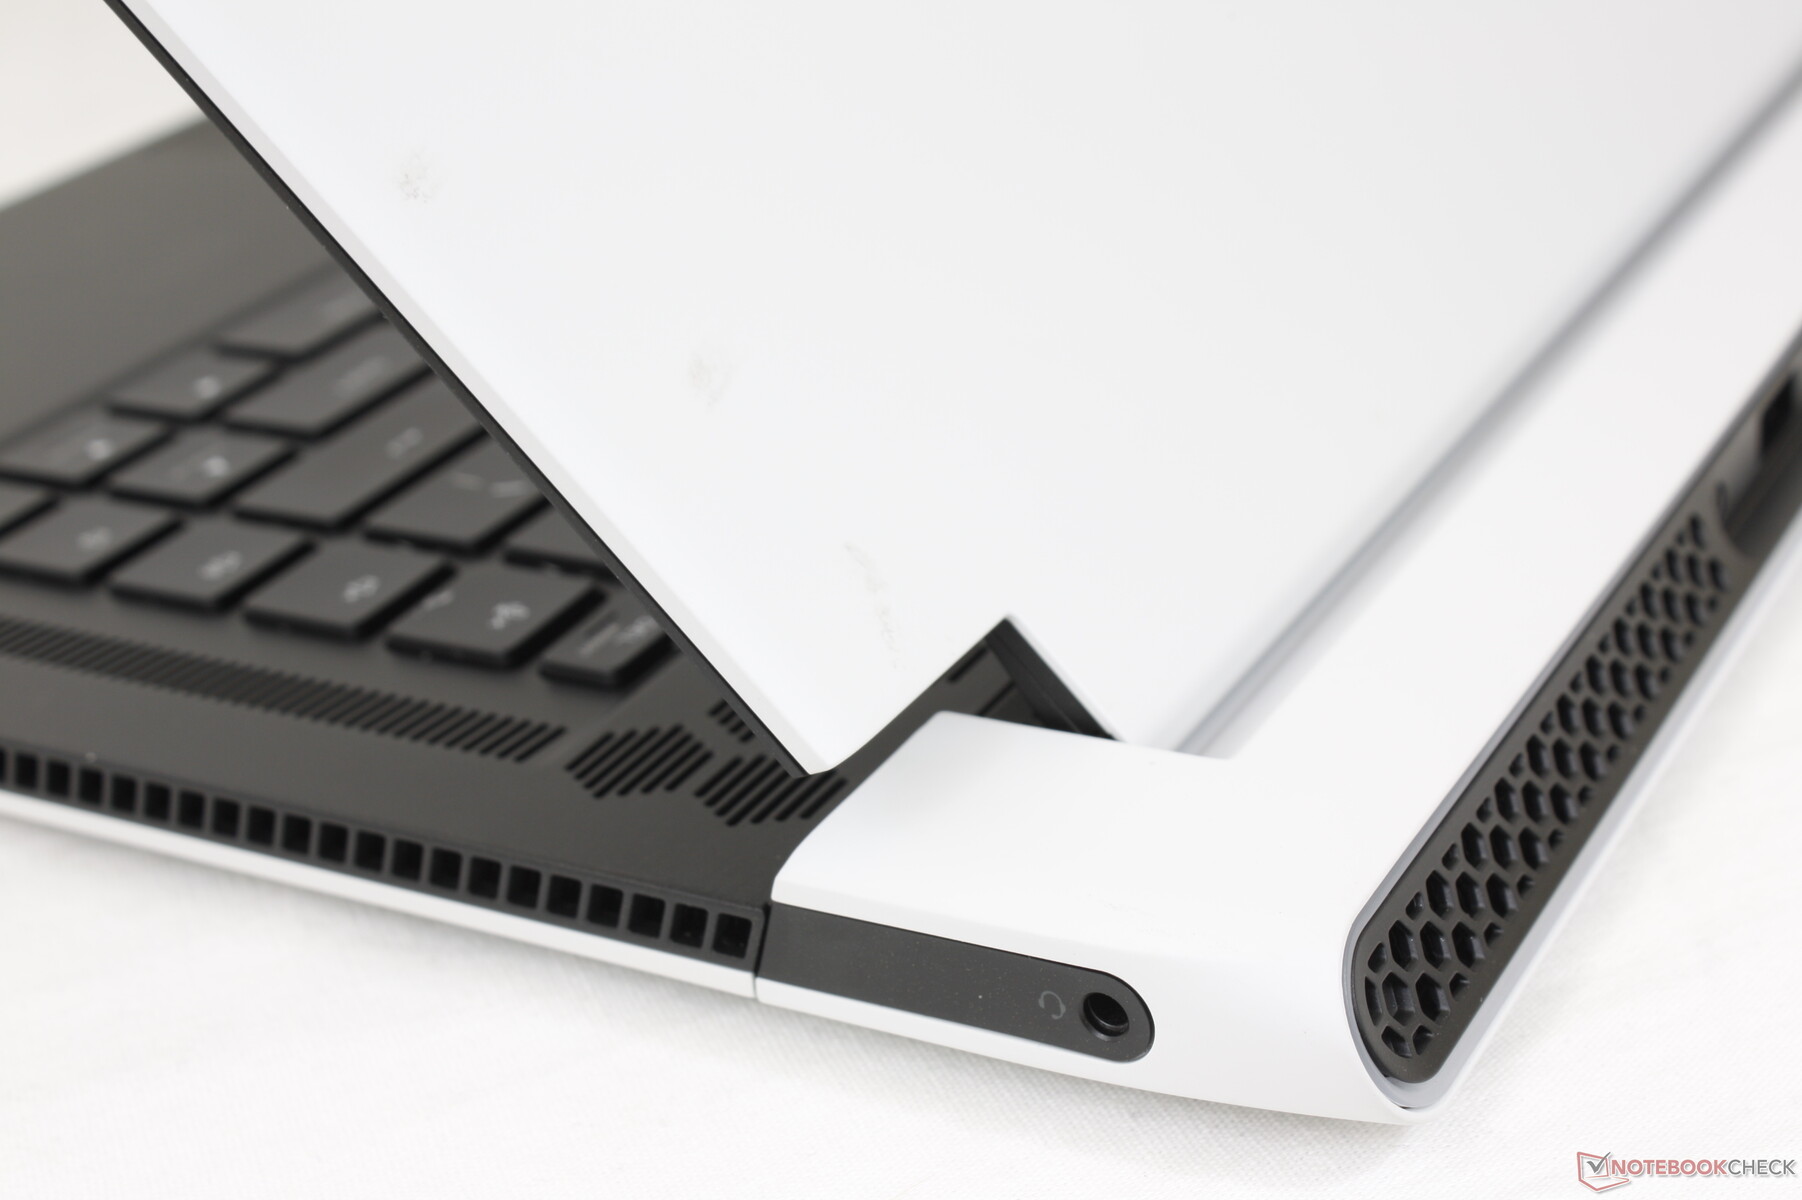
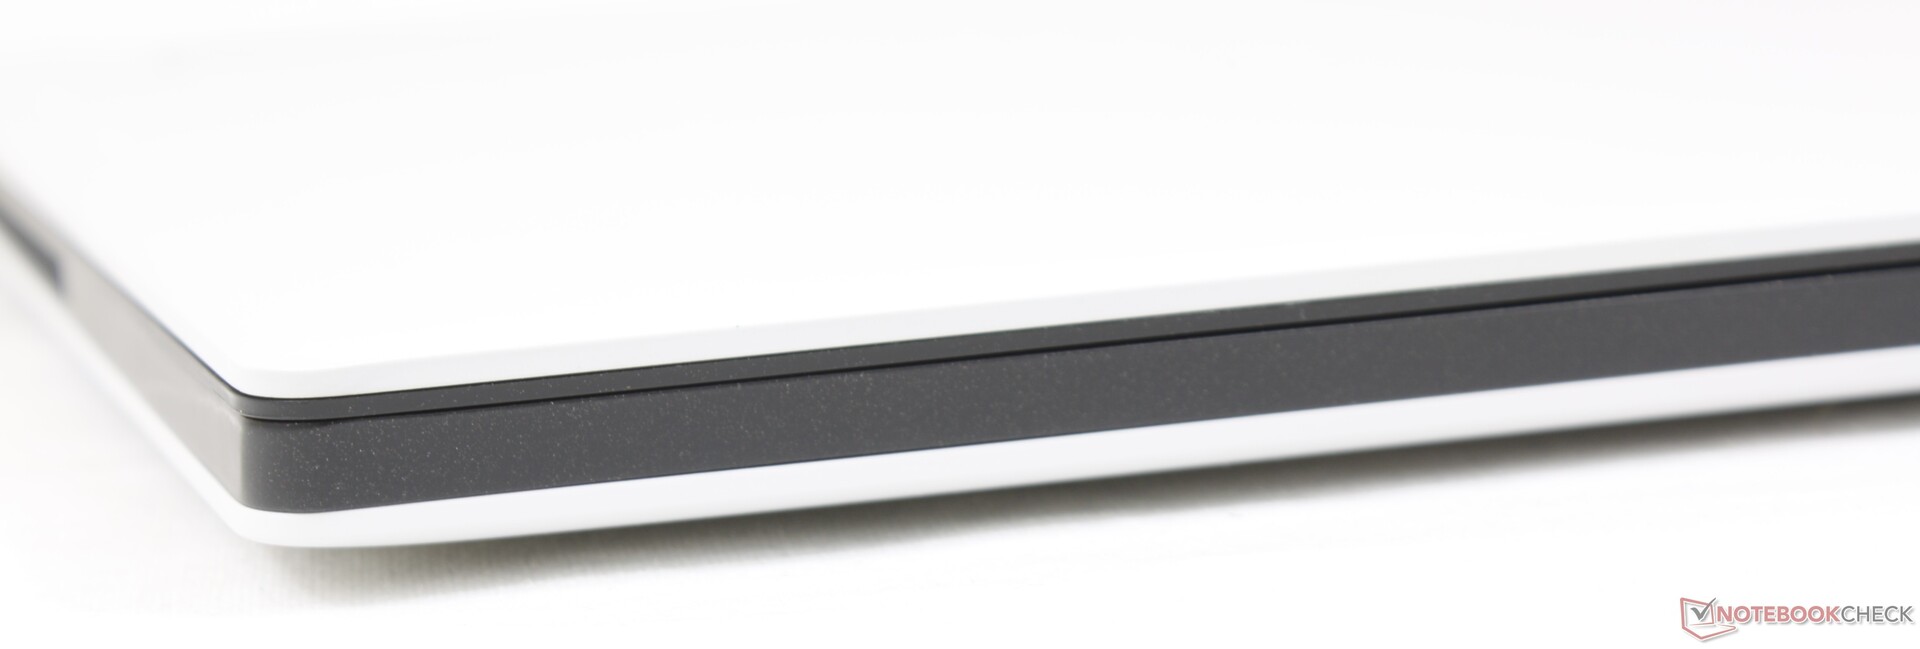
Caja - Más delgada pero más ancha
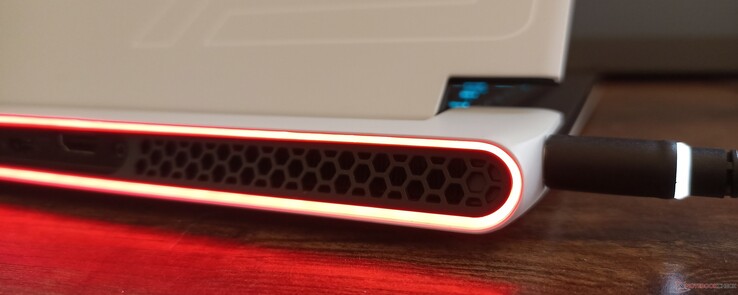
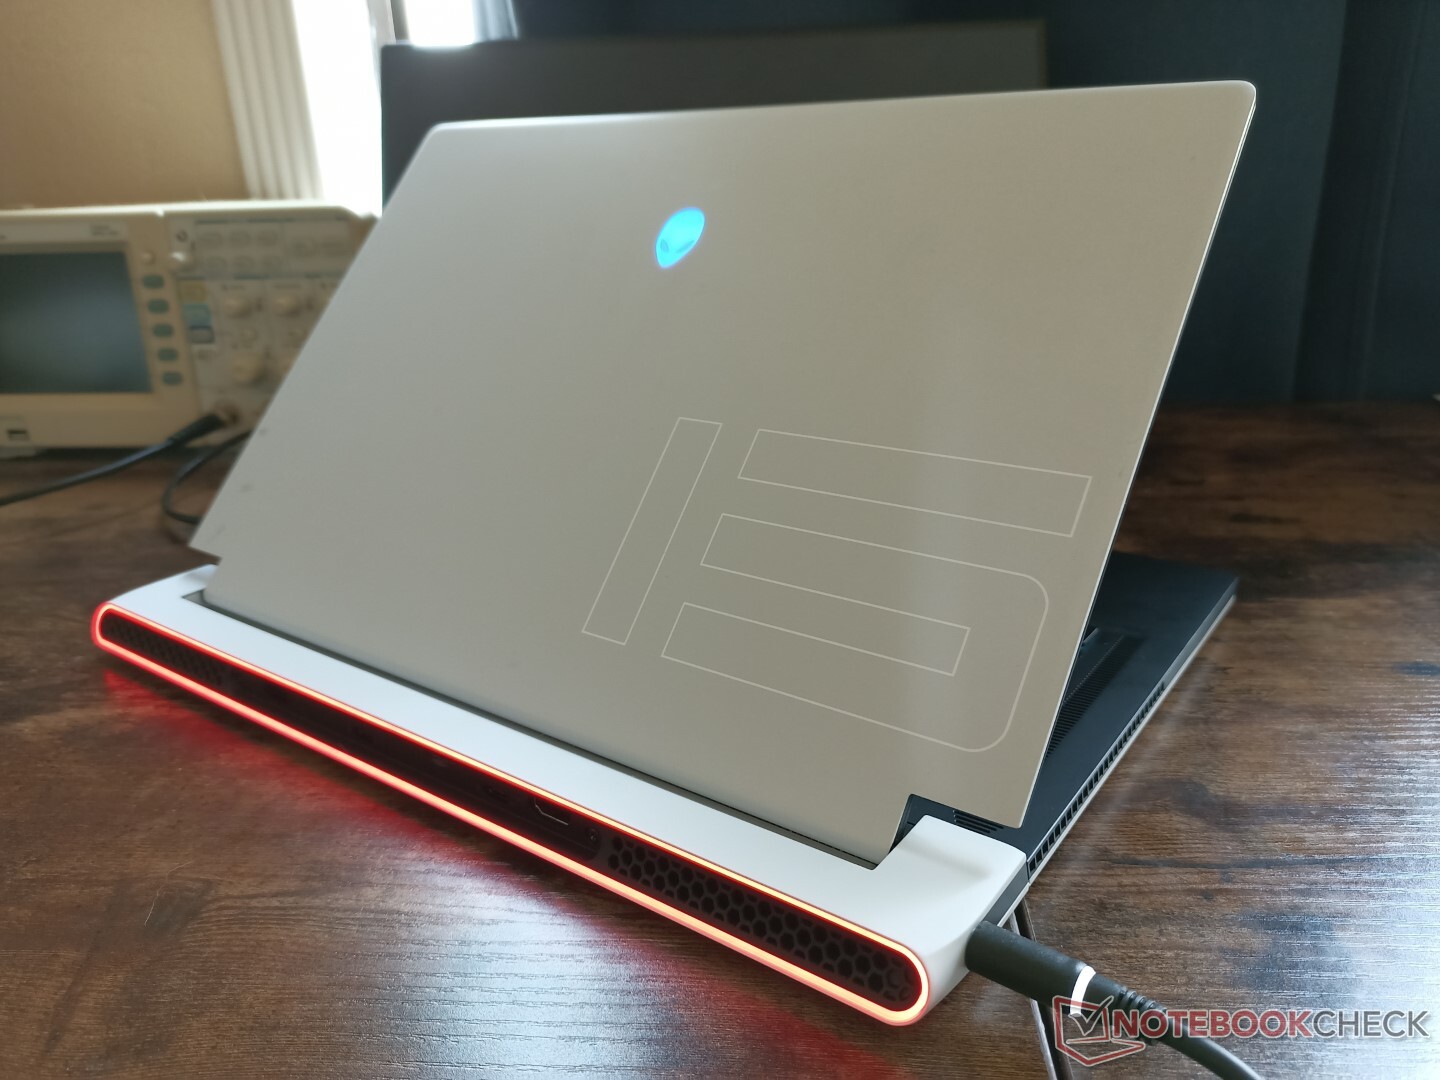
El nuevo chasis se puede describir mejor como un Alienware m15 R2 pero más plano ya que el x15 R1 es casi el mismo en términos de longitud y anchura y utiliza casi los mismos materiales del chasis para una sensación similar. Han desaparecido las barras de plástico brillante a lo largo del borde frontal y el bisel inferior para una construcción mate más uniforme. El chasis se acerca bastante al aspecto de un Ultrabook, pero mantiene todos los aspectos originales del diseño del m15 R2 Legend, como las rejillas de nido de abeja y el anillo LED RGB trasero.
La rigidez del chasis es ligeramente inferior a la del m15 R2/R3/R4/R5. Tanto la base como la tapa se flexionan más fácilmente desde sus respectivas esquinas y con algo más de crujido que en el antiguo diseño más grueso. Si se aplica presión en el centro del teclado o en la tapa exterior también se produce un poco de flexión. Encontramos que la construcción general es comparable a la del MSI GS66 aunque está un poco por debajo del Razer Blade 15.
A diferencia del Alienware x17 R1, que en realidad es ligeramente más grueso y pesado que el antiguo Alienware m17 R4 al que sustituye, el Alienware x15 R1 es más delgado que el Alienware m15 R5 y pesa prácticamente lo mismo. Esto también significa que el x15 sigue siendo uno de los portátiles para juegos más grandes y pesados de su categoría de tamaño, ya que los modelos de la competencia, como el Zephyrus S15 o el Razer Blade 15 son más pequeños y ligeros por márgenes perceptibles. El gran tamaño del x15 es quizás el precio a pagar por un perfil tan delgado
Algunos modelos con el panel FHD 165Hz serán más gruesos que nuestro modelo QHD por fracciones de milímetro (16,3 vs. 15,9 mm).
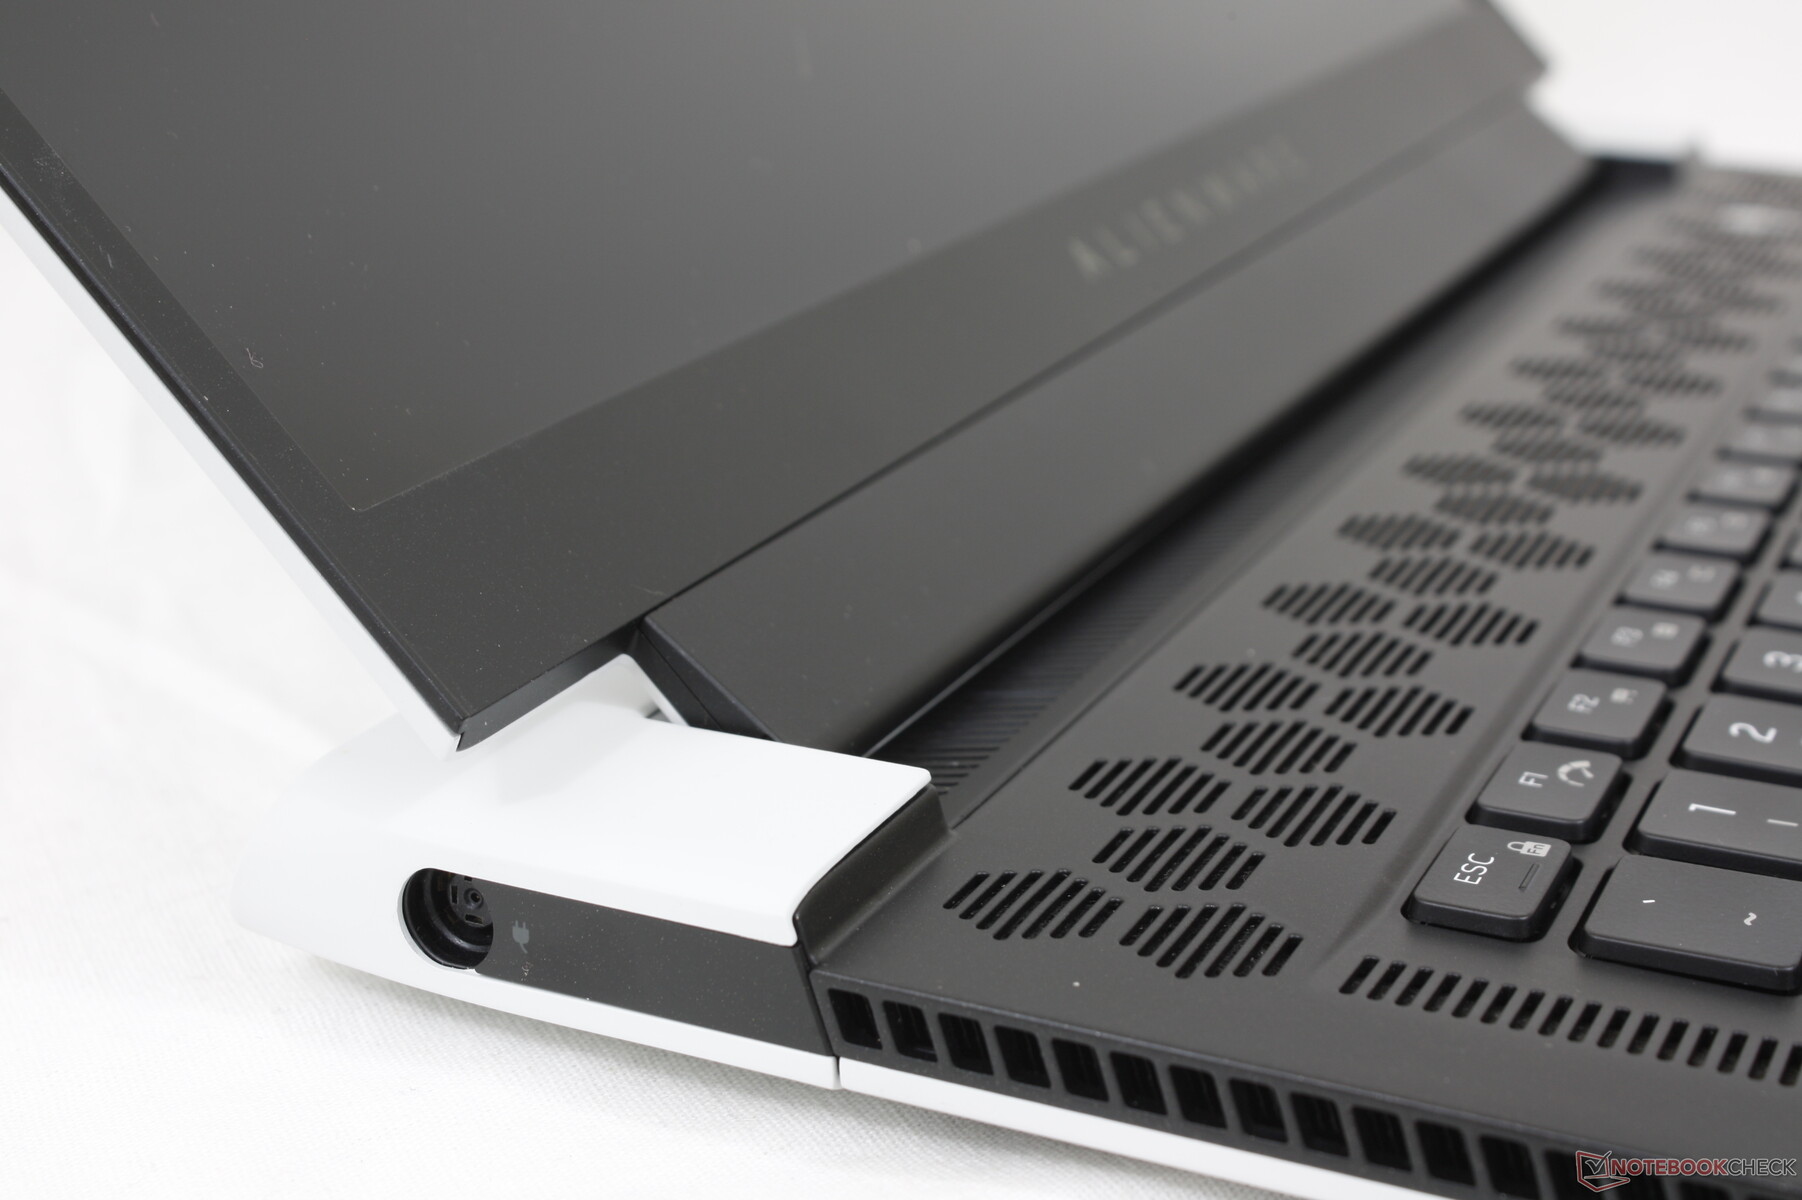
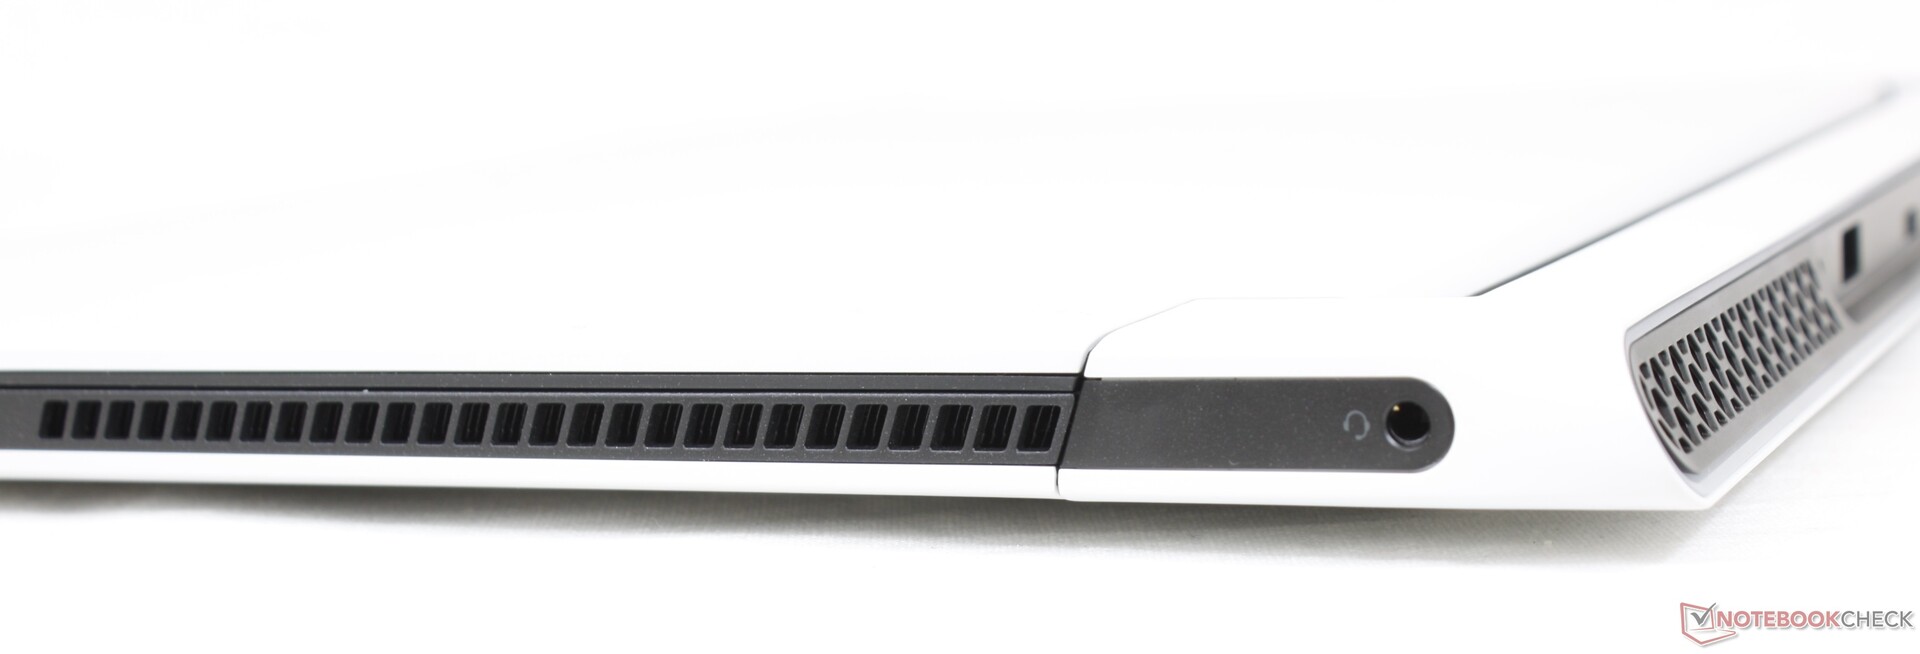
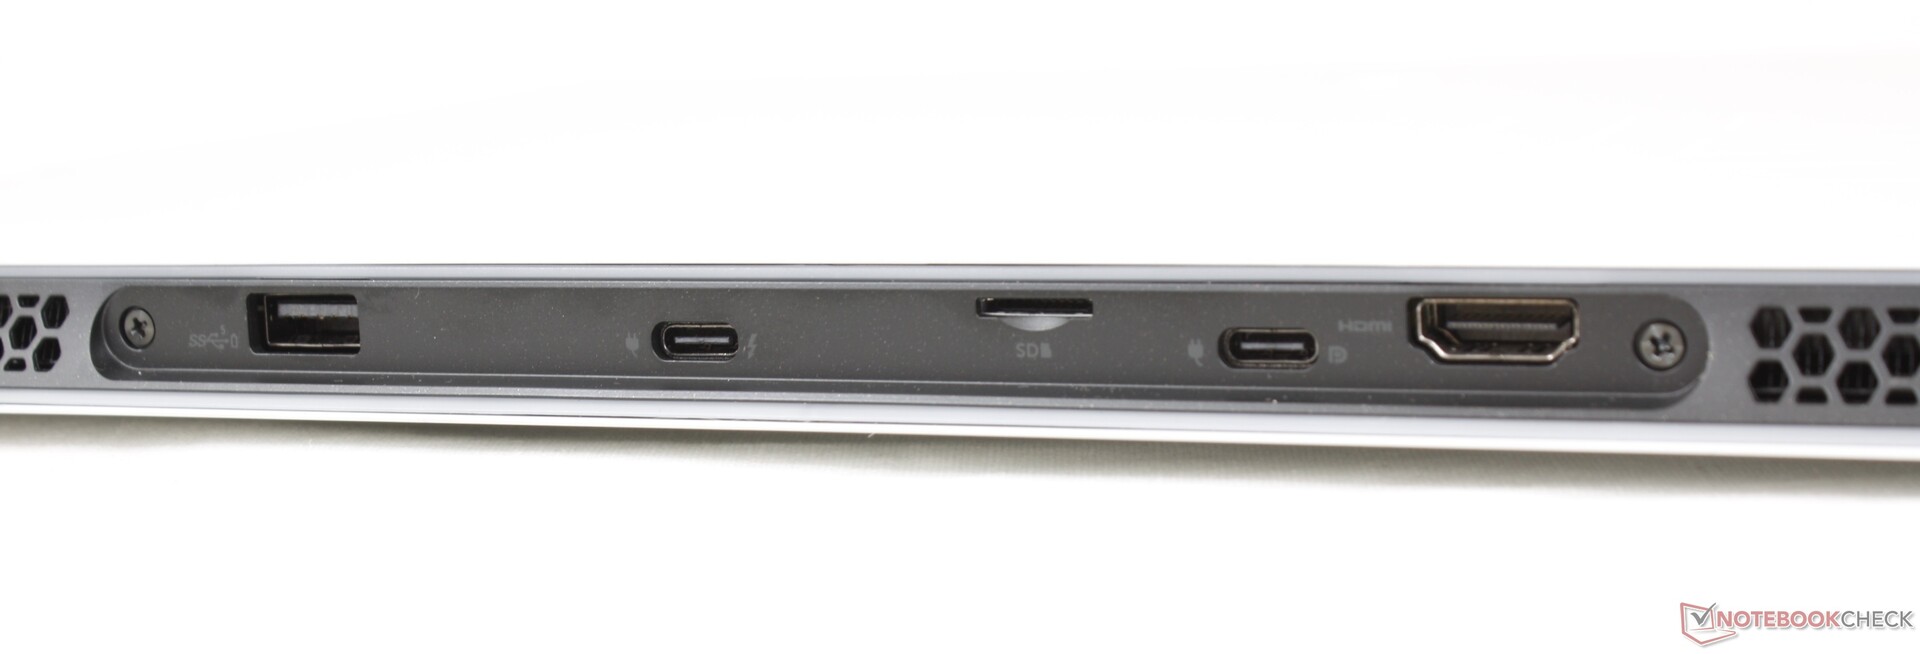
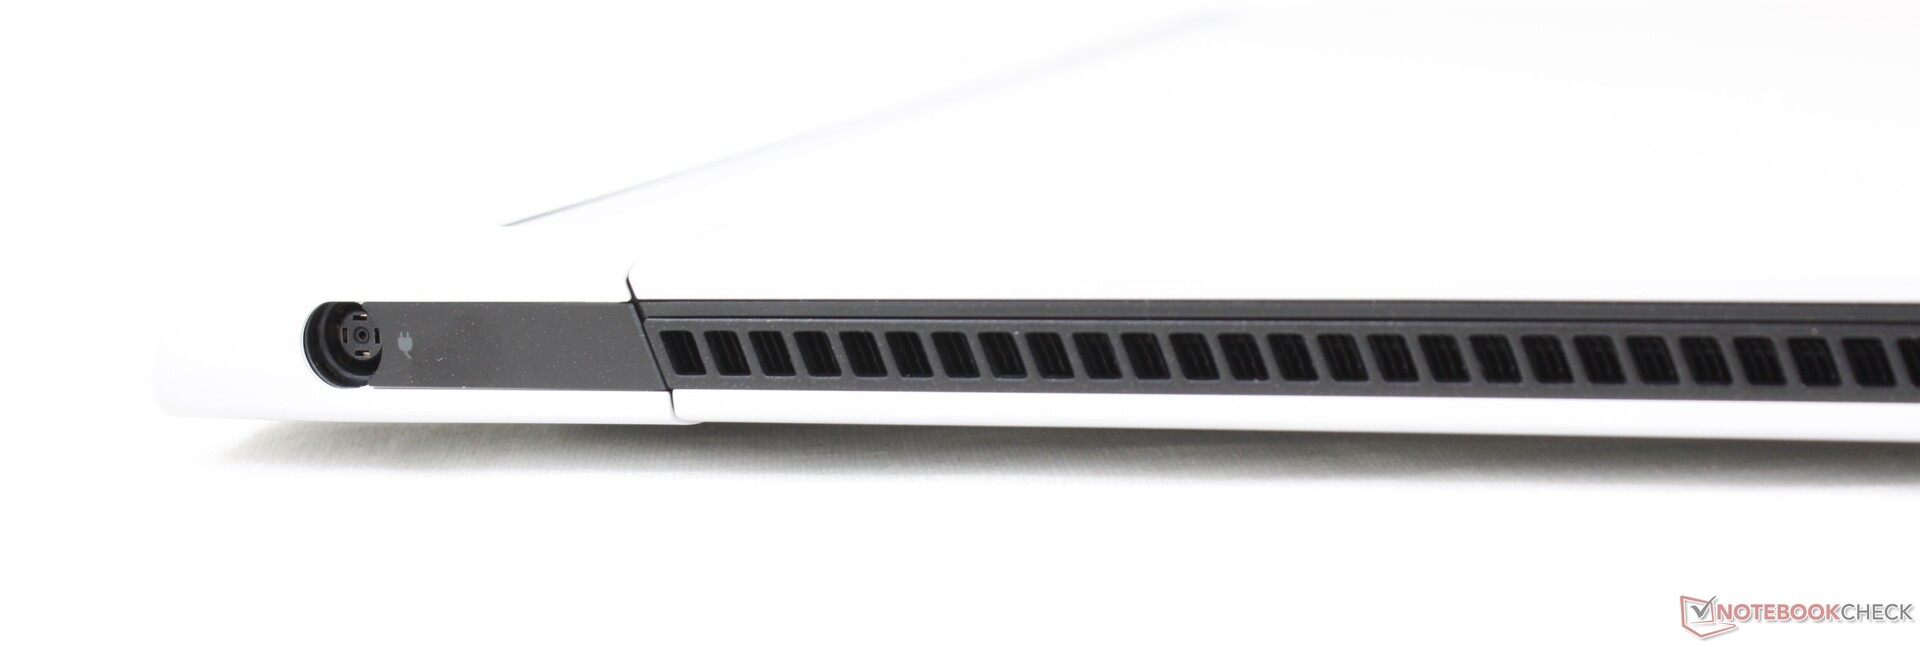
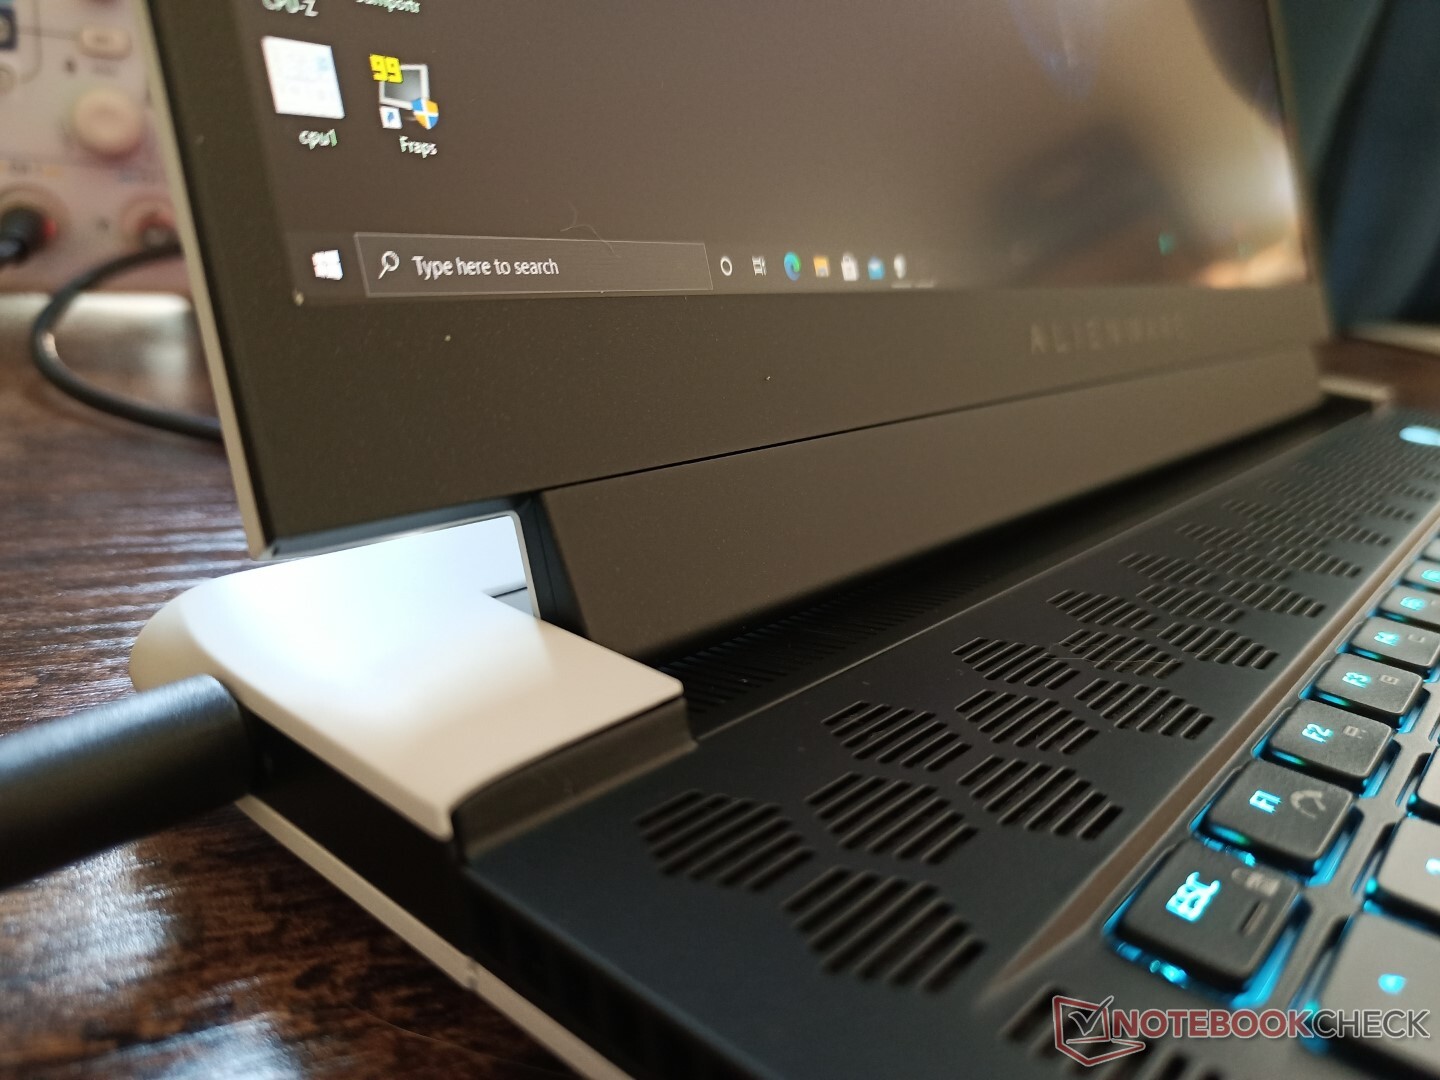
Conectividad: más y menos que antes
Se han recortado las opciones de puerto del antiguo Alienware m15 R4. Los propietarios ahora sólo tienen un puerto USB-A en vez de tres, mientras que el RJ-45, el mini DisplayPort y el puerto del Amplificador Gráfico se han eliminado. El sistema gana un segundo puerto USB-C que podría ser más versátil dependiendo del escenario
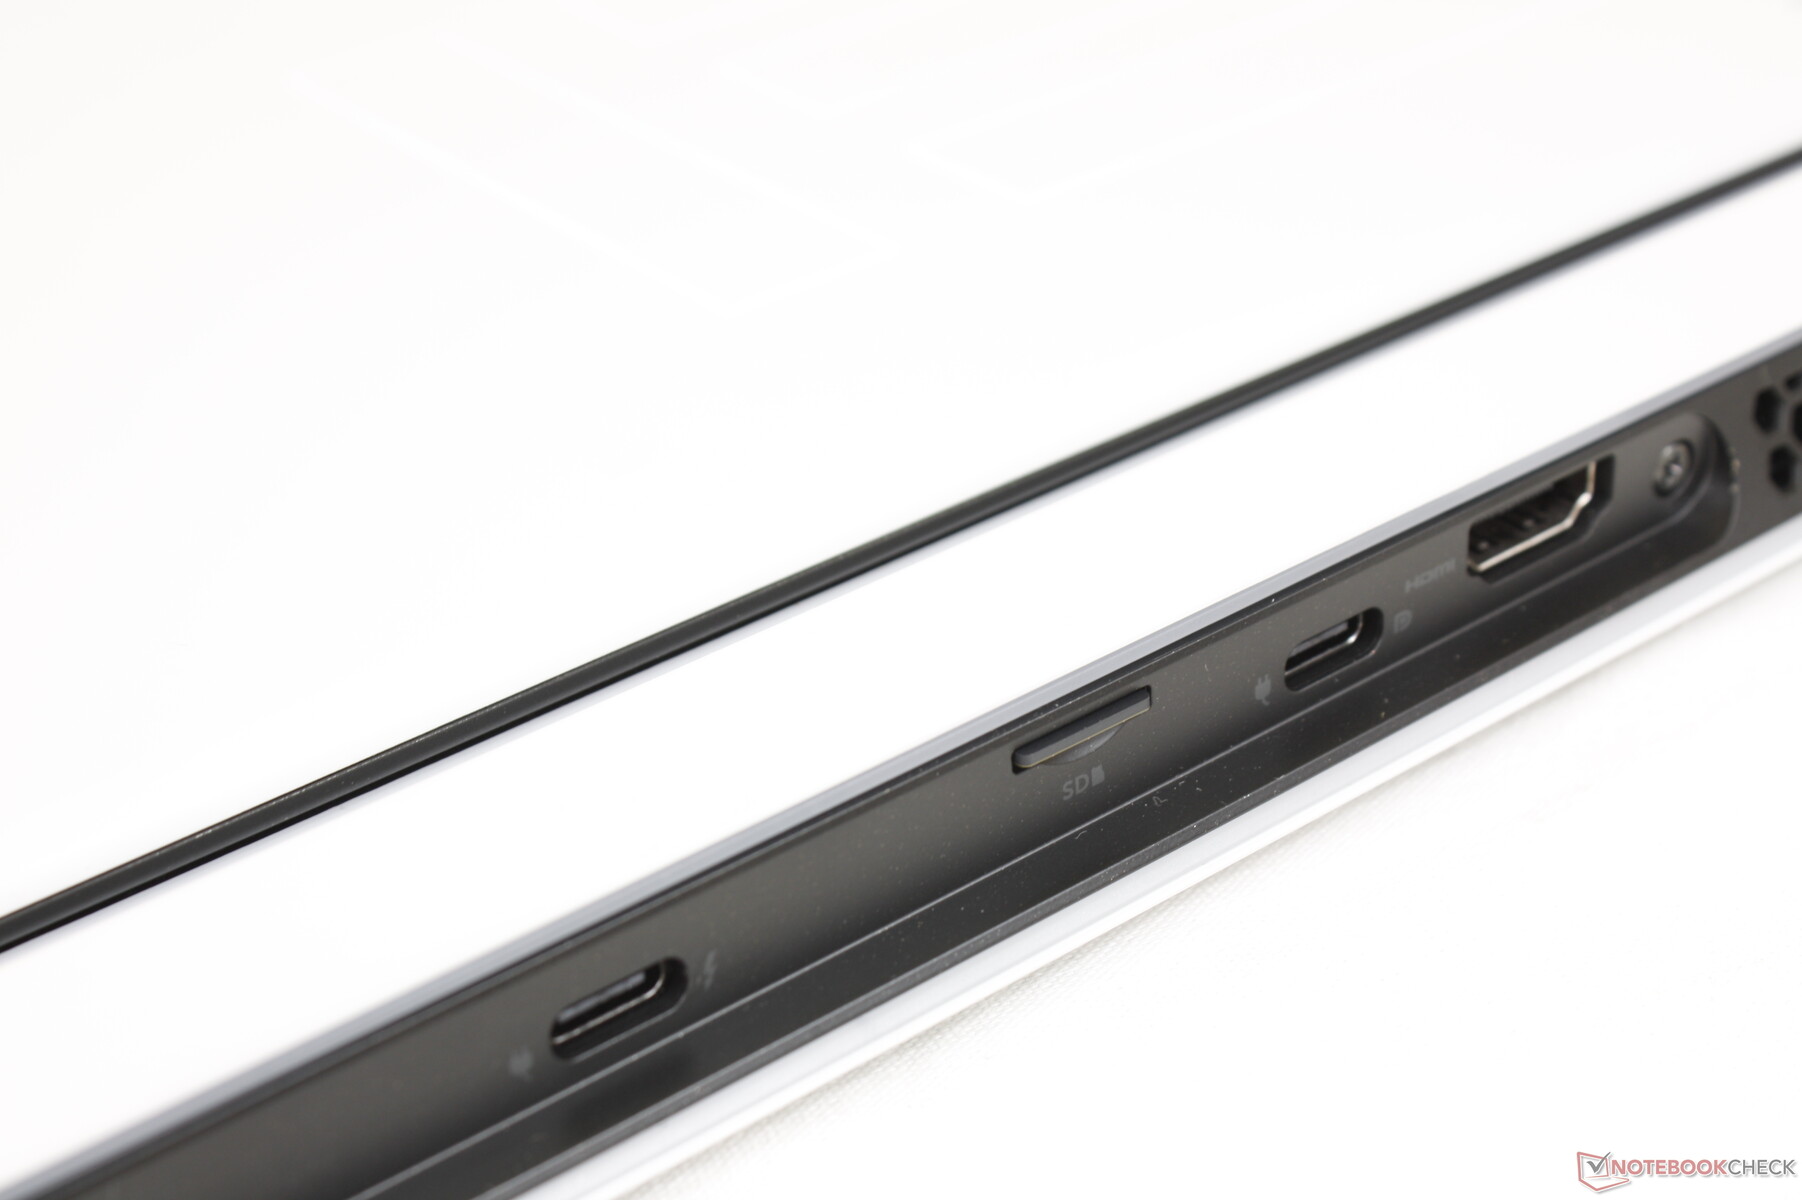
Casi todos los puertos están en la parte trasera del chasis, lo que puede dificultar la accesibilidad. Además, estos puertos pueden ser difíciles de ver ya que no se iluminan ni tienen símbolos fáciles de leer.
Lector de tarjetas SD
Elogiamos a Dell por integrar un lector de MicroSD, ya que la mayoría de portátiles de juego ultradelgados de 15,6 pulgadas no tienen ninguno, incluyendo el Asus Zephyrus S15, el MSI GS66 o el Razer Blade 15. Las tasas de transferencia son muy rápidas con nuestra tarjeta de prueba UHS-II a unos 200 MB/s.
| SD Card Reader | |
| average JPG Copy Test (av. of 3 runs) | |
| Alienware x15 RTX 3070 P111F (AV Pro V60) | |
| Alienware m15 R4 RTX 3080 (AV PRO microSD 128 GB V60) | |
| maximum AS SSD Seq Read Test (1GB) | |
| Alienware x15 RTX 3070 P111F (AV Pro V60) | |
| Alienware m15 R4 RTX 3080 (AV PRO microSD 128 GB V60) | |
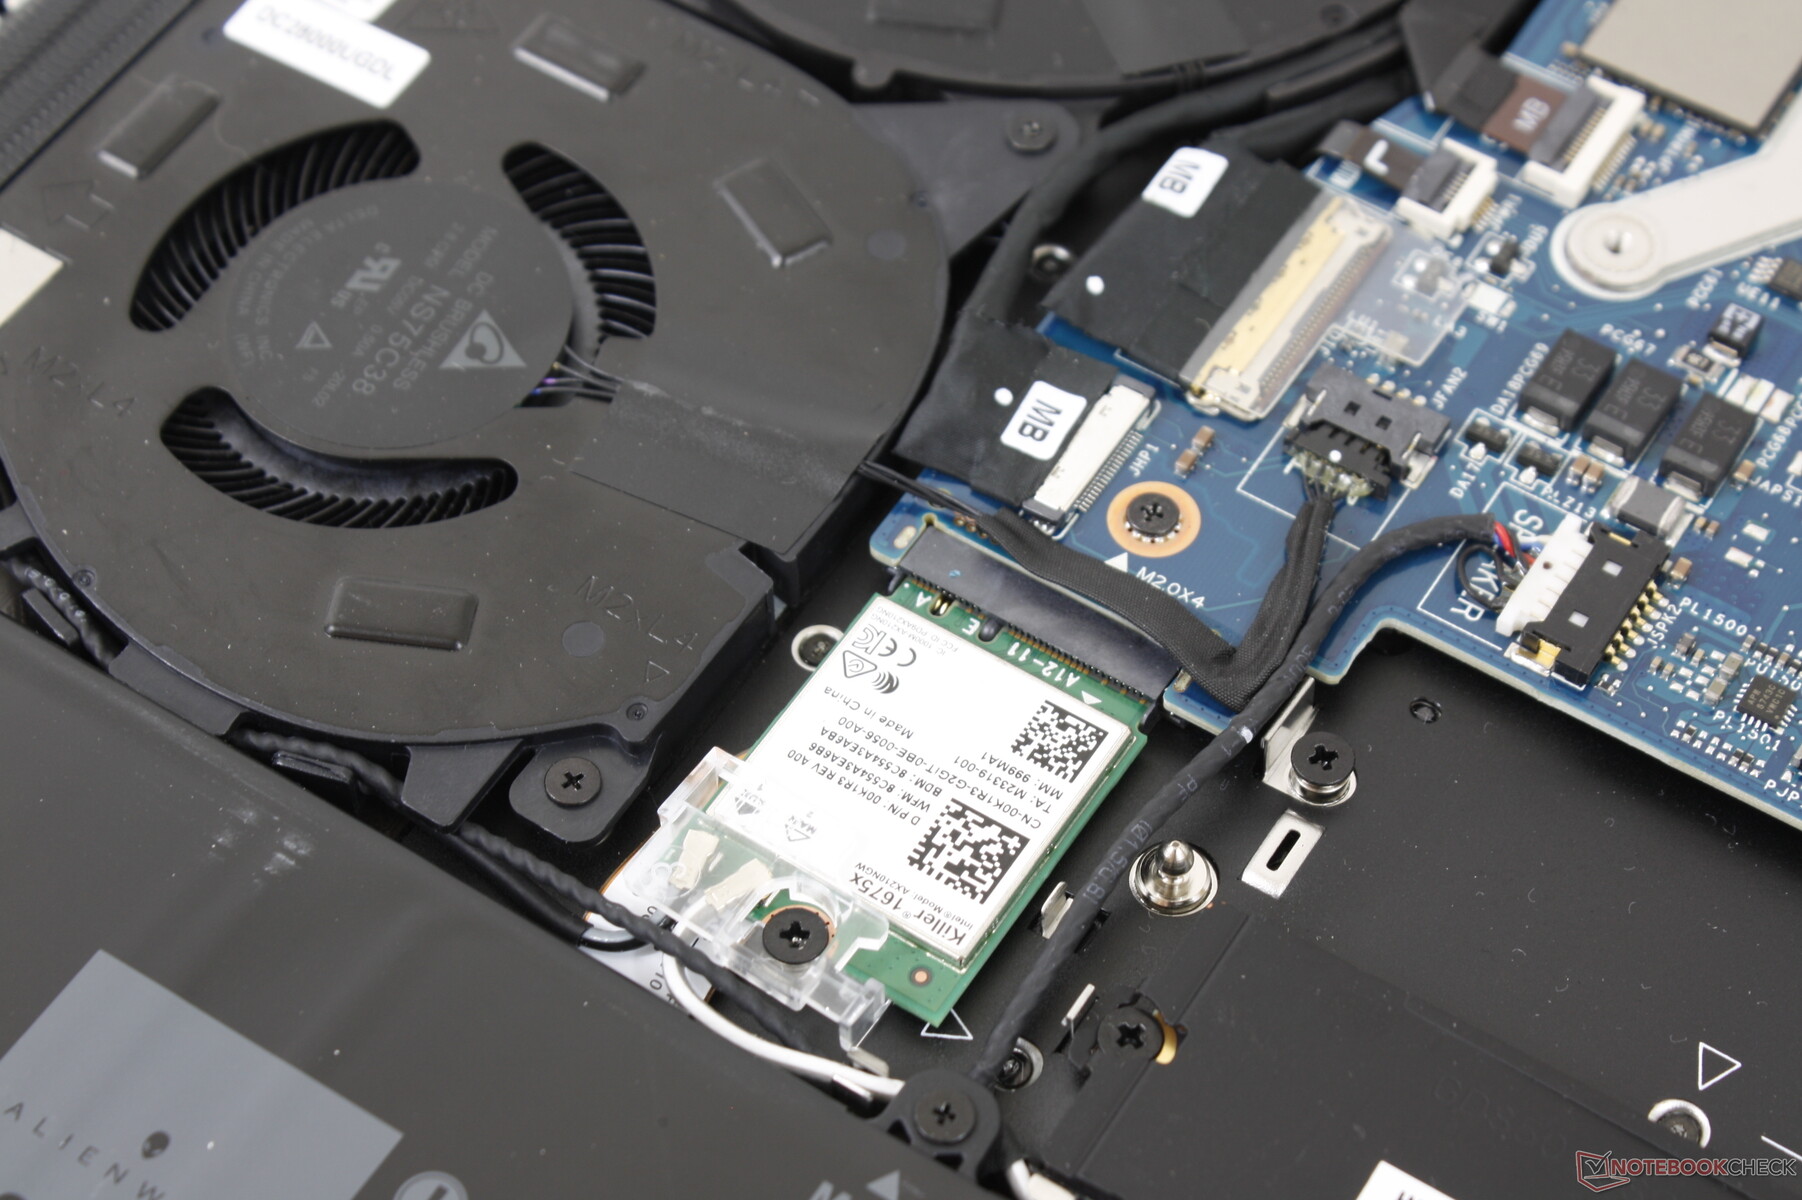
Comunicación - W-Fi 6E Standard
Todos los SKUs vienen con el módulo WLAN Killer Wi-Fi 6E AX1675x que sustituye al Killer AX1650w del año pasado. A diferencia del Intel AX210, estos módulos Killer son compatibles con la Killer Performance Suite y todas sus funciones de software.
Cámara web
La calidad de la cámara sigue siendo pobre con sólo 720p y sin obturador de cámara web. Se incluye IR para la compatibilidad con Windows Hello.


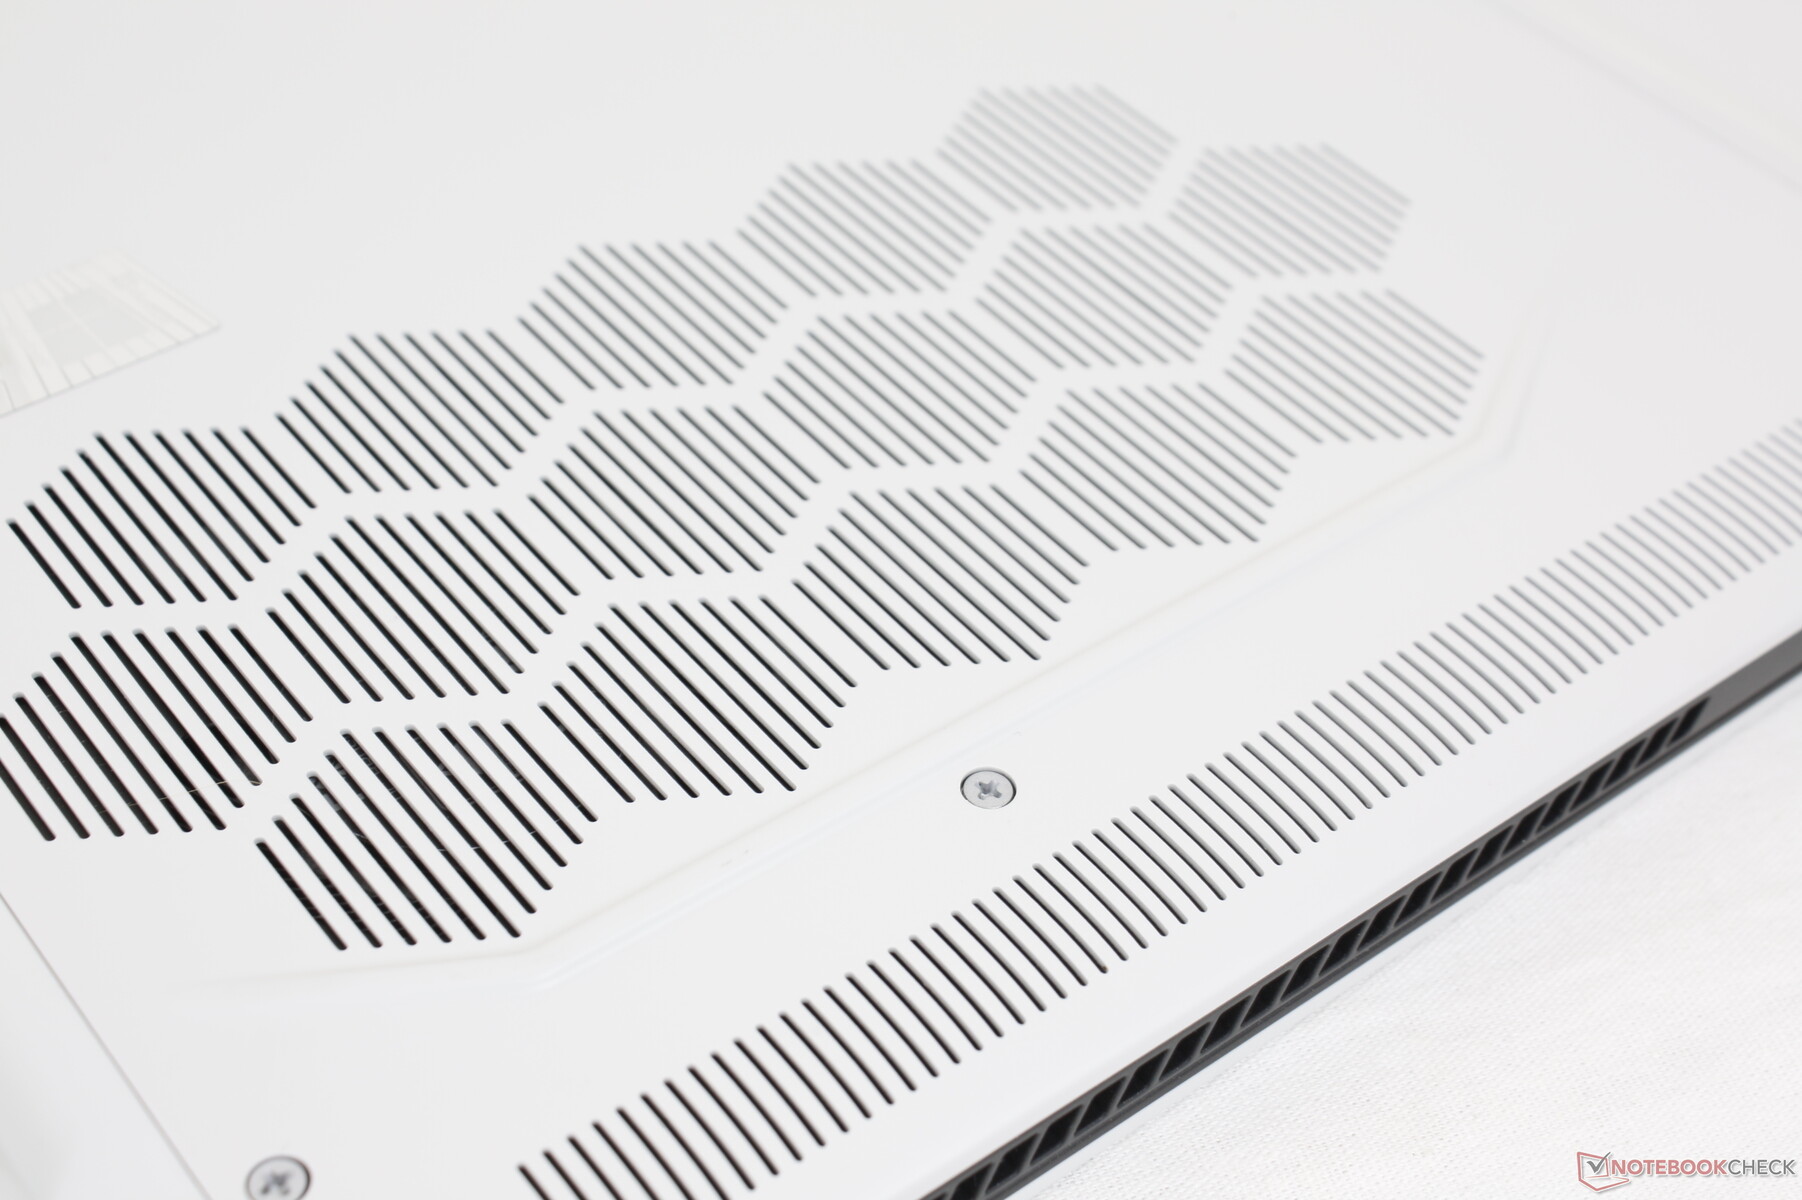
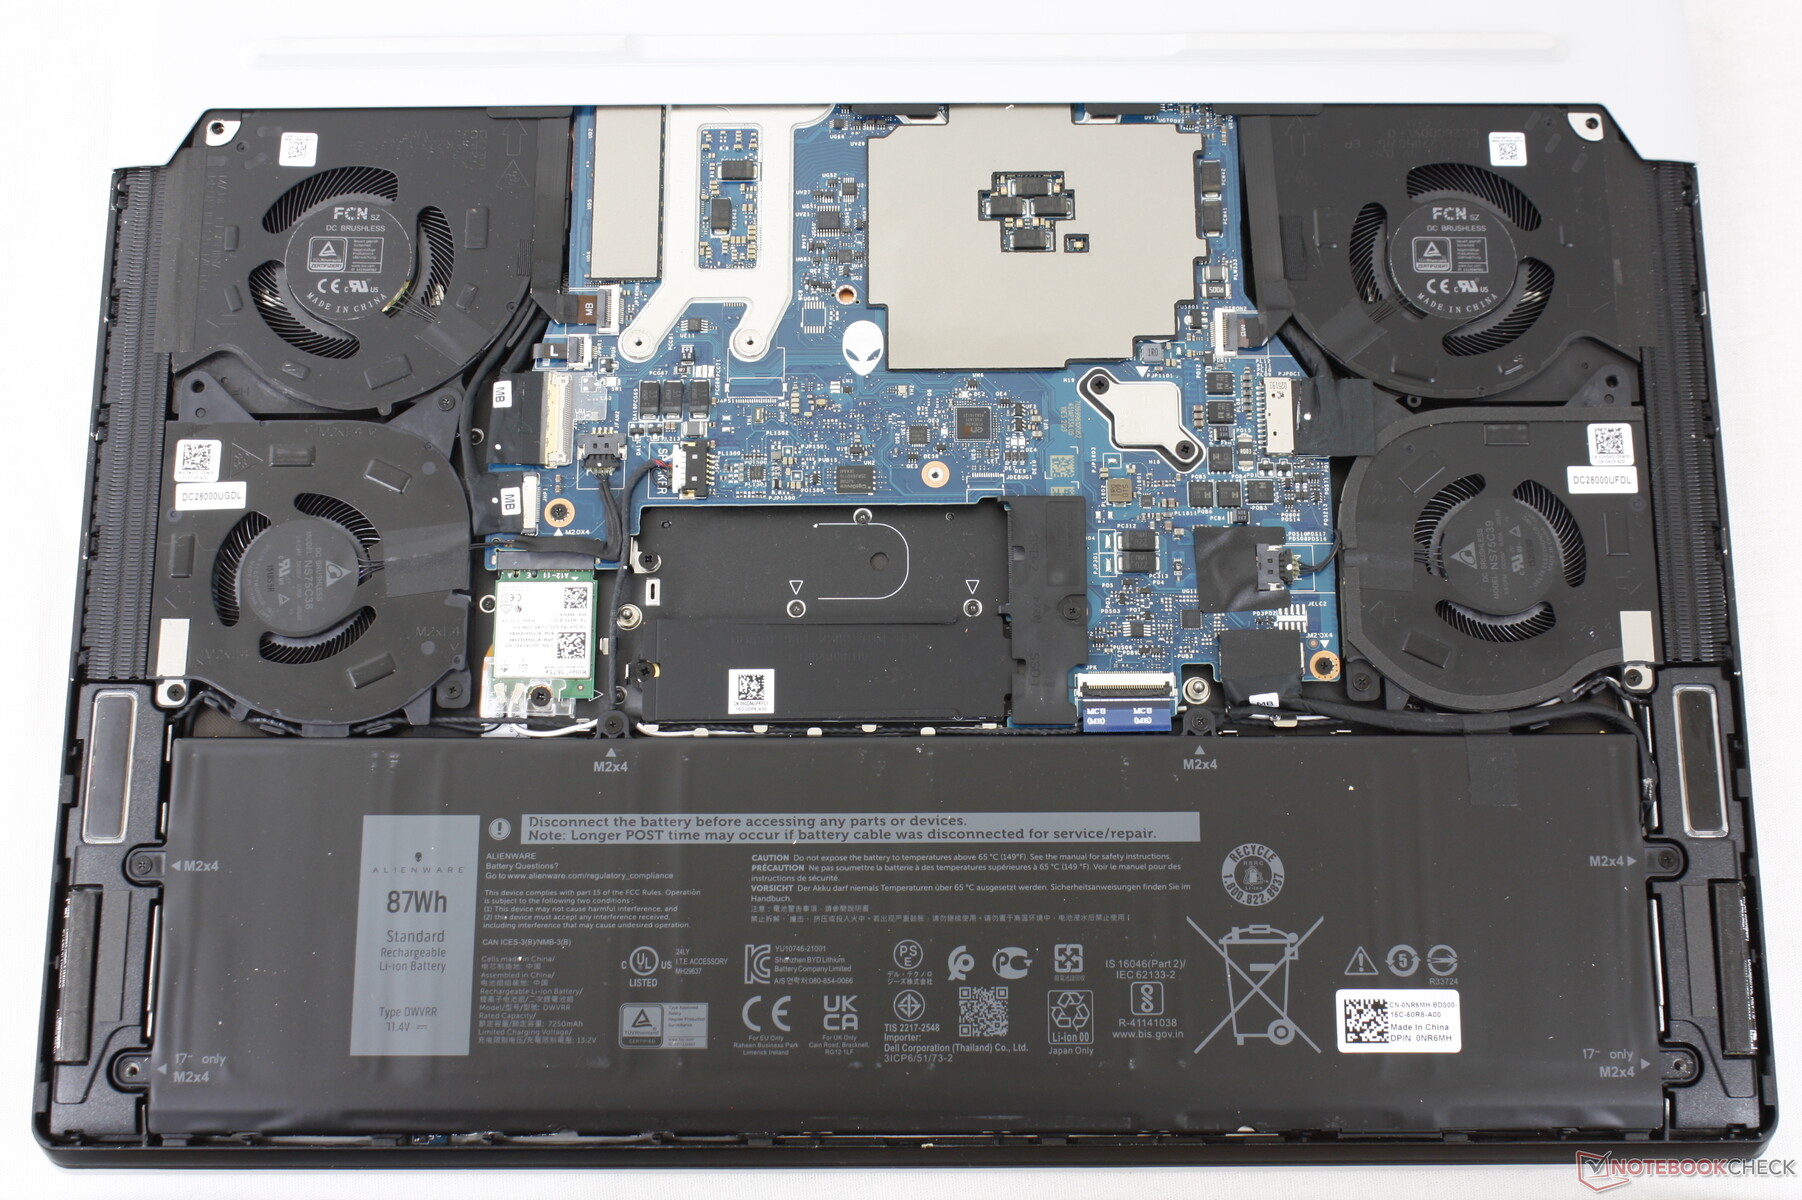
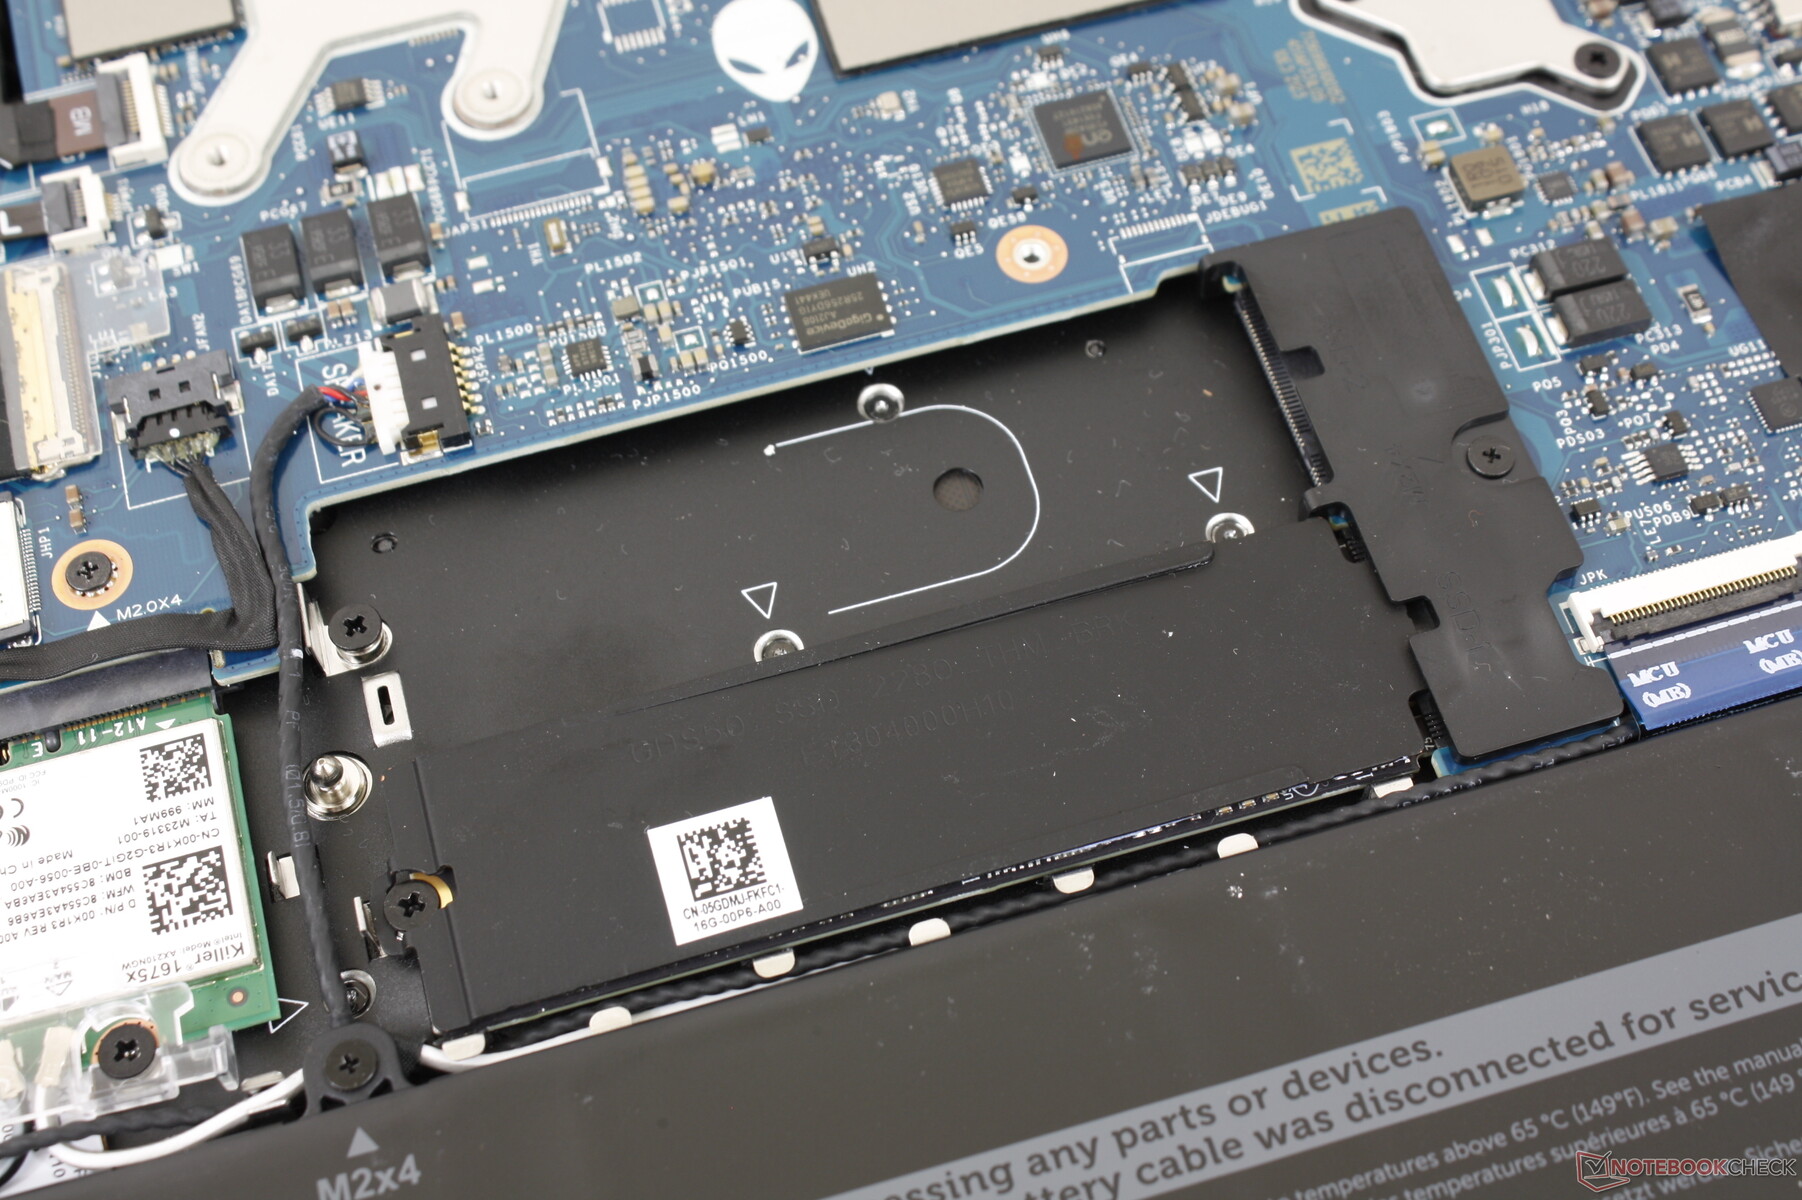
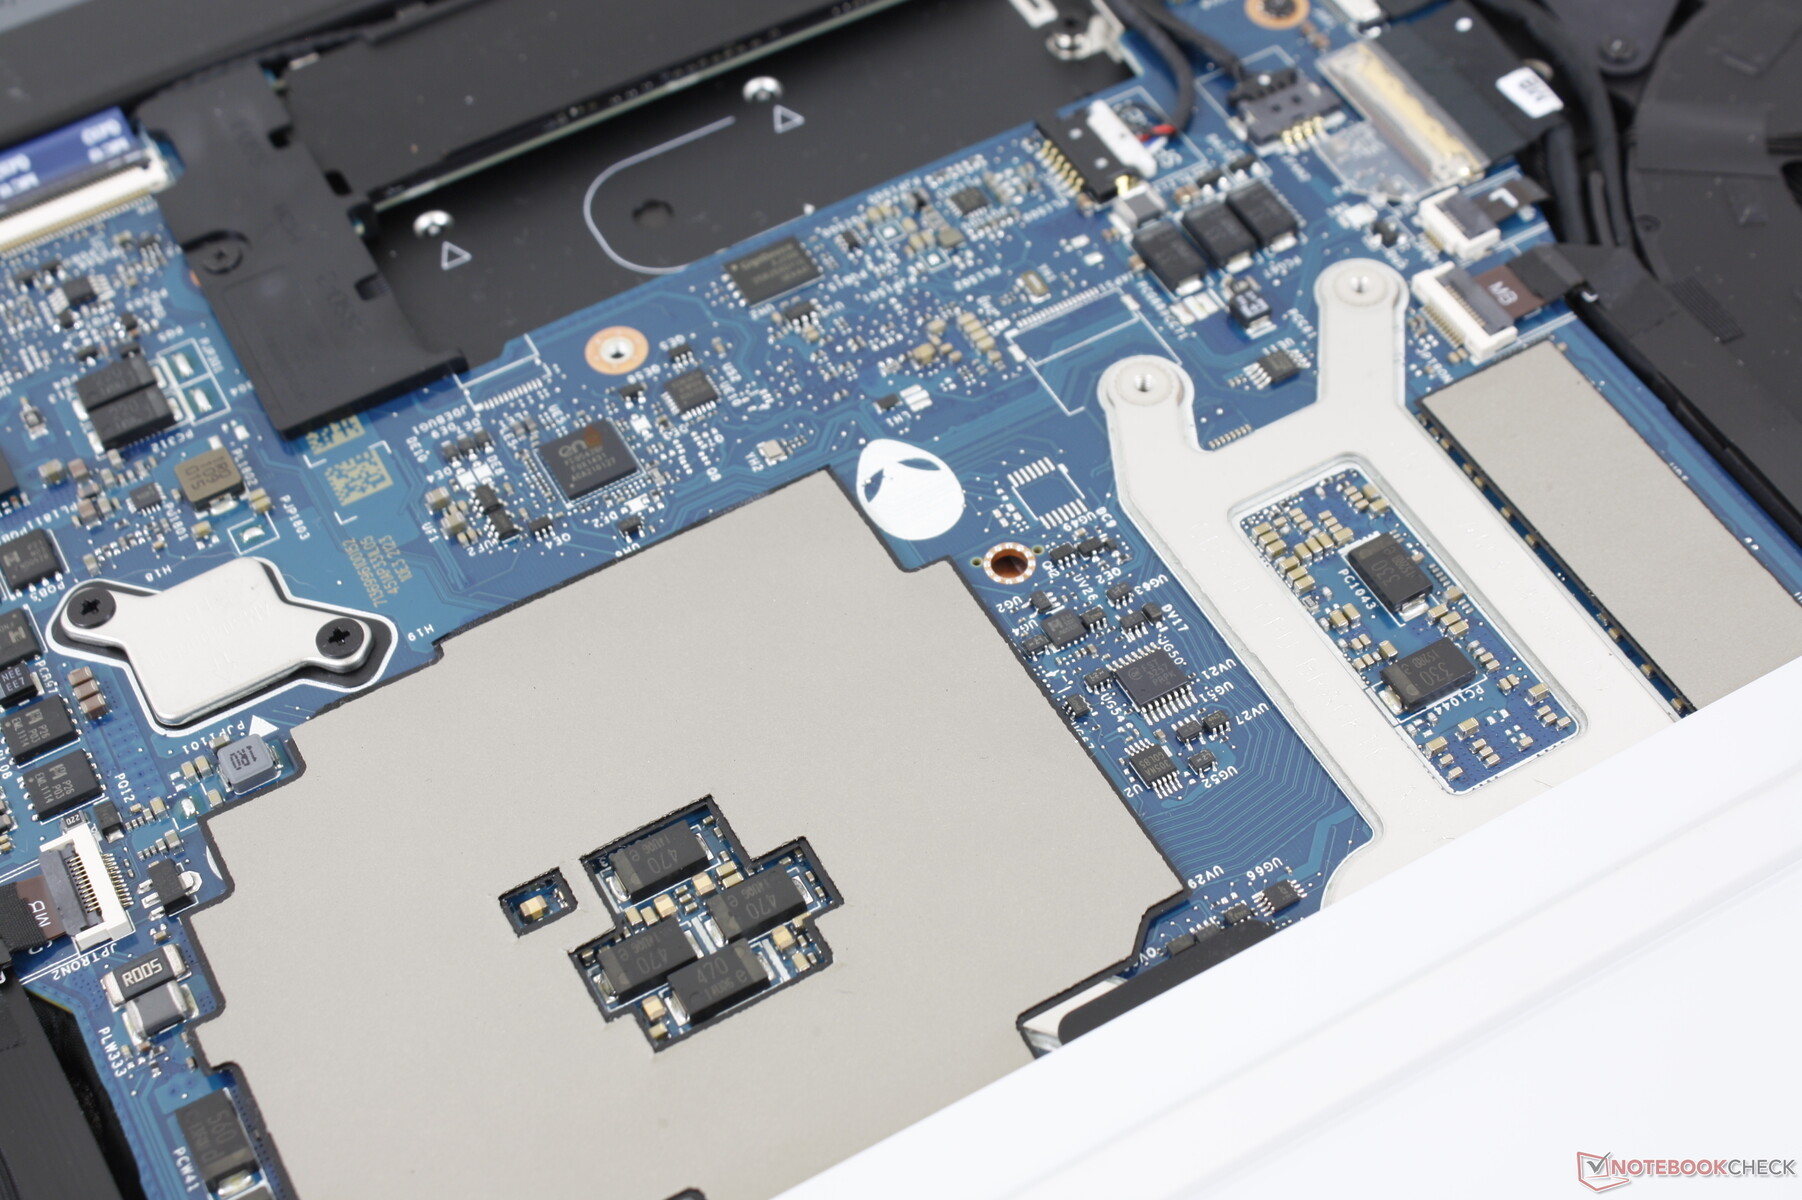
Mantenimiento
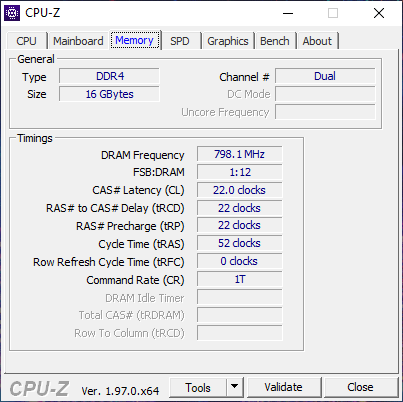
El panel inferior se fija con sólo seis tornillos Philips para facilitar el mantenimiento y las actualizaciones. Sin embargo, la RAM está soldada, por lo que los usuarios sólo podrán actualizar los SSD M.2. Los modelos de la competencia, como el Razer Blade 15 o el MSI GS66, tienen ranuras SODIMM para que el usuario pueda actualizarla.
Accesorios y garantía
No hay más extras en la caja que el adaptador de CA y la documentación. Se aplica la habitual garantía limitada de un año con multitud de extras si se pide a Dell.
Dispositivos de entrada - Teclas de crisol
Teclado
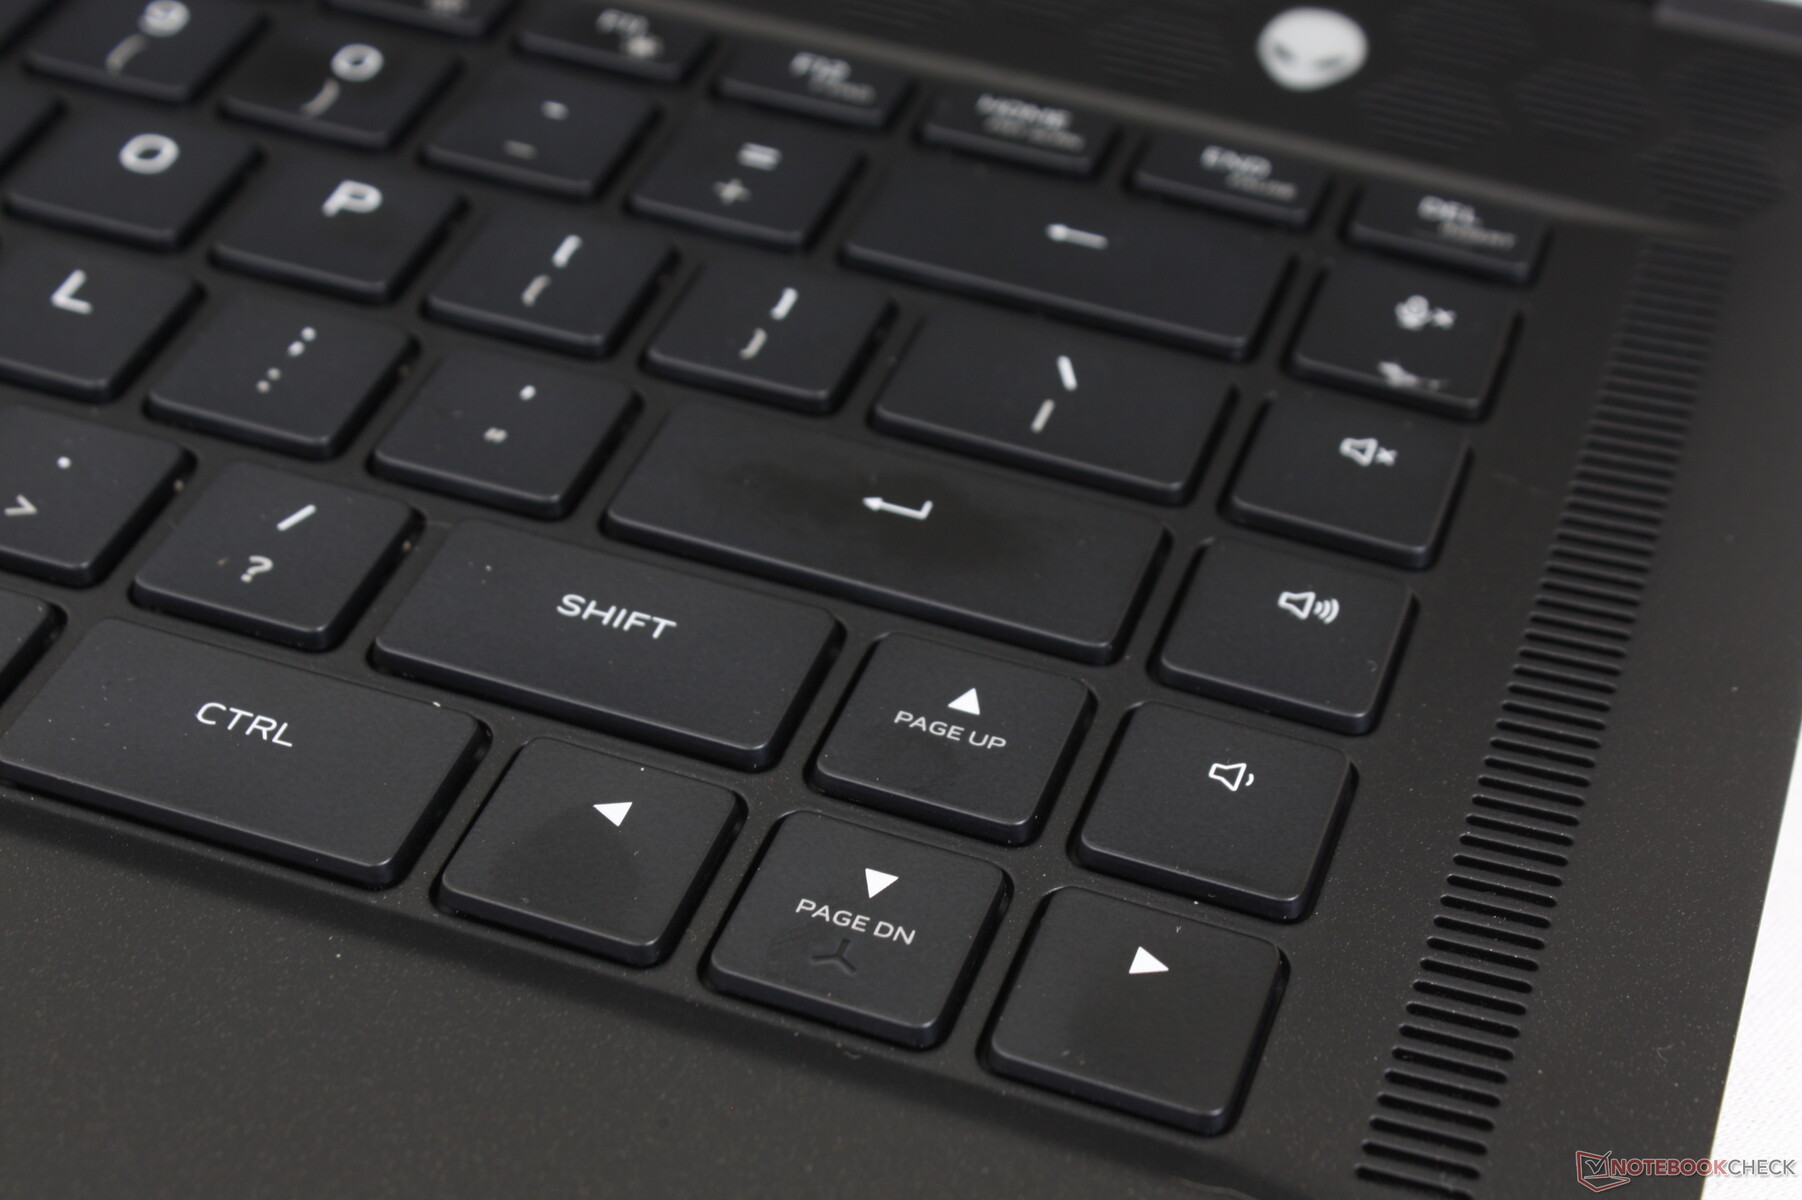
El x15 utiliza teclas estándar de membrana con retroiluminación RGB por tecla, lo que supone una mejora respecto a la iluminación de cuatro zonas del Alienware m15 R4. La respuesta es más nítida y firme de lo esperado con su recorrido de teclas de 1,5 mm para evitar las teclas suaves y demasiado superficiales de la mayoría de los Ultrabooks. Encontramos que el sistema es más cómodo para teclear que en la serie Asus Zephyrus o el Razer Blade 15. Sin embargo, las teclas Enter y Espacio son significativamente más ruidosas que las teclas QWERTY más silenciosas
Los símbolos de las teclas secundarias no se iluminan como en la serie m15. El teclado x17 R1 también tiene este mismo problema.
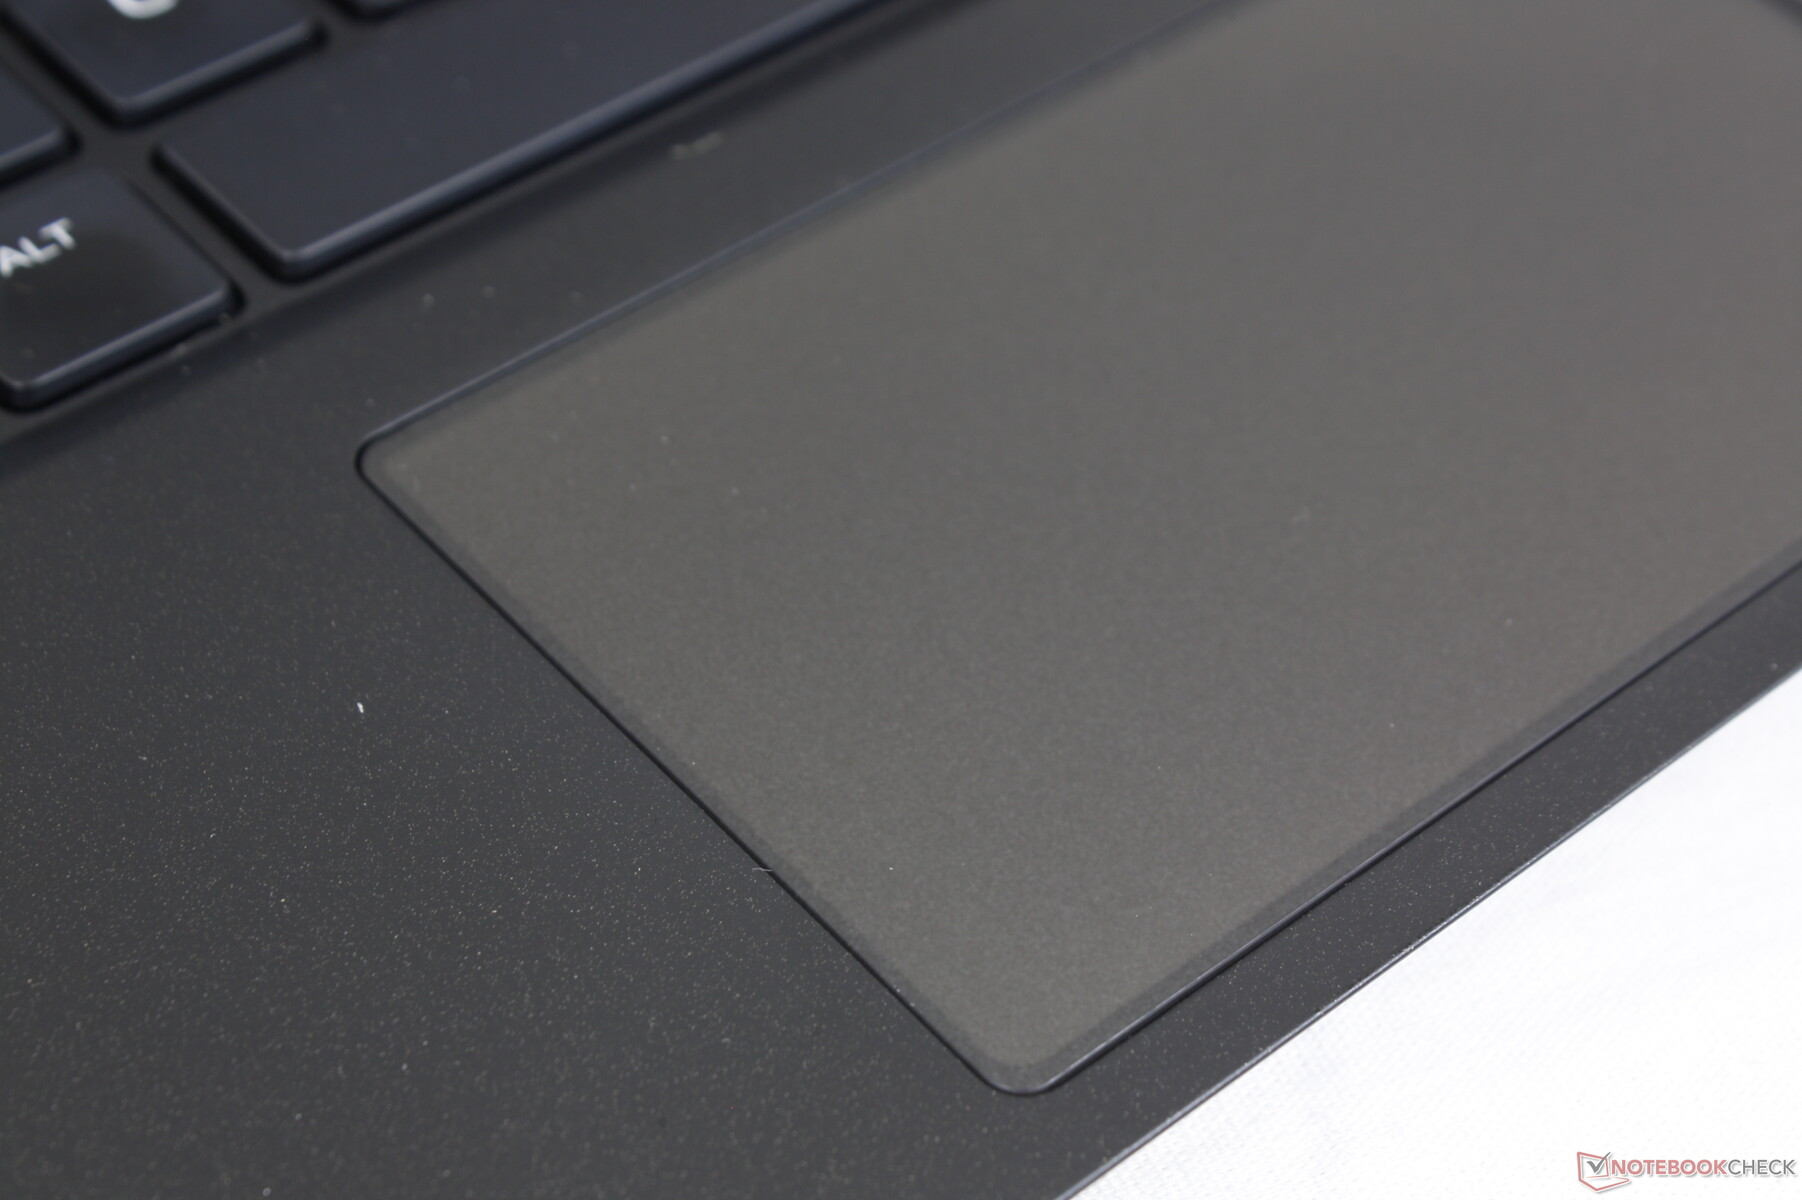
Panel táctil
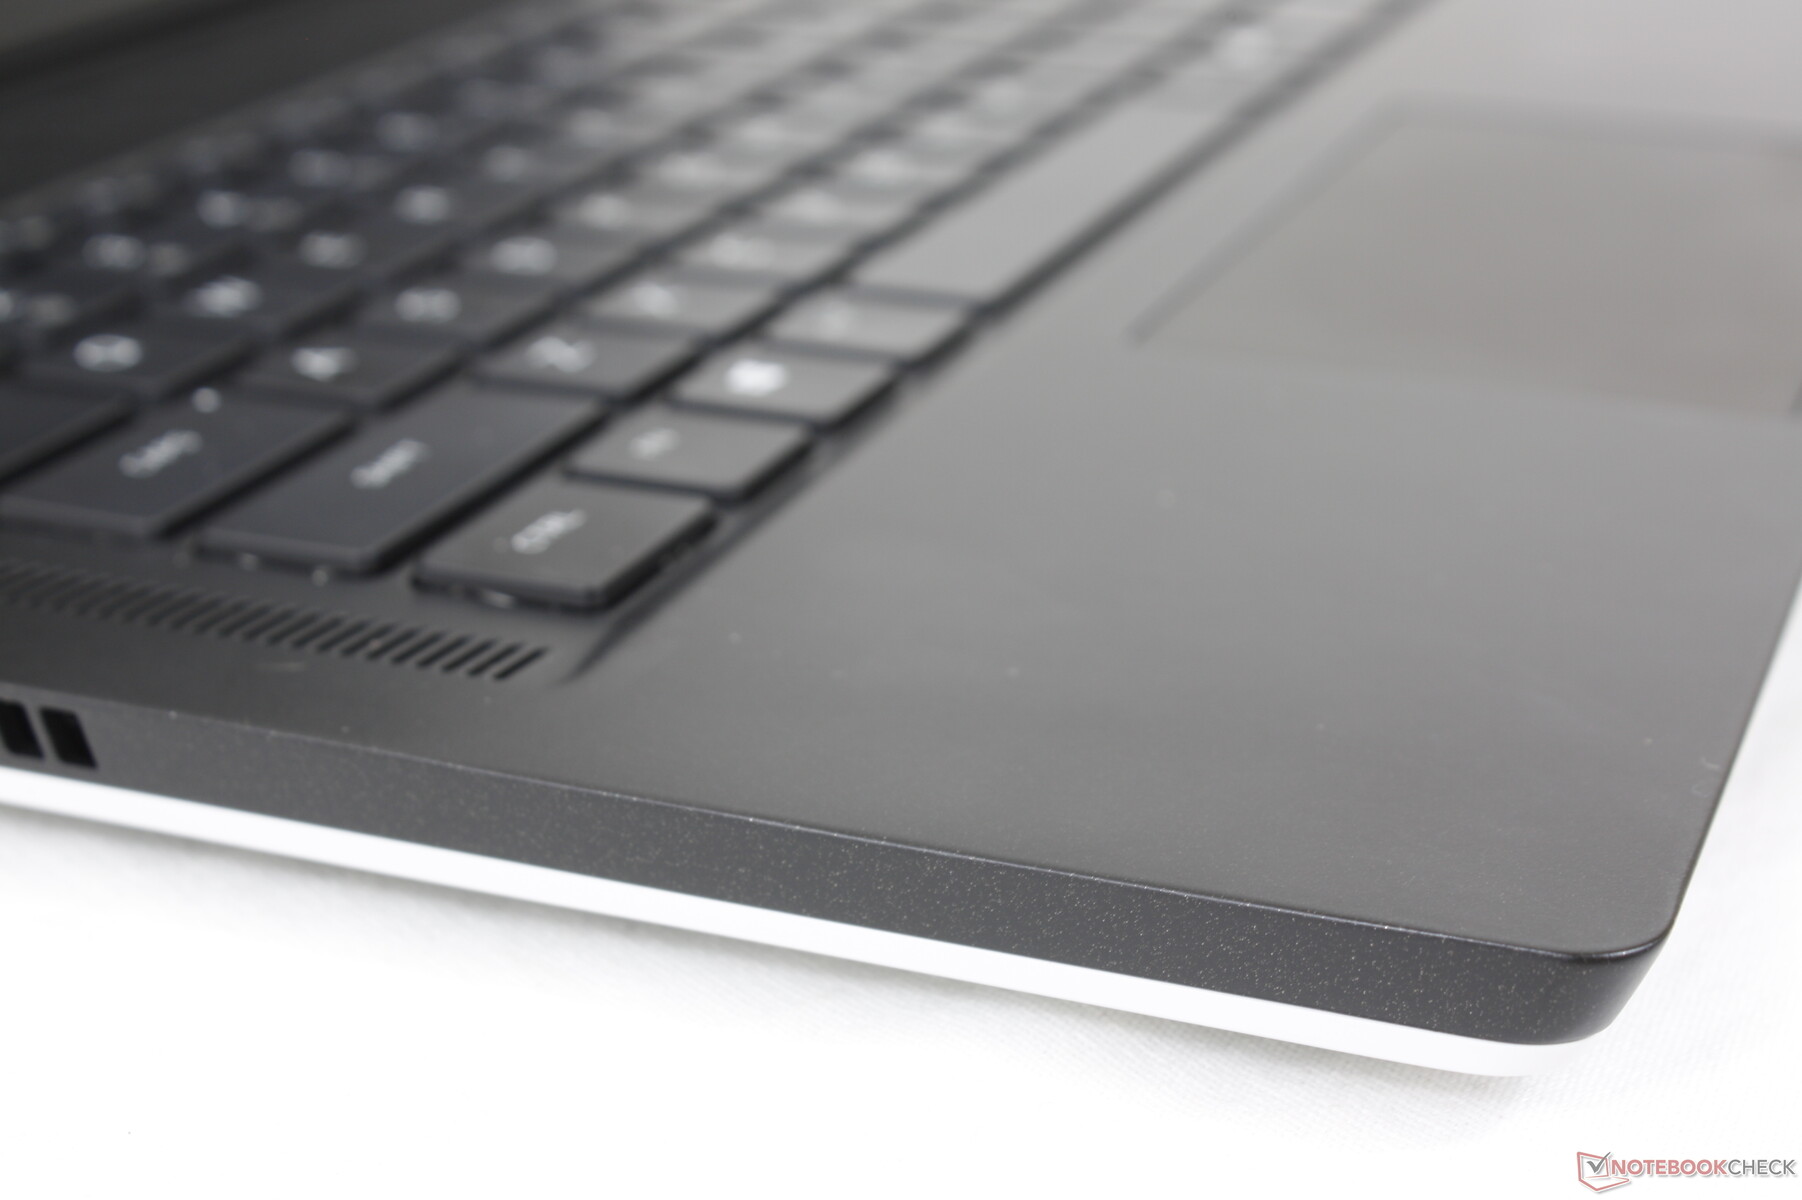
La superficie del clickpad no ha cambiado respecto al modelo del año pasado, con sólo 10,5 x 6 cm. La tracción es suave cuando se desliza a velocidades medias o rápidas, mientras que las velocidades más lentas se pegan un poco para lograr un clic más preciso. Desgraciadamente, el clic sigue siendo un poco esponjoso y la respuesta es poco satisfactoria. Además, el color gris oscuro acentuará las huellas dactilares mucho más fácilmente en comparación con el clickpad blanco de la serie Alienware m15 del año pasado


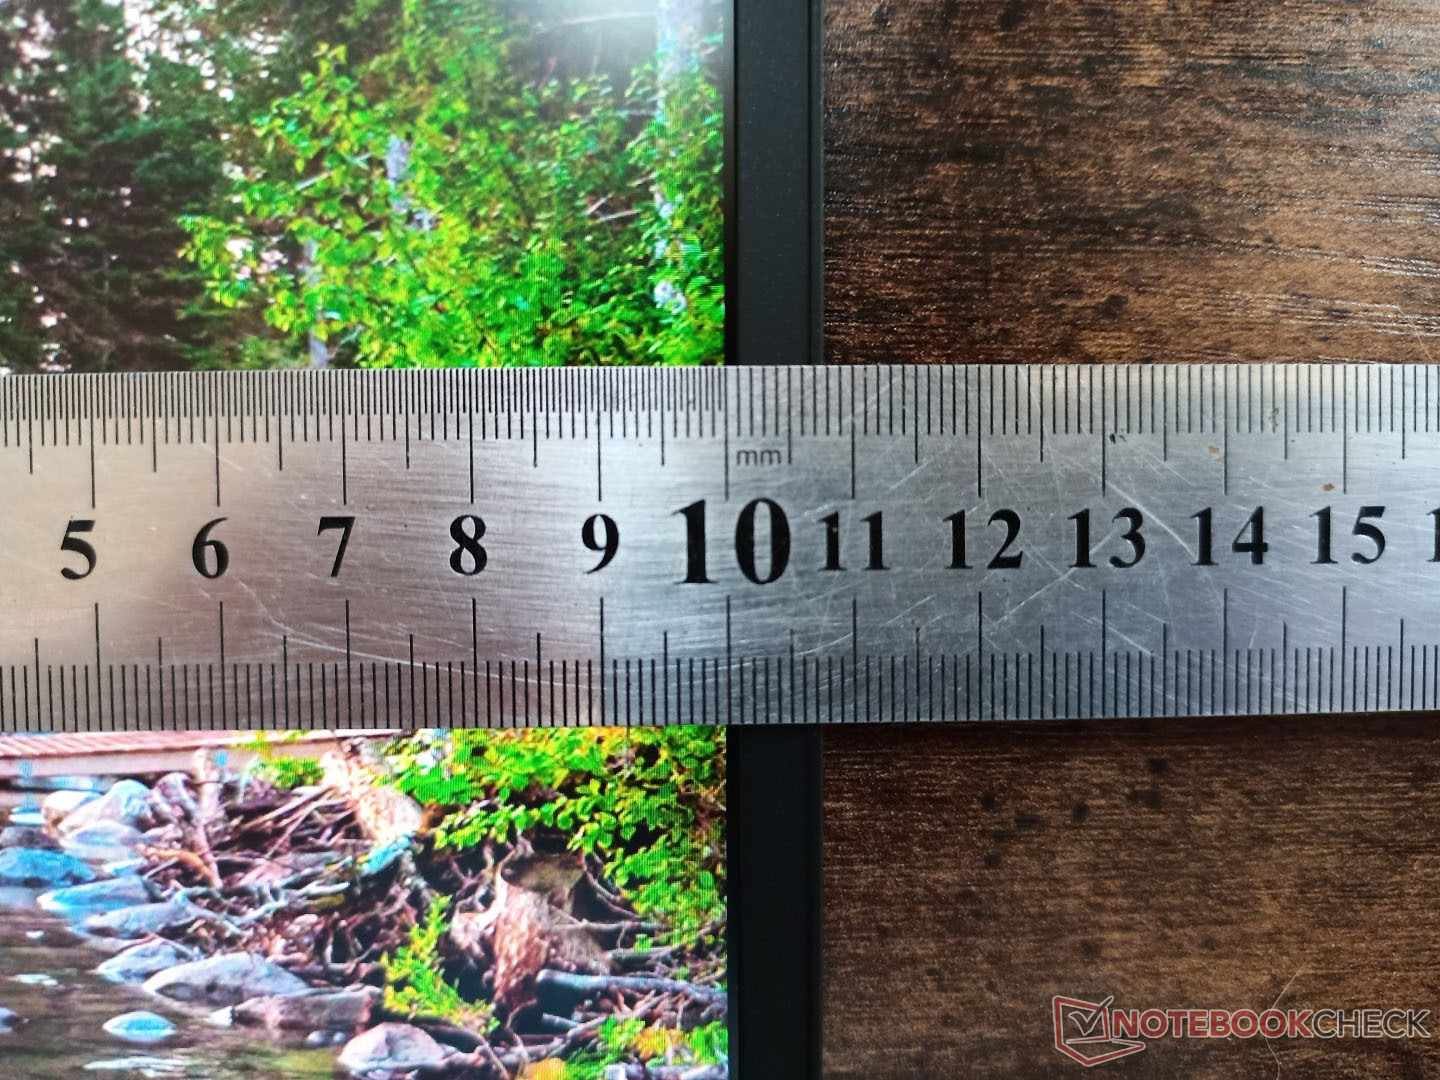
Pantalla - No más opciones OLED
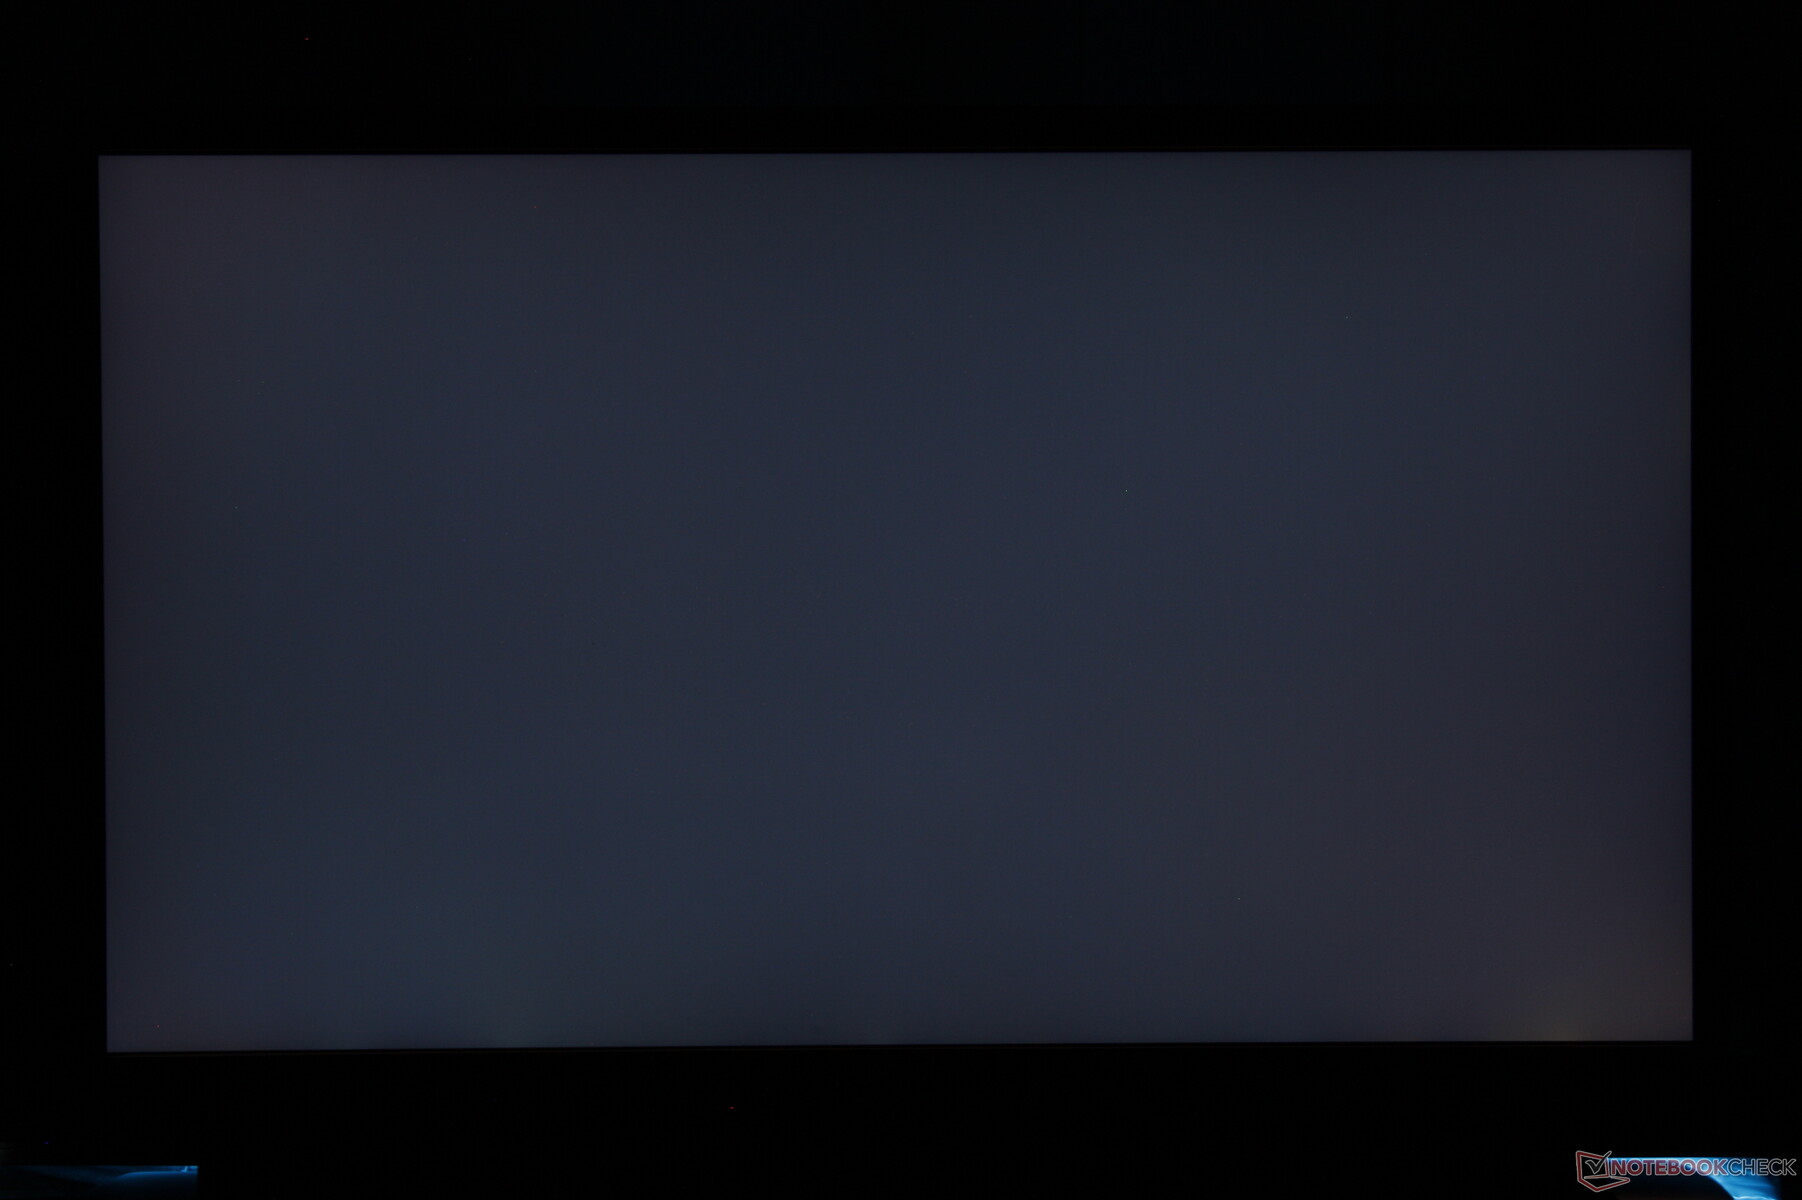
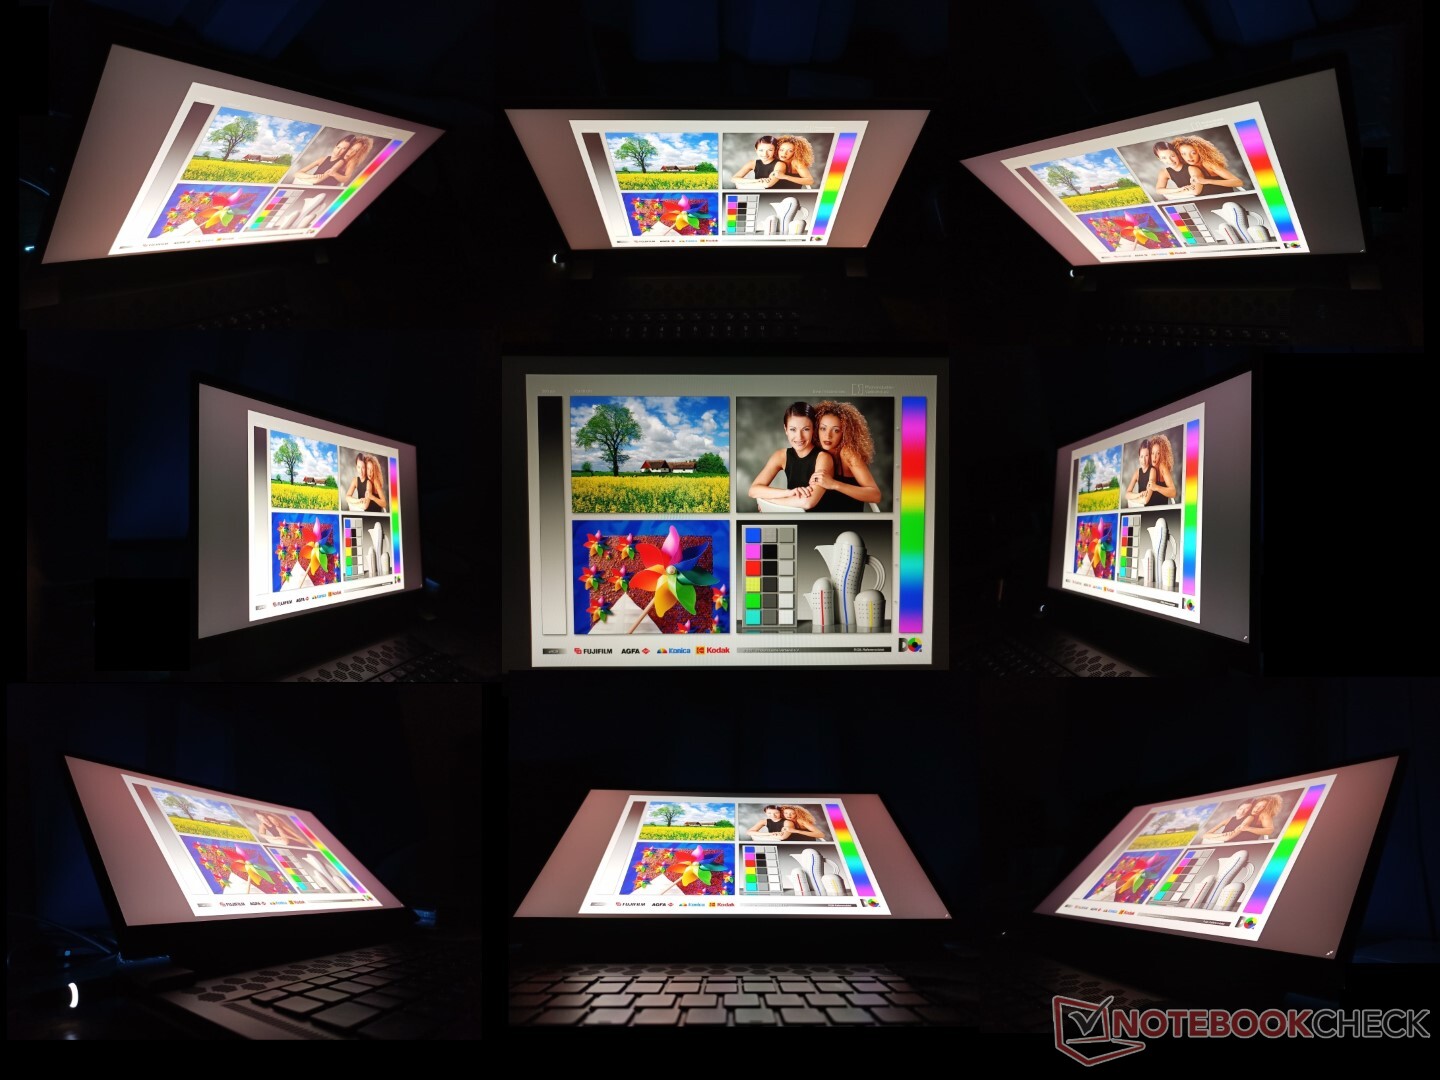
El panel IPS LG Philips 156QHG 1440p es el primero que aparece en nuestra base de datos. Sus atributos son excelentes, con tiempos de respuesta rápidos de 6 ms, una rápida tasa de refresco de 240 Hz, una amplia cobertura de color con casi el 100 por ciento de DCI-P3 y una brillante retroiluminación de 400 nits que es más brillante que la de muchos otros portátiles de 15,6 pulgadas para juegos, incluido el nuevoMSI GS66. Tal vez su mayor inconveniente es su relación de contraste poco excepcional de alrededor de 900:1, que es más bien media teniendo en cuenta el precio de venta.
| |||||||||||||||||||||||||
iluminación: 88 %
Brillo con batería: 409.5 cd/m²
Contraste: 871:1 (Negro: 0.47 cd/m²)
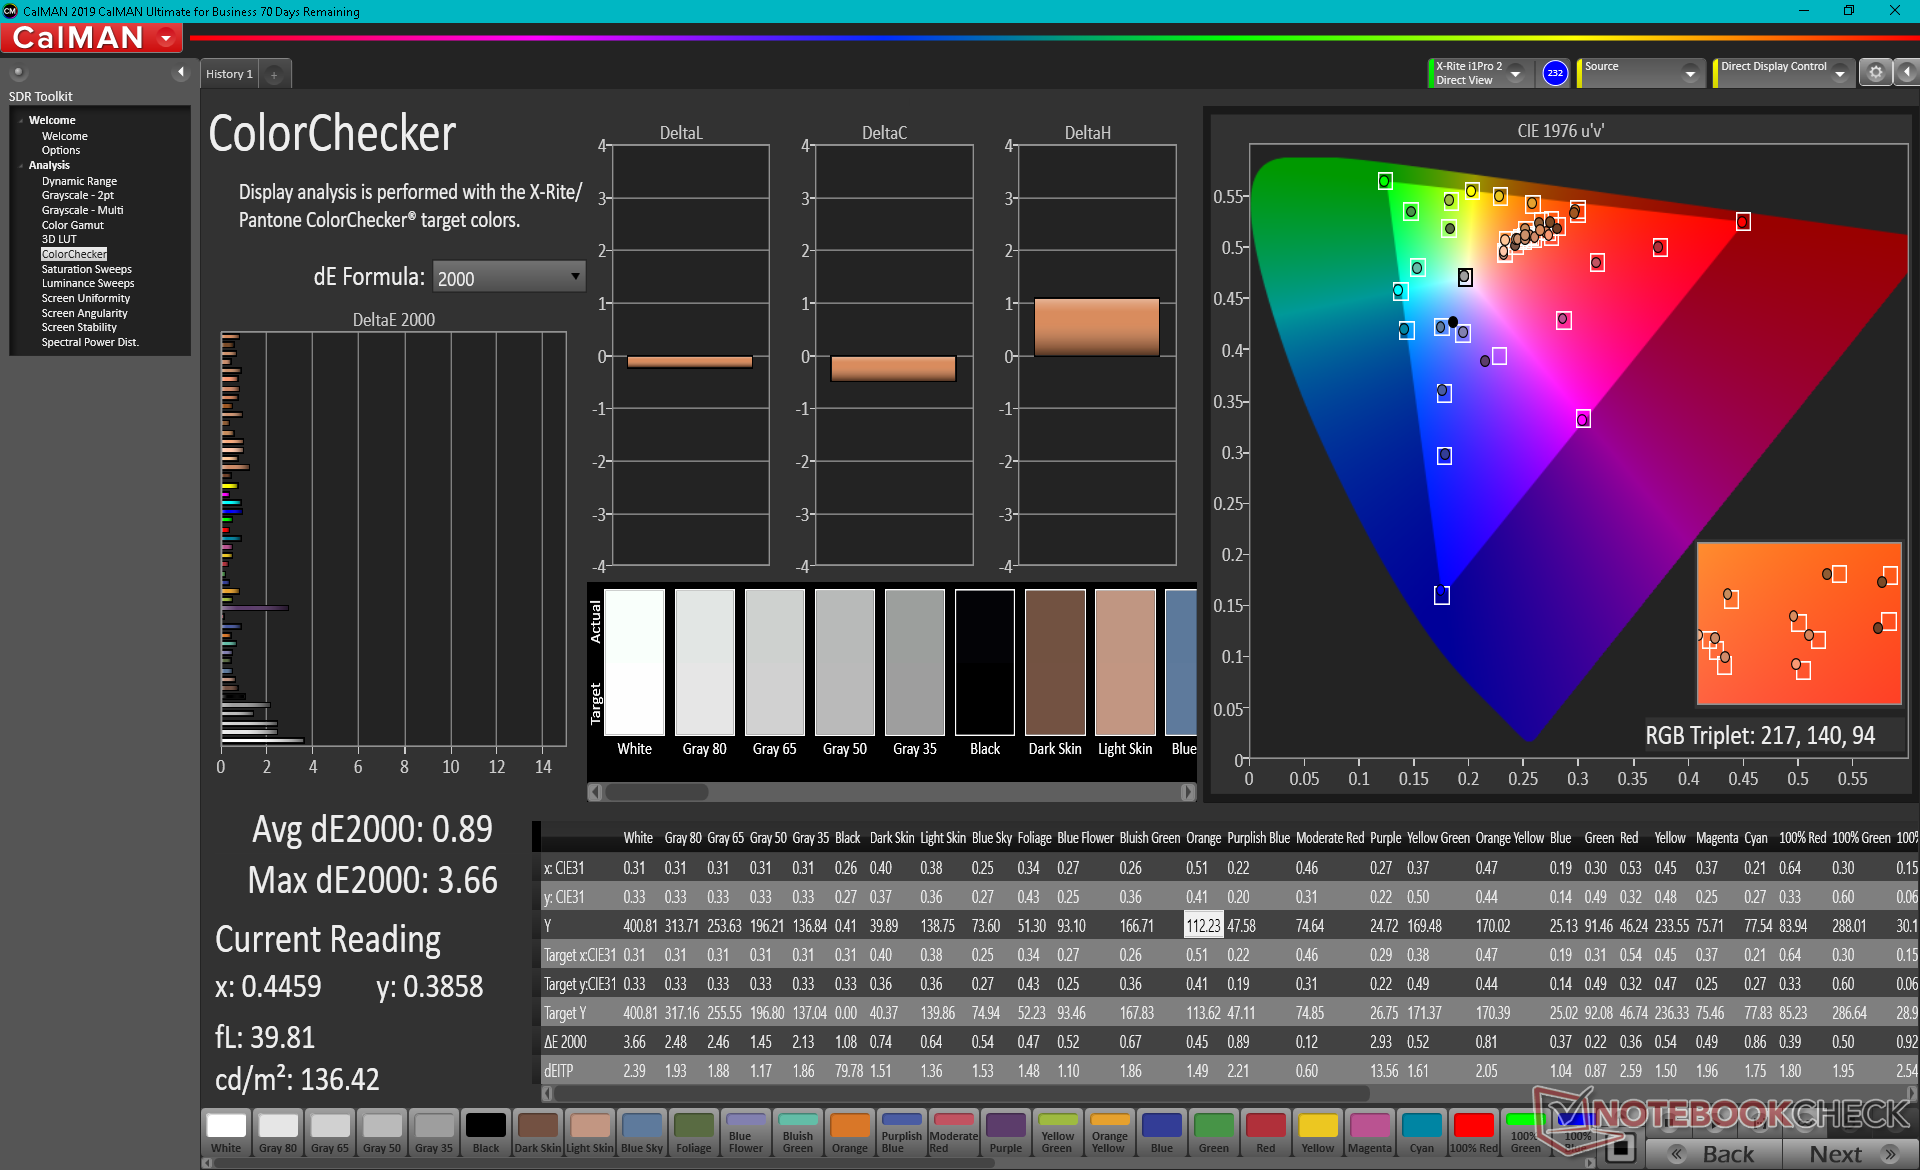
ΔE ColorChecker Calman: 3.48 | ∀{0.5-29.43 Ø4.73}
calibrated: 0.89
ΔE Greyscale Calman: 5 | ∀{0.09-98 Ø4.97}
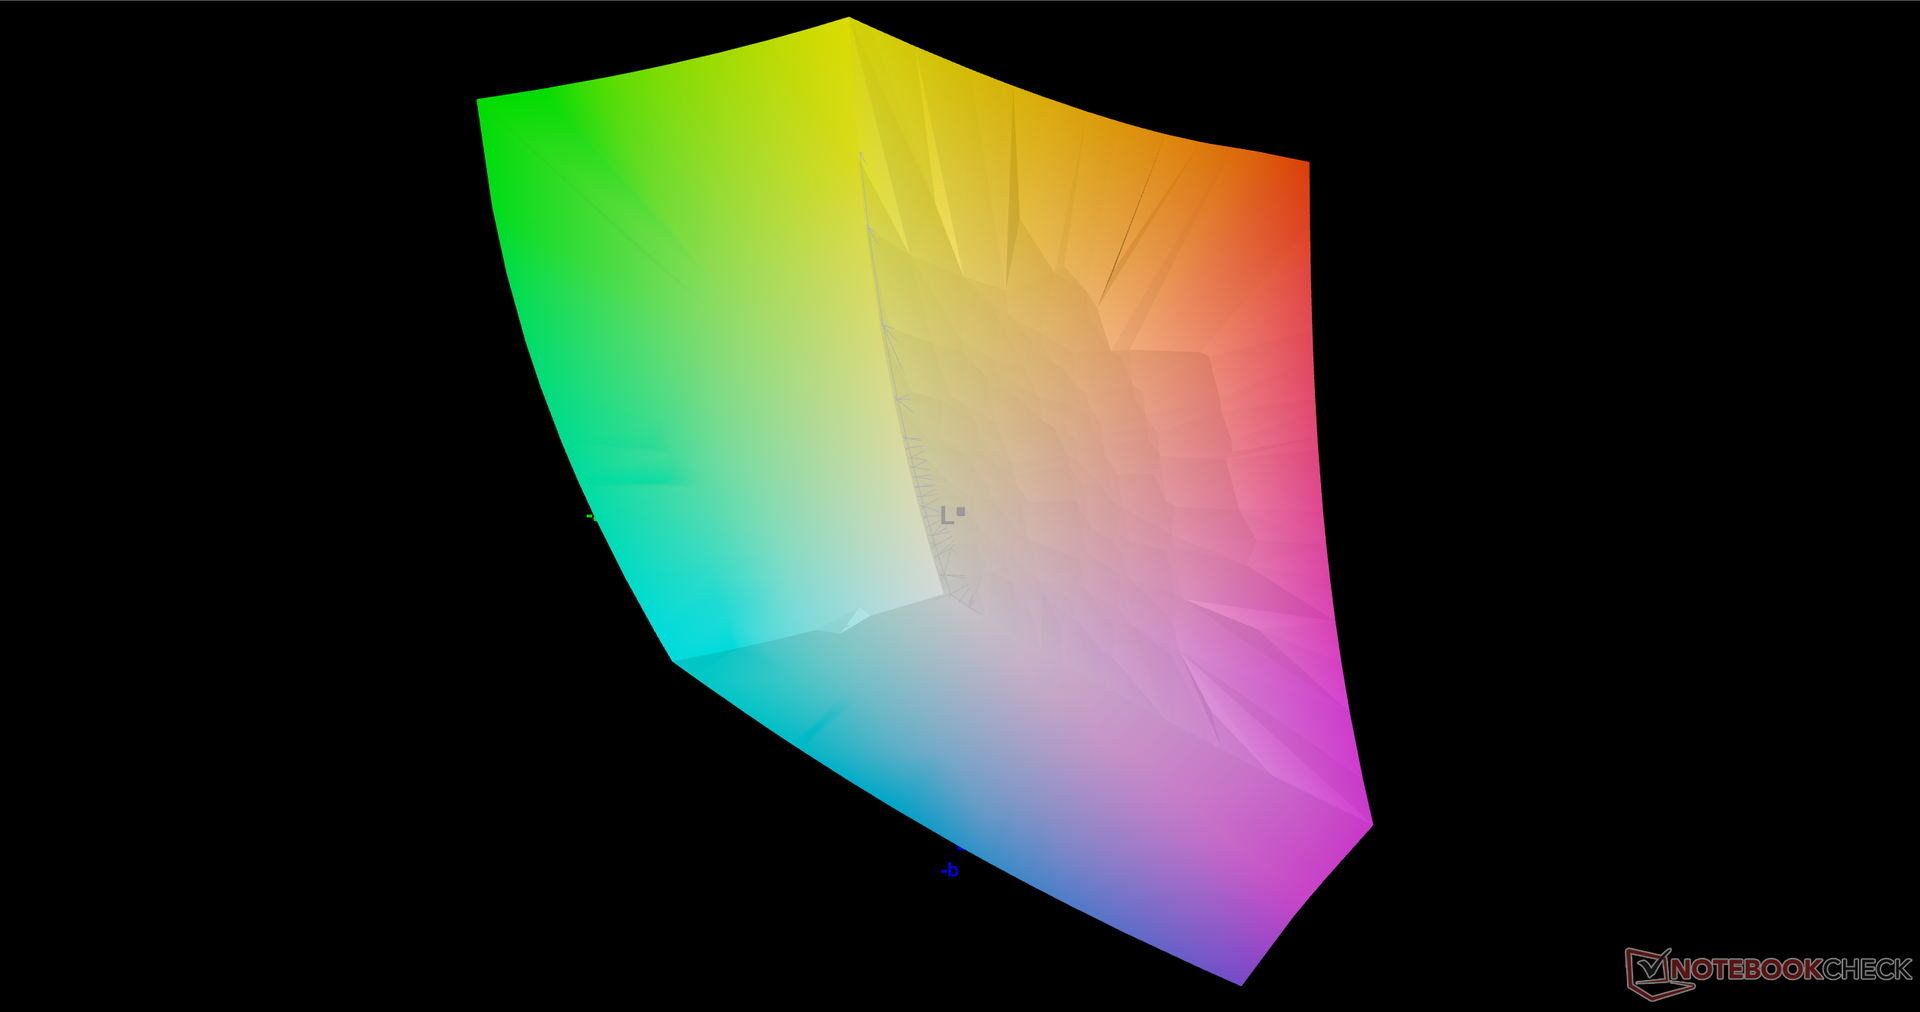
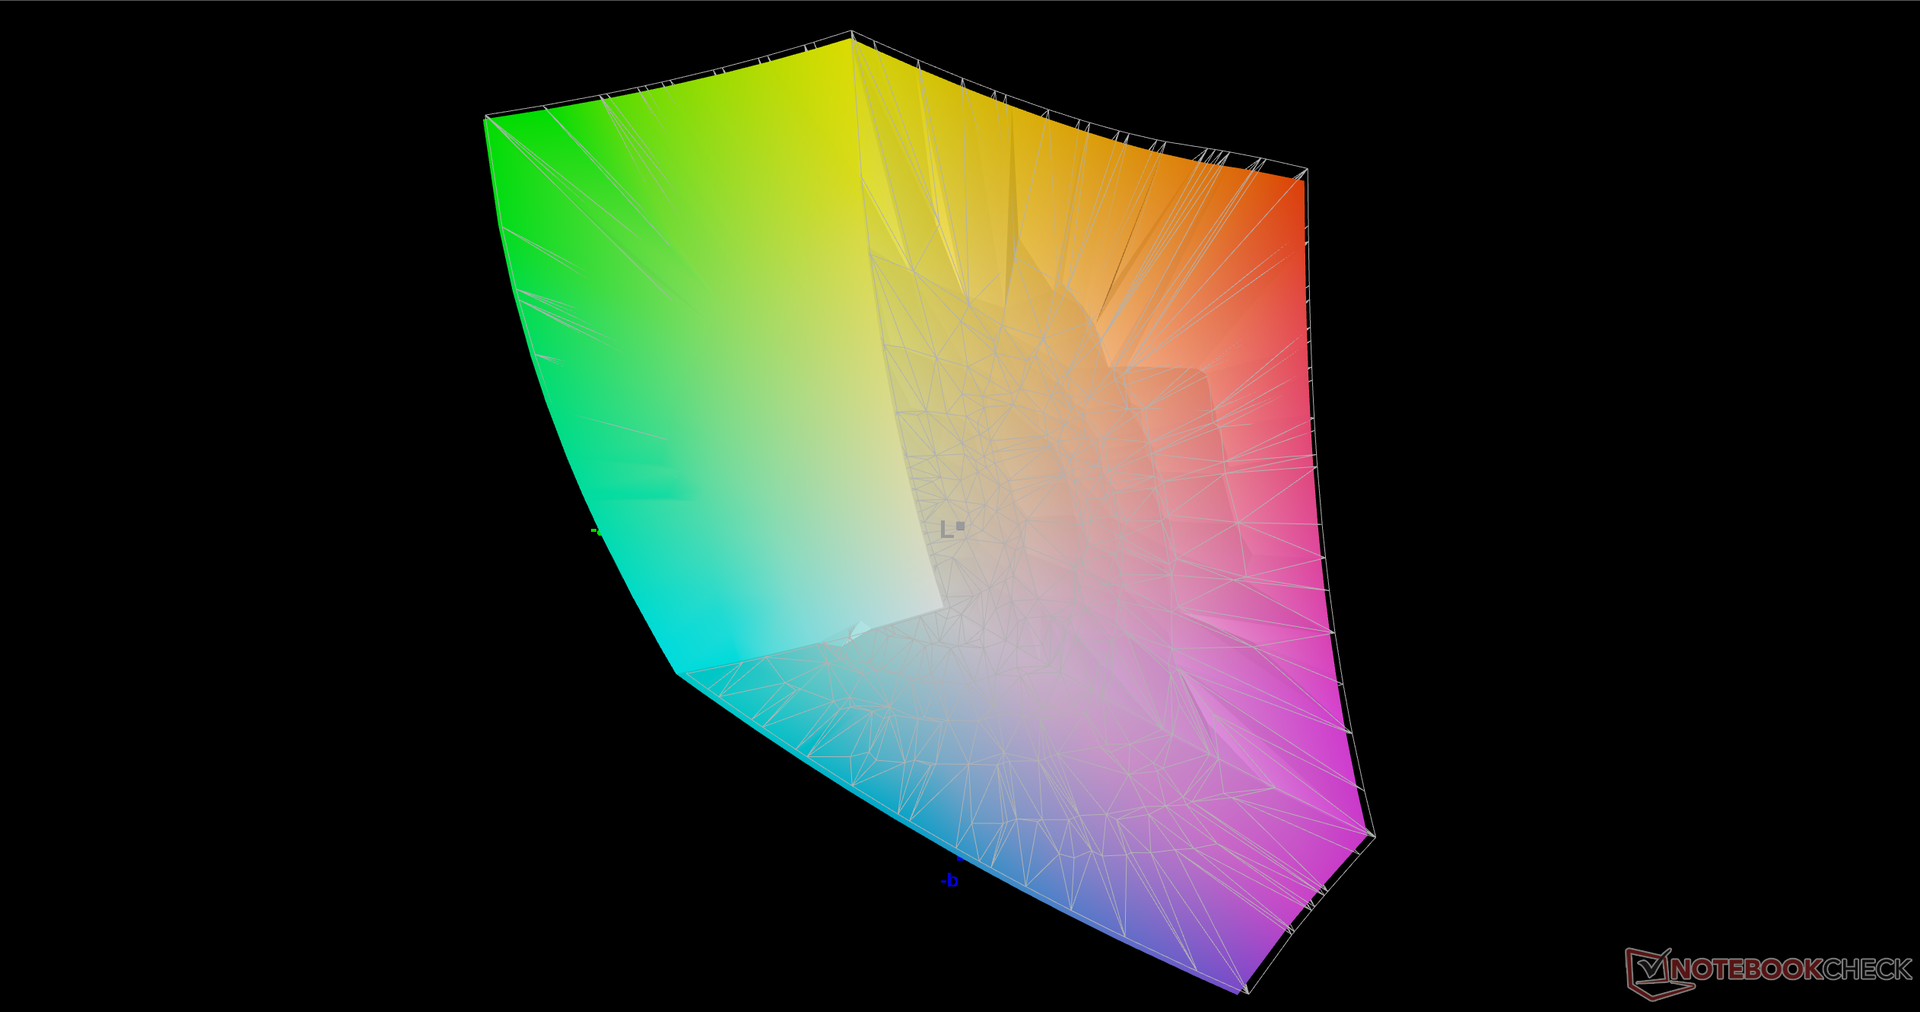
99.9% sRGB (Argyll 3D)
97.8% Display P3 (Argyll 3D)
Gamma: 2.16
CCT: 6591 K
| Alienware x15 RTX 3070 P111F LG Philips 156QHG, IPS, 15.6", 2560x1440 | Alienware m15 R4 RTX 3080 LG Philips LGD066E (156WFG), IPS, 15.6", 1920x1080 | MSI GS66 Stealth 10UG AU Optronics B156HAN12.0, IPS, 15.6", 1920x1080 | Razer Blade 15 Advanced (Mid 2021) TL156VDXP02-0, IPS, 15.6", 1920x1080 | Asus Zephyrus S15 GX502L B156HAN12.0 (AUOBC8C), IPS, 15.6", 1920x1080 | Acer Predator Helios 300 PH315-53-786B Sharp LQ156M1JW09, IPS, 15.6", 1920x1080 | |
|---|---|---|---|---|---|---|
| Display | -14% | -17% | -18% | -15% | -16% | |
| Display P3 Coverage (%) | 97.8 | 70.1 -28% | 67.7 -31% | 66.9 -32% | 69.7 -29% | 68.4 -30% |
| sRGB Coverage (%) | 99.9 | 99.8 0% | 98.4 -2% | 97.1 -3% | 99.7 0% | 99.4 -1% |
| AdobeRGB 1998 Coverage (%) | 71.5 | 69.1 | 69 | 71.1 | 70.4 | |
| Response Times | 23% | -16% | 35% | -5% | -8% | |
| Response Time Grey 50% / Grey 80% * (ms) | 12 ? | 7.6 ? 37% | 14.4 ? -20% | 4.2 ? 65% | 14 ? -17% | 15.2 ? -27% |
| Response Time Black / White * (ms) | 10.4 ? | 9.6 ? 8% | 11.6 ? -12% | 10 ? 4% | 9.6 ? 8% | 9.2 ? 12% |
| PWM Frequency (Hz) | 23580 ? | |||||
| Screen | 19% | -1% | 12% | 9% | 3% | |
| Brightness middle (cd/m²) | 409.5 | 347 -15% | 259.5 -37% | 353.4 -14% | 283 -31% | 312 -24% |
| Brightness (cd/m²) | 390 | 318 -18% | 264 -32% | 340 -13% | 289 -26% | 290 -26% |
| Brightness Distribution (%) | 88 | 86 -2% | 90 2% | 92 5% | 90 2% | 87 -1% |
| Black Level * (cd/m²) | 0.47 | 0.31 34% | 0.25 47% | 0.31 34% | 0.24 49% | 0.32 32% |
| Contrast (:1) | 871 | 1119 28% | 1038 19% | 1140 31% | 1179 35% | 975 12% |
| Colorchecker dE 2000 * | 3.48 | 1.68 52% | 2.52 28% | 2.17 38% | 2.26 35% | 3.03 13% |
| Colorchecker dE 2000 max. * | 6.31 | 3.03 52% | 5.55 12% | 5.69 10% | 5.64 11% | 6.81 -8% |
| Colorchecker dE 2000 calibrated * | 0.89 | 1.08 -21% | 1.93 -117% | 1.05 -18% | 1.11 -25% | 0.71 20% |
| Greyscale dE 2000 * | 5 | 1.8 64% | 1.7 66% | 3.4 32% | 3.4 32% | 4.7 6% |
| Gamma | 2.16 102% | 2.262 97% | 2.04 108% | 2.2 100% | 2.228 99% | 2.177 101% |
| CCT | 6591 99% | 6592 99% | 6414 101% | 6830 95% | 7249 90% | 6676 97% |
| Color Space (Percent of AdobeRGB 1998) (%) | 71 | 63.3 | 71 | |||
| Color Space (Percent of sRGB) (%) | 94 | 98.8 | 93 | |||
| Media total (Programa/Opciones) | 9% /
15% | -11% /
-6% | 10% /
11% | -4% /
3% | -7% /
-2% |
* ... más pequeño es mejor
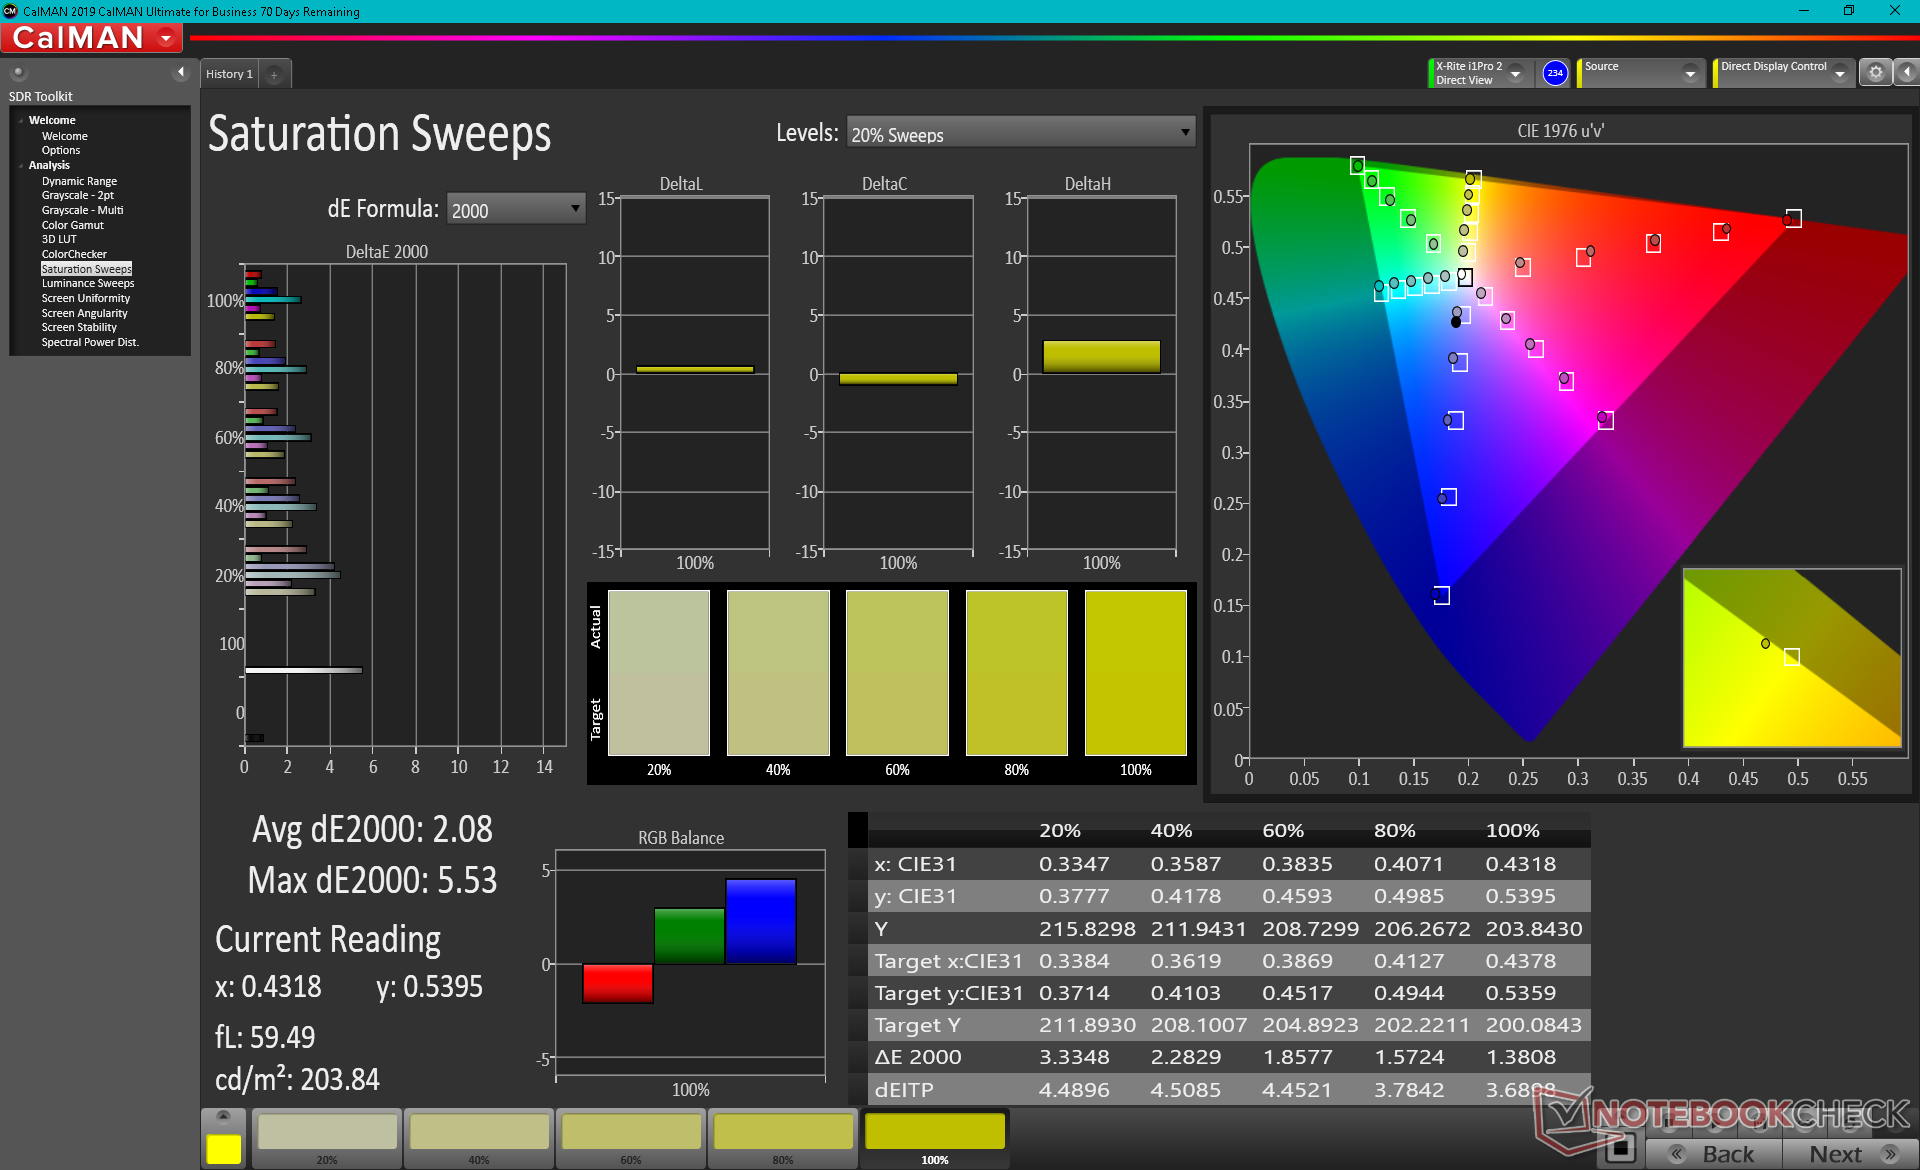
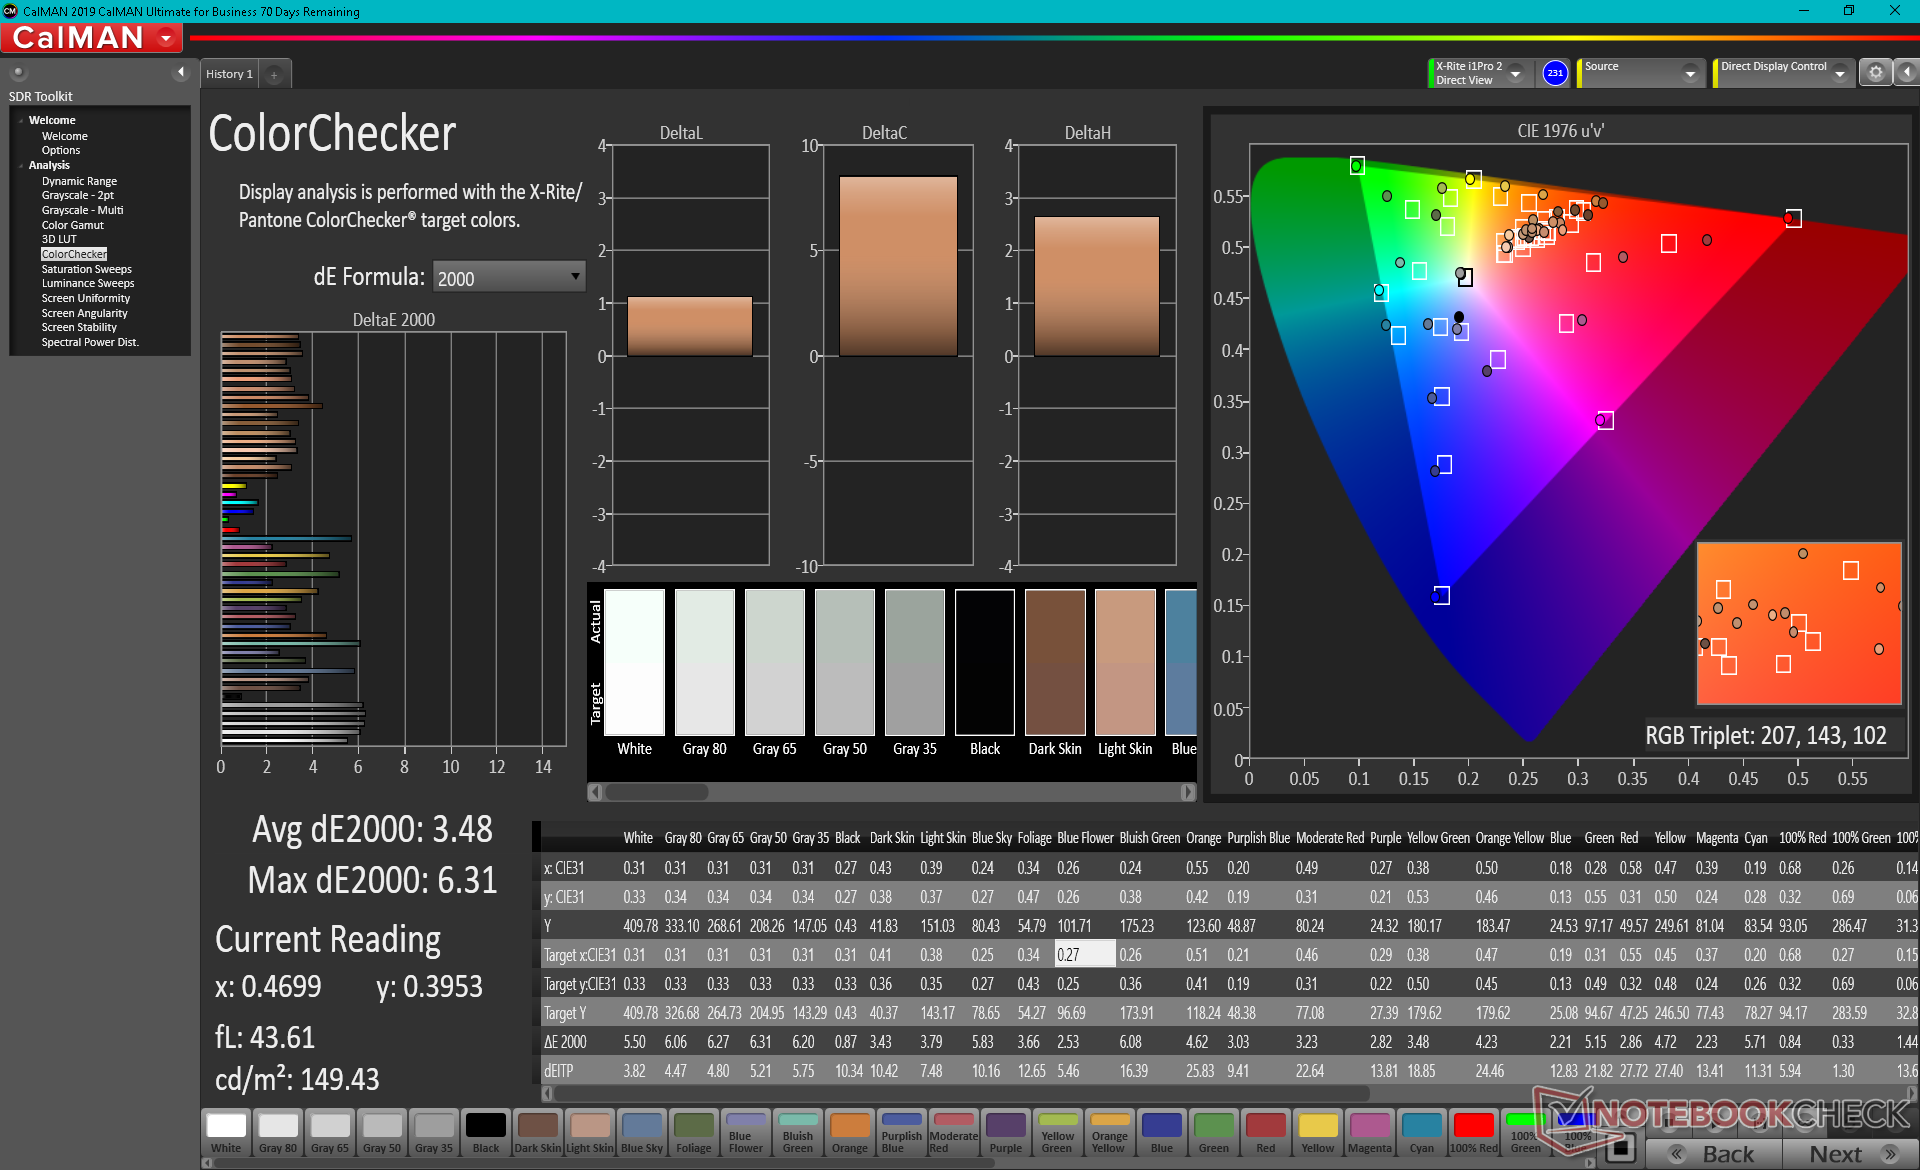
Dell anuncia un 99% de cobertura DCI-P3 que podemos confirmar con nuestras propias mediciones independientes. Este panel de 8 bits es, por tanto, adecuado tanto para los juegos como para la mayoría de la edición de gráficos con sus colores profundos y sus rápidos tiempos de respuesta.
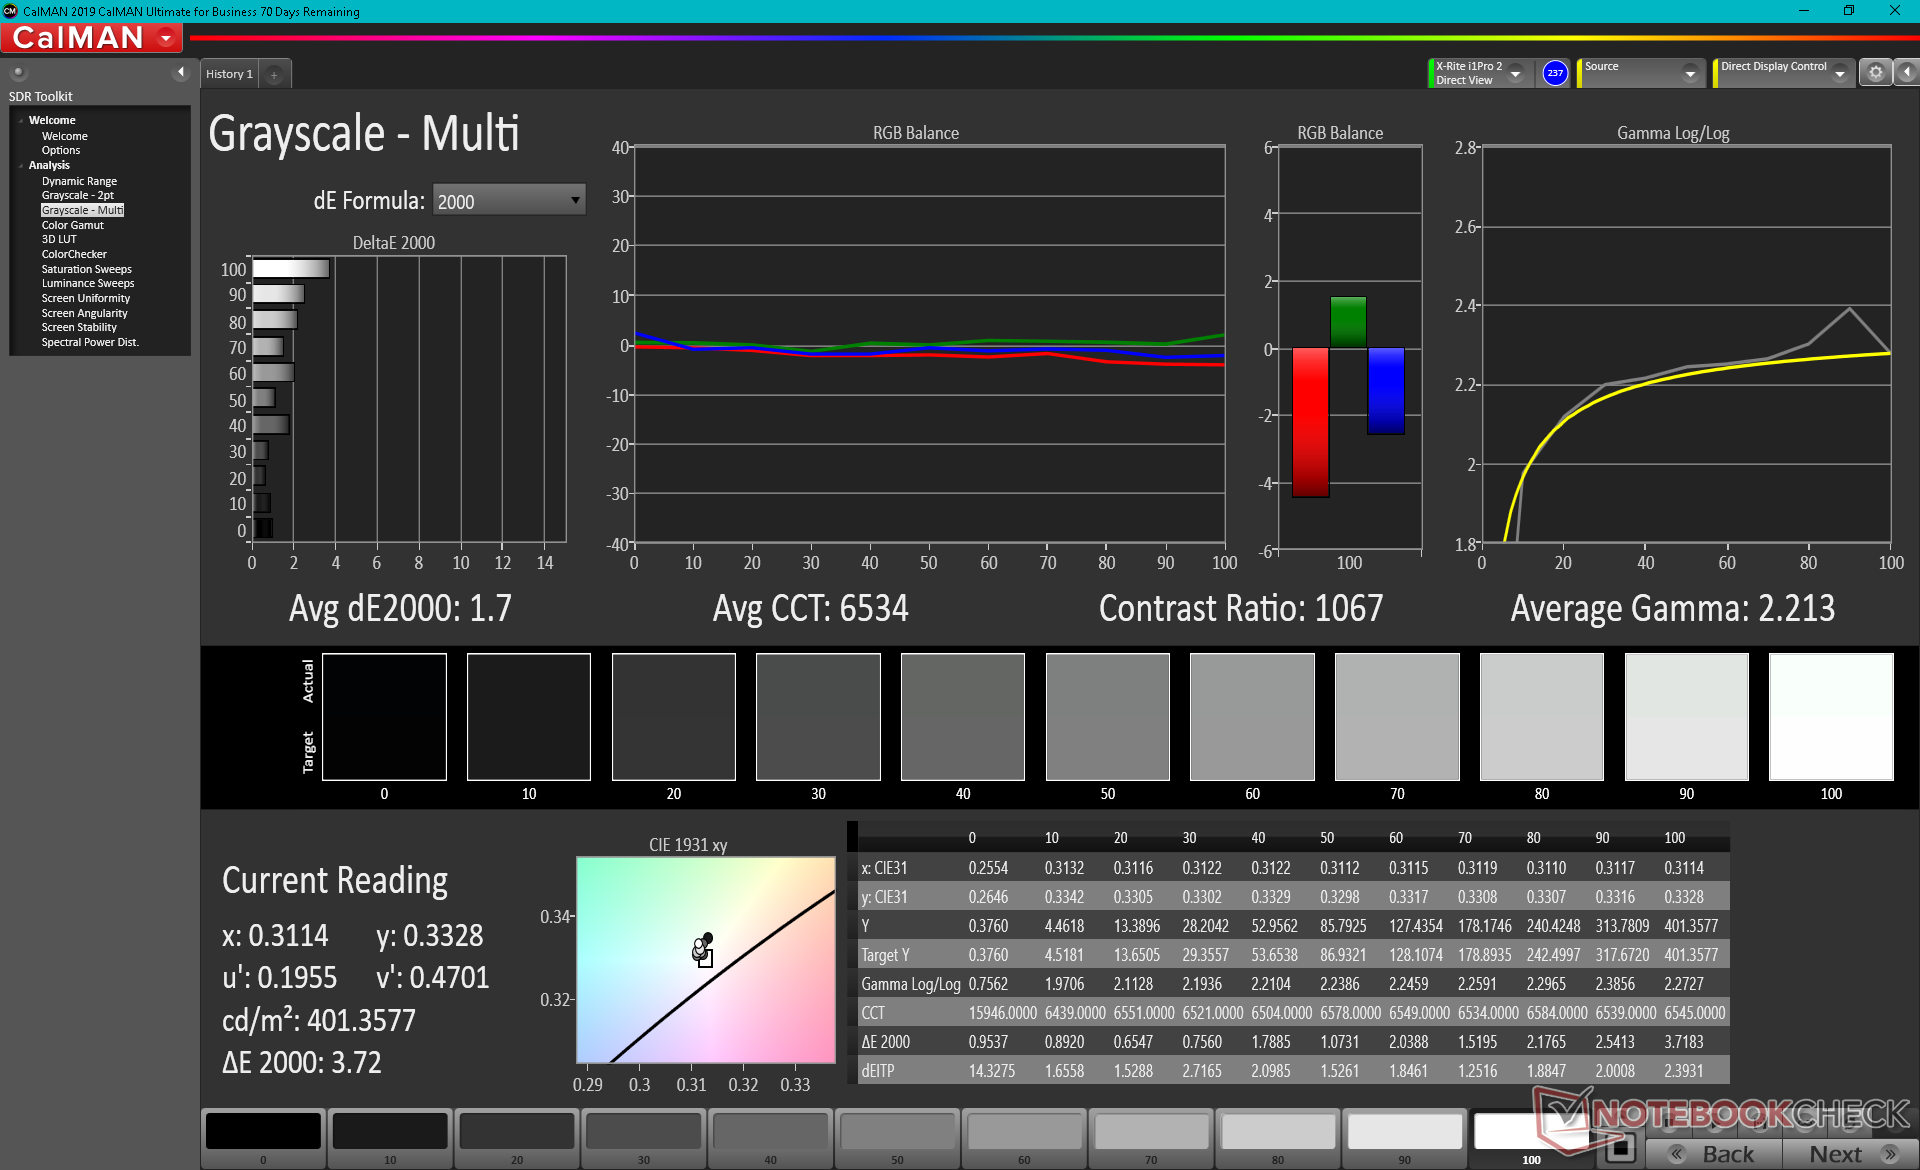
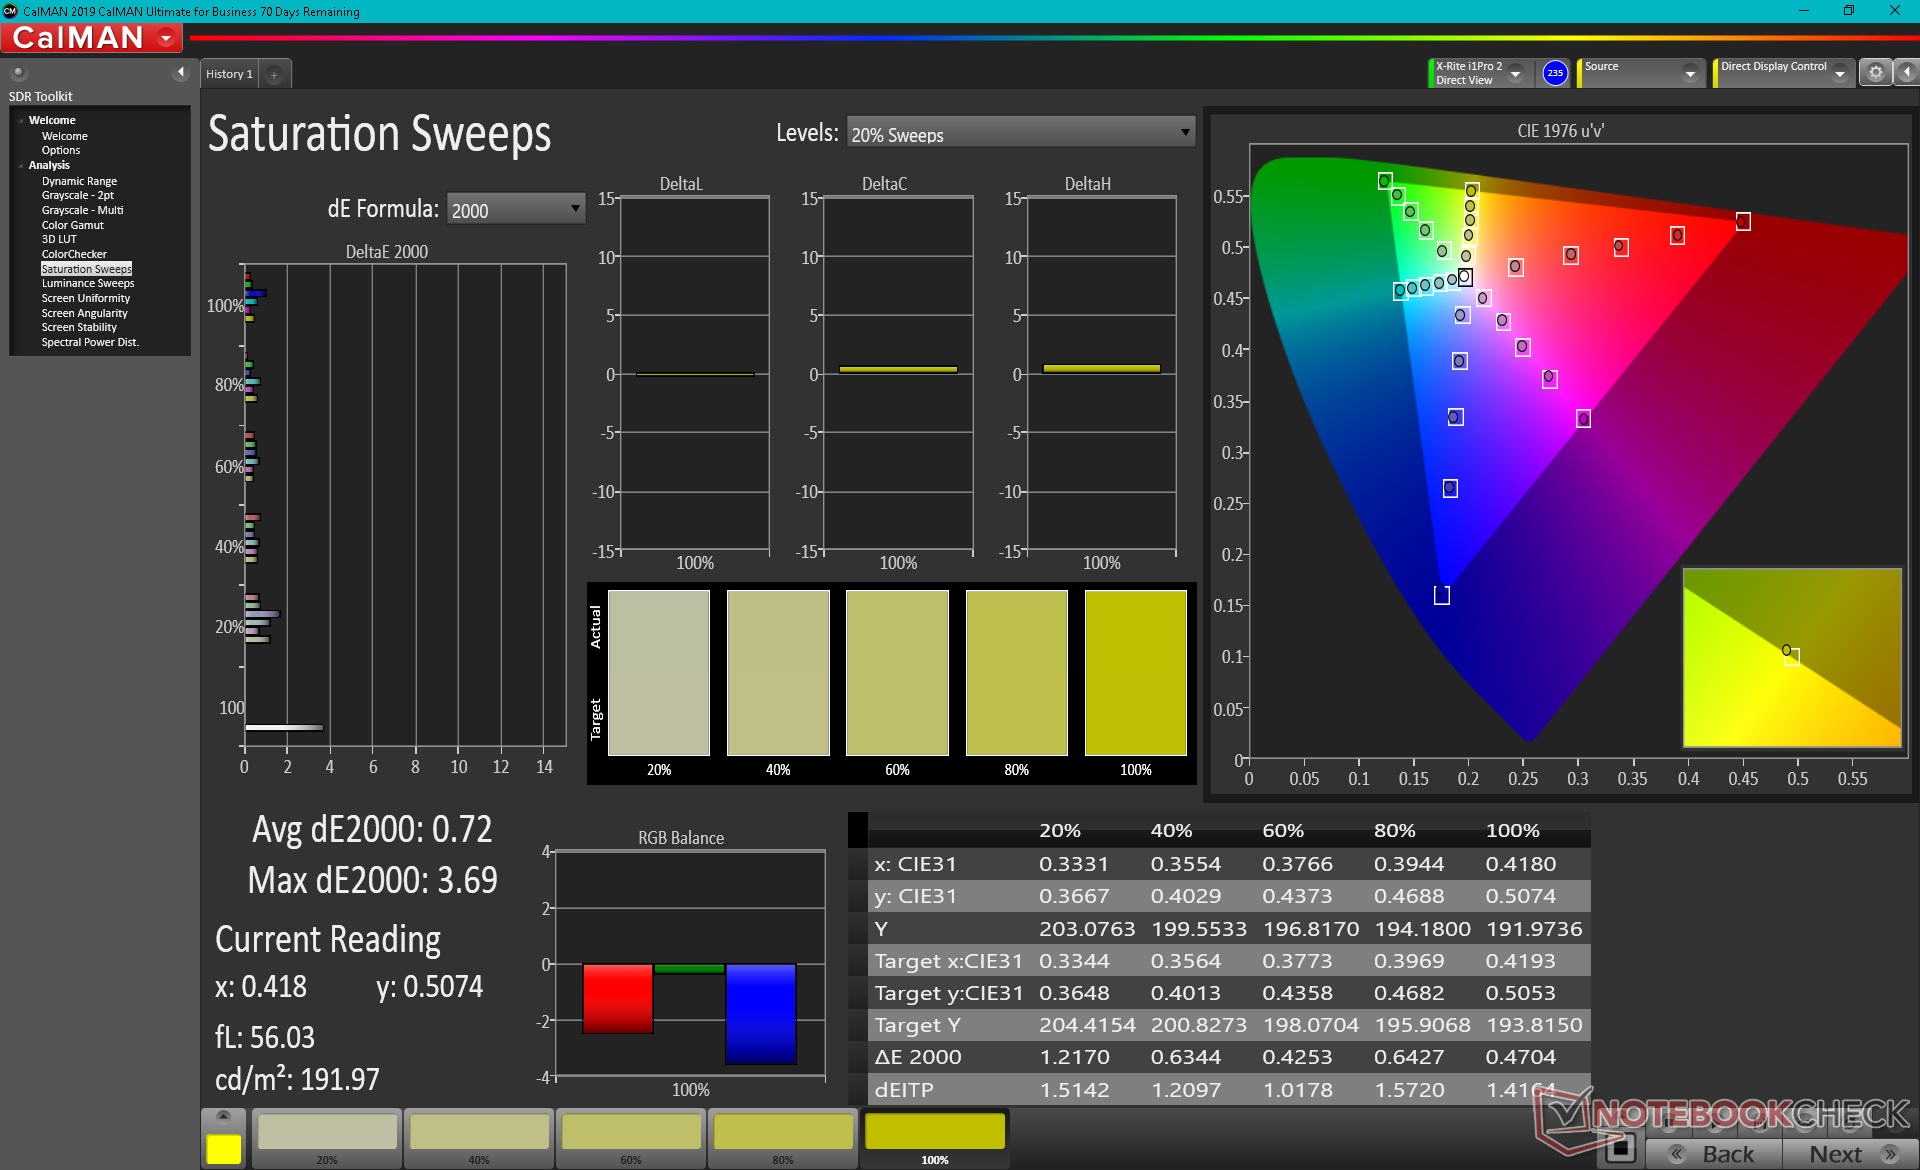
La pantalla está decentemente calibrada desde el principio, con valores medios de escala de grises y color deltaE de 5 y 3,48, respectivamente. Los esfuerzos adicionales de calibración pueden reducir estos valores debido a la ya mencionada amplia cobertura de color, como muestran nuestros resultados de CalMan a continuación.

Tiempos de respuesta del display
| ↔ Tiempo de respuesta de Negro a Blanco | ||
|---|---|---|
| 10.4 ms ... subida ↗ y bajada ↘ combinada | ↗ 6 ms subida | 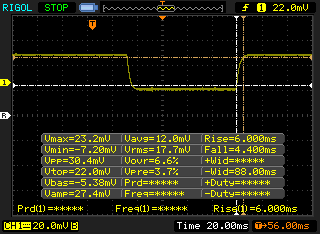 |
| ↘ 4.4 ms bajada | ||
| La pantalla mostró buenos tiempos de respuesta en nuestros tests pero podría ser demasiado lenta para los jugones competitivos. En comparación, todos los dispositivos de prueba van de ##min### (mínimo) a 240 (máximo) ms. » 28 % de todos los dispositivos son mejores. Esto quiere decir que el tiempo de respuesta medido es mejor que la media (19.9 ms) de todos los dispositivos testados. | ||
| ↔ Tiempo de respuesta 50% Gris a 80% Gris | ||
| 12 ms ... subida ↗ y bajada ↘ combinada | ↗ 6 ms subida | 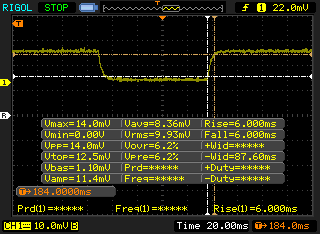 |
| ↘ 6 ms bajada | ||
| La pantalla mostró buenos tiempos de respuesta en nuestros tests pero podría ser demasiado lenta para los jugones competitivos. En comparación, todos los dispositivos de prueba van de ##min### (mínimo) a 636 (máximo) ms. » 25 % de todos los dispositivos son mejores. Esto quiere decir que el tiempo de respuesta medido es mejor que la media (31.1 ms) de todos los dispositivos testados. | ||
Parpadeo de Pantalla / PWM (Pulse-Width Modulation)
| Parpadeo de Pantalla / PWM no detectado | 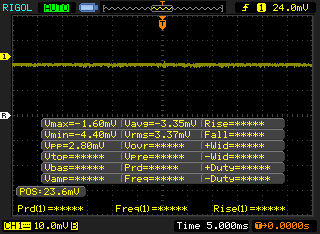 | ||
Comparación: 52 % de todos los dispositivos testados no usaron PWM para atenuar el display. Si se usó, medimos una media de 7798 (mínimo: 5 - máxmo: 343500) Hz. | |||
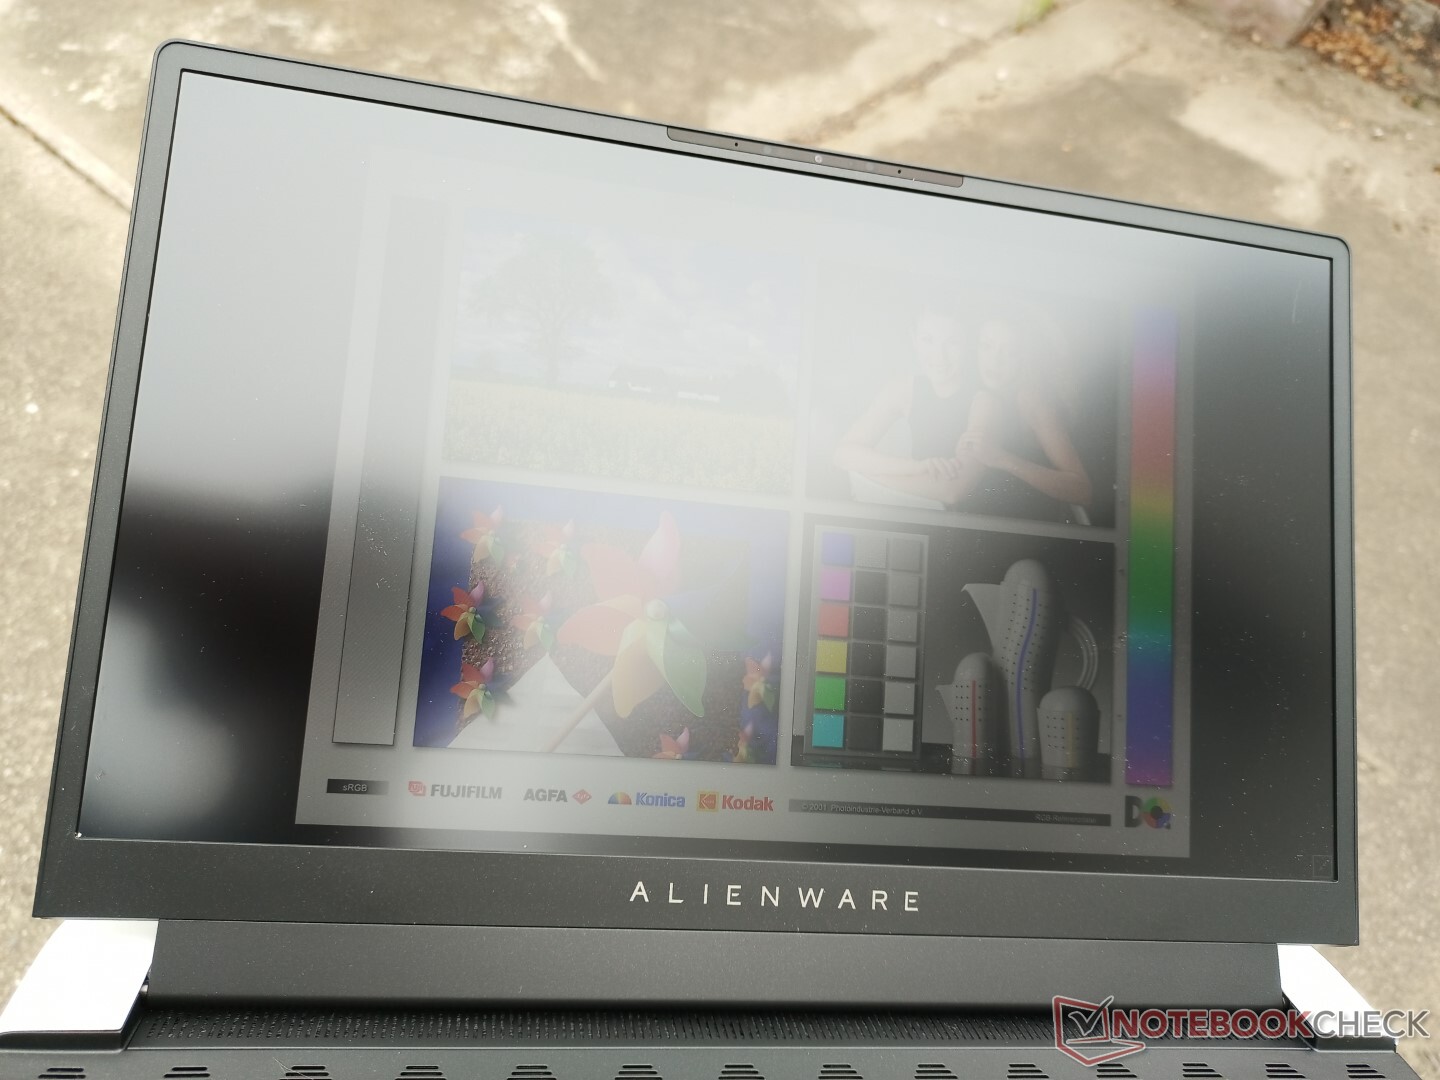
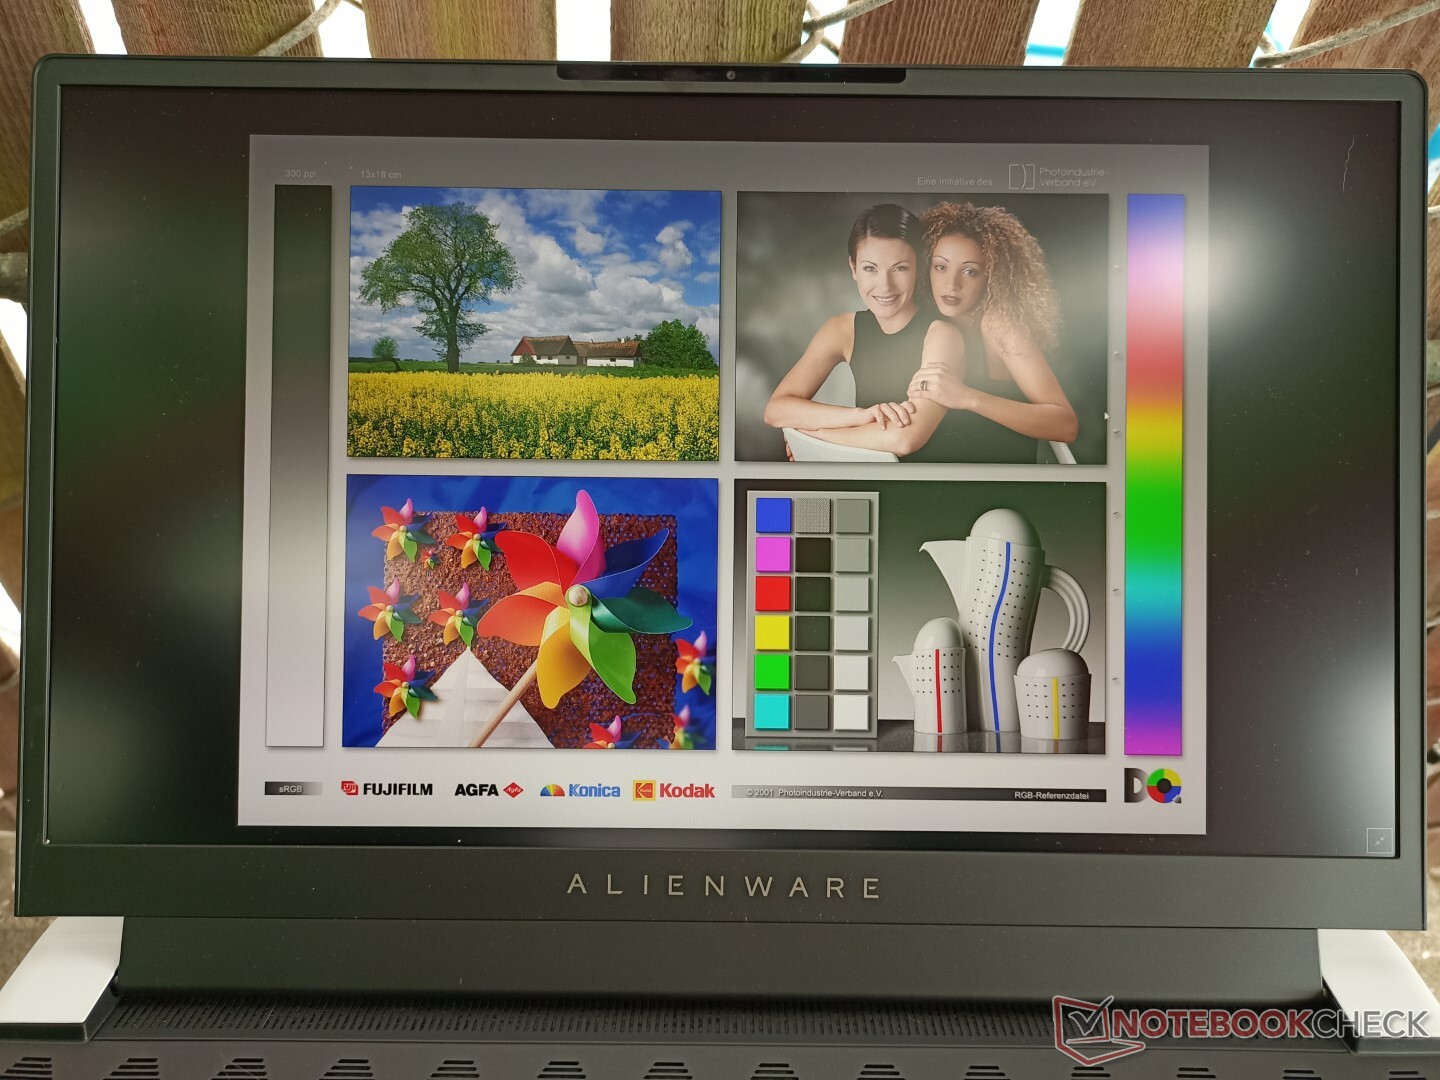
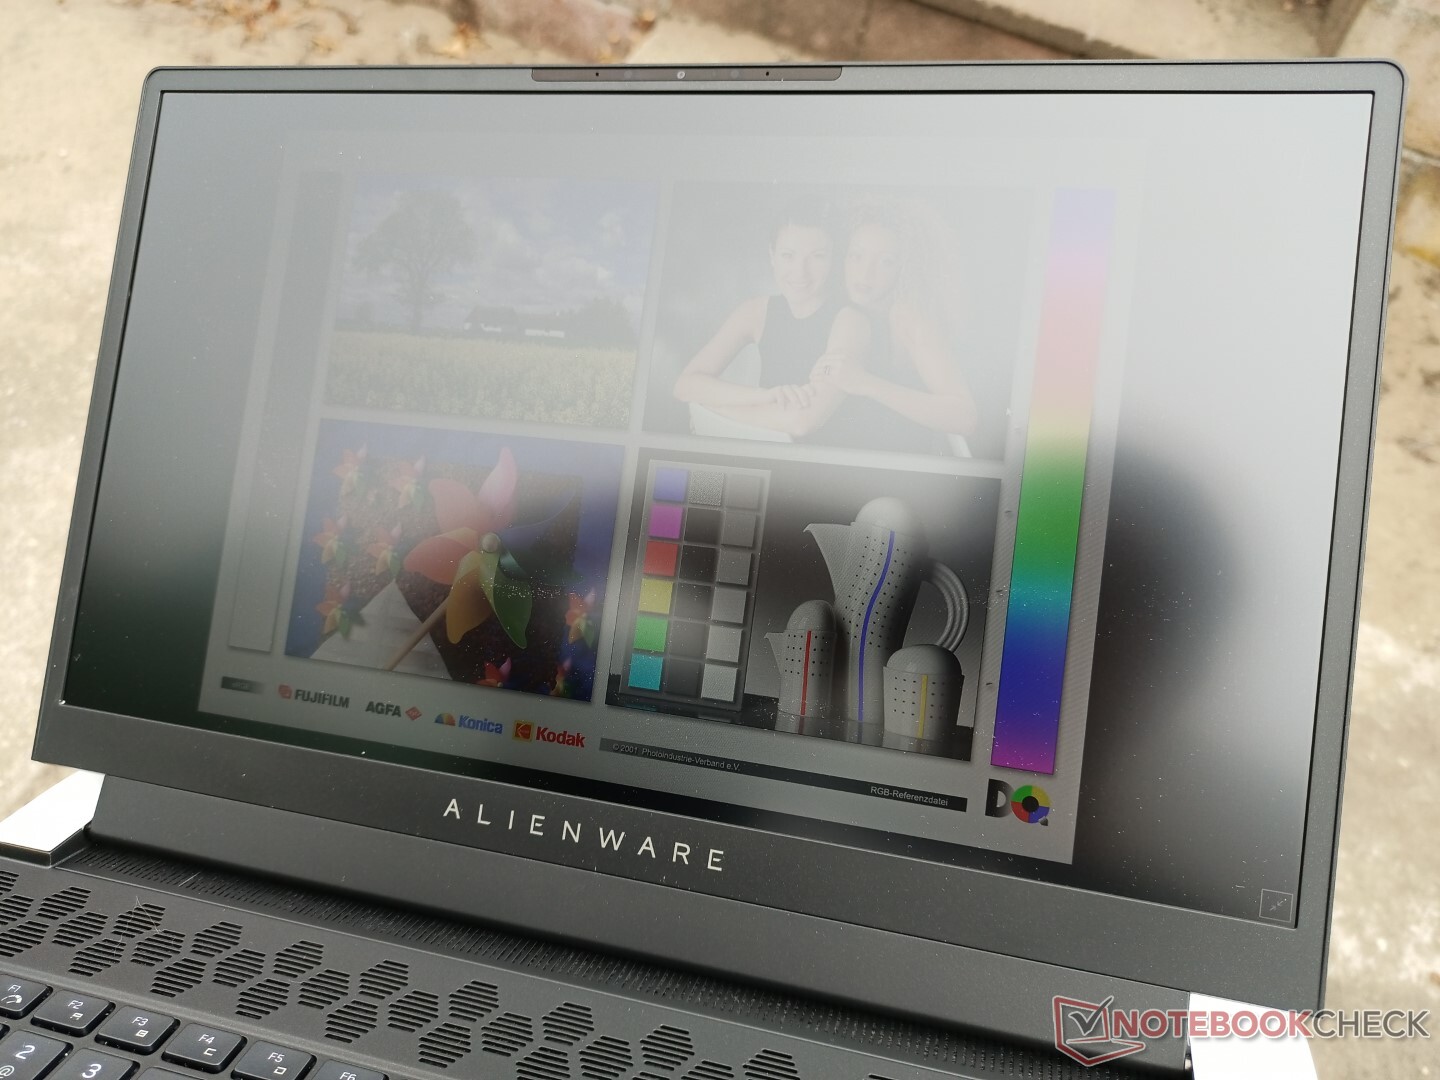
La visibilidad en exteriores es mejor que en muchos otros portátiles para juegos, simplemente debido a la luz de fondo más brillante de 400 nits en comparación con la media de 300 nits de la categoría. La pantalla es utilizable cuando está a la sombra, como en el Dell XPS 15pero los usuarios deberían evitar la luz solar directa siempre que sea posible.
Rendimiento - La GPU TGP sufre un ligero descenso
Los usuarios pueden elegir entre la 11ª generación Tiger Lake Core i7-11800H o Core i9-11900H con gráficos GeForce RTX 3060, RTX 3070, o RTX 3080 Ampere con un objetivo de 90 W, 110 W, o 110 W TGP, respectivamente. En realidad se trata de una rebaja con respecto al Alienware m15 R4 donde la GPU podía alcanzar hasta 140 W TGP. Es una GPU Max-Q a todos los efectos, aunque "Max-Q" ya no forme parte del nombre.
Soporta Dynamic Boost 2.0, WhisperMode 2.0 y Advanced Optimus con G-Sync. De hecho, el Alienware x15 es uno de los pocos portátiles para juegos con Advanced Optimus en primer lugar. Tenga en cuenta que la característica sólo está disponible en los SKUs 240 Hz QHD y 360 Hz FHD. Los usuarios también deben instalar la último parche BIOS 1.3.0 que permite funcionar sólo en el modo de GPU discreta.
Nuestra unidad de prueba se configuró en modo de alto rendimiento a través del software Alienware Command Center antes de ejecutar nuestros benchmarks a continuación para obtener las puntuaciones más altas posibles.
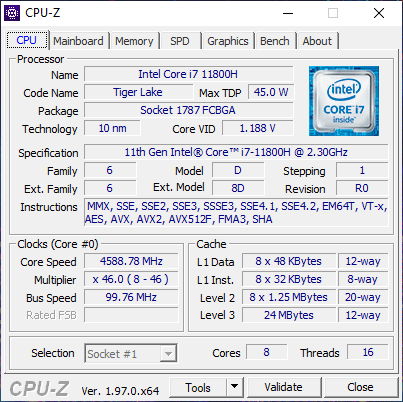
Procesador - Más rápido de lo esperado
El rendimiento bruto de la CPU es excelente, con resultados multihilo que son un 15 por ciento más rápidos que la media de los portátiles de nuestra base de datos equipados con el mismo Core i7-11800H Incluyendo el Razer Blade 15. Esto sitúa a nuestro sistema codo con codo con el competidor Ryzen 9 5900HX que normalmente es más rápido que el i7-11800H. La sostenibilidad del rendimiento también es excelente, como demuestran nuestros resultados constantes de CineBench R15 xT a continuación
La actualización al Core i9-11900H sólo se espera que traiga beneficios de rendimiento muy marginales sobre nuestro i7-11800H basado en nuestras experiencias con el procesador en otros portátiles como el Asus Zephyrus S17.
Cinebench R15 Multi Loop
Cinebench R23: Multi Core | Single Core
Cinebench R15: CPU Multi 64Bit | CPU Single 64Bit
Blender: v2.79 BMW27 CPU
7-Zip 18.03: 7z b 4 -mmt1 | 7z b 4
Geekbench 5.5: Single-Core | Multi-Core
HWBOT x265 Benchmark v2.2: 4k Preset
LibreOffice : 20 Documents To PDF
R Benchmark 2.5: Overall mean
| Cinebench R23 / Multi Core | |
| Alienware x15 RTX 3070 P111F | |
| Asus ROG Strix Scar 15 G533QS | |
| Asus ROG Zephyrus S17 GX703HSD | |
| Acer Nitro 5 AN515-45-R1JH | |
| Medio Intel Core i7-11800H (6508 - 14088, n=48) | |
| Alienware m15 R4 RTX 3080 | |
| MSI GS66 Stealth 10UG | |
| Razer Blade 15 Advanced Model Early 2021 | |
| Cinebench R23 / Single Core | |
| Asus ROG Zephyrus S17 GX703HSD | |
| Alienware x15 RTX 3070 P111F | |
| Medio Intel Core i7-11800H (1386 - 1522, n=45) | |
| Asus ROG Strix Scar 15 G533QS | |
| Acer Nitro 5 AN515-45-R1JH | |
| MSI GS66 Stealth 10UG | |
| Alienware m15 R4 RTX 3080 | |
| Razer Blade 15 Advanced Model Early 2021 | |
| Geekbench 5.5 / Single-Core | |
| Asus ROG Zephyrus S17 GX703HSD | |
| Medio Intel Core i7-11800H (1429 - 1625, n=40) | |
| Acer Nitro 5 AN515-45-R1JH | |
| Alienware m15 R4 RTX 3080 | |
| Razer Blade 15 Advanced Model Early 2021 | |
| MSI GS66 Stealth 10UG | |
| Dell G5 15 SE 5505 P89F | |
| Schenker XMG Pro 15 | |
| Geekbench 5.5 / Multi-Core | |
| Asus ROG Zephyrus S17 GX703HSD | |
| Medio Intel Core i7-11800H (4655 - 9851, n=40) | |
| Alienware m15 R4 RTX 3080 | |
| Dell G5 15 SE 5505 P89F | |
| MSI GS66 Stealth 10UG | |
| Acer Nitro 5 AN515-45-R1JH | |
| Razer Blade 15 Advanced Model Early 2021 | |
| Schenker XMG Pro 15 | |
| HWBOT x265 Benchmark v2.2 / 4k Preset | |
| Asus ROG Zephyrus S17 GX703HSD | |
| Alienware x15 RTX 3070 P111F | |
| Asus ROG Strix Scar 15 G533QS | |
| Acer Nitro 5 AN515-45-R1JH | |
| Medio Intel Core i7-11800H (7.38 - 17.4, n=46) | |
| Alienware m15 R4 RTX 3080 | |
| Dell G5 15 SE 5505 P89F | |
| MSI GS66 Stealth 10UG | |
| Razer Blade 15 Advanced Model Early 2021 | |
| Schenker XMG Pro 15 | |
| LibreOffice / 20 Documents To PDF | |
| Alienware m15 R4 RTX 3080 | |
| Acer Nitro 5 AN515-45-R1JH | |
| Dell G5 15 SE 5505 P89F | |
| Razer Blade 15 Advanced Model Early 2021 | |
| Asus ROG Strix Scar 15 G533QS | |
| Alienware x15 RTX 3070 P111F | |
| MSI GS66 Stealth 10UG | |
| Medio Intel Core i7-11800H (38.6 - 59.9, n=45) | |
| Asus ROG Zephyrus S17 GX703HSD | |
* ... más pequeño es mejor
Rendimiento del sistema
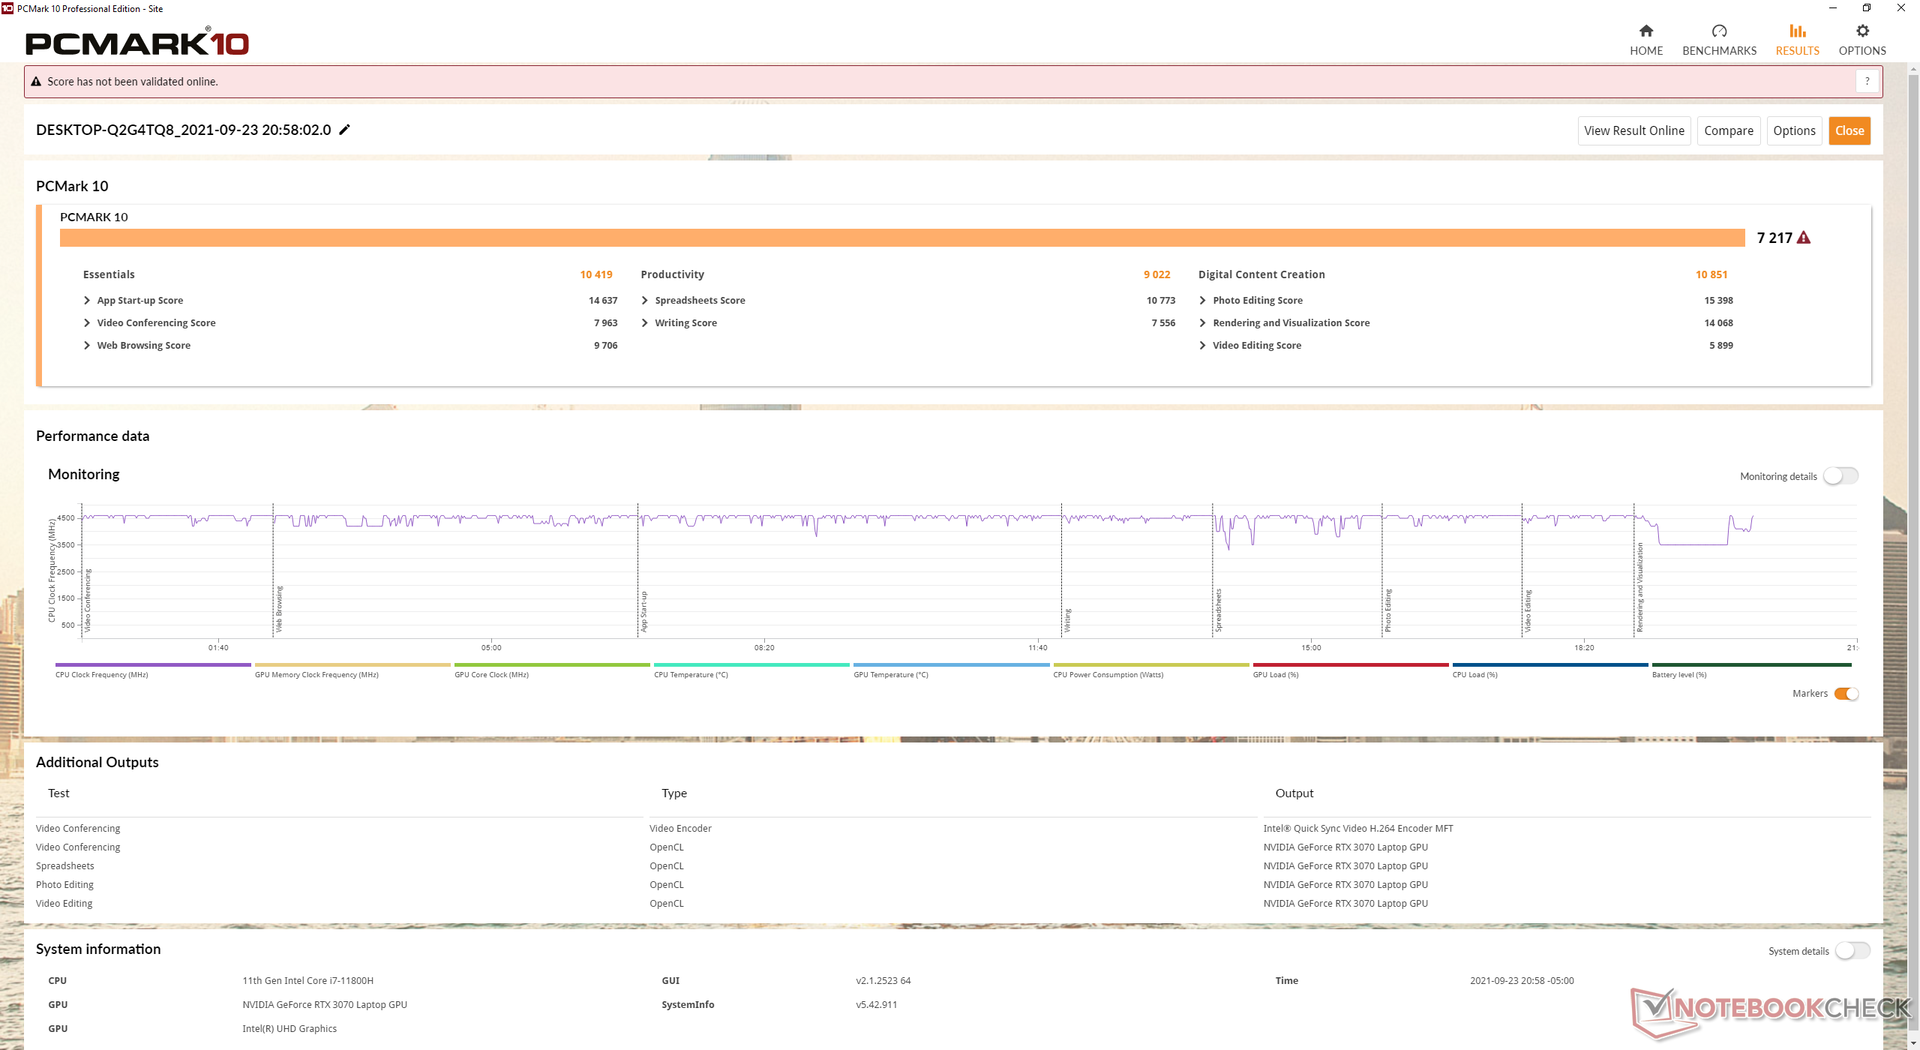
Las puntuaciones de PCMark 10 son excelentes con resultados que están constantemente por delante del Alienware m15 R4 del año pasado, salvo en la categoría de productividad, ya que nuestro m15 R4 estaba equipado con unidades RAID 0 más rápidas.
Experimentamos un problema con nuestra unidad de prueba donde la pantalla se volvía repentinamente negra cuando se cambiaban los perfiles térmicos a través del software Alienware Command Center, por lo que se requería un reinicio duro. Aunque no pudimos repetir el problema de forma fiable, vale la pena mencionarlo, especialmente porque nuestra unidad de prueba x17 la semana pasada no tuvo estos problemas.
| PCMark 10 / Score | |
| Razer Blade 15 Advanced (Mid 2021) | |
| Alienware x15 RTX 3070 P111F | |
| Alienware m15 R4 RTX 3080 | |
| Medio Intel Core i7-11800H, NVIDIA GeForce RTX 3070 Laptop GPU (6126 - 7311, n=11) | |
| MSI GS66 Stealth 10UG | |
| Acer Predator Helios 300 PH315-53-786B | |
| Asus Zephyrus S15 GX502L | |
| PCMark 10 / Essentials | |
| Razer Blade 15 Advanced (Mid 2021) | |
| Alienware x15 RTX 3070 P111F | |
| Medio Intel Core i7-11800H, NVIDIA GeForce RTX 3070 Laptop GPU (9248 - 10832, n=11) | |
| Alienware m15 R4 RTX 3080 | |
| Asus Zephyrus S15 GX502L | |
| MSI GS66 Stealth 10UG | |
| Acer Predator Helios 300 PH315-53-786B | |
| PCMark 10 / Productivity | |
| Alienware m15 R4 RTX 3080 | |
| Medio Intel Core i7-11800H, NVIDIA GeForce RTX 3070 Laptop GPU (8571 - 9669, n=11) | |
| Alienware x15 RTX 3070 P111F | |
| Razer Blade 15 Advanced (Mid 2021) | |
| Asus Zephyrus S15 GX502L | |
| Acer Predator Helios 300 PH315-53-786B | |
| MSI GS66 Stealth 10UG | |
| PCMark 10 / Digital Content Creation | |
| Alienware x15 RTX 3070 P111F | |
| Razer Blade 15 Advanced (Mid 2021) | |
| Alienware m15 R4 RTX 3080 | |
| Medio Intel Core i7-11800H, NVIDIA GeForce RTX 3070 Laptop GPU (7627 - 10851, n=11) | |
| MSI GS66 Stealth 10UG | |
| Acer Predator Helios 300 PH315-53-786B | |
| Asus Zephyrus S15 GX502L | |
| PCMark 10 Score | 7217 puntos | |
ayuda | ||
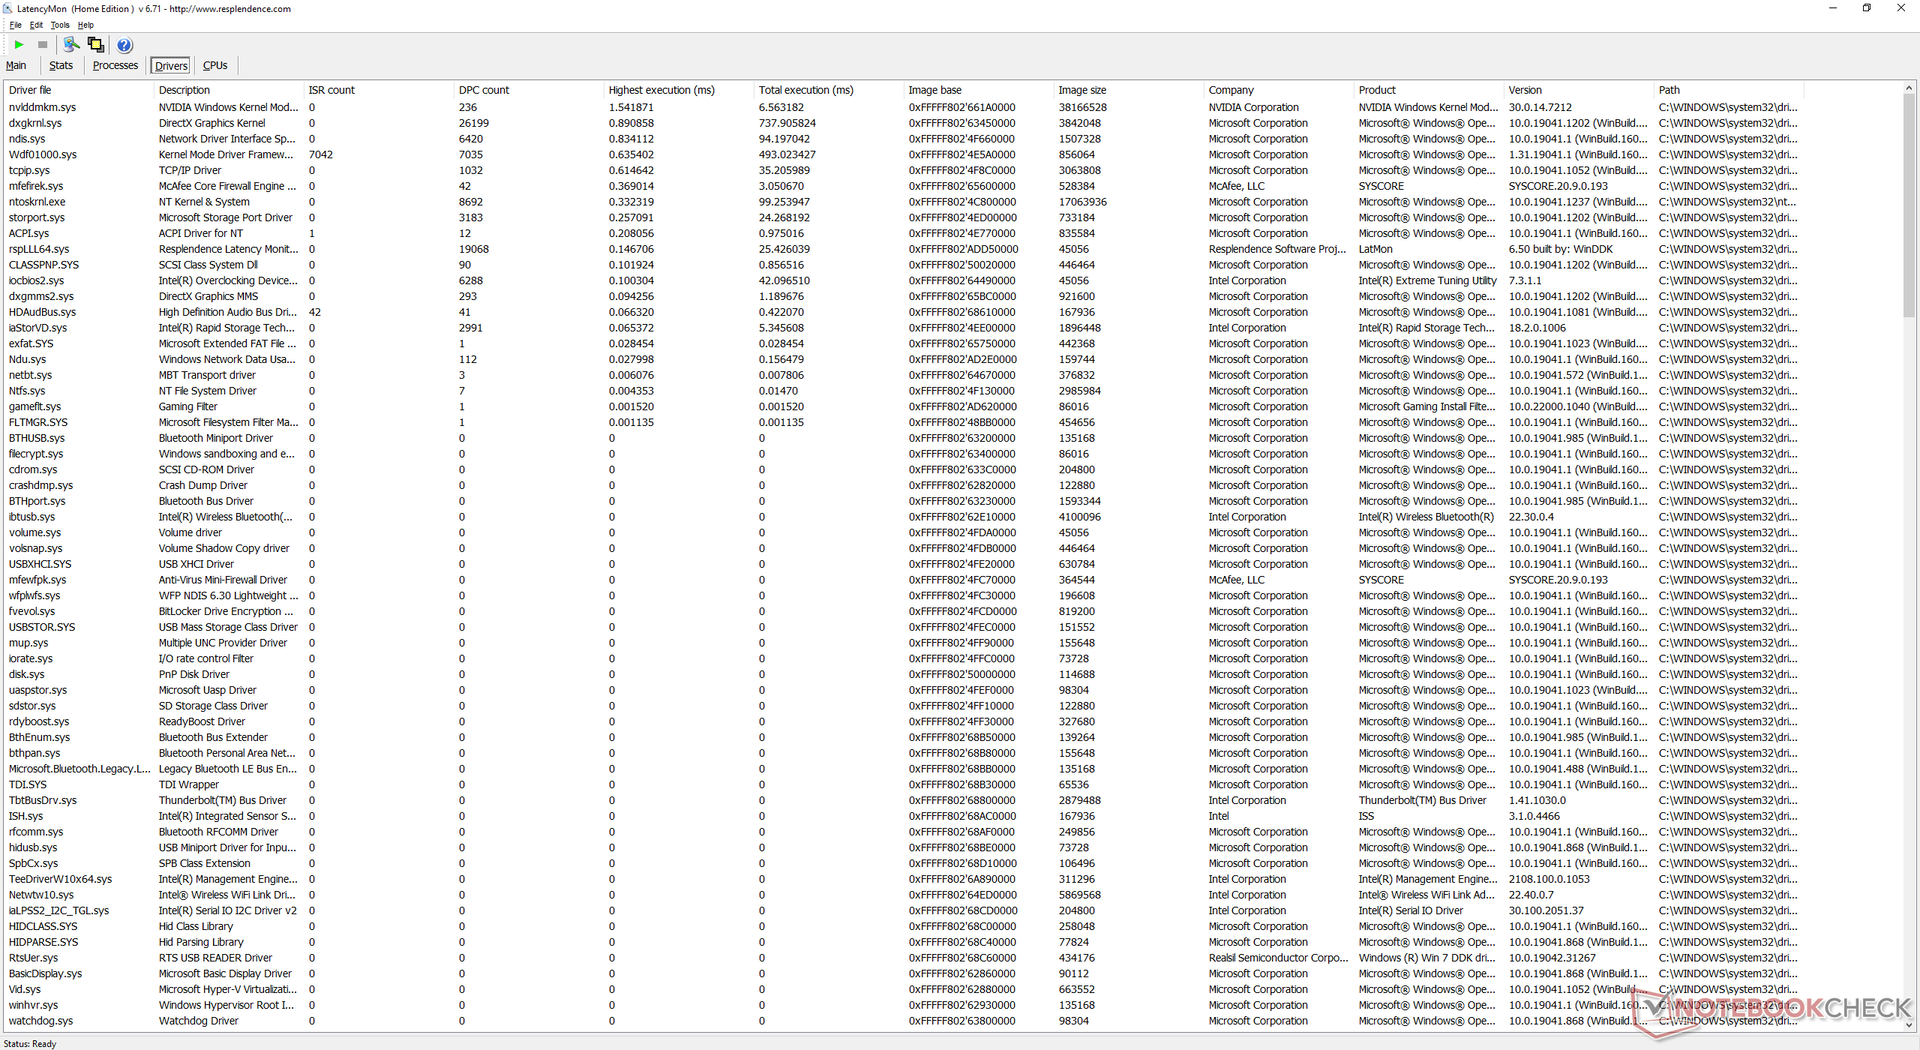
Latencia del CPD
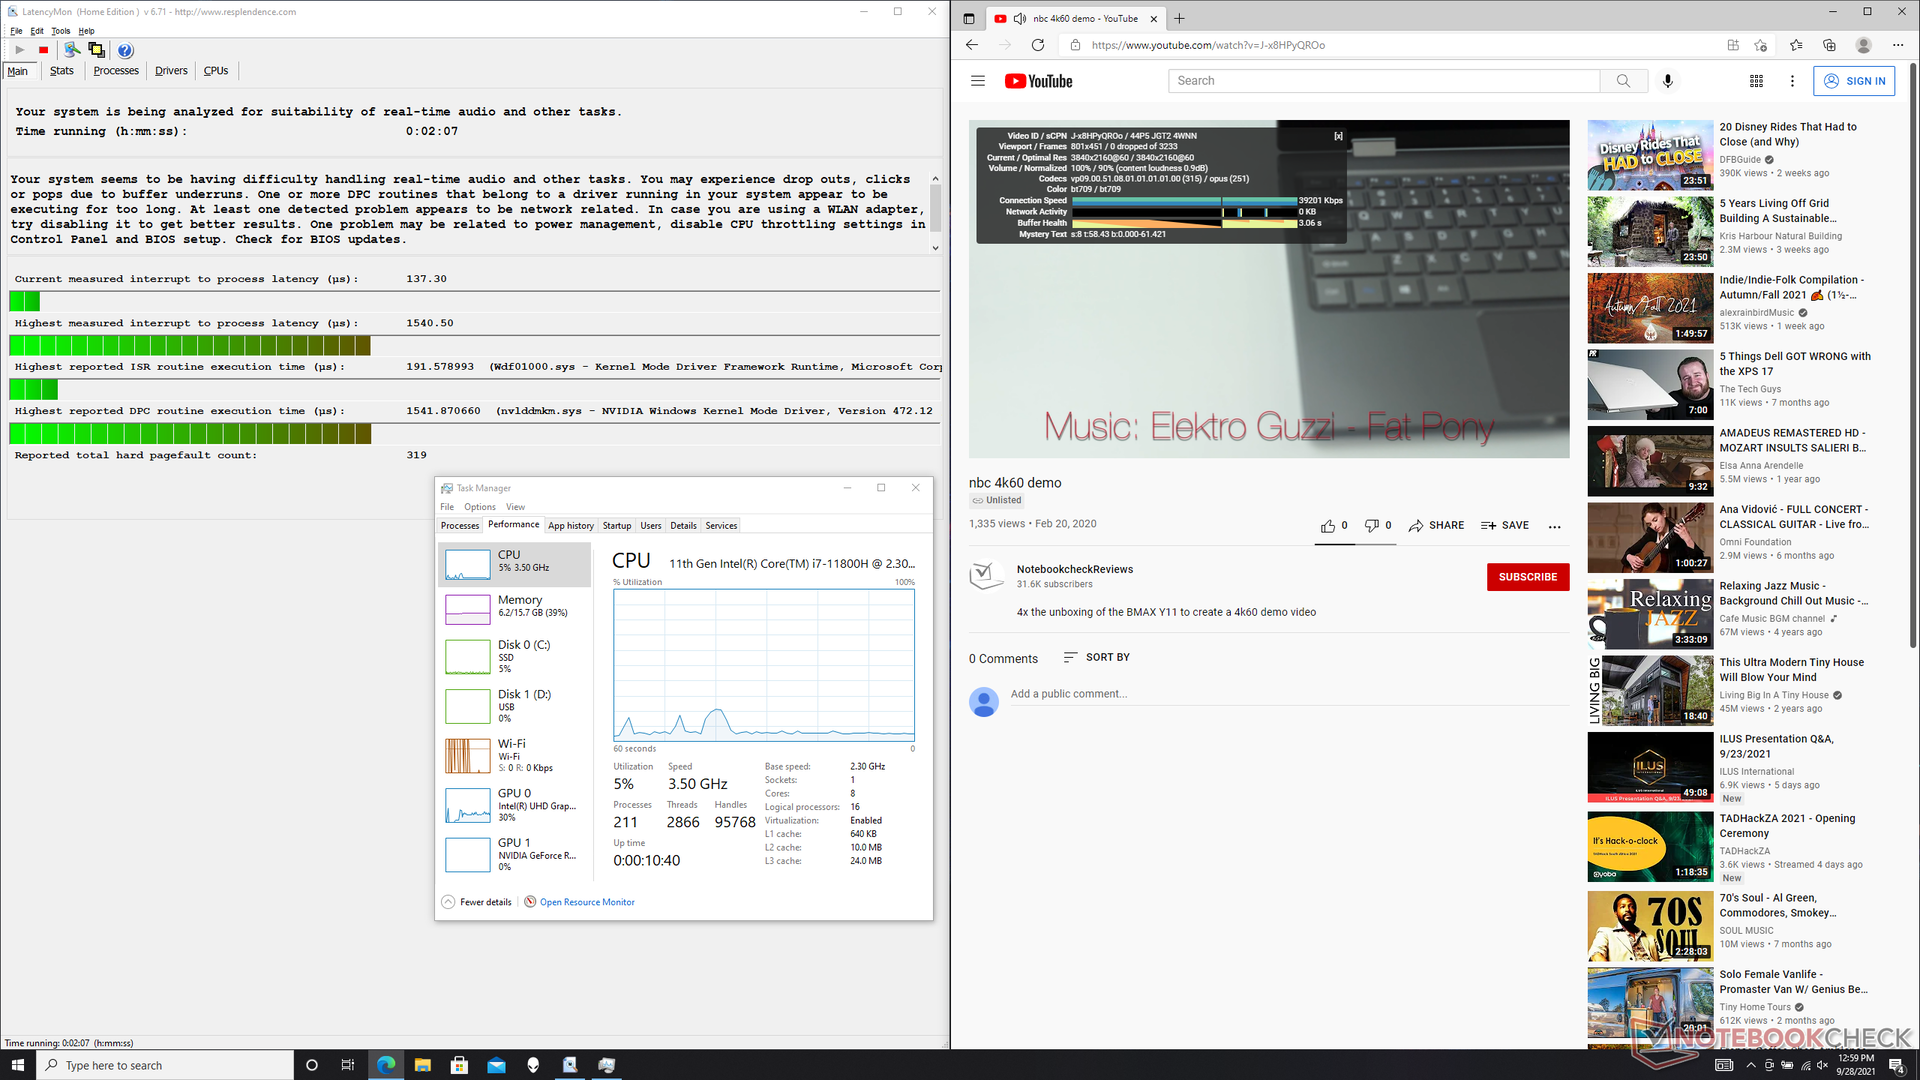
LatencyMon muestra problemas menores de latencia del CPD al abrir varias pestañas del navegador en nuestra página de inicio y al ejecutar Prime95 para estresar la CPU. La reproducción de vídeo 4K a 60 FPS es, por lo demás, perfecta, sin pérdida de frames en el modo iGPU.
| DPC Latencies / LatencyMon - interrupt to process latency (max), Web, Youtube, Prime95 | |
| Asus Zephyrus S15 GX502L | |
| Razer Blade 15 Advanced (Mid 2021) | |
| Alienware x15 RTX 3070 P111F | |
| Alienware m15 R4 RTX 3080 | |
| MSI GS66 Stealth 10UG | |
| Acer Predator Helios 300 PH315-53-786B | |
* ... más pequeño es mejor
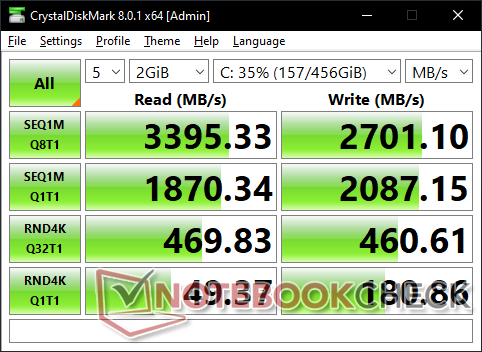
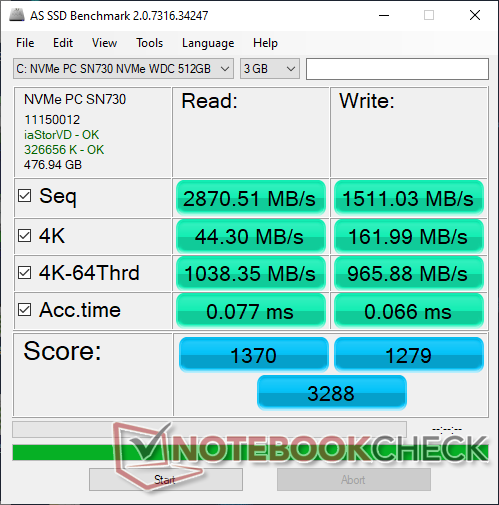
Dispositivos de almacenamiento - Soporte PCIe4 x4
Los usuarios pueden instalar hasta dos unidades M.2 en configuración RAID 0. Sin embargo, sólo una ranura es compatible con PCIe4, mientras que la otra puede soportar hasta PCIe3, como en el Alienware x17 R1. Los SKUs actuales del x15 R1 sólo se envían con SSDs PCIe3 NVMe, como los 512 GB WD SN730 en nuestra unidad de prueba. Las tasas de transferencia son generalmente comparables a las del Samsung PM981a que se encuentra en otras máquinas de juego de gama alta como la serie Razer Blade.
| Alienware x15 RTX 3070 P111F WDC PC SN730 SDBPNTY-512G | Alienware m15 R4 RTX 3080 2x WDC PC SN730 SDBPNTY-512G (RAID 0) | MSI GS66 Stealth 10UG WDC PC SN730 SDBPNTY-1T00 | Razer Blade 15 Advanced (Mid 2021) SSSTC CA6-8D1024 | Acer Predator Helios 300 PH315-53-786B Samsung PM981a MZVLB1T0HBLR | |
|---|---|---|---|---|---|
| AS SSD | 29% | 37% | 90% | 34% | |
| Seq Read (MB/s) | 2871 | 2888 1% | 2198 -23% | 5739 100% | 2792 -3% |
| Seq Write (MB/s) | 1511 | 2786 84% | 2596 72% | 4201 178% | 2311 53% |
| 4K Read (MB/s) | 44.3 | 41.98 -5% | 43.81 -1% | 53.8 21% | 48.34 9% |
| 4K Write (MB/s) | 162 | 108 -33% | 115.5 -29% | 179.2 11% | 93.9 -42% |
| 4K-64 Read (MB/s) | 1038 | 1396 34% | 1692 63% | 2959 185% | 1516 46% |
| 4K-64 Write (MB/s) | 966 | 1234 28% | 2162 124% | 1891 96% | 1940 101% |
| Access Time Read * (ms) | 0.077 | 0.056 27% | 0.056 27% | 0.027 65% | |
| Access Time Write * (ms) | 0.066 | 0.035 47% | 0.098 -48% | 0.154 -133% | 0.04 39% |
| Score Read (Points) | 1370 | 1727 26% | 1956 43% | 3587 162% | 1843 35% |
| Score Write (Points) | 1279 | 1621 27% | 2537 98% | 2490 95% | 2265 77% |
| Score Total (Points) | 3288 | 4227 29% | 5513 68% | 7821 138% | 5030 53% |
| Copy ISO MB/s (MB/s) | 1962 | 1868 -5% | 2236 14% | 3027 54% | 1921 -2% |
| Copy Program MB/s (MB/s) | 407.9 | 812 99% | 690 69% | 1177 189% | 581 42% |
| Copy Game MB/s (MB/s) | 1105 | 1596 44% | 1546 40% | 2170 96% | 1454 32% |
| CrystalDiskMark 5.2 / 6 | -1% | 4% | 81% | -29% | |
| Write 4K (MB/s) | 179.6 | 114.2 -36% | 163.1 -9% | 295.6 65% | 76.2 -58% |
| Read 4K (MB/s) | 49.21 | 43.77 -11% | 48.97 0% | 85.7 74% | 34.32 -30% |
| Write Seq (MB/s) | 2062 | 2607 26% | 4149 101% | 776 -62% | |
| Read Seq (MB/s) | 1849 | 2316 25% | 4203 127% | 2169 17% | |
| Write 4K Q32T1 (MB/s) | 462.9 | 464.5 0% | 338 -27% | 715 54% | 357.3 -23% |
| Read 4K Q32T1 (MB/s) | 470.2 | 546 16% | 475.6 1% | 709 51% | 429.6 -9% |
| Write Seq Q32T1 (MB/s) | 2702 | 3233 20% | 3090 14% | 4681 73% | 788 -71% |
| Read Seq Q32T1 (MB/s) | 3371 | 3473 3% | 3421 1% | 6905 105% | 3542 5% |
| Write 4K Q8T8 (MB/s) | 1375 | ||||
| Read 4K Q8T8 (MB/s) | 1447 | ||||
| Media total (Programa/Opciones) | 14% /
20% | 21% /
25% | 86% /
87% | 3% /
10% |
* ... más pequeño es mejor

Disk Throttling: DiskSpd Read Loop, Queue Depth 8
Rendimiento de la GPU
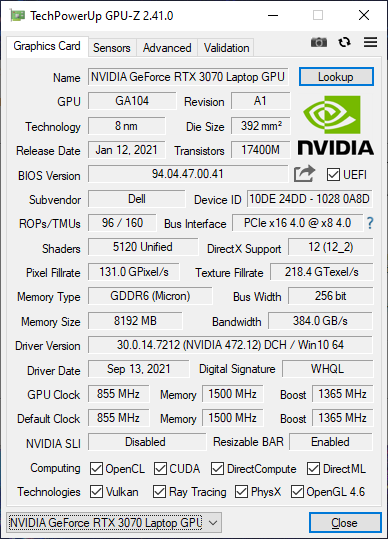
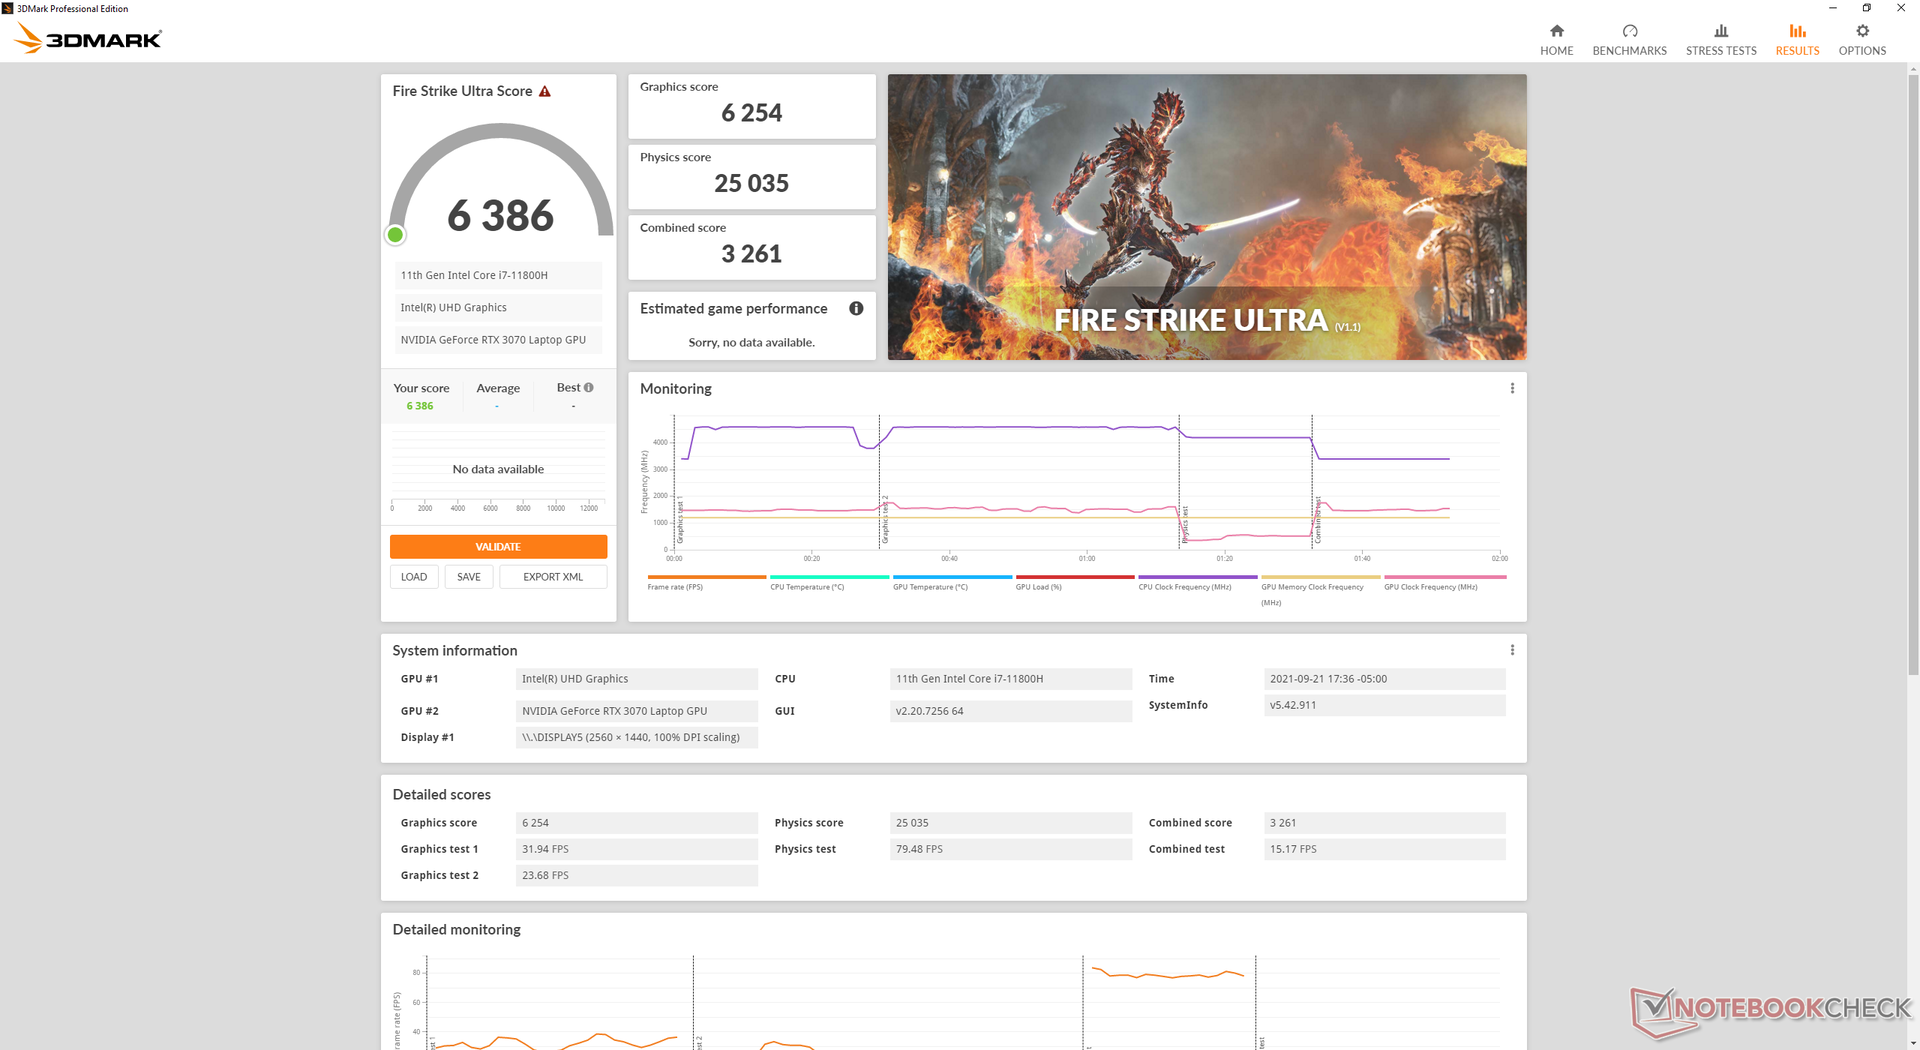
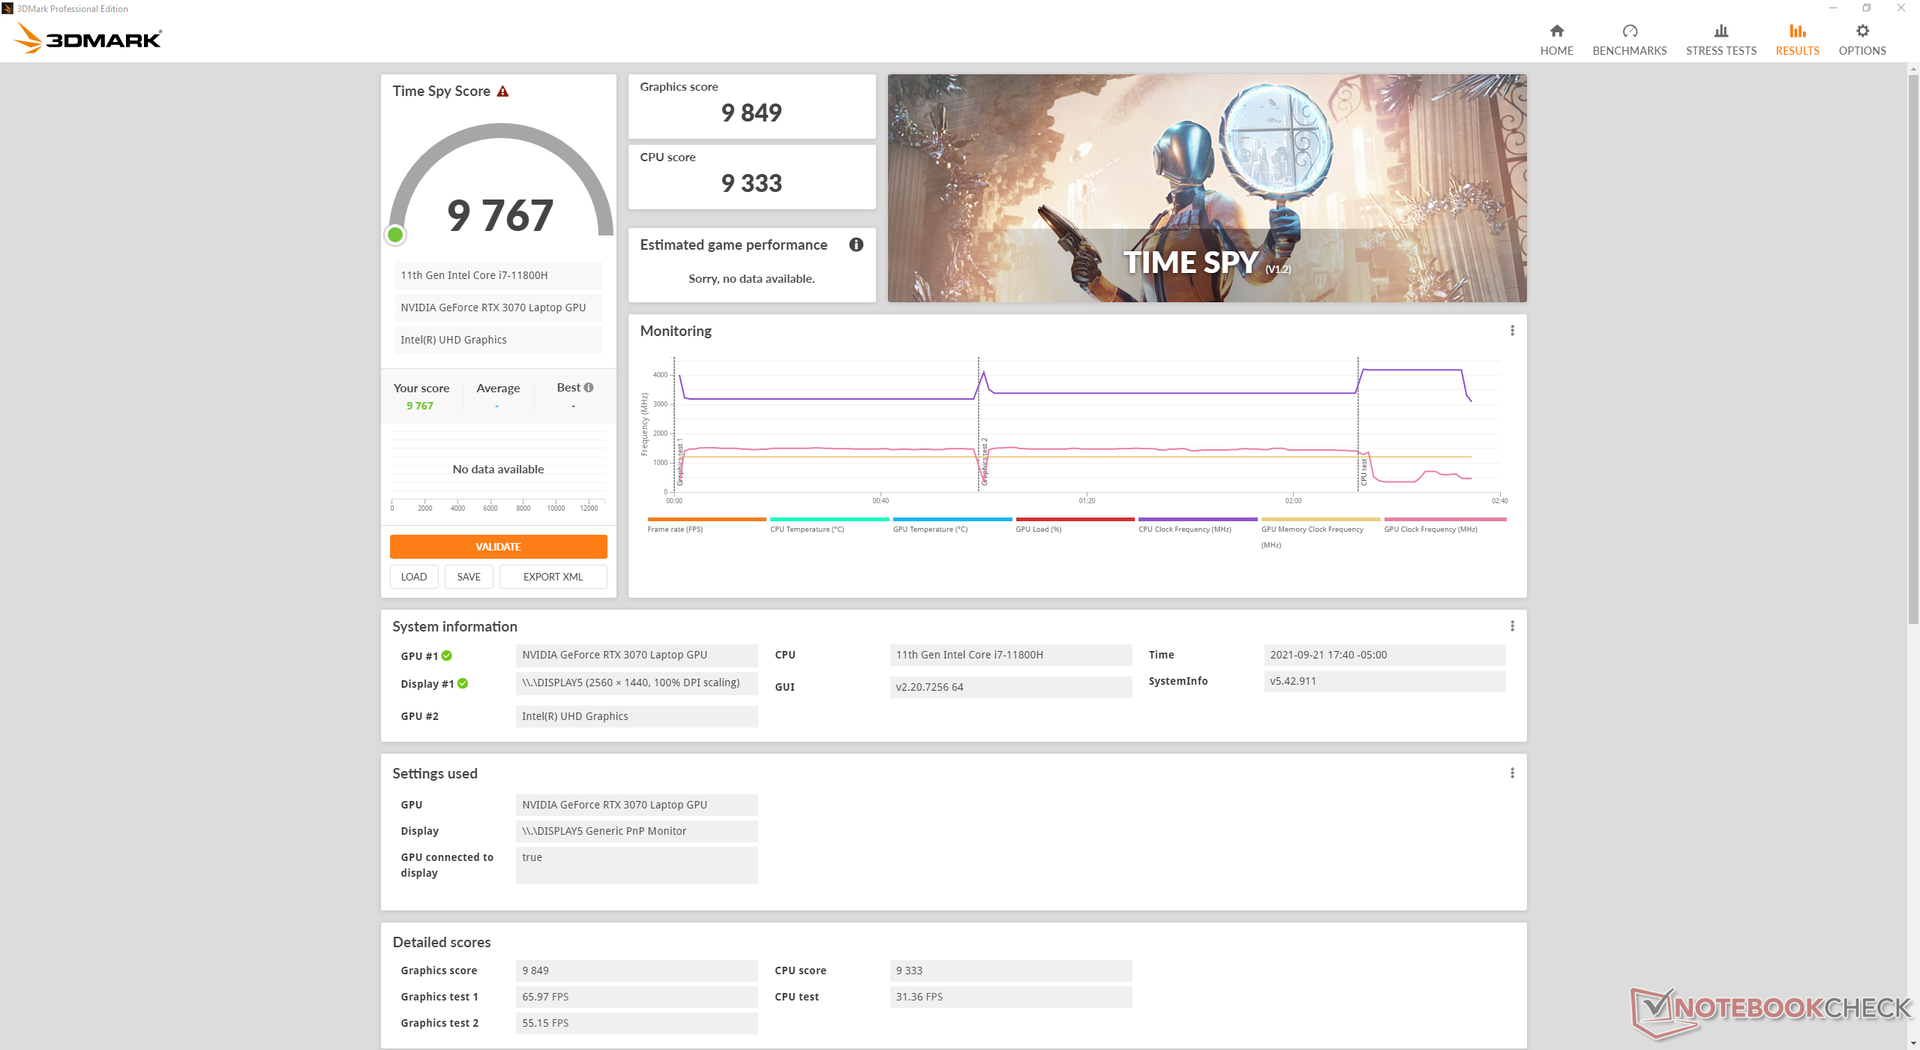
Nuestro móvil GeForce RTX 3070 rinde donde esperamos que lo haga en relación a otros portátiles con la misma GPU. Por desgracia, esto es algo decepcionante porque el antiguo Alienware m15 R4 con RTX 3070 superaba sistemáticamente a nuestro más reciente x15 R1 en un 10% en todas las pruebas 3DMark. Sospechamos que el objetivo TGP comparativamente más bajo del x15 R1 (110 W frente a 140 W) es responsable del rendimiento gráfico general más lento.
La actualización a la RTX 3080 No se espera que el rendimiento gráfico aumente significativamente con respecto a nuestra RTX 3070, especialmente porque tiene como objetivo el mismo límite de TGP de 110 W. En cambio, las mayores ganancias estarán entre las RTX 3060 y 3070.
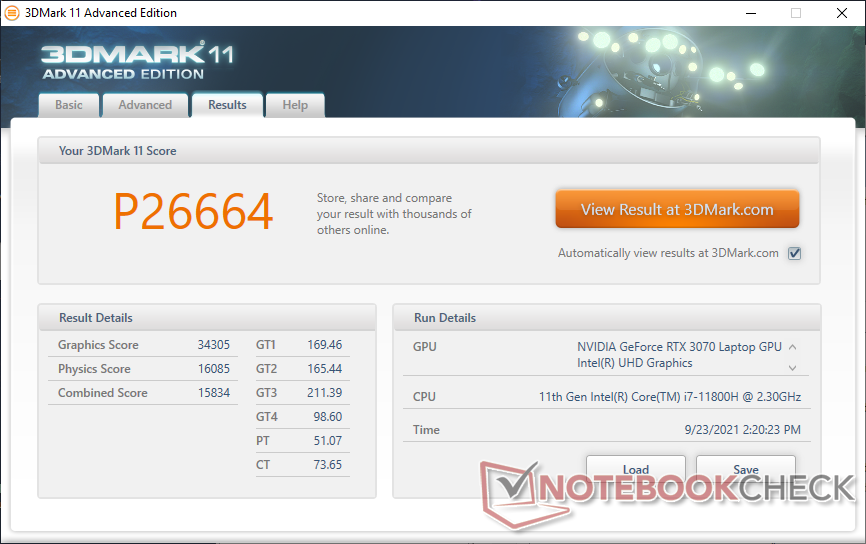
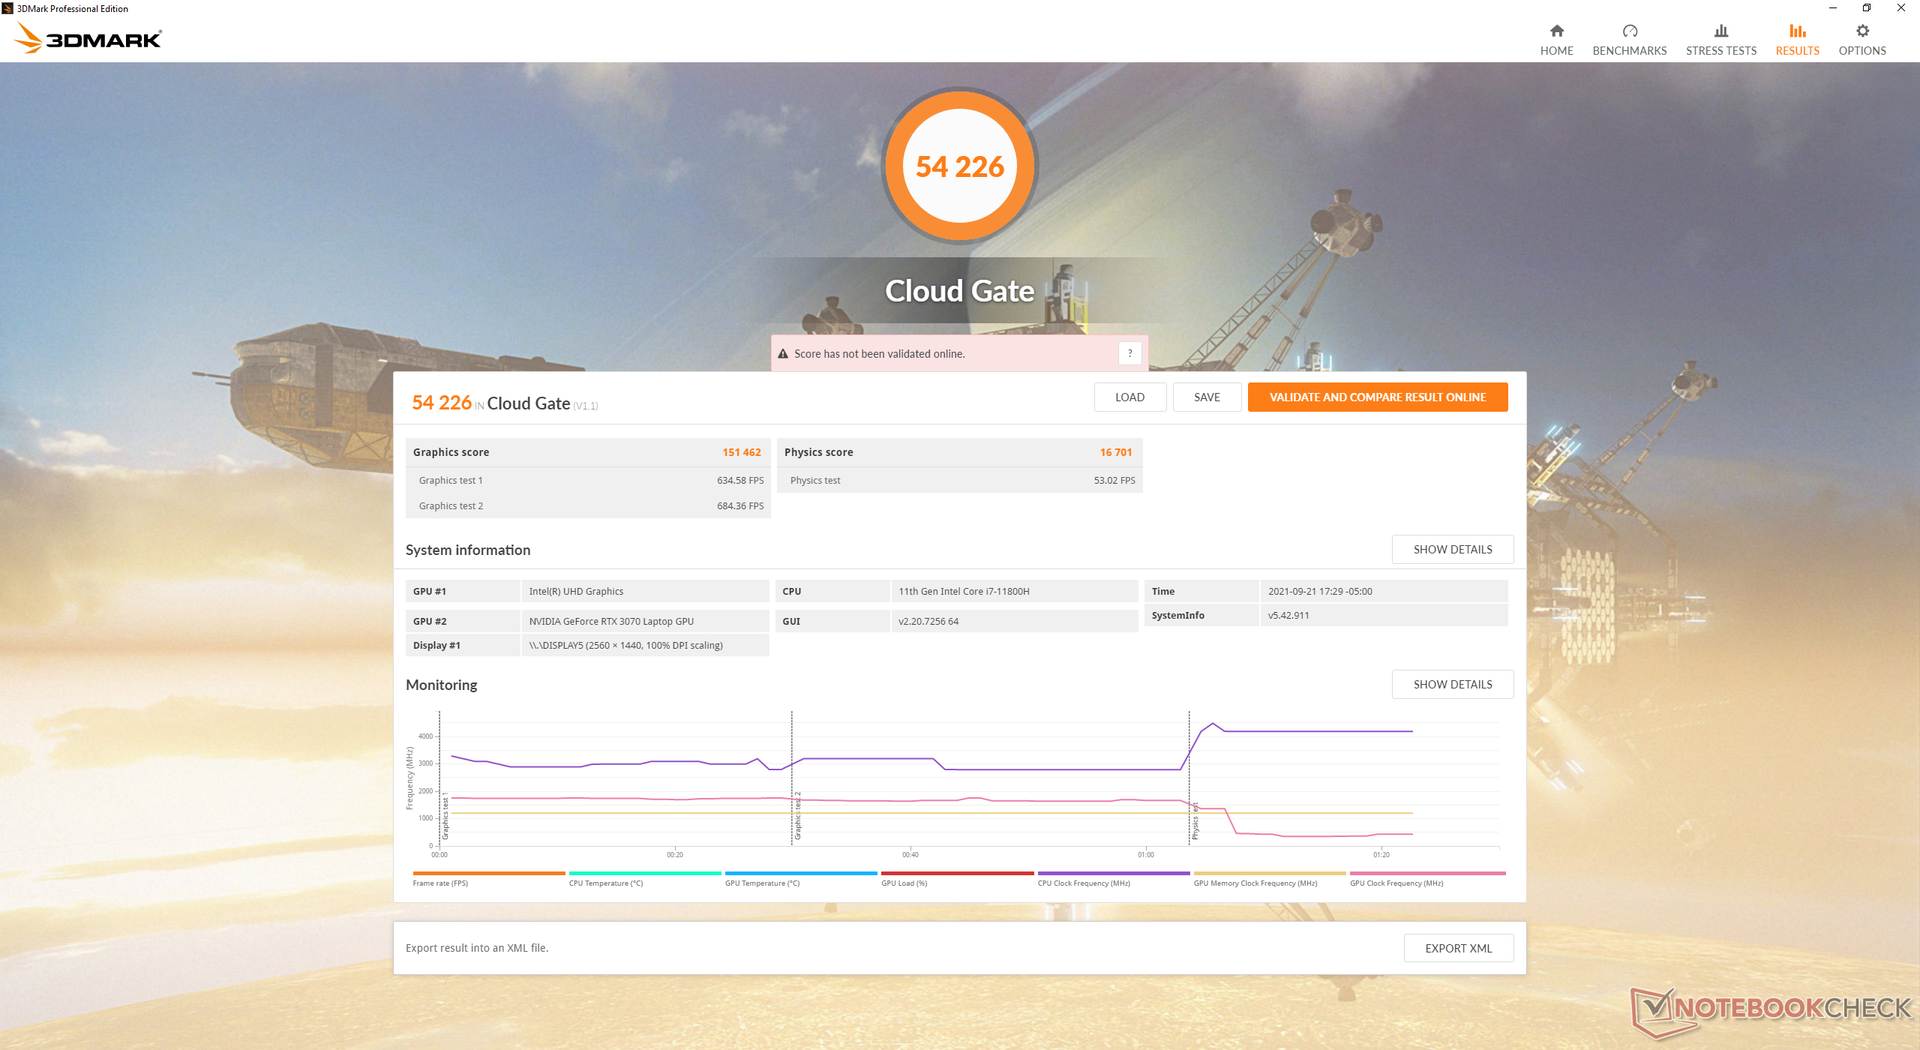
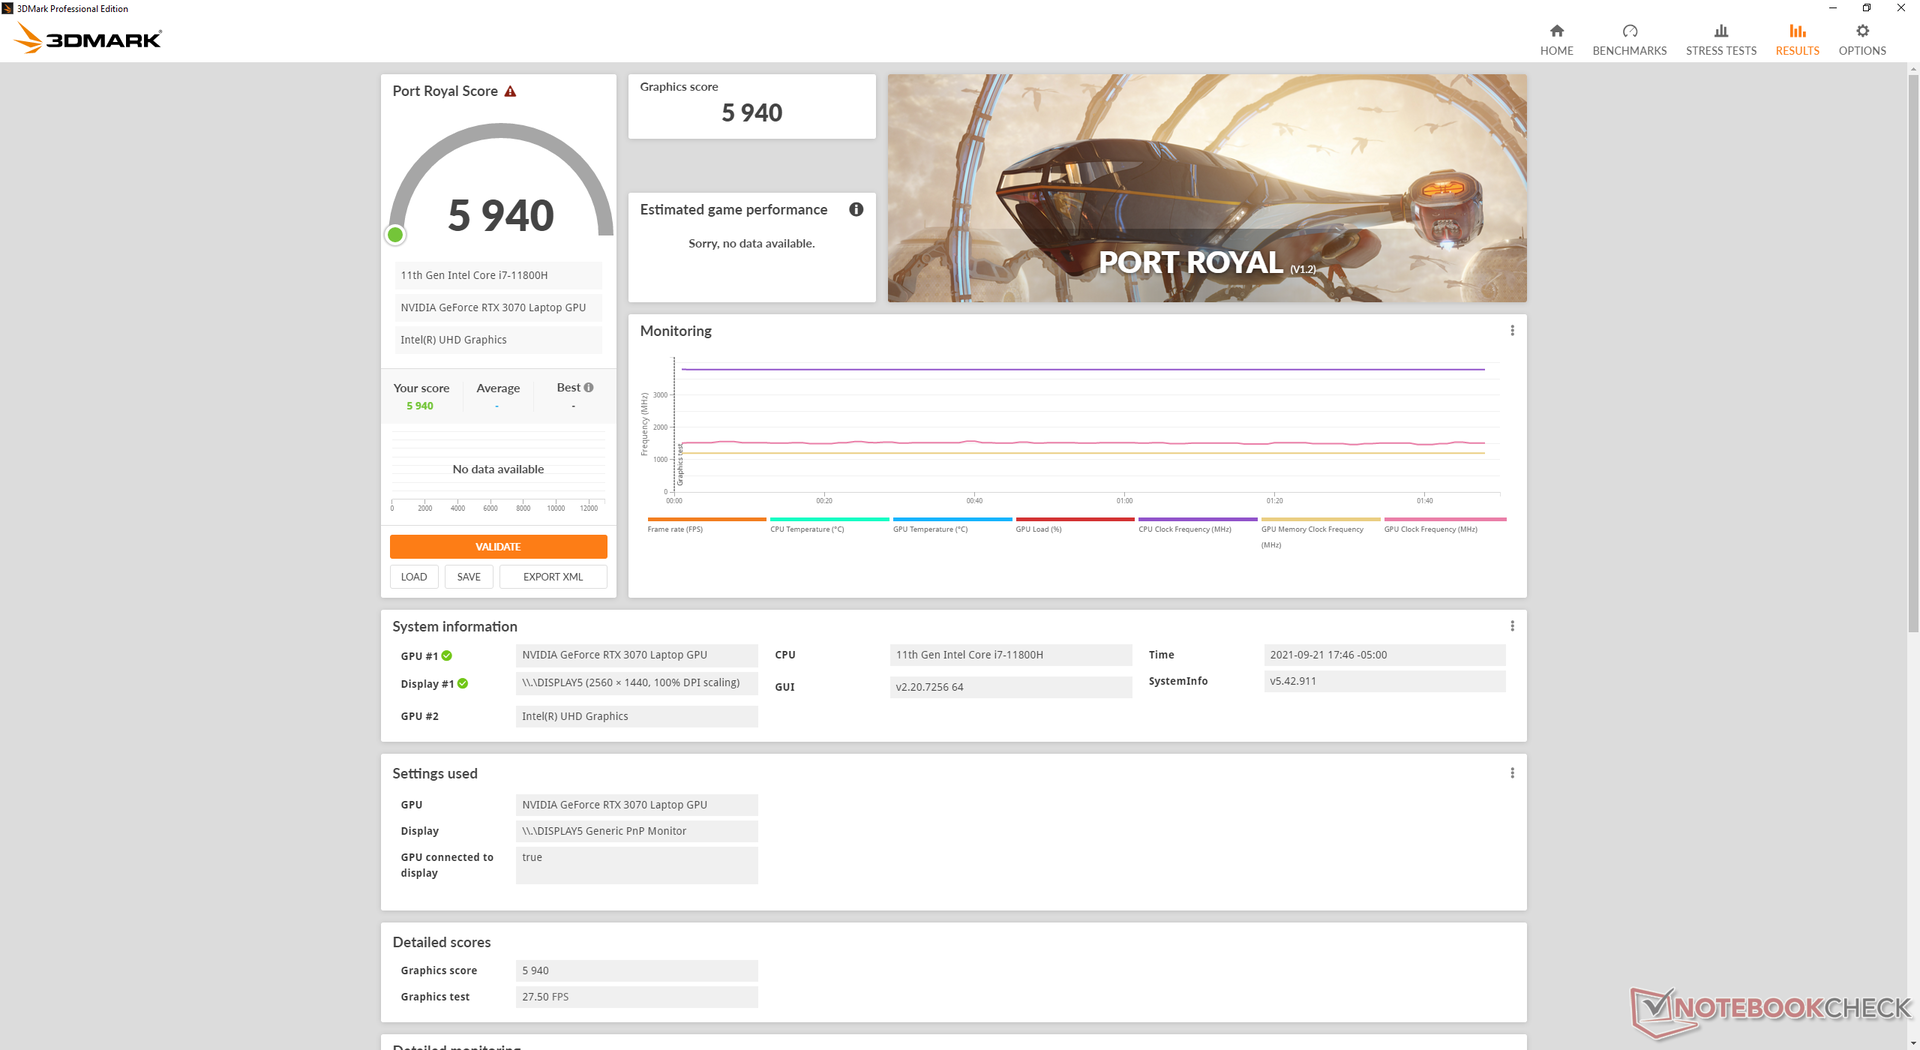
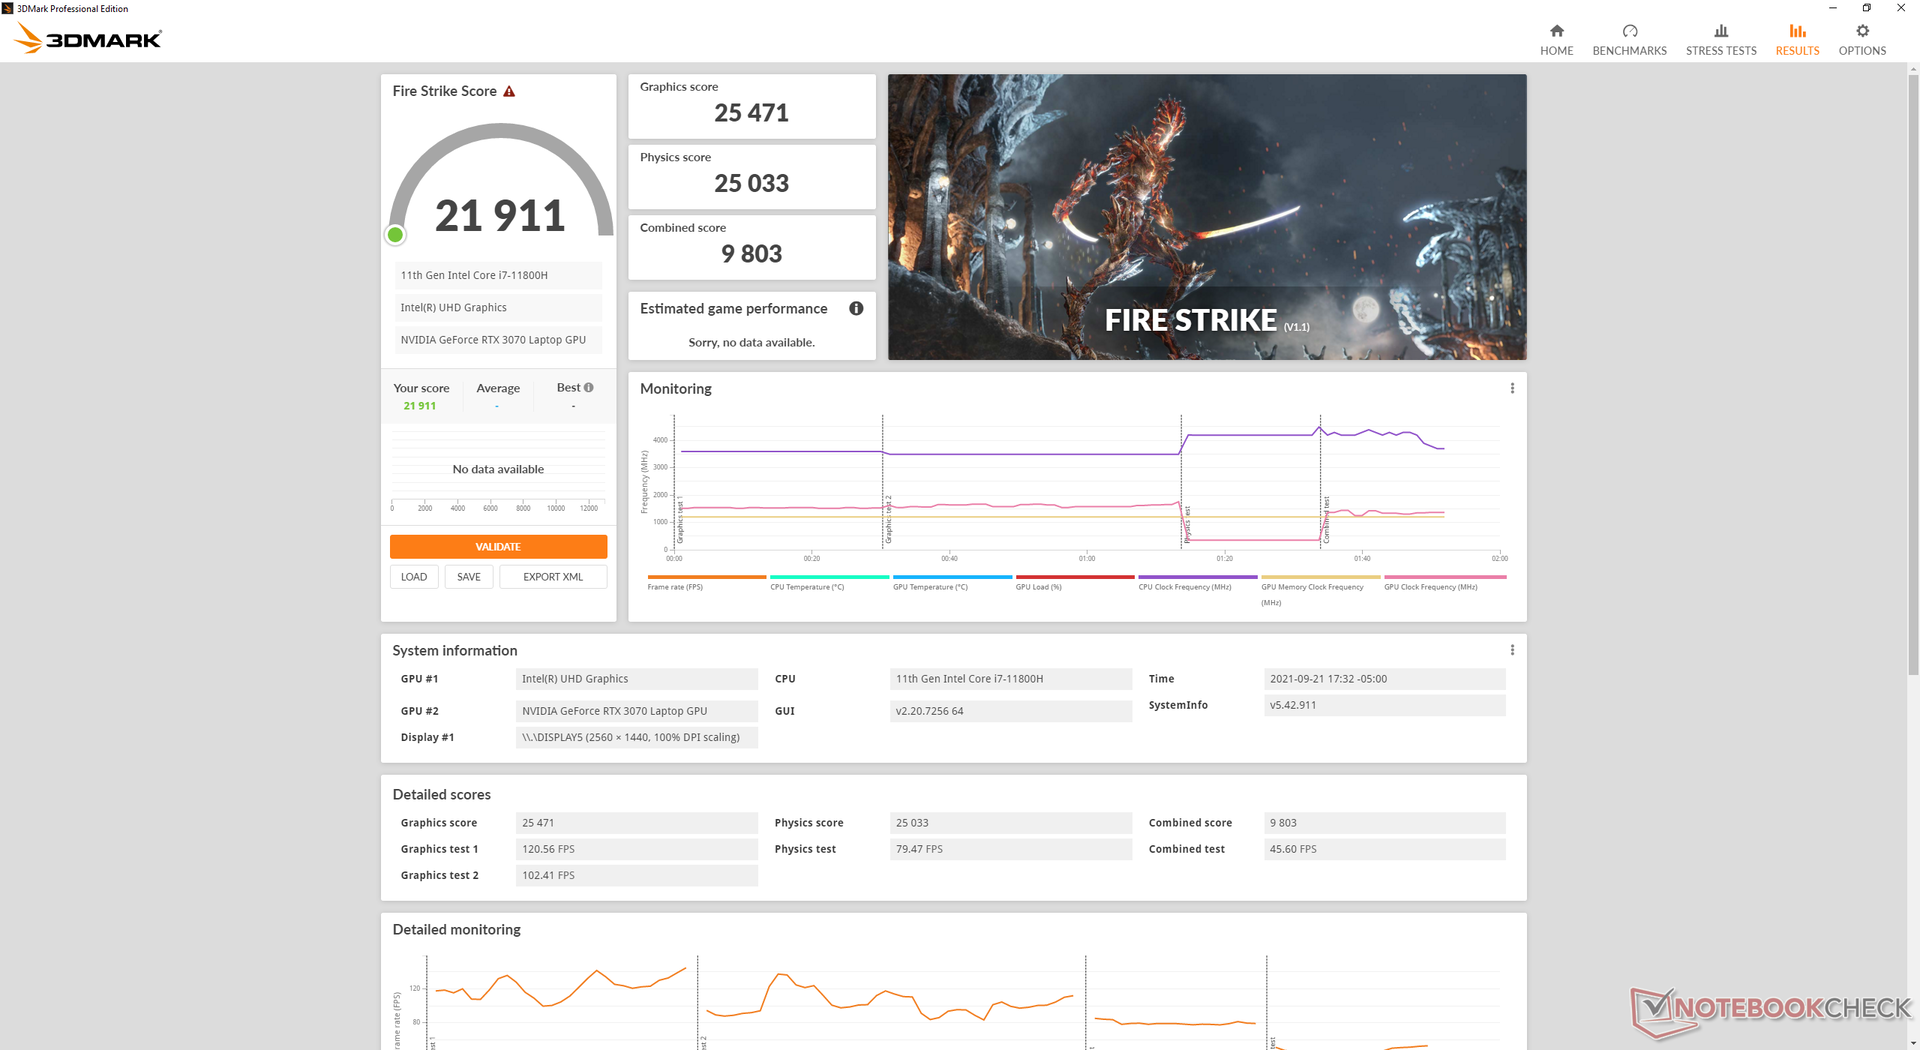
| 3DMark 11 Performance | 26664 puntos | |
| 3DMark Cloud Gate Standard Score | 54226 puntos | |
| 3DMark Fire Strike Score | 21911 puntos | |
| 3DMark Time Spy Score | 9767 puntos | |
ayuda | ||
Witcher 3 FPS Chart
| bajo | medio | alto | ultra | QHD | |
|---|---|---|---|---|---|
| GTA V (2015) | 181 | 174 | 166 | 95.8 | 83.7 |
| The Witcher 3 (2015) | 415.4 | 279.4 | 197.7 | 100.2 | |
| Dota 2 Reborn (2015) | 167 | 148 | 143 | 130 | |
| Final Fantasy XV Benchmark (2018) | 150 | 123 | 93.7 | 73.8 | |
| X-Plane 11.11 (2018) | 129 | 114 | 89.9 | ||
| Far Cry 5 (2018) | 143 | 125 | 118 | 113 | 96 |
| Strange Brigade (2018) | 467 | 253 | 206 | 178 | 132 |
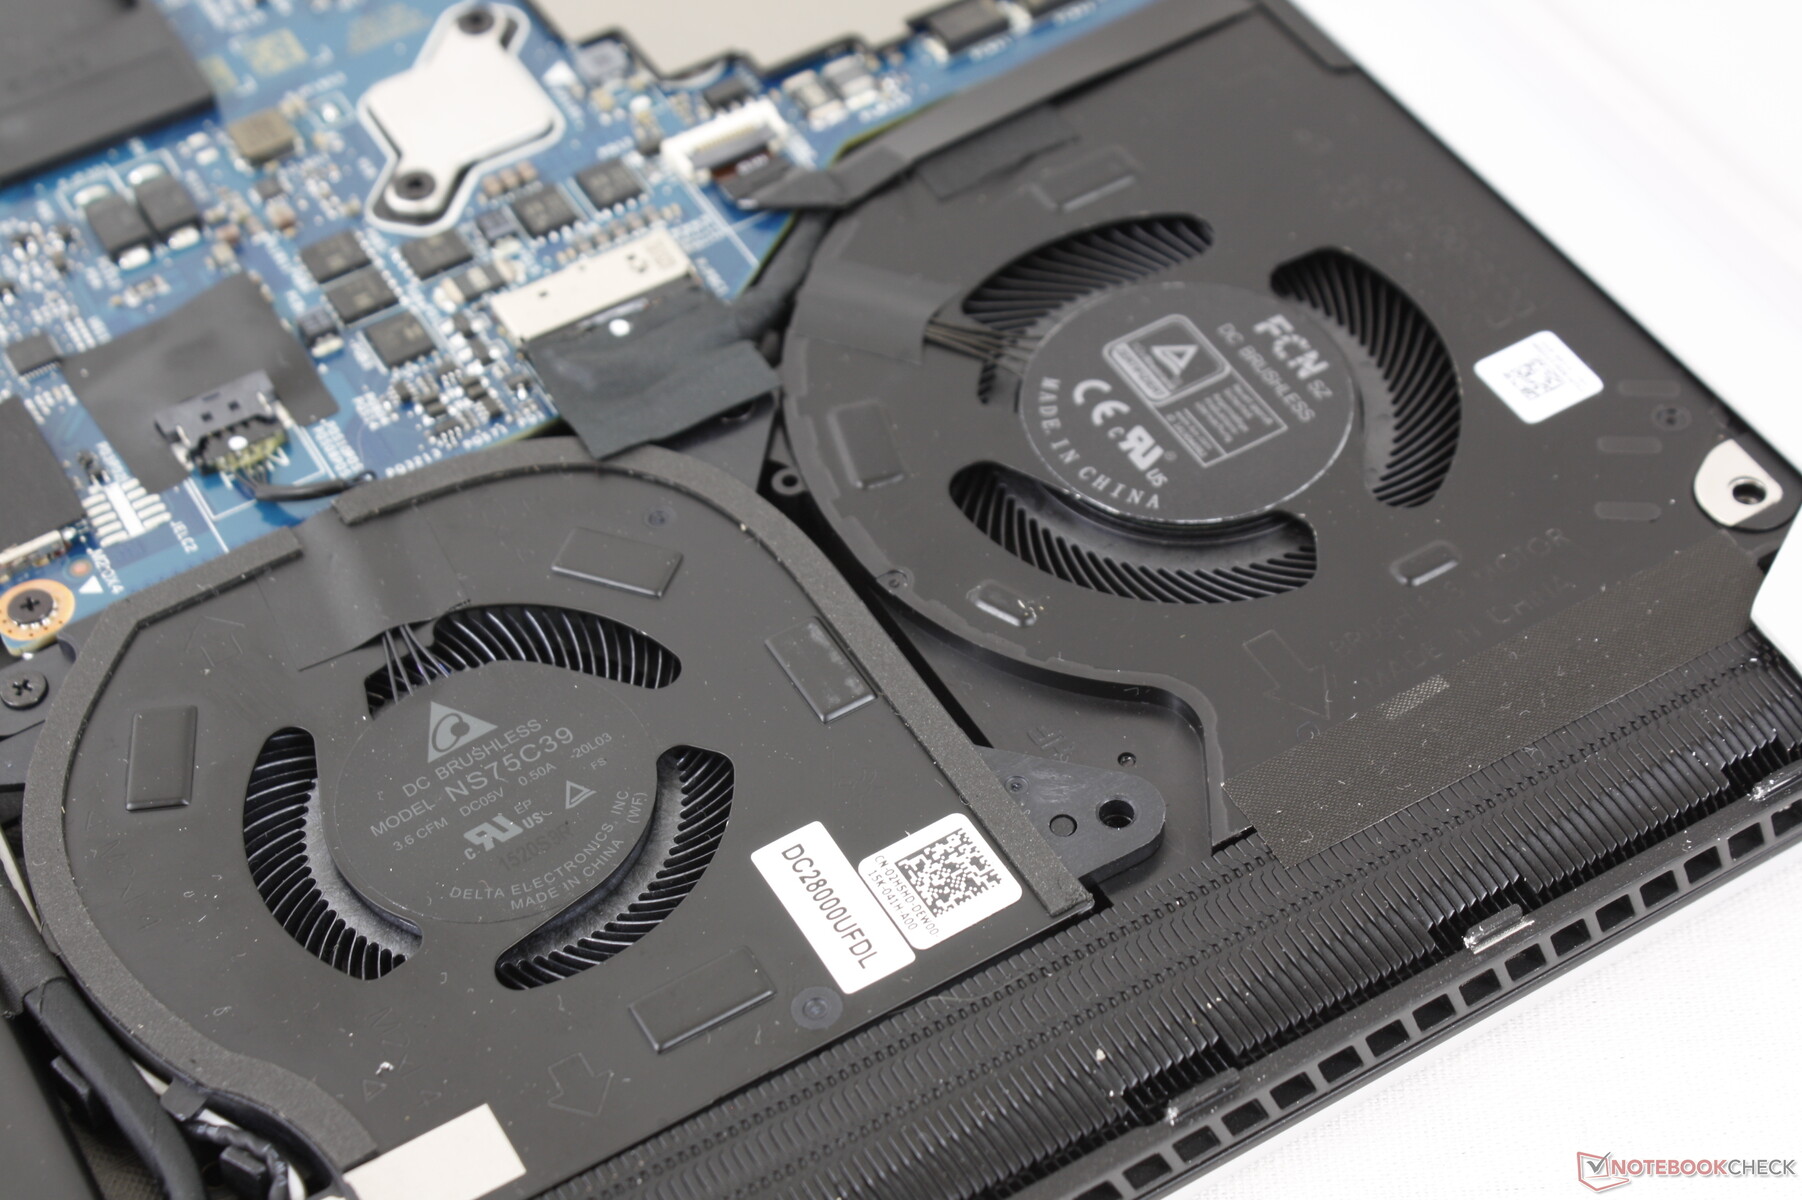
Emissions
Ruido del sistema: fuerte sólo cuando se juega
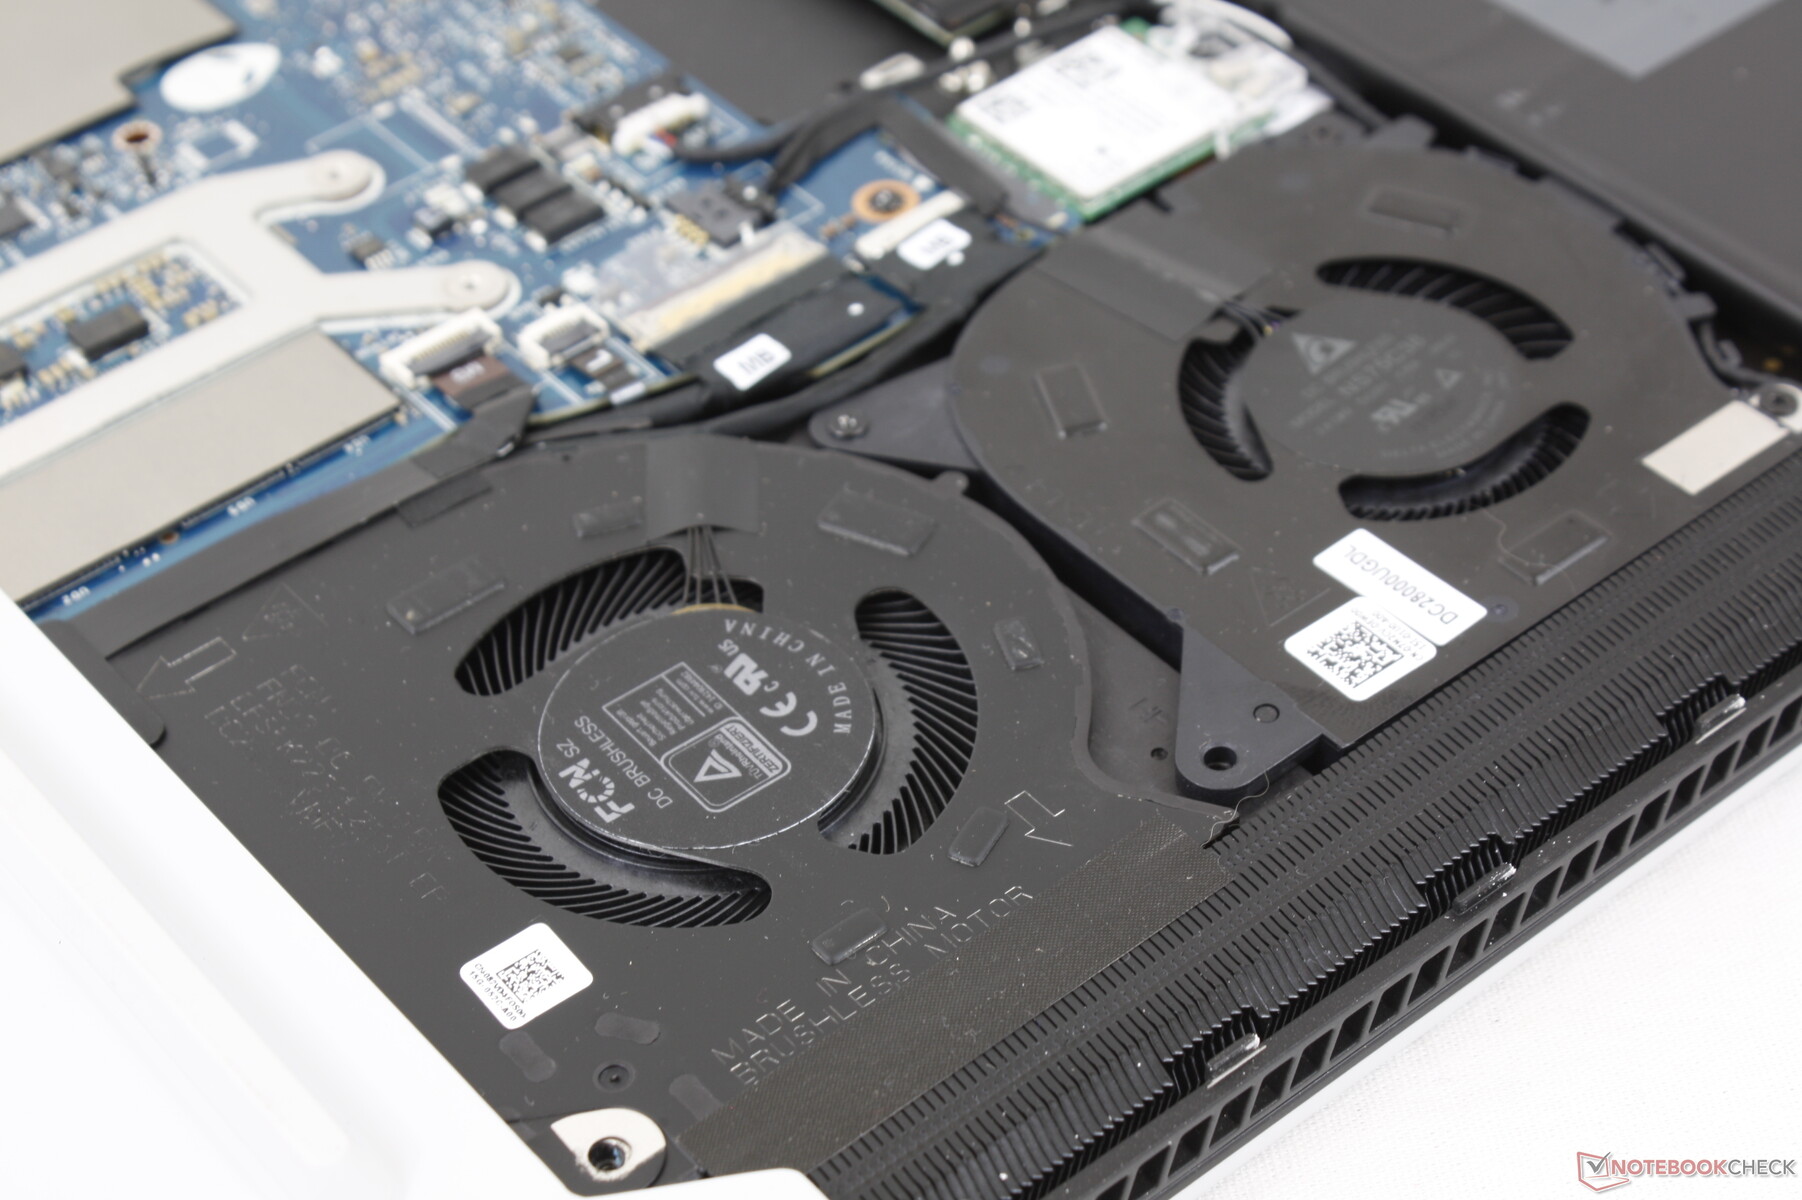
El Alienware x15 R1 usa la misma pasta térmica de galio-silicona para su CPU y los ajustes del ventilador del Centro de Comando Alienware (Silencio, Rendimiento y Velocidad Máxima) que se encuentran en el x17 R1. Las aplicaciones poco exigentes como la navegación web o el streaming de vídeo pueden inducir un ruido de ventilador de sólo 26 a 31 dB(A) contra un fondo silencioso de 24,1 dB(A) para ser mayormente imperceptible y mucho más silencioso que lo que observamos en el Alienware m15 R4 donde los ventiladores pulsarían más frecuentemente.
Cuando se juega, el ruido de los ventiladores se acerca a lo que registramos en el x17 R1 con casi 50 dB(A) en los modos Balanceado o Rendimiento. Si los ventiladores se ponen en modo Full Speed, el ruido máximo de los ventiladores aumenta a 55 dB(A). El x15 R1 no es necesariamente más silencioso o más ruidoso que la mayoría de los otros portátiles de juego de 15,6 pulgadas en este aspecto a pesar de tener más ventiladores que la mayoría.
| Alienware x15 RTX 3070 P111F GeForce RTX 3070 Laptop GPU, i7-11800H, WDC PC SN730 SDBPNTY-512G | Alienware m15 R4 RTX 3080 GeForce RTX 3080 Laptop GPU, i9-10980HK, 2x WDC PC SN730 SDBPNTY-512G (RAID 0) | MSI GS66 Stealth 10UG GeForce RTX 3070 Laptop GPU, i7-10870H, WDC PC SN730 SDBPNTY-1T00 | Razer Blade 15 Advanced (Mid 2021) GeForce RTX 3080 Laptop GPU, i7-11800H, SSSTC CA6-8D1024 | Asus Zephyrus S15 GX502L GeForce RTX 2070 Super Mobile, i7-10875H, WDC PC SN730 SDBPNTY-1T00 | Acer Predator Helios 300 PH315-53-786B GeForce RTX 3070 Laptop GPU, i7-10750H, Samsung PM981a MZVLB1T0HBLR | |
|---|---|---|---|---|---|---|
| Noise | -10% | -21% | -2% | -23% | -11% | |
| apagado / medio ambiente * (dB) | 24.1 | 25 -4% | 26.2 -9% | 25.1 -4% | 25 -4% | 25 -4% |
| Idle Minimum * (dB) | 26.6 | 25 6% | 34 -28% | 25.3 5% | 28 -5% | 25 6% |
| Idle Average * (dB) | 26.6 | 29 -9% | 34 -28% | 25.3 5% | 31 -17% | 27 -2% |
| Idle Maximum * (dB) | 26.6 | 33 -24% | 34 -28% | 25.3 5% | 36 -35% | 35 -32% |
| Load Average * (dB) | 30.9 | 48 -55% | 47.2 -53% | 42 -36% | 56 -81% | 46 -49% |
| Witcher 3 ultra * (dB) | 49.9 | 46 8% | 46.3 7% | 45.6 9% | 55 -10% | 49 2% |
| Load Maximum * (dB) | 53.5 | 49 8% | 58.2 -9% | 51.6 4% | 57 -7% | 51 5% |
* ... más pequeño es mejor
Ruido
| Ocioso |
| 26.6 / 26.6 / 26.6 dB(A) |
| Carga |
| 30.9 / 53.5 dB(A) |
 | ||
30 dB silencioso 40 dB(A) audible 50 dB(A) ruidosamente alto |
||
min: | ||
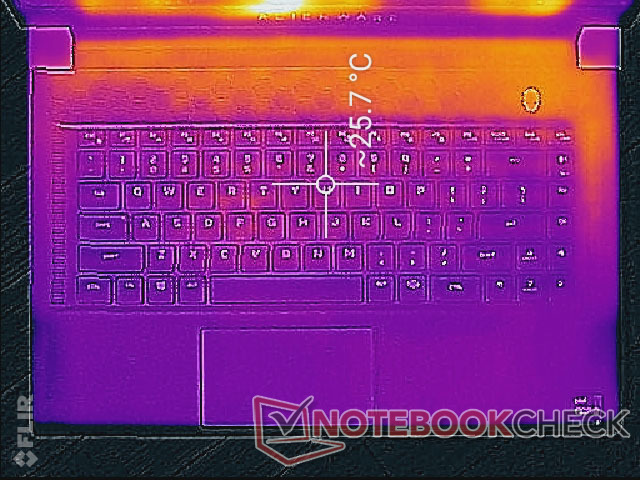
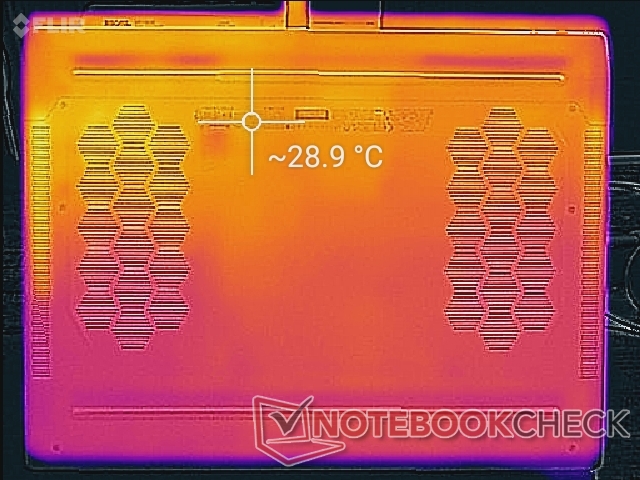
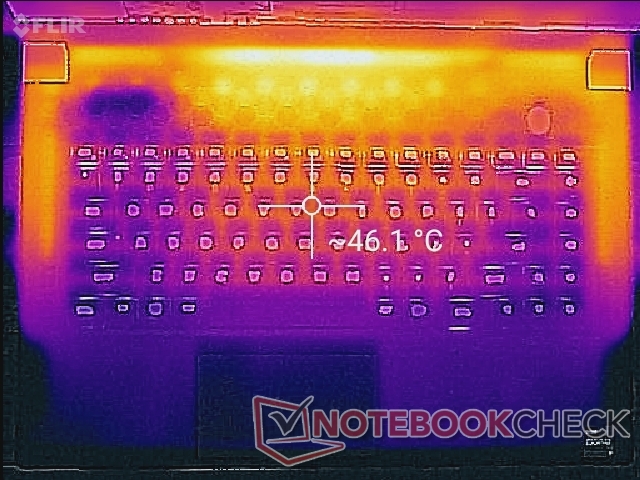
Temperatura - Trasero caliente
Los antiguos portátiles Alienware m15 tenían reposamanos muy calientes que se acercaban a los 40 C cuando se ejecutaban juegos. Afortunadamente, los descansos de las palmas en el x15 R1 son significativamente más fríos en comparación por cerca de 8 C para manos y dedos más cómodos. Ten en cuenta que aunque las teclas WASD no están tan calientes como antes, las superficies entre los bordes del chasis y los bordes del teclado pueden estar muy calientes ya que hay tubos de calor de cobre debajo.
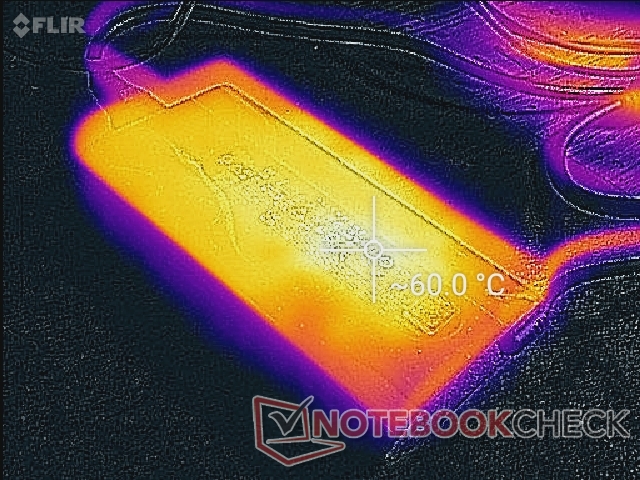
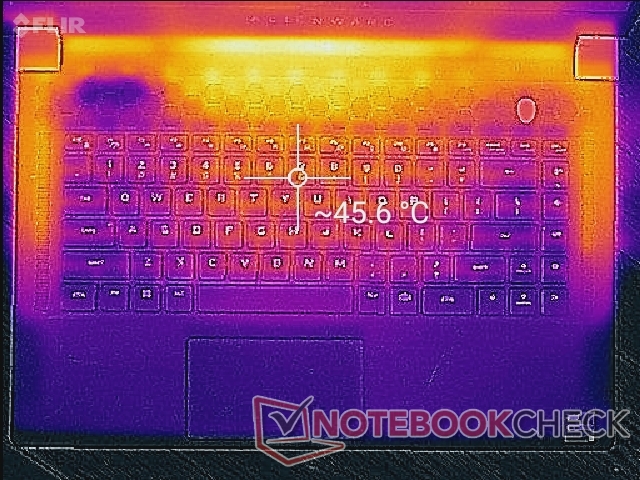
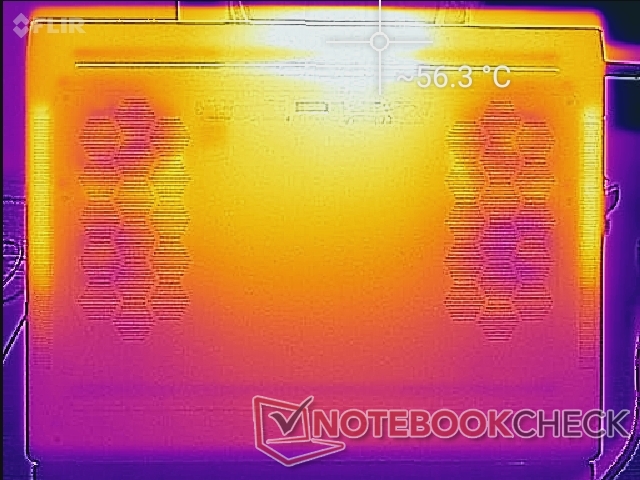
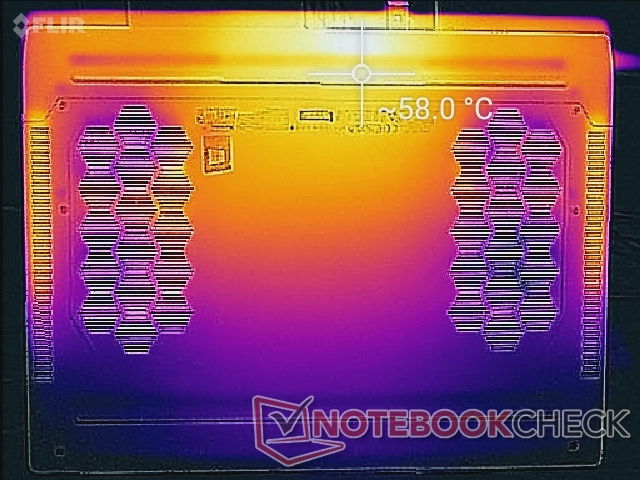
Los puntos calientes en la parte superior e inferior del chasis pueden alcanzar casi 60 C cada uno, que son similares a los máximos que registramos en el antiguo diseño m15. Afortunadamente, estos puntos están hacia la parte trasera donde es poco probable que las manos toquen.
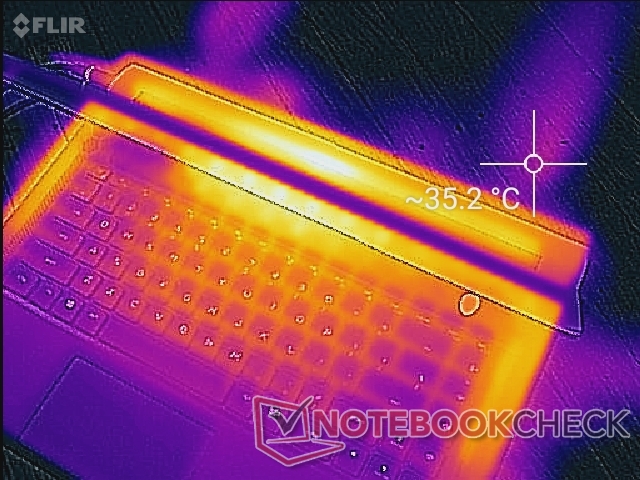
(-) La temperatura máxima en la parte superior es de 59.2 °C / 139 F, frente a la media de 40.4 °C / 105 F, que oscila entre 21.2 y 68.8 °C para la clase Gaming.
(-) El fondo se calienta hasta un máximo de 58 °C / 136 F, frente a la media de 43.2 °C / 110 F
(+) En reposo, la temperatura media de la parte superior es de 26.2 °C / 79# F, frente a la media del dispositivo de 33.9 °C / 93 F.
(-) Jugando a The Witcher 3, la temperatura media de la parte superior es de 43.2 °C / 110 F, frente a la media del dispositivo de 33.9 °C / 93 F.
(+) Los reposamanos y el panel táctil alcanzan como máximo la temperatura de la piel (32.2 °C / 90 F) y, por tanto, no están calientes.
(-) La temperatura media de la zona del reposamanos de dispositivos similares fue de 28.8 °C / 83.8 F (-3.4 °C / -6.2 F).
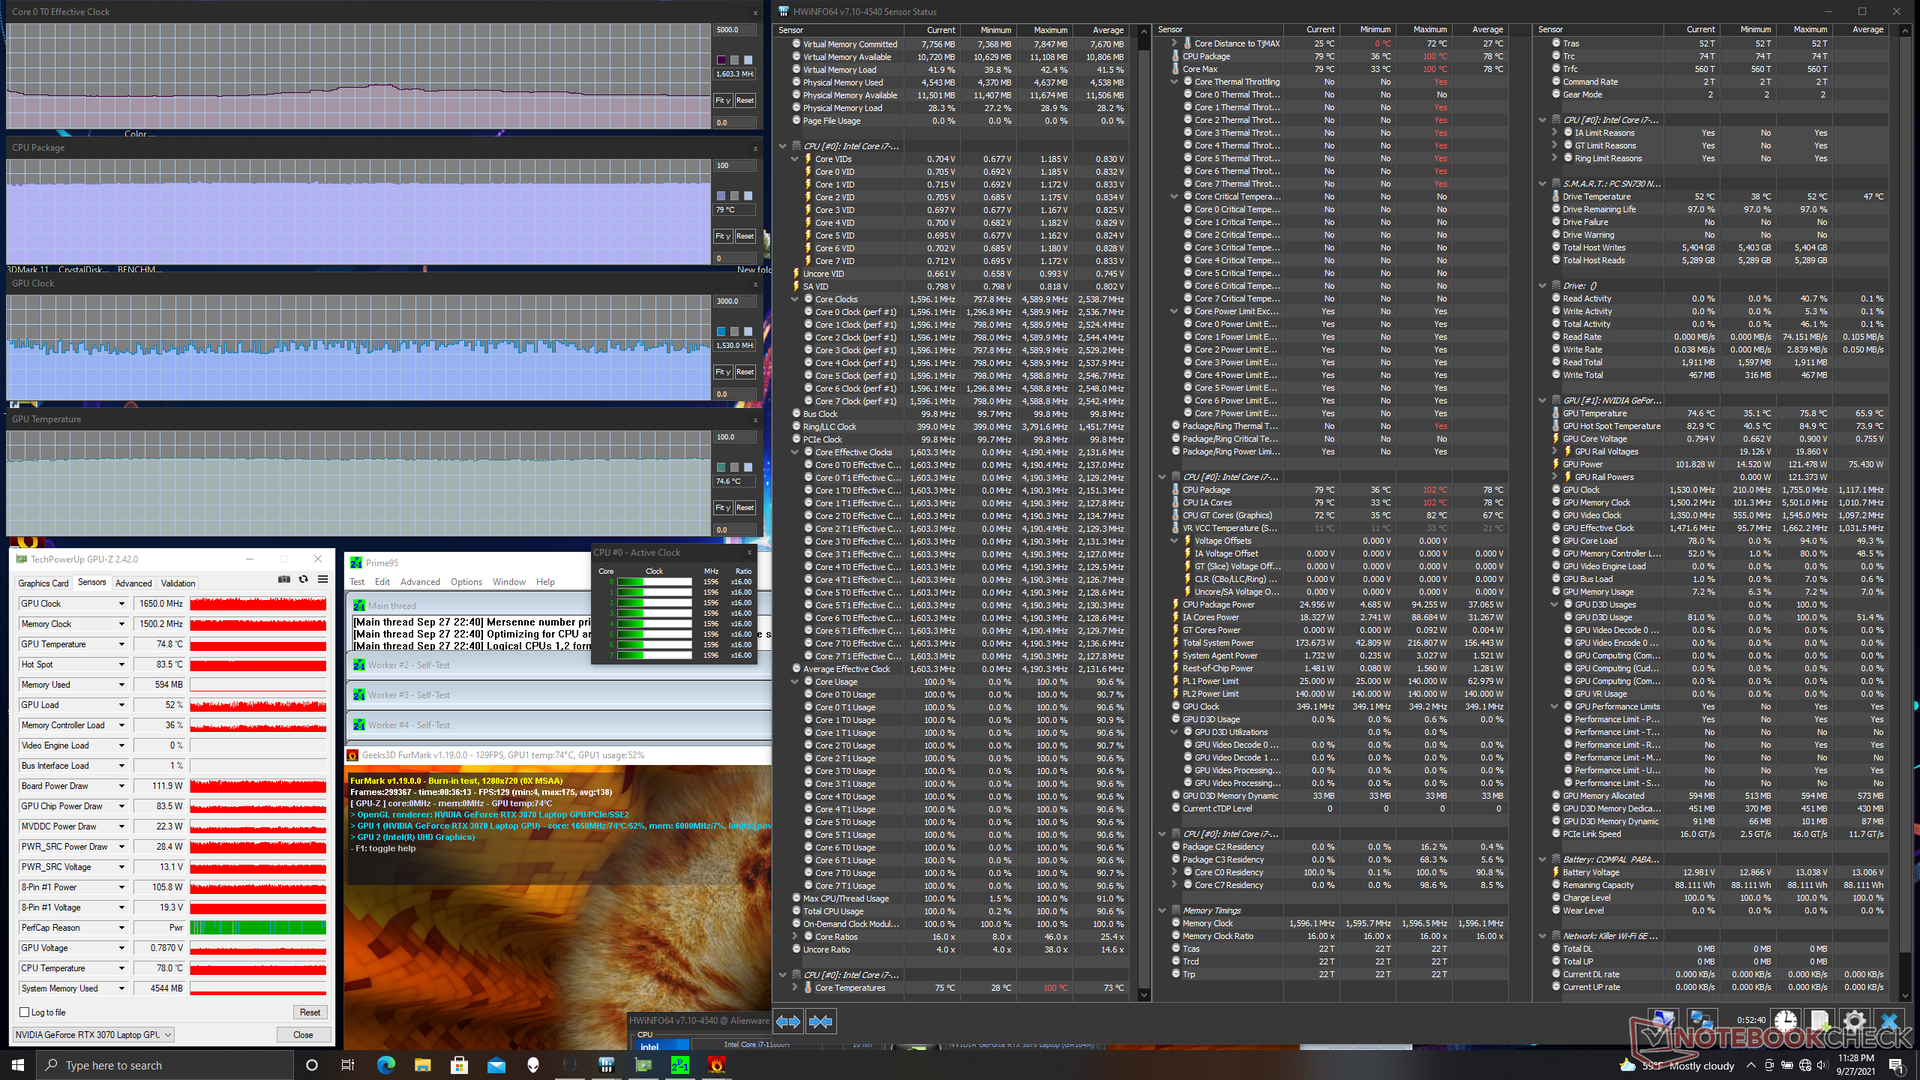
Prueba de esfuerzo
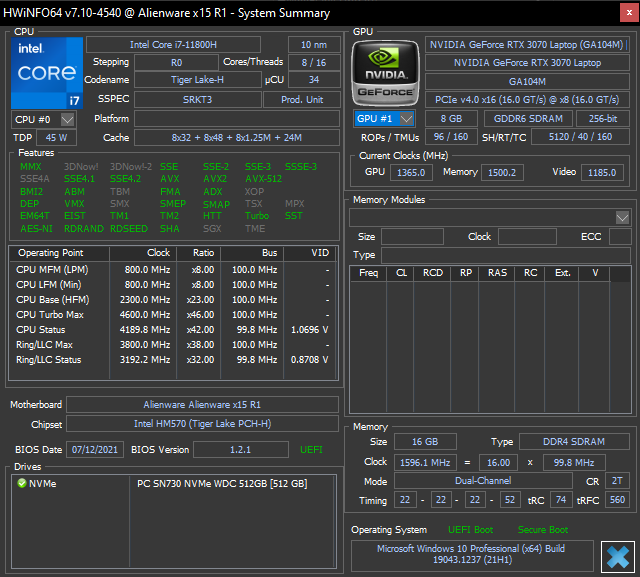
Cuando se ejecuta Prime95 para estresar a la CPU, las velocidades de reloj y la temperatura ciclan entre 3,5 y 4,2 GHz y entre 90 C y 100 C, respectivamente, con una potencia del paquete de la CPU que oscila entre 79 W y 95 W. Este comportamiento cíclico también puede observarse en el Alienware x17 R1 cuando se somete a las mismas condiciones. El procesador funciona más rápido y más caliente que en la mayoría de los portátiles con la misma CPU, como el Razer Blade 15 Modelo Avanzado donde su CPU i7-11800H se estabiliza a "sólo" 2,9 GHz y 83 C
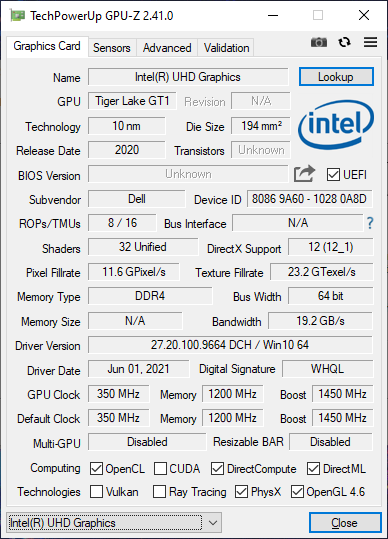
La GPU aquí se estabilizaría a 1605 MHz y 74 C cuando se ejecuta Witcher 3respectivamente, en comparación con los 1680 MHz y 80 C del Alienware m15 R4 RTX 3070. La velocidad de reloj de la memoria, en particular, es notablemente más rápida en la antigua m15 R4 en comparación con nuestra nueva x15 R1 (1750 MHz frente a 1500 MHz según GPU-Z). Los relojes ligeramente más rápidos en el modelo más antiguo de Alienware tienen sentido teniendo en cuenta los resultados ligeramente más rápidos de 3DMark mencionados anteriormente.
El TGP se estabiliza en 108 W cuando se ejecuta Witcher 3 lo que está muy cerca del objetivo de 110 W máximo. Dell valora la GPU a 90 W con un turbo de 20 W, pero parece que el chasis no tiene problemas para mantener un nivel de rendimiento cercano al rango superior del chip gráfico cuando se juega.
Funcionar con batería limitará mucho el rendimiento gráfico. Una prueba de Fire Strike en baterías devolvería puntuaciones de Física y Gráficos de 24234 y 16281 puntos, respectivamente, comparado con 25033 y 25471 puntos cuando está conectado a la red.
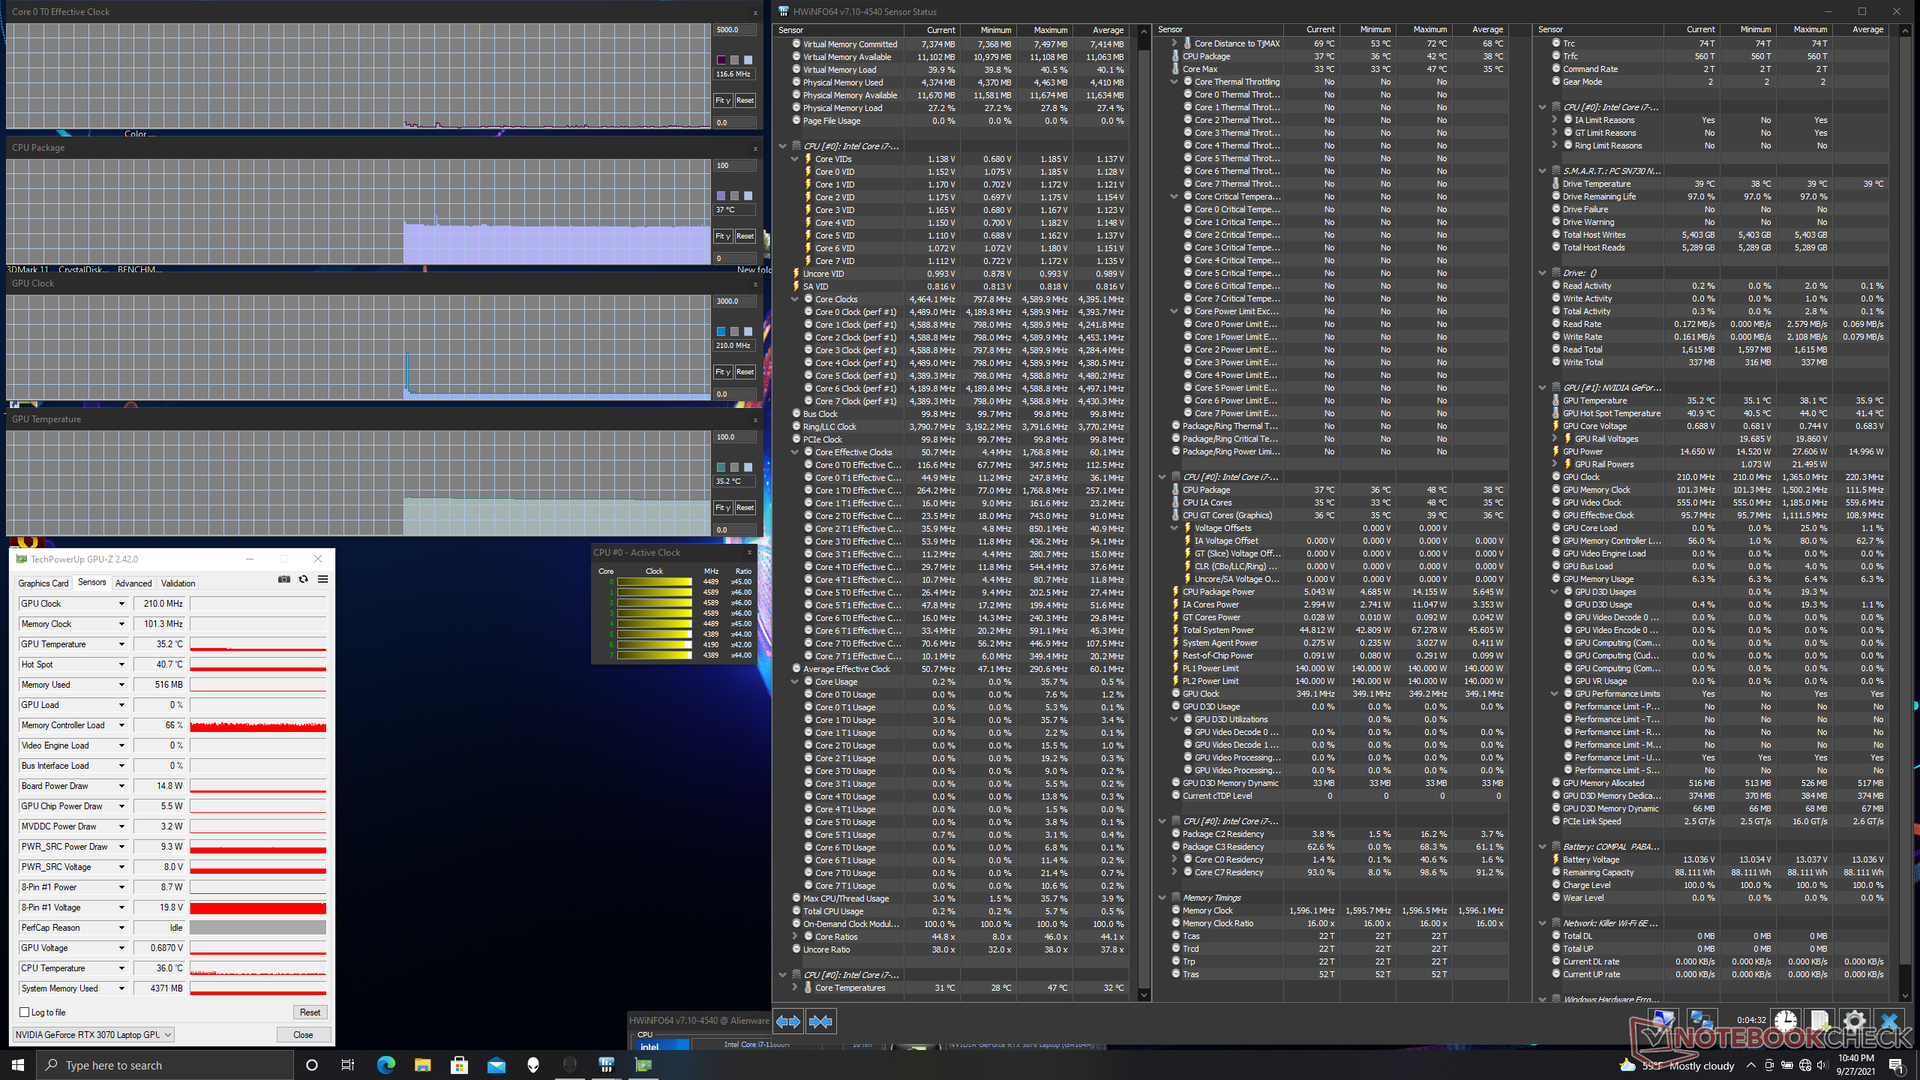
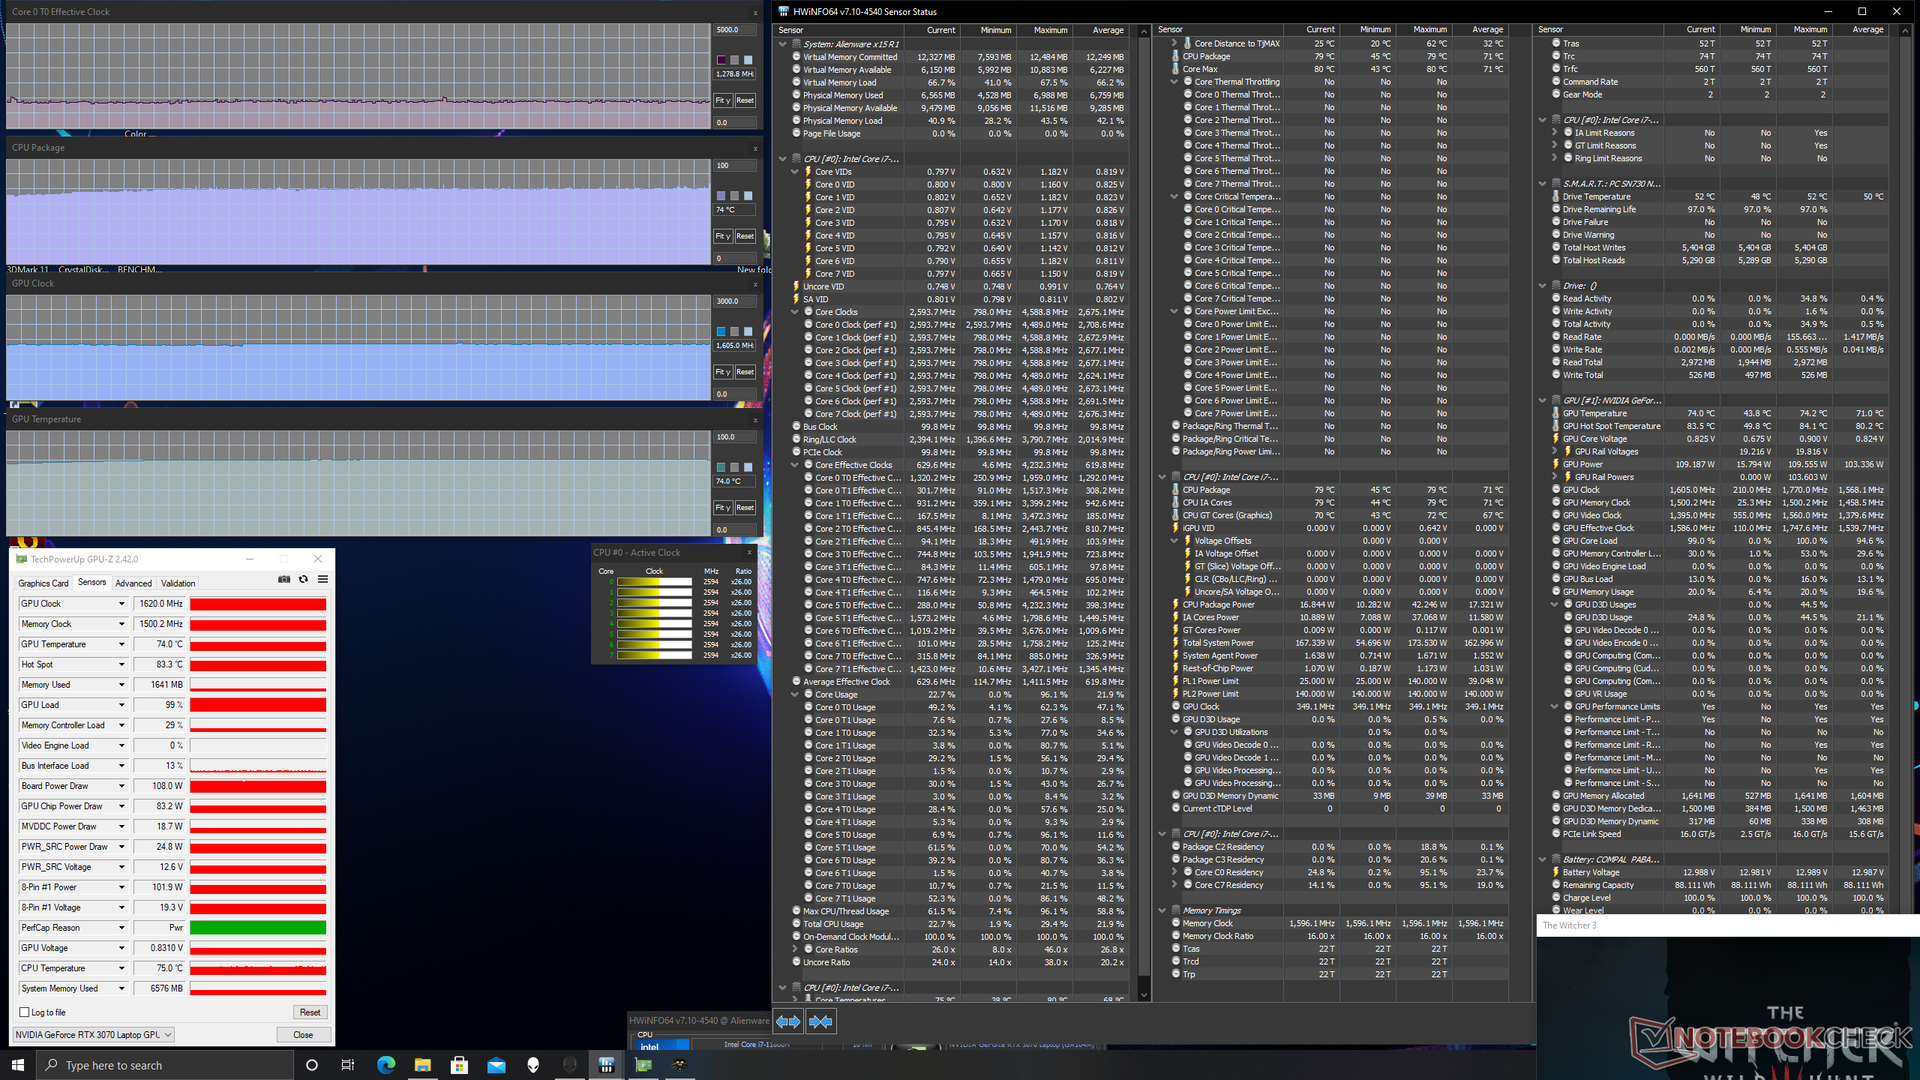
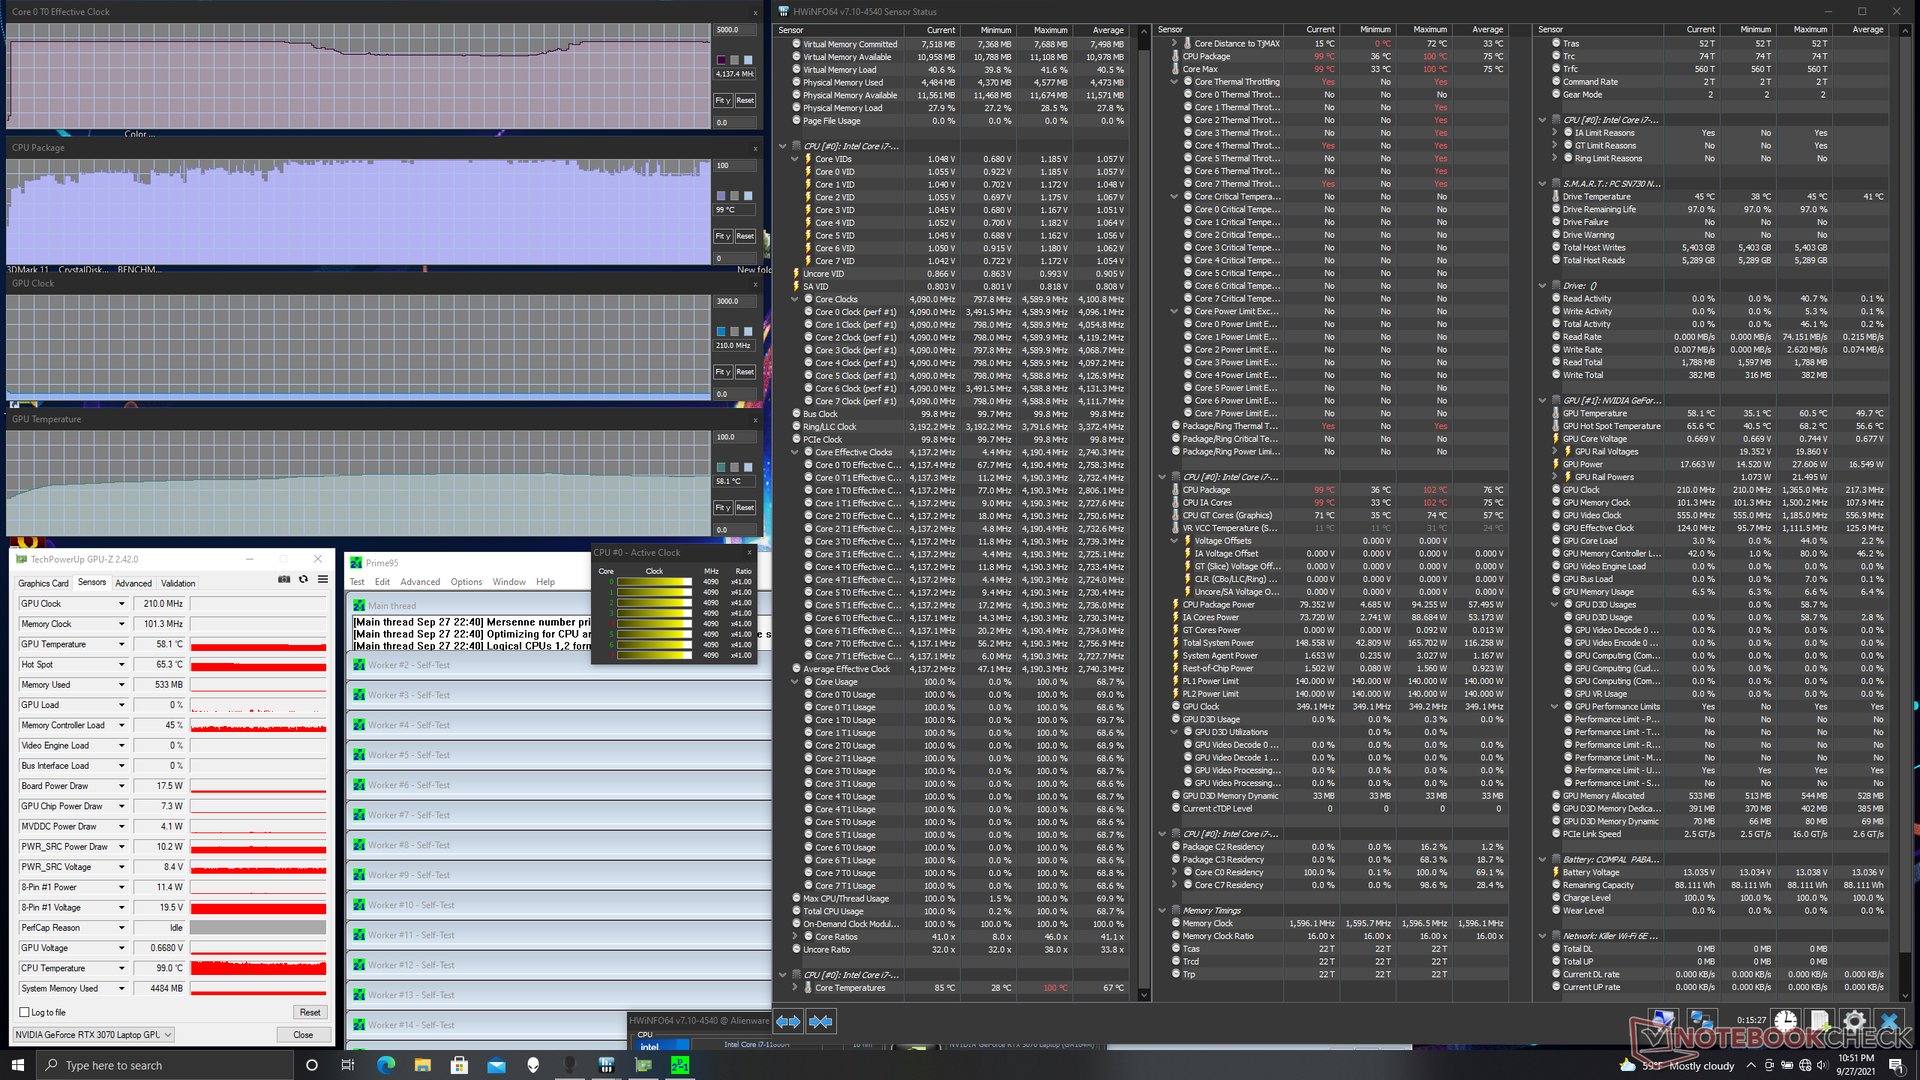
| Relojde la CPU(GHz) | Reloj dela GPU(MHz) | Temperatura media de la CPU (°C) | Temperaturamediade la GPU (°C) | |
| Sistema en reposo | 37 | 35 | ||
| EstrésPrime95 | 3,5 - 4,2 | 90 - 100 | ||
| Estrés de Prime95+ FurMark | 1,6 - 2,0 | 79 | ~1530 | 75 |
| Witcher 3 Stress | 2.6 | 1605 | 74 | 74 |
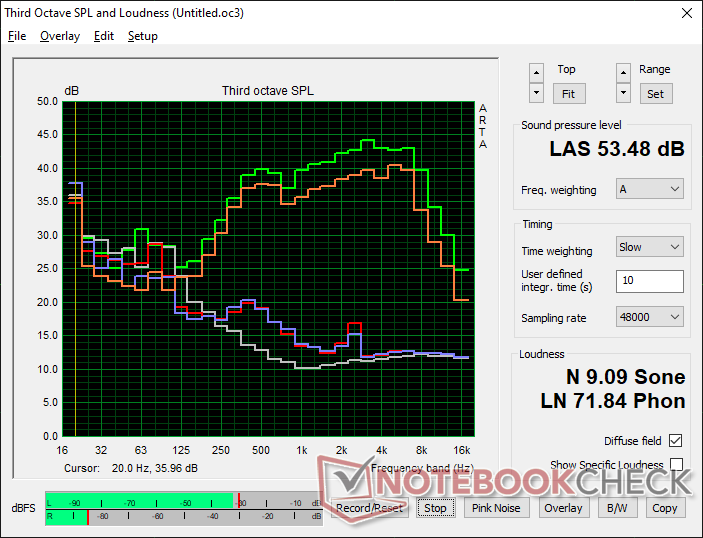
Altavoces: calidad de audio similar a la de un ultrabook
 cerca de las esquinas delanteras. La calidad de audio es decente, pero carece tanto de volumen como de empuje")

Alienware x15 RTX 3070 P111F análisis de audio
(+) | los altavoces pueden reproducir a un volumen relativamente alto (#82.7 dB)
Graves 100 - 315 Hz
(-) | casi sin bajos - de media 24.2% inferior a la mediana
(±) | la linealidad de los graves es media (11.8% delta a frecuencia anterior)
Medios 400 - 2000 Hz
(±) | medias más altas - de media 10.3% más altas que la mediana
(±) | la linealidad de los medios es media (8.8% delta respecto a la frecuencia anterior)
Altos 2 - 16 kHz
(±) | máximos más altos - de media 6.1% más altos que la mediana
(±) | la linealidad de los máximos es media (8.6% delta a frecuencia anterior)
Total 100 - 16.000 Hz
(±) | la linealidad del sonido global es media (29.3% de diferencia con la mediana)
En comparación con la misma clase
» 95% de todos los dispositivos probados de esta clase eran mejores, 2% similares, 3% peores
» El mejor tuvo un delta de 6%, la media fue 18%, el peor fue ###max##%
En comparación con todos los dispositivos probados
» 87% de todos los dispositivos probados eran mejores, 3% similares, 10% peores
» El mejor tuvo un delta de 4%, la media fue 24%, el peor fue ###max##%
Apple MacBook 12 (Early 2016) 1.1 GHz análisis de audio
(+) | los altavoces pueden reproducir a un volumen relativamente alto (#83.6 dB)
Graves 100 - 315 Hz
(±) | lubina reducida - en promedio 11.3% inferior a la mediana
(±) | la linealidad de los graves es media (14.2% delta a frecuencia anterior)
Medios 400 - 2000 Hz
(+) | medios equilibrados - a sólo 2.4% de la mediana
(+) | los medios son lineales (5.5% delta a la frecuencia anterior)
Altos 2 - 16 kHz
(+) | máximos equilibrados - a sólo 2% de la mediana
(+) | los máximos son lineales (4.5% delta a la frecuencia anterior)
Total 100 - 16.000 Hz
(+) | el sonido global es lineal (10.2% de diferencia con la mediana)
En comparación con la misma clase
» 7% de todos los dispositivos probados de esta clase eran mejores, 2% similares, 91% peores
» El mejor tuvo un delta de 5%, la media fue 18%, el peor fue ###max##%
En comparación con todos los dispositivos probados
» 5% de todos los dispositivos probados eran mejores, 1% similares, 94% peores
» El mejor tuvo un delta de 4%, la media fue 24%, el peor fue ###max##%
Energy Management
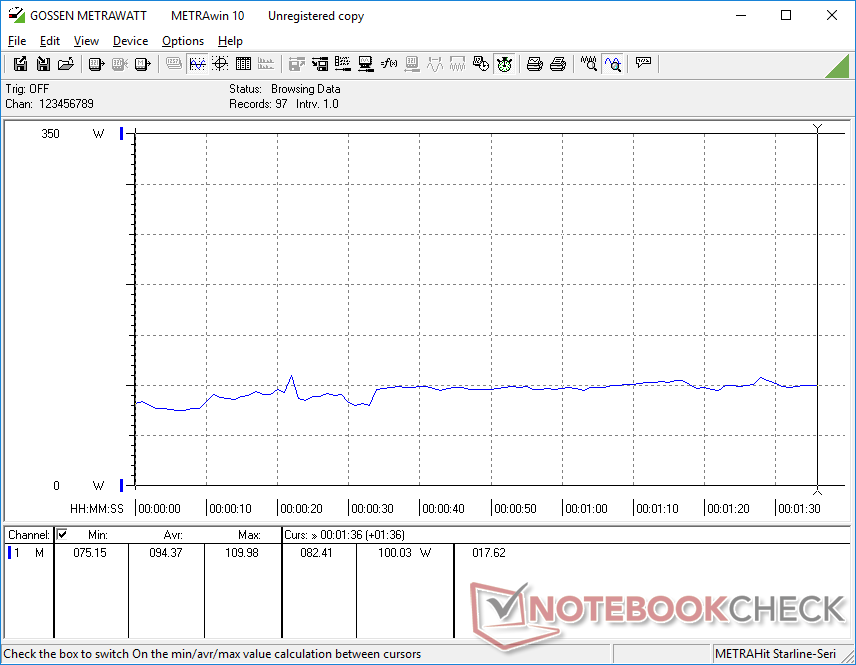
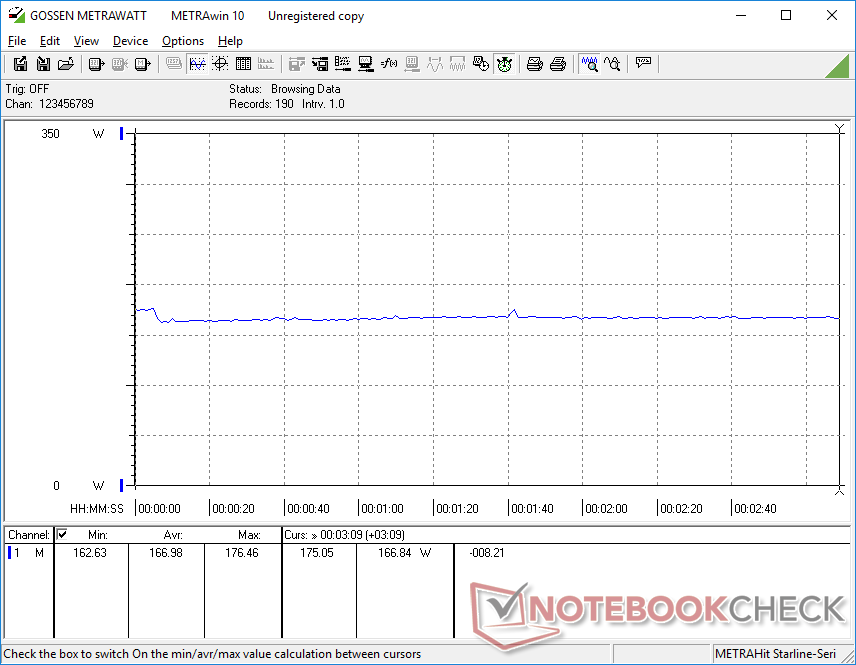
Consumo de energía
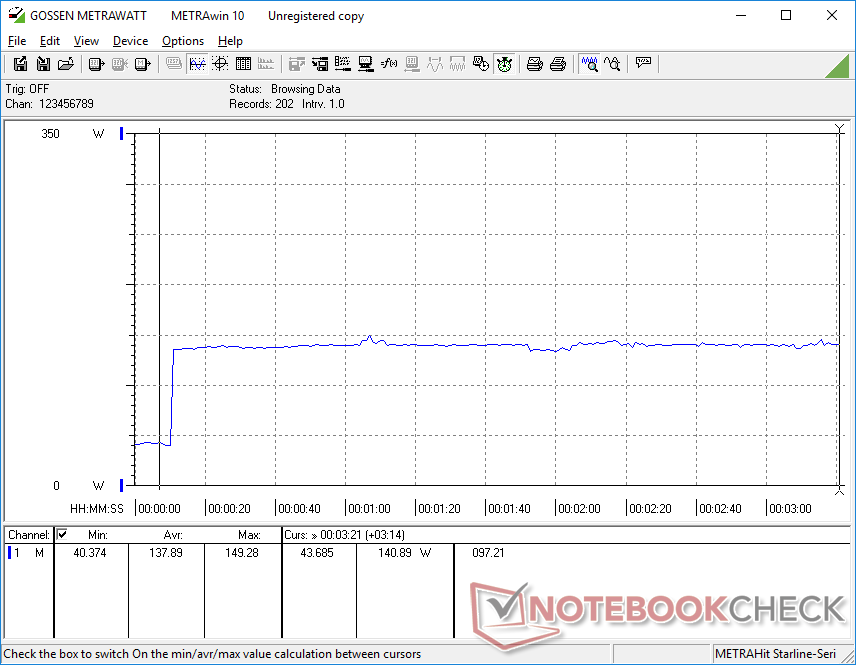
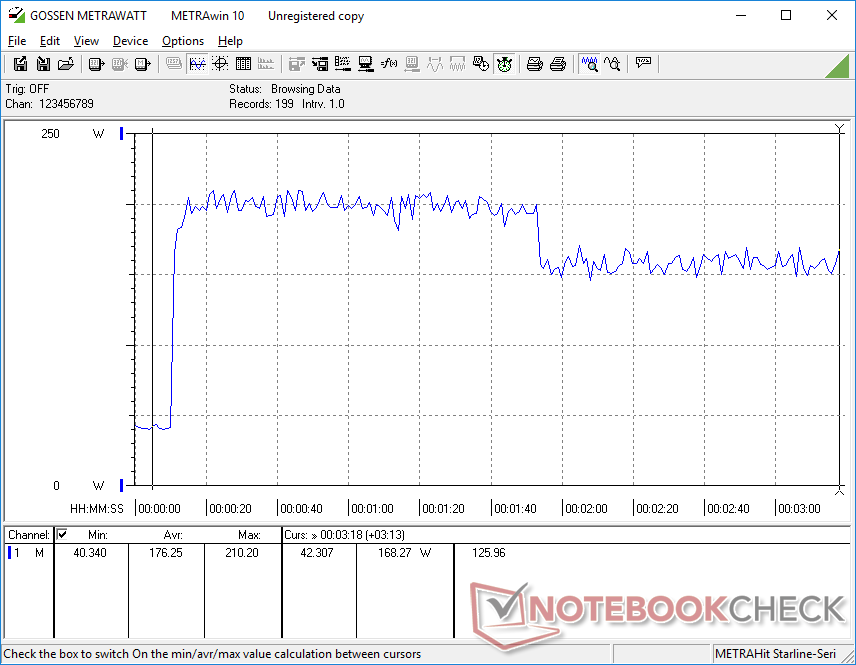
El consumo de energía ha mejorado significativamente respecto al Alienware m15 R4 del año pasado. El consumo de energía en reposo en el escritorio sin aplicaciones en ejecución es de solo 16 W, frente a más del doble en el modelo anterior. Además, la ejecución de Witcher 3 consumiría unos 167 W frente a los 194 W de la m15 R4 equipada con la misma GPU RTX 3070, lo que supone un ahorro de energía del 14%, aunque con un déficit de rendimiento del 10%. Quizá no sea casualidad que la diferencia entre 194 W y 167 W sea casi igual a la diferencia de TGP entre los dos portátiles
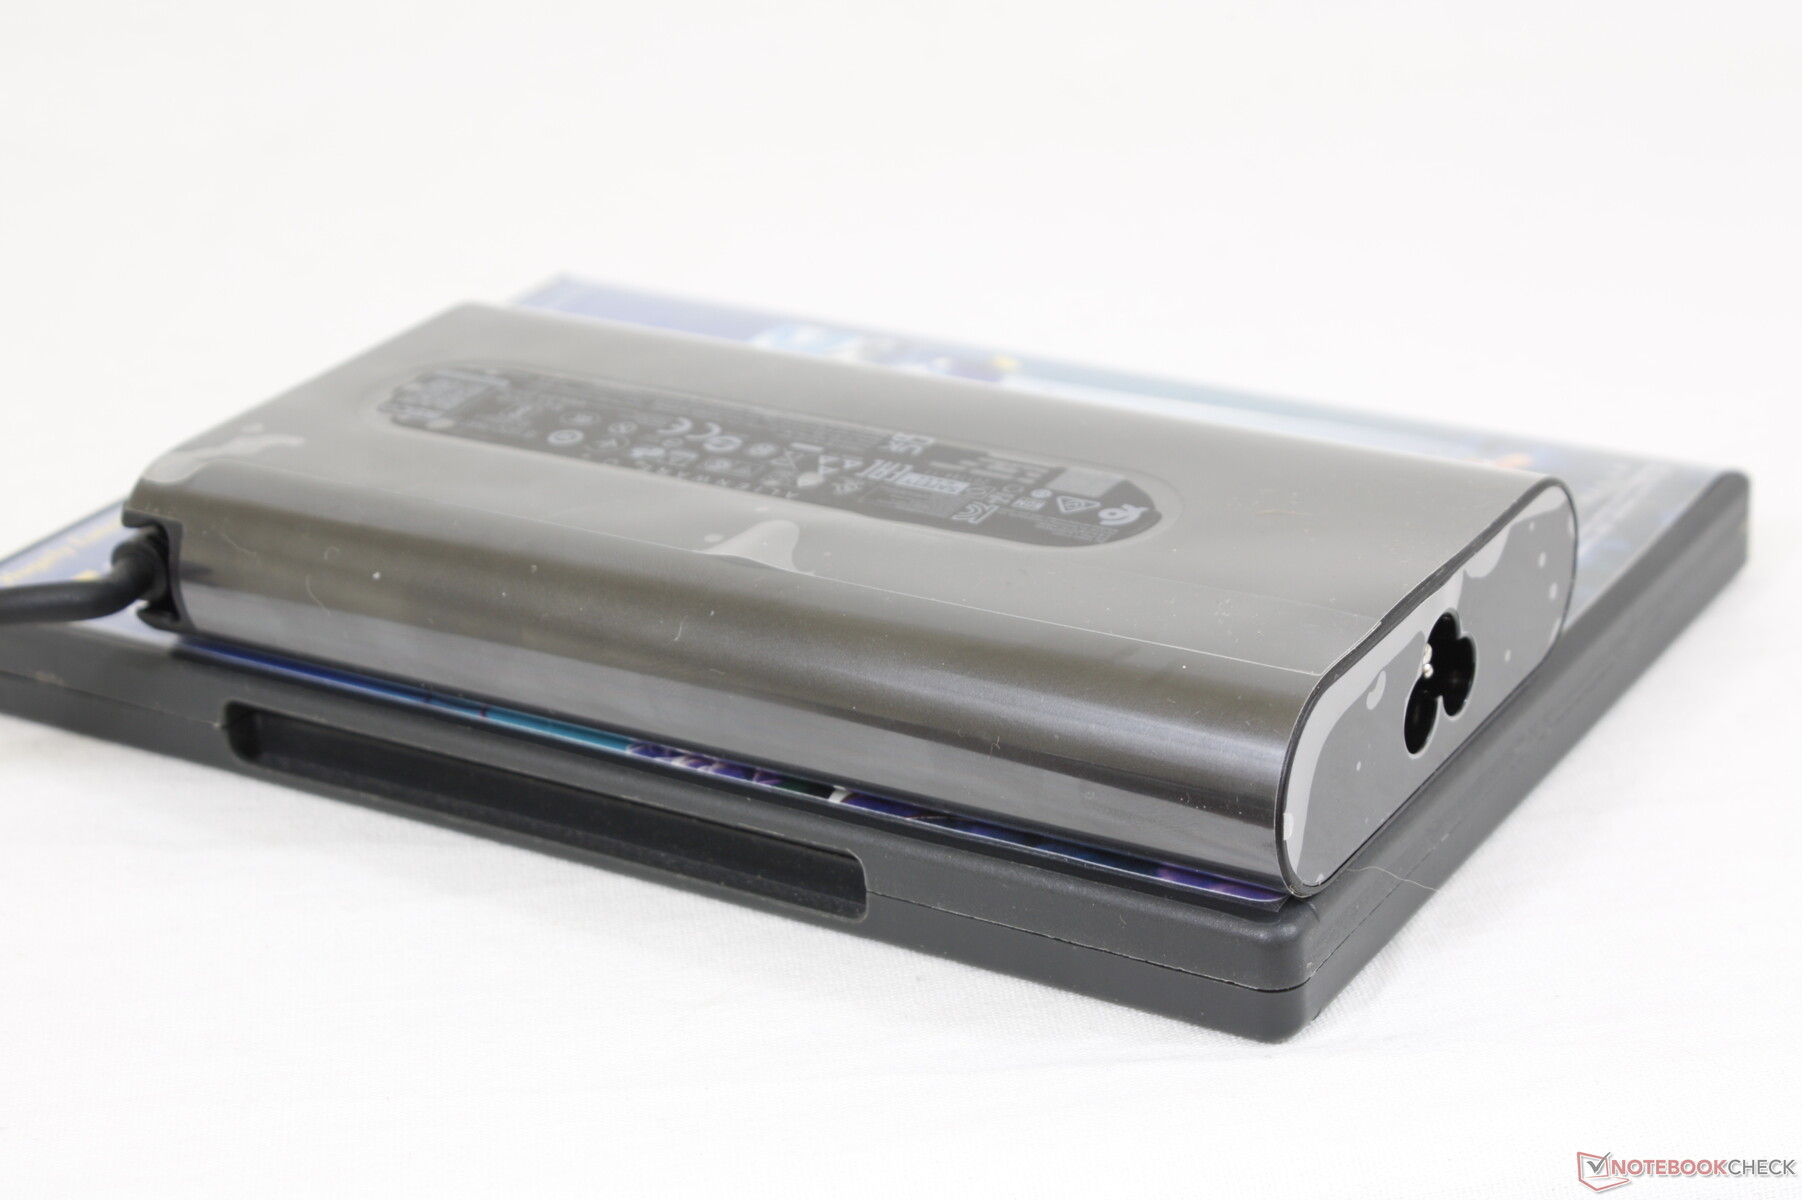
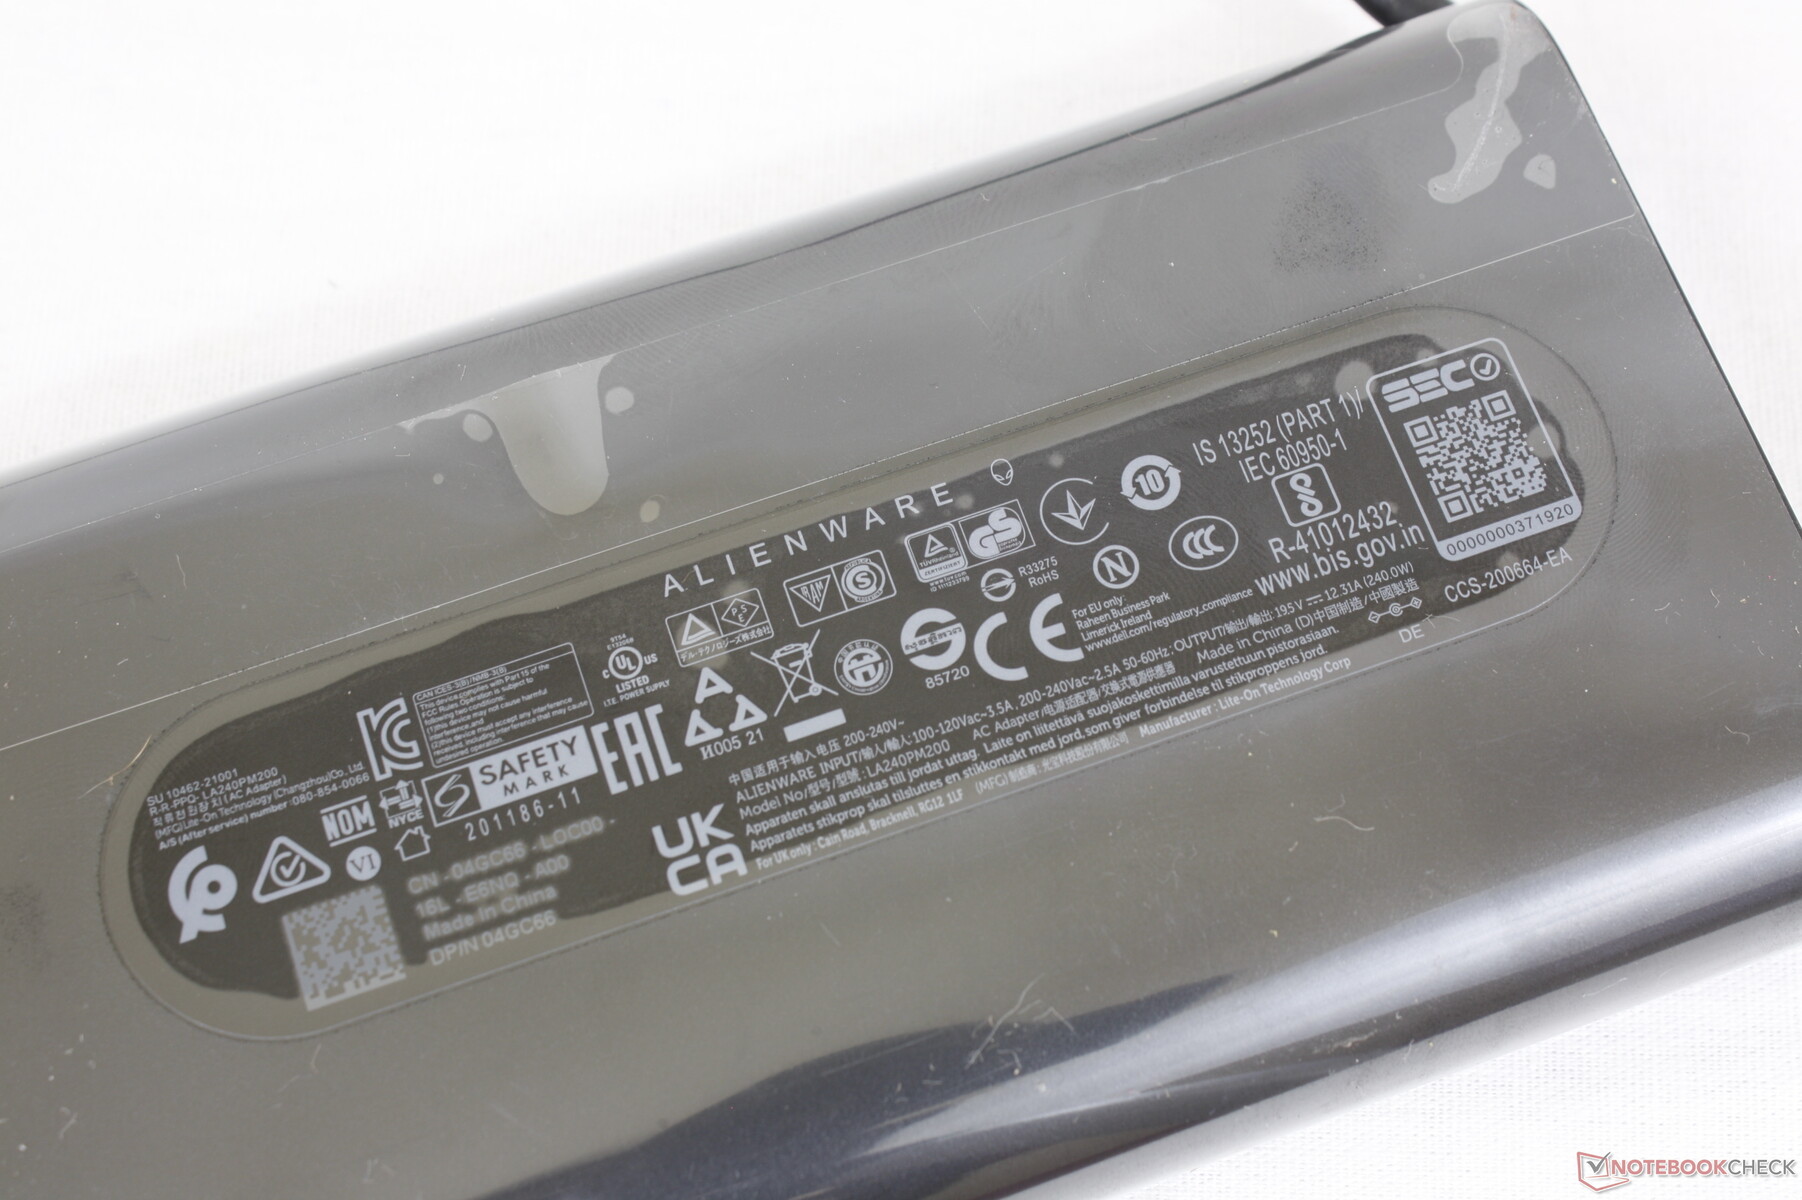
Hemos podido registrar un consumo máximo temporal de 184 W con el adaptador de CA de 240 W de tamaño medio (~15,2 x 7,6 x 2,4 cm). Este mismo adaptador de corriente también viene con algunas unidades de gama baja del Alienware x17 R1.
| Off / Standby | |
| Ocioso | |
| Carga |
|
Clave:
min: | |
| Alienware x15 RTX 3070 P111F i7-11800H, GeForce RTX 3070 Laptop GPU, WDC PC SN730 SDBPNTY-512G, IPS, 2560x1440, 15.6" | Alienware m15 R4 i9-10980HK, GeForce RTX 3070 Laptop GPU, Micron 2300 1TB MTFDHBA1T0TDV, IPS, 1920x1080, 15.6" | MSI GS66 Stealth 10UG i7-10870H, GeForce RTX 3070 Laptop GPU, WDC PC SN730 SDBPNTY-1T00, IPS, 1920x1080, 15.6" | Razer Blade 15 Advanced (Mid 2021) i7-11800H, GeForce RTX 3080 Laptop GPU, SSSTC CA6-8D1024, IPS, 1920x1080, 15.6" | Asus Zephyrus S15 GX502L i7-10875H, GeForce RTX 2070 Super Mobile, WDC PC SN730 SDBPNTY-1T00, IPS, 1920x1080, 15.6" | Acer Predator Helios 300 PH315-53-786B i7-10750H, GeForce RTX 3070 Laptop GPU, Samsung PM981a MZVLB1T0HBLR, IPS, 1920x1080, 15.6" | |
|---|---|---|---|---|---|---|
| Power Consumption | -54% | 8% | -10% | 8% | 25% | |
| Idle Minimum * (Watt) | 15.7 | 35 -123% | 12.9 18% | 19.5 -24% | 7 55% | 4 75% |
| Idle Average * (Watt) | 20.3 | 39 -92% | 15.4 24% | 23.3 -15% | 13 36% | 11 46% |
| Idle Maximum * (Watt) | 43 | 48 -12% | 27.1 37% | 40.1 7% | 25 42% | 24 44% |
| Load Average * (Watt) | 94.4 | 135 -43% | 98.2 -4% | 98.9 -5% | 148 -57% | 91 4% |
| Witcher 3 ultra * (Watt) | 167 | 194 -16% | 164.9 1% | 174 -4% | 175 -5% | 164 2% |
| Load Maximum * (Watt) | 183.4 | 252 -37% | 232.9 -27% | 214 -17% | 232 -26% | 220 -20% |
* ... más pequeño es mejor
Power Consumption Witcher 3 / Stresstest
Duración de la batería: mucho más larga que antes
Al igual que el salto del Alienware m17 al x17, el salto del Alienware m15 al x15 también ha dado lugar a ganancias significativas en la duración de la batería en general debido a la mejora de la eficiencia energética mencionada anteriormente. Hemos registrado una duración total de WLAN de poco más de 6 horas en comparación con menos de 2 horas en el Alienware m15 R4 a pesar de que la capacidad de la batería sigue siendo casi la misma en 87 Wh cada una.
La carga de vacío a lleno es rápida con unos 75 minutos con el adaptador de barril AC incluido. Se puede cargar con USB-C, aunque a una velocidad más lenta.
| Alienware x15 RTX 3070 P111F i7-11800H, GeForce RTX 3070 Laptop GPU, 87 Wh | Alienware m15 R4 RTX 3080 i9-10980HK, GeForce RTX 3080 Laptop GPU, 86 Wh | MSI GS66 Stealth 10UG i7-10870H, GeForce RTX 3070 Laptop GPU, 99.9 Wh | Razer Blade 15 Advanced (Mid 2021) i7-11800H, GeForce RTX 3080 Laptop GPU, 80 Wh | Asus Zephyrus S15 GX502L i7-10875H, GeForce RTX 2070 Super Mobile, 76 Wh | Acer Predator Helios 300 PH315-53-786B i7-10750H, GeForce RTX 3070 Laptop GPU, 58.75 Wh | |
|---|---|---|---|---|---|---|
| Duración de Batería | -41% | 57% | -3% | 2% | 27% | |
| Reader / Idle (h) | 9.7 | 10.8 11% | 8.7 -10% | 10.6 9% | ||
| WiFi v1.3 (h) | 6.1 | 1.8 -70% | 7.1 16% | 5.9 -3% | 3 -51% | 6.4 5% |
| Load (h) | 0.9 | 0.8 -11% | 2.2 144% | 1.5 67% | 1.5 67% | |
| Witcher 3 ultra (h) | 0.8 |
Pro
Contra
Veredicto - Un gran salto hacia adelante y unos pocos pasos hacia atrás
Dell buscó crear no solo el portátil Alienware de 15,6 pulgadas más delgado, sino también el portátil de juegos de 15,6 pulgadas más delgado con gráficos GeForce RTX disponible actualmente. El Alienware x15 R1 merece el reconocimiento en este aspecto, pero viene con un puñado de inconvenientes que los usuarios deben tener en cuenta.
En primer lugar, el TGP de la GPU se ha reducido de 140 W en el Alienware m15 R4 a solo 90 - 110 W en el nuevo x15 R1, lo que supone un rendimiento gráfico ligeramente más lento de un año a otro. En segundo lugar, el sistema es más pesado y ocupa más espacio que muchos portátiles de juego de 15,6 pulgadas de la competencia, como el Razer Blade 15 o el MSI GS66 a pesar de la atención adicional a la refrigeración. En tercer lugar, los usuarios no pueden actualizar la memoria RAM, lo que puede irritar a los entusiastas. Y por último, la inusual posición de los puertos puede ser desfavorable para muchos usuarios
El Alienware x15 R1 es más delgado, más delgado, más fresco y más duradero que el Alienware m15 R5. Sin embargo, no es necesariamente más rápido, en términos de potencial gráfico bruto.
Sin embargo, de generación en generación, el x15 R1 ha mejorado enormemente con respecto a la serie m15 en muchos otros aspectos. La duración de la batería, el consumo de energía, el comportamiento de los ventiladores y las temperaturas de la superficie, en particular, son mucho mejores esta vez, aunque el nuevo diseño es más delgado y con muchas de las mismas opciones de pantalla. Tanto el rendimiento del procesador como la respuesta de las teclas también son mejores de lo esperado. Si valoras maximizar el rendimiento de la CPU sin conformarte con modelos más gruesos como el Area-51m o Serie MSI GTentonces el Alienware x15 sería tu mejor solución. Si tiene la intención de viajar a menudo, entonces el más ligero y compacto Blade 15 puede ofrecer un rendimiento de juego muy similar.
Precio y disponibilidad
Newegg tiene actualmente una sola unidad del Alienware x15 R1 por 3149 dólares, mientras que Best Buy tiene varios en stock entre $2399 y $2999 USD. Para obtener la mayor cantidad de opciones, los usuarios pueden querer comprar directamente de Dell.
Alienware x15 RTX 3070 P111F
- 09/30/2021 v7 (old)
Allen Ngo
Price comparison

