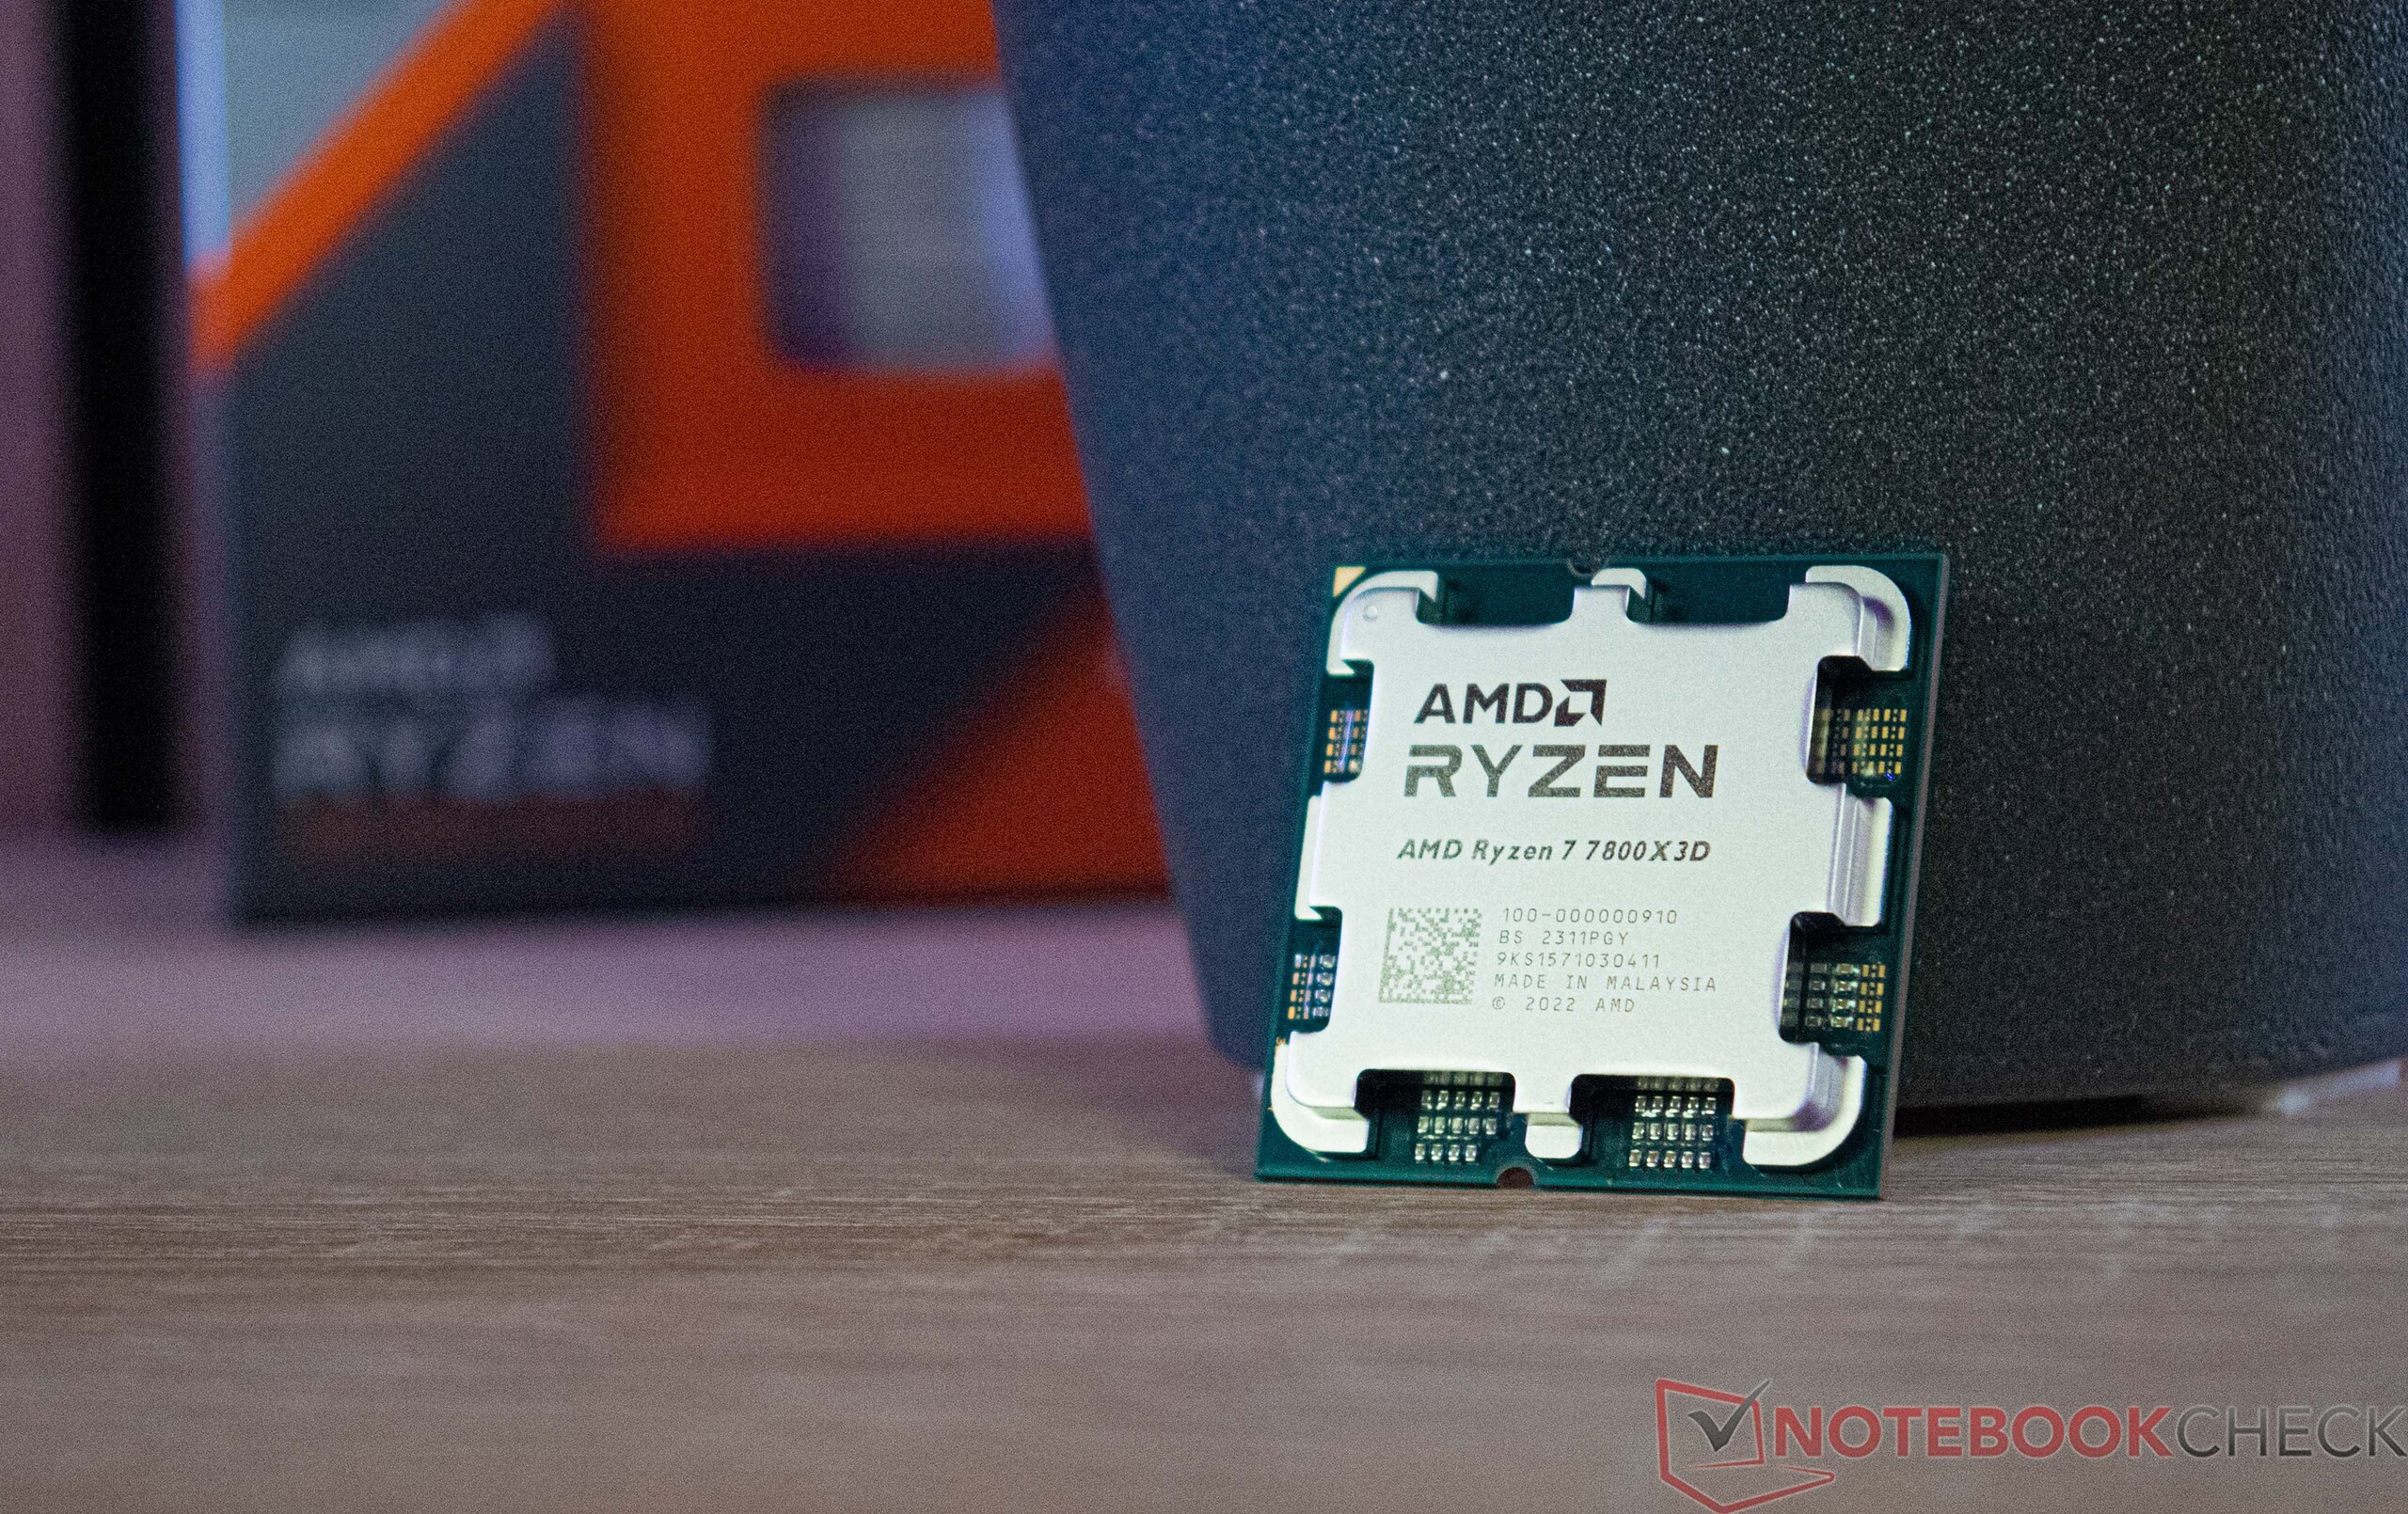
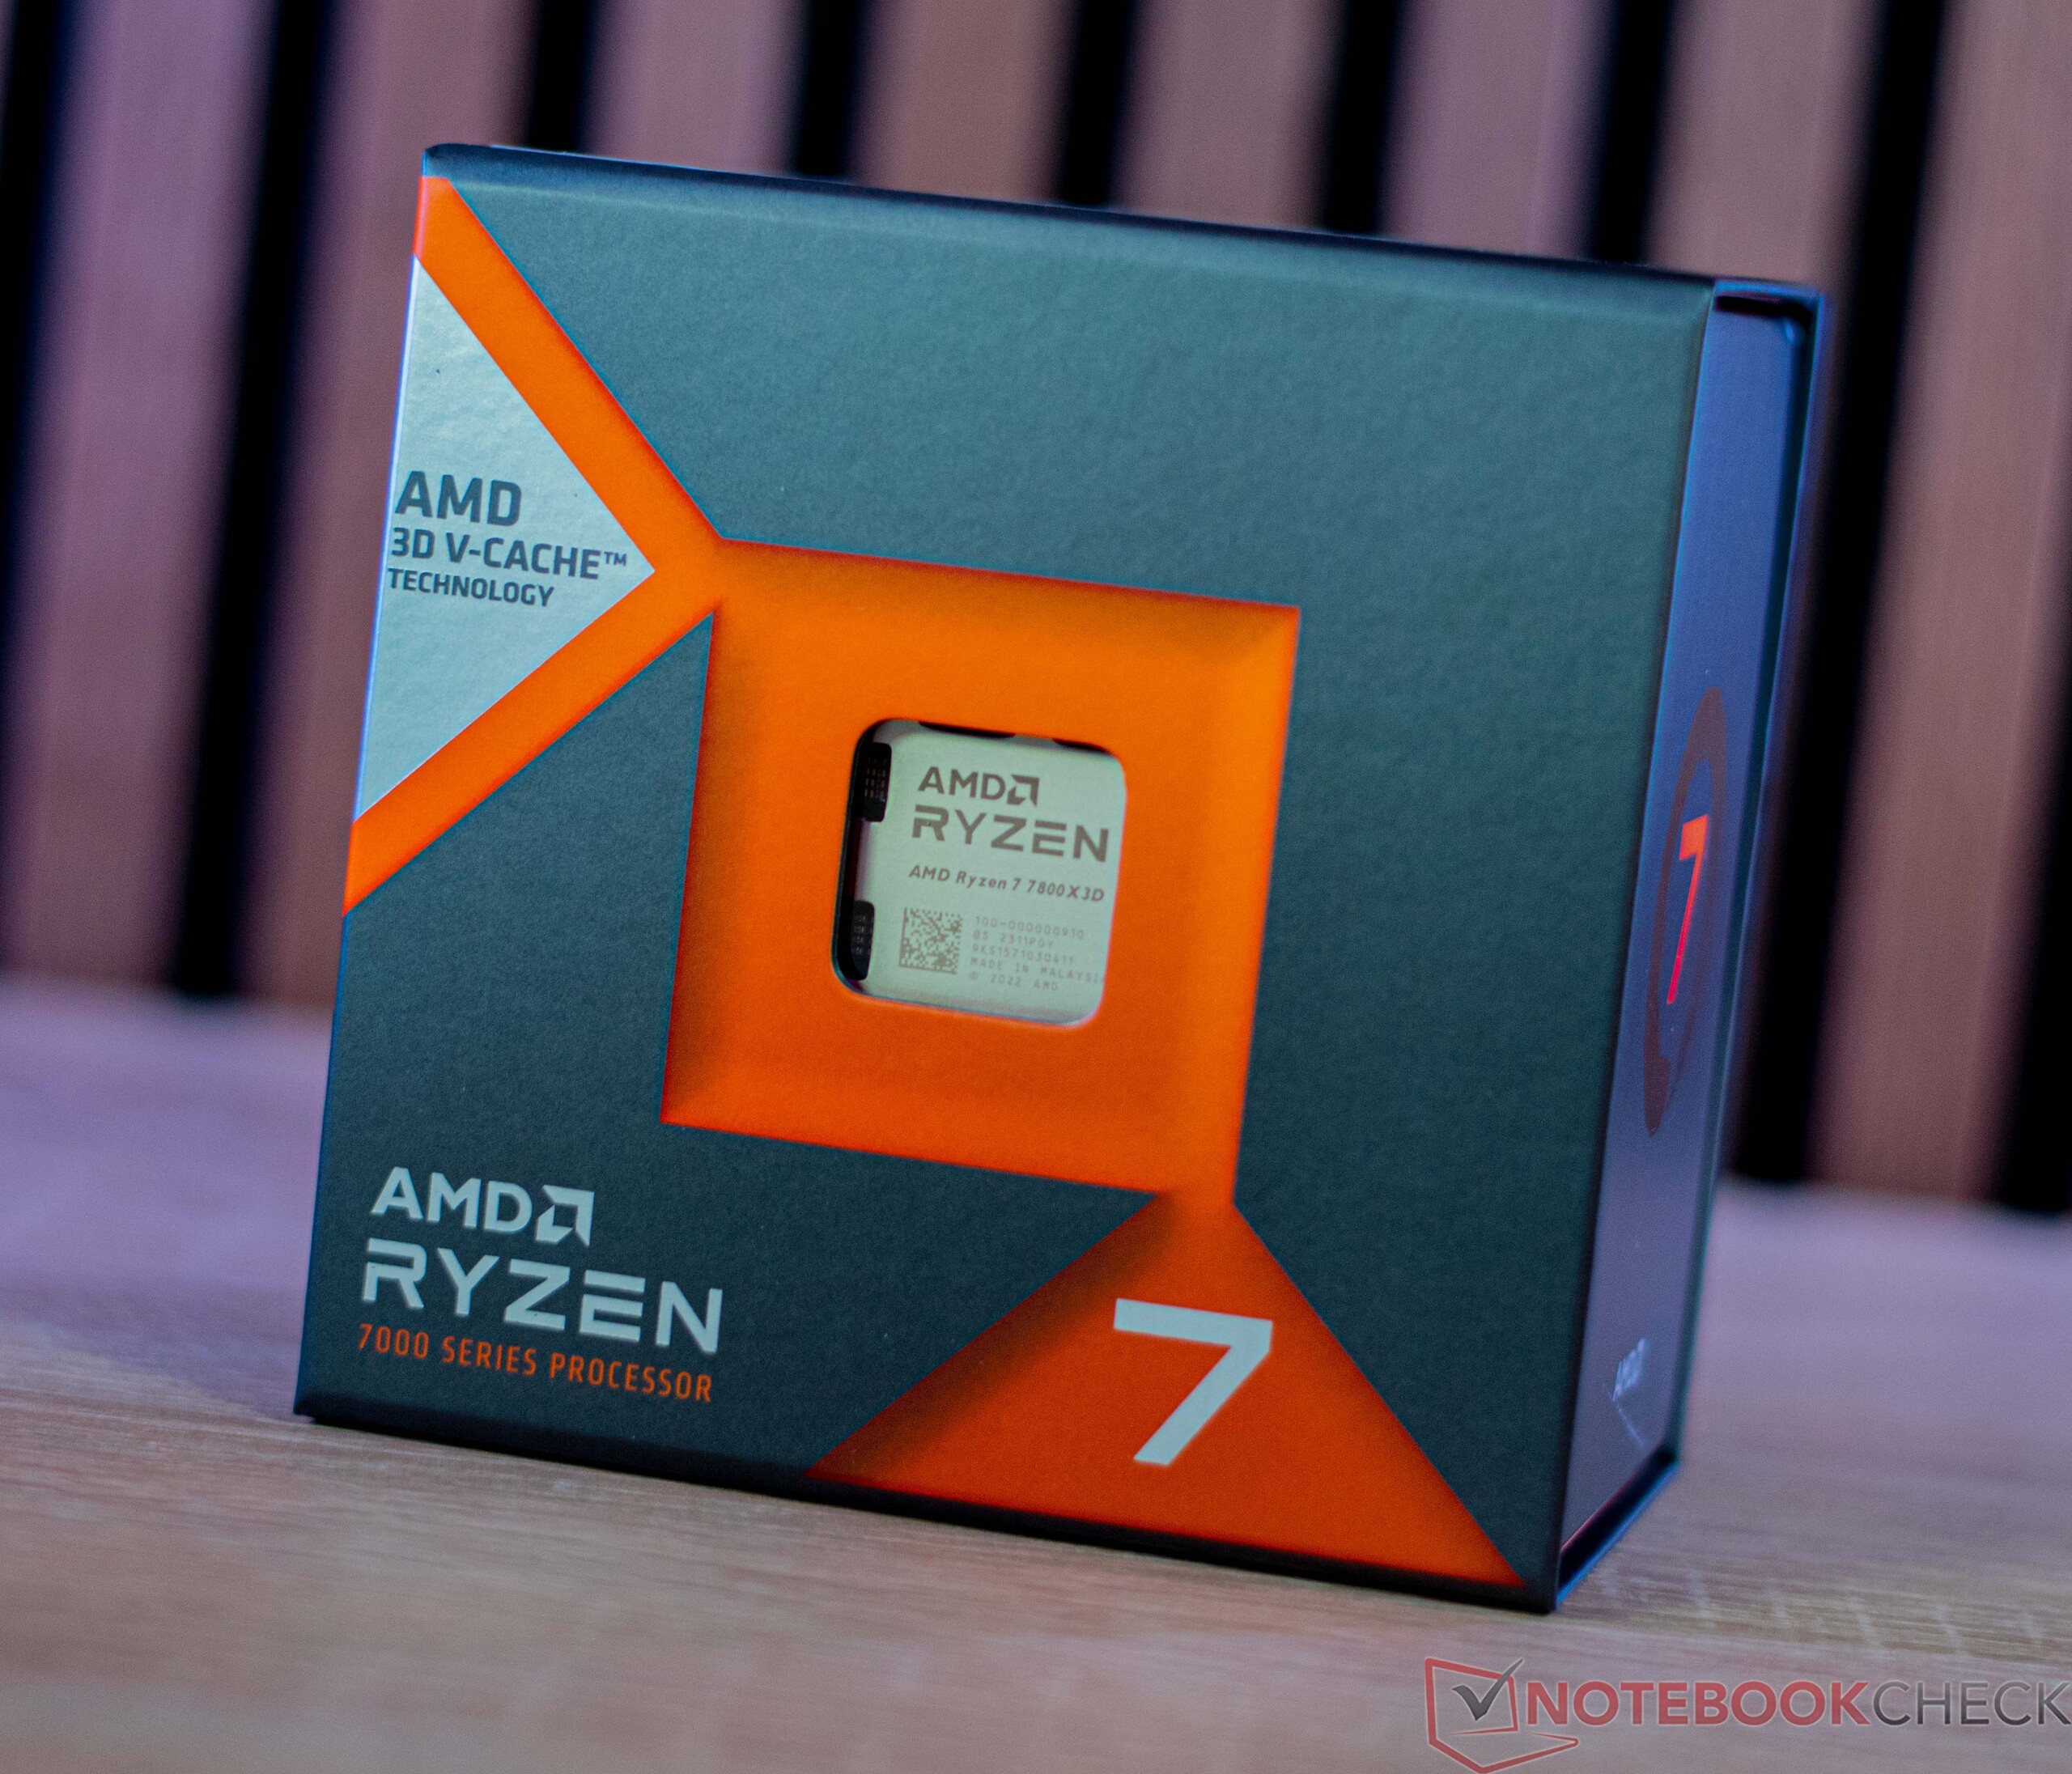
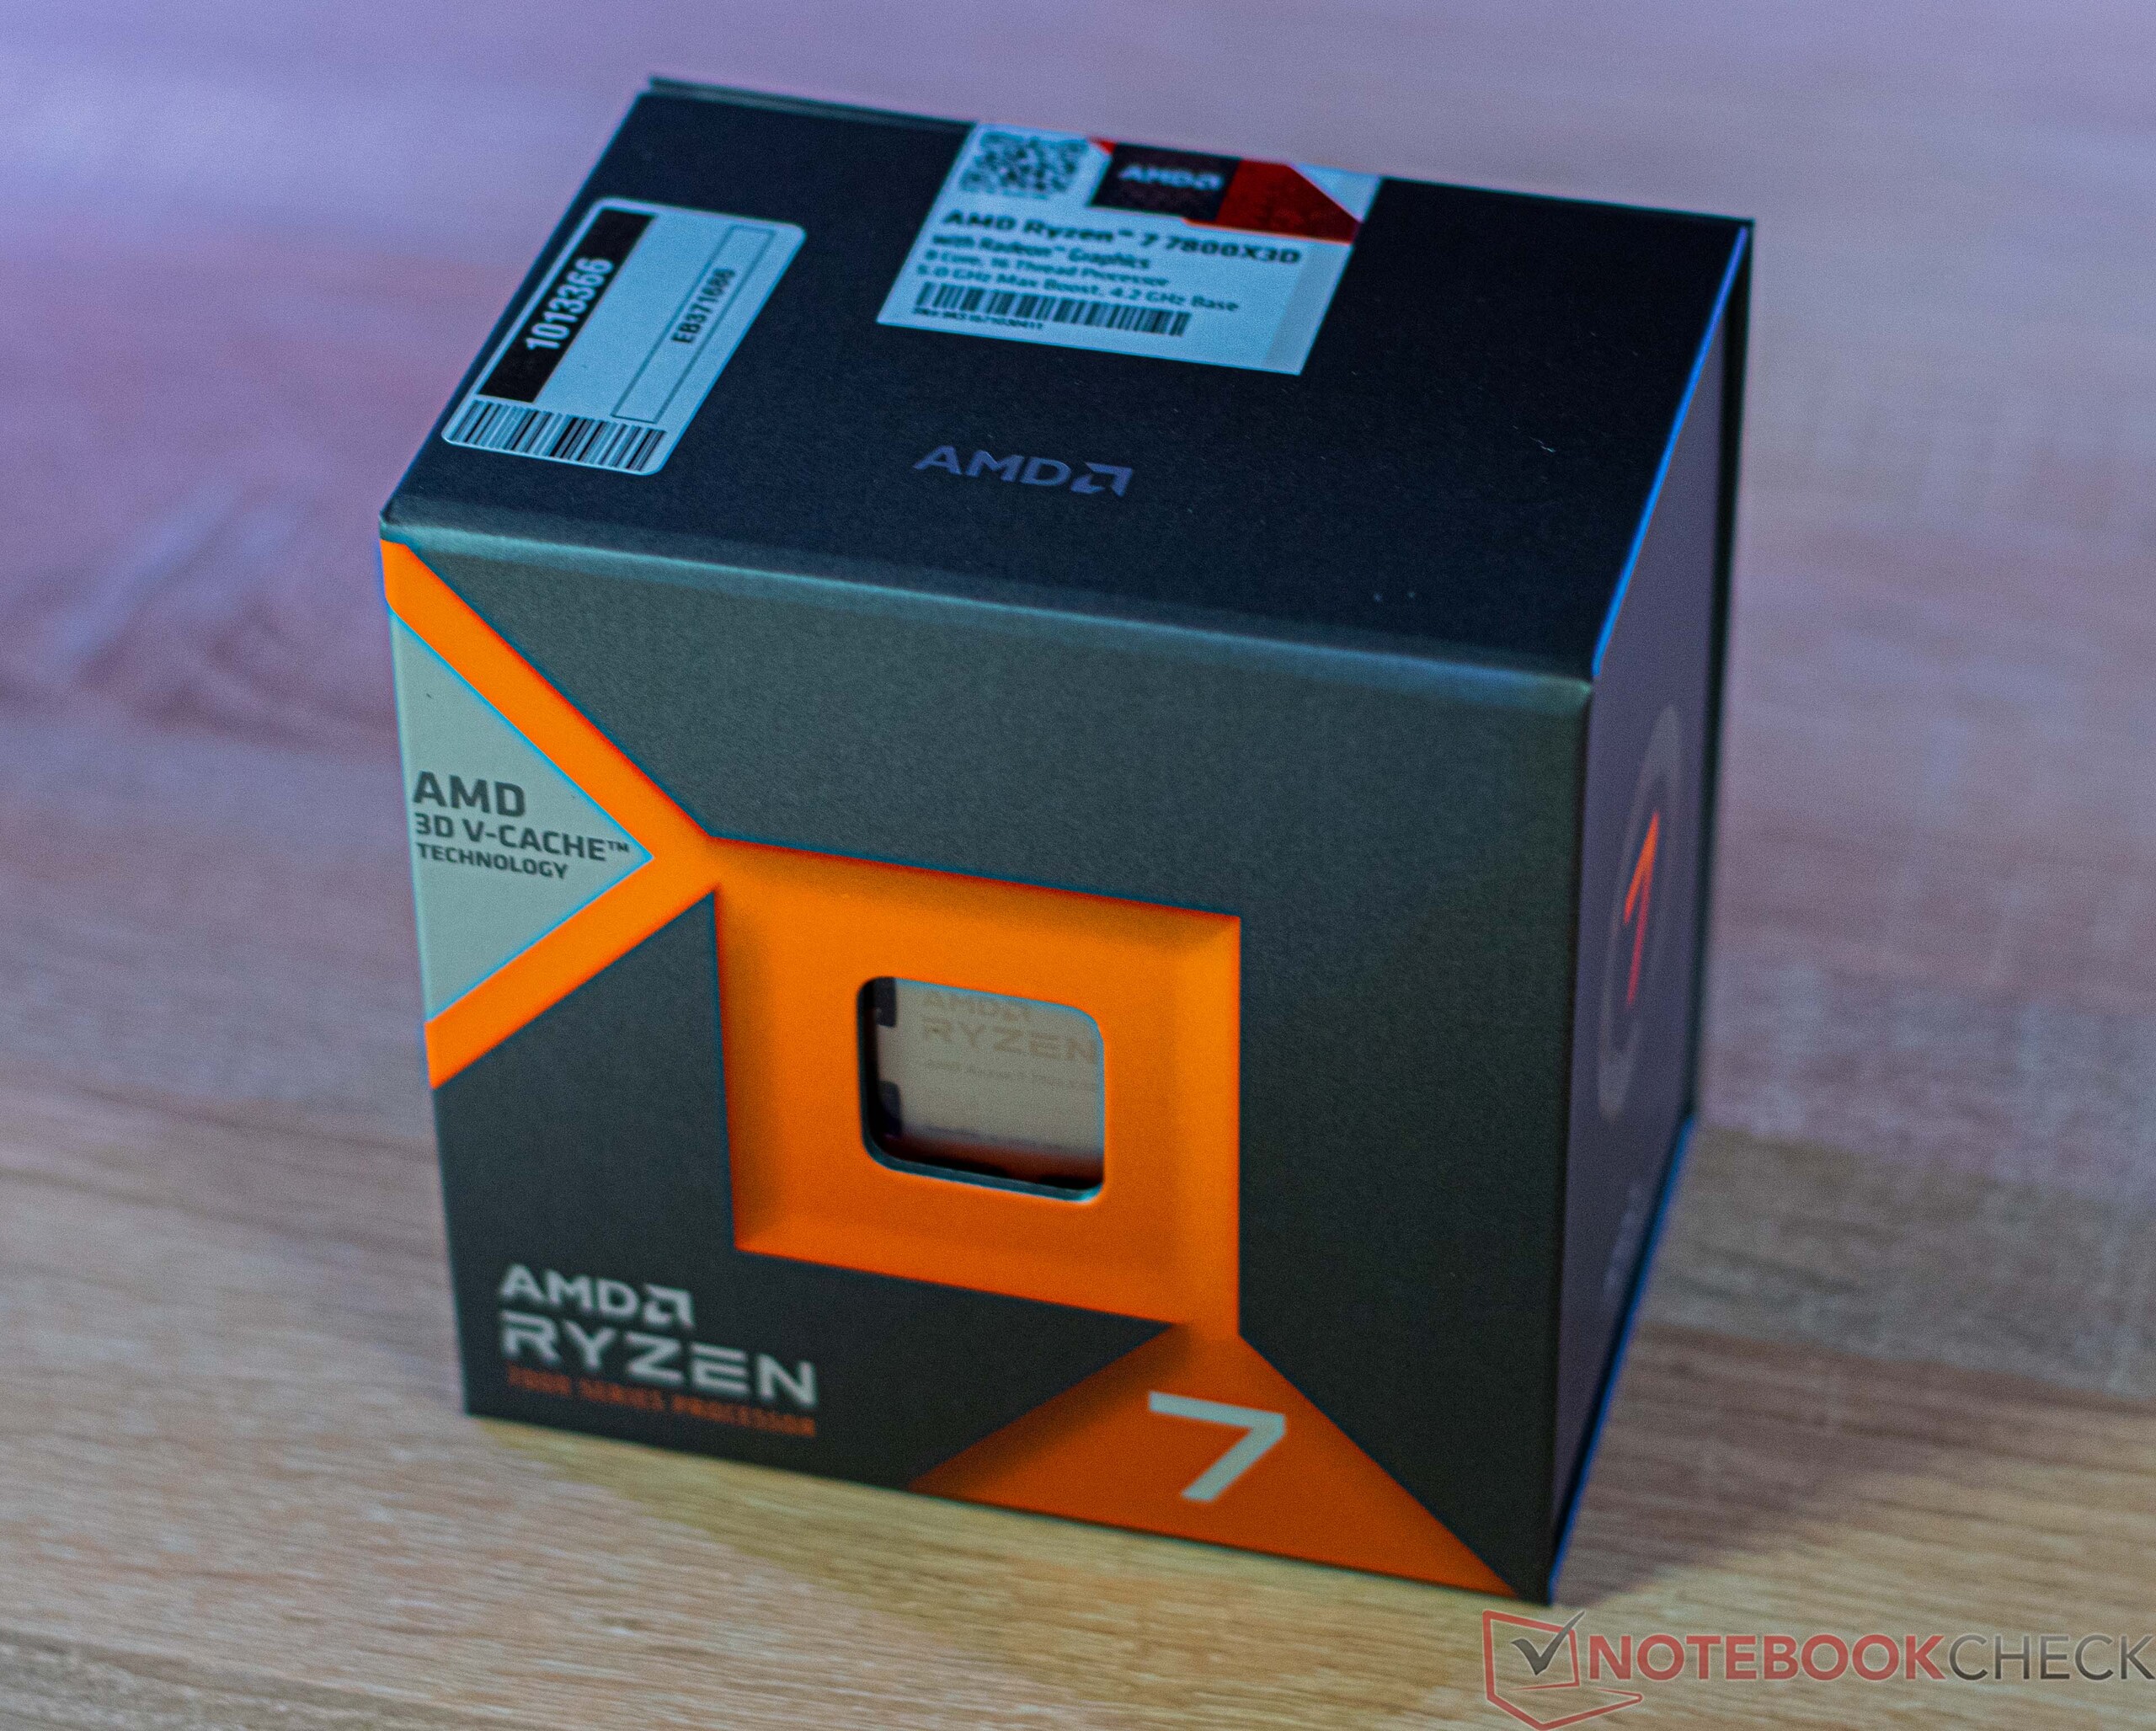
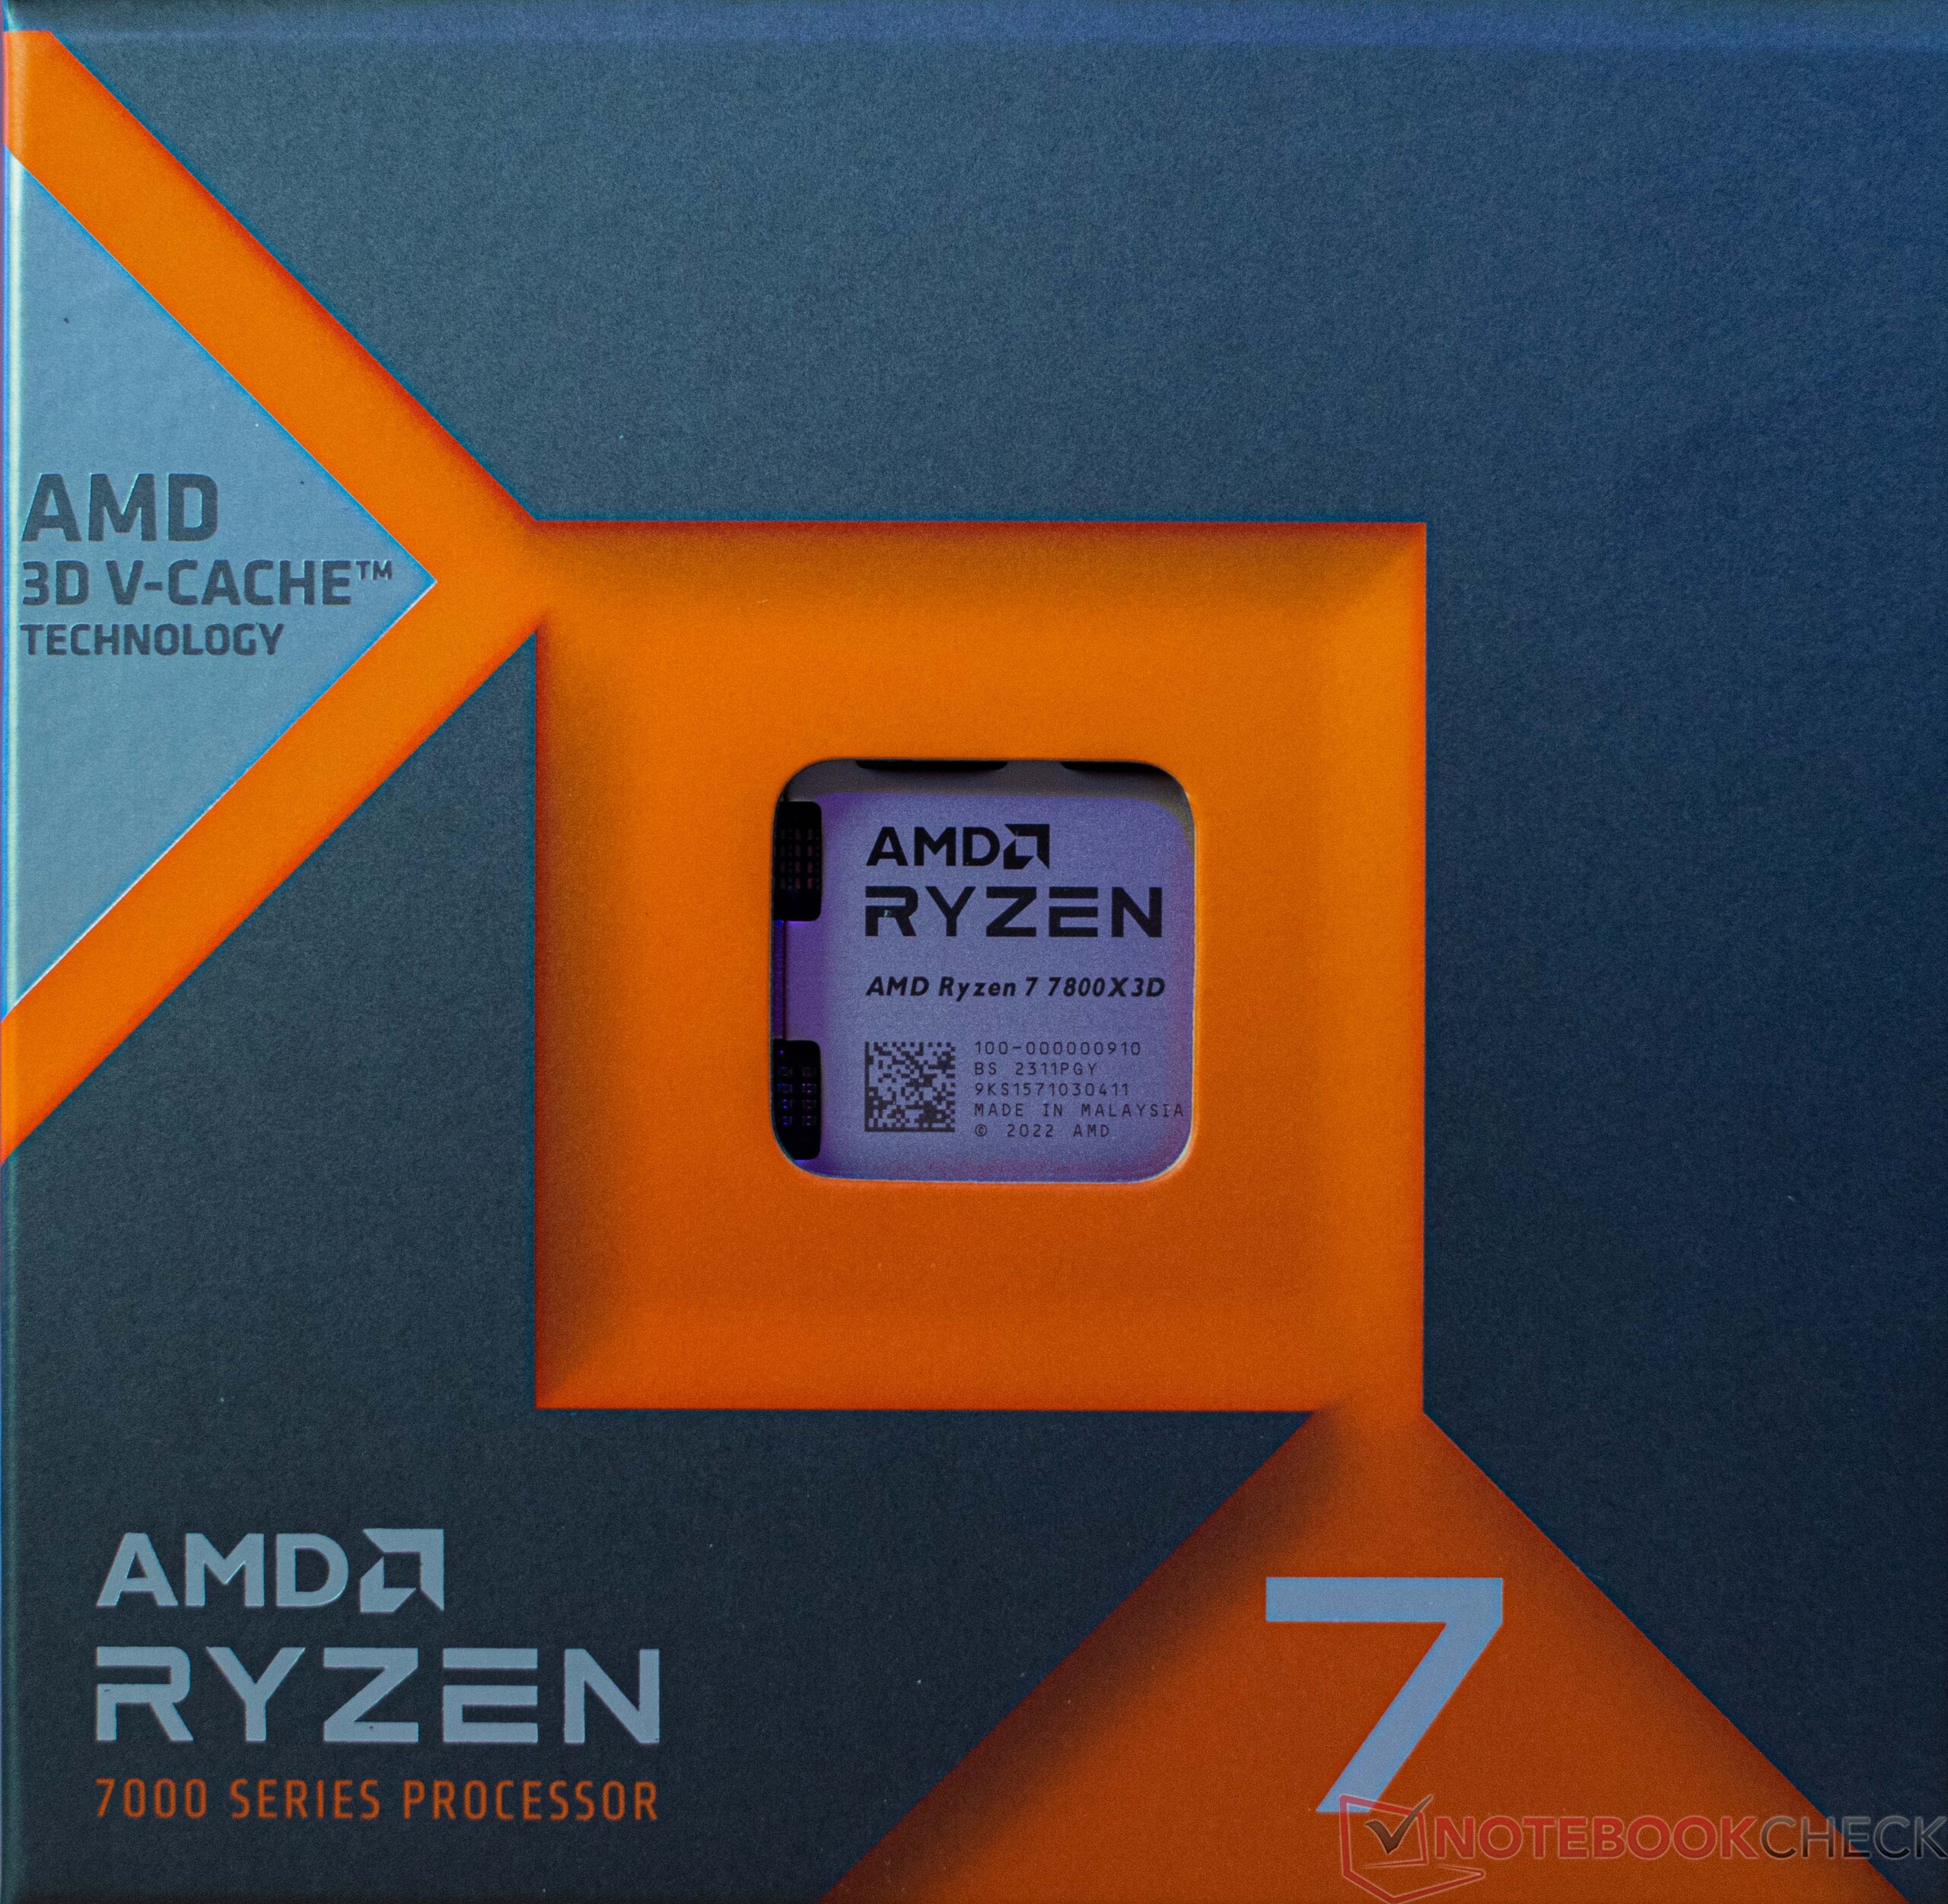
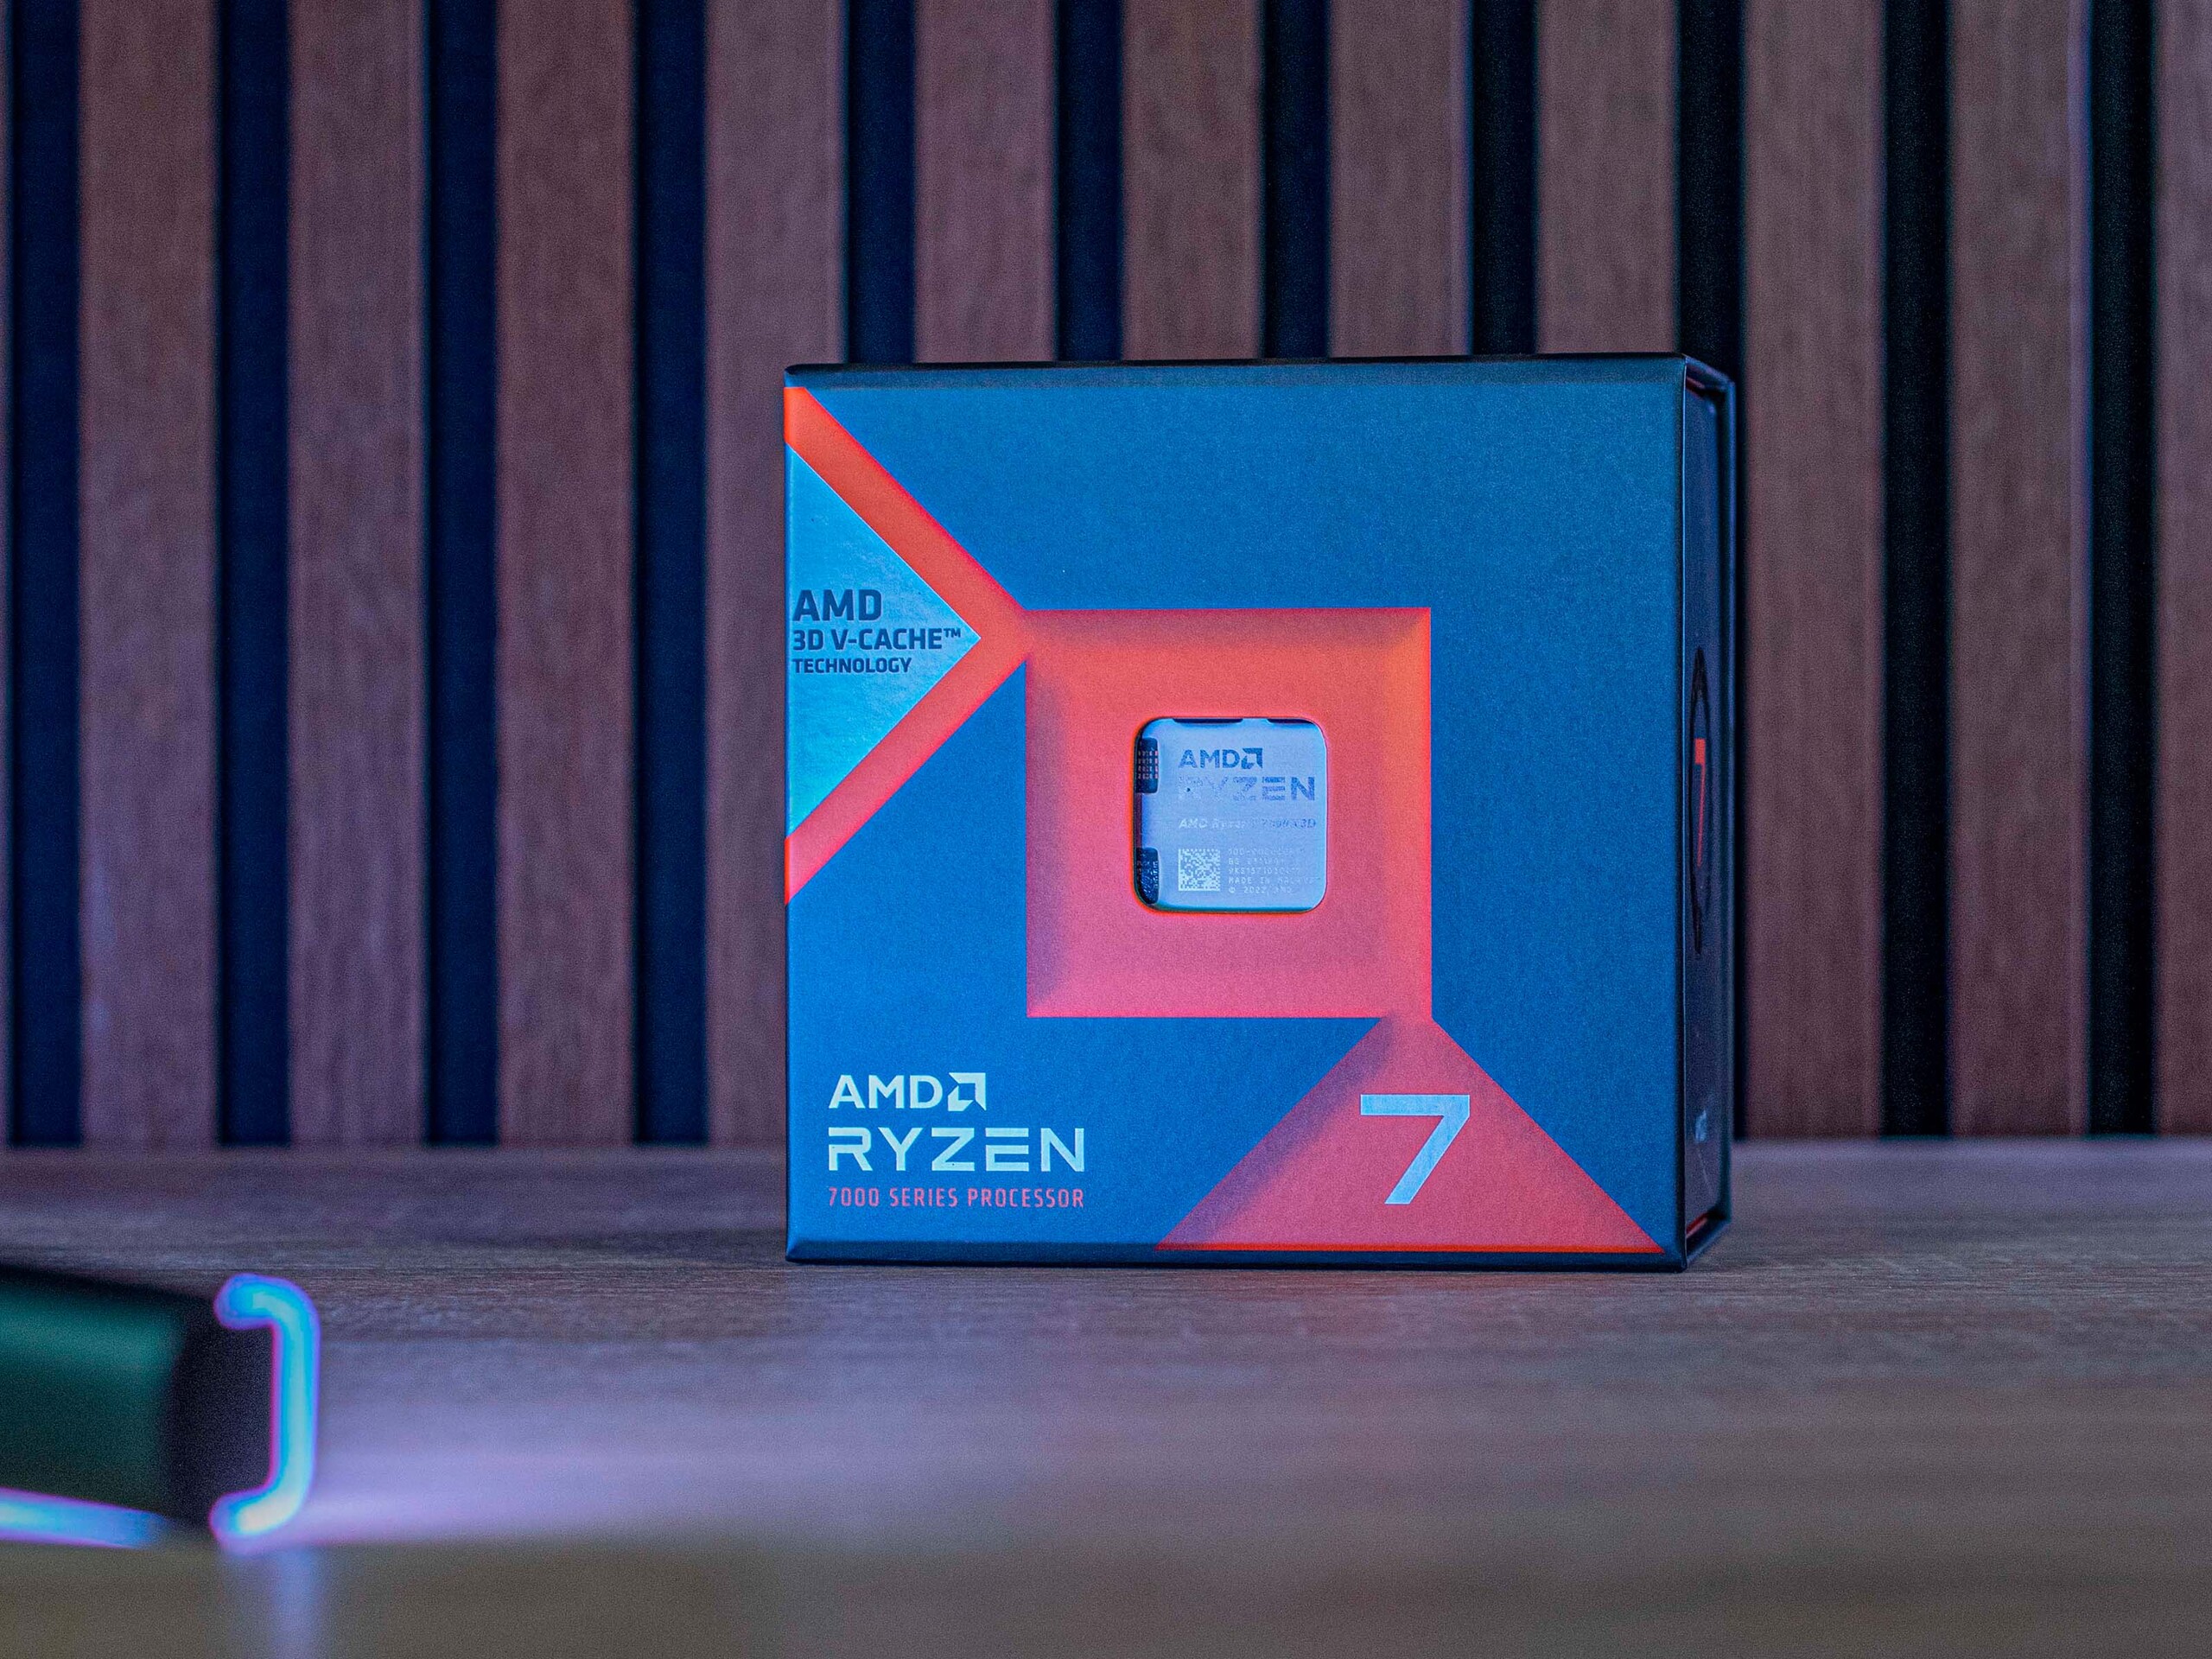
Análisis de la CPU de sobremesa AMD Ryzen 7 7800X3D: Más rápido que un Core i9-13900K gracias a 3D V-Cache y sólo 8 núcleos
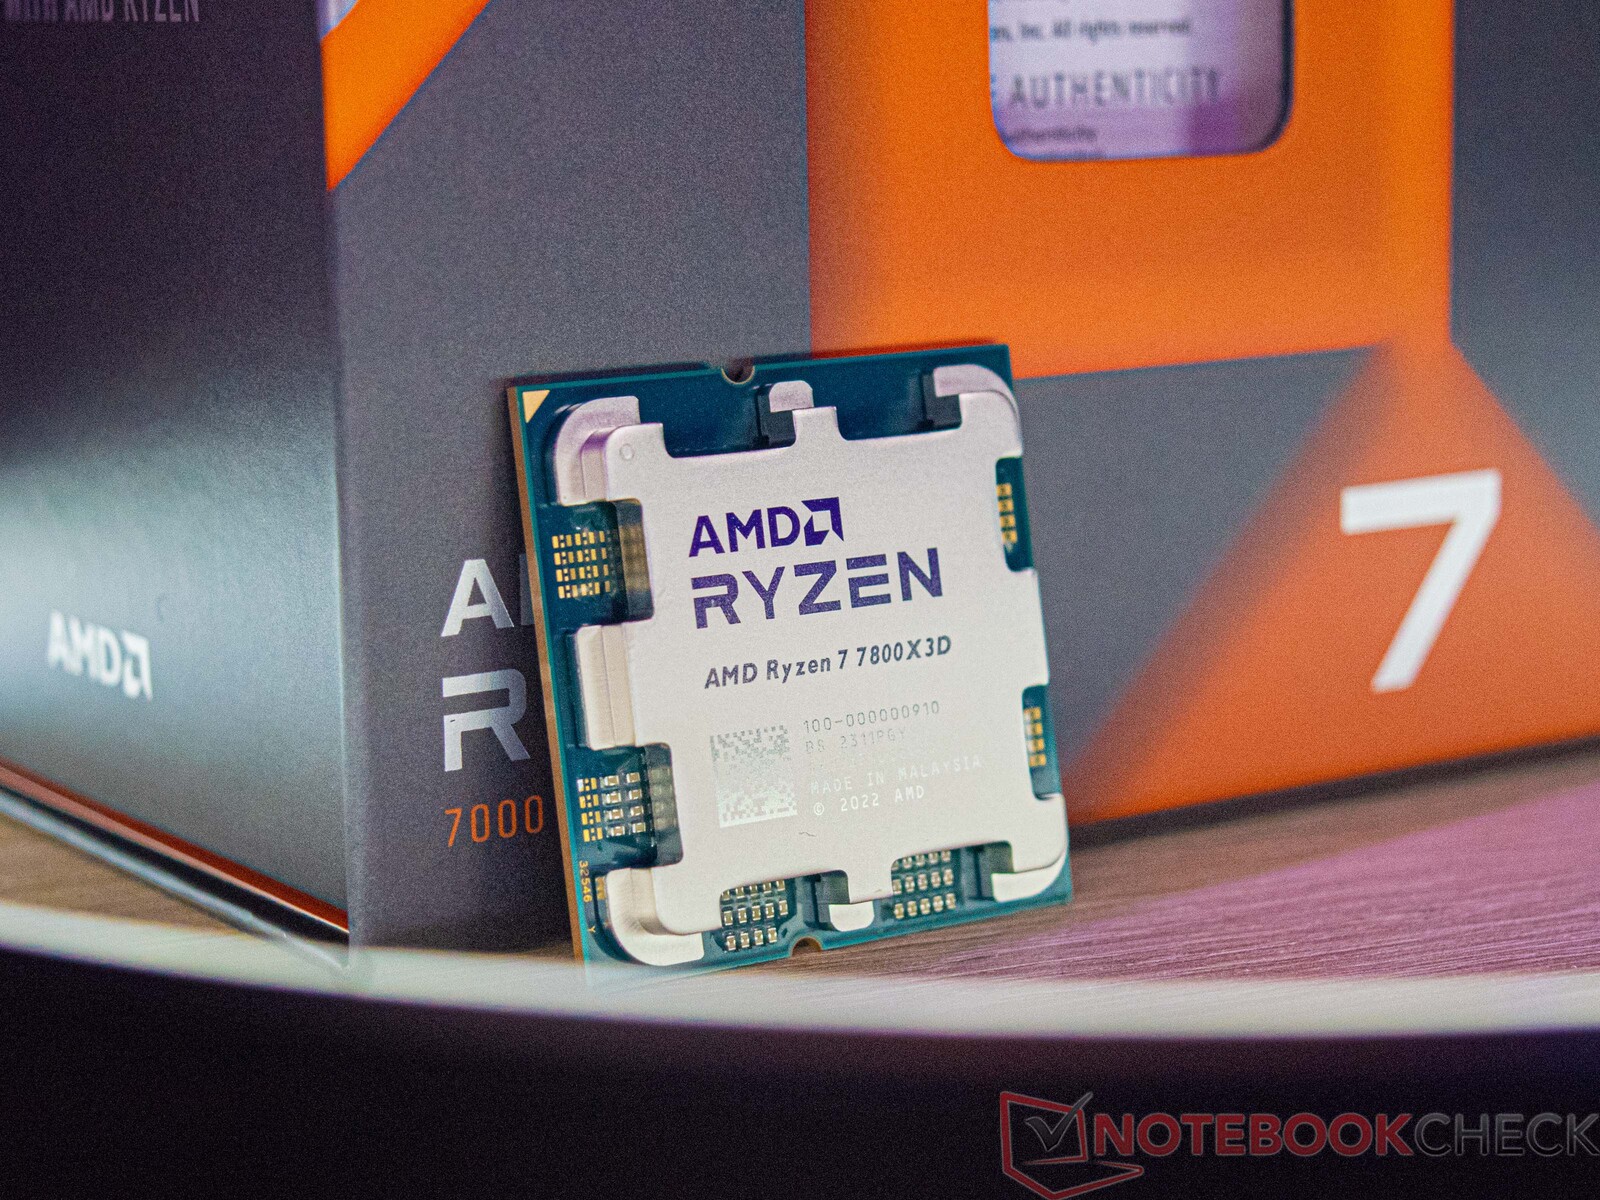
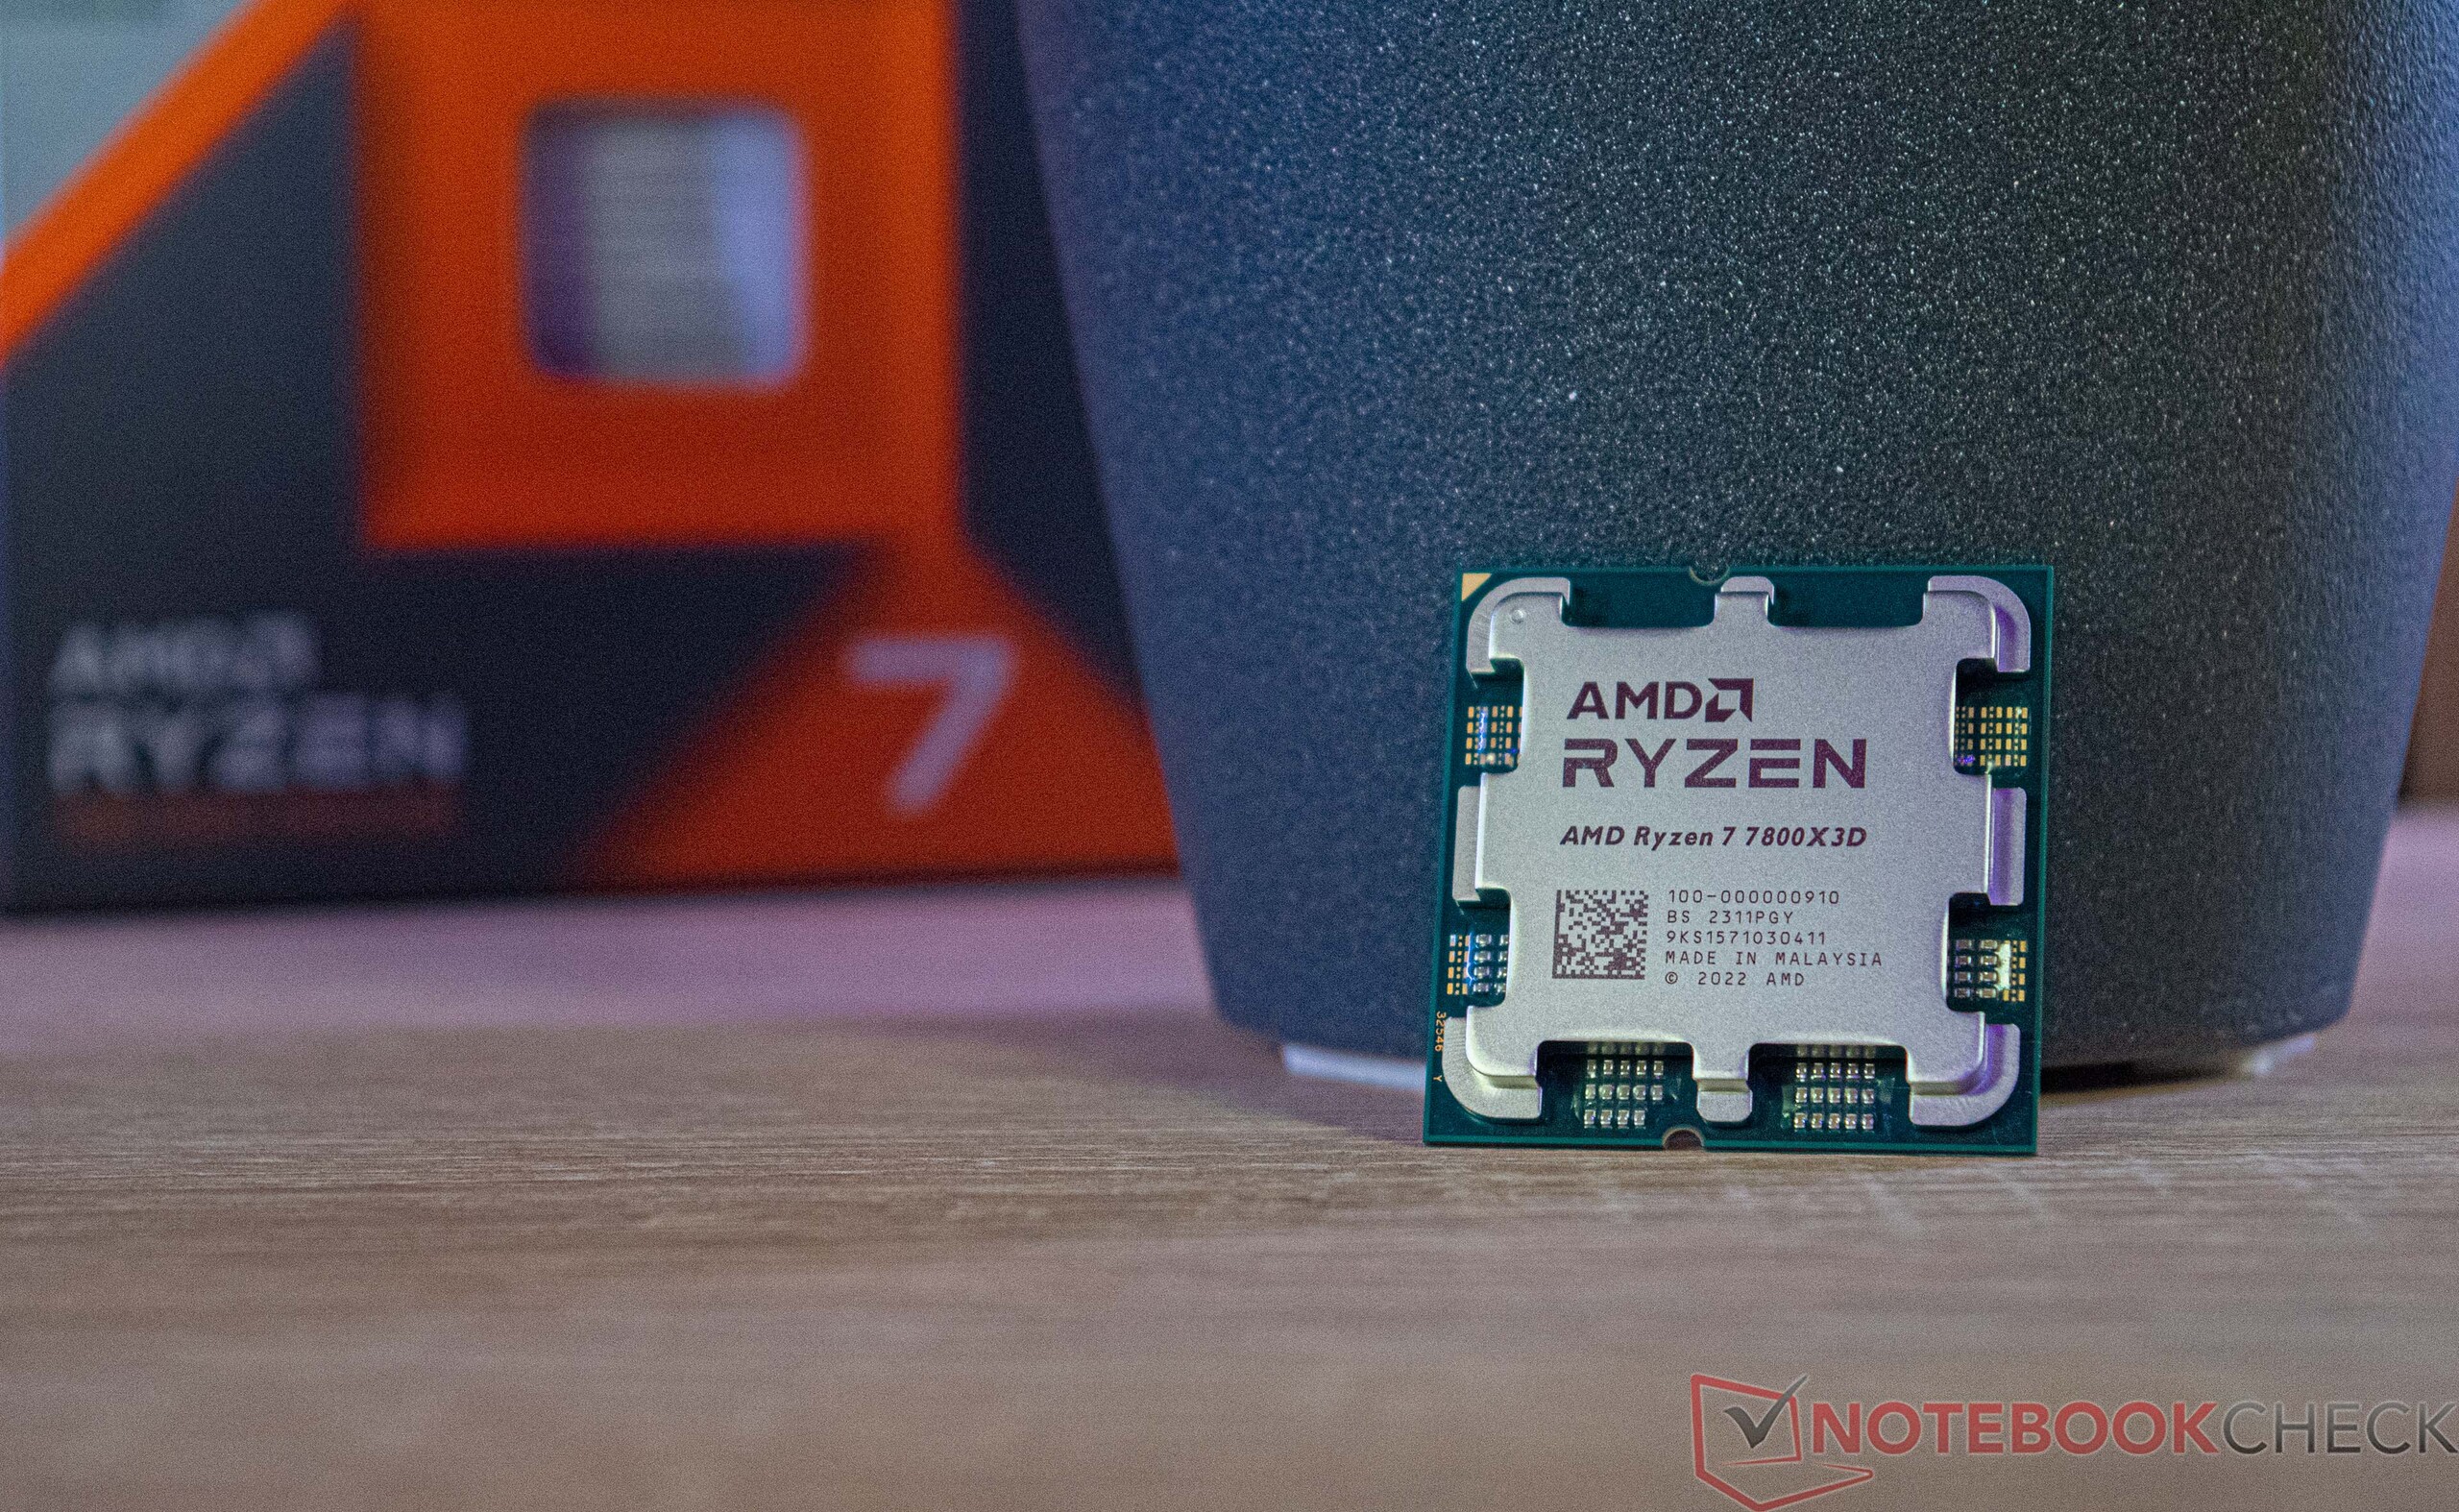
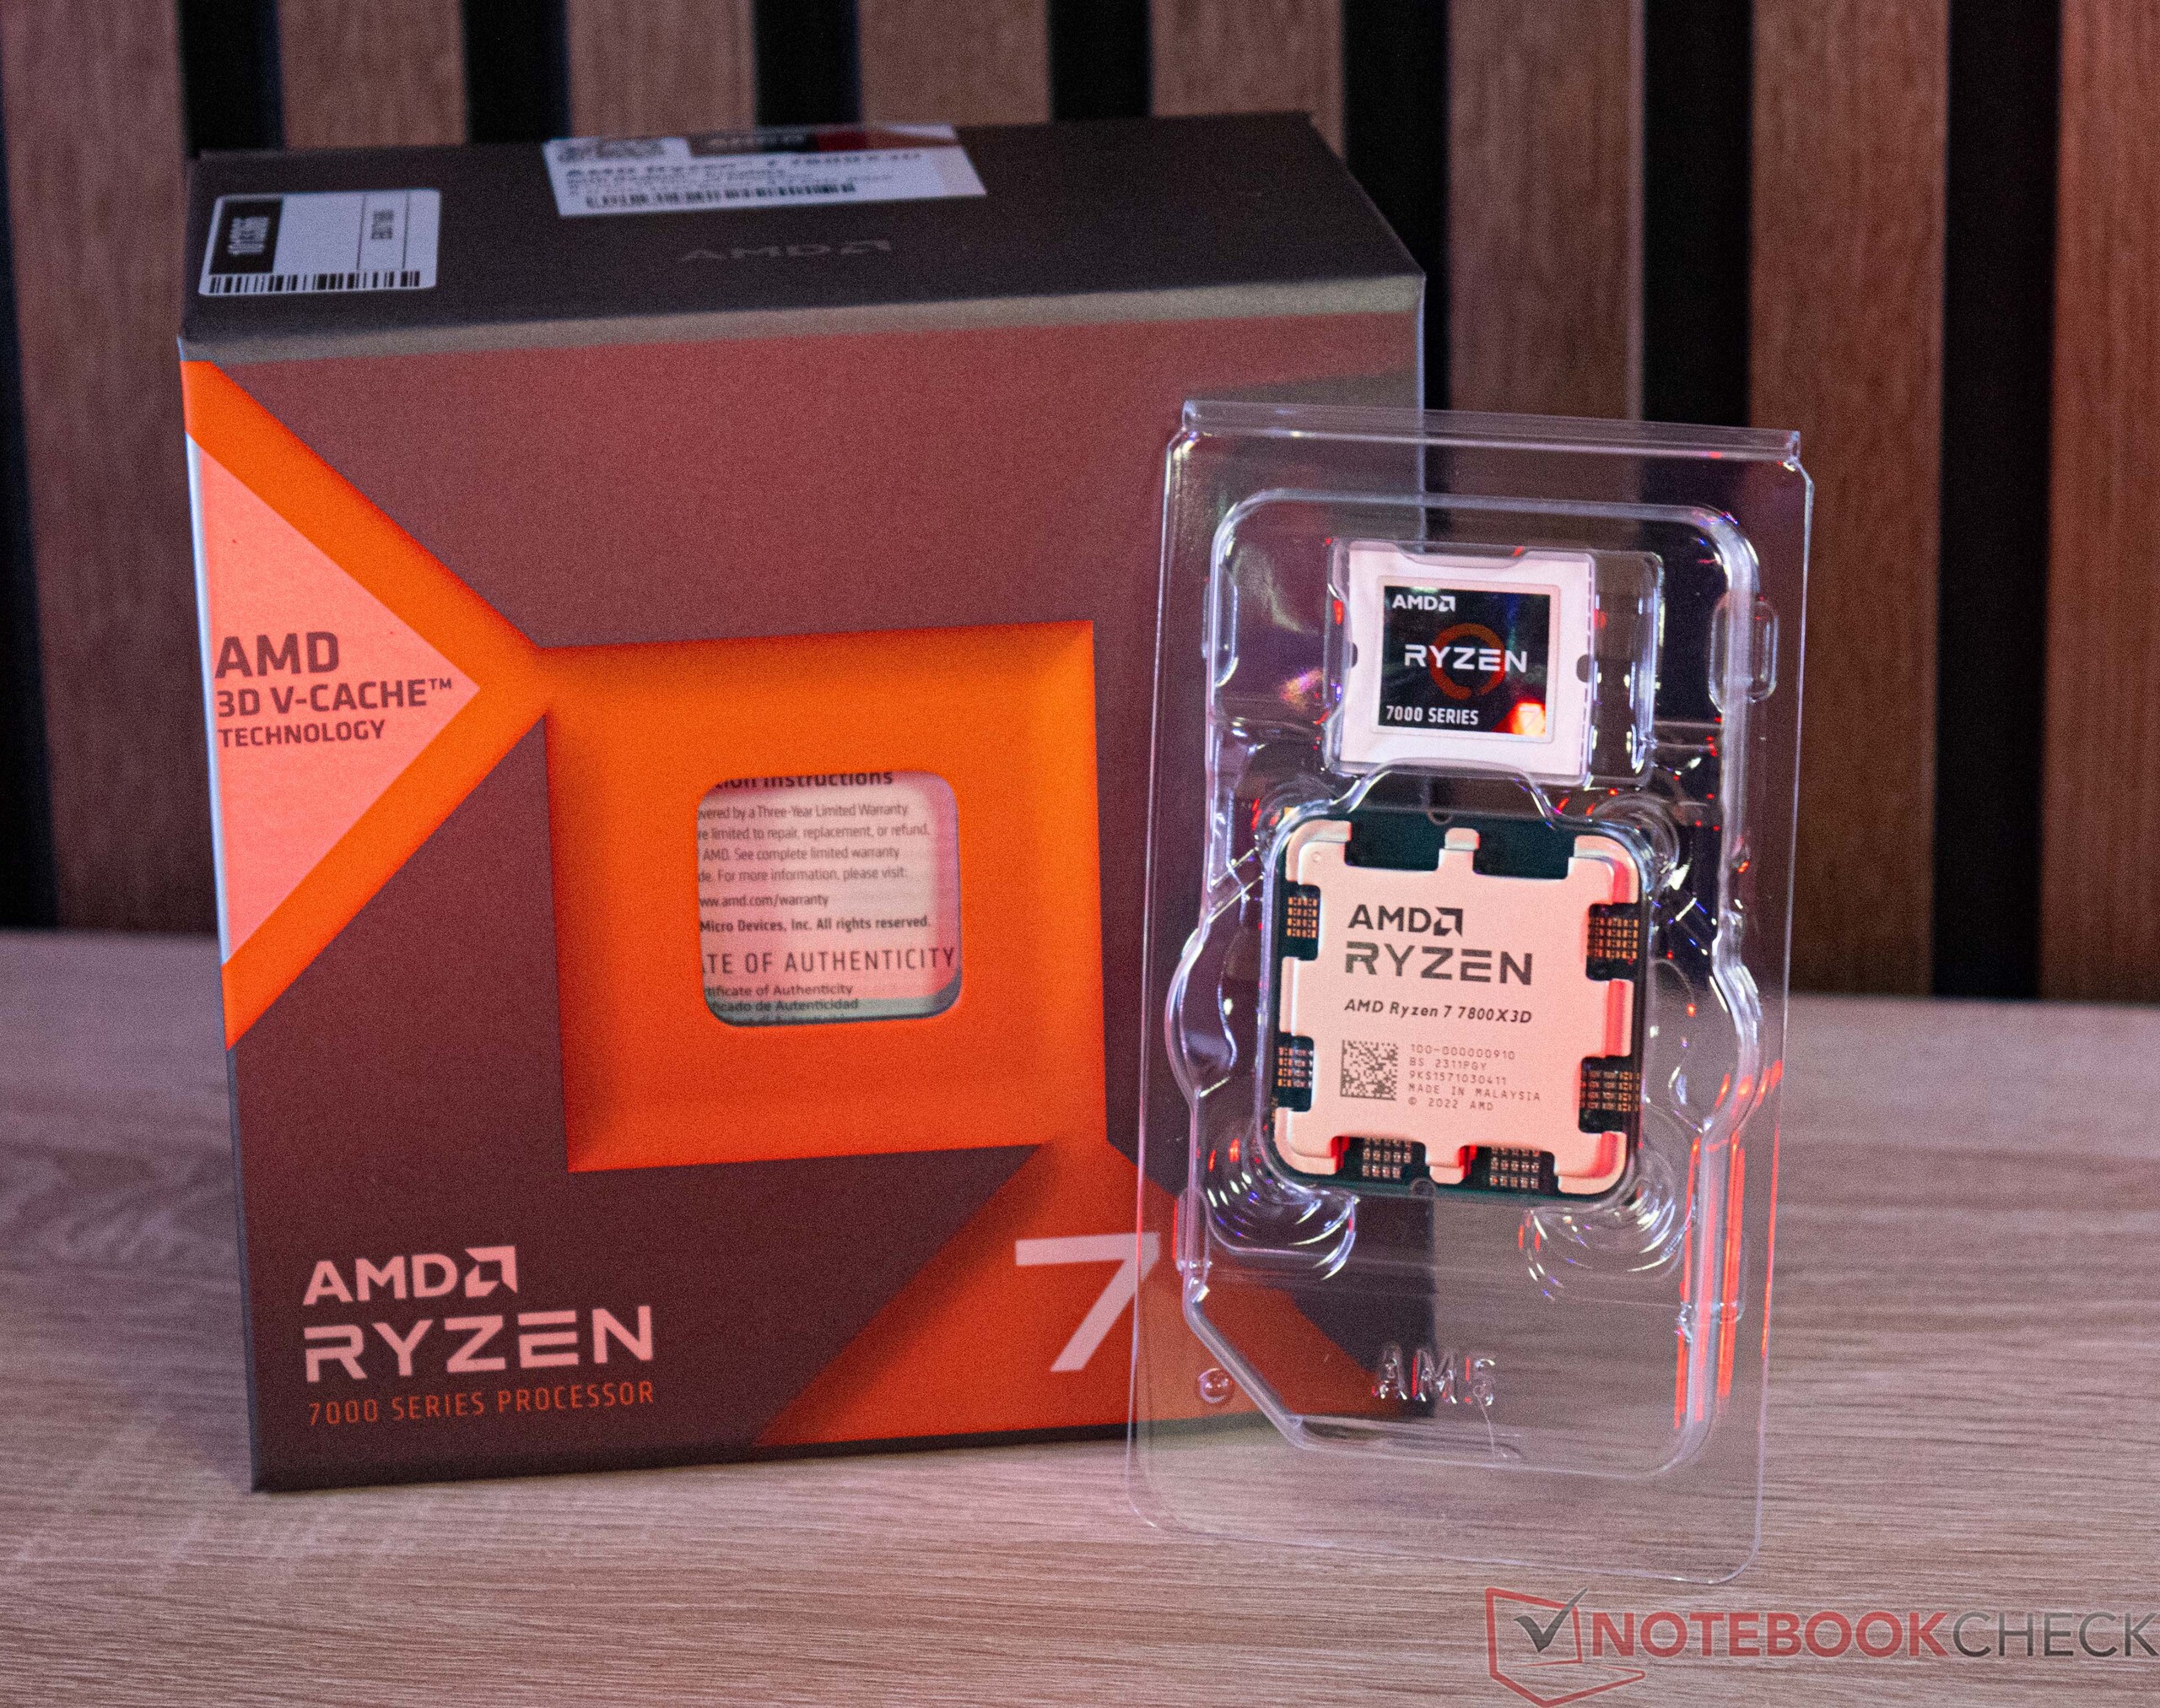
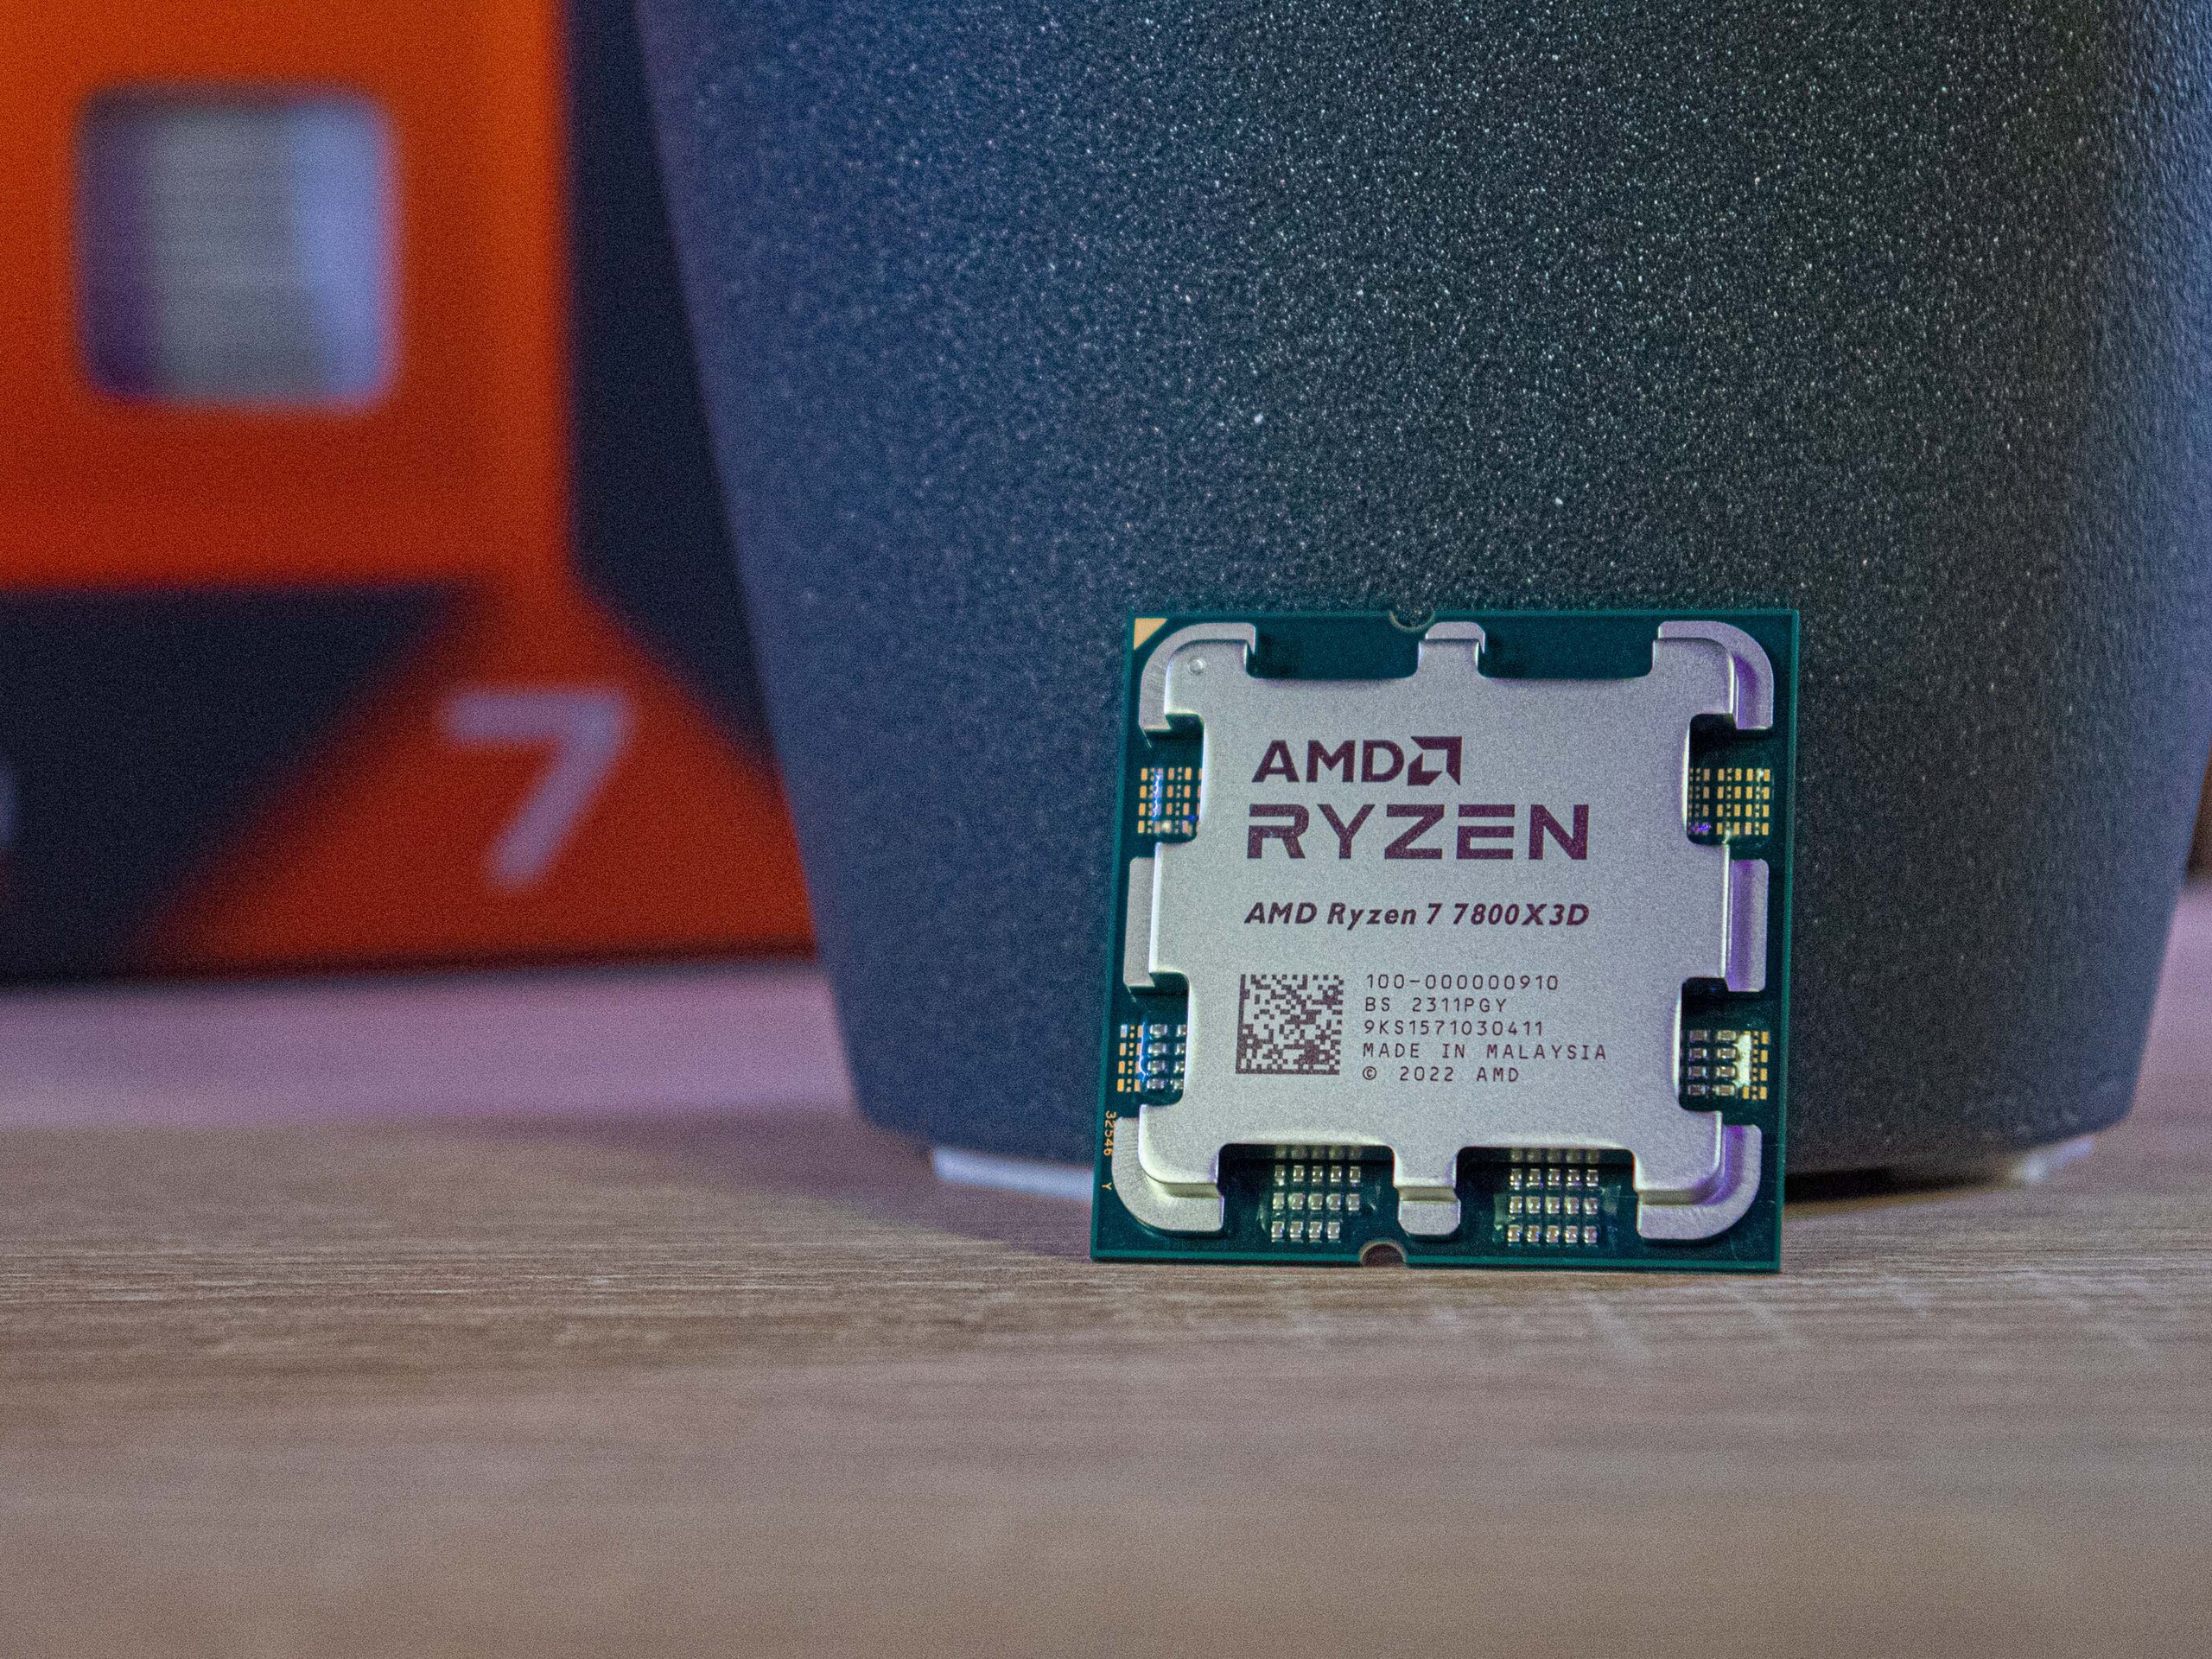
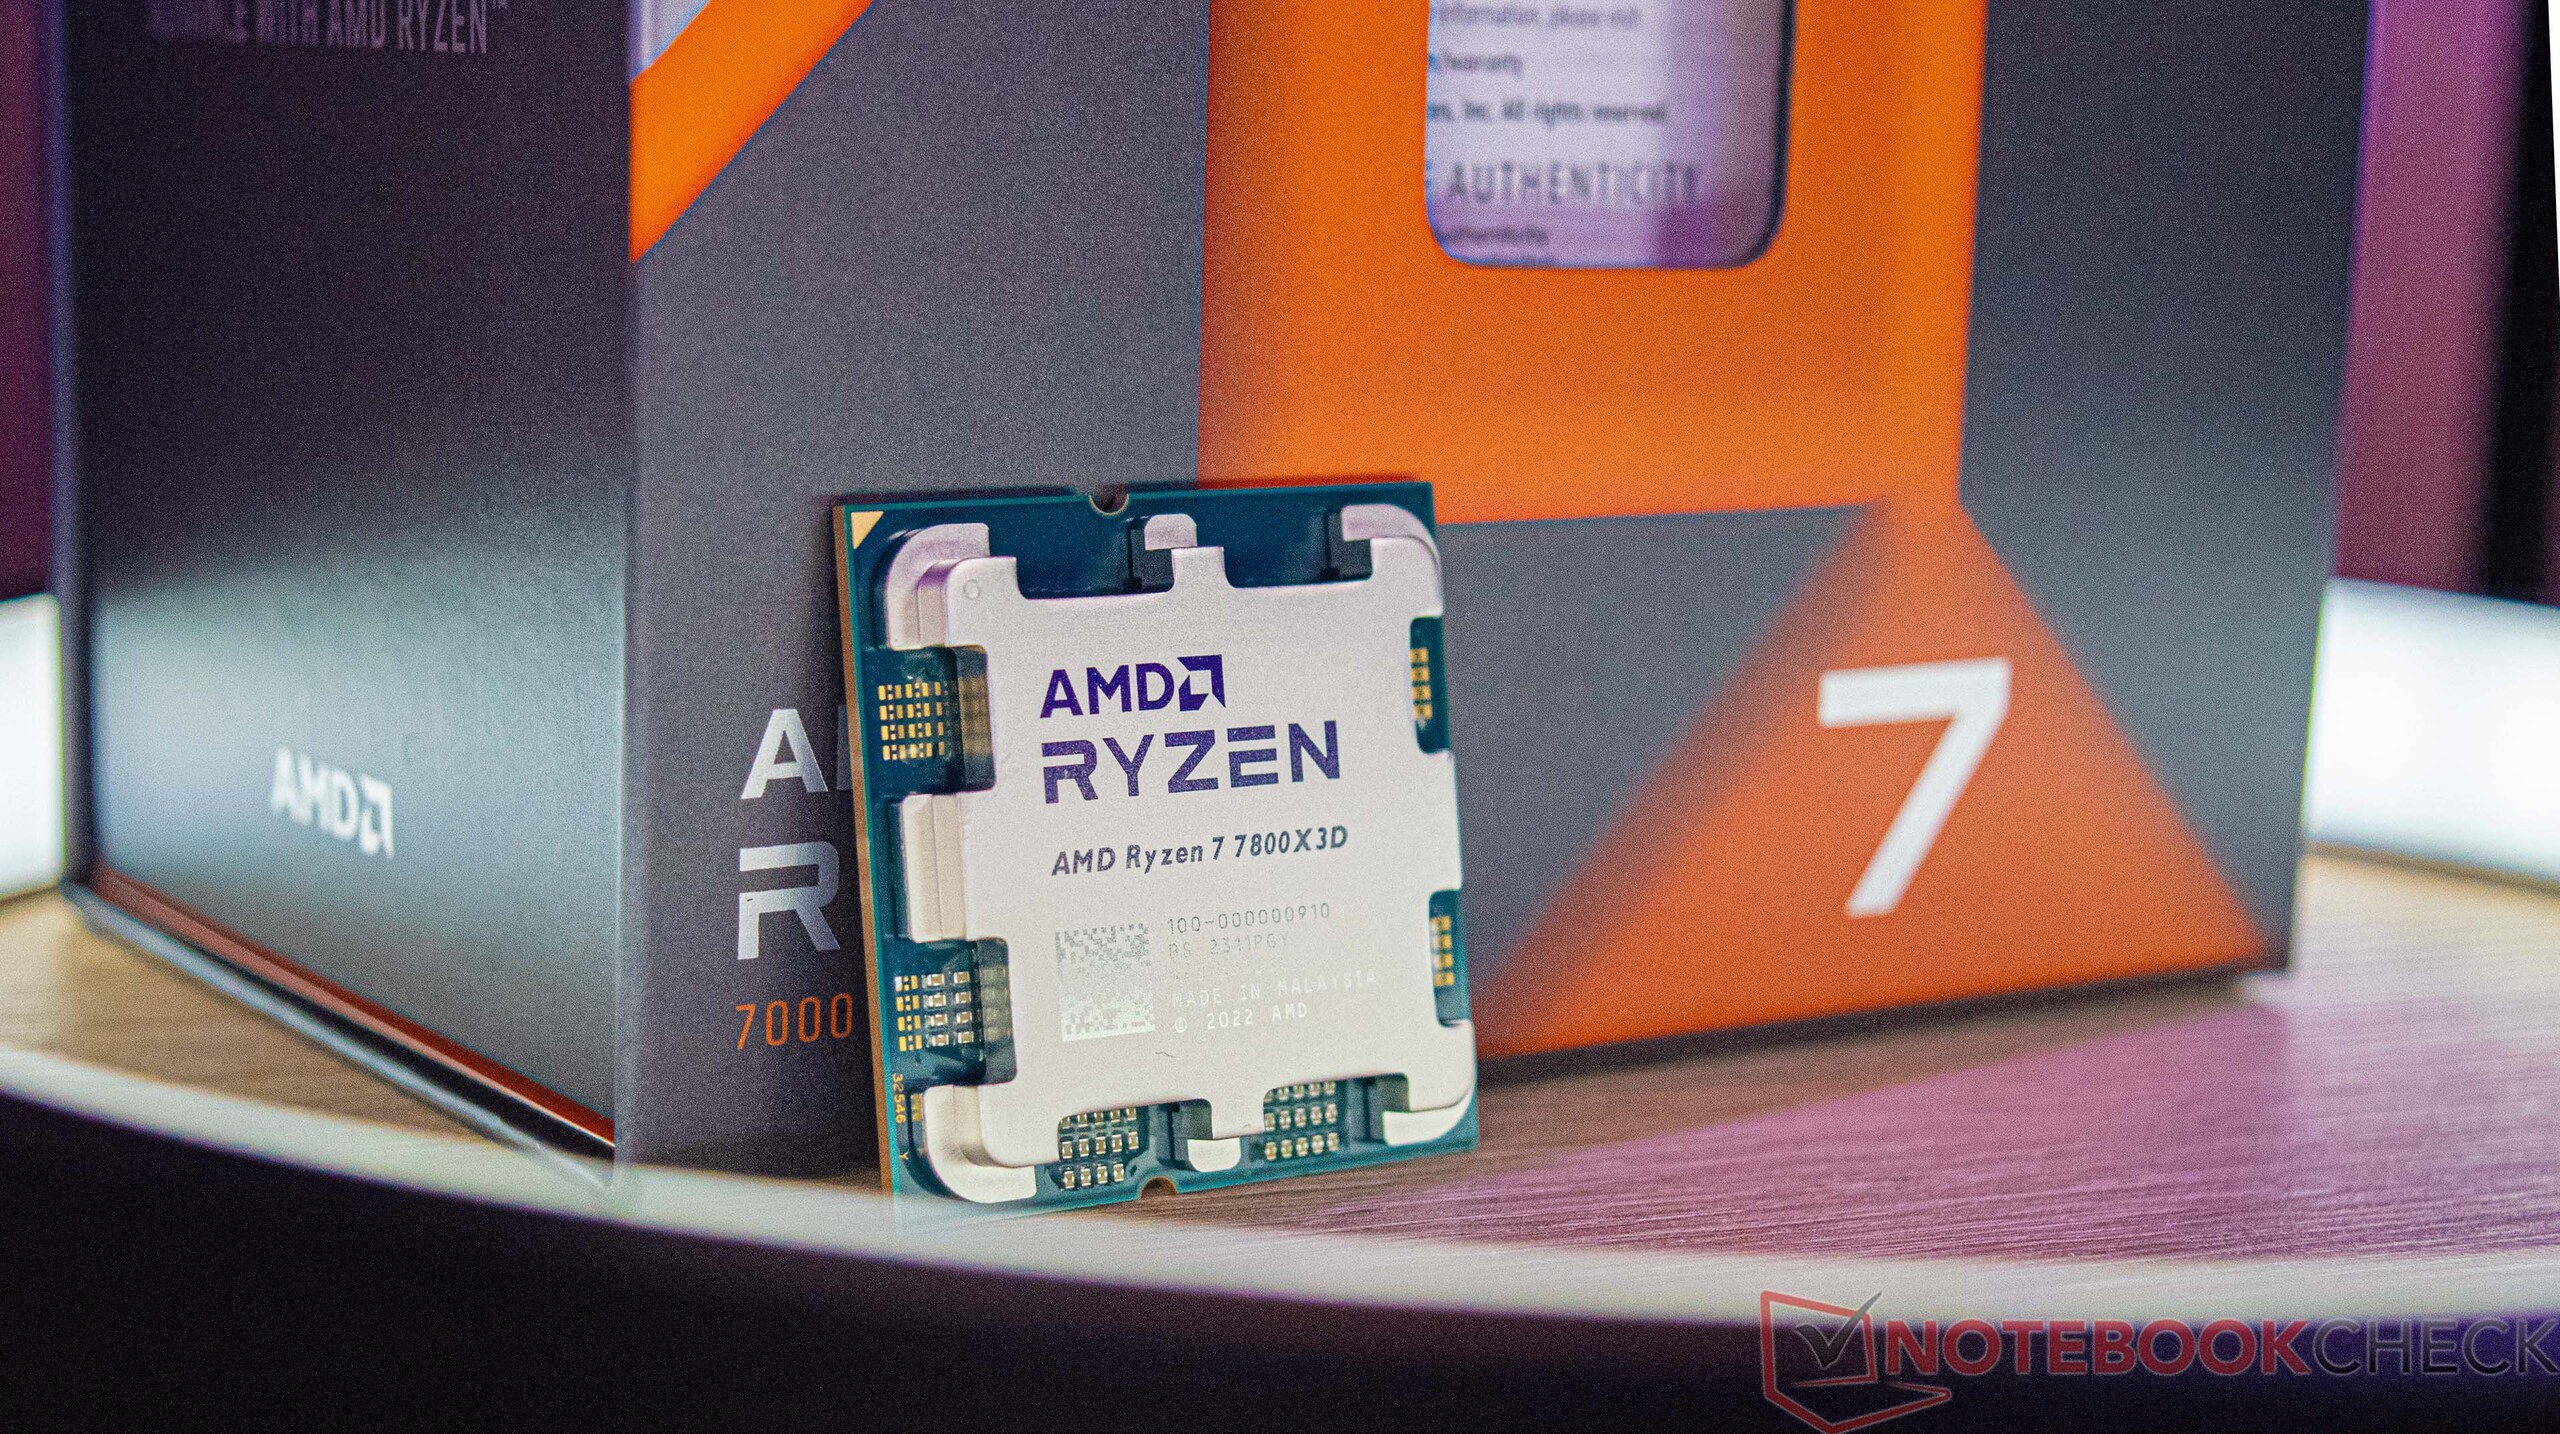
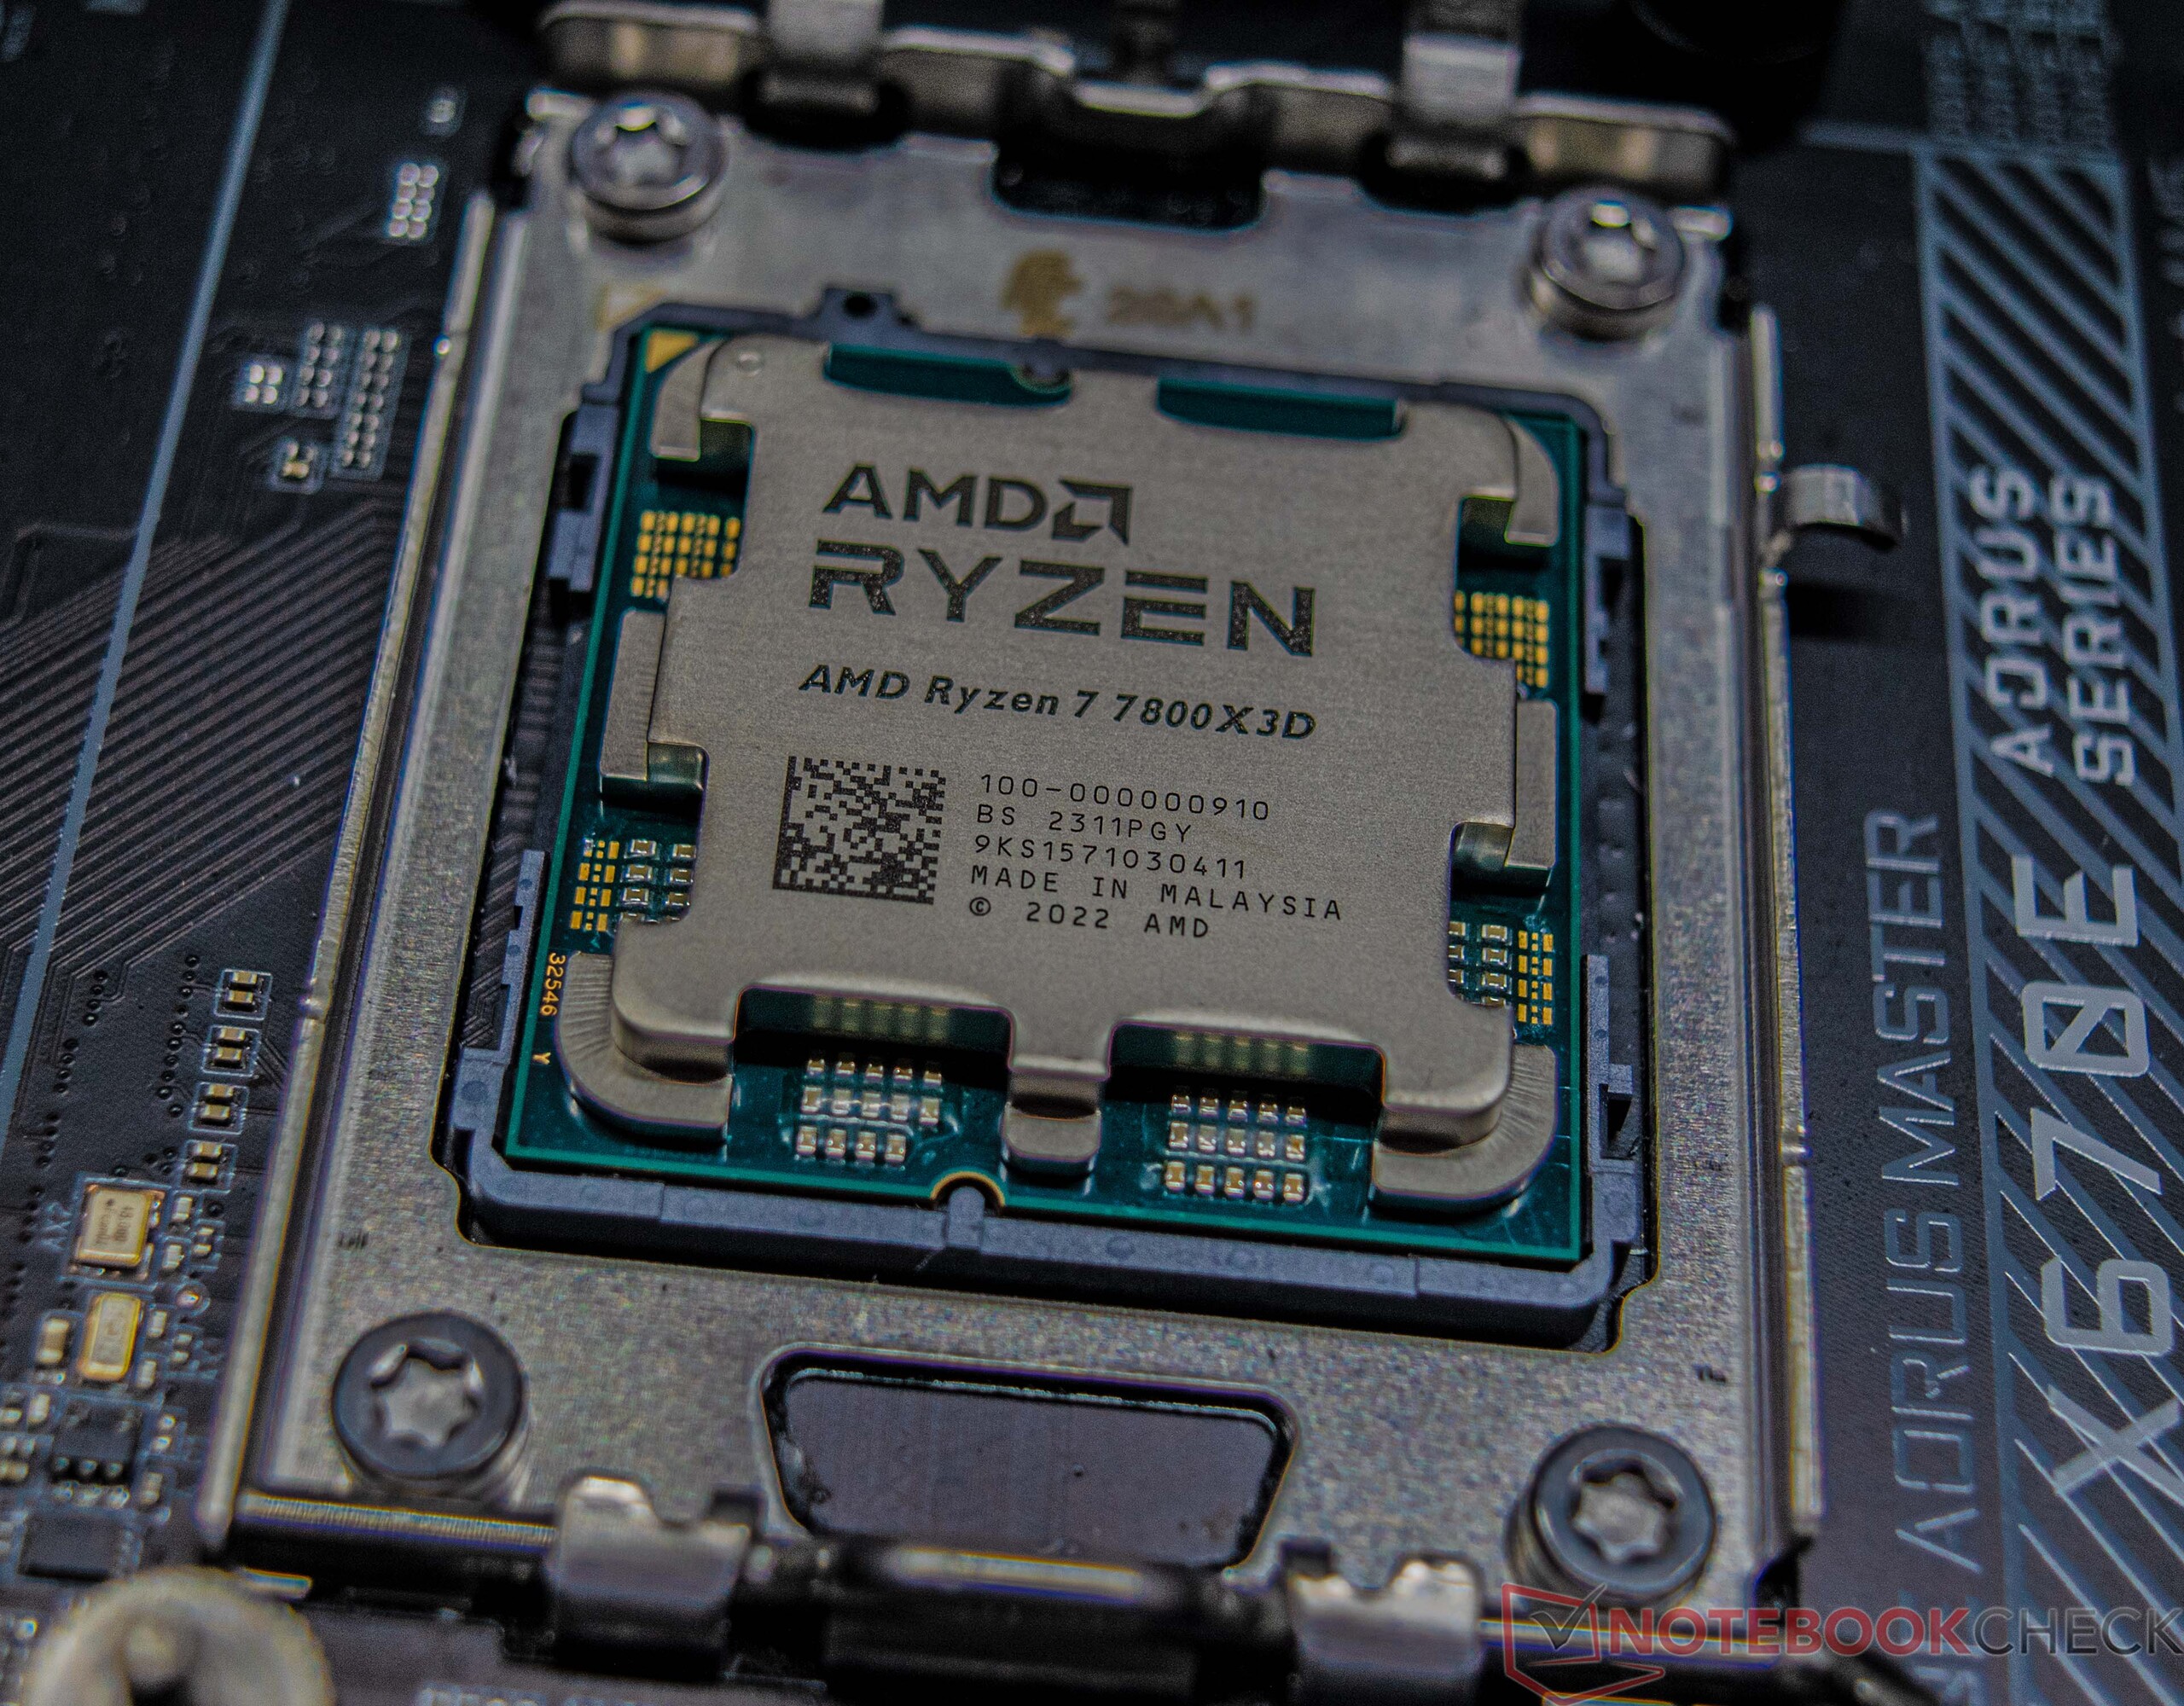
El AMD Ryzen 7 7800X3D es ahora el tercer procesador de AMD basado en AM 5 con 3D V-Sync - después de los dos modelos Ryzen 9 (AMD Ryzen 9 7950X3Dy AMD Ryzen 9 7900X3D). Junto con los dos modelos mayores, el procesador nativo de 8 núcleos se presentó el pasado mes de enero en el CES de Las Vegas. Aunque hubo que esperar bastante hasta que el componente salió finalmente al mercado el 6 de abril de 2023.
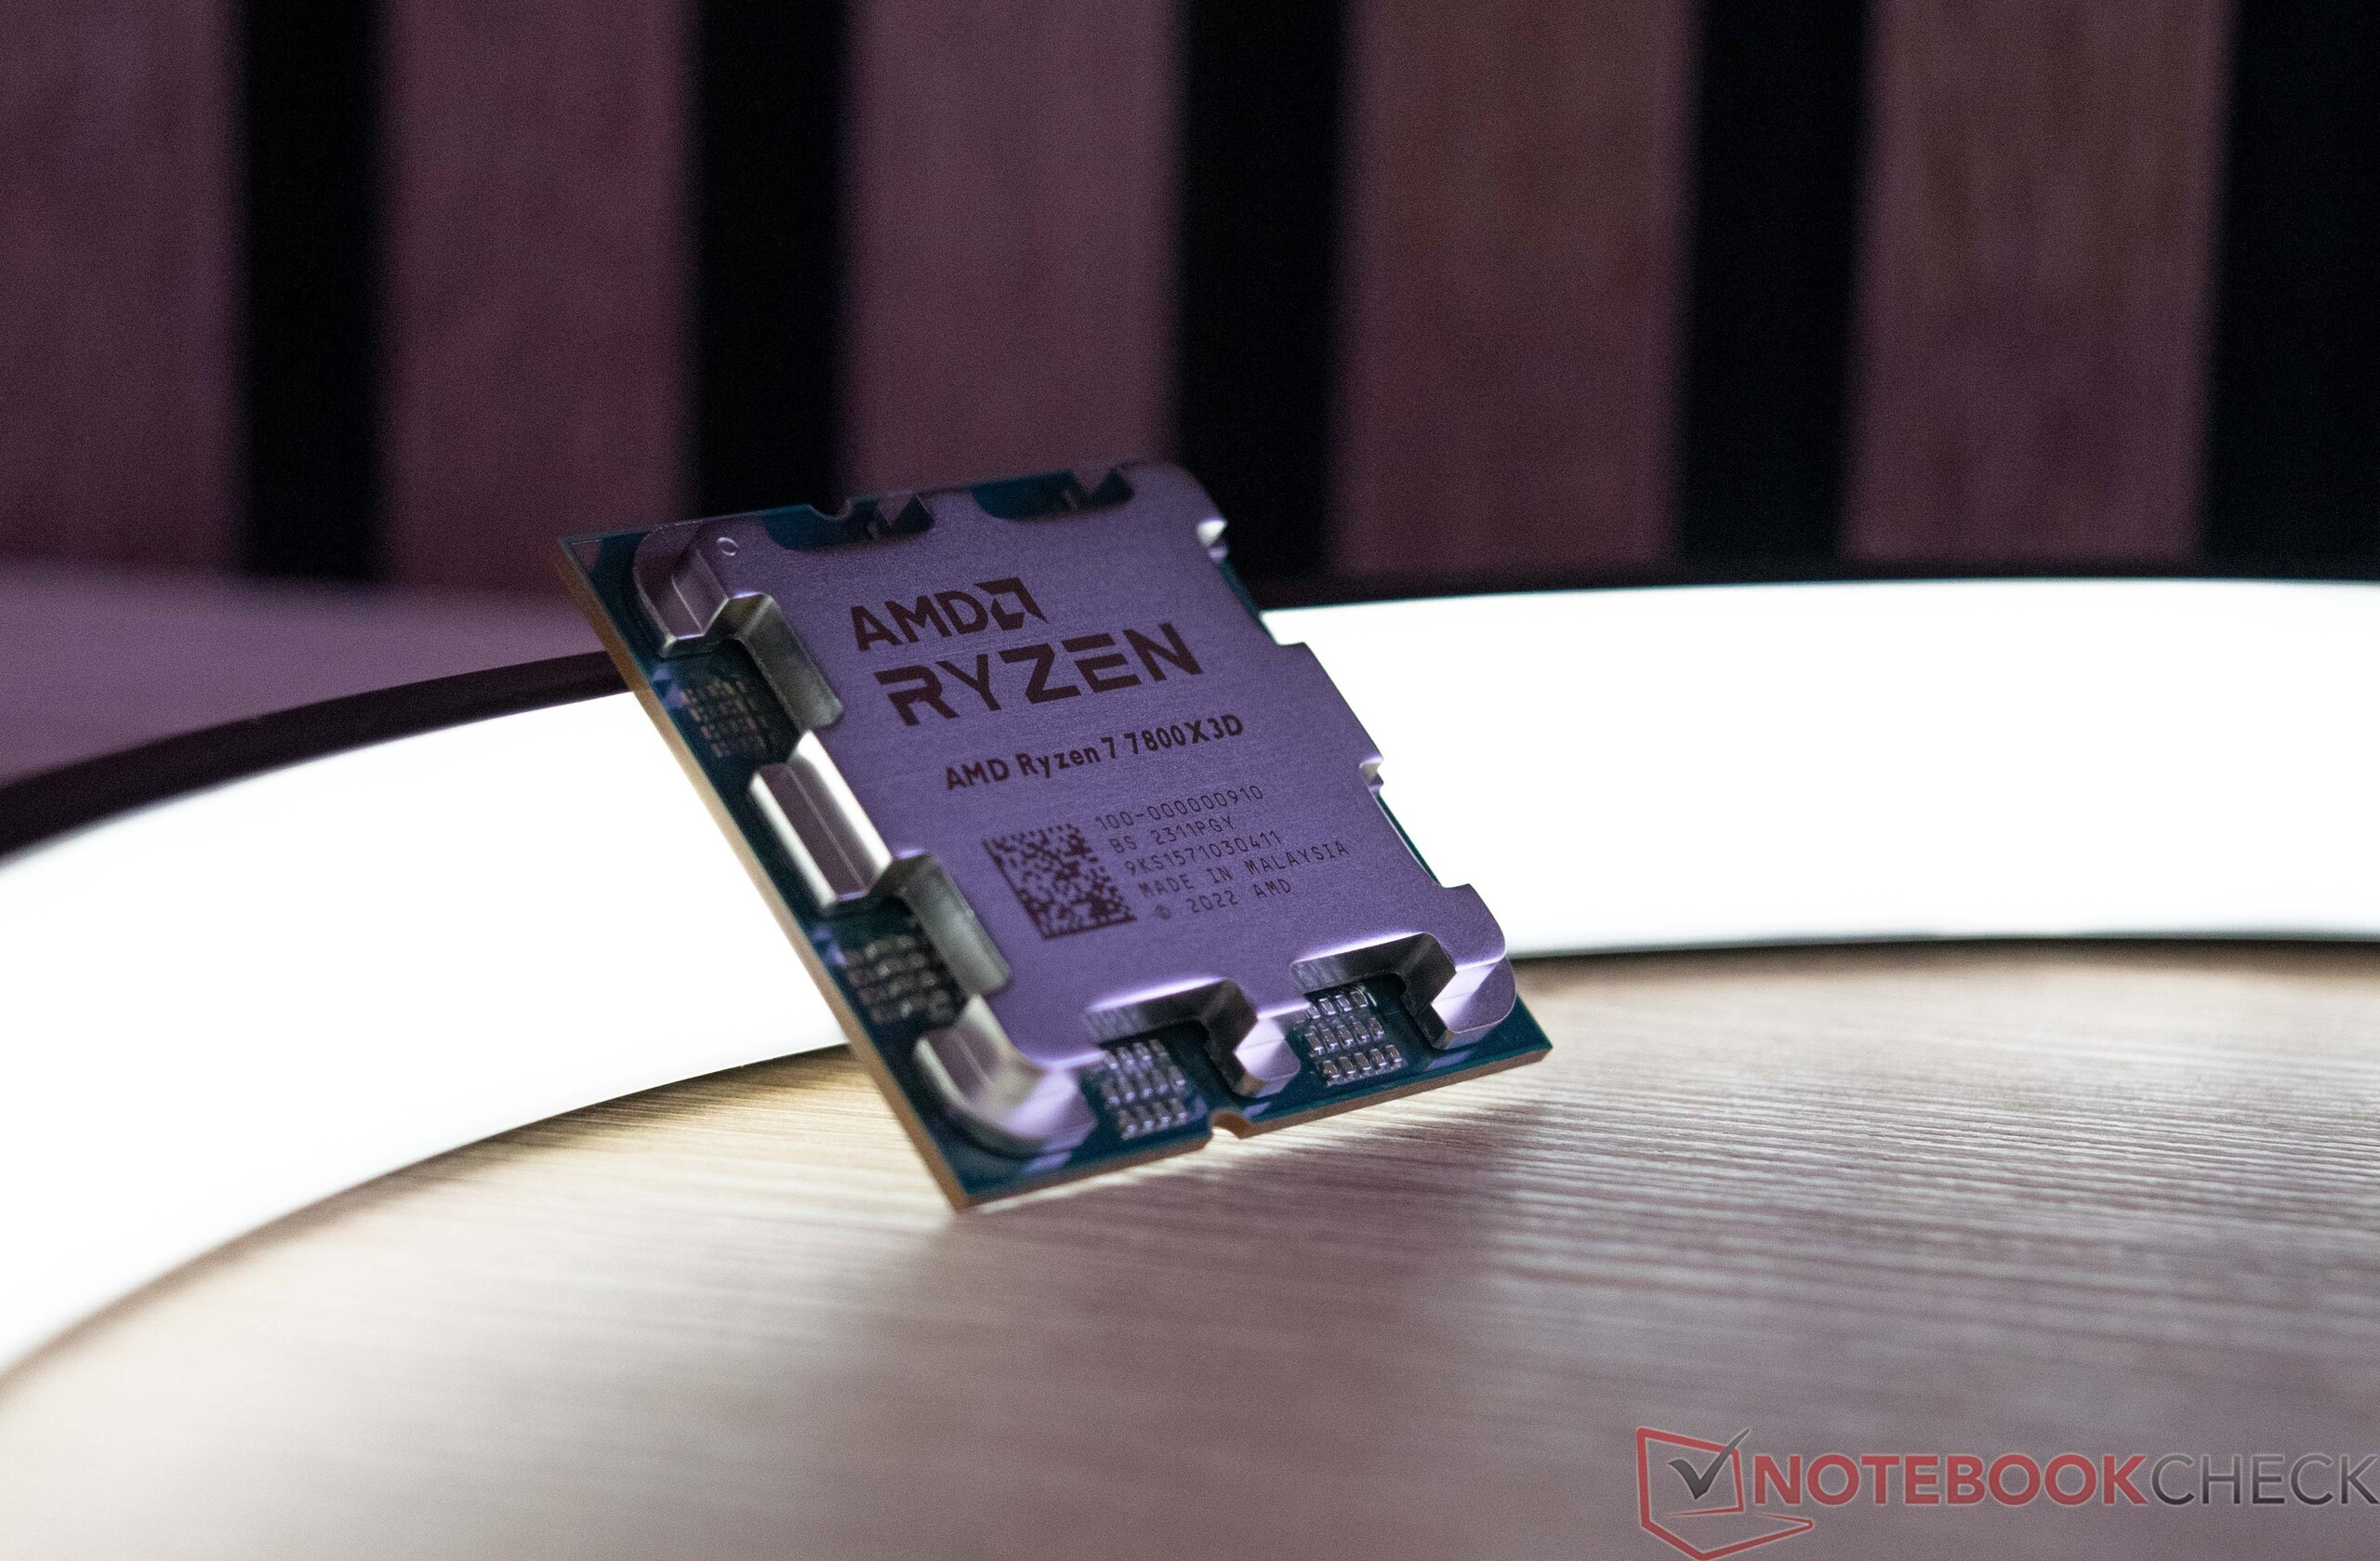
Nosotros ya probado el AMD Ryzen 9 7950X3D a fondo y quedamos impresionados por su gran rendimiento y bajo consumo. Veremos qué tal le va al AMD Ryzen 7 7800X3D en comparación. En general, su 3D V-Cache debería resultar en un aumento del rendimiento, lo que significa que elAMD Ryzen 7 5800X3Dbasado en AM4 debería seguir siendo bastante popular. Sin embargo, su estructura interna es diferente en comparación con los dos modelos Ryzen 9 que tienen esta V-Cache 3D. El AMD Ryzen 7 7800X3D sólo tiene un CCD con 8 núcleos incluyendo caché rápida, y a su vez, los modelos Ryzen 9 tienen dos CCD con 6 y 8 núcleos de CPU, respectivamente. Pero, sólo uno de los CCD está equipado con el 3D V-Cache, mientras que el otro CCD es bien conocido delAMD Ryzen 9 7950X. Un CCD es el troquel real de la CPU bajo el disipador de calor, que combina un máximo de ocho núcleos.
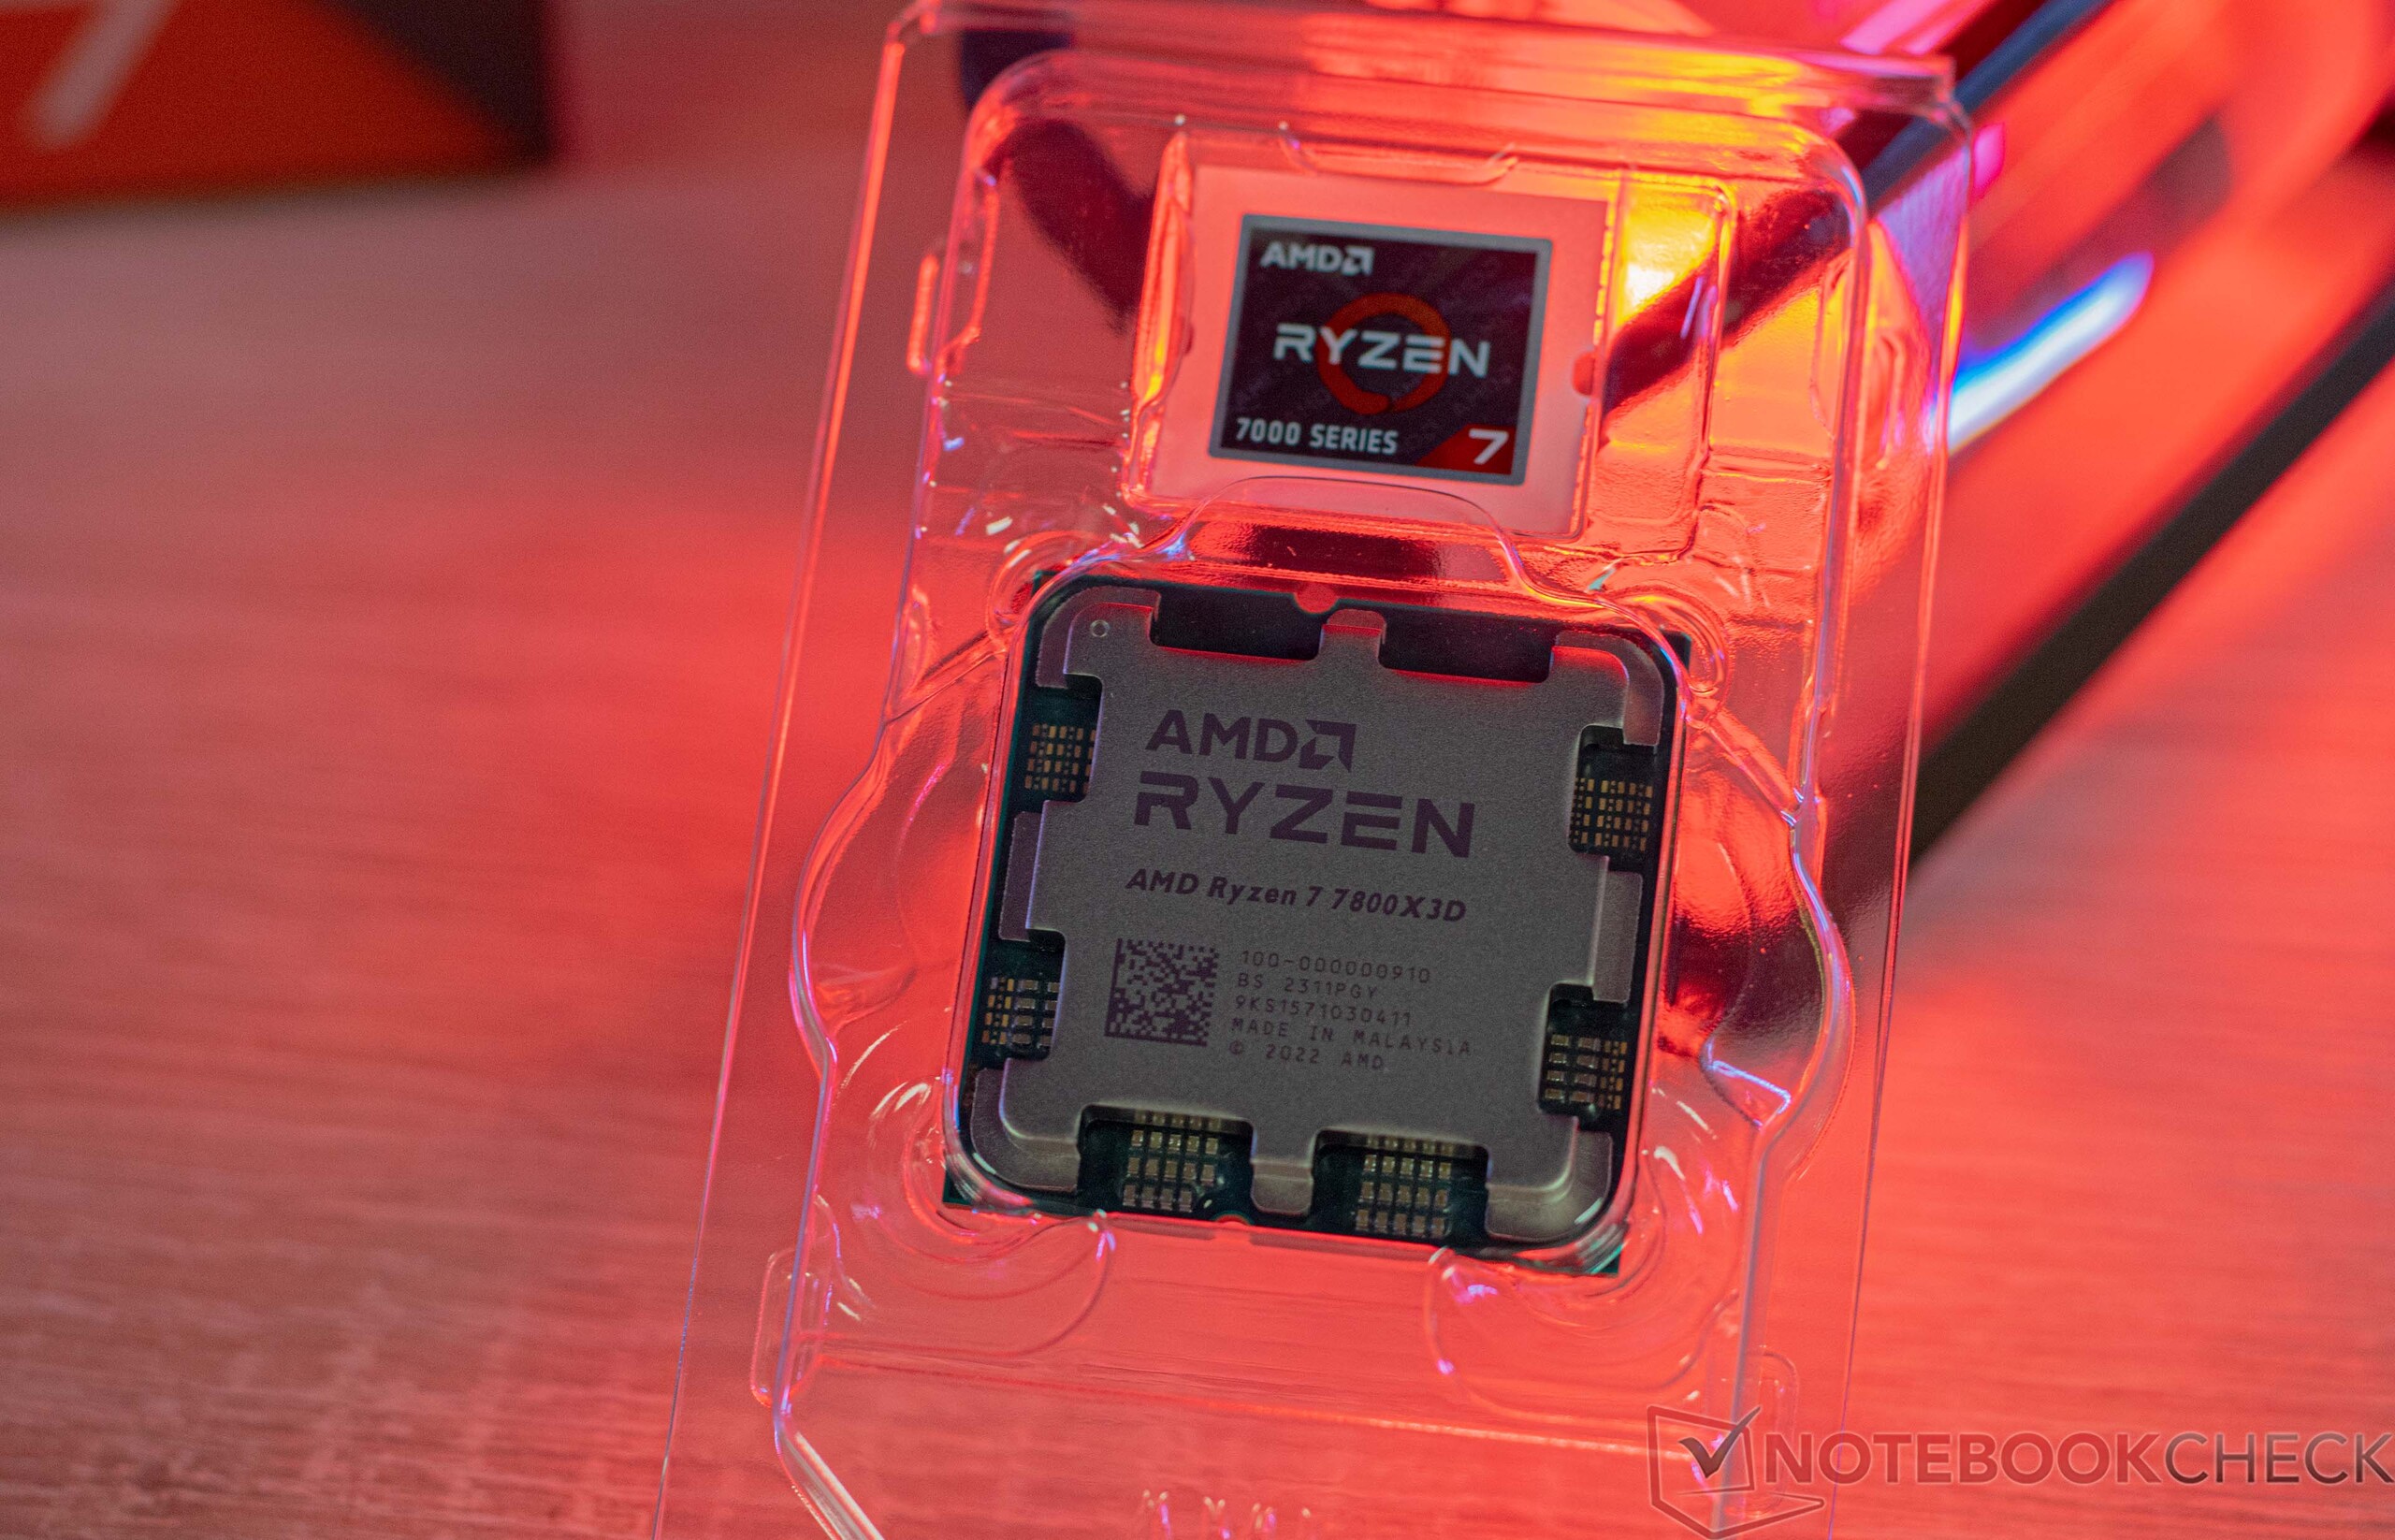
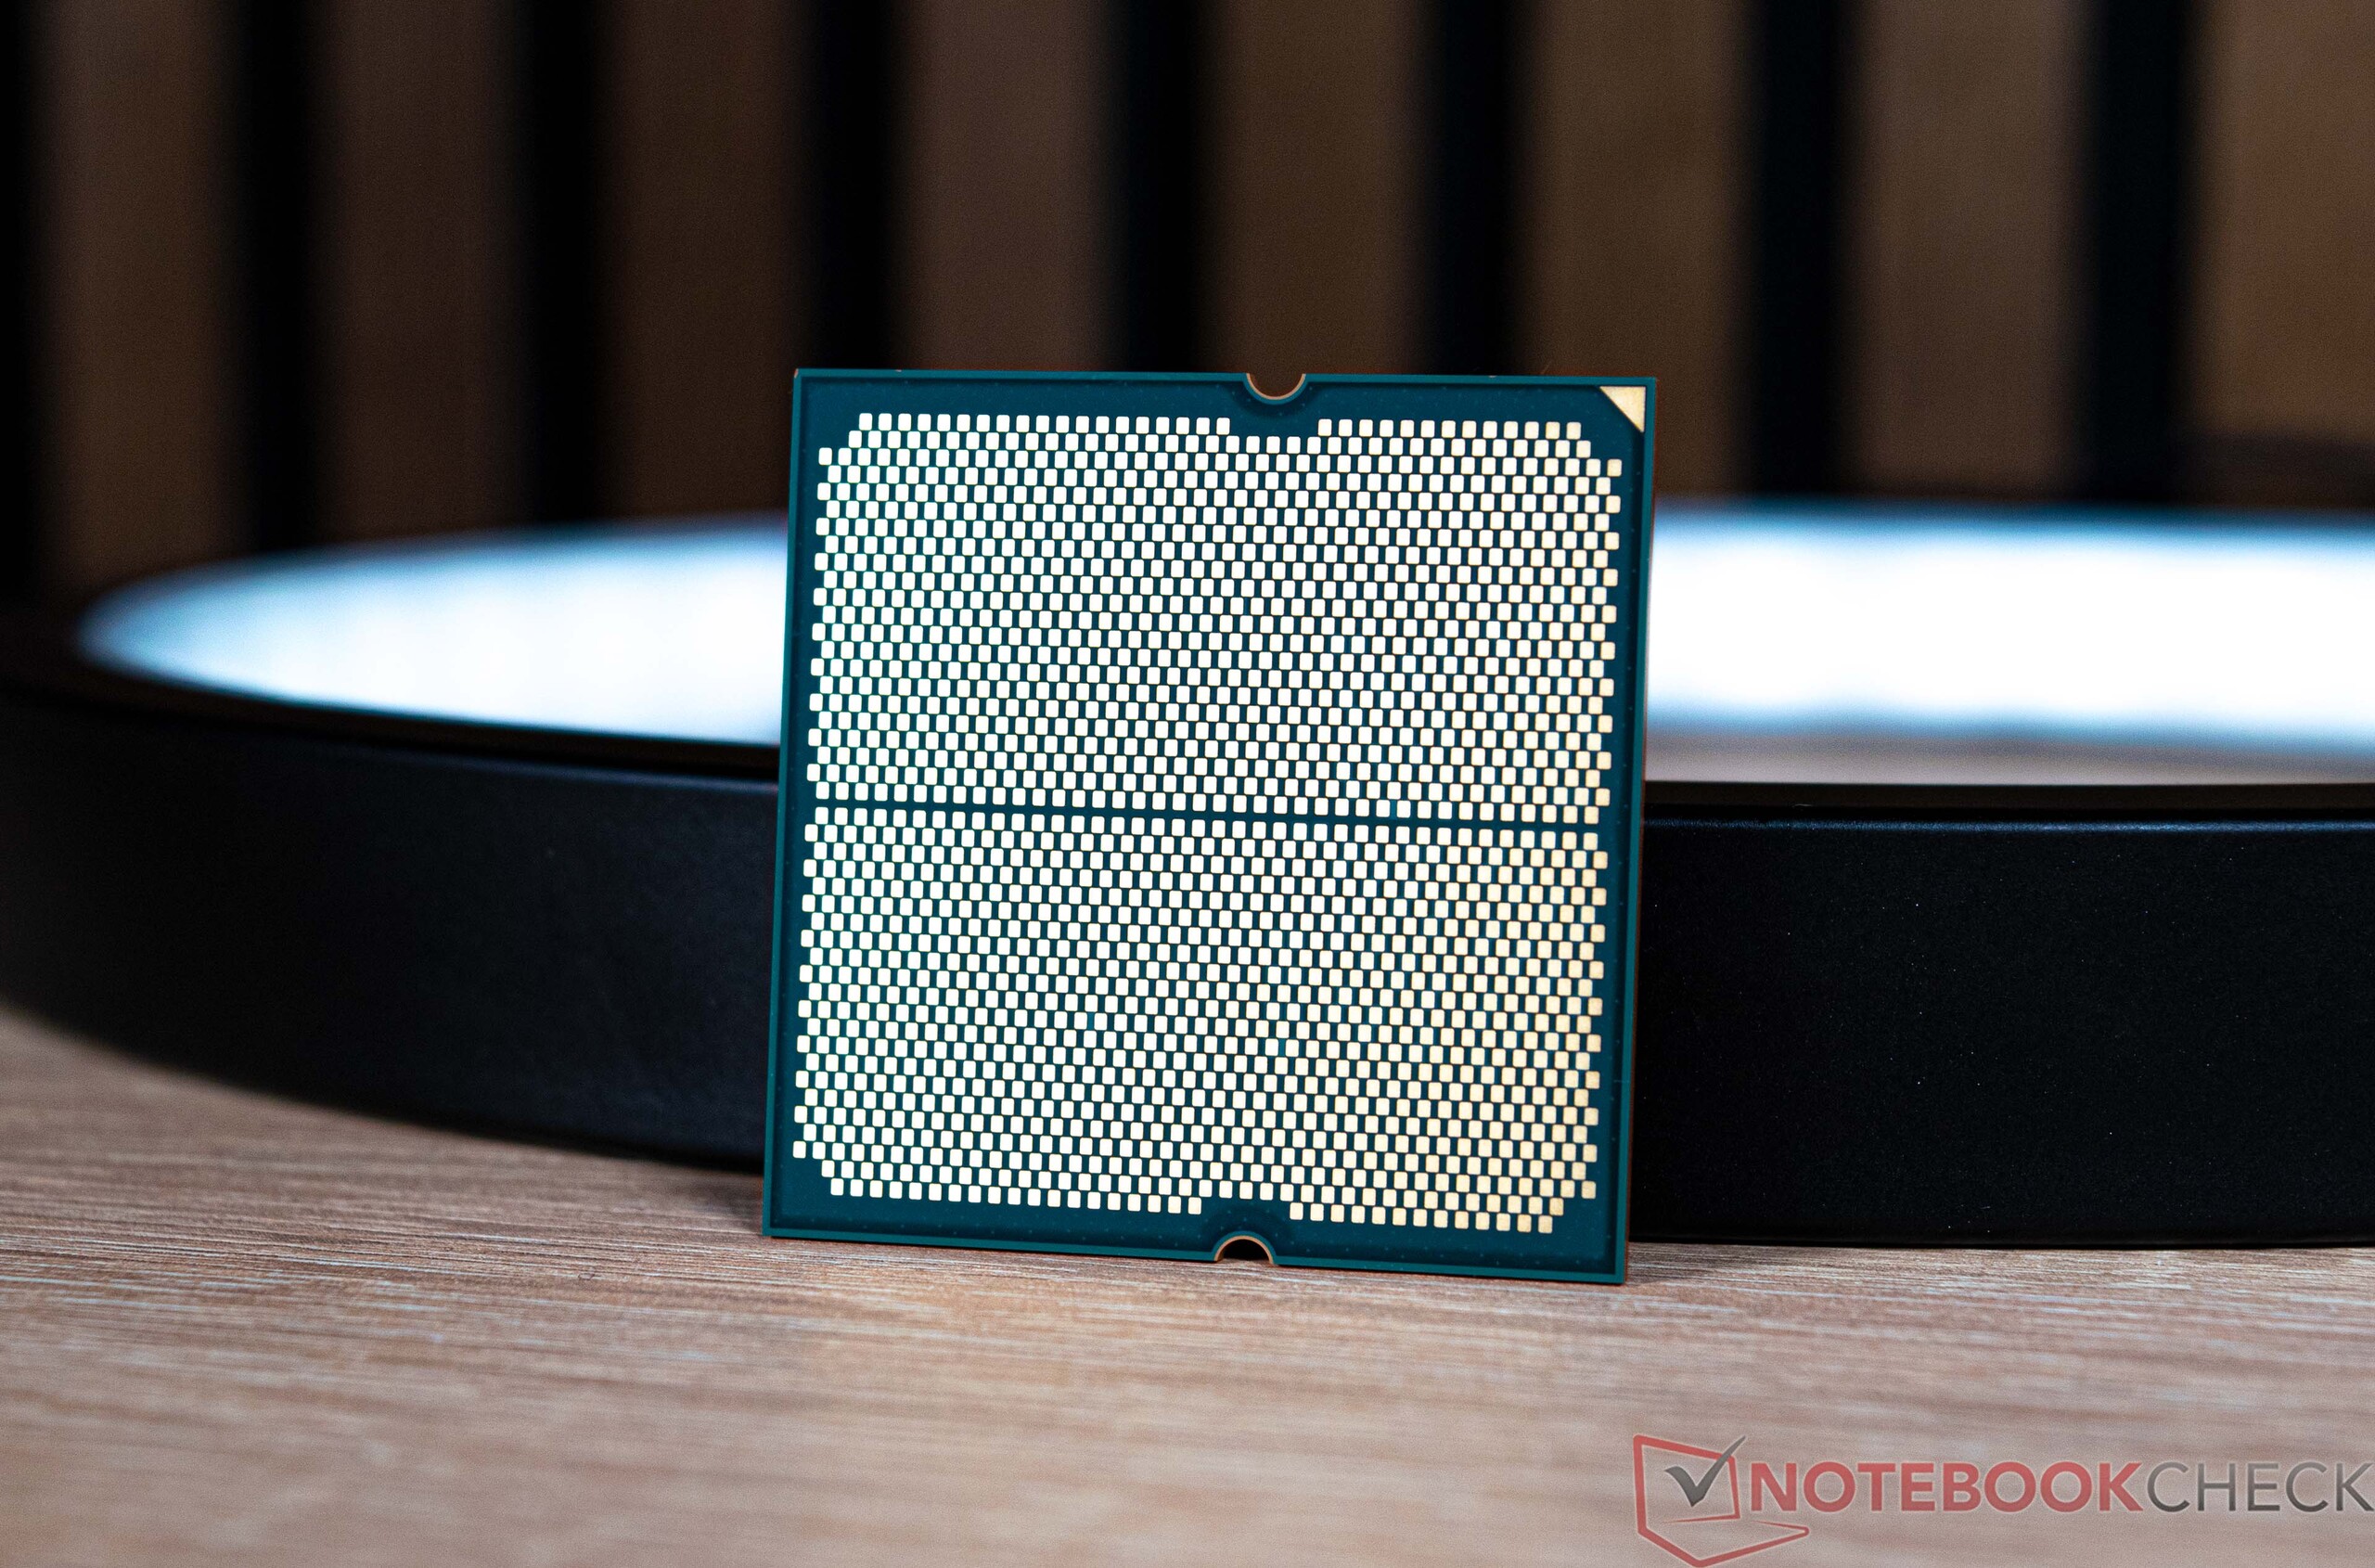
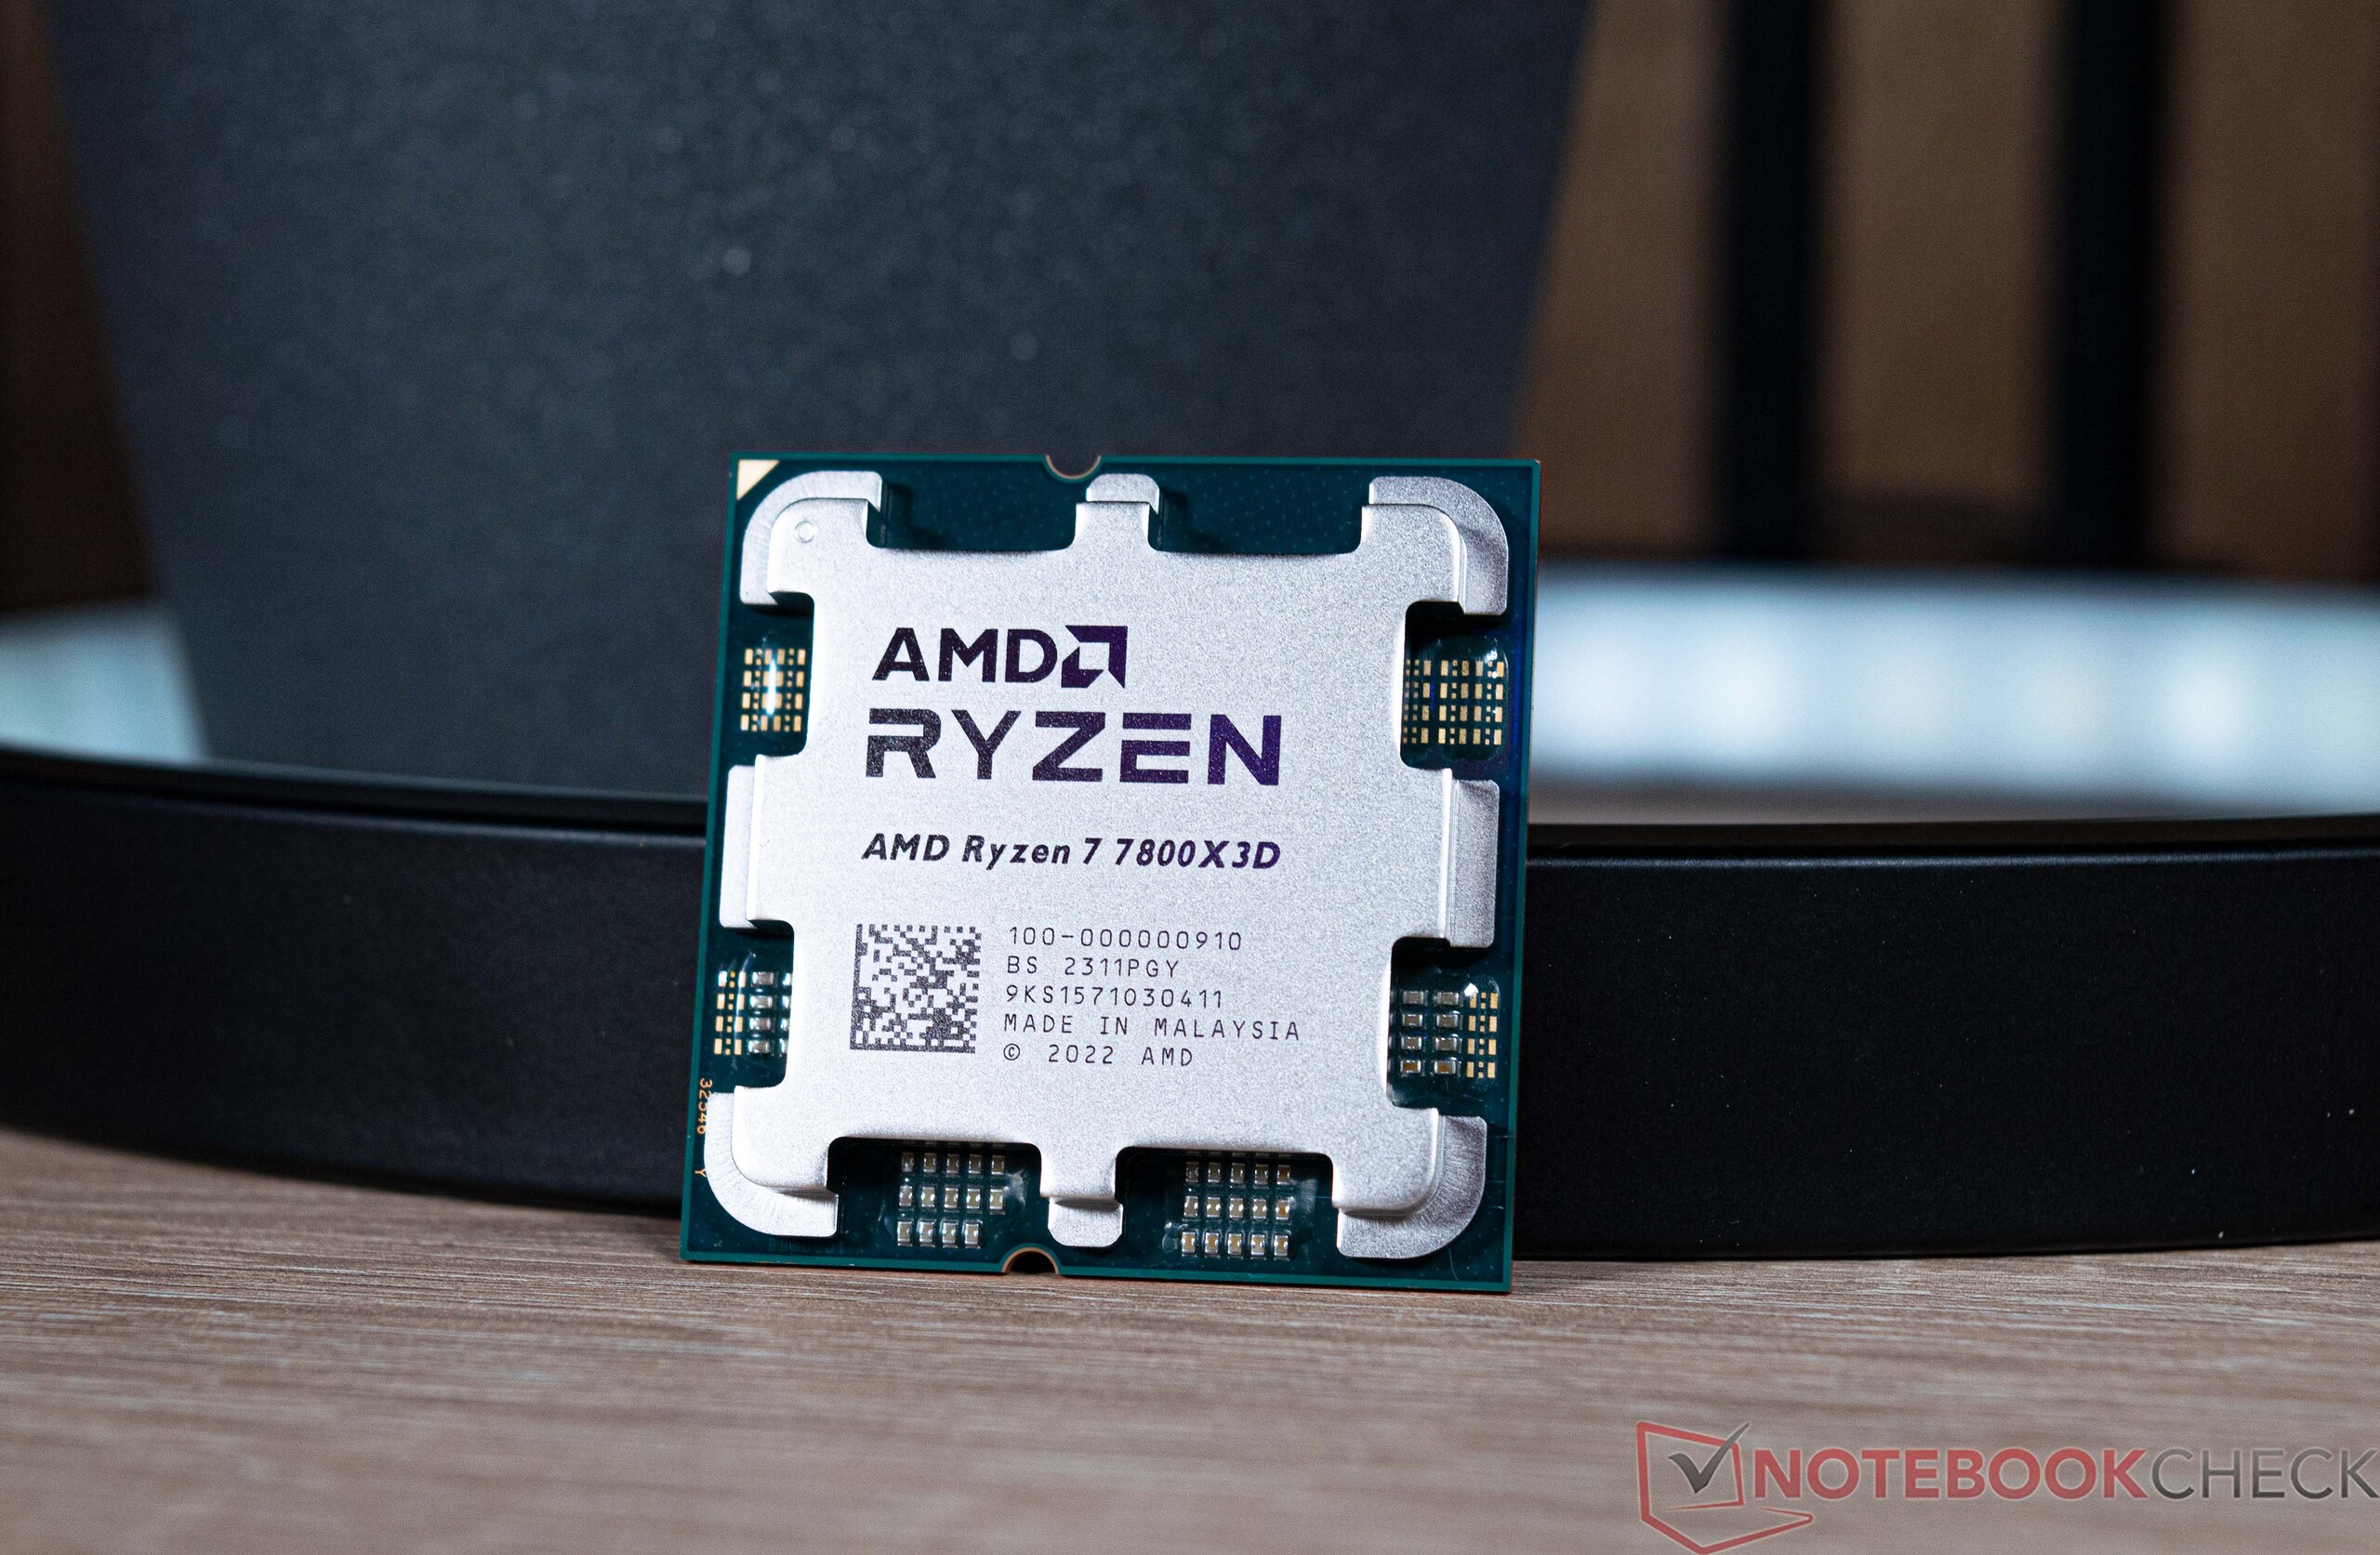
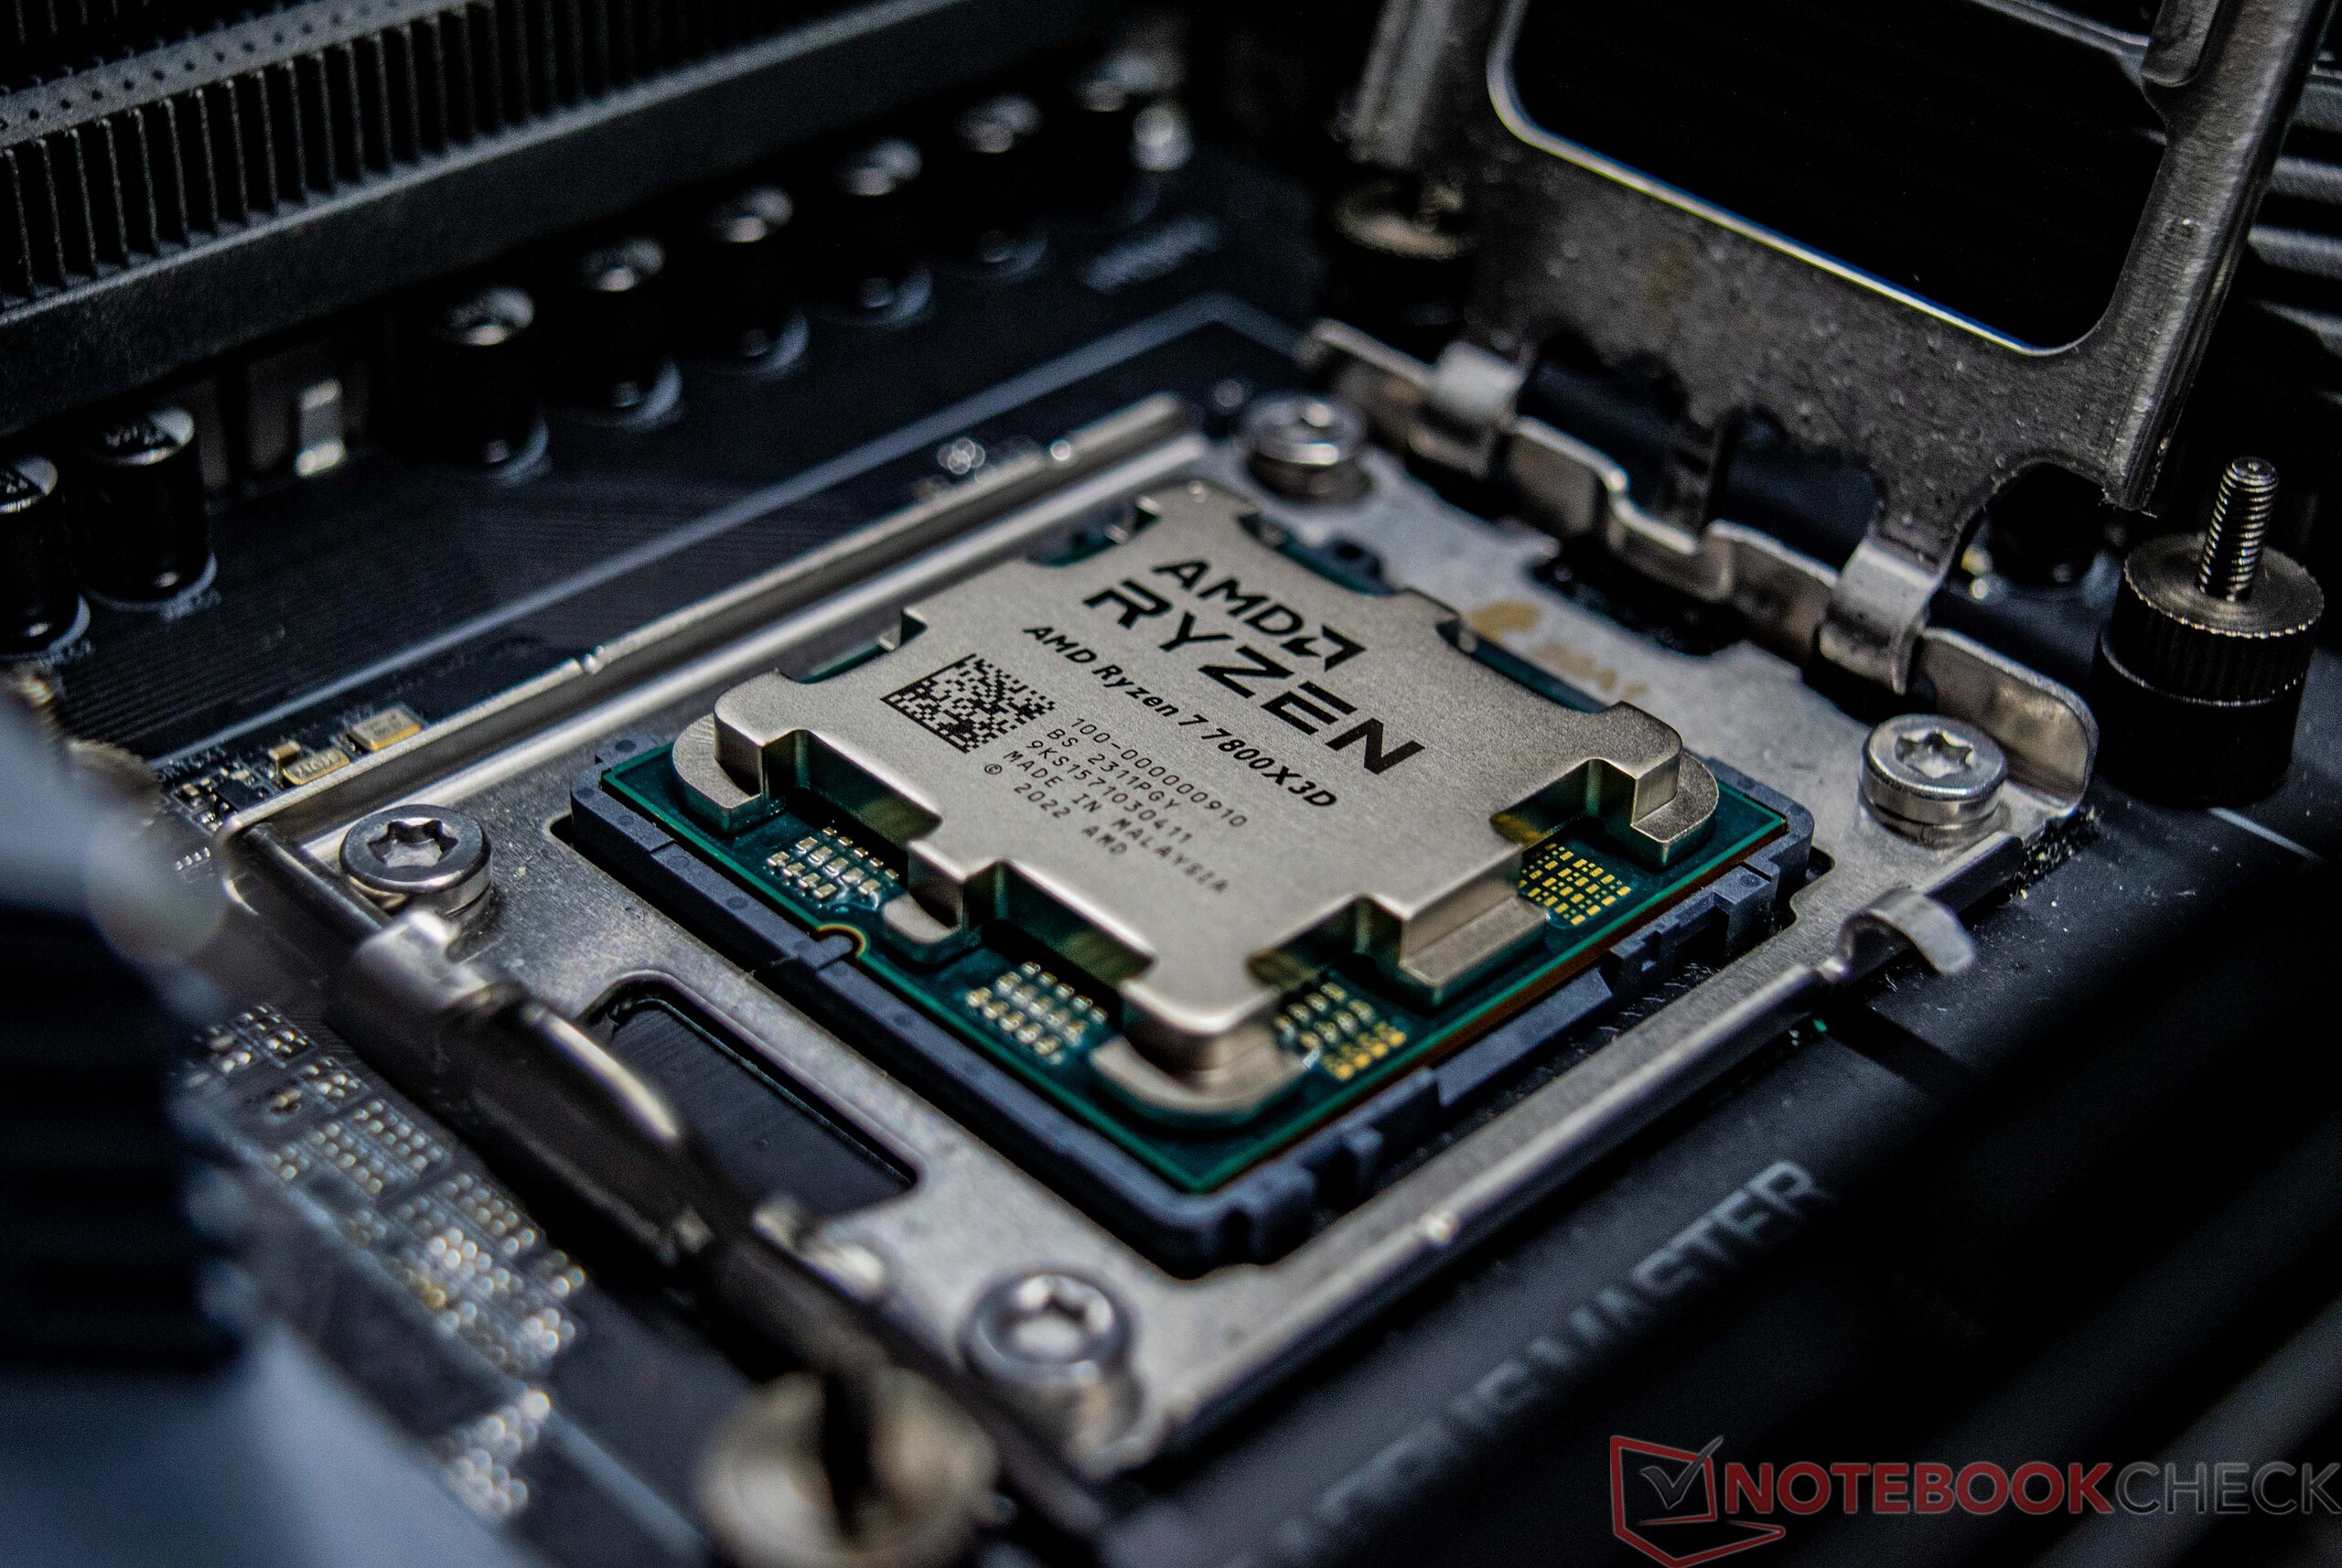
El AMD Ryzen 7 7800X3D, como todos los procesadores de la serie Ryzen 7000, requiere el socket AM5 (1.718 contactos). Actualizar desde un Ryzen de la serie 5000 o anterior implica comprar una nueva placa base y tener que invertir en una nueva memoria RAM. En cuanto al consumo de energía, el fabricante señala un TDP de 120 vatios. Su consumo máximo, sin embargo, está limitado a 162 vatios por el PPT (Package Power Tracking).
La familia AMD-Ryzen-7000 en breve
| Modelo | Núcleos/Hilos | Reloj base | Turbo reloj | L2-Cache | L3-Cache | TDP | PPT | Precio de lanzamiento |
|---|---|---|---|---|---|---|---|---|
| Ryzen 9 7950X3D | 16/32 | 4,2 GHz | 5,7 GHz | 16x 1 MB | 128 MB | 120 vatios | 162 vatios | 699 USD |
| Ryzen 9 7950X | 16/32 | 4,5 GHz | 5,7 GHz | 16x 1 MB | 64 MB | 170 vatios | 230 vatios | 699 USD |
| Ryzen 9 7900X3D | 12/24 | 4,4 GHz | 5,6 GHz | 12x 1 MB | 128 MB | 120 vatios | 162 vatios | 599 USD |
| Ryzen 9 7900X | 12/24 | 4,7 GHz | 5,6 GHz | 12x 1 MB | 64 MB | 170 vatios | 230 vatios | 549 USD |
| Ryzen 77800X3D | 8/16 | 4,2 GHz | 5,0 GHz | 8x 1 MB | 96 MB | 120 vatios | 162 vatios | 549 USD |
| Ryzen 7 7700X | 8/16 | 4,5 GHz | 5,4 GHz | 8x 1 MB | 32 MB | 105 vatios | 142 vatios | 399 USD |
| Ryzen 5 7600X | 6/12 | 4,7 GHz | 5,3 GHz | 6x 1 MB | 32 MB | 105 vatios | 142 vatios | 299 USD |
Nuestro sistema de pruebas en detalle
Hemos utilizado este sistema para las siguientes pruebas de rendimiento:
- Lian Li O11 Dynamic
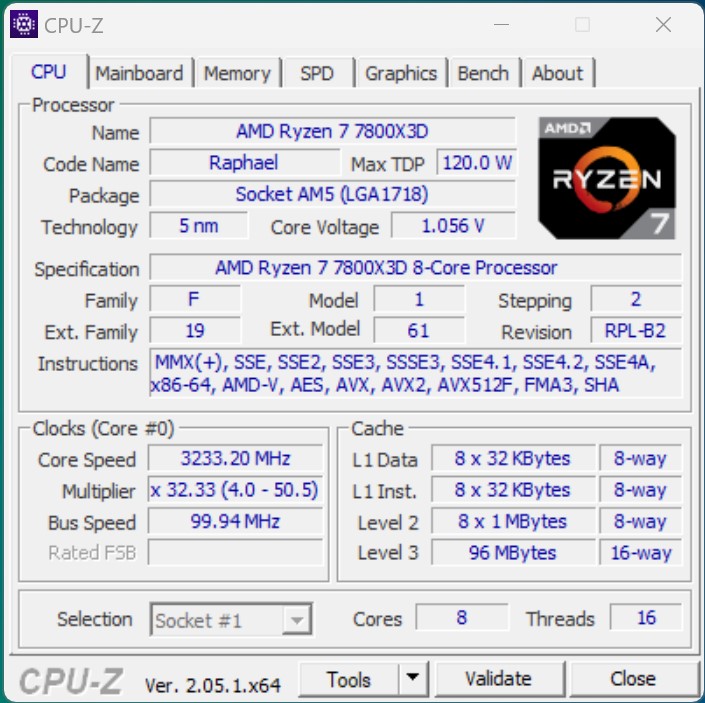
- AMD Ryzen 7 7800X3D
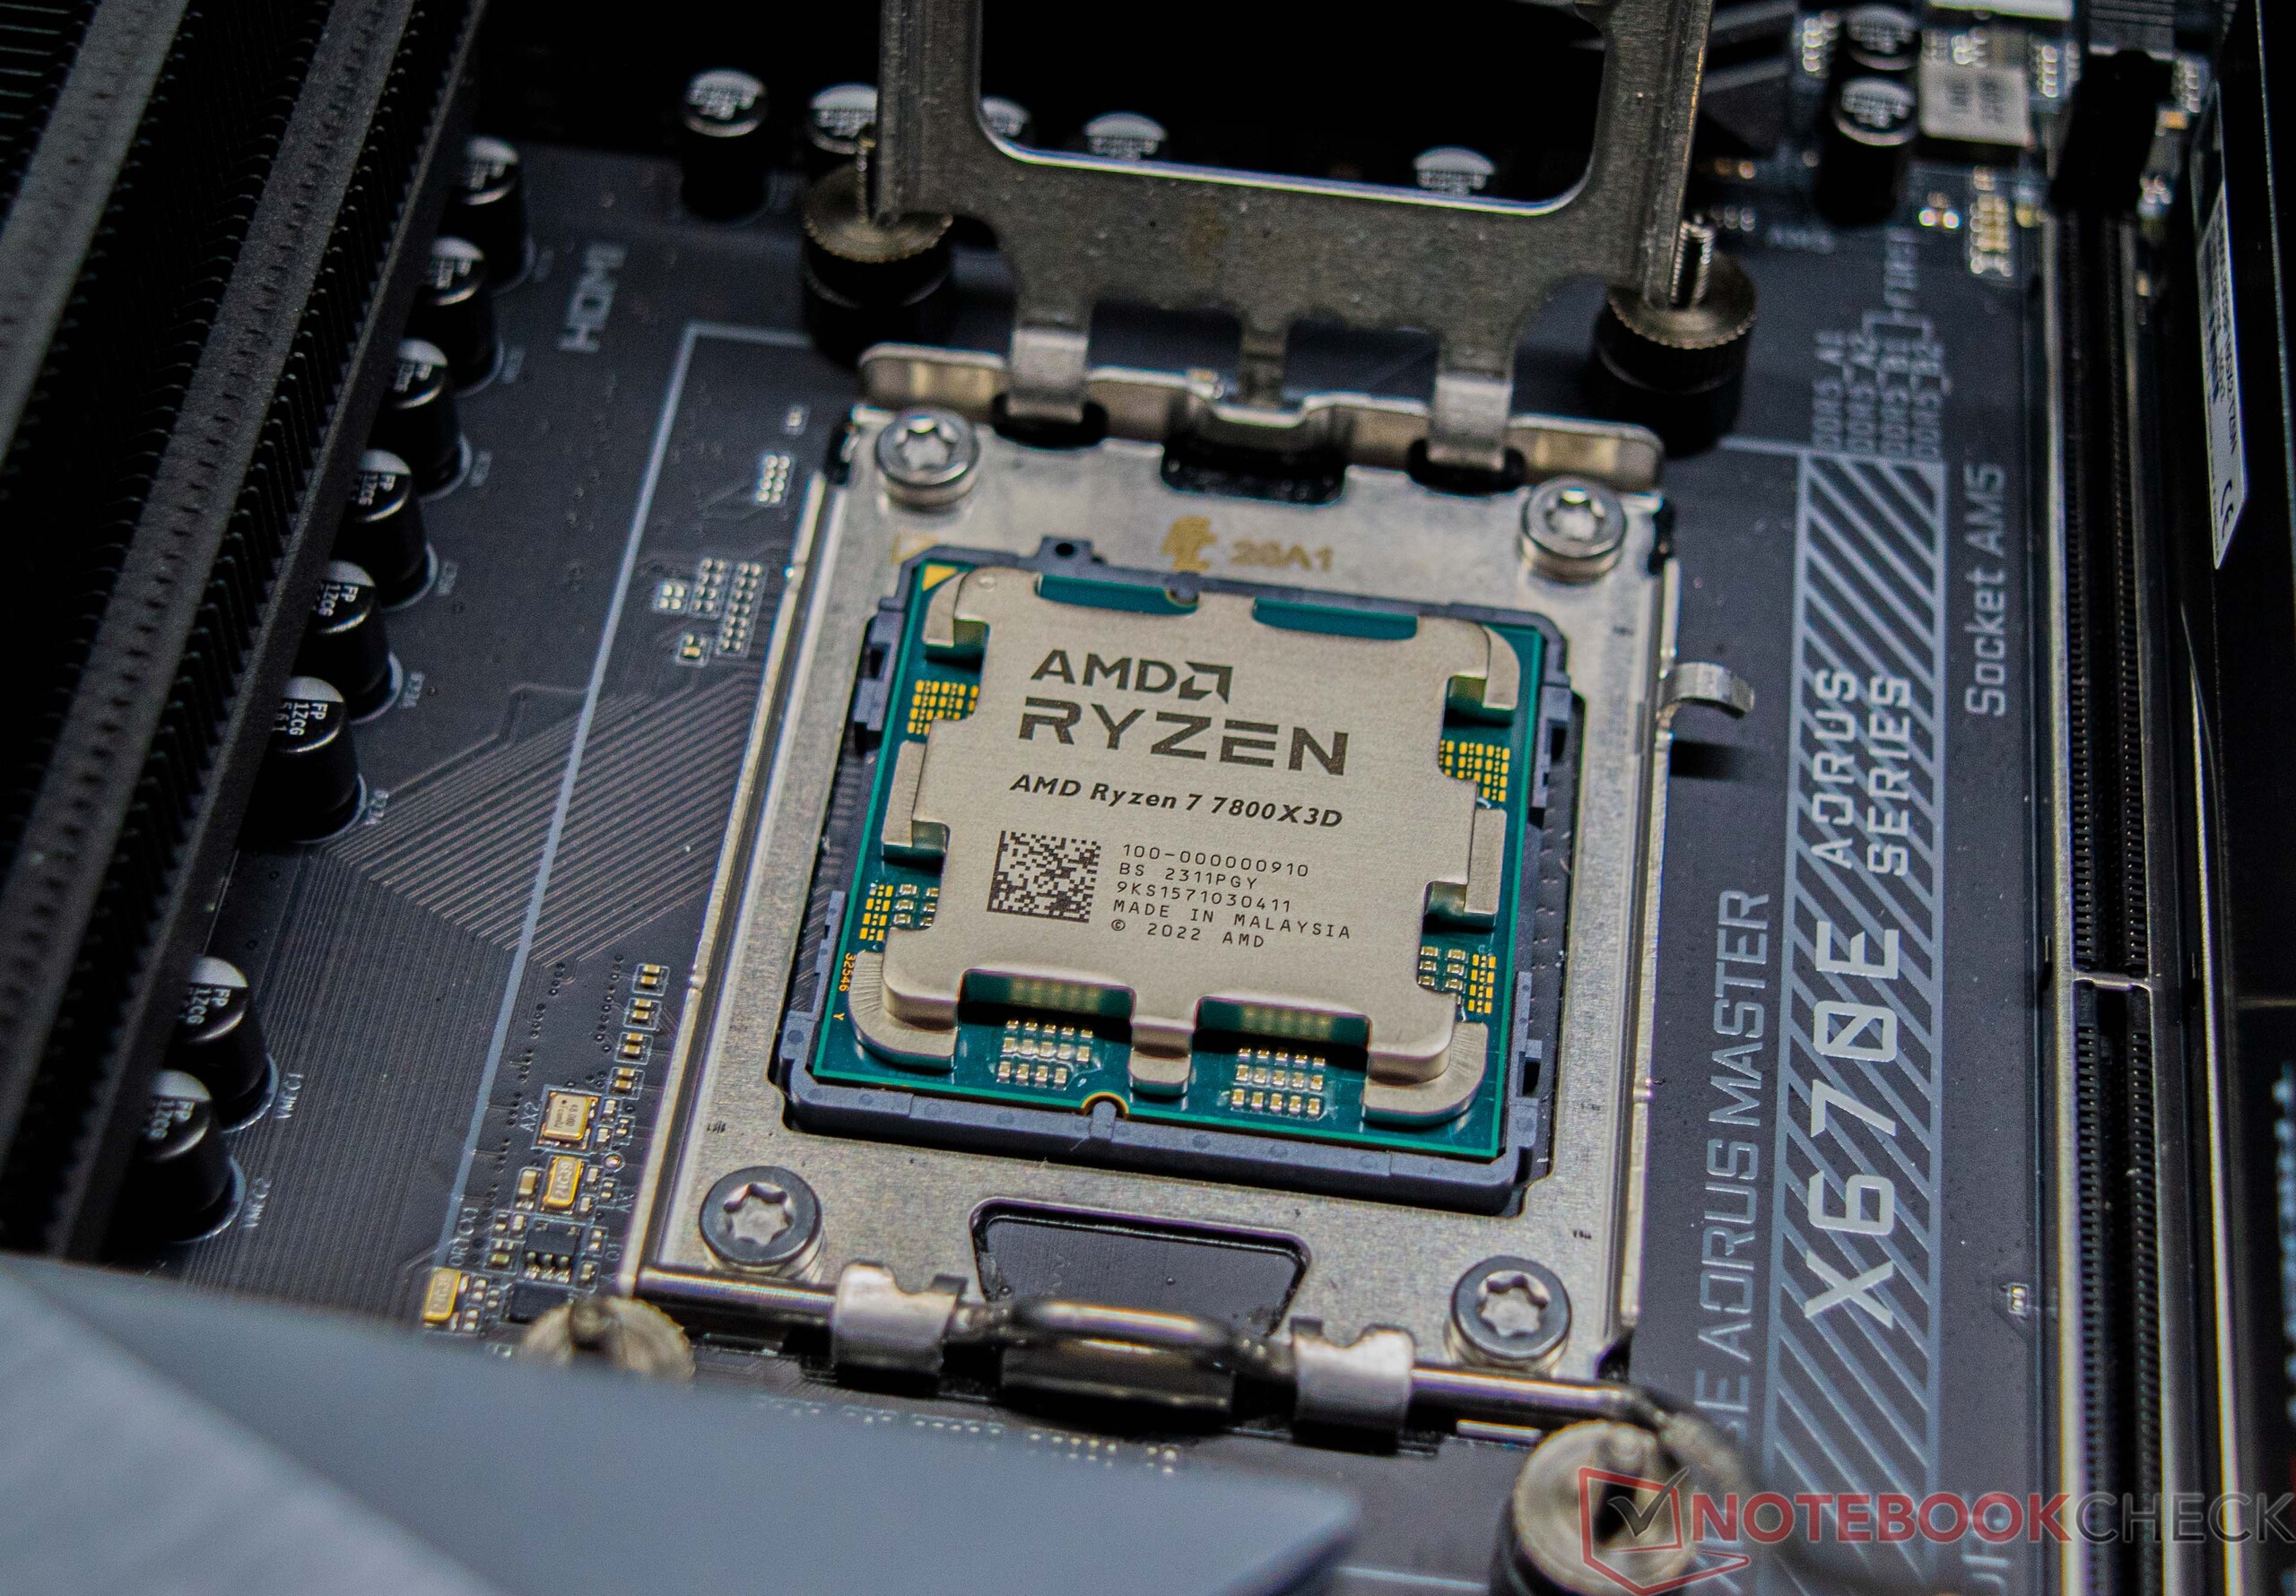
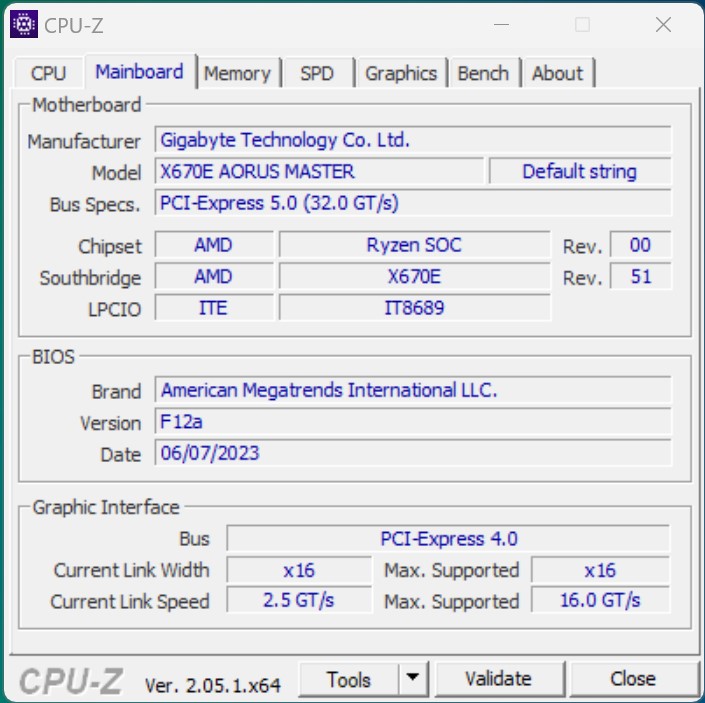
- Gigabyte X670E Aorus Master, BIOS: F12a
- Palit GeForce RTX 4090 GameRock OC
- DeepCool LT360
- Corsair HX1200i
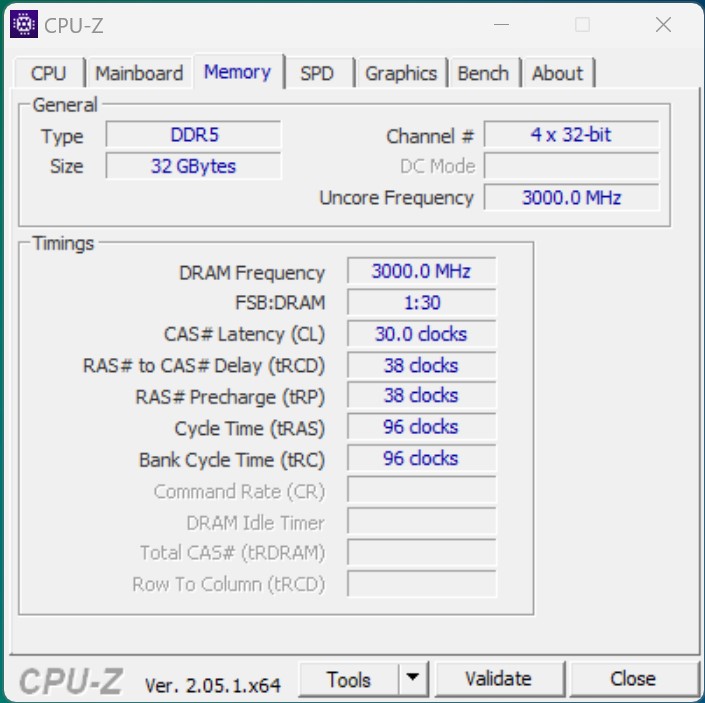
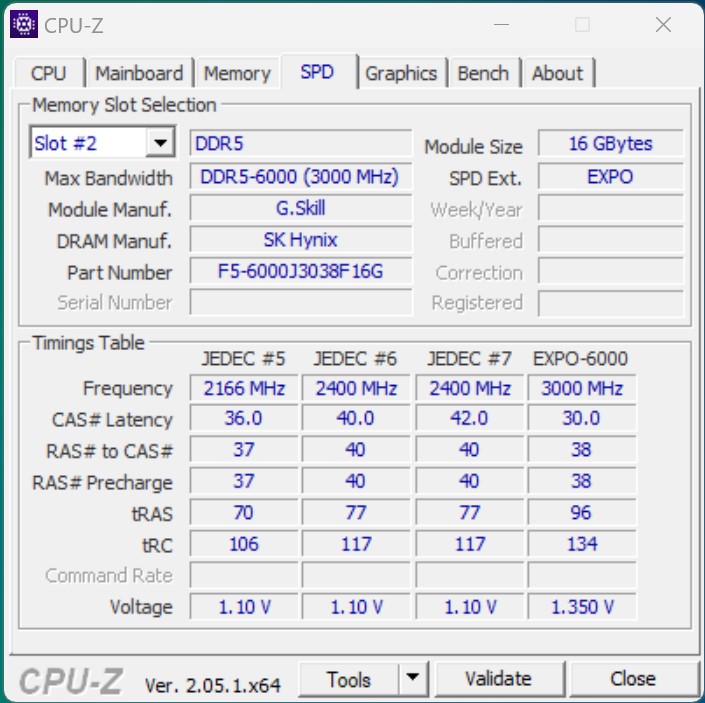
- G.Skill Trident Z5 Neo DDR5-6000 2x 16 GB, EXPO (DDR5-6000 CL30-38-38-96)
- Corsair MP600
- Microsoft Windows 11 Professional 64 Bit (Versión 22H2)


Condiciones de ensayo
Realizamos todas las pruebas de rendimiento utilizando el perfil energético "Máximo rendimiento". Sólo nos desviamos de éste durante las mediciones de consumo de energía. Se usó una solución DeepCool LT360 AiO como unidad de refrigeración en este test. Según el fabricante, está listada entre las unidades de refrigeración compatibles para los procesadores AMD Ryzen 7000. En consecuencia, usted estará en el lado seguro de usar esto para no violar las especificaciones del fabricante.
Puntos de referencia del procesador - Un Ryzen 7 7800X3D medio
Antes de echar un vistazo a los benchmarks de juegos, primero echaremos un vistazo al rendimiento puro de la CPU del procesador. Con la ayuda de una variedad de puntos de referencia, observamos que el AMD Ryzen 7 7800X3D alcanzó casi tan buen rendimiento como unAMD Ryzen 9 5950X. En comparación con Intel, esto fue suficiente para derrotar alAMD Ryzen 9 5950X. En este punto, nos gustaría reiterar que el AMD Ryzen 7 7800X3D es un procesador de 8 núcleos. Esto significa que es considerablemente peor en las pruebas multihilo que muchos de sus competidores.
Comparado con el AMD Ryzen 9 7950X3D, el Ryzen 7 7800X3D más pequeño se queda un 24% por detrás. En esta fase, el Intel Core i9-13900K fue el que mejor lo hizo, superando en un punto porcentual al anterior modelo de gama alta de AMD.
Encontrará más pruebas comparativas de procesadores en aquí.
| Performance rating - Percent | |
| Intel Core i9-13900K | |
| AMD Ryzen 9 7950X | |
| AMD Ryzen 9 7950X3D | |
| Intel Core i7-13700K | |
| AMD Ryzen 9 7900X | |
| AMD Ryzen 9 5950X | |
| Intel Core i5-13600K | |
| AMD Ryzen 7 7800X3D | |
| Intel Core i7-12700 | |
| Intel Core i5-12600K | |
| Intel Core i5-13400 | |
| Cinebench R15 | |
| CPU Single 64Bit | |
| Intel Core i9-13900K | |
| AMD Ryzen 9 7950X3D | |
| AMD Ryzen 9 7900X | |
| AMD Ryzen 9 7950X | |
| Intel Core i7-13700K | |
| AMD Ryzen 7 7800X3D | |
| Intel Core i5-13600K | |
| Intel Core i5-12600K | |
| AMD Ryzen 9 5950X | |
| Intel Core i7-12700 | |
| Intel Core i5-13400 | |
| CPU Multi 64Bit | |
| AMD Ryzen 9 7950X | |
| Intel Core i9-13900K | |
| AMD Ryzen 9 7950X3D | |
| AMD Ryzen 9 7900X | |
| Intel Core i7-13700K | |
| AMD Ryzen 9 5950X | |
| Intel Core i5-13600K | |
| Intel Core i7-12700 | |
| AMD Ryzen 7 7800X3D | |
| Intel Core i5-12600K | |
| Intel Core i5-13400 | |
| Cinebench R20 | |
| CPU (Single Core) | |
| Intel Core i9-13900K | |
| Intel Core i7-13700K | |
| AMD Ryzen 9 7950X3D | |
| AMD Ryzen 9 7900X | |
| AMD Ryzen 9 7950X | |
| Intel Core i5-13600K | |
| Intel Core i5-12600K | |
| Intel Core i7-12700 | |
| AMD Ryzen 7 7800X3D | |
| Intel Core i5-13400 | |
| AMD Ryzen 9 5950X | |
| CPU (Multi Core) | |
| Intel Core i9-13900K | |
| AMD Ryzen 9 7950X | |
| AMD Ryzen 9 7950X3D | |
| Intel Core i7-13700K | |
| AMD Ryzen 9 7900X | |
| AMD Ryzen 9 5950X | |
| Intel Core i5-13600K | |
| Intel Core i7-12700 | |
| AMD Ryzen 7 7800X3D | |
| Intel Core i5-12600K | |
| Intel Core i5-13400 | |
| Cinebench R23 | |
| Single Core | |
| Intel Core i9-13900K | |
| Intel Core i7-13700K | |
| AMD Ryzen 9 7950X3D | |
| AMD Ryzen 9 7900X | |
| AMD Ryzen 9 7950X | |
| Intel Core i5-13600K | |
| Intel Core i5-12600K | |
| Intel Core i7-12700 | |
| AMD Ryzen 7 7800X3D | |
| Intel Core i5-13400 | |
| AMD Ryzen 9 5950X | |
| Multi Core | |
| Intel Core i9-13900K | |
| AMD Ryzen 9 7950X | |
| AMD Ryzen 9 7950X3D | |
| Intel Core i7-13700K | |
| AMD Ryzen 9 7900X | |
| AMD Ryzen 9 5950X | |
| Intel Core i5-13600K | |
| Intel Core i7-12700 | |
| AMD Ryzen 7 7800X3D | |
| Intel Core i5-12600K | |
| Intel Core i5-13400 | |
| Cinebench R11.5 | |
| CPU Single 64Bit | |
| Intel Core i9-13900K | |
| AMD Ryzen 9 7950X3D | |
| AMD Ryzen 9 7900X | |
| AMD Ryzen 9 7950X | |
| Intel Core i7-13700K | |
| Intel Core i5-13600K | |
| AMD Ryzen 7 7800X3D | |
| Intel Core i5-12600K | |
| Intel Core i7-12700 | |
| AMD Ryzen 9 5950X | |
| Intel Core i5-13400 | |
| CPU Multi 64Bit | |
| Intel Core i9-13900K | |
| AMD Ryzen 9 7950X | |
| AMD Ryzen 9 7950X3D | |
| AMD Ryzen 9 7900X | |
| Intel Core i7-13700K | |
| AMD Ryzen 9 5950X | |
| Intel Core i5-13600K | |
| Intel Core i7-12700 | |
| AMD Ryzen 7 7800X3D | |
| Intel Core i5-12600K | |
| Intel Core i5-13400 | |
| Blender - v2.79 BMW27 CPU | |
| Intel Core i5-13400 | |
| Intel Core i5-12600K | |
| AMD Ryzen 7 7800X3D | |
| Intel Core i7-12700 | |
| Intel Core i5-13600K | |
| AMD Ryzen 9 5950X | |
| AMD Ryzen 9 7900X | |
| Intel Core i7-13700K | |
| AMD Ryzen 9 7950X3D | |
| AMD Ryzen 9 7950X | |
| Intel Core i9-13900K | |
| wPrime 2.10 | |
| 32m | |
| Intel Core i5-12600K | |
| Intel Core i5-13400 | |
| Intel Core i7-12700 | |
| AMD Ryzen 9 5950X | |
| Intel Core i5-13600K | |
| AMD Ryzen 7 7800X3D | |
| Intel Core i7-13700K | |
| AMD Ryzen 9 7950X3D | |
| Intel Core i9-13900K | |
| AMD Ryzen 9 7900X | |
| AMD Ryzen 9 7950X | |
| 1024m | |
| Intel Core i5-13400 | |
| Intel Core i7-12700 | |
| Intel Core i5-12600K | |
| Intel Core i5-13600K | |
| Intel Core i7-13700K | |
| Intel Core i9-13900K | |
| AMD Ryzen 9 5950X | |
| AMD Ryzen 7 7800X3D | |
| AMD Ryzen 9 7900X | |
| AMD Ryzen 9 7950X3D | |
| AMD Ryzen 9 7950X | |
| X264 HD Benchmark 4.0 | |
| Pass 1 | |
| Intel Core i9-13900K | |
| Intel Core i7-13700K | |
| AMD Ryzen 9 7950X3D | |
| Intel Core i5-13600K | |
| AMD Ryzen 9 7950X | |
| AMD Ryzen 9 7900X | |
| Intel Core i7-12700 | |
| AMD Ryzen 7 7800X3D | |
| AMD Ryzen 9 5950X | |
| Intel Core i5-12600K | |
| Intel Core i5-13400 | |
| Pass 2 | |
| AMD Ryzen 9 7950X | |
| Intel Core i9-13900K | |
| AMD Ryzen 9 7950X3D | |
| AMD Ryzen 9 7900X | |
| Intel Core i7-13700K | |
| AMD Ryzen 9 5950X | |
| Intel Core i5-13600K | |
| Intel Core i7-12700 | |
| AMD Ryzen 7 7800X3D | |
| Intel Core i5-12600K | |
| Intel Core i5-13400 | |
| WinRAR - Result | |
| AMD Ryzen 9 7900X | |
| AMD Ryzen 7 7800X3D | |
| AMD Ryzen 9 7950X3D | |
| AMD Ryzen 9 7950X | |
| Intel Core i9-13900K | |
| Intel Core i7-13700K | |
| AMD Ryzen 9 5950X | |
| Intel Core i5-13600K | |
| Intel Core i7-12700 | |
| Intel Core i5-13400 | |
| Intel Core i5-12600K | |
| TrueCrypt | |
| AES Mean 100MB | |
| AMD Ryzen 9 7950X | |
| Intel Core i9-13900K | |
| AMD Ryzen 9 5950X | |
| AMD Ryzen 9 7950X3D | |
| Intel Core i5-13600K | |
| Intel Core i7-13700K | |
| AMD Ryzen 7 7800X3D | |
| AMD Ryzen 9 7900X | |
| Intel Core i7-12700 | |
| Intel Core i5-12600K | |
| Intel Core i5-13400 | |
| Twofish Mean 100MB | |
| Intel Core i9-13900K | |
| AMD Ryzen 9 7950X | |
| AMD Ryzen 9 7950X3D | |
| Intel Core i7-13700K | |
| AMD Ryzen 9 5950X | |
| Intel Core i5-13600K | |
| AMD Ryzen 9 7900X | |
| Intel Core i7-12700 | |
| Intel Core i5-12600K | |
| AMD Ryzen 7 7800X3D | |
| Intel Core i5-13400 | |
| Serpent Mean 100MB | |
| Intel Core i9-13900K | |
| AMD Ryzen 9 7950X | |
| AMD Ryzen 9 7950X3D | |
| AMD Ryzen 9 5950X | |
| Intel Core i7-13700K | |
| Intel Core i5-13600K | |
| AMD Ryzen 9 7900X | |
| Intel Core i7-12700 | |
| Intel Core i5-12600K | |
| AMD Ryzen 7 7800X3D | |
| Intel Core i5-13400 | |
| Geekbench 5.5 | |
| Multi-Core | |
| AMD Ryzen 9 7950X3D | |
| Intel Core i9-13900K | |
| AMD Ryzen 9 7950X | |
| AMD Ryzen 9 7900X | |
| Intel Core i7-13700K | |
| AMD Ryzen 9 5950X | |
| Intel Core i5-13600K | |
| Intel Core i7-12700 | |
| AMD Ryzen 7 7800X3D | |
| Intel Core i5-12600K | |
| Intel Core i5-13400 | |
| Single-Core | |
| AMD Ryzen 9 7950X3D | |
| Intel Core i9-13900K | |
| AMD Ryzen 9 7900X | |
| AMD Ryzen 9 7950X | |
| Intel Core i7-13700K | |
| AMD Ryzen 7 7800X3D | |
| Intel Core i5-13600K | |
| Intel Core i7-12700 | |
| Intel Core i5-12600K | |
| Intel Core i5-13400 | |
| AMD Ryzen 9 5950X | |
| Geekbench 5.0 | |
| 5.0 Multi-Core | |
| Intel Core i9-13900K | |
| AMD Ryzen 9 7950X3D | |
| AMD Ryzen 9 7950X | |
| AMD Ryzen 9 7900X | |
| Intel Core i7-13700K | |
| Intel Core i5-13600K | |
| AMD Ryzen 9 5950X | |
| Intel Core i7-12700 | |
| AMD Ryzen 7 7800X3D | |
| Intel Core i5-12600K | |
| Intel Core i5-13400 | |
| 5.0 Single-Core | |
| Intel Core i9-13900K | |
| AMD Ryzen 9 7900X | |
| AMD Ryzen 9 7950X3D | |
| AMD Ryzen 9 7950X | |
| Intel Core i7-13700K | |
| AMD Ryzen 7 7800X3D | |
| Intel Core i5-13600K | |
| Intel Core i7-12700 | |
| Intel Core i5-12600K | |
| Intel Core i5-13400 | |
| AMD Ryzen 9 5950X | |
| Geekbench 4.4 | |
| 64 Bit Single-Core Score | |
| Intel Core i9-13900K | |
| AMD Ryzen 9 7950X3D | |
| AMD Ryzen 9 7900X | |
| AMD Ryzen 7 7800X3D | |
| AMD Ryzen 9 7950X | |
| Intel Core i7-13700K | |
| Intel Core i5-13600K | |
| Intel Core i5-12600K | |
| Intel Core i7-12700 | |
| Intel Core i5-13400 | |
| AMD Ryzen 9 5950X | |
| 64 Bit Multi-Core Score | |
| AMD Ryzen 9 7950X3D | |
| Intel Core i9-13900K | |
| AMD Ryzen 9 7950X | |
| AMD Ryzen 9 7900X | |
| Intel Core i7-13700K | |
| AMD Ryzen 9 5950X | |
| Intel Core i5-13600K | |
| AMD Ryzen 7 7800X3D | |
| Intel Core i7-12700 | |
| Intel Core i5-12600K | |
| Intel Core i5-13400 | |
| 3DMark 11 - 1280x720 Performance Physics | |
| AMD Ryzen 9 7950X3D | |
| AMD Ryzen 7 7800X3D | |
| AMD Ryzen 9 7950X | |
| Intel Core i9-13900K | |
| Intel Core i7-13700K | |
| Intel Core i5-13600K | |
| AMD Ryzen 9 7900X | |
| Intel Core i7-12700 | |
| AMD Ryzen 9 5950X | |
| Intel Core i5-12600K | |
| Intel Core i5-13400 | |
| 7-Zip 18.03 | |
| 7z b 4 | |
| AMD Ryzen 9 7950X3D | |
| AMD Ryzen 9 7950X | |
| Intel Core i9-13900K | |
| AMD Ryzen 9 5950X | |
| AMD Ryzen 9 7900X | |
| Intel Core i7-13700K | |
| Intel Core i5-13600K | |
| AMD Ryzen 7 7800X3D | |
| Intel Core i7-12700 | |
| Intel Core i5-12600K | |
| Intel Core i5-13400 | |
| 7z b 4 -mmt1 | |
| AMD Ryzen 9 7950X3D | |
| AMD Ryzen 9 7900X | |
| AMD Ryzen 7 7800X3D | |
| AMD Ryzen 9 7950X | |
| Intel Core i9-13900K | |
| Intel Core i7-13700K | |
| AMD Ryzen 9 5950X | |
| Intel Core i5-13600K | |
| Intel Core i7-12700 | |
| Intel Core i5-12600K | |
| Intel Core i5-13400 | |
| HWBOT x265 Benchmark v2.2 - 4k Preset | |
| AMD Ryzen 9 7950X | |
| Intel Core i9-13900K | |
| AMD Ryzen 9 7950X3D | |
| AMD Ryzen 9 7900X | |
| Intel Core i7-13700K | |
| AMD Ryzen 9 5950X | |
| Intel Core i5-12600K | |
| Intel Core i5-13600K | |
| Intel Core i7-12700 | |
| AMD Ryzen 7 7800X3D | |
| Intel Core i5-13400 | |
| R Benchmark 2.5 - Overall mean | |
| Intel Core i5-13400 | |
| AMD Ryzen 9 5950X | |
| Intel Core i5-12600K | |
| Intel Core i7-12700 | |
| AMD Ryzen 7 7800X3D | |
| Intel Core i5-13600K | |
| Intel Core i7-13700K | |
| AMD Ryzen 9 7950X | |
| AMD Ryzen 9 7900X | |
| AMD Ryzen 9 7950X3D | |
| Intel Core i9-13900K | |
| LibreOffice - 20 Documents To PDF | |
| Intel Core i5-12600K | |
| AMD Ryzen 9 5950X | |
| AMD Ryzen 7 7800X3D | |
| Intel Core i5-13400 | |
| AMD Ryzen 9 7950X3D | |
| Intel Core i7-12700 | |
| Intel Core i9-13900K | |
| AMD Ryzen 9 7950X | |
| Intel Core i5-13600K | |
| AMD Ryzen 9 7900X | |
| Intel Core i7-13700K | |
| WebXPRT 3 - Overall | |
| AMD Ryzen 9 7950X3D | |
| AMD Ryzen 9 7900X | |
| Intel Core i9-13900K | |
| AMD Ryzen 9 7950X | |
| AMD Ryzen 7 7800X3D | |
| Intel Core i7-13700K | |
| Intel Core i5-13600K | |
| Intel Core i7-12700 | |
| Intel Core i5-13400 | |
| Intel Core i5-12600K | |
| AMD Ryzen 9 5950X | |
| Mozilla Kraken 1.1 - Total | |
| AMD Ryzen 9 5950X | |
| Intel Core i5-13400 | |
| Intel Core i5-12600K | |
| Intel Core i7-12700 | |
| AMD Ryzen 7 7800X3D | |
| Intel Core i5-13600K | |
| Intel Core i7-13700K | |
| AMD Ryzen 9 7950X | |
| AMD Ryzen 9 7950X3D | |
| Intel Core i9-13900K | |
| AMD Ryzen 9 7900X | |
| 3DMark | |
| 1920x1080 Fire Strike Physics | |
| Intel Core i9-13900K | |
| AMD Ryzen 9 7950X | |
| Intel Core i7-13700K | |
| AMD Ryzen 9 7950X3D | |
| AMD Ryzen 9 7900X | |
| AMD Ryzen 9 5950X | |
| Intel Core i5-13600K | |
| Intel Core i7-12700 | |
| AMD Ryzen 7 7800X3D | |
| Intel Core i5-12600K | |
| Intel Core i5-13400 | |
| 2560x1440 Time Spy CPU | |
| Intel Core i9-13900K | |
| Intel Core i7-13700K | |
| AMD Ryzen 9 7950X3D | |
| Intel Core i5-13600K | |
| AMD Ryzen 9 7900X | |
| Intel Core i7-12700 | |
| AMD Ryzen 9 7950X | |
| AMD Ryzen 7 7800X3D | |
| Intel Core i5-12600K | |
| AMD Ryzen 9 5950X | |
| Intel Core i5-13400 | |
* ... más pequeño es mejor
AMD Ryzen 7 7800X3D vs. Cinebench R15 Multi Loop
Con la ayuda del Cinebench R15 Multi Loop, podemos en este punto ver que el sistema de refrigeración DeepCool es suficiente para enfriar el AMD Ryzen 7 7800X3D de forma fiable. Para una revelación completa, debemos señalar que todas las pruebas se realizaron con la carcasa cerrada. La circulación de aire en la Lian Li O11 Dynamic no era la mejor en nuestro sistema de pruebas, ya que no había ventiladores instalados que tuvieran acceso a aire fresco.
Puntos de referencia sintéticos y rendimiento de las aplicaciones
Las pruebas de aplicaciones sintéticas del AMD Ryzen 7 7800X3D ya parecen algo mejores que las de su CPU. No quedó muy por detrás delIntel Core i5-13600Ky elAMD Ryzen 9 5950Xfue claramente capaz de ser superado.
Durante las pruebas de RAM, habríamos esperado resultados similares a los de AMD Ryzen 9 7950X3D, ya que la plataforma de pruebas es la misma y su velocidad de reloj de RAM de 6.000 MT/s también sigue siendo la misma. Sin embargo, debes tener en cuenta que el AMD Ryzen 7 7800X3D funciona fuera de las especificaciones del fabricante cuando el perfil EXPO está activado. La velocidad de reloj habitual del AMD Ryzen 7 7800X3D es de 5.200 MT/s.
| Performance rating - Percent | |
| Intel Core i9-13900K | |
| AMD Ryzen 9 7950X | |
| AMD Ryzen 9 7950X3D | |
| Intel Core i7-13700K | |
| AMD Ryzen 9 7900X | |
| Intel Core i5-13600K | |
| AMD Ryzen 7 7800X3D | |
| Intel Core i7-12700 | |
| AMD Ryzen 9 5950X | |
| Intel Core i5-13400 | |
| PCMark 10 | |
| Productivity | |
| AMD Ryzen 9 7950X3D | |
| AMD Ryzen 9 7950X | |
| Intel Core i7-13700K | |
| AMD Ryzen 7 7800X3D | |
| AMD Ryzen 9 7900X | |
| Intel Core i5-13600K | |
| Intel Core i9-13900K | |
| Intel Core i7-12700 | |
| AMD Ryzen 9 5950X | |
| Intel Core i5-13400 | |
| Essentials | |
| Intel Core i9-13900K | |
| AMD Ryzen 9 7900X | |
| AMD Ryzen 9 7950X | |
| Intel Core i5-13600K | |
| AMD Ryzen 9 7950X3D | |
| Intel Core i7-13700K | |
| AMD Ryzen 7 7800X3D | |
| AMD Ryzen 9 5950X | |
| Intel Core i7-12700 | |
| Intel Core i5-13400 | |
| 3DMark | |
| 1920x1080 Fire Strike Physics | |
| Intel Core i9-13900K | |
| AMD Ryzen 9 7950X | |
| Intel Core i7-13700K | |
| AMD Ryzen 9 7950X3D | |
| AMD Ryzen 9 7900X | |
| AMD Ryzen 9 5950X | |
| Intel Core i5-13600K | |
| Intel Core i7-12700 | |
| AMD Ryzen 7 7800X3D | |
| Intel Core i5-13400 | |
| 2560x1440 Time Spy CPU | |
| Intel Core i9-13900K | |
| Intel Core i7-13700K | |
| AMD Ryzen 9 7950X3D | |
| Intel Core i5-13600K | |
| AMD Ryzen 9 7900X | |
| Intel Core i7-12700 | |
| AMD Ryzen 9 7950X | |
| AMD Ryzen 7 7800X3D | |
| AMD Ryzen 9 5950X | |
| Intel Core i5-13400 | |
| 3DMark 11 - 1280x720 Performance Physics | |
| AMD Ryzen 9 7950X3D | |
| AMD Ryzen 7 7800X3D | |
| AMD Ryzen 9 7950X | |
| Intel Core i9-13900K | |
| Intel Core i7-13700K | |
| Intel Core i5-13600K | |
| AMD Ryzen 9 7900X | |
| Intel Core i7-12700 | |
| AMD Ryzen 9 5950X | |
| Intel Core i5-13400 | |
| CrossMark - Overall | |
| Intel Core i9-13900K | |
| AMD Ryzen 9 7950X | |
| AMD Ryzen 9 7900X | |
| Intel Core i7-13700K | |
| Intel Core i5-13600K | |
| AMD Ryzen 7 7800X3D | |
| AMD Ryzen 9 7950X3D | |
| Intel Core i7-12700 | |
| Intel Core i5-13400 | |
| AMD Ryzen 9 5950X | |
| AIDA64 / Memory Copy | |
| Intel Core i9-13900K | |
| AMD Ryzen 9 7950X3D | |
| Intel Core i7-13700K | |
| Intel Core i7-12700 | |
| Intel Core i5-13400 | |
| Intel Core i5-13600K | |
| Intel Core i5-12600K | |
| AMD Ryzen 9 7900X | |
| AMD Ryzen 9 7950X | |
| AMD Ryzen 7 7800X3D | |
| AMD Ryzen 9 5950X | |
| Media de la clase (4514 - 234662, n=2204) | |
| AIDA64 / Memory Read | |
| Intel Core i9-13900K | |
| Intel Core i7-13700K | |
| Intel Core i7-12700 | |
| AMD Ryzen 9 7950X3D | |
| Intel Core i5-13400 | |
| Intel Core i5-12600K | |
| Intel Core i5-13600K | |
| AMD Ryzen 9 7950X | |
| AMD Ryzen 9 7900X | |
| AMD Ryzen 9 5950X | |
| AMD Ryzen 7 7800X3D | |
| Media de la clase (4031 - 271066, n=2166) | |
| AIDA64 / Memory Write | |
| AMD Ryzen 7 7800X3D | |
| Intel Core i7-12700 | |
| AMD Ryzen 9 7950X3D | |
| AMD Ryzen 9 7900X | |
| AMD Ryzen 9 7950X | |
| Intel Core i9-13900K | |
| Intel Core i5-13400 | |
| Intel Core i5-12600K | |
| Intel Core i5-13600K | |
| Intel Core i7-13700K | |
| Media de la clase (3506 - 242868, n=2171) | |
| AMD Ryzen 9 5950X | |
| AIDA64 / Memory Latency | |
| Media de la clase (6.1 - 536, n=2233) | |
| Intel Core i5-13600K | |
| Intel Core i5-13400 | |
| Intel Core i9-13900K | |
| Intel Core i7-12700 | |
| Intel Core i7-13700K | |
| AMD Ryzen 7 7800X3D | |
| AMD Ryzen 9 5950X | |
| AMD Ryzen 9 7950X3D | |
| AMD Ryzen 9 7950X | |
| AMD Ryzen 9 7900X | |
* ... más pequeño es mejor
Pruebas de juego: muy rápido para tener sólo 8 núcleos
Durante nuestras pruebas de juegos, observamos que el AMD Ryzen 7 7800X3D sobresalió en su trabajo principal. El procesador de 8 núcleos fue capaz incluso de desbancar al buque insignia de la casa del primer puesto, desplazándolo hasta la segunda posición. Por supuesto, su ventaja es mínima y no se nota en el uso diario, pero cuando se trata de coronar al rey del rendimiento, tenemos que ceñirnos a los números puros. Nuestro modelo de pruebas ganó la comparación con elIntel Core i9-13900Kcon bastante facilidad y le sacó una ventaja de 13 puntos porcentuales.
El AMD Ryzen 9 7950X3D a veces tuvo problemas de distribución de carga entre los dos CCDs en algunos de los juegos que probamos porque, como sabemos, sólo uno de los CCDs del componente de 16 núcleos cuenta con la caché 3D-V. El AMD Ryzen 7 7800X3D no tiene este problema, y probablemente por eso logró un rendimiento ligeramente mejor en juegos. Debido a sus benchmarks de CPU, podemos comparar nuestra muestra de prueba con un Intel Core i7-12700 en esta etapa. Antes estaba a la par con el AMD Ryzen 7 7800X3D, pero ahora podemos documentar una diferencia de un buen 30%.
En combinación con la Palit GeForce RTX 4090 GameRock OC, la plataforma AM5 basada en el AMD Ryzen 7 7800X3D ofrece actualmente la mejor combinación cuando se trata de juego puro. El resumen de todos los juegos que probamos con esta plataforma muestra que todos ellos son actualmente jugables sin problemas en 2.160p con los máximos detalles. En principio, esto también es posible con un Intel Core i9-13900K o un AMD Ryzen 9 7590X3D. Sin embargo, tendrás que pagar más por estos dos.
| Performance rating - Percent | |
| AMD Ryzen 7 7800X3D | |
| AMD Ryzen 9 7950X3D | |
| Intel Core i9-13900K | |
| Intel Core i7-13700K | |
| Intel Core i7-13700 | |
| Intel Core i7-12700 | |
| Intel Core i5-13400 | |
| Intel Core i5-12400F | |
| F1 22 | |
| 1920x1080 Low Preset AA:T AF:16x | |
| AMD Ryzen 7 7800X3D | |
| AMD Ryzen 9 7950X3D | |
| Intel Core i9-13900K | |
| Intel Core i7-13700K | |
| Intel Core i7-13700 | |
| Intel Core i7-12700 | |
| Intel Core i5-12400F | |
| Intel Core i5-13400 | |
| 3840x2160 Ultra High Preset AA:T AF:16x | |
| AMD Ryzen 7 7800X3D | |
| Intel Core i7-13700K | |
| AMD Ryzen 9 7950X3D | |
| Intel Core i5-12400F | |
| Intel Core i7-13700 | |
| Intel Core i7-12700 | |
| Intel Core i5-13400 | |
| Intel Core i9-13900K | |
| Far Cry 5 | |
| 1280x720 Low Preset AA:T | |
| AMD Ryzen 7 7800X3D | |
| AMD Ryzen 9 7950X3D | |
| Intel Core i7-13700K | |
| Intel Core i9-13900K | |
| Intel Core i7-13700 | |
| Intel Core i7-12700 | |
| Intel Core i5-13400 | |
| Intel Core i5-12400F | |
| 3840x2160 Ultra Preset AA:T | |
| AMD Ryzen 7 7800X3D | |
| AMD Ryzen 9 7950X3D | |
| Intel Core i9-13900K | |
| Intel Core i7-13700K | |
| Intel Core i7-13700 | |
| Intel Core i7-12700 | |
| Intel Core i5-13400 | |
| Intel Core i5-12400F | |
| X-Plane 11.11 | |
| 1280x720 low (fps_test=1) | |
| Intel Core i9-13900K | |
| AMD Ryzen 9 7950X3D | |
| Intel Core i7-13700K | |
| AMD Ryzen 7 7800X3D | |
| Intel Core i7-13700 | |
| Intel Core i7-12700 | |
| Intel Core i5-13400 | |
| Intel Core i5-12400F | |
| 3840x2160 high (fps_test=3) | |
| AMD Ryzen 7 7800X3D | |
| AMD Ryzen 9 7950X3D | |
| Intel Core i9-13900K | |
| Intel Core i7-13700K | |
| Intel Core i7-13700 | |
| Intel Core i7-12700 | |
| Intel Core i5-13400 | |
| Intel Core i5-12400F | |
| Final Fantasy XV Benchmark | |
| 1280x720 Lite Quality | |
| Intel Core i7-13700 | |
| Intel Core i7-13700K | |
| AMD Ryzen 7 7800X3D | |
| Intel Core i9-13900K | |
| AMD Ryzen 9 7950X3D | |
| Intel Core i7-12700 | |
| Intel Core i5-12400F | |
| Intel Core i5-13400 | |
| 3840x2160 High Quality | |
| AMD Ryzen 7 7800X3D | |
| Intel Core i7-13700 | |
| AMD Ryzen 9 7950X3D | |
| Intel Core i7-13700K | |
| Intel Core i9-13900K | |
| Intel Core i7-12700 | |
| Intel Core i5-12400F | |
| Intel Core i5-13400 | |
| Dota 2 Reborn | |
| 1280x720 min (0/3) fastest | |
| AMD Ryzen 7 7800X3D | |
| AMD Ryzen 9 7950X3D | |
| Intel Core i9-13900K | |
| Intel Core i7-13700K | |
| Intel Core i7-13700 | |
| Intel Core i7-12700 | |
| Intel Core i5-12400F | |
| Intel Core i5-13400 | |
| 3840x2160 ultra (3/3) best looking | |
| AMD Ryzen 7 7800X3D | |
| AMD Ryzen 9 7950X3D | |
| Intel Core i9-13900K | |
| Intel Core i7-13700K | |
| Intel Core i7-13700 | |
| Intel Core i7-12700 | |
| Intel Core i5-12400F | |
| Intel Core i5-13400 | |
| The Witcher 3 | |
| 1024x768 Low Graphics & Postprocessing | |
| AMD Ryzen 9 7950X3D | |
| AMD Ryzen 7 7800X3D | |
| Intel Core i9-13900K | |
| Intel Core i7-13700K | |
| Intel Core i7-13700 | |
| Intel Core i7-12700 | |
| Intel Core i5-13400 | |
| Intel Core i5-12400F | |
| 3840x2160 High Graphics & Postprocessing (Nvidia HairWorks Off) | |
| Intel Core i5-13400 | |
| Intel Core i7-13700 | |
| Intel Core i7-12700 | |
| Intel Core i9-13900K | |
| AMD Ryzen 7 7800X3D | |
| Intel Core i7-13700K | |
| AMD Ryzen 9 7950X3D | |
| Intel Core i5-12400F | |
| F1 2021 | |
| 3840x2160 Ultra High Preset + Raytracing AA:T AF:16x | |
| AMD Ryzen 7 7800X3D | |
| AMD Ryzen 9 7950X3D | |
| Intel Core i7-13700K | |
| Intel Core i7-13700 | |
| Intel Core i9-13900K | |
| Intel Core i7-12700 | |
| Intel Core i5-12400F | |
| Intel Core i5-13400 | |
| 1280x720 Ultra Low Preset | |
| AMD Ryzen 7 7800X3D | |
| AMD Ryzen 9 7950X3D | |
| Intel Core i9-13900K | |
| Intel Core i7-13700K | |
| Intel Core i7-13700 | |
| Intel Core i7-12700 | |
| Intel Core i5-12400F | |
| Intel Core i5-13400 | |
| Shadow of the Tomb Raider | |
| 1280x720 Lowest Preset | |
| AMD Ryzen 7 7800X3D | |
| AMD Ryzen 9 7950X3D | |
| Intel Core i9-13900K | |
| Intel Core i7-13700 | |
| Intel Core i7-13700K | |
| Intel Core i7-12700 | |
| Intel Core i5-13400 | |
| Intel Core i5-12400F | |
| 3840x2160 Highest Preset AA:T | |
| Intel Core i7-13700K | |
| AMD Ryzen 7 7800X3D | |
| Intel Core i7-13700 | |
| AMD Ryzen 9 7950X3D | |
| Intel Core i9-13900K | |
| Intel Core i7-12700 | |
| Intel Core i5-13400 | |
| Intel Core i5-12400F | |
| Borderlands 3 | |
| 1280x720 Very Low Overall Quality (DX11) | |
| AMD Ryzen 7 7800X3D | |
| AMD Ryzen 9 7950X3D | |
| Intel Core i9-13900K | |
| Intel Core i7-13700 | |
| Intel Core i7-13700K | |
| Intel Core i7-12700 | |
| Intel Core i5-13400 | |
| Intel Core i5-12400F | |
| 3840x2160 Badass Overall Quality (DX11) | |
| Intel Core i7-13700K | |
| AMD Ryzen 7 7800X3D | |
| AMD Ryzen 9 7950X3D | |
| Intel Core i9-13900K | |
| Intel Core i7-13700 | |
| Intel Core i7-12700 | |
| Intel Core i5-13400 | |
| Intel Core i5-12400F | |
| Tiny Tina's Wonderlands | |
| 1280x720 Lowest Preset (DX12) | |
| AMD Ryzen 7 7800X3D | |
| AMD Ryzen 9 7950X3D | |
| Intel Core i9-13900K | |
| Intel Core i7-13700 | |
| Intel Core i7-13700K | |
| Intel Core i7-12700 | |
| Intel Core i5-13400 | |
| Intel Core i5-12400F | |
| 3840x2160 Badass Preset (DX12) | |
| AMD Ryzen 9 7950X3D | |
| Intel Core i7-13700 | |
| AMD Ryzen 7 7800X3D | |
| Intel Core i7-12700 | |
| Intel Core i5-13400 | |
| Intel Core i7-13700K | |
| Intel Core i9-13900K | |
| Intel Core i5-12400F | |
| God of War | |
| 1280x720 Low Preset | |
| AMD Ryzen 9 7950X3D | |
| AMD Ryzen 7 7800X3D | |
| Intel Core i9-13900K | |
| Intel Core i7-13700K | |
| Intel Core i7-13700 | |
| Intel Core i7-12700 | |
| Intel Core i5-13400 | |
| Intel Core i5-12400F | |
| 3840x2160 Ultra Preset | |
| AMD Ryzen 7 7800X3D | |
| AMD Ryzen 9 7950X3D | |
| Intel Core i7-13700 | |
| Intel Core i5-13400 | |
| Intel Core i7-13700K | |
| Intel Core i9-13900K | |
| Intel Core i7-12700 | |
| Intel Core i5-12400F | |
| Far Cry New Dawn | |
| 1280x720 Low Preset | |
| AMD Ryzen 7 7800X3D | |
| AMD Ryzen 9 7950X3D | |
| Intel Core i9-13900K | |
| Intel Core i7-13700 | |
| Intel Core i7-13700K | |
| Intel Core i7-12700 | |
| Intel Core i5-13400 | |
| Intel Core i5-12400F | |
| 3840x2160 Ultra Preset | |
| AMD Ryzen 7 7800X3D | |
| AMD Ryzen 9 7950X3D | |
| Intel Core i9-13900K | |
| Intel Core i7-13700 | |
| Intel Core i7-13700K | |
| Intel Core i7-12700 | |
| Intel Core i5-13400 | |
| Intel Core i5-12400F | |
| Far Cry 6 | |
| 1280x720 Low Graphics Quality | |
| AMD Ryzen 7 7800X3D | |
| AMD Ryzen 9 7950X3D | |
| Intel Core i9-13900K | |
| Intel Core i7-13700 | |
| Intel Core i7-13700K | |
| Intel Core i7-12700 | |
| Intel Core i5-13400 | |
| Intel Core i5-12400F | |
| 3840x2160 Ultra Graphics Quality + HD Textures AA:T | |
| AMD Ryzen 7 7800X3D | |
| AMD Ryzen 9 7950X3D | |
| Intel Core i7-13700K | |
| Intel Core i7-13700 | |
| Intel Core i9-13900K | |
| Intel Core i7-12700 | |
| Intel Core i5-13400 | |
| Intel Core i5-12400F | |
AMD Ryzen 7 78003D with an Nvidia GeForce RTX 4090
| bajo | medio | alto | ultra | QHD | 4K DLSS | 4K | |
|---|---|---|---|---|---|---|---|
| GTA V (2015) | 188.5 | 188.5 | 188.1 | 182 | 181.1 | 188 | |
| The Witcher 3 (2015) | 858.4 | 820.4 | 658.8 | 314.3 | 281 | ||
| Dota 2 Reborn (2015) | 322.9 | 299.6 | 288.9 | 267.5 | 258.2 | ||
| Final Fantasy XV Benchmark (2018) | 236 | 234 | 233 | 231 | 158.2 | ||
| X-Plane 11.11 (2018) | 219 | 214 | 188.1 | 160.5 | |||
| Far Cry 5 (2018) | 344 | 303 | 303 | 278 | 268 | 187 | |
| Strange Brigade (2018) | 760 | 618 | 601 | 589 | 534 | 289 | |
| Shadow of the Tomb Raider (2018) | 407 | 383 | 387 | 375 | 322 | 187.7 | |
| Far Cry New Dawn (2019) | 291 | 258 | 253 | 226 | 223 | 180 | |
| Metro Exodus (2019) | 374 | 326 | 268 | 219 | 199.8 | 141.6 | |
| Control (2019) | 240 | 240 | 240 | 220 | 137.5 | 114 | |
| Borderlands 3 (2019) | 310 | 271 | 252 | 241 | 224 | 137.4 | |
| F1 2020 (2020) | 681 | 571 | 563 | 503 | 446 | 288 | |
| F1 2021 (2021) | 830 | 763 | 667 | 369 | 324 | 207 | |
| Far Cry 6 (2021) | 285 | 256 | 230 | 223 | 211 | 141.4 | |
| Guardians of the Galaxy (2021) | 268 | 266 | 267 | 267 | 263 | 194 | |
| God of War (2022) | 315 | 313 | 287 | 212 | 181.5 | 132 | |
| Cyberpunk 2077 1.6 (2022) | 272 | 268 | 251 | 241 | 166.6 | 82.3 | |
| Tiny Tina's Wonderlands (2022) | 506 | 434 | 371 | 309 | 233 | 129.8 | |
| F1 22 (2022) | 533 | 483 | 477 | 221 | 162.9 | 84.5 | |
| The Quarry (2022) | 462 | 355 | 309 | 267 | 198.1 | 82.6 | |
| A Plague Tale Requiem (2022) | 231 | 209 | 189.9 | 168.8 | 132.5 | 148.3 | 76.3 |
| Uncharted Legacy of Thieves Collection (2022) | 159.8 | 164.5 | 163 | 156.9 | 155.8 | 103.5 | |
| Spider-Man Miles Morales (2022) | 233 | 233 | 196.7 | 191.6 | 245 | 134.9 | |
| The Callisto Protocol (2022) | 279.1 | 279.7 | 280.8 | 281.1 | 274.5 | 237.1 | |
| High On Life (2023) | 446 | 404 | 345 | 312 | 225 | 107.8 | |
| The Witcher 3 v4 (2023) | 367 | 300 | 279 | 261 | 260 | 169.9 | |
| Dead Space Remake (2023) | 291 | 282 | 262 | 259 | 201 | 106.7 | |
| Hogwarts Legacy (2023) | 218 | 200 | 164.4 | 163.3 | 146.7 | 82.4 | |
| Returnal (2023) | 262 | 256 | 237 | 211 | 172 | 112 | |
| Atomic Heart (2023) | 360 | 306 | 274 | 228 | 184.1 | 112.4 | |
| Company of Heroes 3 (2023) | 465.1 | 429.6 | 376.5 | 373.3 | 314.6 | 215.4 | |
| Sons of the Forest (2023) | 184.7 | 176.4 | 171.4 | 165.4 | 159.1 | 132.1 | |
| Resident Evil 4 Remake (2023) | 383 | 344 | 336 | 237 | 199.9 | 124.2 | |
| The Last of Us (2023) | 241 | 215 | 202 | 191.1 | 146 | 122.9 | 82.6 |
| Dead Island 2 (2023) | 379 | 369 | 336 | 315 | 284 | 161.6 | |
| Star Wars Jedi Survivor (2023) | 197.7 | 197.3 | 196.1 | 193.8 | 157.6 | 82.3 | |
| Diablo 4 (2023) | 399 | 399 | 398 | 397 | 390 | 238 | 216 |
| F1 23 (2023) | 576 | 594 | 542 | 226 | 152 | 80 |
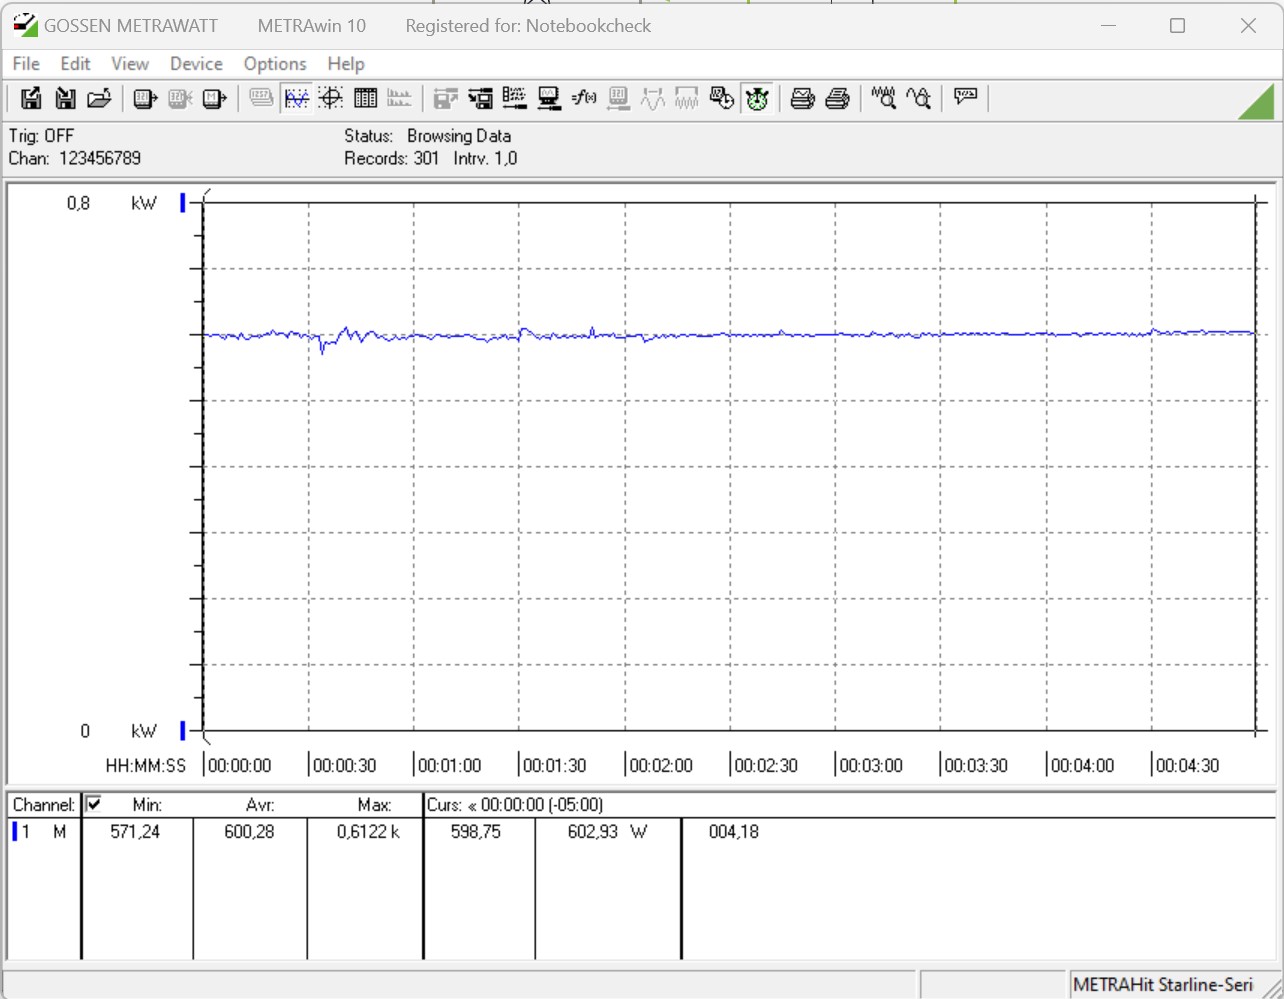
Consumo de energía - Frugal, pero es imprescindible un buen flujo de aire
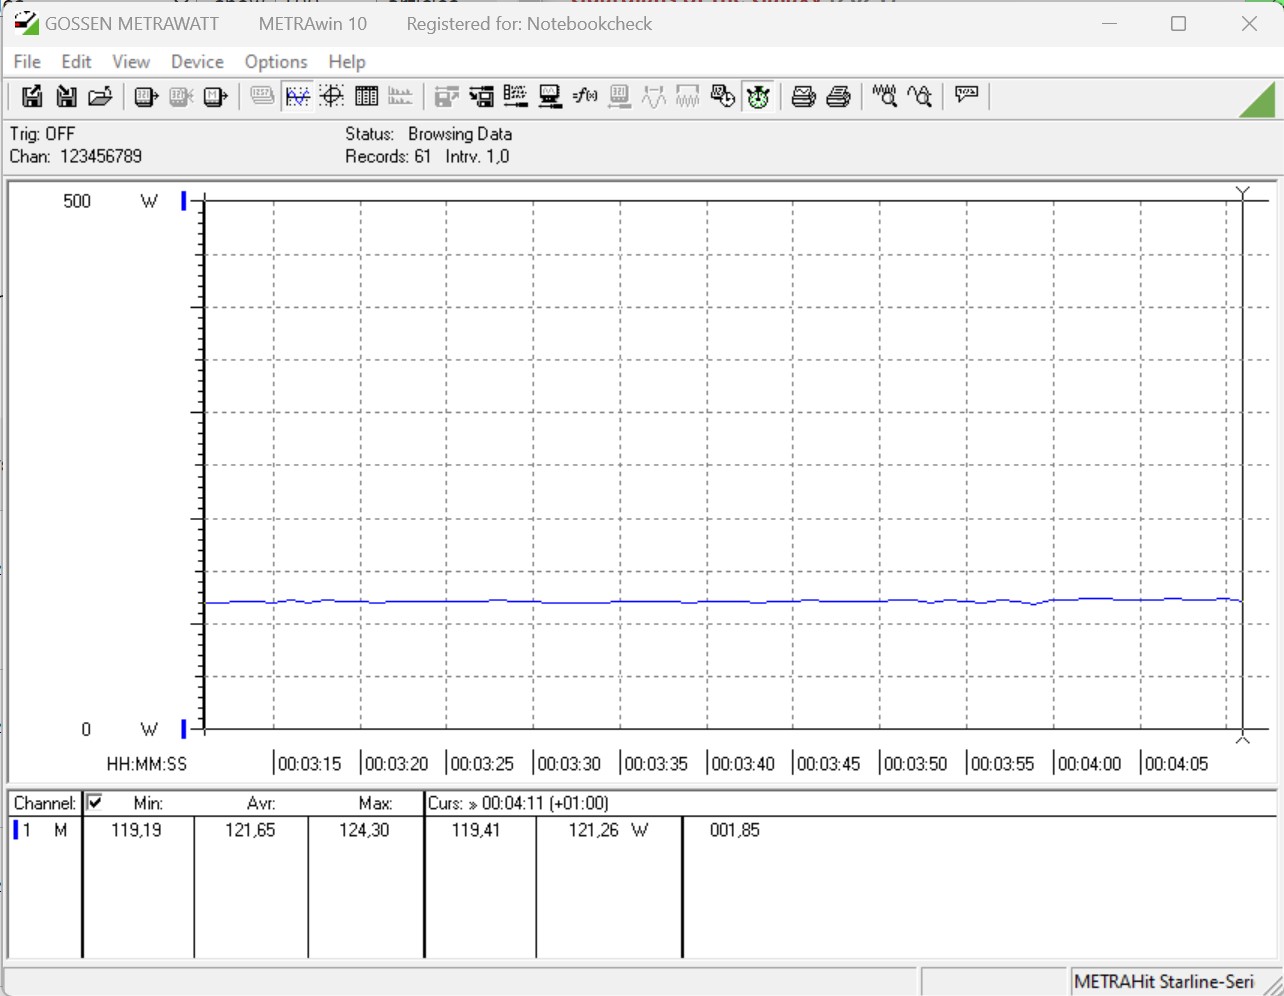
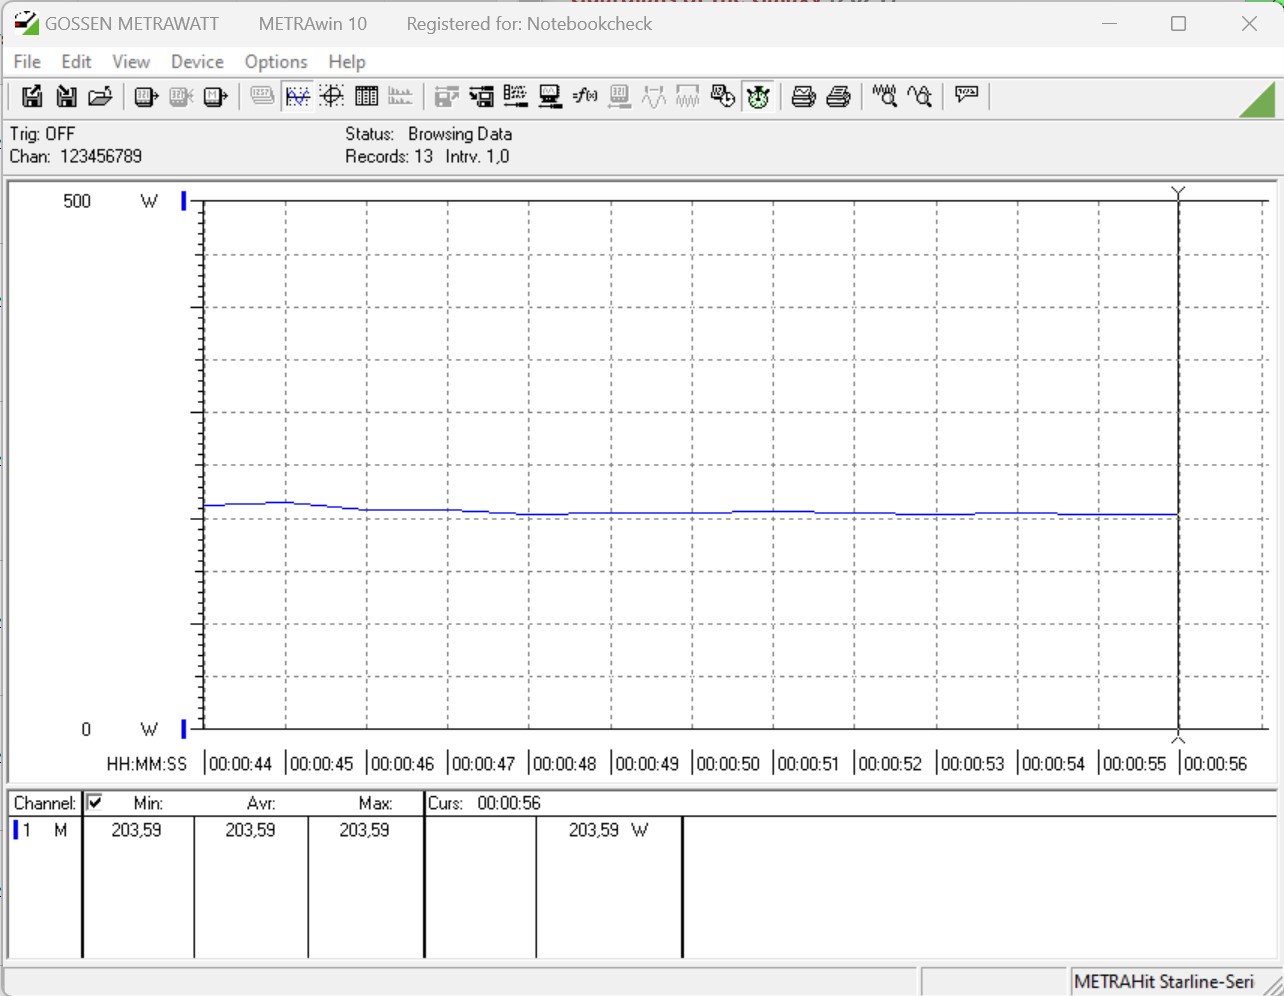
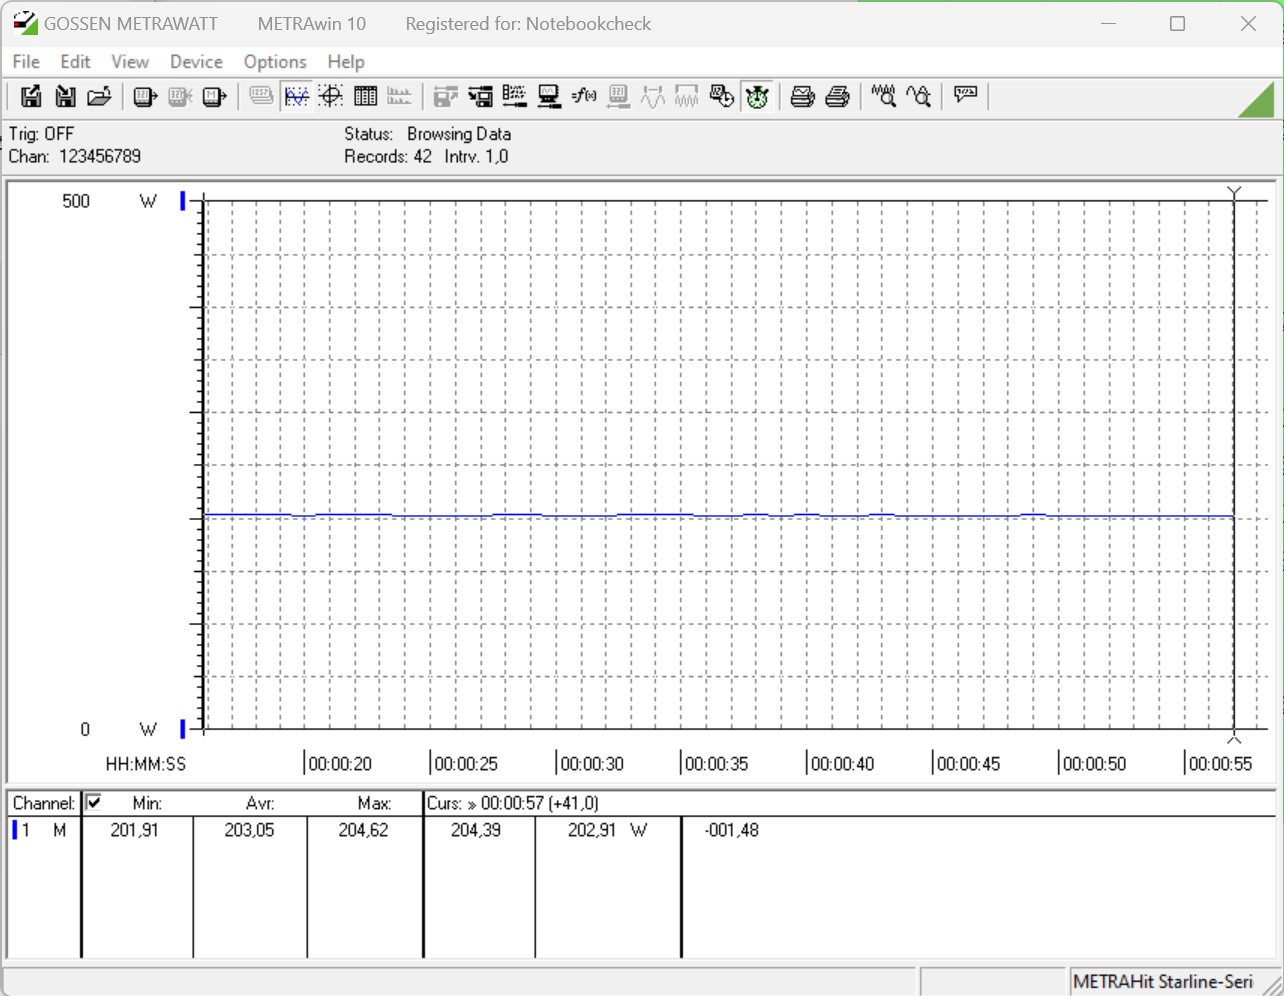
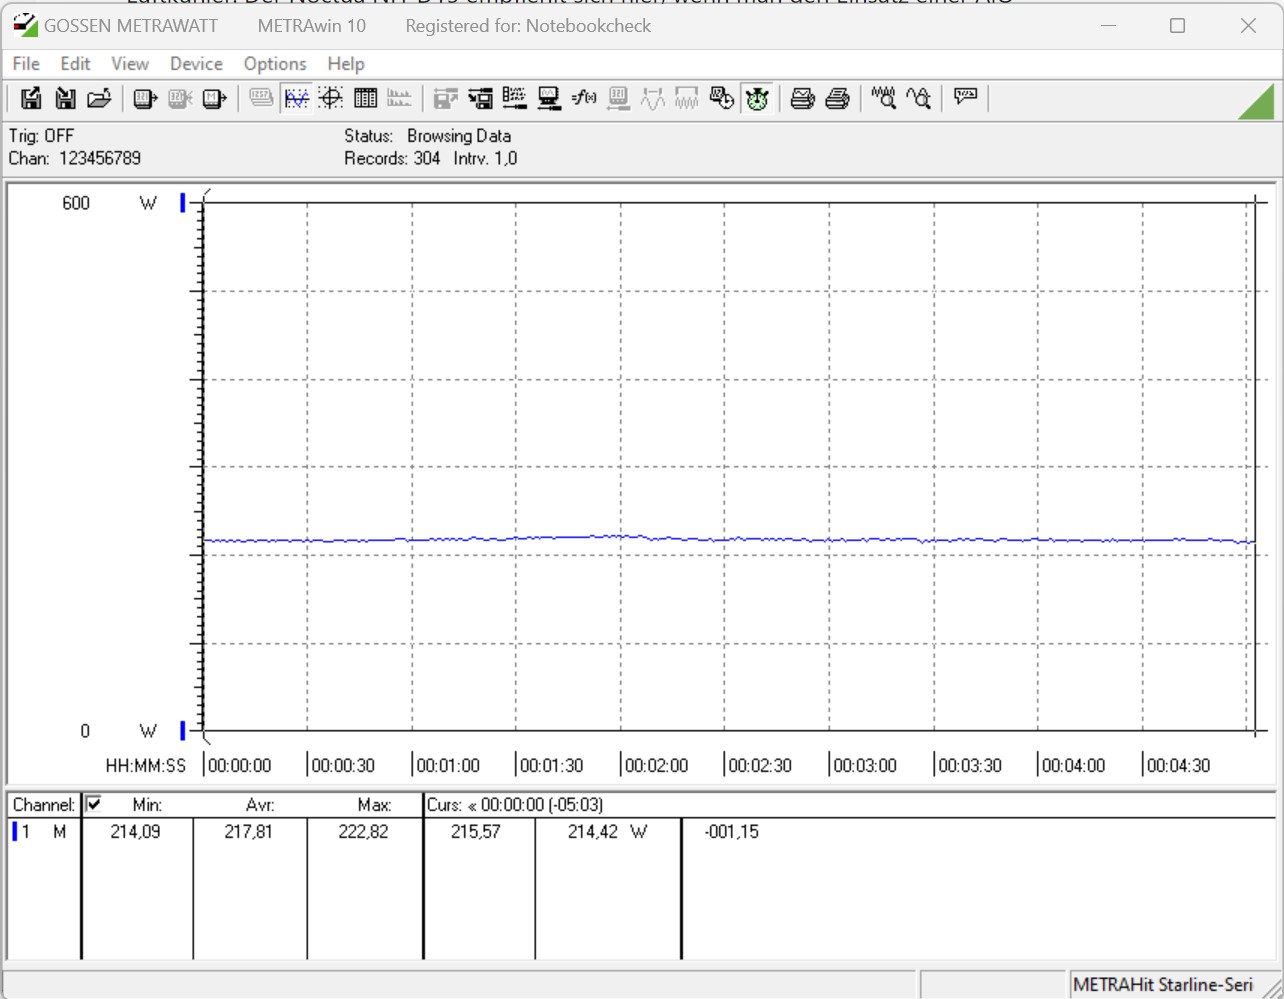
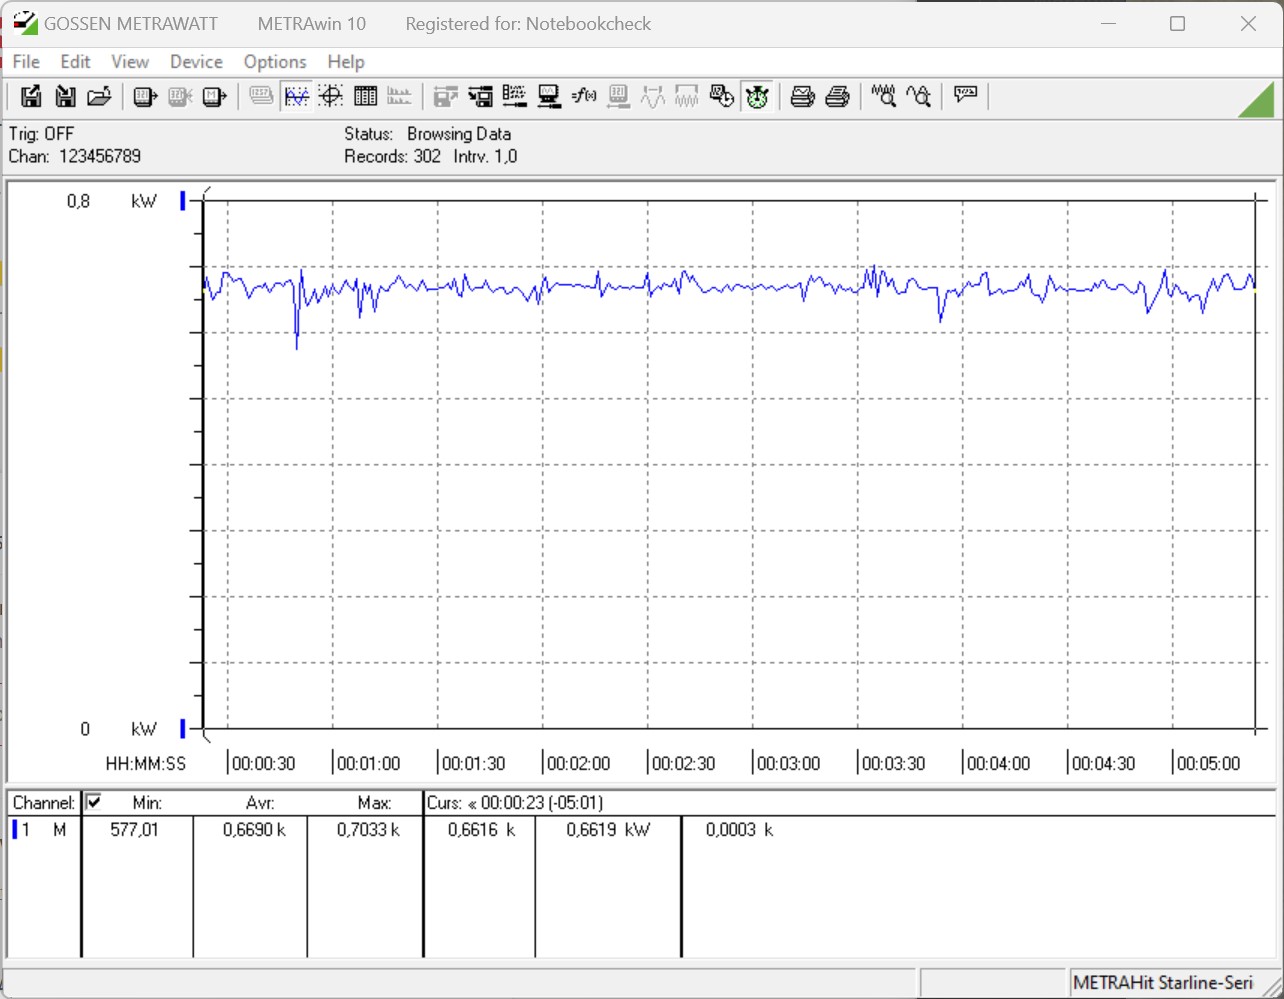
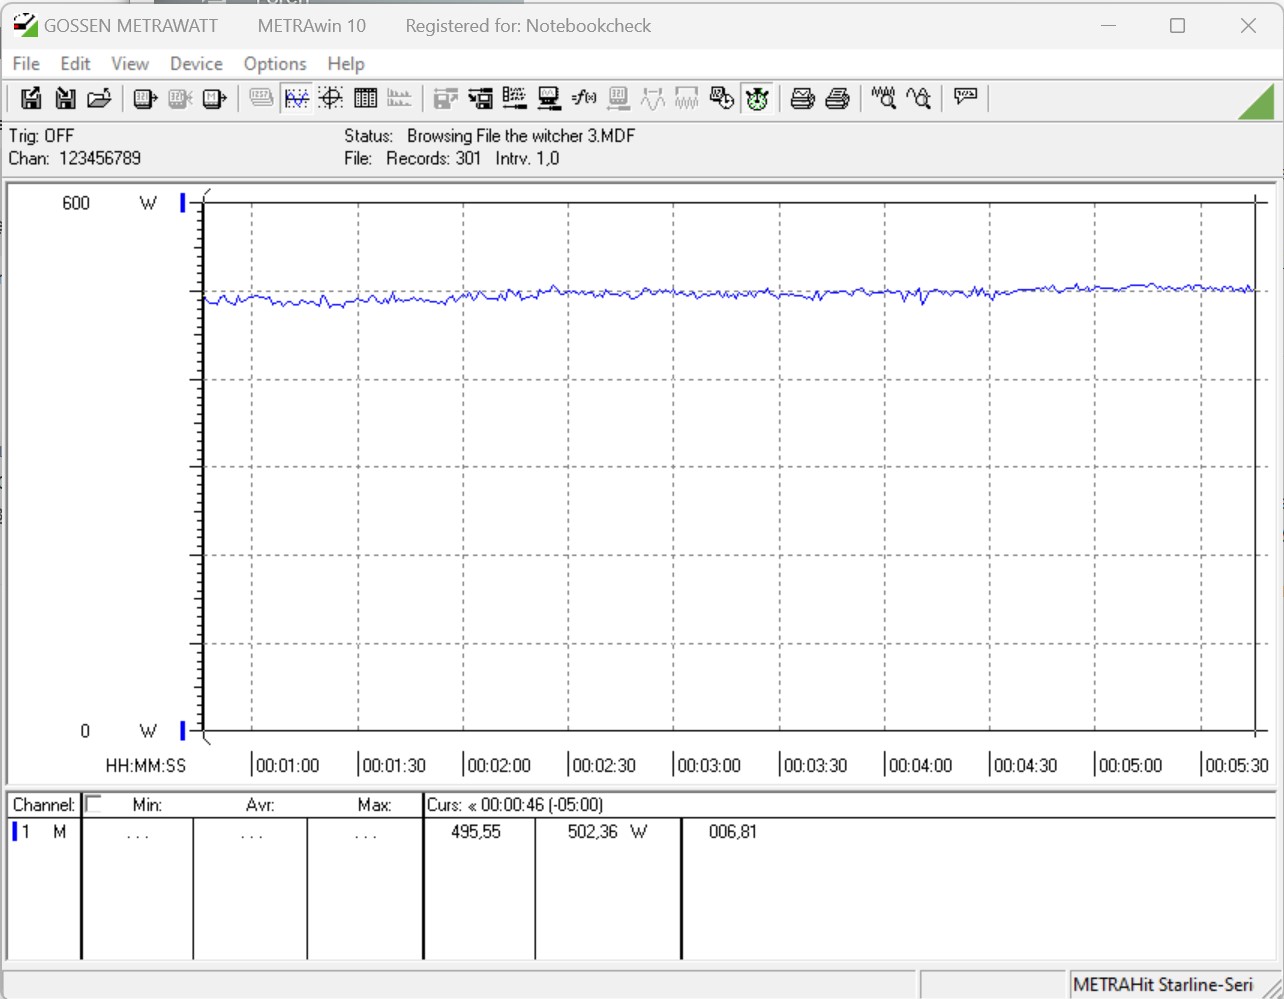
Todos los procesadores X3D de la serie 7000 están limitados a un consumo máximo de 162 vatios (PPT). Como resultado, lo mismo puede decirse de nuestro AMD Ryzen 7 7800X3D. En modo inactivo, no observamos valores récord a 120 vatios, pero en comparación con elAMD Ryzen 9 7950X3Dnuestros valores medidos fueron casi idénticos. Mientras jugábamos, documentamos un promedio de 497 vatios durante nuestra Witcher 3 escena de juego. Esto significa que nuestro sistema de pruebas está más o menos al mismo nivel que uno basado en unIntel Core i5-13400. Durante nuestra prueba de estrés Prime95, el sistema basado en un AMD Ryzen 7 7800X3D fue en realidad el más frugal. Su valor medio fue de sólo 218 vatios.
Para nuestras mediciones bajo carga, hay que tener en cuenta el consumo de energía de la tarjeta gráfica. LaPalit GeForce RTX 4090 GameRock OCpor sí sola ya consume 450 vatios.
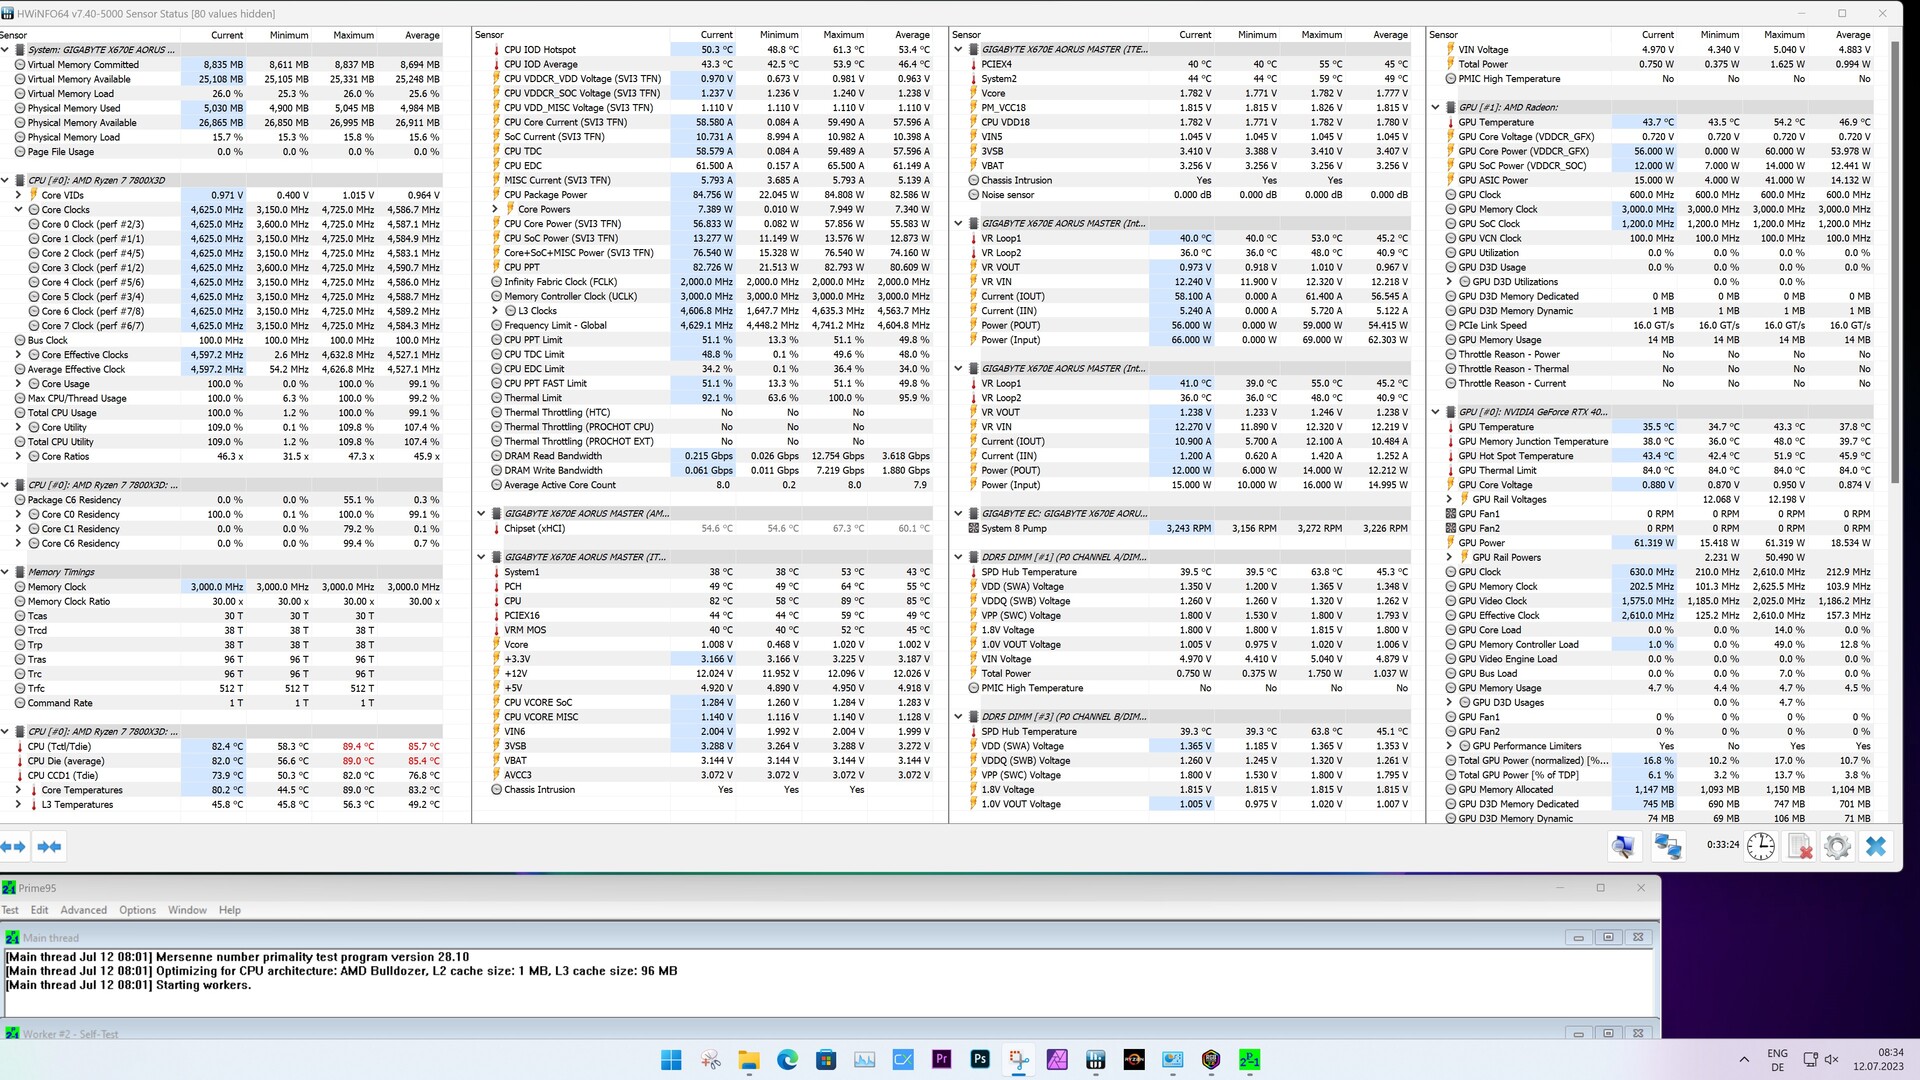
Hemos observado temperaturas bastante elevadas debido a la mala refrigeración de la carcasa. En el peor de los casos, el AMD Ryzen 7 7800X3D alcanzó su límite térmico y tuvo que ser ralentizado. Para no falsear nuestras mediciones, no realizamos esta prueba con la carcasa abierta. Quitamos la parte lateral, lo que hizo que las temperaturas de la CPU cayeran bastante rápido hasta valores poco críticos. Una carcasa con buena circulación de aire refrigera bien el procesador de 8 núcleos. Sin embargo, no recomendaríamos renunciar a una AiO. En este punto, aconsejaríamos echar un vistazo a la lista de disipadores recomendados por el fabricante en https://www.amd.com/de/technologies/cpu-cooler-solution#AMD-FL%C3%9CSSIGK%C3%9CHLER-ANIMATIONEN para los procesadores AMD Ryzen 7000.
| Power Consumption / Cinebench R15 Multi (external Monitor) | |
| Schenker XMG SECTOR, i9 13900K, RTX 4090 | |
| Intel Core i7-13700 | |
| Intel Core i7-13700K | |
| Intel Core i7-12700 | |
| AMD Ryzen 9 7950X3D | |
| AMD Ryzen 7 7800X3D | |
| Intel Core i5-13400 | |
| Intel Core i5-12400F | |
| Power Consumption / Cinebench R15 Multi Efficiency (external Monitor) | |
| AMD Ryzen 9 7950X3D | |
| AMD Ryzen 7 7800X3D | |
| Power Consumption / Prime95 V2810 Stress (external Monitor) | |
| Intel Core i7-13700 | |
| Schenker XMG SECTOR, i9 13900K, RTX 4090 | |
| Intel Core i7-13700K | |
| Intel Core i7-12700 | |
| AMD Ryzen 9 7950X3D | |
| Intel Core i5-12400F | |
| Intel Core i5-13400 | |
| AMD Ryzen 7 7800X3D | |
| Power Consumption / The Witcher 3 ultra (external Monitor) | |
| Intel Core i7-13700 | |
| Intel Core i7-13700K | |
| AMD Ryzen 9 7950X3D | |
| Schenker XMG SECTOR, i9 13900K, RTX 4090 | |
| Intel Core i7-12700 | |
| Intel Core i5-13400 | |
| AMD Ryzen 7 7800X3D | |
| Intel Core i5-12400F | |
* ... más pequeño es mejor
| Power Consumption - Cinebench R15 Multi Efficiency (external Monitor) | |
| AMD Ryzen 9 7950X3D | |
| AMD Ryzen 9 5950X | |
| AMD Ryzen 9 7950X | |
| AMD Ryzen 9 7900X | |
| AMD Ryzen 7 7800X3D | |
| Intel Core i9-13900K | |
Power consumption with external monitor
Pro
Contra
Veredicto: una gran CPU para los jugadores más exigentes
En este análisis, echamos un vistazo más de cerca al AMD Ryzen 7 7800X3D, el primer procesador X3D completo de la nueva plataforma AM5. Lo que queremos decir con esto es que se trata de un nuevo procesador que no está construido sobre un diseño híbrido - en su lugar, sólo tiene un troquel CCD en la forma de su 3D V-Cache. Esto es una ventaja para muchos juegos y, como resultado, el procesador de 8 núcleos es capaz de saltar por delante del AMD Ryzen 9 7950X3D muy ligeramente.
Esto no significa que el AMD Ryzen 7 7800X3D pueda pasar por un todoterreno. El procesador de 8 núcleos no lo hizo lo suficientemente bien en las pruebas de rendimiento de CPU y, debido a su limitado rendimiento multinúcleo, el componente no pudo seguir el ritmo de los modelos de gama alta. Pero no tiene por qué. Como CPU de juego pura, la 7800X3D puede hacer exactamente aquello para lo que fue desarrollada. Un aspecto positivo es su bajo consumo de energía.
El AMD Ryzen 7 7800X3D ofrece un gran rendimiento en juegos. En cuanto al precio, al procesador de 8 núcleos le costará un poco convencer a los compradores para que elijan este modelo.
En resumen, podemos decir que el AMD Ryzen 7 7800X3D es, hoy por hoy, una de las CPU para juegos más rápidas del mercado. No podemos decir que sea el procesador más rápido, ya que, por ejemplo, elAMD Ryzen 9 7950X3Dofrece un rendimiento ligeramente superior en bastantes juegos, siempre y cuando su correcta asignación de hilos permita aprovechar todo el rendimiento de la CPU. Debido a la estructura híbrida de los modelos Ryzen 9 con 3D V-Cache, desafortunadamente no siempre está garantizado que el CCD con 3D V-Cache tenga prioridad. Aquí, el AMD Ryzen 7 7800X3D se beneficia gracias a su construcción interna más simple. Aunque, esto es quejarse en el más alto de los niveles - todos los juegos que probamos podrían ejecutarse, independientemente de la CPU utilizada.
El mayor problema del componente en este momento es, a nuestros ojos, su precio. Actualmente, se vende por un mínimo de 441,99 dólares. UnIntel Core i7-13700Kcuesta más o menos lo mismo y ofrece niveles de rendimiento similares - pero, ofrece un mejor rendimiento total de la CPU. Si tenemos en cuenta lo preparados que están estos procesadores para el futuro, entonces nadie puede vencer a AMD. Lo creas o no, los rumores apuntan a que la plataforma AM5 seguirá recibiendo soporte hasta 2025. El zócalo 1.700, que es el que utilizan actualmente los sistemas Intel, probablemente será sustituido por su sucesor el año que viene y no se lanzarán más procesadores para el zócalo 1.700.
Precio y disponibilidad
Actualmente, puedes comprar el AMD Ryzen 7 7800X3D en Amazon por 441,99 dólares.
Transparencia
Nuestro equipo editorial se encarga de seleccionar los dispositivos que se someten a revisión. La muestra de prueba fue adquirida libremente por el autor a sus expensas. El prestamista no influyó en esta reseña, ni el fabricante recibió una copia de la misma antes de su publicación. No había ninguna obligación de publicar esta reseña. Como empresa de medios independiente, Notebookcheck no está sujeta a la autoridad de fabricantes, minoristas o editores.
Así es como prueba Notebookcheck
Cada año, Notebookcheck revisa de forma independiente cientos de portátiles y smartphones utilizando procedimientos estandarizados para asegurar que todos los resultados son comparables. Hemos desarrollado continuamente nuestros métodos de prueba durante unos 20 años y hemos establecido los estándares de la industria en el proceso. En nuestros laboratorios de pruebas, técnicos y editores experimentados utilizan equipos de medición de alta calidad. Estas pruebas implican un proceso de validación en varias fases. Nuestro complejo sistema de clasificación se basa en cientos de mediciones y puntos de referencia bien fundamentados, lo que mantiene la objetividad.
