Análisis del Acer Swift X 16: La RTX 3050 brilla en un portátil multimedia
El Acer Swift X 16 se diferencia básicamente delAcer Swift 3 (SF316)sólo en las tarjetas gráficas, ya que el primero utiliza Nvidia GeForce RTX 3050el portátil multimedia está alimentado por un Core i5-11320H o un Core i7-11390H QuadCore CPU - Tiger Lake Refresh con un TDP de 35 vatios. No se ofrece ninguna variante AMD como su hermano pequeño, el Acer Swift X 14. La RAM es siempre una soldada de 16 GB de LPDDR4X-4266, mientras que el SSD PCIe 3.0 tiene 512 GB.
Lo que más nos interesa para nuestro análisis es saber si la pantalla y el rendimiento multimedia se reflejan adecuadamente en el precio de 1.200 dólares. Después de todo, los dispositivos de la competencia, como el Inspiron 16 Plus de Dell, IdeaPad 5 Pro 16 de Lenovo y VivoBook Pro 16X de Asus no deben ser subestimados.
Posibles contendientes en la comparación
Valoración | Fecha | Modelo | Peso | Altura | Tamaño | Resolución | Precio |
|---|---|---|---|---|---|---|---|
| 86.2 % v7 (old) | 07/2022 | Acer Swift X SFX16-51G-5388 i5-11320H, GeForce RTX 3050 4GB Laptop GPU | 1.8 kg | 18.9 mm | 16.10" | 1920x1080 | |
| 86.4 % v7 (old) | 10/2021 | Acer Swift 3 SF316-51 i7-11370H, Iris Xe G7 96EUs | 1.7 kg | 15.9 mm | 16.10" | 1920x1080 | |
| 85.6 % v7 (old) | 03/2022 | Acer Swift X SFX14-41G-R7F3 R5 5500U, GeForce GTX 1650 Mobile | 1.4 kg | 18.89 mm | 14.00" | 1920x1080 | |
| 86.1 % v7 (old) | 09/2021 | Lenovo IdeaPad 5 Pro 16ACH R7 5800H, GeForce GTX 1650 Mobile | 2 kg | 17.5 mm | 16.00" | 2560x1600 | |
| 86.7 % v7 (old) | 08/2021 | Dell Inspiron 16 Plus 7610 i7-11800H, GeForce RTX 3050 4GB Laptop GPU | 2 kg | 18.99 mm | 16.00" | 3072x1920 | |
v (old) | 12/2021 | Asus Vivobook Pro 16X-M7600QE R9 5900HX, GeForce RTX 3050 Ti Laptop GPU | 1.9 kg | 19 mm | 16.10" | 3840x2400 | |
| 86.5 % v7 (old) | 10/2021 | Huawei MateBook 16 R7 5800H R7 5800H, Vega 8 | 2 kg | 17.8 mm | 16.00" | 2520x1680 |
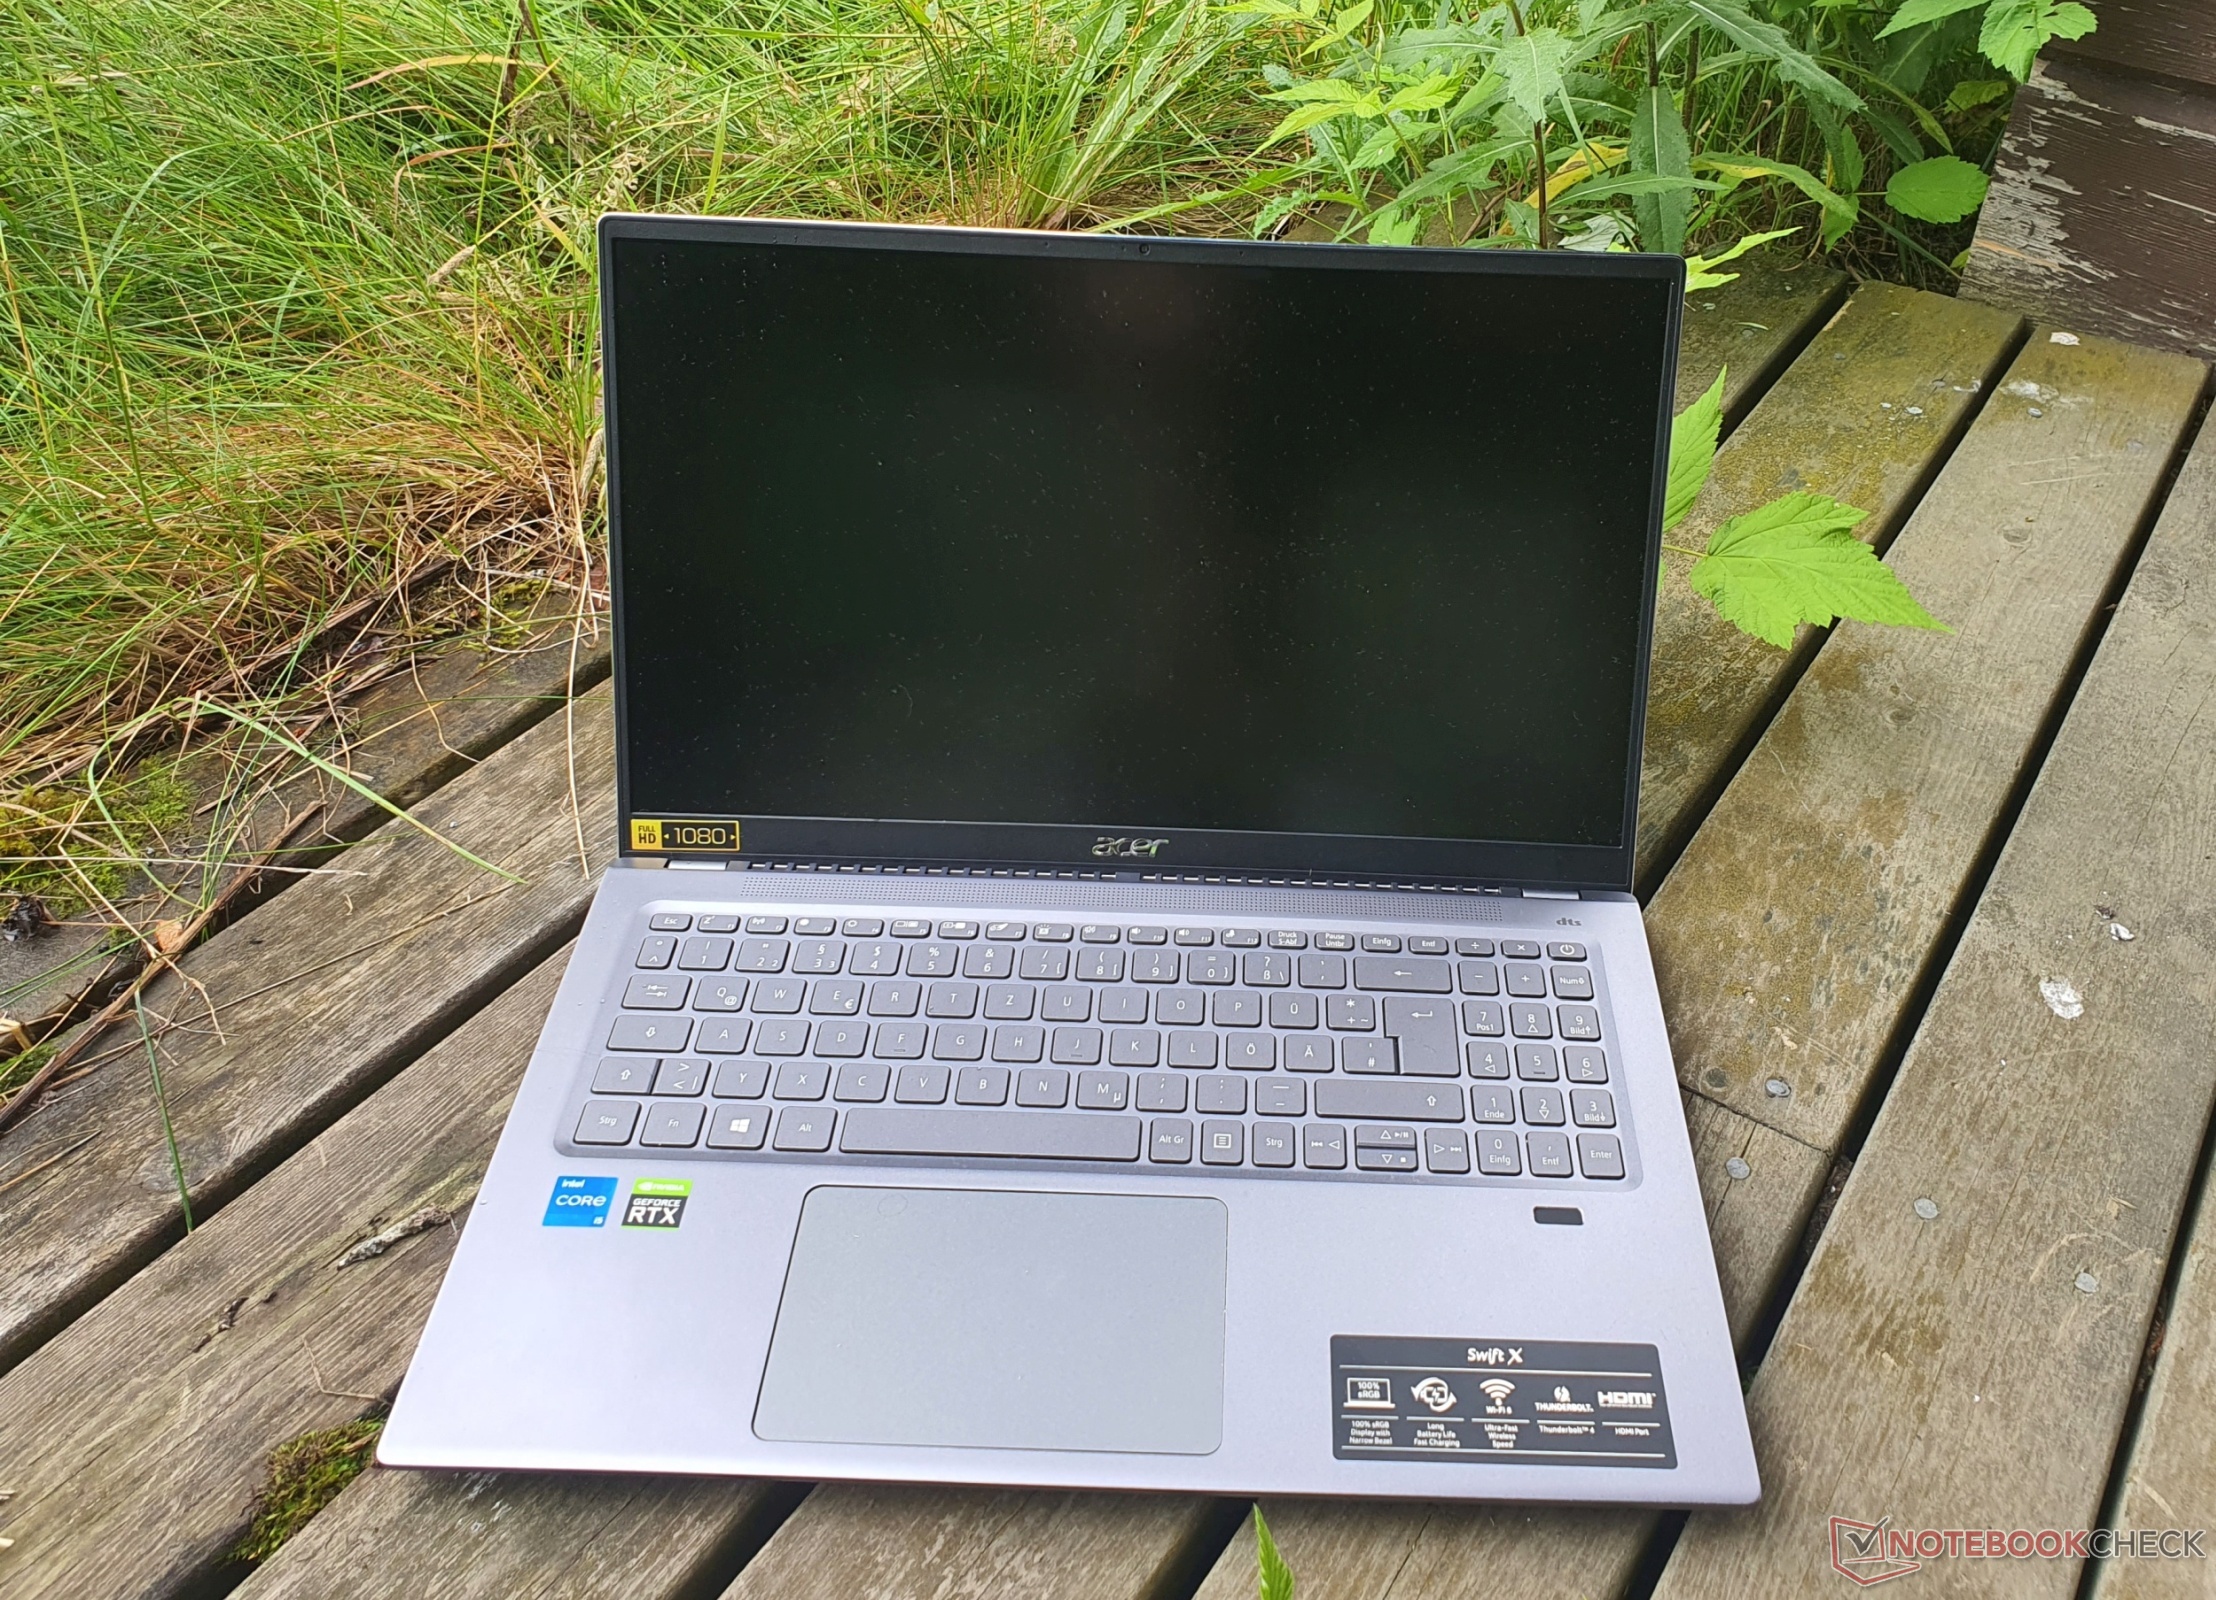
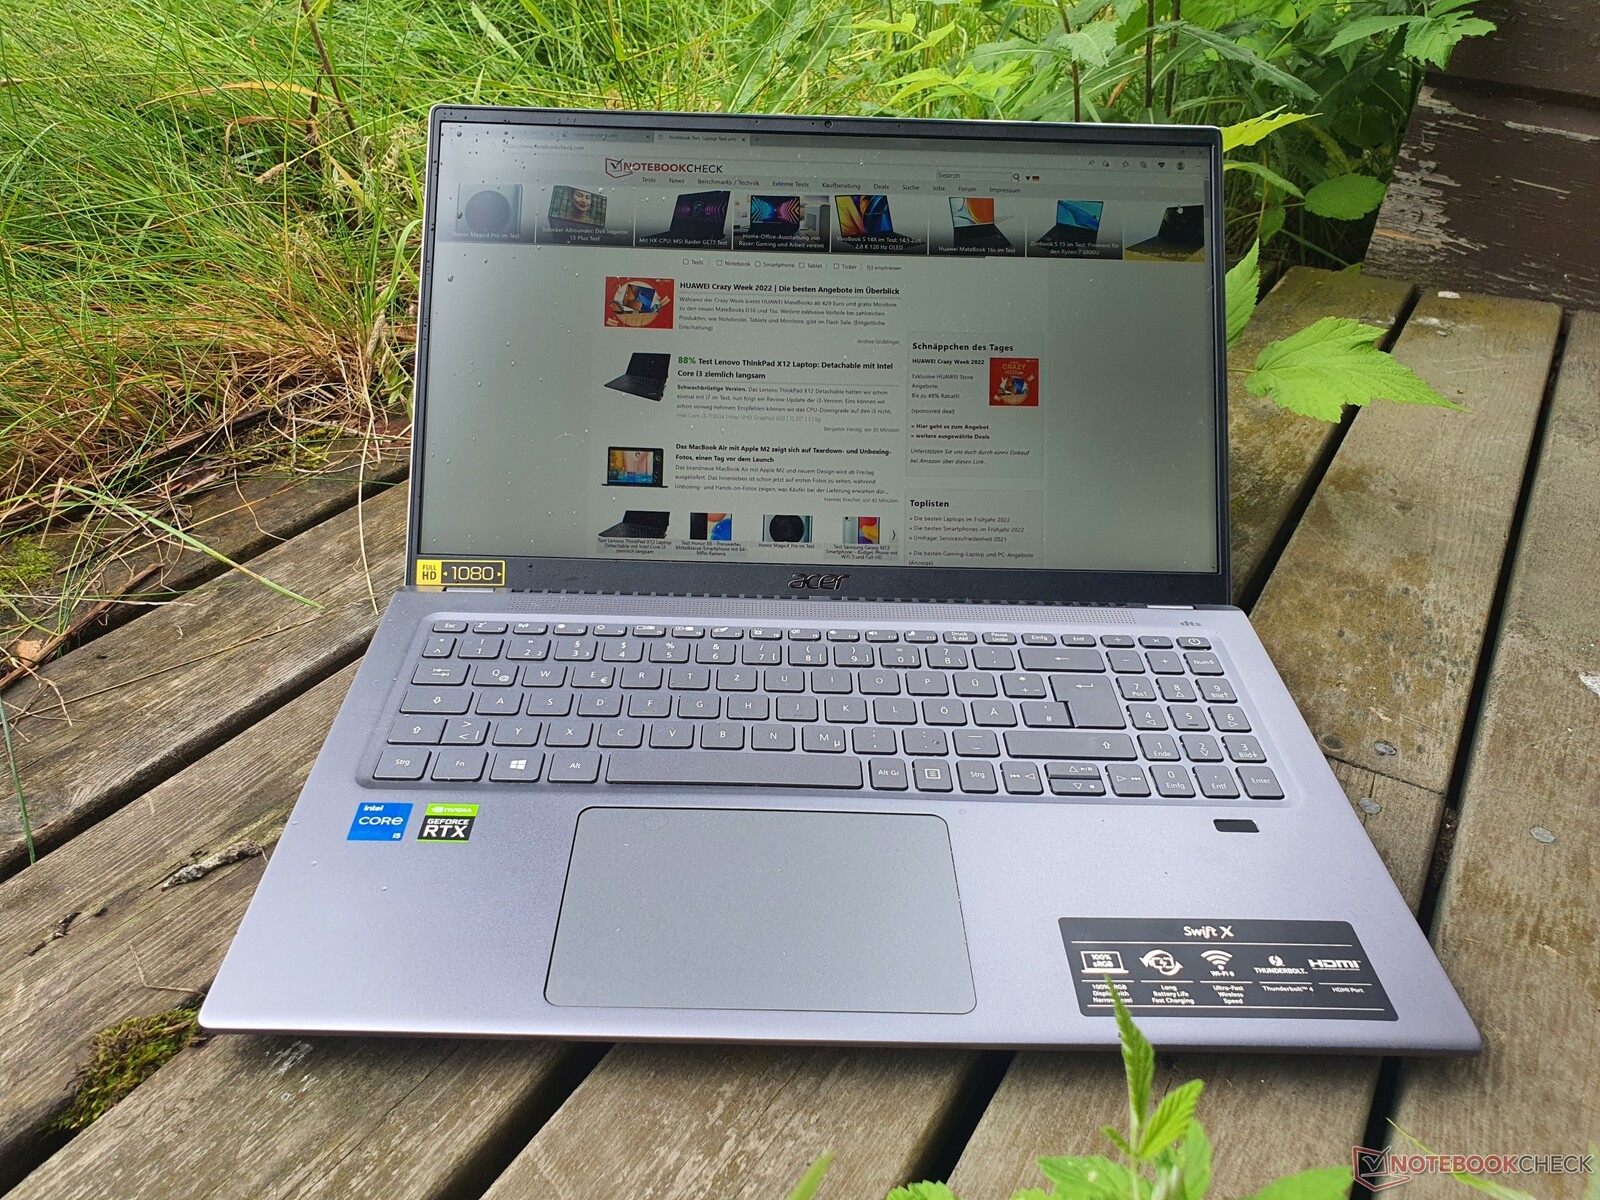
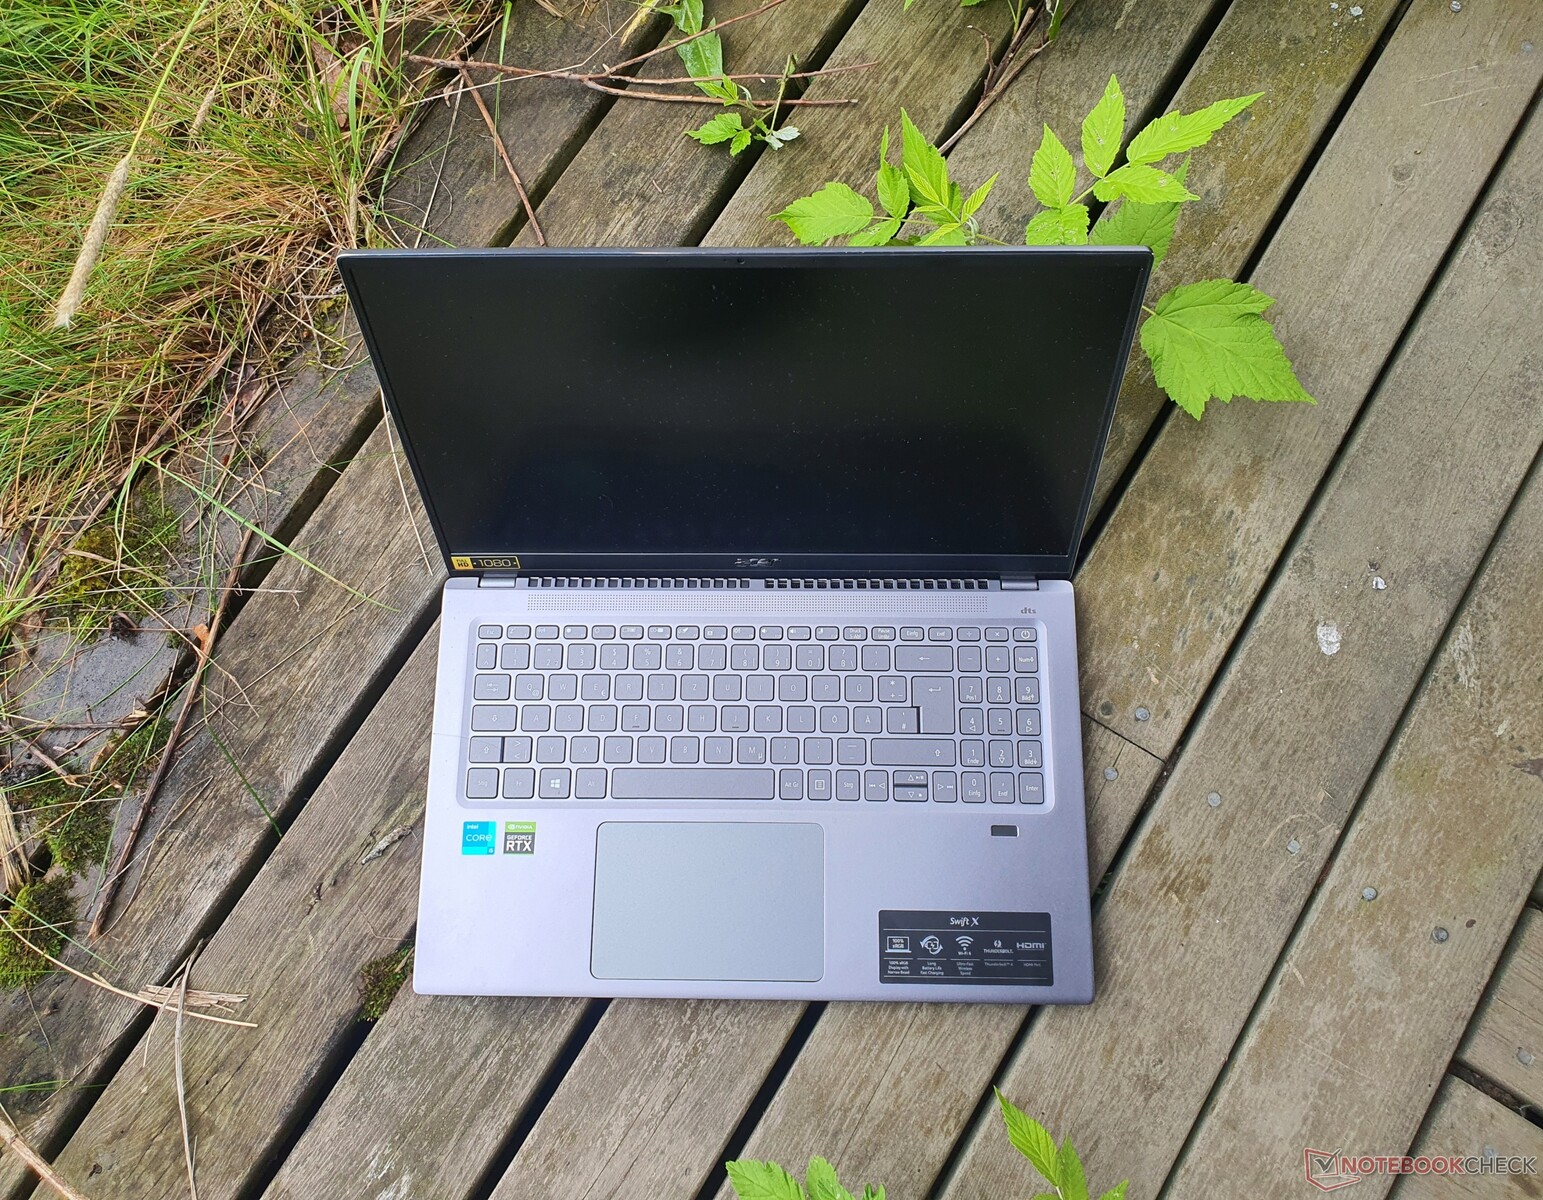
La carcasa de aluminio da estabilidad al Acer Swift X 16
La carcasa de aluminio gris-azulado y mate tiene un tacto de alta calidad y es bastante estable; la flexión del reposamanos es mínima. Las bisagras están bien ajustadas, de modo que la pantalla sólo se tambalea un poco, pero al mismo tiempo permite abrirla con una sola mano.
Sin embargo, la tapa podría haber sido un poco más resistente a la torsión y se comporta peor bajo determinadas aplicaciones de presión. Pero esto apenas supone un problema en el uso diario. La fabricación no presenta huecos ni protuberancias y el ángulo máximo de apertura es de unos relativamente pequeños 130 grados.
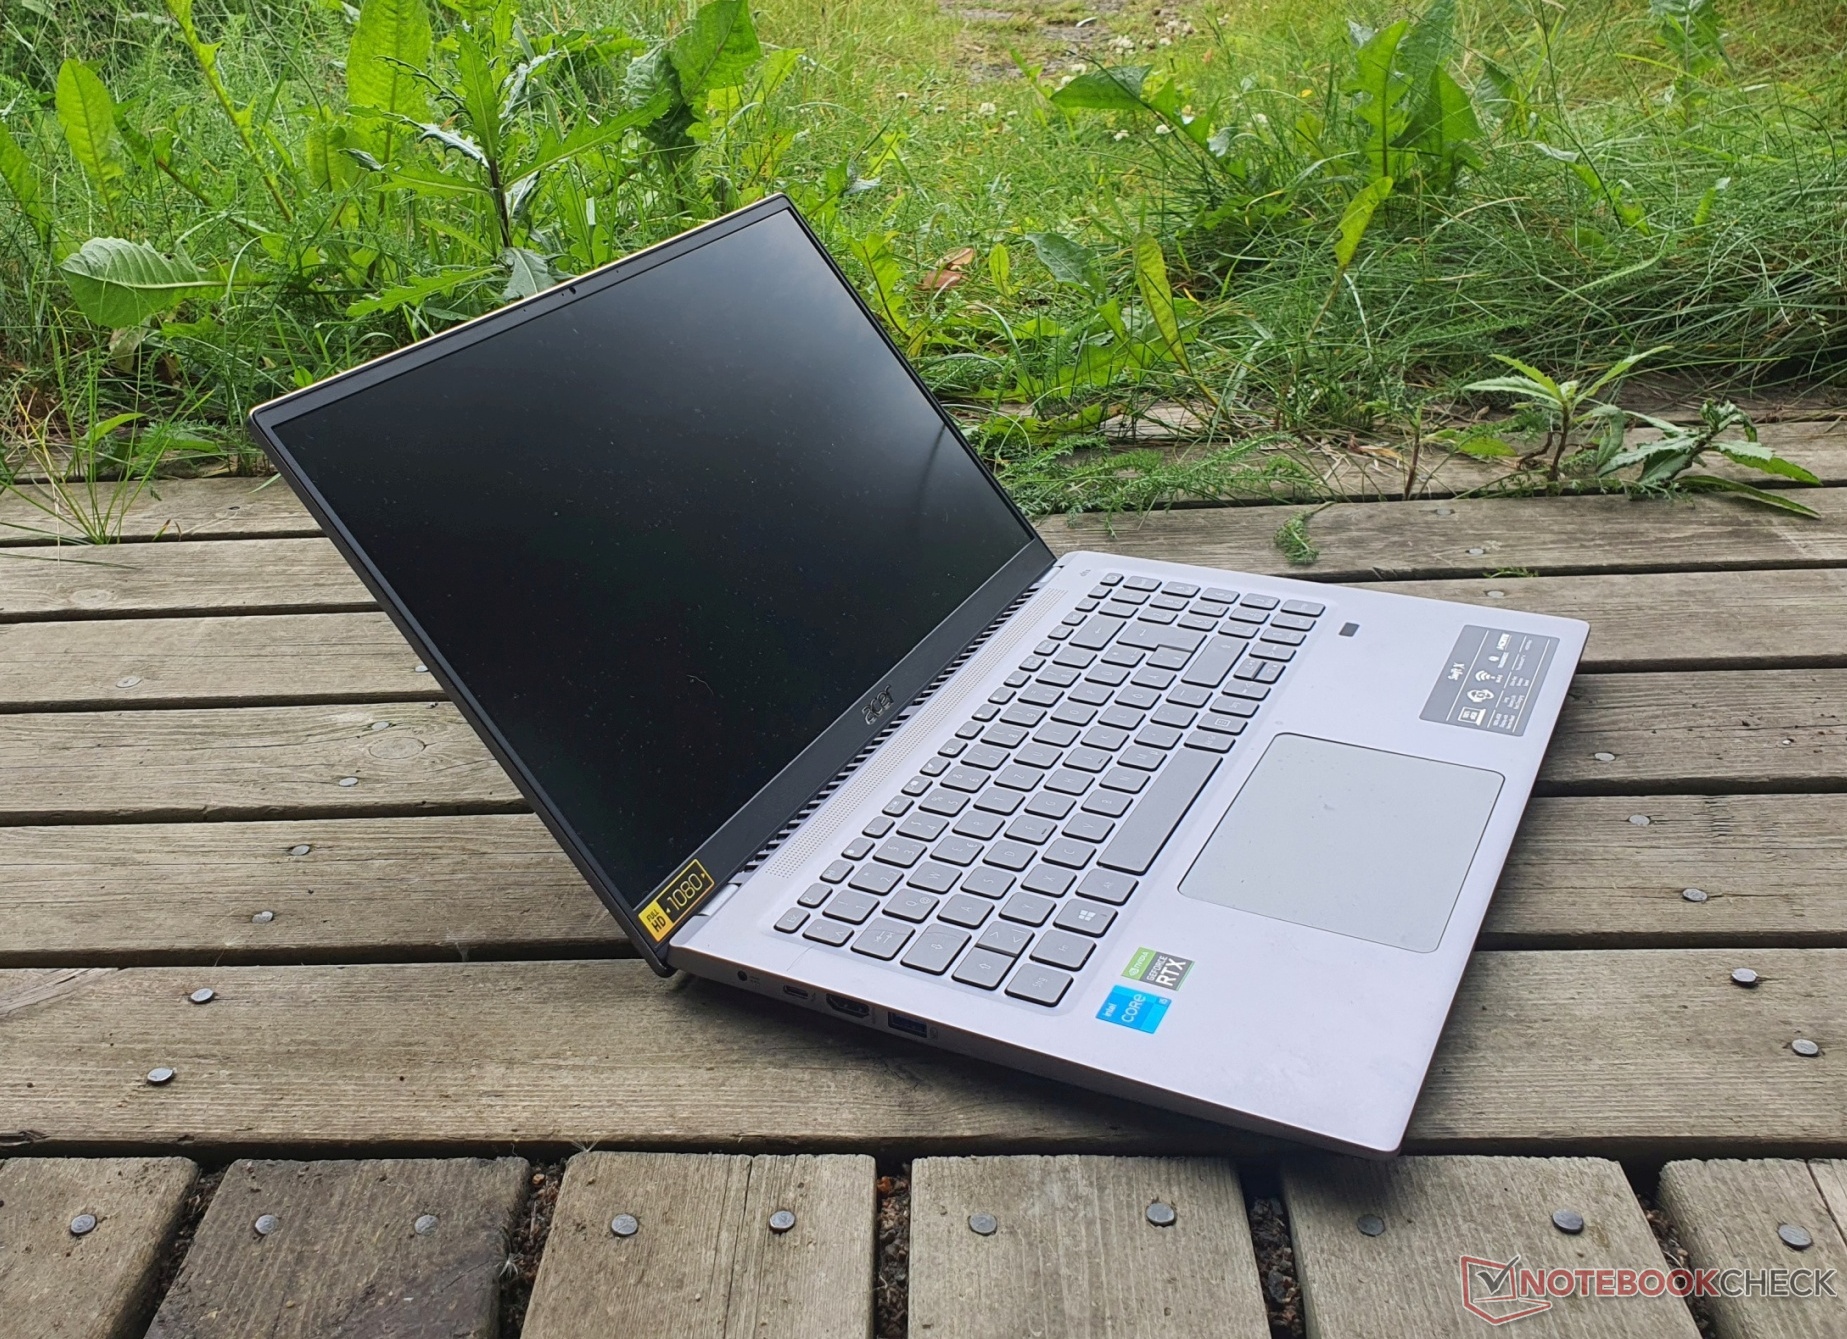
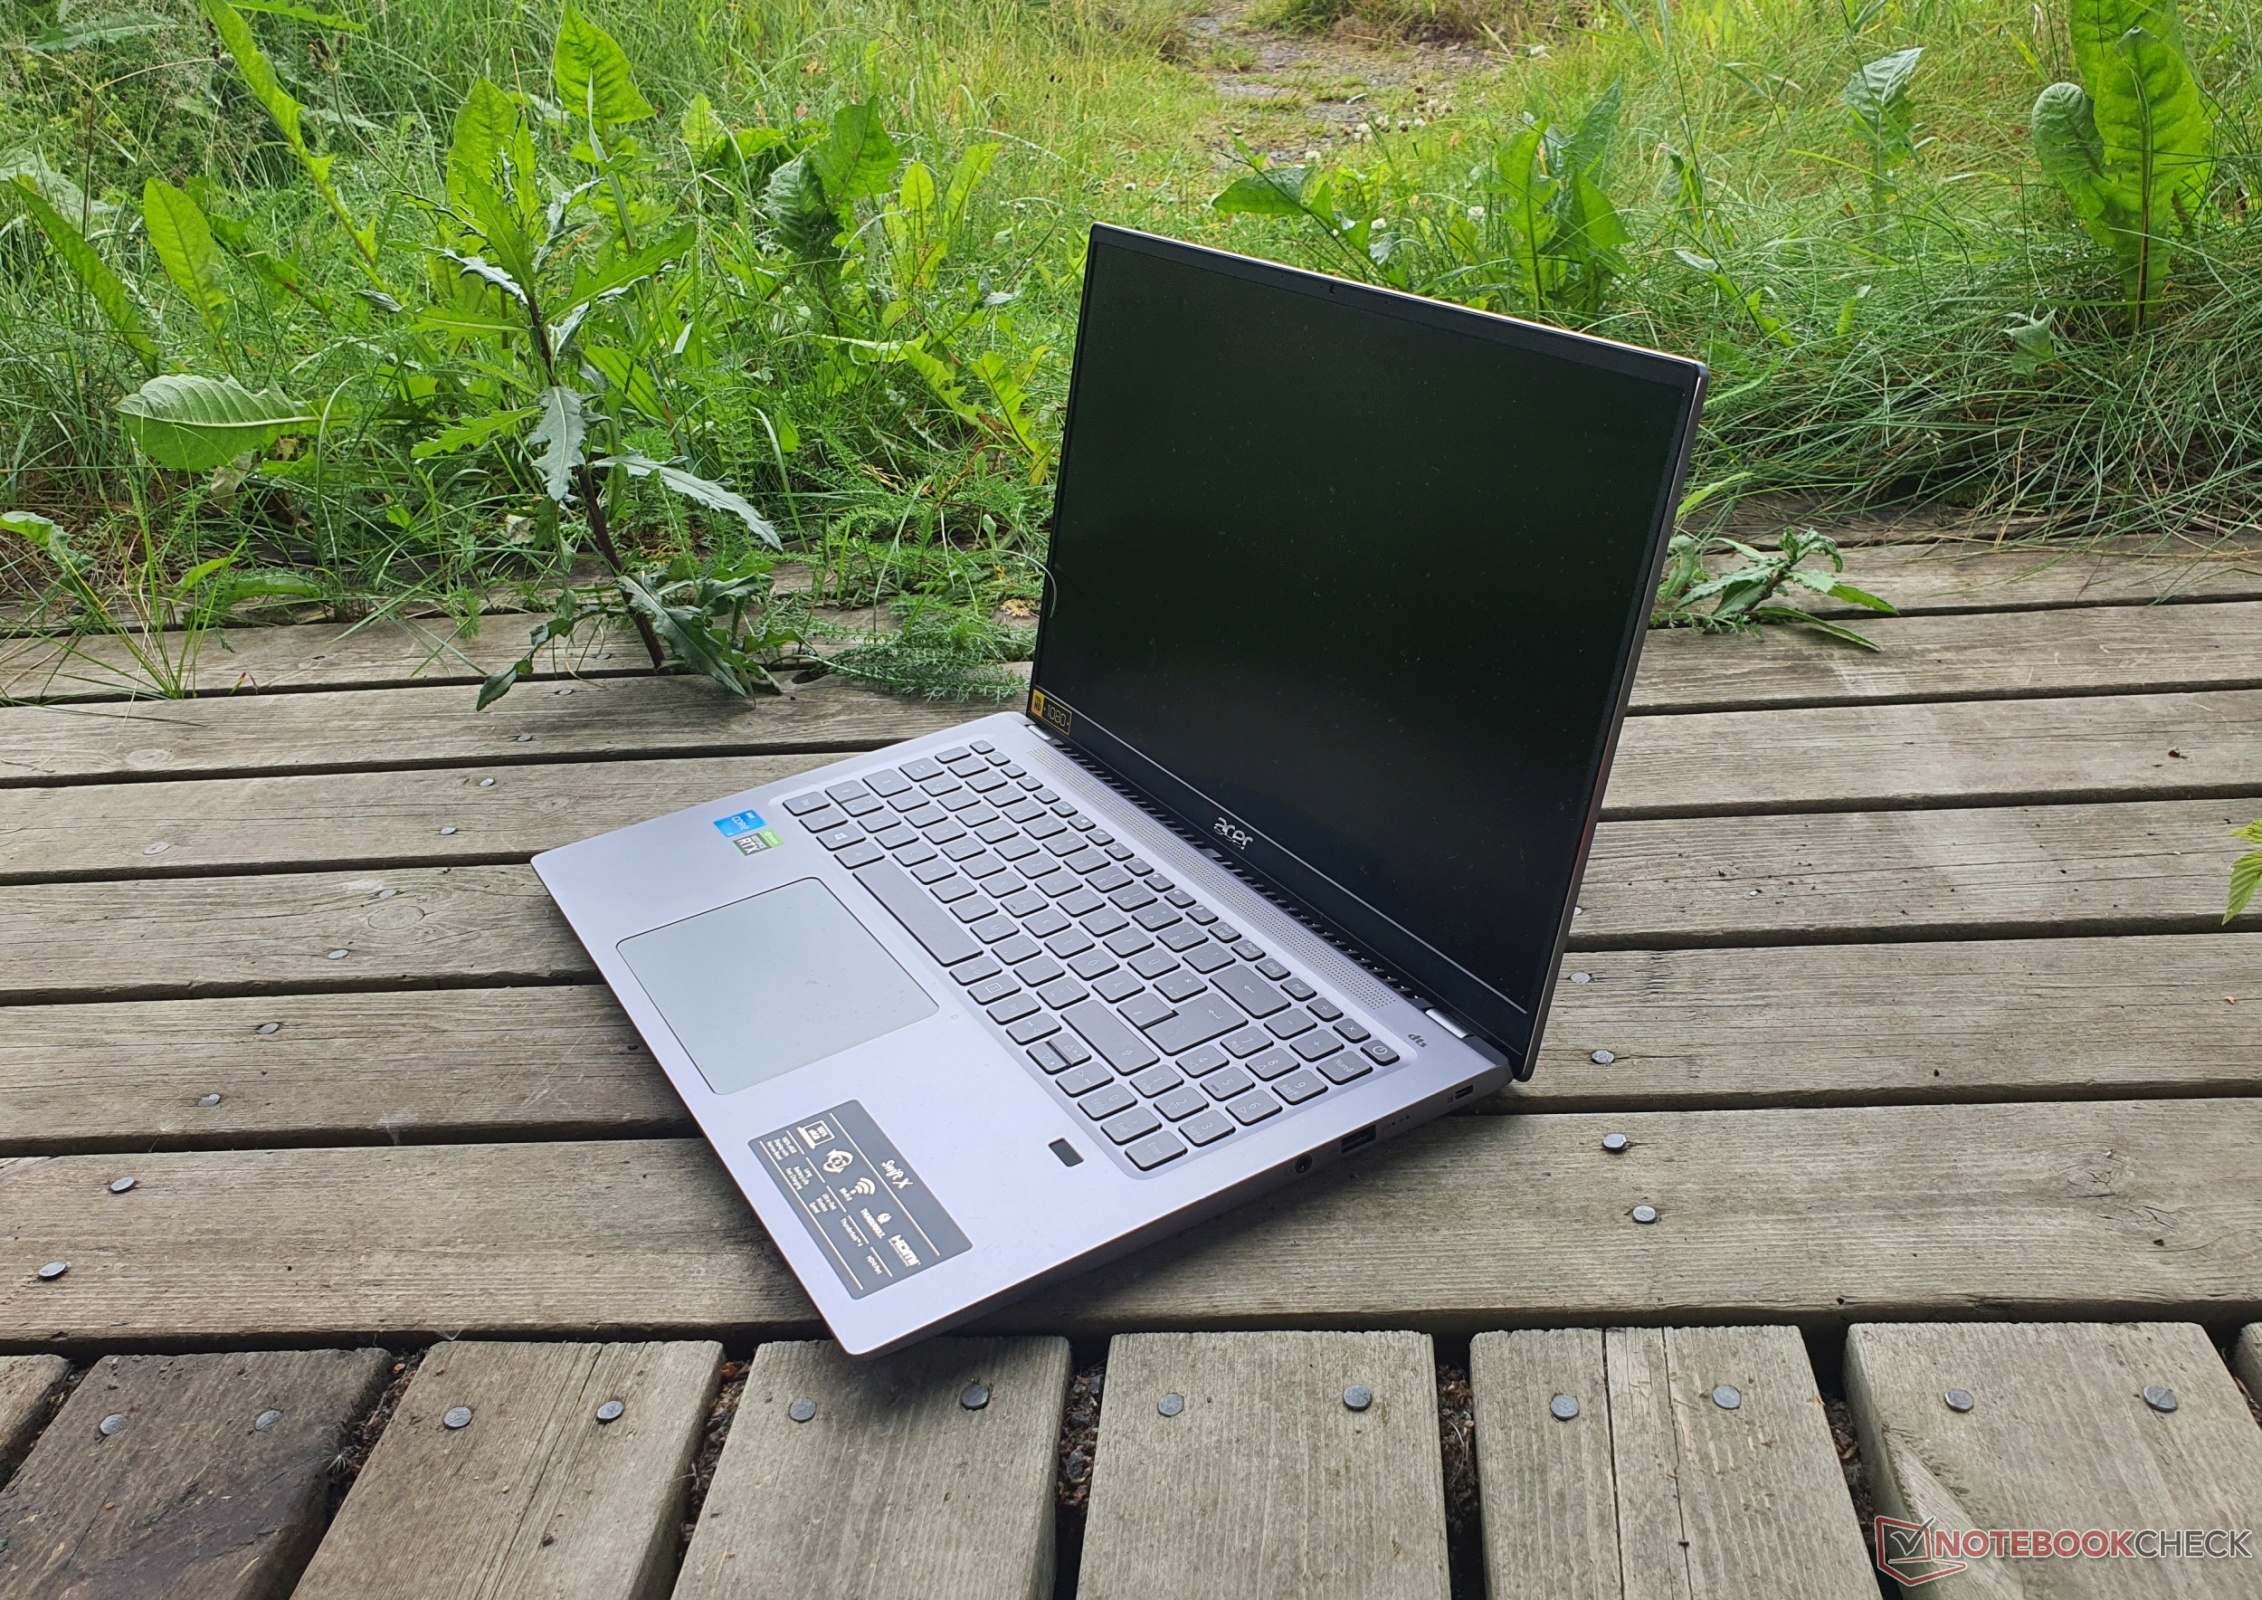
Debido a la pantalla de 16,1 pulgadas en formato 16:9, el Acer Swift X es ligeramente más largo, pero menos ancho y comparativamente ligero con 1,8 kg. El Swift 3 pesa unos 130 gramos menos debido a la falta de una dGPU. Todos los demás dispositivos de la comparación ofrecen una pantalla de 16 pulgadas en formato 16:10 y pesan alrededor de 2 kg.
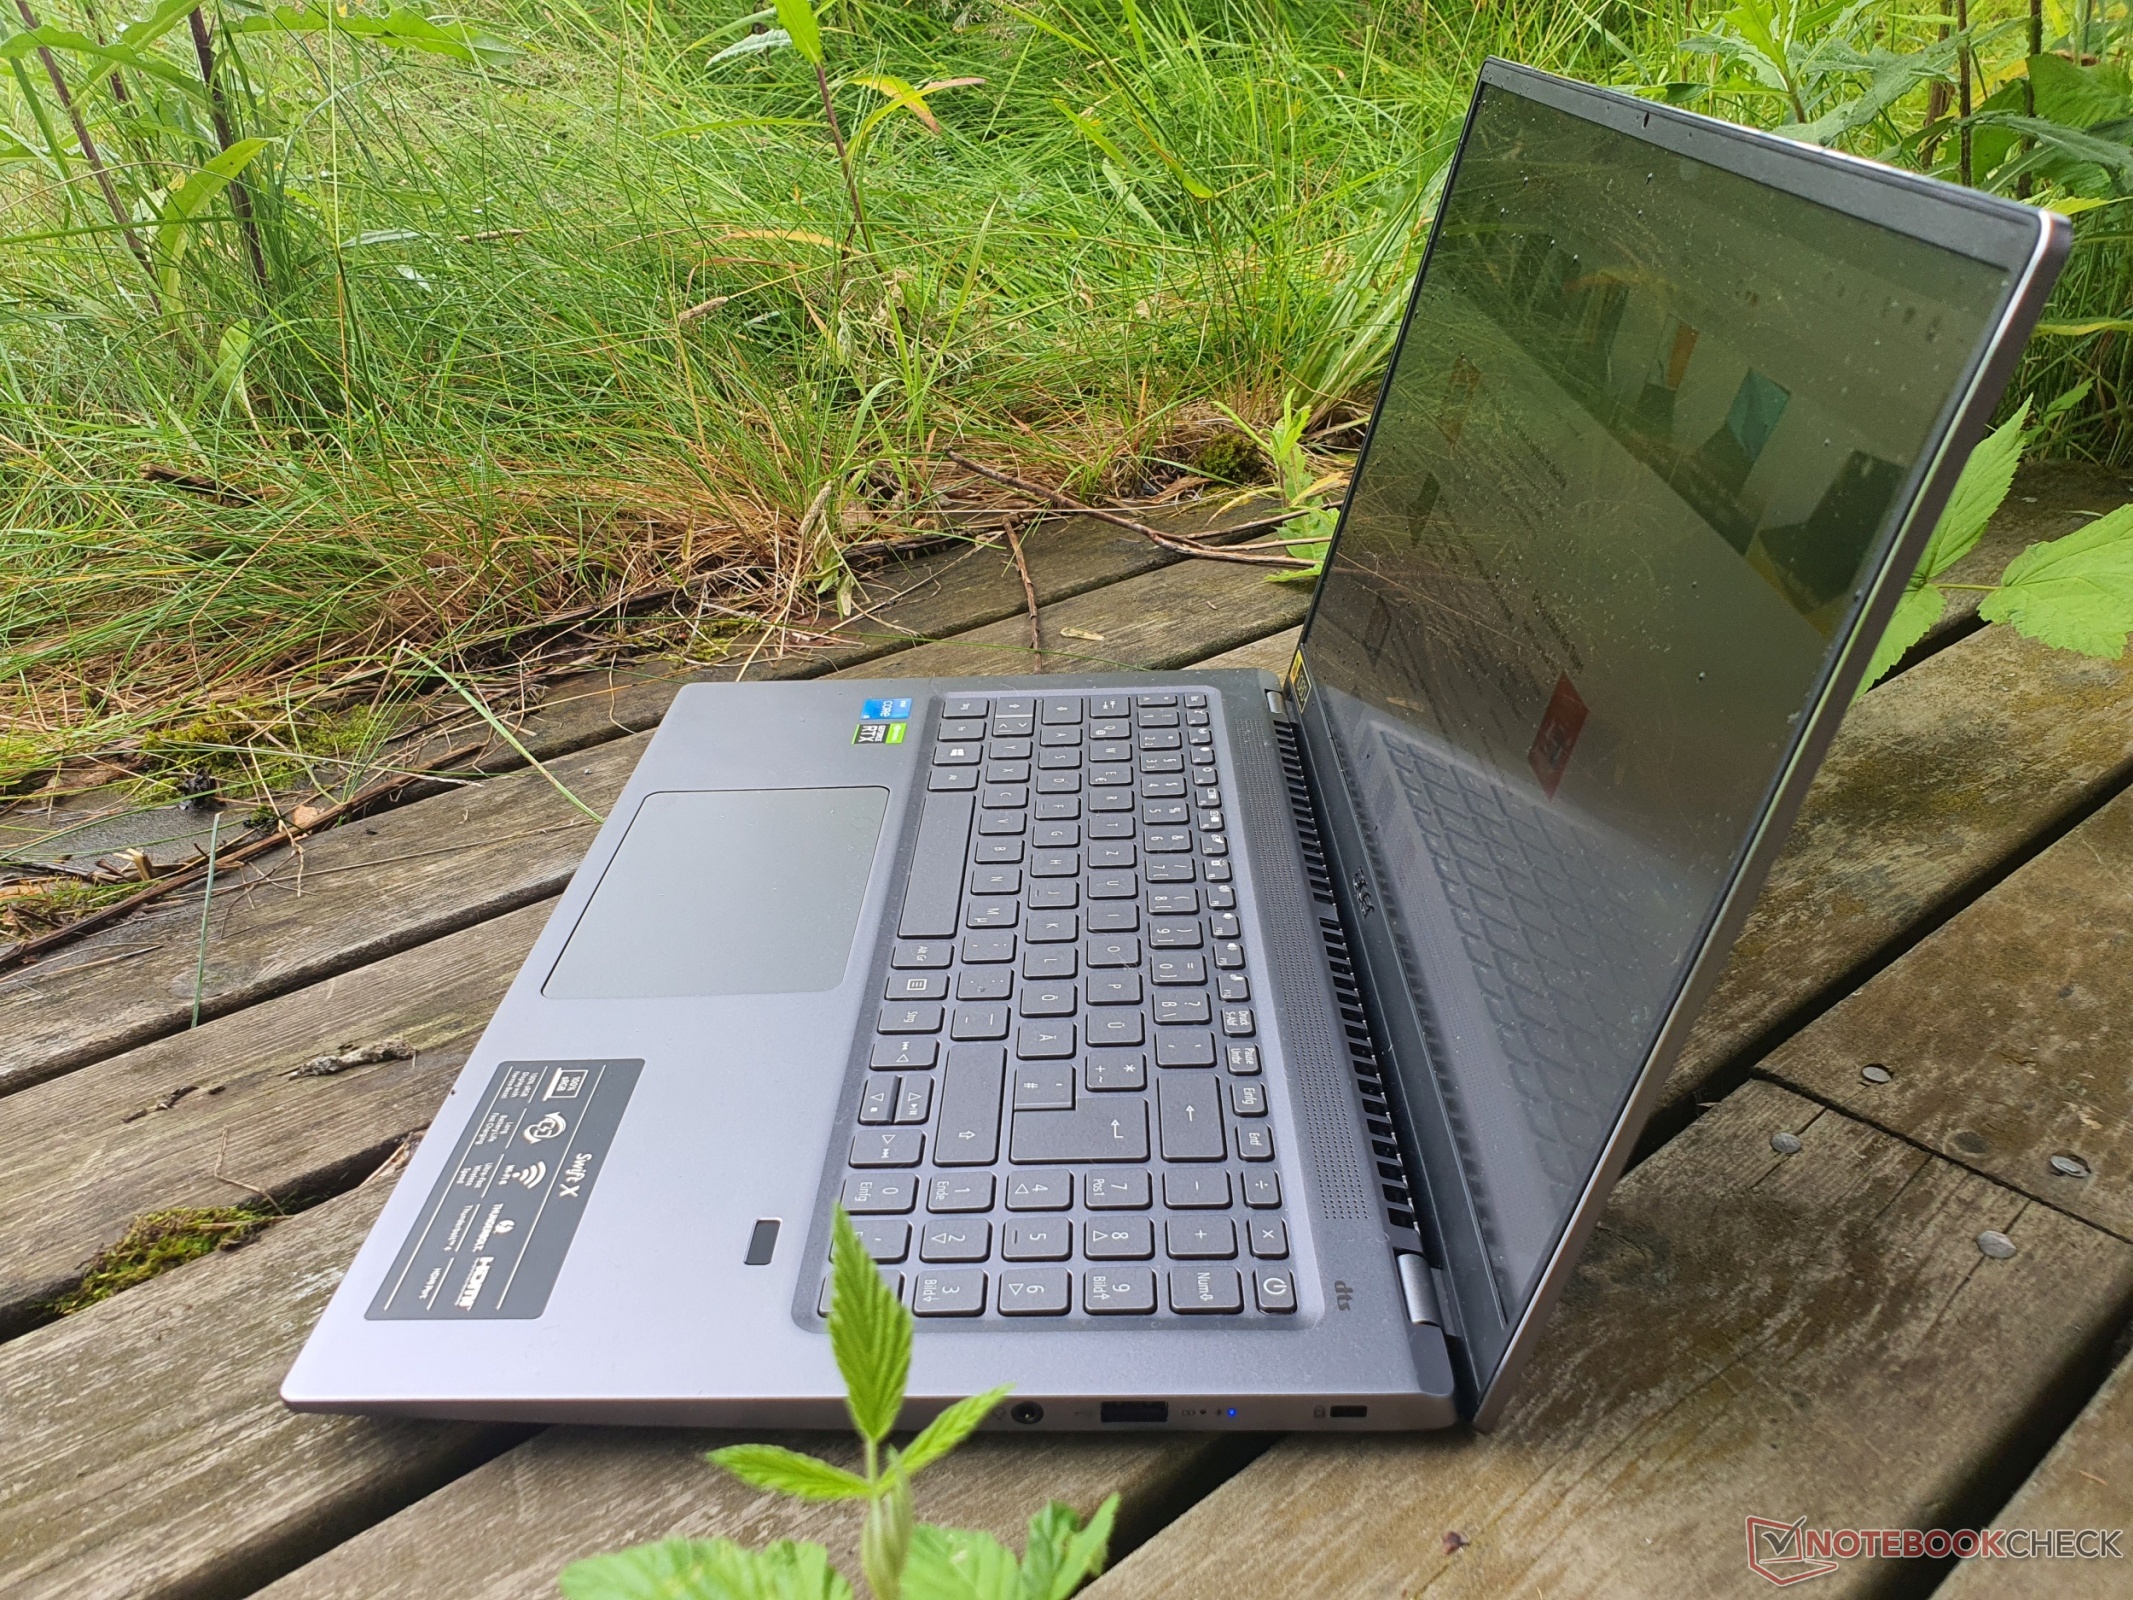
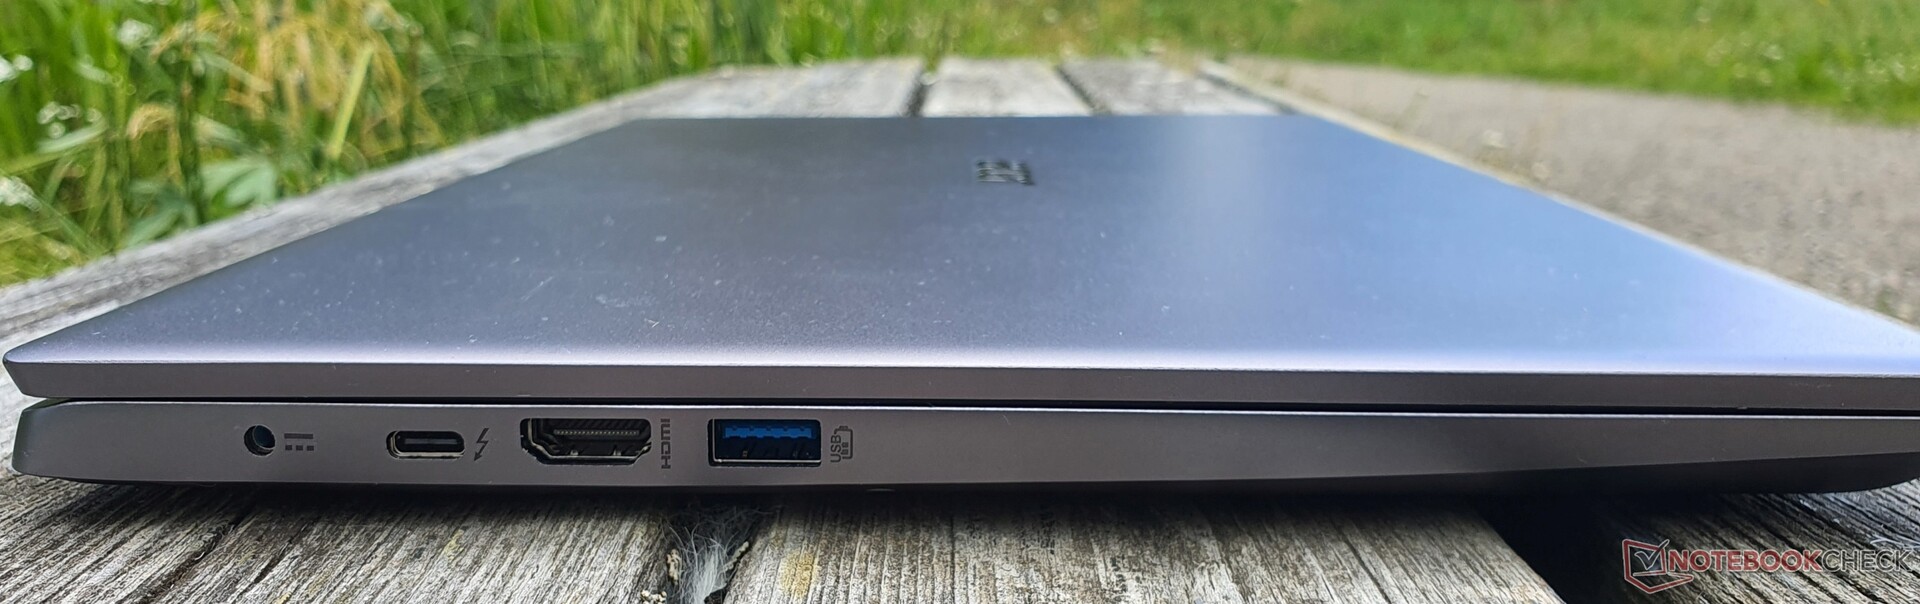
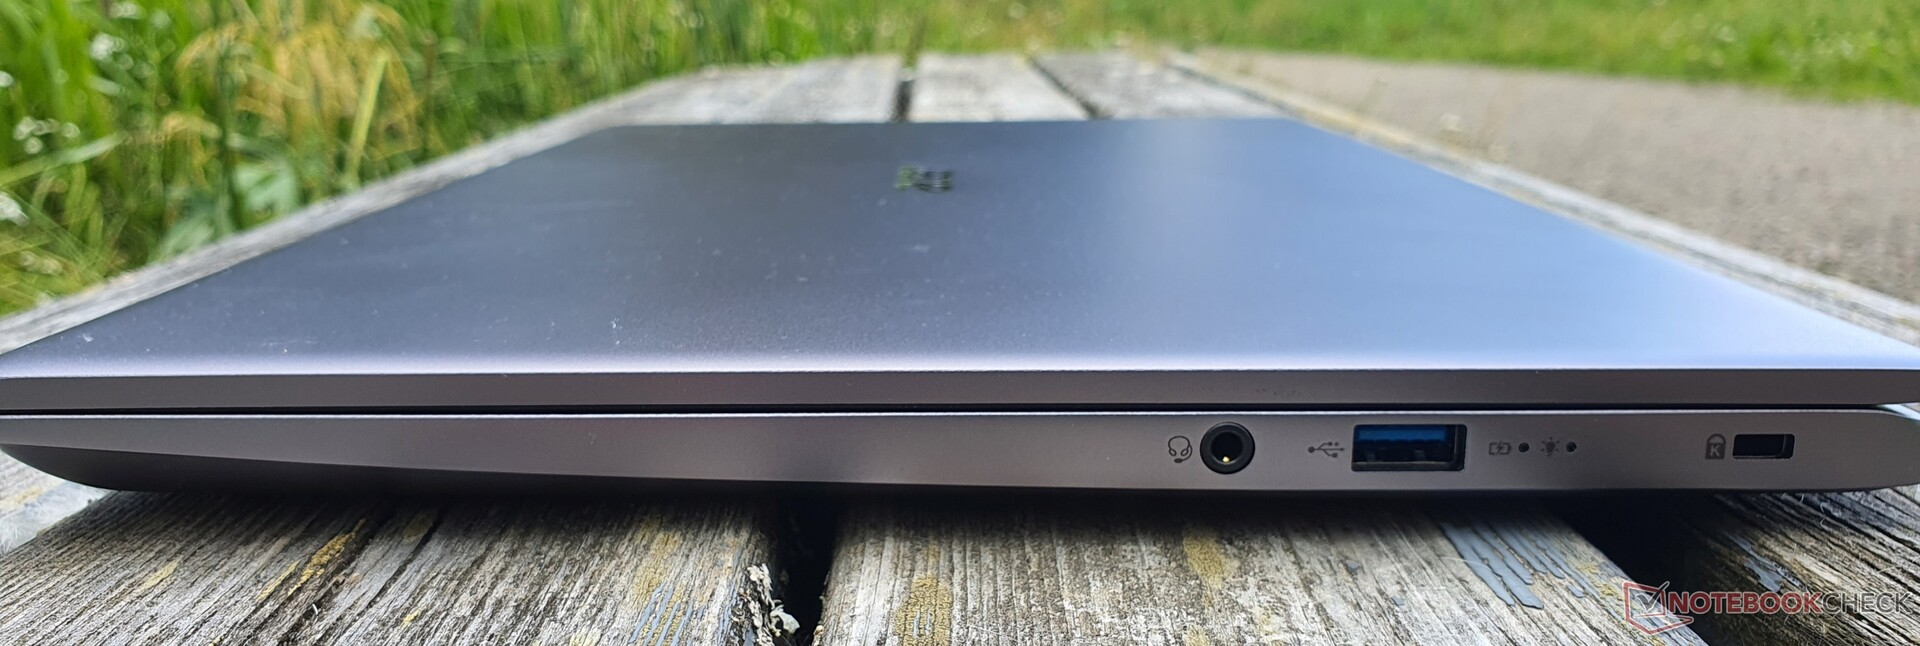
Equipos: Acer es "veloz" con Thunderbolt 4
Los puertos del Acer Swift X están lo suficientemente espaciados como para no bloquearse entre sí. Un puerto HDMI 2.0 y DisplayPort 1.4 vía Thunderbolt 4 están disponibles para pantallas externas.
También hay dos puertos USB-A 3.2 Gen1, uno en cada lado. También hay una toma de audio y un dispositivo Kensington, pero no hay lector de tarjetas SD ni puerto LAN. La carga tiene lugar a través de una conexión propietaria o USB-C.
Comunicación
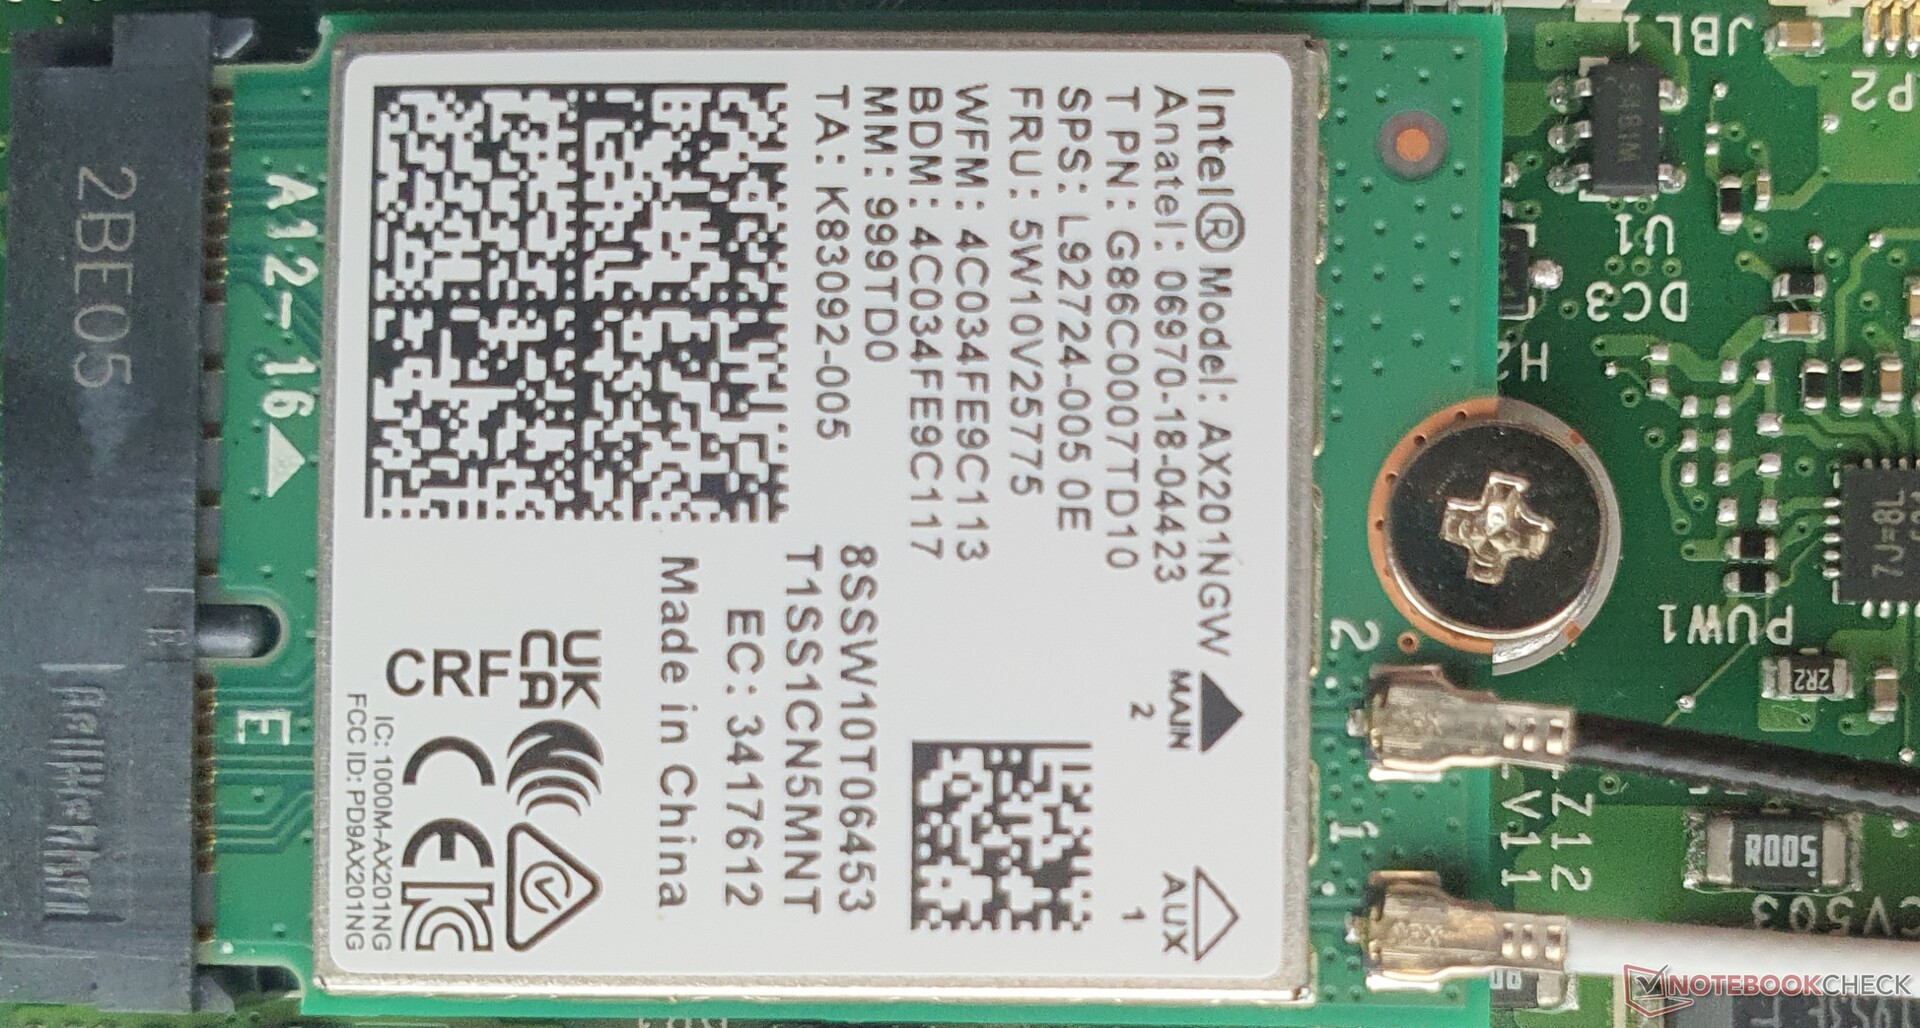
Gracias al módulo Intel AX201 WiFi 6 conectado, las velocidades de transferencia están a muy buen nivel. SóloMatebook 16 de Huaweies algo más rápido en términos de envío. Se incluye Bluetooth 5.0, pero no hay opciones para WWAN y NFC.
Cámara web

Como suele ser el caso, la calidad de la webcam integrada de 720p (1.280 x 720) deja mucho que desear: la imagen es ruidosa, borrosa y descolorida. Los valores DeltaE (10,4 de media) proporcionan una precisión de color media en el mejor de los casos. No hay apertura de la webcam ni IR para Windows Hello, pero hay micrófonos de doble matriz con reducción de ruido.


Seguridad
Además del chip de seguridad TPM 2.0, hay un dispositivo de bloqueo Kensington (nano) y un lector de huellas dactilares que hace su trabajo de forma rápida y fiable con un simple toque del dedo.
Accesorios
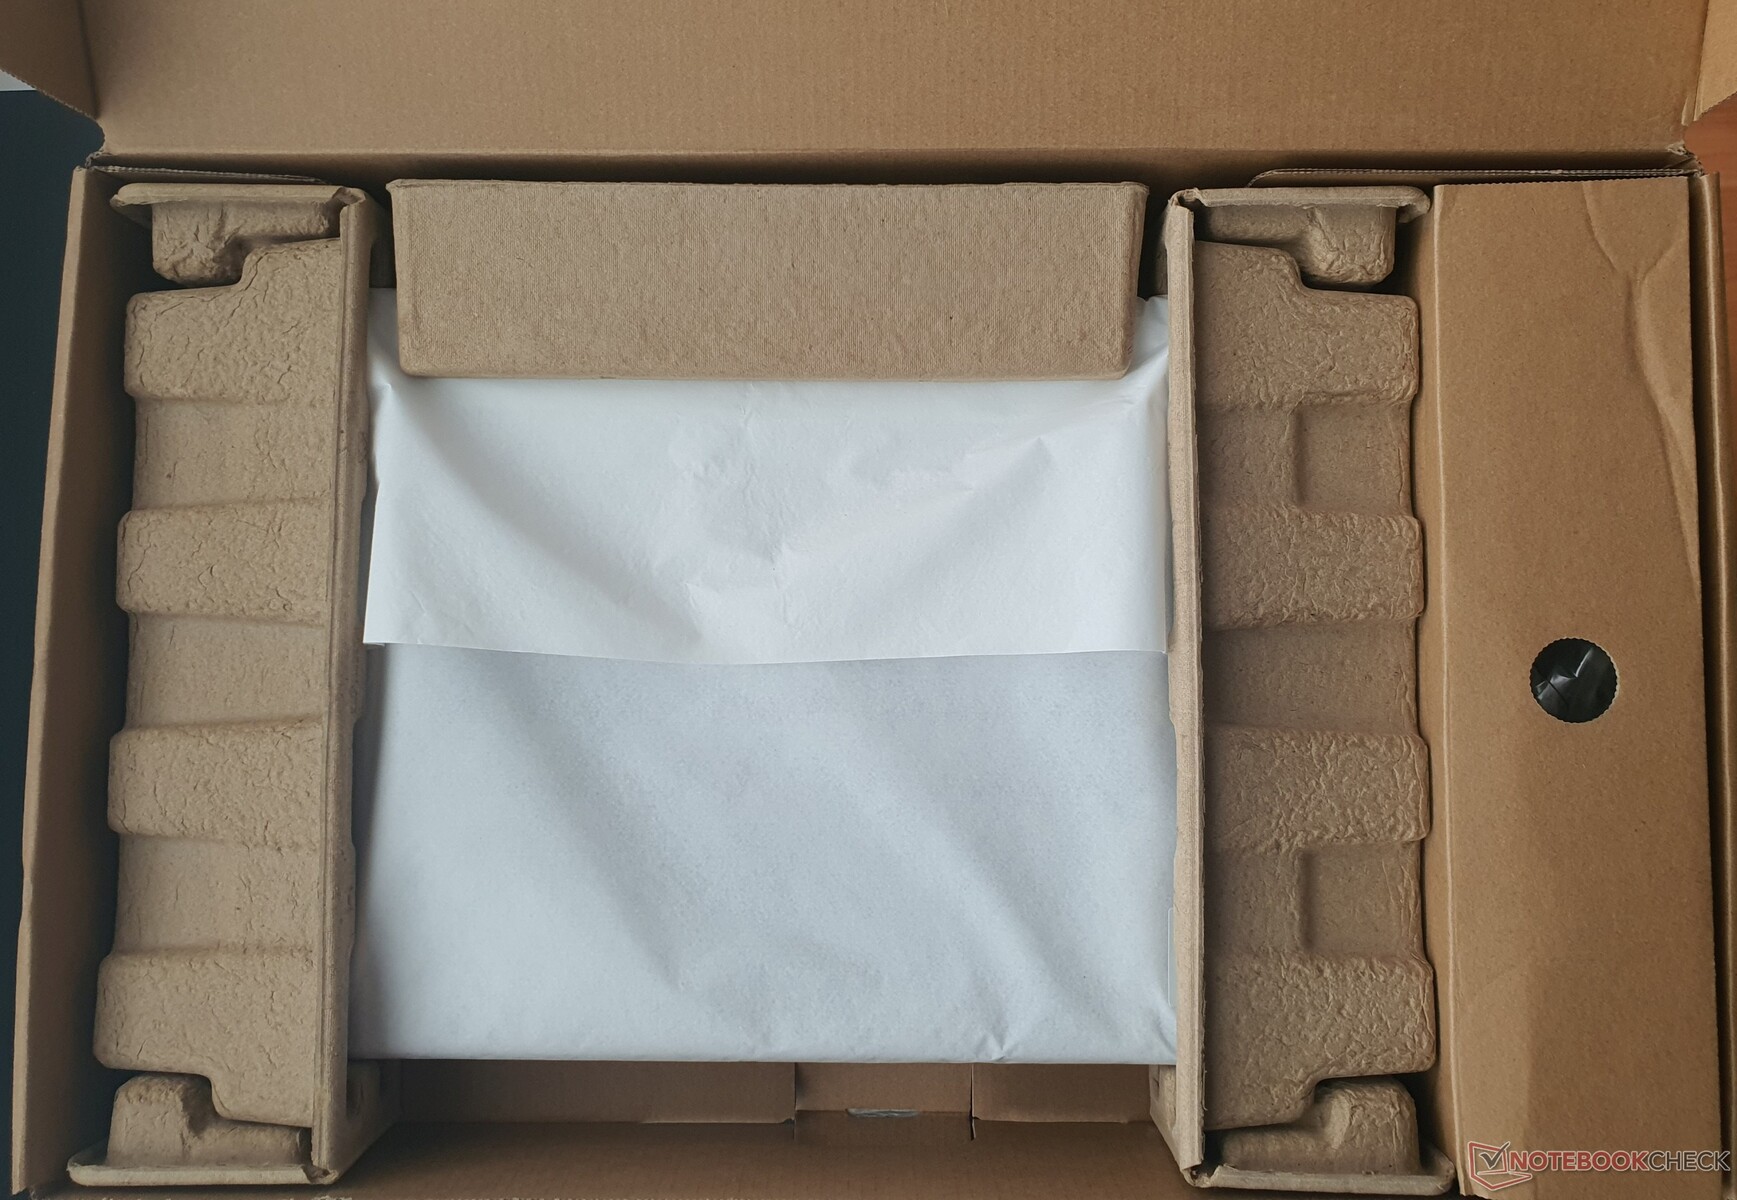
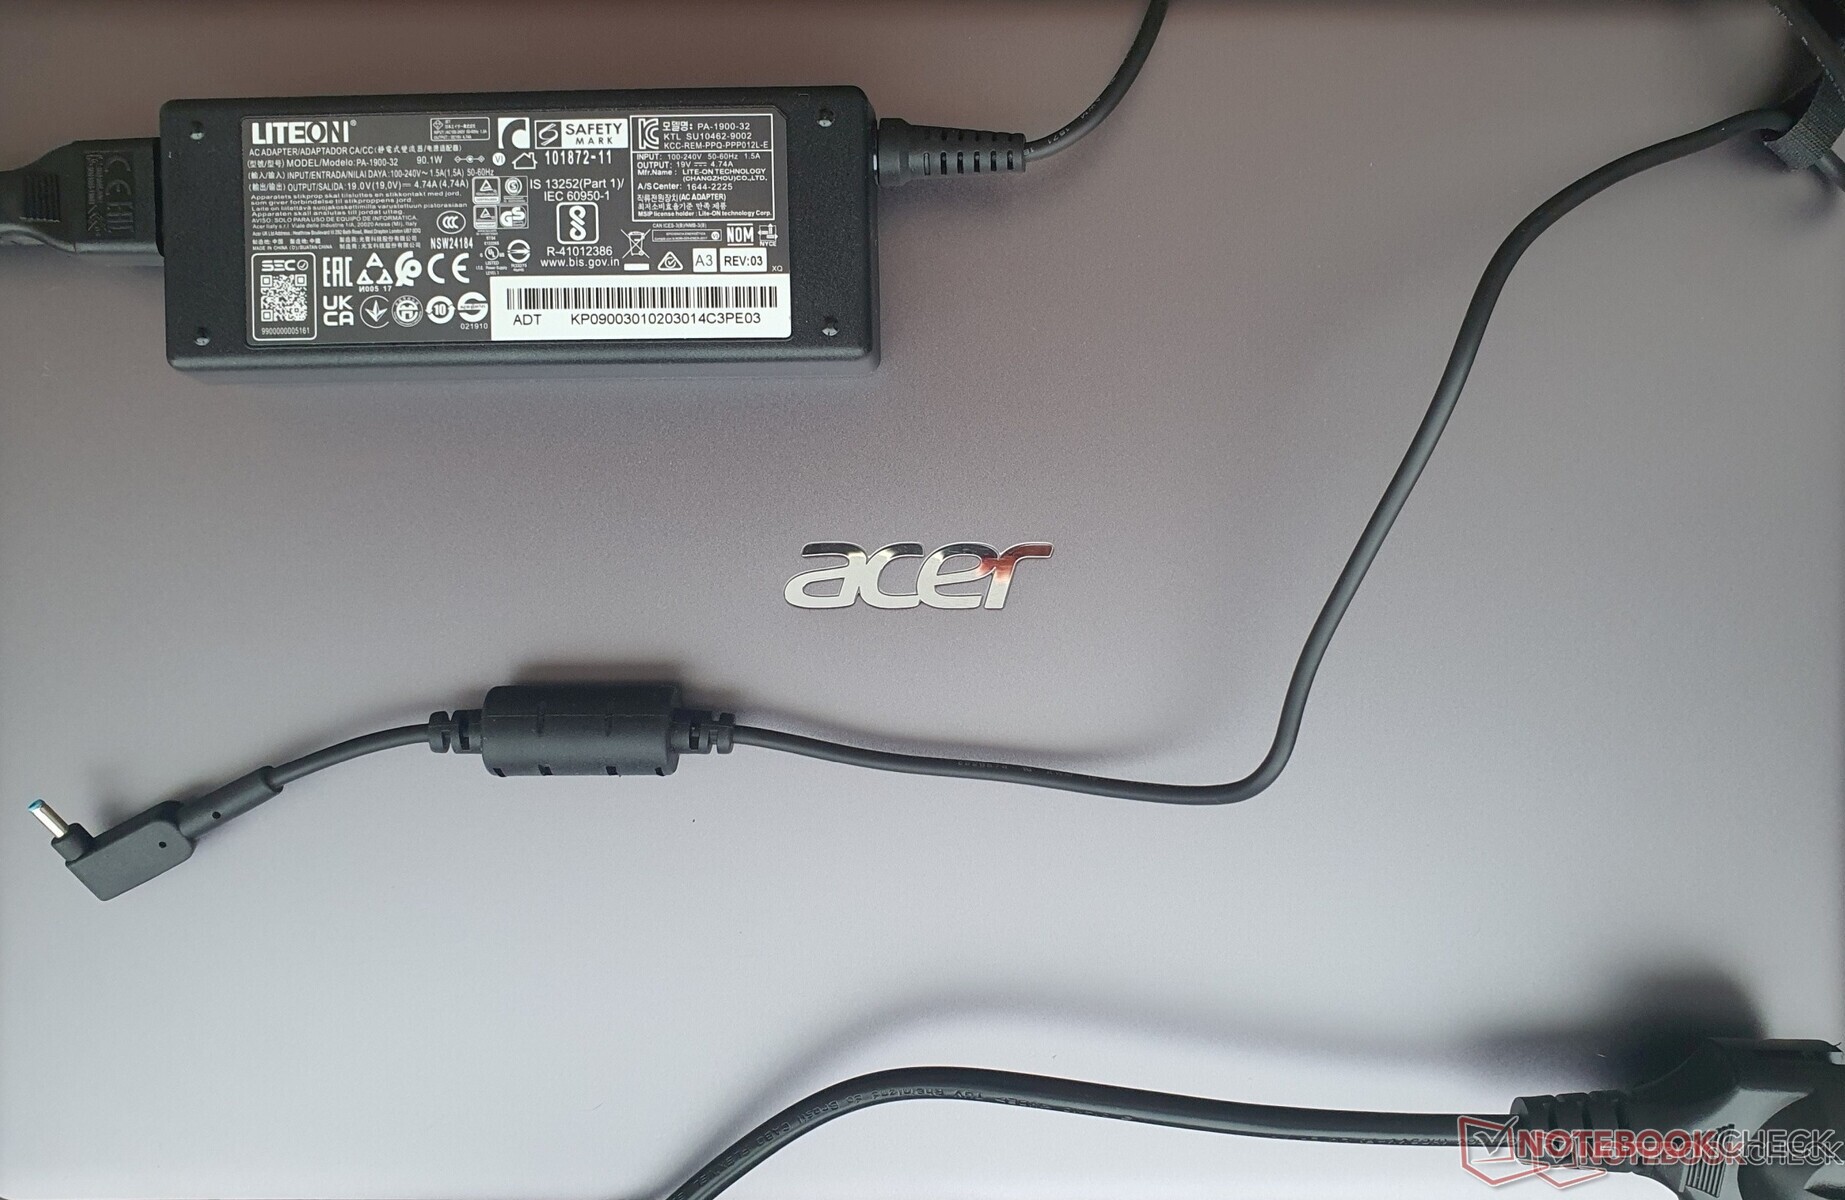
No se incluyen accesorios, aparte de la fuente de alimentación de 90 vatios de la marca LiteON, necesaria para la GPU Nvidia. Acer se ha propuesto que el embalaje del Swift X sea respetuoso con el medio ambiente: se utiliza muy poco plástico.
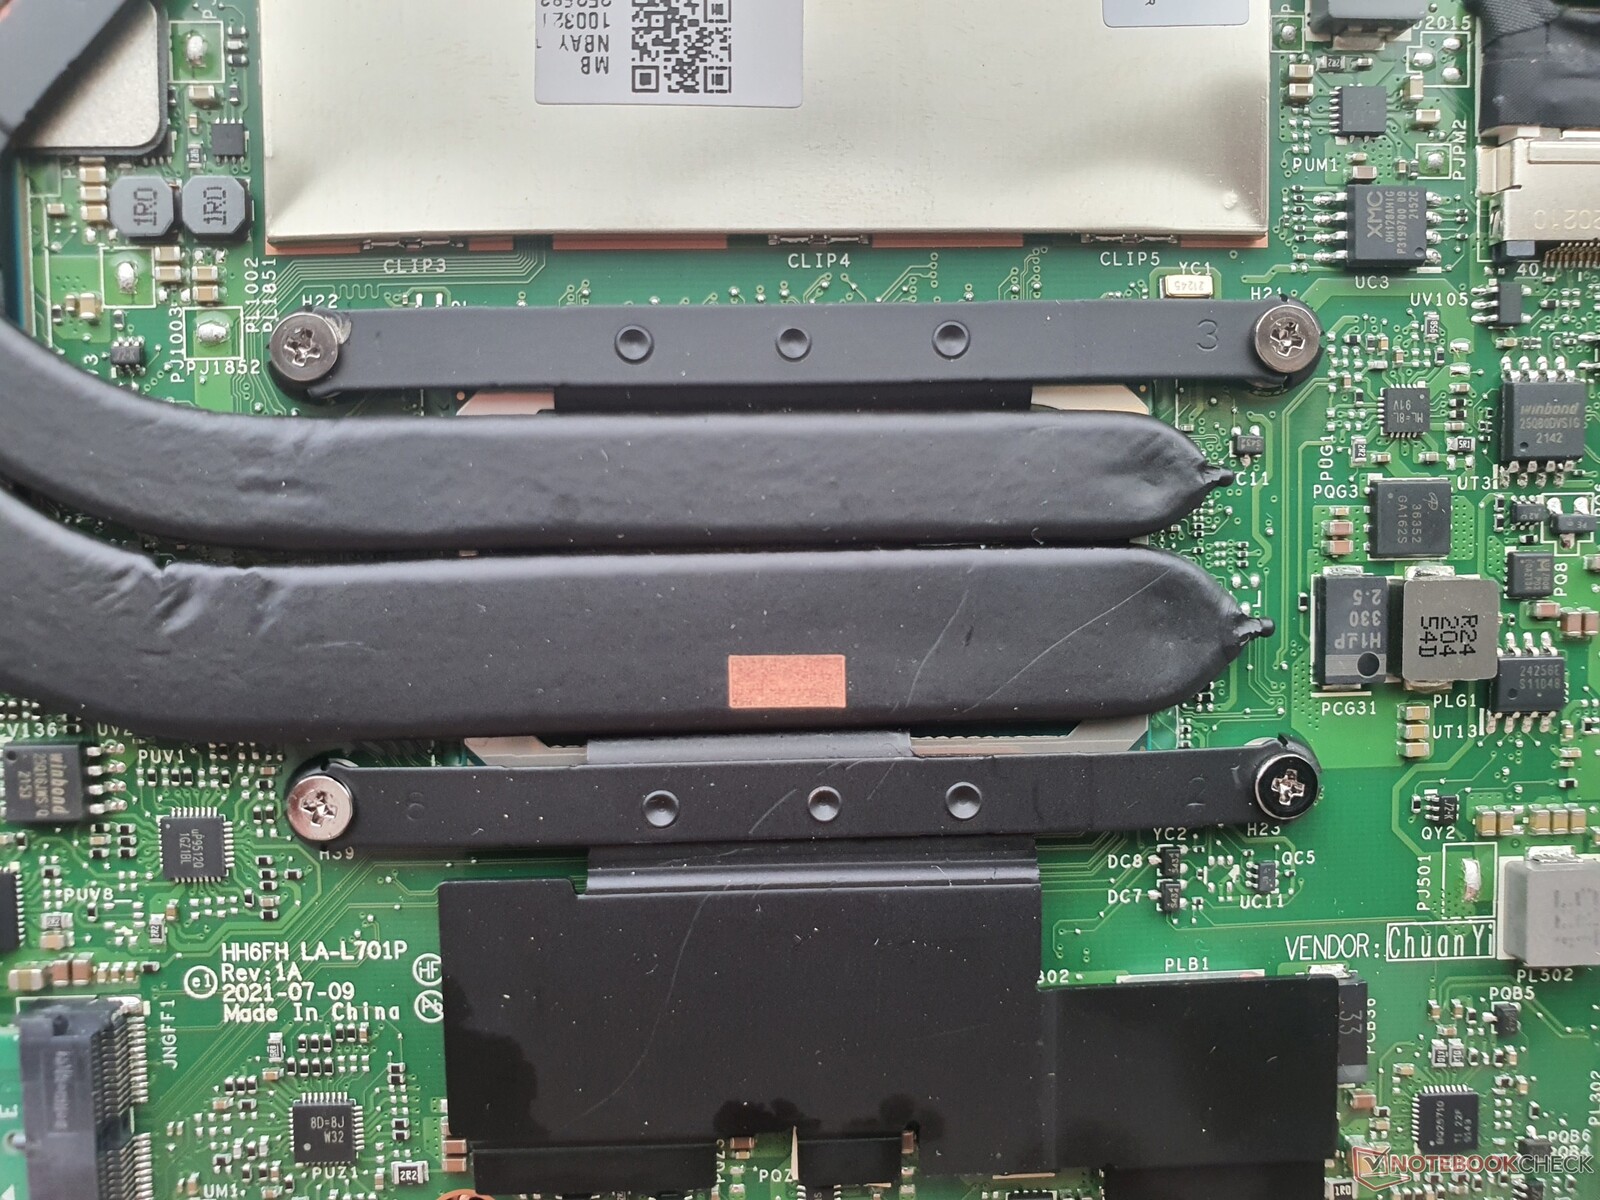
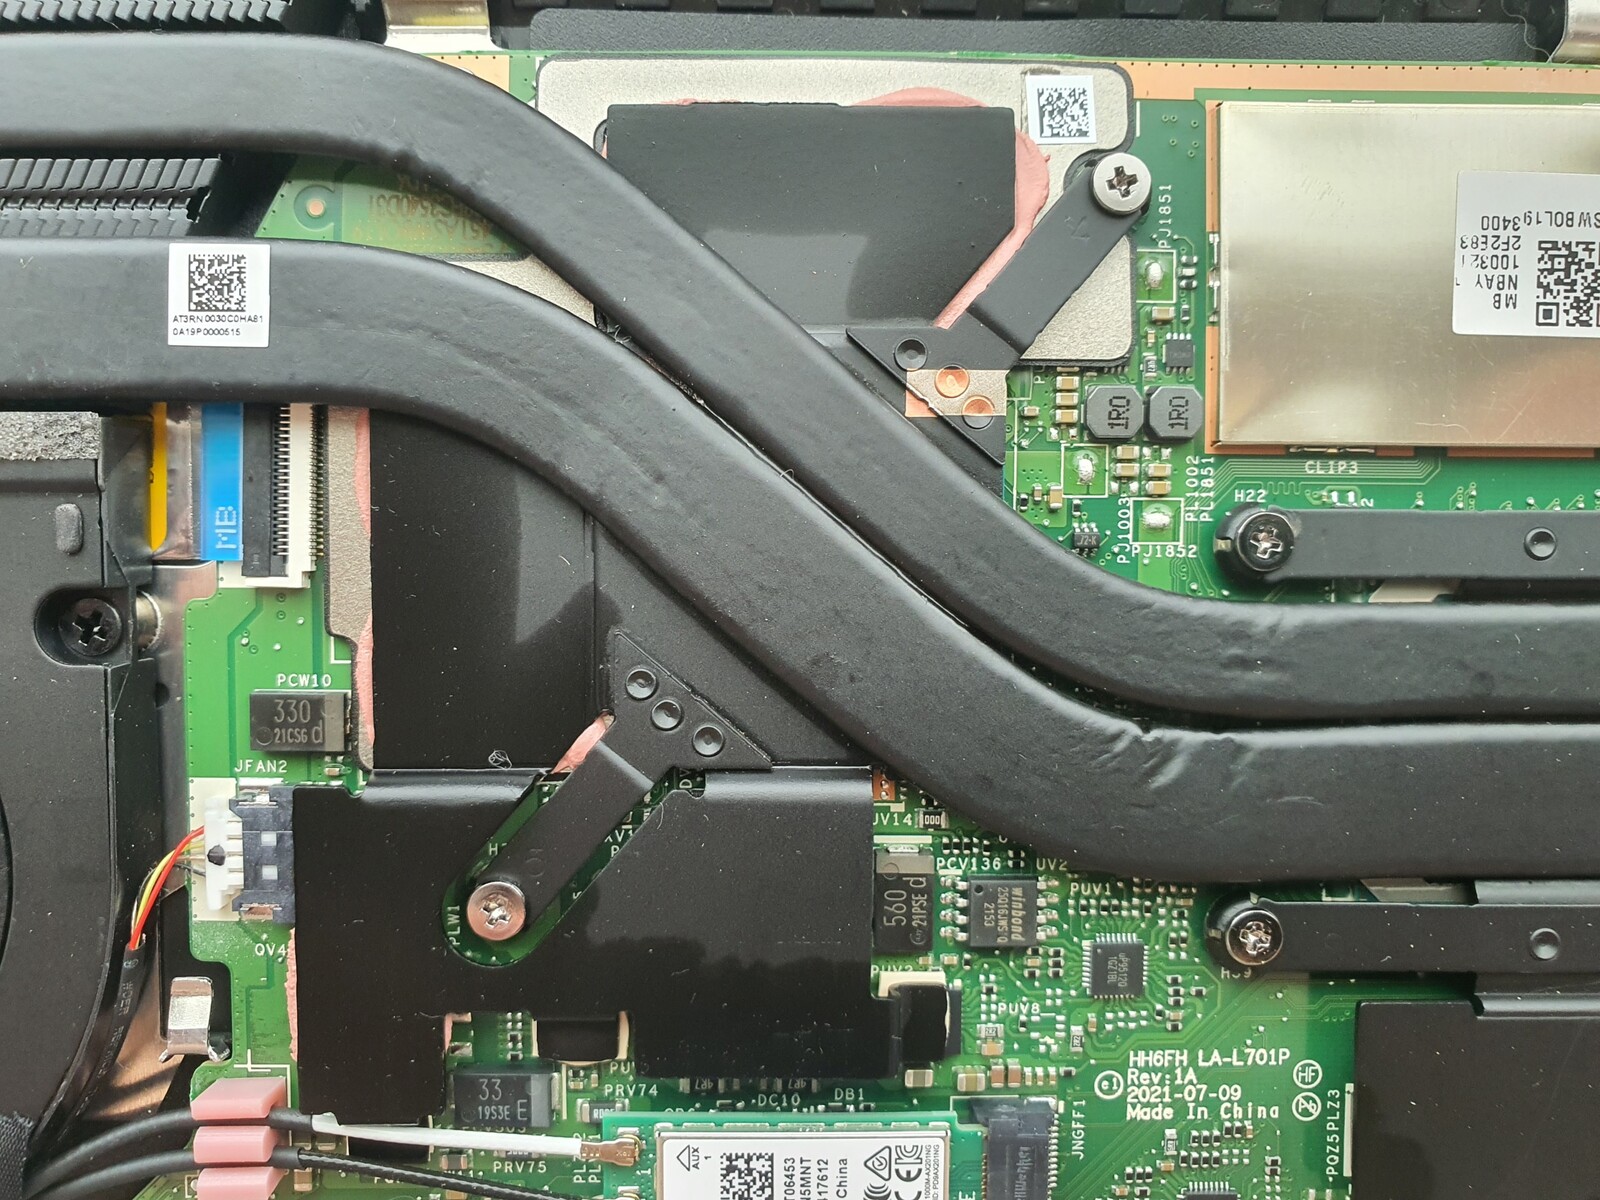
Mantenimiento
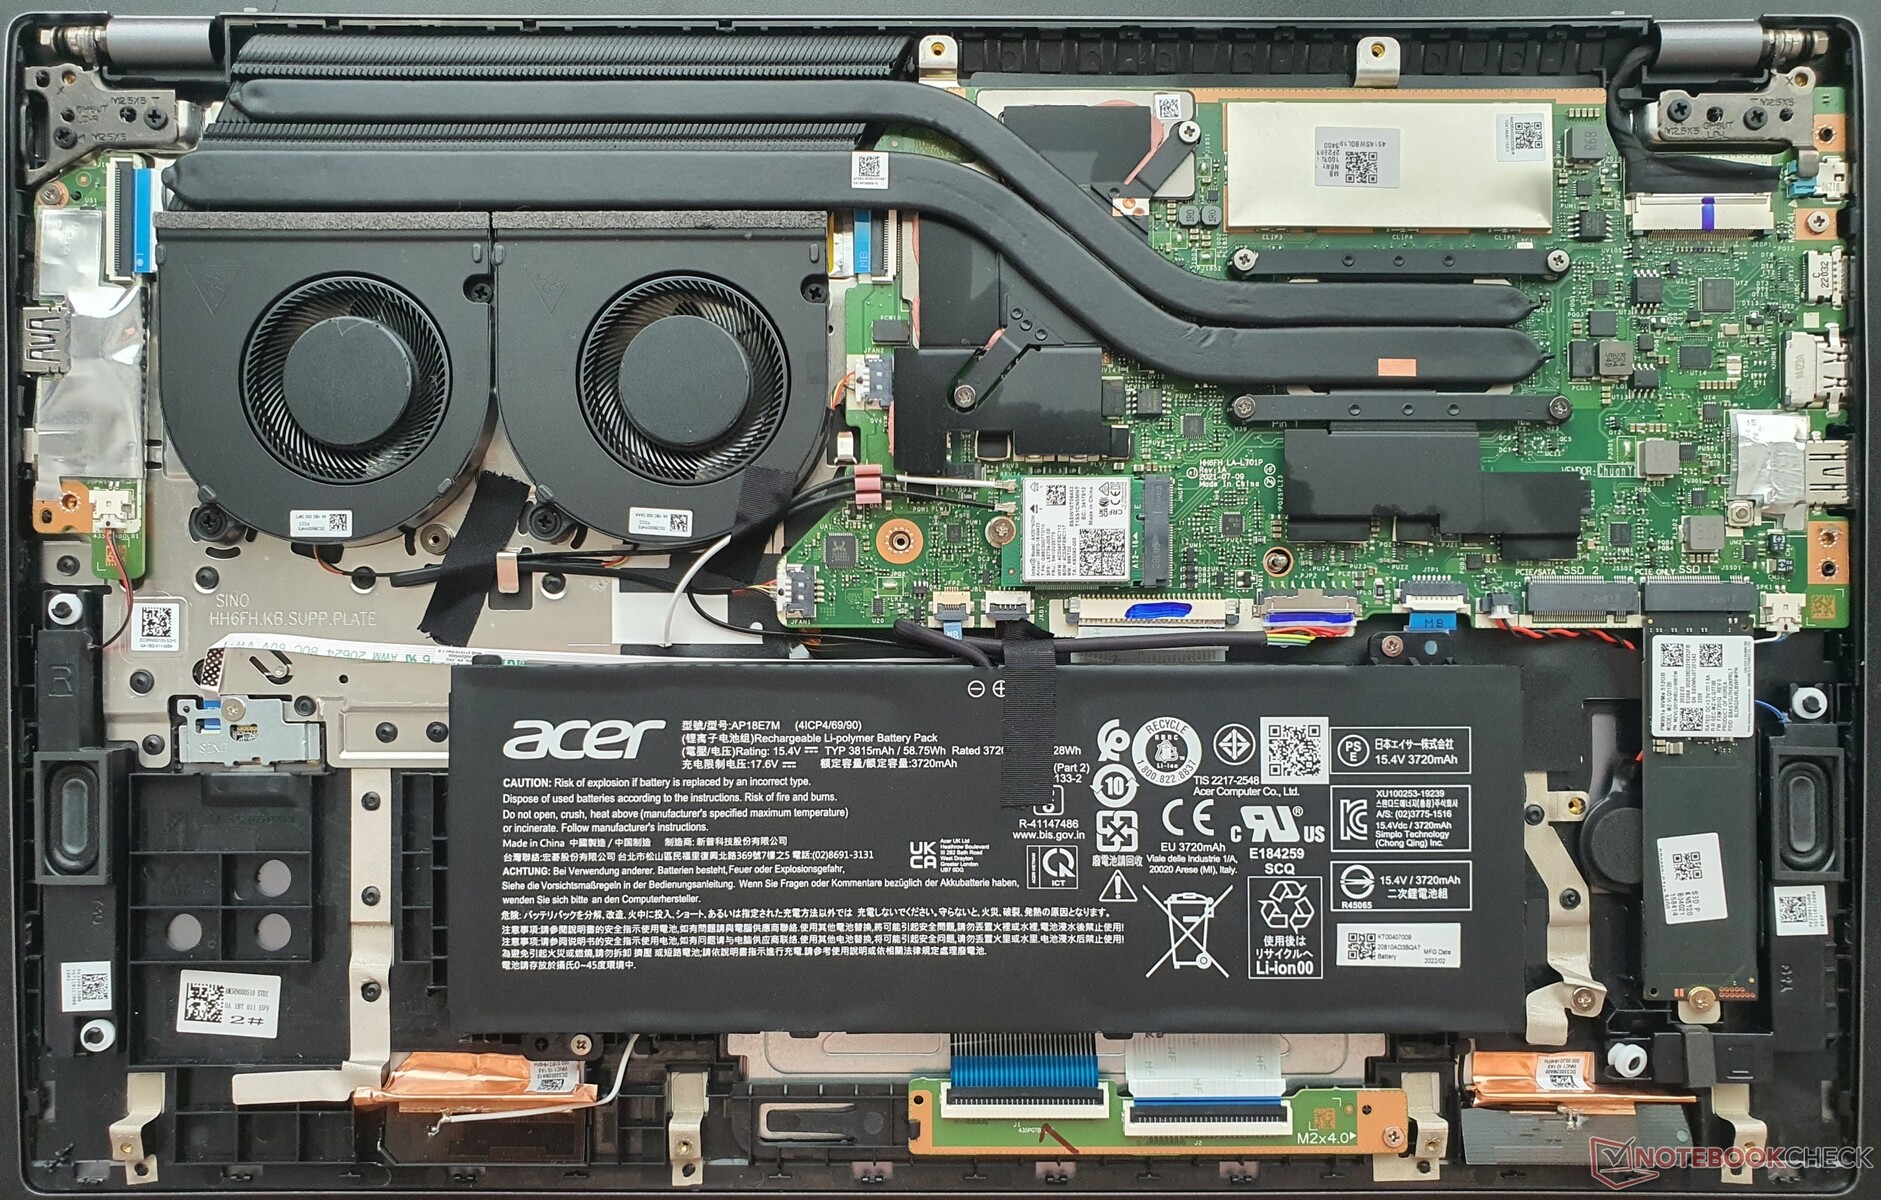
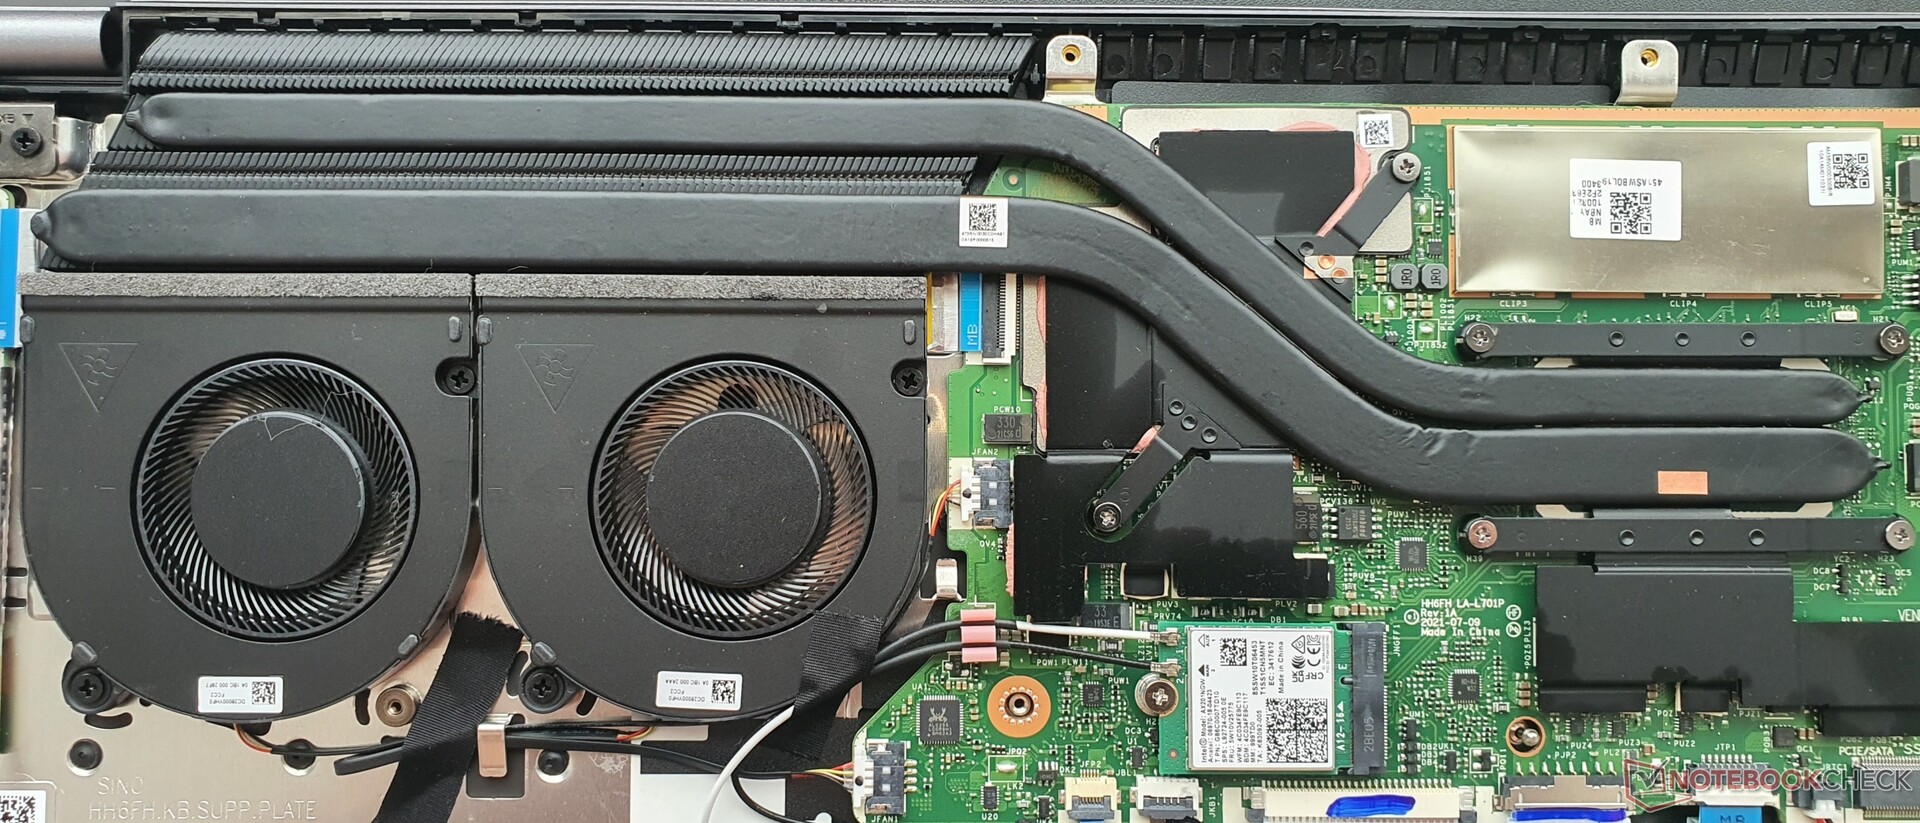
Después de aflojar 12 pequeños tornillos Torx, la placa base se puede retirar fácilmente con la ayuda de una espátula de plástico plana. La RAM está completamente soldada, pero hay dos ranuras M.2-2280. El módulo WLAN y la batería atornillada son reemplazables, y los ventiladores pueden limpiarse.
Garantía
En la mayoría de los países, Acer ofrece una garantía limitada de 1 año para sus portátiles. Esto puede variar, así que asegúrese de comprobarlo con su proveedor antes de la compra
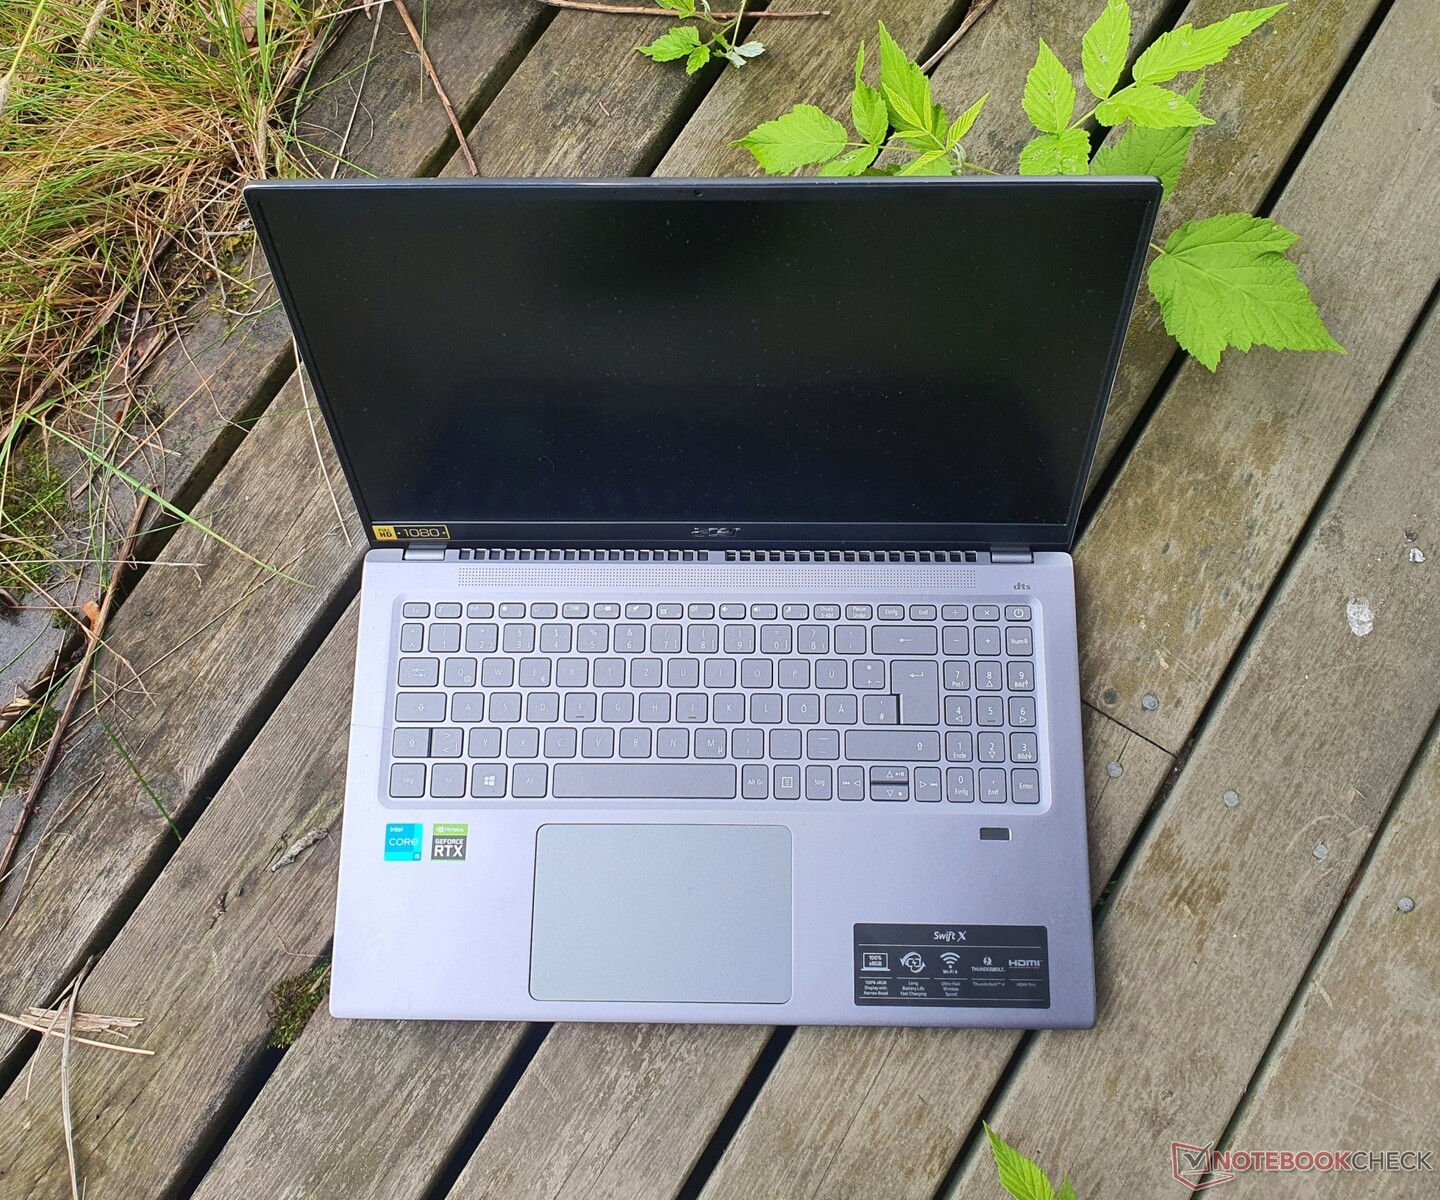
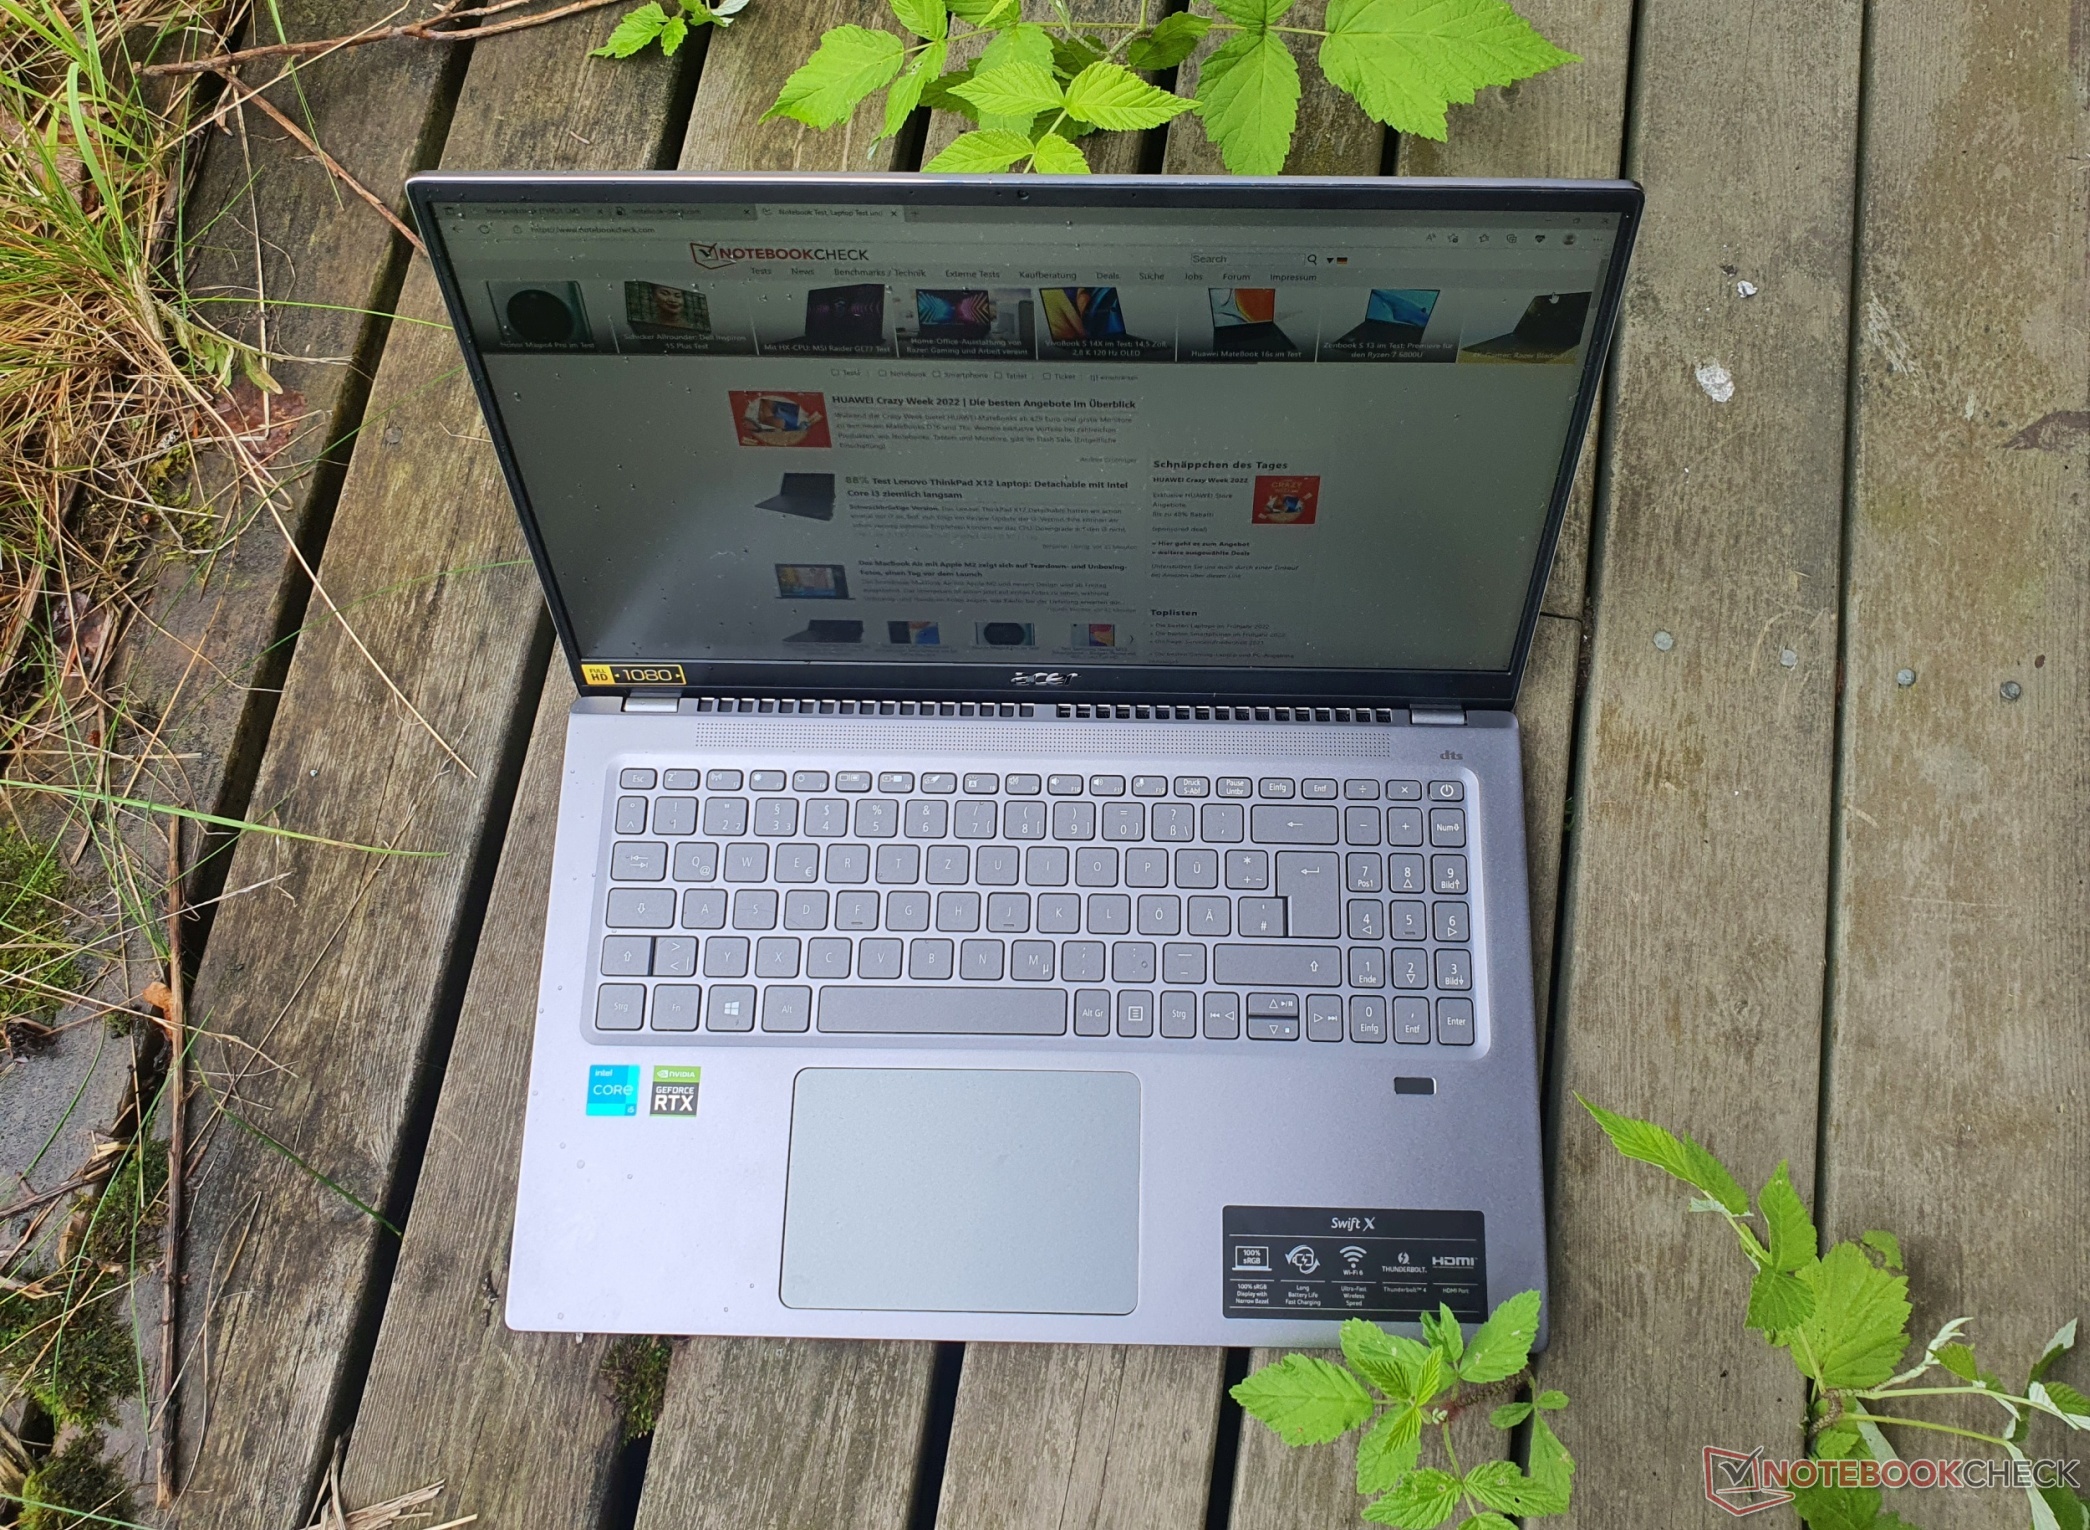
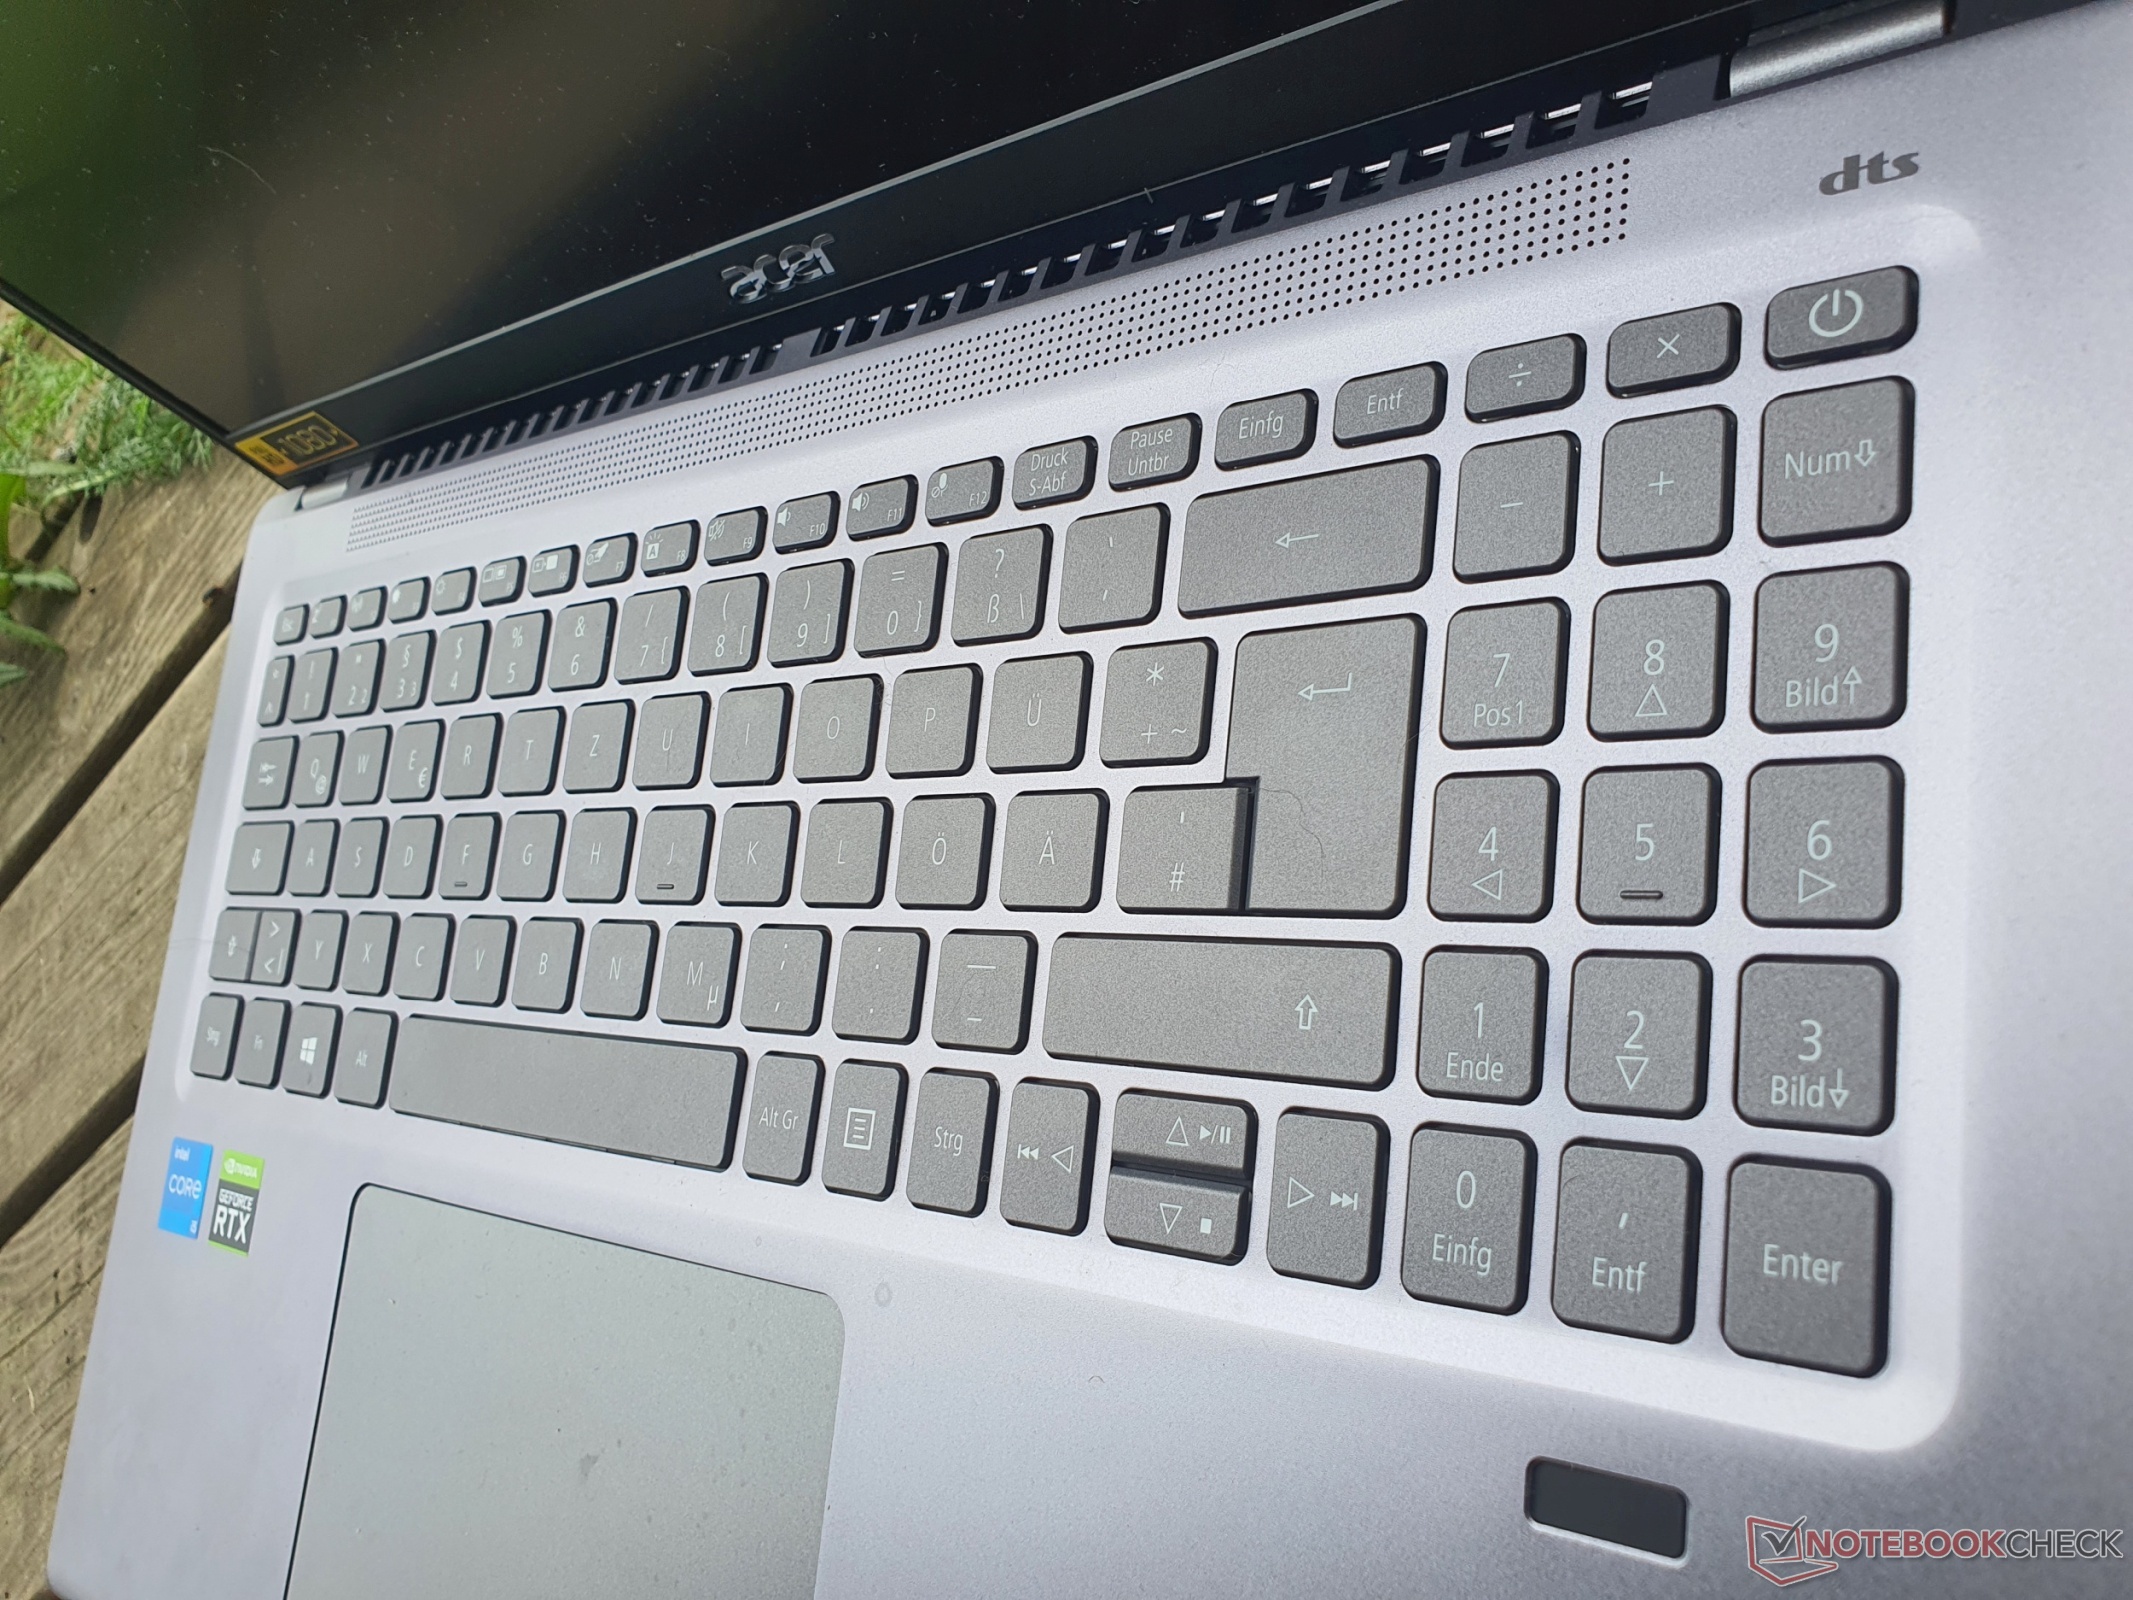
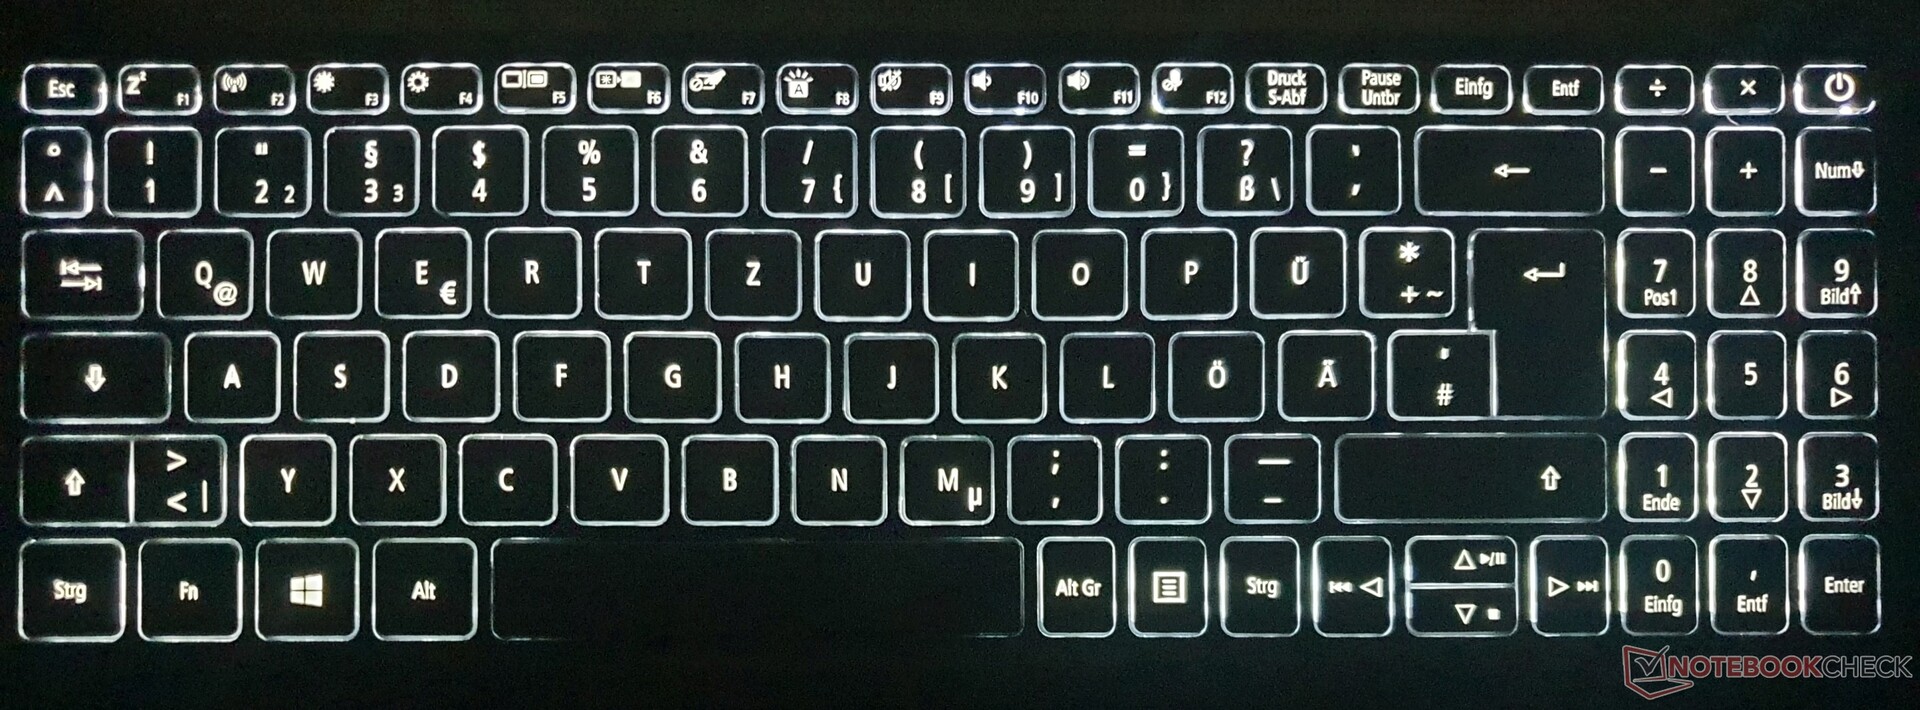
Dispositivos de entrada: Escritura rápida en teclado retroiluminado
Teclado
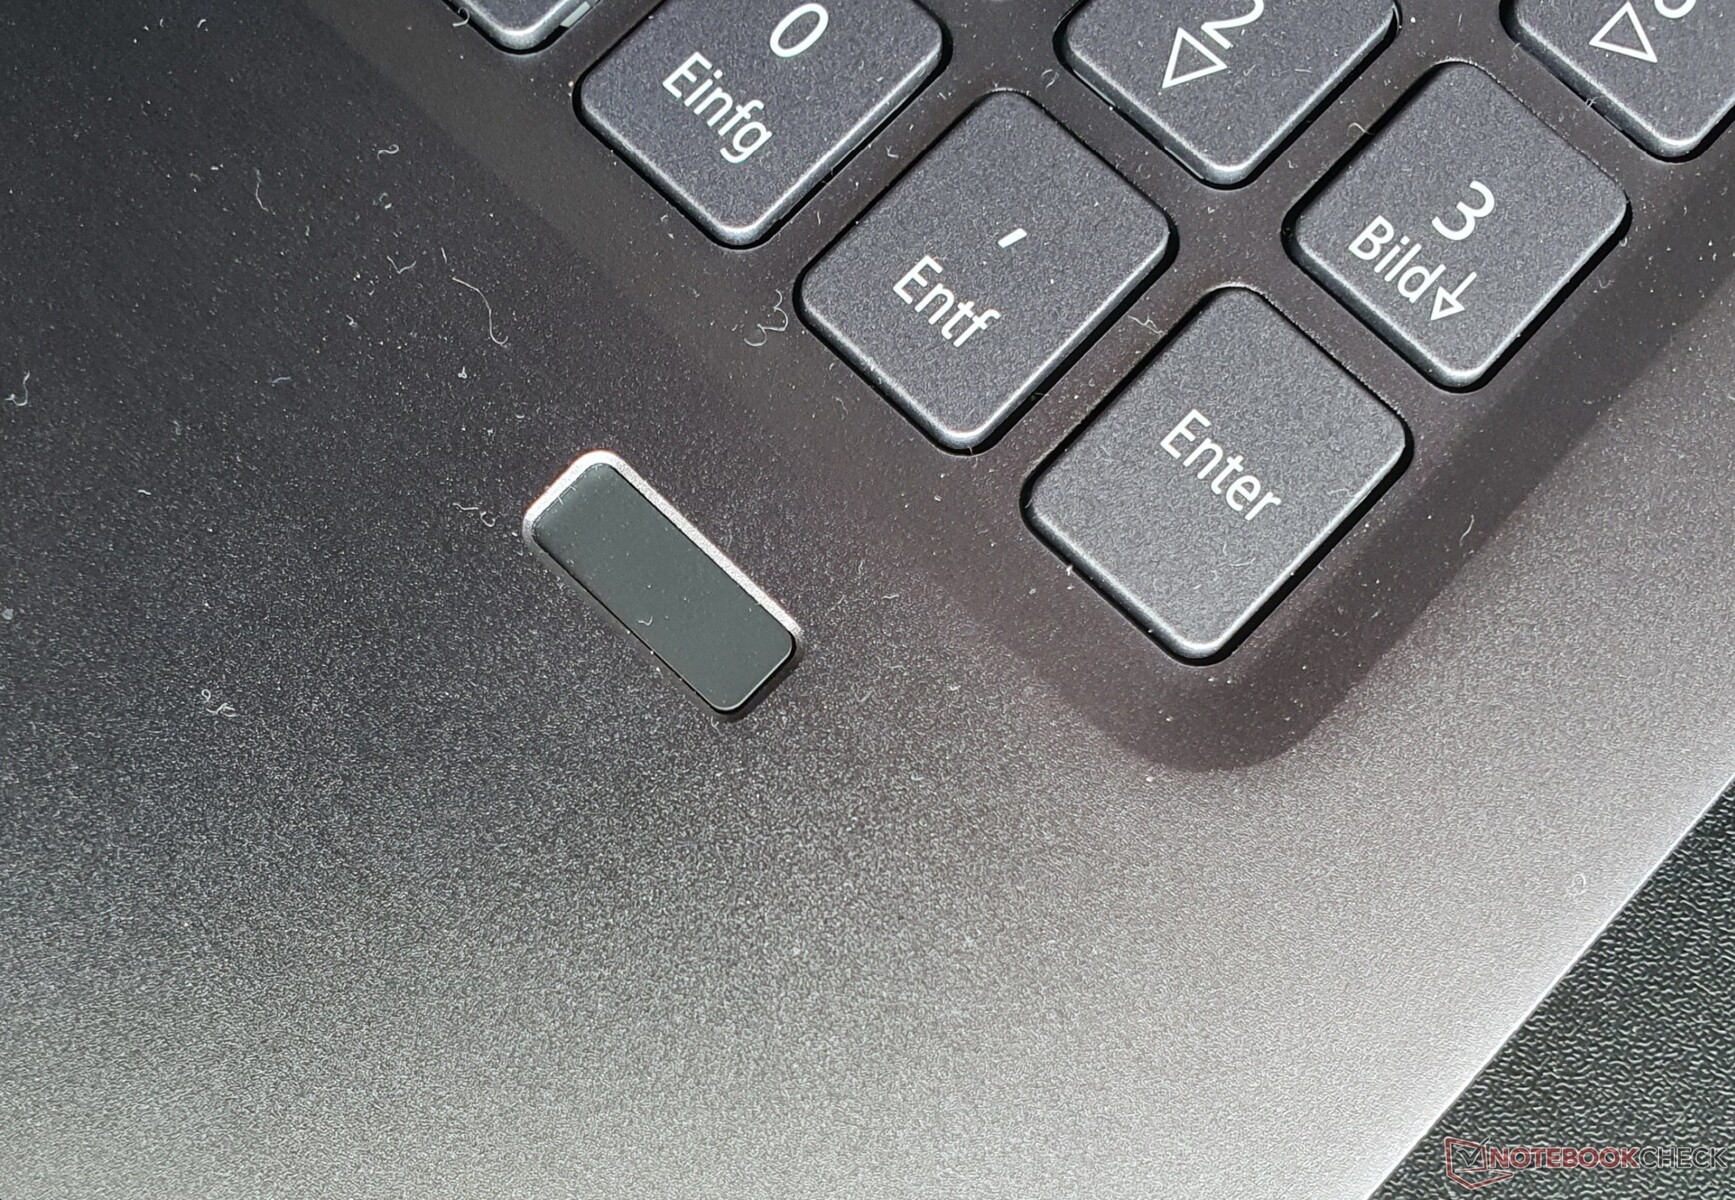
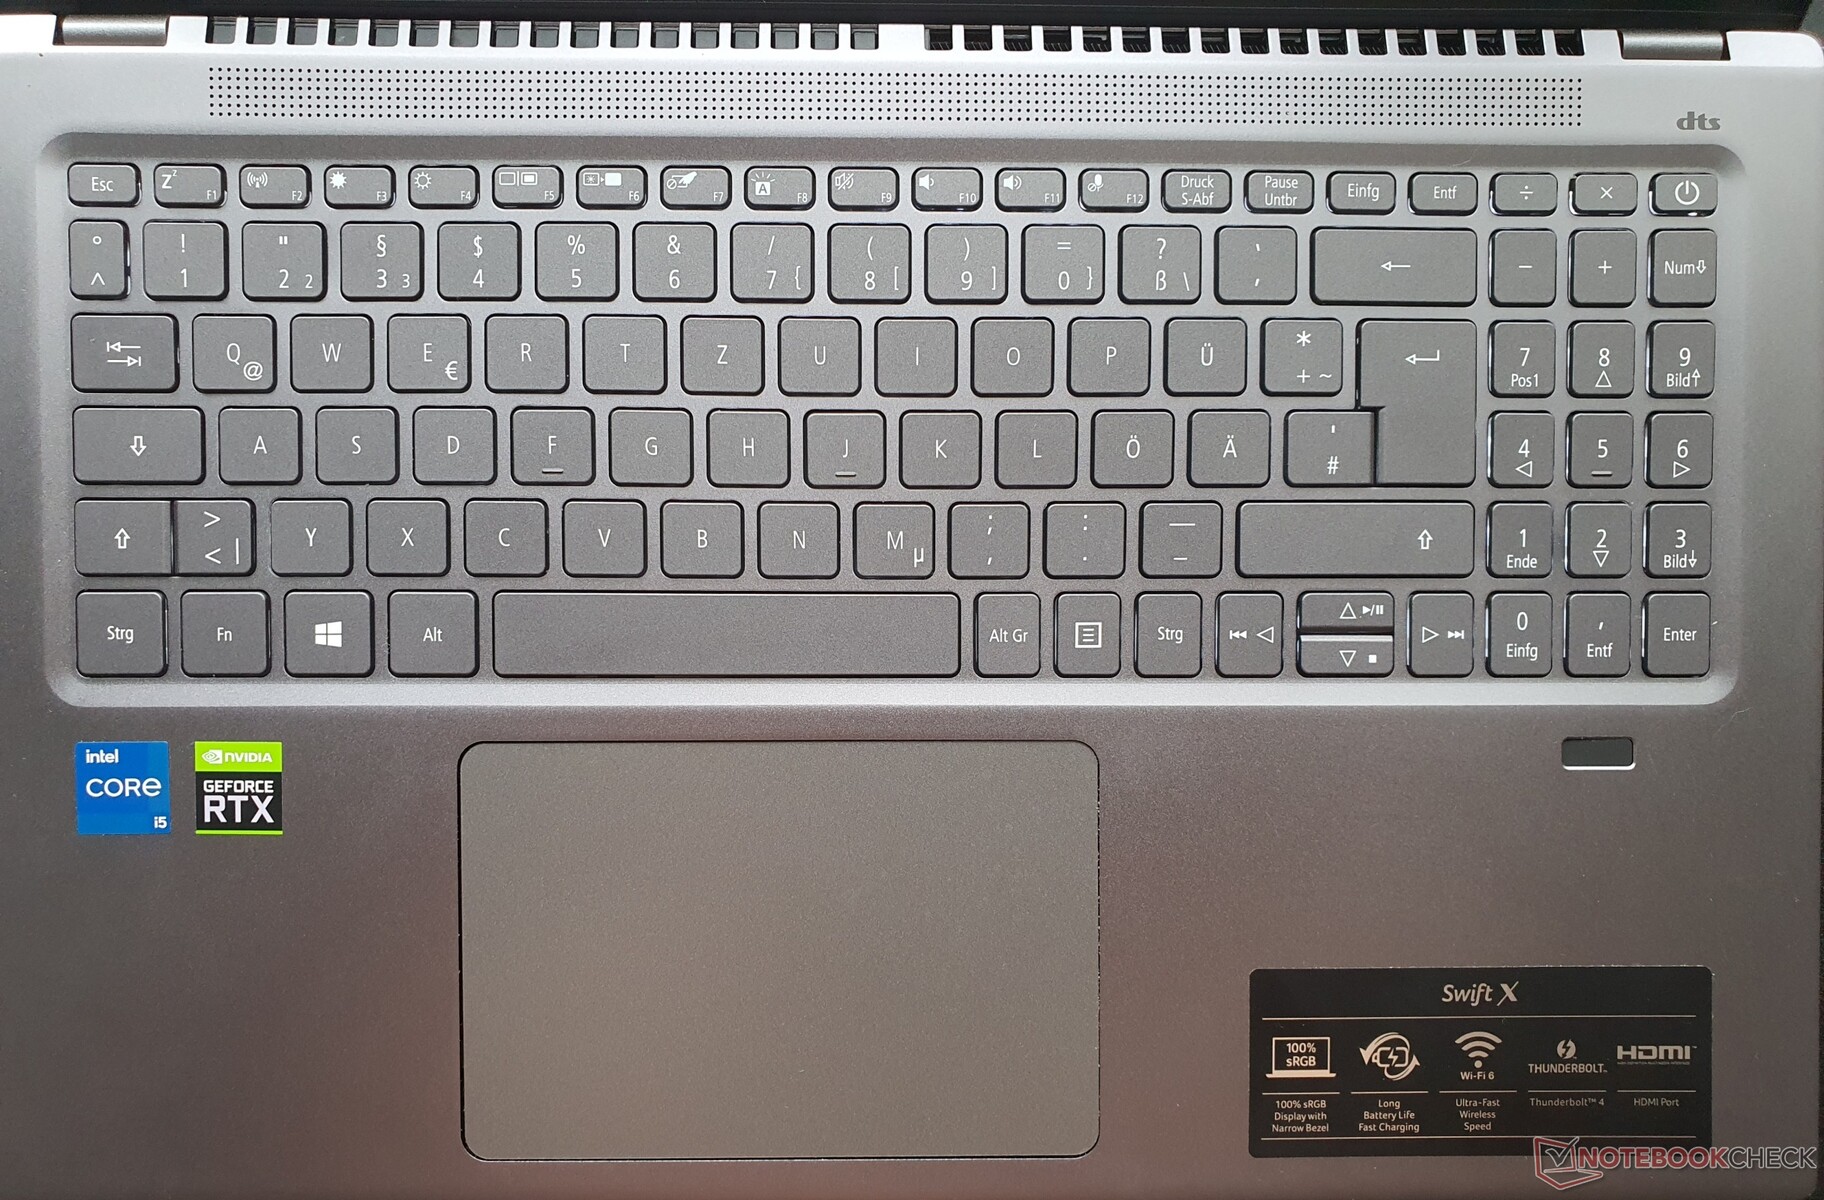
Las teclas del Swift X son un poco más pequeñas, especialmente la fila superior, el NumPad y las teclas de flecha verticales. El recorrido de las teclas es corto, el punto de presión bien dosificado y la resistencia clara. En general, es posible escribir rápido en el teclado Acer retroiluminado de un solo nivel, que además hace su trabajo de forma agradablemente silenciosa.
La disposición es buena, con asignaciones dobles para "Pos1/Final" y algunas funciones multimedia (reproducción, pausa, rebobinado). El teclado cede ligeramente bajo presión, pero esto no es un problema al escribir.
Teclado táctil
El clickpad mide 12,5 x 8 cm y deslizar el puntero del ratón es un juego de niños en la superficie lisa. Los botones integrados en la zona inferior del touchpad tienen un recorrido corto, requieren más fuerza de la habitual para hacer clic y ofrecen una respuesta moderada (para el gusto del crítico)
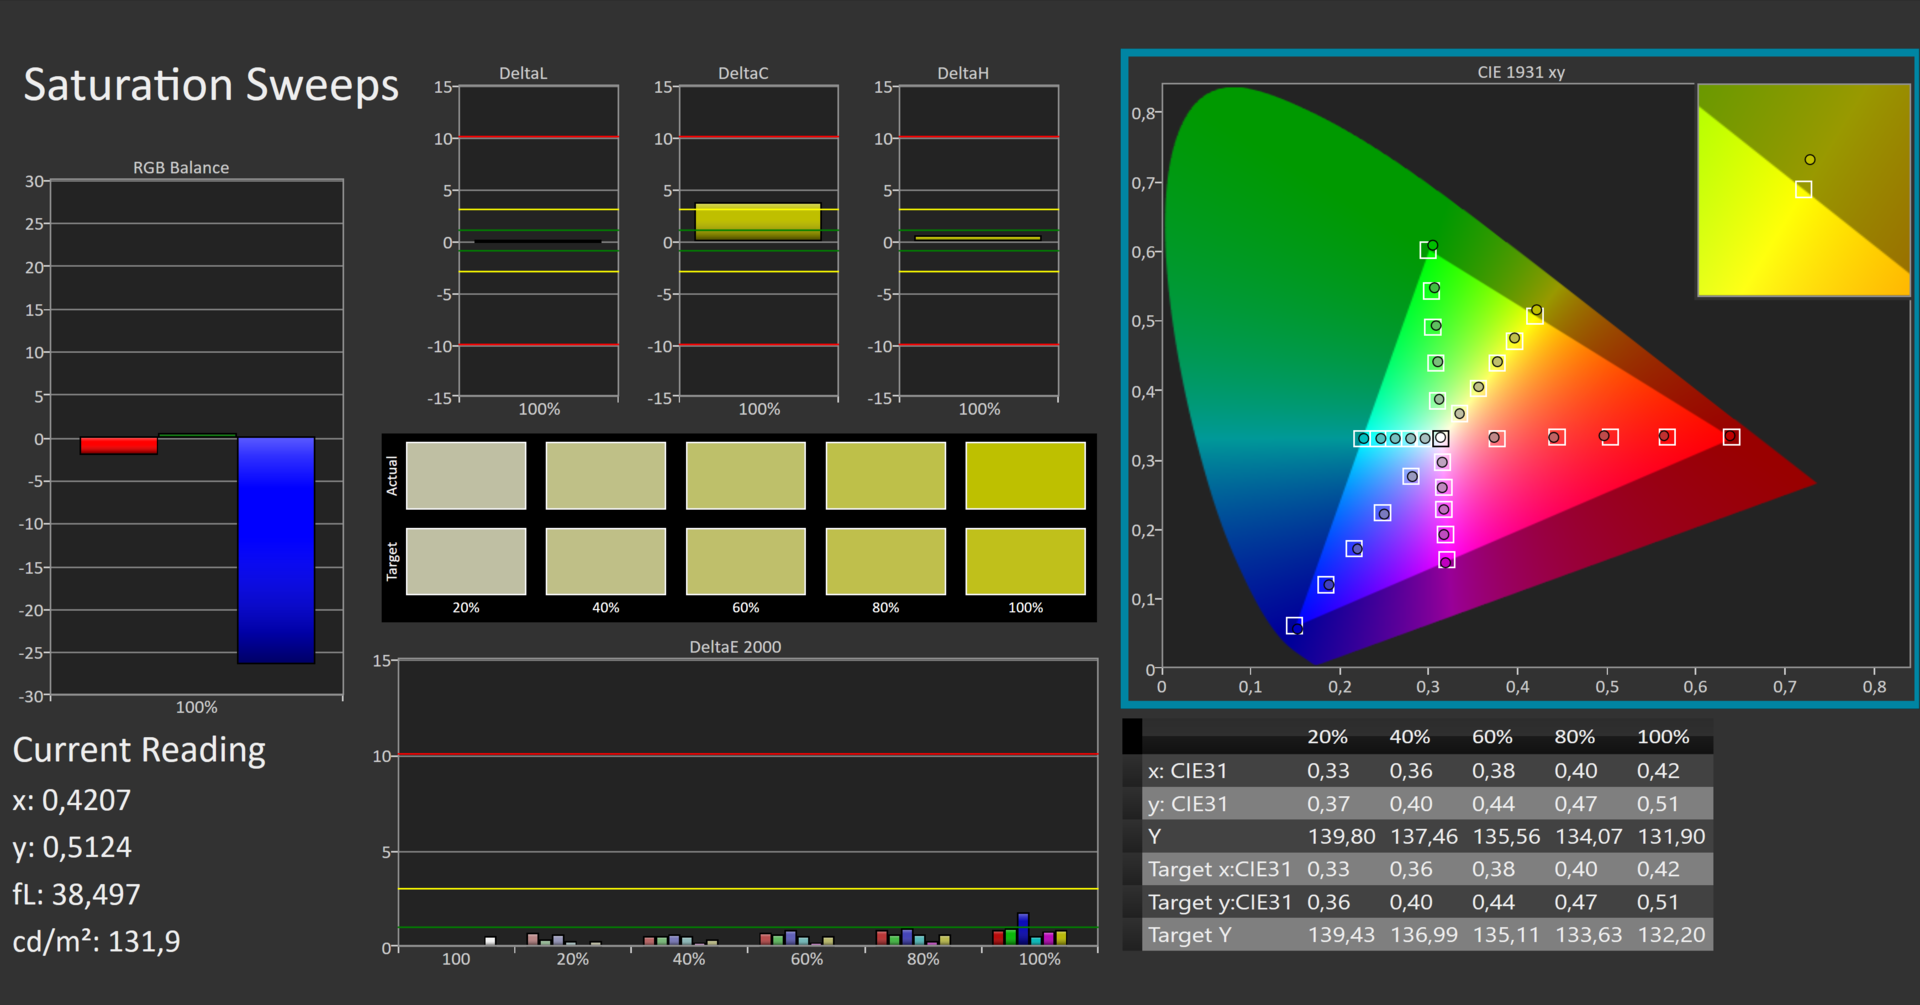
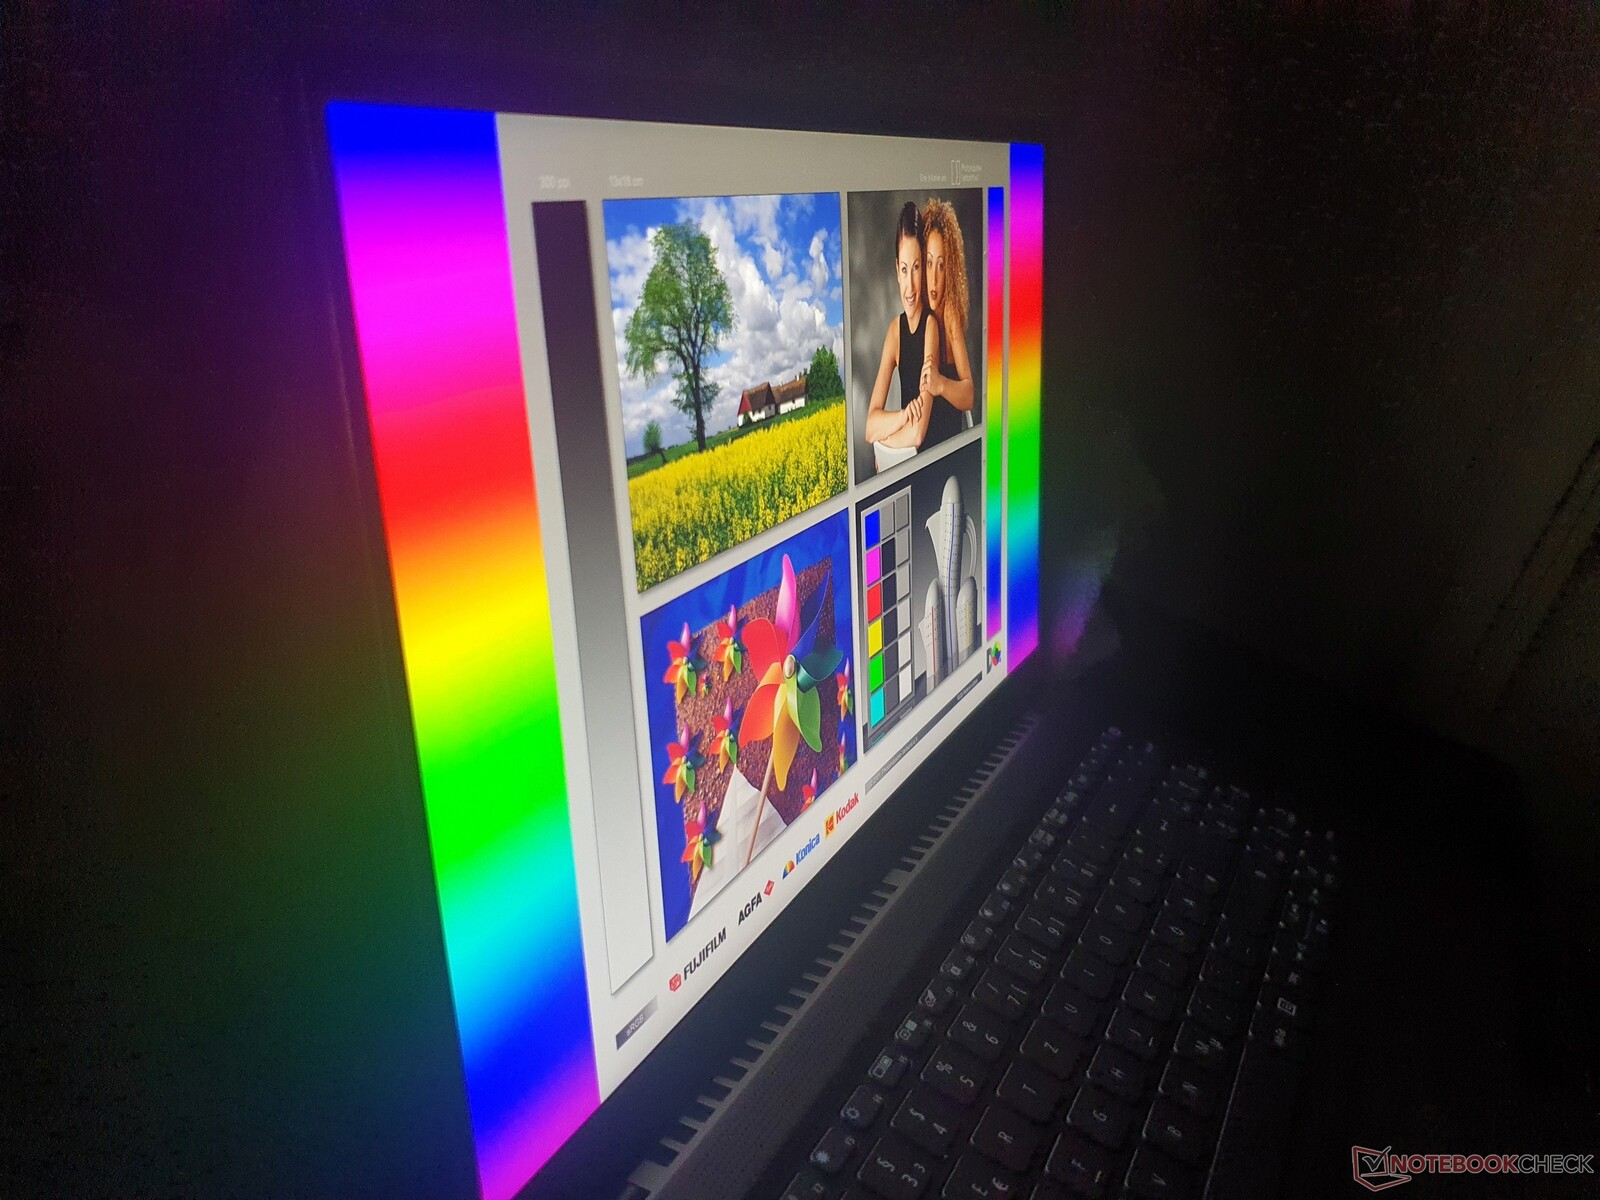
Pantalla: Acer promete un 100% de sRGB para el Swift X 16
La pantalla mate del Acer Swift X mide 16,1 pulgadas, pero mantiene el formato 16:9 (bueno para los medios, menos adecuado para las tareas de oficina), mientras que la competencia suele usar 16:10. La resolución de 1.920 x 1.080 píxeles está bien en 16 pulgadas, lo que significa que el escalado de Windows puede permanecer al 100% (nitidez de imagen óptima).
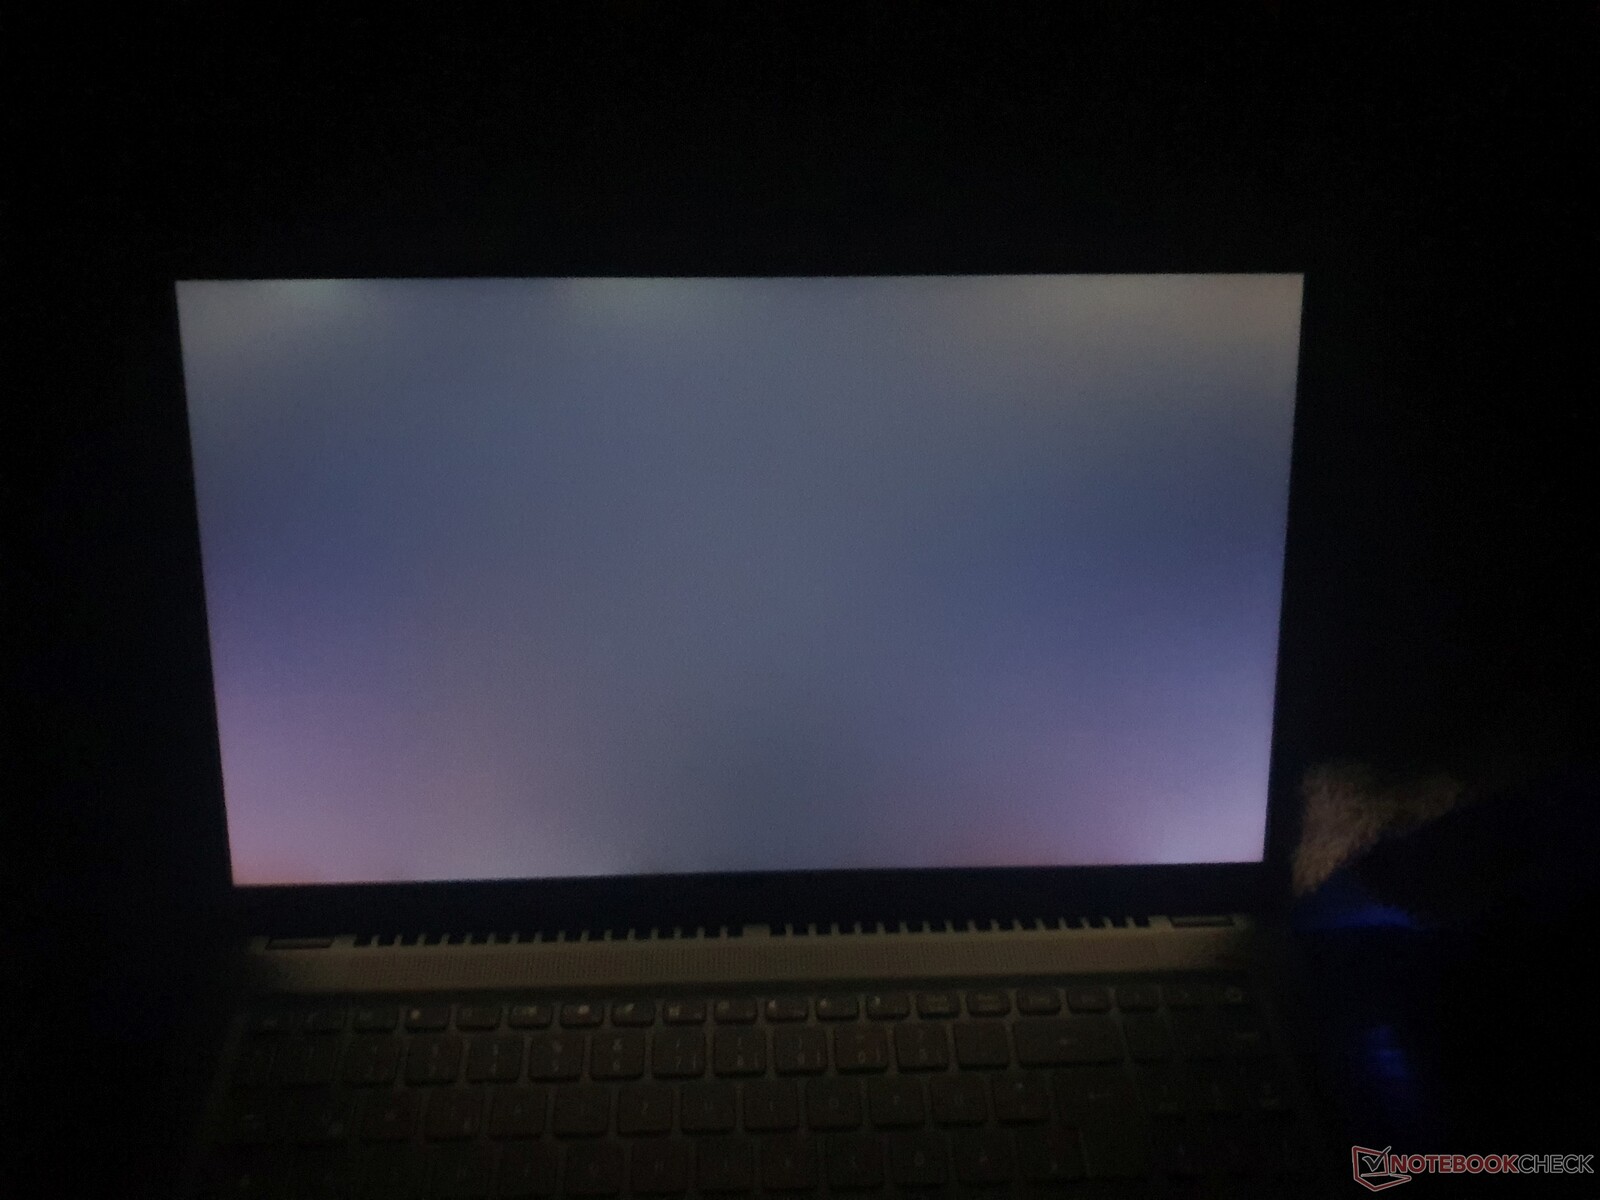
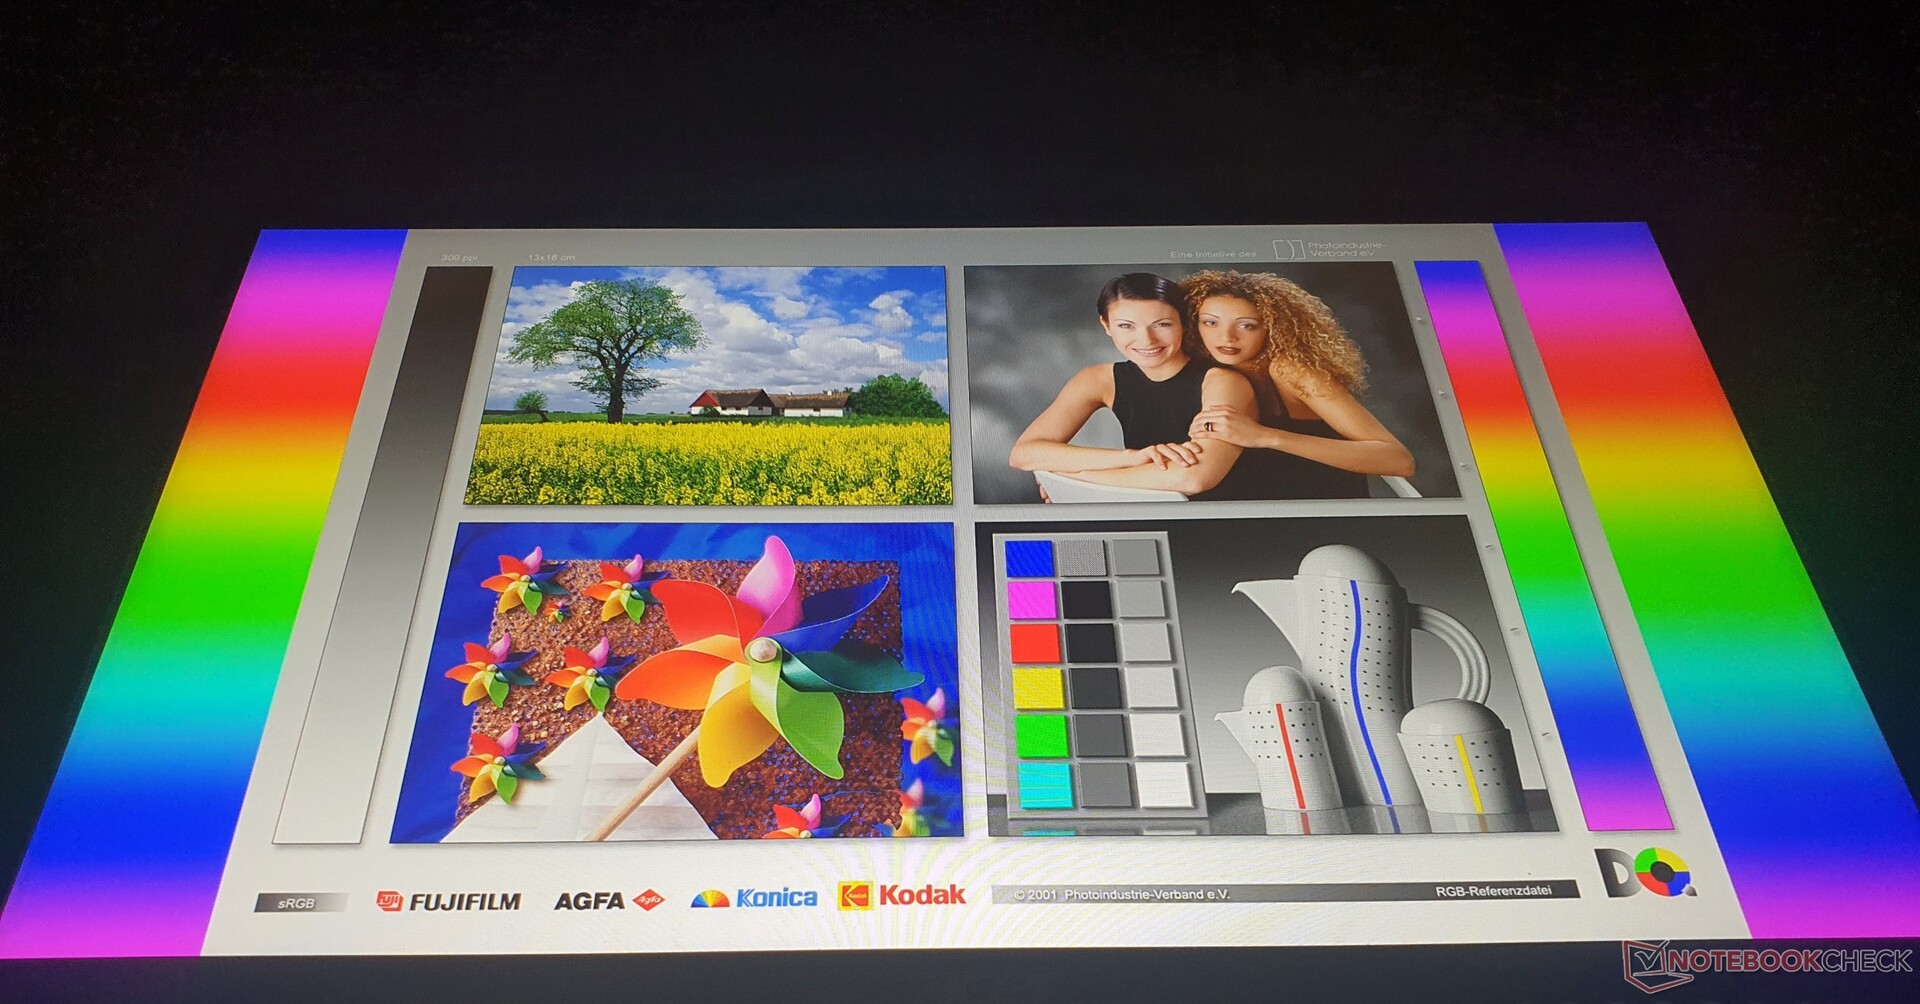
Una desventaja es el bajo brillo de los 264 nits medidos, que es suficiente en interiores, pero subóptimo. No hay opciones de pantalla alternativas. Además, el brillo vuelve a caer en modo batería a sólo 180 nits.
El ratio de contraste (1.725:1) y el nivel de negro (0.16 nits) son muy buenos para un display IPS y los bajos valores DeltaE resultan en una adecuada representación del color. Los tiempos de respuesta del panel no son ni buenos ni malos, pero son suficientes para el juego casual. No se detectó ningún parpadeo PWM.
El panel en sí es fundamentalmente sólido, pero los portátiles de la competencia en nuestra tabla comparativa tienen paneles consistentemente mejores con resoluciones y valores de brillo más altos. El Lenovo IdeaPad 5 Pro 16también tiene una tasa de refresco de 120 Hz, mientras que el Asus Vivobook Pro 16Xtiene un panel OLED 4K.
| |||||||||||||||||||||||||
iluminación: 85 %
Brillo con batería: 180 cd/m²
Contraste: 1725:1 (Negro: 0.16 cd/m²)
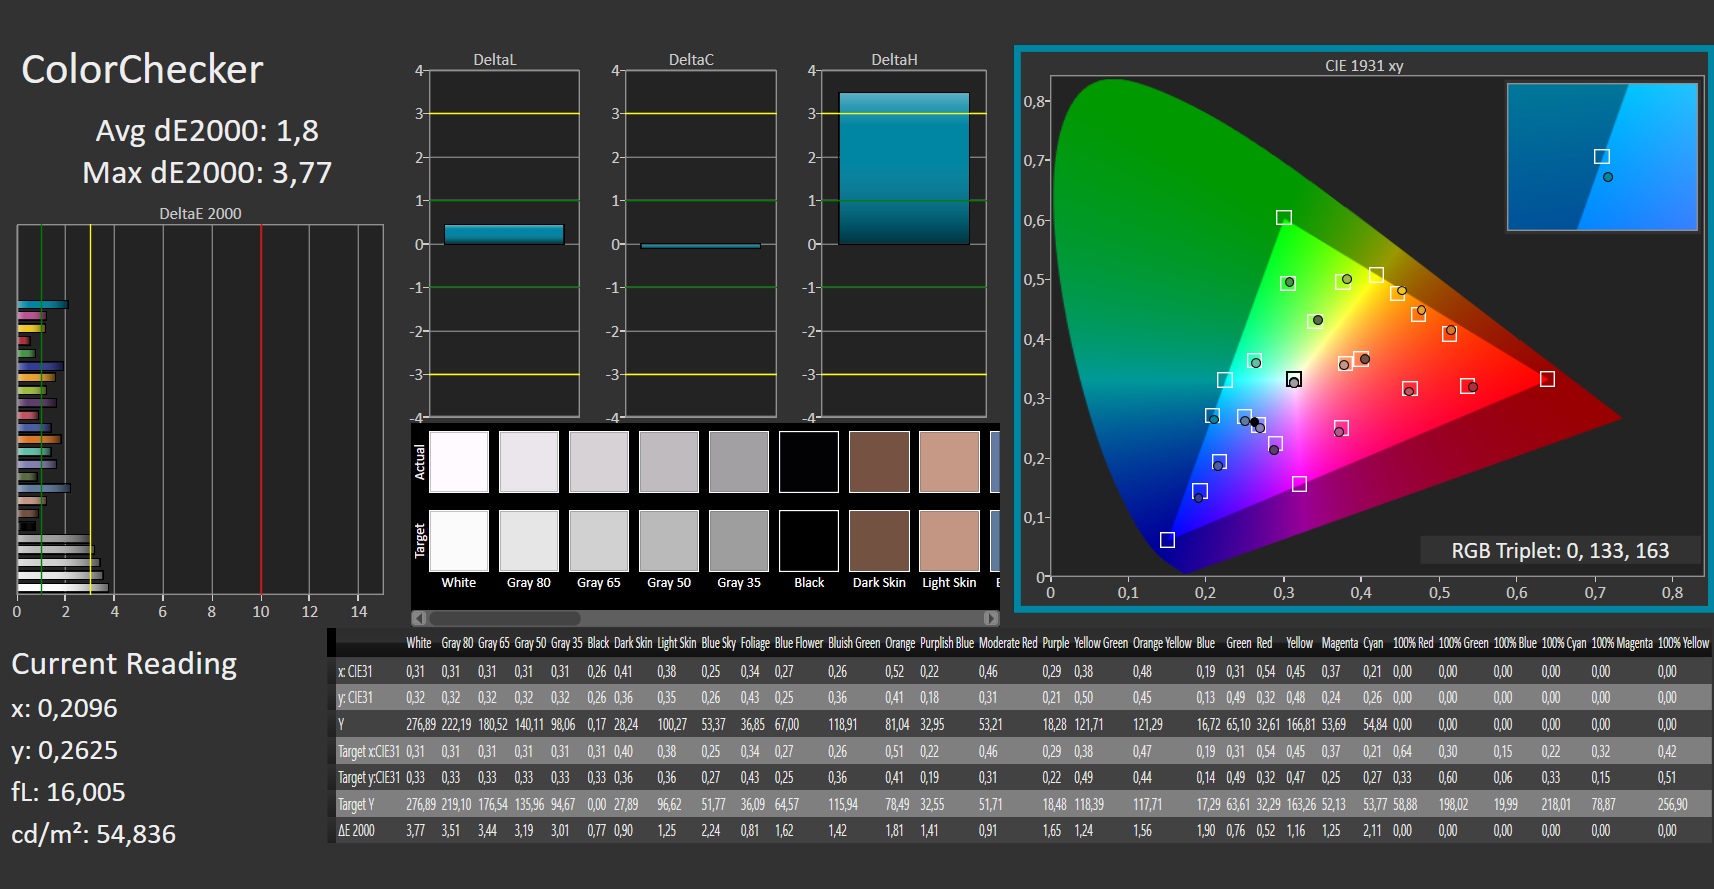
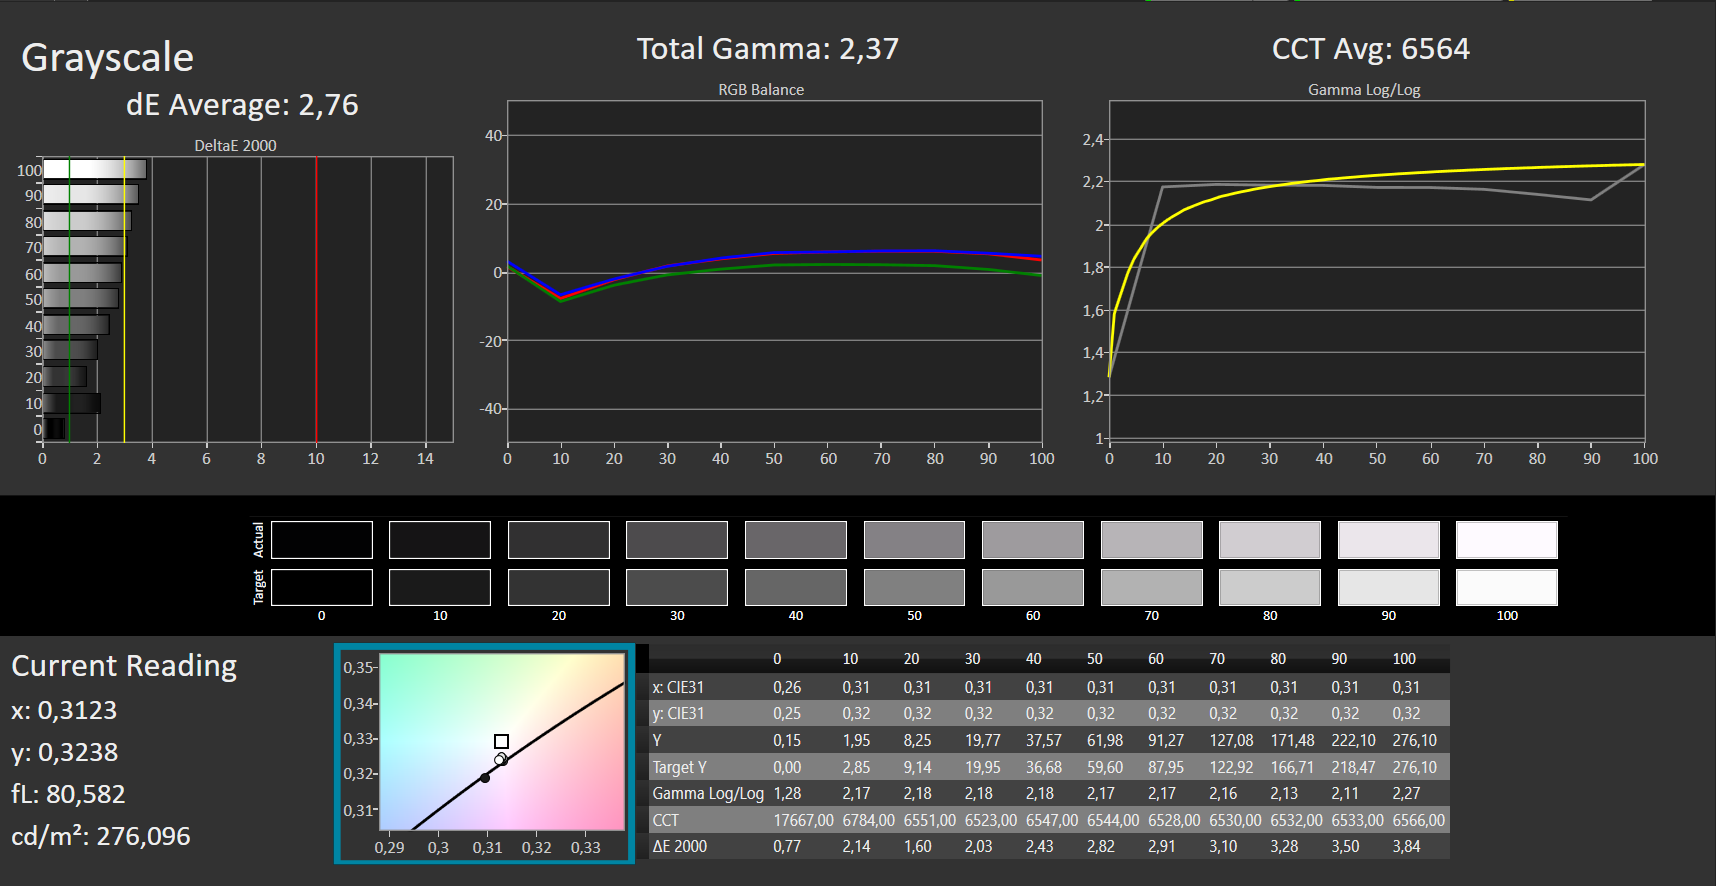
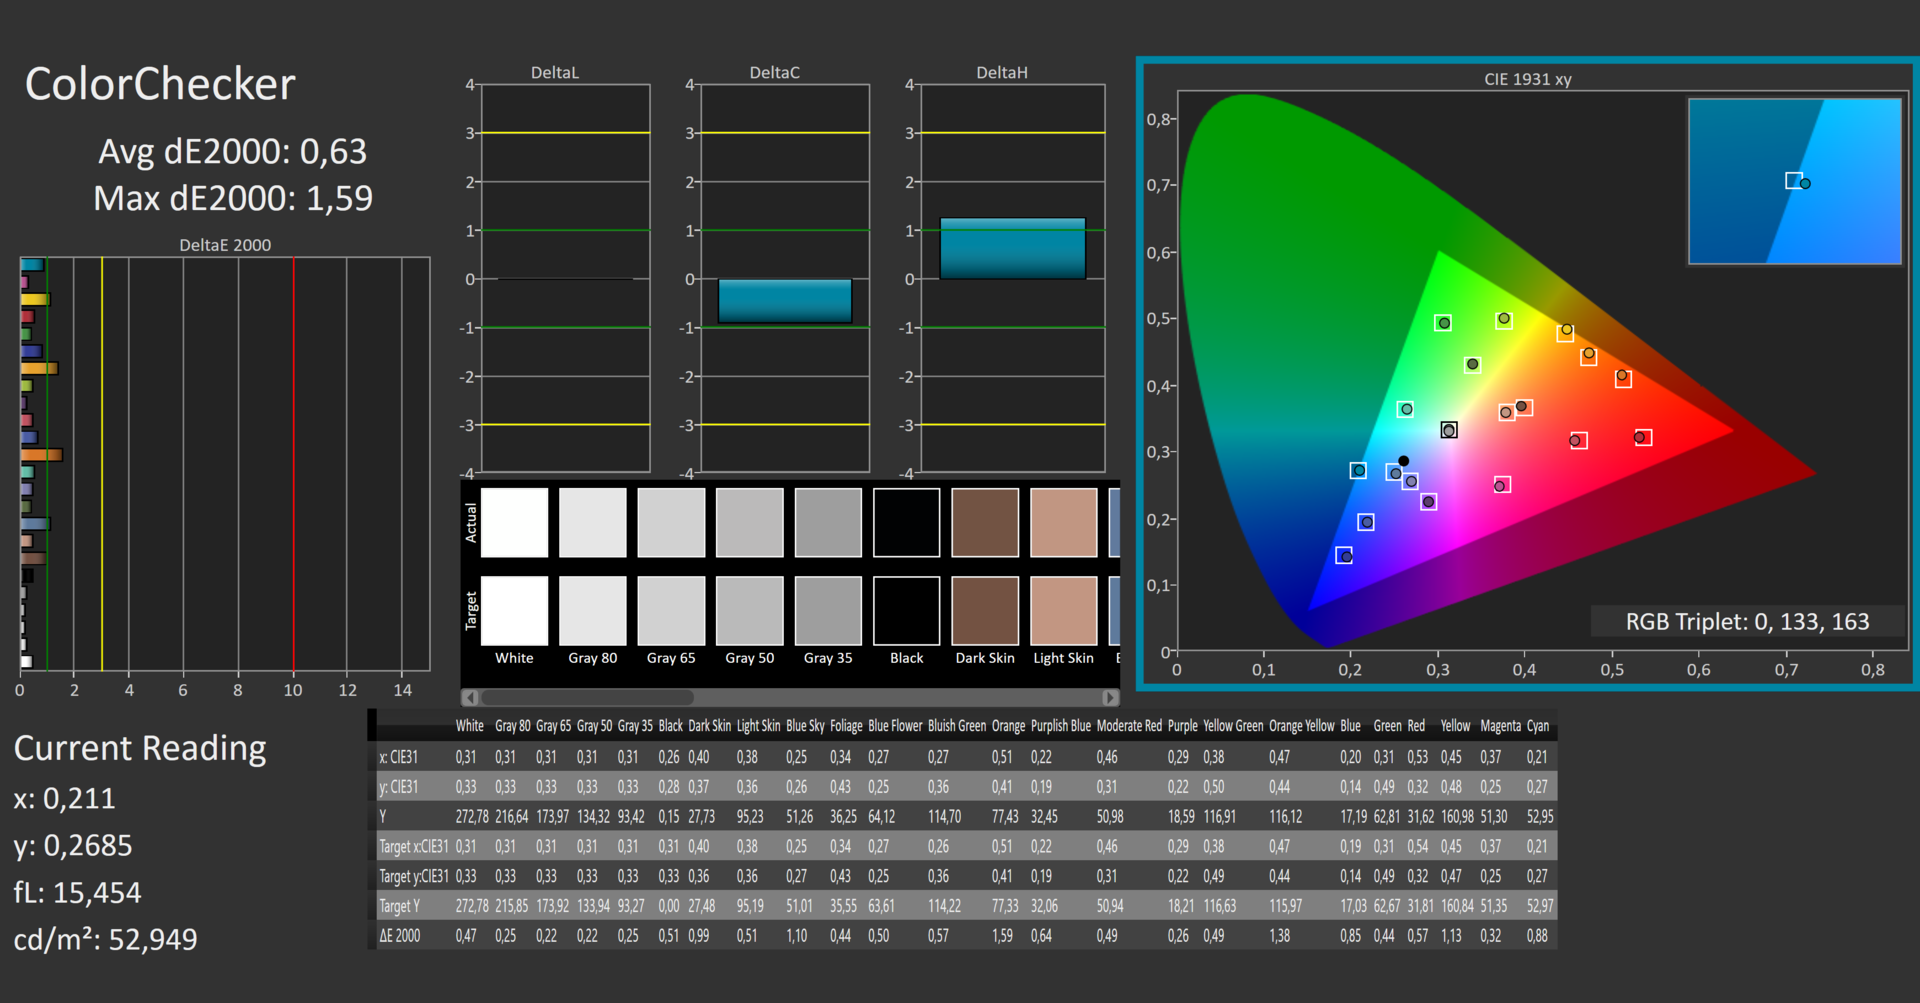
ΔE ColorChecker Calman: 1.8 | ∀{0.5-29.43 Ø4.71}
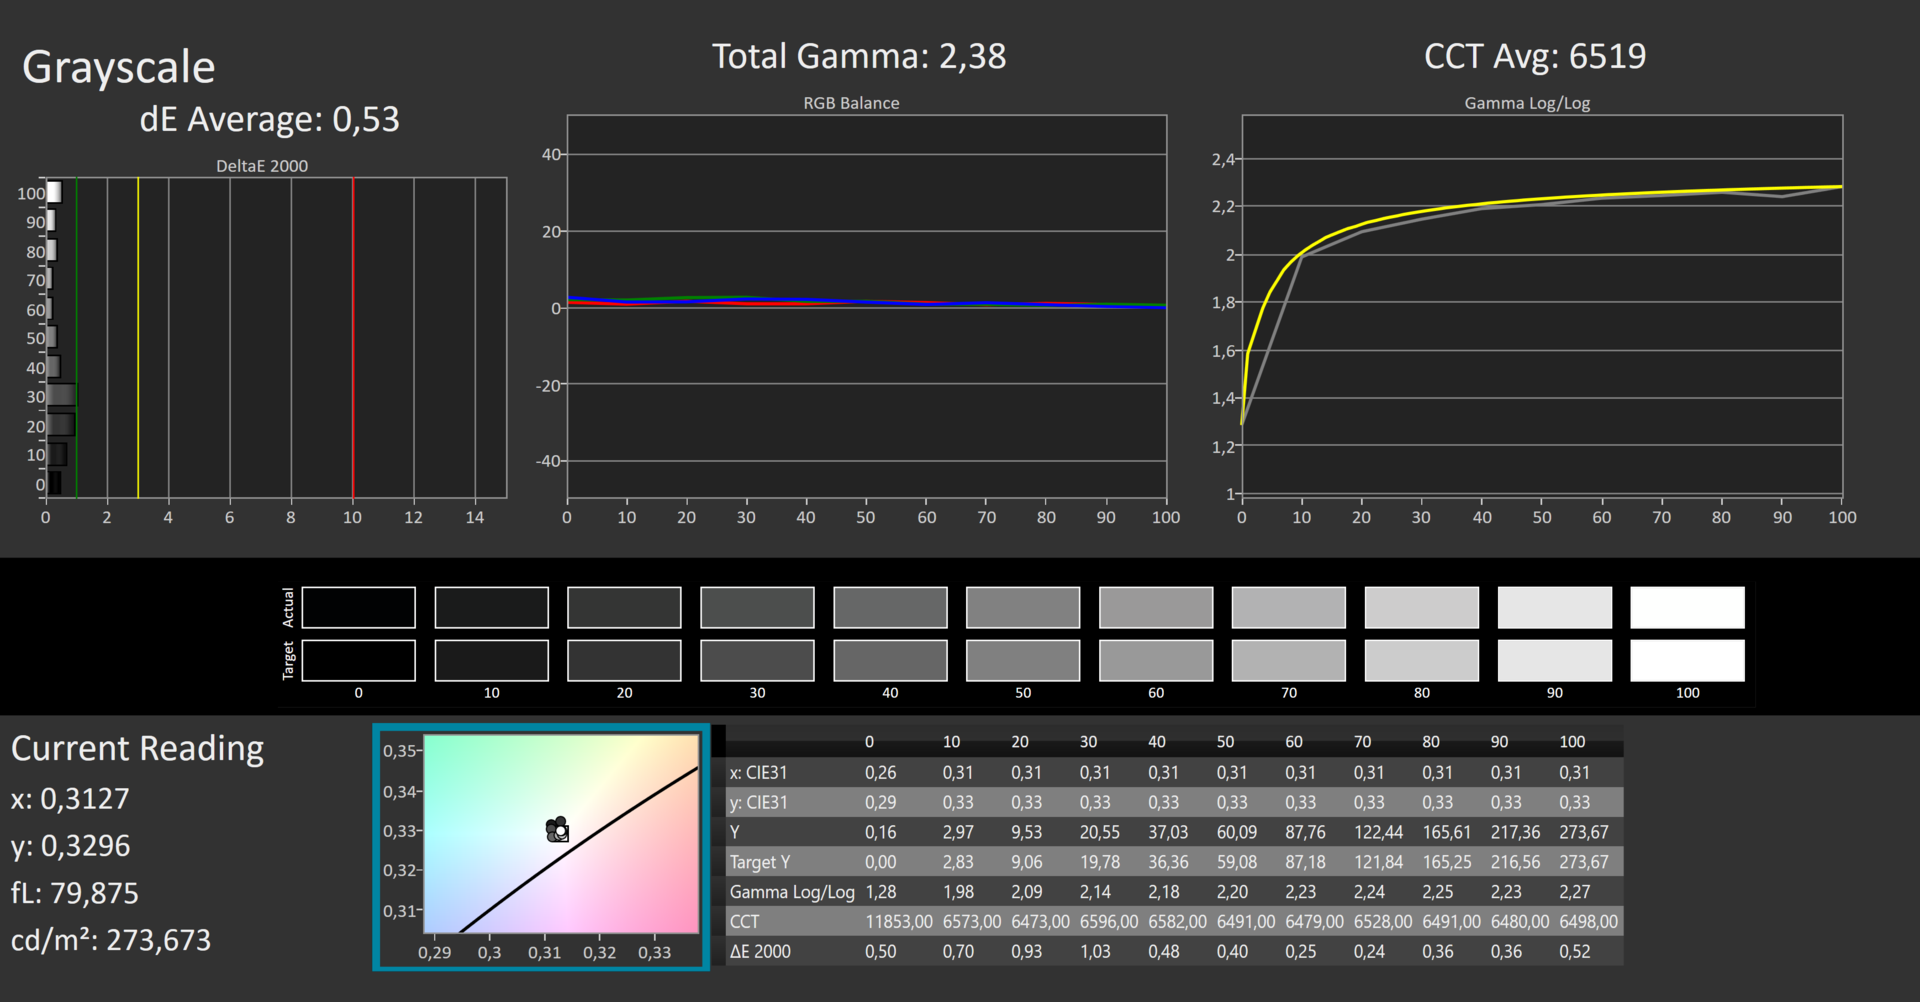
calibrated: 0.63
ΔE Greyscale Calman: 2.76 | ∀{0.09-98 Ø4.96}
66.75% AdobeRGB 1998 (Argyll 3D)
95.65% sRGB (Argyll 3D)
65.1% Display P3 (Argyll 3D)
Gamma: 2.37
CCT: 6564 K
| Acer Swift X SFX16-51G-5388 Chi Mei N161HCA-EA3, , 1920x1080, 16.1" | Acer Swift 3 SF316-51 Chi Mei CMN160B, IPS, 1920x1080, 16.1" | Lenovo IdeaPad 5 Pro 16ACH IPS LED, 2560x1600, 16" | Dell Inspiron 16 Plus 7610 AU Optronics B160QAN, IPS, 3072x1920, 16" | Asus Vivobook Pro 16X-M7600QE Samsung ATNA60YV02-0, OLED, 3840x2400, 16.1" | Huawei MateBook 16 R7 5800H BOE TV160DKT-NH0, , 2520x1680, 16" | |
|---|---|---|---|---|---|---|
| Display | 3% | 8% | 11% | 34% | -2% | |
| Display P3 Coverage (%) | 65.1 | 66.6 2% | 71 9% | 74.1 14% | 99.8 53% | 63.1 -3% |
| sRGB Coverage (%) | 95.65 | 99.5 4% | 99 4% | 99.4 4% | 100 5% | 94.9 -1% |
| AdobeRGB 1998 Coverage (%) | 66.75 | 68.5 3% | 73.3 10% | 75.8 14% | 96.9 45% | 65.1 -2% |
| Response Times | -4% | 51% | -74% | 92% | -35% | |
| Response Time Grey 50% / Grey 80% * (ms) | 30 ? | 32 ? -7% | 16.4 ? 45% | 49.2 ? -64% | 2 ? 93% | 41.2 ? -37% |
| Response Time Black / White * (ms) | 20 ? | 20 ? -0% | 8.8 ? 56% | 36.8 ? -84% | 2 ? 90% | 26.4 ? -32% |
| PWM Frequency (Hz) | 2500 ? | 24940 ? | 60 ? | |||
| Screen | 7% | -25% | -32% | -5% | 7% | |
| Brightness middle (cd/m²) | 276 | 304 10% | 395 43% | 296.8 8% | 392 42% | 357 29% |
| Brightness (cd/m²) | 264 | 284 8% | 375 42% | 292 11% | 396 50% | 349 32% |
| Brightness Distribution (%) | 85 | 88 4% | 90 6% | 87 2% | 98 15% | 93 9% |
| Black Level * (cd/m²) | 0.16 | 0.165 -3% | 0.32 -100% | 0.21 -31% | 0.21 -31% | |
| Contrast (:1) | 1725 | 1842 7% | 1234 -28% | 1413 -18% | 1700 -1% | |
| Colorchecker dE 2000 * | 1.8 | 1.44 20% | 2.6 -44% | 2.56 -42% | 1.74 3% | 1.6 11% |
| Colorchecker dE 2000 max. * | 3.77 | 3.62 4% | 5.4 -43% | 4.76 -26% | 3.18 16% | 3.9 -3% |
| Colorchecker dE 2000 calibrated * | 0.63 | 1.1 -75% | 1.86 -195% | 1.85 -194% | 0.6 5% | |
| Greyscale dE 2000 * | 2.76 | 2.6 6% | 3.4 -23% | 2.6 6% | 1.77 36% | 2.4 13% |
| Gamma | 2.37 93% | 2.41 91% | 2.12 104% | 2.07 106% | 2.22 99% | 2.14 103% |
| CCT | 6564 99% | 6527 100% | 6140 106% | 6628 98% | 6483 100% | 6728 97% |
| Color Space (Percent of AdobeRGB 1998) (%) | 68.5 | |||||
| Color Space (Percent of sRGB) (%) | 99.5 | |||||
| Media total (Programa/Opciones) | 2% /
4% | 11% /
-7% | -32% /
-29% | 40% /
21% | -10% /
-1% |
* ... más pequeño es mejor
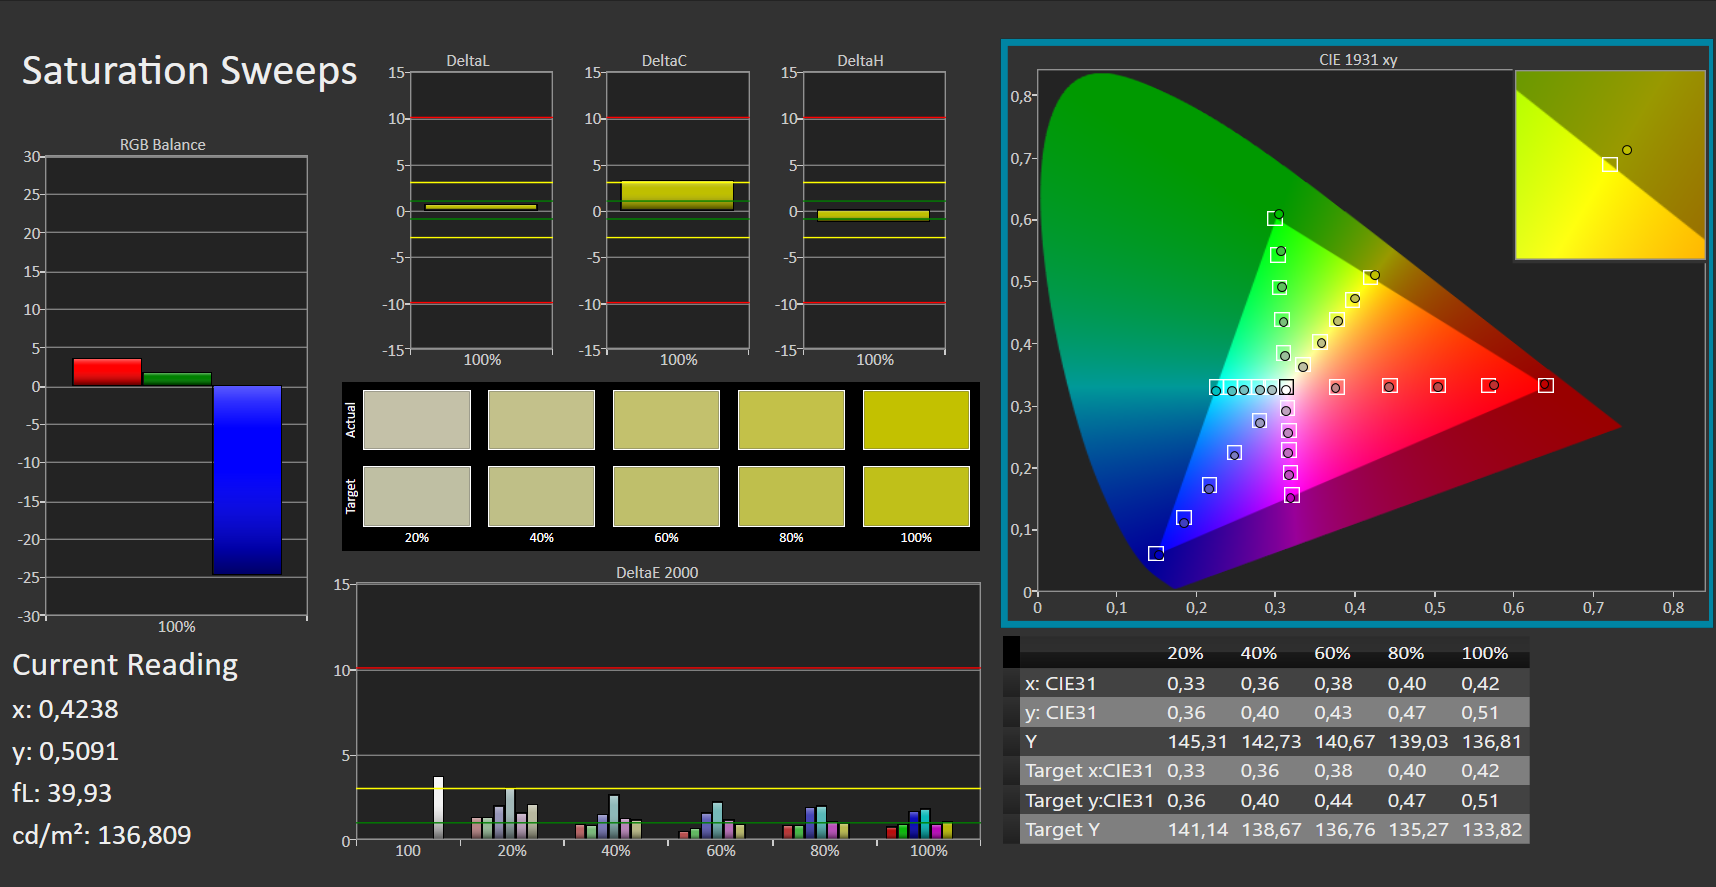
Acer promete una cobertura completa de sRGB, lo que se confirma con nuestra medición del 95,7%. Para los espacios de color Adobe RGB y DCI-P3, registramos un 66,8% y un 65,1%, respectivamente. Esto hace posible la edición semiprofesional de imágenes y vídeos
La pantalla ya está bastante bien calibrada de fábrica, pero hemos podido mejorar aún más los resultados. Como siempre, nuestro perfil de color ICC está disponible para su descarga junto al gráfico de iluminación
Tiempos de respuesta del display
| ↔ Tiempo de respuesta de Negro a Blanco | ||
|---|---|---|
| 20 ms ... subida ↗ y bajada ↘ combinada | ↗ 11 ms subida |  |
| ↘ 9 ms bajada | ||
| La pantalla mostró buenos tiempos de respuesta en nuestros tests pero podría ser demasiado lenta para los jugones competitivos. En comparación, todos los dispositivos de prueba van de ##min### (mínimo) a 240 (máximo) ms. » 44 % de todos los dispositivos son mejores. Eso quiere decir que el tiempo de respuesta es similar al dispositivo testado medio (19.8 ms). | ||
| ↔ Tiempo de respuesta 50% Gris a 80% Gris | ||
| 30 ms ... subida ↗ y bajada ↘ combinada | ↗ 14 ms subida |  |
| ↘ 16 ms bajada | ||
| La pantalla mostró tiempos de respuesta lentos en nuestros tests y podría ser demasiado lenta para los jugones. En comparación, todos los dispositivos de prueba van de ##min### (mínimo) a 636 (máximo) ms. » 40 % de todos los dispositivos son mejores. Eso quiere decir que el tiempo de respuesta es similar al dispositivo testado medio (31 ms). | ||
Parpadeo de Pantalla / PWM (Pulse-Width Modulation)
| Parpadeo de Pantalla / PWM no detectado |  | ||
Comparación: 52 % de todos los dispositivos testados no usaron PWM para atenuar el display. Si se usó, medimos una media de 7754 (mínimo: 5 - máxmo: 343500) Hz. | |||
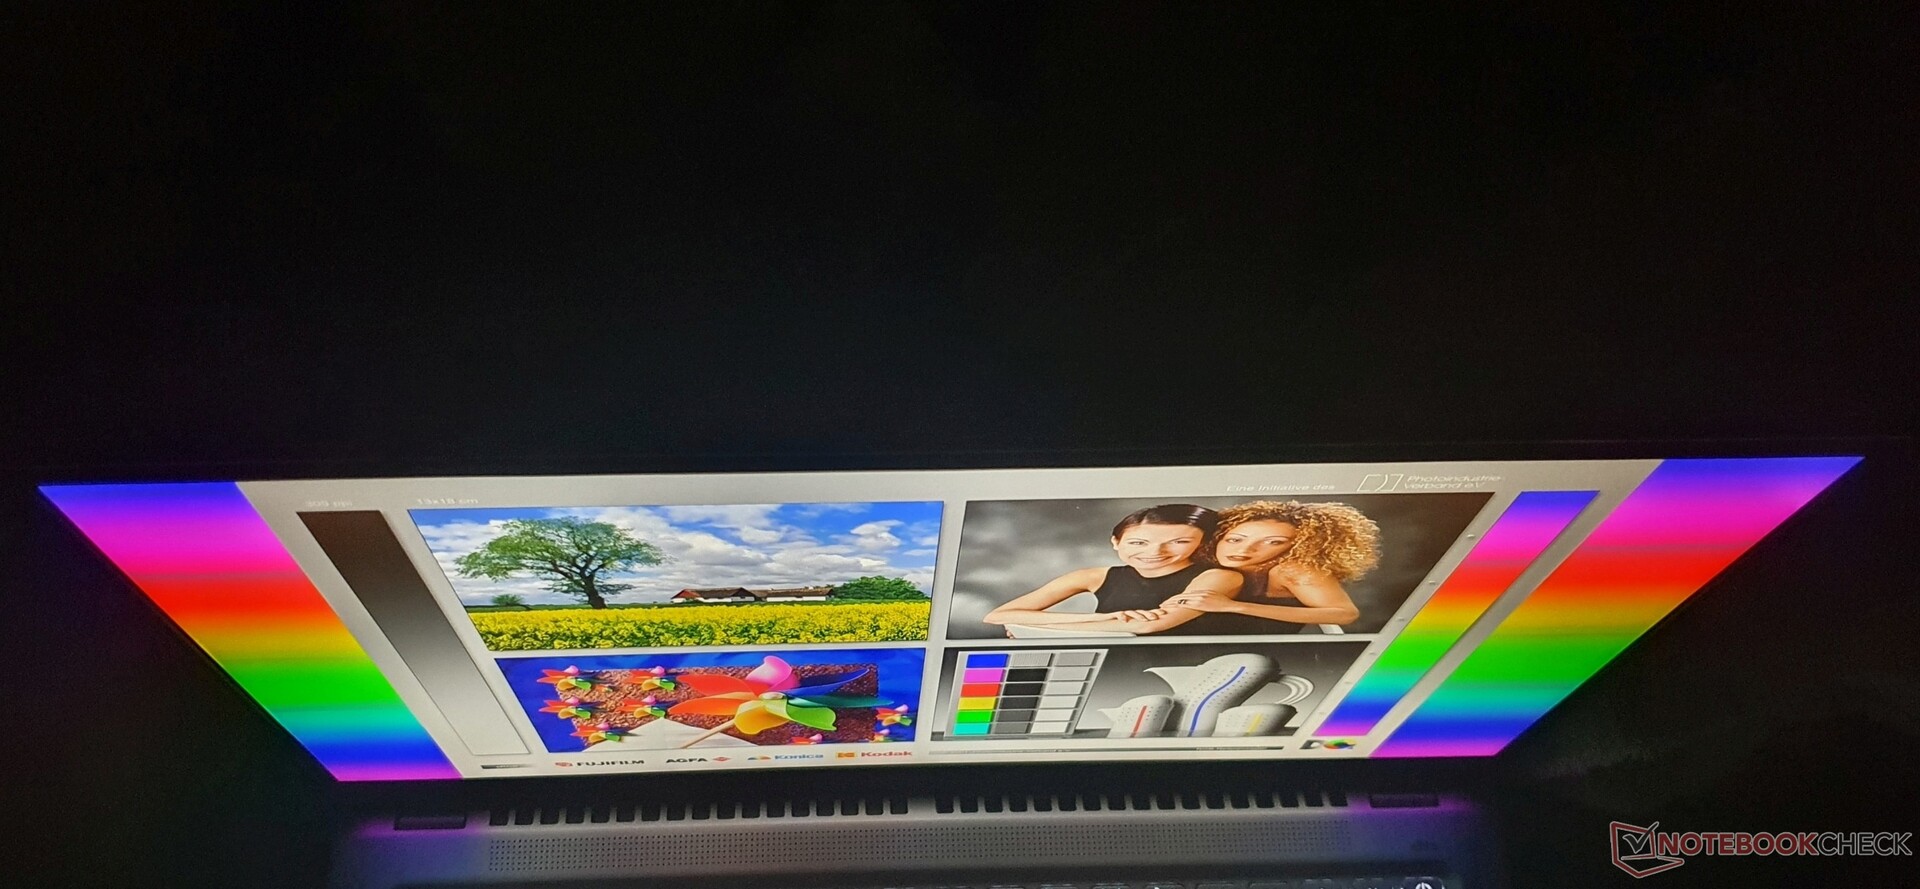
Para el uso en exteriores, el Acer Swift X 16 sólo puede utilizarse a la sombra. A pesar de su superficie mate, la pantalla simplemente no es lo suficientemente brillante como para soportar el sol.
Rendimiento: El Swift X tiene un buen rendimiento, pero el SSD está ralentizado
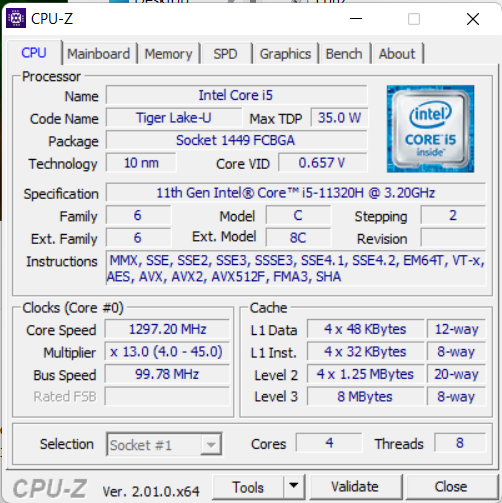
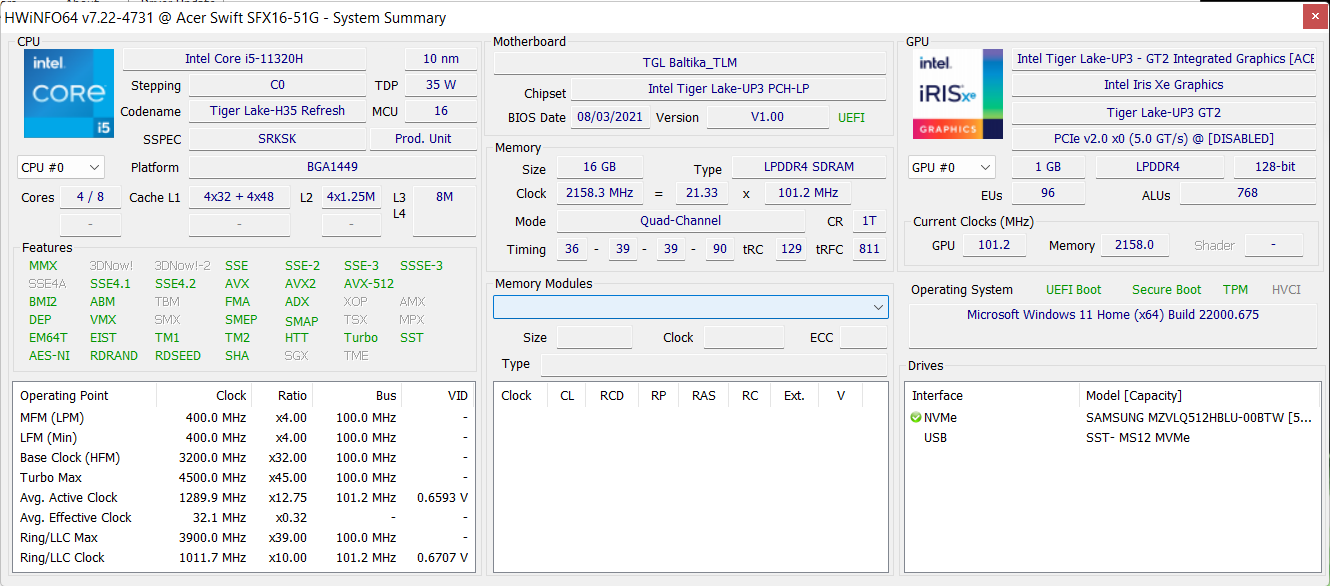
Acer ofrece exactamente dos opciones de CPU para su Swift X 16: un Intel Core i5-11320H con 4,5 GHz Turbo (en nuestro modelo) y un Core i7-11390H con 5 GHz Turbo. Ambos son procesadores de cuatro núcleos.
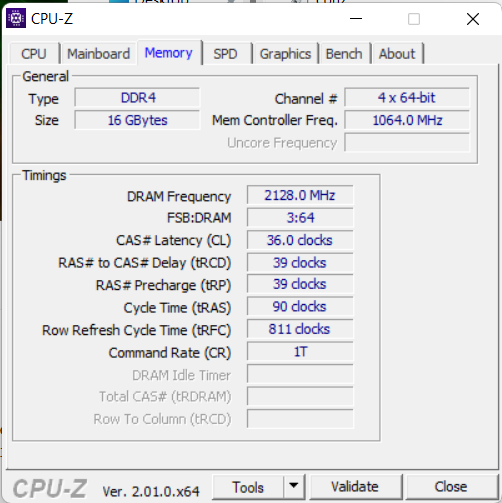
El portátil suele venir con una Nvidia GeForce RTX 3050 y 16 GB de RAM LPDDR4X-4266 soldada. En cuanto al espacio de almacenamiento, el estándar es un SSD de 512 GB (PCIe 3.0), aunque en algunas configuraciones se ofrece un SDD de 1 TB en otros países. En general, este nivel de hardware es suficiente para fines multimedia, como la edición sencilla de vídeo, la edición de audio o los juegos FHD, y para el uso general en la oficina.

Condiciones de la prueba
Acer ofrece tres modos de energía diferentes que se pueden alternar mediante la combinación de teclas "Fn + F": "Silencio", "Normal" y "Rendimiento".
Éstos influyen directamente en el volumen del ventilador y los límites de rendimiento. Así, los ventiladores son significativamente más silenciosos en el modo Silencioso , y menos intrusivos en el modo Normal (en relación con el modo Rendimiento). El Turbo Boost no se ve afectado y el rendimiento bruto de la CPU sólo se reduce ligeramente en el modo Silencioso - bajo carga constante (6% de estrangulamiento térmico). La GPU nunca se ralentiza, pero los 5 vatios extra de "Dynamic Boost" sólo están disponibles en el modo Rendimiento .
La configuración más silenciosa se logra bajo la opción de Windows "Mejor Ahorro de Energía" + el modo Silencioso de Acer. Nuestras pruebas se realizaron en modo Rendimiento , mientras que la duración de la batería (navegación web y vídeo) se determinó en modo Equilibrado .
| TDP en vatios | TGP en vatios | kombiniert | |
|---|---|---|---|
| Modosilencioso | 35 | 35 | 20+35 |
| Normal-Modus | 35 | 35 | 25+35 |
| Módulo derendimiento | 35 | 40 | 25+40 |
| Akkubetrieb | 25 | 30 | 15+30 |
| Win11: Beste Einsparung | 12,5 | 30 | 12,5+30 |
Procesador
El Intel Core i5-11320H es una CPU de cuatro núcleos con un TDP de 35 vatios y un reloj base de 3,2 GHz. El turbo está especificado en 4,5 GHz. La CPU es más o menos la misma que el Core i5-1155G7que puede configurarse entre 15 y un máximo de 28 vatios
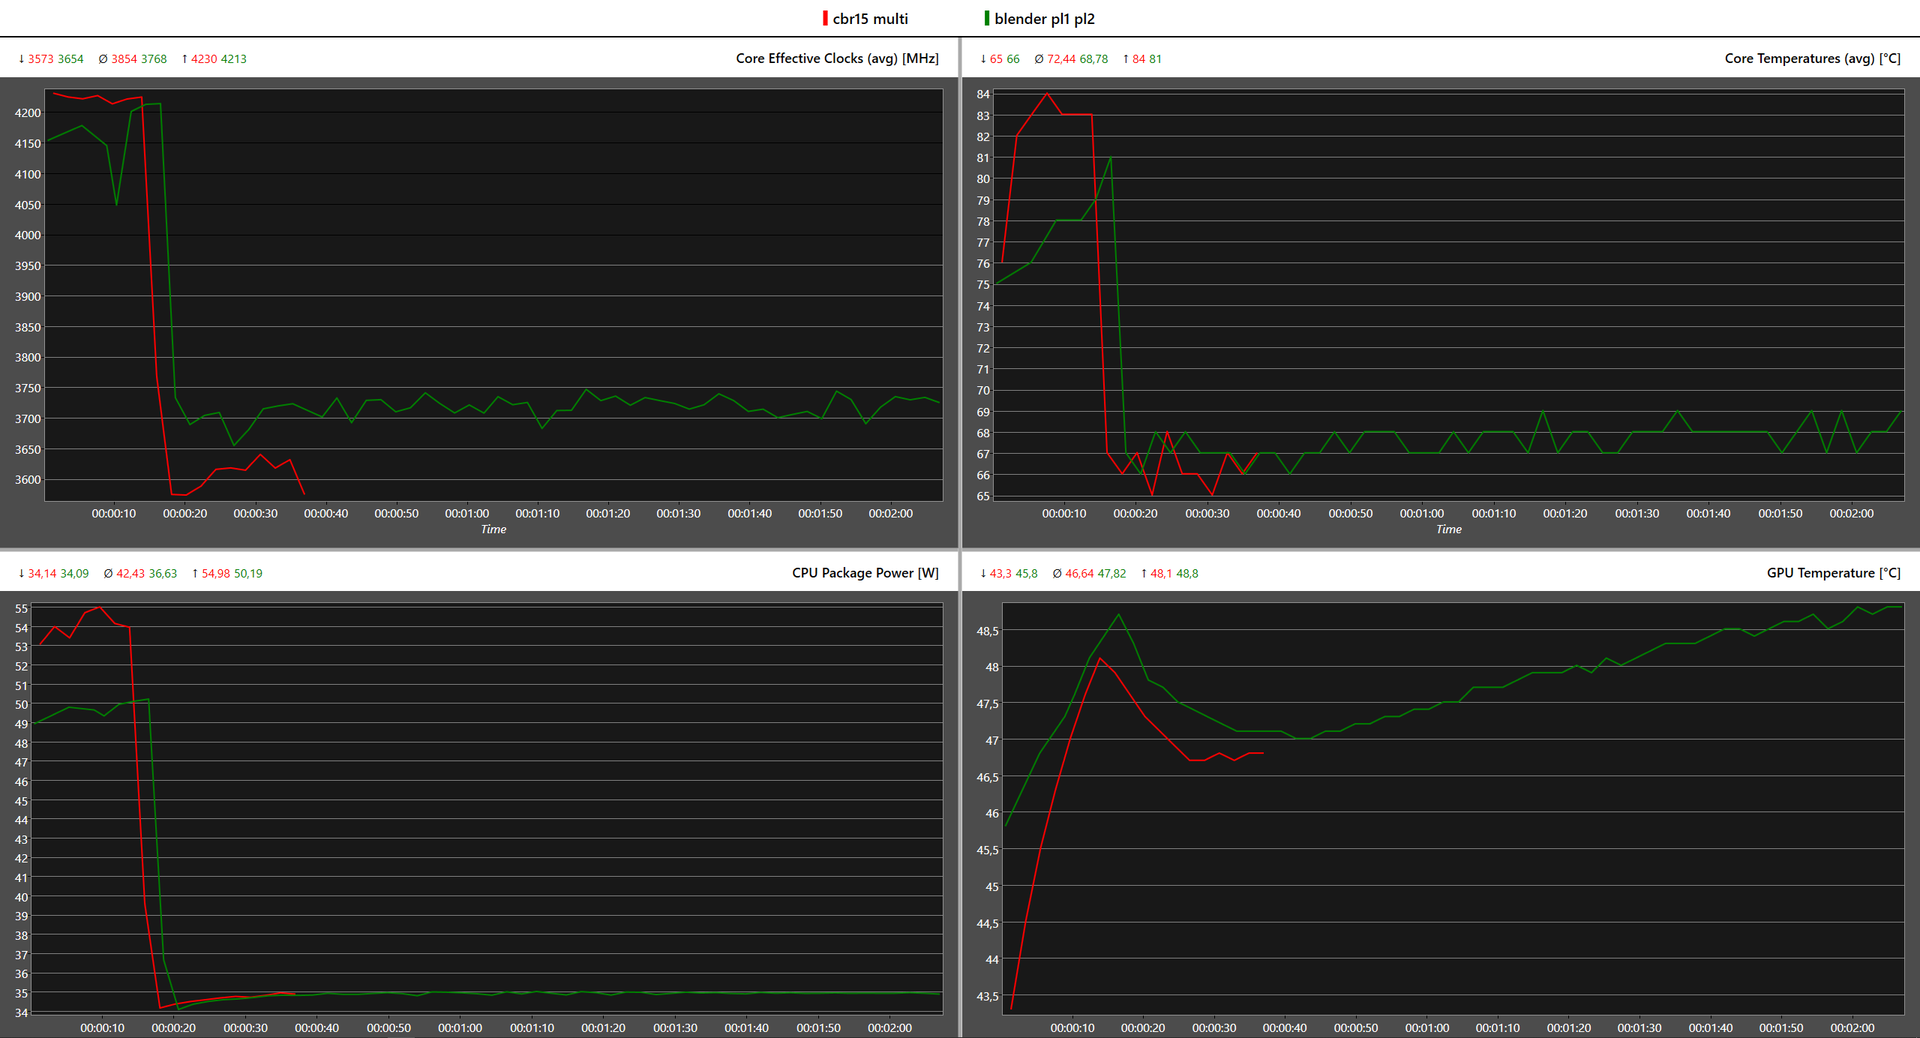
En Turbo, el procesador Intel consume inicialmente 55 vatios a 4,15 GHz. El consumo de energía cae permanentemente a los 35 vatios especificados después de menos de un minuto, por lo que el reloj base de 3,2 GHz entra en juego
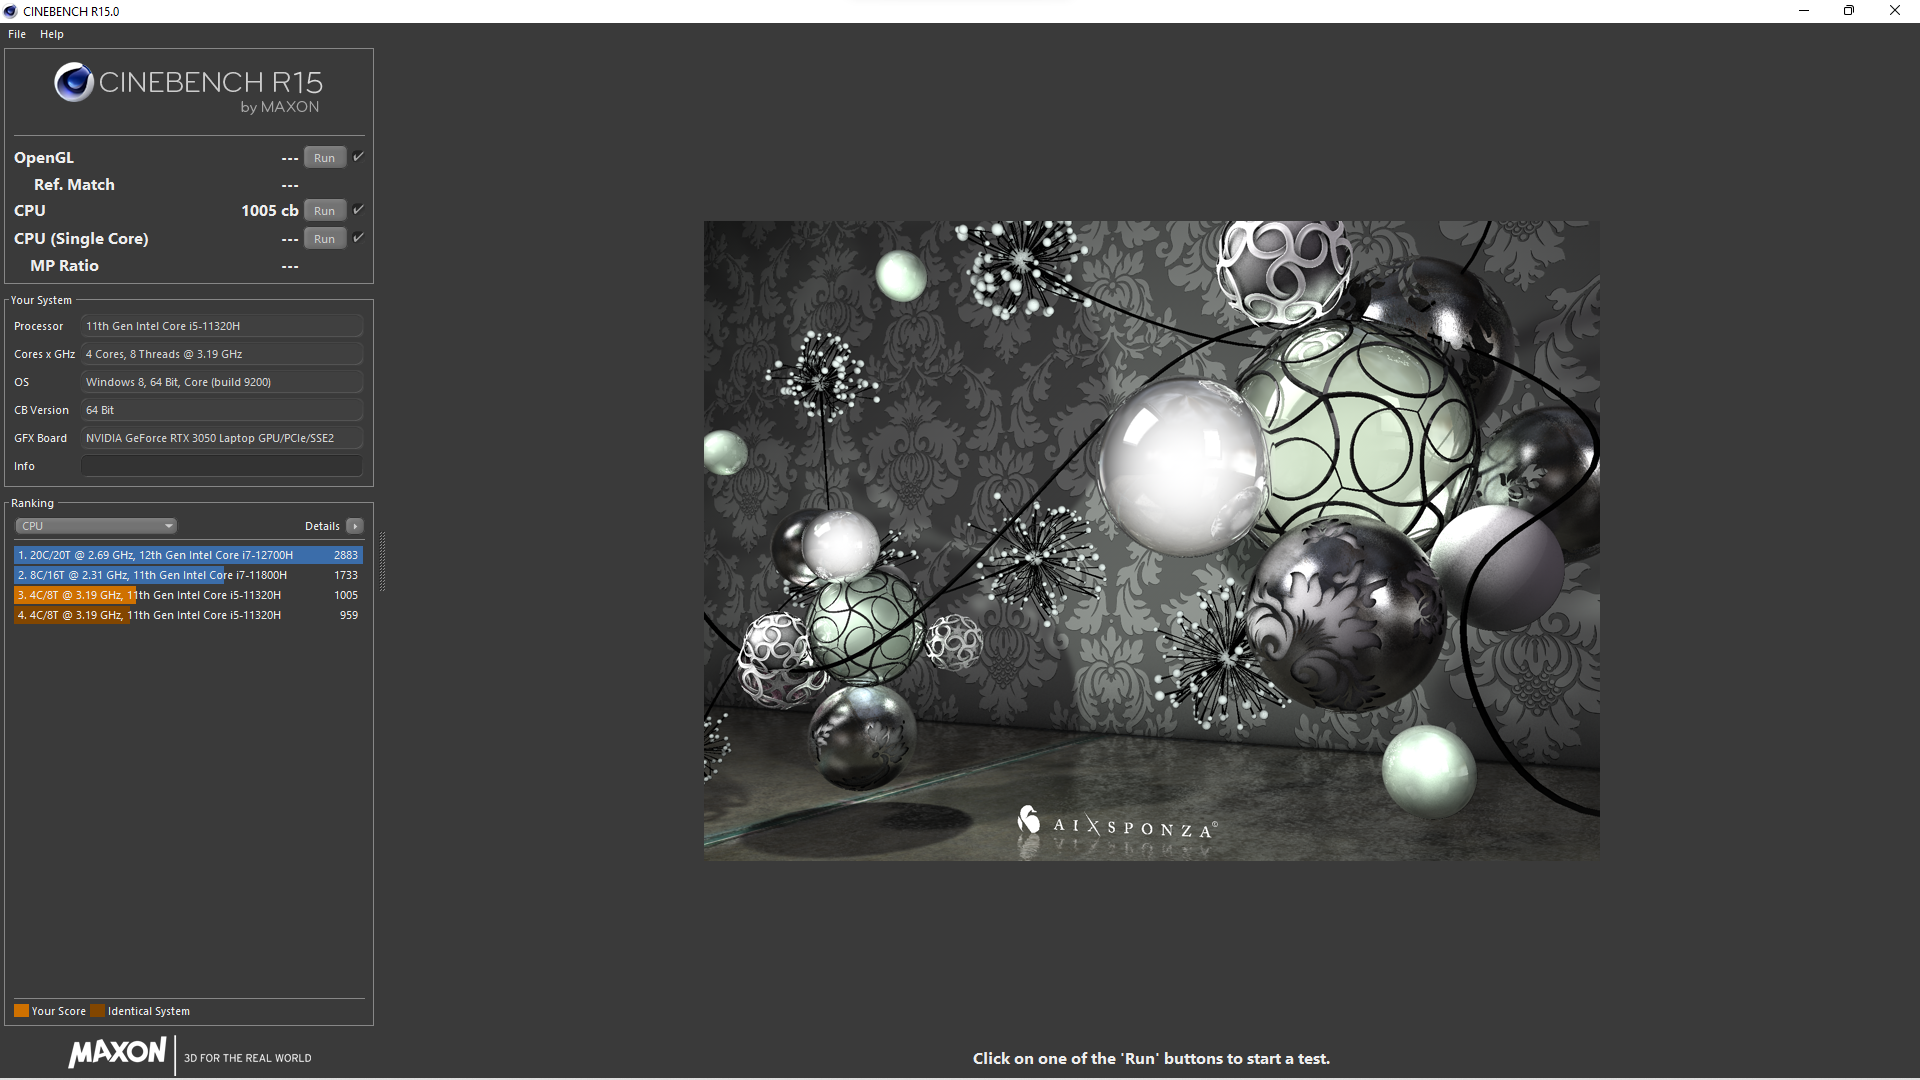
El Swift X se sitúa en la retaguardia de la comparación en términos de rendimiento. En modo batería, la CPU sigue consumiendo 25 vatios, pero el rendimiento cae en un ~25%.

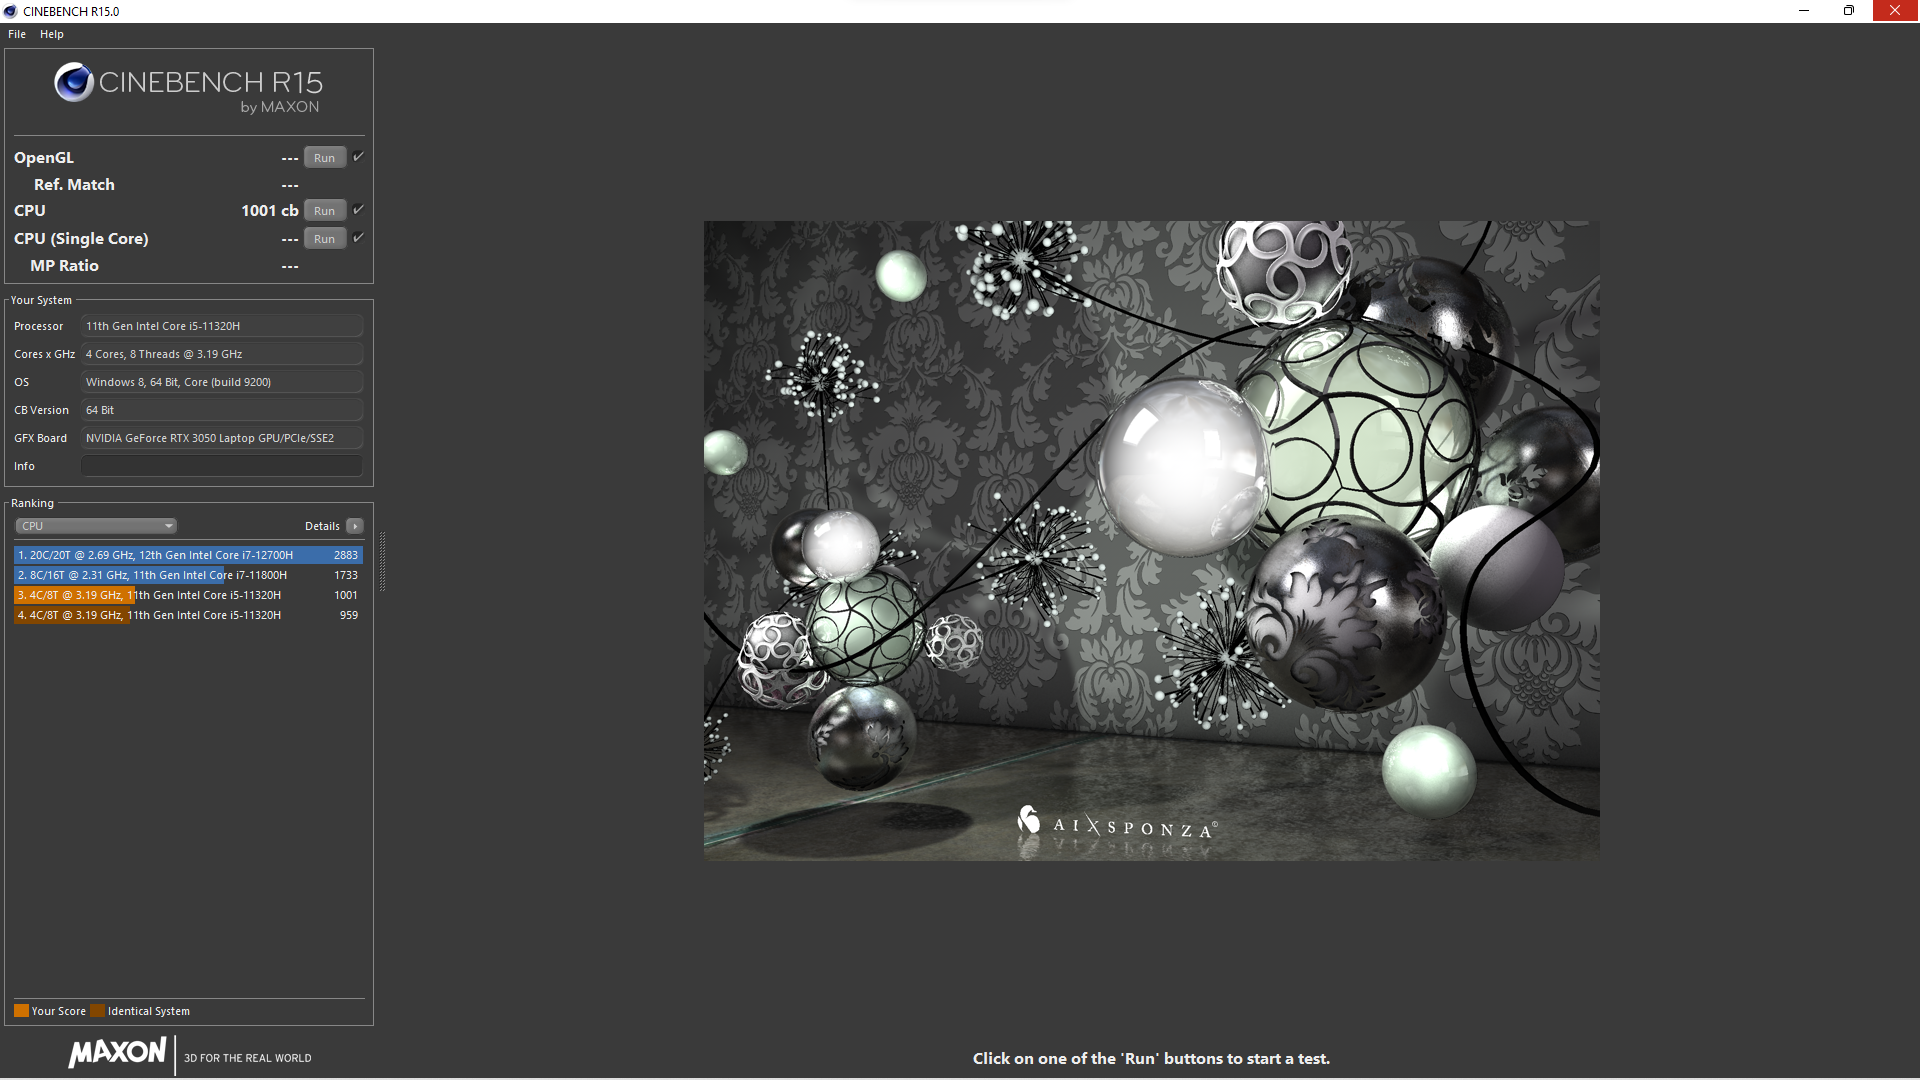
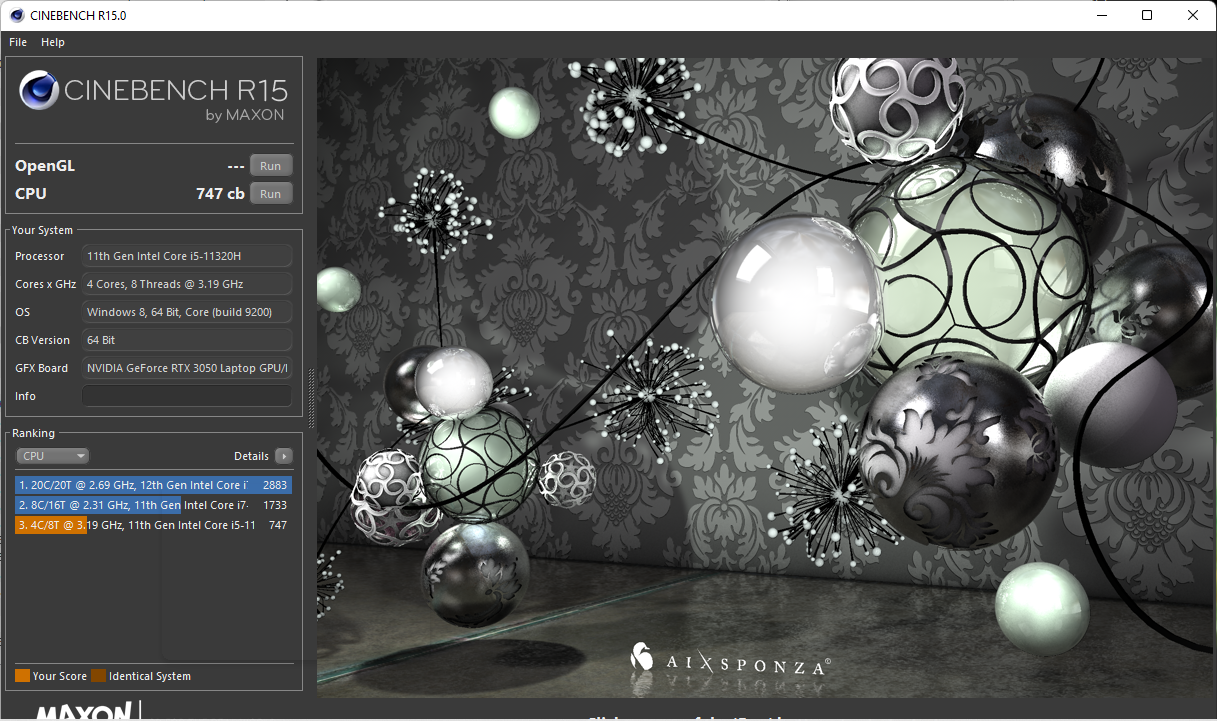
Cinebench R15 Multi Sustained Load
Cinebench R23: Multi Core | Single Core
Cinebench R20: CPU (Multi Core) | CPU (Single Core)
Cinebench R15: CPU Multi 64Bit | CPU Single 64Bit
Blender: v2.79 BMW27 CPU | v3.3 Classroom CPU | v3.3 Classroom CUDA
7-Zip 18.03: 7z b 4 | 7z b 4 -mmt1
Geekbench 5.5: Multi-Core | Single-Core | OpenCL Score
HWBOT x265 Benchmark v2.2: 4k Preset
LibreOffice : 20 Documents To PDF
R Benchmark 2.5: Overall mean
V-Ray 5 Benchmark: CPU | GPU CUDA
WebXPRT 3: Overall
WebXPRT 4: Overall
Mozilla Kraken 1.1: Total
Octane V2: Total Score
Jetstream 2: 2.0 Total
| CPU Performance rating | |
| Media de la clase Multimedia | |
| Asus Vivobook Pro 16X-M7600QE -7! | |
| Lenovo IdeaPad 5 Pro 16ACH -7! | |
| Dell Inspiron 16 Plus 7610 -8! | |
| Acer Swift 3 SF316-51 -7! | |
| Acer Swift X SFX14-41G-R7F3 -7! | |
| Acer Swift X SFX16-51G-5388 | |
| Medio Intel Core i5-11320H | |
| Cinebench R23 / Multi Core | |
| Media de la clase Multimedia (4861 - 33362, n=74, últimos 2 años) | |
| Asus Vivobook Pro 16X-M7600QE | |
| Asus Vivobook Pro 16X-M7600QE | |
| Lenovo IdeaPad 5 Pro 16ACH | |
| Dell Inspiron 16 Plus 7610 | |
| Acer Swift X SFX14-41G-R7F3 | |
| Acer Swift 3 SF316-51 | |
| Acer Swift X SFX16-51G-5388 | |
| Medio Intel Core i5-11320H (5720 - 6051, n=4) | |
| Cinebench R23 / Single Core | |
| Media de la clase Multimedia (1128 - 2459, n=66, últimos 2 años) | |
| Acer Swift 3 SF316-51 | |
| Dell Inspiron 16 Plus 7610 | |
| Asus Vivobook Pro 16X-M7600QE | |
| Asus Vivobook Pro 16X-M7600QE | |
| Medio Intel Core i5-11320H (1341 - 1467, n=4) | |
| Lenovo IdeaPad 5 Pro 16ACH | |
| Acer Swift X SFX16-51G-5388 | |
| Acer Swift X SFX14-41G-R7F3 | |
| Cinebench R20 / CPU (Multi Core) | |
| Media de la clase Multimedia (1887 - 12912, n=57, últimos 2 años) | |
| Asus Vivobook Pro 16X-M7600QE | |
| Asus Vivobook Pro 16X-M7600QE | |
| Lenovo IdeaPad 5 Pro 16ACH | |
| Dell Inspiron 16 Plus 7610 | |
| Acer Swift X SFX14-41G-R7F3 | |
| Acer Swift X SFX16-51G-5388 | |
| Acer Swift 3 SF316-51 | |
| Medio Intel Core i5-11320H (2208 - 2349, n=4) | |
| Cinebench R20 / CPU (Single Core) | |
| Media de la clase Multimedia (425 - 853, n=57, últimos 2 años) | |
| Acer Swift 3 SF316-51 | |
| Dell Inspiron 16 Plus 7610 | |
| Asus Vivobook Pro 16X-M7600QE | |
| Asus Vivobook Pro 16X-M7600QE | |
| Medio Intel Core i5-11320H (557 - 567, n=4) | |
| Acer Swift X SFX16-51G-5388 | |
| Lenovo IdeaPad 5 Pro 16ACH | |
| Acer Swift X SFX14-41G-R7F3 | |
| Cinebench R15 / CPU Multi 64Bit | |
| Media de la clase Multimedia (856 - 5224, n=61, últimos 2 años) | |
| Asus Vivobook Pro 16X-M7600QE | |
| Asus Vivobook Pro 16X-M7600QE | |
| Lenovo IdeaPad 5 Pro 16ACH | |
| Dell Inspiron 16 Plus 7610 | |
| Acer Swift X SFX14-41G-R7F3 | |
| Acer Swift X SFX16-51G-5388 | |
| Acer Swift 3 SF316-51 | |
| Medio Intel Core i5-11320H (857 - 1019, n=4) | |
| Cinebench R15 / CPU Single 64Bit | |
| Media de la clase Multimedia (184.8 - 326, n=59, últimos 2 años) | |
| Asus Vivobook Pro 16X-M7600QE | |
| Asus Vivobook Pro 16X-M7600QE | |
| Acer Swift 3 SF316-51 | |
| Dell Inspiron 16 Plus 7610 | |
| Lenovo IdeaPad 5 Pro 16ACH | |
| Acer Swift X SFX16-51G-5388 | |
| Medio Intel Core i5-11320H (212 - 215, n=4) | |
| Acer Swift X SFX14-41G-R7F3 | |
| Blender / v2.79 BMW27 CPU | |
| Medio Intel Core i5-11320H (507 - 543, n=4) | |
| Acer Swift 3 SF316-51 | |
| Acer Swift X SFX16-51G-5388 | |
| Acer Swift X SFX14-41G-R7F3 | |
| Dell Inspiron 16 Plus 7610 | |
| Lenovo IdeaPad 5 Pro 16ACH | |
| Asus Vivobook Pro 16X-M7600QE | |
| Asus Vivobook Pro 16X-M7600QE | |
| Media de la clase Multimedia (100 - 557, n=58, últimos 2 años) | |
| Blender / v3.3 Classroom CPU | |
| Medio Intel Core i5-11320H (937 - 1010, n=3) | |
| Acer Swift X SFX16-51G-5388 | |
| Media de la clase Multimedia (134.5 - 1042, n=62, últimos 2 años) | |
| Blender / v3.3 Classroom CUDA | |
| Acer Swift X SFX16-51G-5388 | |
| Medio Intel Core i5-11320H (n=1) | |
| Media de la clase Multimedia (20 - 186, n=22, últimos 2 años) | |
| 7-Zip 18.03 / 7z b 4 | |
| Asus Vivobook Pro 16X-M7600QE | |
| Asus Vivobook Pro 16X-M7600QE | |
| Media de la clase Multimedia (26062 - 130368, n=55, últimos 2 años) | |
| Lenovo IdeaPad 5 Pro 16ACH | |
| Dell Inspiron 16 Plus 7610 | |
| Acer Swift X SFX14-41G-R7F3 | |
| Acer Swift 3 SF316-51 | |
| Medio Intel Core i5-11320H (24718 - 26858, n=4) | |
| Acer Swift X SFX16-51G-5388 | |
| 7-Zip 18.03 / 7z b 4 -mmt1 | |
| Media de la clase Multimedia (3666 - 7545, n=56, últimos 2 años) | |
| Asus Vivobook Pro 16X-M7600QE | |
| Asus Vivobook Pro 16X-M7600QE | |
| Dell Inspiron 16 Plus 7610 | |
| Acer Swift 3 SF316-51 | |
| Lenovo IdeaPad 5 Pro 16ACH | |
| Medio Intel Core i5-11320H (4813 - 5119, n=4) | |
| Acer Swift X SFX16-51G-5388 | |
| Acer Swift X SFX14-41G-R7F3 | |
| Geekbench 5.5 / Multi-Core | |
| Media de la clase Multimedia (4652 - 20422, n=56, últimos 2 años) | |
| Asus Vivobook Pro 16X-M7600QE | |
| Asus Vivobook Pro 16X-M7600QE | |
| Lenovo IdeaPad 5 Pro 16ACH | |
| Acer Swift 3 SF316-51 | |
| Acer Swift X SFX16-51G-5388 | |
| Acer Swift X SFX14-41G-R7F3 | |
| Medio Intel Core i5-11320H (4927 - 5955, n=4) | |
| Geekbench 5.5 / Single-Core | |
| Media de la clase Multimedia (805 - 2974, n=56, últimos 2 años) | |
| Acer Swift 3 SF316-51 | |
| Asus Vivobook Pro 16X-M7600QE | |
| Asus Vivobook Pro 16X-M7600QE | |
| Medio Intel Core i5-11320H (1453 - 1523, n=4) | |
| Acer Swift X SFX16-51G-5388 | |
| Lenovo IdeaPad 5 Pro 16ACH | |
| Acer Swift X SFX14-41G-R7F3 | |
| Geekbench 5.5 / OpenCL Score | |
| Media de la clase Multimedia (11562 - 217159, n=56, últimos 2 años) | |
| Asus Vivobook Pro 16X-M7600QE | |
| Asus Vivobook Pro 16X-M7600QE | |
| Acer Swift X SFX16-51G-5388 | |
| Lenovo IdeaPad 5 Pro 16ACH | |
| Acer Swift X SFX14-41G-R7F3 | |
| Medio Intel Core i5-11320H (17641 - 50997, n=4) | |
| Acer Swift 3 SF316-51 | |
| HWBOT x265 Benchmark v2.2 / 4k Preset | |
| Media de la clase Multimedia (5.26 - 36.1, n=56, últimos 2 años) | |
| Asus Vivobook Pro 16X-M7600QE | |
| Asus Vivobook Pro 16X-M7600QE | |
| Lenovo IdeaPad 5 Pro 16ACH | |
| Dell Inspiron 16 Plus 7610 | |
| Acer Swift X SFX14-41G-R7F3 | |
| Acer Swift X SFX16-51G-5388 | |
| Acer Swift 3 SF316-51 | |
| Medio Intel Core i5-11320H (7.25 - 7.91, n=4) | |
| LibreOffice / 20 Documents To PDF | |
| Asus Vivobook Pro 16X-M7600QE | |
| Asus Vivobook Pro 16X-M7600QE | |
| Acer Swift X SFX16-51G-5388 | |
| Media de la clase Multimedia (23.9 - 146.7, n=57, últimos 2 años) | |
| Medio Intel Core i5-11320H (44 - 50, n=4) | |
| Lenovo IdeaPad 5 Pro 16ACH | |
| Dell Inspiron 16 Plus 7610 | |
| Acer Swift 3 SF316-51 | |
| R Benchmark 2.5 / Overall mean | |
| Acer Swift X SFX14-41G-R7F3 | |
| Medio Intel Core i5-11320H (0.581 - 0.622, n=4) | |
| Acer Swift X SFX16-51G-5388 | |
| Dell Inspiron 16 Plus 7610 | |
| Acer Swift 3 SF316-51 | |
| Lenovo IdeaPad 5 Pro 16ACH | |
| Asus Vivobook Pro 16X-M7600QE | |
| Asus Vivobook Pro 16X-M7600QE | |
| Media de la clase Multimedia (0.3604 - 0.947, n=56, últimos 2 años) | |
| V-Ray 5 Benchmark / CPU | |
| Media de la clase Multimedia (3126 - 14552, n=24, últimos 2 años) | |
| Dell Inspiron 16 Plus 7610 | |
| Acer Swift X SFX16-51G-5388 | |
| Medio Intel Core i5-11320H (3985 - 4415, n=4) | |
| V-Ray 5 Benchmark / GPU CUDA | |
| Media de la clase Multimedia (335 - 1482, n=5, últimos 2 años) | |
| Acer Swift X SFX16-51G-5388 | |
| Medio Intel Core i5-11320H (99 - 374, n=2) | |
| WebXPRT 3 / Overall | |
| Media de la clase Multimedia (136.4 - 596, n=63, últimos 2 años) | |
| Asus Vivobook Pro 16X-M7600QE | |
| Lenovo IdeaPad 5 Pro 16ACH | |
| Acer Swift 3 SF316-51 | |
| Medio Intel Core i5-11320H (243 - 269, n=4) | |
| Dell Inspiron 16 Plus 7610 | |
| Acer Swift X SFX16-51G-5388 | |
| Acer Swift X SFX14-41G-R7F3 | |
| WebXPRT 4 / Overall | |
| Media de la clase Multimedia (167.3 - 402, n=65, últimos 2 años) | |
| Medio Intel Core i5-11320H (202 - 206, n=3) | |
| Acer Swift X SFX16-51G-5388 | |
| Mozilla Kraken 1.1 / Total | |
| Acer Swift X SFX14-41G-R7F3 | |
| Acer Swift X SFX16-51G-5388 | |
| Medio Intel Core i5-11320H (662 - 680, n=4) | |
| Lenovo IdeaPad 5 Pro 16ACH | |
| Dell Inspiron 16 Plus 7610 | |
| Acer Swift 3 SF316-51 | |
| Asus Vivobook Pro 16X-M7600QE | |
| Asus Vivobook Pro 16X-M7600QE | |
| Media de la clase Multimedia (228 - 835, n=66, últimos 2 años) | |
| Octane V2 / Total Score | |
| Media de la clase Multimedia (64079 - 153175, n=30, últimos 2 años) | |
| Acer Swift X SFX16-51G-5388 | |
| Medio Intel Core i5-11320H (n=1) | |
| Acer Swift X SFX14-41G-R7F3 | |
| Jetstream 2 / 2.0 Total | |
| Media de la clase Multimedia (287 - 481, n=31, últimos 2 años) | |
| Acer Swift X SFX16-51G-5388 | |
| Medio Intel Core i5-11320H (174.3 - 208, n=3) | |
| Dell Inspiron 16 Plus 7610 | |
* ... más pequeño es mejor
AIDA64: FP32 Ray-Trace | FPU Julia | CPU SHA3 | CPU Queen | FPU SinJulia | FPU Mandel | CPU AES | CPU ZLib | FP64 Ray-Trace | CPU PhotoWorxx
| Performance rating | |
| Media de la clase Multimedia | |
| Asus Vivobook Pro 16X-M7600QE | |
| Lenovo IdeaPad 5 Pro 16ACH | |
| Acer Swift X SFX14-41G-R7F3 | |
| Medio Intel Core i5-11320H | |
| Acer Swift X SFX16-51G-5388 | |
| Dell Inspiron 16 Plus 7610 -9! | |
| AIDA64 / FP32 Ray-Trace | |
| Media de la clase Multimedia (2214 - 50388, n=53, últimos 2 años) | |
| Asus Vivobook Pro 16X-M7600QE | |
| Asus Vivobook Pro 16X-M7600QE | |
| Lenovo IdeaPad 5 Pro 16ACH | |
| Acer Swift X SFX14-41G-R7F3 | |
| Medio Intel Core i5-11320H (6369 - 7489, n=4) | |
| Acer Swift X SFX16-51G-5388 | |
| AIDA64 / FPU Julia | |
| Asus Vivobook Pro 16X-M7600QE | |
| Asus Vivobook Pro 16X-M7600QE | |
| Lenovo IdeaPad 5 Pro 16ACH | |
| Media de la clase Multimedia (12867 - 201874, n=54, últimos 2 años) | |
| Acer Swift X SFX14-41G-R7F3 | |
| Medio Intel Core i5-11320H (27391 - 31637, n=4) | |
| Acer Swift X SFX16-51G-5388 | |
| AIDA64 / CPU SHA3 | |
| Media de la clase Multimedia (626 - 8623, n=54, últimos 2 años) | |
| Asus Vivobook Pro 16X-M7600QE | |
| Asus Vivobook Pro 16X-M7600QE | |
| Lenovo IdeaPad 5 Pro 16ACH | |
| Medio Intel Core i5-11320H (1847 - 2099, n=4) | |
| Acer Swift X SFX16-51G-5388 | |
| Acer Swift X SFX14-41G-R7F3 | |
| AIDA64 / CPU Queen | |
| Asus Vivobook Pro 16X-M7600QE | |
| Asus Vivobook Pro 16X-M7600QE | |
| Lenovo IdeaPad 5 Pro 16ACH | |
| Media de la clase Multimedia (13483 - 181505, n=41, últimos 2 años) | |
| Acer Swift X SFX14-41G-R7F3 | |
| Medio Intel Core i5-11320H (43565 - 52477, n=4) | |
| Acer Swift X SFX16-51G-5388 | |
| AIDA64 / FPU SinJulia | |
| Asus Vivobook Pro 16X-M7600QE | |
| Asus Vivobook Pro 16X-M7600QE | |
| Lenovo IdeaPad 5 Pro 16ACH | |
| Acer Swift X SFX14-41G-R7F3 | |
| Media de la clase Multimedia (886 - 28794, n=54, últimos 2 años) | |
| Medio Intel Core i5-11320H (4381 - 5011, n=4) | |
| Acer Swift X SFX16-51G-5388 | |
| AIDA64 / FPU Mandel | |
| Asus Vivobook Pro 16X-M7600QE | |
| Asus Vivobook Pro 16X-M7600QE | |
| Lenovo IdeaPad 5 Pro 16ACH | |
| Media de la clase Multimedia (6395 - 105740, n=53, últimos 2 años) | |
| Acer Swift X SFX14-41G-R7F3 | |
| Medio Intel Core i5-11320H (16659 - 18770, n=4) | |
| Acer Swift X SFX16-51G-5388 | |
| AIDA64 / CPU AES | |
| Asus Vivobook Pro 16X-M7600QE | |
| Asus Vivobook Pro 16X-M7600QE | |
| Lenovo IdeaPad 5 Pro 16ACH | |
| Medio Intel Core i5-11320H (59851 - 76500, n=4) | |
| Media de la clase Multimedia (8171 - 126790, n=54, últimos 2 años) | |
| Acer Swift X SFX16-51G-5388 | |
| Acer Swift X SFX14-41G-R7F3 | |
| AIDA64 / CPU ZLib | |
| Media de la clase Multimedia (143.8 - 2022, n=54, últimos 2 años) | |
| Asus Vivobook Pro 16X-M7600QE | |
| Asus Vivobook Pro 16X-M7600QE | |
| Lenovo IdeaPad 5 Pro 16ACH | |
| Acer Swift X SFX14-41G-R7F3 | |
| Medio Intel Core i5-11320H (330 - 410, n=4) | |
| Acer Swift X SFX16-51G-5388 | |
| Dell Inspiron 16 Plus 7610 | |
| AIDA64 / FP64 Ray-Trace | |
| Media de la clase Multimedia (1014 - 26875, n=54, últimos 2 años) | |
| Asus Vivobook Pro 16X-M7600QE | |
| Asus Vivobook Pro 16X-M7600QE | |
| Lenovo IdeaPad 5 Pro 16ACH | |
| Acer Swift X SFX14-41G-R7F3 | |
| Medio Intel Core i5-11320H (3536 - 4021, n=4) | |
| Acer Swift X SFX16-51G-5388 | |
| AIDA64 / CPU PhotoWorxx | |
| Media de la clase Multimedia (8187 - 88154, n=54, últimos 2 años) | |
| Acer Swift X SFX16-51G-5388 | |
| Medio Intel Core i5-11320H (25964 - 36644, n=4) | |
| Asus Vivobook Pro 16X-M7600QE | |
| Asus Vivobook Pro 16X-M7600QE | |
| Acer Swift X SFX14-41G-R7F3 | |
| Lenovo IdeaPad 5 Pro 16ACH | |
Rendimiento del sistema
El sistema funciona muy rápidamente y sin lags, incluso mientras se trabaja con múltiples pestañas y se reproduce un vídeo 4K de YouTube en segundo plano.
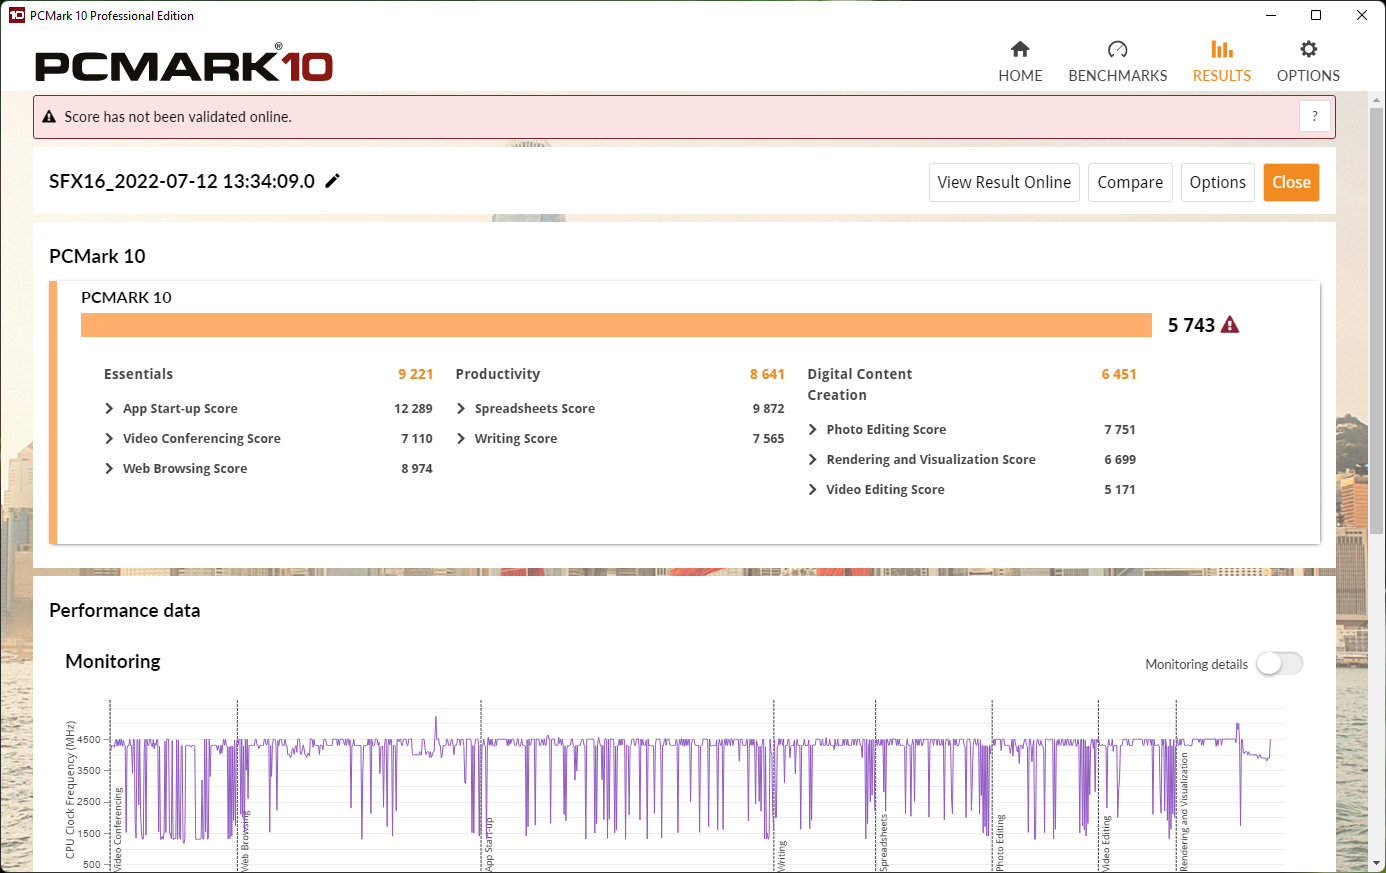
Las puntuaciones PCMark 10 son relativamente cercanas en nuestro campo de comparación. El Acer Swift X destaca más en términos de puntuación AIDA64/memoria, probablemente debido a su rápida RAM LPDDR4X.
CrossMark: Overall | Productivity | Creativity | Responsiveness
| PCMark 10 / Score | |
| Media de la clase Multimedia (4325 - 10386, n=52, últimos 2 años) | |
| Asus Vivobook Pro 16X-M7600QE | |
| Dell Inspiron 16 Plus 7610 | |
| Lenovo IdeaPad 5 Pro 16ACH | |
| Acer Swift X SFX16-51G-5388 | |
| Medio Intel Core i5-11320H, NVIDIA GeForce RTX 3050 4GB Laptop GPU (n=1) | |
| Acer Swift 3 SF316-51 | |
| Acer Swift X SFX14-41G-R7F3 | |
| PCMark 10 / Essentials | |
| Media de la clase Multimedia (8025 - 11664, n=51, últimos 2 años) | |
| Asus Vivobook Pro 16X-M7600QE | |
| Acer Swift 3 SF316-51 | |
| Lenovo IdeaPad 5 Pro 16ACH | |
| Dell Inspiron 16 Plus 7610 | |
| Acer Swift X SFX16-51G-5388 | |
| Medio Intel Core i5-11320H, NVIDIA GeForce RTX 3050 4GB Laptop GPU (n=1) | |
| Acer Swift X SFX14-41G-R7F3 | |
| PCMark 10 / Productivity | |
| Media de la clase Multimedia (7323 - 18233, n=51, últimos 2 años) | |
| Asus Vivobook Pro 16X-M7600QE | |
| Acer Swift X SFX16-51G-5388 | |
| Medio Intel Core i5-11320H, NVIDIA GeForce RTX 3050 4GB Laptop GPU (n=1) | |
| Dell Inspiron 16 Plus 7610 | |
| Lenovo IdeaPad 5 Pro 16ACH | |
| Acer Swift 3 SF316-51 | |
| Acer Swift X SFX14-41G-R7F3 | |
| PCMark 10 / Digital Content Creation | |
| Media de la clase Multimedia (3651 - 16240, n=51, últimos 2 años) | |
| Dell Inspiron 16 Plus 7610 | |
| Asus Vivobook Pro 16X-M7600QE | |
| Lenovo IdeaPad 5 Pro 16ACH | |
| Acer Swift X SFX16-51G-5388 | |
| Medio Intel Core i5-11320H, NVIDIA GeForce RTX 3050 4GB Laptop GPU (n=1) | |
| Acer Swift 3 SF316-51 | |
| Acer Swift X SFX14-41G-R7F3 | |
| CrossMark / Overall | |
| Media de la clase Multimedia (866 - 2728, n=60, últimos 2 años) | |
| Acer Swift X SFX16-51G-5388 | |
| Medio Intel Core i5-11320H, NVIDIA GeForce RTX 3050 4GB Laptop GPU (n=1) | |
| Acer Swift X SFX14-41G-R7F3 | |
| CrossMark / Productivity | |
| Media de la clase Multimedia (931 - 2489, n=60, últimos 2 años) | |
| Acer Swift X SFX16-51G-5388 | |
| Medio Intel Core i5-11320H, NVIDIA GeForce RTX 3050 4GB Laptop GPU (n=1) | |
| Acer Swift X SFX14-41G-R7F3 | |
| CrossMark / Creativity | |
| Media de la clase Multimedia (907 - 3465, n=60, últimos 2 años) | |
| Acer Swift X SFX16-51G-5388 | |
| Medio Intel Core i5-11320H, NVIDIA GeForce RTX 3050 4GB Laptop GPU (n=1) | |
| Acer Swift X SFX14-41G-R7F3 | |
| CrossMark / Responsiveness | |
| Media de la clase Multimedia (605 - 2024, n=60, últimos 2 años) | |
| Acer Swift X SFX16-51G-5388 | |
| Medio Intel Core i5-11320H, NVIDIA GeForce RTX 3050 4GB Laptop GPU (n=1) | |
| Acer Swift X SFX14-41G-R7F3 | |
| PCMark 10 Score | 5743 puntos | |
ayuda | ||
| AIDA64 / Memory Copy | |
| Media de la clase Multimedia (11299 - 132135, n=54, últimos 2 años) | |
| Acer Swift X SFX16-51G-5388 | |
| Medio Intel Core i5-11320H (41106 - 55961, n=4) | |
| Lenovo IdeaPad 5 Pro 16ACH | |
| Huawei MateBook 16 R7 5800H | |
| Acer Swift X SFX14-41G-R7F3 | |
| AIDA64 / Memory Read | |
| Media de la clase Multimedia (11624 - 174586, n=54, últimos 2 años) | |
| Acer Swift X SFX16-51G-5388 | |
| Medio Intel Core i5-11320H (46516 - 52799, n=4) | |
| Acer Swift X SFX14-41G-R7F3 | |
| Lenovo IdeaPad 5 Pro 16ACH | |
| Huawei MateBook 16 R7 5800H | |
| AIDA64 / Memory Write | |
| Media de la clase Multimedia (11755 - 134998, n=54, últimos 2 años) | |
| Acer Swift X SFX16-51G-5388 | |
| Medio Intel Core i5-11320H (46760 - 63323, n=4) | |
| Acer Swift X SFX14-41G-R7F3 | |
| Huawei MateBook 16 R7 5800H | |
| Lenovo IdeaPad 5 Pro 16ACH | |
| AIDA64 / Memory Latency | |
| Media de la clase Multimedia (7 - 535, n=53, últimos 2 años) | |
| Acer Swift X SFX14-41G-R7F3 | |
| Acer Swift X SFX16-51G-5388 | |
| Medio Intel Core i5-11320H (77.6 - 114.1, n=4) | |
| Huawei MateBook 16 R7 5800H | |
| Lenovo IdeaPad 5 Pro 16ACH | |
| Dell Inspiron 16 Plus 7610 | |
* ... más pequeño es mejor
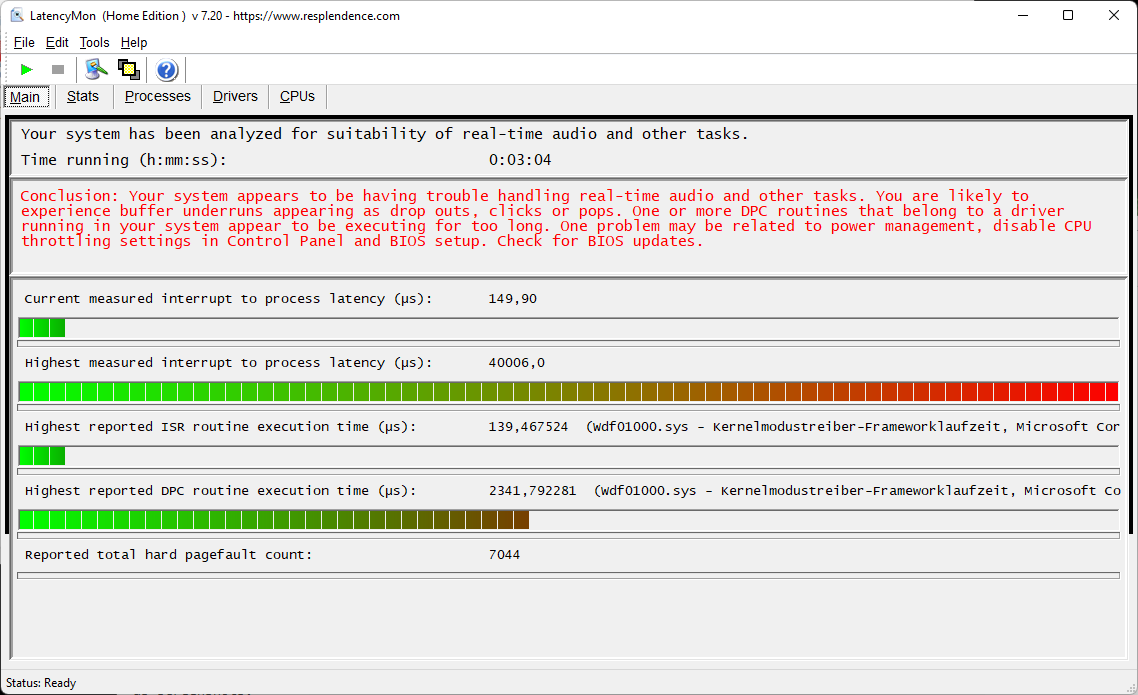
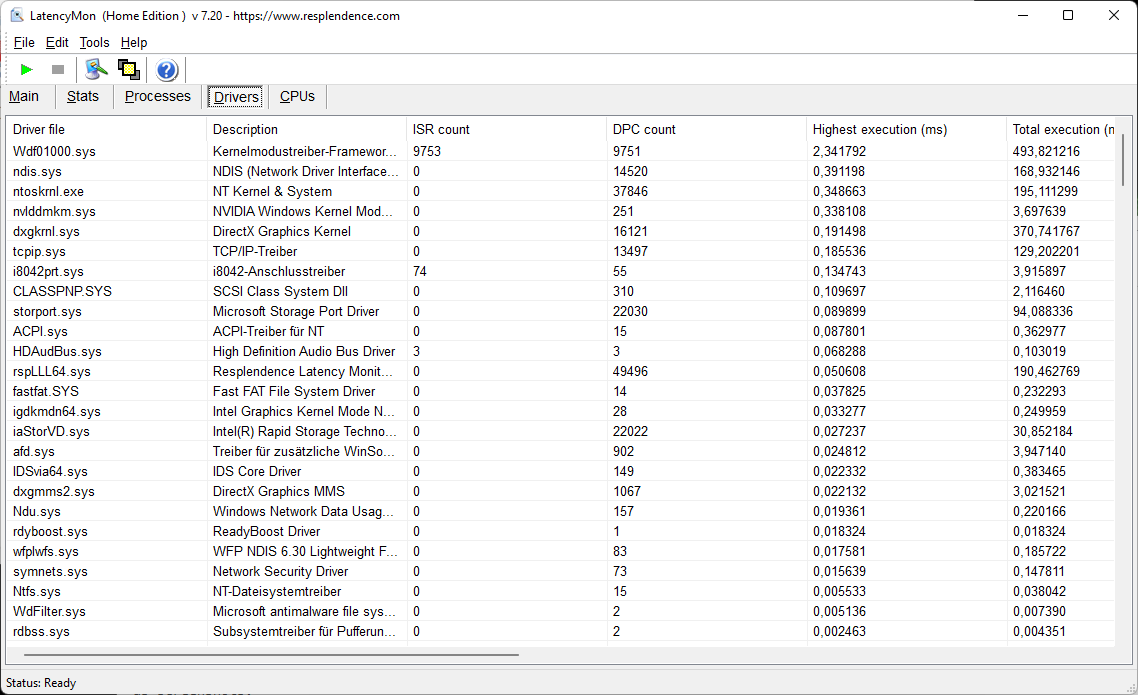
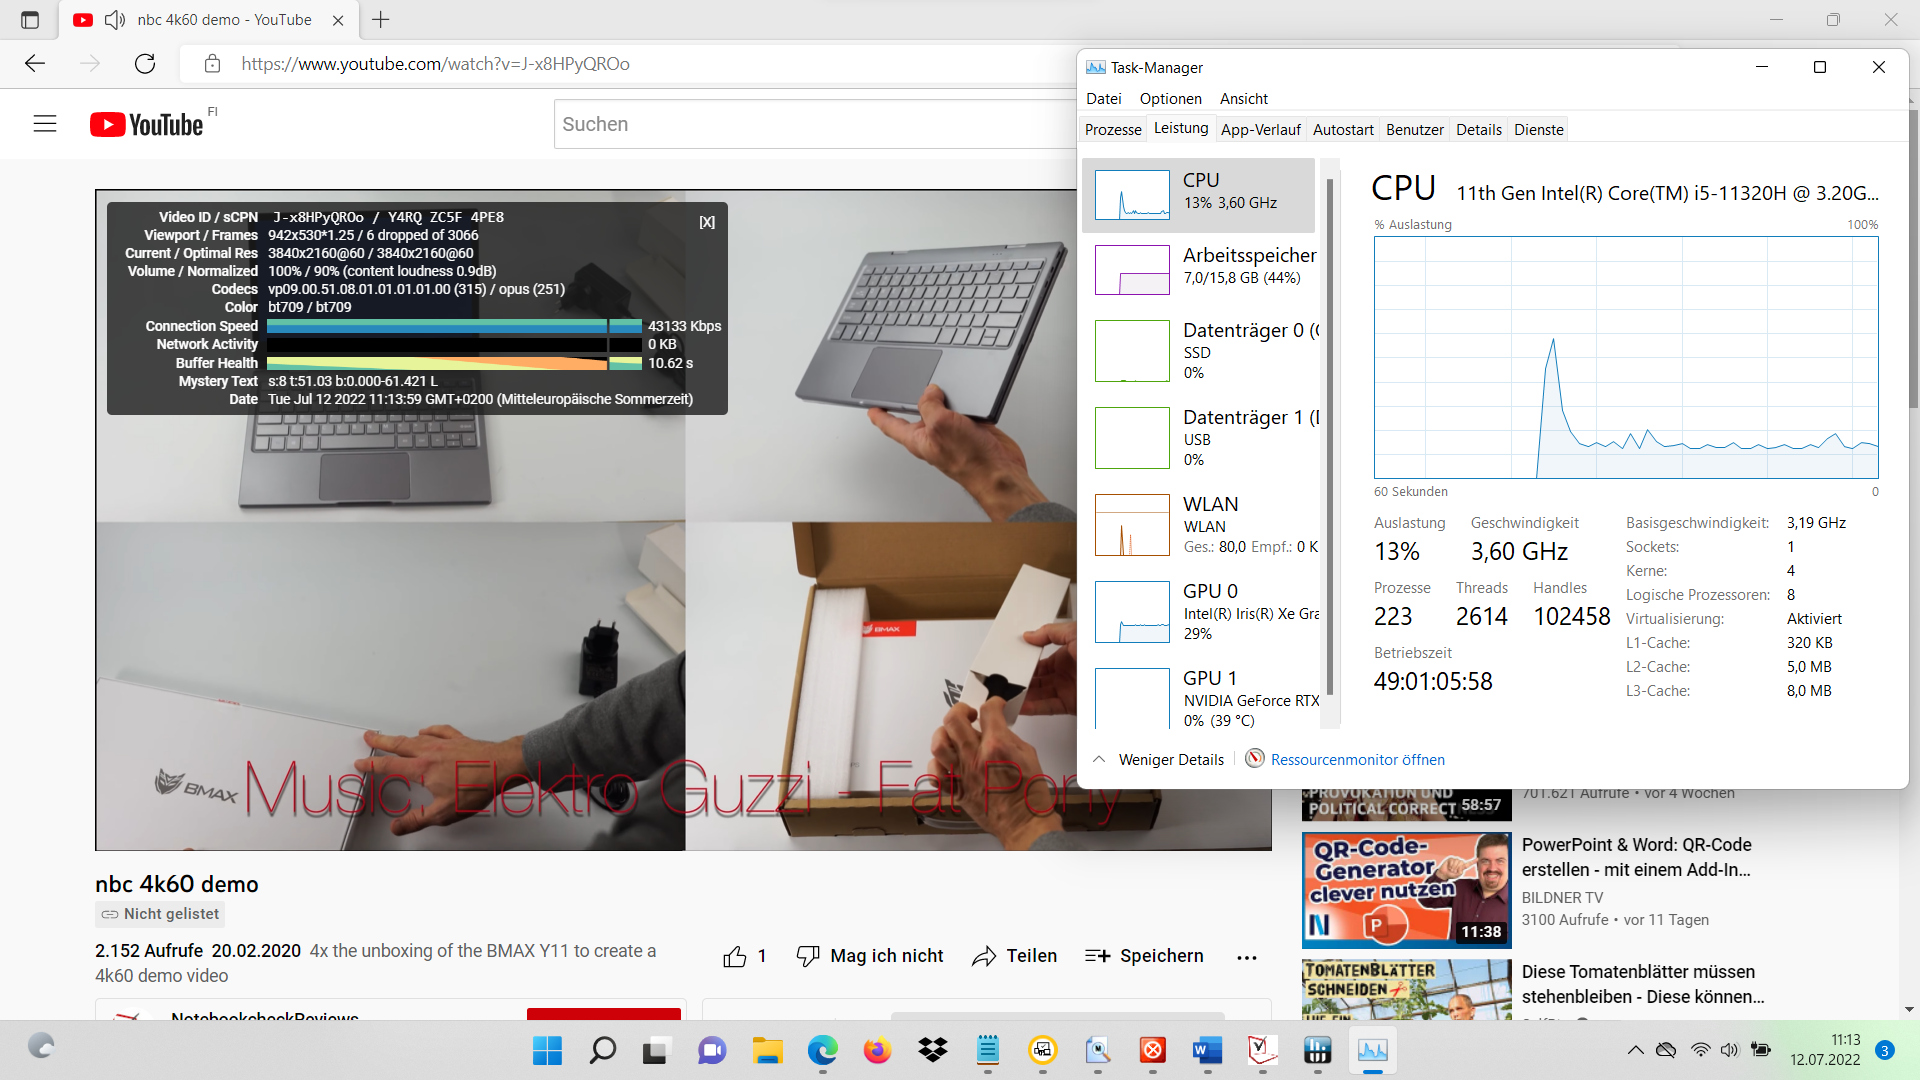
Latencia del CPD
Las latencias del DPC son sorprendentemente altas, por lo que repetimos la prueba varias veces, pero con resultados muy similares: 0.04 segundos de retardo es muy lento, por lo que no se recomiendan las aplicaciones en tiempo real (audio/vídeo). Acer debería mejorar esto urgentemente con una actualización de la BIOS.
Como suele ocurrir, la causa es el controlador del módulo central. la reproducción de YouTube en 4K causa una carga de la CPU del 13% y casi el 30% para la GPU Intel.
| DPC Latencies / LatencyMon - interrupt to process latency (max), Web, Youtube, Prime95 | |
| Acer Swift X SFX16-51G-5388 | |
| Asus Vivobook Pro 16X-M7600QE | |
| Dell Inspiron 16 Plus 7610 | |
| Acer Swift X SFX14-41G-R7F3 | |
| Lenovo IdeaPad 5 Pro 16ACH | |
| Huawei MateBook 16 R7 5800H | |
| Acer Swift 3 SF316-51 | |
* ... más pequeño es mejor
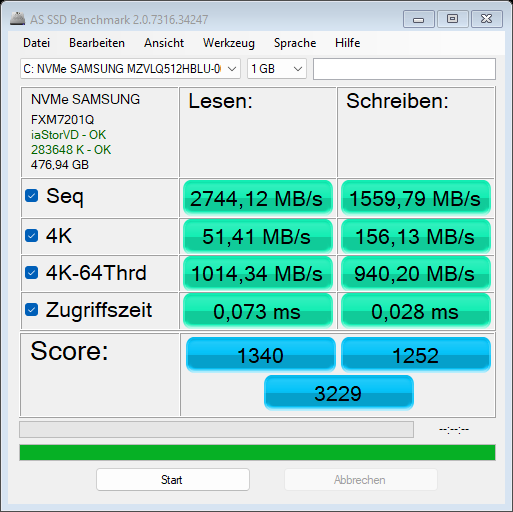
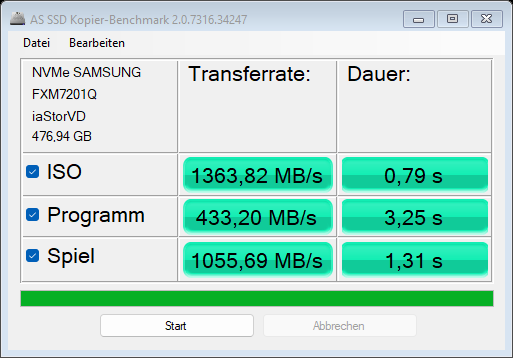
Dispositivos de almacenamiento
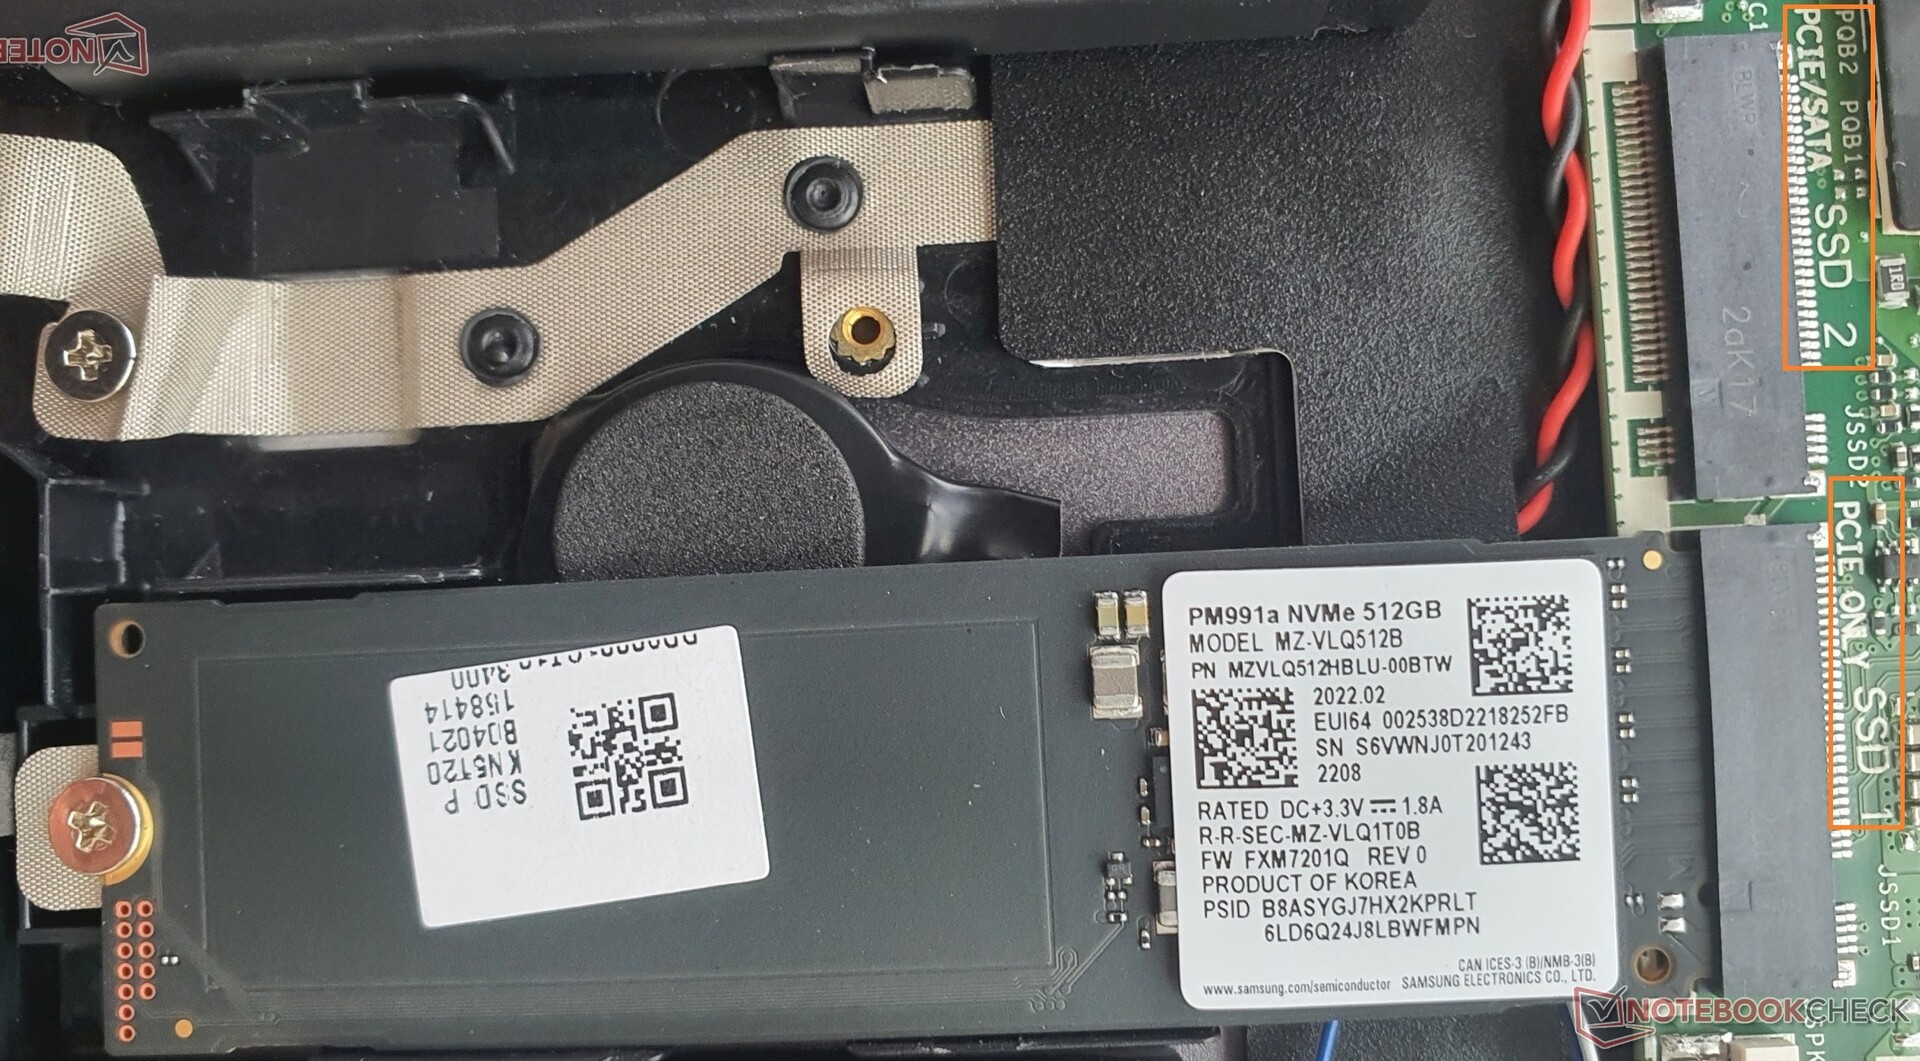
El SSD Samsung PM991 PCIe 3.0 muestra velocidades medias. Tras unos minutos, empero, cae un ~40%, aparentemente debido al sobrecalentamiento. El Samsung PM991 también muestra este comportamiento en algunas de nuestras otras pruebas de portátiles y, por tanto, no es específico del Acer Swift X 16.
En contraste con el Swift 3hay una segunda ranura M.2 para otro SSD.
| Acer Swift X SFX16-51G-5388 GeForce RTX 3050 4GB Laptop GPU, i5-11320H, Samsung PM991 MZVLQ512HBLU | Acer Swift 3 SF316-51 Iris Xe G7 96EUs, i7-11370H, Micron 2210 MTFDHBA512QFD | Acer Swift X SFX14-41G-R7F3 GeForce GTX 1650 Mobile, R5 5500U, WDC PC SN530 SDBPNPZ-1T00 | Lenovo IdeaPad 5 Pro 16ACH GeForce GTX 1650 Mobile, R7 5800H, Micron 2300 512GB MTFDHBA512TDV | Dell Inspiron 16 Plus 7610 GeForce RTX 3050 4GB Laptop GPU, i7-11800H, Kingston OM3PDP3512B | Asus Vivobook Pro 16X-M7600QE GeForce RTX 3050 Ti Laptop GPU, R9 5900HX, SK Hynix HFM001TD3JX013N | |
|---|---|---|---|---|---|---|
| AS SSD | -0% | -5% | -19% | -12% | 12% | |
| Seq Read (MB/s) | 2744.12 | 2015 -27% | 2091 -24% | 2643 -4% | 2077 -24% | 2913 6% |
| Seq Write (MB/s) | 1559.79 | 1055 -32% | 1856 19% | 1510 -3% | 778 -50% | 1806 16% |
| 4K Read (MB/s) | 51.41 | 73.9 44% | 27.51 -46% | 42.86 -17% | 49.6 -4% | 47.67 -7% |
| 4K Write (MB/s) | 156.13 | 223.2 43% | 116.3 -26% | 85.5 -45% | 236.1 51% | 101.5 -35% |
| 4K-64 Read (MB/s) | 1014.34 | 589 -42% | 812 -20% | 768 -24% | 801 -21% | 1382 36% |
| 4K-64 Write (MB/s) | 940.2 | 1029 9% | 1415 50% | 1983 111% | 942 0% | 2164 130% |
| Access Time Read * (ms) | 0.073 | 0.056 23% | 0.103 -41% | 0.06 18% | 0.044 40% | |
| Access Time Write * (ms) | 0.028 | 0.039 -39% | 0.033 -18% | 0.101 -261% | 0.073 -161% | 0.109 -289% |
| Score Read (Points) | 1340 | 865 -35% | 1048 -22% | 1075 -20% | 1059 -21% | 1720 28% |
| Score Write (Points) | 1252 | 1358 8% | 1717 37% | 2220 77% | 1256 0% | 2446 95% |
| Score Total (Points) | 3229 | 2644 -18% | 3292 2% | 3797 18% | 2804 -13% | 4995 55% |
| Copy ISO MB/s (MB/s) | 1363.82 | 1186 -13% | 1028 -25% | 2649 94% | ||
| Copy Program MB/s (MB/s) | 433.2 | 782 81% | 794 83% | 372.8 -14% | ||
| Copy Game MB/s (MB/s) | 1055.69 | 1028 -3% | 987 -7% | 1126 7% |
* ... más pequeño es mejor
* ... más pequeño es mejor
Sustained Performance Read: DiskSpd Read Loop, Queue Depth 8
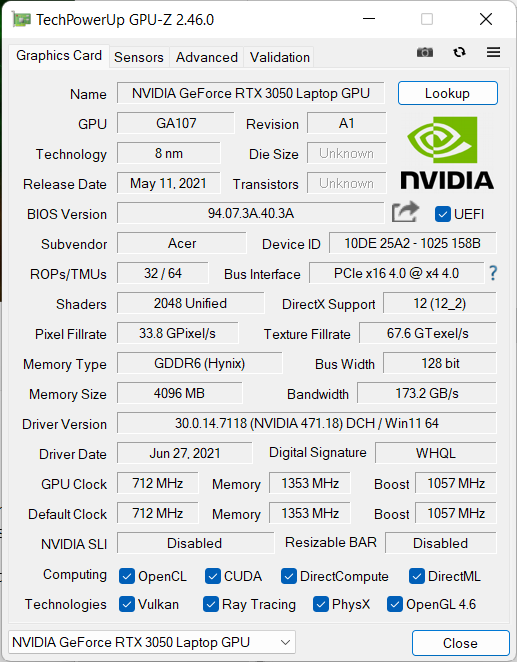
Tarjeta gráfica
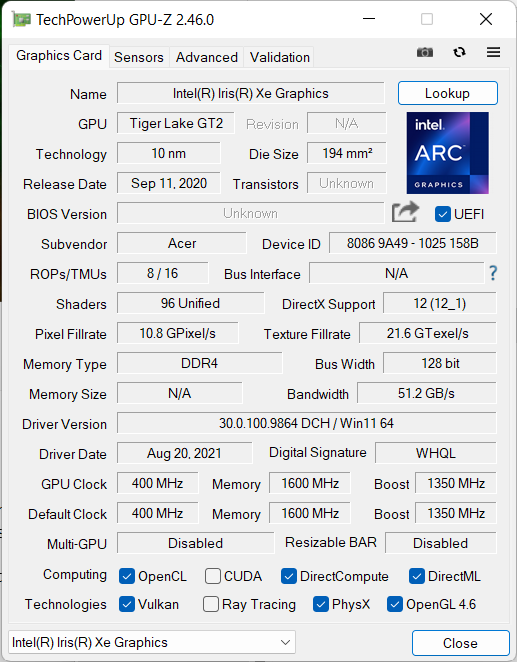

El Acer Swift X 16 viene con unIntel Xe G7 (96EUs)iGPU y la Nvidia GeForce RTX 3050 en la variante más pequeña con un TGP de 35 vatios + 5 vatios de Dynamic Boost. Esto asegura que los nuevos juegos puedan mostrarse en Full HD con detalles medios y altos y permite el renderizado de algunos vídeos
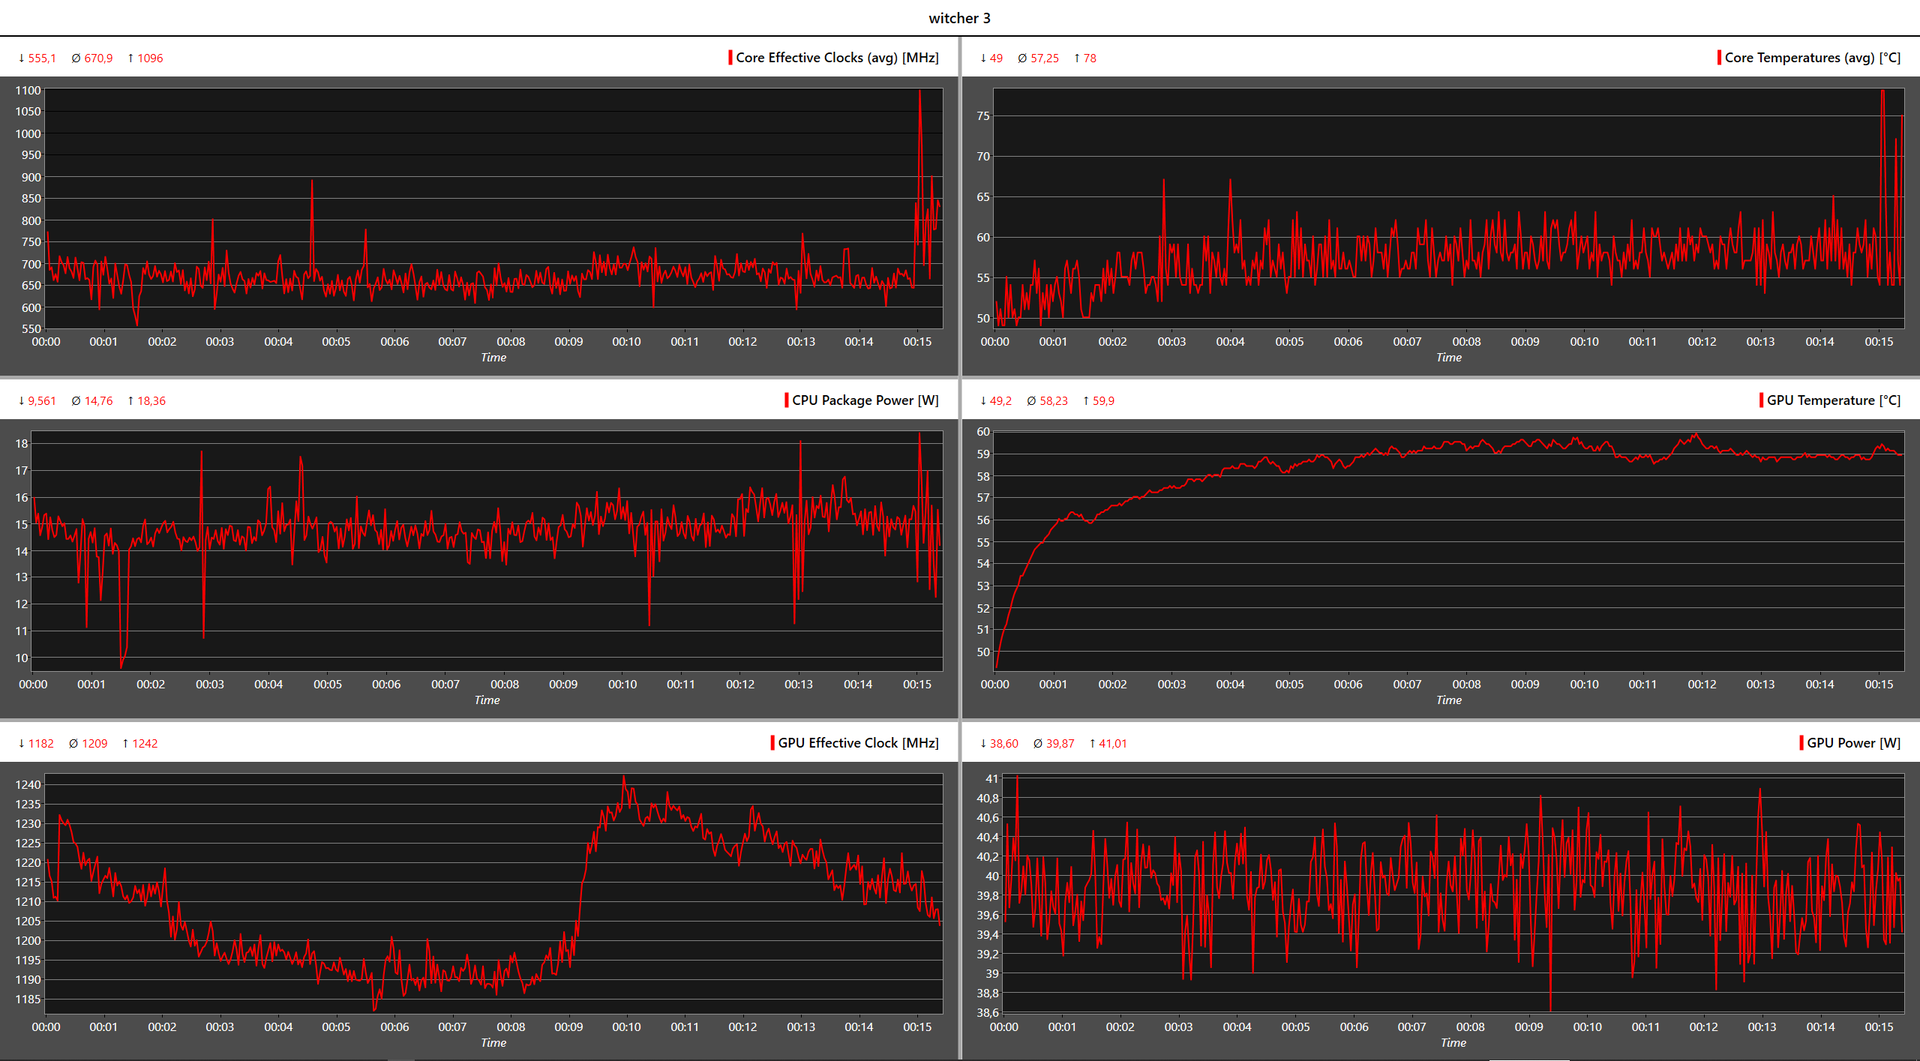
El reloj boost de 1,057 MHz se supera con una media de 1,209 MHz, lo que se debe al Dynamic Boost. La temperatura de la GPU ni siquiera sube a 60 °C.
Los jugadores más rápidos en nuestro campo de comparación son sólo el Asus Vivobook Pro 16X (por ~20 %) y el Dells Inspiron 16 Plus (por ~40 %), que permiten a sus RTX 3050 un TGP más alto (50 y 65 vatios, respectivamente). El IdeaPad 5 Pro 16 con GTX 1650 puede ser superado entre un 10 y un 25% dependiendo del benchmark/juego.
En el modo de batería, el rendimiento de la GPU cae alrededor de un 15%.
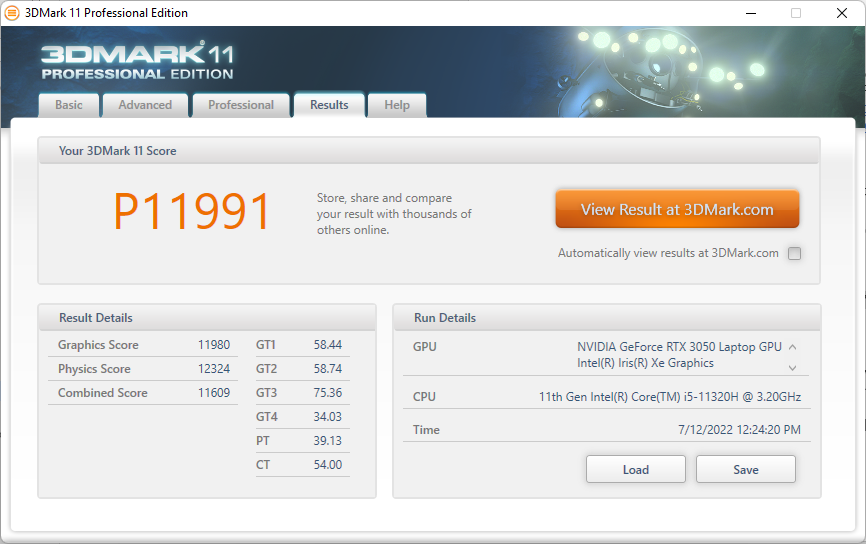
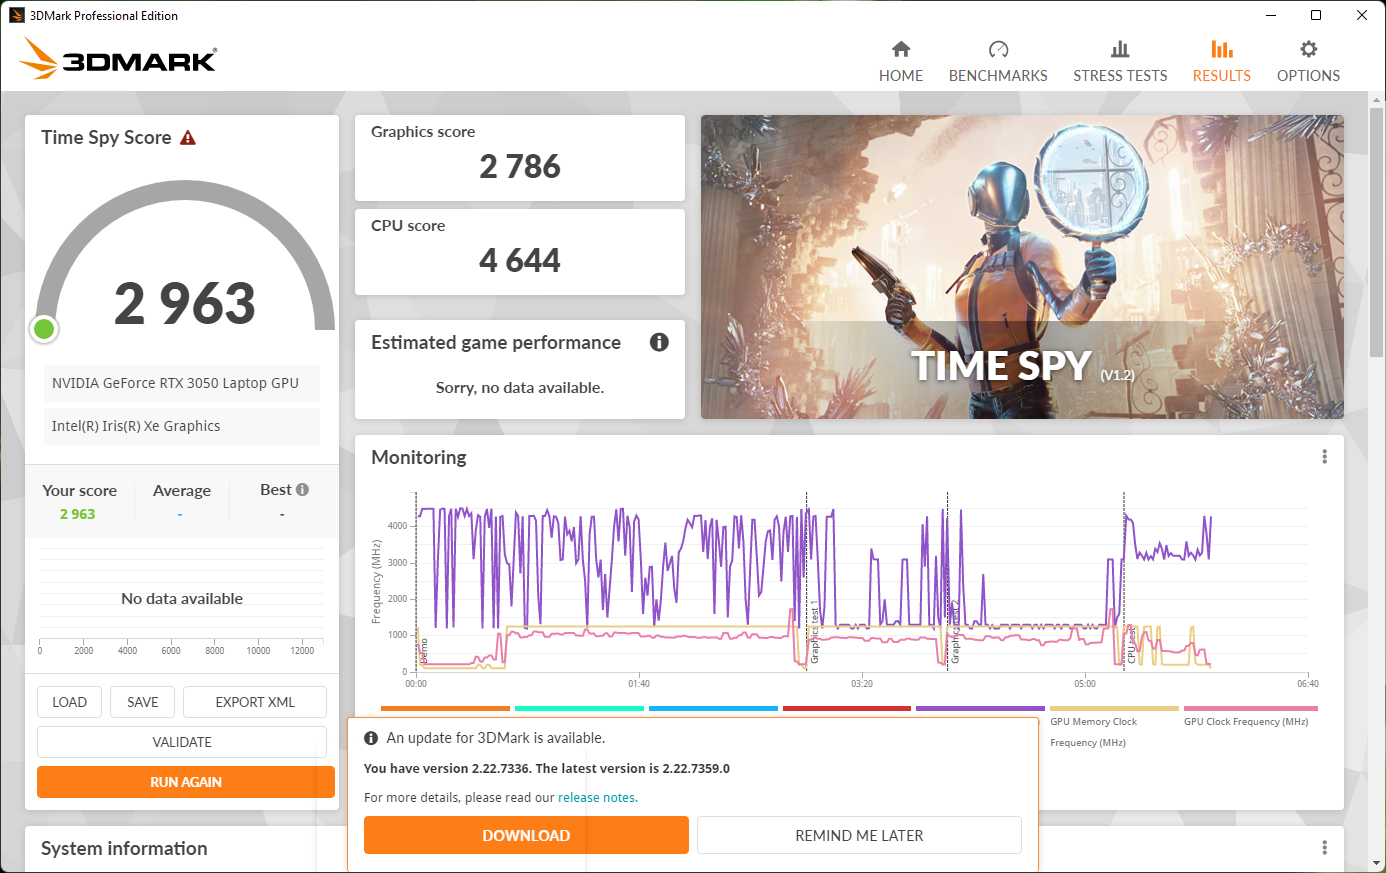
| 3DMark 11 Performance | 11991 puntos | |
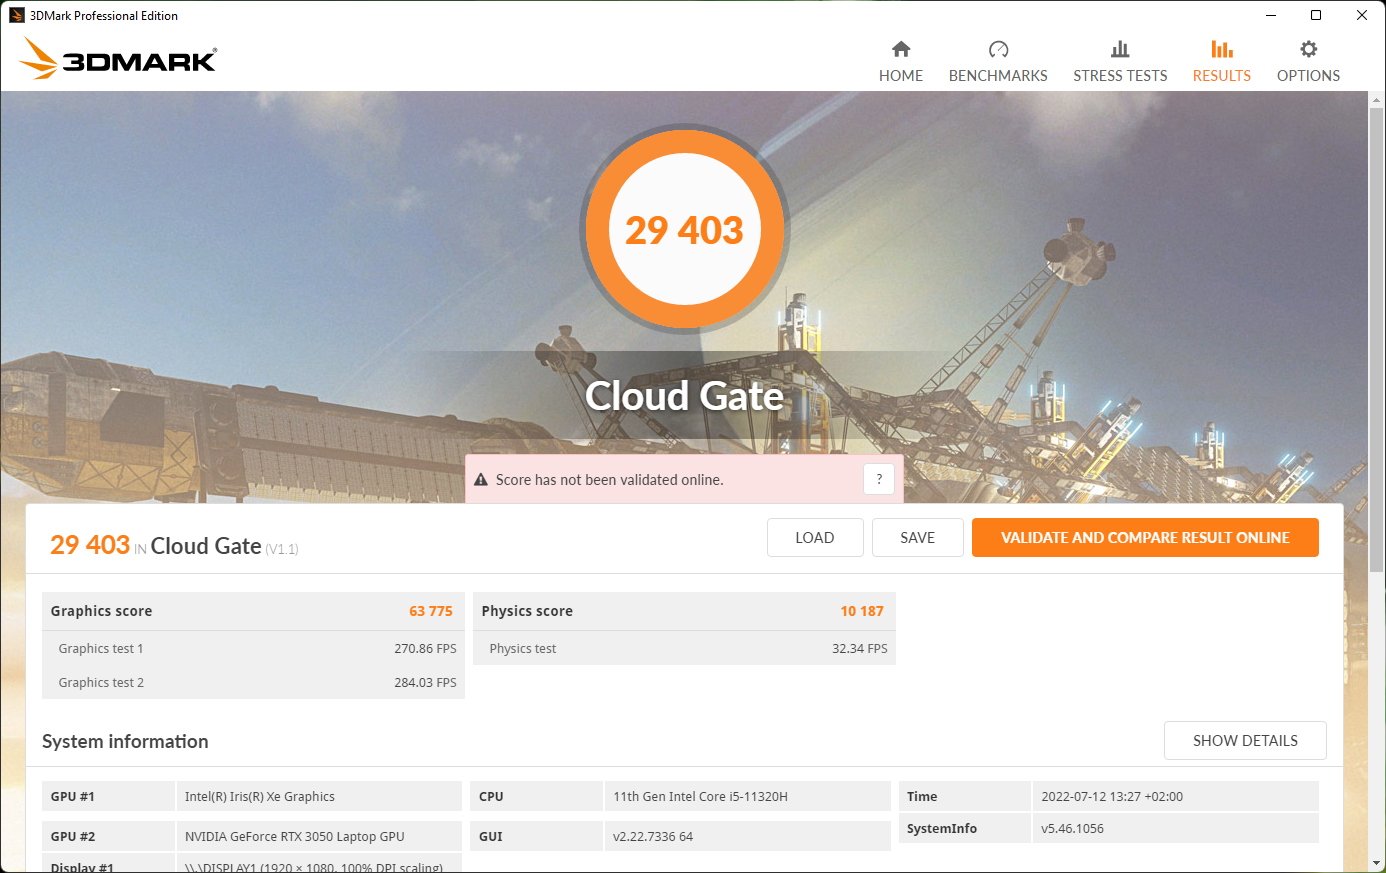
| 3DMark Cloud Gate Standard Score | 29403 puntos | |
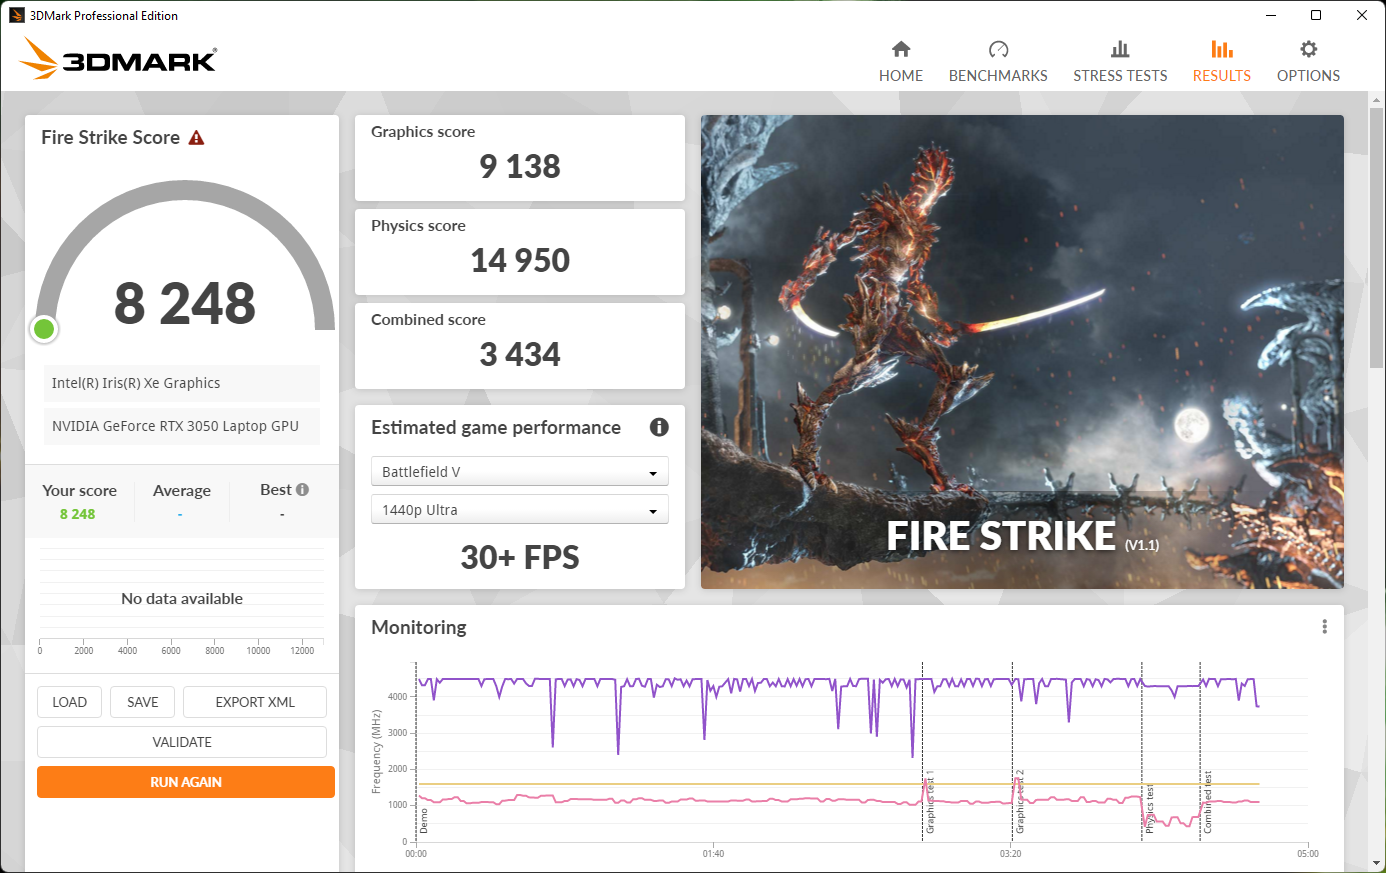
| 3DMark Fire Strike Score | 9249 puntos | |
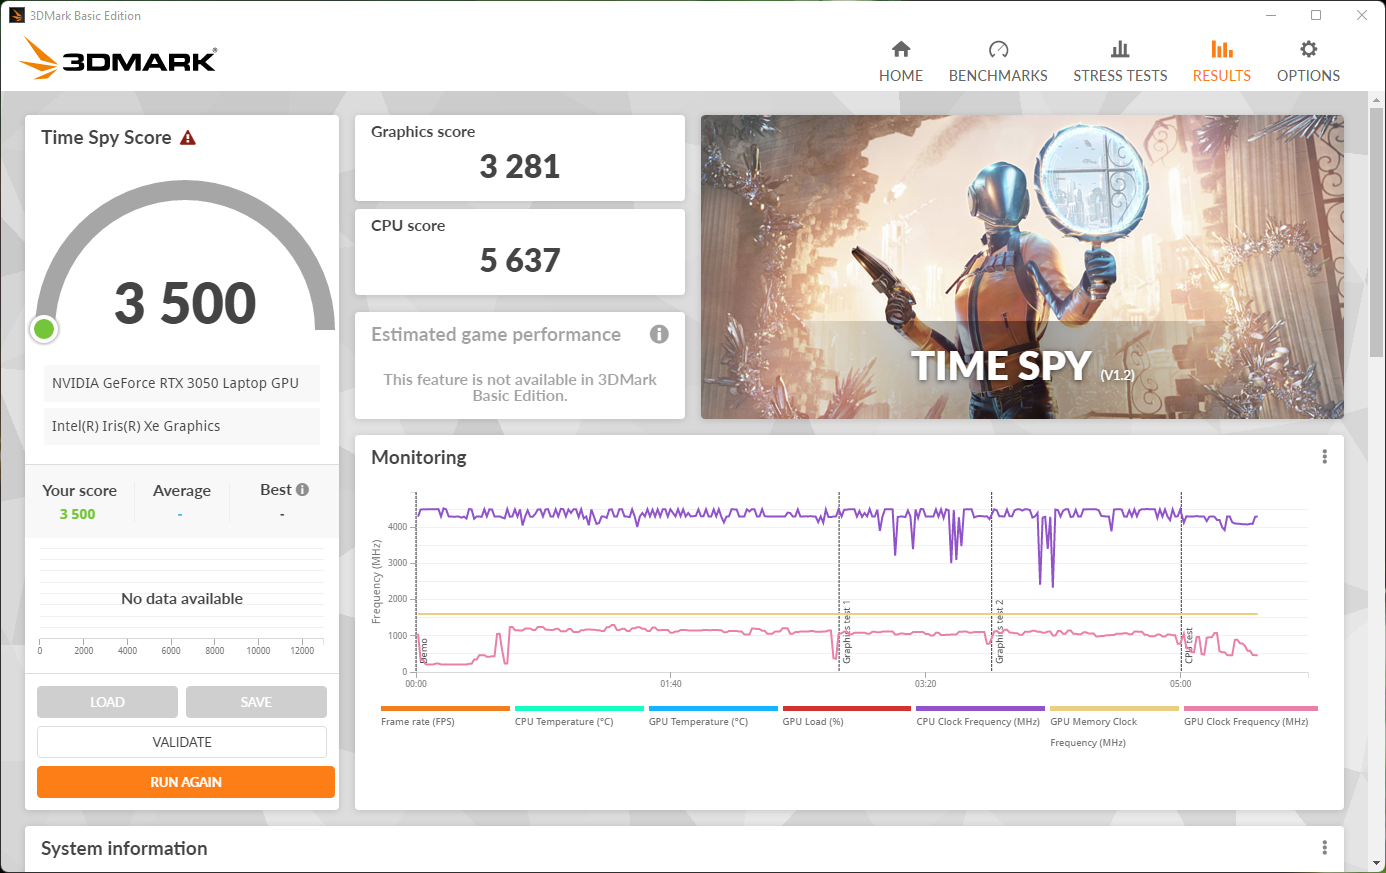
| 3DMark Time Spy Score | 3500 puntos | |
ayuda | ||
| Ghostwire Tokyo - 1920x1080 High Settings | |
| Medio NVIDIA GeForce RTX 3050 4GB Laptop GPU (55.7 - 79.7, n=3) | |
| Acer Swift X SFX16-51G-5388 | |
La prueba de estrés de una hora de Wichter 3 muestra niveles de rendimiento bastante estables según la curva de FPS
Witcher 3 FPS Chart
| bajo | medio | alto | ultra | |
|---|---|---|---|---|
| GTA V (2015) | 170.4 | 163.1 | 99.2 | 48 |
| The Witcher 3 (2015) | 183.9 | 106.7 | 58.7 | 31.5 |
| Dota 2 Reborn (2015) | 138.6 | 122.7 | 119.4 | 116 |
| Final Fantasy XV Benchmark (2018) | 97.4 | 48.7 | 35.9 | |
| X-Plane 11.11 (2018) | 104.7 | 87 | 72.5 | |
| Far Cry 5 (2018) | 104 | 64 | 56 | 59 |
| Strange Brigade (2018) | 216 | 90.4 | 72.1 | 62.1 |
| Ghostwire Tokyo (2022) | 58.2 | 55.7 | 53.9 |
Emisiones: Acer Swift X 16 con modo silencioso
Ruido del sistema
El Swift X 16 está equipado con dos ventiladores de tamaño medio y dos heat pipes. A diferencia del Swift 3la CPU comparte el sistema de refrigeración con una GPU dedicada.
Como resultado, los ventiladores se vuelven más ruidosos bajo carga, y los juegos también provocan un comportamiento irregular de los ventiladores, pero en intervalos más largos, por lo que no destaca realmente. Aunque 41 db(A) bajo carga no es silencioso, es significativamente menos molesto que un portátil de juego tradicional.
Los dispositivos de comparación con una GPU dedicada están más o menos al mismo nivel, pero el Dell Inspiron 16 Pluscon un TGP superior de 55 W se vuelve más ruidoso. El propio modo silencioso de Acer hace las cosas aún más silenciosas. Cuando se navega por la web, los ventiladores suelen quedarse quietos; a una velocidad de navegación algo mayor, hay breves "ráfagas" a volúmenes cómodos
Ruido
| Ocioso |
| 25.4 / 25.4 / 27.8 dB(A) |
| Carga |
| 41 / 47 dB(A) |
 | ||
30 dB silencioso 40 dB(A) audible 50 dB(A) ruidosamente alto |
||
min: | ||
| Acer Swift X SFX16-51G-5388 GeForce RTX 3050 4GB Laptop GPU, i5-11320H, Samsung PM991 MZVLQ512HBLU | Acer Swift 3 SF316-51 Iris Xe G7 96EUs, i7-11370H, Micron 2210 MTFDHBA512QFD | Acer Swift X SFX14-41G-R7F3 GeForce GTX 1650 Mobile, R5 5500U, WDC PC SN530 SDBPNPZ-1T00 | Lenovo IdeaPad 5 Pro 16ACH GeForce GTX 1650 Mobile, R7 5800H, Micron 2300 512GB MTFDHBA512TDV | Dell Inspiron 16 Plus 7610 GeForce RTX 3050 4GB Laptop GPU, i7-11800H, Kingston OM3PDP3512B | Asus Vivobook Pro 16X-M7600QE GeForce RTX 3050 Ti Laptop GPU, R9 5900HX, SK Hynix HFM001TD3JX013N | Huawei MateBook 16 R7 5800H Vega 8, R7 5800H, Lite-On CA5-8D512 | |
|---|---|---|---|---|---|---|---|
| Noise | 5% | -1% | 3% | 0% | -2% | 7% | |
| apagado / medio ambiente * (dB) | 25.4 | 26 -2% | 26 -2% | 24.04 5% | 24.4 4% | 26 -2% | 24.8 2% |
| Idle Minimum * (dB) | 25.4 | 26 -2% | 26 -2% | 24.04 5% | 24.4 4% | 27 -6% | 24.8 2% |
| Idle Average * (dB) | 25.4 | 26 -2% | 27 -6% | 24.04 5% | 24.4 4% | 27 -6% | 24.8 2% |
| Idle Maximum * (dB) | 27.8 | 27.7 -0% | 27.4 1% | 24.04 14% | 24.4 12% | 27.5 1% | 26.7 4% |
| Load Average * (dB) | 41 | 32.7 20% | 42.2 -3% | 41.3 -1% | 48.3 -18% | 41.7 -2% | 32 22% |
| Load Maximum * (dB) | 47 | 39 17% | 44.3 6% | 52.93 -13% | 48.9 -4% | 45.3 4% | 42.4 10% |
| Witcher 3 ultra * (dB) | 49.21 | 48.9 | 32 |
* ... más pequeño es mejor
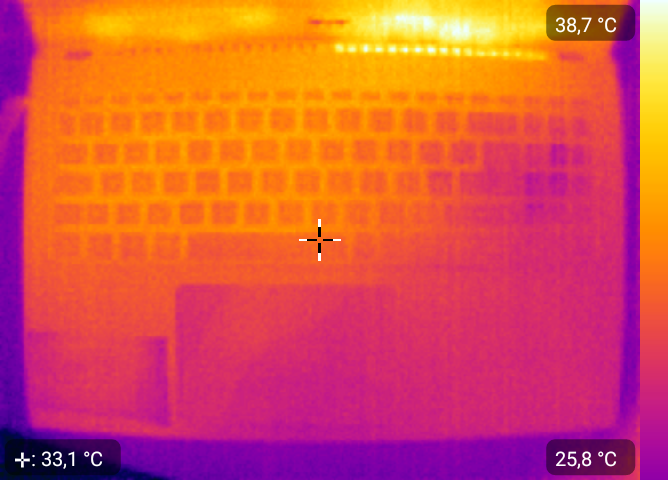
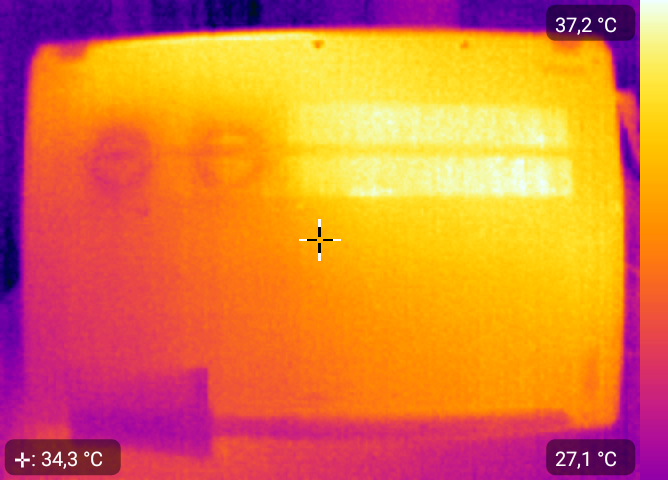
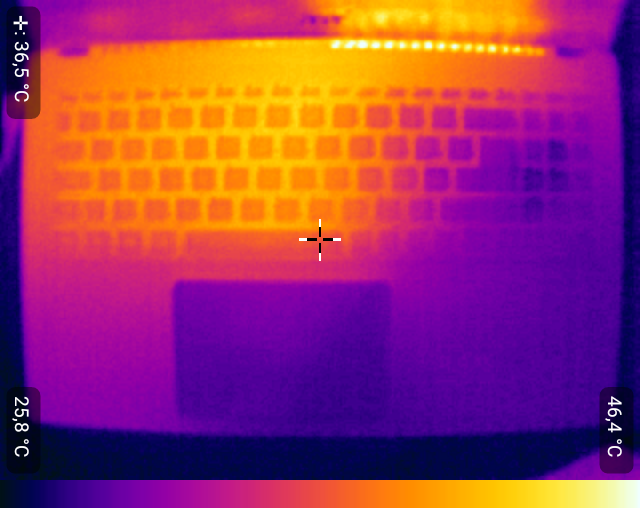
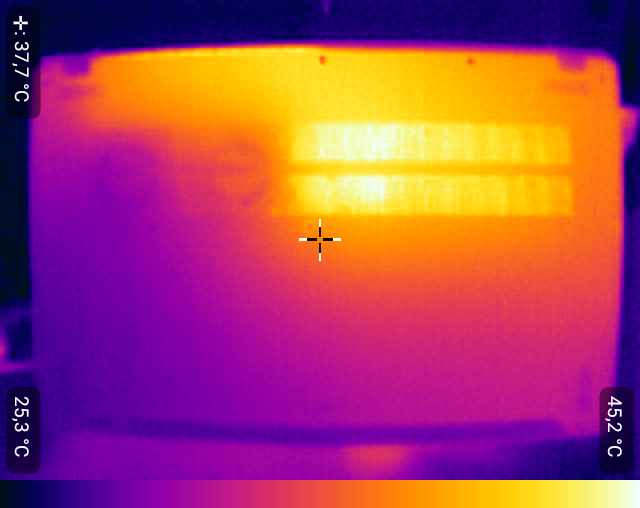
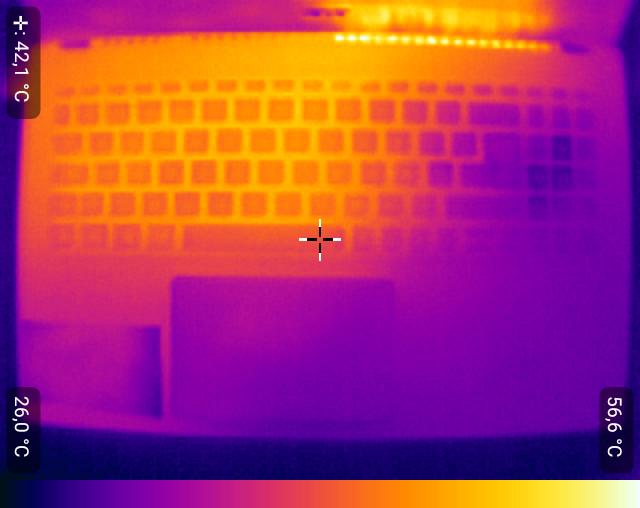
Temperatura
Cuando se juega, las temperaturas permanecen dentro de los límites y nada se calienta notablemente o molesta de alguna manera. Los puntos calientes sólo aparecen bajo la prueba de estrés combinada, especialmente por encima del teclado. El Asus Vivobook Pro 16X permanece significativamente más fresco a pesar de la RTX 3050mientras que el Dell Inspiron 16 Plus se calienta más notablemente.
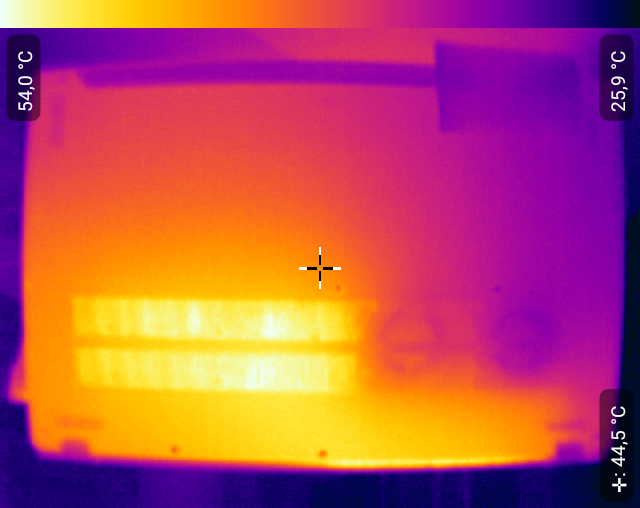
(-) La temperatura máxima en la parte superior es de 52.4 °C / 126 F, frente a la media de 36.8 °C / 98 F, que oscila entre 21 y 71 °C para la clase Multimedia.
(-) El fondo se calienta hasta un máximo de 50 °C / 122 F, frente a la media de 39.1 °C / 102 F
(+) En reposo, la temperatura media de la parte superior es de 27.8 °C / 82# F, frente a la media del dispositivo de 31.3 °C / 88 F.
(±) Jugando a The Witcher 3, la temperatura media de la parte superior es de 32.8 °C / 91 F, frente a la media del dispositivo de 31.3 °C / 88 F.
(±) El reposamanos y el touchpad pueden calentarse mucho al tacto con un máximo de 39.2 °C / 102.6 F.
(-) La temperatura media de la zona del reposamanos de dispositivos similares fue de 28.7 °C / 83.7 F (-10.5 °C / -18.9 F).
| Acer Swift X SFX16-51G-5388 Intel Core i5-11320H, NVIDIA GeForce RTX 3050 4GB Laptop GPU | Acer Swift 3 SF316-51 Intel Core i7-11370H, Intel Iris Xe Graphics G7 96EUs | Lenovo IdeaPad 5 Pro 16ACH AMD Ryzen 7 5800H, NVIDIA GeForce GTX 1650 Mobile | Dell Inspiron 16 Plus 7610 Intel Core i7-11800H, NVIDIA GeForce RTX 3050 4GB Laptop GPU | Asus Vivobook Pro 16X-M7600QE AMD Ryzen 9 5900HX, NVIDIA GeForce RTX 3050 Ti Laptop GPU | Huawei MateBook 16 R7 5800H AMD Ryzen 7 5800H, AMD Radeon RX Vega 8 (Ryzen 4000/5000) | |
|---|---|---|---|---|---|---|
| Heat | 7% | 4% | -6% | 14% | 13% | |
| Maximum Upper Side * (°C) | 52.4 | 40 24% | 51.9 1% | 46.4 11% | 39.4 25% | 40.2 23% |
| Maximum Bottom * (°C) | 50 | 47 6% | 51.5 -3% | 54.8 -10% | 43.6 13% | 49.7 1% |
| Idle Upper Side * (°C) | 30.3 | 30.1 1% | 27.2 10% | 31.4 -4% | 27.6 9% | 26.4 13% |
| Idle Bottom * (°C) | 30.4 | 31.6 -4% | 28.5 6% | 36.6 -20% | 27.5 10% | 26.4 13% |
* ... más pequeño es mejor
Prueba de esfuerzo
En condiciones de estrés de la CPU, el Intel Core i5-11320H funciona a 3 GHz (200 MHz por debajo del reloj base) y alcanza los 73 °C.
Bajo estrés puro de la dGPU, laRTX 3050 funciona a 700 MHz, lo que corresponde a su reloj base. La carga combinada (FurMark + Prime95) reduce la CPU a 2,4 GHz, mientras que la GPU sólo se ralentiza ligeramente a 600 MHz. Las temperaturas rondan los 75 °C y 65 °C, respectivamente. Un buen resultado.
El consumo combinado es de 25W (CPU) + 35W (GPU) = 60 vatios. En juegos, esto supone 15W + 40W. En modo batería, 15W + 30W.
| Reloj dela CPU (GHz) | Reloj de la GPU (MHz) | Temperaturamedia dela CPU (°C) | Temperatura media de la GPU (°C) | PL1 (vatios) | TGP (vatios) | |
| Sistema en reposo | 0,04 | 200 | 29 | 34 | -- | -- |
| Prime95Stress | 3 | 200 | 73 | 52 | 35 | -- |
| Prime95+ FurMark Stress | 2,4 | 600 | 75 | 66 | 25 | 40 |
| FurMark Stress | 0,1 | 700 | 48 | 56 | -- | 40 |
| Witcher 3 Stress | 0,7 | 1200 | 60 | 59 | 15 | 40 |
| Witcher 3 @Akku | 0,7 | 1057 | 59 | 58 | 15 | 30 |
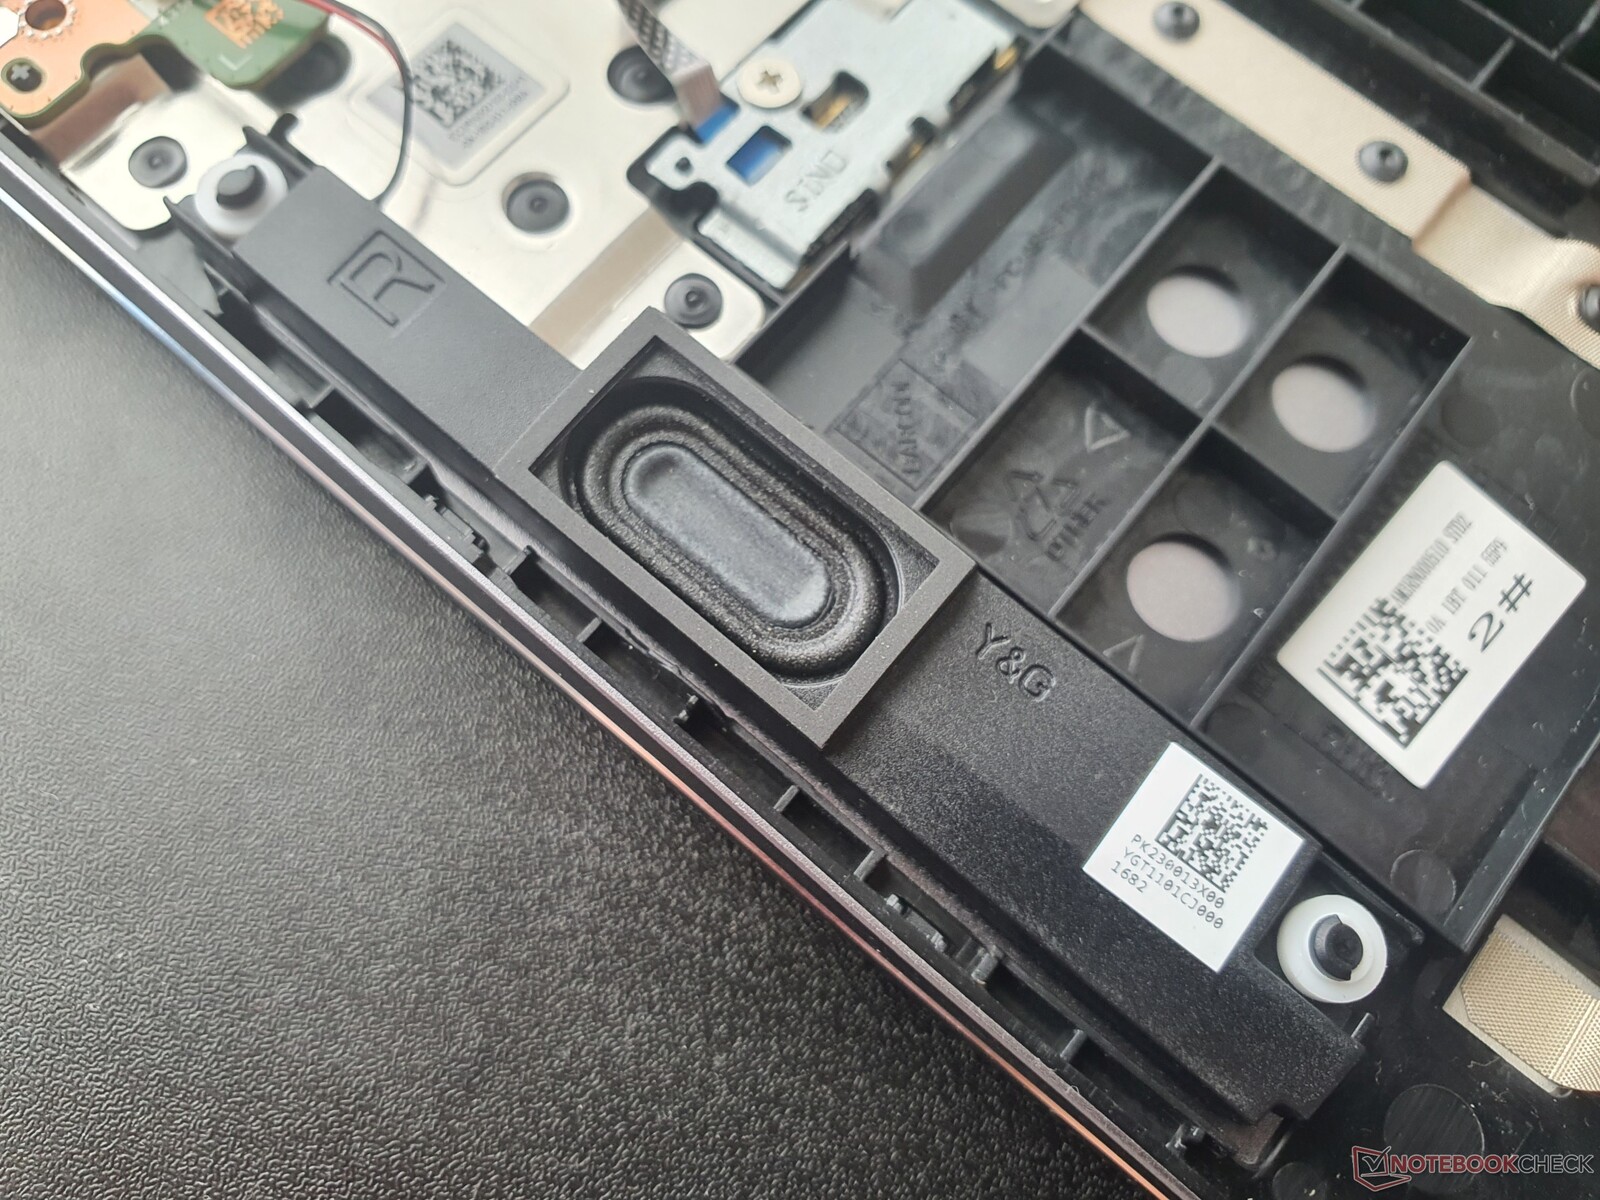
Altavoces
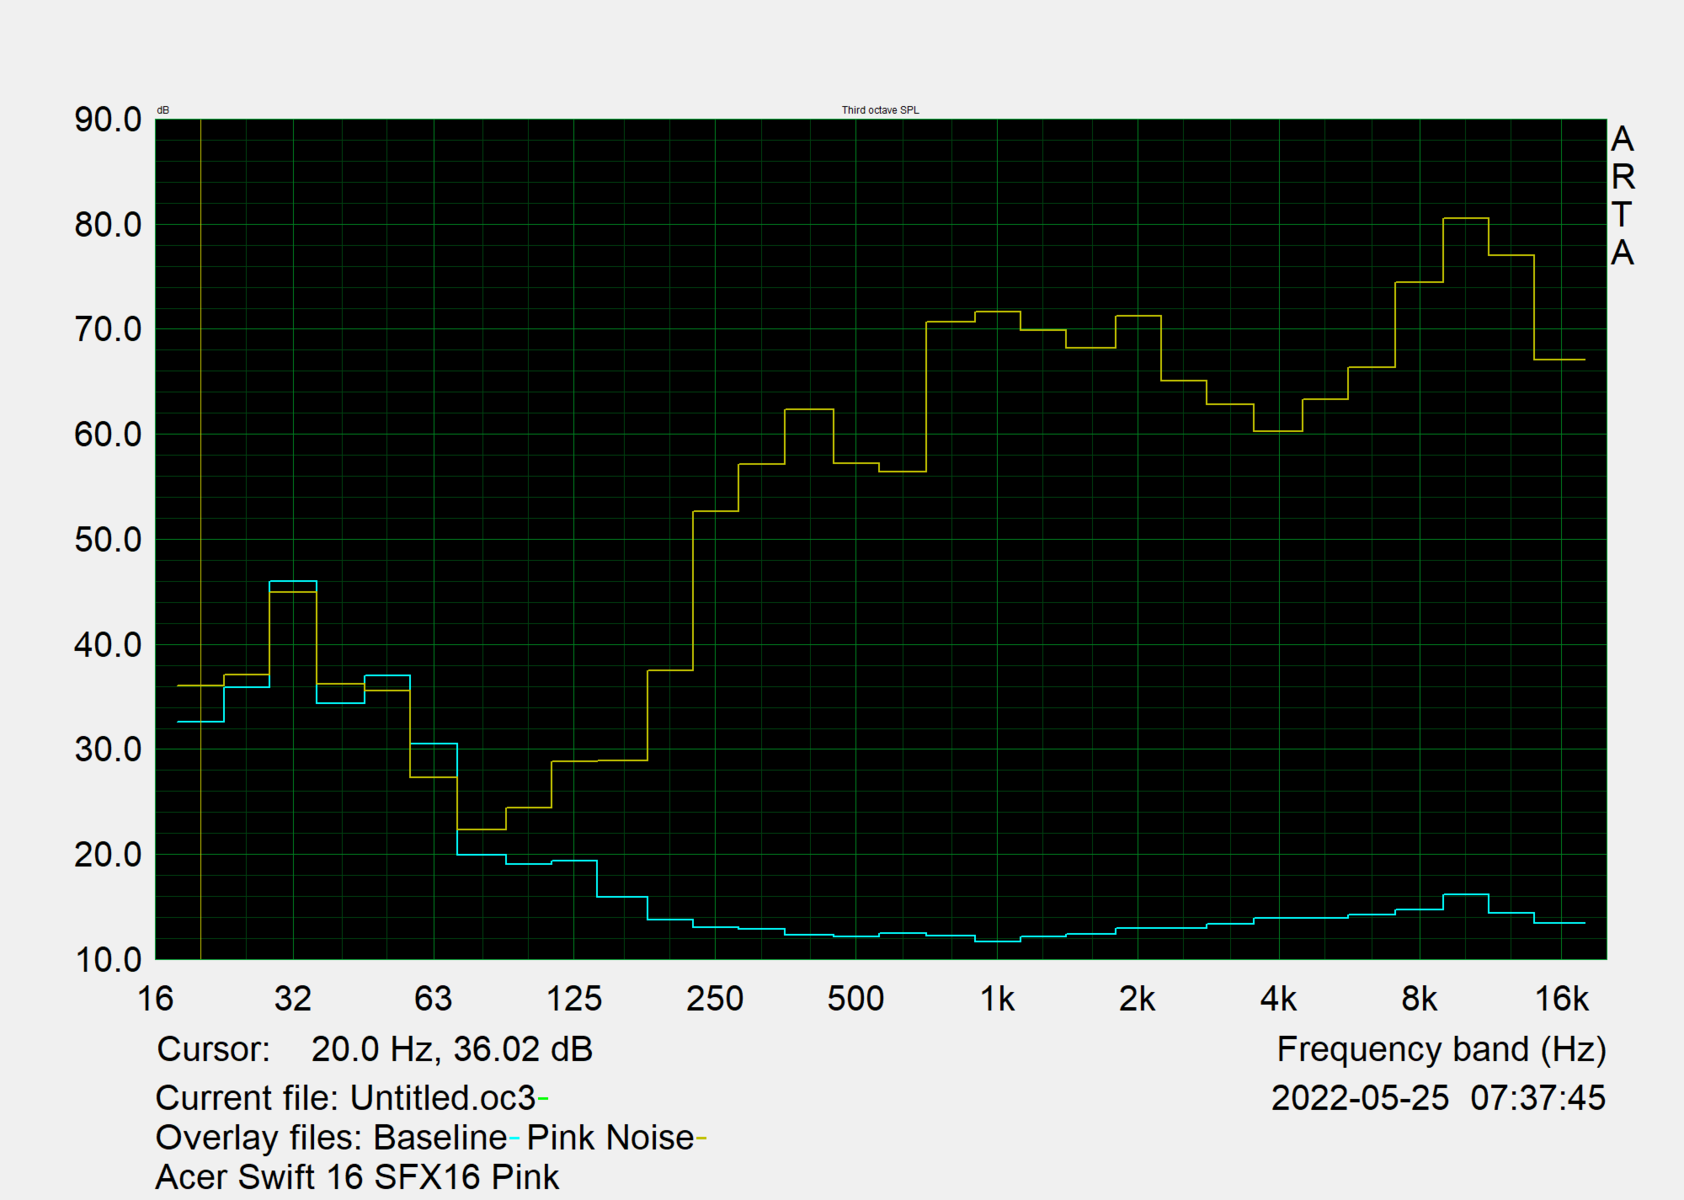
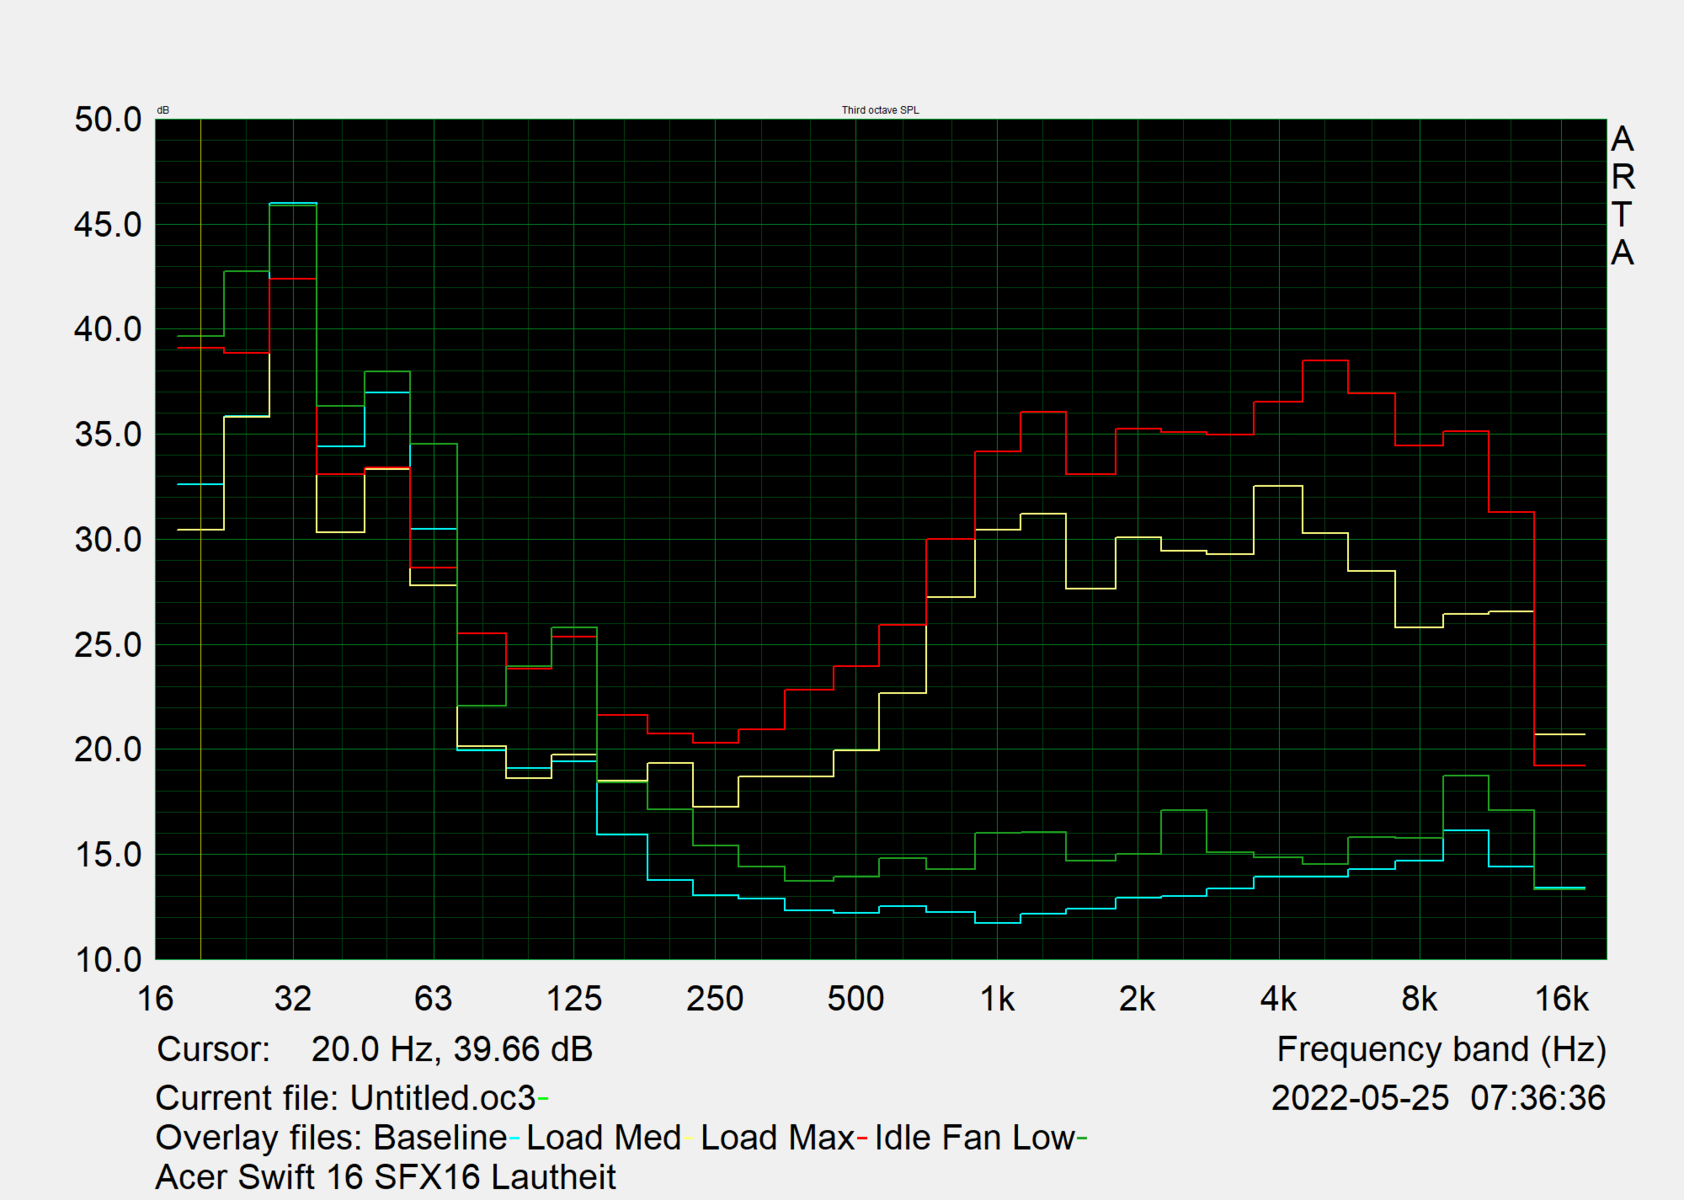
Los altavoces producen un sonido de calidad inferior, lo que no debería ser el caso en un portátil multimedia. Los sonidos son demasiado silenciosos, apenas hay graves e incluso los medios y los agudos sólo se reproducen con una precisión limitada.
Por tanto, se recomienda el uso de periféricos de audio externos a través de la clavija de 3,5 mm o del Bluetooth.
Acer Swift X SFX16-51G-5388 análisis de audio
(±) | la sonoridad del altavoz es media pero buena (77 dB)
Graves 100 - 315 Hz
(-) | casi sin bajos - de media 25% inferior a la mediana
(±) | la linealidad de los graves es media (11.6% delta a frecuencia anterior)
Medios 400 - 2000 Hz
(±) | medias más altas - de media 6.1% más altas que la mediana
(±) | la linealidad de los medios es media (8.2% delta respecto a la frecuencia anterior)
Altos 2 - 16 kHz
(±) | máximos más altos - de media 5.3% más altos que la mediana
(±) | la linealidad de los máximos es media (8.9% delta a frecuencia anterior)
Total 100 - 16.000 Hz
(±) | la linealidad del sonido global es media (22.9% de diferencia con la mediana)
En comparación con la misma clase
» 81% de todos los dispositivos probados de esta clase eran mejores, 5% similares, 14% peores
» El mejor tuvo un delta de 5%, la media fue 17%, el peor fue ###max##%
En comparación con todos los dispositivos probados
» 68% de todos los dispositivos probados eran mejores, 6% similares, 26% peores
» El mejor tuvo un delta de 4%, la media fue 23%, el peor fue ###max##%
Lenovo IdeaPad 5 Pro 16ACH análisis de audio
(-) | altavoces no muy altos (#68.8 dB)
Graves 100 - 315 Hz
(-) | casi sin bajos - de media 24.4% inferior a la mediana
(±) | la linealidad de los graves es media (13.3% delta a frecuencia anterior)
Medios 400 - 2000 Hz
(+) | medios equilibrados - a sólo 3.2% de la mediana
(+) | los medios son lineales (4.1% delta a la frecuencia anterior)
Altos 2 - 16 kHz
(+) | máximos equilibrados - a sólo 2% de la mediana
(+) | los máximos son lineales (6.3% delta a la frecuencia anterior)
Total 100 - 16.000 Hz
(±) | la linealidad del sonido global es media (22.5% de diferencia con la mediana)
En comparación con la misma clase
» 80% de todos los dispositivos probados de esta clase eran mejores, 4% similares, 16% peores
» El mejor tuvo un delta de 5%, la media fue 17%, el peor fue ###max##%
En comparación con todos los dispositivos probados
» 66% de todos los dispositivos probados eran mejores, 6% similares, 28% peores
» El mejor tuvo un delta de 4%, la media fue 23%, el peor fue ###max##%
Gestión de la energía: Swift X, como tantas veces, en el medio
Consumo de energía
El Swift X está sediento en el modo de espera, exigiendo 3 vatios completos. Los valores en reposo, por otro lado, son mediocres y están más o menos a la par con nuestro campo de comparación.
Bajo carga, las máquinas con una CPU de 45 vatios + un TGP más alto pueden consumir bastante más energía, hasta 100 vatios, lo que beneficia al rendimiento. El Swift X 16 de Acer extrae un máximo de 63 vatios de la red eléctrica. Por tanto, la fuente de alimentación está suficientemente dimensionada con 90 vatios.
| Off / Standby | |
| Ocioso | |
| Carga |
|
Clave:
min: | |
| Acer Swift X SFX16-51G-5388 i5-11320H, GeForce RTX 3050 4GB Laptop GPU, Samsung PM991 MZVLQ512HBLU, , 1920x1080, 16.1" | Acer Swift 3 SF316-51 i7-11370H, Iris Xe G7 96EUs, Micron 2210 MTFDHBA512QFD, IPS, 1920x1080, 16.1" | Acer Swift X SFX14-41G-R7F3 R5 5500U, GeForce GTX 1650 Mobile, WDC PC SN530 SDBPNPZ-1T00, IPS, 1920x1080, 14" | Lenovo IdeaPad 5 Pro 16ACH R7 5800H, GeForce GTX 1650 Mobile, Micron 2300 512GB MTFDHBA512TDV, IPS LED, 2560x1600, 16" | Dell Inspiron 16 Plus 7610 i7-11800H, GeForce RTX 3050 4GB Laptop GPU, Kingston OM3PDP3512B, IPS, 3072x1920, 16" | Asus Vivobook Pro 16X-M7600QE R9 5900HX, GeForce RTX 3050 Ti Laptop GPU, SK Hynix HFM001TD3JX013N, OLED, 3840x2400, 16.1" | Huawei MateBook 16 R7 5800H R7 5800H, Vega 8, Lite-On CA5-8D512, , 2520x1680, 16" | Medio NVIDIA GeForce RTX 3050 4GB Laptop GPU | Media de la clase Multimedia | |
|---|---|---|---|---|---|---|---|---|---|
| Power Consumption | 39% | 25% | -11% | -33% | -21% | 11% | -16% | 2% | |
| Idle Minimum * (Watt) | 7 | 4.8 31% | 3.4 51% | 5.7 19% | 7.7 -10% | 8.2 -17% | 4.6 34% | 7.17 ? -2% | 5.66 ? 19% |
| Idle Average * (Watt) | 10.1 | 7.4 27% | 6 41% | 9.3 8% | 10.7 -6% | 16.2 -60% | 10.5 -4% | 10.4 ? -3% | 10.2 ? -1% |
| Idle Maximum * (Watt) | 15 | 9 40% | 9.2 39% | 11 27% | 16.8 -12% | 19.7 -31% | 11.2 25% | 14.8 ? 1% | 12.5 ? 17% |
| Load Average * (Watt) | 63.3 | 34.9 45% | 57 10% | 83.4 -32% | 100.39 -59% | 65.8 -4% | 59.1 7% | 89.7 ? -42% | 65.2 ? -3% |
| Witcher 3 ultra * (Watt) | 63.3 | 34.9 45% | 57.3 9% | 94.4 -49% | 108 -71% | 65.6 -4% | 58.6 7% | ||
| Load Maximum * (Watt) | 94 | 51.4 45% | 93.6 -0% | 128.7 -37% | 129 -37% | 104 -11% | 98.3 -5% | 124.8 ? -33% | 113.5 ? -21% |
* ... más pequeño es mejor
Power consumption Witcher 3 / Stress test
Power consumption with an external monitor
Duración de la batería
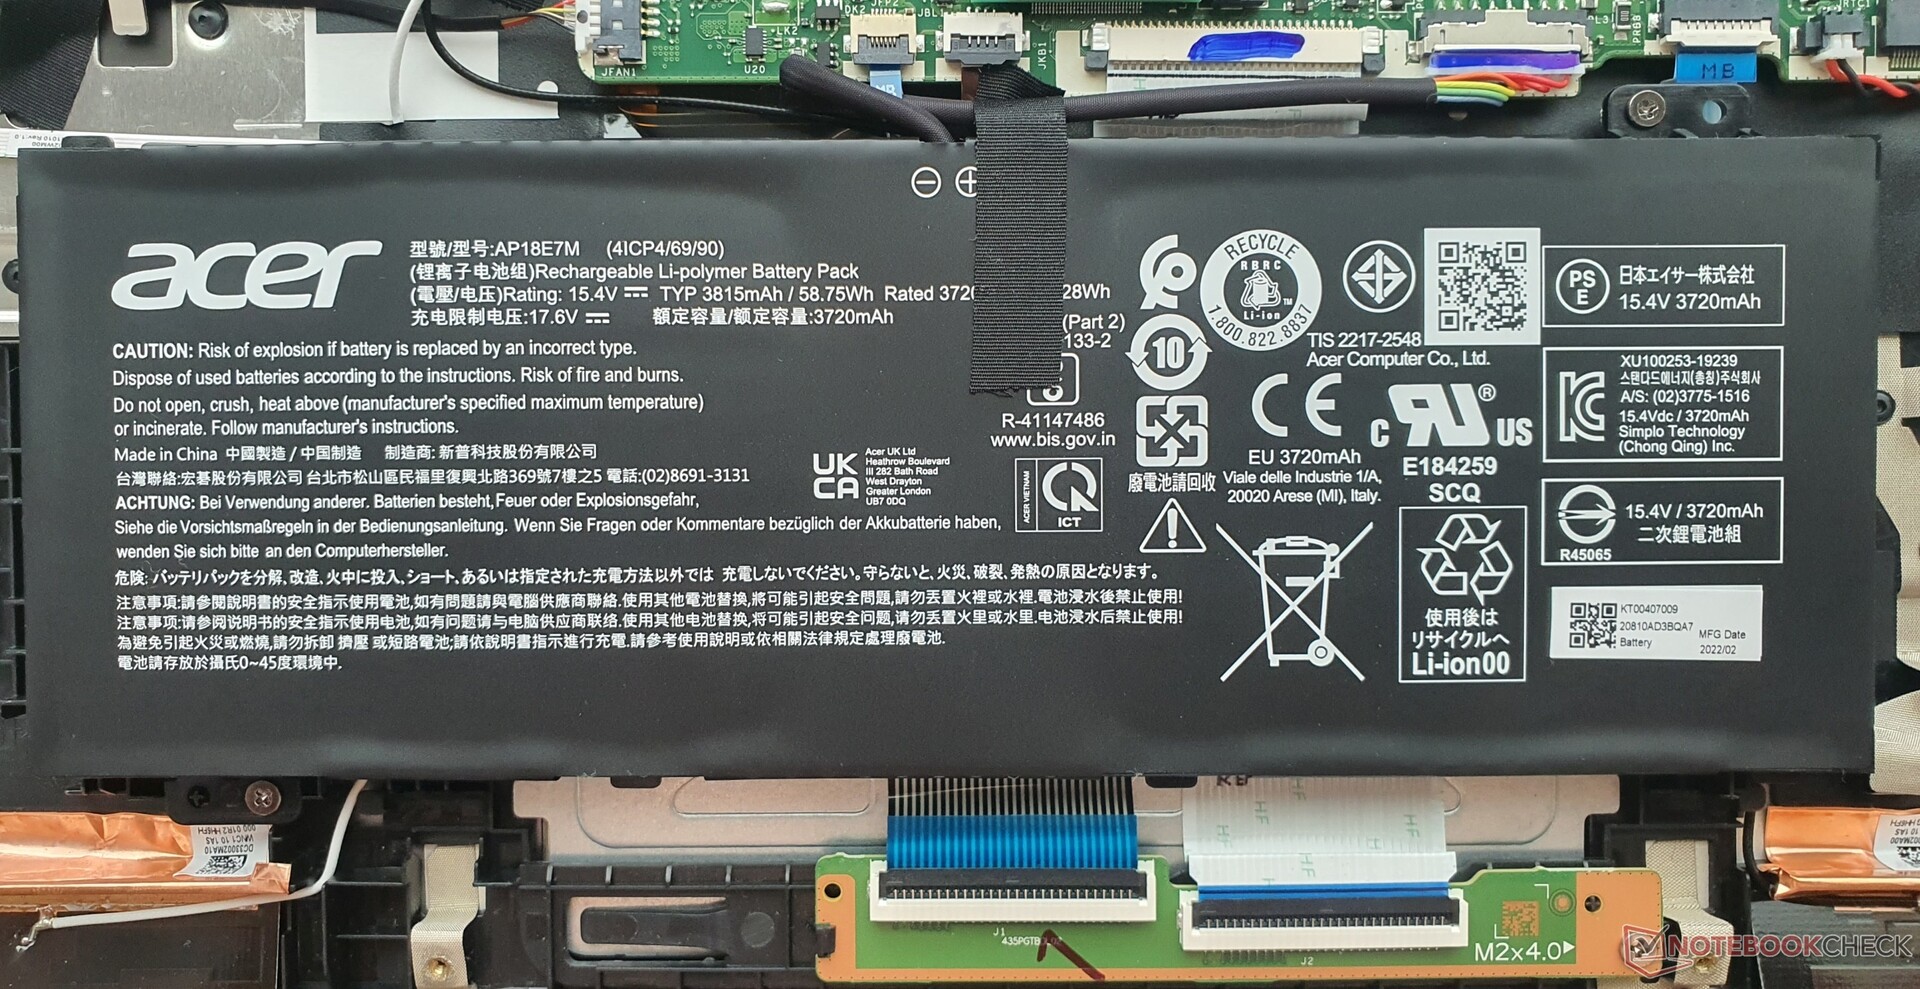
La duración de la batería de ~8 horas al navegar por la web a 150 nits es aceptable, pero queda en último lugar en nuestro campo de comparación. ElSwift 3sin dGPU dura más de hora y media, y el LenovoIdeaPad 5 Pro 16logra un 50% más de duración.
| Acer Swift X SFX16-51G-5388 i5-11320H, GeForce RTX 3050 4GB Laptop GPU, 58.7 Wh | Acer Swift 3 SF316-51 i7-11370H, Iris Xe G7 96EUs, 56 Wh | Acer Swift X SFX14-41G-R7F3 R5 5500U, GeForce GTX 1650 Mobile, 58.7 Wh | Lenovo IdeaPad 5 Pro 16ACH R7 5800H, GeForce GTX 1650 Mobile, 75 Wh | Dell Inspiron 16 Plus 7610 i7-11800H, GeForce RTX 3050 4GB Laptop GPU, 86 Wh | Asus Vivobook Pro 16X-M7600QE R9 5900HX, GeForce RTX 3050 Ti Laptop GPU, 96 Wh | Media de la clase Multimedia | |
|---|---|---|---|---|---|---|---|
| Duración de Batería | 19% | 19% | 31% | 71% | 7% | 51% | |
| H.264 (h) | 8.4 | 10.3 23% | 10.4 24% | 17.1 ? 104% | |||
| WiFi v1.3 (h) | 8.1 | 9.8 21% | 10.1 25% | 12.6 56% | 9.9 22% | 11.3 40% | 12.2 ? 51% |
| Gaming (h) | 1.1 | 1.533 ? 39% | |||||
| Load (h) | 1.5 | 1.7 13% | 1.7 13% | 1.7 13% | 3.3 120% | 1.1 -27% | 1.664 ? 11% |
| Reader / Idle (h) | 20.1 | 7.6 | 20.5 | 20.3 | 24.9 ? | ||
| Witcher 3 ultra (h) | 2.2 | 1.2 |
Pro
Contra
Veredicto: Acer Swift X 16 por 1200 dólares es simplemente demasiado caro
El compacto Acer Swift X 16 es bastante ligero con 1.8 kg y silencioso bajo carga gracias a los modos de energía bien implementados por Acer. Los dispositivos de entrada son buenos, mientras que Thunderbolt 4 mejora la conectividad, aunque se echa en falta un lector de tarjetas SD así como un puerto LAN
El rendimiento gráfico del robusto híbrido multimedia de oficina es suficiente para los juegos Full HD o la creación ocasional de contenidos. Esto último también se beneficia del espacio de color sRGB del 95% de la pantalla de 16 pulgadas. Esto también es ideal para disfrutar de los medios, pero un formato 16:10 sería más ventajoso para trabajar. Teniendo en cuenta el precio bastante elevado, Acer podría haber instalado una versión más potente de la GeForce RTX 3050.
Por 1.200 dólares, se obtiene un dispositivo de trabajo de alto rendimiento, relativamente silencioso y compacto para tareas multimedia. Por desgracia, la pantalla de 16 pulgadas es un poco demasiado oscura y no está a la altura de la competencia, también en términos de altavoces y duración de la batería.
Teniendo en cuenta que se supone que es un portátil multimedia, hay algunas cosas que nos molestan. Por ejemplo, la pantalla demasiado oscura, los pobres altavoces, la webcam y las altas latencias del CPD. Además, la RAM está soldada y la duración de la batería de 8 horas es mediocre para la clase de portátil.
El Vivobook Pro 16X de Asus ofrece mejor rendimiento en casi todas las áreas: pantalla OLED 4K más brillante, una CPU AMD Ryzen HX, mayor duración, mejores altavoces y rendimiento gráfico (mayor TGP). También podemos hacer afirmaciones similares sobre el Dell Inspiron 16 Plus y el mucho más barato Lenovo Ideapad 5 Pro 16.
Precio y disponibilidad
Se aconseja a los lectores que comprueben directamente a través del sitio web de Acer la disponibilidad en su país. Tenga en cuenta que Acer ofrece una variedad de configuraciones del SFX16-51G que varían de un lugar a otro. En los siguientes ejemplos, las diferencias con nuestro modelo revisado(SFX16-51G-5388: Intel Core i5-11320H, Nvidia GeForce RTX 3050, 16 GB de RAM y 512 GB de SSD) se destacan en negrita:
EE.UU, a partir de 1.199,99 dólares (Intel Core i7-11390H, Nvidia GeForce RTX 3050Ti, 16 GB de RAM y 512 GB de SSD)
Reino Unido, a partir de 1.199,99 GBP (Intel Core i7-11390H, Nvidia GeForce RTX 30 50Ti , 16 GB de RAM y 1 TB de SSD )
Canadáa partir de 1.299,99 dólares canadienses (Intel Core i7-11370H, gráficos Intel Iris Xe, 16 GB de RAM y SDD de 512 GB)
Los precios son a fecha de 18.07.2022. A modo de comparación, nuestro dispositivo analizado tenía un precio de venta al público de 1.200 euros (1.200 dólares).
Acer Swift X SFX16-51G-5388
- 07/15/2022 v7 (old)
Marvin Gollor
Price comparison

