Análisis del Asus ROG Strix SCAR 17 X3D - El portátil para juegos más rápido del mundo
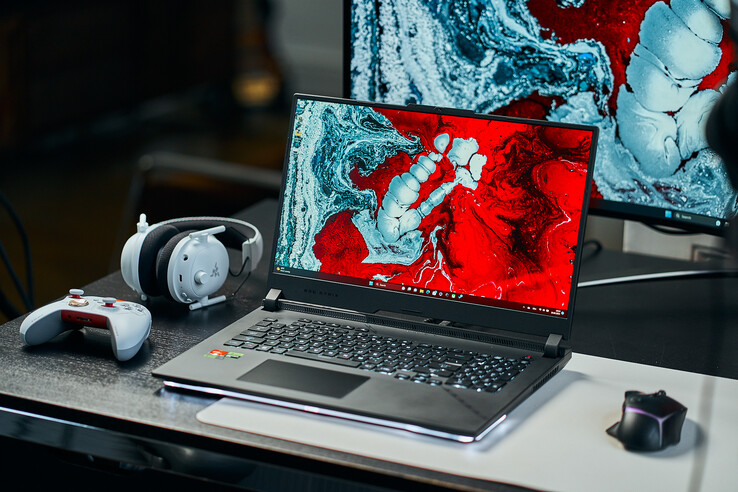
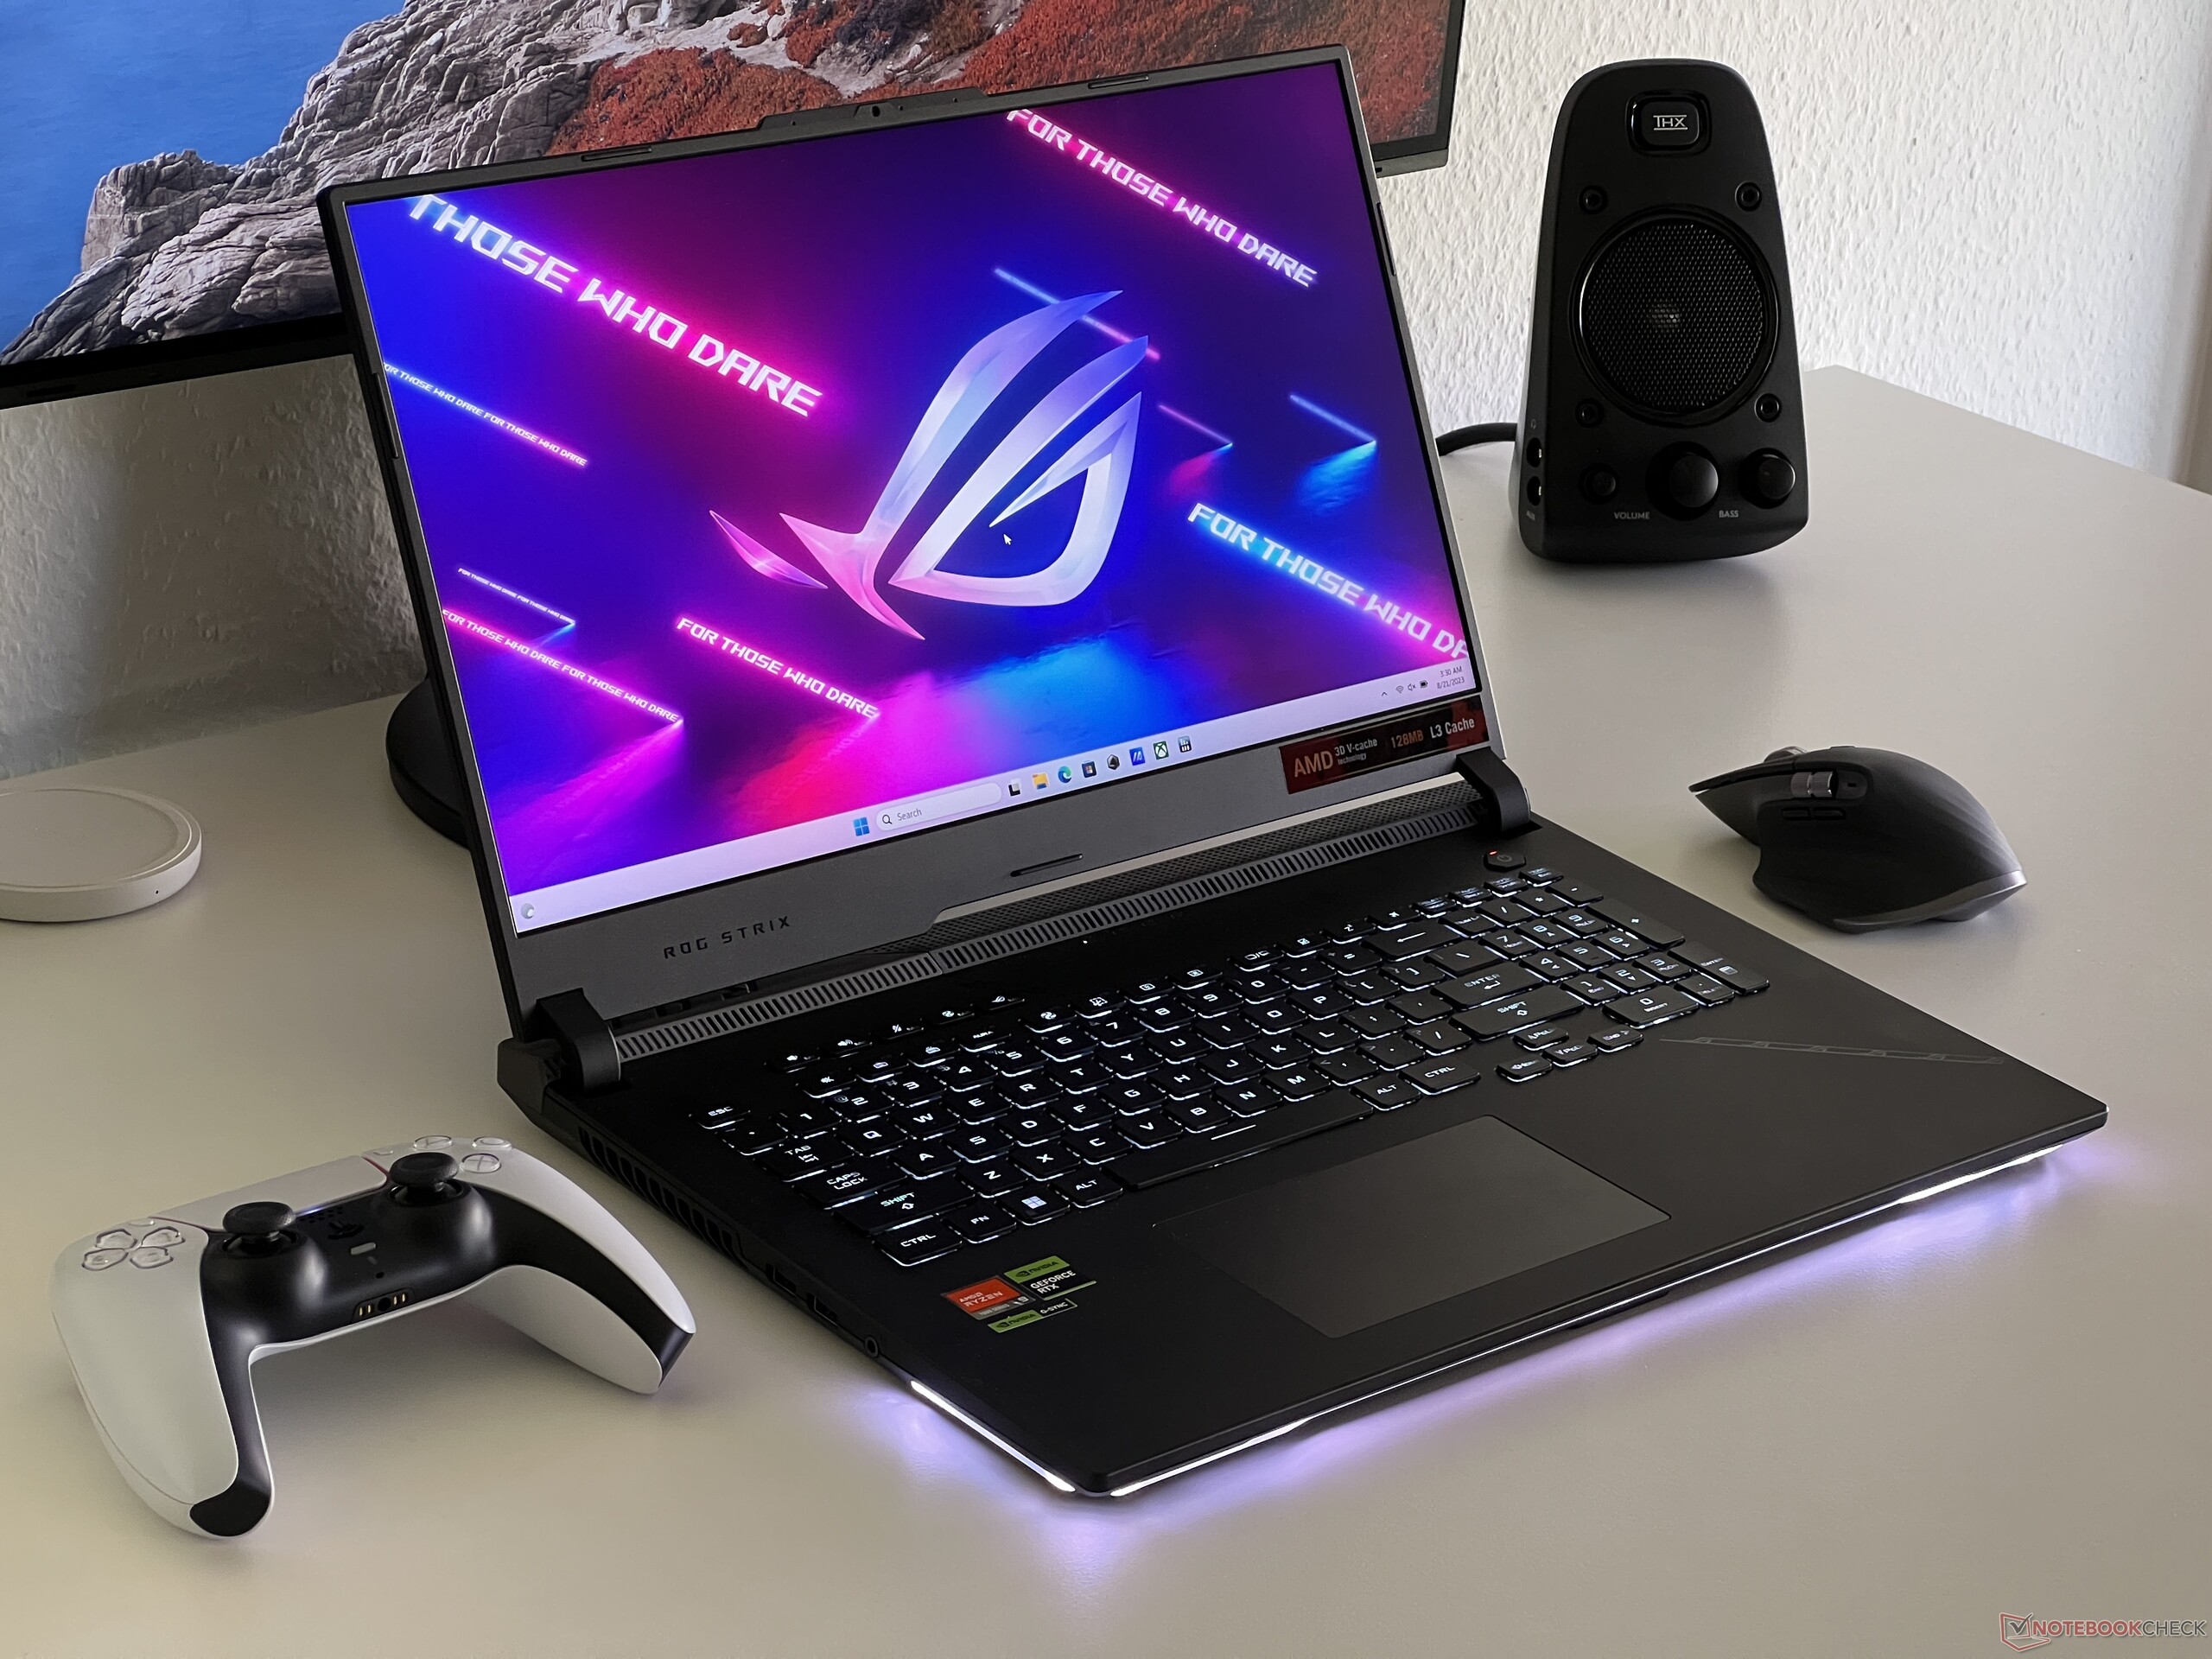
Puede que el ROG Strix SCAR 17 no sea el PC para juegos más moderno de Asus, pero sin duda es uno de los más rápidos del mercado. Ya hemos probado diversas configuraciones, en primer lugar la versión con procesador AMD Zen4 Ryzen 9 7945HX, así como el portátil Nvidia GeForce RTX 4090. Con el flamante ROG Strix SCAR 17 X3D, Asus ha cooperado con AMD para ser el primer fabricante en instalar el nuevo Ryzen 9 7945HX3D en un portátil que verá incrementado aún más su supuestamente ya buen rendimiento en juegos gracias al V-Cache 3D adicional.
Aparte del procesador, el ROG Strix SCAR 17 X3D no ofrece nada nuevo, por lo que en este análisis nos centraremos plenamente en su rendimiento y emisiones. Para más información sobre su carcasa, conectividad, dispositivos de entrada, pantalla y altavoces, puedes echar un vistazo a nuestro análisis anterior. Además, recomendamos echar un vistazo a nuestro artículo de análisis del nuevo AMD Ryzen 9 7945HX3D, que incluye toda la información técnica del procesador:
Posibles contendientes en la comparación
Valoración | Fecha | Modelo | Peso | Altura | Tamaño | Resolución | Precio |
|---|---|---|---|---|---|---|---|
| 87.2 % v7 (old) | 08/2023 | Asus ROG Strix Scar 17 G733PYV-LL053X R9 7945HX3D, GeForce RTX 4090 Laptop GPU | 2.9 kg | 28.3 mm | 17.30" | 2560x1440 | |
| 88.3 % v7 (old) | 04/2023 | Asus ROG Strix Scar 17 G733PY-XS96 R9 7945HX, GeForce RTX 4090 Laptop GPU | 2.9 kg | 28.3 mm | 17.30" | 2560x1440 | |
| 90.7 % v7 (old) | 04/2023 | Alienware m18 R1 i9-13980HX, GeForce RTX 4090 Laptop GPU | 3.9 kg | 26.7 mm | 18.00" | 1920x1200 | |
| 86.6 % v7 (old) | 02/2023 | Asus ROG Strix Scar 18 2023 G834JY-N6005W i9-13980HX, GeForce RTX 4090 Laptop GPU | 3.1 kg | 30.8 mm | 18.00" | 2560x1600 | |
| 89 % v7 (old) | 02/2023 | MSI Titan GT77 HX 13VI i9-13950HX, GeForce RTX 4090 Laptop GPU | 3.5 kg | 23 mm | 17.30" | 3840x2160 | |
| 85.5 % v7 (old) | 06/2023 | Schenker Key 17 Pro (Early 23) i9-13900HX, GeForce RTX 4090 Laptop GPU | 3.4 kg | 24.9 mm | 17.30" | 3840x2160 |
Rendimiento - El SCAR 17 X3D con lo mejor de AMD y Nvidia
En comparación con laROG Strix SCAR 17con elRyzen 9 7945HXesta versión presenta un cambio importante en la refrigeración del procesador. Debido a la textura metálica de la superficie del nuevo procesador 7945HX3D, no se puede usar metal líquido, sino pasta térmica normal. En general, su clasificación TDP sigue siendo la misma según Asus, pero pasa factura al rendimiento del portátil.
Condiciones de ensayo
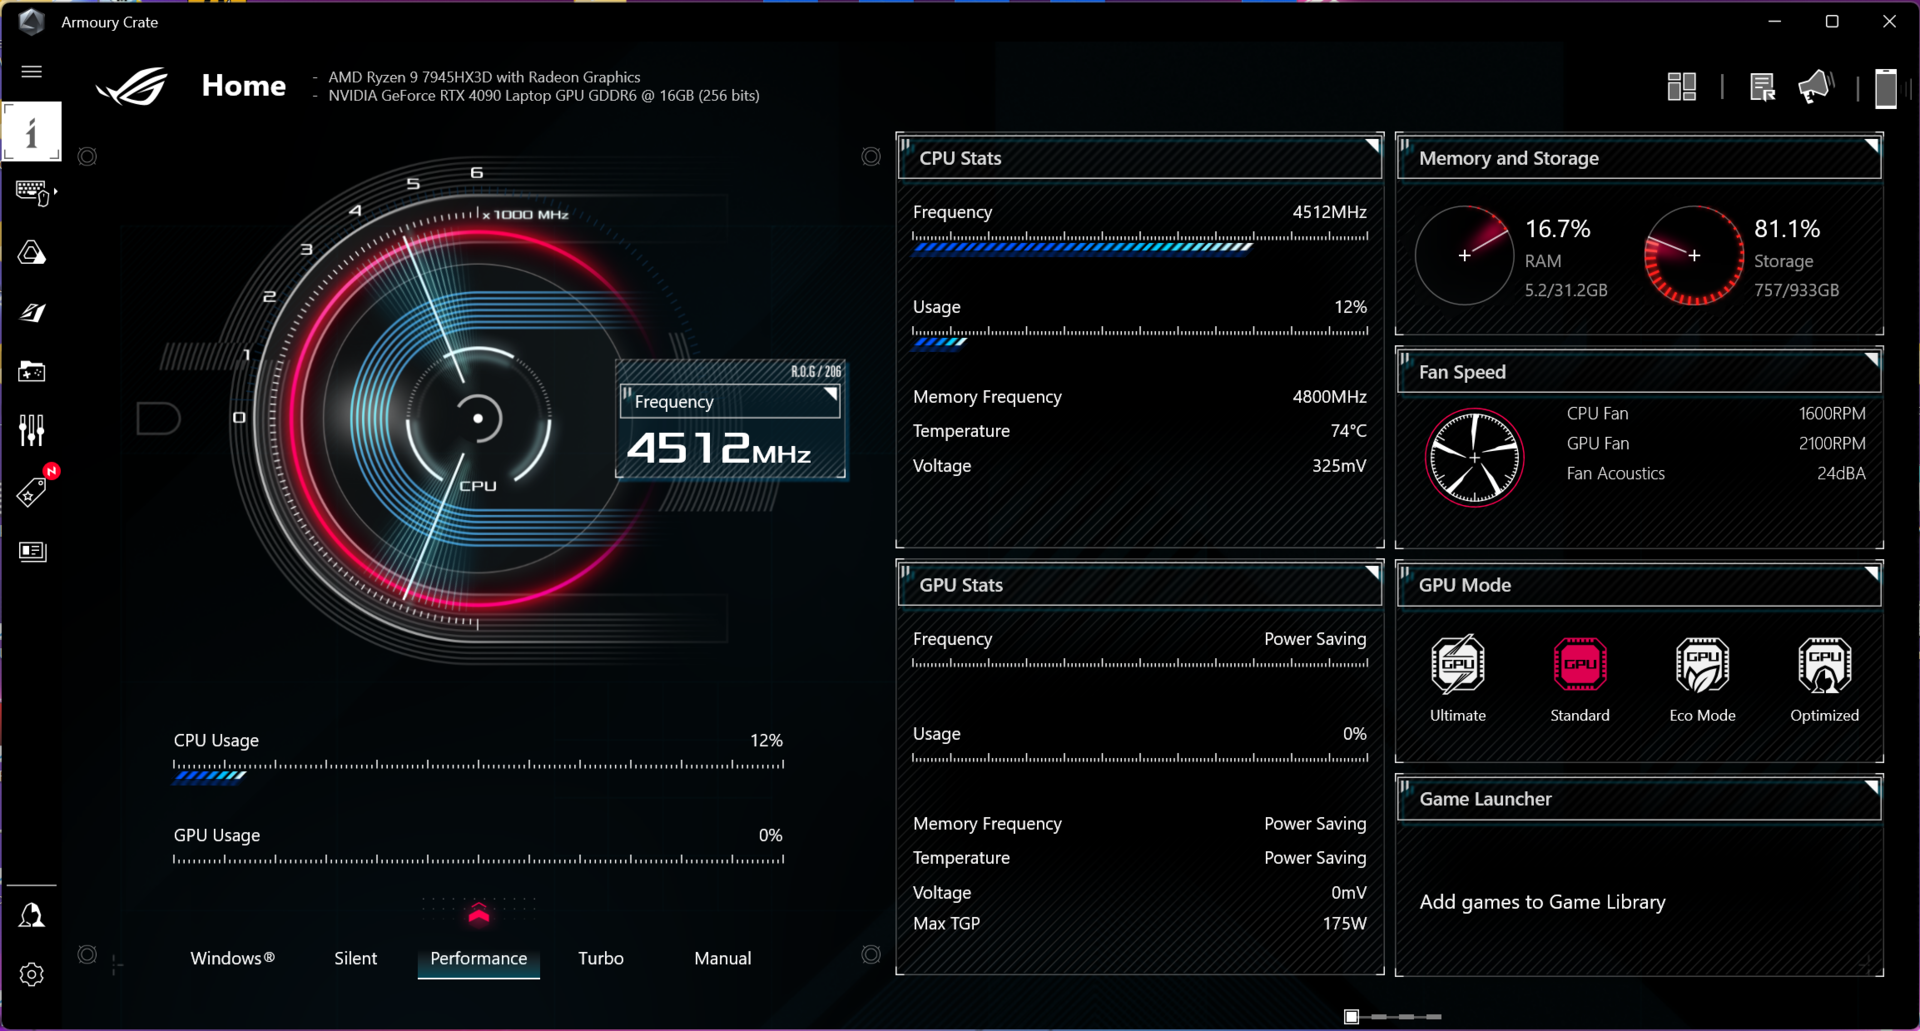
El software Armoury Crate preinstalado te da acceso a los conocidos perfiles de energía Silencio, Rendimiento y Turbo. Además, hay un modo manual que te permite cambiar los valores TDP/TGP de la CPU/GPU. También hay algunos modos de GPU para elegir - en nuestra prueba, utilizamos el modo Ultimate en coordinación con el perfil de energía Turbo. La siguiente tabla contiene los respectivos valores TDP/TGP en los diferentes perfiles de energía. En modo batería, el perfil Turbo no está disponible.
| Escenario | Silencioso | Rendimiento | Turbo |
|---|---|---|---|
| Carga de la CPU | 65/55 vatios | 90/85 vatios | 125/90 vatios |
| Carga de GPU | D-Notify | 140 + 20 vatios Dynamic Boost | 150 + 25 vatios Dynamic Boost |
| Prueba de esfuerzo | CPU: 35 vatios GPU: D-Notify |
CPU: 40 vatios GPU: 150 vatios |
CPU: 50 vatios GPU: 175 vatios |
Nota: D-Notify es una función específica de Nvidia. Con la función D-Notify activada, la GPU aumentará su consumo de energía en función de la aplicación/carga hasta que la GPU alcance una temperatura de 75 °C. En este caso, el TGP se limita a 55 vatios.
Procesador - Ryzen 9 7945HX3D
El nuevoAMD Ryzen 9 7945HX3Dson idénticas a las del modelo normalRyzen 9 7945HX: 16 núcleos Zen4 (32 hilos) con un reloj máximo de hasta 5,4 GHz. Sin embargo, en el nuevo modelo, la caché de 80 MB (16 MB L2 + 64 MB L3) se incrementa con una caché L3 adicional de 64 MB. Toda la información técnica adicional al respecto se puede encontrar en nuestro análisis del nuevo Ryzen 9 7945HX3D.
En contraste con el SCAR 17 con el Ryzen 9 7945HX normal, los benchmarks ejecutados usando la nueva versión mostraron valores de consumo de energía total más bajos. Observamos un máximo de hasta 115 vatios que rápidamente se equilibró en 100 vatios. Aquí, el metal líquido que falta ya se hace notar. Los resultados del benchmark siguen siendo fenomenales en total - aunque, cuando se trata del rendimiento puro de la CPU, los modelos 7945HX normales tienen una ligera ventaja. De nuevo, su rendimiento total es comparable al de las CPU Intel HX, que sólo lo hicieron mejor en ciertas pruebas de un solo núcleo. Al mismo tiempo, no hay que olvidar que los chips Intel consumen mucha más energía, tanto en el uso mononúcleo como, sobre todo, cuando todos los núcleos están cargados. Para comparar: El Ryzen 9 7945HX3D con 100 vatios fue considerablemente más rápido en las pruebas multinúcleo comparado con el Core i9-13980HX a 170 vatios.
En uso de batería, el procesador usa un máximo de 85 vatios durante un corto espacio de tiempo, tras lo cual se equilibra rápidamente a 55 vatios. En la prueba Cinebench R23 Multi, esto le bastó para asegurarse 24.127 puntos, lo que equivale a un déficit del 26 %. Su uso mononúcleo no fue limitado. Encontrará más pruebas de CPU en nuestra sección técnica Procesadores mobiles - lista de benchmarks (nueva) .
Cinebench R15 Multi continuous test
Cinebench R23: Multi Core | Single Core
Cinebench R20: CPU (Multi Core) | CPU (Single Core)
Cinebench R15: CPU Multi 64Bit | CPU Single 64Bit
Blender: v2.79 BMW27 CPU
7-Zip 18.03: 7z b 4 | 7z b 4 -mmt1
Geekbench 5.5: Multi-Core | Single-Core
HWBOT x265 Benchmark v2.2: 4k Preset
LibreOffice : 20 Documents To PDF
R Benchmark 2.5: Overall mean
| CPU Performance rating | |
| Asus ROG Strix Scar 17 G733PY-XS96 | |
| Asus ROG Strix Scar 17 G733PYV-LL053X | |
| Medio AMD Ryzen 9 7945HX3D | |
| Asus ROG Strix Scar 18 2023 G834JY-N6005W | |
| Alienware m18 R1 | |
| MSI Titan GT77 HX 13VI | |
| Lenovo Legion Pro 7 RTX4090 | |
| Schenker Key 17 Pro (Early 23) | |
| Media de la clase Gaming | |
| Lenovo Legion Pro 5 16ARX8 | |
| Asus ROG Zephyrus M16 GU604VY-NM042X | |
| Cinebench R23 / Multi Core | |
| Asus ROG Strix Scar 17 G733PY-XS96 | |
| MSI Titan GT77 HX 13VI | |
| Asus ROG Strix Scar 17 G733PYV-LL053X | |
| Medio AMD Ryzen 9 7945HX3D (n=1) | |
| Alienware m18 R1 | |
| Asus ROG Strix Scar 18 2023 G834JY-N6005W | |
| Lenovo Legion Pro 7 RTX4090 | |
| Schenker Key 17 Pro (Early 23) | |
| Media de la clase Gaming (10488 - 42661, n=104, últimos 2 años) | |
| Asus ROG Zephyrus M16 GU604VY-NM042X | |
| Lenovo Legion Pro 5 16ARX8 | |
| Cinebench R23 / Single Core | |
| Asus ROG Strix Scar 18 2023 G834JY-N6005W | |
| Alienware m18 R1 | |
| MSI Titan GT77 HX 13VI | |
| Lenovo Legion Pro 7 RTX4090 | |
| Schenker Key 17 Pro (Early 23) | |
| Media de la clase Gaming (1601 - 2415, n=104, últimos 2 años) | |
| Asus ROG Zephyrus M16 GU604VY-NM042X | |
| Asus ROG Strix Scar 17 G733PYV-LL053X | |
| Medio AMD Ryzen 9 7945HX3D (n=1) | |
| Asus ROG Strix Scar 17 G733PY-XS96 | |
| Lenovo Legion Pro 5 16ARX8 | |
| Cinebench R20 / CPU (Multi Core) | |
| Asus ROG Strix Scar 17 G733PY-XS96 | |
| Asus ROG Strix Scar 17 G733PYV-LL053X | |
| Medio AMD Ryzen 9 7945HX3D (n=1) | |
| MSI Titan GT77 HX 13VI | |
| Alienware m18 R1 | |
| Asus ROG Strix Scar 18 2023 G834JY-N6005W | |
| Lenovo Legion Pro 7 RTX4090 | |
| Schenker Key 17 Pro (Early 23) | |
| Media de la clase Gaming (4029 - 16433, n=103, últimos 2 años) | |
| Asus ROG Zephyrus M16 GU604VY-NM042X | |
| Lenovo Legion Pro 5 16ARX8 | |
| Cinebench R20 / CPU (Single Core) | |
| Asus ROG Strix Scar 18 2023 G834JY-N6005W | |
| Alienware m18 R1 | |
| MSI Titan GT77 HX 13VI | |
| Media de la clase Gaming (622 - 913, n=103, últimos 2 años) | |
| Schenker Key 17 Pro (Early 23) | |
| Lenovo Legion Pro 7 RTX4090 | |
| Asus ROG Strix Scar 17 G733PYV-LL053X | |
| Medio AMD Ryzen 9 7945HX3D (n=1) | |
| Asus ROG Zephyrus M16 GU604VY-NM042X | |
| Asus ROG Strix Scar 17 G733PY-XS96 | |
| Lenovo Legion Pro 5 16ARX8 | |
| Cinebench R15 / CPU Multi 64Bit | |
| Asus ROG Strix Scar 17 G733PYV-LL053X | |
| Medio AMD Ryzen 9 7945HX3D (n=1) | |
| Asus ROG Strix Scar 17 G733PY-XS96 | |
| MSI Titan GT77 HX 13VI | |
| Alienware m18 R1 | |
| Asus ROG Strix Scar 18 2023 G834JY-N6005W | |
| Lenovo Legion Pro 7 RTX4090 | |
| Schenker Key 17 Pro (Early 23) | |
| Media de la clase Gaming (1578 - 6330, n=102, últimos 2 años) | |
| Asus ROG Zephyrus M16 GU604VY-NM042X | |
| Lenovo Legion Pro 5 16ARX8 | |
| Cinebench R15 / CPU Single 64Bit | |
| Asus ROG Strix Scar 18 2023 G834JY-N6005W | |
| Asus ROG Strix Scar 17 G733PYV-LL053X | |
| Medio AMD Ryzen 9 7945HX3D (n=1) | |
| Asus ROG Strix Scar 17 G733PY-XS96 | |
| Alienware m18 R1 | |
| MSI Titan GT77 HX 13VI | |
| Media de la clase Gaming (188.8 - 350, n=103, últimos 2 años) | |
| Lenovo Legion Pro 5 16ARX8 | |
| Asus ROG Zephyrus M16 GU604VY-NM042X | |
| Schenker Key 17 Pro (Early 23) | |
| Lenovo Legion Pro 7 RTX4090 | |
| Blender / v2.79 BMW27 CPU | |
| Lenovo Legion Pro 5 16ARX8 | |
| Asus ROG Zephyrus M16 GU604VY-NM042X | |
| Media de la clase Gaming (79 - 330, n=101, últimos 2 años) | |
| Schenker Key 17 Pro (Early 23) | |
| Lenovo Legion Pro 7 RTX4090 | |
| Asus ROG Strix Scar 18 2023 G834JY-N6005W | |
| MSI Titan GT77 HX 13VI | |
| Alienware m18 R1 | |
| Asus ROG Strix Scar 17 G733PYV-LL053X | |
| Medio AMD Ryzen 9 7945HX3D (n=1) | |
| Asus ROG Strix Scar 17 G733PY-XS96 | |
| 7-Zip 18.03 / 7z b 4 -mmt1 | |
| Asus ROG Strix Scar 17 G733PY-XS96 | |
| Asus ROG Strix Scar 17 G733PYV-LL053X | |
| Medio AMD Ryzen 9 7945HX3D (n=1) | |
| Lenovo Legion Pro 5 16ARX8 | |
| Asus ROG Strix Scar 18 2023 G834JY-N6005W | |
| Lenovo Legion Pro 7 RTX4090 | |
| MSI Titan GT77 HX 13VI | |
| Alienware m18 R1 | |
| Schenker Key 17 Pro (Early 23) | |
| Media de la clase Gaming (4824 - 7436, n=102, últimos 2 años) | |
| Asus ROG Zephyrus M16 GU604VY-NM042X | |
| Geekbench 5.5 / Multi-Core | |
| Alienware m18 R1 | |
| Asus ROG Strix Scar 18 2023 G834JY-N6005W | |
| MSI Titan GT77 HX 13VI | |
| Lenovo Legion Pro 7 RTX4090 | |
| Asus ROG Strix Scar 17 G733PYV-LL053X | |
| Medio AMD Ryzen 9 7945HX3D (n=1) | |
| Schenker Key 17 Pro (Early 23) | |
| Asus ROG Strix Scar 17 G733PY-XS96 | |
| Media de la clase Gaming (6460 - 28263, n=102, últimos 2 años) | |
| Asus ROG Zephyrus M16 GU604VY-NM042X | |
| Lenovo Legion Pro 5 16ARX8 | |
| Geekbench 5.5 / Single-Core | |
| Asus ROG Strix Scar 17 G733PYV-LL053X | |
| Medio AMD Ryzen 9 7945HX3D (n=1) | |
| Asus ROG Strix Scar 18 2023 G834JY-N6005W | |
| Media de la clase Gaming (1403 - 2474, n=102, últimos 2 años) | |
| Alienware m18 R1 | |
| Asus ROG Strix Scar 17 G733PY-XS96 | |
| MSI Titan GT77 HX 13VI | |
| Lenovo Legion Pro 5 16ARX8 | |
| Lenovo Legion Pro 7 RTX4090 | |
| Asus ROG Zephyrus M16 GU604VY-NM042X | |
| Schenker Key 17 Pro (Early 23) | |
| HWBOT x265 Benchmark v2.2 / 4k Preset | |
| Asus ROG Strix Scar 17 G733PY-XS96 | |
| Asus ROG Strix Scar 17 G733PYV-LL053X | |
| Medio AMD Ryzen 9 7945HX3D (n=1) | |
| Asus ROG Strix Scar 18 2023 G834JY-N6005W | |
| Alienware m18 R1 | |
| MSI Titan GT77 HX 13VI | |
| Lenovo Legion Pro 7 RTX4090 | |
| Media de la clase Gaming (11.5 - 44.4, n=102, últimos 2 años) | |
| Schenker Key 17 Pro (Early 23) | |
| Lenovo Legion Pro 5 16ARX8 | |
| Asus ROG Zephyrus M16 GU604VY-NM042X | |
| LibreOffice / 20 Documents To PDF | |
| Asus ROG Zephyrus M16 GU604VY-NM042X | |
| Media de la clase Gaming (33.2 - 88.8, n=102, últimos 2 años) | |
| Alienware m18 R1 | |
| MSI Titan GT77 HX 13VI | |
| Schenker Key 17 Pro (Early 23) | |
| Lenovo Legion Pro 7 RTX4090 | |
| Asus ROG Strix Scar 17 G733PYV-LL053X | |
| Medio AMD Ryzen 9 7945HX3D (n=1) | |
| Lenovo Legion Pro 5 16ARX8 | |
| Asus ROG Strix Scar 17 G733PY-XS96 | |
| Asus ROG Strix Scar 18 2023 G834JY-N6005W | |
| R Benchmark 2.5 / Overall mean | |
| Media de la clase Gaming (0.3439 - 0.59, n=102, últimos 2 años) | |
| Lenovo Legion Pro 5 16ARX8 | |
| Asus ROG Strix Scar 17 G733PYV-LL053X | |
| Medio AMD Ryzen 9 7945HX3D (n=1) | |
| Asus ROG Zephyrus M16 GU604VY-NM042X | |
| Asus ROG Strix Scar 17 G733PY-XS96 | |
| MSI Titan GT77 HX 13VI | |
| Lenovo Legion Pro 7 RTX4090 | |
| Schenker Key 17 Pro (Early 23) | |
| Alienware m18 R1 | |
| Asus ROG Strix Scar 18 2023 G834JY-N6005W | |
* ... más pequeño es mejor
AIDA64: FP32 Ray-Trace | FPU Julia | CPU SHA3 | CPU Queen | FPU SinJulia | FPU Mandel | CPU AES | CPU ZLib | FP64 Ray-Trace | CPU PhotoWorxx
| Performance rating | |
| Asus ROG Strix Scar 17 G733PYV-LL053X | |
| Medio AMD Ryzen 9 7945HX3D | |
| Asus ROG Strix Scar 17 G733PY-XS96 | |
| Alienware m18 R1 | |
| Asus ROG Strix Scar 18 2023 G834JY-N6005W | |
| MSI Titan GT77 HX 13VI | |
| Lenovo Legion Pro 7 RTX4090 | |
| Media de la clase Gaming | |
| Schenker Key 17 Pro (Early 23) | |
| Lenovo Legion Pro 5 16ARX8 | |
| Asus ROG Zephyrus M16 GU604VY-NM042X | |
| AIDA64 / FP32 Ray-Trace | |
| Asus ROG Strix Scar 17 G733PY-XS96 | |
| Asus ROG Strix Scar 17 G733PYV-LL053X | |
| Medio AMD Ryzen 9 7945HX3D (n=1) | |
| Media de la clase Gaming (10227 - 85542, n=102, últimos 2 años) | |
| Lenovo Legion Pro 5 16ARX8 | |
| Alienware m18 R1 | |
| MSI Titan GT77 HX 13VI | |
| Asus ROG Strix Scar 18 2023 G834JY-N6005W | |
| Lenovo Legion Pro 7 RTX4090 | |
| Schenker Key 17 Pro (Early 23) | |
| Asus ROG Zephyrus M16 GU604VY-NM042X | |
| AIDA64 / FPU SinJulia | |
| Asus ROG Strix Scar 17 G733PY-XS96 | |
| Asus ROG Strix Scar 17 G733PYV-LL053X | |
| Medio AMD Ryzen 9 7945HX3D (n=1) | |
| Asus ROG Strix Scar 18 2023 G834JY-N6005W | |
| MSI Titan GT77 HX 13VI | |
| Alienware m18 R1 | |
| Lenovo Legion Pro 5 16ARX8 | |
| Lenovo Legion Pro 7 RTX4090 | |
| Media de la clase Gaming (4424 - 33636, n=102, últimos 2 años) | |
| Schenker Key 17 Pro (Early 23) | |
| Asus ROG Zephyrus M16 GU604VY-NM042X | |
| AIDA64 / FP64 Ray-Trace | |
| Asus ROG Strix Scar 17 G733PY-XS96 | |
| Asus ROG Strix Scar 17 G733PYV-LL053X | |
| Medio AMD Ryzen 9 7945HX3D (n=1) | |
| Media de la clase Gaming (5509 - 45446, n=102, últimos 2 años) | |
| Alienware m18 R1 | |
| Lenovo Legion Pro 5 16ARX8 | |
| MSI Titan GT77 HX 13VI | |
| Asus ROG Strix Scar 18 2023 G834JY-N6005W | |
| Lenovo Legion Pro 7 RTX4090 | |
| Schenker Key 17 Pro (Early 23) | |
| Asus ROG Zephyrus M16 GU604VY-NM042X | |
| AIDA64 / CPU PhotoWorxx | |
| Alienware m18 R1 | |
| Lenovo Legion Pro 7 RTX4090 | |
| Schenker Key 17 Pro (Early 23) | |
| Asus ROG Zephyrus M16 GU604VY-NM042X | |
| Media de la clase Gaming (12271 - 89891, n=102, últimos 2 años) | |
| Asus ROG Strix Scar 18 2023 G834JY-N6005W | |
| MSI Titan GT77 HX 13VI | |
| Asus ROG Strix Scar 17 G733PYV-LL053X | |
| Medio AMD Ryzen 9 7945HX3D (n=1) | |
| Asus ROG Strix Scar 17 G733PY-XS96 | |
| Lenovo Legion Pro 5 16ARX8 | |
Rendimiento del sistema
El nuevo ROG Strix SCAR 17 X3D también lo hizo mejor que la competencia en la prueba sintética PCMark 10 - aunque, las diferencias no eran grandes y en el uso diario, todos los dispositivos de comparación son extremadamente rápidos. El dispositivo de prueba AMD sólo quedó por detrás de sus competidores Intel más rápidos en la prueba CrossMark multiplataforma.
CrossMark: Overall | Productivity | Creativity | Responsiveness
| PCMark 10 / Score | |
| Asus ROG Strix Scar 17 G733PYV-LL053X | |
| Medio AMD Ryzen 9 7945HX3D, NVIDIA GeForce RTX 4090 Laptop GPU (n=1) | |
| Schenker Key 17 Pro (Early 23) | |
| MSI Titan GT77 HX 13VI | |
| Asus ROG Strix Scar 18 2023 G834JY-N6005W | |
| Alienware m18 R1 | |
| Asus ROG Strix Scar 17 G733PY-XS96 | |
| Media de la clase Gaming (5828 - 12414, n=93, últimos 2 años) | |
| Asus ROG Zephyrus M16 GU604VY-NM042X | |
| Lenovo Legion Pro 5 16ARX8 | |
| Lenovo Legion Pro 7 RTX4090 | |
| PCMark 10 / Essentials | |
| MSI Titan GT77 HX 13VI | |
| Asus ROG Zephyrus M16 GU604VY-NM042X | |
| Asus ROG Strix Scar 17 G733PYV-LL053X | |
| Medio AMD Ryzen 9 7945HX3D, NVIDIA GeForce RTX 4090 Laptop GPU (n=1) | |
| Schenker Key 17 Pro (Early 23) | |
| Alienware m18 R1 | |
| Asus ROG Strix Scar 17 G733PY-XS96 | |
| Lenovo Legion Pro 7 RTX4090 | |
| Lenovo Legion Pro 5 16ARX8 | |
| Media de la clase Gaming (8810 - 11935, n=97, últimos 2 años) | |
| PCMark 10 / Productivity | |
| Media de la clase Gaming (6845 - 25323, n=95, últimos 2 años) | |
| Schenker Key 17 Pro (Early 23) | |
| Asus ROG Zephyrus M16 GU604VY-NM042X | |
| Asus ROG Strix Scar 17 G733PYV-LL053X | |
| Medio AMD Ryzen 9 7945HX3D, NVIDIA GeForce RTX 4090 Laptop GPU (n=1) | |
| Asus ROG Strix Scar 17 G733PY-XS96 | |
| Lenovo Legion Pro 5 16ARX8 | |
| Alienware m18 R1 | |
| MSI Titan GT77 HX 13VI | |
| Lenovo Legion Pro 7 RTX4090 | |
| PCMark 10 / Digital Content Creation | |
| MSI Titan GT77 HX 13VI | |
| Asus ROG Strix Scar 17 G733PYV-LL053X | |
| Medio AMD Ryzen 9 7945HX3D, NVIDIA GeForce RTX 4090 Laptop GPU (n=1) | |
| Alienware m18 R1 | |
| Asus ROG Strix Scar 17 G733PY-XS96 | |
| Schenker Key 17 Pro (Early 23) | |
| Lenovo Legion Pro 7 RTX4090 | |
| Media de la clase Gaming (7602 - 19954, n=95, últimos 2 años) | |
| Lenovo Legion Pro 5 16ARX8 | |
| Asus ROG Zephyrus M16 GU604VY-NM042X | |
| CrossMark / Overall | |
| Schenker Key 17 Pro (Early 23) | |
| Alienware m18 R1 | |
| MSI Titan GT77 HX 13VI | |
| Asus ROG Strix Scar 17 G733PYV-LL053X | |
| Medio AMD Ryzen 9 7945HX3D, NVIDIA GeForce RTX 4090 Laptop GPU (n=1) | |
| Asus ROG Strix Scar 18 2023 G834JY-N6005W | |
| Lenovo Legion Pro 5 16ARX8 | |
| Asus ROG Strix Scar 17 G733PY-XS96 | |
| Media de la clase Gaming (1366 - 2409, n=94, últimos 2 años) | |
| Asus ROG Zephyrus M16 GU604VY-NM042X | |
| CrossMark / Productivity | |
| Schenker Key 17 Pro (Early 23) | |
| Alienware m18 R1 | |
| MSI Titan GT77 HX 13VI | |
| Asus ROG Strix Scar 17 G733PYV-LL053X | |
| Medio AMD Ryzen 9 7945HX3D, NVIDIA GeForce RTX 4090 Laptop GPU (n=1) | |
| Lenovo Legion Pro 5 16ARX8 | |
| Asus ROG Strix Scar 18 2023 G834JY-N6005W | |
| Media de la clase Gaming (1386 - 2254, n=94, últimos 2 años) | |
| Asus ROG Zephyrus M16 GU604VY-NM042X | |
| Asus ROG Strix Scar 17 G733PY-XS96 | |
| CrossMark / Creativity | |
| Alienware m18 R1 | |
| Asus ROG Strix Scar 18 2023 G834JY-N6005W | |
| Schenker Key 17 Pro (Early 23) | |
| MSI Titan GT77 HX 13VI | |
| Asus ROG Strix Scar 17 G733PYV-LL053X | |
| Medio AMD Ryzen 9 7945HX3D, NVIDIA GeForce RTX 4090 Laptop GPU (n=1) | |
| Asus ROG Strix Scar 17 G733PY-XS96 | |
| Media de la clase Gaming (1343 - 2786, n=94, últimos 2 años) | |
| Asus ROG Zephyrus M16 GU604VY-NM042X | |
| Lenovo Legion Pro 5 16ARX8 | |
| CrossMark / Responsiveness | |
| Schenker Key 17 Pro (Early 23) | |
| Alienware m18 R1 | |
| MSI Titan GT77 HX 13VI | |
| Lenovo Legion Pro 5 16ARX8 | |
| Media de la clase Gaming (1226 - 2334, n=94, últimos 2 años) | |
| Asus ROG Zephyrus M16 GU604VY-NM042X | |
| Asus ROG Strix Scar 17 G733PYV-LL053X | |
| Medio AMD Ryzen 9 7945HX3D, NVIDIA GeForce RTX 4090 Laptop GPU (n=1) | |
| Asus ROG Strix Scar 18 2023 G834JY-N6005W | |
| Asus ROG Strix Scar 17 G733PY-XS96 | |
| PCMark 10 Score | 9117 puntos | |
ayuda | ||
| AIDA64 / Memory Write | |
| Alienware m18 R1 | |
| Schenker Key 17 Pro (Early 23) | |
| Lenovo Legion Pro 7 RTX4090 | |
| Media de la clase Gaming (22297 - 135096, n=102, últimos 2 años) | |
| Asus ROG Zephyrus M16 GU604VY-NM042X | |
| Asus ROG Strix Scar 18 2023 G834JY-N6005W | |
| MSI Titan GT77 HX 13VI | |
| Asus ROG Strix Scar 17 G733PY-XS96 | |
| Asus ROG Strix Scar 17 G733PYV-LL053X | |
| Medio AMD Ryzen 9 7945HX3D (n=1) | |
| Lenovo Legion Pro 5 16ARX8 | |
| AIDA64 / Memory Latency | |
| Media de la clase Gaming (75.3 - 165.4, n=102, últimos 2 años) | |
| MSI Titan GT77 HX 13VI | |
| Asus ROG Strix Scar 18 2023 G834JY-N6005W | |
| Schenker Key 17 Pro (Early 23) | |
| Asus ROG Strix Scar 17 G733PYV-LL053X | |
| Medio AMD Ryzen 9 7945HX3D (n=1) | |
| Asus ROG Zephyrus M16 GU604VY-NM042X | |
| Lenovo Legion Pro 5 16ARX8 | |
| Lenovo Legion Pro 7 RTX4090 | |
| Asus ROG Strix Scar 17 G733PY-XS96 | |
| Alienware m18 R1 | |
* ... más pequeño es mejor
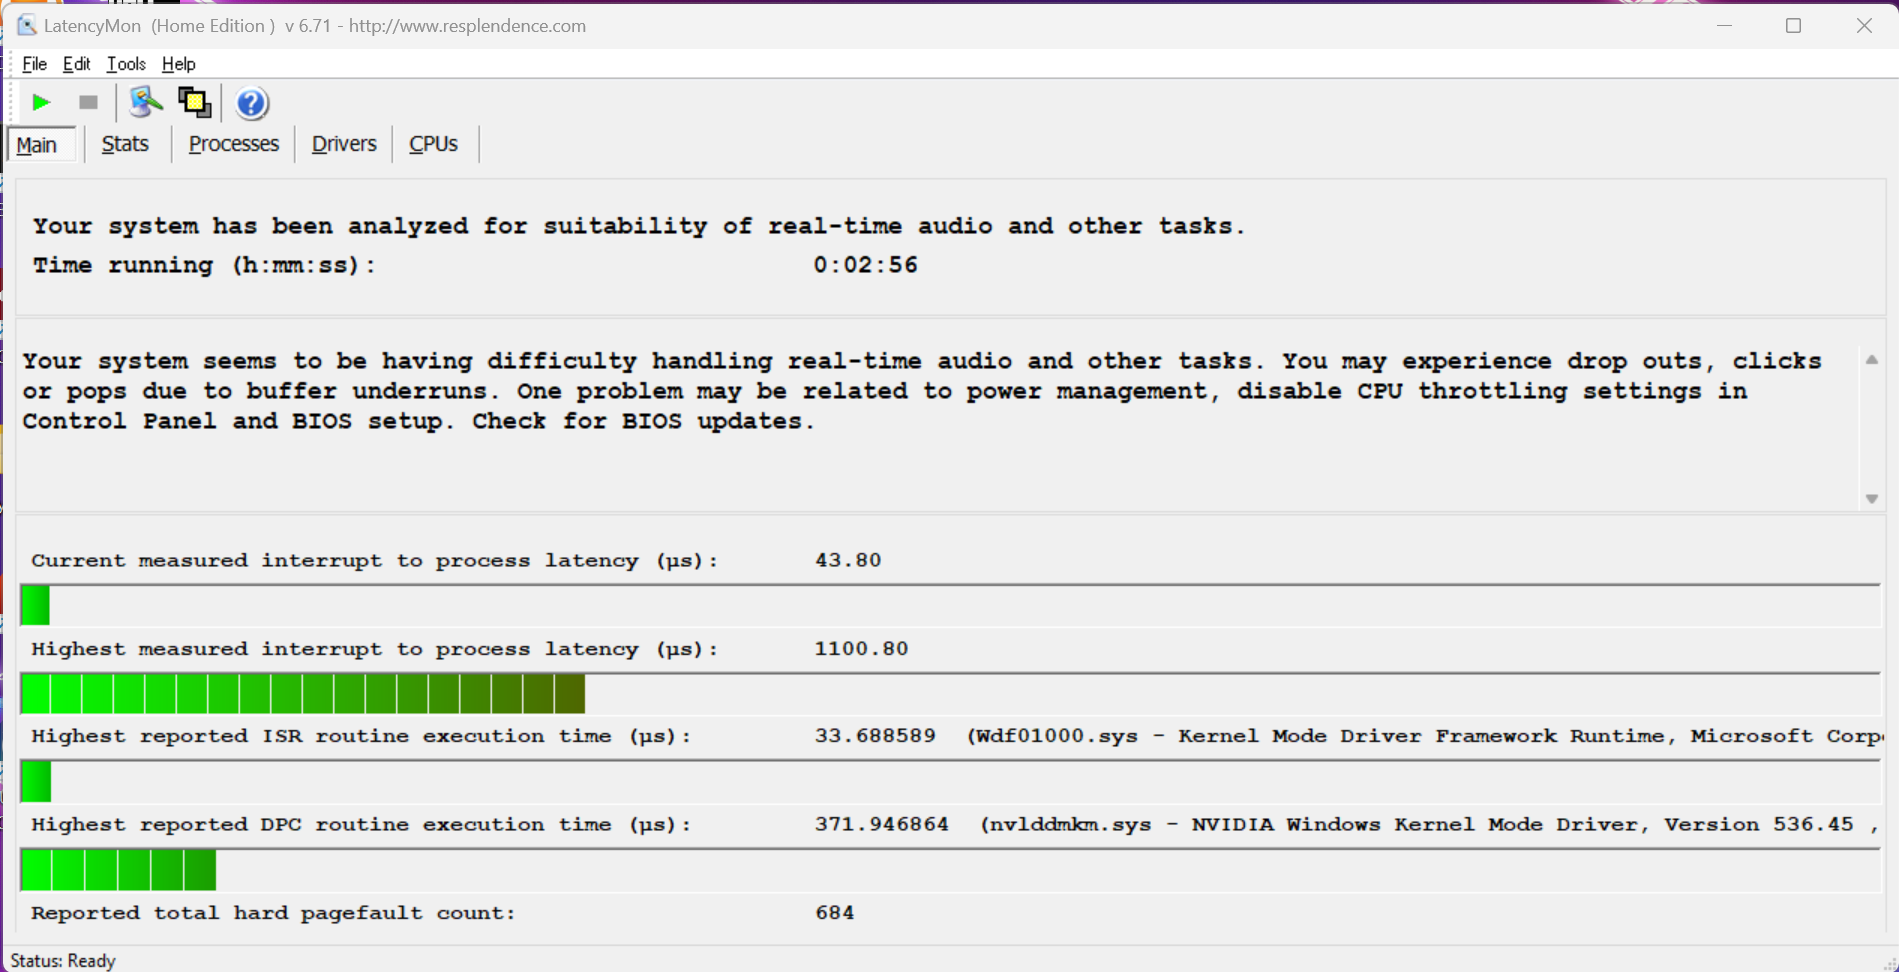
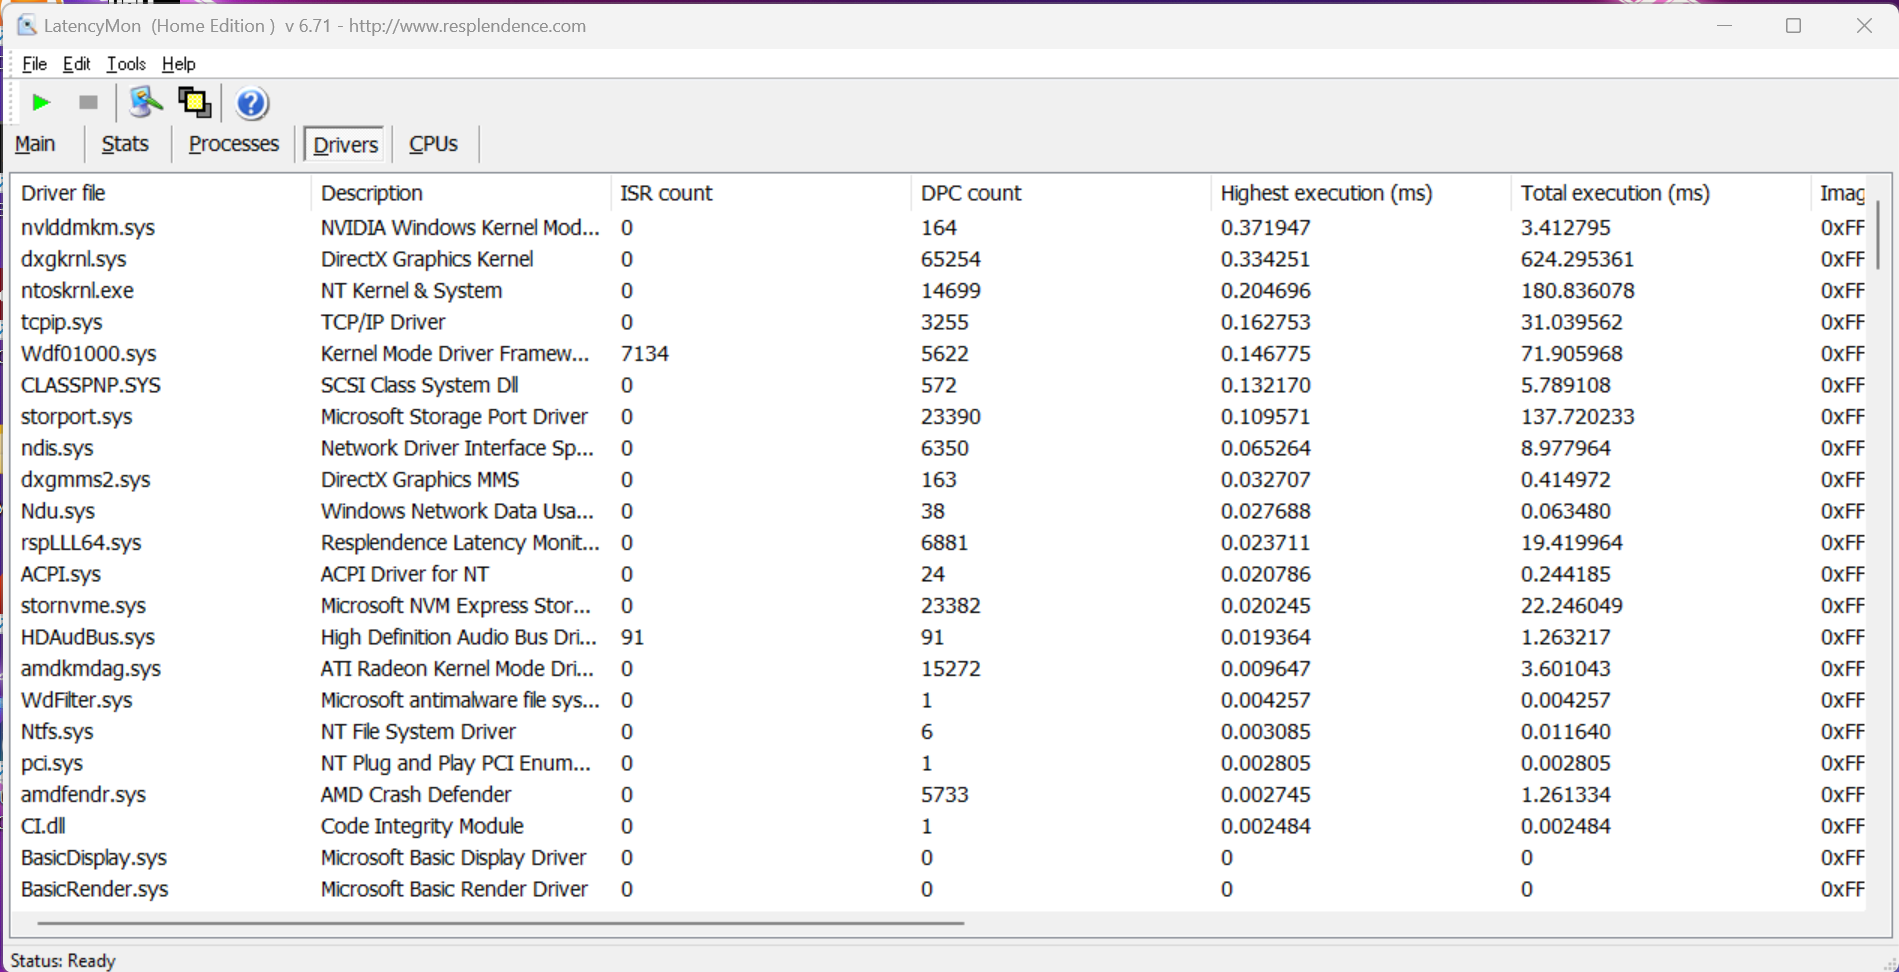
Latencia del CPD
En nuestra prueba de latencia estandarizada (navegación web, reproducción 4K de YouTube, carga de la CPU), nuestro dispositivo de pruebas mostró ligeras restricciones al usar aplicaciones de audio en tiempo real con la versión actual de la BIOS.
| DPC Latencies / LatencyMon - interrupt to process latency (max), Web, Youtube, Prime95 | |
| Asus ROG Strix Scar 17 G733PYV-LL053X | |
* ... más pequeño es mejor
Dispositivos de almacenamiento
En el ROG Strix SCAR 17 X3D se ha instalado un SSD de 1 TB de SK Hynix (PC801). El SSD M.2 2280 se conecta a través de la rápida interfaz PCIe 4.0 y ofrece muy buenas velocidades de transferencia. Además, su rendimiento se mantiene estable incluso bajo carga permanente. Tras el primer arranque, los usuarios disponen de 868 GB, pero gracias a la segunda ranura M.2 (también M.2 2280, PCIe 4.0), el espacio de almacenamiento puede ampliarse si es necesario. Más pruebas de SSD aquí.

Reading continuous performance: DiskSpd Read Loop, Queue Depth 8
Tarjeta gráfica - GeForce RTX 4090 Portátil
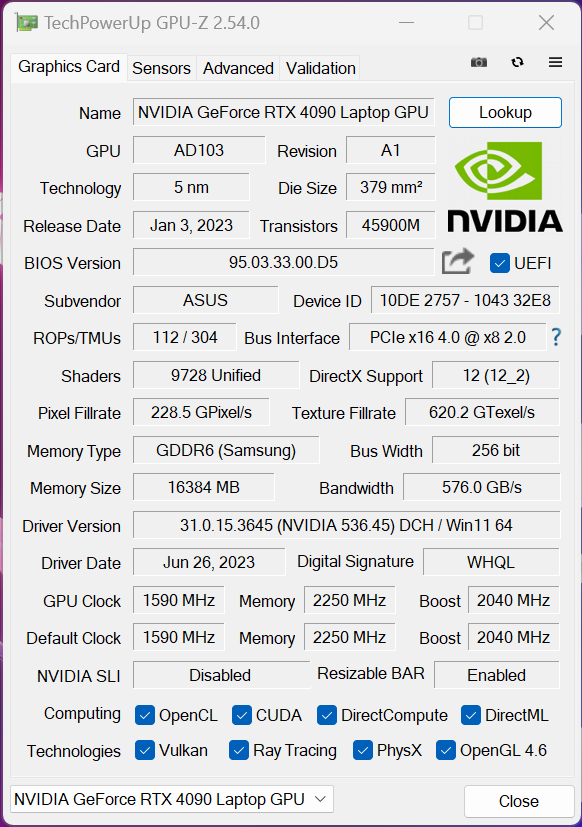
El ROG Strix SCAR 17 X3D es compatible con la tecnología Advanced Optimus de Nvidia. Al completar tareas sencillas, el procesador integradoRadeon 610Mse encarga del procesamiento gráfico y, para tareas más exigentes (por ejemplo, juegos), el portátil cambia automáticamente a la tarjeta dedicadaGeForce Portátil RTX 4090. Gracias a un interruptor MUX integrado, la iGPU puede desactivarse sin necesidad de reiniciar completamente el portátil. Con un consumo máximo de 175 vatios (150 vatios TGP + 25 vatios Dynamic Boost), esta es una de las versiones más rápidas del RTX 4090 Laptop.
Puede que haya habido una o dos diferencias en los benchmarks, pero en total, los portátiles equipados con la RTX 4090 Laptop funcionan prácticamente igual. En uso de batería, el GeForce RTX 4090 Laptop podía consumir un máximo de 55 vatios, lo que fue suficiente para asegurarse una puntuación gráfica de 5.590 puntos en nuestra prueba Time Spy. Esto corresponde a un déficit del 75 %. Puedes encontrar más pruebas de GPU en aquí.
| 3DMark 11 Performance | 47621 puntos | |
| 3DMark Fire Strike Score | 41279 puntos | |
| 3DMark Time Spy Score | 19832 puntos | |
| 3DMark Steel Nomad Score | 5139 puntos | |
ayuda | ||
| Blender / v3.3 Classroom OPTIX/RTX | |
| Lenovo Legion Pro 5 16ARX8 | |
| Media de la clase Gaming (9 - 32, n=103, últimos 2 años) | |
| Asus ROG Zephyrus M16 GU604VY-NM042X | |
| Medio NVIDIA GeForce RTX 4090 Laptop GPU (9 - 19, n=39) | |
| Lenovo Legion Pro 7 RTX4090 | |
| MSI Titan GT77 HX 13VI | |
| Asus ROG Strix Scar 17 G733PY-XS96 | |
| Schenker Key 17 Pro (Early 23) | |
| Asus ROG Strix Scar 17 G733PYV-LL053X | |
| Asus ROG Strix Scar 18 2023 G834JY-N6005W | |
| Blender / v3.3 Classroom CUDA | |
| Lenovo Legion Pro 5 16ARX8 | |
| Media de la clase Gaming (15 - 228, n=103, últimos 2 años) | |
| Schenker Key 17 Pro (Early 23) | |
| Medio NVIDIA GeForce RTX 4090 Laptop GPU (16 - 24, n=39) | |
| Asus ROG Strix Scar 18 2023 G834JY-N6005W | |
| Asus ROG Strix Scar 18 2023 G834JY-N6005W | |
| Asus ROG Zephyrus M16 GU604VY-NM042X | |
| Lenovo Legion Pro 7 RTX4090 | |
| Asus ROG Strix Scar 17 G733PYV-LL053X | |
| MSI Titan GT77 HX 13VI | |
| Alienware m18 R1 | |
| Asus ROG Strix Scar 17 G733PY-XS96 | |
| Blender / v3.3 Classroom CPU | |
| Asus ROG Zephyrus M16 GU604VY-NM042X | |
| Lenovo Legion Pro 5 16ARX8 | |
| Media de la clase Gaming (122 - 565, n=99, últimos 2 años) | |
| Schenker Key 17 Pro (Early 23) | |
| Medio NVIDIA GeForce RTX 4090 Laptop GPU (144 - 305, n=39) | |
| Lenovo Legion Pro 7 RTX4090 | |
| Asus ROG Strix Scar 18 2023 G834JY-N6005W | |
| MSI Titan GT77 HX 13VI | |
| Alienware m18 R1 | |
| Asus ROG Strix Scar 17 G733PYV-LL053X | |
| Asus ROG Strix Scar 17 G733PY-XS96 | |
* ... más pequeño es mejor
Rendimiento en juegos
Ahora es el momento de echar un vistazo a los benchmarks de juegos. En primer lugar, analizaremos la resolución Full HD. Aquí, el nuevoRyzen 9 7945HX3Dpudo mostrar claramente sus fortalezas en ciertos juegos y a menudo notamos ventajas porcentuales de dos dígitos; en Far Cry 5, incluso medimos una enorme ventaja del 36 % sobre el Ryzen 9 7945HX normal, así como sobre las CPU HX de Intel. Sin embargo, tampoco hubo ventaja en unos pocos juegos, como The Witcher 3 o Call of Duty Modern Warfare 2.
| The Witcher 3 - 1920x1080 Ultra Graphics & Postprocessing (HBAO+) | |
| Alienware m18 R1 | |
| Asus ROG Strix Scar 17 G733PYV-LL053X | |
| Schenker Key 17 Pro (Early 23) | |
| Asus ROG Strix Scar 17 G733PY-XS96 | |
| Lenovo Legion Pro 7 RTX4090 | |
| MSI Titan GT77 HX 13VI | |
| Media de la clase Gaming (104.7 - 240, n=7, últimos 2 años) | |
| Lenovo Legion Pro 5 16ARX8 | |
| Shadow of the Tomb Raider - 1920x1080 Highest Preset AA:T | |
| Asus ROG Strix Scar 17 G733PYV-LL053X | |
| Asus ROG Strix Scar 17 G733PY-XS96 | |
| MSI Titan GT77 HX 13VI | |
| Lenovo Legion Pro 5 16ARX8 | |
| Asus ROG Strix Scar 18 2023 G834JY-N6005W | |
| Media de la clase Gaming (96 - 116, n=2, últimos 2 años) | |
| Far Cry 6 - 1920x1080 Ultra Graphics Quality + HD Textures AA:T | |
| Asus ROG Strix Scar 17 G733PYV-LL053X | |
| MSI Titan GT77 HX 13VI | |
| Media de la clase Gaming (n=1últimos 2 años) | |
| Asus ROG Strix Scar 17 G733PY-XS96 | |
| Lenovo Legion Pro 5 16ARX8 | |
| Call of Duty Modern Warfare 2 2022 - 1920x1080 Extreme Quality Preset AA:T2X Filmic SM | |
| Asus ROG Strix Scar 17 G733PYV-LL053X | |
| Asus ROG Strix Scar 17 G733PY-XS96 | |
| MSI Titan GT77 HX 13VI | |
| Asus ROG Strix Scar 18 2023 G834JY-N6005W | |
| Lenovo Legion Pro 5 16ARX8 | |
| Cyberpunk 2077 1.6 - 1920x1080 Ultra Preset | |
| Asus ROG Strix Scar 17 G733PYV-LL053X | |
| MSI Titan GT77 HX 13VI | |
| Asus ROG Strix Scar 17 G733PY-XS96 | |
| Alienware m18 R1 | |
| Asus ROG Strix Scar 18 2023 G834JY-N6005W | |
| Lenovo Legion Pro 5 16ARX8 | |
En resolución QHD, el nuevo procesador también mostró sus ventajas, aunque la diferencia no fue tan grande aquí en comparación con los ajustes 1080p. En total, el Ryzen 9 7945HX3D sigue siendo capaz de ofrecer mejor rendimiento que sus competidores - a veces suficiente para asegurarse una ventaja porcentual de dos dígitos.
| Shadow of the Tomb Raider - 2560x1440 Highest Preset AA:T | |
| Asus ROG Strix Scar 17 G733PYV-LL053X | |
| Asus ROG Strix Scar 17 G733PY-XS96 | |
| MSI Titan GT77 HX 13VI | |
| Lenovo Legion Pro 7 RTX4090 | |
| Far Cry 5 - 2560x1440 Ultra Preset AA:T | |
| Asus ROG Strix Scar 17 G733PYV-LL053X | |
| MSI Titan GT77 HX 13VI | |
| Asus ROG Strix Scar 17 G733PY-XS96 | |
| Far Cry 6 - 2560x1440 Ultra Graphics Quality + HD Textures AA:T | |
| Asus ROG Strix Scar 17 G733PYV-LL053X | |
| MSI Titan GT77 HX 13VI | |
| Asus ROG Strix Scar 17 G733PY-XS96 | |
| Final Fantasy XV Benchmark - 2560x1440 High Quality | |
| MSI Titan GT77 HX 13VI | |
| Alienware m18 R1 | |
| Schenker Key 17 Pro (Early 23) | |
| Lenovo Legion Pro 7 RTX4090 | |
| Asus ROG Strix Scar 17 G733PYV-LL053X | |
| Asus ROG Strix Scar 17 G733PY-XS96 | |
| GTA V - 2560x1440 Highest AA:4xMSAA + FX AF:16x | |
| Asus ROG Strix Scar 17 G733PYV-LL053X | |
| Alienware m18 R1 | |
| Schenker Key 17 Pro (Early 23) | |
| MSI Titan GT77 HX 13VI | |
| Lenovo Legion Pro 7 RTX4090 | |
| Asus ROG Strix Scar 17 G733PY-XS96 | |
| F1 22 - 2560x1440 Ultra High Preset AA:T AF:16x | |
| Alienware m18 R1 | |
| Asus ROG Strix Scar 17 G733PY-XS96 | |
| Asus ROG Strix Scar 17 G733PYV-LL053X | |
| MSI Titan GT77 HX 13VI | |
| Lenovo Legion Pro 7 RTX4090 | |
| Call of Duty Modern Warfare 2 2022 - 2560x1440 Extreme Quality Preset AA:T2X Filmic SM | |
| Asus ROG Strix Scar 17 G733PYV-LL053X | |
| MSI Titan GT77 HX 13VI | |
| Asus ROG Strix Scar 17 G733PY-XS96 | |
| Lenovo Legion Pro 7 RTX4090 | |
| Cyberpunk 2077 1.6 - 2560x1440 Ultra Preset | |
| Asus ROG Strix Scar 17 G733PYV-LL053X | |
| Asus ROG Strix Scar 17 G733PY-XS96 | |
| Alienware m18 R1 | |
| Lenovo Legion Pro 7 RTX4090 | |
| MSI Titan GT77 HX 13VI | |
En resolución 4K, el nuevo Ryzen 9 7945HX3D no tiene ninguna ventaja sobre el Ryzen 9 7945HX normal o los procesadores HX móviles de Intel, aunque todos los modelos se sitúan en un nivel comparable.
| Shadow of the Tomb Raider - 3840x2160 Highest Preset AA:T | |
| Lenovo Legion Pro 7 RTX4090 | |
| Asus ROG Strix Scar 17 G733PY-XS96 | |
| Asus ROG Strix Scar 17 G733PYV-LL053X | |
| MSI Titan GT77 HX 13VI | |
| Far Cry 5 - 3840x2160 Ultra Preset AA:T | |
| MSI Titan GT77 HX 13VI | |
| Asus ROG Strix Scar 17 G733PYV-LL053X | |
| Asus ROG Strix Scar 17 G733PY-XS96 | |
| Far Cry 6 - 3840x2160 Ultra Graphics Quality + HD Textures AA:T | |
| MSI Titan GT77 HX 13VI | |
| Asus ROG Strix Scar 17 G733PYV-LL053X | |
| Asus ROG Strix Scar 17 G733PY-XS96 | |
| Final Fantasy XV Benchmark - 3840x2160 High Quality | |
| MSI Titan GT77 HX 13VI | |
| Asus ROG Strix Scar 17 G733PY-XS96 | |
| Alienware m18 R1 | |
| Schenker Key 17 Pro (Early 23) | |
| Lenovo Legion Pro 7 RTX4090 | |
| Asus ROG Strix Scar 17 G733PYV-LL053X | |
| GTA V - 3840x2160 High/On (Advanced Graphics Off) AA:FX AF:8x | |
| Asus ROG Strix Scar 17 G733PYV-LL053X | |
| Alienware m18 R1 | |
| MSI Titan GT77 HX 13VI | |
| Lenovo Legion Pro 7 RTX4090 | |
| Asus ROG Strix Scar 17 G733PY-XS96 | |
| Schenker Key 17 Pro (Early 23) | |
| F1 22 - 3840x2160 Ultra High Preset AA:T AF:16x | |
| Lenovo Legion Pro 7 RTX4090 | |
| Asus ROG Strix Scar 17 G733PY-XS96 | |
| Alienware m18 R1 | |
| Asus ROG Strix Scar 17 G733PYV-LL053X | |
| MSI Titan GT77 HX 13VI | |
| Call of Duty Modern Warfare 2 2022 - 3840x2160 Extreme Quality Preset AA:T2X Filmic SM | |
| MSI Titan GT77 HX 13VI | |
| Asus ROG Strix Scar 17 G733PYV-LL053X | |
| Asus ROG Strix Scar 17 G733PY-XS96 | |
| Lenovo Legion Pro 7 RTX4090 | |
| Cyberpunk 2077 1.6 - 3840x2160 Ultra Preset | |
| MSI Titan GT77 HX 13VI | |
| Asus ROG Strix Scar 17 G733PYV-LL053X | |
| Lenovo Legion Pro 7 RTX4090 | |
| Alienware m18 R1 | |
| Asus ROG Strix Scar 17 G733PY-XS96 | |
| bajo | medio | alto | ultra | QHD DLSS | QHD | 4K DLSS | 4K | |
|---|---|---|---|---|---|---|---|---|
| GTA V (2015) | 187.1 | 167.7 | 160.6 | 182.7 | ||||
| The Witcher 3 (2015) | 414 | 207 | 163 | 155 | ||||
| Dota 2 Reborn (2015) | 288 | 255 | 244 | 220 | 205 | |||
| Final Fantasy XV Benchmark (2018) | 229 | 180 | 151.2 | 85 | ||||
| X-Plane 11.11 (2018) | 196.3 | 190.3 | 166.2 | 139.5 | ||||
| Far Cry 5 (2018) | 248 | 232 | 218 | 194 | 110 | |||
| Strange Brigade (2018) | 460 | 420 | 318 | 161 | ||||
| Shadow of the Tomb Raider (2018) | 293 | 271 | 199 | 104 | ||||
| Assassin´s Creed Valhalla (2020) | 195 | 178 | 138 | 80 | ||||
| F1 2021 (2021) | 685 | 616 | 470 | 271 | 204 | 115.1 | ||
| Far Cry 6 (2021) | 182 | 167 | 146 | 88 | ||||
| Cyberpunk 2077 1.6 (2022) | 205 | 157 | 116 | 51 | ||||
| F1 22 (2022) | 281 | 135.9 | 91.8 | 45 | ||||
| Call of Duty Modern Warfare 2 2022 (2022) | 190 | 182 | 136 | 83 | ||||
| Star Wars Jedi Survivor (2023) | 106 | 103 | 71 | 39 | ||||
| F1 23 (2023) | 374 | 132 | 85.1 | 73.5 | 42.2 | |||
| Baldur's Gate 3 (2023) | 178.8 | 133.3 | 114 | 74.6 | ||||
| Cyberpunk 2077 (2023) | 158 | 99.5 | 44.2 | |||||
| Alan Wake 2 (2023) | 116.1 | 82 | 43.4 | |||||
| F1 24 (2024) | 144.9 | 150.4 | 96.8 | 83.2 | 48.4 | |||
| Call of Duty Black Ops 6 (2024) | 150 | 129 | 119 | 78 | 76 | |||
| Indiana Jones and the Great Circle (2024) | 128.4 | 117.9 | 100.5 | 60.6 | ||||
| Monster Hunter Wilds (2025) | 85.6 | 81.7 | 69.4 | 58.5 | 42.8 | |||
| Assassin's Creed Shadows (2025) | 55 | 56 | 47 | 46 | 34 |
Emisiones - El SCAR 17 tiene un molesto zumbido de bobina
Emisiones sonoras
Por supuesto, es de esperar que los ventiladores se oigan en un dispositivo tan potente como éste, pero aun así el portátil cuenta con un modo silencioso que desactiva por completo los ventiladores en el uso diario. Es muy útil para navegar por Internet, escribir correos electrónicos o ver vídeos. No es posible jugar en este modo y, en este caso, observamos valores de emisión de ruido relativamente decentes de unos 41 dB(A). Sin embargo, desafortunadamente notamos algunos ruidos de bobina realmente molestos durante nuestras pruebas de juego (y nunca durante ningún otro uso). Los ventiladores son bastante más ruidosos en modo Rendimiento y Turbo (~48 dB(A) & 54 dB(A)), lo que incluso ahoga el ruido de la bobina. En cualquier caso, recomendamos el uso de auriculares para cualquiera de estos modos. La siguiente tabla muestra las emisiones de ruido del ventilador en varias aplicaciones y perfiles de energía.
| Escenario | Silencioso | Rendimiento | Turbo |
|---|---|---|---|
| 3DMark 06 | 30 dB(A) | 35,5 dB(A) | 53,4 dB(A) |
| The Witcher 3 (Ultra settings) | 40.9 dB(A) | 48.5 dB(A) | 53.4 dB(A) |
| Cyberpunk 2077 (Ultra configuración) | 40,9 dB(A) | 48,5 dB(A) | 53,4 dB(A) |
| Prueba de estrés | 40,9 dB(A) | 48,5 dB(A) | 53,4 dB(A) |
Ruido
| Ocioso |
| 23 / 27.7 / 34.7 dB(A) |
| Carga |
| 53.4 / 53.4 dB(A) |
 | ||
30 dB silencioso 40 dB(A) audible 50 dB(A) ruidosamente alto |
||
min: | ||
| Asus ROG Strix Scar 17 G733PYV-LL053X GeForce RTX 4090 Laptop GPU, R9 7945HX3D, SK hynix PC801 HFS001TEJ9X101N | Asus ROG Strix Scar 17 G733PY-XS96 GeForce RTX 4090 Laptop GPU, R9 7945HX, SK hynix PC801 HFS001TEJ9X101N | Alienware m18 R1 GeForce RTX 4090 Laptop GPU, i9-13980HX, SK hynix PC801 HFS001TEJ9X101N | Asus ROG Strix Scar 18 2023 G834JY-N6005W GeForce RTX 4090 Laptop GPU, i9-13980HX, 2x Samsung PM9A1 MZVL21T0HCLR (RAID 0) | MSI Titan GT77 HX 13VI GeForce RTX 4090 Laptop GPU, i9-13950HX, Samsung PM9A1 MZVL22T0HBLB | Schenker Key 17 Pro (Early 23) GeForce RTX 4090 Laptop GPU, i9-13900HX, Samsung 990 Pro 2 TB MZVL72T0HDLB | |
|---|---|---|---|---|---|---|
| Noise | 9% | 12% | 2% | -5% | -17% | |
| apagado / medio ambiente * (dB) | 23 | 22.7 1% | 22.8 1% | 23.9 -4% | 24.6 -7% | 26 -13% |
| Idle Minimum * (dB) | 23 | 23.5 -2% | 23 -0% | 23.9 -4% | 29.2 -27% | 26 -13% |
| Idle Average * (dB) | 27.7 | 27.7 -0% | 23 17% | 32.6 -18% | 29.2 -5% | 33 -19% |
| Idle Maximum * (dB) | 34.7 | 27.7 20% | 23 34% | 32.6 6% | 29.2 16% | 46 -33% |
| Load Average * (dB) | 53.4 | 30.5 43% | 35.6 33% | 35.9 33% | 50.7 5% | 56 -5% |
| Witcher 3 ultra * (dB) | 53.4 | 51.4 4% | 51.3 4% | 53.3 -0% | 62 -16% | |
| Load Maximum * (dB) | 53.4 | 54.1 -1% | 56.7 -6% | 55.8 -4% | 61 -14% | 64 -20% |
* ... más pequeño es mejor
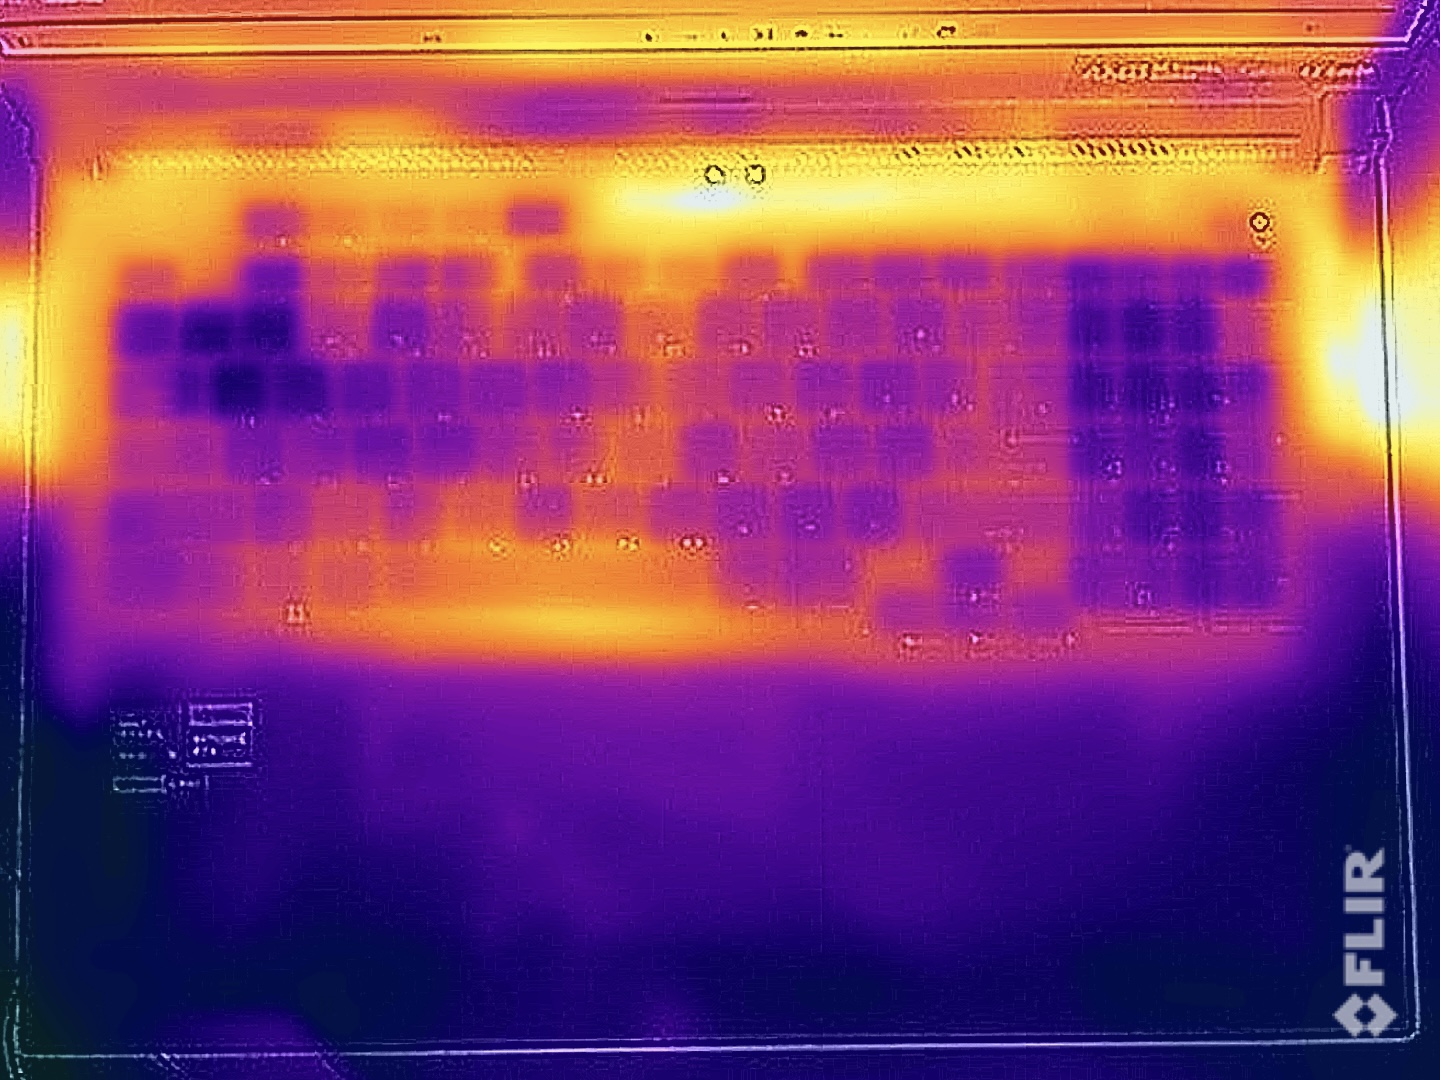
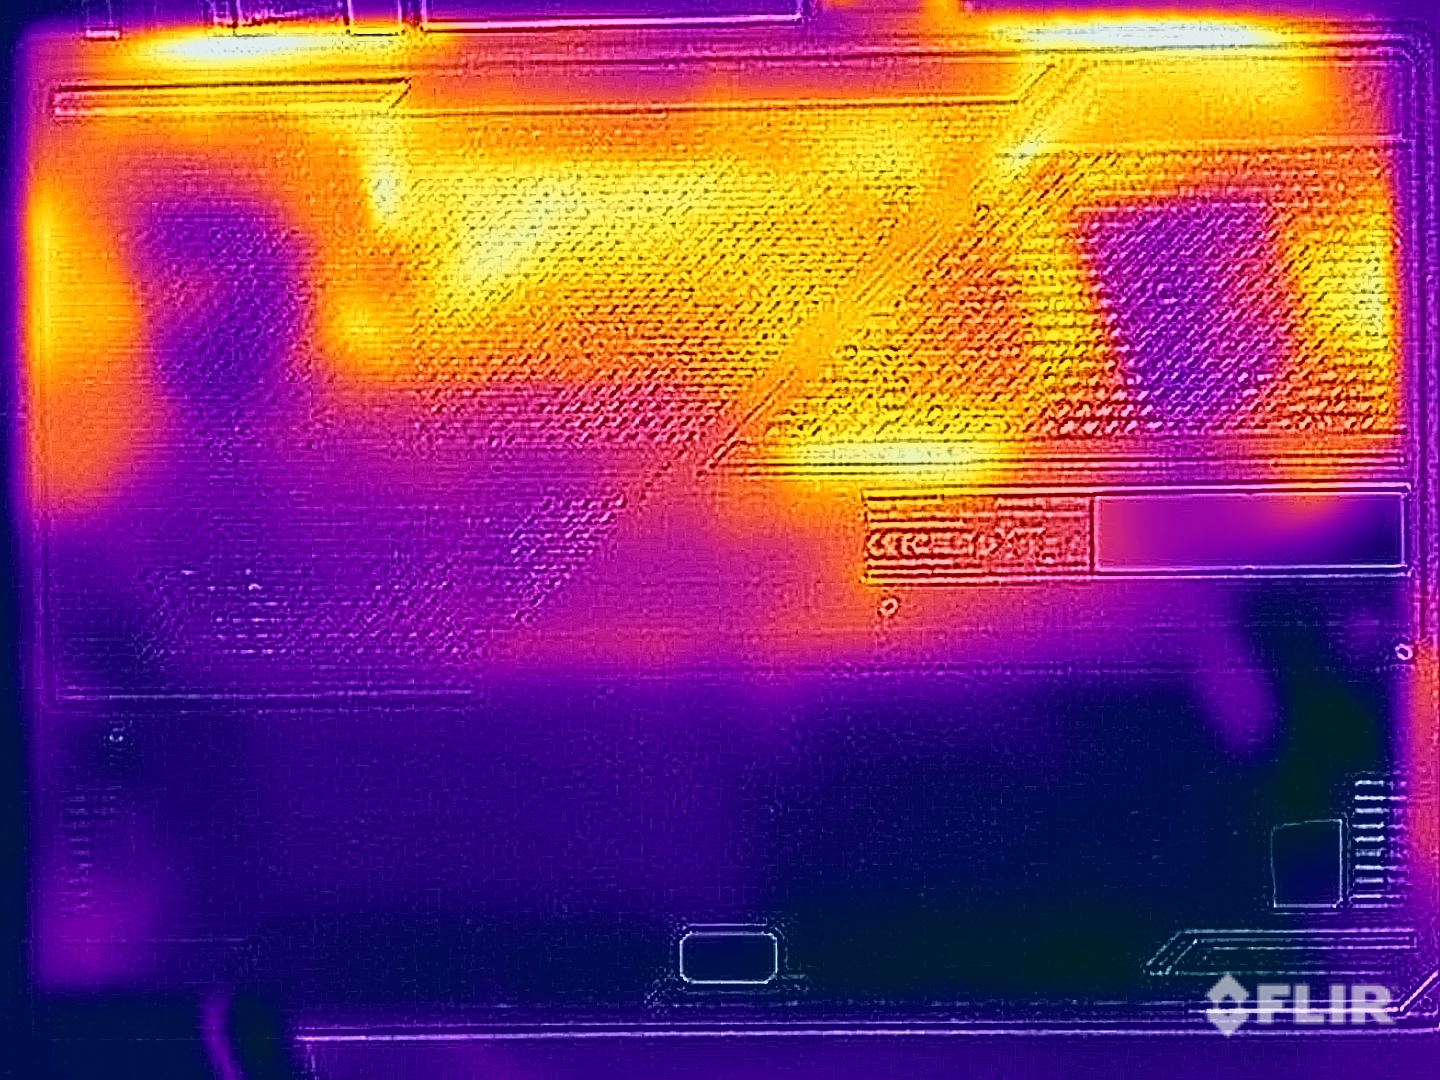
Temperatura
Incluso bajo carga, las temperaturas superficiales del portátil demostraron estar totalmente bien - podrías colocar fácilmente el SCAR 17 sobre tus muslos mientras juegas sin ninguna queja (aunque probablemente no querrás hacerlo debido a su tamaño). Durante la prueba de estrés, la GPU se vio favorecida, lo que ya quedó claro al ver las configuraciones TDP/TGP. Al principio de la prueba, el procesador consumía 85 vatios y la GPU tenía un consumo de 120 vatios - tras unos minutos, el procesador se equilibró a 50 vatios y la tarjeta gráfica consumió 175 vatios.
(±) La temperatura máxima en la parte superior es de 40.1 °C / 104 F, frente a la media de 40.4 °C / 105 F, que oscila entre 21.2 y 68.8 °C para la clase Gaming.
(-) El fondo se calienta hasta un máximo de 46.7 °C / 116 F, frente a la media de 43.2 °C / 110 F
(+) En reposo, la temperatura media de la parte superior es de 25.8 °C / 78# F, frente a la media del dispositivo de 33.9 °C / 93 F.
(±) Jugando a The Witcher 3, la temperatura media de la parte superior es de 33.3 °C / 92 F, frente a la media del dispositivo de 33.9 °C / 93 F.
(+) El reposamanos y el panel táctil están a una temperatura inferior a la de la piel, con un máximo de 25.6 °C / 78.1 F y, por tanto, son fríos al tacto.
(+) La temperatura media de la zona del reposamanos de dispositivos similares fue de 28.8 °C / 83.8 F (+3.2 °C / 5.7 F).
| Asus ROG Strix Scar 17 G733PYV-LL053X AMD Ryzen 9 7945HX3D, NVIDIA GeForce RTX 4090 Laptop GPU | Asus ROG Strix Scar 17 G733PY-XS96 AMD Ryzen 9 7945HX, NVIDIA GeForce RTX 4090 Laptop GPU | Alienware m18 R1 Intel Core i9-13980HX, NVIDIA GeForce RTX 4090 Laptop GPU | Asus ROG Strix Scar 18 2023 G834JY-N6005W Intel Core i9-13980HX, NVIDIA GeForce RTX 4090 Laptop GPU | MSI Titan GT77 HX 13VI Intel Core i9-13950HX, NVIDIA GeForce RTX 4090 Laptop GPU | Schenker Key 17 Pro (Early 23) Intel Core i9-13900HX, NVIDIA GeForce RTX 4090 Laptop GPU | |
|---|---|---|---|---|---|---|
| Heat | 7% | 4% | -15% | 1% | -29% | |
| Maximum Upper Side * (°C) | 40.1 | 34.6 14% | 39 3% | 54 -35% | 40.6 -1% | 57 -42% |
| Maximum Bottom * (°C) | 46.7 | 35.6 24% | 36.4 22% | 46 1% | 41.1 12% | 60 -28% |
| Idle Upper Side * (°C) | 26.5 | 27.2 -3% | 29.2 -10% | 30 -13% | 26.2 1% | 32 -21% |
| Idle Bottom * (°C) | 27.7 | 30 -8% | 27.8 -0% | 31 -12% | 30.3 -9% | 34 -23% |
* ... más pequeño es mejor
Gestión de la energía - Un portátil para juegos con poca resistencia
Consumo de energía
Como era de esperar, el SCAR 17 X3D consume una tonelada de energía y durante el inicio de la prueba de estrés, medimos alrededor de 328 vatios. Después de un rato, esto se igualó a 300 vatios - mientras jugaba, consumía entre 260 - 300 vatios. Como resultado, la conexión de alimentación suministrada es de tamaño suficiente.
| Off / Standby | |
| Ocioso | |
| Carga |
|
Clave:
min: | |
| Asus ROG Strix Scar 17 G733PYV-LL053X R9 7945HX3D, GeForce RTX 4090 Laptop GPU, SK hynix PC801 HFS001TEJ9X101N, IPS, 2560x1440, 17.3" | Asus ROG Strix Scar 17 G733PY-XS96 R9 7945HX, GeForce RTX 4090 Laptop GPU, SK hynix PC801 HFS001TEJ9X101N, IPS, 2560x1440, 17.3" | Alienware m18 R1 i9-13980HX, GeForce RTX 4090 Laptop GPU, SK hynix PC801 HFS001TEJ9X101N, IPS, 1920x1200, 18" | Asus ROG Strix Scar 18 2023 G834JY-N6005W i9-13980HX, GeForce RTX 4090 Laptop GPU, 2x Samsung PM9A1 MZVL21T0HCLR (RAID 0), IPS, 2560x1600, 18" | MSI Titan GT77 HX 13VI i9-13950HX, GeForce RTX 4090 Laptop GPU, Samsung PM9A1 MZVL22T0HBLB, Mini-LED, 3840x2160, 17.3" | Schenker Key 17 Pro (Early 23) i9-13900HX, GeForce RTX 4090 Laptop GPU, Samsung 990 Pro 2 TB MZVL72T0HDLB, IPS, 3840x2160, 17.3" | Medio NVIDIA GeForce RTX 4090 Laptop GPU | Media de la clase Gaming | |
|---|---|---|---|---|---|---|---|---|
| Power Consumption | -13% | -46% | -32% | -6% | -10% | -15% | 8% | |
| Idle Minimum * (Watt) | 15.4 | 14.5 6% | 21.6 -40% | 17.3 -12% | 14 9% | 18 -17% | 16.2 ? -5% | 13.1 ? 15% |
| Idle Average * (Watt) | 21.6 | 21.1 2% | 25.2 -17% | 27 -25% | 21.6 -0% | 20 7% | 23.1 ? -7% | 19 ? 12% |
| Idle Maximum * (Watt) | 22.2 | 42.8 -93% | 56.7 -155% | 46 -107% | 24.8 -12% | 25 -13% | 34.2 ? -54% | 24.6 ? -11% |
| Load Average * (Watt) | 116.7 | 116.7 -0% | 164.1 -41% | 133 -14% | 122.5 -5% | 136 -17% | 130.5 ? -12% | 111.3 ? 5% |
| Witcher 3 ultra * (Watt) | 262 | 278 -6% | 311 -19% | 265 -1% | 292 -11% | |||
| Cyberpunk 2077 ultra external monitor * (Watt) | 272 | |||||||
| Load Maximum * (Watt) | 327.1 | 279.6 15% | 338.9 -4% | 329 -1% | 418 -28% | 358 -9% | 324 ? 1% | 260 ? 21% |
* ... más pequeño es mejor
Power consumption Witcher 3 / stress test
Power consumption with external monitor
Tiempos de ejecución
Igualando su consumo en reposo, la batería de 90 Wh permitió duraciones de entre 4 y 5 horas en las pruebas de WLAN y vídeo a 60 Hz (dependiendo del brillo). Esto no es mucho y algunos rivales ofrecen más aguante. Aunque, comparado con su predecesorel aguante del portátil al menos ha mejorado un poco.
| Asus ROG Strix Scar 17 G733PYV-LL053X R9 7945HX3D, GeForce RTX 4090 Laptop GPU, 90 Wh | Asus ROG Strix Scar 17 G733PY-XS96 R9 7945HX, GeForce RTX 4090 Laptop GPU, 90 Wh | Alienware m18 R1 i9-13980HX, GeForce RTX 4090 Laptop GPU, 97 Wh | Asus ROG Strix Scar 18 2023 G834JY-N6005W i9-13980HX, GeForce RTX 4090 Laptop GPU, 90 Wh | MSI Titan GT77 HX 13VI i9-13950HX, GeForce RTX 4090 Laptop GPU, 99.9 Wh | Schenker Key 17 Pro (Early 23) i9-13900HX, GeForce RTX 4090 Laptop GPU, 99 Wh | Media de la clase Gaming | |
|---|---|---|---|---|---|---|---|
| Duración de Batería | -15% | -16% | 29% | 29% | 44% | 60% | |
| H.264 (h) | 5 | 7 40% | 6 20% | 8.27 ? 65% | |||
| WiFi v1.3 (h) | 4.8 | 4.1 -15% | 4.3 -10% | 7.1 48% | 5.3 10% | 6.9 44% | 7.08 ? 48% |
| Load (h) | 0.9 | 0.7 -22% | 0.9 0% | 1.4 56% | 1.496 ? 66% | ||
| Witcher 3 ultra (h) | 0.9 |
Pro
Contra
Veredicto - El ROG Strix SCAR 17 X3D es ahora aún más rápido
Gracias al nuevoAMD Ryzen 9 9745HX3Del ROG Strix SCAR 17 X3D de Asus es ahora aún más rápido, lo que lo convierte en uno de los portátiles para juegos más veloces que existen. El nuevo procesador, gracias a su 3D V-Cache adicional, es capaz de mostrar aumentos de rendimiento porcentuales de dos cifras, en particular cuando se juega a 1080p. En resoluciones QHD superiores, sus ventajas no son tan grandes y en 4K, realmente no hay mucha diferencia en comparación con el Ryzen 9 7945HX normal.
Como el nuevo Ryzen 9 7945HX3D no es compatible con metal líquido, su rendimiento máximo de CPU multinúcleo es en realidad un poco peor que el Ryzen 9 7945HX normal como resultado directo de su refrigeración más débil. Al final del día, sus rendimientos son comparables en el uso diario, y los chips siguen siendo mucho más eficientes que los procesadores HX de Intel.
Gracias al AMD Ryzen 9 7945HX3D, el nuevo ROG Strix SCAR 17 3DX es aún más rápido cuando se trata de juegos en resolución Full HD/QHD. Como resultado, se promociona como el portátil para juegos más rápido del mercado.
Sus conocidos defectos permanecen en este modelo porque aunque su rendimiento es bueno, el diseño del portátil con su panel 16:9 se siente un poco anticuado a estas alturas. Además, nos habría gustado ver una versión más reservada del ProArt que también pudieras usar discretamente como estación de trabajo. Su modo silencioso, normalmente práctico, apenas puede usarse mientras se juega, ya que se oye constantemente un molesto ruido de bobina y recomendaríamos usar auriculares para cualquier otro perfil de energía. El ruido de la bobina y la ruidosa unidad de refrigeración también impiden que este portátil obtenga una mejor puntuación.
Precio y disponibilidad
El nuevo Asus ROG Strix SCAR 17 X3D estará disponible a partir del 22 de agosto. En cuanto tengamos información oficial sobre precios, actualizaremos este artículo.
Asus ROG Strix Scar 17 G733PYV-LL053X
- 08/22/2023 v7 (old)
Andreas Osthoff
Transparencia
La selección de los dispositivos que se van a reseñar corre a cargo de nuestro equipo editorial. La muestra de prueba fue proporcionada al autor en calidad de préstamo por el fabricante o el minorista a los efectos de esta reseña. El prestamista no tuvo ninguna influencia en esta reseña, ni el fabricante recibió una copia de la misma antes de su publicación. No había ninguna obligación de publicar esta reseña. Como empresa de medios independiente, Notebookcheck no está sujeta a la autoridad de fabricantes, minoristas o editores.
Así es como prueba Notebookcheck
Cada año, Notebookcheck revisa de forma independiente cientos de portátiles y smartphones utilizando procedimientos estandarizados para asegurar que todos los resultados son comparables. Hemos desarrollado continuamente nuestros métodos de prueba durante unos 20 años y hemos establecido los estándares de la industria en el proceso. En nuestros laboratorios de pruebas, técnicos y editores experimentados utilizan equipos de medición de alta calidad. Estas pruebas implican un proceso de validación en varias fases. Nuestro complejo sistema de clasificación se basa en cientos de mediciones y puntos de referencia bien fundamentados, lo que mantiene la objetividad.Price comparison

