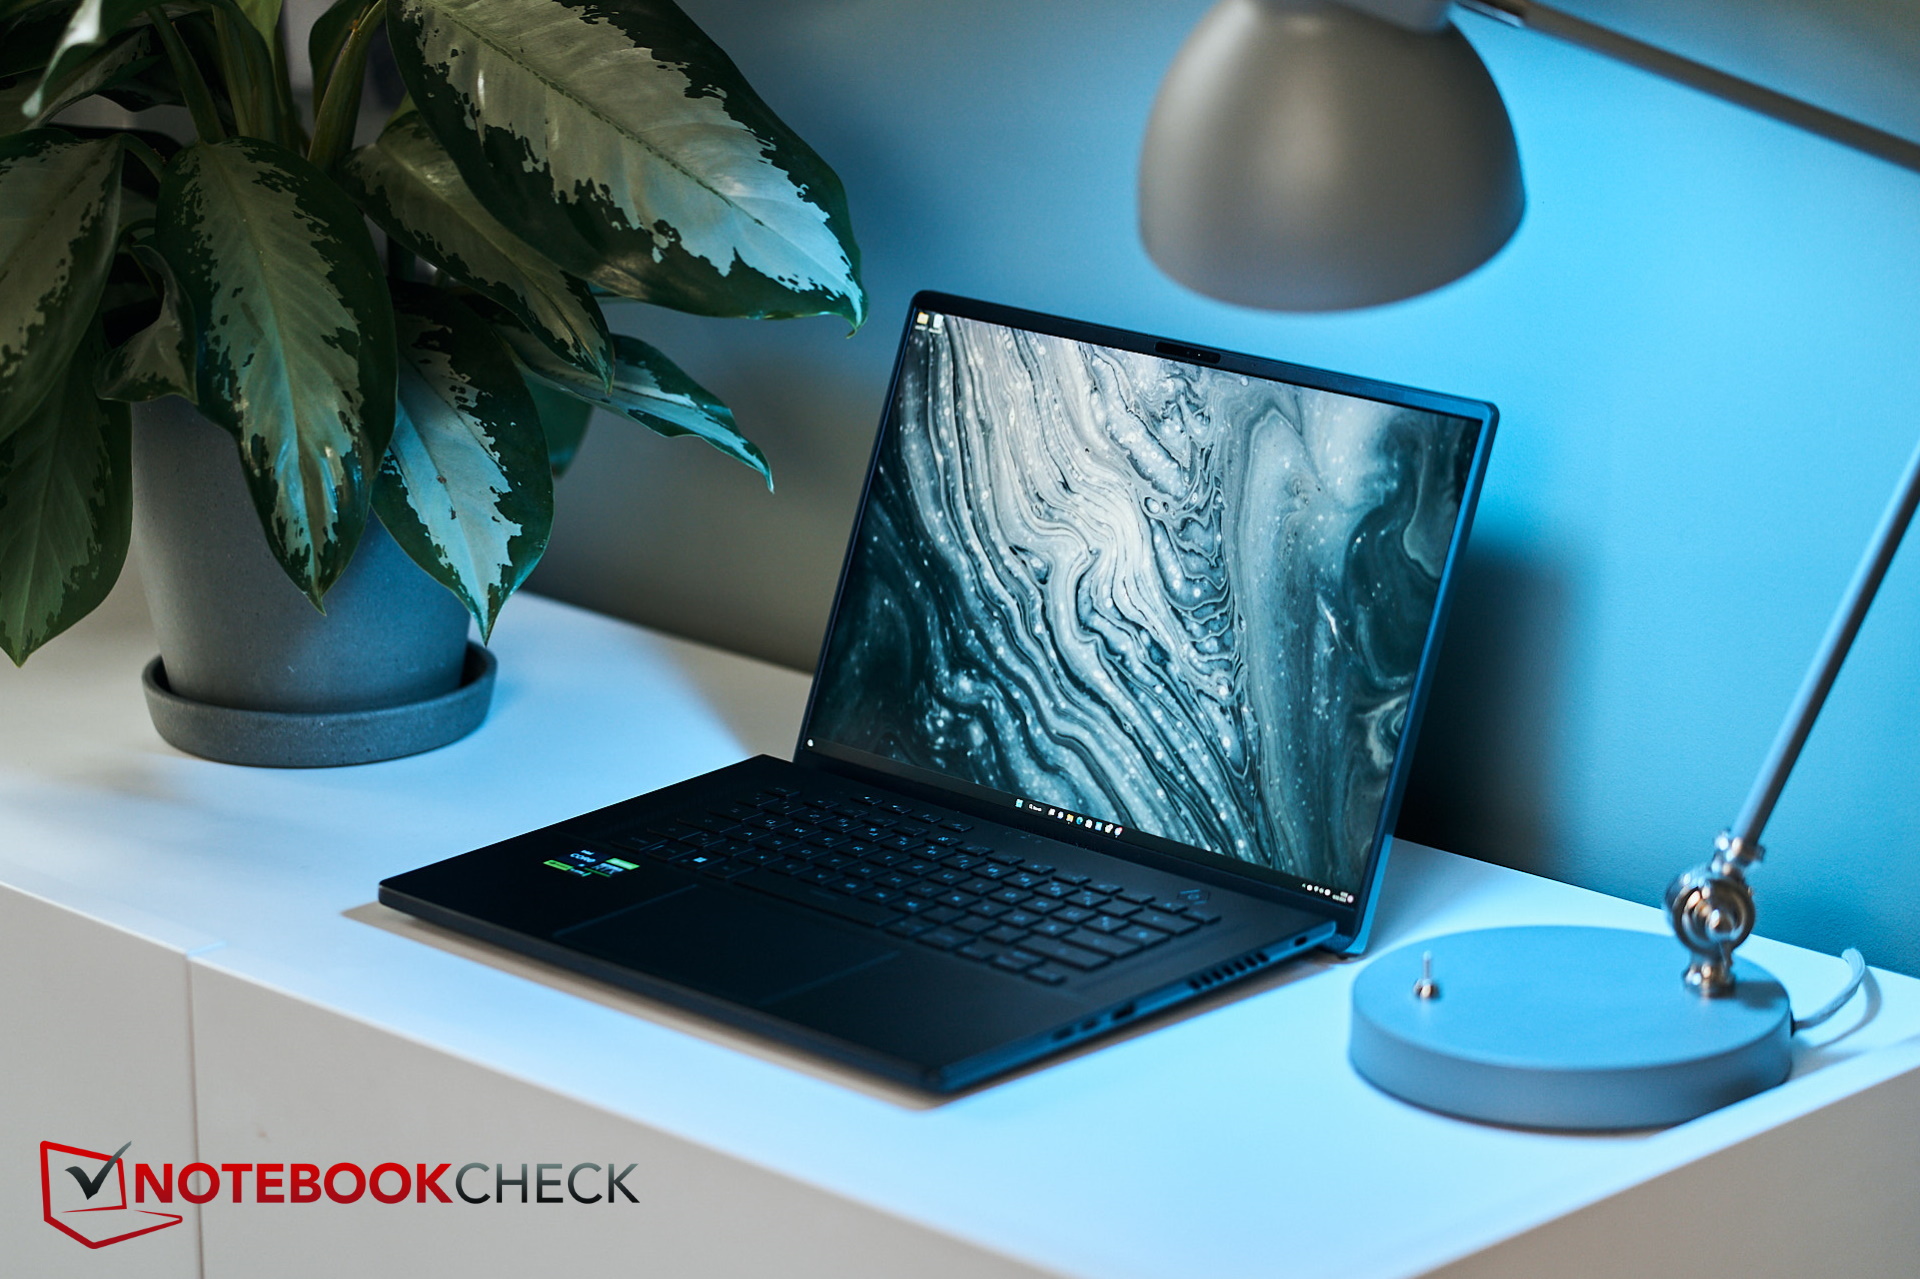
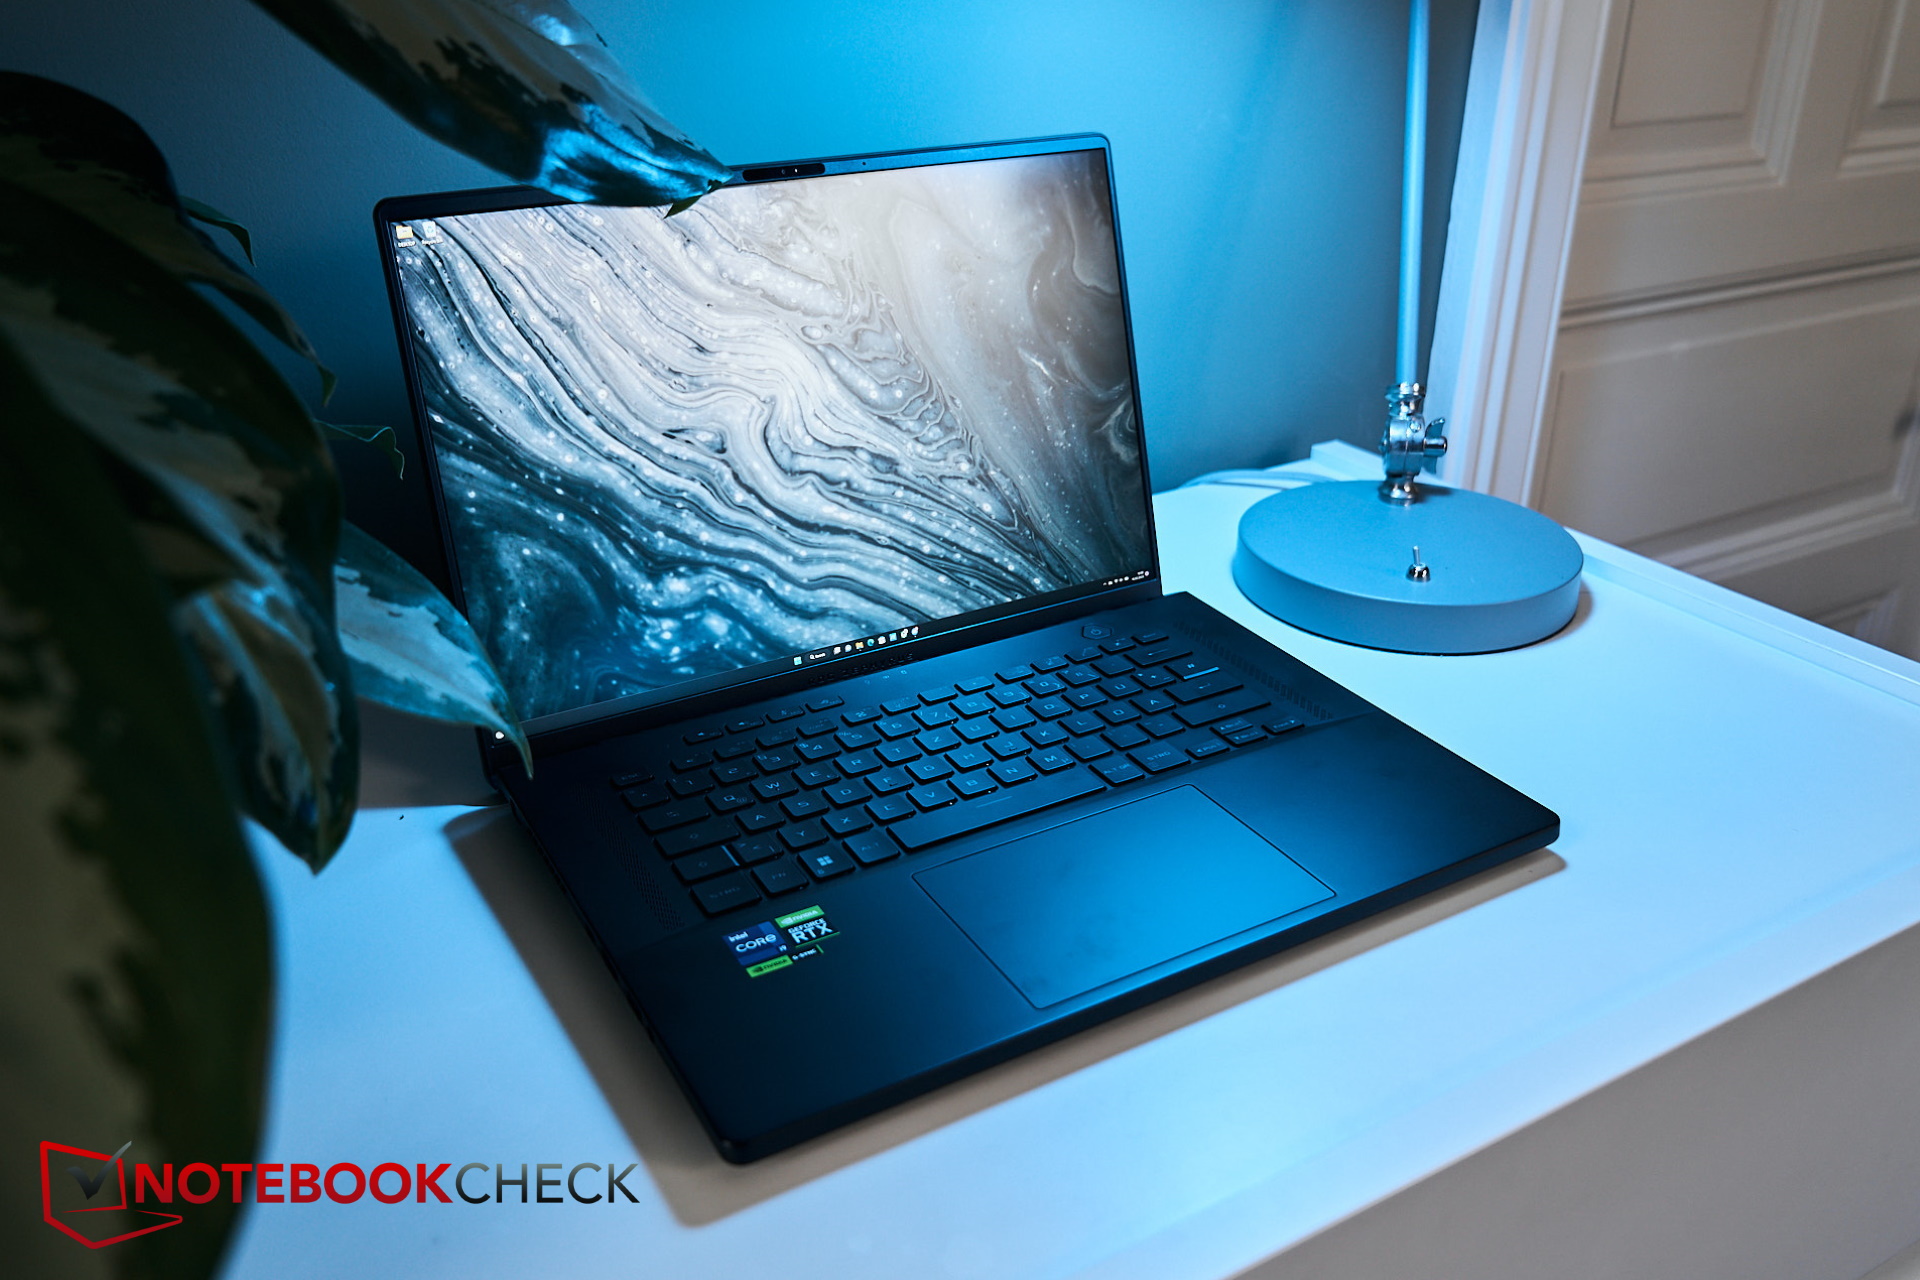
Análisis del portátil Asus ROG Zephyrus M16 (2023): RTX 4090 con una pantalla Mini-LED superbrillante

Como uno de los últimos ejemplos de la "vieja" generación de CPU/GPU, hace poco analizamos el ROG Zephyrus M16que venía equipado con unCore i9-12900Hy unaRTX 3070 Ti. Pero ahora, un cambio de guardia ha llegado en la forma de la M16, esta vez con unCore i9-13900Hy unaRTX 4090 dentro de una carcasa "AniMe Matrix". Esta última ha cambiado ligeramente, ya que la matriz se ha vuelto algo más fina. Hemos echado un vistazo detallado a estos cambios e investigado si el M16 puede llevarse bien con la RTX 4090.
Ni que decir tiene que comparamos el nuevo dispositivo con el predecesor, así como con otras máquinas de juego de gama alta. Como la RTX 4090 se encuentra normalmente en portátiles más grandes, también analizamos el de 18 pulgadasAsus ROG Strix Scar 18 o el 17 pulgadasMSI Titan GT77. También consideramos el Lenovo Legion Pro 7 16IRX y el Razer Blade 16 como competidores.
Posibles contendientes en la comparación
Valoración | Fecha | Modelo | Peso | Altura | Tamaño | Resolución | Precio |
|---|---|---|---|---|---|---|---|
| 89.4 % v7 (old) | 03/2023 | Asus ROG Zephyrus M16 GU604VY-NM042X i9-13900H, GeForce RTX 4090 Laptop GPU | 2.3 kg | 22.9 mm | 16.00" | 2560x1600 | |
| 87.8 % v7 (old) | 02/2023 | Asus ROG Zephyrus M16 GU603Z i9-12900H, GeForce RTX 3070 Ti Laptop GPU | 2.1 kg | 19.9 mm | 16.00" | 2560x1600 | |
| 86.6 % v7 (old) | 02/2023 | Asus ROG Strix Scar 18 2023 G834JY-N6005W i9-13980HX, GeForce RTX 4090 Laptop GPU | 3.1 kg | 30.8 mm | 18.00" | 2560x1600 | |
| 89 % v7 (old) | 02/2023 | MSI Titan GT77 HX 13VI i9-13950HX, GeForce RTX 4090 Laptop GPU | 3.5 kg | 23 mm | 17.30" | 3840x2160 | |
| 89.4 % v7 (old) | 02/2023 | Lenovo Legion Pro 7 16IRX8H i9-13900HX, GeForce RTX 4080 Laptop GPU | 2.7 kg | 26 mm | 16.00" | 2560x1600 | |
| 91.2 % v7 (old) | 02/2023 | Razer Blade 16 Early 2023 i9-13950HX, GeForce RTX 4080 Laptop GPU | 2.4 kg | 21.99 mm | 16.00" | 2560x1600 |
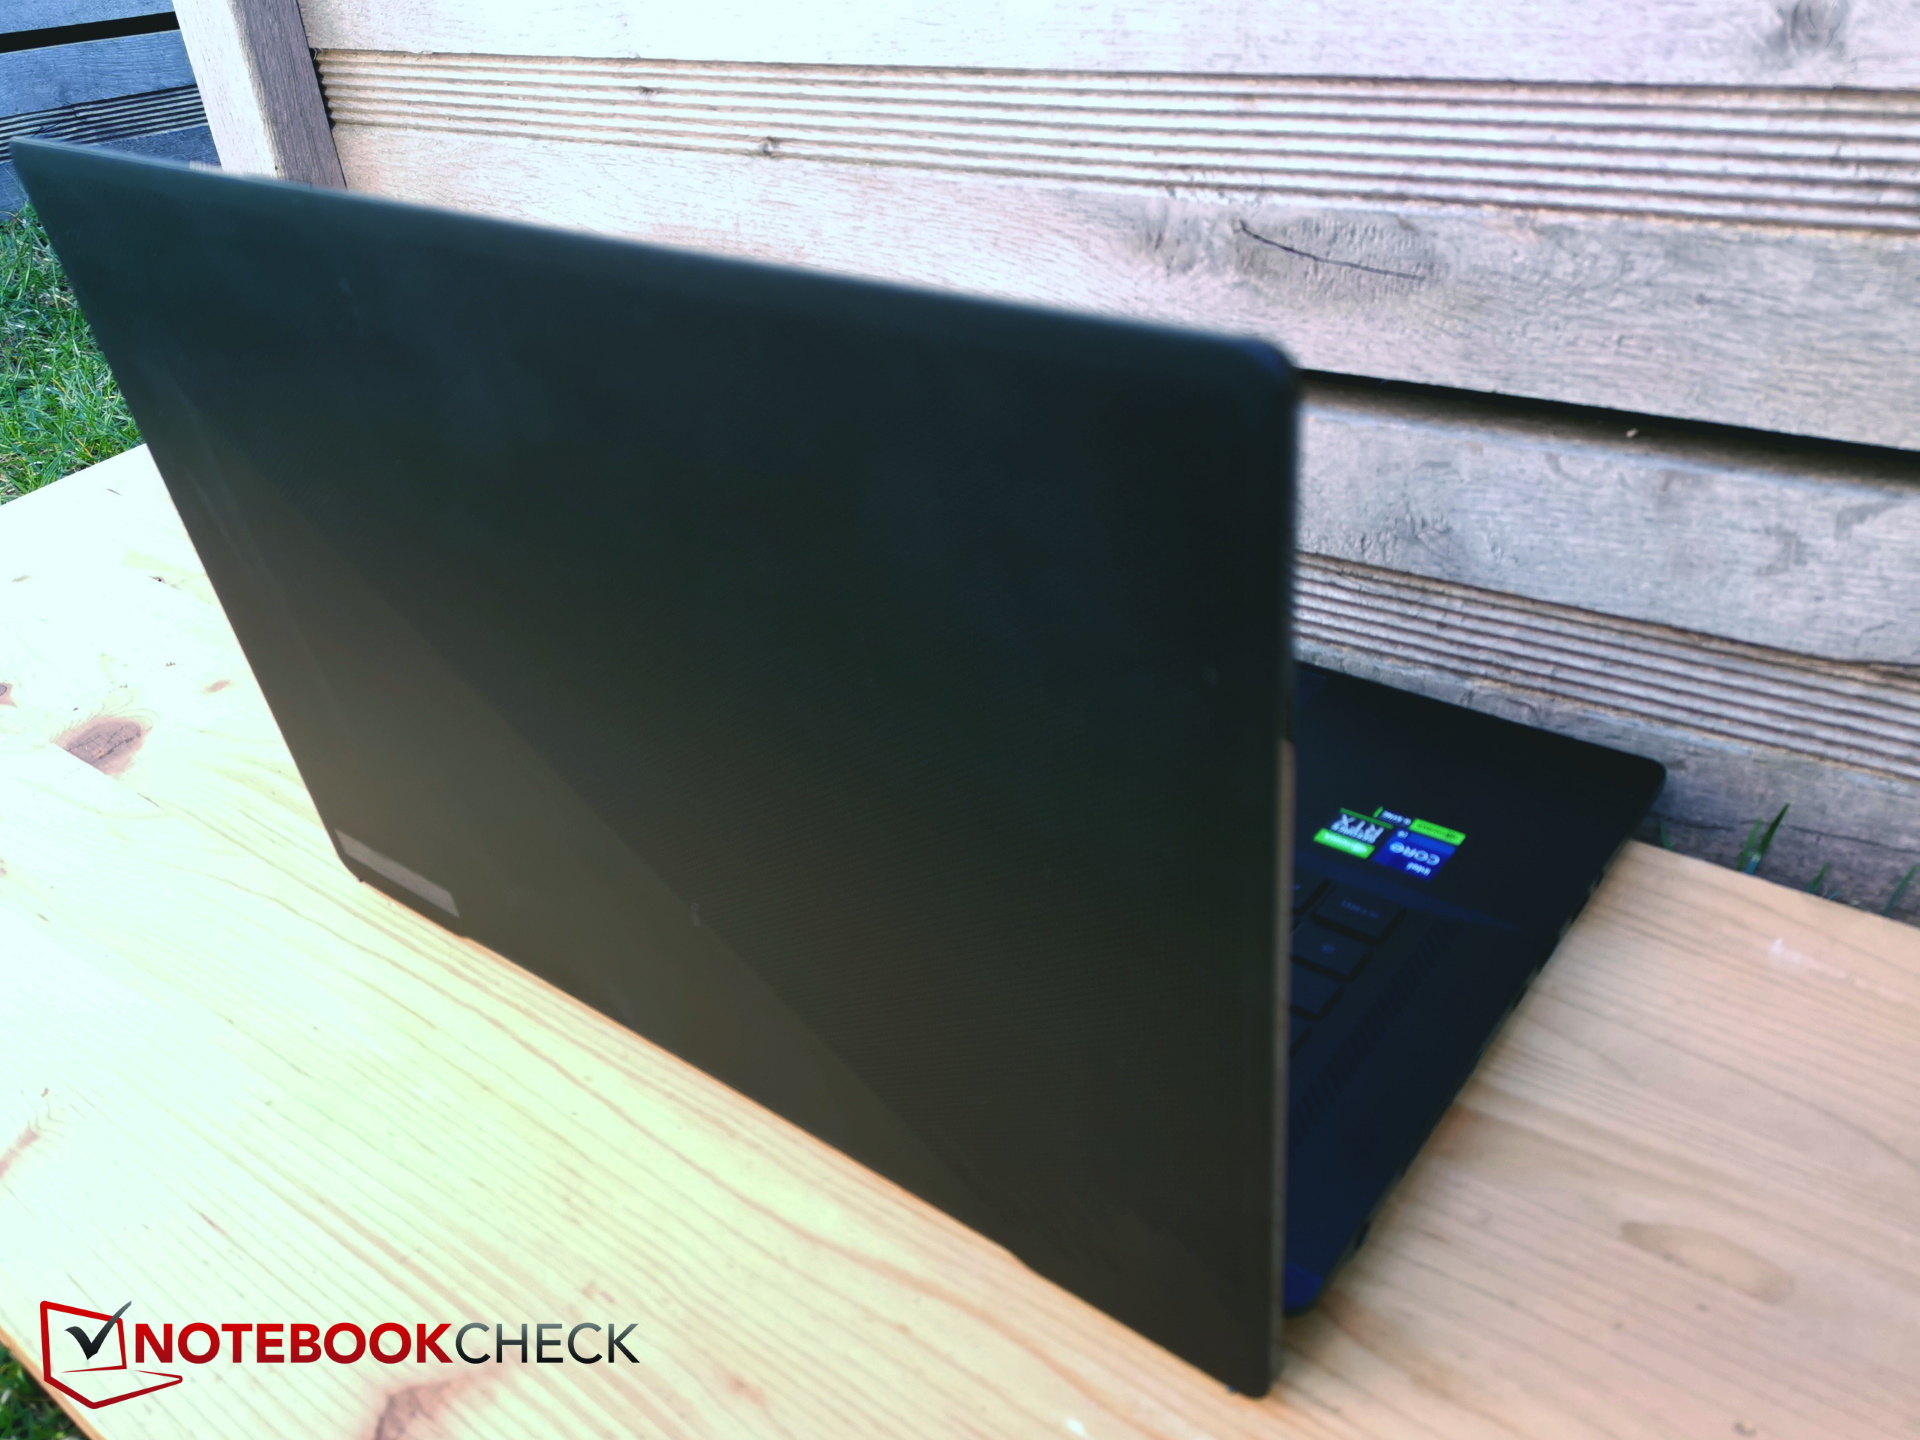
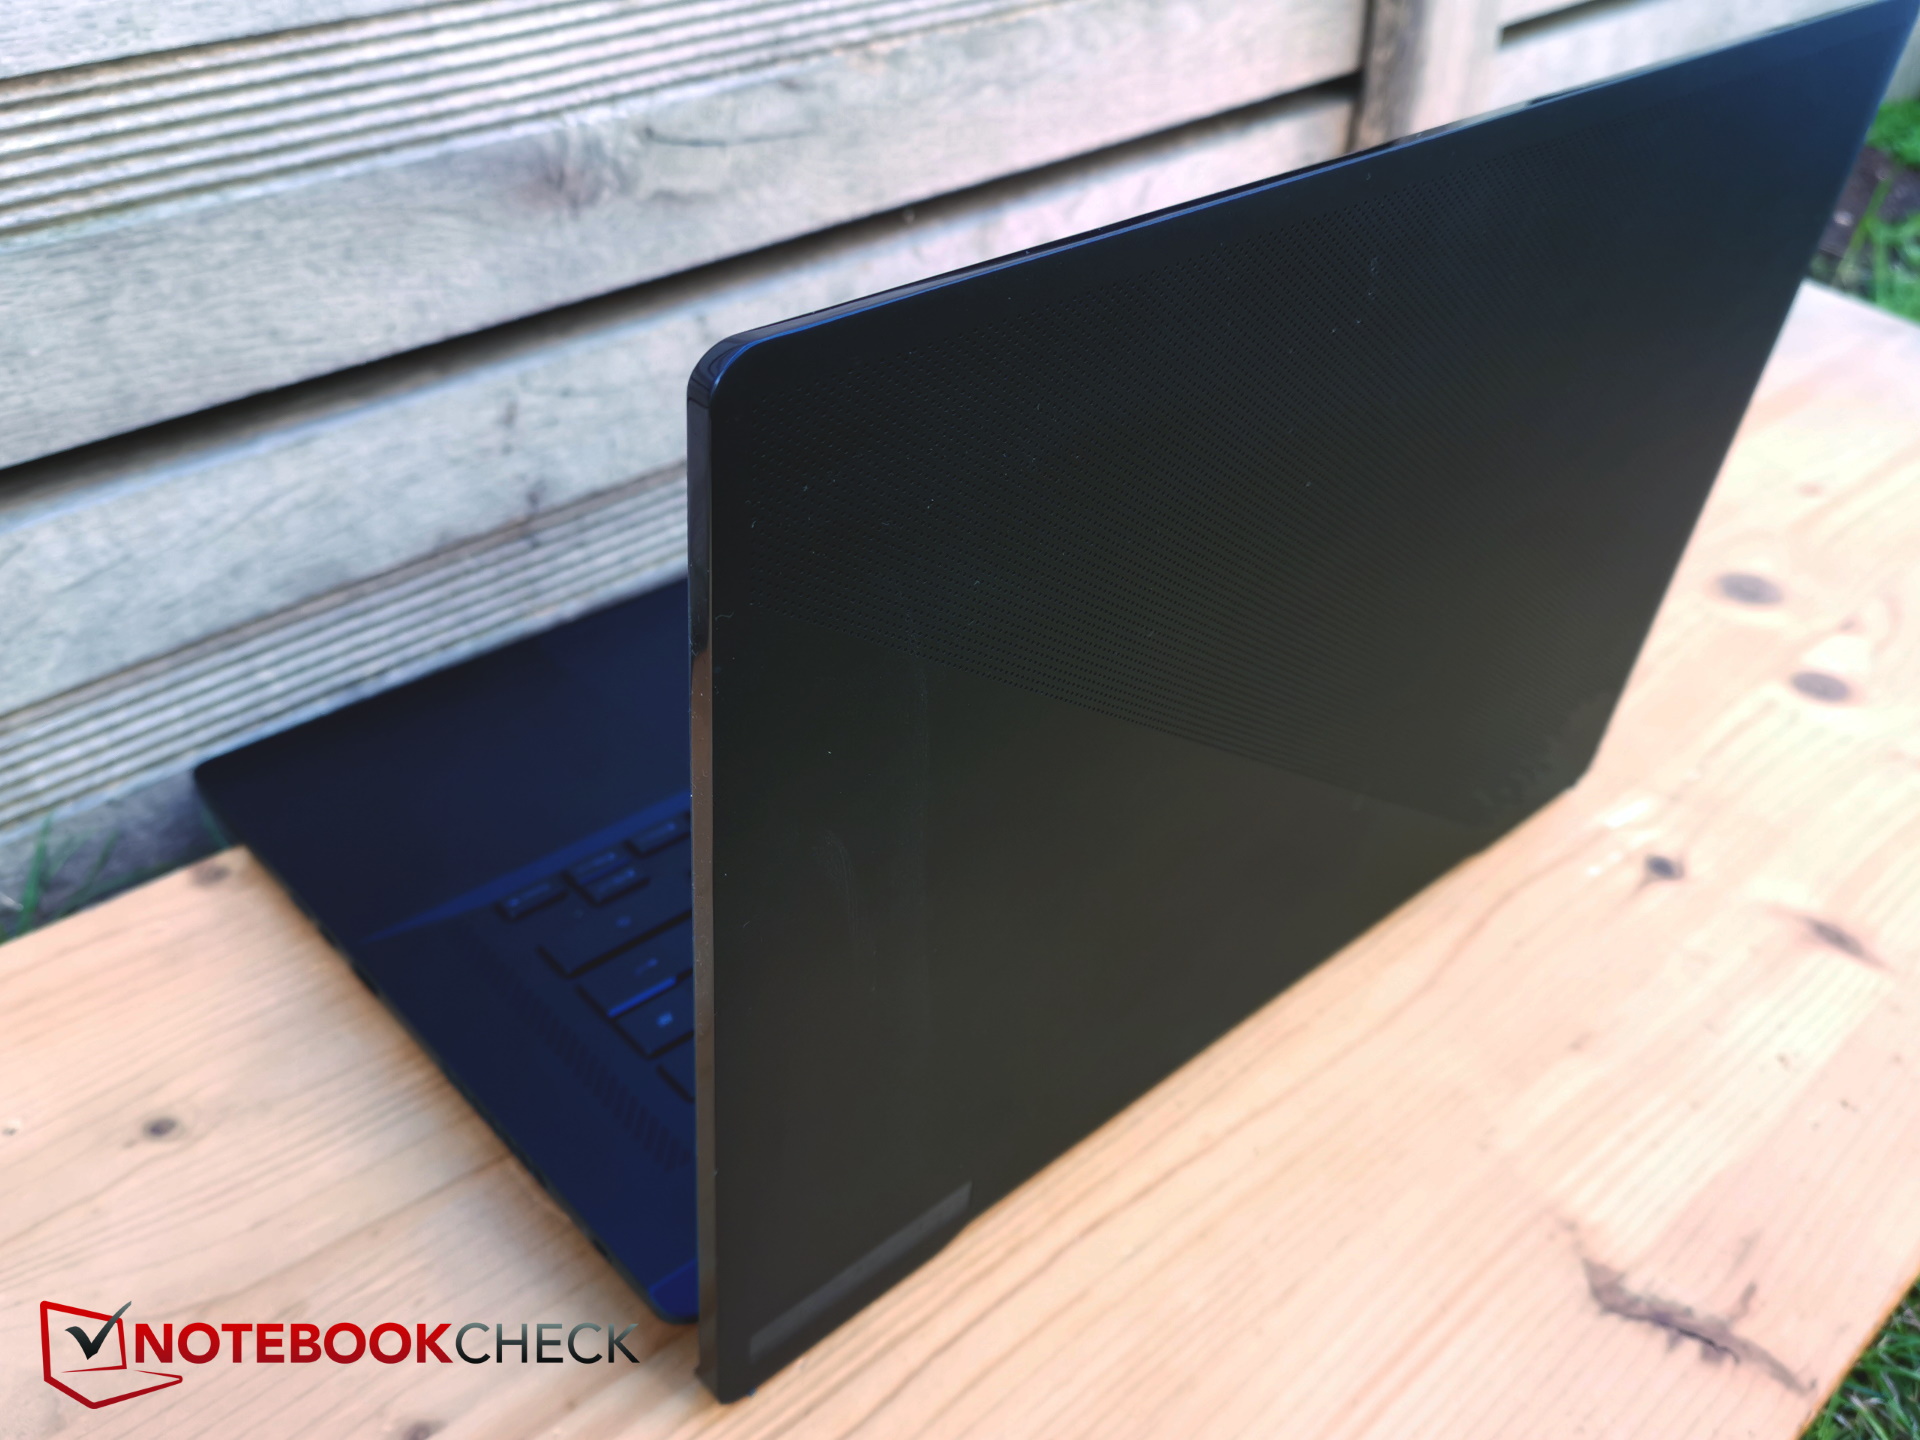
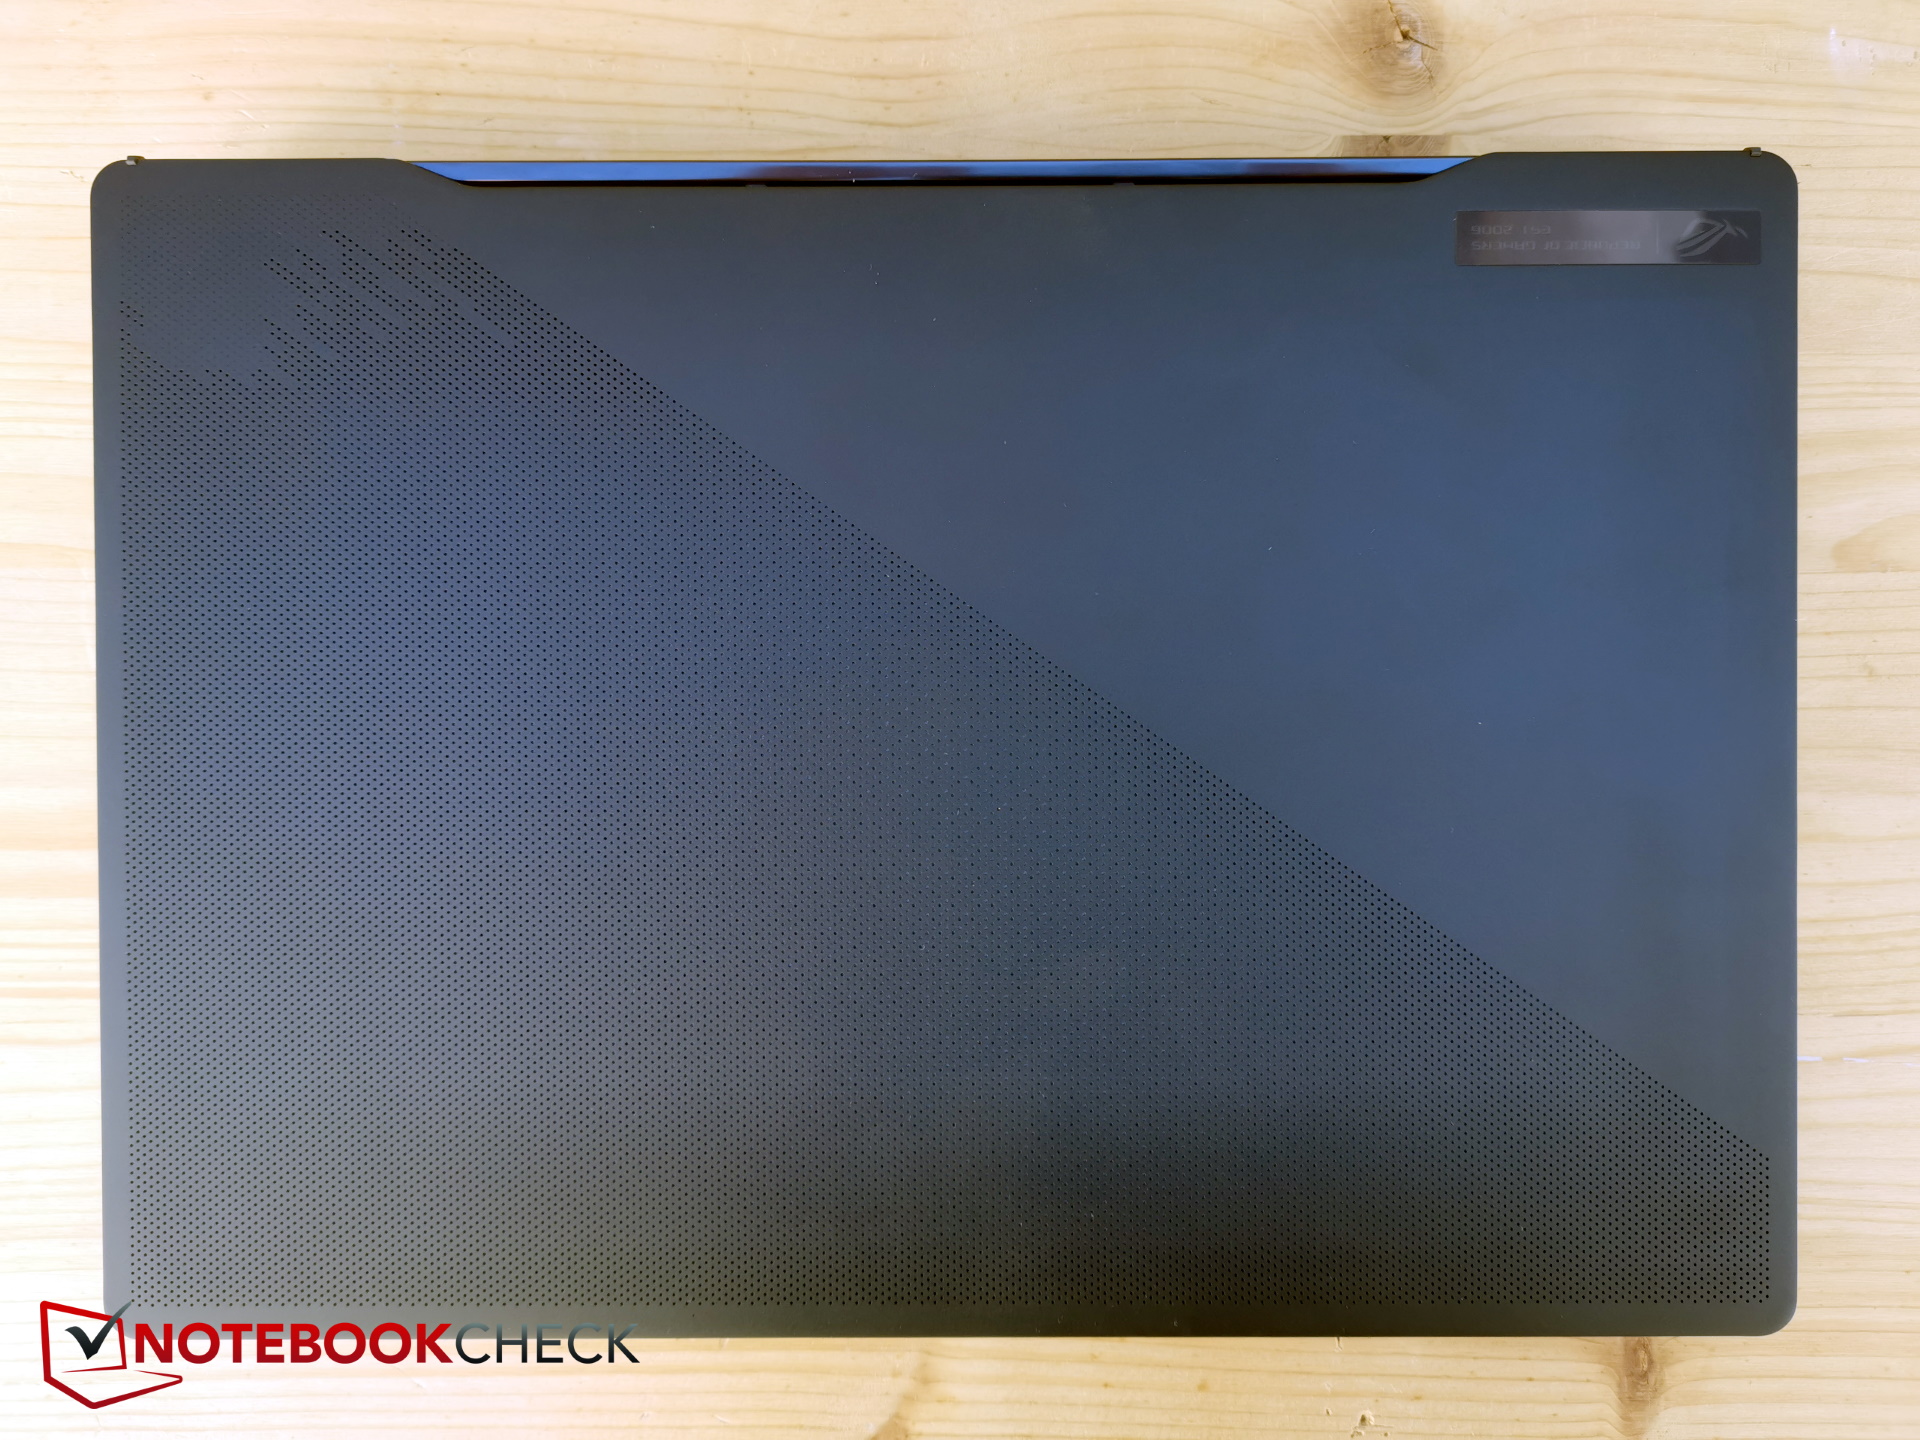
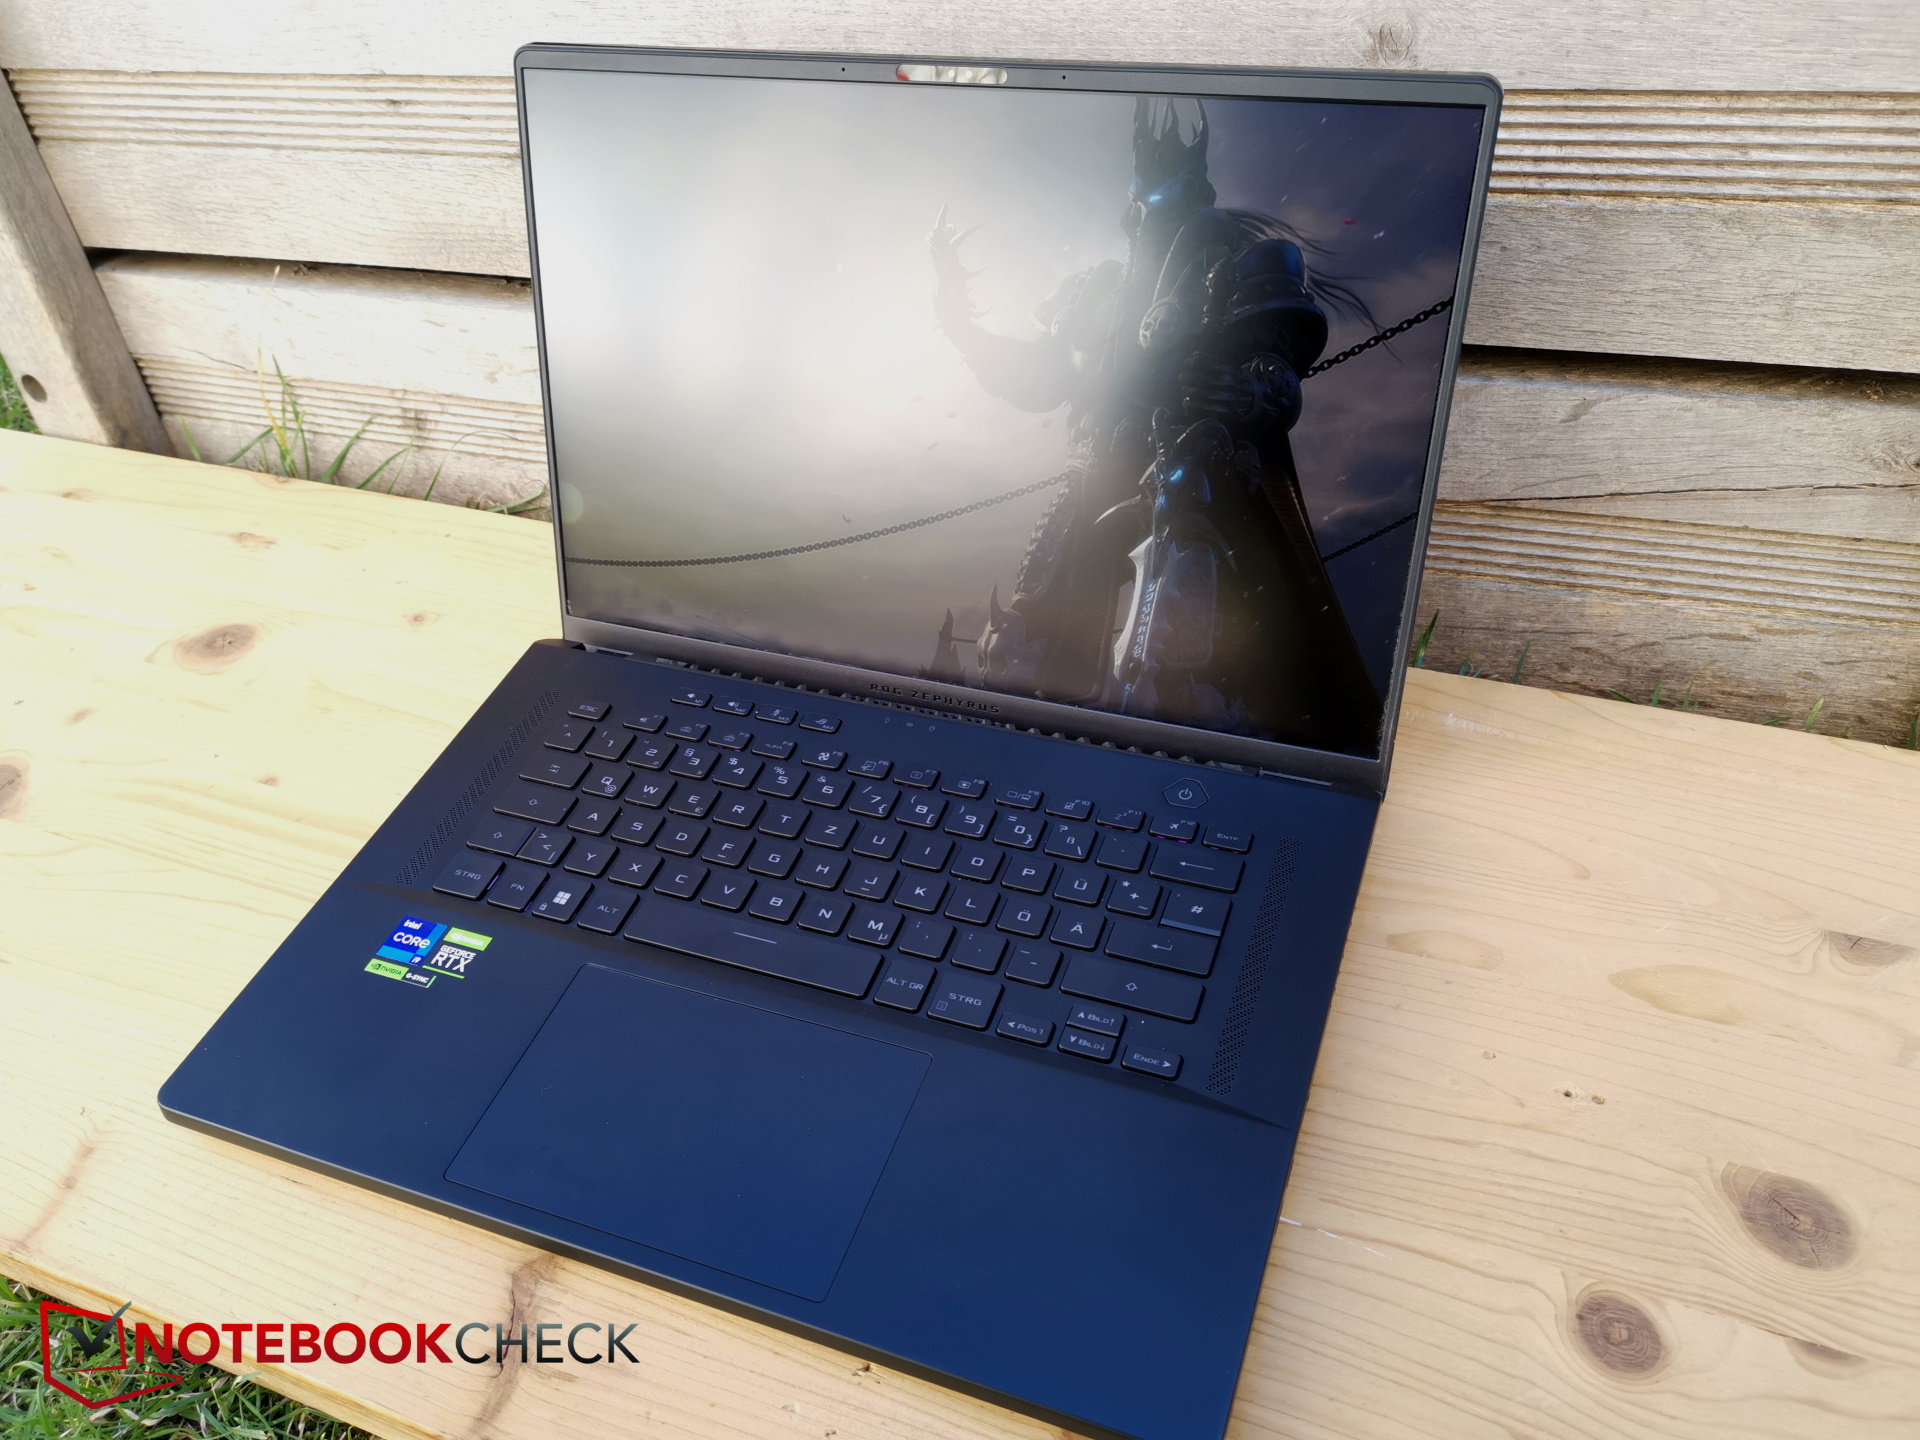
Caso - Una Matriz AniMe de infarto
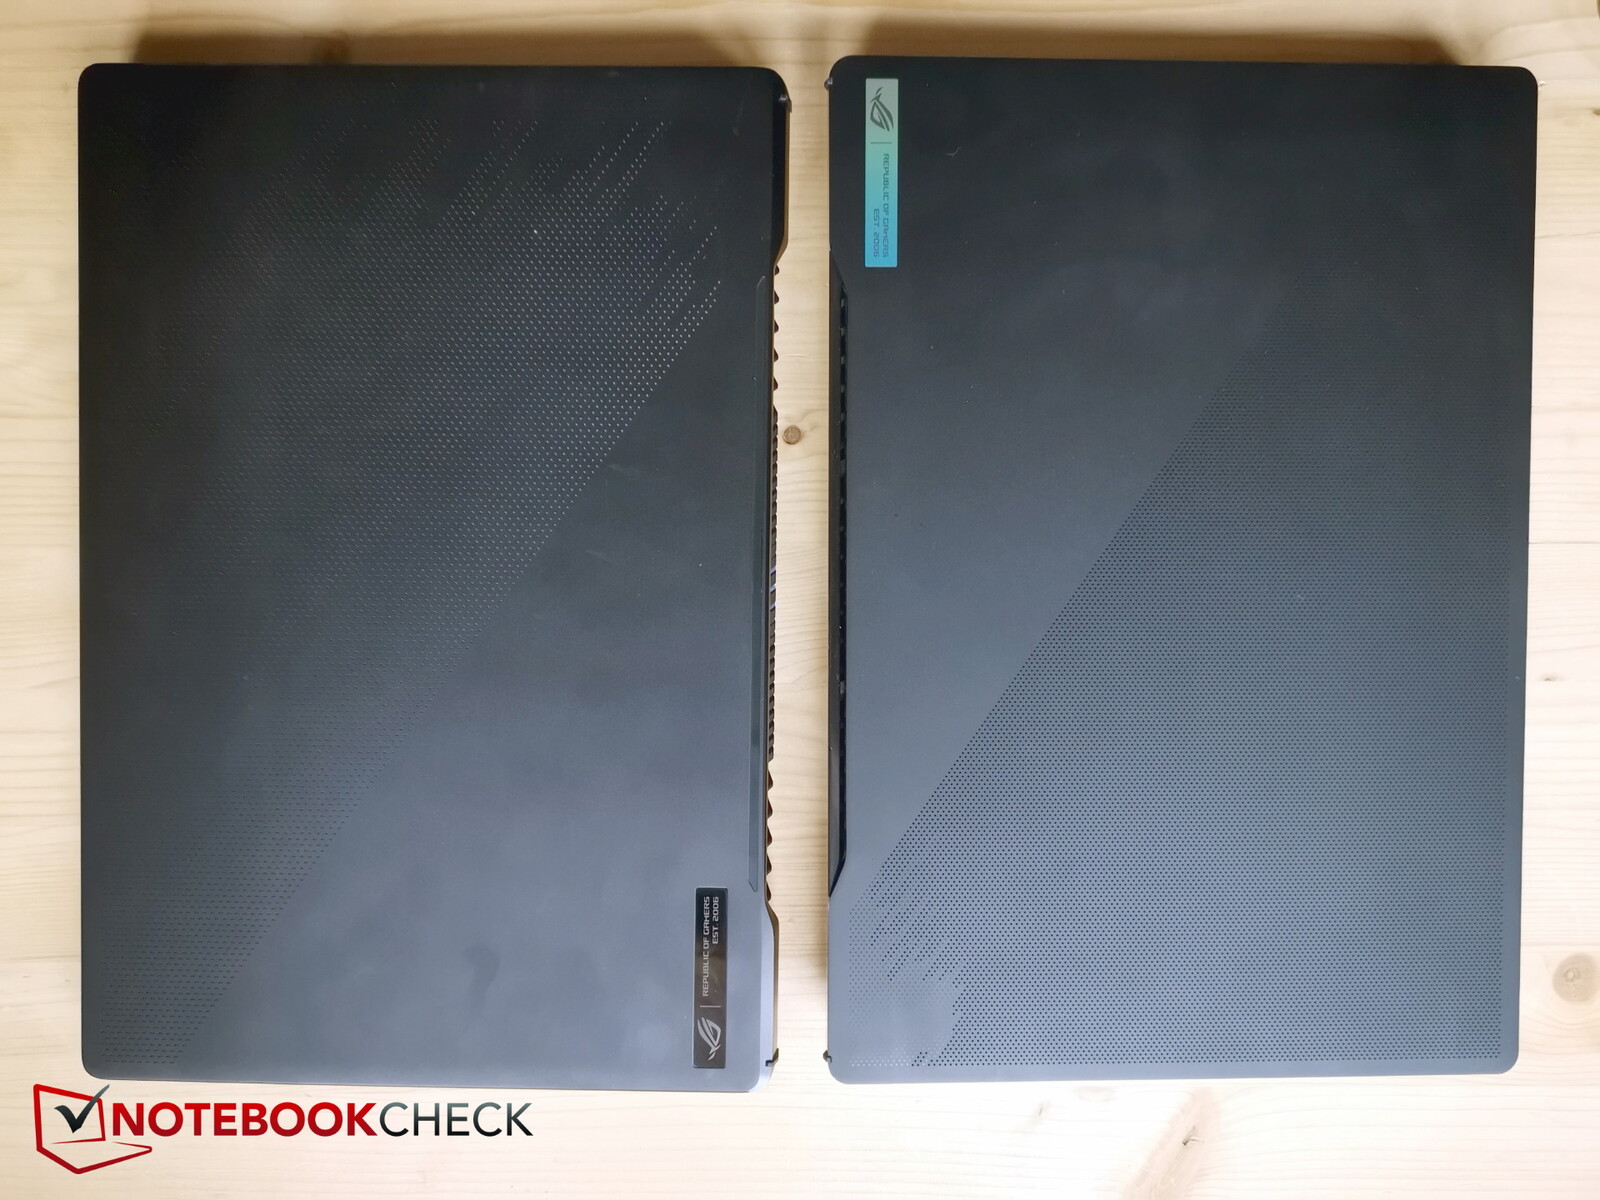
Gigabyte ha revisado la carcasa este año pero, a primera vista, es difícil detectar diferencias obvias. El chasis sigue siendo de plástico negro que ahora es ligeramente más grueso.
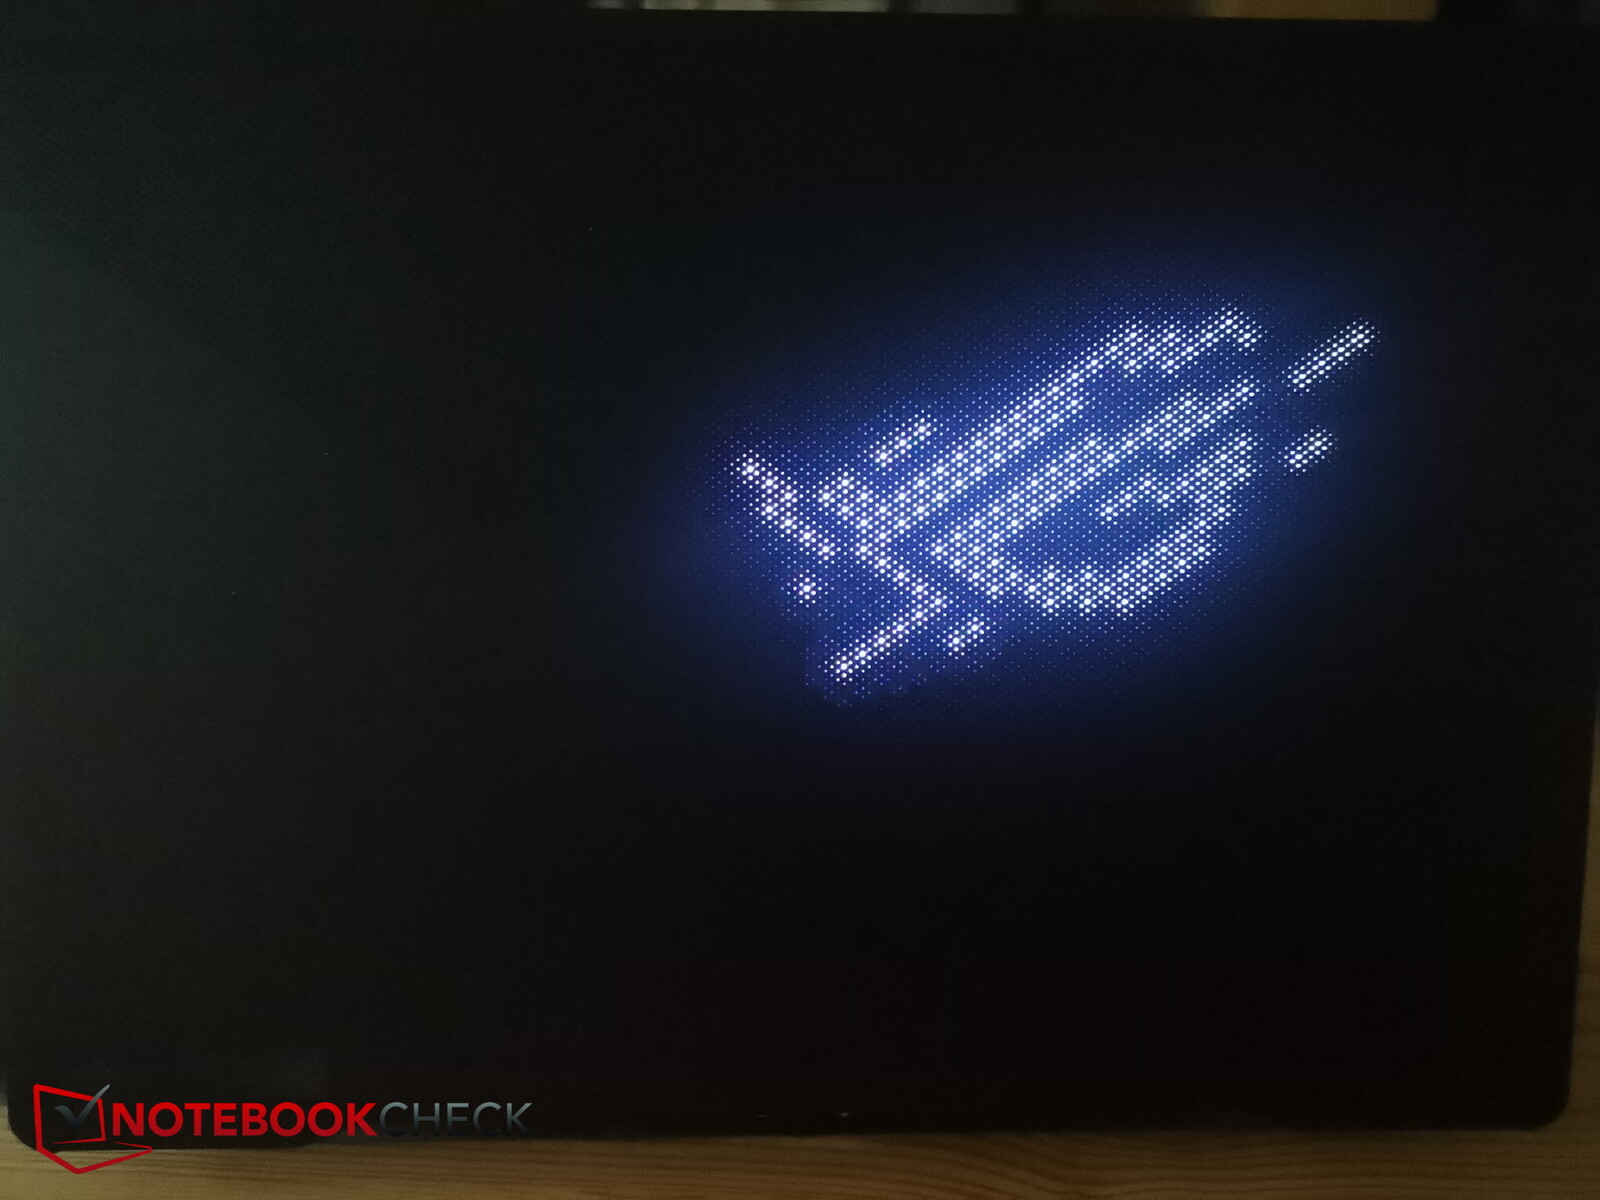
La denominada matriz AniMe de la superficie superior es más fina y detallada que antes y puede mostrar logotipos o texto sencillos en movimiento con efectos adicionales. Por un lado, esto es genial, pero no sólo es probable que aumente el consumo de energía del dispositivo, sino que es prácticamente invisible para el usuario cuando el portátil está abierto. Por eso, el efecto está más dirigido a impresionar a los curiosos.
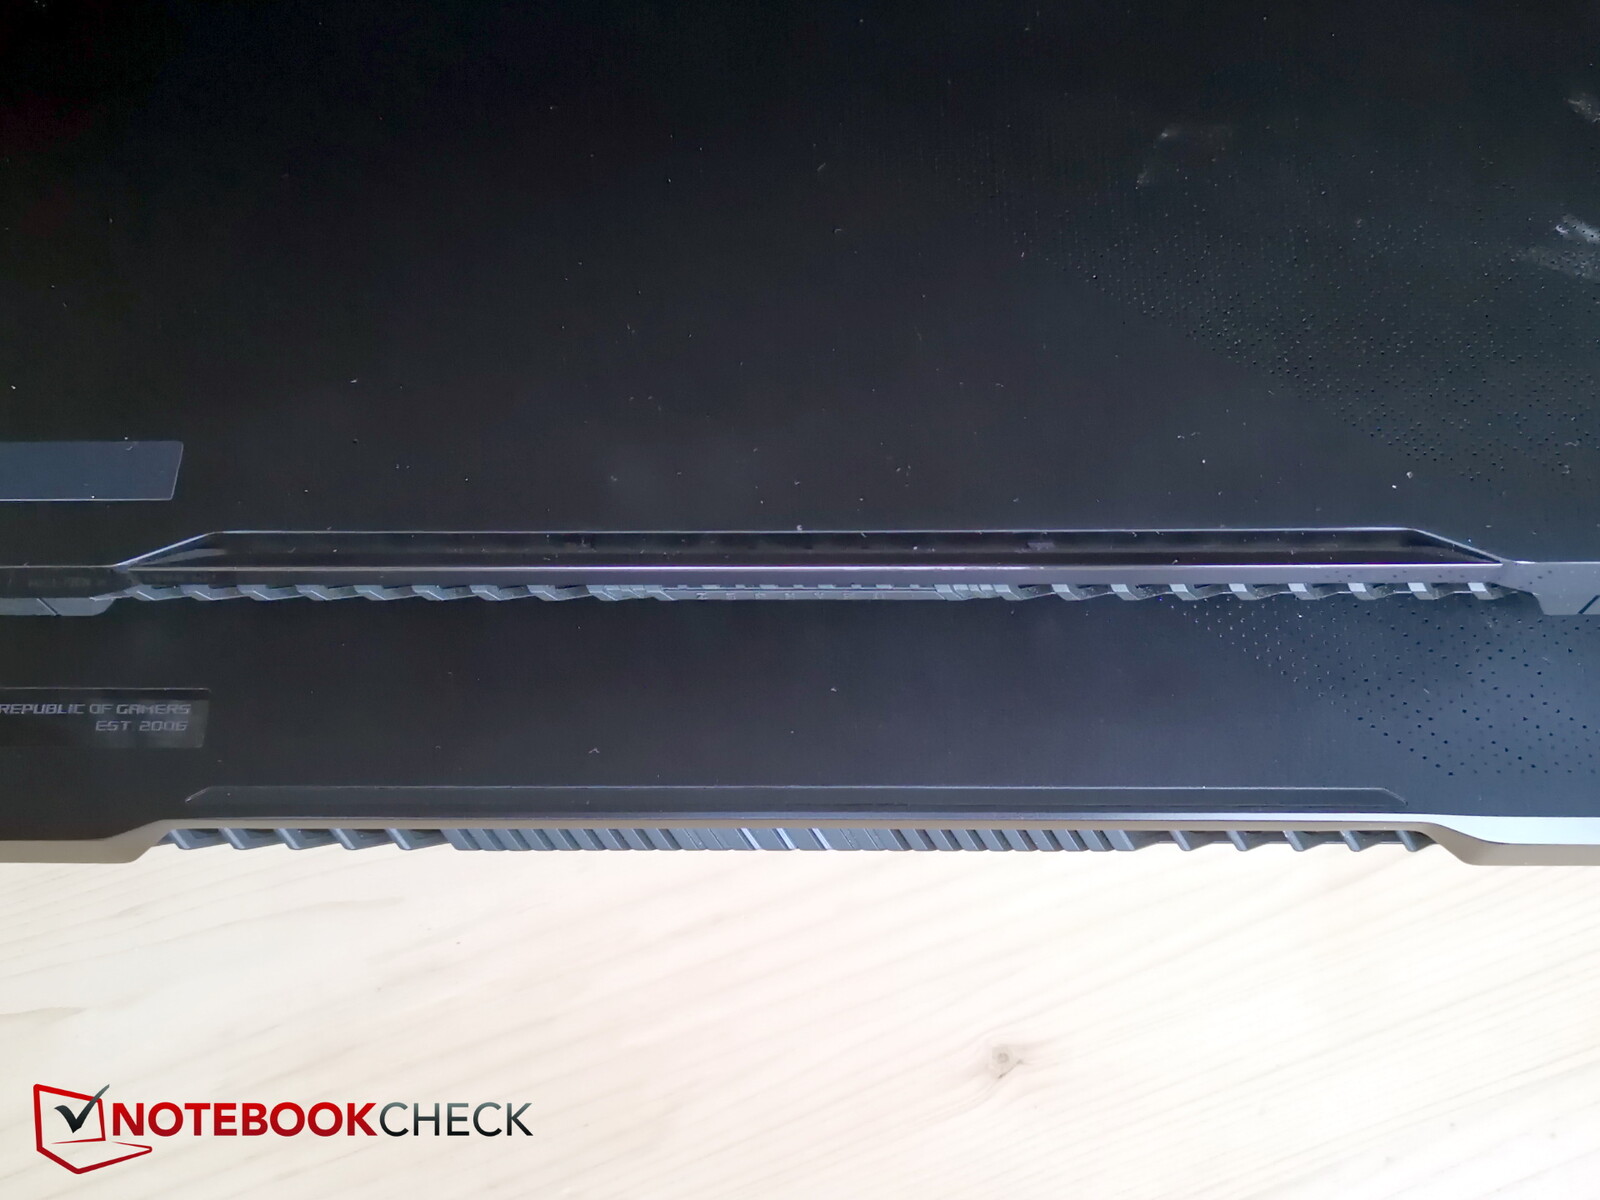
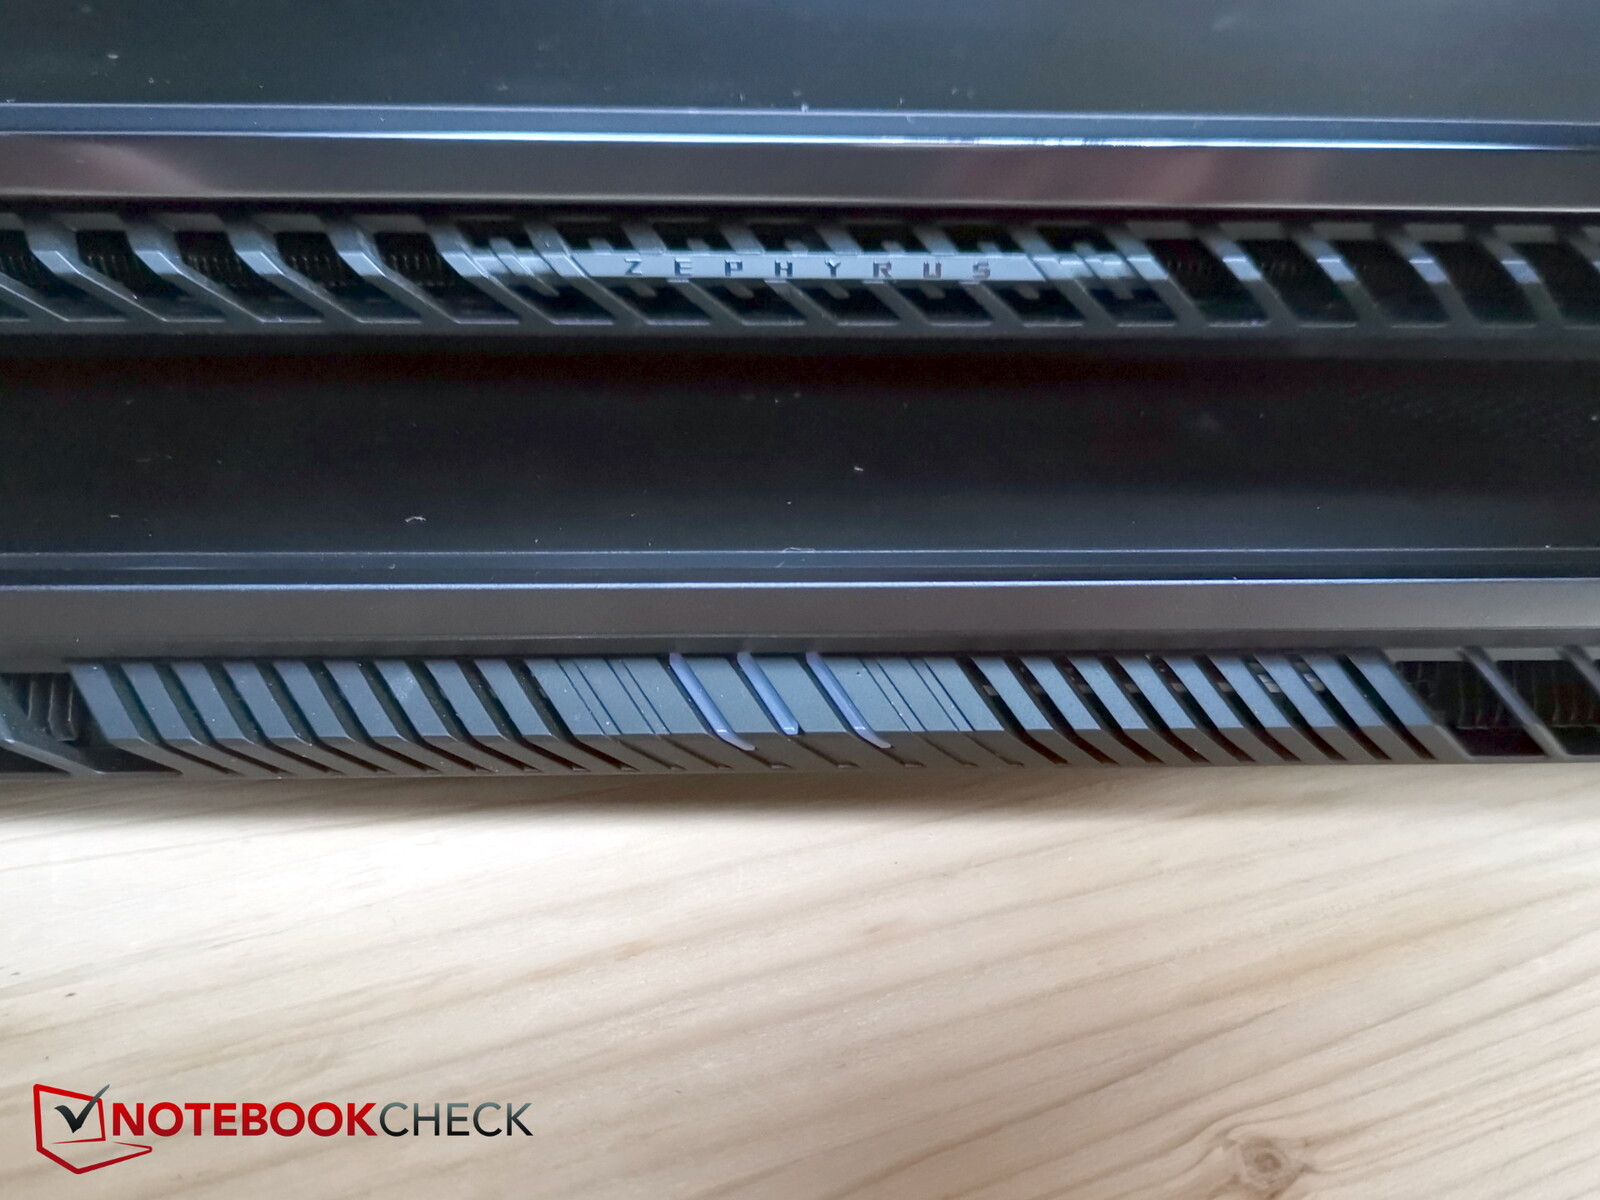
No nos impresionó la barra de plástico negro en blanco de la parte superior trasera de la tapa. Tiene un aspecto algo barato, no es muy estable y ya había empezado a mostrar signos de desgaste. En general, casi todas las rejillas de ventilación de los laterales se han modificado ligeramente, al igual que la ubicación de los puertos.
La base parece robusta pero cruje y cruje bastante al intentar girar la carcasa. Lo mismo ocurre con la tapa de la pantalla, que se puede doblar con bastante facilidad. Las bisagras sujetan la pantalla con bastante seguridad y garantizan que la tapa pueda abrirse en un ángulo de hasta 180 grados. Al abrir el portátil, se revelan dos cosas al usuario: el teclado se levanta ligeramente y los biseles de la pantalla son bastante finos.

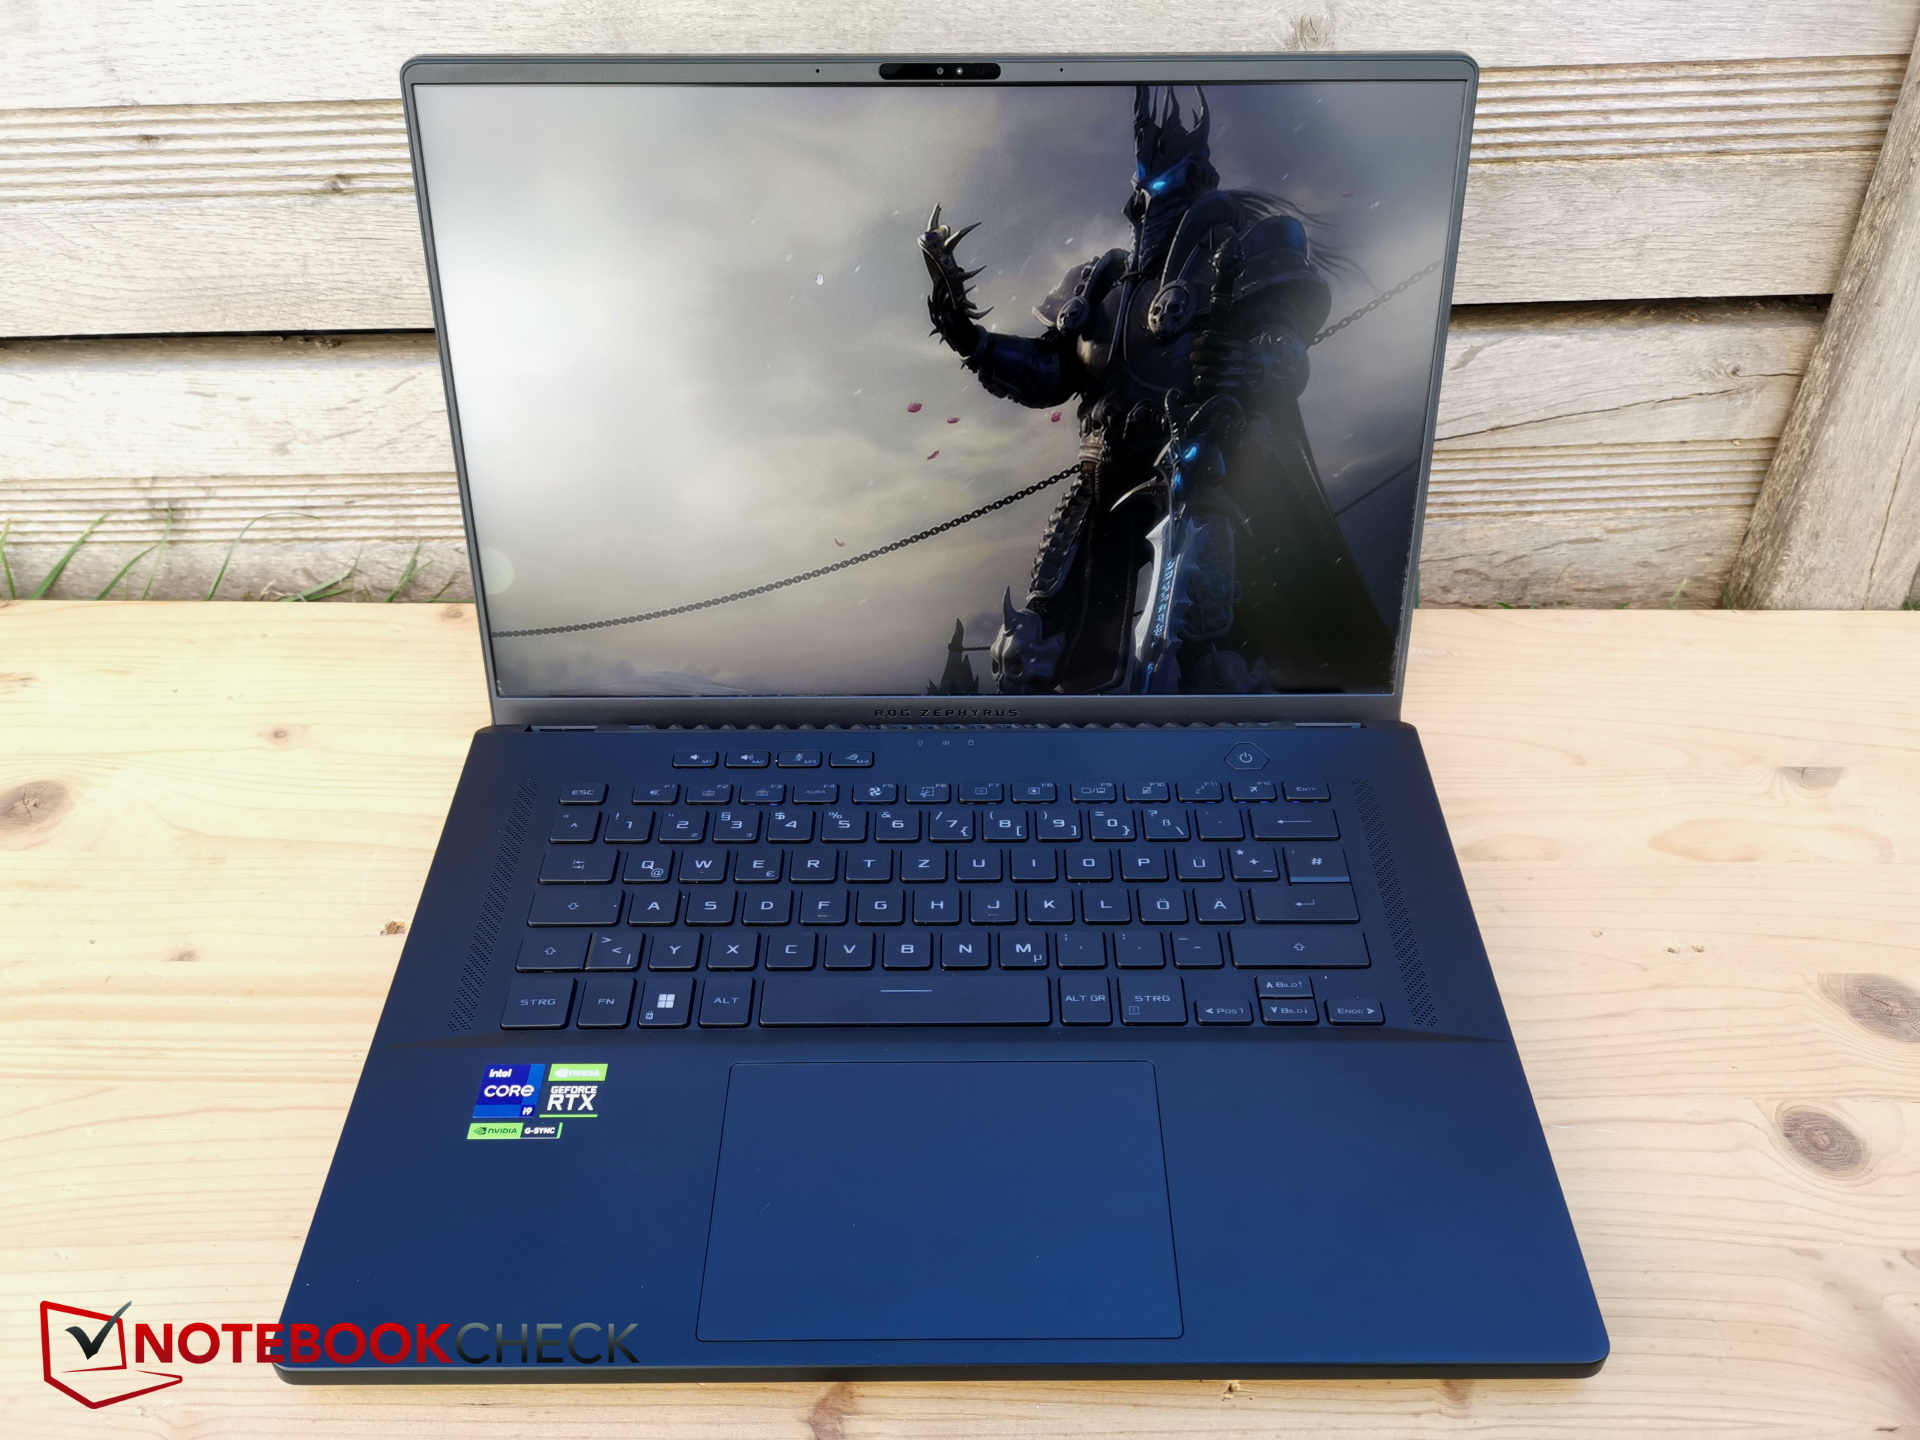
Lo inusual es que el tamaño del dispositivo ha aumentado en comparación con su predecesor predecesor. En contra de la tendencia a fabricar dispositivos más pequeños, delgados y ligeros, el nuevo M16 es ligeramente más grande y también 3 mm más grueso que el modelo de la generación anterior.
El sitioRazer Blade 16 es solo 1 mm más fino, y elLenovo Legion Pro 7es ligeramente más grueso, lo que significa que el nuevo M16 se sitúa en un punto intermedio, también en lo que respecta al peso.
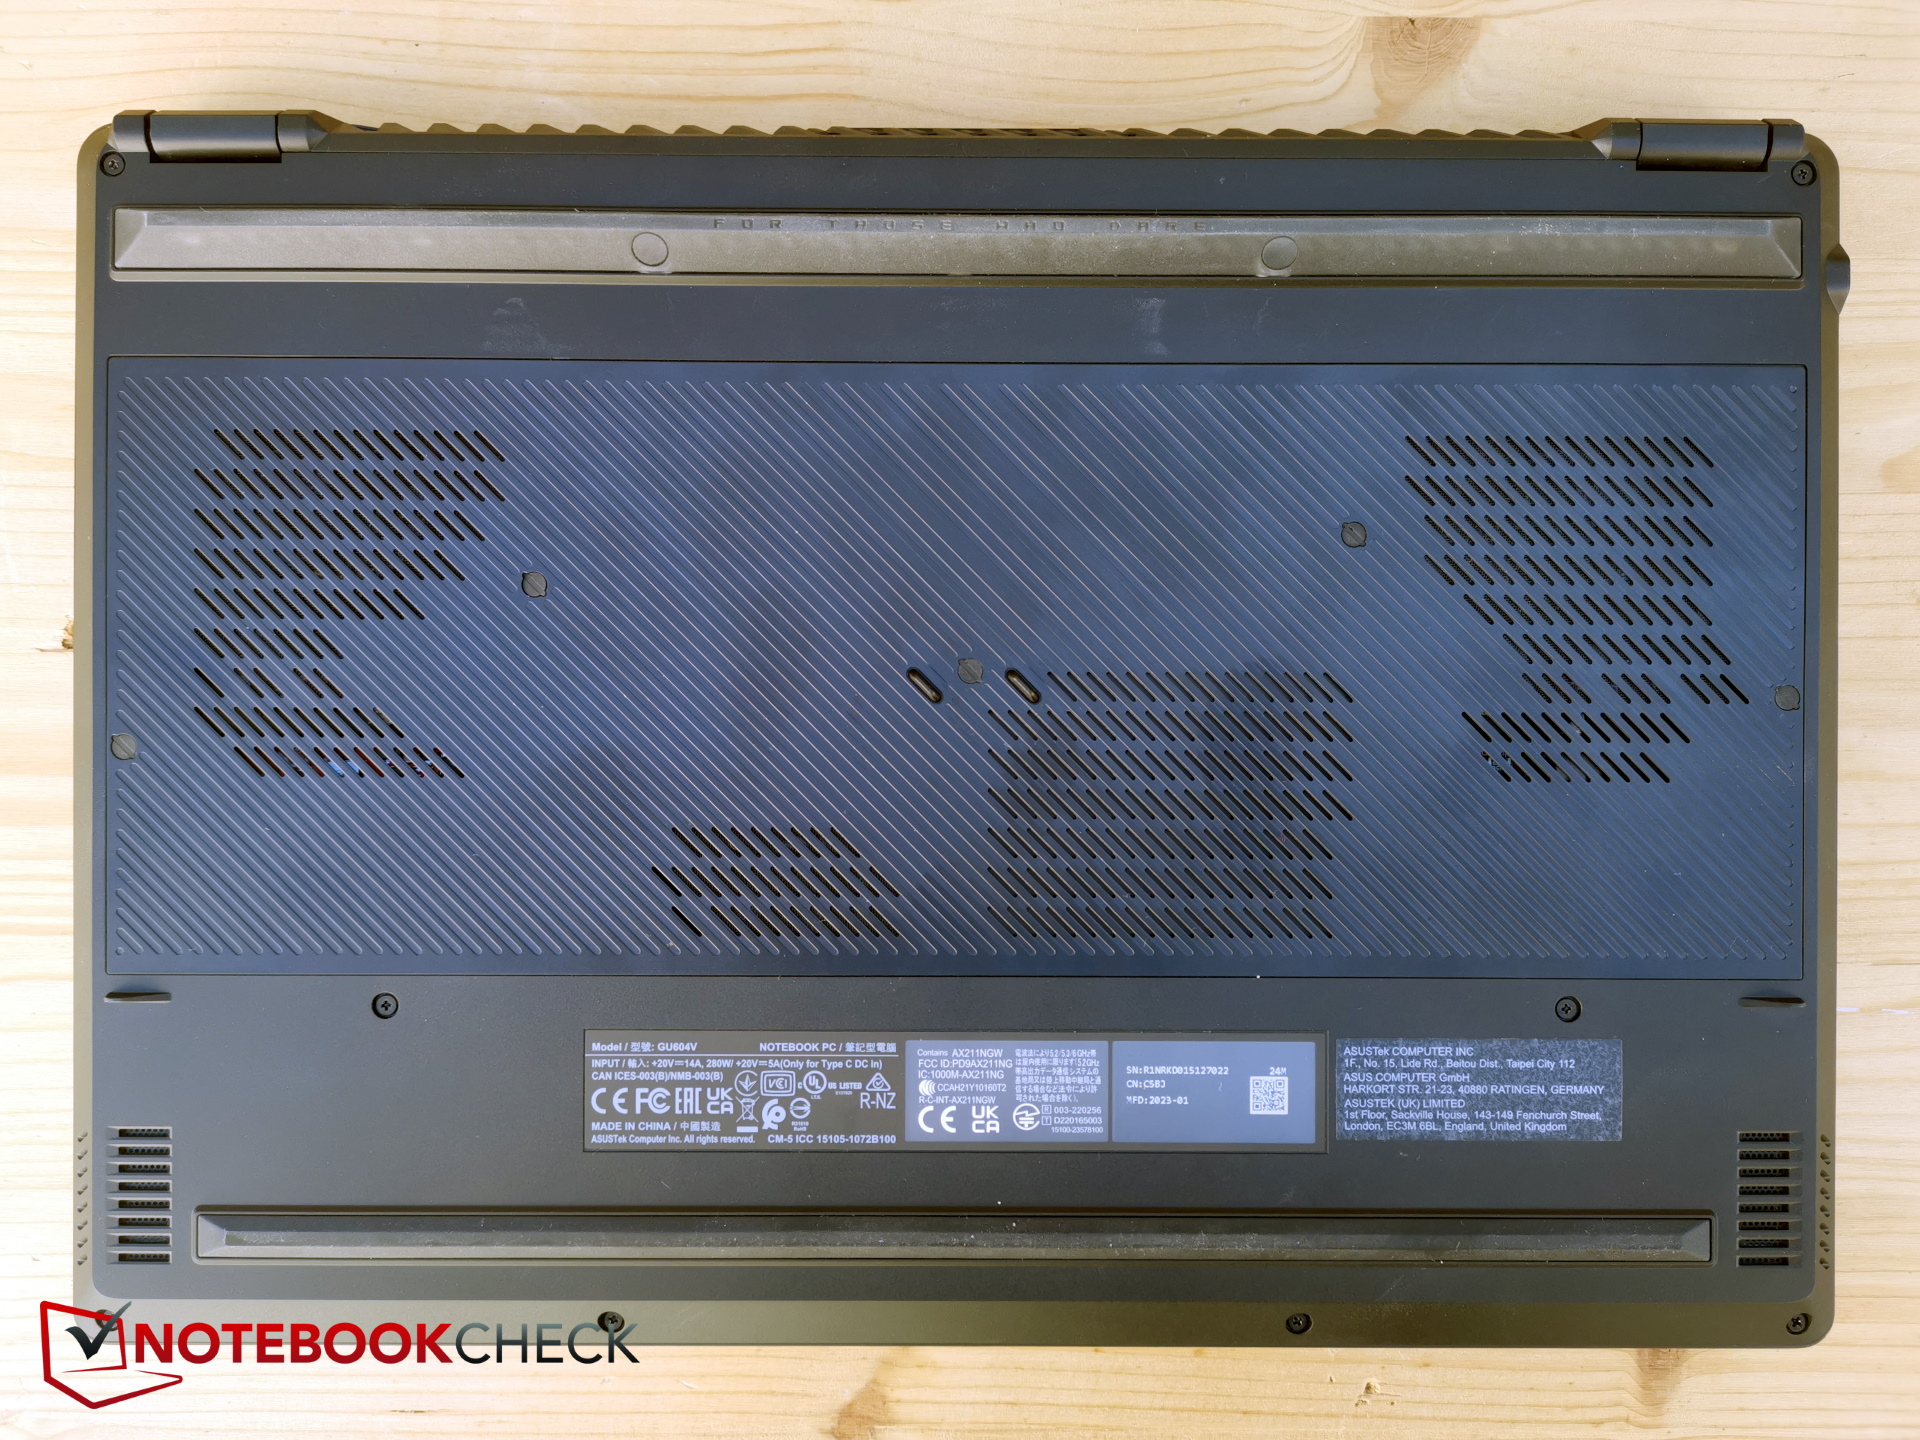
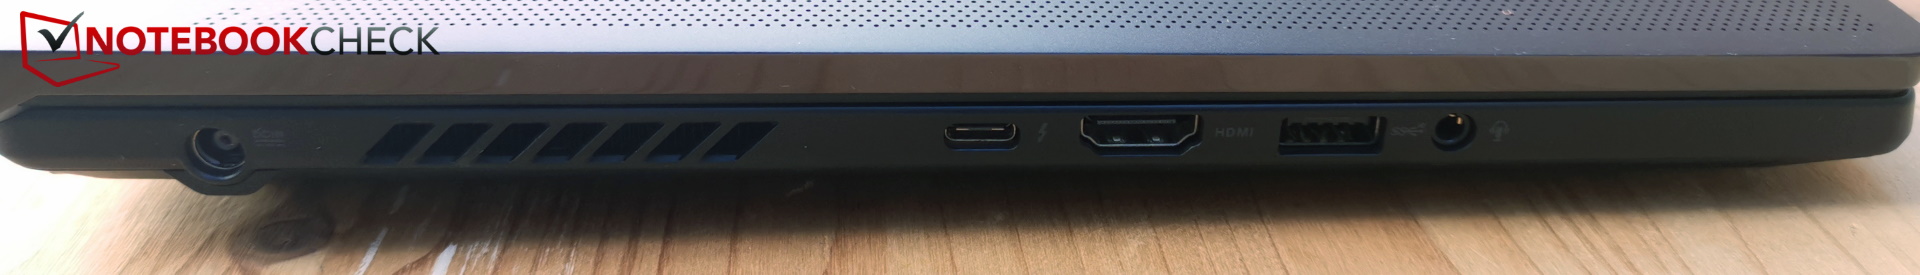
Características - Una máquina de juegos sin puerto LAN
Tampoco en este aspecto todo ha cambiado para mejor: El puerto LAN simplemente se ha omitido, lo que significa que una conexión rápida a Internet sólo es posible con un adaptador para aquellos jugadores que busquen la latencia más corta y la conexión más rápida.
Uno de los puertos USB-C se ha desplazado del lado izquierdo al derecho. Esto significa que hay más espacio disponible a la izquierda del dispositivo. En la parte trasera sigue habiendo solo rejillas de ventilador, lo que resulta en una falta de espacio para conectores más voluminosos como HDMI o el puerto LAN que falta.
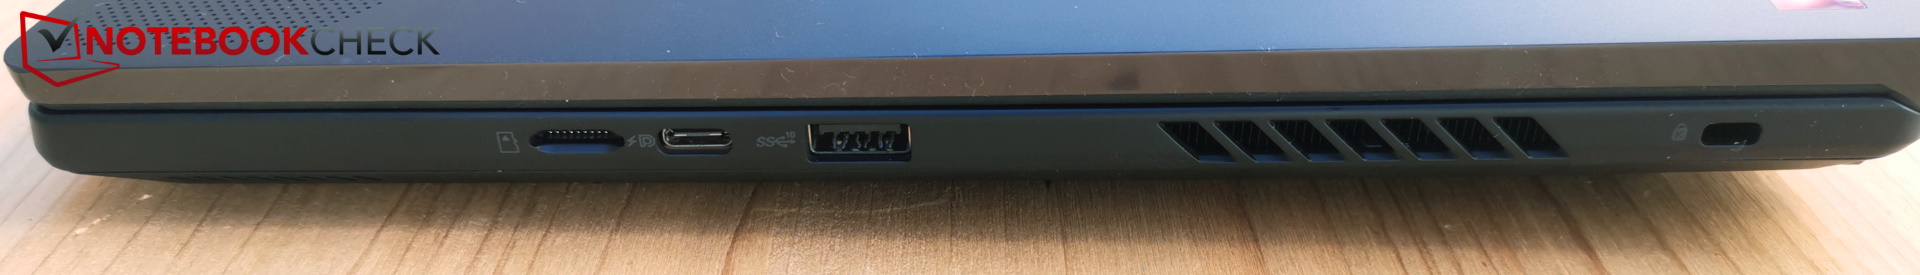
Lector de tarjetas SD
Al menos, el portátil viene con un lector de tarjetas SD integrado y, aunque por desgracia sólo está pensado para tarjetas microSD, sigue siendo muy rápido. Pudimos copiar una imagen de 1 GB en el escritorio en menos de 6 segundos con nuestra tarjeta de referencia AV PRO microSD 128 GB V60.
| SD Card Reader | |
| average JPG Copy Test (av. of 3 runs) | |
| Asus ROG Zephyrus M16 GU604VY-NM042X | |
| Asus ROG Zephyrus M16 GU603Z | |
| Media de la clase Gaming (20.9 - 210, n=54, últimos 2 años) | |
| Razer Blade 16 Early 2023 (AV PRO microSD 128 GB V60) | |
| MSI Titan GT77 HX 13VI (Angelibird AV Pro V60) | |
| maximum AS SSD Seq Read Test (1GB) | |
| Asus ROG Zephyrus M16 GU603Z | |
| Razer Blade 16 Early 2023 (AV PRO microSD 128 GB V60) | |
| Asus ROG Zephyrus M16 GU604VY-NM042X | |
| Media de la clase Gaming (25.5 - 261, n=51, últimos 2 años) | |
| MSI Titan GT77 HX 13VI (Angelibird AV Pro V60) | |
Comunicación
Por desgracia, el fabricante ha prescindido del puerto LAN y no ha incluido ningún adaptador.
De las conexiones inalámbricas se encarga el módulo Intel AX210 WiFi 6E. Este transmite a 2,4 GHz, 5 GHz y 6 GHz.
Las velocidades de transferencia son rápidas y constantes.
Cámara web
En este campo, el fabricante por fin ha actualizado a una cámara FullHD y este modelo tiene incluso un sensor IR para iniciar sesión en Windows usando Windows Hello. Sin embargo, las imágenes tienen un evidente tinte amarillo y la desviación del color es relativamente alta.


Seguridad
Dispone de TPM y conector Kensington, pero no tiene sensor de huellas dactilares ni, por desgracia, obturador físico para la webcam.
Accesorios
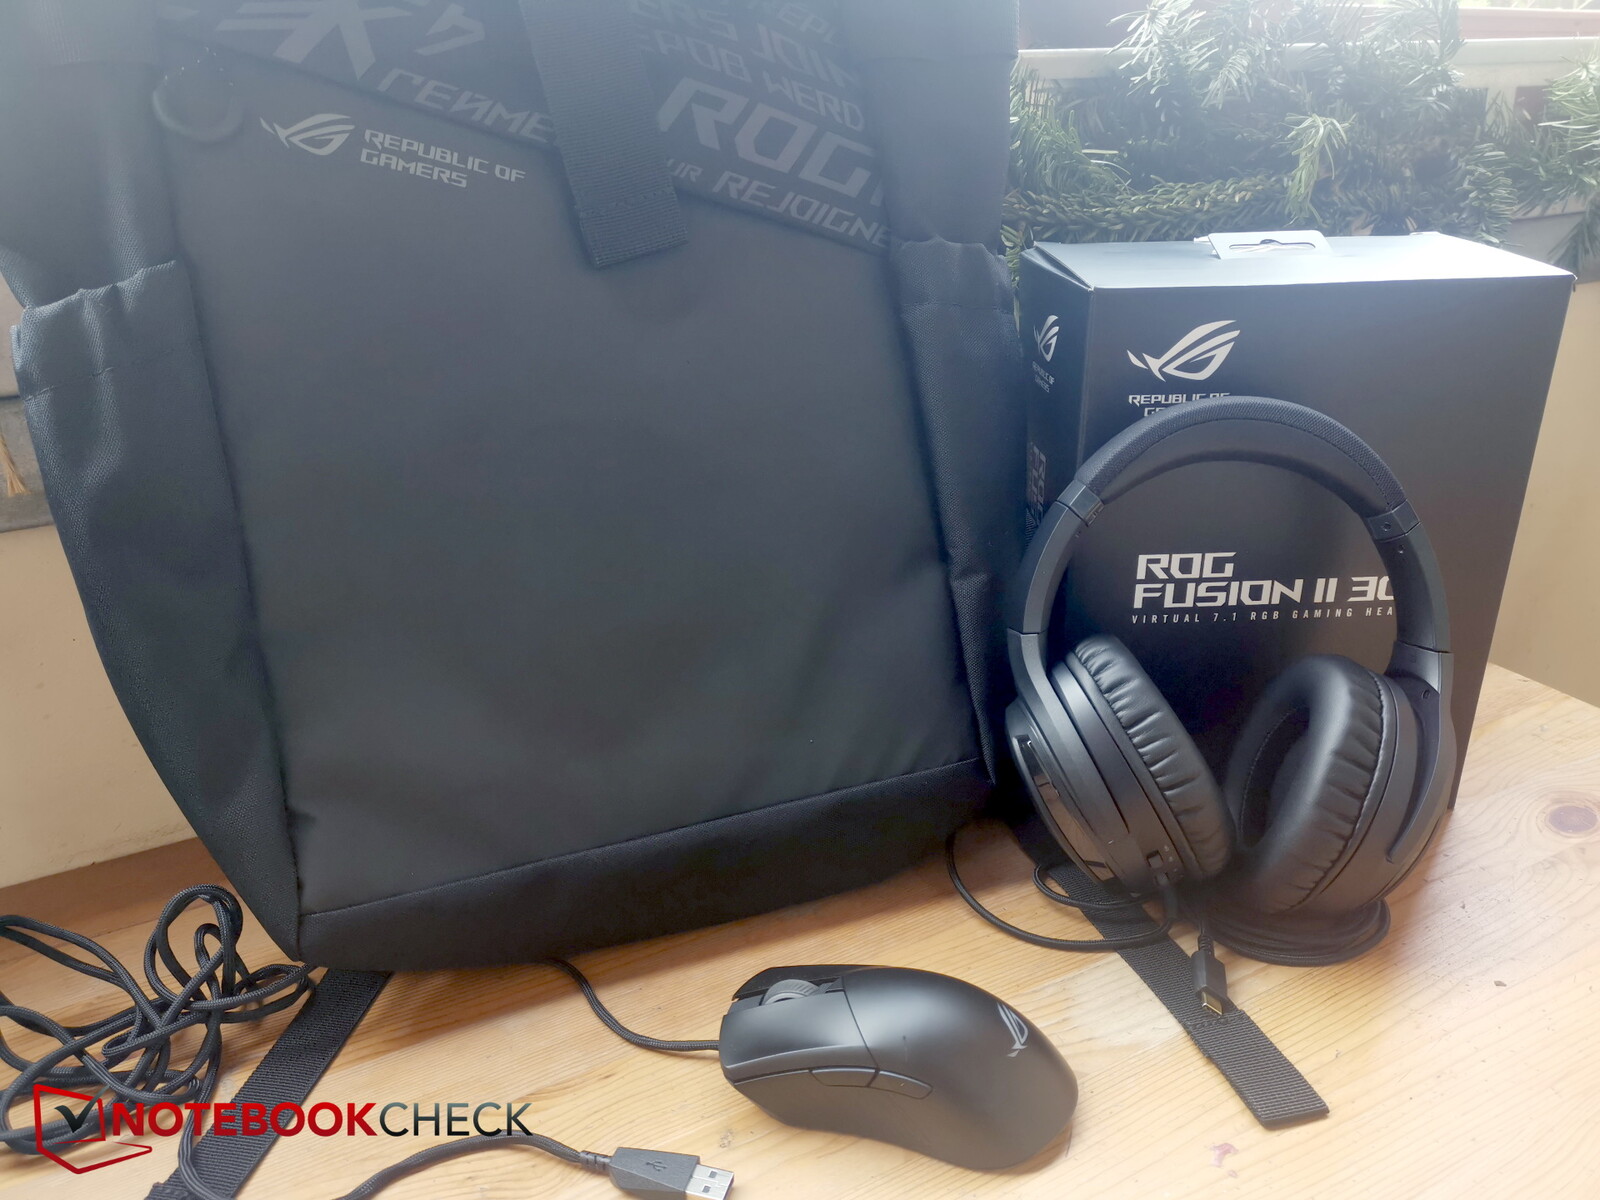
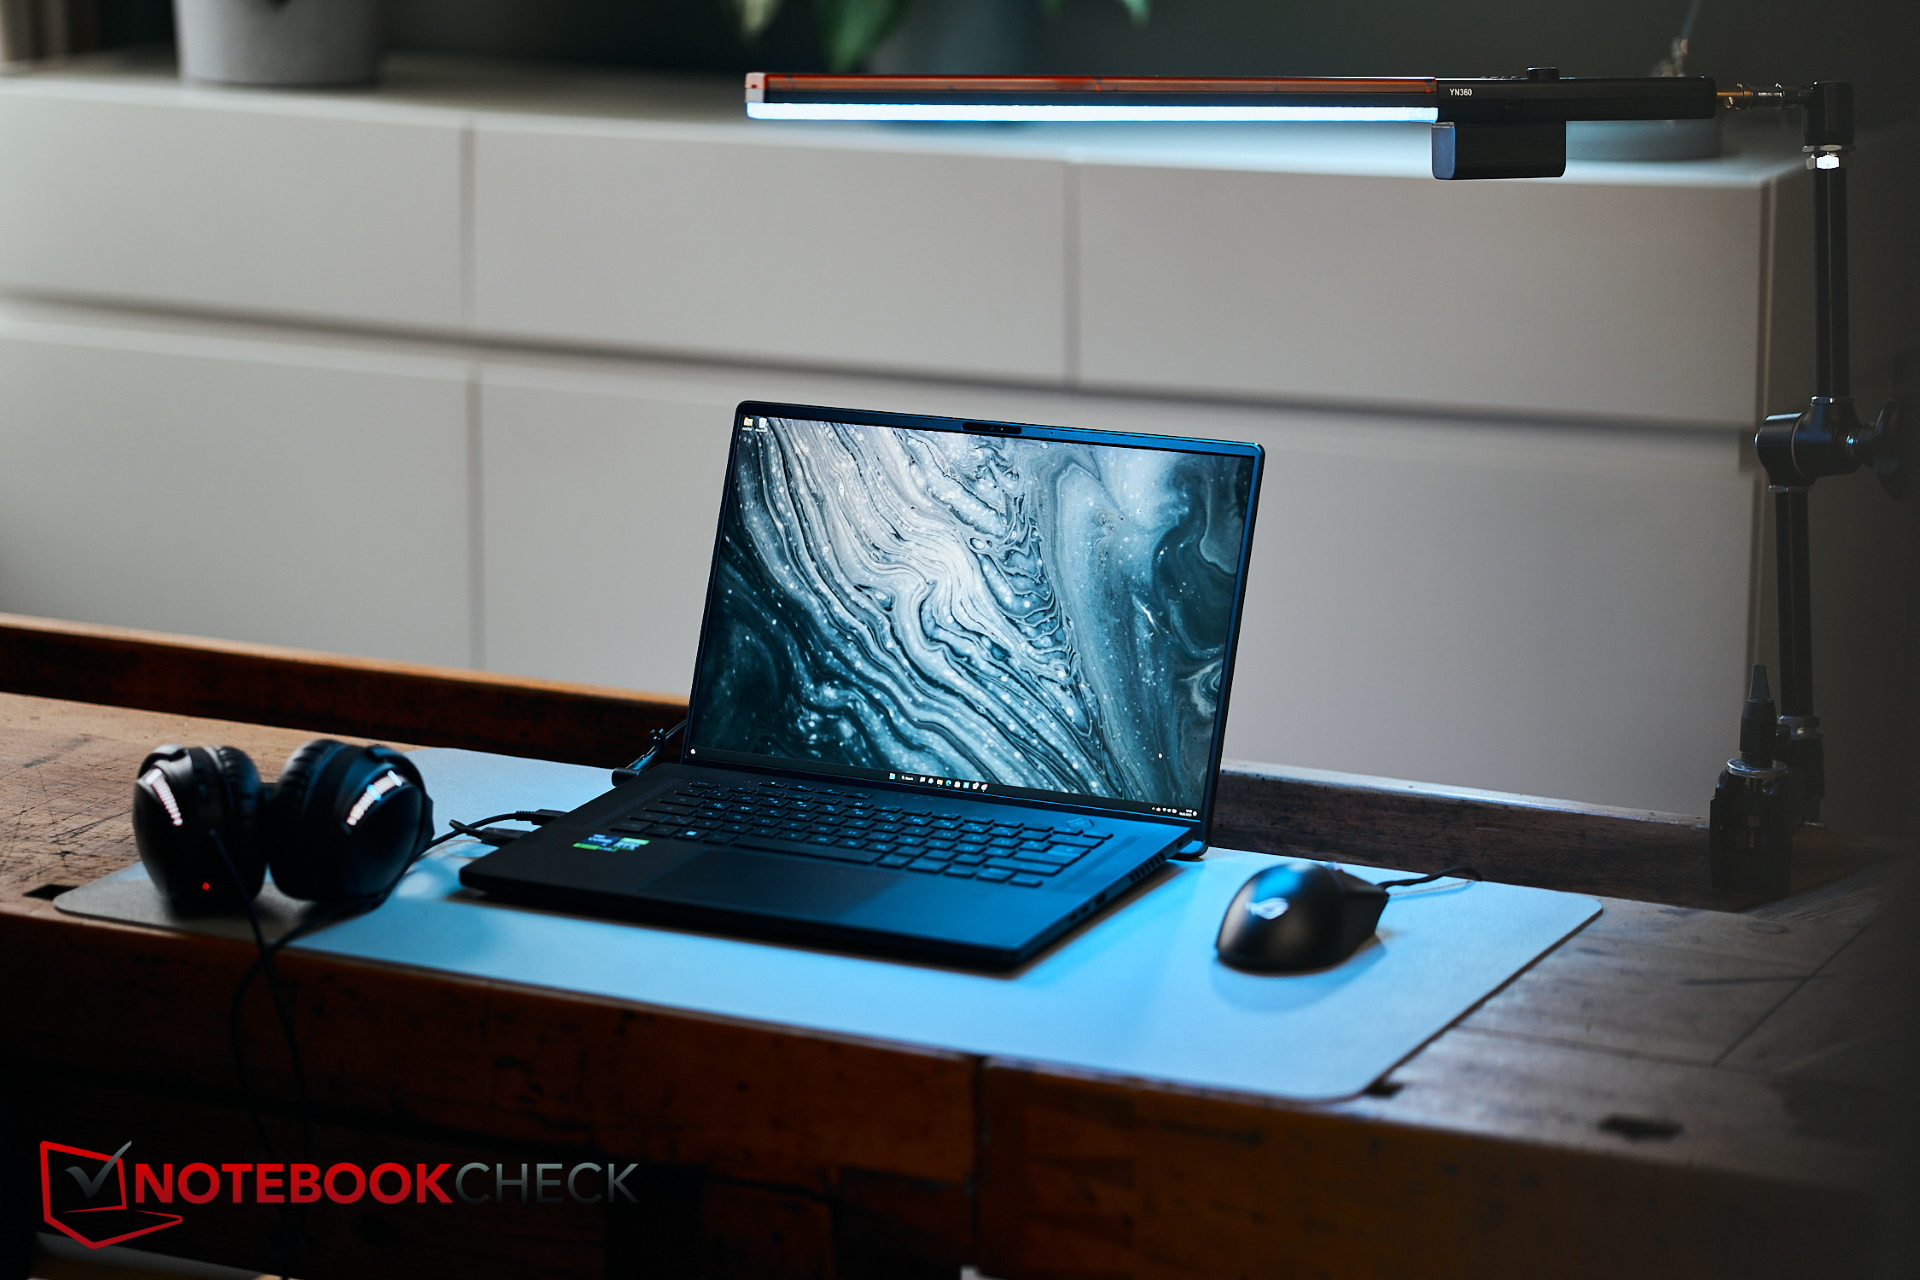
Nuestro modelo de prueba venía en un paquete enorme que nos recordaba más a una central eléctrica. En cambio, se incluían bastantes accesorios. Por ejemplo, una bolsa con compartimento para el portátil, un ratón (ROG Gladius III) y unos auriculares (ROG Fusion II 300), todo ello con la marca ROG.
Según Asus, estos accesorios vienen con nuestro modelo de configuración, pero el M16 también se puede comprar como dispositivo independiente.
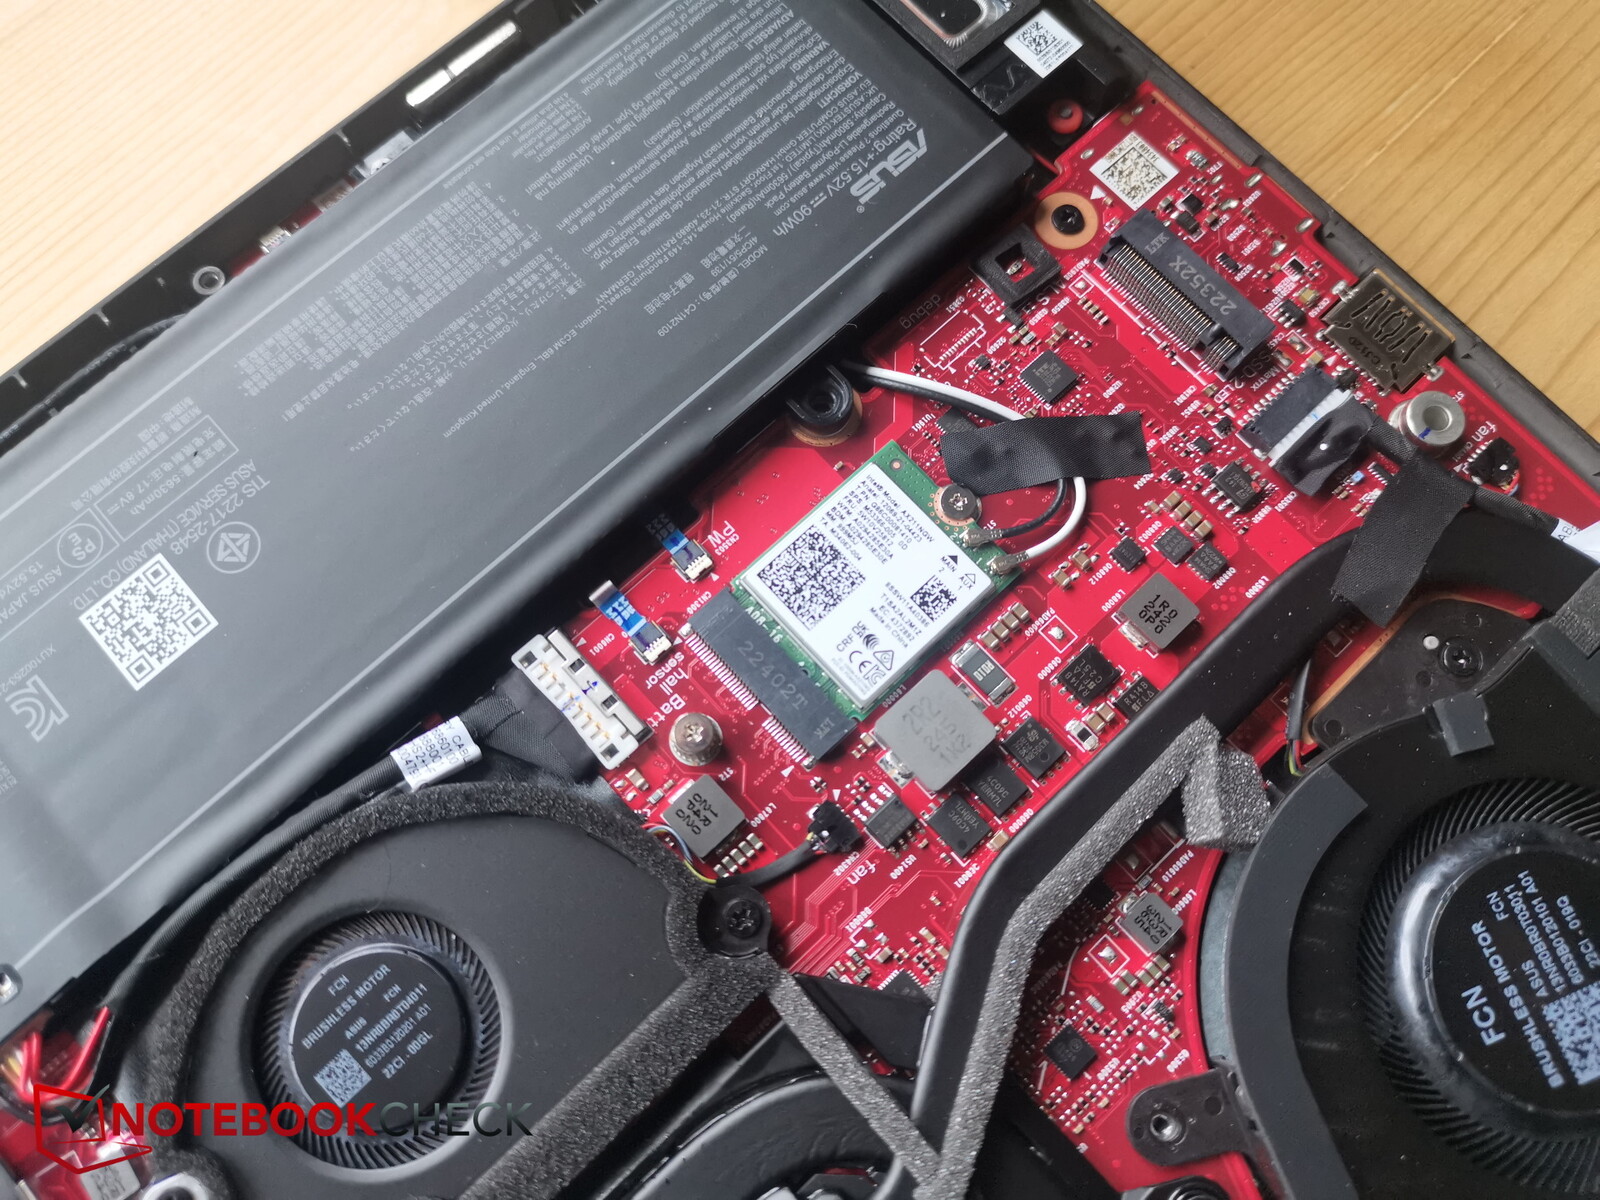
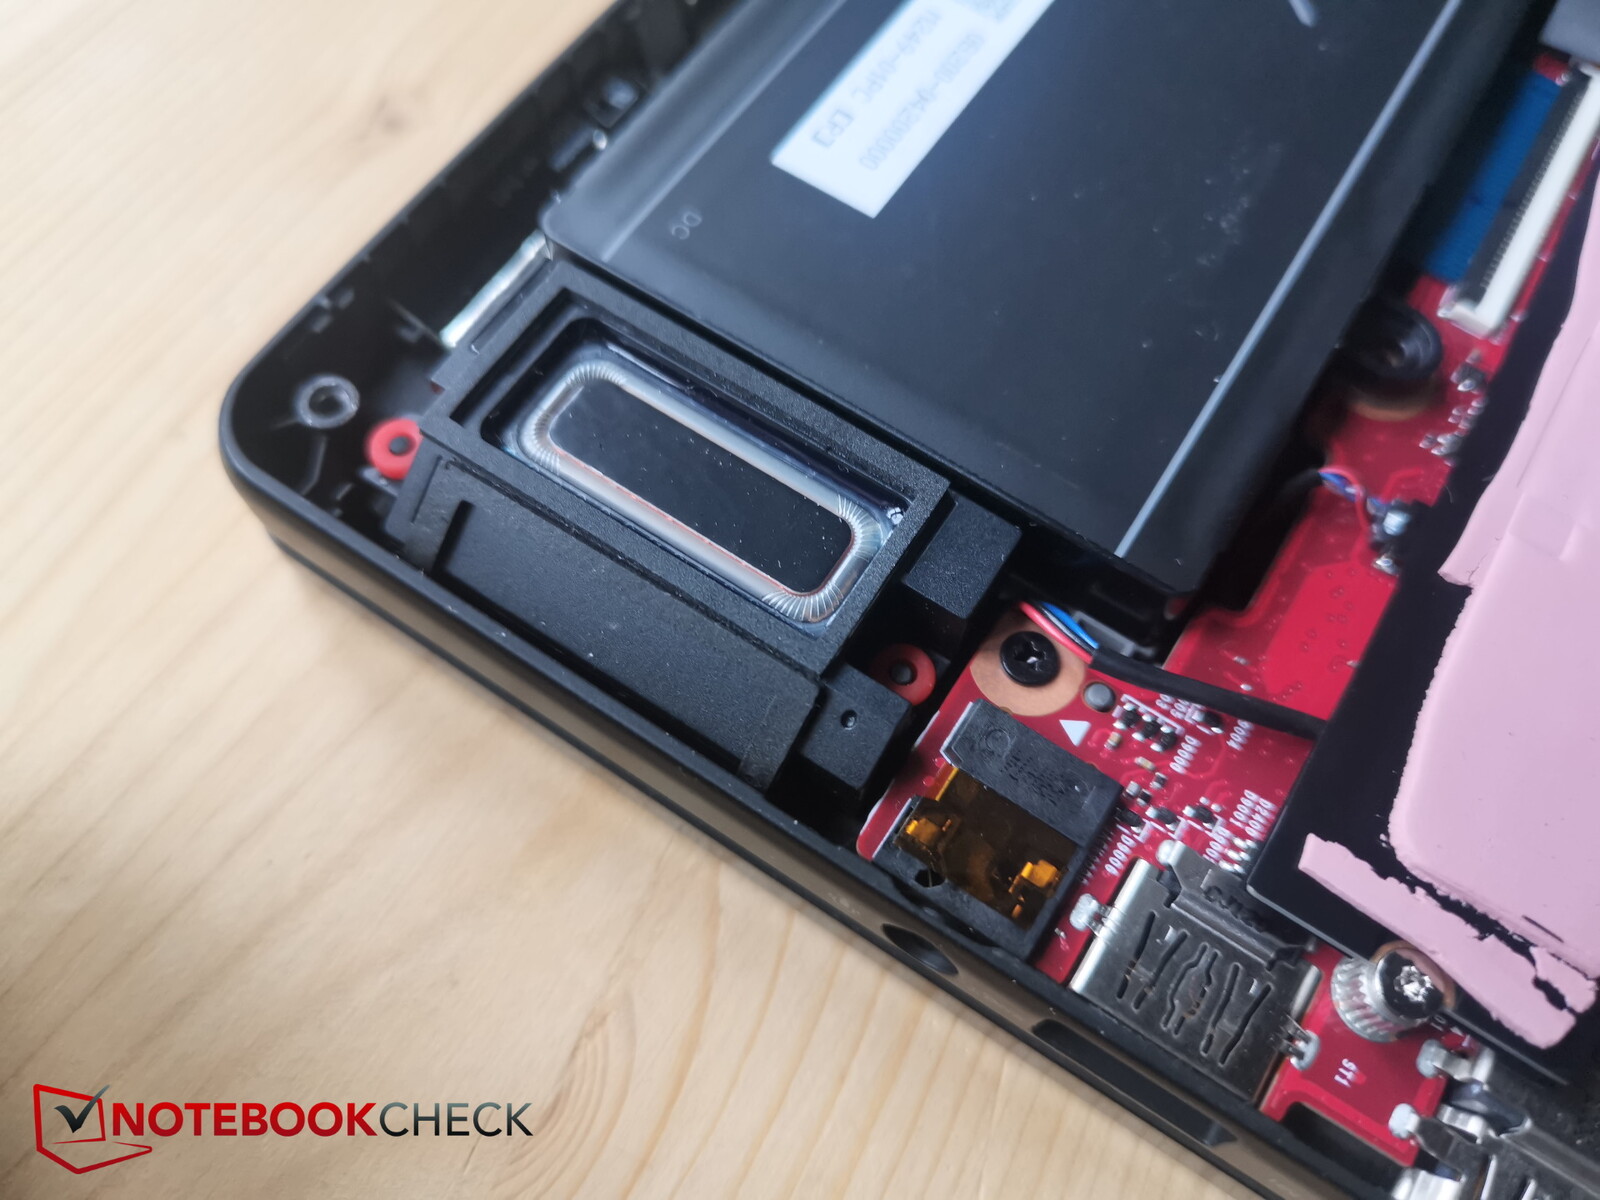
Mantenimiento
En la base de la unidad, 15 tornillos de estrella esperan a ser retirados. Lamentablemente, siete de ellos se encuentran debajo de unos tapones de goma pegados, cuya extracción resulta complicada, molesta y poco práctica.
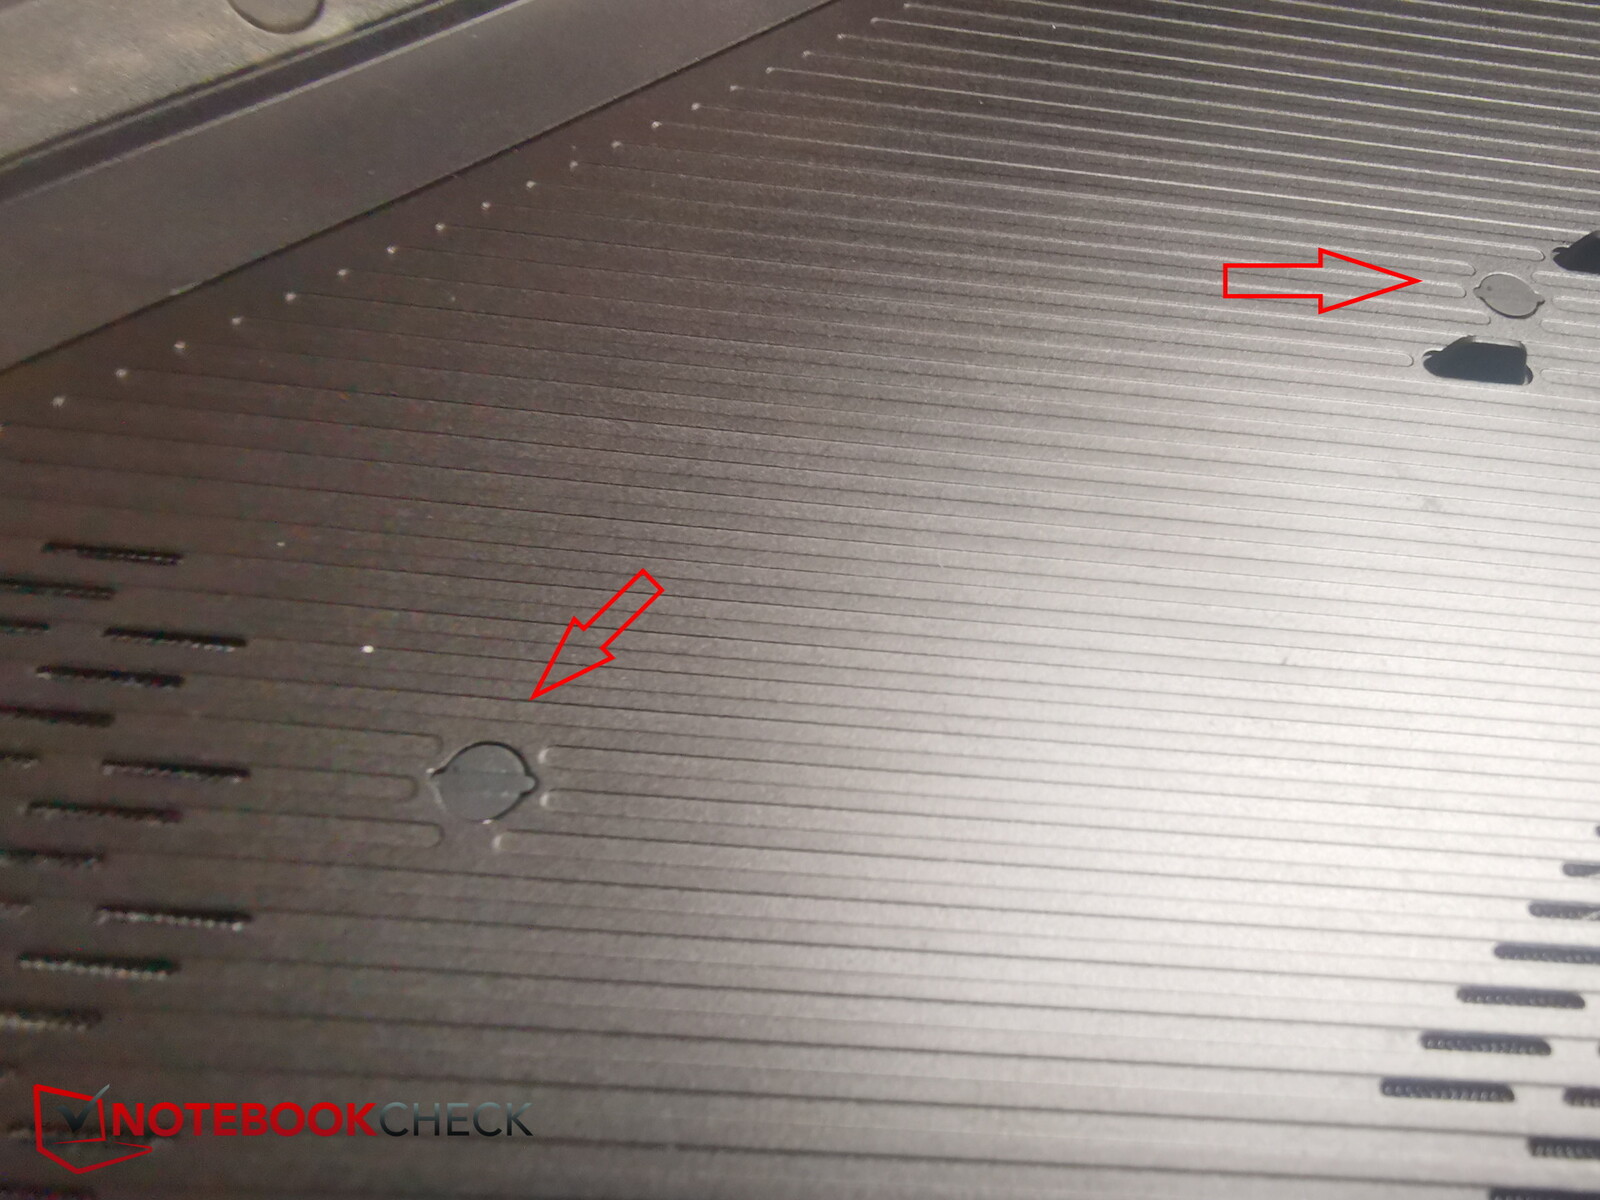
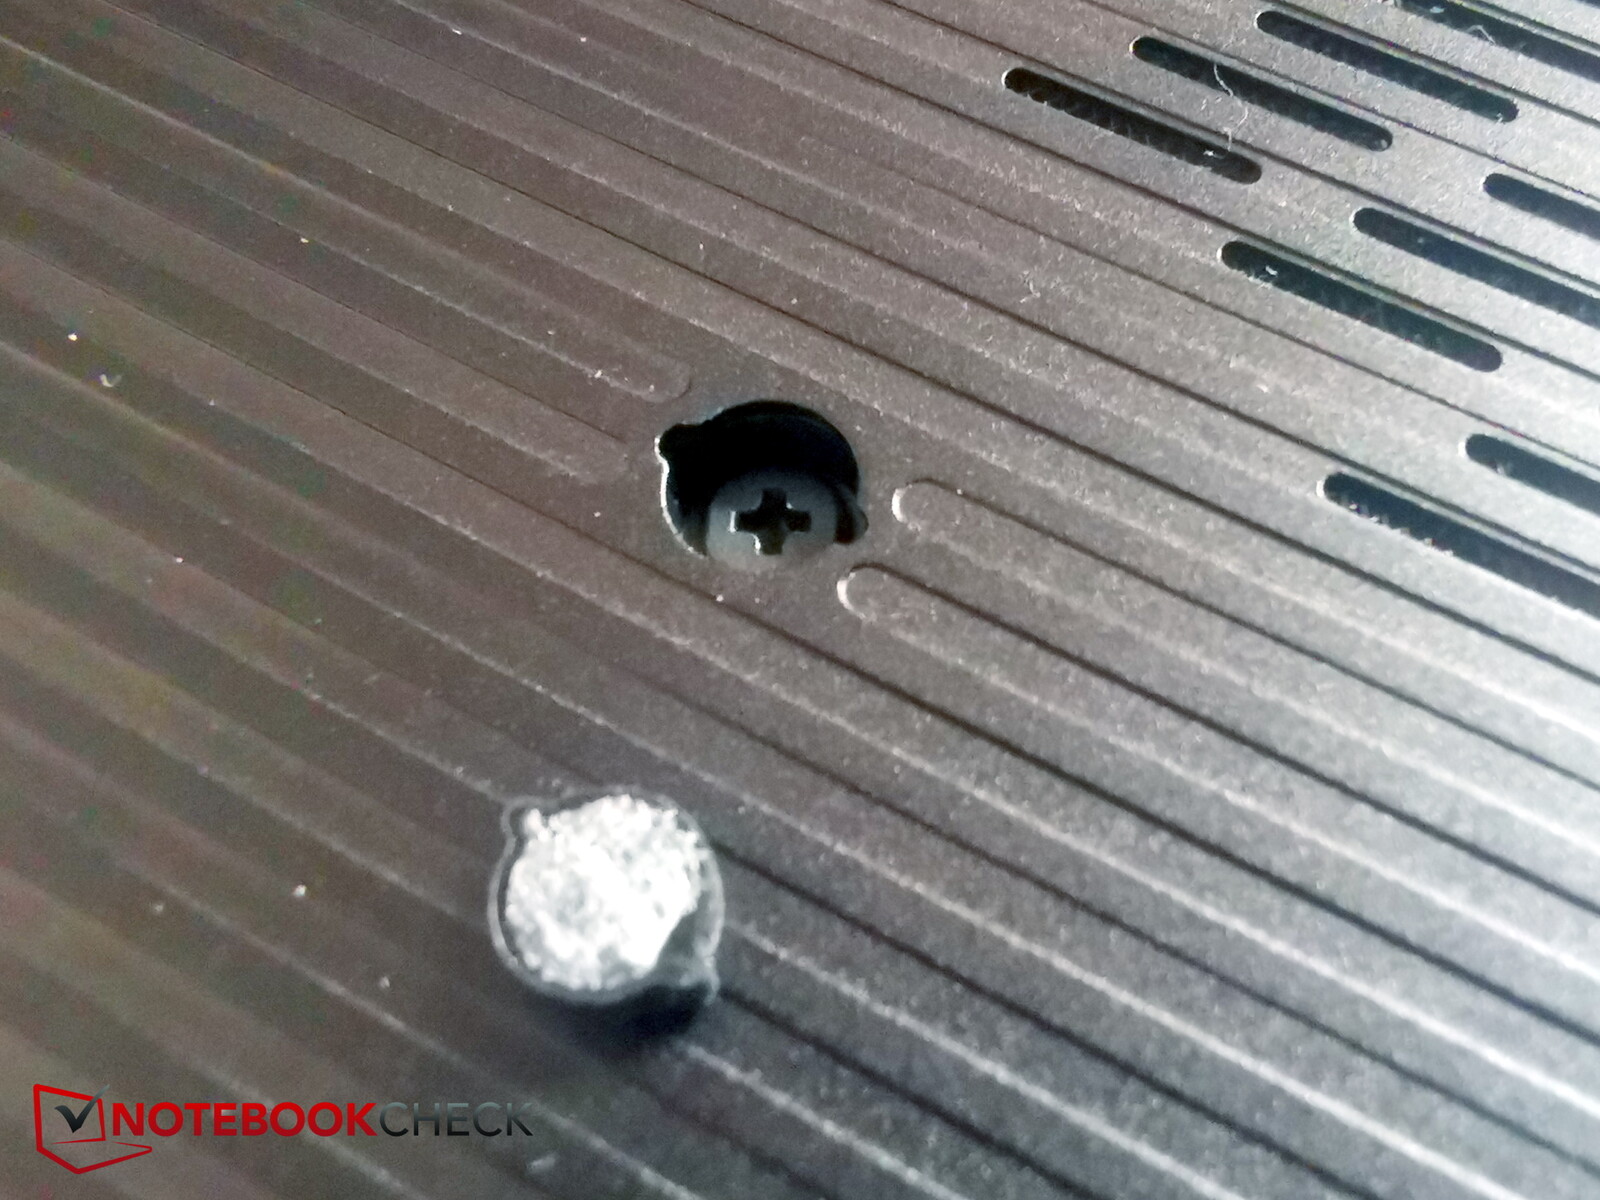
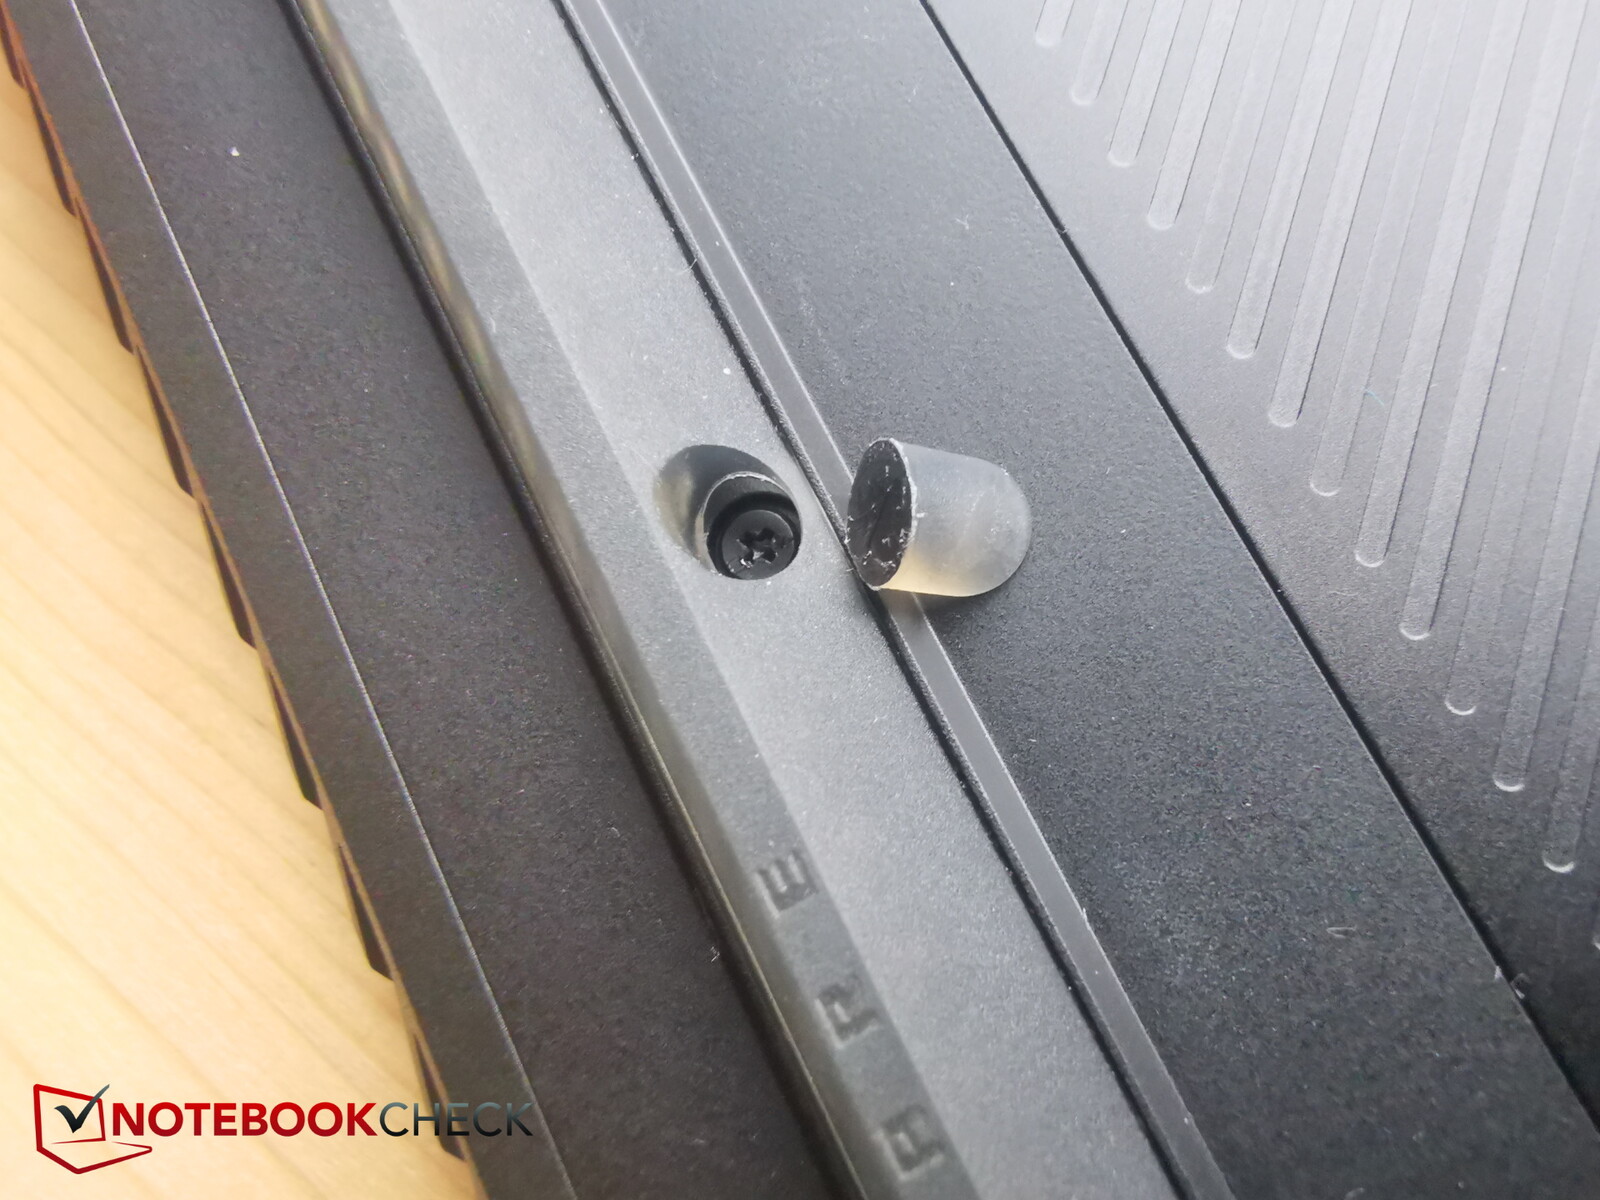
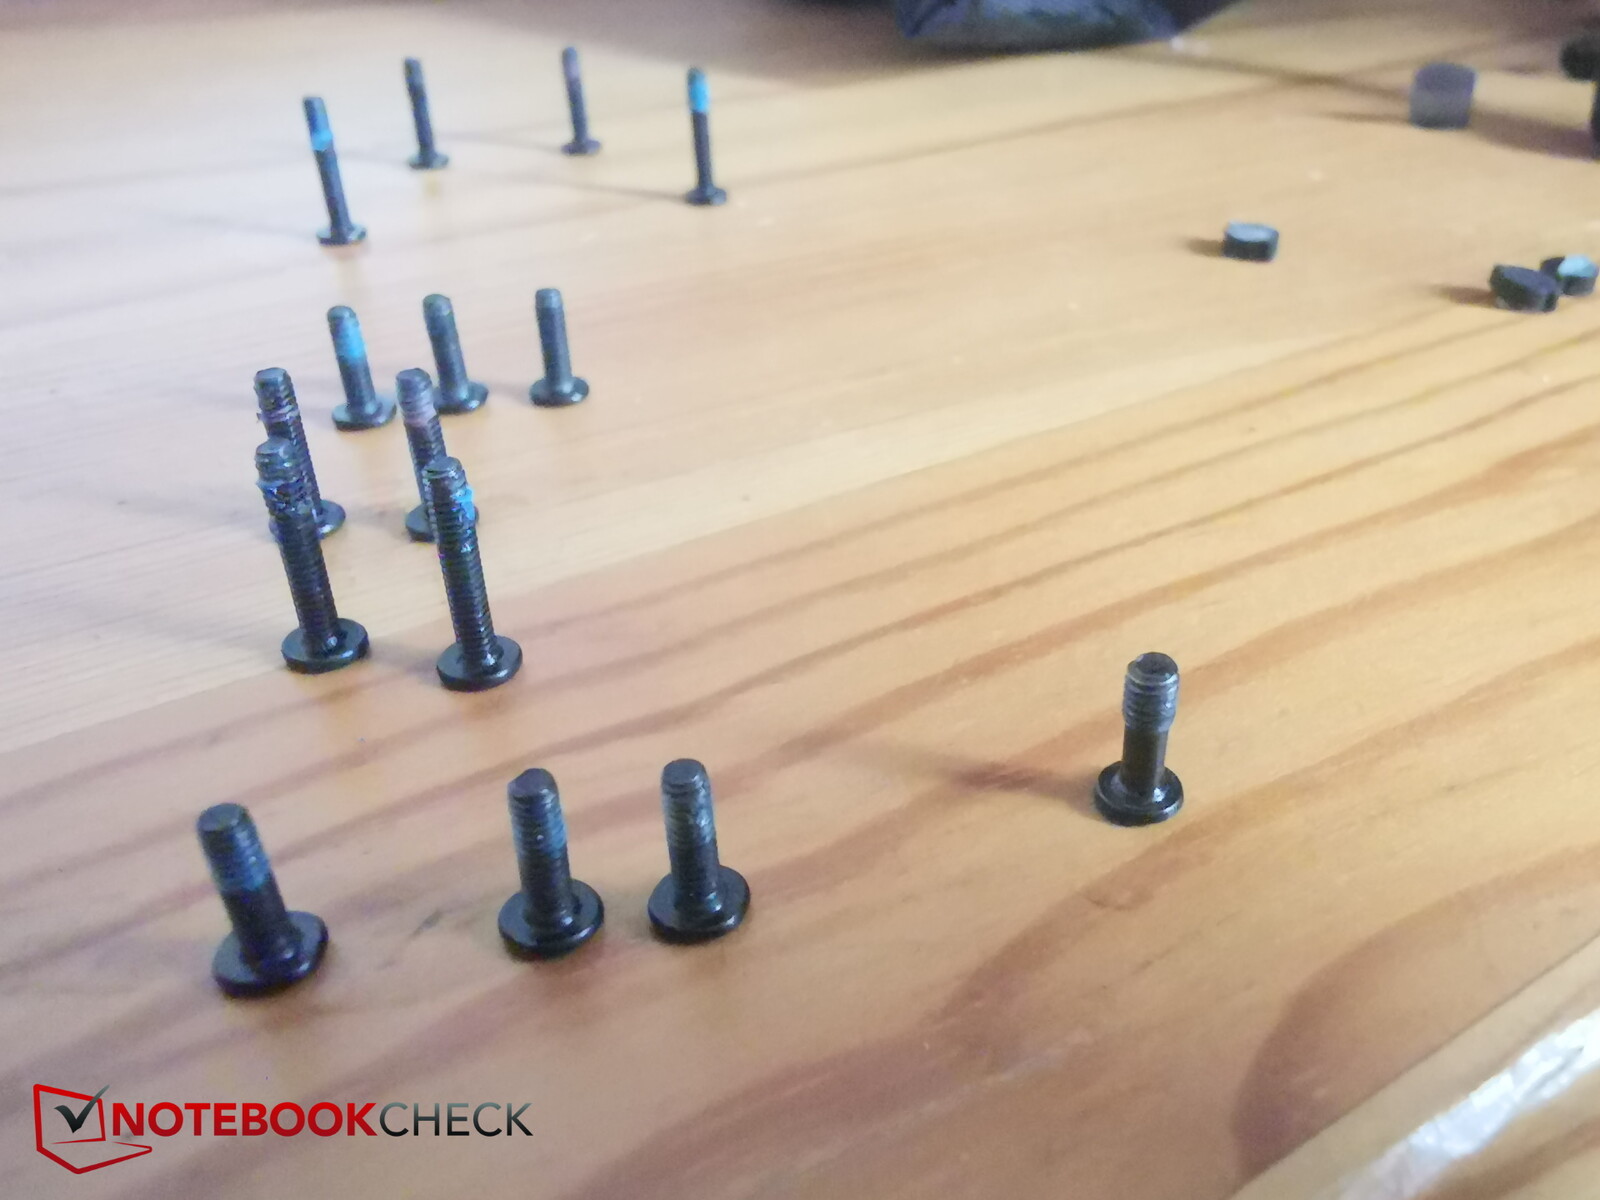
En total, hemos descubierto 4 longitudes y tipos de tornillos diferentes Por lo tanto, vale la pena notar cuales pertenecen a donde. Junto con los 7 tornillos ocultos y la RAM SO-DIMM, el M16 puede ser considerado difícil de actualizar o reparar.
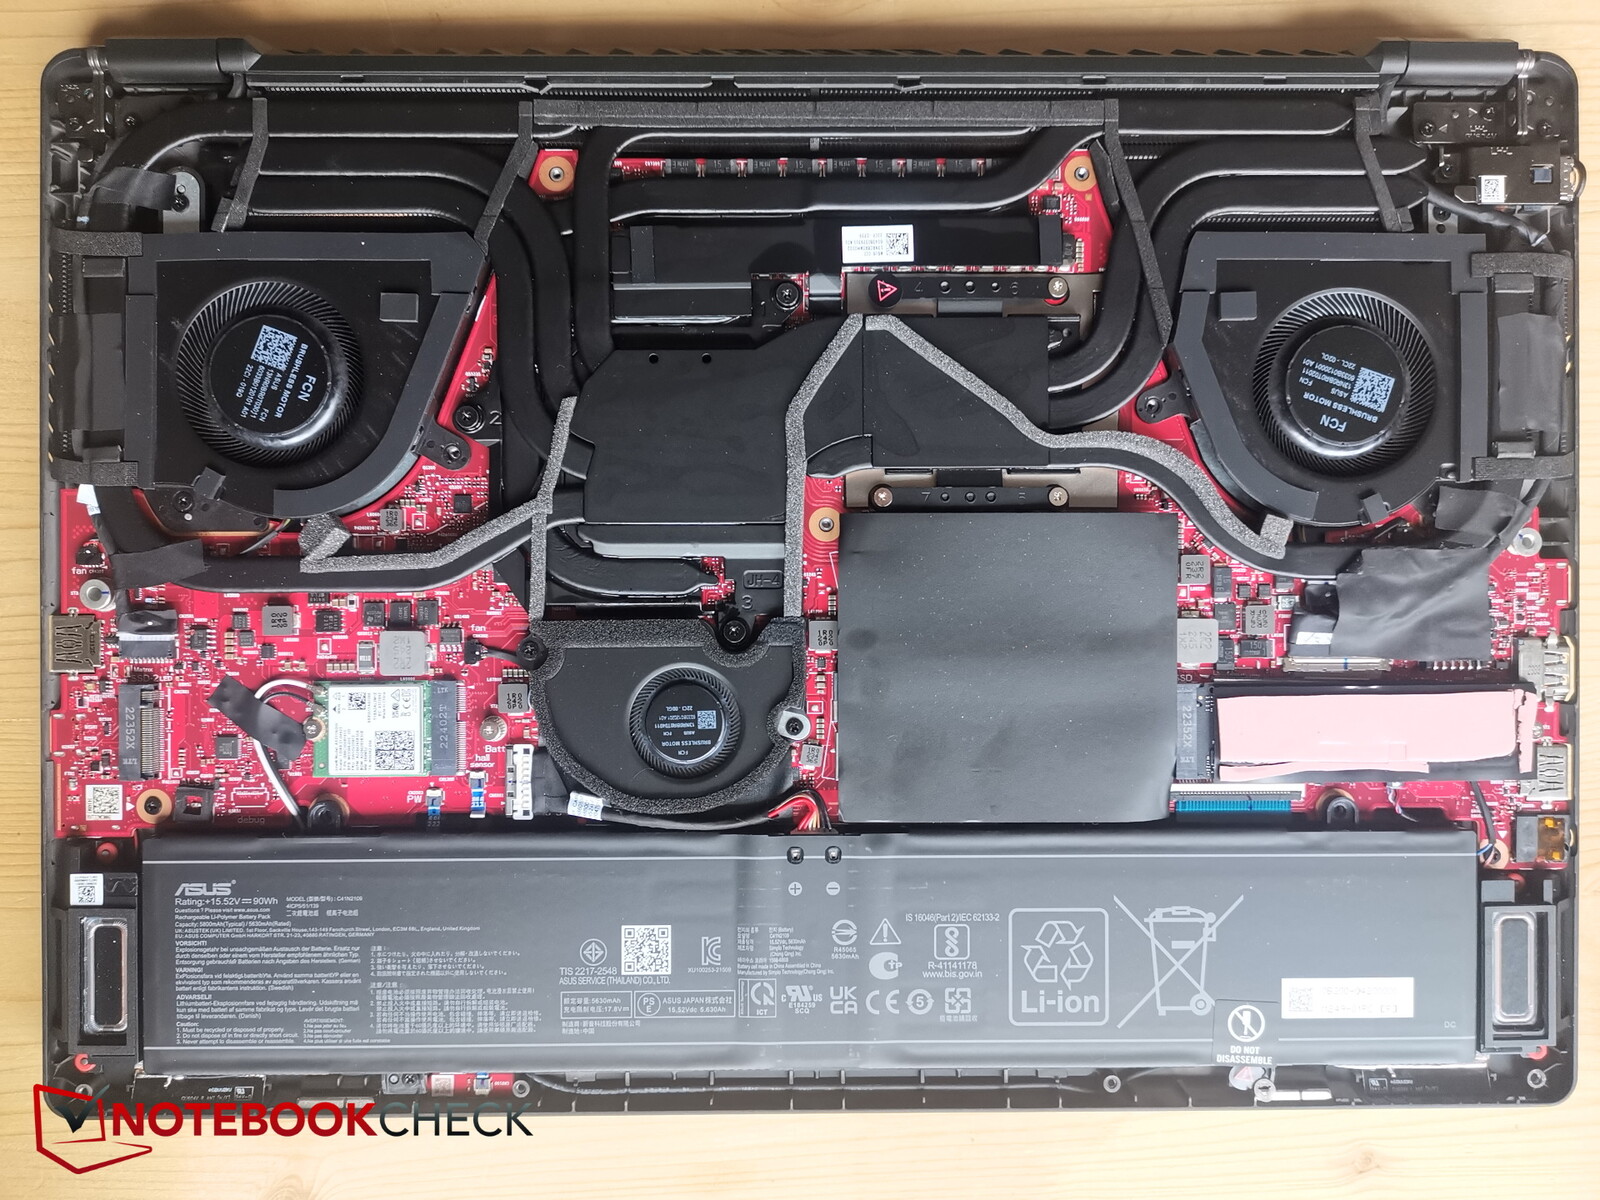
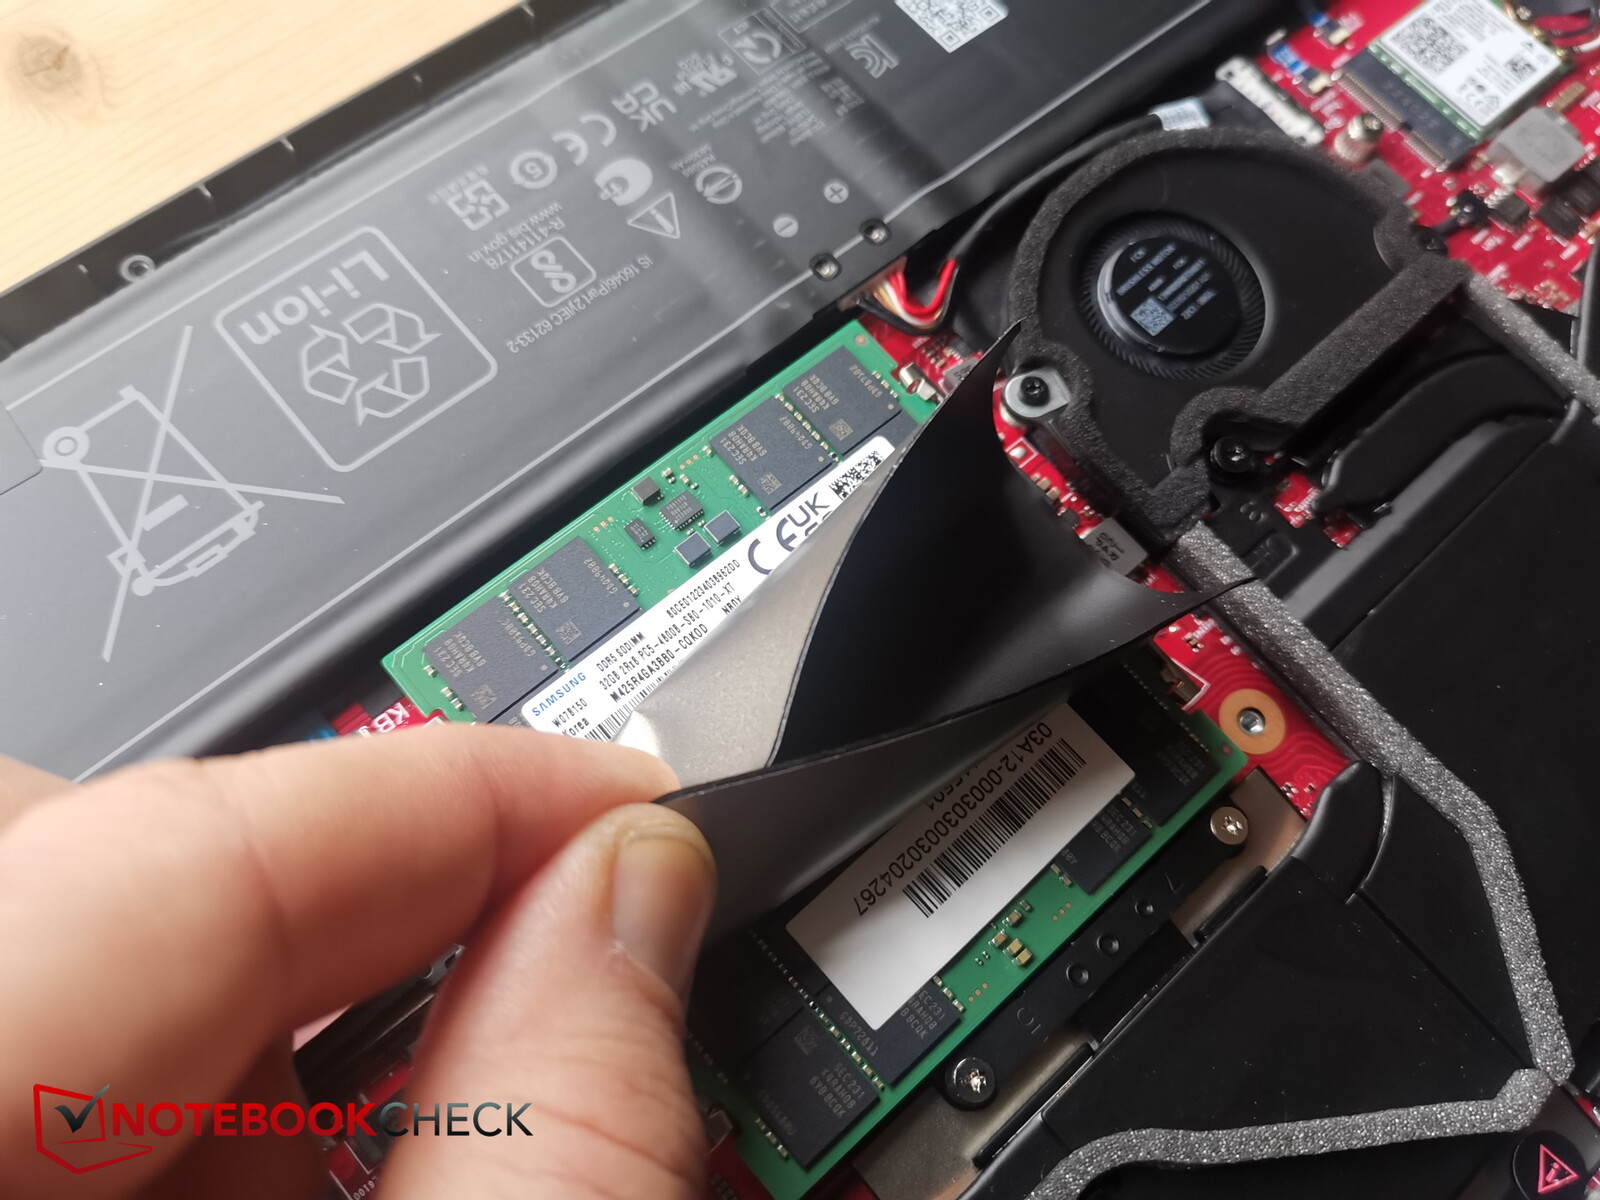
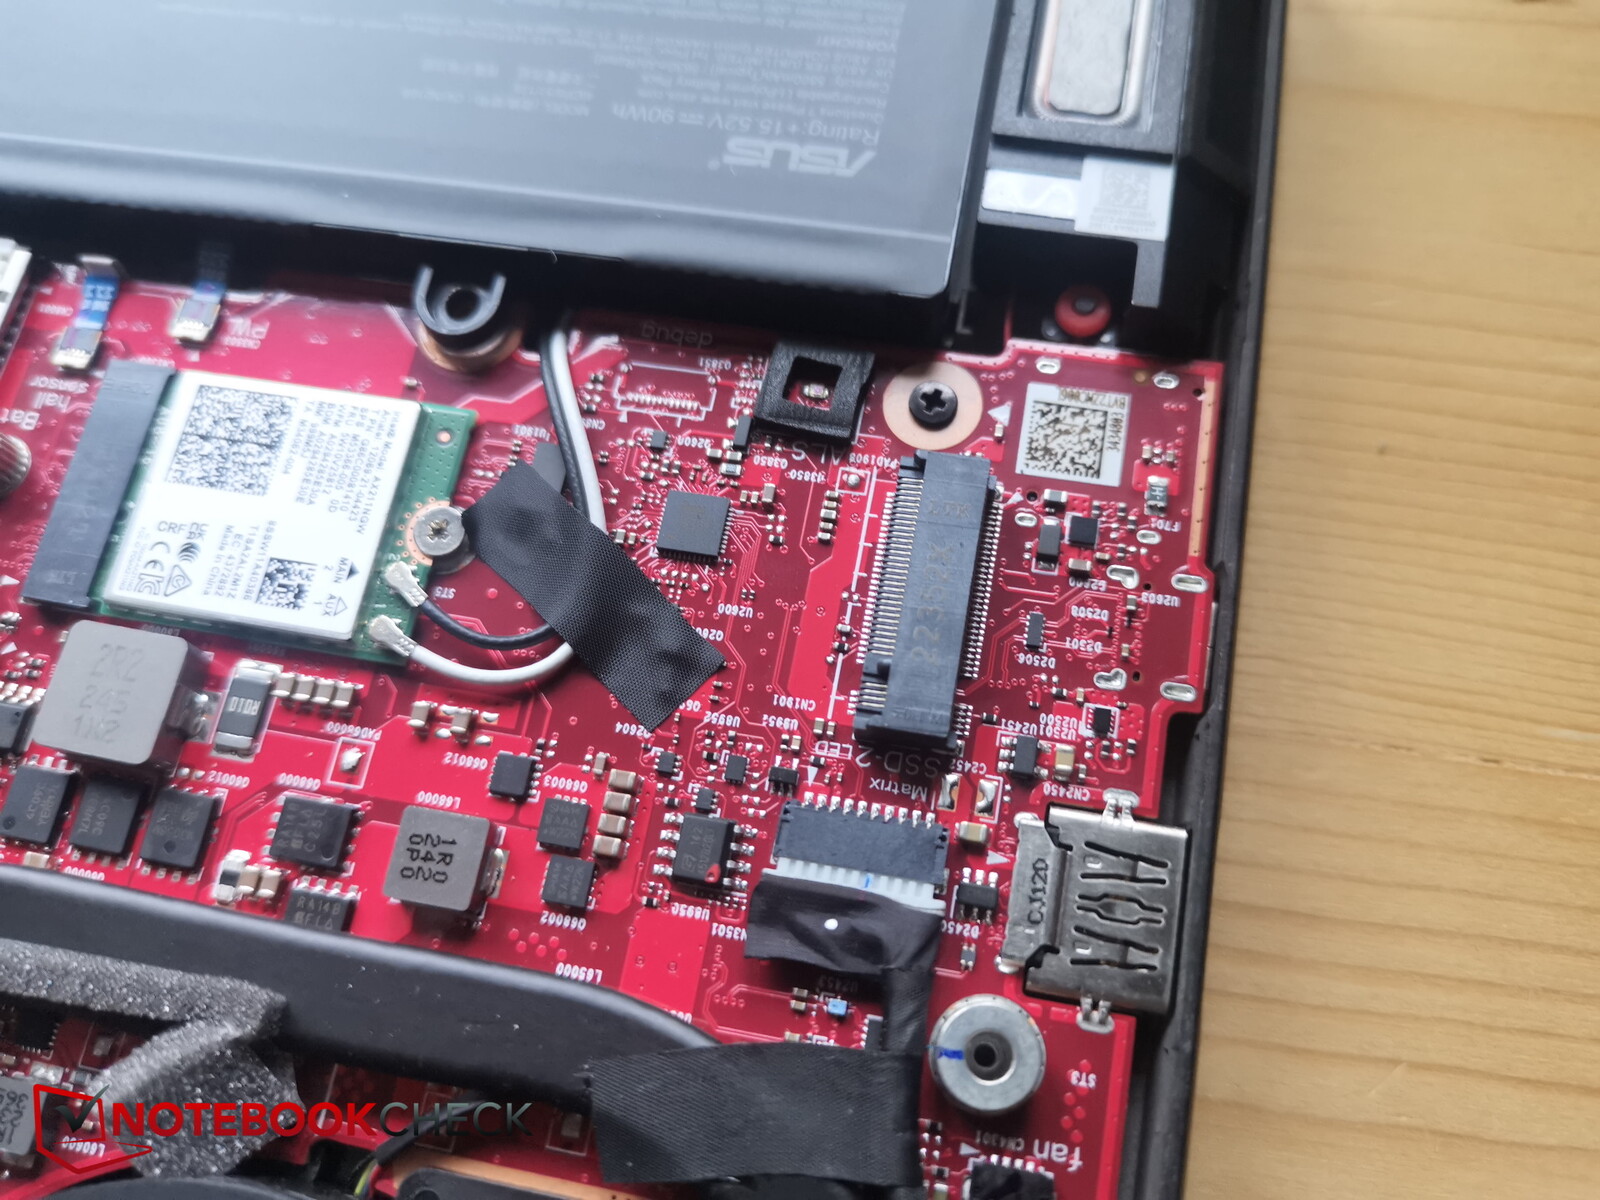
Al menos la placa base se puede abrir fácilmente. Internamente, es posible acceder a los tres ventiladores, la batería, el SSD, la segunda ranura M.2 SSD, el módulo WiFi reemplazable, así como la ranura SO-DIMM RAM.
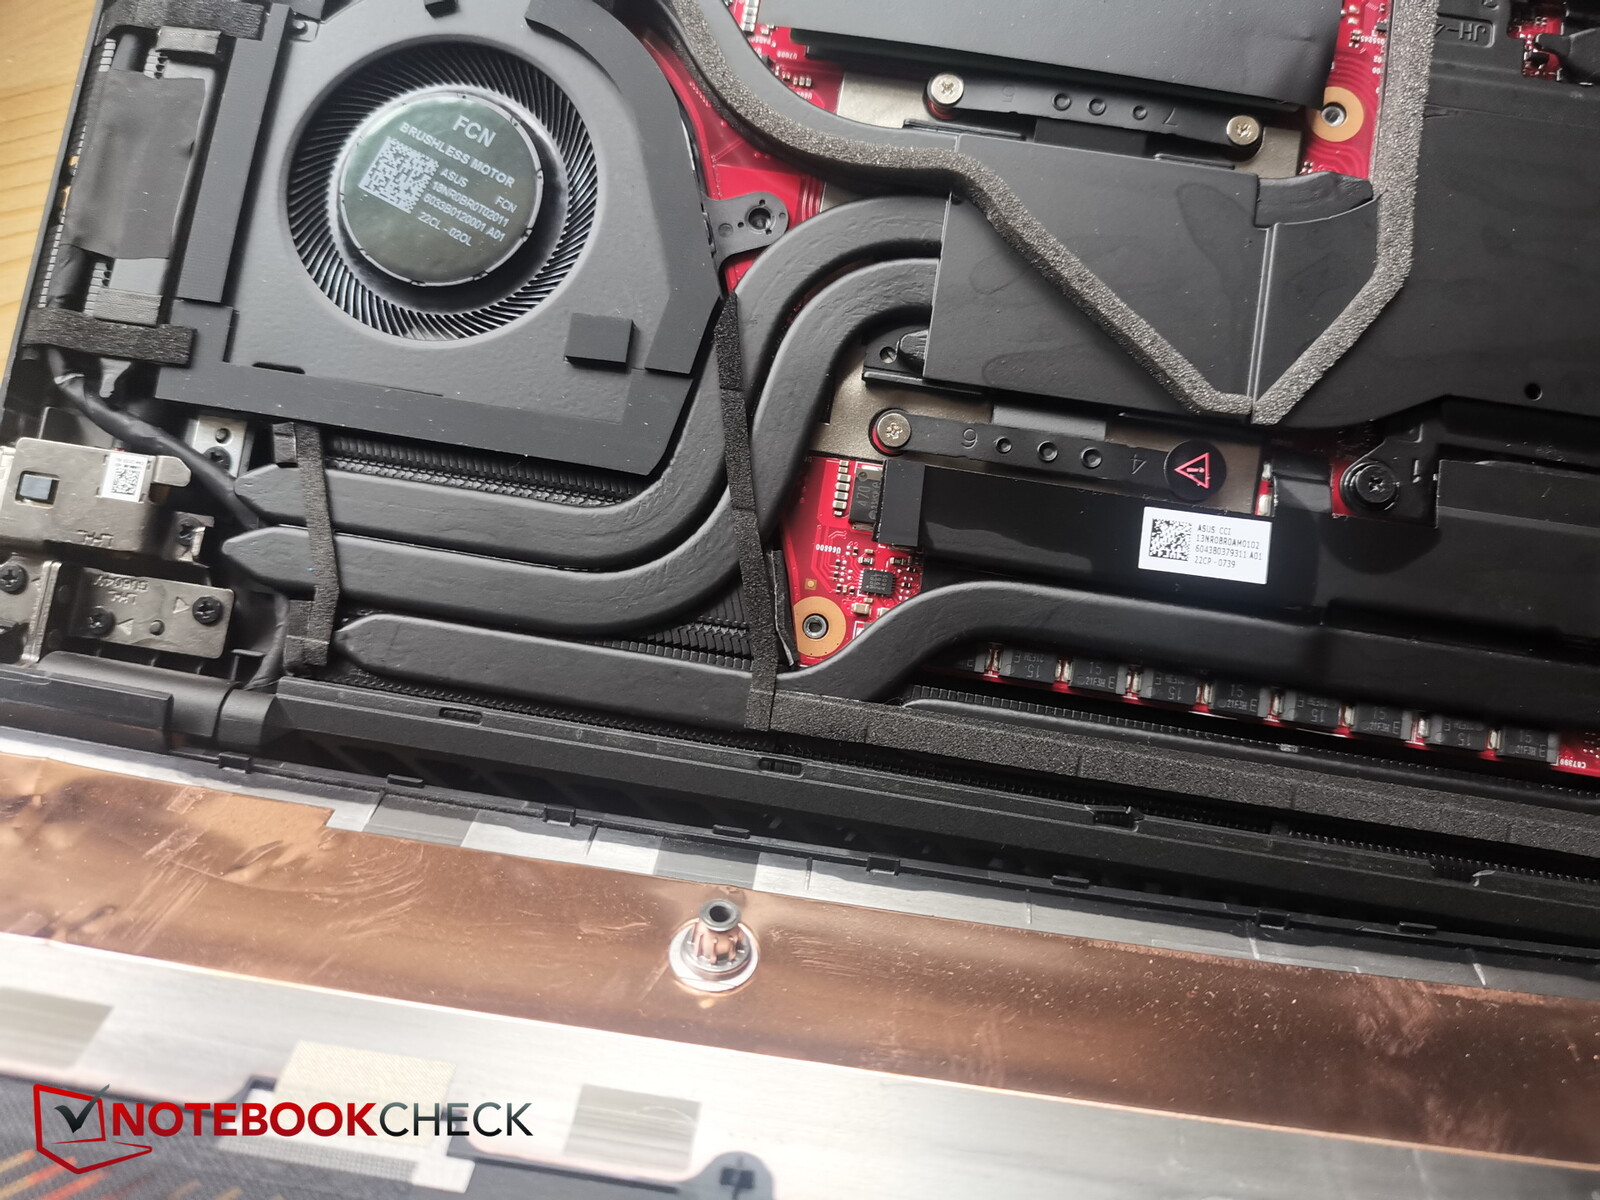
El sistema de refrigeración consta de 2 ventiladores de tamaño normal y un pequeño ventilador adicional que presumiblemente se sitúa encima de la unidad gráfica. El SSD posee una almohadilla de refrigeración que parece bastante deshilachada en nuestro modelo de análisis.
Garantía
Los portátiles Gigabyte tienen una garantía de 24 meses.
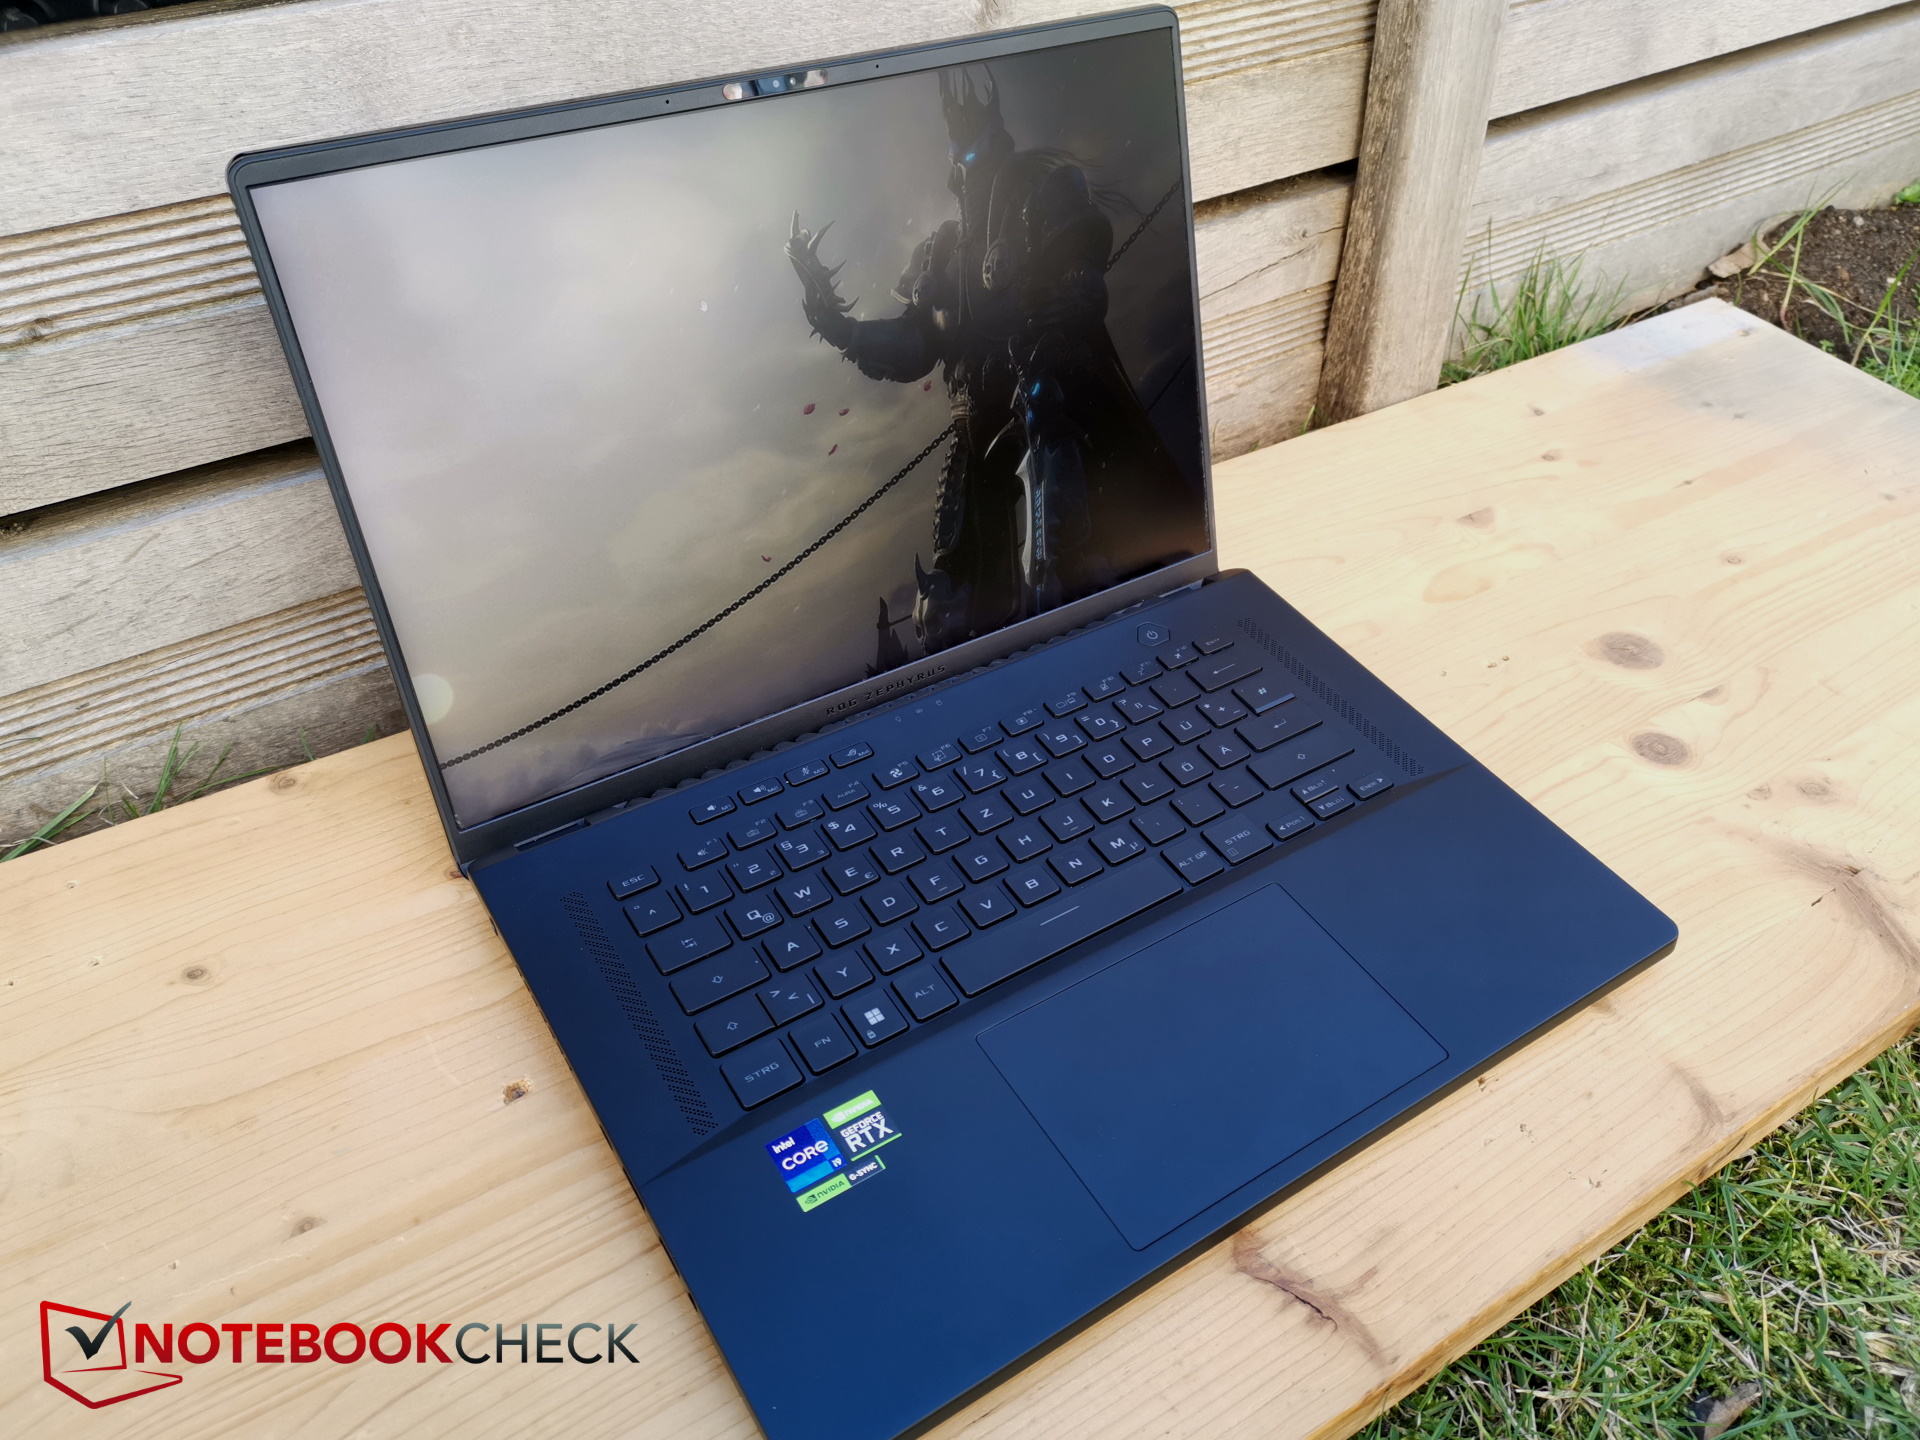
Dispositivos de entrada - Teclas poco profundas y un gran touchpad
Teclado
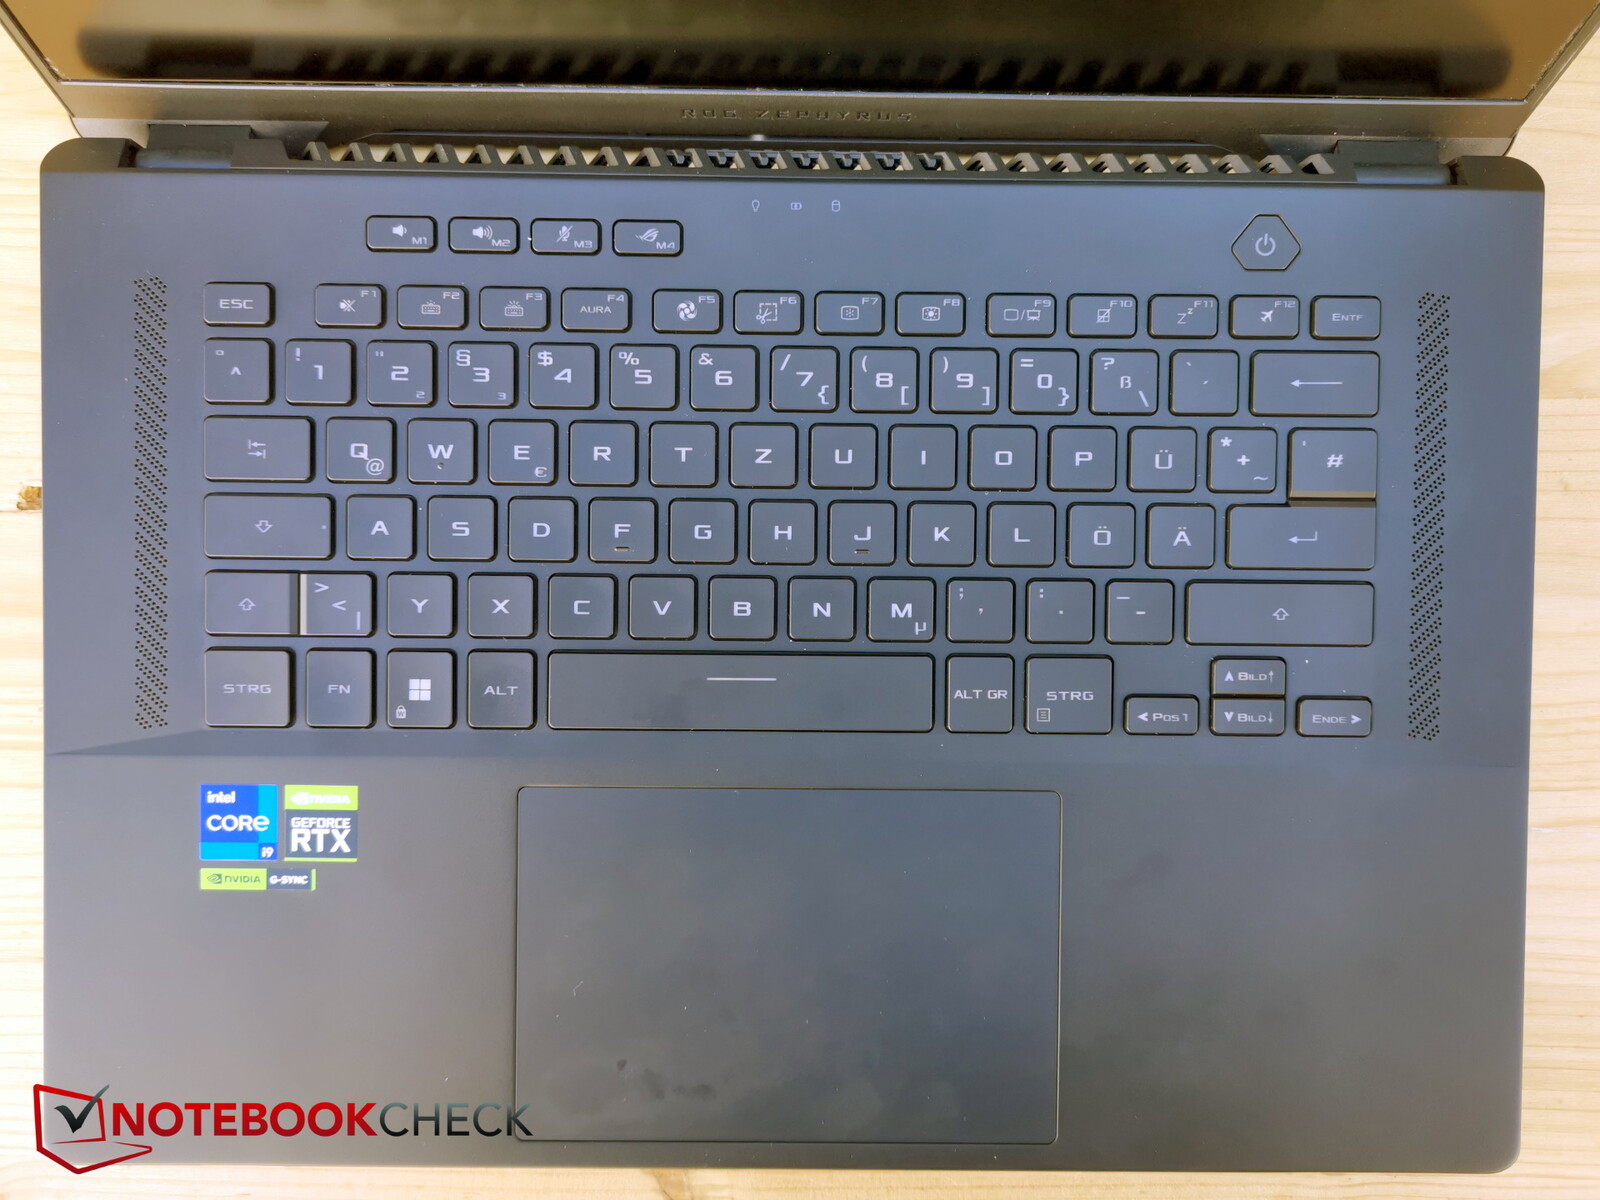
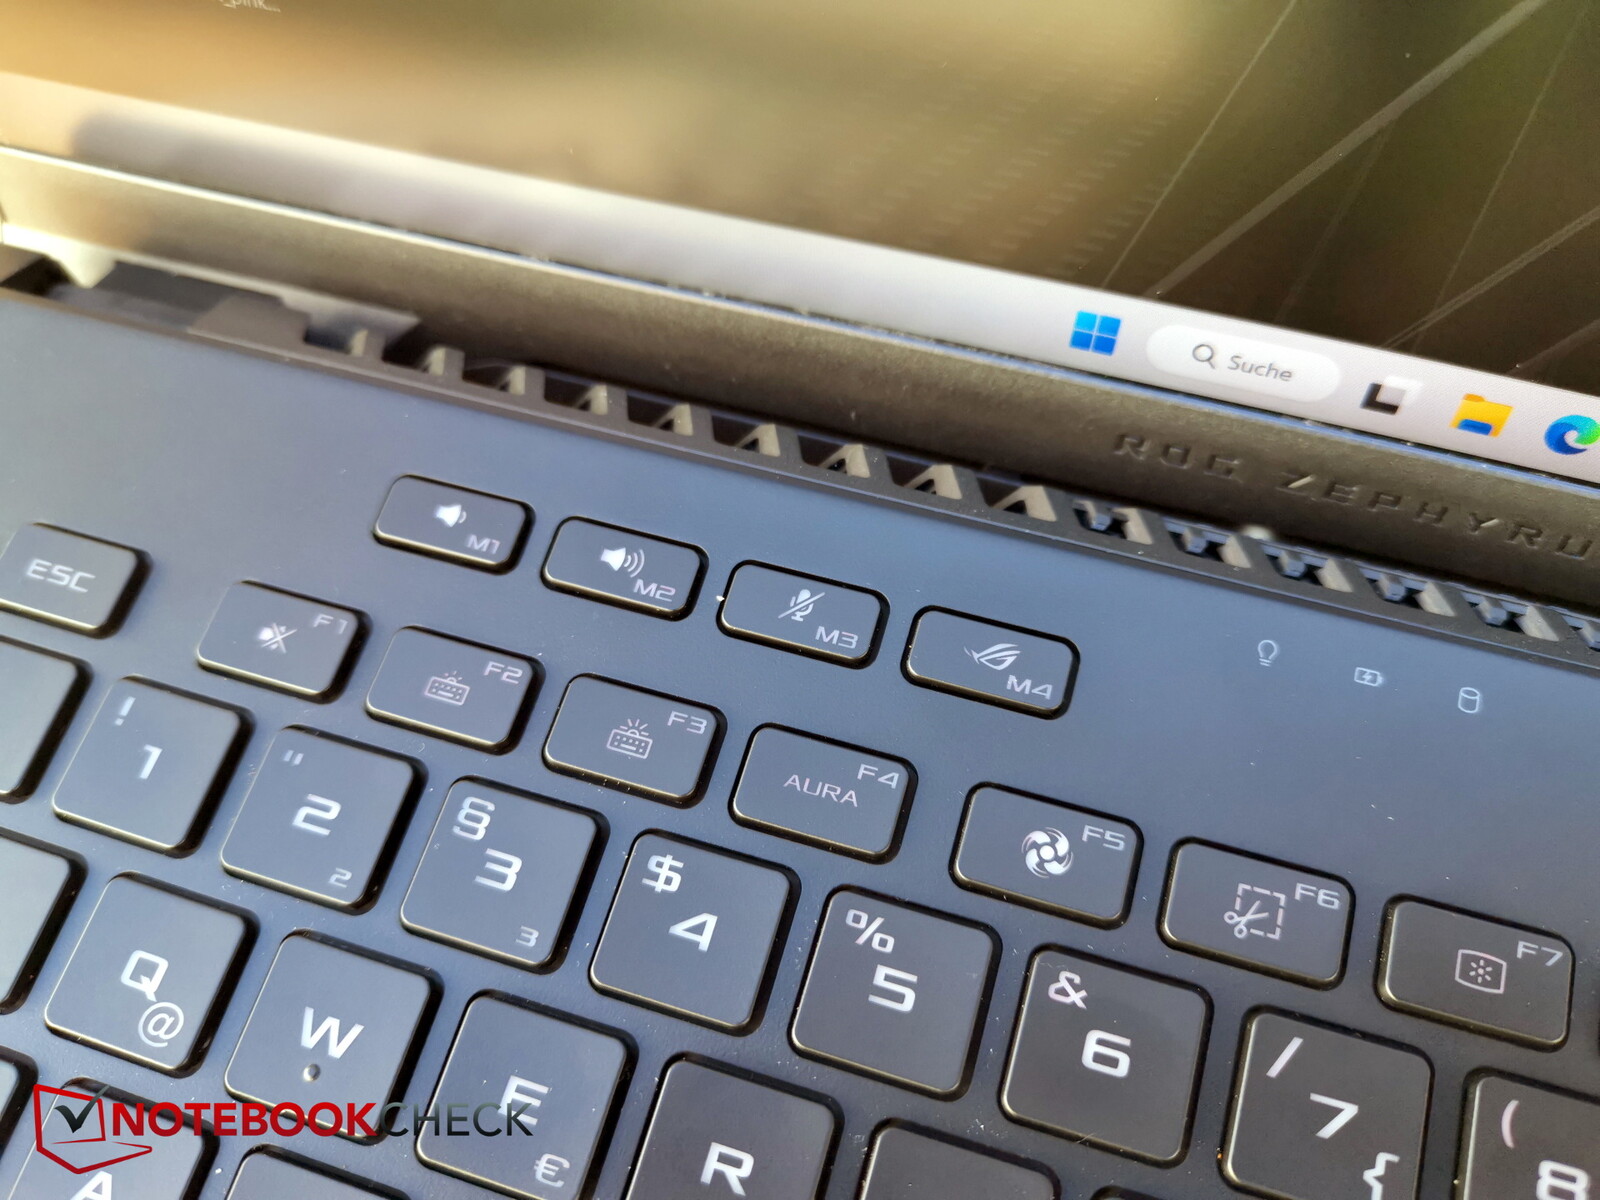
La distribución parece muy espaciosa. En la parte superior izquierda, Asus ha incluido cuatro teclas especiales adicionales para el control de volumen, el micrófono y el centro de control de Asus. Estas también pueden configurarse manualmente.
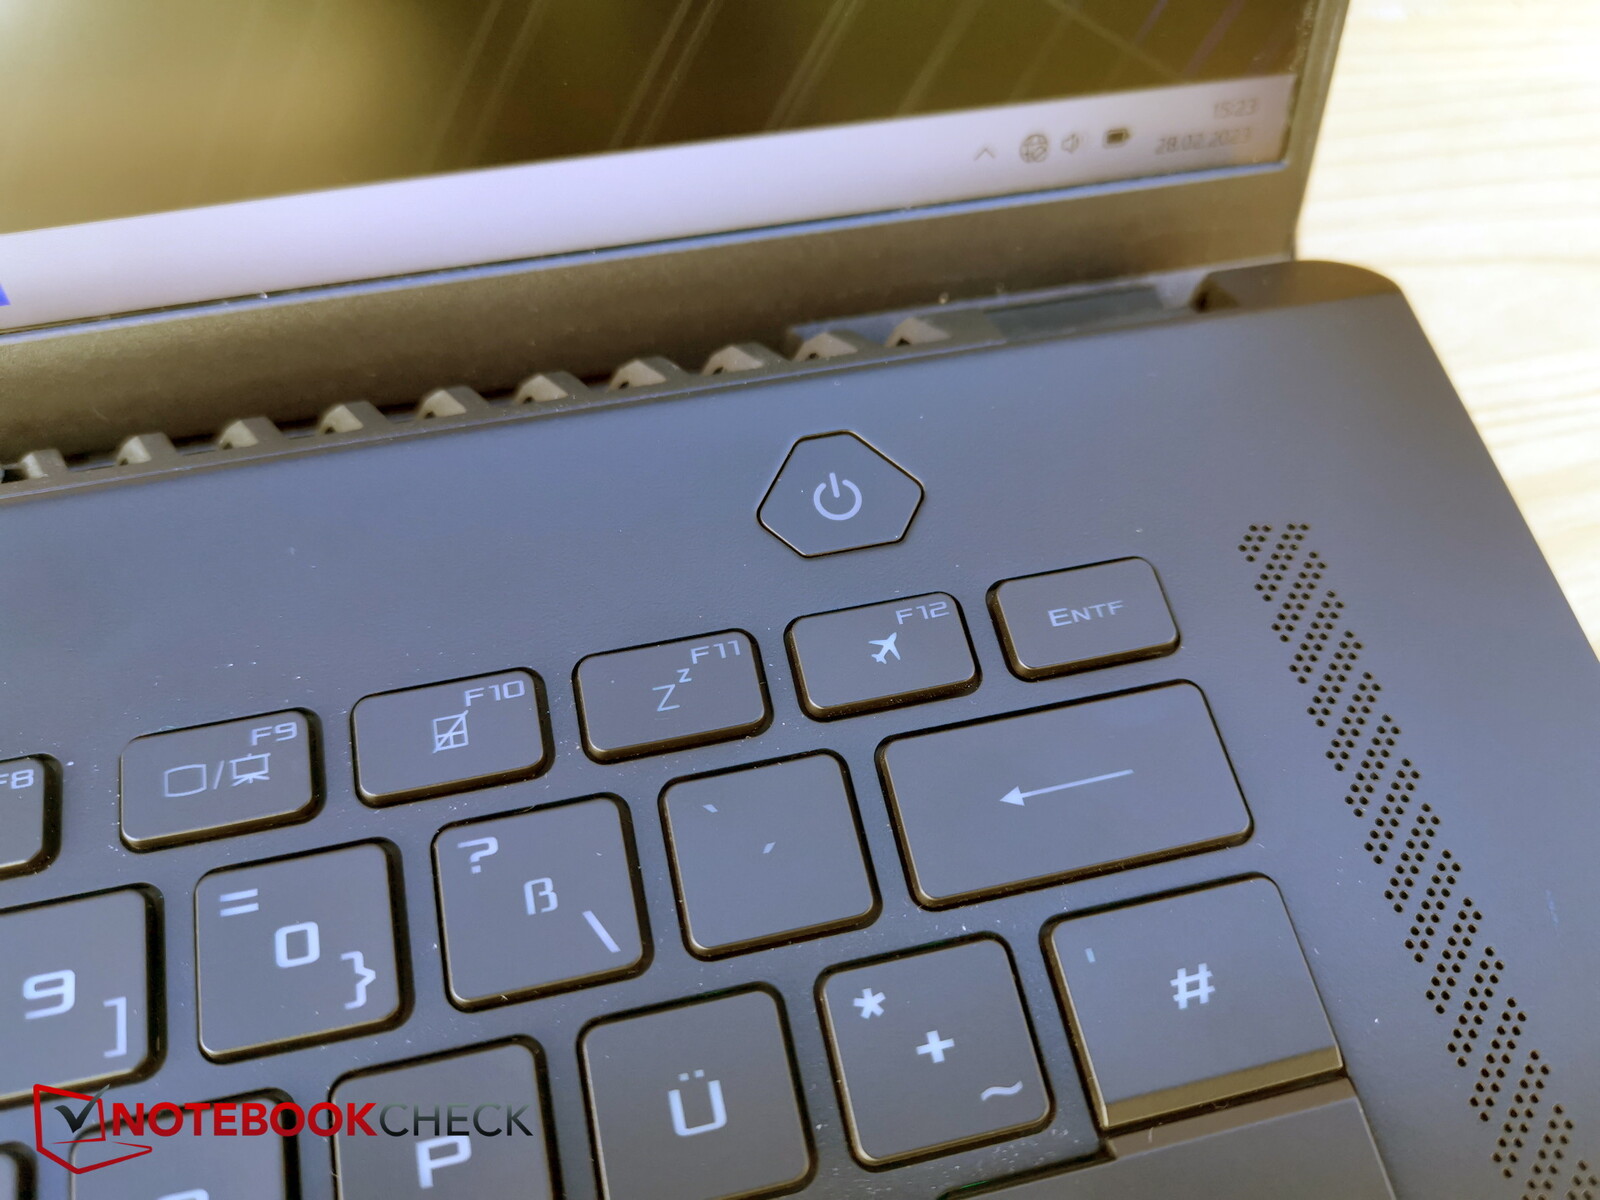
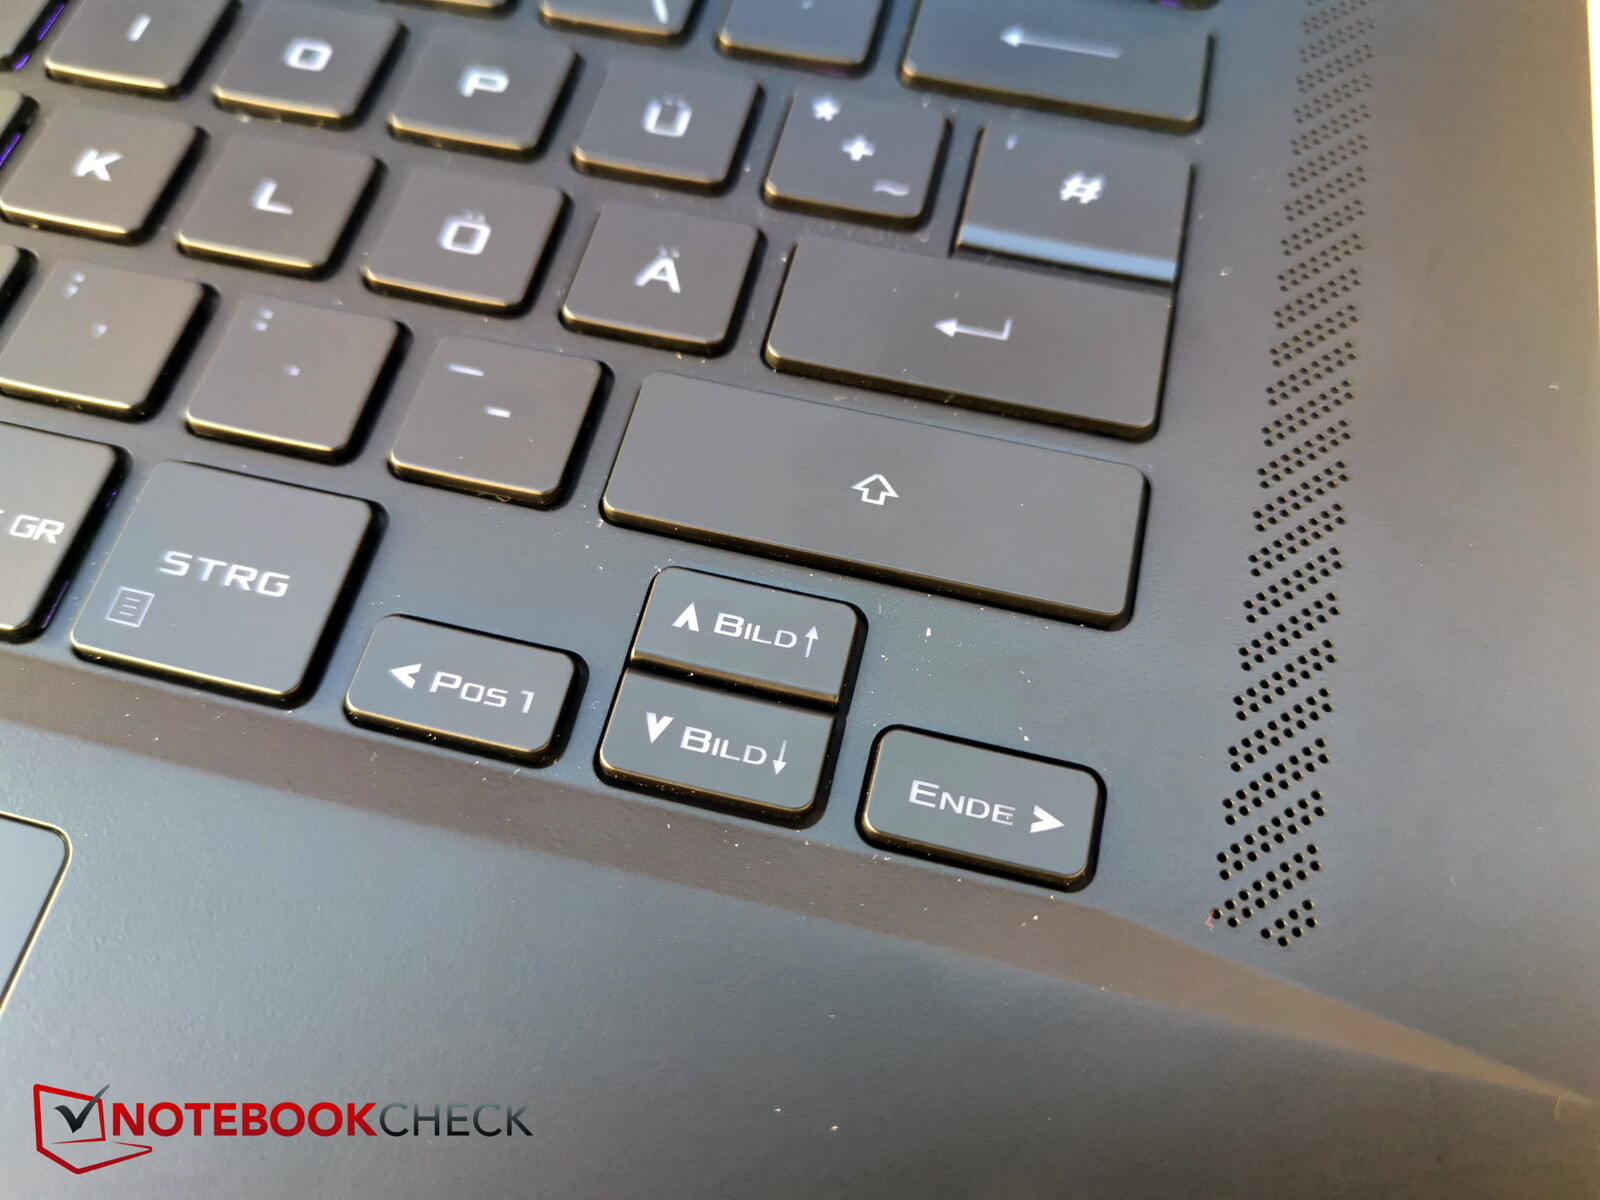
Por desgracia, las teclas de dirección son muy estrechas, y el botón de encendido, típico de este tipo de teclado, es una tecla separada. A pesar de ser un dispositivo de 16 pulgadas, no hay teclado numérico.
Las teclas tienen un recorrido muy corto y la respuesta es un poco superficial, pero suficientemente precisa. En general, aunque la experiencia de tecleo es bastante buena, habríamos preferido unas teclas algo más nítidas. El ruido de tecleo es moderado.
La retroiluminación de 3 niveles se ilumina en varios colores RGB pero sólo en una zona.
Panel táctil
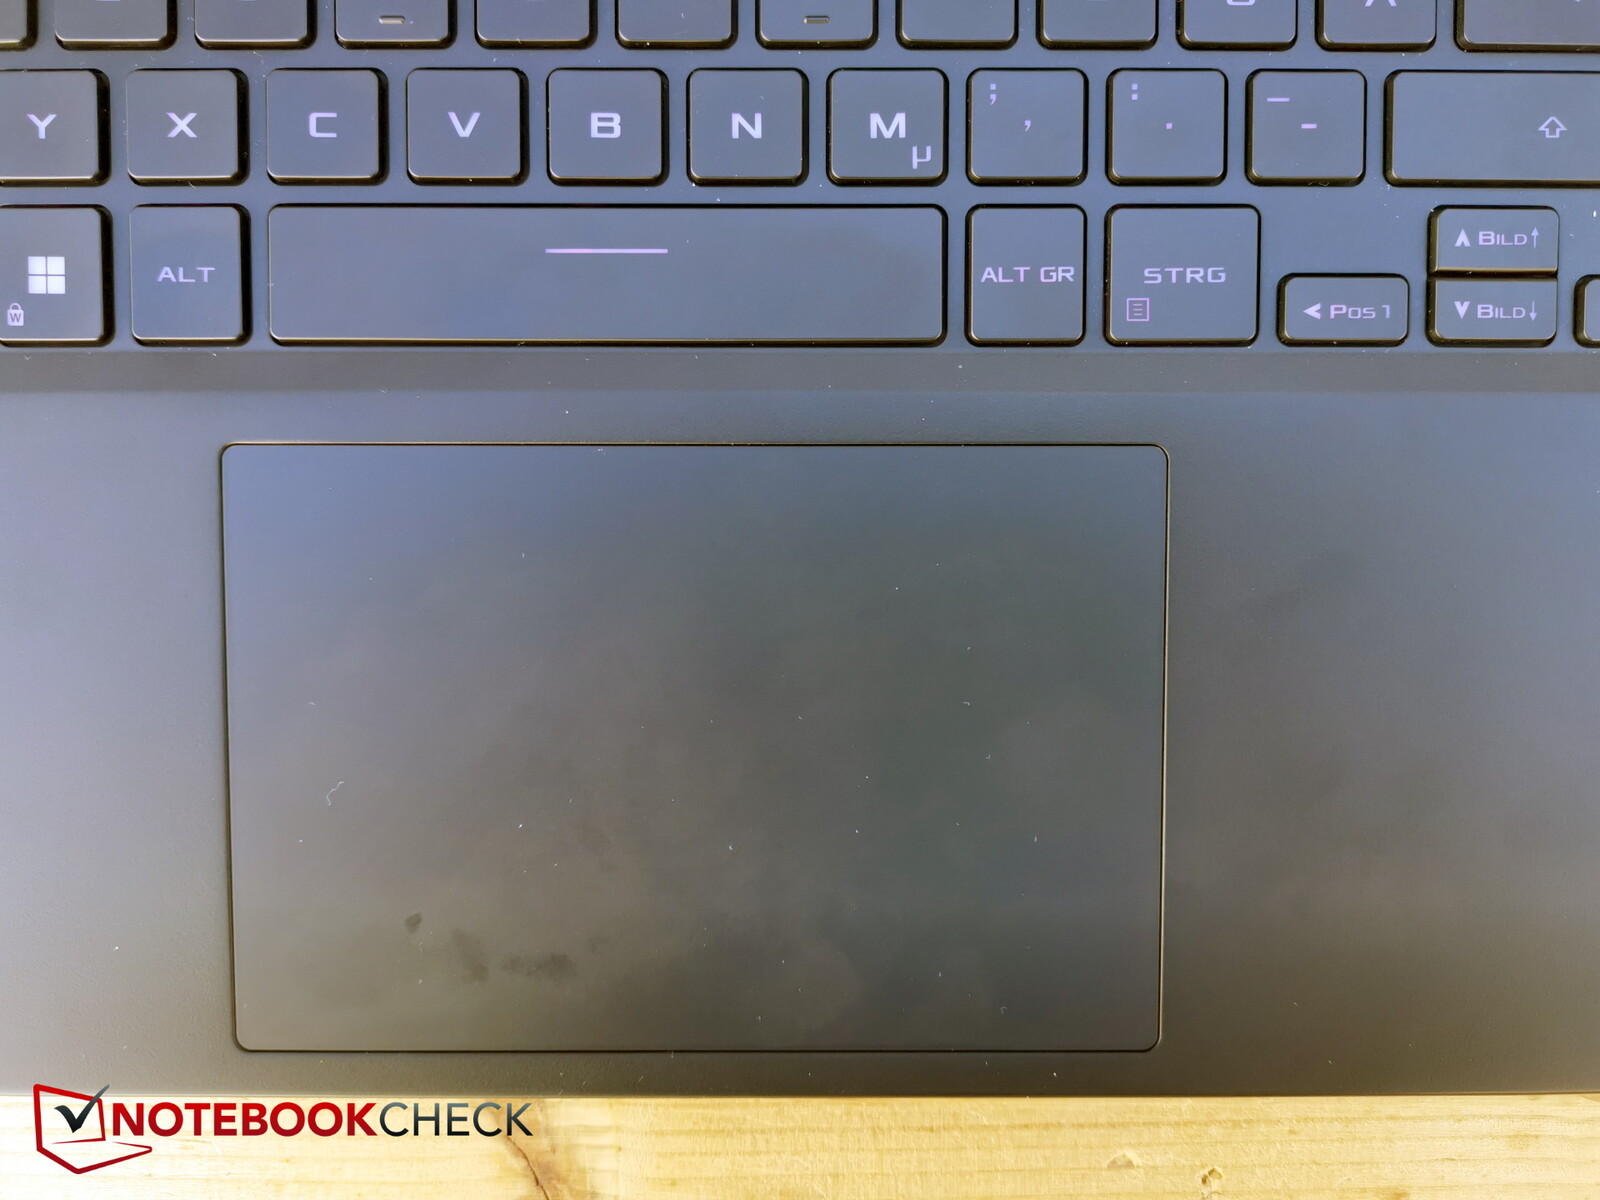
El gran touchpad (aprox. 13 x 8,5 cm) está ligeramente descentrado a la derecha y ofrece una experiencia de deslizamiento suave incluso al realizar movimientos más largos.
Las teclas integradas tienen un punto de presión corto pero bueno con una respuesta clara. Los ruidos de clic pueden describirse como de silenciosos a moderados.
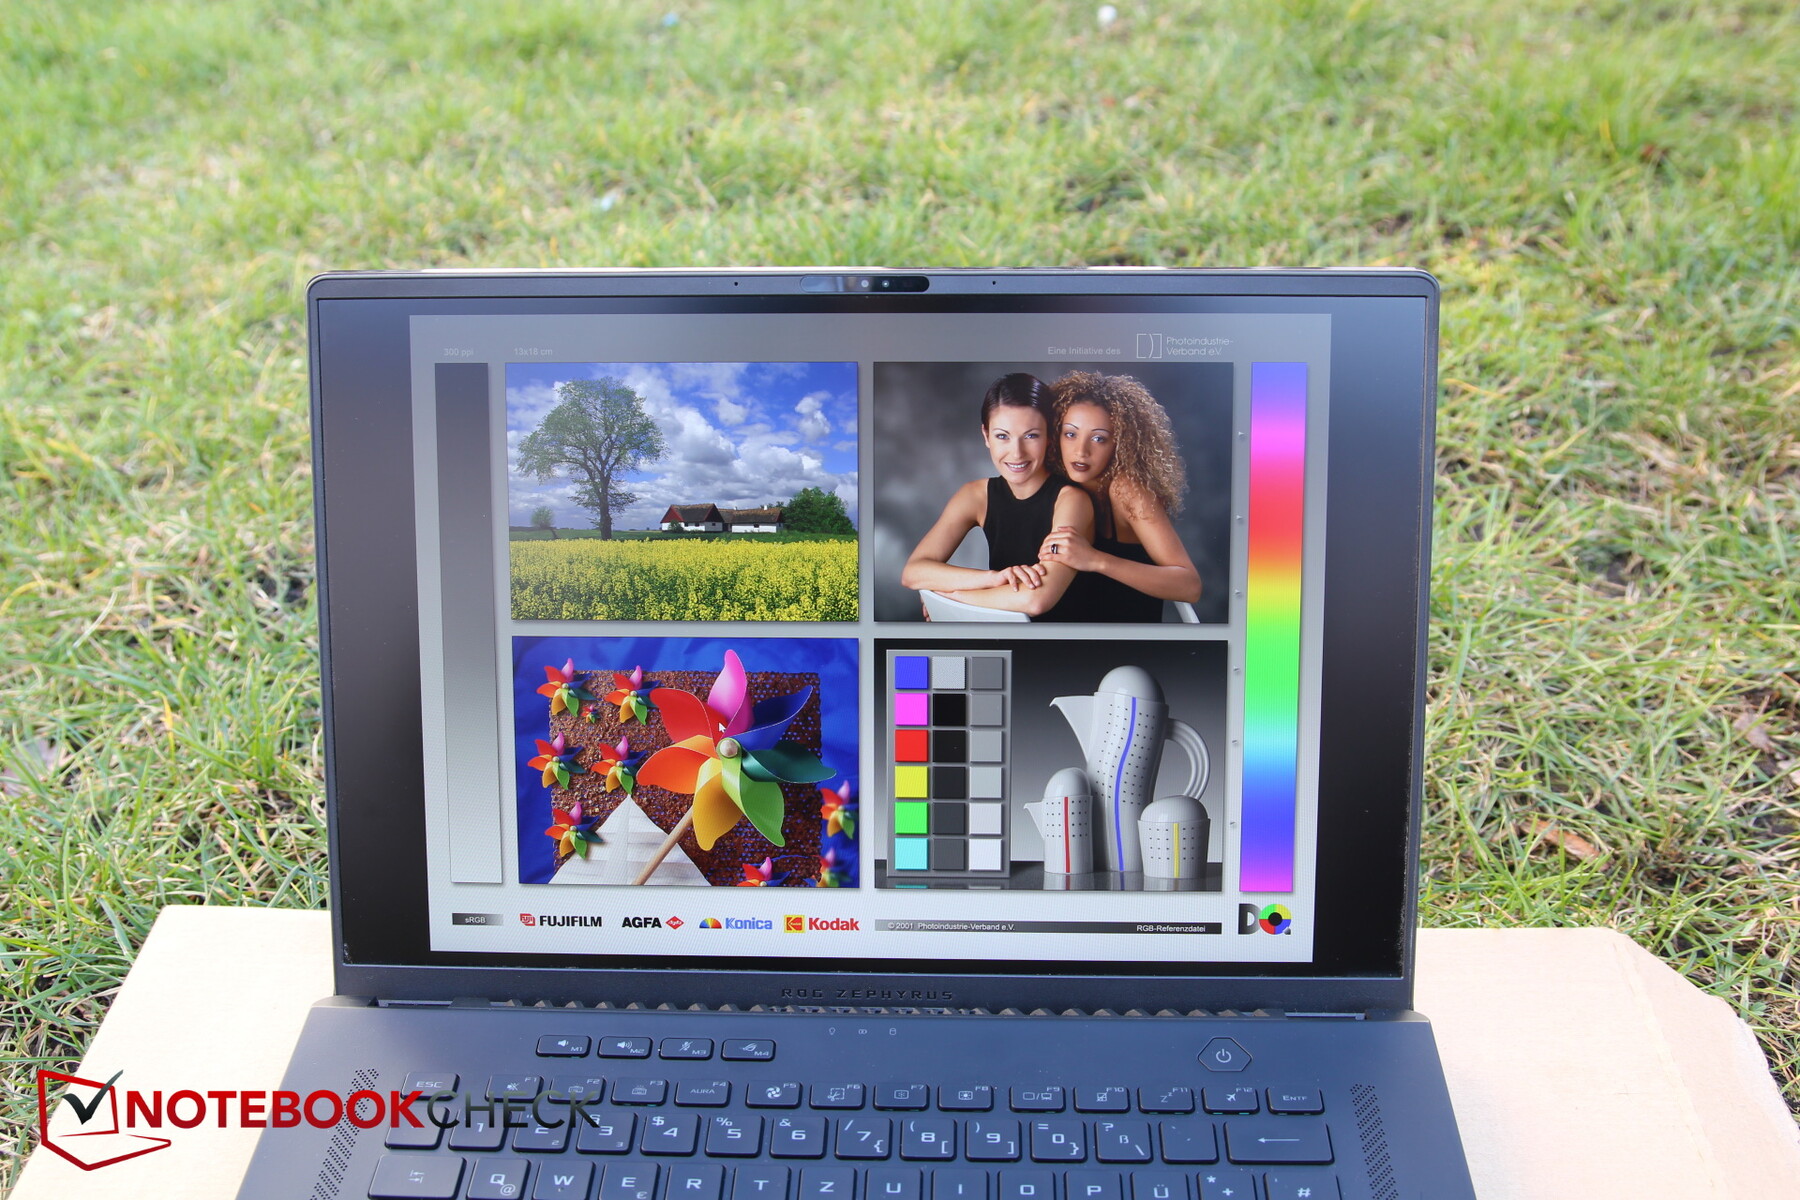
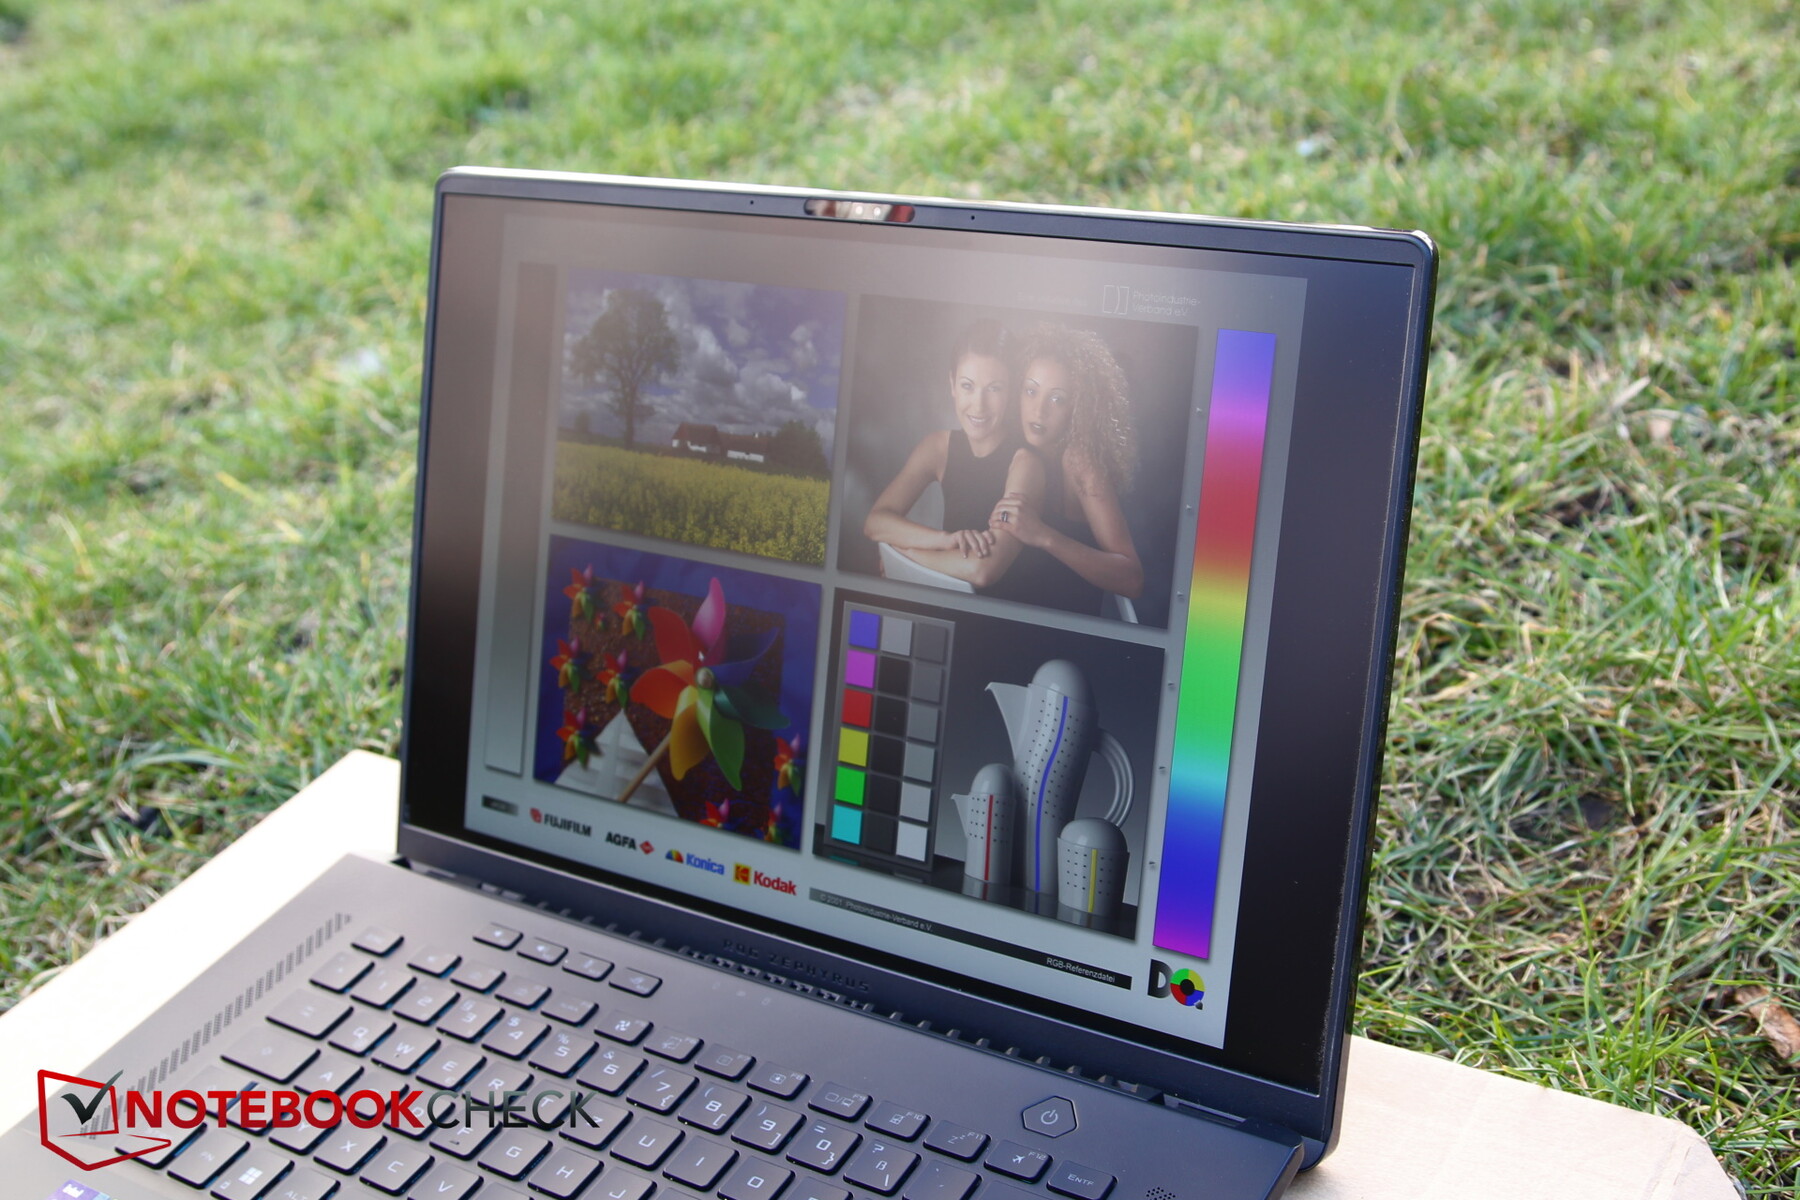
Pantalla - Una Mini-LED muy brillante con HDR
Una vez más, el fabricante ha optado por una pantalla mate, 16:10, IPS con una resolución de 2.560 x 1.600 píxeles. Sin embargo, no es el mismo panel, ya que lleva un nuevo número de versión y ahora está retroiluminado por tecnología Mini-LED. Asus no ha revelado el número de zonas de atenuación empleadas por el panel.
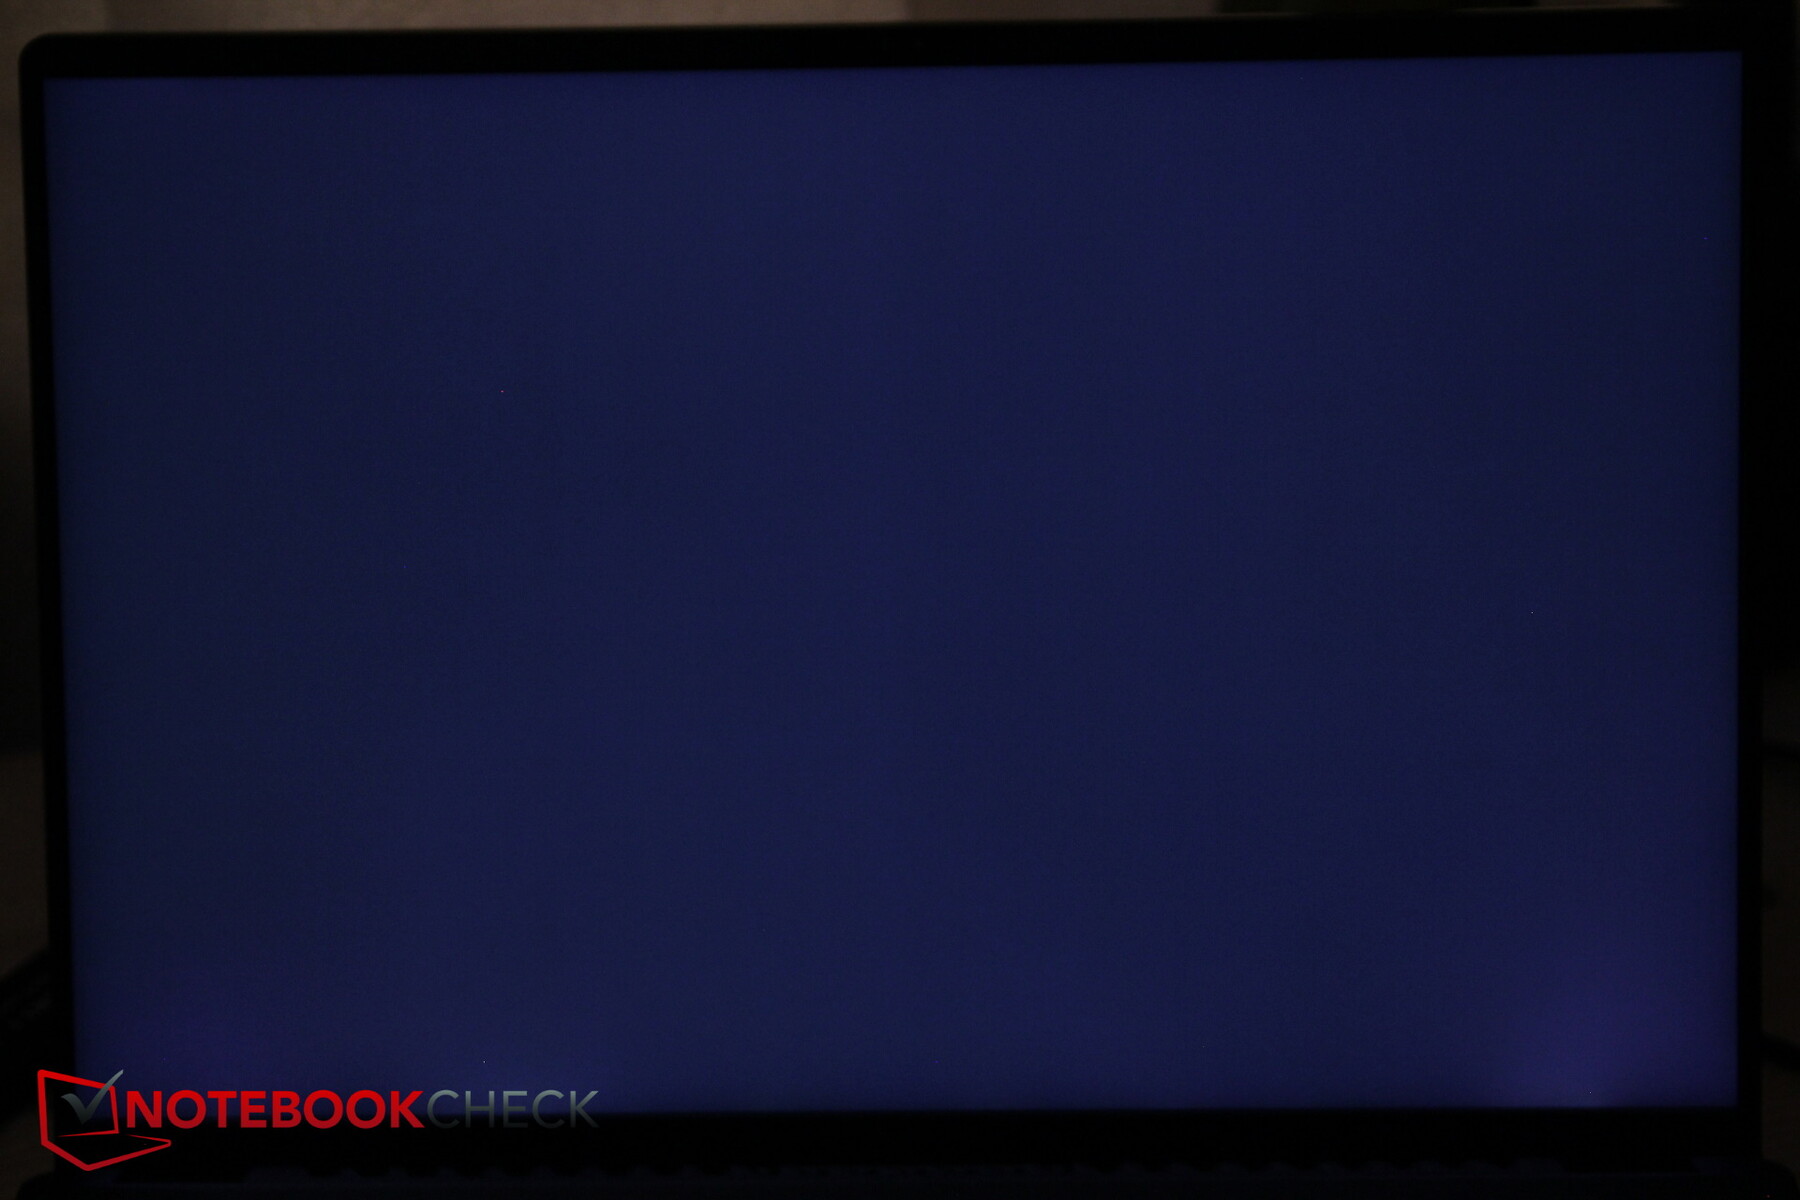
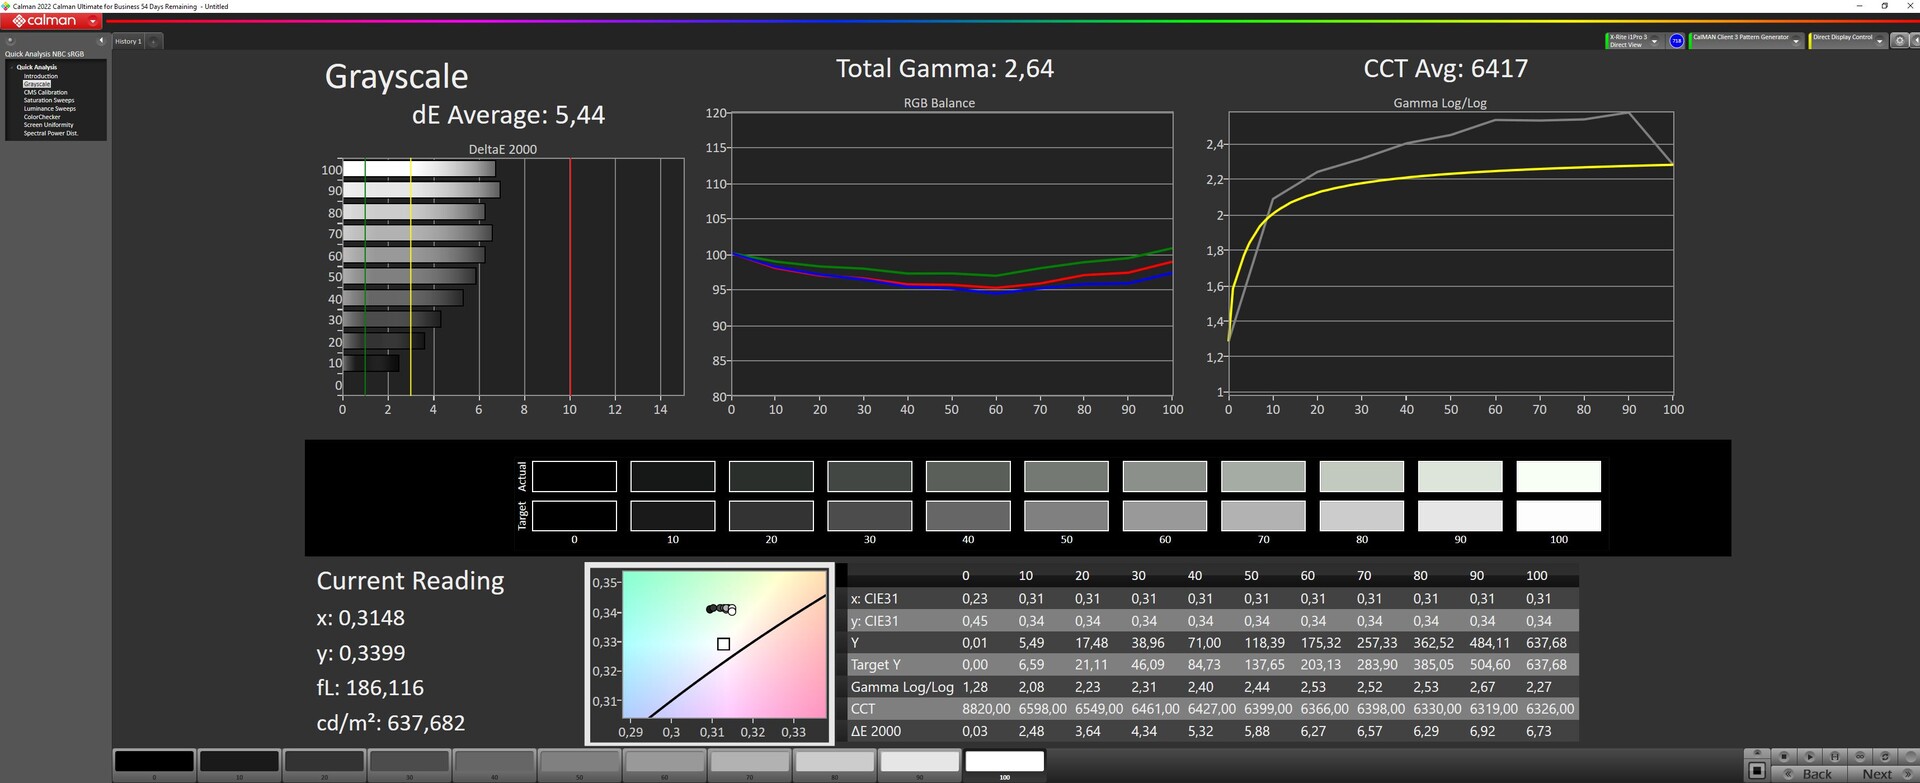
Hay que tener en cuenta algunas cosas cuando se trata de Mini-LEDs: El brillo máximo sólo puede alcanzarse cuando la retroiluminación se configura en multizonas usando el propio centro de control de Asus, el software Armory Crate. En modo HDR, esto se ajusta automáticamente y si se desactiva HDR (el modo SDR está calibrado y tiene menos desviación de color), el panel ilumina automáticamente áreas individuales. Con este ajuste, el brillo es unos 100 nits inferior.
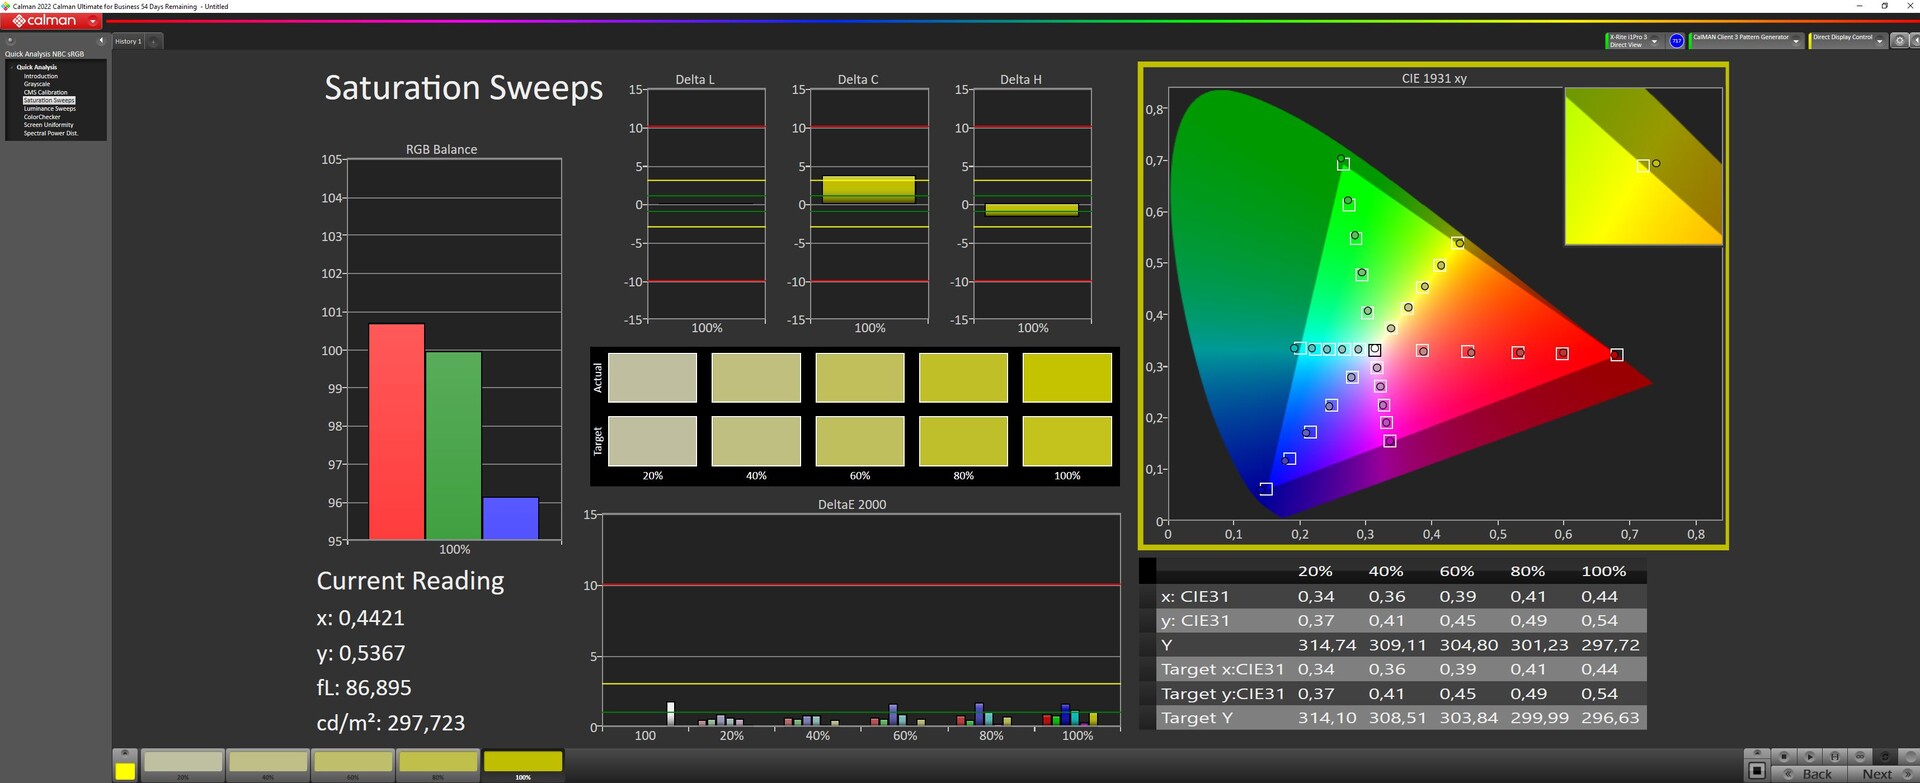
A continuación, destacamos los valores del modo SDR con las multizonas activadas. Sin embargo, este modo no es ideal para el procesamiento de imágenes.
Los niveles de negro también son sorprendentes. Usando la retroiluminación de una sola zona es de sólo 0,55, pero el contraste es pobre. Sólo cuando se utiliza el ajuste multizona baja a un excelente 0,03. Esta es una de las razones por las que realizamos nuestras mediciones con la multizona activada.
Medimos el brillo en unos 627 nits (multizona, si no, unos 519 nits). Con un 92%, la iluminación es muy buena y el brillo disminuye hacia el lado derecho de la pantalla. En comparación con su predecesor, la frecuencia de refresco del panel ha aumentado de 165 a 240 Hz.
| |||||||||||||||||||||||||
iluminación: 92 %
Brillo con batería: 634 cd/m²
Contraste: 21133:1 (Negro: 0.03 cd/m²)
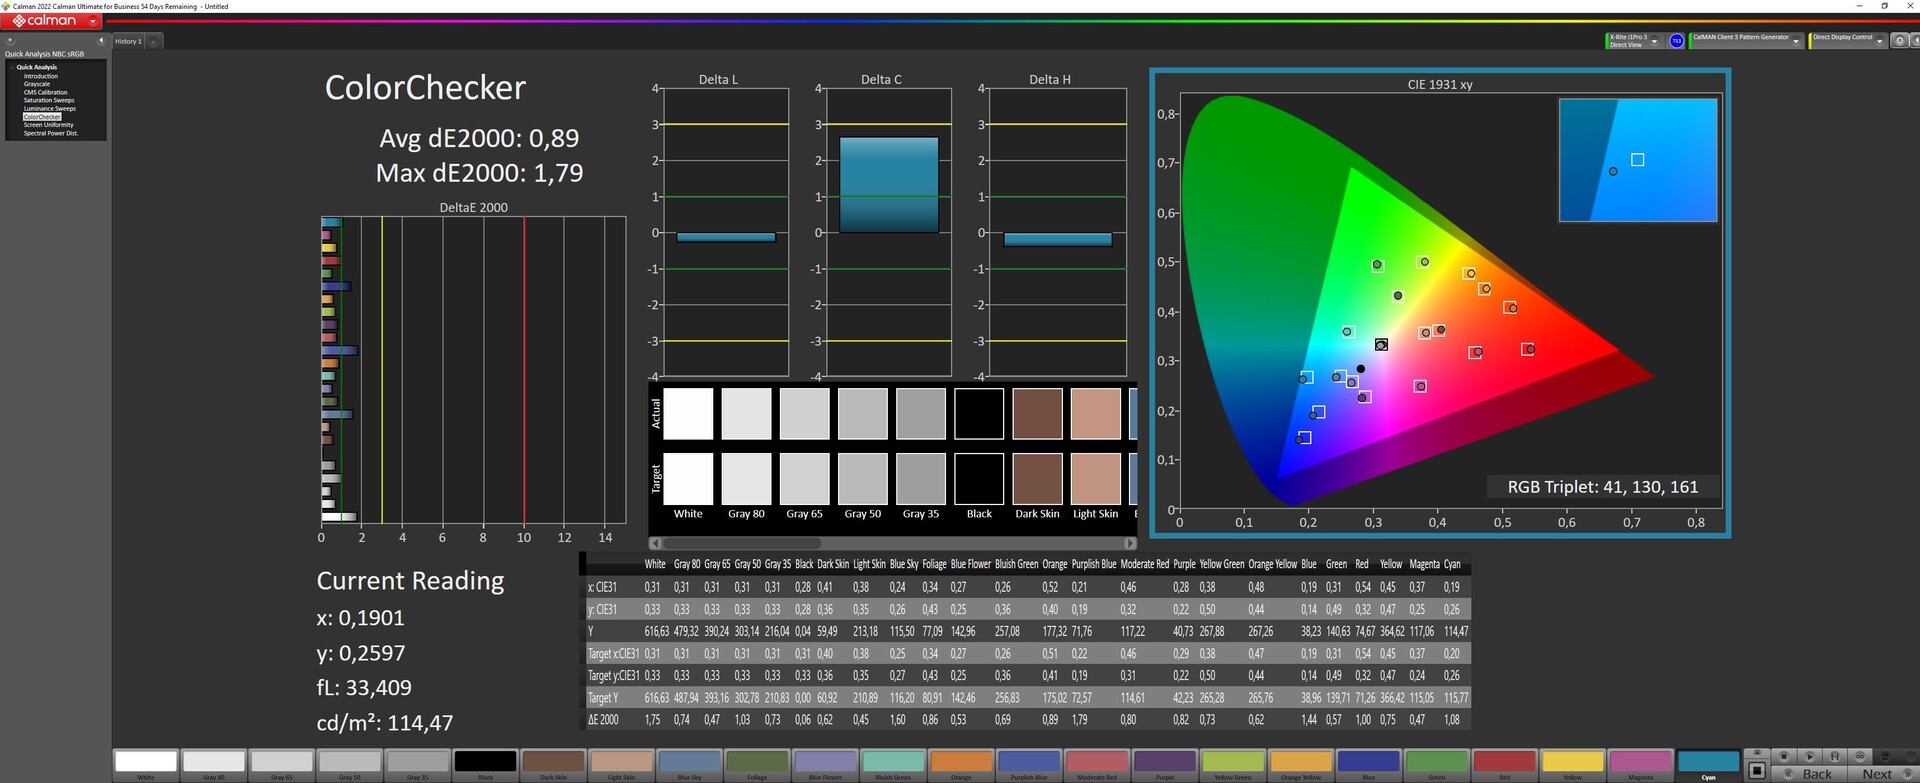
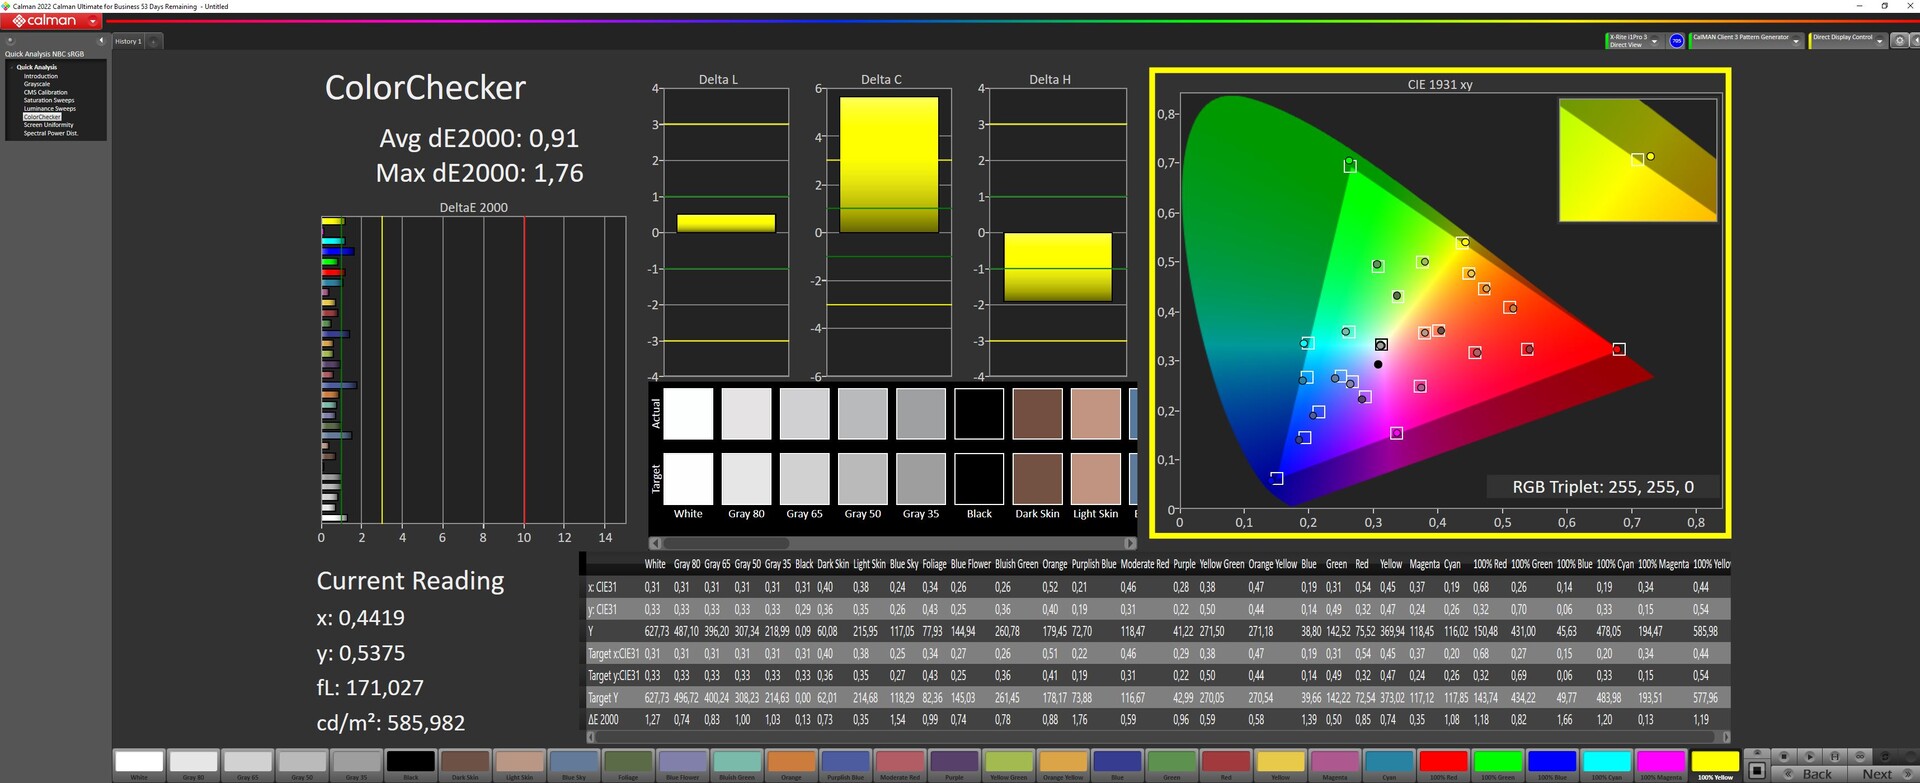
ΔE ColorChecker Calman: 0.89 | ∀{0.5-29.43 Ø4.72}
calibrated: 0.91
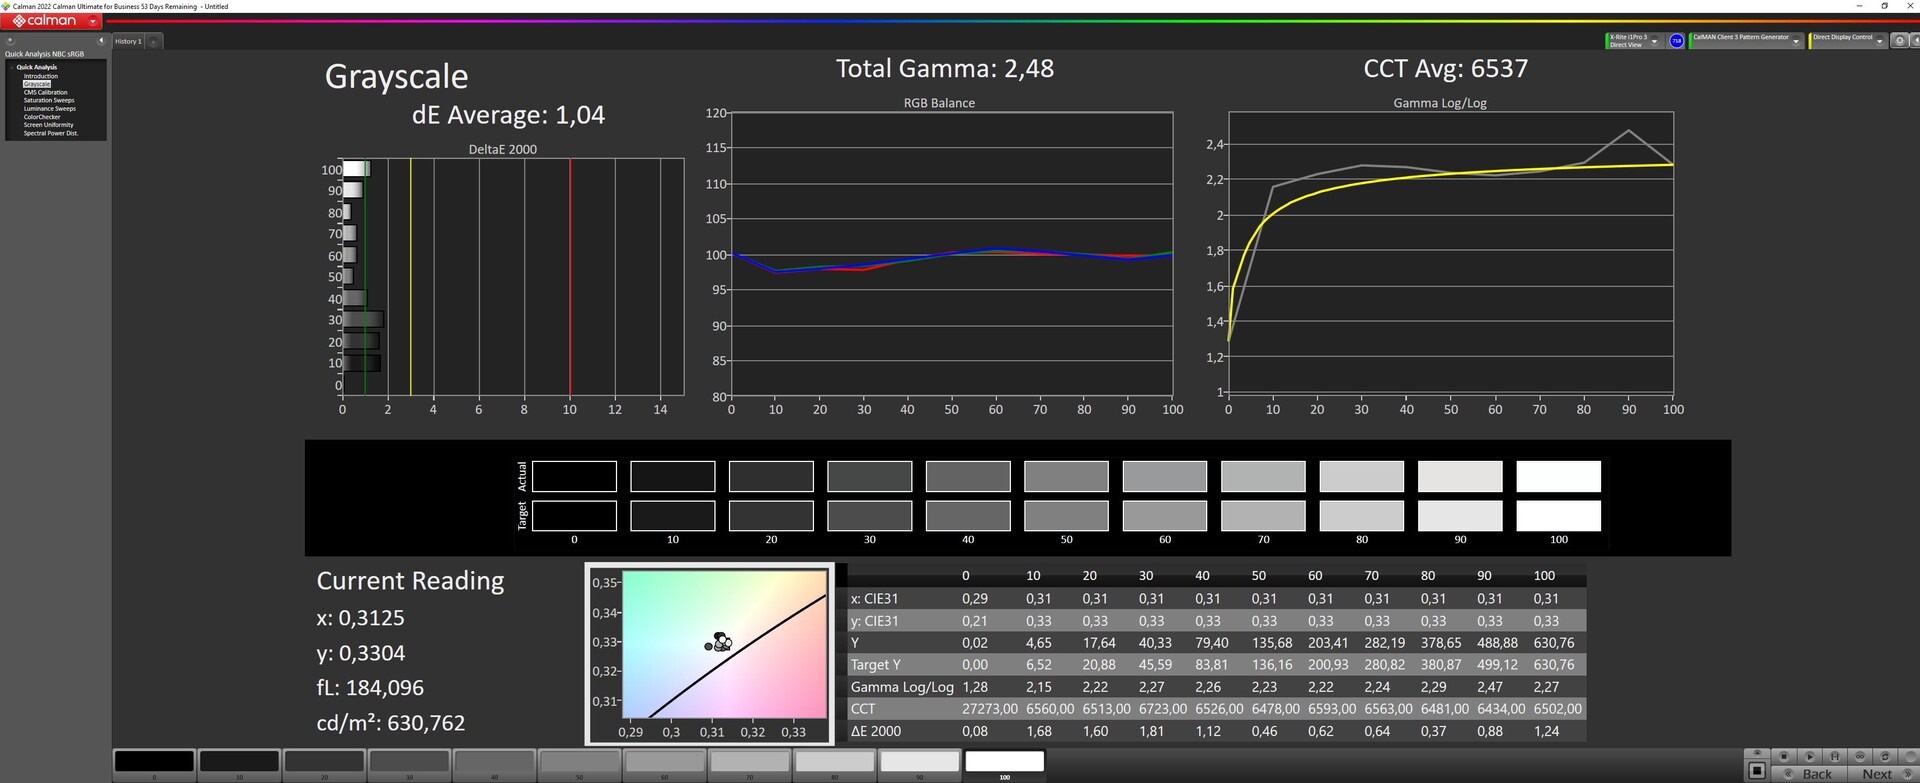
ΔE Greyscale Calman: 1.13 | ∀{0.09-98 Ø4.97}
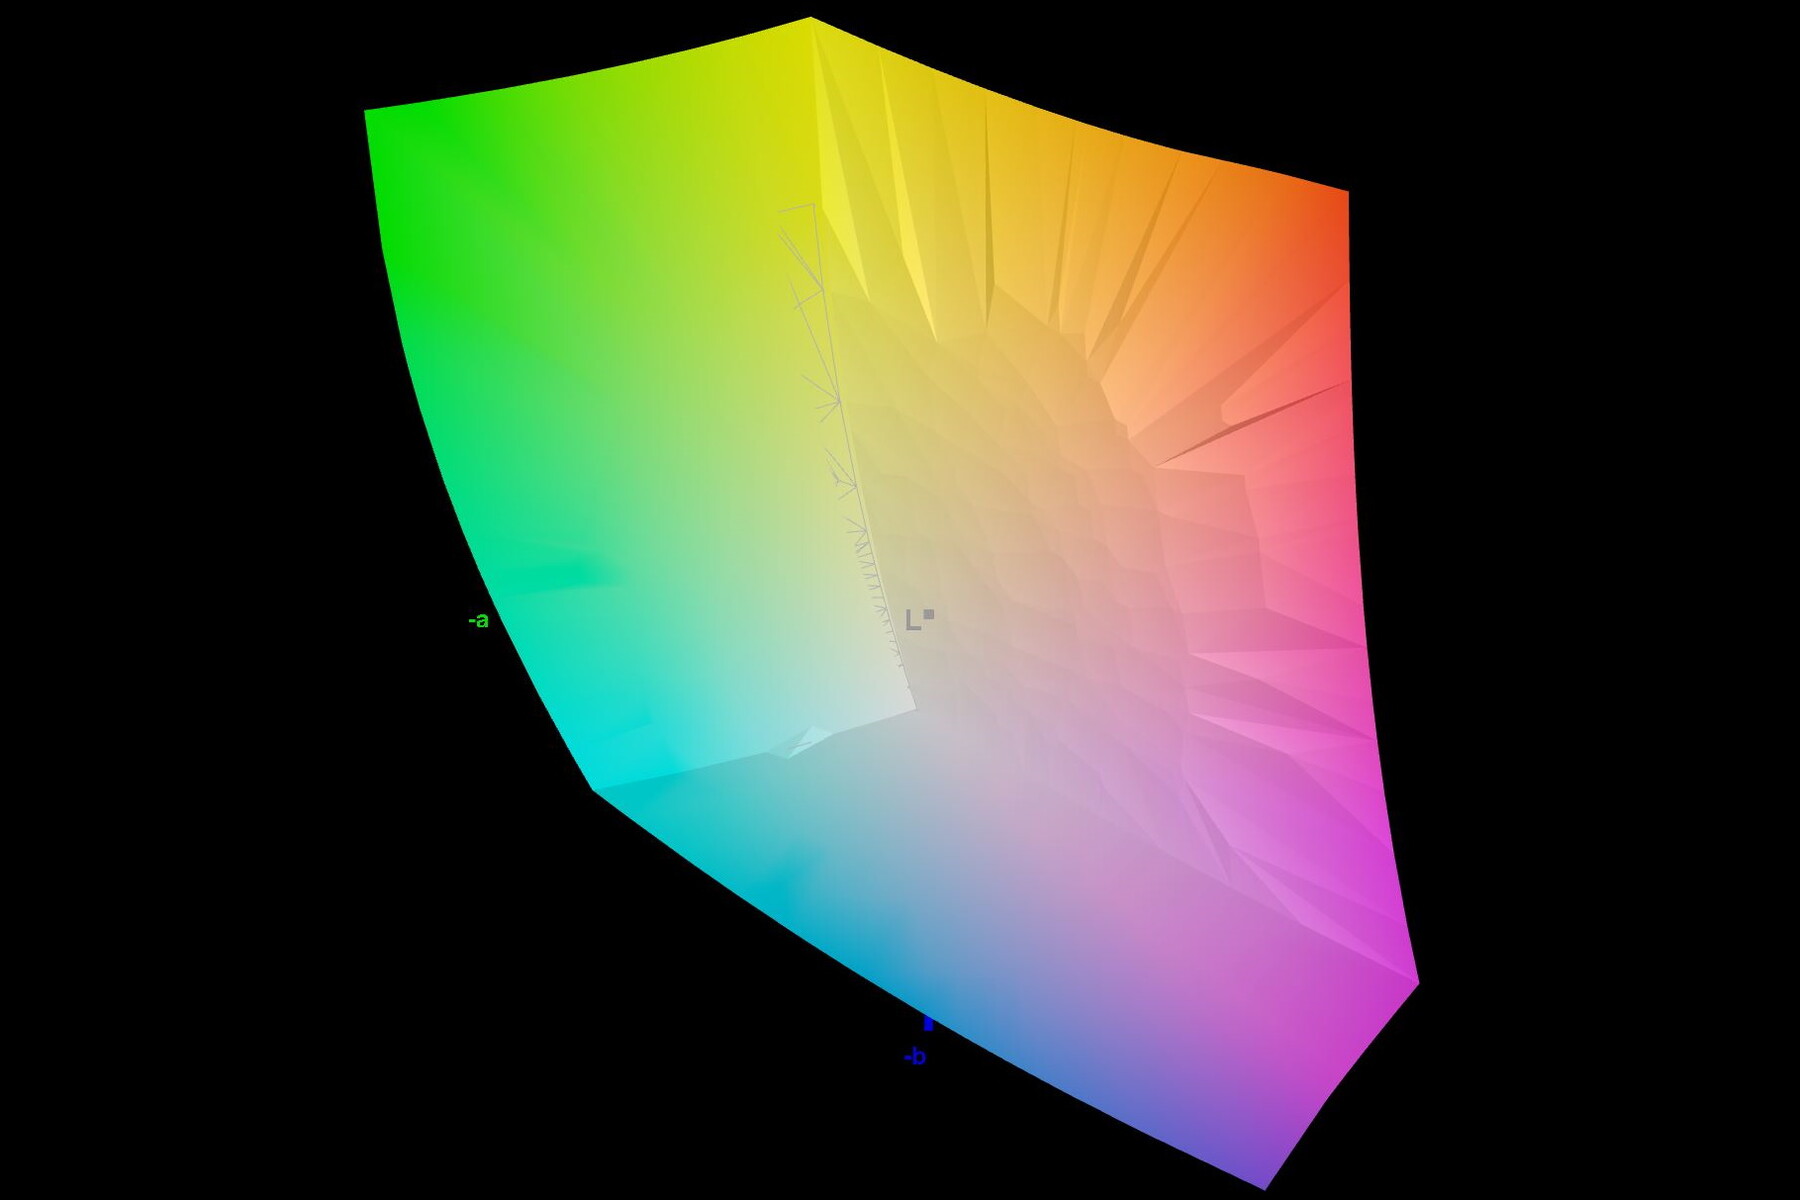
90.01% AdobeRGB 1998 (Argyll 3D)
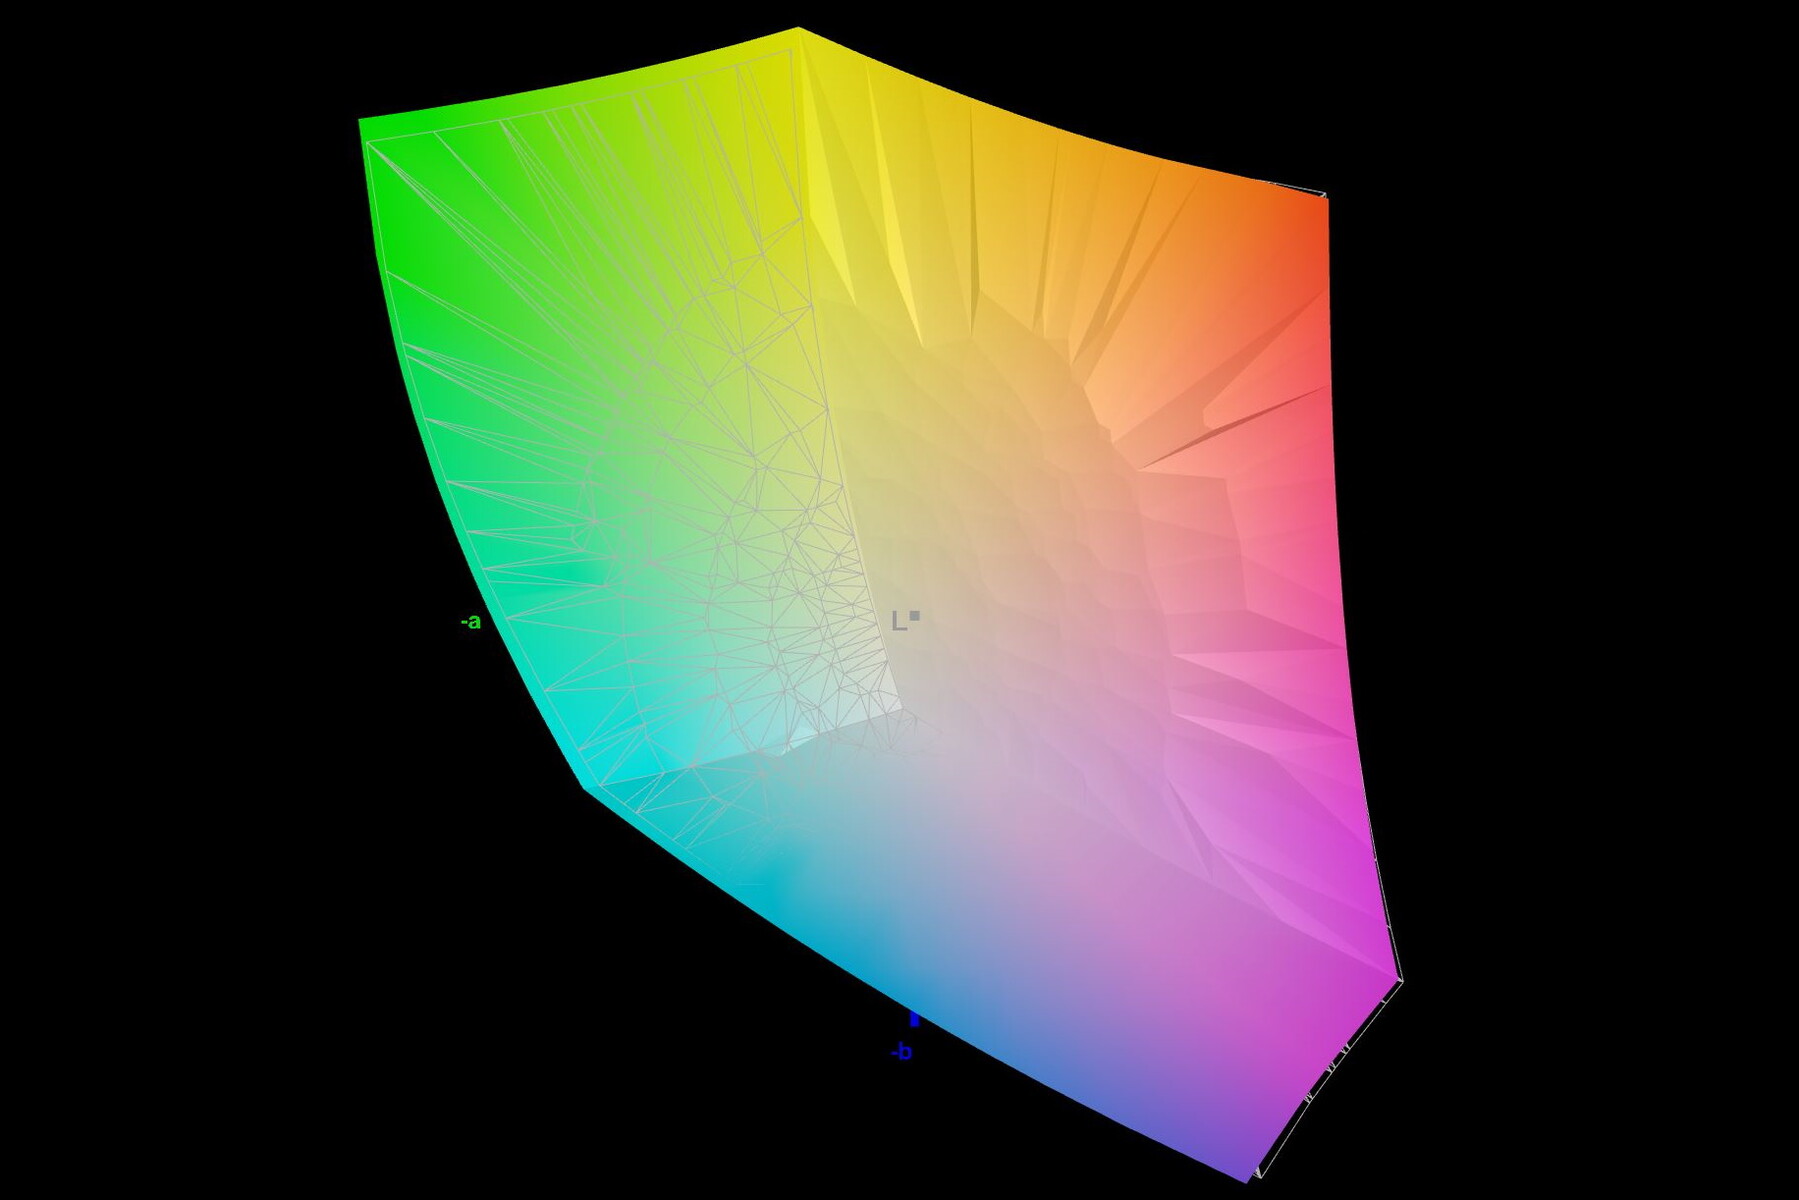
99.9% sRGB (Argyll 3D)
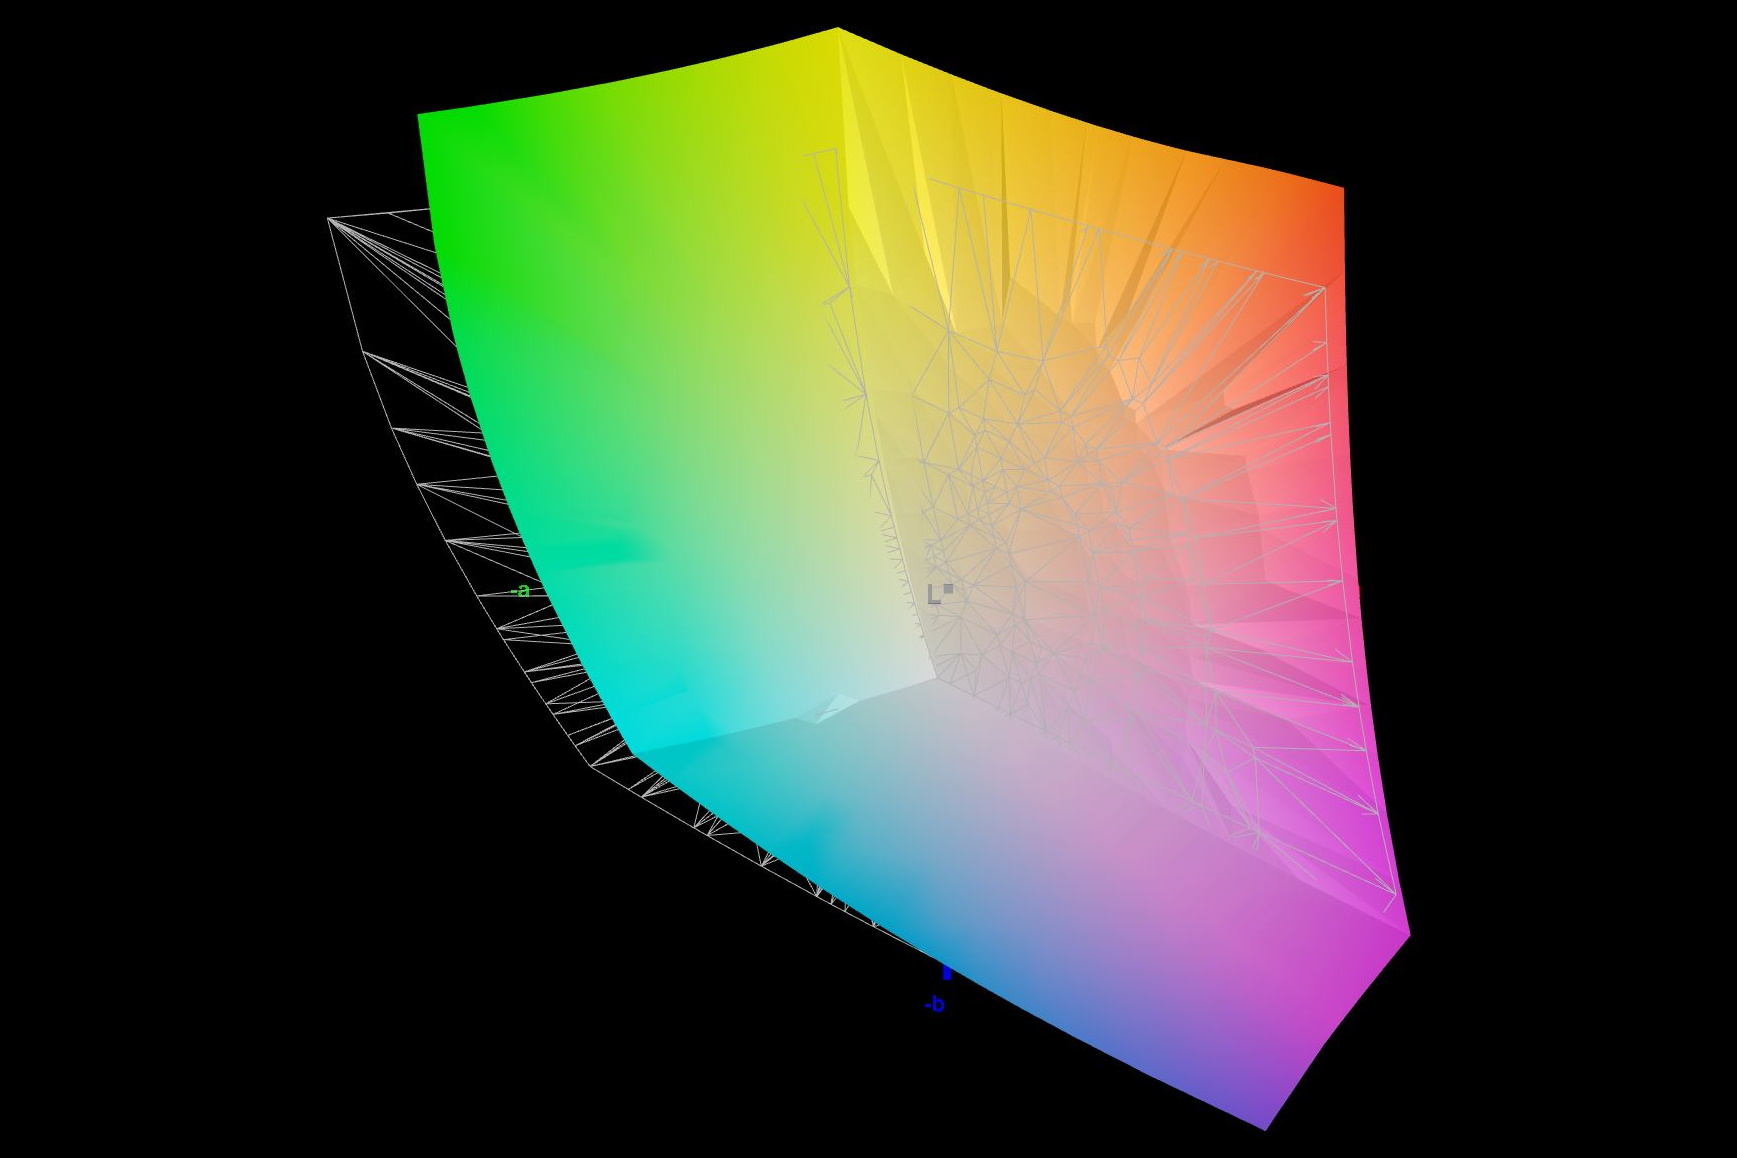
99.33% Display P3 (Argyll 3D)
Gamma: 2.47
CCT: 6497 K
| Asus ROG Zephyrus M16 GU604VY-NM042X BOE0B74 (NE160QDM-NM4, IPS, 2560x1600, 16" | Asus ROG Zephyrus M16 GU603Z BOE0A0B (BOE CQ NE160QDM-NY3), IPS, 2560x1600, 16" | Asus ROG Strix Scar 18 2023 G834JY-N6005W NE180QDM-NZ2, IPS, 2560x1600, 18" | MSI Titan GT77 HX 13VI B173ZAN06.C, Mini-LED, 3840x2160, 17.3" | Lenovo Legion Pro 7 16IRX8H MNG007DA2-3 (CSO1628), IPS, 2560x1600, 16" | Razer Blade 16 Early 2023 CSOT T3 MNG007DA4-1, IPS, 2560x1600, 16" | |
|---|---|---|---|---|---|---|
| Display | -5% | -3% | -0% | -17% | -0% | |
| Display P3 Coverage (%) | 99.33 | 92.8 -7% | 97.2 -2% | 94.9 -4% | 69.1 -30% | 98.5 -1% |
| sRGB Coverage (%) | 99.9 | 98.5 -1% | 99.9 0% | 99.9 0% | 99.7 0% | 100 0% |
| AdobeRGB 1998 Coverage (%) | 90.01 | 83.1 -8% | 84.9 -6% | 92.4 3% | 71.2 -21% | 89.7 0% |
| Response Times | 76% | 80% | 17% | 78% | 73% | |
| Response Time Grey 50% / Grey 80% * (ms) | 50.8 ? | 7.6 ? 85% | 5.41 ? 89% | 38.4 ? 24% | 12.3 ? 76% | 6.6 ? 87% |
| Response Time Black / White * (ms) | 29.6 ? | 10 ? 66% | 8.62 ? 71% | 26.6 ? 10% | 5.9 ? 80% | 12 ? 59% |
| PWM Frequency (Hz) | 12000 | 2380 ? | ||||
| Screen | -181% | -399% | 3033% | -150% | -212% | |
| Brightness middle (cd/m²) | 634 | 497 -22% | 490 -23% | 606 -4% | 511 -19% | 456.8 -28% |
| Brightness (cd/m²) | 627 | 481 -23% | 468 -25% | 602 -4% | 469 -25% | 437 -30% |
| Brightness Distribution (%) | 92 | 82 -11% | 86 -7% | 93 1% | 86 -7% | 83 -10% |
| Black Level * (cd/m²) | 0.03 | 0.21 -600% | 0.54 -1700% | 0.0001 100% | 0.4 -1233% | 0.35 -1067% |
| Contrast (:1) | 21133 | 2367 -89% | 907 -96% | 6060000 28576% | 1278 -94% | 1305 -94% |
| Colorchecker dE 2000 * | 0.89 | 3.53 -297% | 4.97 -458% | 4.8 -439% | 0.95 -7% | 3.7 -316% |
| Colorchecker dE 2000 max. * | 1.79 | 6.15 -244% | 11.02 -516% | 8.2 -358% | 2.07 -16% | 6.42 -259% |
| Colorchecker dE 2000 calibrated * | 0.91 | 3.53 -288% | 2.97 -226% | 1.8 -98% | 0.91 -0% | 0.66 27% |
| Greyscale dE 2000 * | 1.13 | 1.74 -54% | 7.2 -537% | 6.5 -475% | 0.6 47% | 2.6 -130% |
| Gamma | 2.47 89% | 2.2 100% | 2.161 102% | 2.63 84% | 2.176 101% | 2.3 96% |
| CCT | 6497 100% | 6418 101% | 6515 100% | 6596 99% | 6545 99% | 6108 106% |
| Media total (Programa/Opciones) | -37% /
-107% | -107% /
-245% | 1017% /
1952% | -30% /
-89% | -46% /
-126% |
* ... más pequeño es mejor
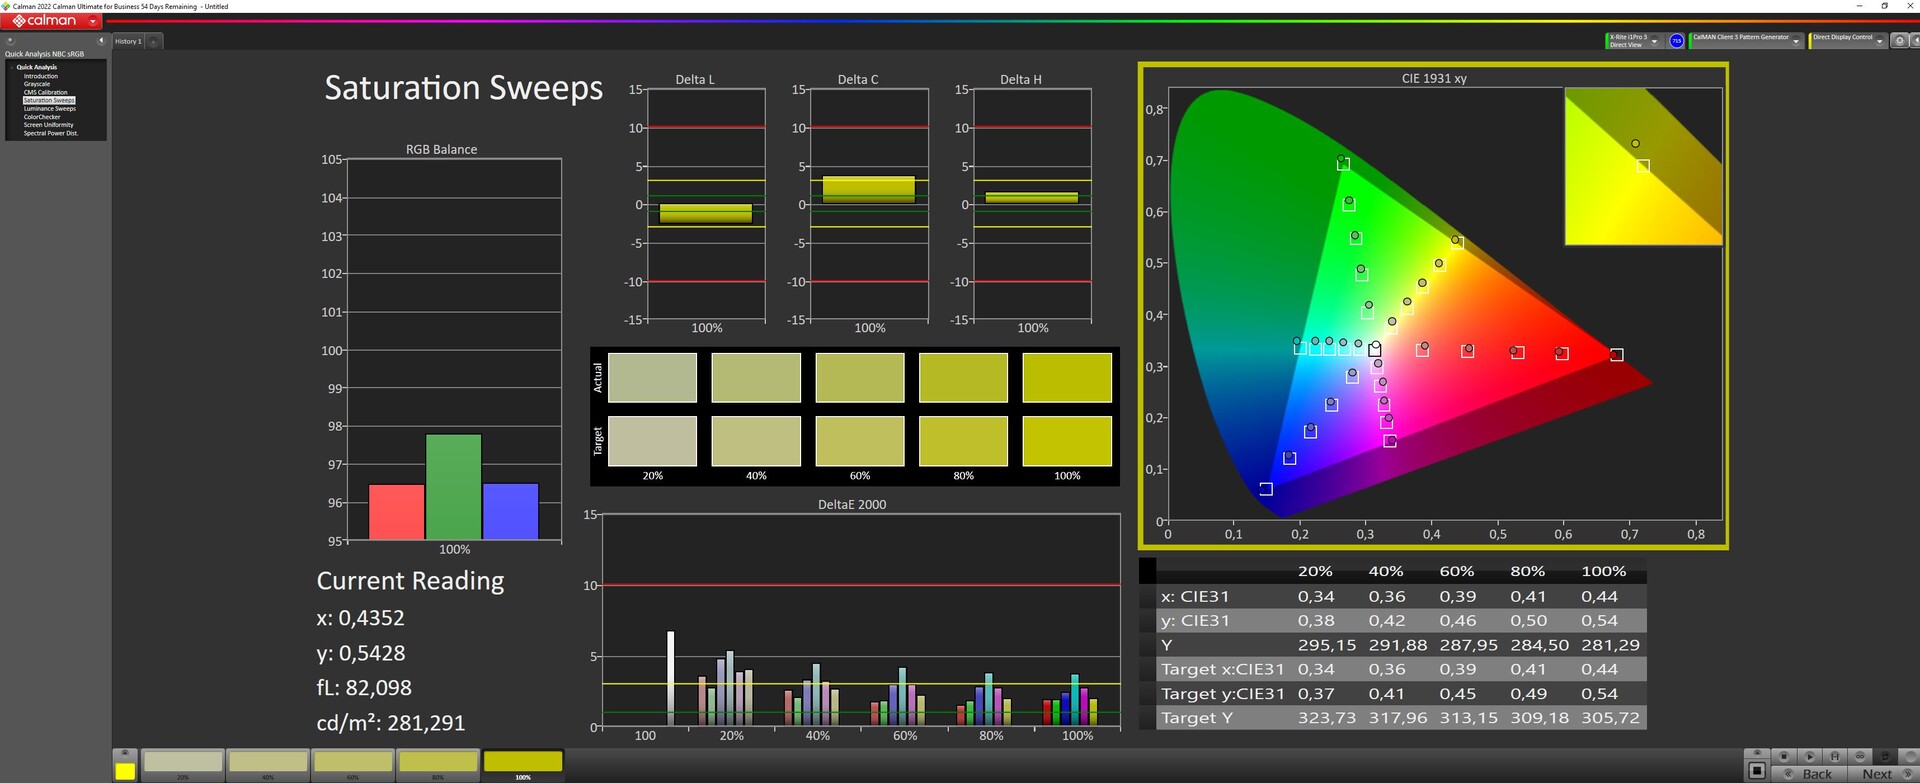
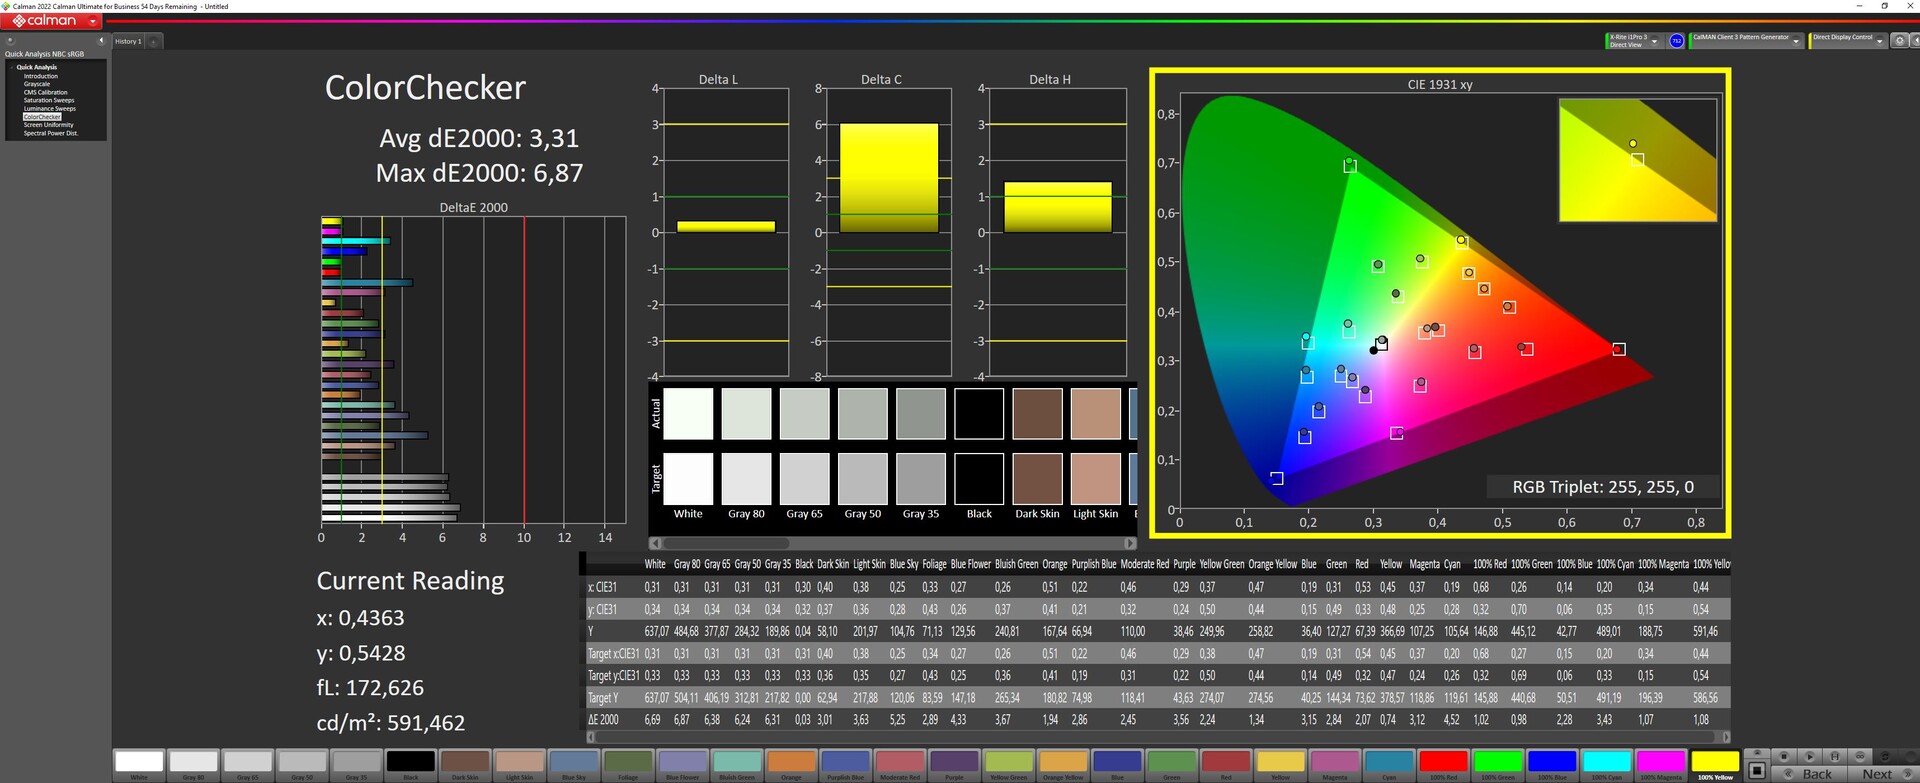
Asus anuncia que el dispositivo tiene un 100 por cien de DCI P3 y esto es algo que nuestro análisis pudo confirmar. AdobeRGB se reproduce al 90 por ciento.
Al sacarlo de la caja, el panel está muy bien calibrado (SDR) y tiene unos valores DeltaE de escala de grises y ColorChecker de sólo 1,13 y 0,89. Una nueva calibración apenas mejora las cosas. El DeltaE de la escala de grises bajó un poco mientras que la desviación del ColorChecker aumentó ligeramente.
Sin embargo, en modo HDR el calibrado desaparece (ver la última fila de nuestras capturas de pantalla más abajo).


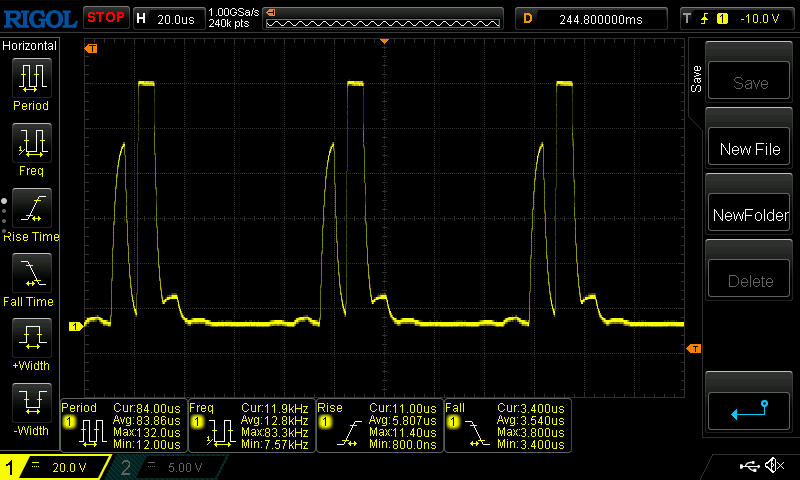
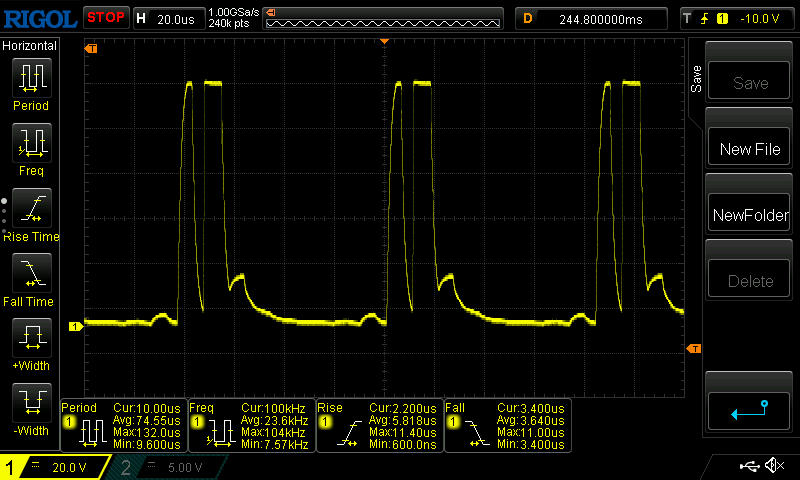
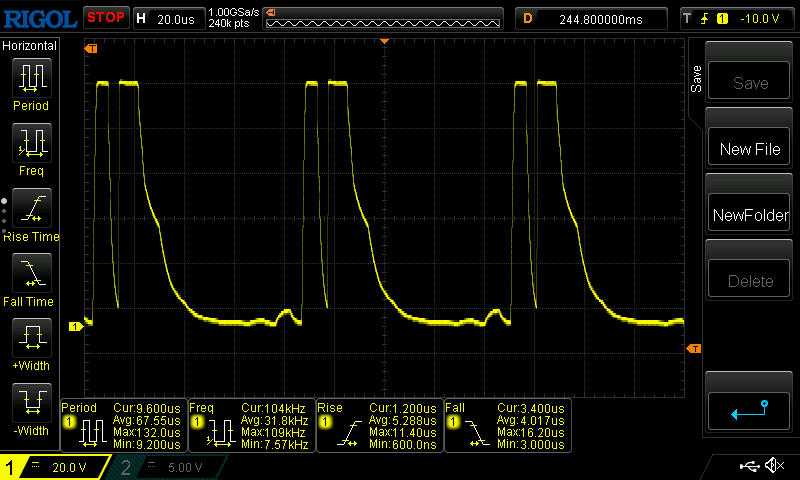
Determinar los tiempos de respuesta no es fácil con nuestro modelo de pruebas ya que la frecuencia PWM de al menos 12 kHz (ver más abajo) se solapa con las curvas de tiempo de respuesta. Asus especifica que es de 3 ms, pero lo hace sin revelar qué técnica de medición usaron. A brillo máximo, lo medimos más en la región de 30 a 50 ms que, por un lado, es alto pero también está posiblemente influenciado por la frecuencia PWM solapada.
Tiempos de respuesta del display
| ↔ Tiempo de respuesta de Negro a Blanco | ||
|---|---|---|
| 29.6 ms ... subida ↗ y bajada ↘ combinada | ↗ 25 ms subida | 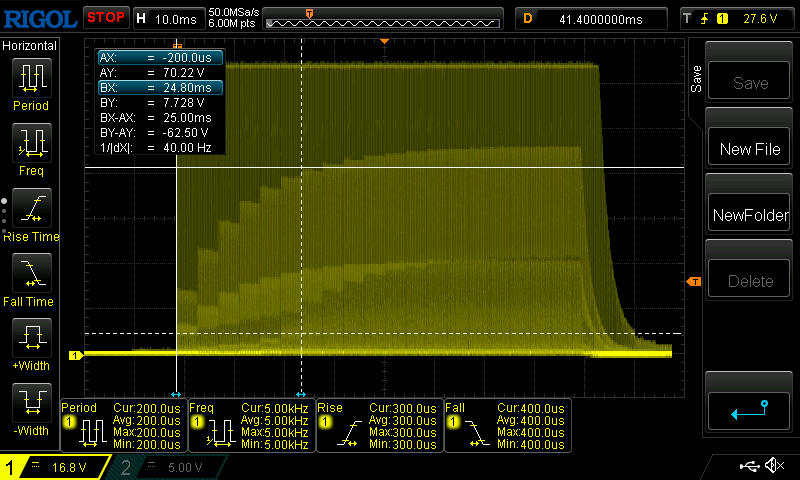 |
| ↘ 4.6 ms bajada | ||
| La pantalla mostró tiempos de respuesta relativamente lentos en nuestros tests pero podría ser demasiado lenta para los jugones. En comparación, todos los dispositivos de prueba van de ##min### (mínimo) a 240 (máximo) ms. » 79 % de todos los dispositivos son mejores. Eso quiere decir que el tiempo de respuesta es peor que la media (19.8 ms) de todos los dispositivos testados. | ||
| ↔ Tiempo de respuesta 50% Gris a 80% Gris | ||
| 50.8 ms ... subida ↗ y bajada ↘ combinada | ↗ 27.6 ms subida | 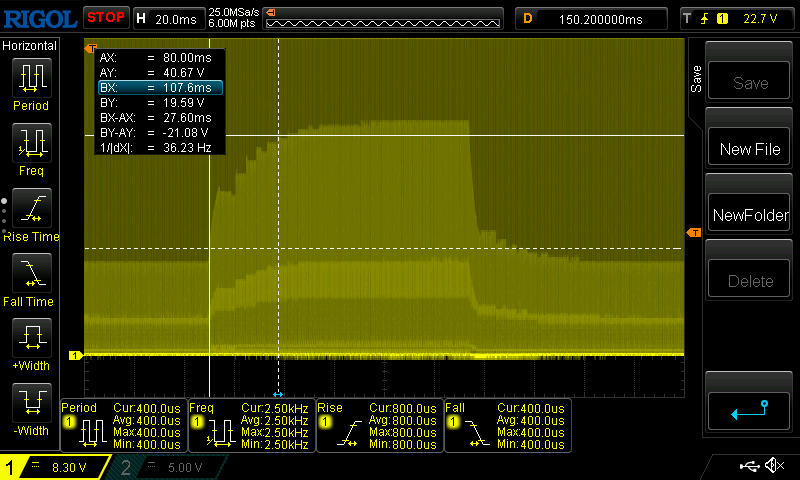 |
| ↘ 23.2 ms bajada | ||
| La pantalla mostró tiempos de respuesta lentos en nuestros tests y podría ser demasiado lenta para los jugones. En comparación, todos los dispositivos de prueba van de ##min### (mínimo) a 636 (máximo) ms. » 87 % de todos los dispositivos son mejores. Eso quiere decir que el tiempo de respuesta es peor que la media (31 ms) de todos los dispositivos testados. | ||
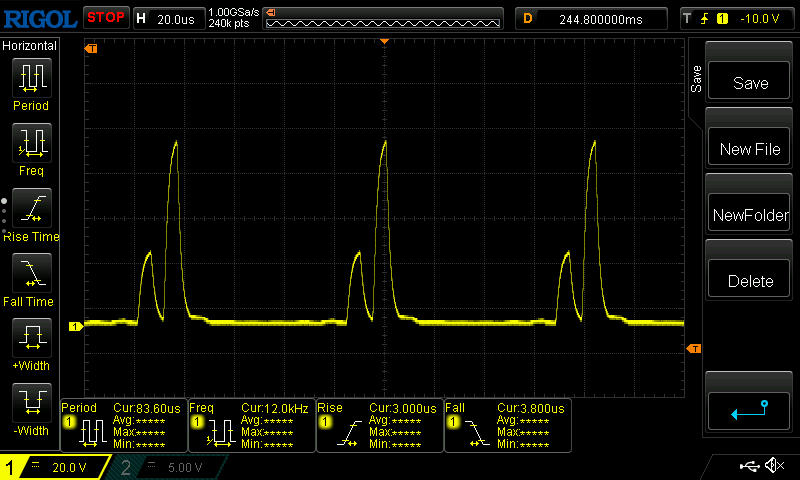
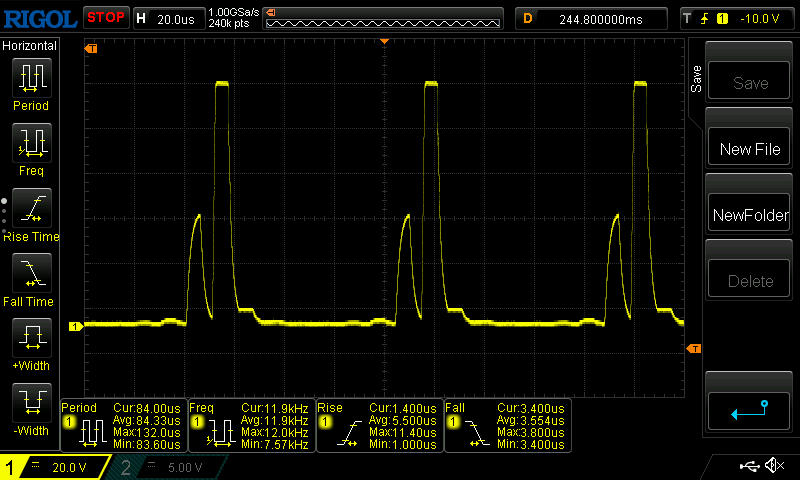
Parpadeo de Pantalla / PWM (Pulse-Width Modulation)
| Parpadeo de Pantalla / PWM detectado | 12000 Hz | 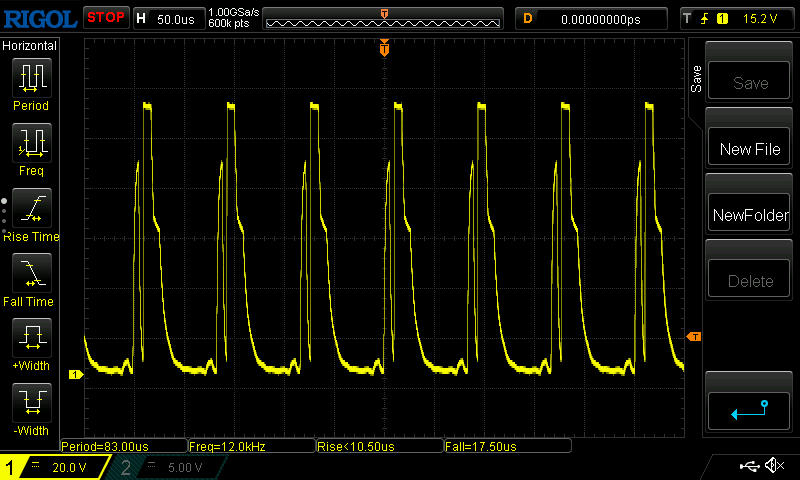 | |
La retroiluminación del display parpadea a 12000 Hz (seguramente usa PWM - Pulse-Width Modulation) . La frecuencia de 12000 Hz es bastante alta, por lo que la mayoría de gente sensible al parpadeo no debería ver parpadeo o tener fatiga visual. Comparación: 52 % de todos los dispositivos testados no usaron PWM para atenuar el display. Si se usó, medimos una media de 7781 (mínimo: 5 - máxmo: 343500) Hz. | |||
PWM se utiliza para regular el brillo. Con un brillo del 100 al 83 por ciento, la frecuencia se situó en 12 kHz, lo que no debería ser perceptible para las personas normalmente sensibles al PWM. Por debajo de ese valor, la frecuencia siguió aumentando y se situó entre 69 y 100 kHz.
En exteriores, la superficie mate garantiza un nivel de brillo comparativamente alto, así como una legibilidad muy buena, al menos a la sombra. Hay que tener cuidado al ver la pantalla desde arriba, ya que las imágenes se desvanecen muy rápidamente.

Rendimiento - Al turbo le falta chispa
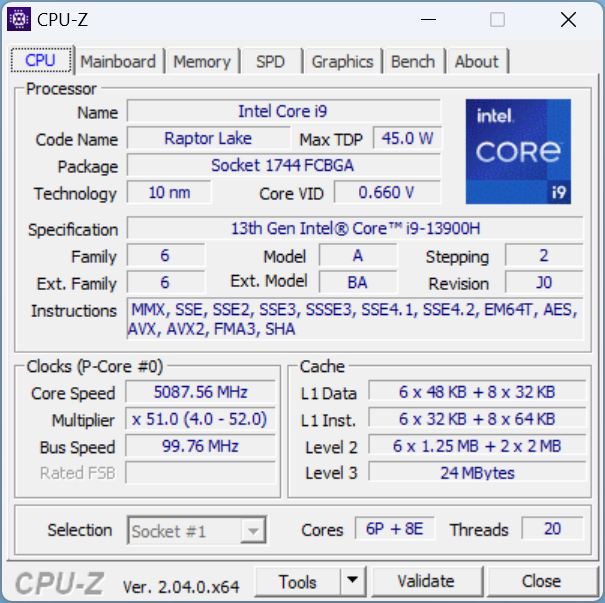
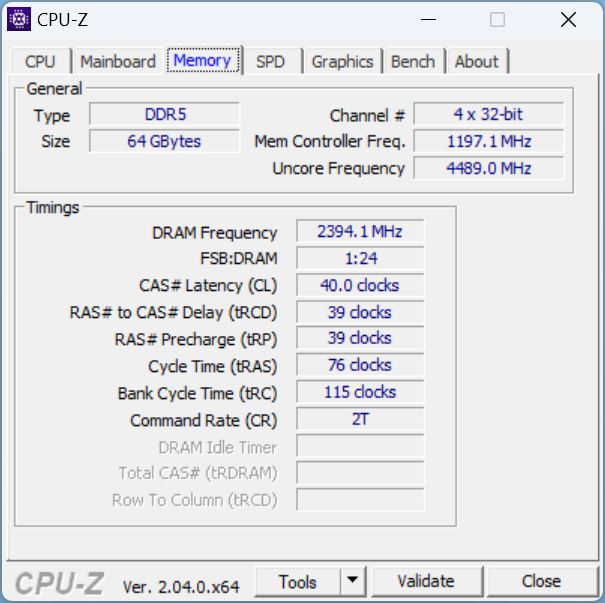
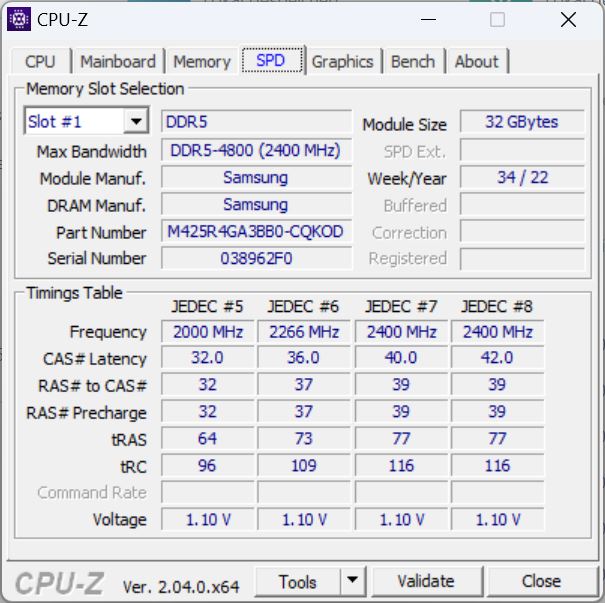
Sobre el papel, el nuevo M16 debería ser un peso pesado del rendimiento en un cuerpo de 16 pulgadas: Raptor Lake Core i9-13900H, Nvidia Geforce RTX 4090y 64 GB de RAM lanzan el guante a todos los aspirantes al trono del rendimiento.
Condiciones de la prueba
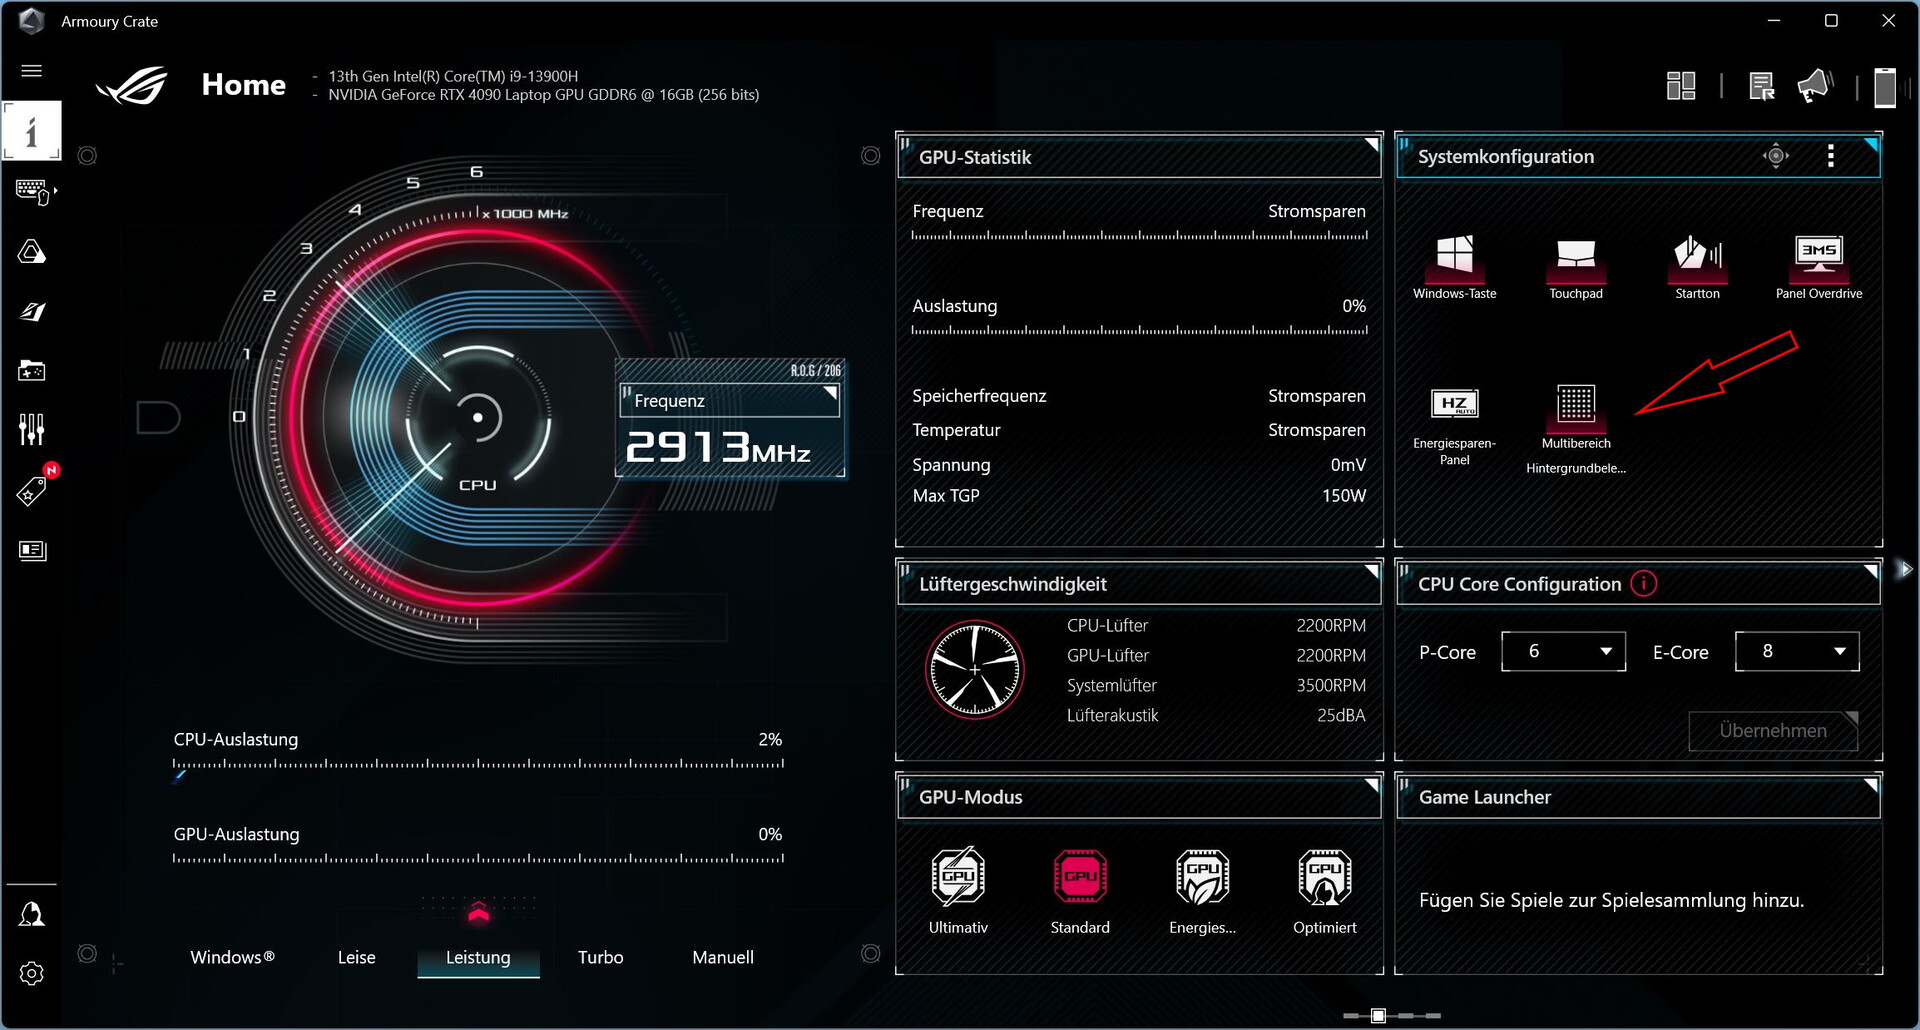
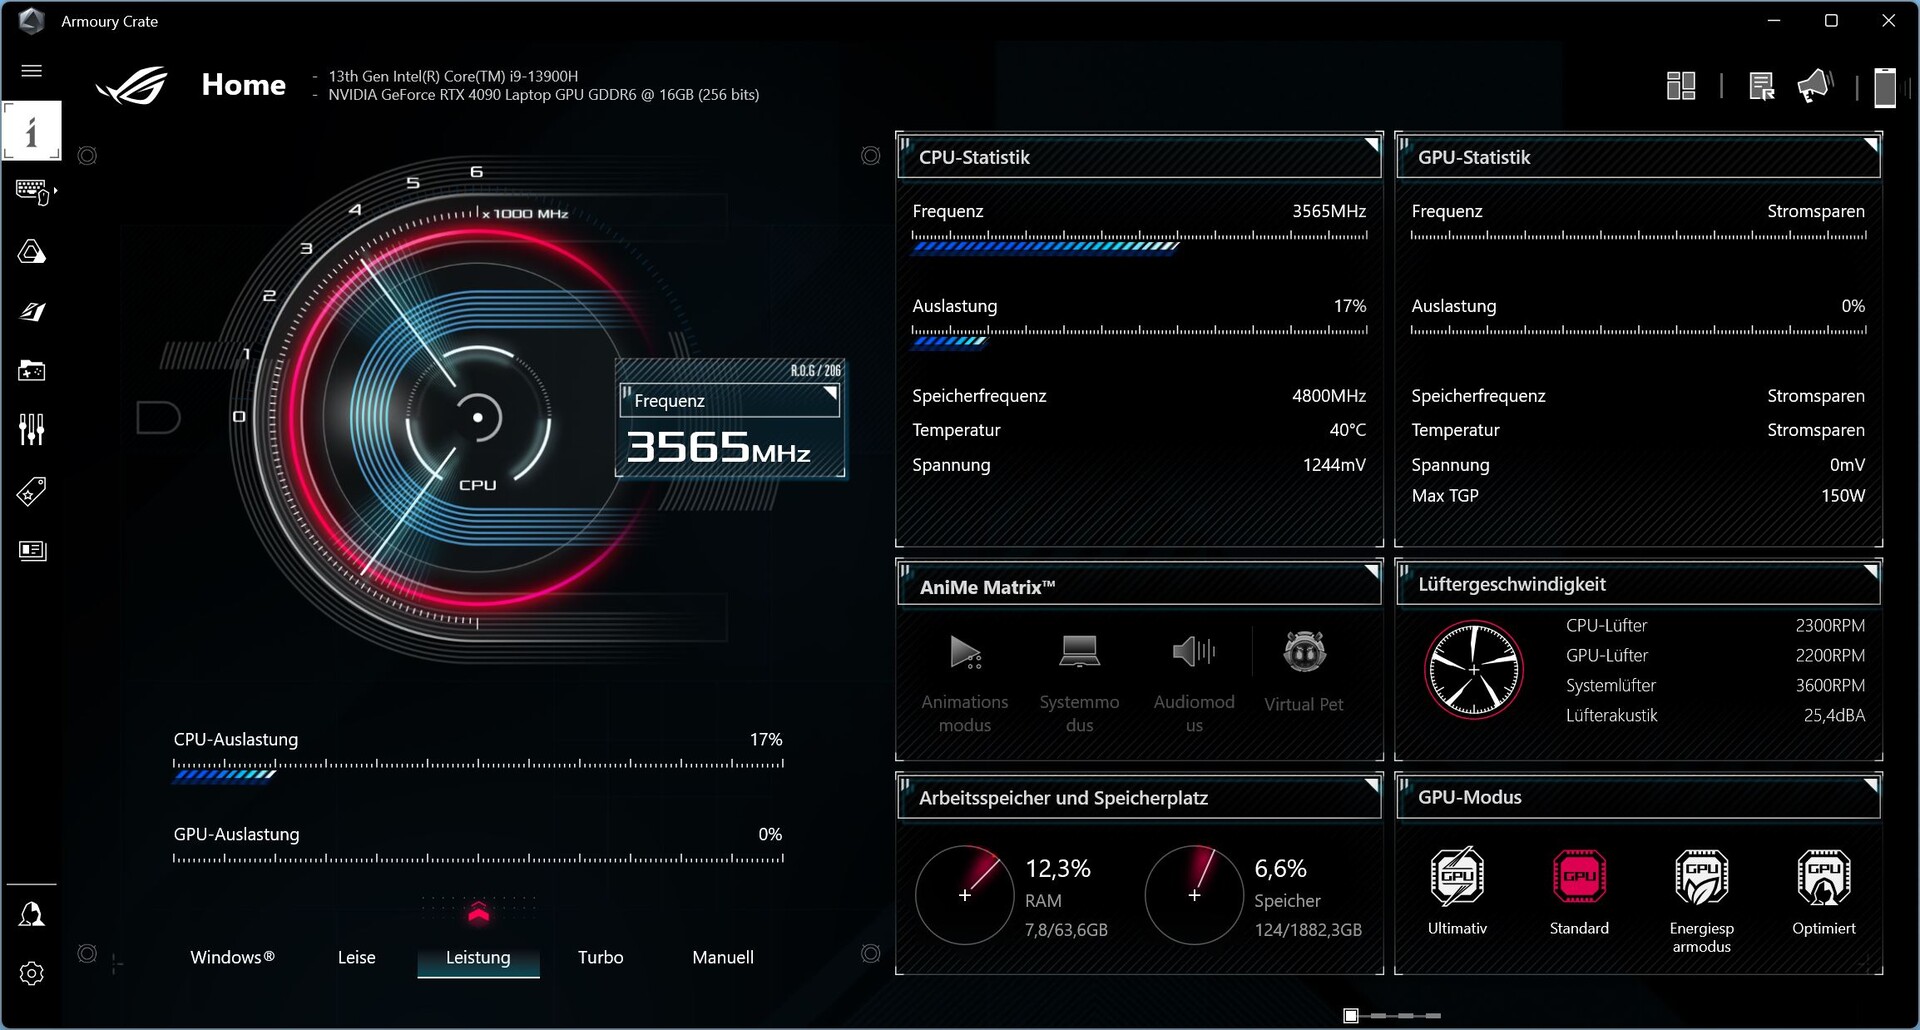
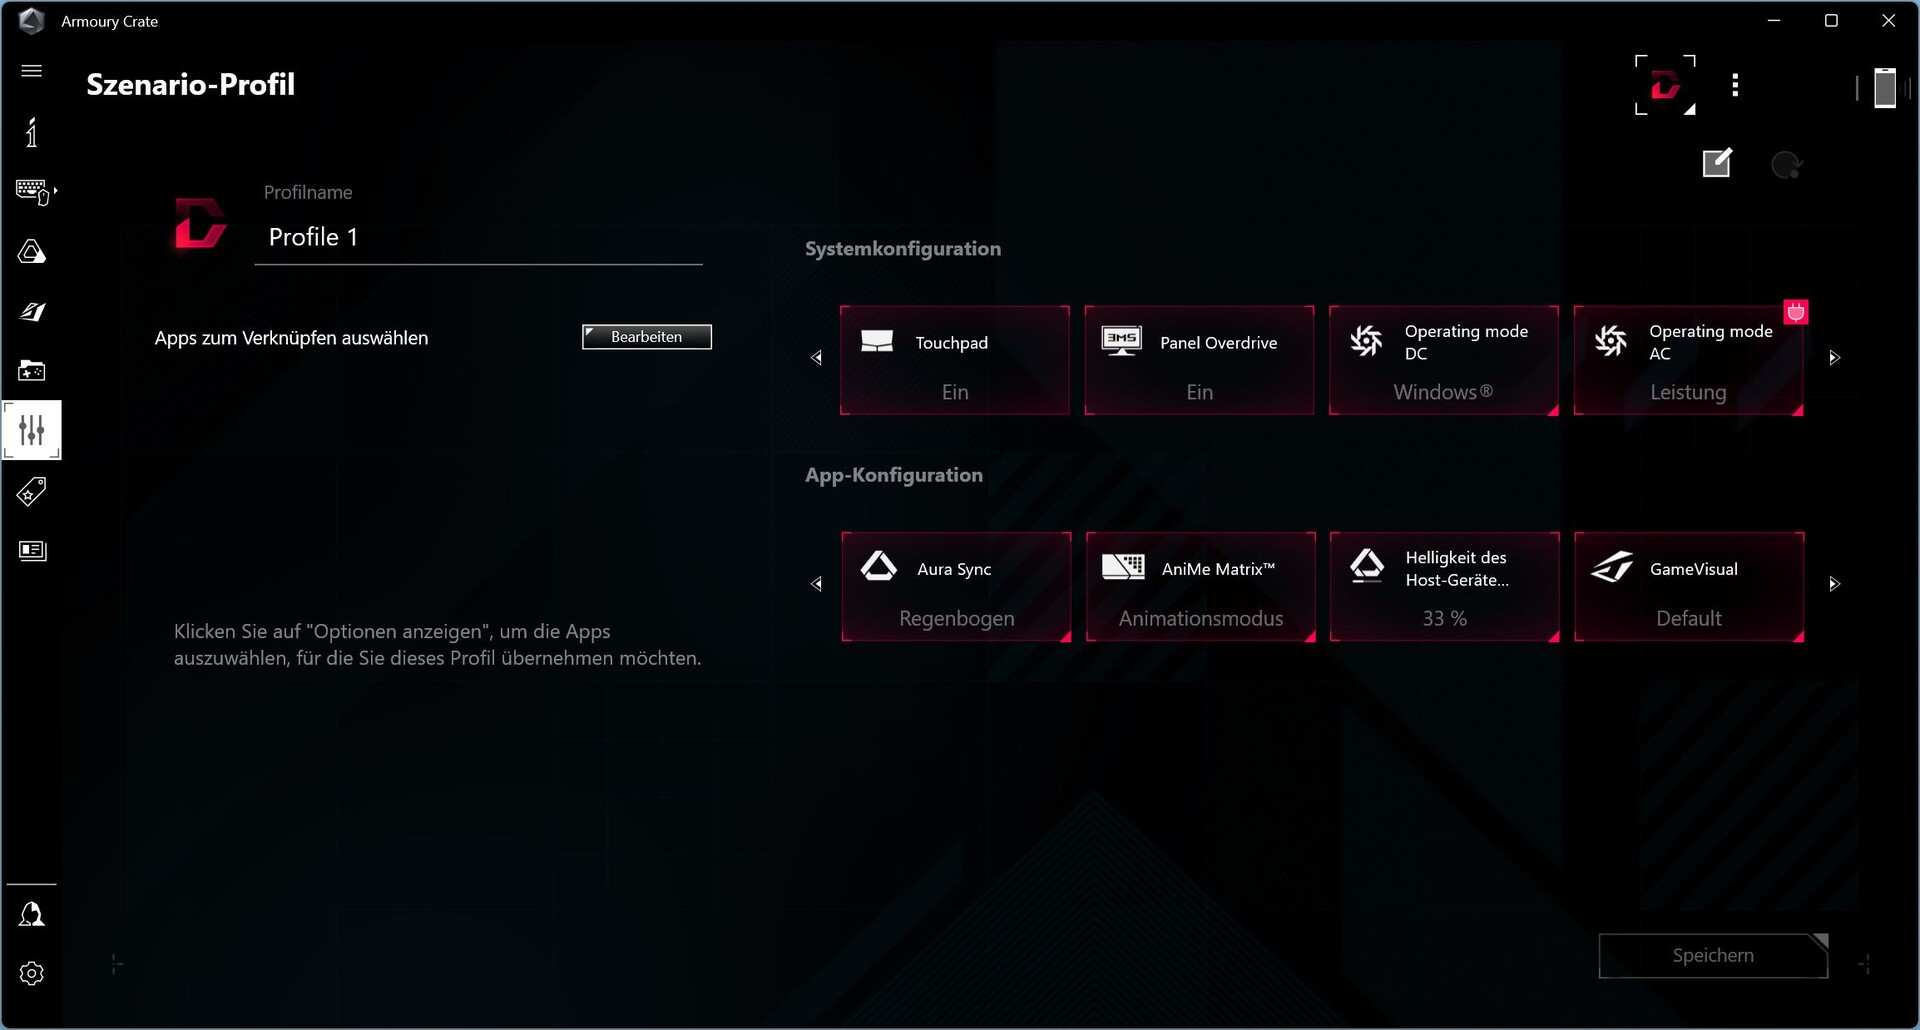
El centro de control de Asus para gamers es el software, Amoury Crate. Además de los diversos modos de rendimiento, aquí es donde se hacen todos los ajustes importantes y también donde se pueden personalizar cosas como la matriz AniMe y las curvas de ventilador.
Para nuestras pruebas de rendimiento, seleccionamos el modo Turbo en la aplicación con el fin de obtener los mejores resultados posibles. Su predecesor se probó con el modo Rendimiento debido a las elevadas emisiones de ruido de la generación anterior y es algo más parecido al modo Equilibrado.
Procesador
Hasta ahora, elCore i9-13900Hes la única opción de CPU y uno de los procesadores más potentes de la nueva serie Raptor Lake de Intel. Ofrece 6 núcleos P y 8 núcleos E, el primero a 5,4 GHz en turbo. La velocidad de reloj base del núcleo E es de 1,9 GHz.
En nuestro bucle Cinebench, el M16 superó a toda la competencia configurada con las CPU de última generación. Sin embargo, la diferencia es relativamente pequeña incluso cuando se compara con el significativamente menos potente i7-12700H que se encuentra en elHP Omen 16. La ventaja sobre su predecesor es igualmente pequeña con una puntuación en modo Rendimiento que probablemente sea casi idéntica.
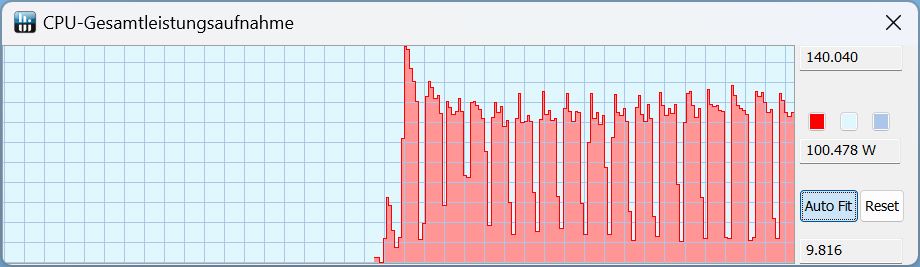
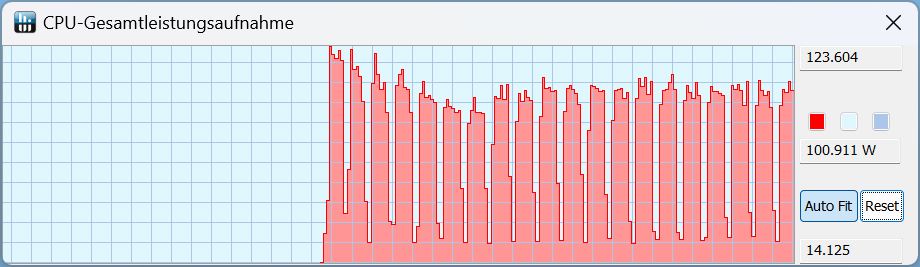
Echando un vistazo al TDP, la primera ejecución en modo Turbo alcanzó un pico de 140 vatios con las demás ejecuciones rondando los 100 vatios.
En modo Rendimiento, el pico inicial de 140 vatios bajó a unos 120 vatios, pero también aquí el TDP se sitúa normalmente en unos 100 vatios.
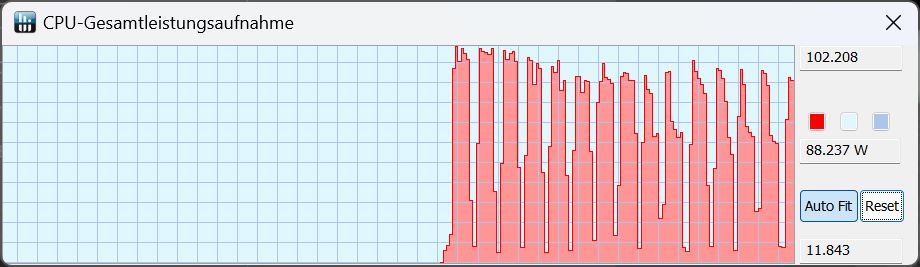
En modo silencioso, el pico desapareció y el TDP osciló entre 60 y un máximo de 100 vatios.
En modo batería, el rendimiento en el mismo modo(Quiet) es aún menor con un máximo de 34 vatios brevemente disponibles y sólo algo más de 20 vatios alcanzados durante periodos más largos de carga sostenida.
Cinebench R15 Multi Continuous
Cinebench R23: Multi Core | Single Core
Cinebench R20: CPU (Multi Core) | CPU (Single Core)
Cinebench R15: CPU Multi 64Bit | CPU Single 64Bit
Blender: v2.79 BMW27 CPU
7-Zip 18.03: 7z b 4 | 7z b 4 -mmt1
Geekbench 5.5: Multi-Core | Single-Core
HWBOT x265 Benchmark v2.2: 4k Preset
LibreOffice : 20 Documents To PDF
R Benchmark 2.5: Overall mean
| CPU Performance rating | |
| Schenker XMG Neo 16 Raptor Lake | |
| Media de la clase Gaming | |
| Asus ROG Zephyrus M16 GU604VY-NM042X | |
| MSI Creator Z16P B12UHST | |
| Lenovo Legion 5 Pro 16 G7 i7 RTX 3070Ti | |
| Asus ROG Zephyrus M16 GU603Z | |
| Acer Predator Triton 300 SE | |
| Medio Intel Core i9-13900H | |
| HP Omen 17-ck1075ng | |
| Razer Blade 15 RZ09-0421NGG3-R3G1 | |
| Cinebench R23 / Multi Core | |
| Schenker XMG Neo 16 Raptor Lake | |
| Schenker XMG Neo 16 Raptor Lake | |
| Schenker XMG Neo 16 Raptor Lake | |
| Media de la clase Gaming (10488 - 40970, n=110, últimos 2 años) | |
| Asus ROG Zephyrus M16 GU604VY-NM042X | |
| Lenovo Legion 5 Pro 16 G7 i7 RTX 3070Ti | |
| MSI Creator Z16P B12UHST | |
| Medio Intel Core i9-13900H (11997 - 20385, n=28) | |
| Razer Blade 15 RZ09-0421NGG3-R3G1 | |
| Acer Predator Triton 300 SE | |
| Asus ROG Zephyrus M16 GU603Z | |
| HP Omen 17-ck1075ng | |
| Cinebench R23 / Single Core | |
| Schenker XMG Neo 16 Raptor Lake | |
| Media de la clase Gaming (1166 - 2356, n=110, últimos 2 años) | |
| Asus ROG Zephyrus M16 GU604VY-NM042X | |
| MSI Creator Z16P B12UHST | |
| Acer Predator Triton 300 SE | |
| Medio Intel Core i9-13900H (1297 - 2054, n=26) | |
| Asus ROG Zephyrus M16 GU603Z | |
| Lenovo Legion 5 Pro 16 G7 i7 RTX 3070Ti | |
| HP Omen 17-ck1075ng | |
| Razer Blade 15 RZ09-0421NGG3-R3G1 | |
| Cinebench R20 / CPU (Multi Core) | |
| Schenker XMG Neo 16 Raptor Lake | |
| Media de la clase Gaming (4029 - 16108, n=109, últimos 2 años) | |
| Asus ROG Zephyrus M16 GU604VY-NM042X | |
| Lenovo Legion 5 Pro 16 G7 i7 RTX 3070Ti | |
| MSI Creator Z16P B12UHST | |
| Medio Intel Core i9-13900H (4935 - 7716, n=25) | |
| Razer Blade 15 RZ09-0421NGG3-R3G1 | |
| Acer Predator Triton 300 SE | |
| Asus ROG Zephyrus M16 GU603Z | |
| HP Omen 17-ck1075ng | |
| Cinebench R20 / CPU (Single Core) | |
| Media de la clase Gaming (442 - 895, n=109, últimos 2 años) | |
| Schenker XMG Neo 16 Raptor Lake | |
| Asus ROG Zephyrus M16 GU604VY-NM042X | |
| MSI Creator Z16P B12UHST | |
| Acer Predator Triton 300 SE | |
| Medio Intel Core i9-13900H (428 - 792, n=25) | |
| Asus ROG Zephyrus M16 GU603Z | |
| Lenovo Legion 5 Pro 16 G7 i7 RTX 3070Ti | |
| HP Omen 17-ck1075ng | |
| Razer Blade 15 RZ09-0421NGG3-R3G1 | |
| Cinebench R15 / CPU Multi 64Bit | |
| Schenker XMG Neo 16 Raptor Lake | |
| Schenker XMG Neo 16 Raptor Lake | |
| Media de la clase Gaming (1578 - 6271, n=109, últimos 2 años) | |
| Asus ROG Zephyrus M16 GU604VY-NM042X | |
| Lenovo Legion 5 Pro 16 G7 i7 RTX 3070Ti | |
| MSI Creator Z16P B12UHST | |
| Medio Intel Core i9-13900H (2061 - 3100, n=26) | |
| Razer Blade 15 RZ09-0421NGG3-R3G1 | |
| Asus ROG Zephyrus M16 GU603Z | |
| HP Omen 17-ck1075ng | |
| HP Omen 17-ck1075ng | |
| Acer Predator Triton 300 SE | |
| Cinebench R15 / CPU Single 64Bit | |
| Media de la clase Gaming (188.8 - 343, n=109, últimos 2 años) | |
| Schenker XMG Neo 16 Raptor Lake | |
| Schenker XMG Neo 16 Raptor Lake | |
| Asus ROG Zephyrus M16 GU604VY-NM042X | |
| MSI Creator Z16P B12UHST | |
| Acer Predator Triton 300 SE | |
| Medio Intel Core i9-13900H (211 - 297, n=26) | |
| Lenovo Legion 5 Pro 16 G7 i7 RTX 3070Ti | |
| Asus ROG Zephyrus M16 GU603Z | |
| HP Omen 17-ck1075ng | |
| HP Omen 17-ck1075ng | |
| Razer Blade 15 RZ09-0421NGG3-R3G1 | |
| Blender / v2.79 BMW27 CPU | |
| HP Omen 17-ck1075ng | |
| Razer Blade 15 RZ09-0421NGG3-R3G1 | |
| Medio Intel Core i9-13900H (166 - 268, n=24) | |
| Acer Predator Triton 300 SE | |
| Asus ROG Zephyrus M16 GU603Z | |
| MSI Creator Z16P B12UHST | |
| Lenovo Legion 5 Pro 16 G7 i7 RTX 3070Ti | |
| Asus ROG Zephyrus M16 GU604VY-NM042X | |
| Media de la clase Gaming (80 - 330, n=107, últimos 2 años) | |
| Schenker XMG Neo 16 Raptor Lake | |
| 7-Zip 18.03 / 7z b 4 | |
| Schenker XMG Neo 16 Raptor Lake | |
| Media de la clase Gaming (33491 - 148086, n=108, últimos 2 años) | |
| Asus ROG Zephyrus M16 GU604VY-NM042X | |
| MSI Creator Z16P B12UHST | |
| Lenovo Legion 5 Pro 16 G7 i7 RTX 3070Ti | |
| Medio Intel Core i9-13900H (45045 - 79032, n=25) | |
| Asus ROG Zephyrus M16 GU603Z | |
| Acer Predator Triton 300 SE | |
| Razer Blade 15 RZ09-0421NGG3-R3G1 | |
| HP Omen 17-ck1075ng | |
| 7-Zip 18.03 / 7z b 4 -mmt1 | |
| Schenker XMG Neo 16 Raptor Lake | |
| Media de la clase Gaming (4199 - 7436, n=108, últimos 2 años) | |
| Asus ROG Zephyrus M16 GU604VY-NM042X | |
| Asus ROG Zephyrus M16 GU603Z | |
| MSI Creator Z16P B12UHST | |
| Medio Intel Core i9-13900H (3665 - 6600, n=25) | |
| Lenovo Legion 5 Pro 16 G7 i7 RTX 3070Ti | |
| HP Omen 17-ck1075ng | |
| Acer Predator Triton 300 SE | |
| Razer Blade 15 RZ09-0421NGG3-R3G1 | |
| Geekbench 5.5 / Multi-Core | |
| Schenker XMG Neo 16 Raptor Lake | |
| Media de la clase Gaming (6460 - 27010, n=108, últimos 2 años) | |
| Asus ROG Zephyrus M16 GU604VY-NM042X | |
| MSI Creator Z16P B12UHST | |
| Lenovo Legion 5 Pro 16 G7 i7 RTX 3070Ti | |
| Acer Predator Triton 300 SE | |
| Asus ROG Zephyrus M16 GU603Z | |
| Medio Intel Core i9-13900H (9094 - 15410, n=26) | |
| Razer Blade 15 RZ09-0421NGG3-R3G1 | |
| HP Omen 17-ck1075ng | |
| Geekbench 5.5 / Single-Core | |
| Media de la clase Gaming (986 - 2474, n=108, últimos 2 años) | |
| Schenker XMG Neo 16 Raptor Lake | |
| Asus ROG Zephyrus M16 GU604VY-NM042X | |
| Medio Intel Core i9-13900H (1140 - 2043, n=26) | |
| MSI Creator Z16P B12UHST | |
| Acer Predator Triton 300 SE | |
| Asus ROG Zephyrus M16 GU603Z | |
| HP Omen 17-ck1075ng | |
| Lenovo Legion 5 Pro 16 G7 i7 RTX 3070Ti | |
| Razer Blade 15 RZ09-0421NGG3-R3G1 | |
| HWBOT x265 Benchmark v2.2 / 4k Preset | |
| Schenker XMG Neo 16 Raptor Lake | |
| Media de la clase Gaming (11.5 - 44.3, n=108, últimos 2 años) | |
| Asus ROG Zephyrus M16 GU604VY-NM042X | |
| Lenovo Legion 5 Pro 16 G7 i7 RTX 3070Ti | |
| MSI Creator Z16P B12UHST | |
| Asus ROG Zephyrus M16 GU603Z | |
| Acer Predator Triton 300 SE | |
| Medio Intel Core i9-13900H (14.1 - 22.3, n=25) | |
| Razer Blade 15 RZ09-0421NGG3-R3G1 | |
| HP Omen 17-ck1075ng | |
| LibreOffice / 20 Documents To PDF | |
| Razer Blade 15 RZ09-0421NGG3-R3G1 | |
| Asus ROG Zephyrus M16 GU604VY-NM042X | |
| Media de la clase Gaming (19 - 88.8, n=108, últimos 2 años) | |
| Medio Intel Core i9-13900H (34.4 - 82.8, n=25) | |
| Schenker XMG Neo 16 Raptor Lake | |
| HP Omen 17-ck1075ng | |
| Asus ROG Zephyrus M16 GU603Z | |
| Lenovo Legion 5 Pro 16 G7 i7 RTX 3070Ti | |
| Acer Predator Triton 300 SE | |
| MSI Creator Z16P B12UHST | |
| R Benchmark 2.5 / Overall mean | |
| Razer Blade 15 RZ09-0421NGG3-R3G1 | |
| HP Omen 17-ck1075ng | |
| Lenovo Legion 5 Pro 16 G7 i7 RTX 3070Ti | |
| Medio Intel Core i9-13900H (0.4052 - 0.723, n=25) | |
| Asus ROG Zephyrus M16 GU603Z | |
| MSI Creator Z16P B12UHST | |
| Media de la clase Gaming (0.3439 - 0.759, n=109, últimos 2 años) | |
| Acer Predator Triton 300 SE | |
| Asus ROG Zephyrus M16 GU604VY-NM042X | |
| Schenker XMG Neo 16 Raptor Lake | |
* ... más pequeño es mejor
AIDA64: FP32 Ray-Trace | FPU Julia | CPU SHA3 | CPU Queen | FPU SinJulia | FPU Mandel | CPU AES | CPU ZLib | FP64 Ray-Trace | CPU PhotoWorxx
| Performance rating | |
| MSI Titan GT77 HX 13VI | |
| Asus ROG Strix Scar 18 2023 G834JY-N6005W | |
| Lenovo Legion Pro 7 16IRX8H | |
| Media de la clase Gaming | |
| Razer Blade 16 Early 2023 | |
| Asus ROG Zephyrus M16 GU604VY-NM042X | |
| Asus ROG Zephyrus M16 GU603Z | |
| Medio Intel Core i9-13900H | |
| AIDA64 / FP32 Ray-Trace | |
| Media de la clase Gaming (10227 - 85542, n=107, últimos 2 años) | |
| MSI Titan GT77 HX 13VI | |
| Asus ROG Strix Scar 18 2023 G834JY-N6005W | |
| Lenovo Legion Pro 7 16IRX8H | |
| Razer Blade 16 Early 2023 | |
| Razer Blade 16 Early 2023 | |
| Razer Blade 16 Early 2023 | |
| Asus ROG Zephyrus M16 GU604VY-NM042X | |
| Asus ROG Zephyrus M16 GU603Z | |
| Medio Intel Core i9-13900H (6788 - 19557, n=25) | |
| AIDA64 / FPU Julia | |
| MSI Titan GT77 HX 13VI | |
| Asus ROG Strix Scar 18 2023 G834JY-N6005W | |
| Media de la clase Gaming (51376 - 238426, n=107, últimos 2 años) | |
| Lenovo Legion Pro 7 16IRX8H | |
| Razer Blade 16 Early 2023 | |
| Razer Blade 16 Early 2023 | |
| Razer Blade 16 Early 2023 | |
| Asus ROG Zephyrus M16 GU604VY-NM042X | |
| Medio Intel Core i9-13900H (22551 - 95579, n=25) | |
| Asus ROG Zephyrus M16 GU603Z | |
| AIDA64 / CPU SHA3 | |
| MSI Titan GT77 HX 13VI | |
| Asus ROG Strix Scar 18 2023 G834JY-N6005W | |
| Lenovo Legion Pro 7 16IRX8H | |
| Razer Blade 16 Early 2023 | |
| Razer Blade 16 Early 2023 | |
| Razer Blade 16 Early 2023 | |
| Media de la clase Gaming (2180 - 9817, n=107, últimos 2 años) | |
| Asus ROG Zephyrus M16 GU604VY-NM042X | |
| Medio Intel Core i9-13900H (2491 - 4270, n=25) | |
| Asus ROG Zephyrus M16 GU603Z | |
| AIDA64 / CPU Queen | |
| Asus ROG Strix Scar 18 2023 G834JY-N6005W | |
| MSI Titan GT77 HX 13VI | |
| Razer Blade 16 Early 2023 | |
| Razer Blade 16 Early 2023 | |
| Lenovo Legion Pro 7 16IRX8H | |
| Asus ROG Zephyrus M16 GU604VY-NM042X | |
| Media de la clase Gaming (49785 - 173351, n=98, últimos 2 años) | |
| Asus ROG Zephyrus M16 GU603Z | |
| Medio Intel Core i9-13900H (65121 - 120936, n=25) | |
| AIDA64 / FPU SinJulia | |
| Asus ROG Strix Scar 18 2023 G834JY-N6005W | |
| MSI Titan GT77 HX 13VI | |
| Razer Blade 16 Early 2023 | |
| Razer Blade 16 Early 2023 | |
| Razer Blade 16 Early 2023 | |
| Lenovo Legion Pro 7 16IRX8H | |
| Media de la clase Gaming (4424 - 33636, n=107, últimos 2 años) | |
| Asus ROG Zephyrus M16 GU604VY-NM042X | |
| Medio Intel Core i9-13900H (6108 - 11631, n=25) | |
| Asus ROG Zephyrus M16 GU603Z | |
| AIDA64 / FPU Mandel | |
| Media de la clase Gaming (25115 - 128721, n=107, últimos 2 años) | |
| MSI Titan GT77 HX 13VI | |
| Asus ROG Strix Scar 18 2023 G834JY-N6005W | |
| Lenovo Legion Pro 7 16IRX8H | |
| Razer Blade 16 Early 2023 | |
| Razer Blade 16 Early 2023 | |
| Razer Blade 16 Early 2023 | |
| Asus ROG Zephyrus M16 GU604VY-NM042X | |
| Medio Intel Core i9-13900H (11283 - 48474, n=25) | |
| Asus ROG Zephyrus M16 GU603Z | |
| AIDA64 / CPU AES | |
| Razer Blade 16 Early 2023 | |
| Razer Blade 16 Early 2023 | |
| Razer Blade 16 Early 2023 | |
| MSI Titan GT77 HX 13VI | |
| Asus ROG Strix Scar 18 2023 G834JY-N6005W | |
| Asus ROG Zephyrus M16 GU603Z | |
| Lenovo Legion Pro 7 16IRX8H | |
| Media de la clase Gaming (39258 - 247074, n=107, últimos 2 años) | |
| Medio Intel Core i9-13900H (3691 - 149377, n=25) | |
| Asus ROG Zephyrus M16 GU604VY-NM042X | |
| AIDA64 / CPU ZLib | |
| MSI Titan GT77 HX 13VI | |
| Asus ROG Strix Scar 18 2023 G834JY-N6005W | |
| Lenovo Legion Pro 7 16IRX8H | |
| Razer Blade 16 Early 2023 | |
| Razer Blade 16 Early 2023 | |
| Razer Blade 16 Early 2023 | |
| Media de la clase Gaming (574 - 2531, n=107, últimos 2 años) | |
| Asus ROG Zephyrus M16 GU604VY-NM042X | |
| Medio Intel Core i9-13900H (789 - 1254, n=25) | |
| Asus ROG Zephyrus M16 GU603Z | |
| AIDA64 / FP64 Ray-Trace | |
| Media de la clase Gaming (5509 - 45446, n=107, últimos 2 años) | |
| MSI Titan GT77 HX 13VI | |
| Asus ROG Strix Scar 18 2023 G834JY-N6005W | |
| Lenovo Legion Pro 7 16IRX8H | |
| Razer Blade 16 Early 2023 | |
| Razer Blade 16 Early 2023 | |
| Razer Blade 16 Early 2023 | |
| Asus ROG Zephyrus M16 GU604VY-NM042X | |
| Asus ROG Zephyrus M16 GU603Z | |
| Medio Intel Core i9-13900H (3655 - 10716, n=25) | |
| AIDA64 / CPU PhotoWorxx | |
| Razer Blade 16 Early 2023 | |
| Razer Blade 16 Early 2023 | |
| Razer Blade 16 Early 2023 | |
| Lenovo Legion Pro 7 16IRX8H | |
| Asus ROG Zephyrus M16 GU604VY-NM042X | |
| Media de la clase Gaming (12271 - 89891, n=107, últimos 2 años) | |
| Asus ROG Strix Scar 18 2023 G834JY-N6005W | |
| Asus ROG Zephyrus M16 GU603Z | |
| MSI Titan GT77 HX 13VI | |
| Medio Intel Core i9-13900H (10871 - 50488, n=25) | |
Rendimiento del sistema
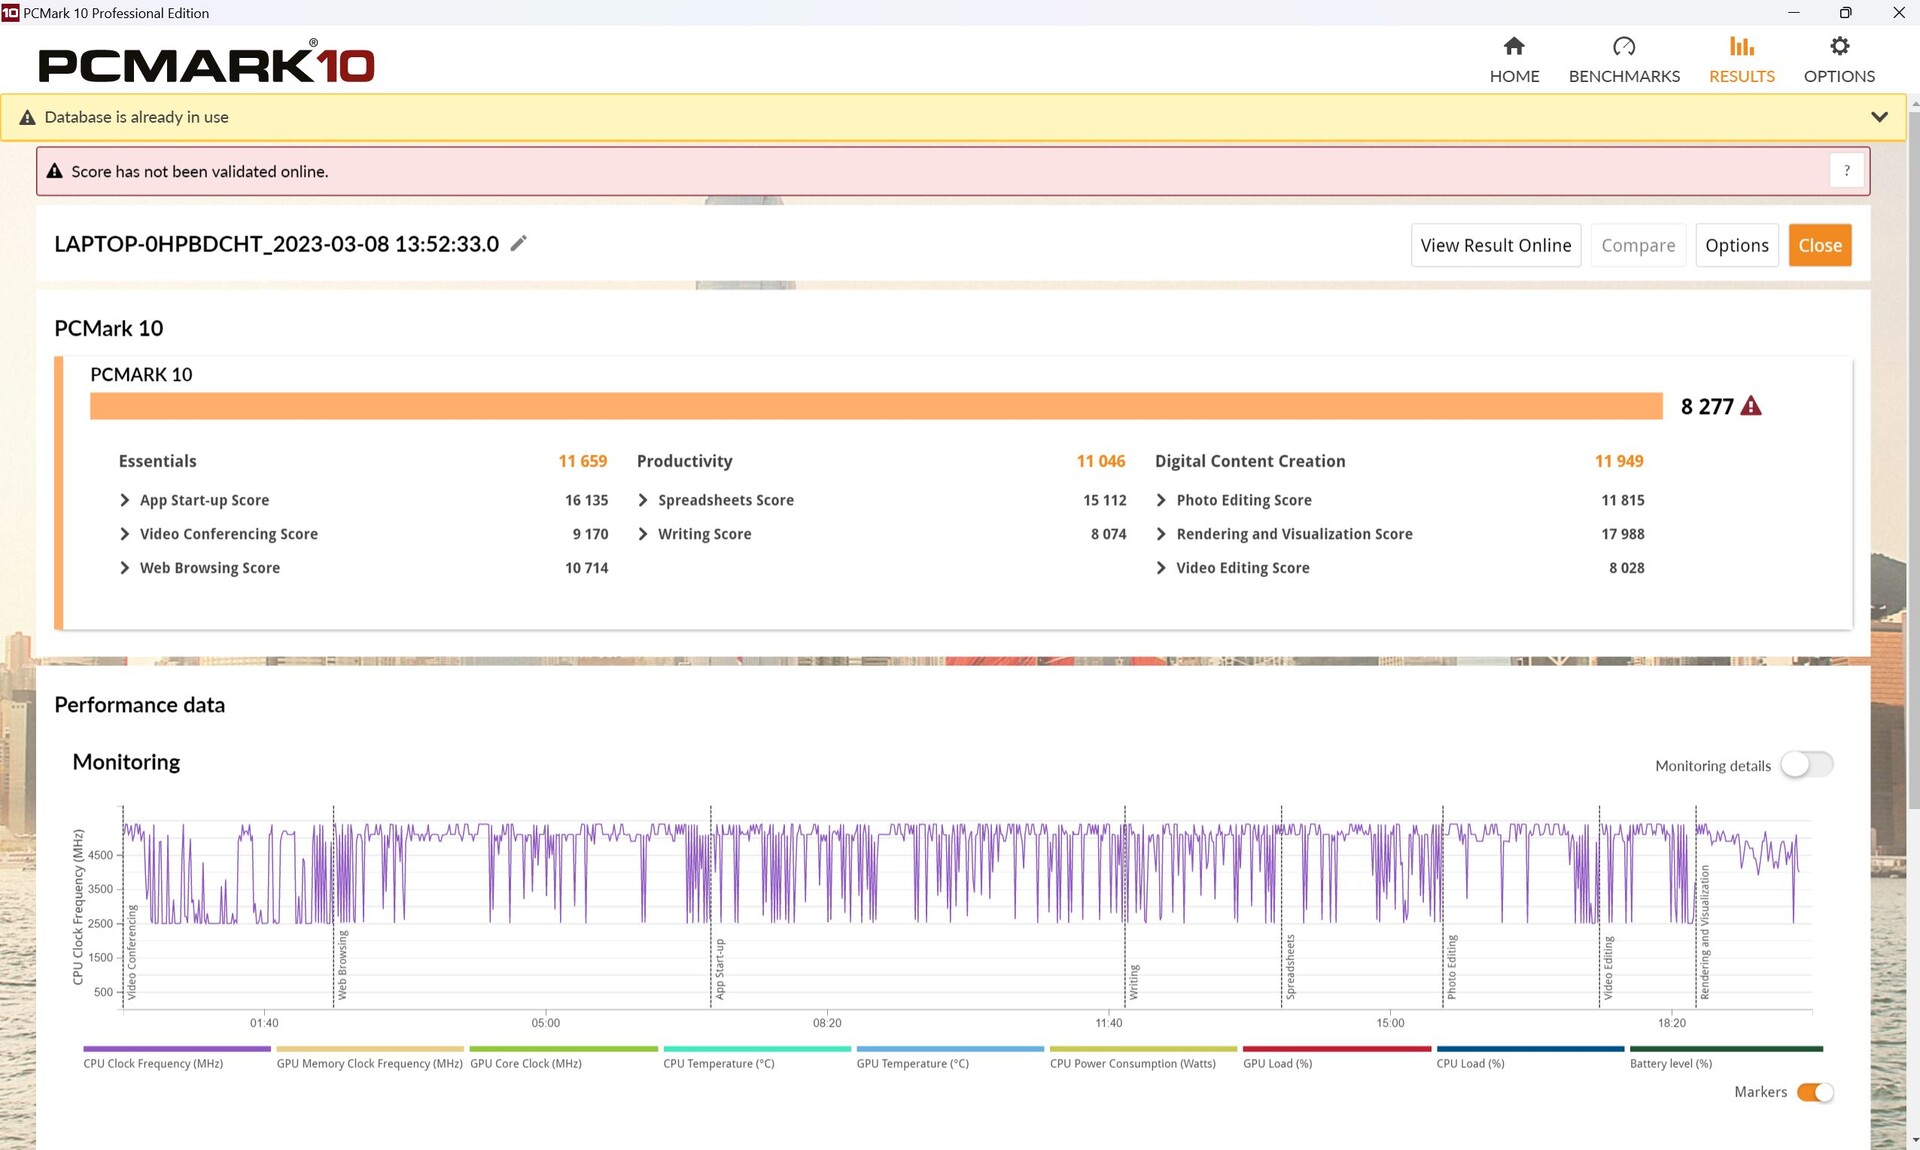
Nuestro M16 no mostró grandes debilidades en PCMark10, pero tampoco se le puede acusar exactamente de superar a la competencia de última generación. ElLegion 7 es en realidad unos puntos porcentuales más rápido. En la prueba de creación de contenidos digitales, las puntuaciones son algo decepcionantes, especialmente en las áreas de edición y renderizado.
CrossMark: Overall | Productivity | Creativity | Responsiveness
| PCMark 10 / Score | |
| Lenovo Legion 7 16IAX7-82TD004SGE | |
| Media de la clase Gaming (5828 - 11574, n=95, últimos 2 años) | |
| Asus ROG Zephyrus M16 GU604VY-NM042X | |
| Alienware x17 R2 P48E | |
| Medio Intel Core i9-13900H, NVIDIA GeForce RTX 4090 Laptop GPU (7985 - 8277, n=2) | |
| MSI Creator Z16P B12UHST | |
| Acer Predator Triton 500 SE PT516-52s-70KX | |
| Alienware x15 R2 P111F | |
| Asus ROG Zephyrus Duo 16 GX650RX | |
| PCMark 10 / Essentials | |
| Asus ROG Zephyrus M16 GU604VY-NM042X | |
| Medio Intel Core i9-13900H, NVIDIA GeForce RTX 4090 Laptop GPU (11500 - 11659, n=2) | |
| Alienware x17 R2 P48E | |
| Lenovo Legion 7 16IAX7-82TD004SGE | |
| Alienware x15 R2 P111F | |
| MSI Creator Z16P B12UHST | |
| Acer Predator Triton 500 SE PT516-52s-70KX | |
| Media de la clase Gaming (8810 - 12600, n=99, últimos 2 años) | |
| Asus ROG Zephyrus Duo 16 GX650RX | |
| PCMark 10 / Productivity | |
| MSI Creator Z16P B12UHST | |
| Asus ROG Zephyrus M16 GU604VY-NM042X | |
| Lenovo Legion 7 16IAX7-82TD004SGE | |
| Medio Intel Core i9-13900H, NVIDIA GeForce RTX 4090 Laptop GPU (10526 - 11046, n=2) | |
| Media de la clase Gaming (6845 - 18766, n=97, últimos 2 años) | |
| Alienware x15 R2 P111F | |
| Alienware x17 R2 P48E | |
| Acer Predator Triton 500 SE PT516-52s-70KX | |
| Asus ROG Zephyrus Duo 16 GX650RX | |
| PCMark 10 / Digital Content Creation | |
| Lenovo Legion 7 16IAX7-82TD004SGE | |
| Media de la clase Gaming (7602 - 19657, n=97, últimos 2 años) | |
| Alienware x17 R2 P48E | |
| Asus ROG Zephyrus M16 GU604VY-NM042X | |
| Medio Intel Core i9-13900H, NVIDIA GeForce RTX 4090 Laptop GPU (11412 - 11949, n=2) | |
| MSI Creator Z16P B12UHST | |
| Acer Predator Triton 500 SE PT516-52s-70KX | |
| Alienware x15 R2 P111F | |
| Asus ROG Zephyrus Duo 16 GX650RX | |
| CrossMark / Overall | |
| Lenovo Legion 7 16IAX7-82TD004SGE | |
| Schenker XMG Neo 16 Raptor Lake | |
| Media de la clase Gaming (1366 - 2409, n=96, últimos 2 años) | |
| Asus ROG Zephyrus M16 GU604VY-NM042X | |
| Medio Intel Core i9-13900H, NVIDIA GeForce RTX 4090 Laptop GPU (n=1) | |
| Alienware x15 R2 P111F | |
| Alienware x17 R2 P48E | |
| Acer Predator Triton 500 SE PT516-52s-70KX | |
| Asus ROG Zephyrus Duo 16 GX650RX | |
| Razer Blade 15 RZ09-0421NGG3-R3G1 | |
| CrossMark / Productivity | |
| Lenovo Legion 7 16IAX7-82TD004SGE | |
| Alienware x15 R2 P111F | |
| Media de la clase Gaming (1386 - 2254, n=96, últimos 2 años) | |
| Asus ROG Zephyrus M16 GU604VY-NM042X | |
| Medio Intel Core i9-13900H, NVIDIA GeForce RTX 4090 Laptop GPU (n=1) | |
| Schenker XMG Neo 16 Raptor Lake | |
| Alienware x17 R2 P48E | |
| Acer Predator Triton 500 SE PT516-52s-70KX | |
| Asus ROG Zephyrus Duo 16 GX650RX | |
| Razer Blade 15 RZ09-0421NGG3-R3G1 | |
| CrossMark / Creativity | |
| Schenker XMG Neo 16 Raptor Lake | |
| Lenovo Legion 7 16IAX7-82TD004SGE | |
| Asus ROG Zephyrus M16 GU604VY-NM042X | |
| Medio Intel Core i9-13900H, NVIDIA GeForce RTX 4090 Laptop GPU (n=1) | |
| Media de la clase Gaming (1343 - 2729, n=96, últimos 2 años) | |
| Alienware x15 R2 P111F | |
| Alienware x17 R2 P48E | |
| Acer Predator Triton 500 SE PT516-52s-70KX | |
| Razer Blade 15 RZ09-0421NGG3-R3G1 | |
| Asus ROG Zephyrus Duo 16 GX650RX | |
| CrossMark / Responsiveness | |
| Lenovo Legion 7 16IAX7-82TD004SGE | |
| Acer Predator Triton 500 SE PT516-52s-70KX | |
| Alienware x15 R2 P111F | |
| Asus ROG Zephyrus Duo 16 GX650RX | |
| Media de la clase Gaming (1226 - 2334, n=96, últimos 2 años) | |
| Alienware x17 R2 P48E | |
| Asus ROG Zephyrus M16 GU604VY-NM042X | |
| Medio Intel Core i9-13900H, NVIDIA GeForce RTX 4090 Laptop GPU (n=1) | |
| Schenker XMG Neo 16 Raptor Lake | |
| Razer Blade 15 RZ09-0421NGG3-R3G1 | |
| PCMark 10 Score | 8277 puntos | |
ayuda | ||
| AIDA64 / Memory Copy | |
| Razer Blade 16 Early 2023 | |
| Razer Blade 16 Early 2023 | |
| Razer Blade 16 Early 2023 | |
| Lenovo Legion Pro 7 16IRX8H | |
| Media de la clase Gaming (21750 - 129946, n=107, últimos 2 años) | |
| Asus ROG Zephyrus M16 GU604VY-NM042X | |
| Asus ROG Strix Scar 18 2023 G834JY-N6005W | |
| MSI Titan GT77 HX 13VI | |
| Asus ROG Zephyrus M16 GU603Z | |
| Medio Intel Core i9-13900H (37448 - 74486, n=25) | |
| AIDA64 / Memory Read | |
| Razer Blade 16 Early 2023 | |
| Razer Blade 16 Early 2023 | |
| Razer Blade 16 Early 2023 | |
| Lenovo Legion Pro 7 16IRX8H | |
| Asus ROG Strix Scar 18 2023 G834JY-N6005W | |
| Media de la clase Gaming (22956 - 118858, n=107, últimos 2 años) | |
| Asus ROG Zephyrus M16 GU604VY-NM042X | |
| Asus ROG Zephyrus M16 GU603Z | |
| MSI Titan GT77 HX 13VI | |
| Medio Intel Core i9-13900H (41599 - 75433, n=25) | |
| AIDA64 / Memory Write | |
| Razer Blade 16 Early 2023 | |
| Razer Blade 16 Early 2023 | |
| Razer Blade 16 Early 2023 | |
| Media de la clase Gaming (22297 - 135096, n=107, últimos 2 años) | |
| Asus ROG Zephyrus M16 GU604VY-NM042X | |
| Lenovo Legion Pro 7 16IRX8H | |
| Asus ROG Strix Scar 18 2023 G834JY-N6005W | |
| Asus ROG Zephyrus M16 GU603Z | |
| Medio Intel Core i9-13900H (36152 - 88505, n=25) | |
| MSI Titan GT77 HX 13VI | |
| AIDA64 / Memory Latency | |
| Media de la clase Gaming (75.3 - 259, n=107, últimos 2 años) | |
| Razer Blade 16 Early 2023 | |
| Razer Blade 16 Early 2023 | |
| Razer Blade 16 Early 2023 | |
| MSI Titan GT77 HX 13VI | |
| Asus ROG Strix Scar 18 2023 G834JY-N6005W | |
| Medio Intel Core i9-13900H (75.8 - 102.3, n=25) | |
| Asus ROG Zephyrus M16 GU603Z | |
| Asus ROG Zephyrus M16 GU604VY-NM042X | |
| Lenovo Legion Pro 7 16IRX8H | |
* ... más pequeño es mejor
Latencias del CPD
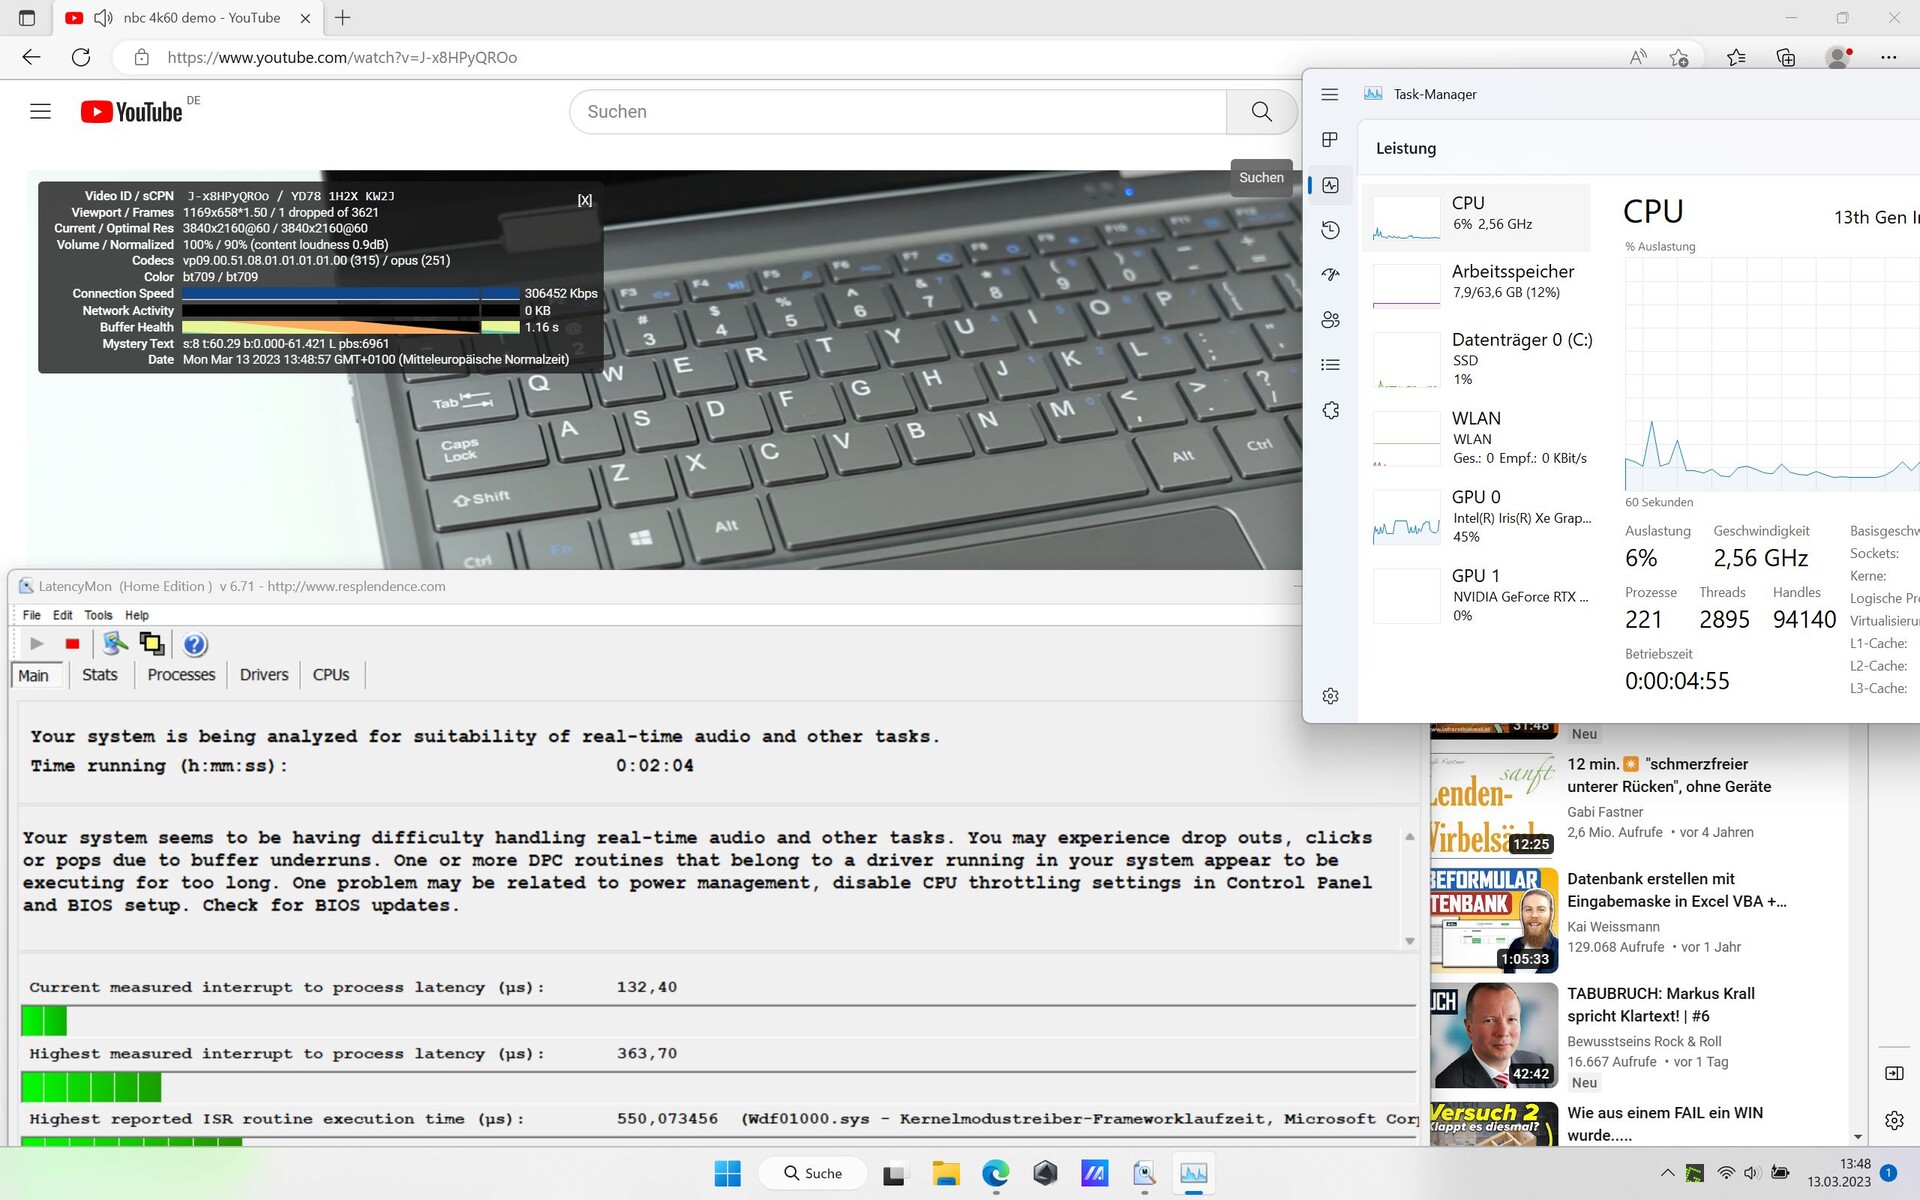
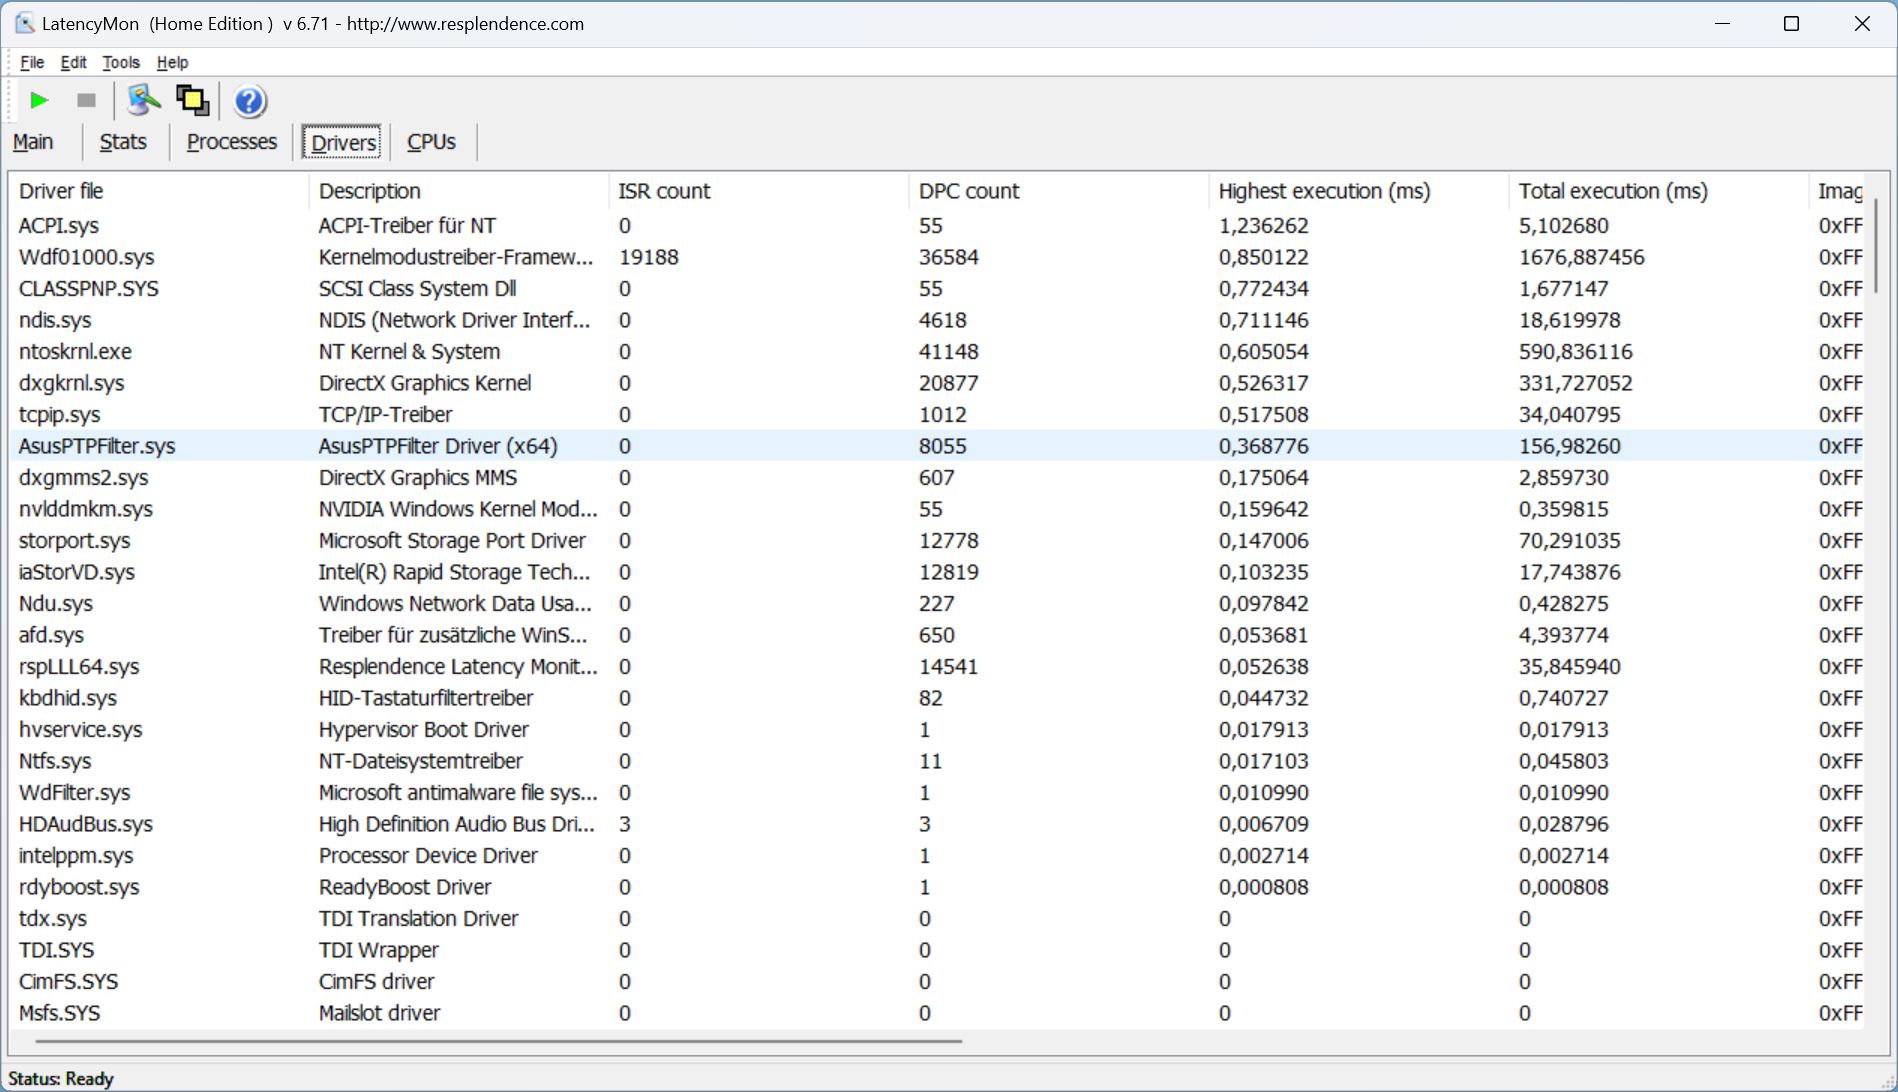
El M16 no se inmuta al abrir varias pestañas del navegador. Todo parecía ir bien hasta que aparecieron grandes latencias durante la reproducción de nuestros vídeos 4k/60 fps de YouTube y posteriormente en Prime95. Lo que hasta entonces habían sido buenos valores, se dispararon varias veces.
De este modo, el M16 tiene latencias significativamente más altas que la competencia de última generación. Los drivers de la nueva generación no parecen estar lo suficientemente maduros y esto queda demostrado por los valores de latencias igualmente altos que se ven en laMSI Titan.

| DPC Latencies / LatencyMon - interrupt to process latency (max), Web, Youtube, Prime95 | |
| MSI Titan GT77 HX 13VI | |
| Asus ROG Zephyrus M16 GU604VY-NM042X | |
| Razer Blade 16 Early 2023 | |
| Asus ROG Strix Scar 18 2023 G834JY-N6005W | |
| Asus ROG Zephyrus M16 GU603Z | |
| Lenovo Legion Pro 7 16IRX8H | |
* ... más pequeño es mejor
Almacenamiento masivo
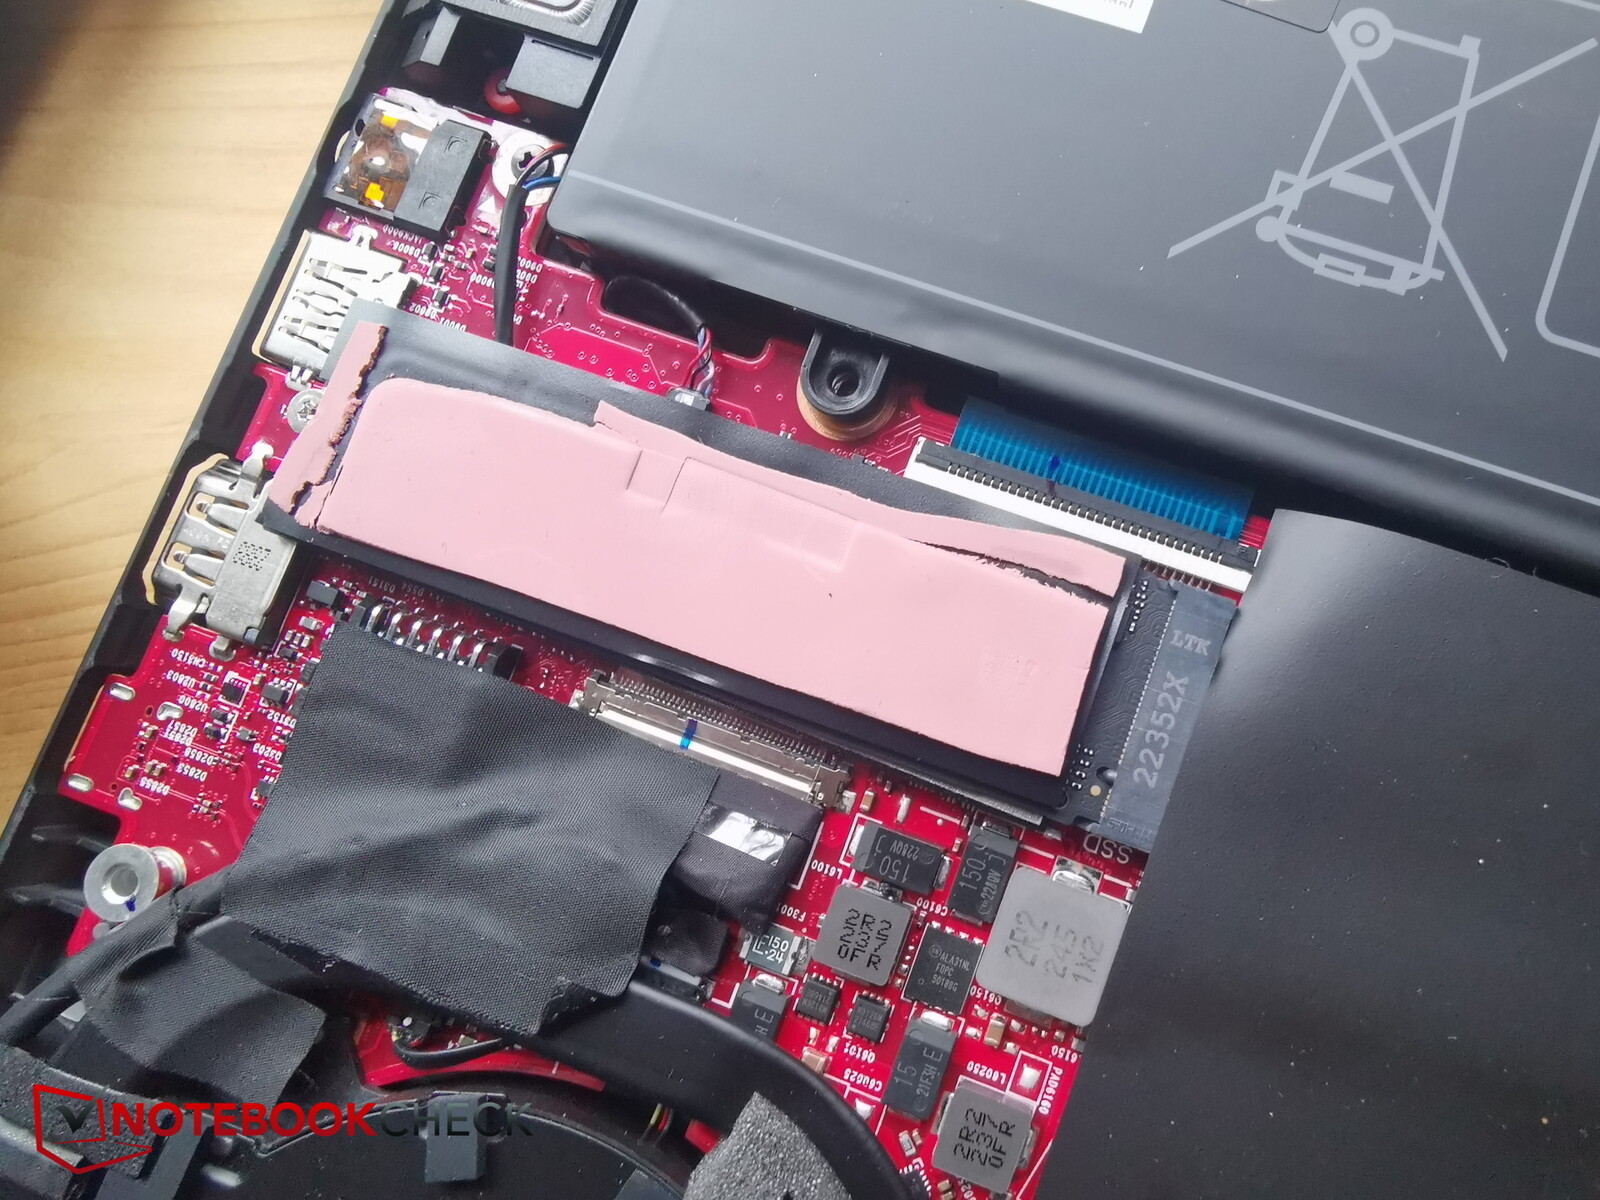
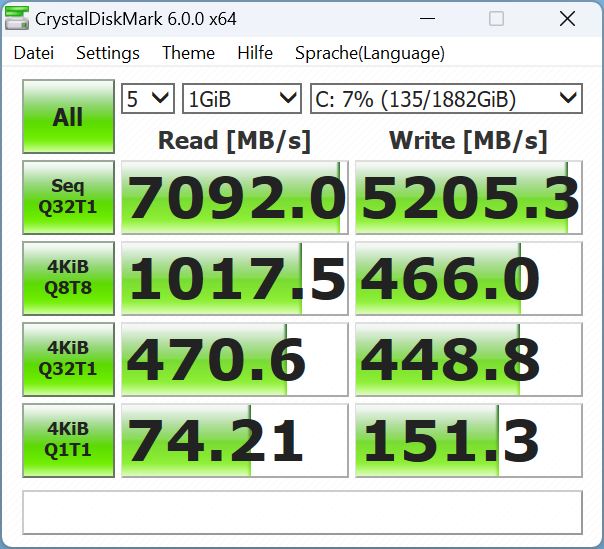
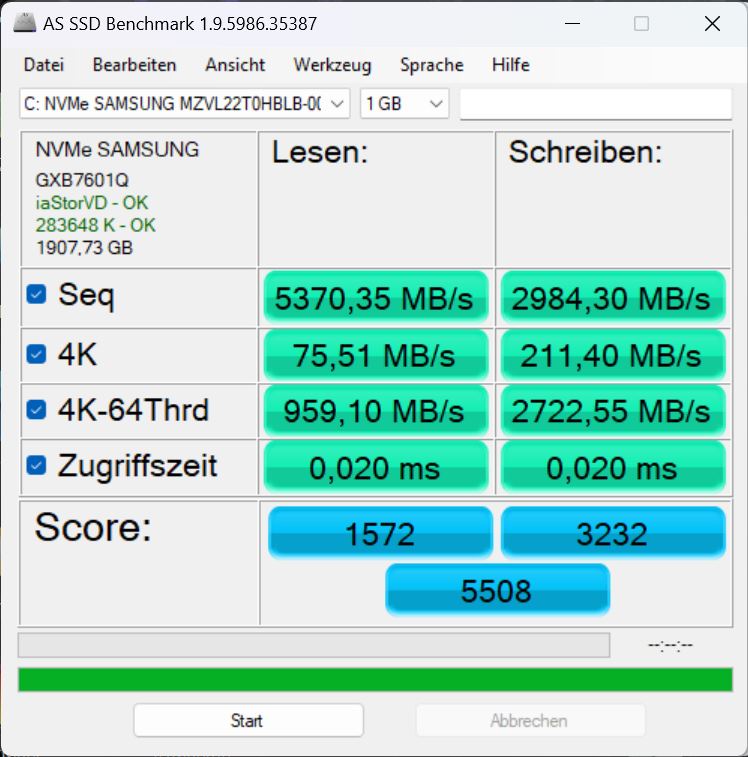
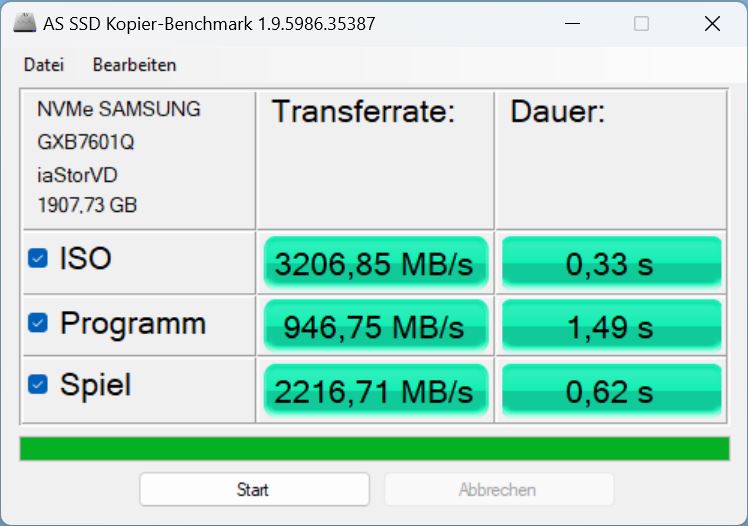
Nuestra configuración cuenta con un SSD NVMe Samsung PM9A1 con cuatro carriles PCIe 4 y una capacidad de 2 TB y se sitúa en el puesto 11 de nuestra lista de mejores SSD.
El rendimiento SSD del M16 está alrededor de un 20% por debajo de lo que se puede esperar para este tipo de SSD. Sin embargo, en el uso real, esto pasará desapercibido y, en el lado positivo, el rendimiento es estable durante largos periodos de tiempo.

* ... más pequeño es mejor
Continuous performance Read: DiskSpd Read Loop, Queue Depth 8
Tarjeta gráfica
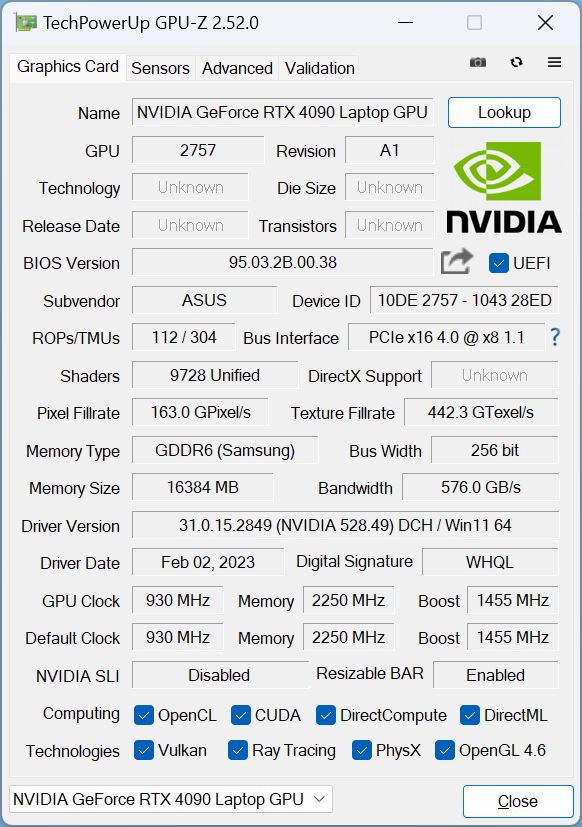
Con la nueva M16, puede elegir entre la RTX 4070, RTX 4080y RTX 4090. En nuestra configuración, el modelo superior es la GPU de portátil más rápida disponible actualmente, con un consumo que varía entre 80 y 150 vatios más 15 vatios de boost dinámico. La M16 puede consumir un máximo de 150 vatios, incluidos los 25 vatios de aumento dinámico.
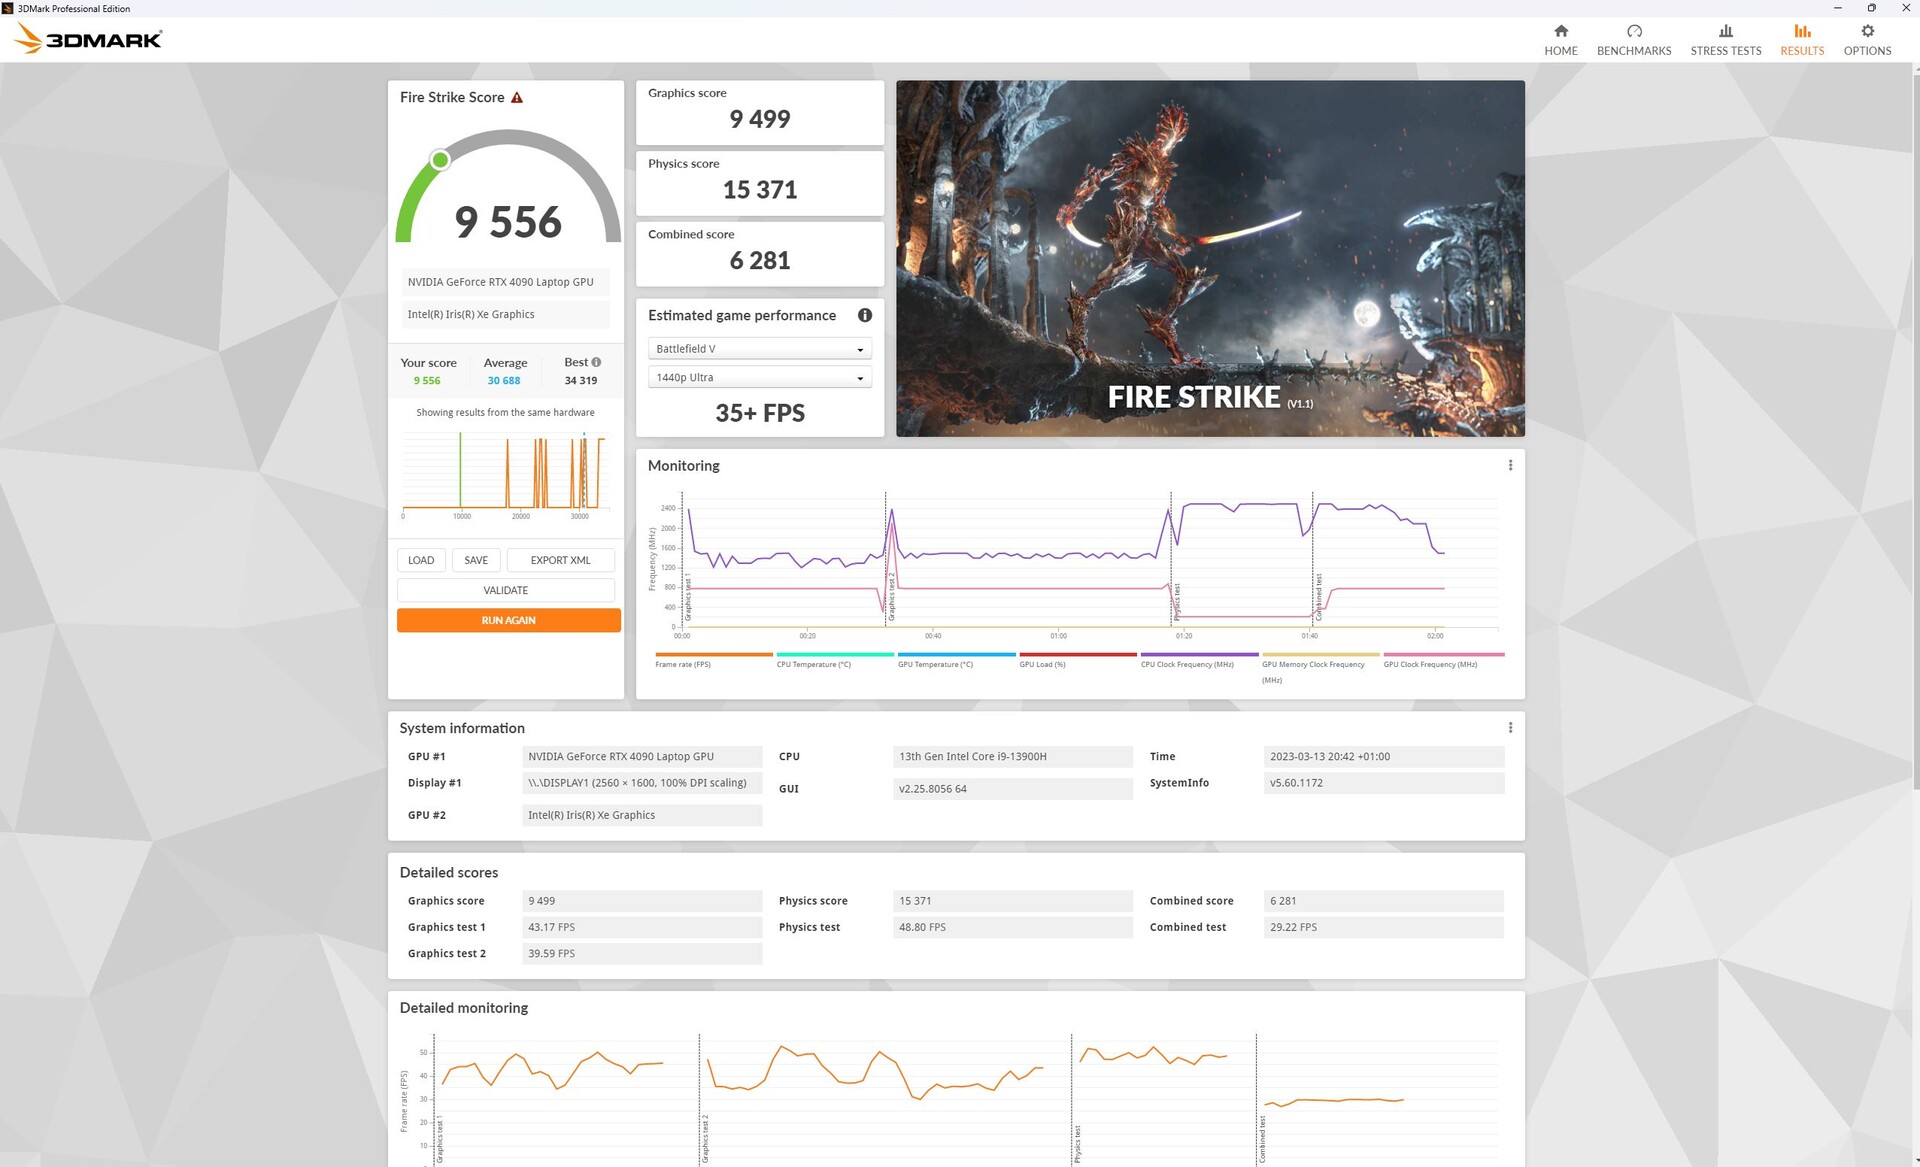
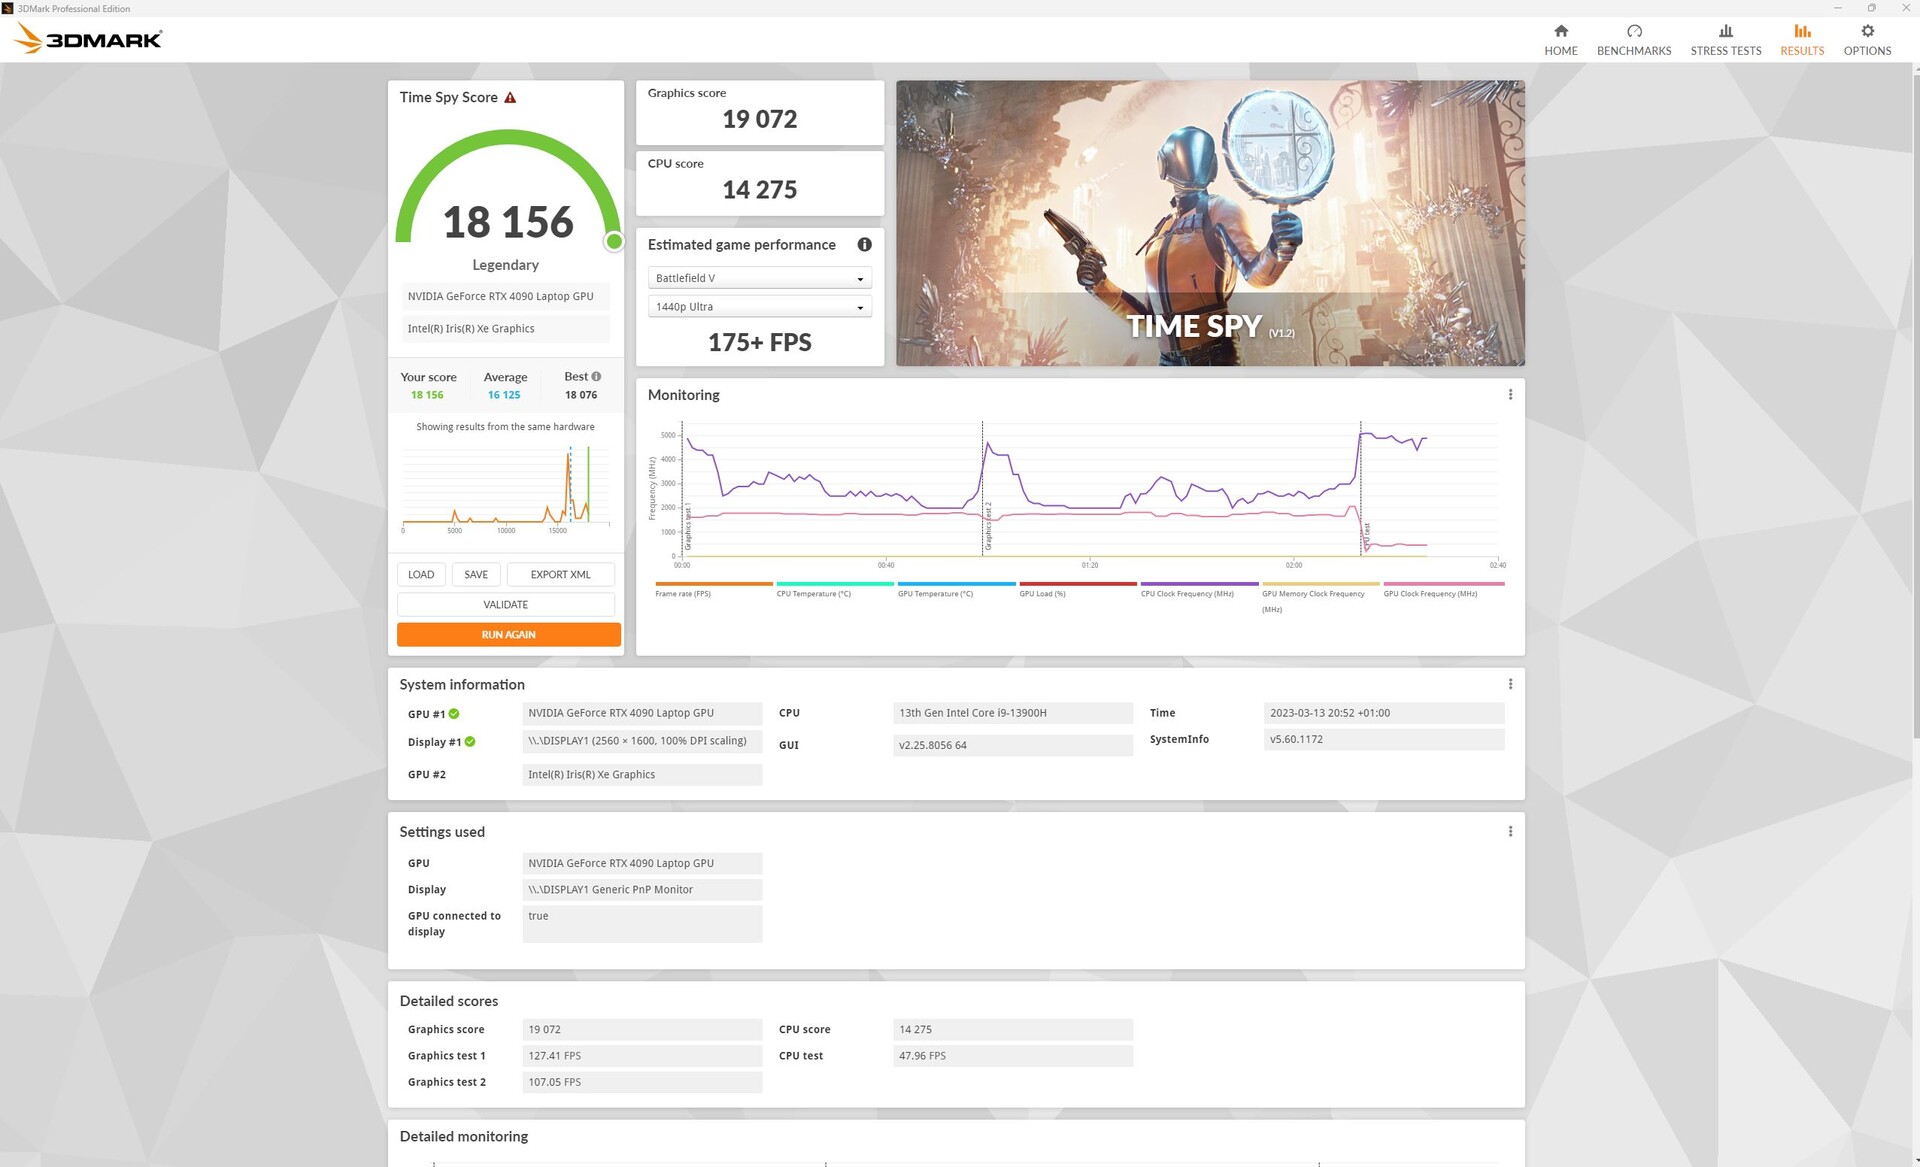
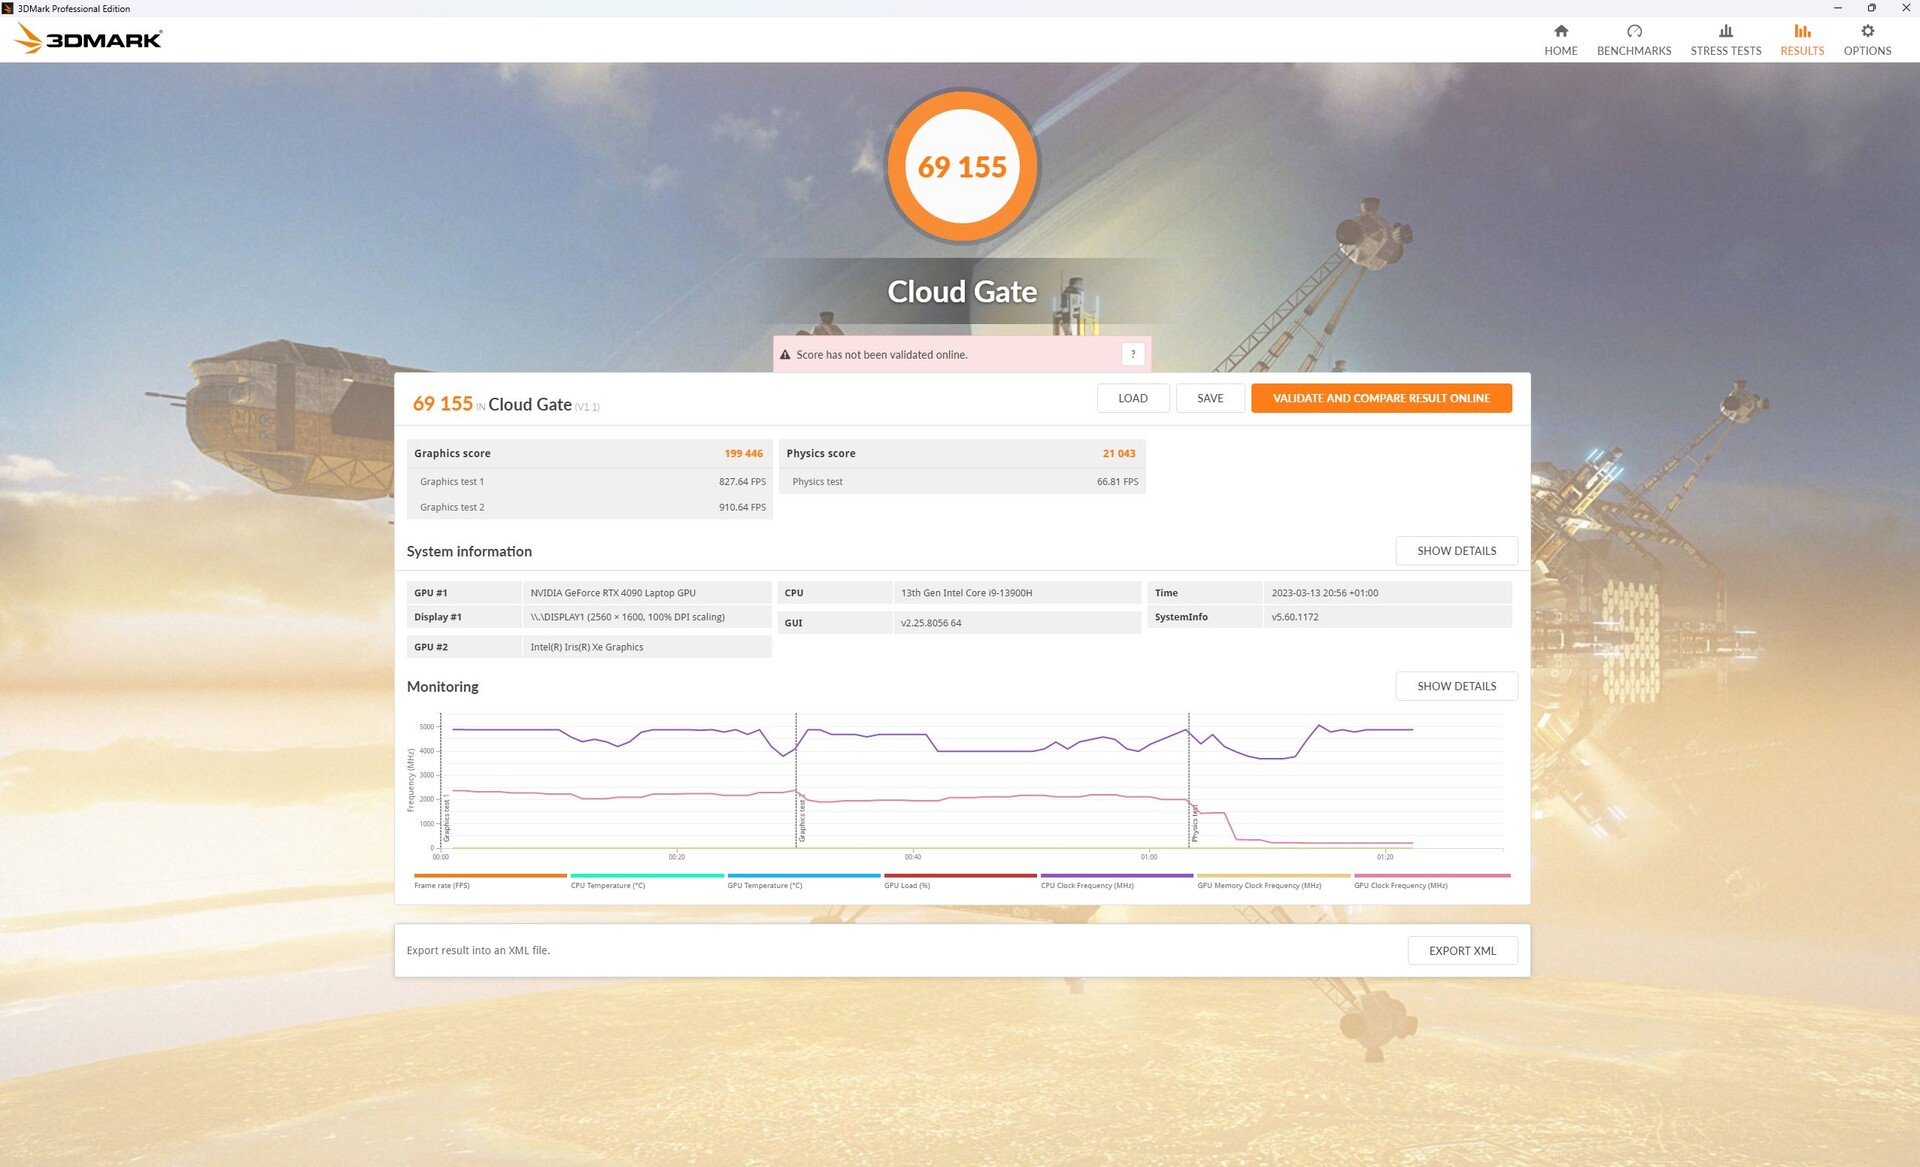
En las pruebas 3DMark, hubo problemas ocasionales al cambiar el dispositivo de visualización a la dGPU a través de Optimus o MSHybrid/Standard, lo que a veces provocó que las pruebas fueran iniciadas por la iGPU. También en este ámbito, parece que los controladores no están totalmente maduros. En caso de duda, la dGPU debería activarse manualmente (MUX).
Hasta ahora, sólo hemos probado la RTX 4090 emparejada con un procesador HX (ver la competencia). No es de extrañar que la GPU de la M16 sea, en todas las pruebas, en torno a un 10% más lenta que la media de la tarjeta según nuestra (aún) limitada base de datos. EnRazer Blade 16con una RTX 4080 ligeramente más lenta, se queda un 4% por detrás.
En modo batería, el rendimiento 3D cayó bruscamente y en Fire Strike, sólo quedan 9.000 puntos de los 44.000 iniciales, ¡lo que representa una caída de casi el 80 por ciento!

| 3DMark Performance rating - Percent | |
| Schenker XMG Neo 16 Raptor Lake | |
| Medio NVIDIA GeForce RTX 4090 Laptop GPU | |
| Asus ROG Zephyrus M16 GU604VY-NM042X | |
| Razer Blade 16 Early 2023 | |
| Media de la clase Gaming | |
| Lenovo Legion 7 16IAX7-82TD004SGE -1! | |
| Asus ROG Strix Scar 17 SE G733CX-LL014W | |
| MSI Raider GE66 12UHS | |
| Alienware x15 R2 P111F | |
| Acer Predator Triton 500 SE PT516-52s-70KX -1! | |
| Razer Blade 15 RZ09-0421NGG3-R3G1 -1! | |
| Asus ROG Zephyrus M16 GU603Z -1! | |
| 3DMark 11 Performance | 41060 puntos | |
| 3DMark Fire Strike Score | 33550 puntos | |
| 3DMark Time Spy Score | 15939 puntos | |
ayuda | ||
* ... más pequeño es mejor
Rendimiento de juego
También al jugar se nota que la M16'sRTX 4090 no está emparejada con una CPU HX. Los portátiles con una CPU HX yRTX 4080como el Blade 16 o elLegion 7suelen ser más rápidas, especialmente cuando se ajustan a resoluciones bajas. ElMSI Titancon una RTX 4090 disfruta de la mayor ventaja de rendimiento sobre la M16.
Aparte de eso, la M16 todavía tiene potencia de sobra a 4K, con suficiente en el tanque para el trazado de rayos, especialmente combinado con el DLSS 3, la tecnología de aumento de escala de IA. Puedes encontrar más pruebas e información sobre las nuevas tarjetas RTX 40 en nuestro artículo de análisis.
| The Witcher 3 - 1920x1080 Ultra Graphics & Postprocessing (HBAO+) | |
| MSI Titan GT77 HX 13VI | |
| Asus ROG Zephyrus M16 GU604VY-NM042X | |
| Lenovo Legion Pro 7 16IRX8H | |
| Razer Blade 16 Early 2023 | |
| Media de la clase Gaming (95 - 240, n=8, últimos 2 años) | |
| Asus ROG Zephyrus M16 GU603Z | |
| Far Cry 6 | |
| 2560x1440 Ultra Graphics Quality + HD Textures AA:T | |
| MSI Titan GT77 HX 13VI | |
| Schenker XMG Neo 16 Raptor Lake | |
| Medio NVIDIA GeForce RTX 4090 Laptop GPU (85 - 146, n=12) | |
| Razer Blade 16 Early 2023 | |
| Asus ROG Zephyrus M16 GU604VY-NM042X | |
| Media de la clase Gaming (74.5 - 116.7, n=2, últimos 2 años) | |
| 1920x1080 Ultra Graphics Quality + HD Textures + DXR AA:T | |
| Razer Blade 16 Early 2023 | |
| MSI Titan GT77 HX 13VI | |
| Schenker XMG Neo 16 Raptor Lake | |
| Media de la clase Gaming (n=1últimos 2 años) | |
| Asus ROG Zephyrus M16 GU604VY-NM042X | |
| Medio NVIDIA GeForce RTX 4090 Laptop GPU (81 - 116, n=5) | |
| Tiny Tina's Wonderlands - 2560x1440 Badass Preset (DX12) | |
| Schenker XMG Neo 16 Raptor Lake | |
| MSI Titan GT77 HX 13VI | |
| Medio NVIDIA GeForce RTX 4090 Laptop GPU (103.4 - 137.8, n=14) | |
| Asus ROG Zephyrus M16 GU604VY-NM042X | |
| Media de la clase Gaming (58.9 - 111.2, n=3, últimos 2 años) | |
| Spider-Man Miles Morales - 2560x1440 Very High Preset AA:T | |
| Schenker XMG Neo 16 Raptor Lake | |
| MSI Titan GT77 HX 13VI | |
| Medio NVIDIA GeForce RTX 4090 Laptop GPU (93.3 - 119.8, n=7) | |
| Asus ROG Strix Scar 18 2023 G834JY-N6005W | |
| Lenovo Legion Pro 7 16IRX8H | |
| Asus ROG Zephyrus M16 GU604VY-NM042X | |
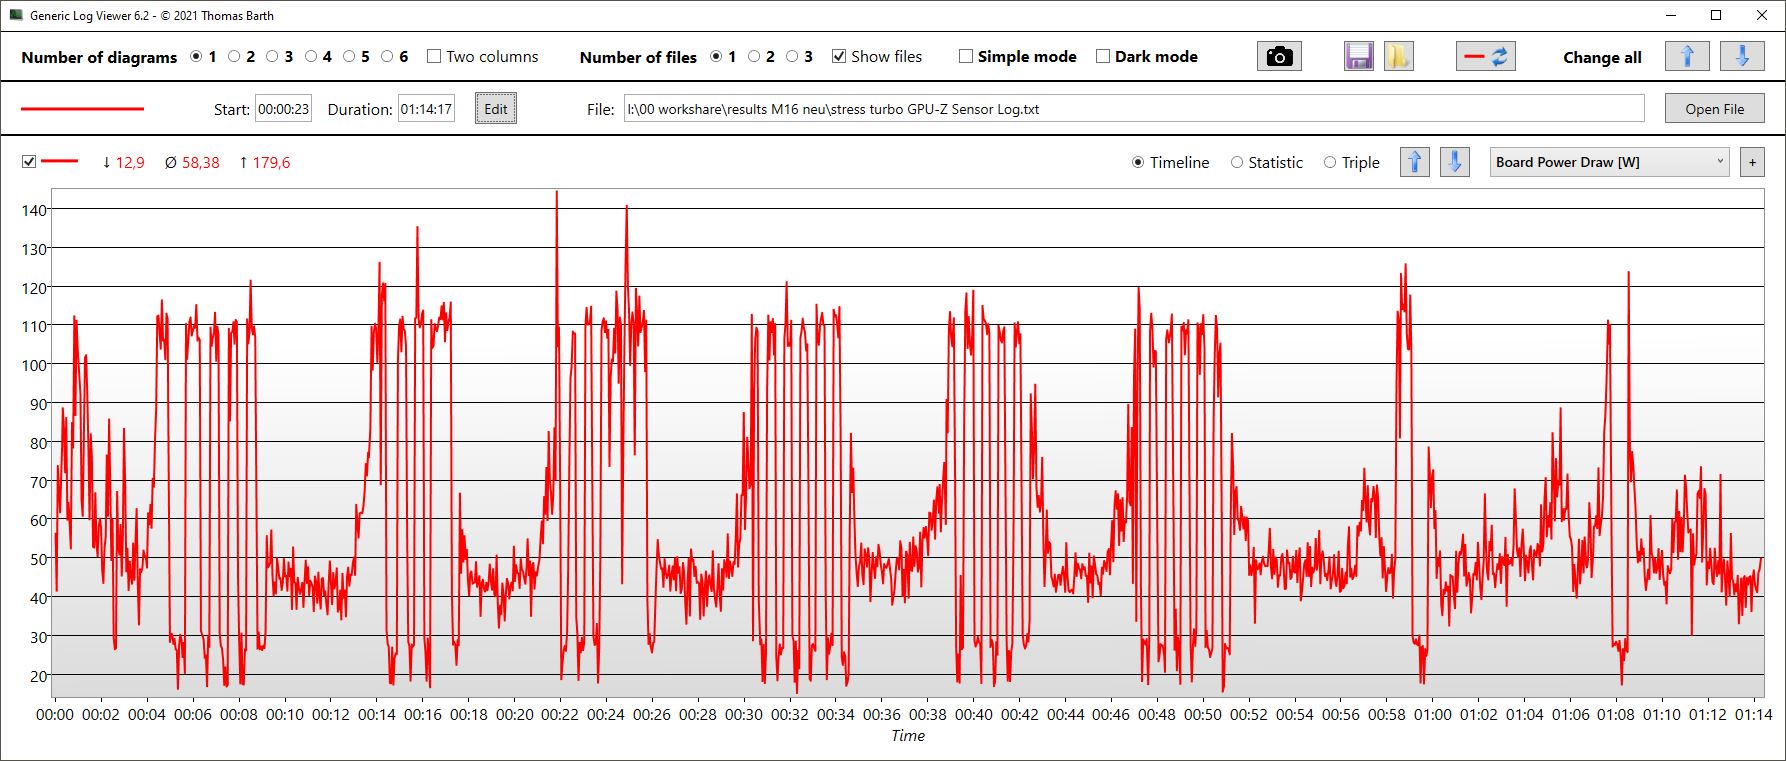
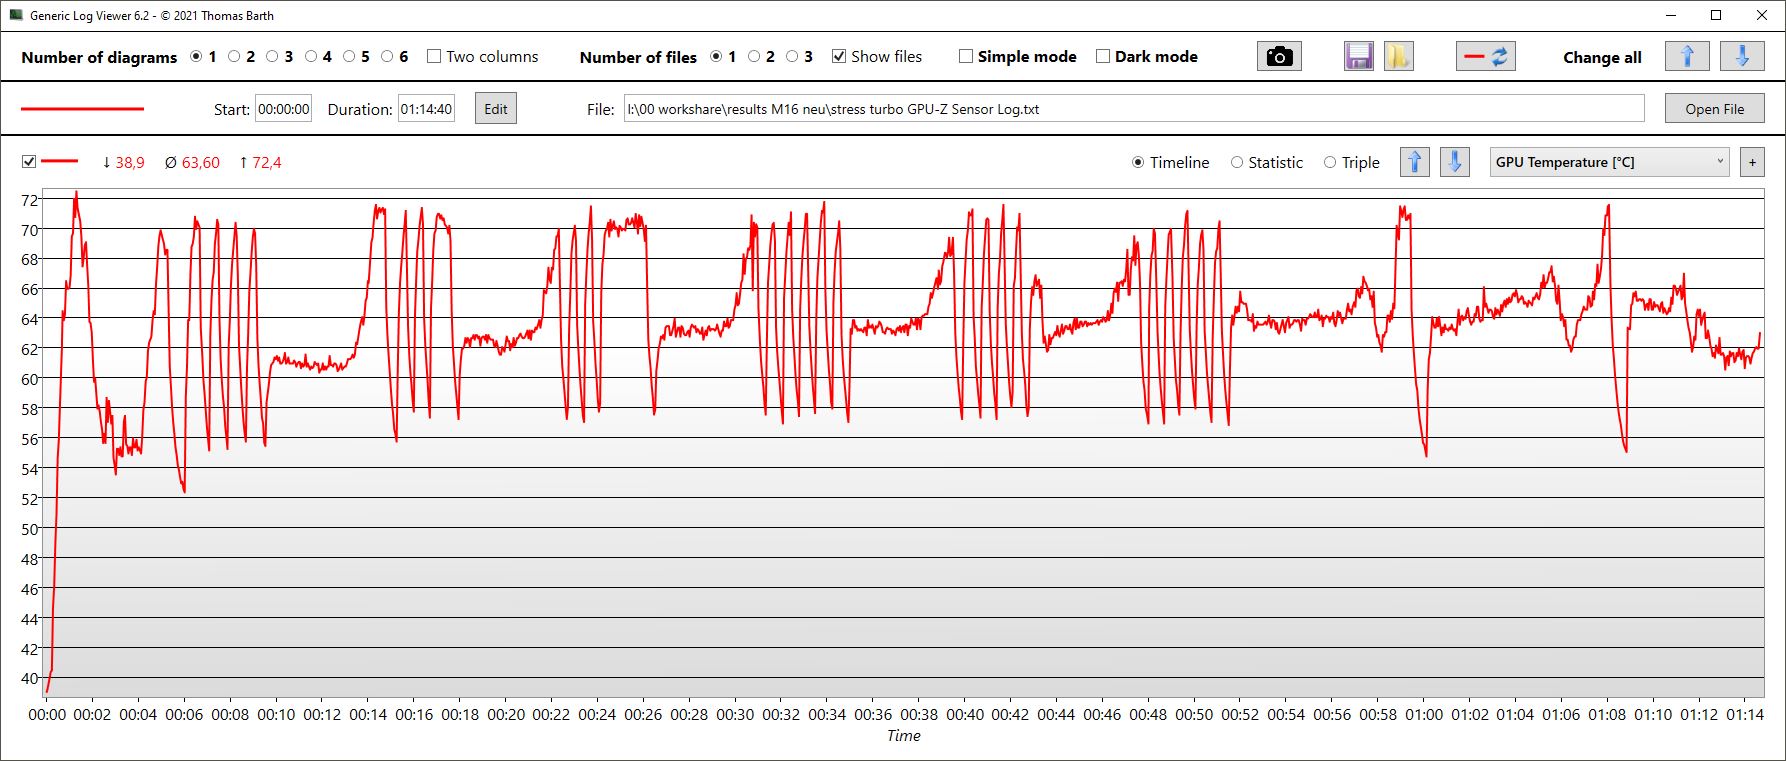
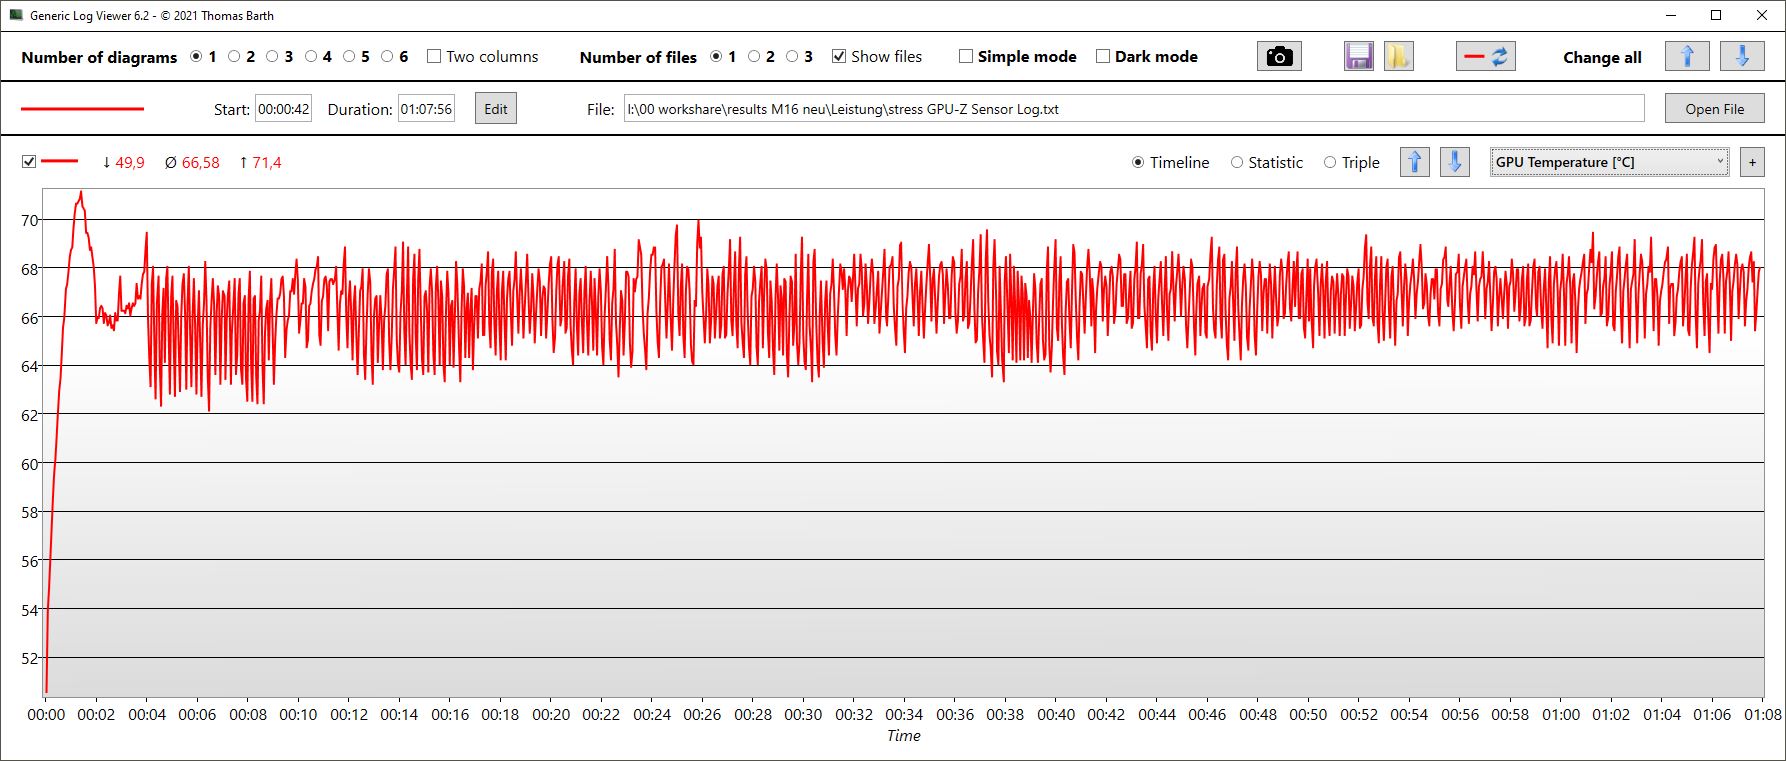
Después de una hora en nuestra prueba de estrés Witcher 3, es realmente obvio que el rendimiento está al mismo nivel que unaRTX 4080emparejada con un procesador HX. No obstante, el rendimiento es tan alto como constante.
Nuestros datos de registro de GPU-Z destacan muy bien la diferencia entre los modosTurbo y Rendimiento: La frecuencia de reloj (1,9 frente a 1,5 GHz), la temperatura (70 frente a 66 °C), el consumo de energía (140 frente a 93 vatios) e incluso la velocidad de reloj de la memoria (2.275 frente a 2.250 MHz) son diferentes. La velocidad de fotogramas bajó de unos 175 a aproximadamente 145 fps.
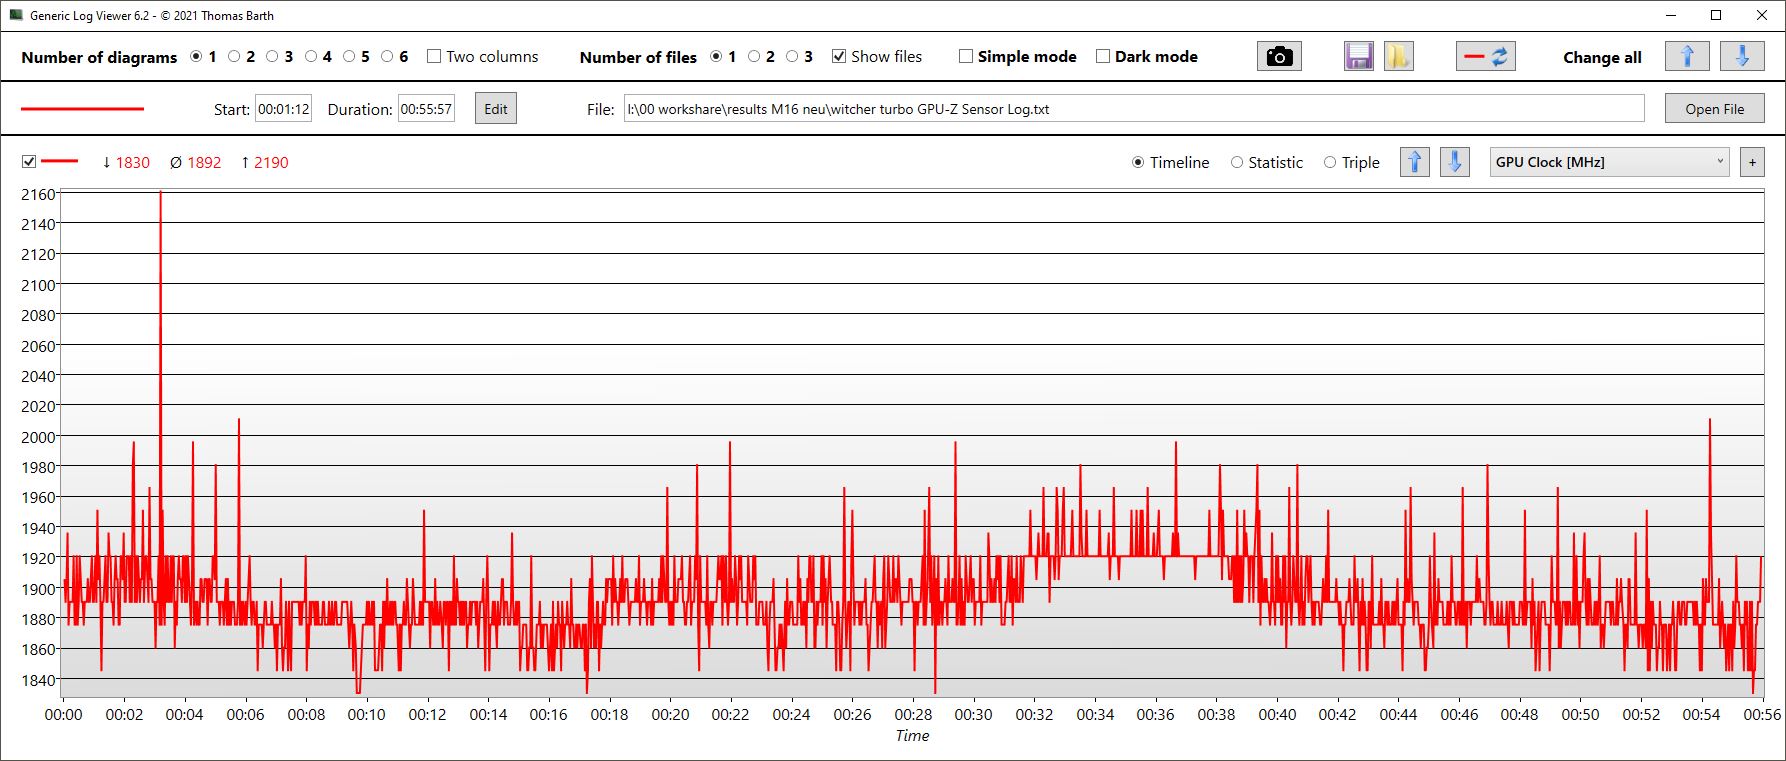
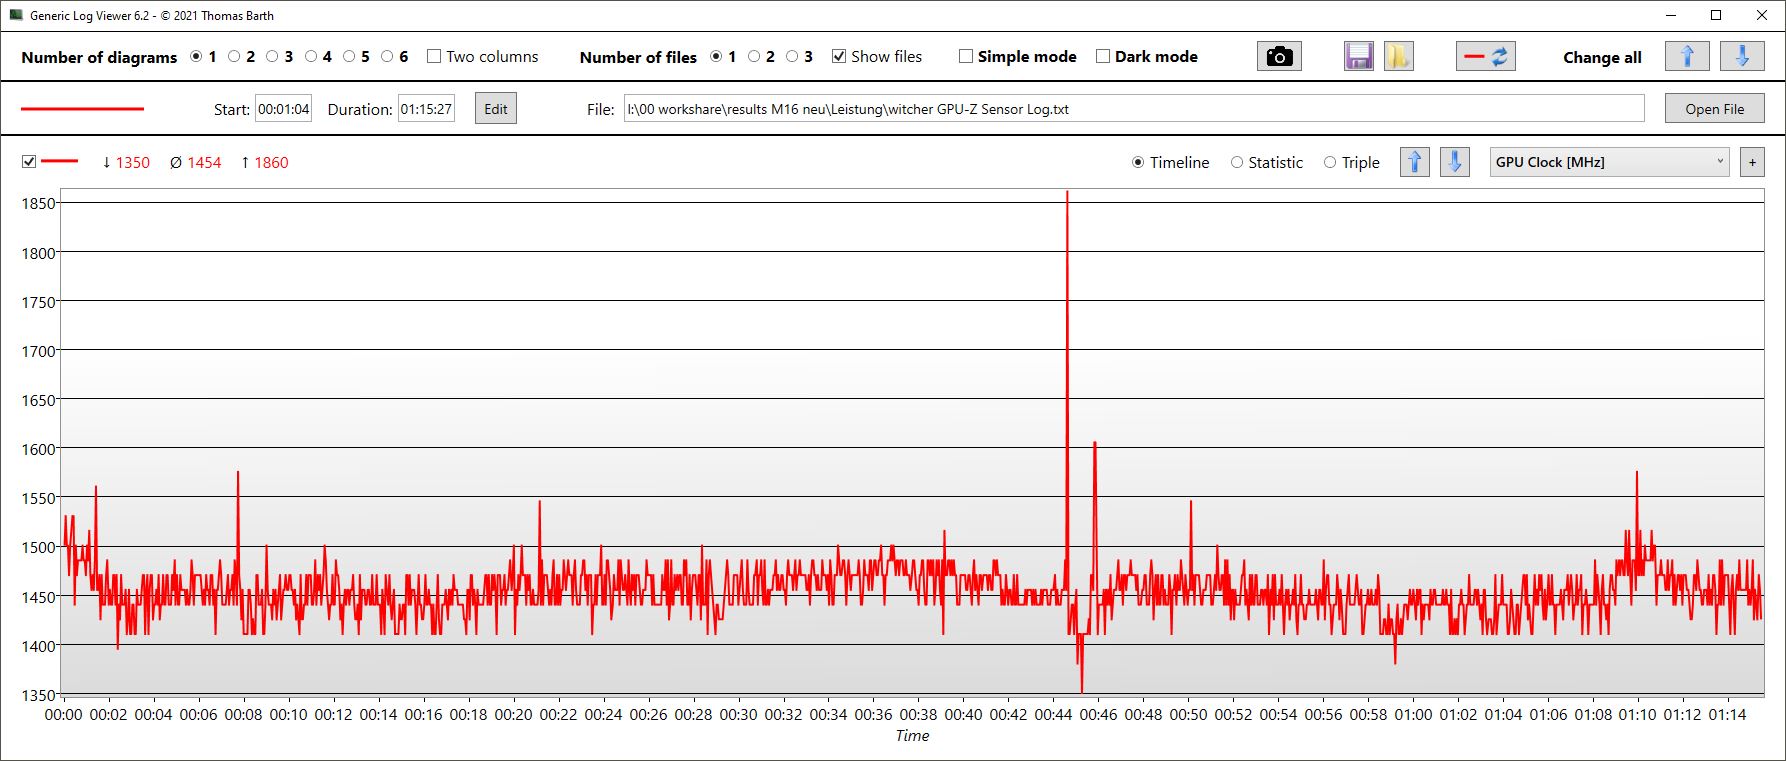
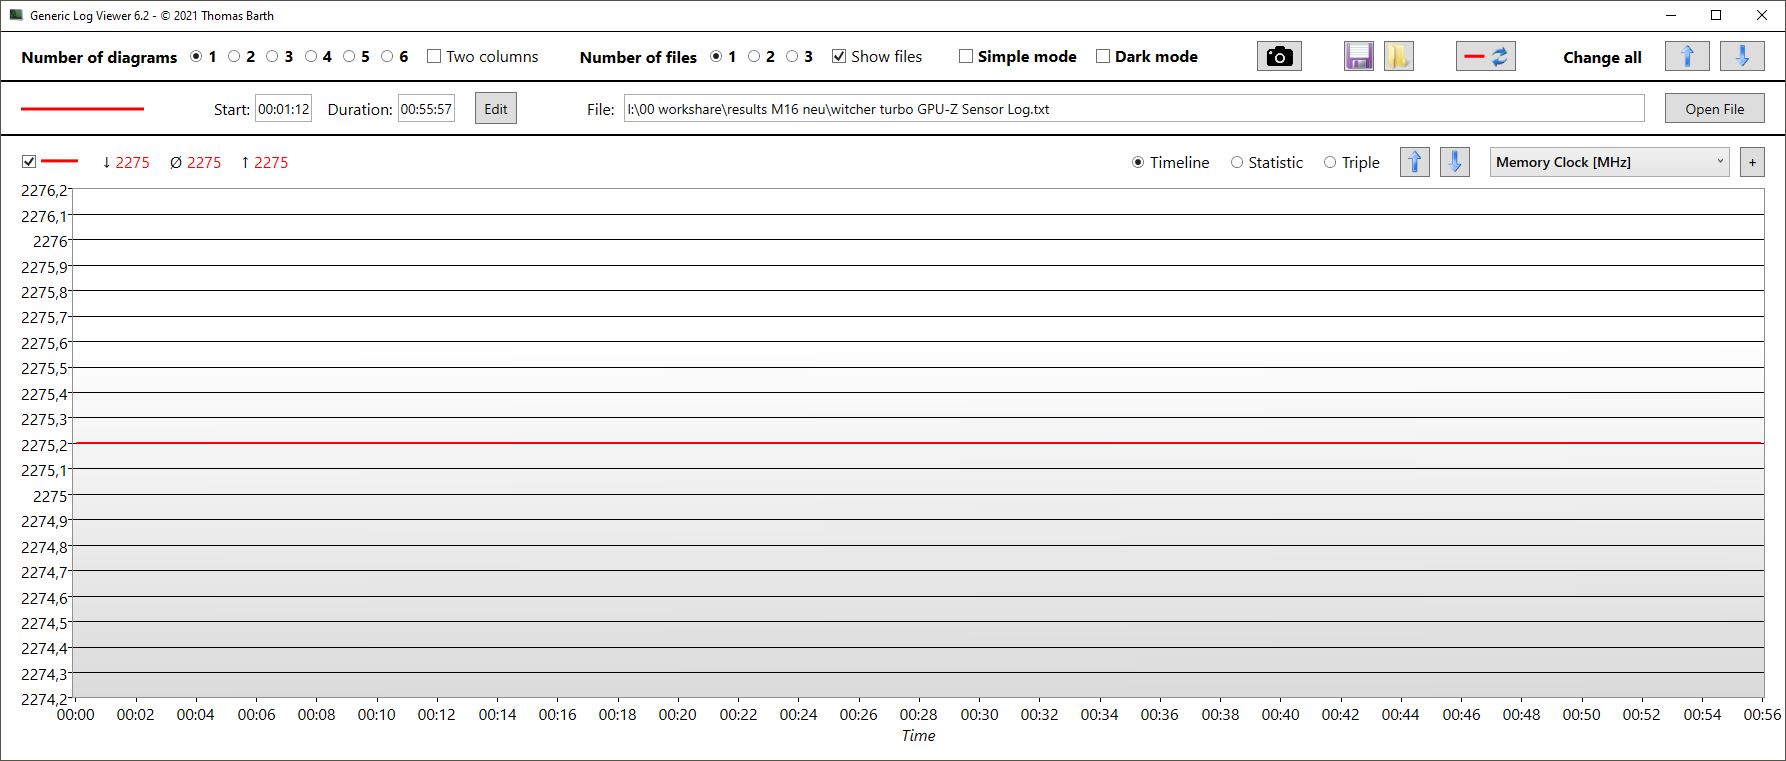
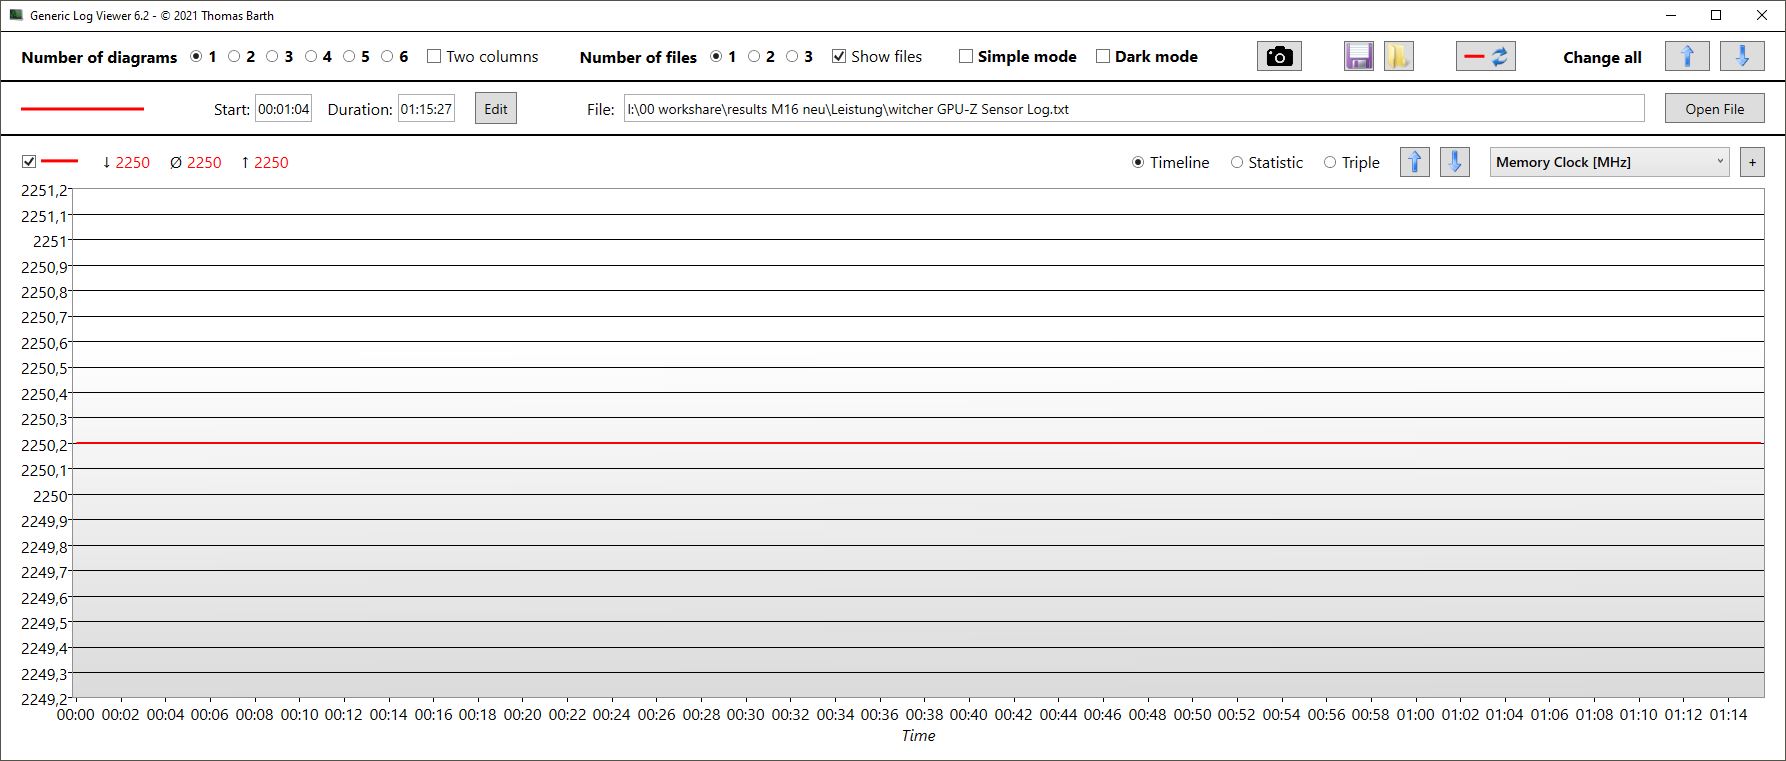
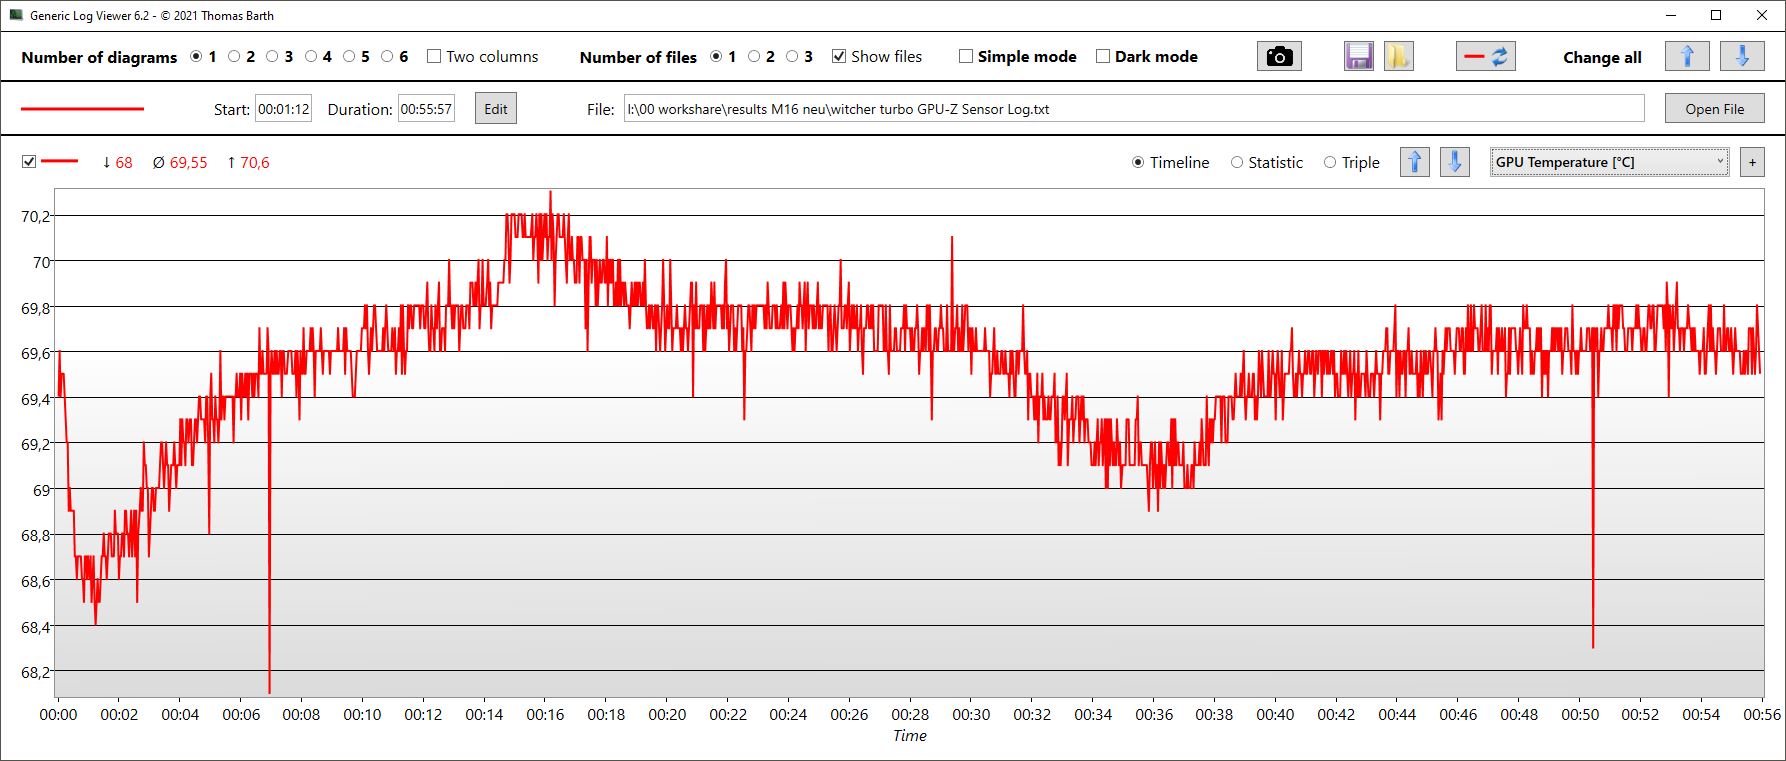
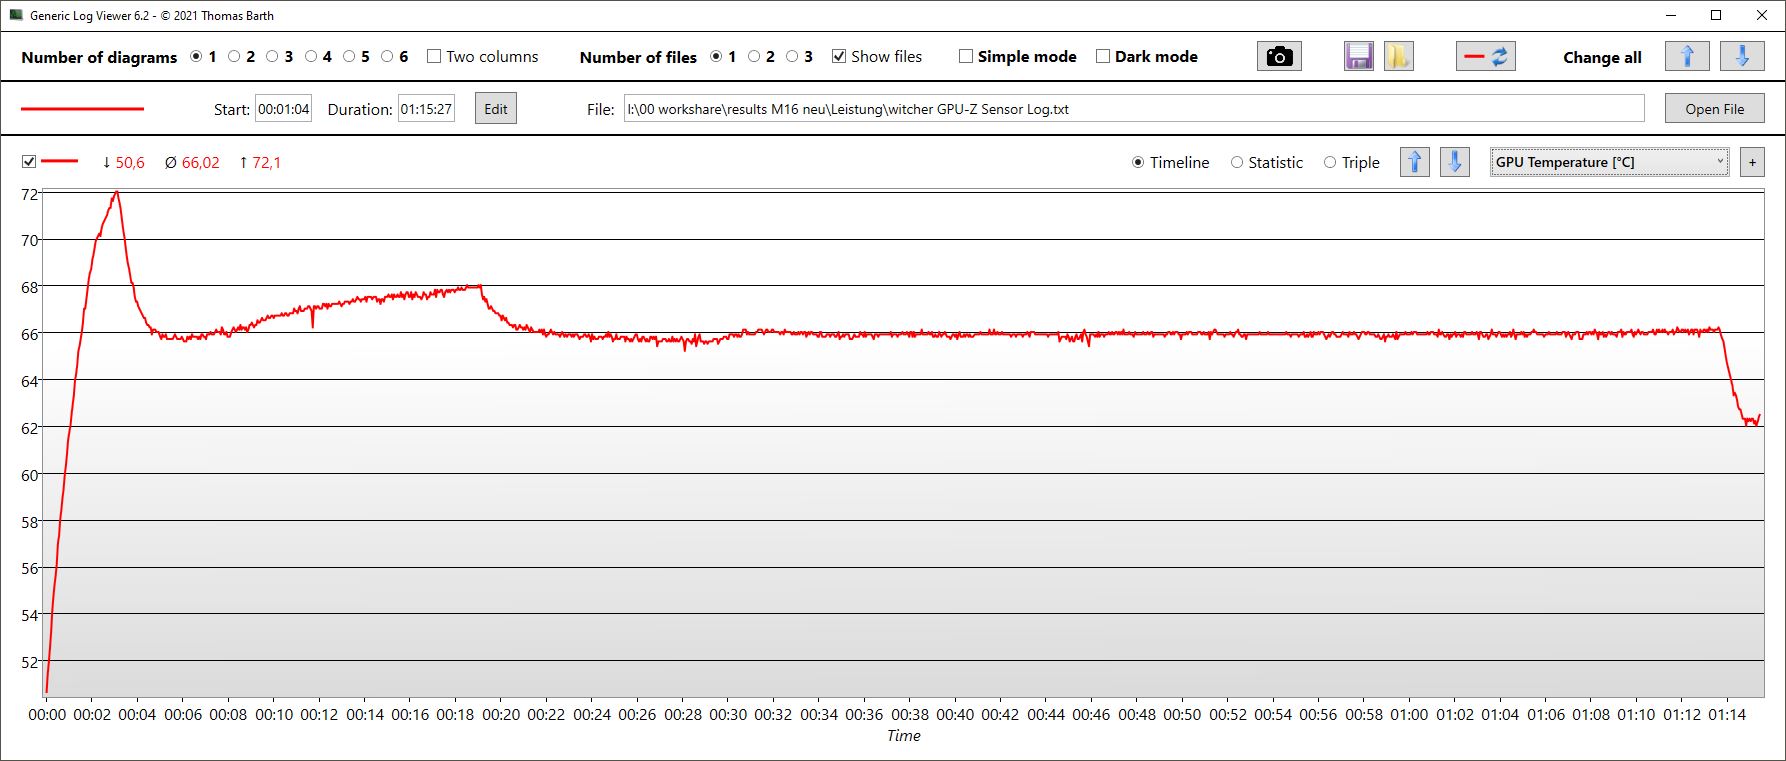
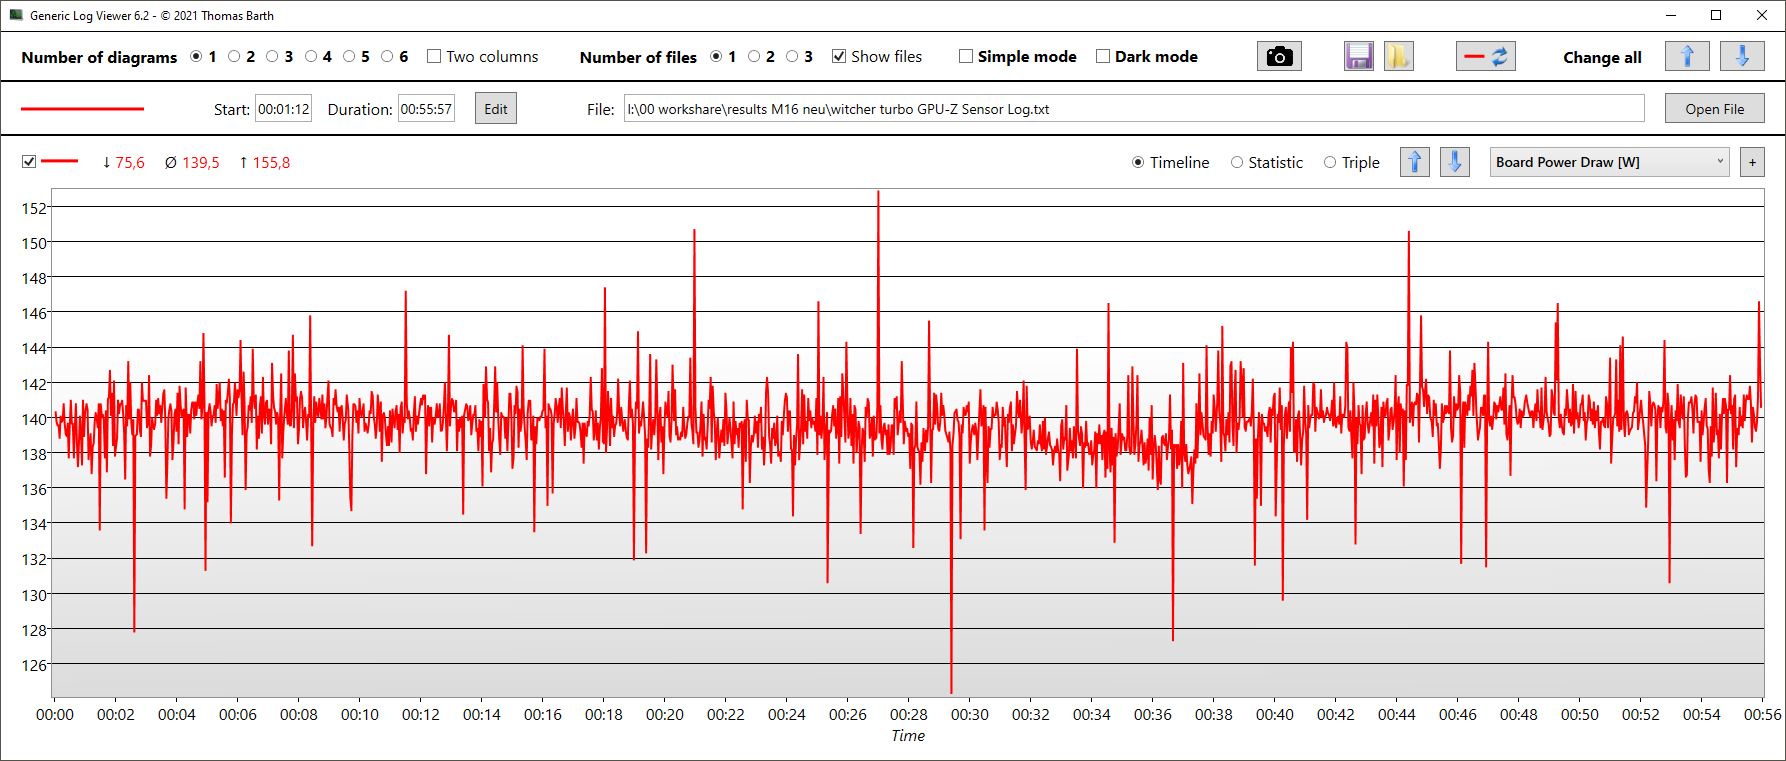
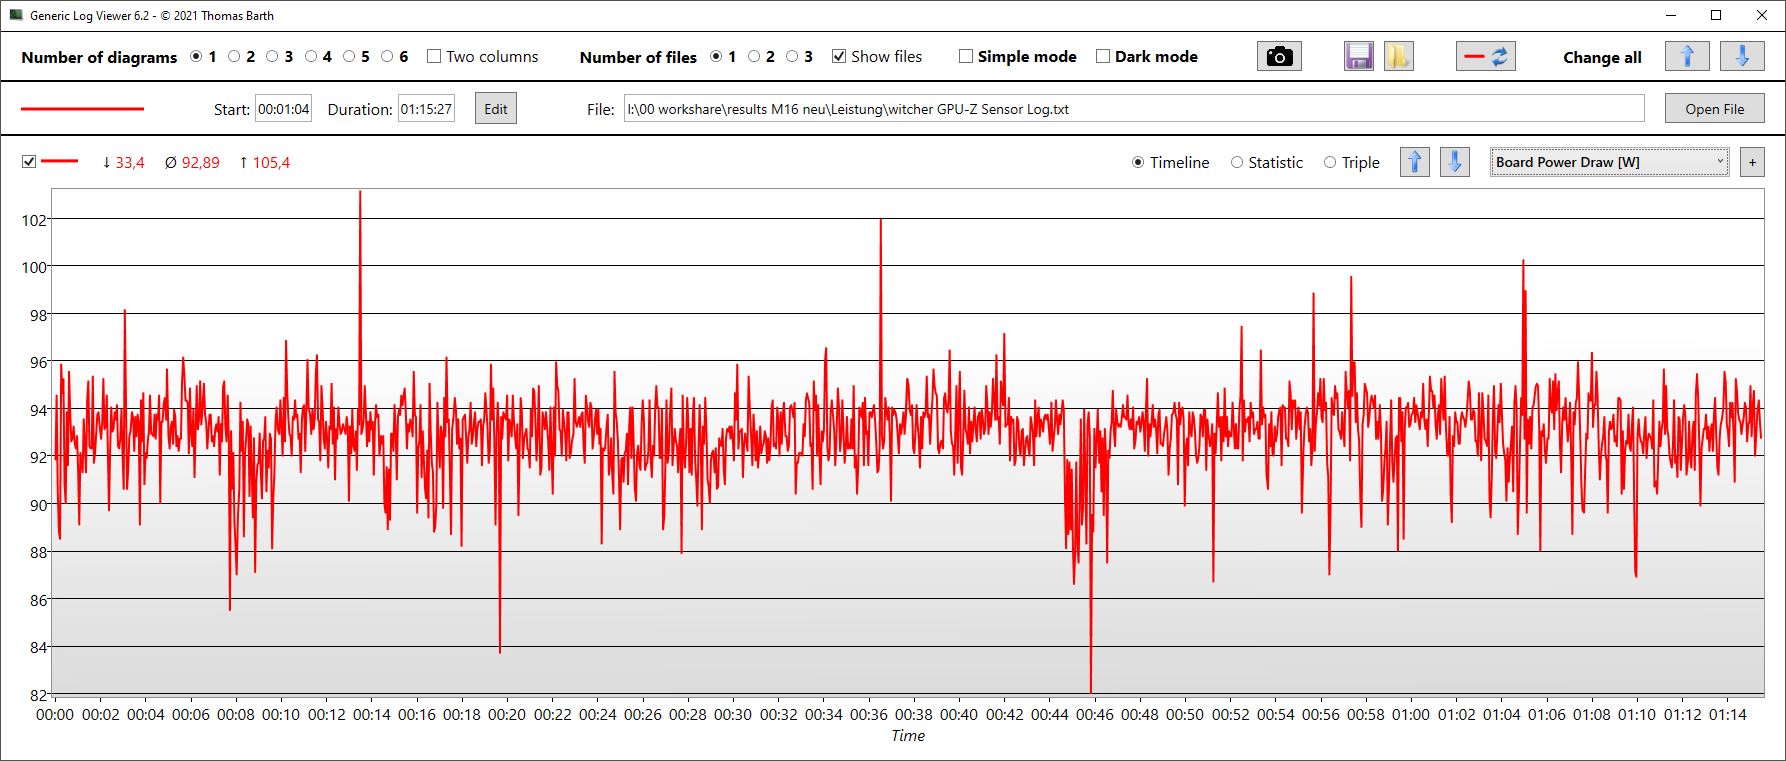
Witcher 3 FPS diagram
| bajo | medio | alto | ultra | QHD | 4K DLSS | 4K | |
|---|---|---|---|---|---|---|---|
| GTA V (2015) | 186 | 183.1 | 179.8 | 127.7 | 123 | ||
| The Witcher 3 (2015) | 444 | 371 | 305 | 178 | |||
| Dota 2 Reborn (2015) | 192.9 | 177.3 | 169.9 | 160.7 | 161.9 | ||
| Final Fantasy XV Benchmark (2018) | 199.1 | 184.5 | 158.6 | 129.5 | |||
| X-Plane 11.11 (2018) | 177.2 | 154.7 | 116.4 | 121.8 | |||
| Far Cry 5 (2018) | 195 | 168 | 156 | 133 | 145 | ||
| Strange Brigade (2018) | 445 | 357 | 343 | 315 | 255 | ||
| Shadow of the Tomb Raider (2018) | 172 | 150 | 90 | ||||
| Watch Dogs Legion (2020) | 102 | 91 | 58 | ||||
| Assassin´s Creed Valhalla (2020) | 126 | 111 | 69 | ||||
| Far Cry 6 (2021) | 111 | 108 | 73 | ||||
| Dying Light 2 (2022) | 145.2 | 103.4 | 53.6 | ||||
| Cyberpunk 2077 1.6 (2022) | 104.49 | 75.69 | 41.9 | ||||
| Tiny Tina's Wonderlands (2022) | 144.06 | 109.64 | 62.33 | ||||
| A Plague Tale Requiem (2022) | 59.4 | ||||||
| Call of Duty Modern Warfare 2 2022 (2022) | 148 | 111 | 98 | 69 | |||
| Spider-Man Miles Morales (2022) | 98.1 | 93.3 | 65.7 | ||||
| The Callisto Protocol (2022) | 113.23 | 90.48 | 53.5 |
Emisiones - Sin duda, los turbos hacen mucho ruido
Emisiones sonoras
En el modo silencioso, los ventiladores están casi siempre inactivos en reposo y también permanecen así bajo cargas ligeras como escribir o navegar por internet. Incluso en modoRendimiento, que el fabricante considera similar a un modo equilibrado, los ventiladores suelen estar en marcha, en inactivo.
Para nuestras pruebas, usamos el modo Turbo. Los ventiladores sólo son tolerables en inactivo, nunca son silenciosos y sólo rugen al máximo bajo carga pesada. En este punto, permanecen a 57 dB constantes, lo que lo convierte en uno de los portátiles más ruidosos de su clase. Sólo el MSI Titan GT77 es más ruidoso bajo carga máxima, pero al menos es más silencioso cuando juega. Vale la pena señalar que muchos portátiles tienen un modo turbo en el que los ventiladores funcionan al máximo en inactivo, por lo que a menudo nos abstenemos de este modo de prueba. El modo Turbo del M16 es algo diferente pero los auriculares siguen siendo imprescindibles cuando se juega.
En modo rendimiento, los niveles de ruido son tolerables y comparables a los de la competencia. En Witcher 3, sólo medimos 49 dB en lugar de 57. A cambio, el rendimiento en juegos bajó entre un 15 y un 18 por ciento.
Ruido
| Ocioso |
| 24 / 29.96 / 34.27 dB(A) |
| Carga |
| 35.89 / 57.54 dB(A) |
 | ||
30 dB silencioso 40 dB(A) audible 50 dB(A) ruidosamente alto |
||
min: | ||
| Asus ROG Zephyrus M16 GU604VY-NM042X GeForce RTX 4090 Laptop GPU, i9-13900H, Samsung PM9A1 MZVL22T0HBLB | Asus ROG Zephyrus M16 GU603Z GeForce RTX 3070 Ti Laptop GPU, i9-12900H, Micron 3400 1TB MTFDKBA1T0TFH | Asus ROG Strix Scar 18 2023 G834JY-N6005W GeForce RTX 4090 Laptop GPU, i9-13980HX, 2x Samsung PM9A1 MZVL21T0HCLR (RAID 0) | MSI Titan GT77 HX 13VI GeForce RTX 4090 Laptop GPU, i9-13950HX, Samsung PM9A1 MZVL22T0HBLB | Lenovo Legion Pro 7 16IRX8H GeForce RTX 4080 Laptop GPU, i9-13900HX, Samsung PM9A1 MZVL21T0HCLR | Razer Blade 16 Early 2023 GeForce RTX 4080 Laptop GPU, i9-13950HX, SSSTC CA6-8D1024 | |
|---|---|---|---|---|---|---|
| Noise | -2% | -0% | -7% | -3% | 11% | |
| apagado / medio ambiente * (dB) | 24 | 23 4% | 23.9 -0% | 24.6 -3% | 24 -0% | 23 4% |
| Idle Minimum * (dB) | 24 | 23 4% | 23.9 -0% | 29.2 -22% | 26 -8% | 23 4% |
| Idle Average * (dB) | 29.96 | 24 20% | 32.6 -9% | 29.2 3% | 28 7% | 23 23% |
| Idle Maximum * (dB) | 34.27 | 47 -37% | 32.6 5% | 29.2 15% | 34 1% | 23.6 31% |
| Load Average * (dB) | 35.89 | 47.91 -33% | 35.9 -0% | 50.7 -41% | 47 -31% | 39 -9% |
| Witcher 3 ultra * (dB) | 57.5 | 48.91 15% | 53.3 7% | 55 4% | 51.6 10% | |
| Load Maximum * (dB) | 57.54 | 50.25 13% | 55.8 3% | 61 -6% | 56 3% | 51.3 11% |
* ... más pequeño es mejor
Temperatura
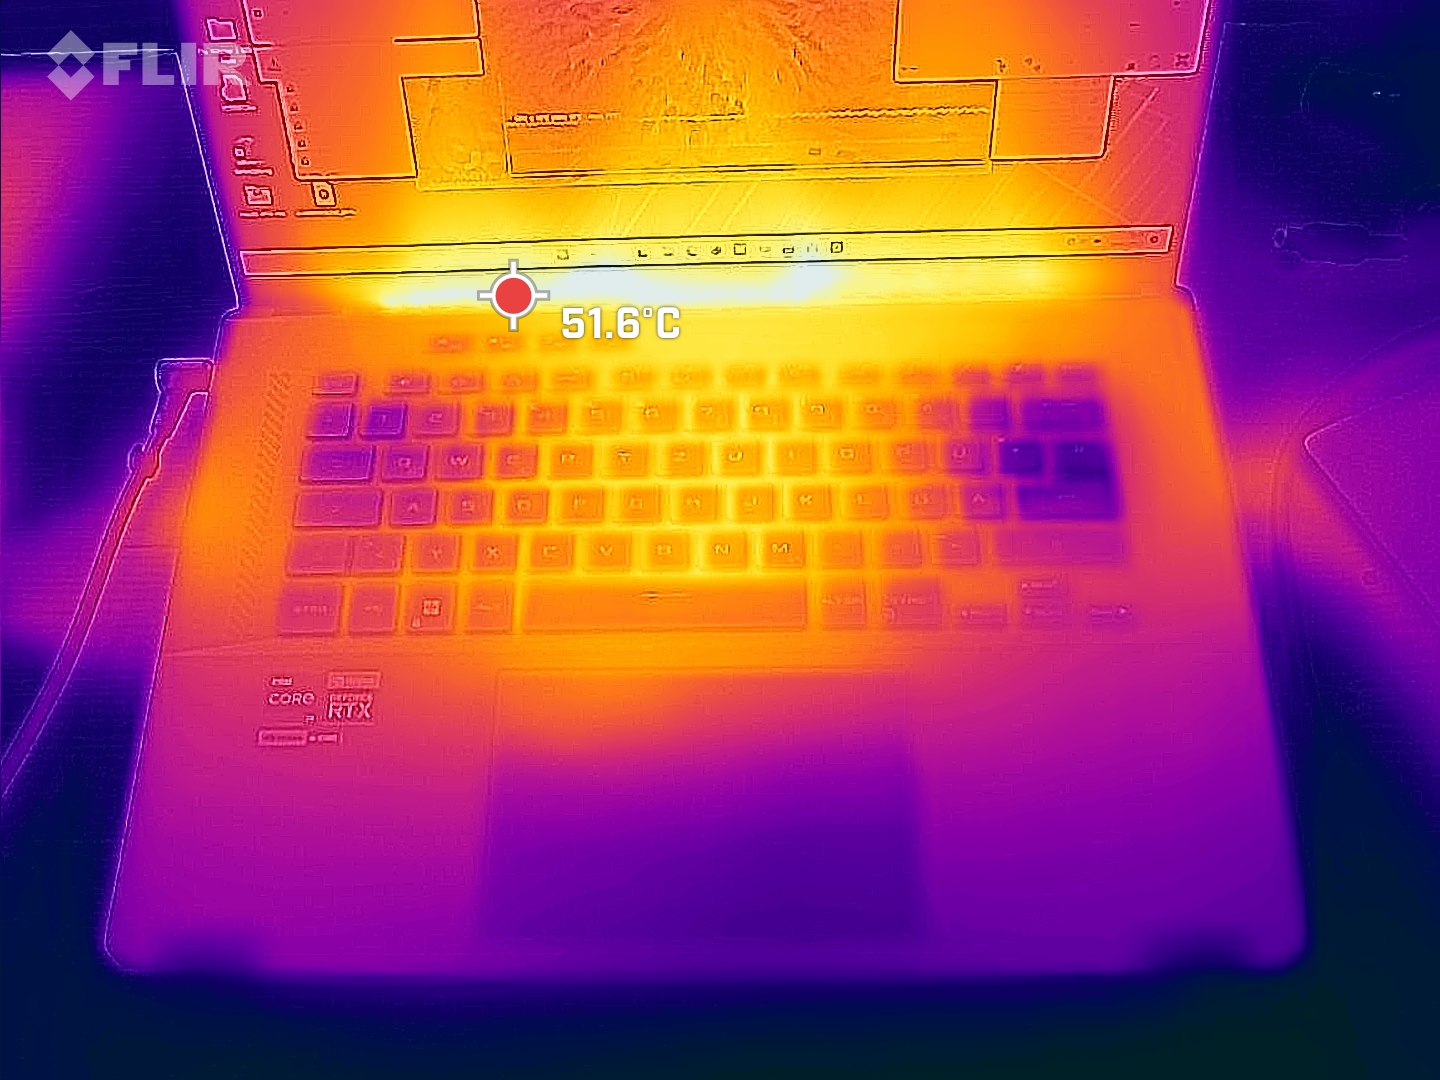
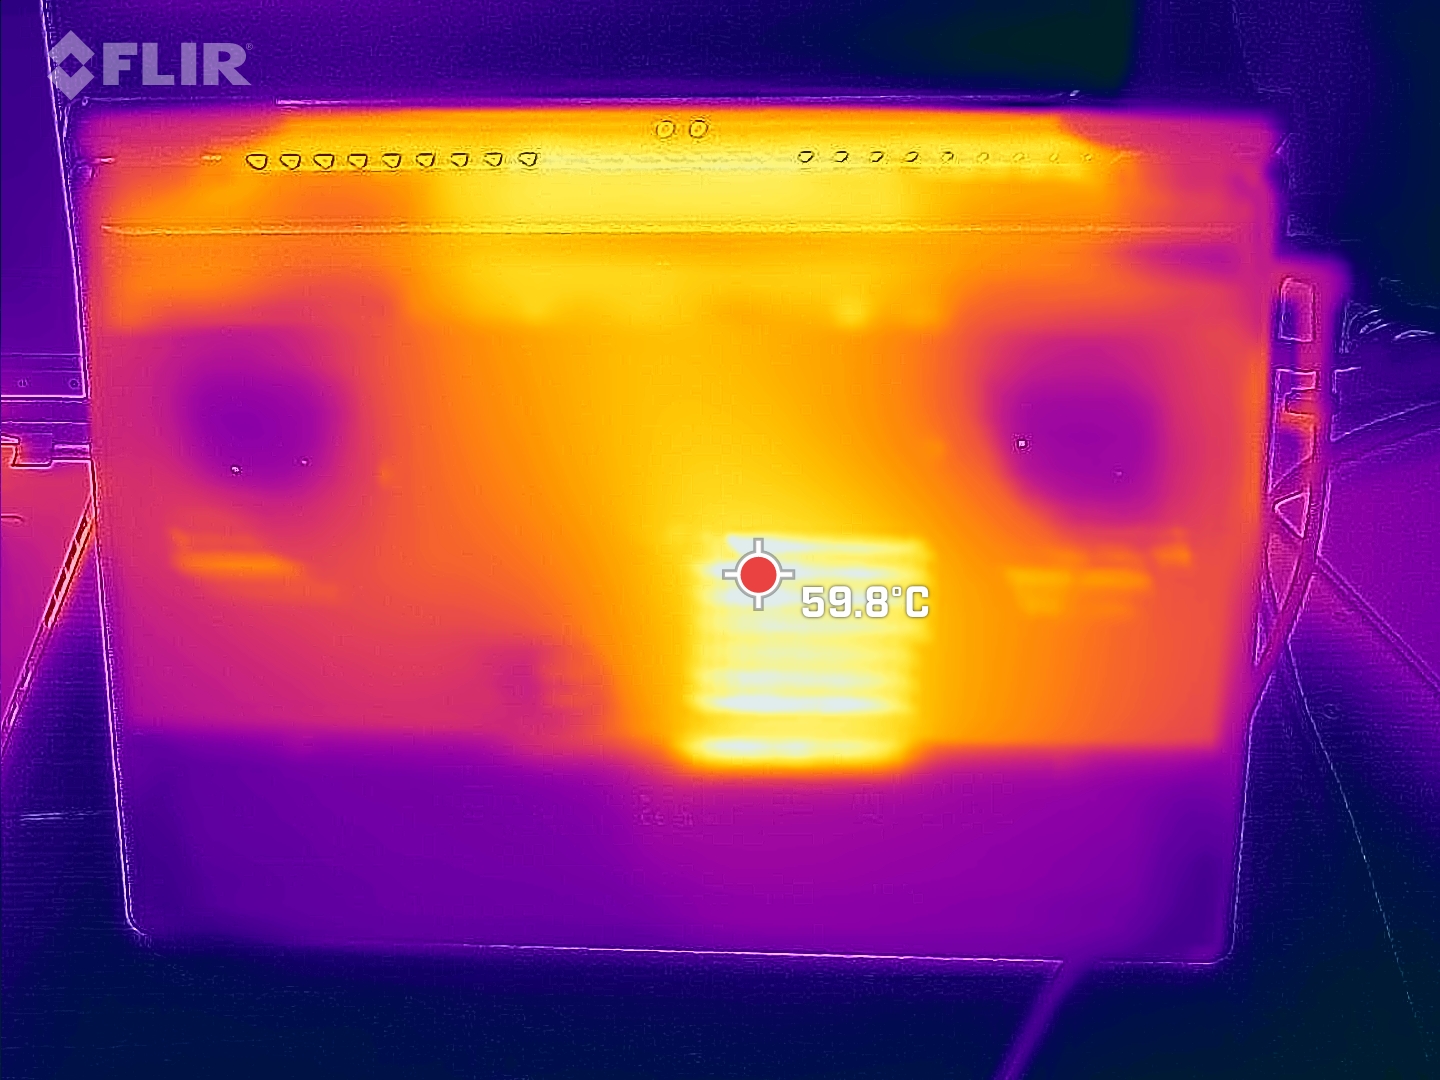
El M16 se calienta un poco, especialmente en la parte inferior del dispositivo. Los puntos calientes medidos estuvieron justo por debajo de los 60 °C bajo estrés máximo y pueden encontrarse en el centro y la trasera. Al jugar, los puntos calientes en sí alcanzaron temperaturas de sólo unos 50 °C.
Por el contrario, el reposamanos permaneció frío en su mayor parte, lo que también se aplica parcialmente a las teclas WASD.
(-) La temperatura máxima en la parte superior es de 50 °C / 122 F, frente a la media de 40.4 °C / 105 F, que oscila entre 21.2 y 68.8 °C para la clase Gaming.
(-) El fondo se calienta hasta un máximo de 58 °C / 136 F, frente a la media de 43.2 °C / 110 F
(+) En reposo, la temperatura media de la parte superior es de 24 °C / 75# F, frente a la media del dispositivo de 33.9 °C / 93 F.
(-) Jugando a The Witcher 3, la temperatura media de la parte superior es de 38.1 °C / 101 F, frente a la media del dispositivo de 33.9 °C / 93 F.
(±) El reposamanos y el touchpad pueden calentarse mucho al tacto con un máximo de 37 °C / 98.6 F.
(-) La temperatura media de la zona del reposamanos de dispositivos similares fue de 28.8 °C / 83.8 F (-8.2 °C / -14.8 F).
| Asus ROG Zephyrus M16 GU604VY-NM042X Intel Core i9-13900H, NVIDIA GeForce RTX 4090 Laptop GPU | Asus ROG Zephyrus M16 GU603Z Intel Core i9-12900H, NVIDIA GeForce RTX 3070 Ti Laptop GPU | Asus ROG Strix Scar 18 2023 G834JY-N6005W Intel Core i9-13980HX, NVIDIA GeForce RTX 4090 Laptop GPU | MSI Titan GT77 HX 13VI Intel Core i9-13950HX, NVIDIA GeForce RTX 4090 Laptop GPU | Lenovo Legion Pro 7 16IRX8H Intel Core i9-13900HX, NVIDIA GeForce RTX 4080 Laptop GPU | Razer Blade 16 Early 2023 Intel Core i9-13950HX, NVIDIA GeForce RTX 4080 Laptop GPU | |
|---|---|---|---|---|---|---|
| Heat | -6% | -3% | 10% | -13% | 5% | |
| Maximum Upper Side * (°C) | 50 | 52 -4% | 54 -8% | 40.6 19% | 48 4% | 40 20% |
| Maximum Bottom * (°C) | 58 | 51 12% | 46 21% | 41.1 29% | 49 16% | 37.6 35% |
| Idle Upper Side * (°C) | 26 | 29 -12% | 30 -15% | 26.2 -1% | 40 -54% | 32.4 -25% |
| Idle Bottom * (°C) | 28 | 33 -18% | 31 -11% | 30.3 -8% | 33 -18% | 31.4 -12% |
* ... más pequeño es mejor
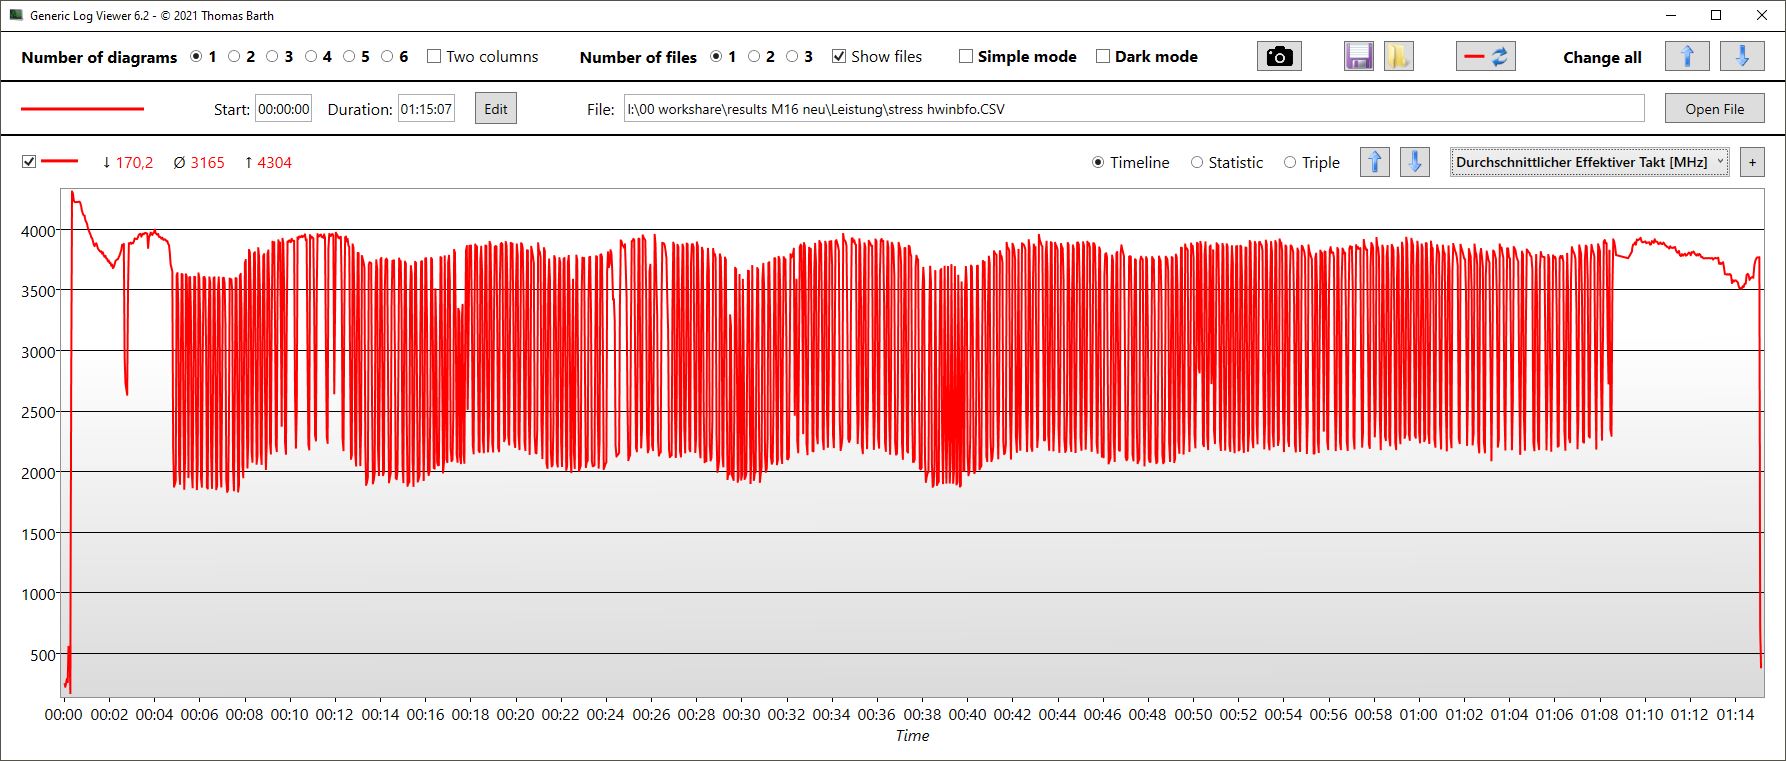
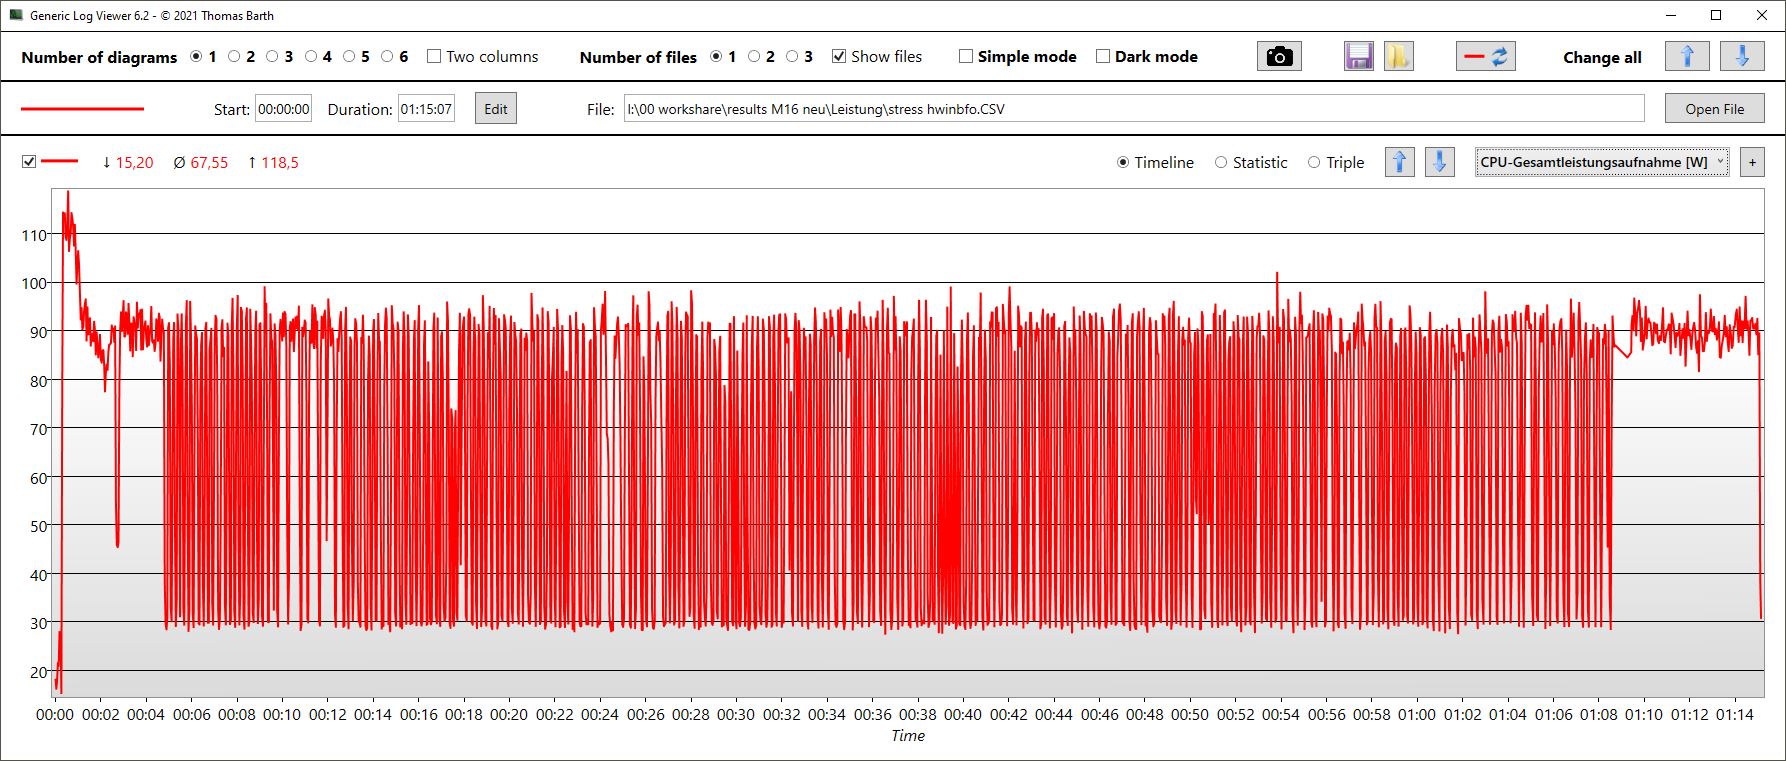
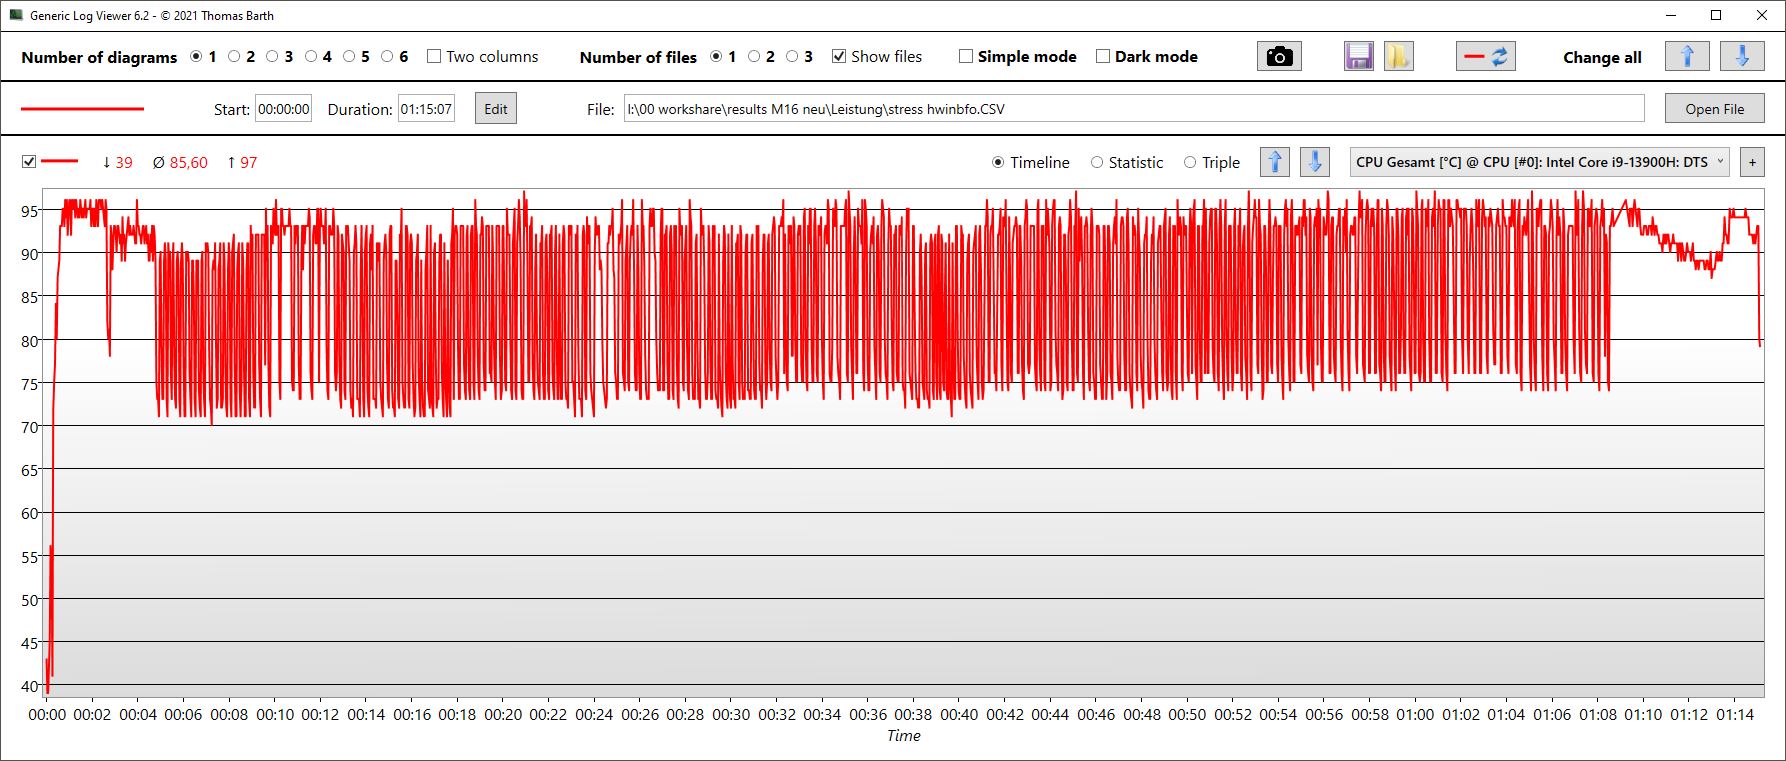
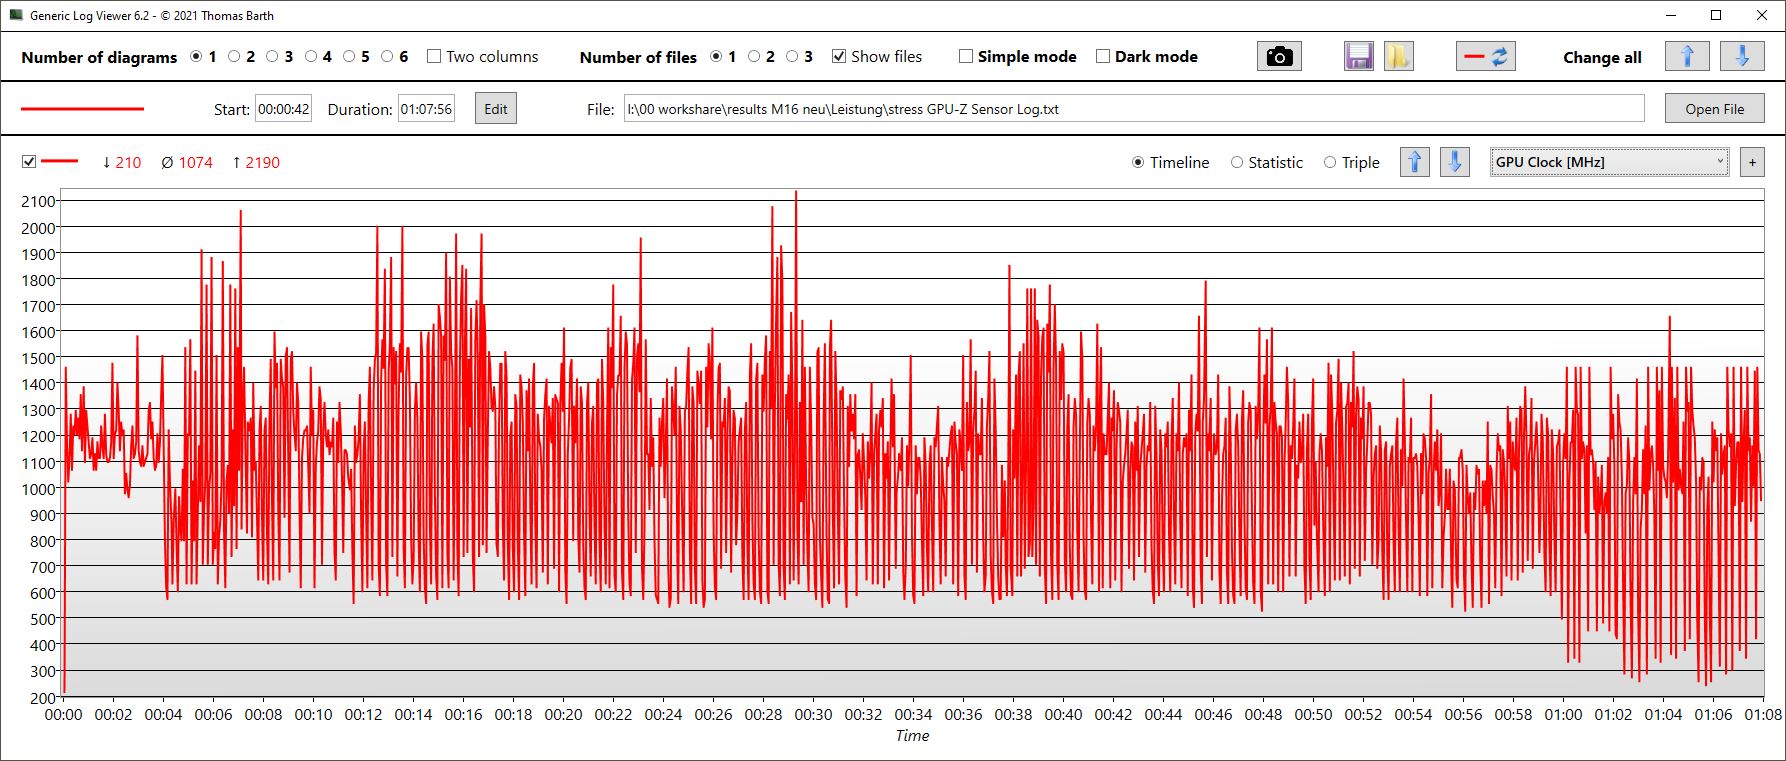
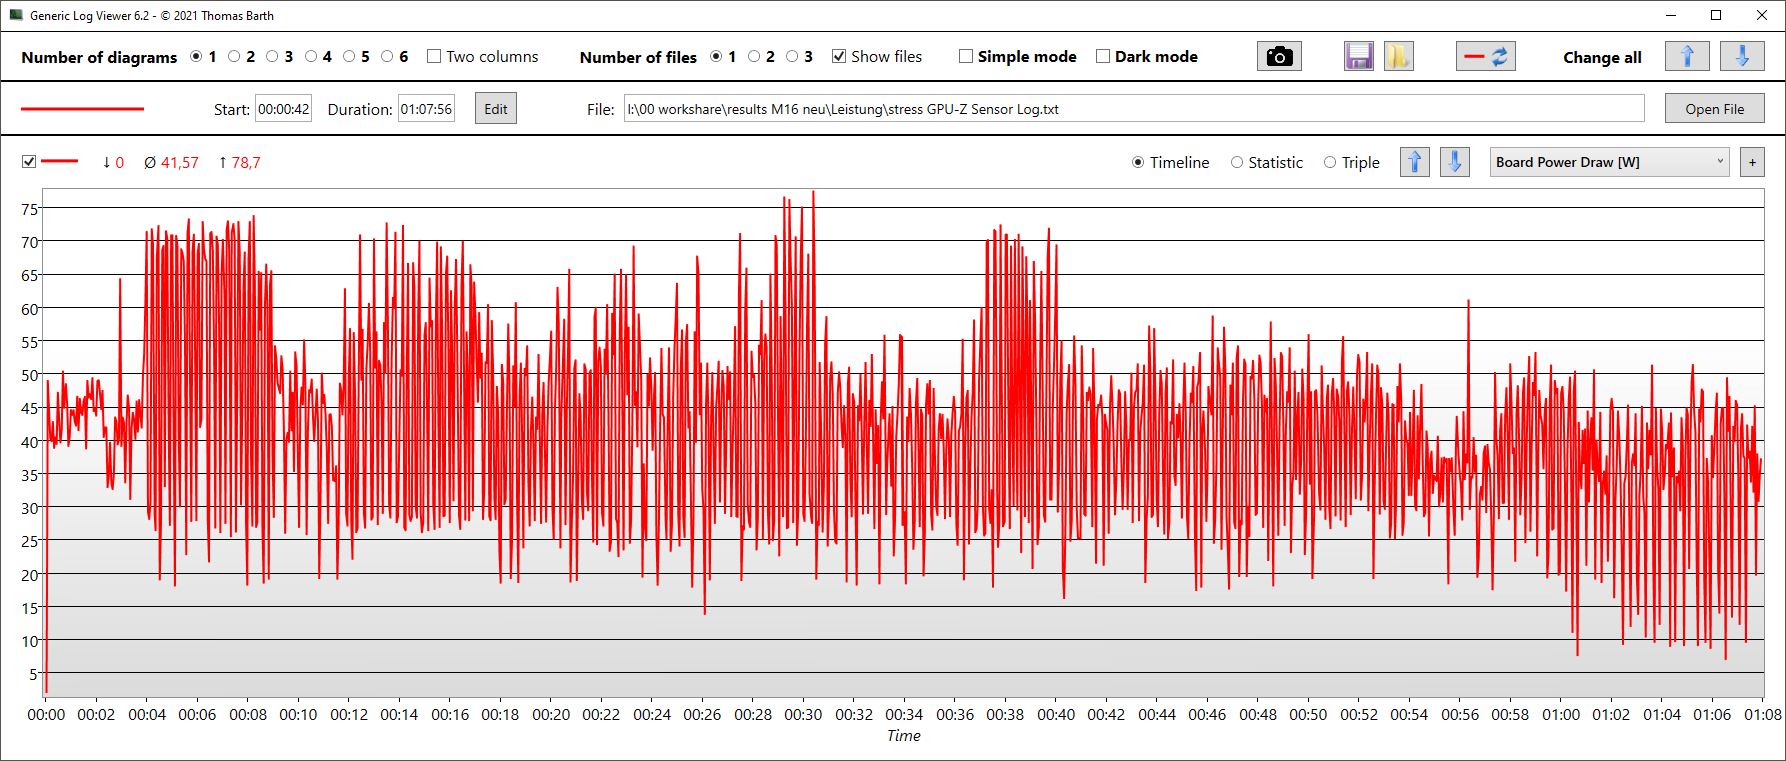
Prueba de esfuerzo
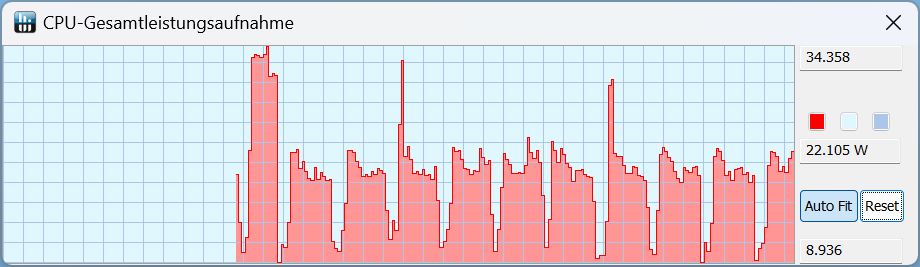
El reloj de la CPU fluctuó entre 2,2 y 4 GHz en la prueba de estrés, en la que las velocidades de reloj rondan el extremo superior durante un periodo de tiempo más largo. Paralelamente, el consumo de energía de la CPU varía y se sitúa, de media, en 77 vatios. Sin embargo, también puede subir a 120 vatios y bajar de nuevo a 40 vatios. Dependiendo de los demás valores, las temperaturas fluctúan de forma similar, con la CPU calentándose hasta 98 °C y una media de 88 °C.
En el modoRendimiento, la diferencia con la CPU en realidad no es tan grande y las temperaturas, el consumo de energía y las velocidades de reloj no son particularmente diferentes entre sí, pero siguen fluctuando a ritmos altos.
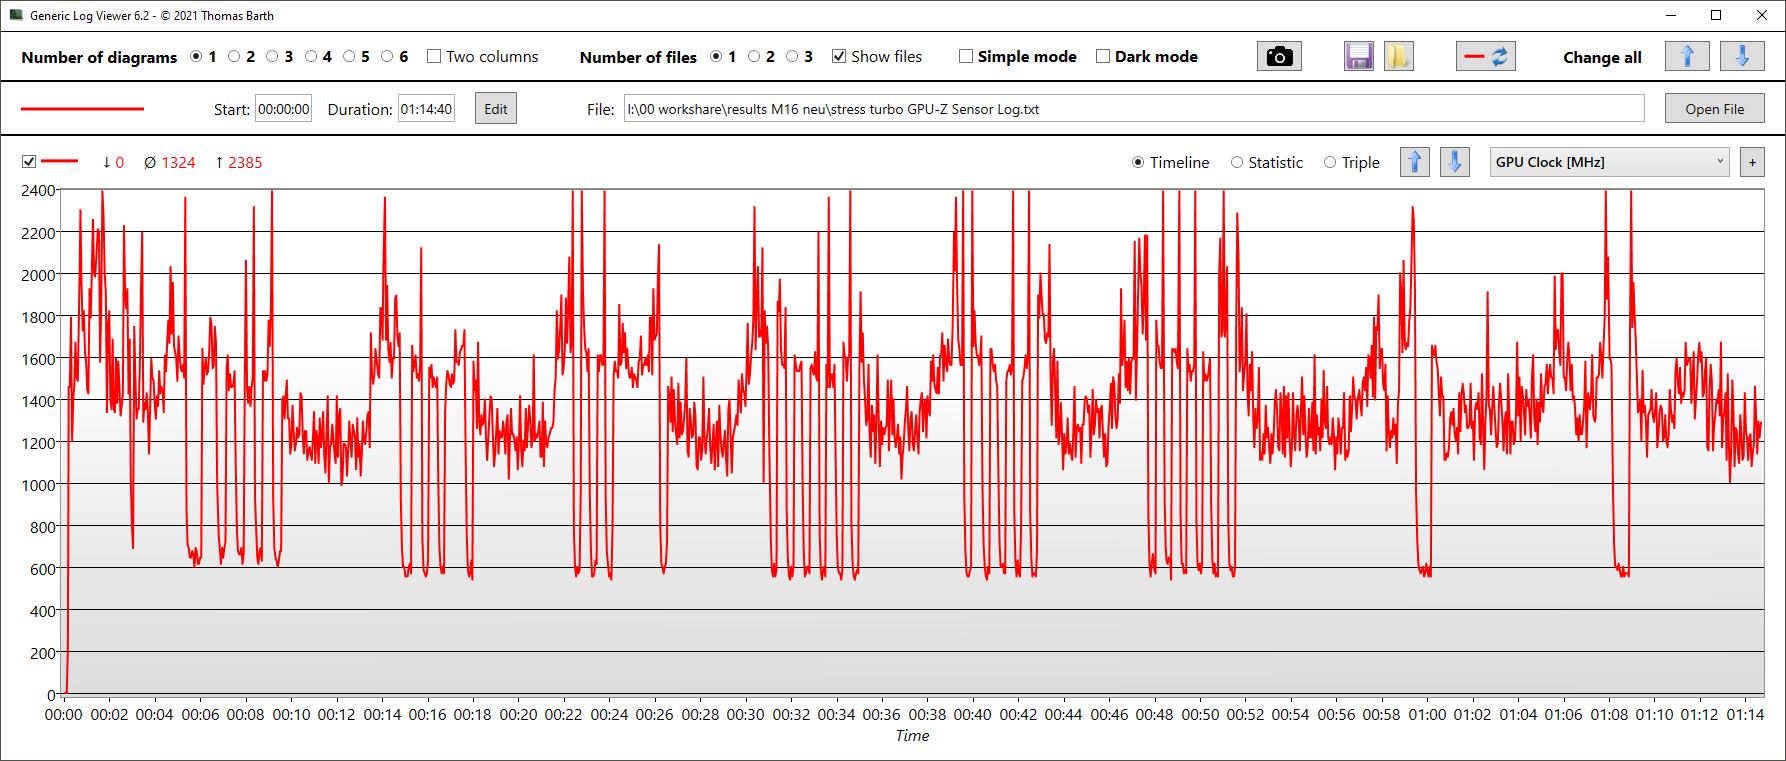
Los valores de la GPU (incluso el reloj de la memoria) fluctúan mucho. La velocidad de reloj del núcleo se sitúa en una media de 1.3 GHz, el consumo medio de energía es de 58 vatios y las temperaturas rondan los 64 °C.
En modoRendimiento, los valores son sólo ligeramente inferiores. La velocidad de reloj cae unos 200 MHz, la temperatura es igual de alta y el consumo ronda los 42 vatios.
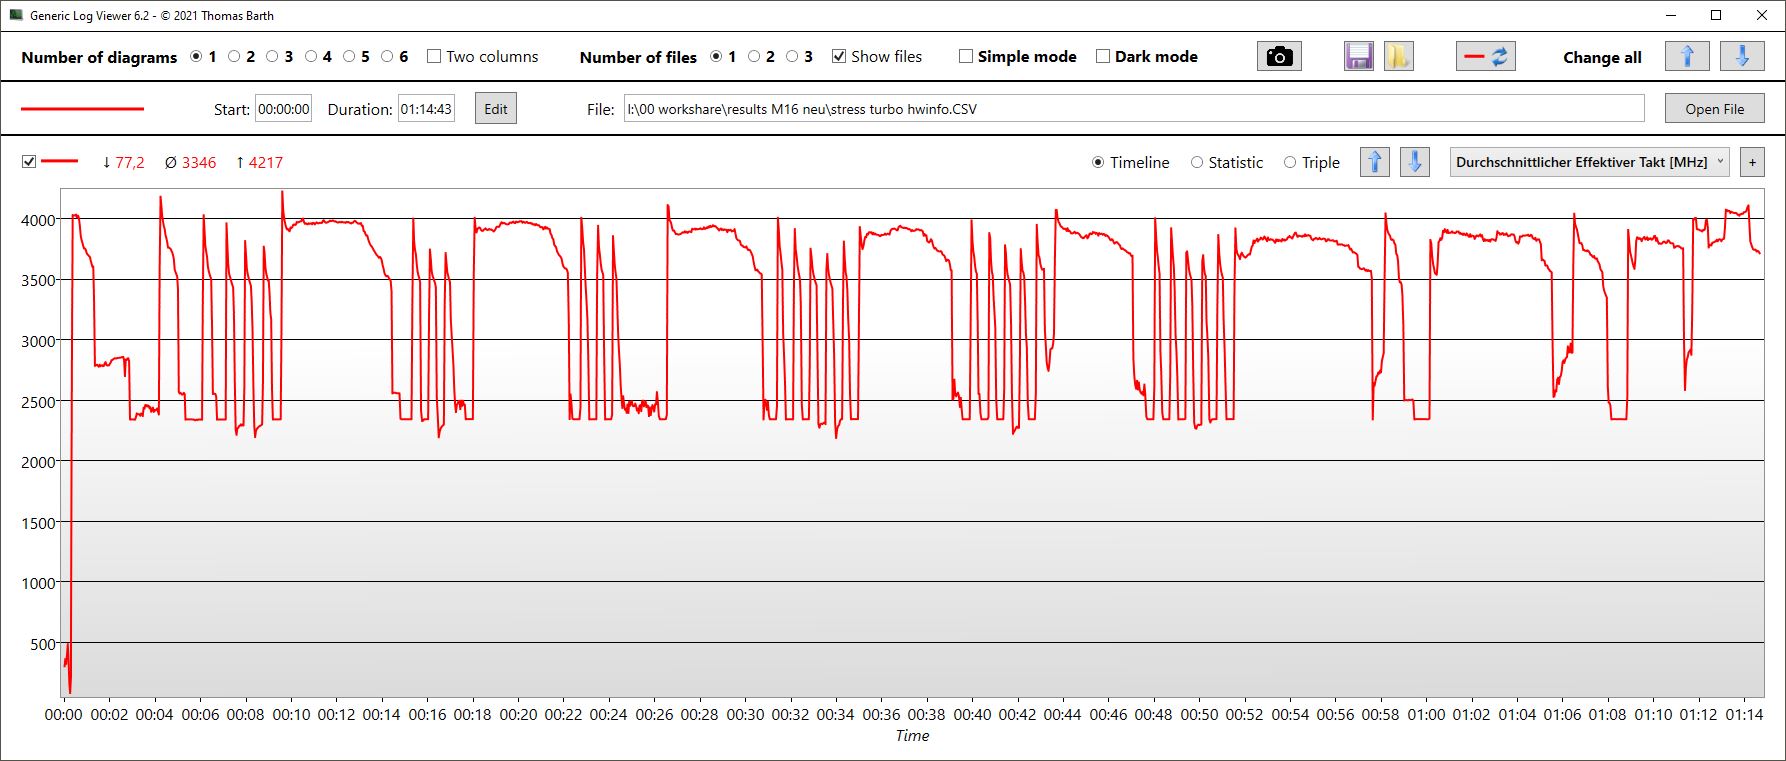
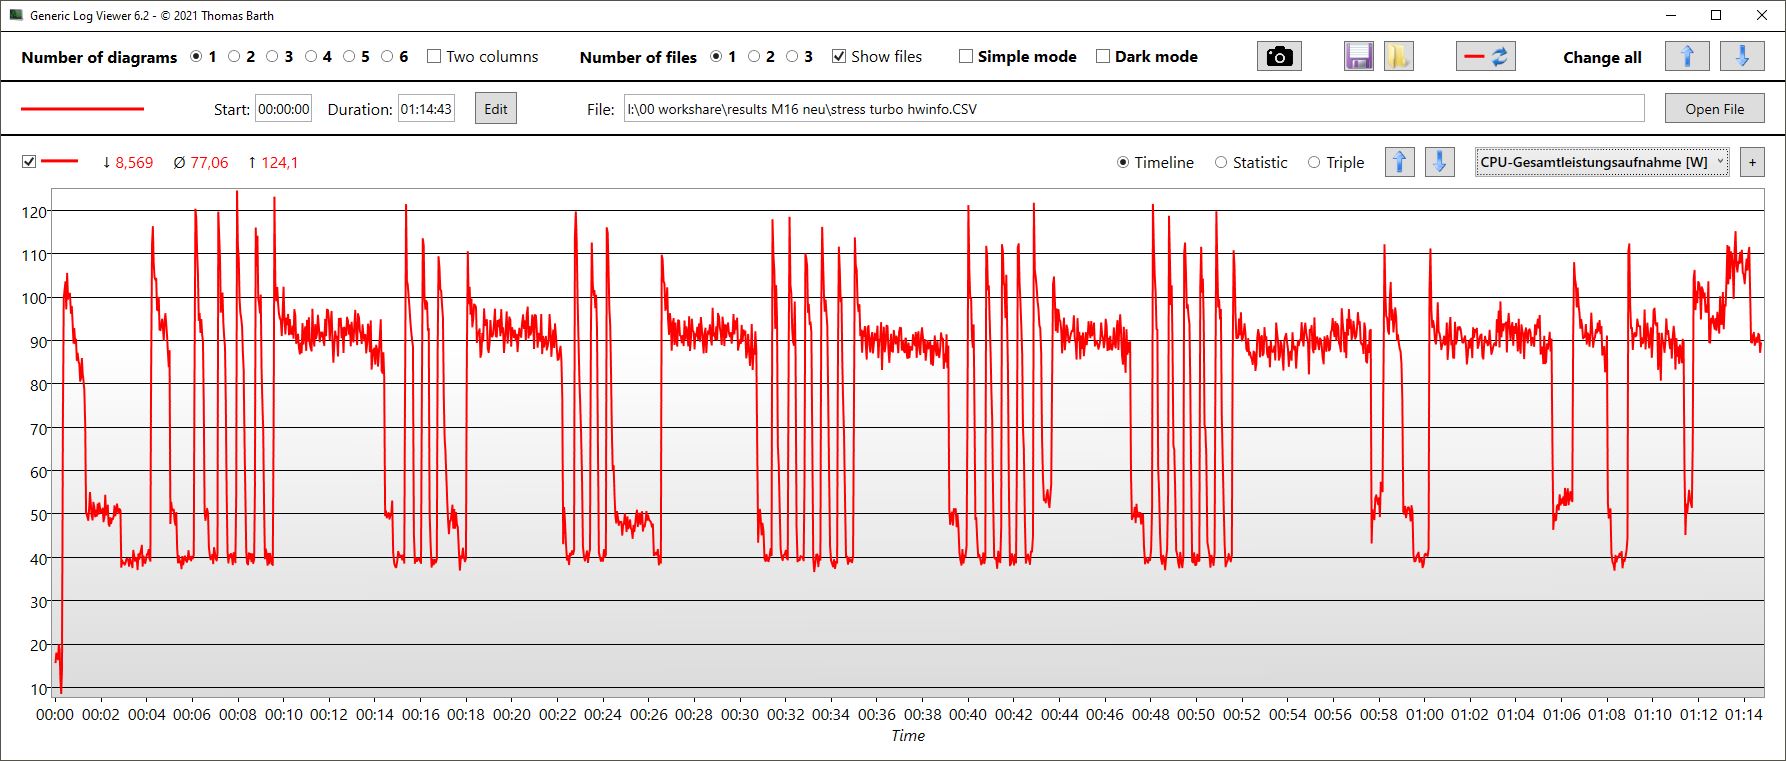
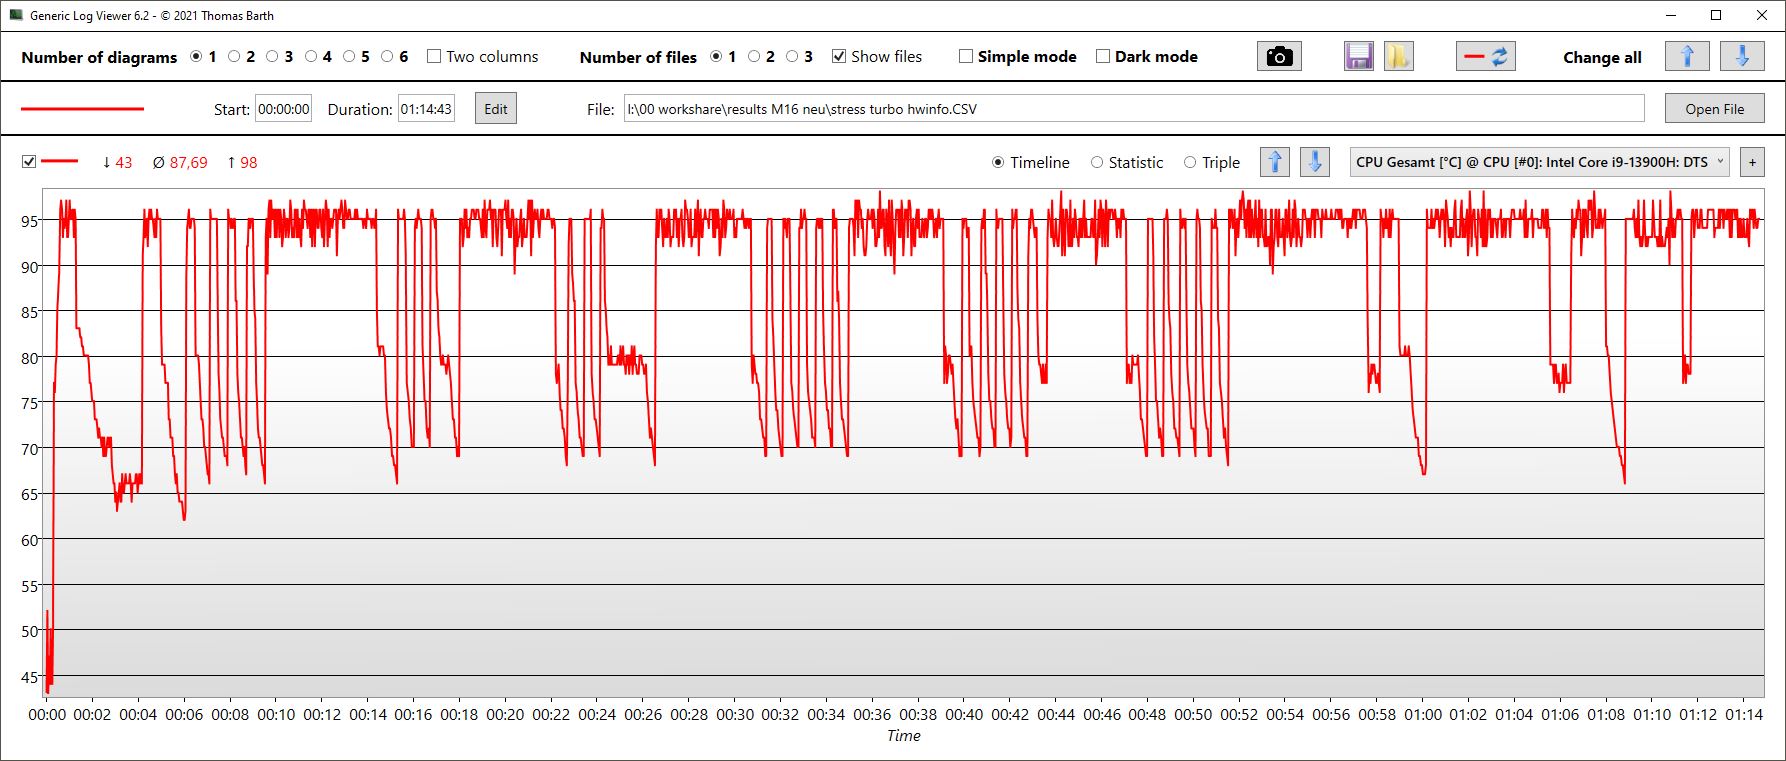
| RelojCPU (GHz) | Reloj GPU (MHz) | Temperatura mediaCPU (°C) | Temperatura media GPU (°C) | |
| Prime95 + FurMark Estrés | 3,3 | 1.324 | 88 | 64 |
| Witcher 3 Estrés | 668 | 1.830 | 69 | 70 |
Altavoces
Comparado con muchos otros fabricantes, Asus ha equipado el portátil con cuatro altavoces en lugar de dos. Esto tiene un efecto positivo ya que pueden llegar a ser relativamente fuertes, ofrecen medios y agudos equilibrados e incluso los graves son un poco más contundentes de lo que es desafortunadamente y típicamente el caso cuando se trata de la competencia.
Se puede disfrutar más del audio conectando un dispositivo analógico externo a través de la toma de audio de 3,5 mm.
Asus ROG Zephyrus M16 GU604VY-NM042X análisis de audio
(+) | los altavoces pueden reproducir a un volumen relativamente alto (#84.45 dB)
Graves 100 - 315 Hz
(±) | lubina reducida - en promedio 11.5% inferior a la mediana
(±) | la linealidad de los graves es media (10.1% delta a frecuencia anterior)
Medios 400 - 2000 Hz
(+) | medios equilibrados - a sólo 4.1% de la mediana
(+) | los medios son lineales (4.9% delta a la frecuencia anterior)
Altos 2 - 16 kHz
(+) | máximos equilibrados - a sólo 1.9% de la mediana
(+) | los máximos son lineales (4.9% delta a la frecuencia anterior)
Total 100 - 16.000 Hz
(+) | el sonido global es lineal (11.1% de diferencia con la mediana)
En comparación con la misma clase
» 8% de todos los dispositivos probados de esta clase eran mejores, 3% similares, 89% peores
» El mejor tuvo un delta de 6%, la media fue 18%, el peor fue ###max##%
En comparación con todos los dispositivos probados
» 7% de todos los dispositivos probados eran mejores, 2% similares, 92% peores
» El mejor tuvo un delta de 4%, la media fue 24%, el peor fue ###max##%
Razer Blade 16 Early 2023 análisis de audio
(+) | los altavoces pueden reproducir a un volumen relativamente alto (#88.2 dB)
Graves 100 - 315 Hz
(-) | casi sin bajos - de media 16.4% inferior a la mediana
(±) | la linealidad de los graves es media (10.8% delta a frecuencia anterior)
Medios 400 - 2000 Hz
(+) | medios equilibrados - a sólo 2.5% de la mediana
(+) | los medios son lineales (2.4% delta a la frecuencia anterior)
Altos 2 - 16 kHz
(+) | máximos equilibrados - a sólo 4.9% de la mediana
(±) | la linealidad de los máximos es media (7.9% delta a frecuencia anterior)
Total 100 - 16.000 Hz
(+) | el sonido global es lineal (12.6% de diferencia con la mediana)
En comparación con la misma clase
» 16% de todos los dispositivos probados de esta clase eran mejores, 3% similares, 81% peores
» El mejor tuvo un delta de 6%, la media fue 18%, el peor fue ###max##%
En comparación con todos los dispositivos probados
» 11% de todos los dispositivos probados eran mejores, 2% similares, 86% peores
» El mejor tuvo un delta de 4%, la media fue 24%, el peor fue ###max##%
Gestión de la energía - Juego eficiente, alto consumo en reposo
Consumo de energía
En los modos de brillo mínimo, silencio y vuelo, el consumo en reposo de unos 20 vatios es algo elevado. Cuando se juega y bajo carga pesada, los procesadores Intel HX parecería dibujar significativamente más energía que algunos de los competidores HX de capacidad similar (incluso aquellos con una RTX 4080) consumen más energía.
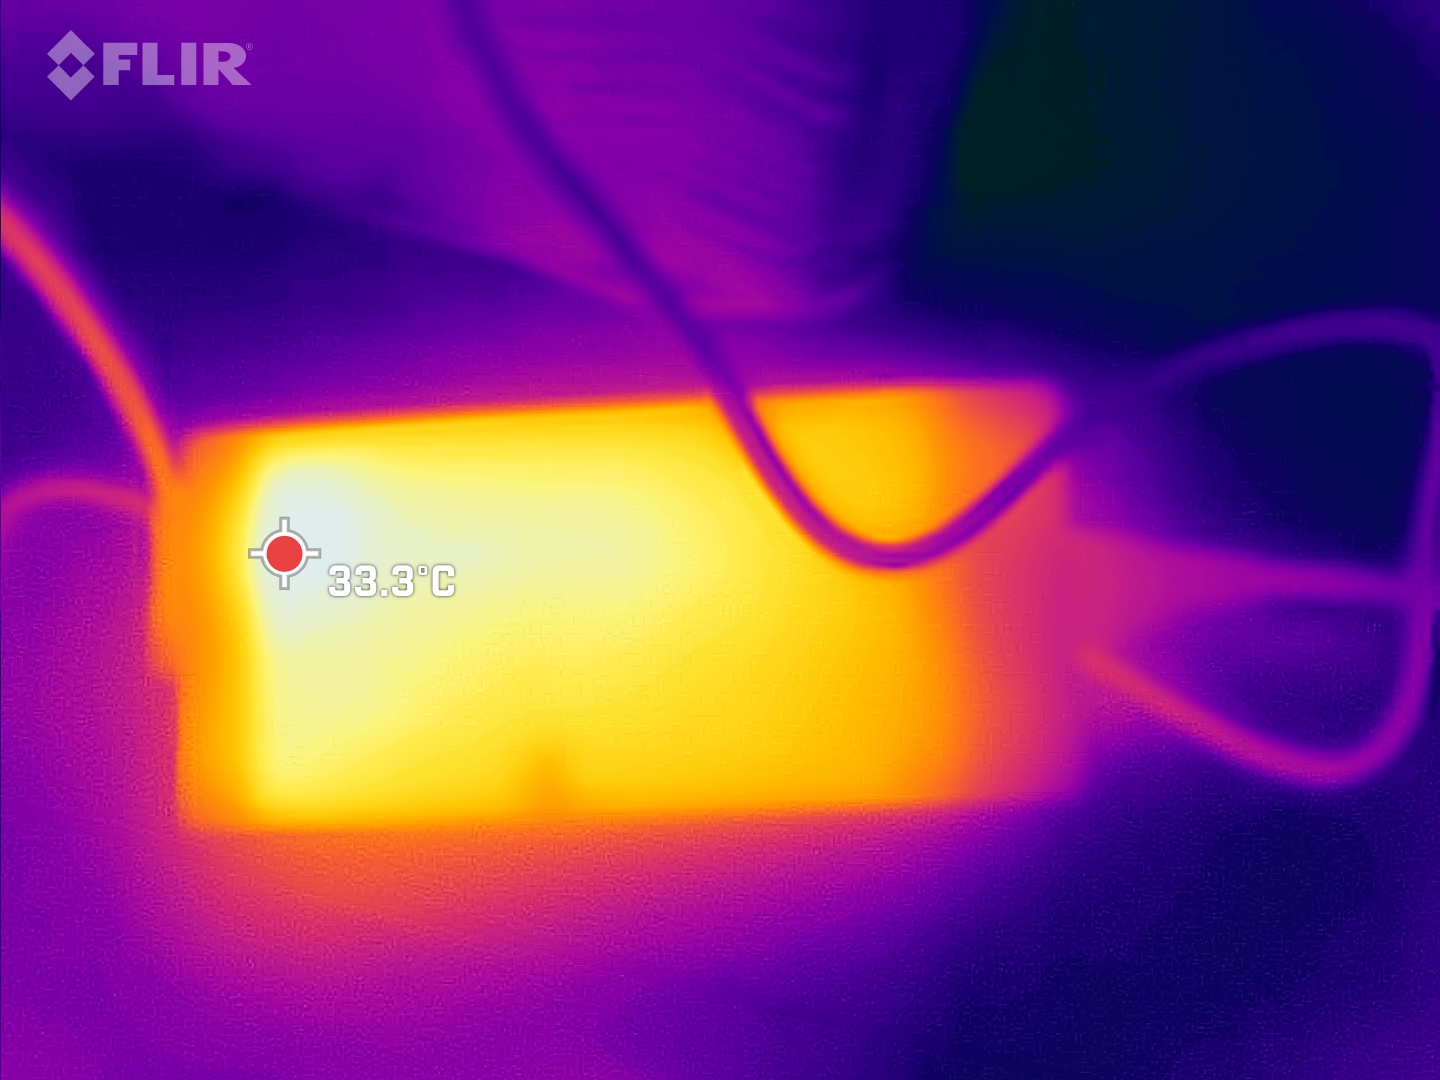
Durante un breve espacio de tiempo, medimos picos de carga de un máximo de 267 vatios en la fuente de alimentación, grande pero plana (unos 18 x 8,3 x 2,5 cm). Está diseñada para 280 vatios, por lo que ofrece reservas de sobra.
| Off / Standby | |
| Ocioso | |
| Carga |
|
Clave:
min: | |
| Asus ROG Zephyrus M16 GU604VY-NM042X i9-13900H, GeForce RTX 4090 Laptop GPU, Samsung PM9A1 MZVL22T0HBLB, IPS, 2560x1600, 16" | Asus ROG Zephyrus M16 GU603Z i9-12900H, GeForce RTX 3070 Ti Laptop GPU, Micron 3400 1TB MTFDKBA1T0TFH, IPS, 2560x1600, 16" | Asus ROG Strix Scar 18 2023 G834JY-N6005W i9-13980HX, GeForce RTX 4090 Laptop GPU, 2x Samsung PM9A1 MZVL21T0HCLR (RAID 0), IPS, 2560x1600, 18" | MSI Titan GT77 HX 13VI i9-13950HX, GeForce RTX 4090 Laptop GPU, Samsung PM9A1 MZVL22T0HBLB, Mini-LED, 3840x2160, 17.3" | Lenovo Legion Pro 7 16IRX8H i9-13900HX, GeForce RTX 4080 Laptop GPU, Samsung PM9A1 MZVL21T0HCLR, IPS, 2560x1600, 16" | Razer Blade 16 Early 2023 i9-13950HX, GeForce RTX 4080 Laptop GPU, SSSTC CA6-8D1024, IPS, 2560x1600, 16" | Medio NVIDIA GeForce RTX 4090 Laptop GPU | Media de la clase Gaming | |
|---|---|---|---|---|---|---|---|---|
| Power Consumption | 24% | -26% | -10% | -14% | -17% | -11% | 12% | |
| Idle Minimum * (Watt) | 20 | 10.8 46% | 17.3 13% | 14 30% | 18 10% | 15.2 24% | 16.2 ? 19% | 13.2 ? 34% |
| Idle Average * (Watt) | 24 | 17 29% | 27 -13% | 21.6 10% | 24 -0% | 22.8 5% | 23.1 ? 4% | 18.9 ? 21% |
| Idle Maximum * (Watt) | 25 | 17.8 29% | 46 -84% | 24.8 1% | 32 -28% | 49.8 -99% | 34.2 ? -37% | 24.3 ? 3% |
| Load Average * (Watt) | 107 | 116 -8% | 133 -24% | 122.5 -14% | 130 -21% | 121.2 -13% | 130.5 ? -22% | 108.3 ? -1% |
| Witcher 3 ultra * (Watt) | 208 | 144 31% | 265 -27% | 260 -25% | 242 -16% | |||
| Load Maximum * (Watt) | 267 | 220 18% | 329 -23% | 418 -57% | 320 -20% | 273.7 -3% | 324 ? -21% | 254 ? 5% |
* ... más pequeño es mejor
Power consumption Witcher 3 / Stress test
Power consumption with an external monitor
Duración de la batería
El Zephyrus M16 tiene una batería con una capacidad de 90 vatios, lo que significa que el portátil Asus puede alcanzar unas 4,5 horas de uso de WiFi a brillo reducido.
A brillo máximo, son posibles 3 horas de navegación por internet (Mini-LED multizona). A brillo reducido, esto puede aumentar a casi 4,5 horas.
En general, la duración de la batería no es particularmente buena y esto se debe al alto consumo en reposo.
| Asus ROG Zephyrus M16 GU604VY-NM042X i9-13900H, GeForce RTX 4090 Laptop GPU, 90 Wh | Asus ROG Zephyrus M16 GU603Z i9-12900H, GeForce RTX 3070 Ti Laptop GPU, 90 Wh | Asus ROG Strix Scar 18 2023 G834JY-N6005W i9-13980HX, GeForce RTX 4090 Laptop GPU, 90 Wh | MSI Titan GT77 HX 13VI i9-13950HX, GeForce RTX 4090 Laptop GPU, 99.9 Wh | Lenovo Legion Pro 7 16IRX8H i9-13900HX, GeForce RTX 4080 Laptop GPU, 99.9 Wh | Razer Blade 16 Early 2023 i9-13950HX, GeForce RTX 4080 Laptop GPU, 95.2 Wh | Media de la clase Gaming | |
|---|---|---|---|---|---|---|---|
| Duración de Batería | 24% | 14% | -1% | -5% | -5% | 29% | |
| H.264 (h) | 4.8 | 7.3 52% | 7 46% | 6 25% | 8.26 ? 72% | ||
| WiFi v1.3 (h) | 4.3 | 7.4 72% | 7.1 65% | 5.3 23% | 5.1 19% | 6.1 42% | 7.04 ? 64% |
| Load (h) | 2.9 | 1.4 -52% | 0.9 -69% | 1.4 -52% | 2.1 -28% | 1.4 -52% | 1.47 ? -49% |
| Witcher 3 ultra (h) | 0.9 | ||||||
| Reader / Idle (h) | 6.4 | 8.9 | 8.71 ? |
Pro
Contra
Veredicto - No está (aún) tan optimizado como su predecesor

Cuando se trata de las nuevas generaciones de portátiles, a los fabricantes les gusta enviarnos sistemas de gama alta. Y sí, laRTX 4090e Intel Gen13 no sólo son impresionantes sobre el papel. En comparación con la generación anterior, el rendimiento y la eficiencia han mejorado notablemente. Además, la maravillosa pantalla Mini-LED Nebula se disputa el protagonismo y casi consigue dejar en la sombra a la CPU y la GPU.
Su predecesor ya nos pareció una máquina de juegos completa y bien optimizada. En general, pero no inequívocamente, eso también se aplica al nuevo Asus M16. Al igual que la mayoría de los nuevos portátiles actuales, estamos ante un doble salto generacional en términos de CPU y GPU. Sin embargo, este cambio no siempre se produce sin problemas. Muchos portátiles RTX 40 sufren actualmente de altas latencias debido a optimizaciones de controladores aún no finalizadas. Además, el consumo de energía en reposo de la M16 es algo demasiado elevado. Esto hace que la duración de la batería no sea óptima, pero es algo que podría solucionarse con la ayuda de una actualización de software. También es un poco molesto que Asus haya hecho el mantenimiento innecesariamente difícil debido a muchos tornillos ocultos y RAM SO-DIMM. Además, la omisión de un puerto LAN es difícil de entender para los jugones y la RTX 4090 de gama alta con una CPU H "sólo" corre tan rápido como unaRTX 4080con una CPU HX.
El Asus ROG Zephyrus M16 emparejado con una RTX 4090 es un potente paquete de juego, con una fantástica pantalla Mini-LED y potencia de sobra, incluso en 4K. Sin embargo, el precio es elevado y hay algunos pequeños problemas que hay que solucionar.
Para muchos, el elevadísimo precio será un verdadero inconveniente pero, como siempre, analizaremos exhaustivamente posibles alternativas (más baratas) a medida que vayan llegando.
Precio y disponibilidad
Actualmente, sólo es posible hacer un pedido anticipado de la nueva M16. Sin embargo, está previsto que la máquina aparezca este mes (marzo de 2023).
Asus ROG Zephyrus M16 GU604VY-NM042X
- 03/15/2023 v7 (old)
Christian Hintze
Transparencia
La selección de los dispositivos que se van a reseñar corre a cargo de nuestro equipo editorial. La muestra de prueba fue proporcionada al autor en calidad de préstamo por el fabricante o el minorista a los efectos de esta reseña. El prestamista no tuvo ninguna influencia en esta reseña, ni el fabricante recibió una copia de la misma antes de su publicación. No había ninguna obligación de publicar esta reseña. Como empresa de medios independiente, Notebookcheck no está sujeta a la autoridad de fabricantes, minoristas o editores.
Así es como prueba Notebookcheck
Cada año, Notebookcheck revisa de forma independiente cientos de portátiles y smartphones utilizando procedimientos estandarizados para asegurar que todos los resultados son comparables. Hemos desarrollado continuamente nuestros métodos de prueba durante unos 20 años y hemos establecido los estándares de la industria en el proceso. En nuestros laboratorios de pruebas, técnicos y editores experimentados utilizan equipos de medición de alta calidad. Estas pruebas implican un proceso de validación en varias fases. Nuestro complejo sistema de clasificación se basa en cientos de mediciones y puntos de referencia bien fundamentados, lo que mantiene la objetividad.Price comparison

