Análisis del Asus ROG Strix Scar 17 SE - Portátil para juegos totalmente equipado con RTX 3080 Ti
El ROG Strix Scar SE es el buque insignia gaming de Asus, y también en 2022 vuelve a estar equipado con los componentes más rápidos que hay actualmente en el mercado. Probamos el modelo superior G733CX con el Intel Core i9-12950HX, la Nvidia GeForce RTX 3080 Ti, dos SSDs de 2-TB de Samsung, y un rápido panel QHD con una tasa de refresco de 240-Hz. El precio también es de gama alta, ya que el MSRP de nuestra unidad de pruebas es de 3,999 Euros.
Posibles contendientes en la comparación
Valoración | Fecha | Modelo | Peso | Altura | Tamaño | Resolución | Precio |
|---|---|---|---|---|---|---|---|
| 86.9 % v7 (old) | 11/2022 | Asus ROG Strix Scar 17 SE G733CX-LL014W i9-12950HX, GeForce RTX 3080 Ti Laptop GPU | 2.9 kg | 28.3 mm | 17.30" | 2560x1440 | |
| 88.9 % v7 (old) | 09/2022 | Lenovo Legion 7 16IAX7-82TD004SGE i9-12900HX, GeForce RTX 3080 Ti Laptop GPU | 2.6 kg | 20 mm | 16.00" | 2560x1600 | |
| 88.3 % v7 (old) | 08/2022 | MSI Titan GT77 12UHS i9-12900HX, GeForce RTX 3080 Ti Laptop GPU | 3.3 kg | 23 mm | 17.30" | 1920x1080 | |
| 87.6 % v7 (old) | 09/2022 | Schenker XMG Neo 17 M22 R9 6900HX, GeForce RTX 3080 Ti Laptop GPU | 2.8 kg | 27 mm | 17.00" | 2560x1600 | |
| 89.2 % v7 (old) | 05/2022 | Alienware x17 R2 P48E i9-12900HK, GeForce RTX 3080 Ti Laptop GPU | 3.1 kg | 20.9 mm | 17.30" | 1920x1080 |
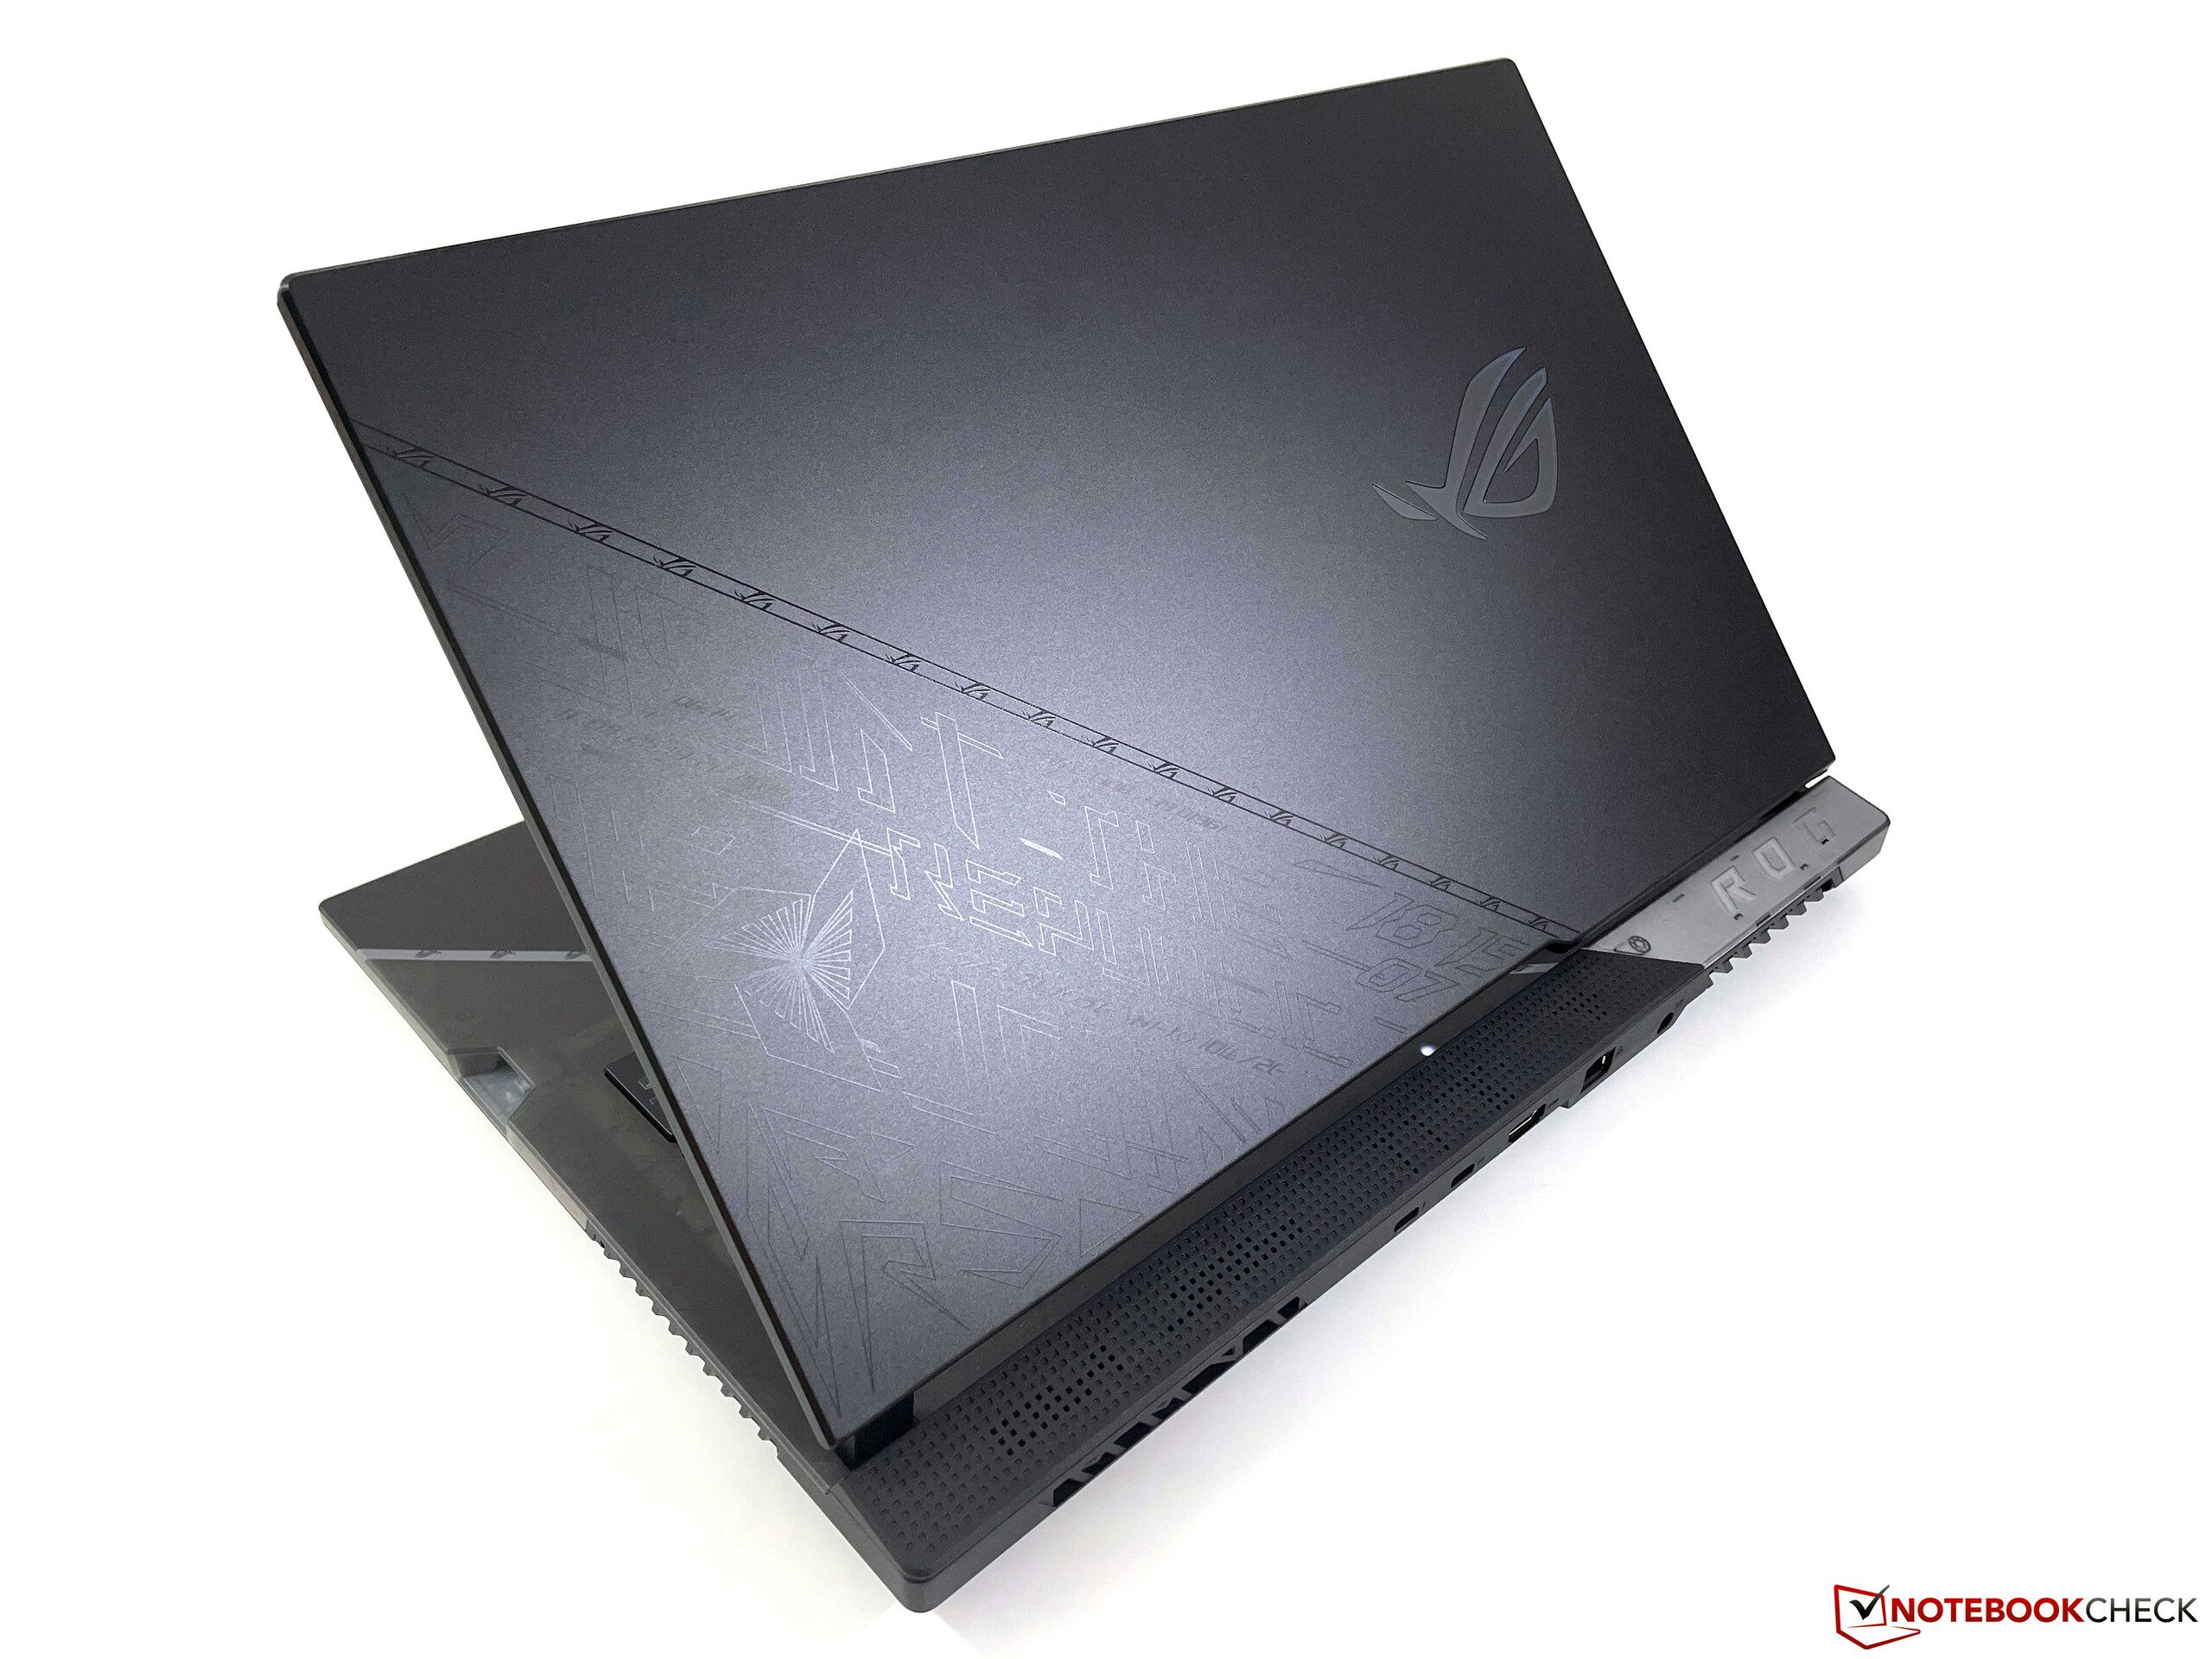
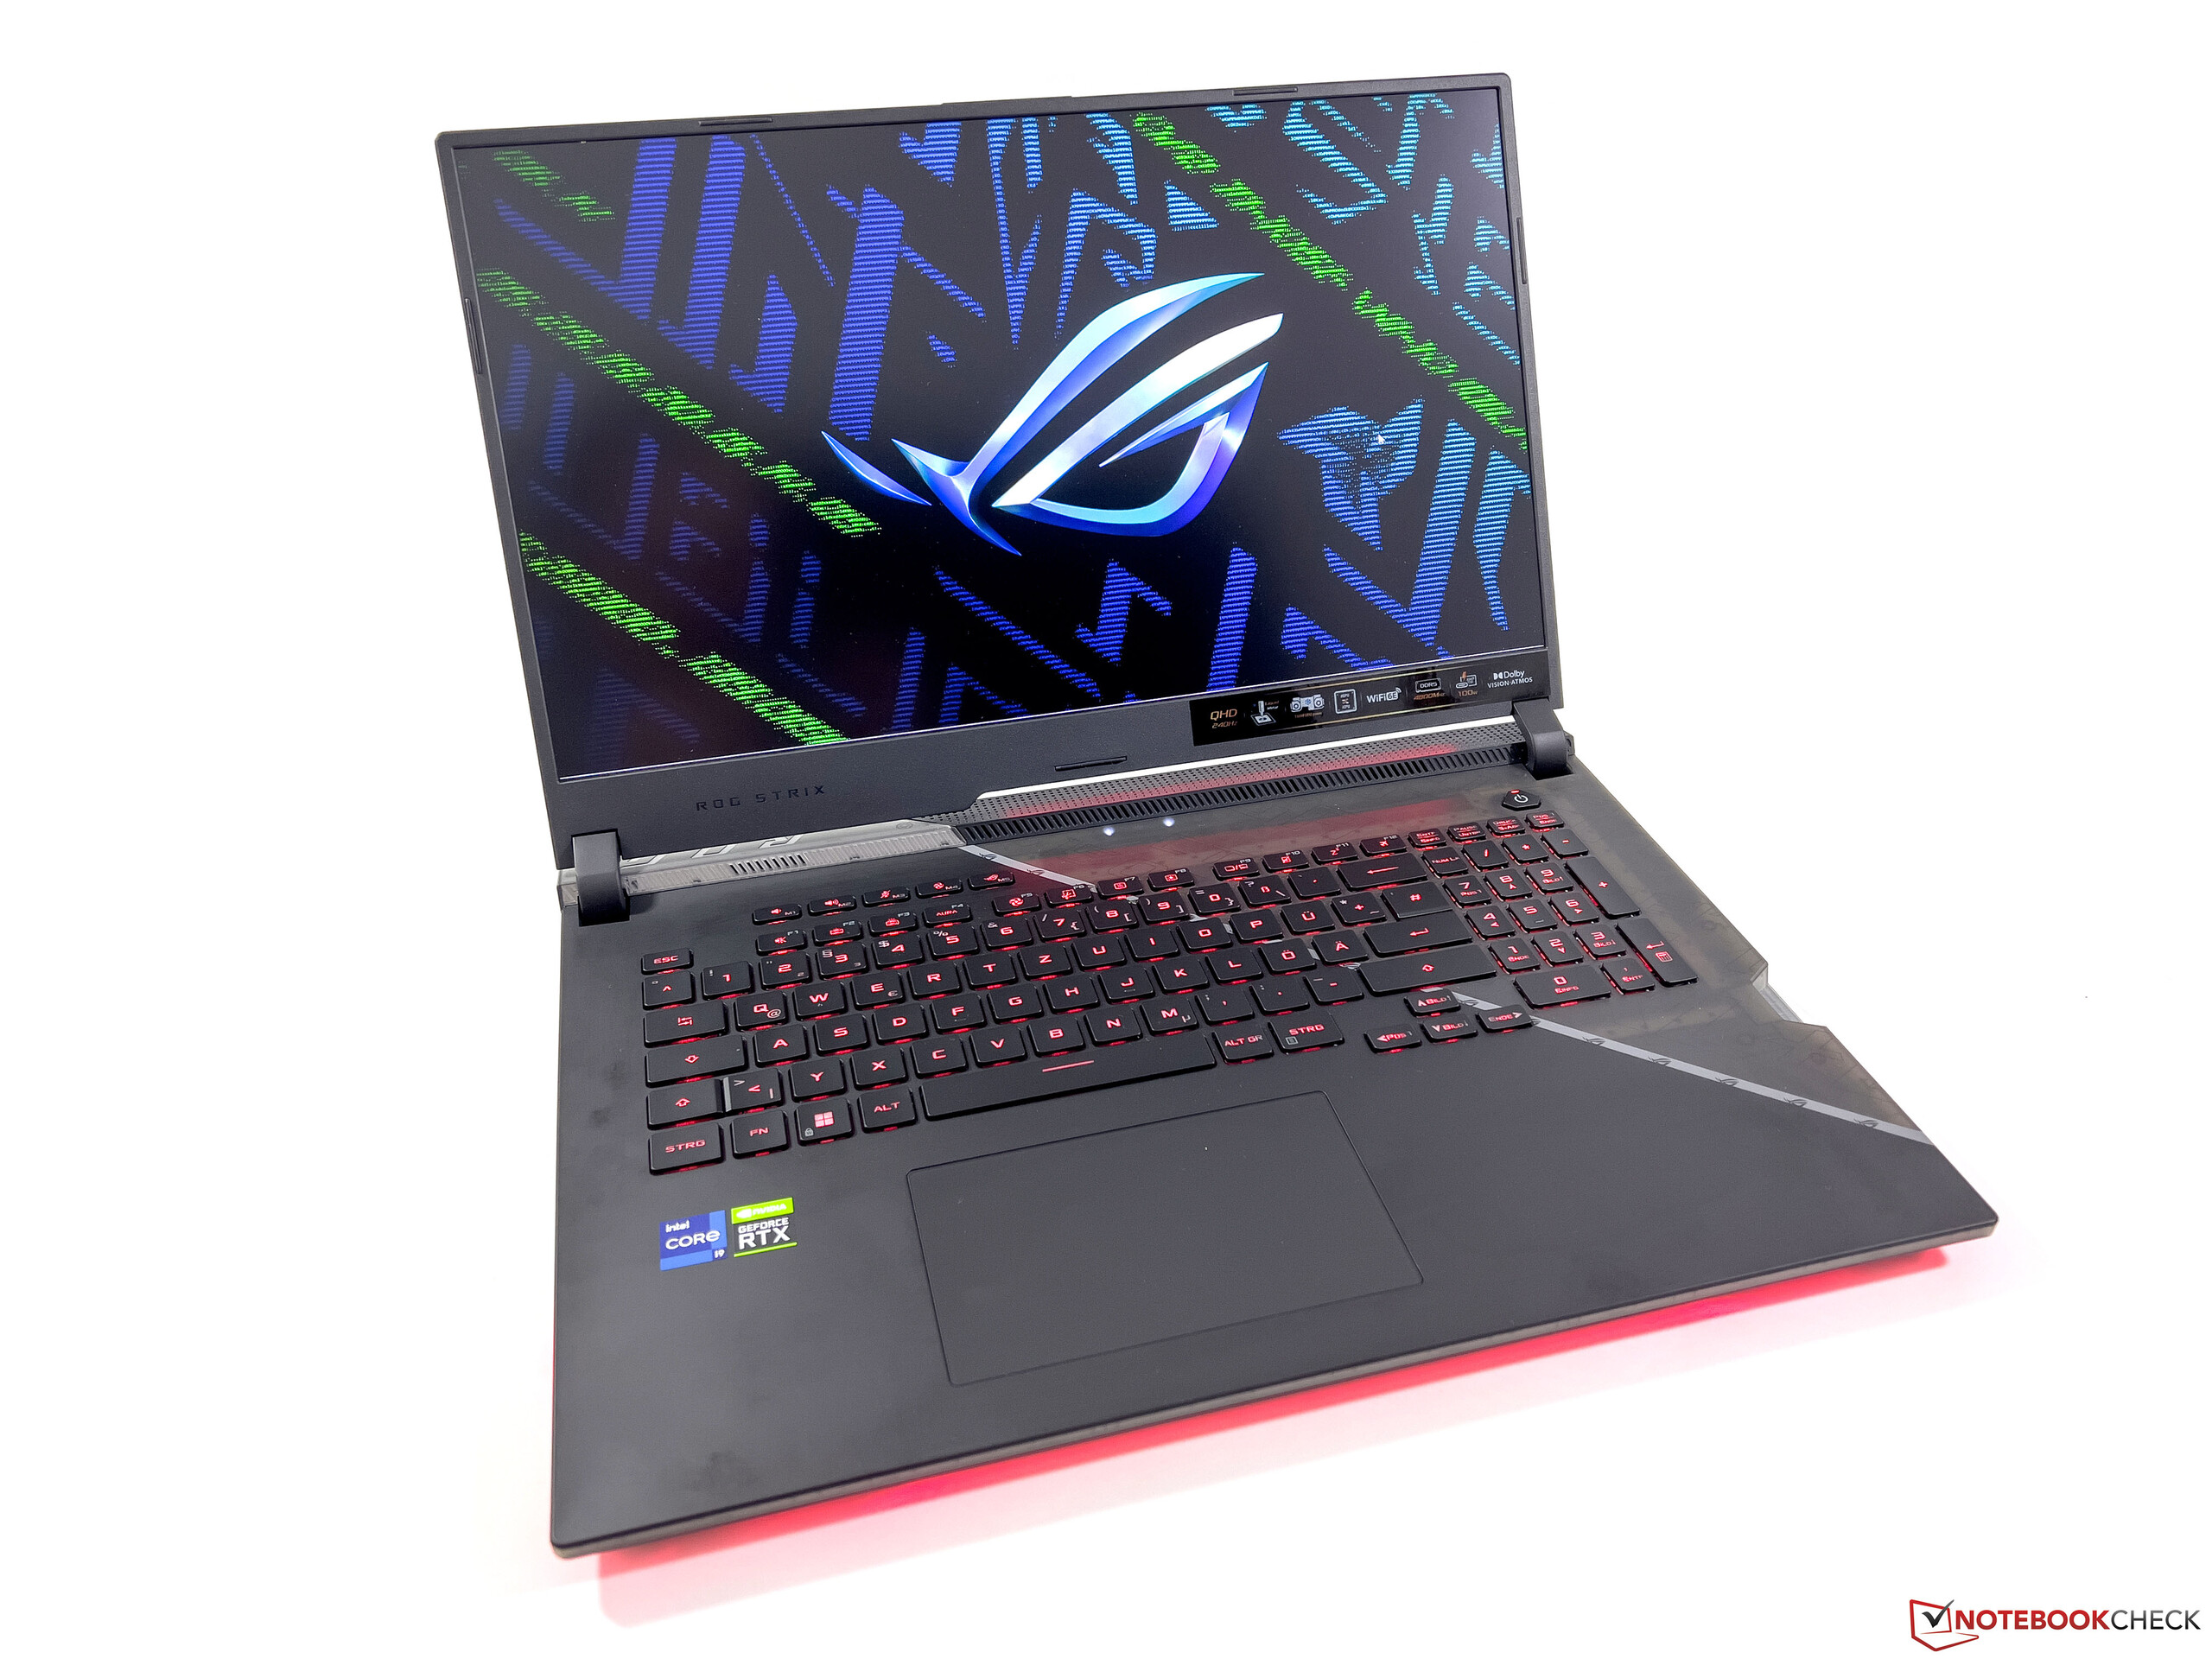
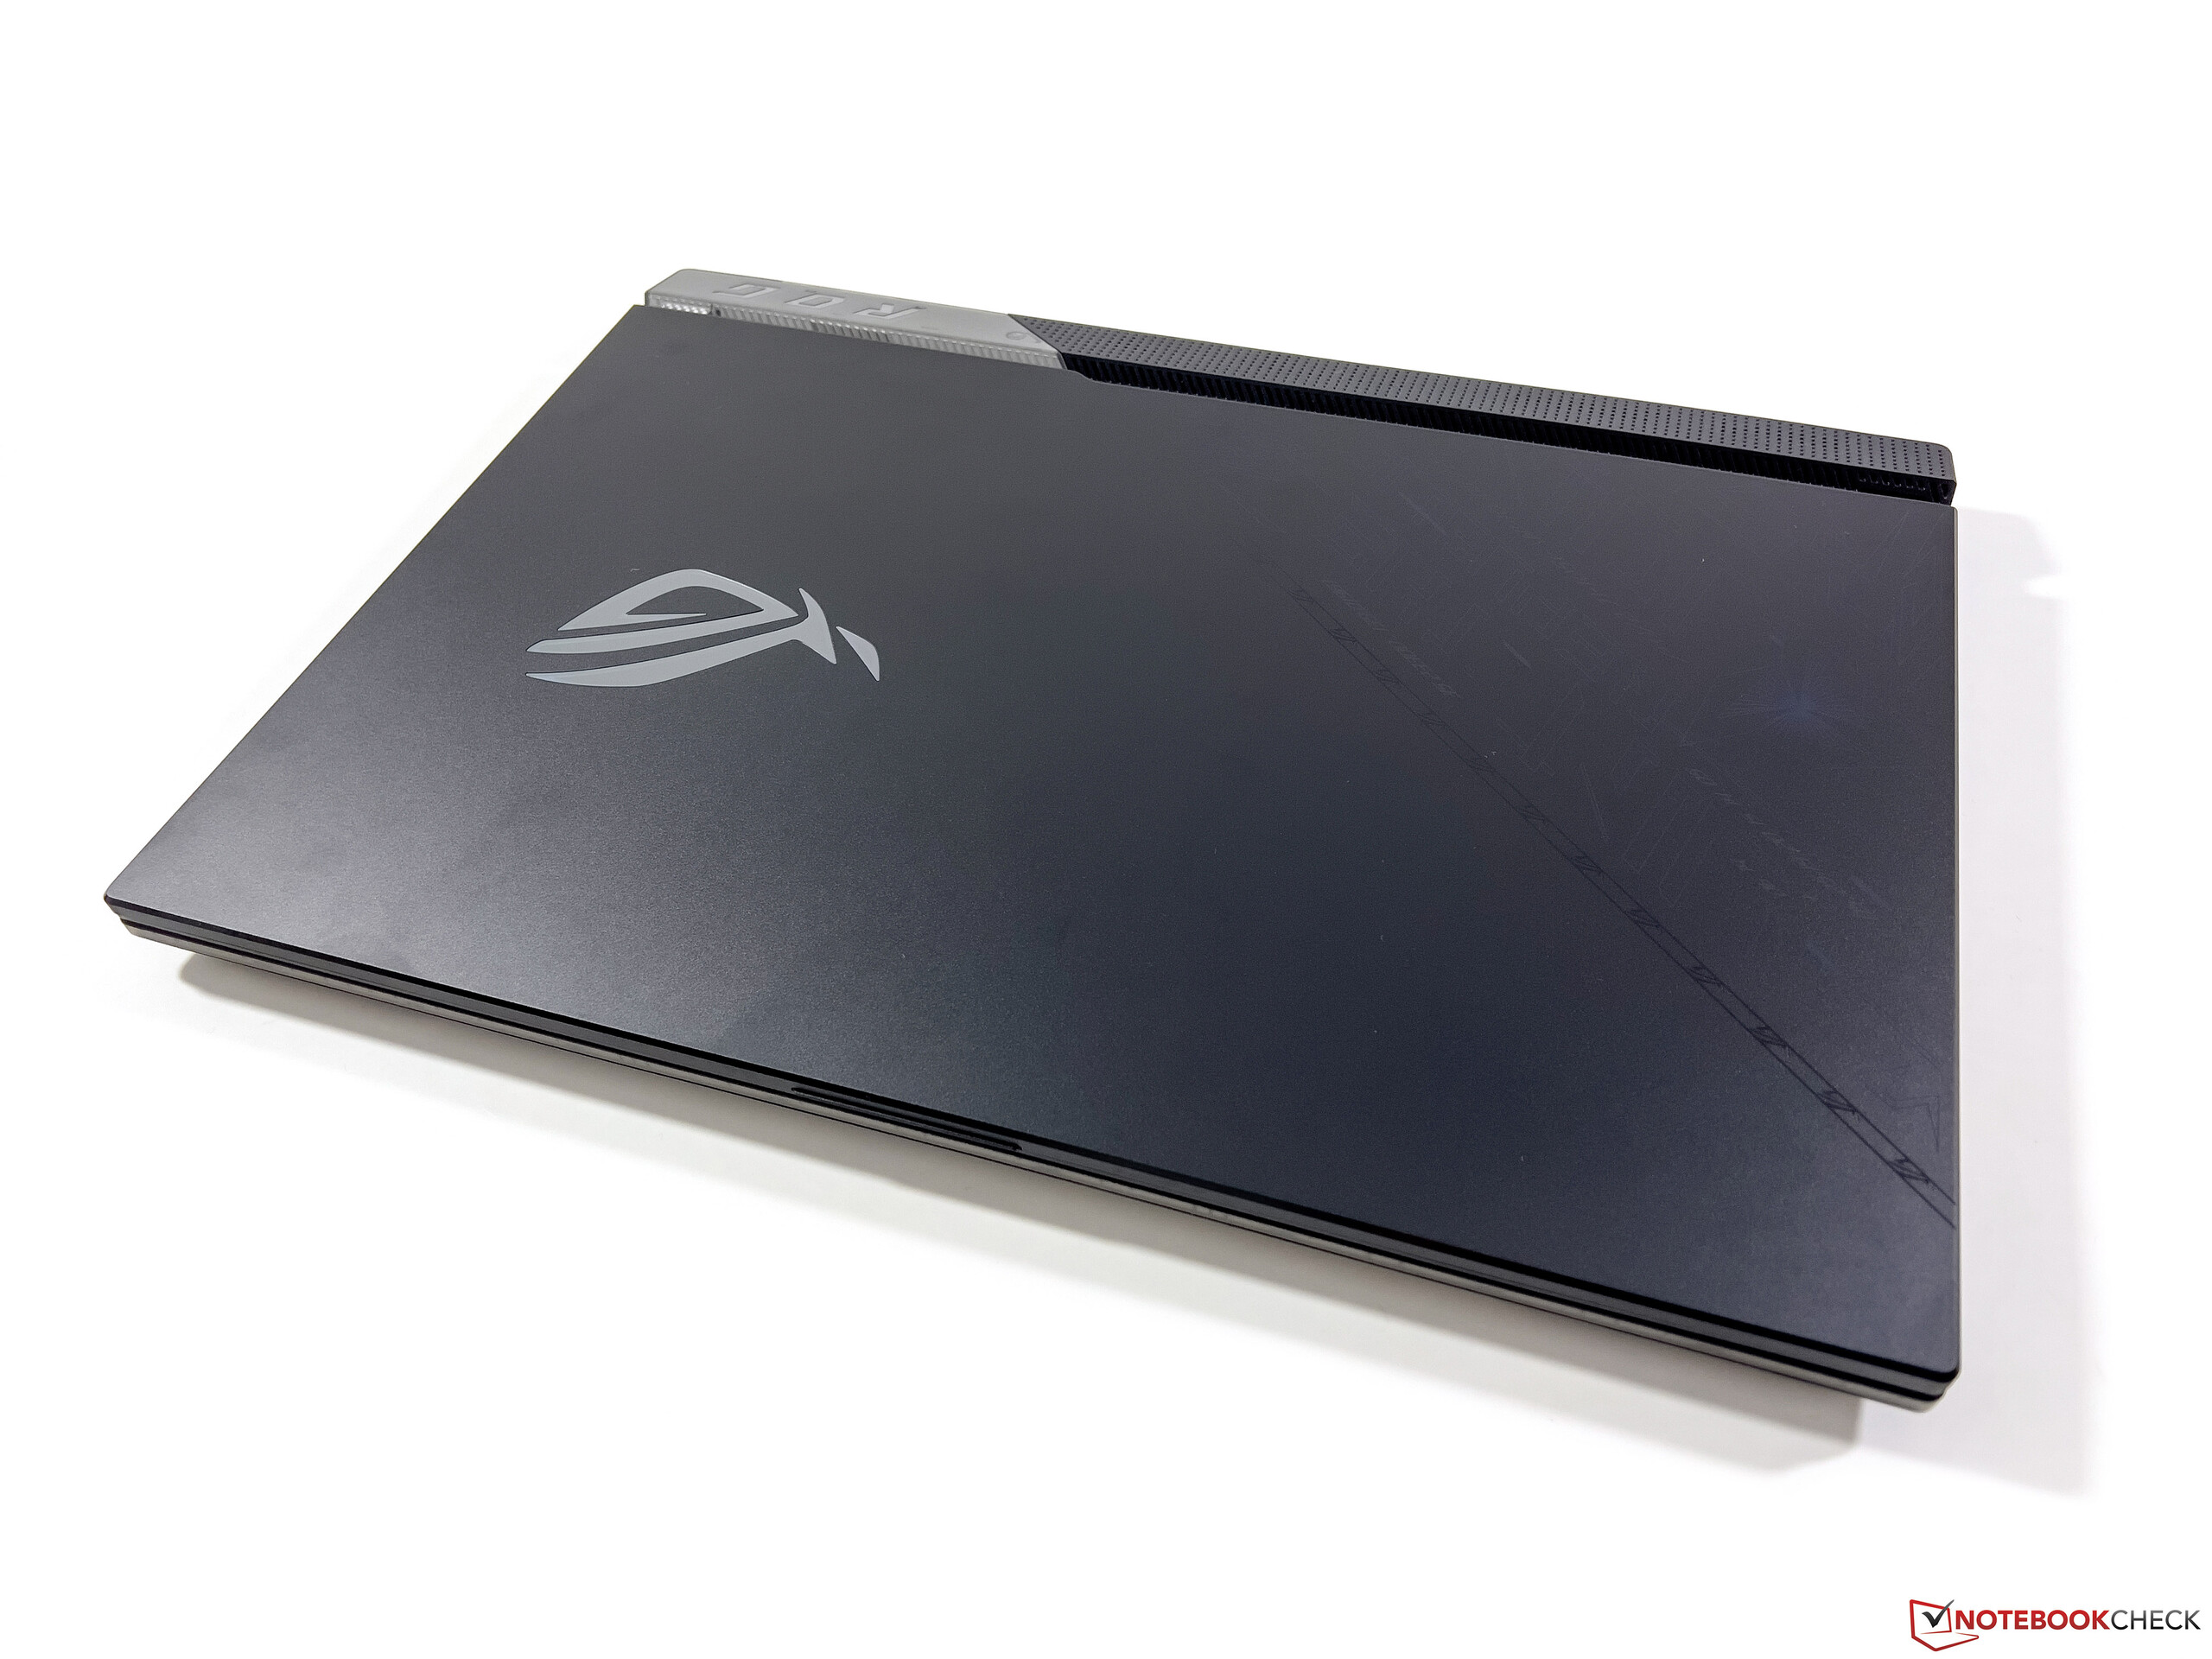
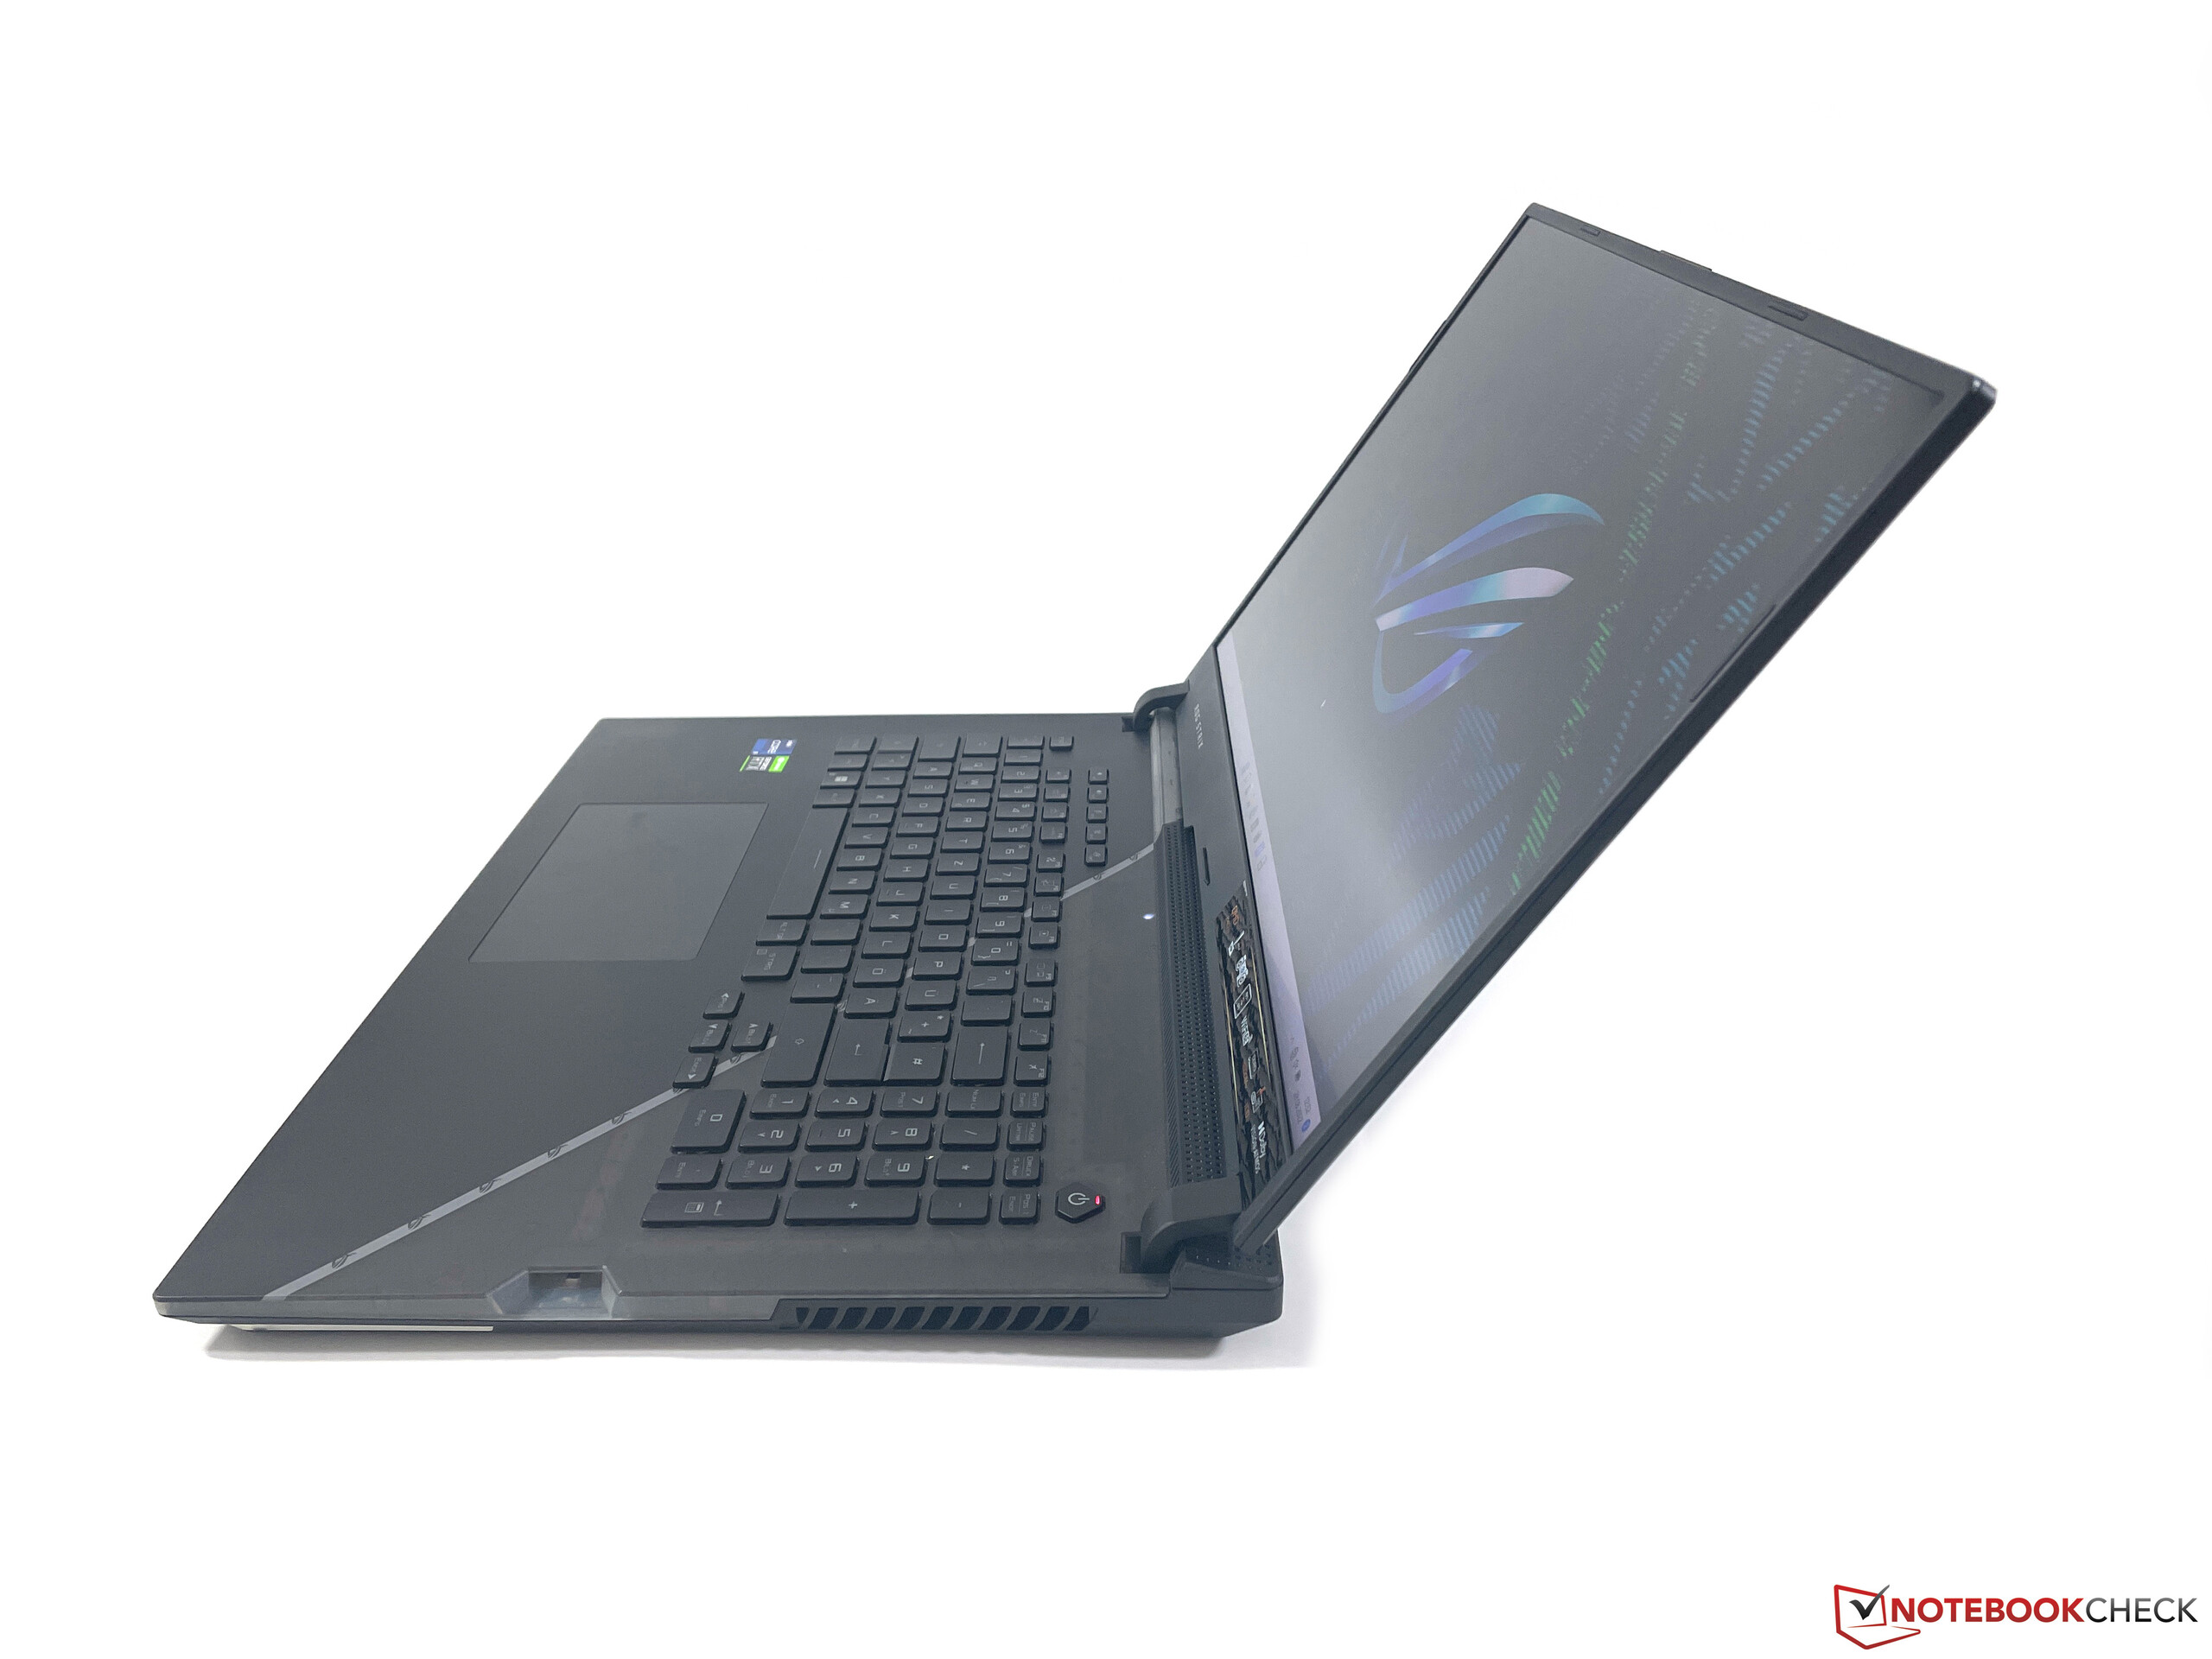
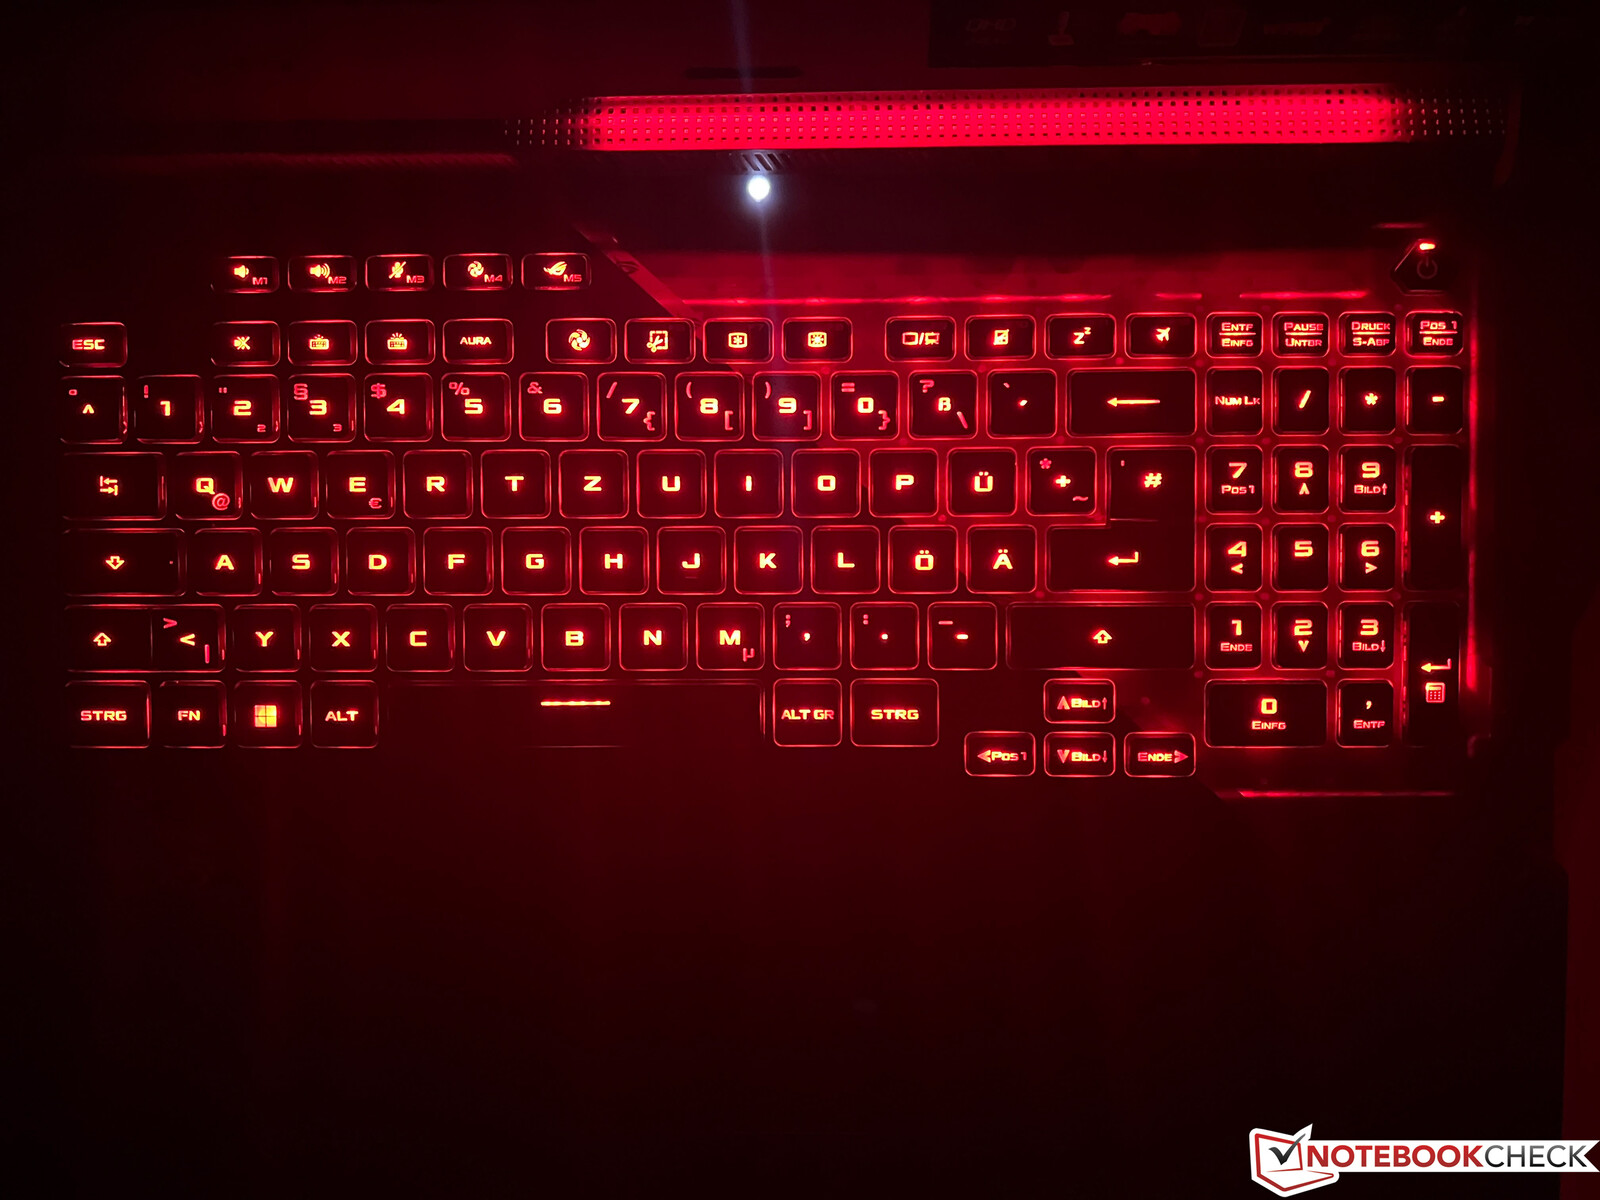
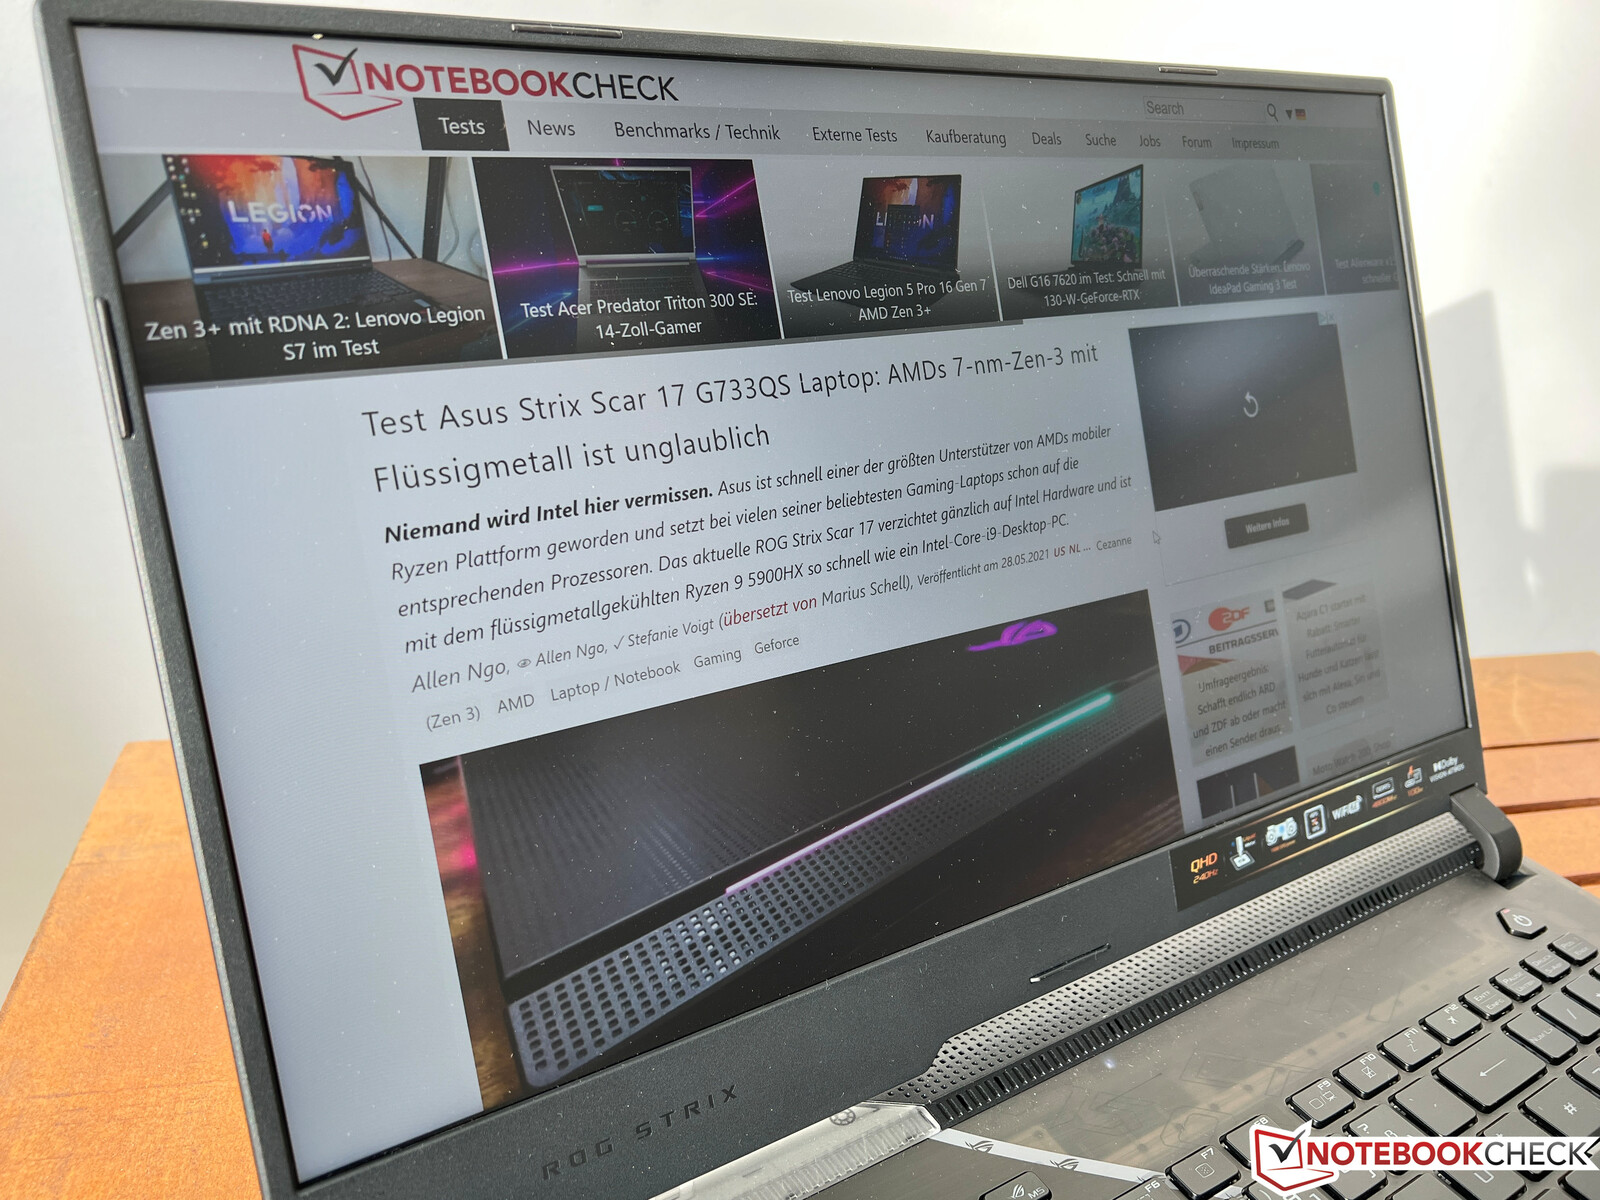
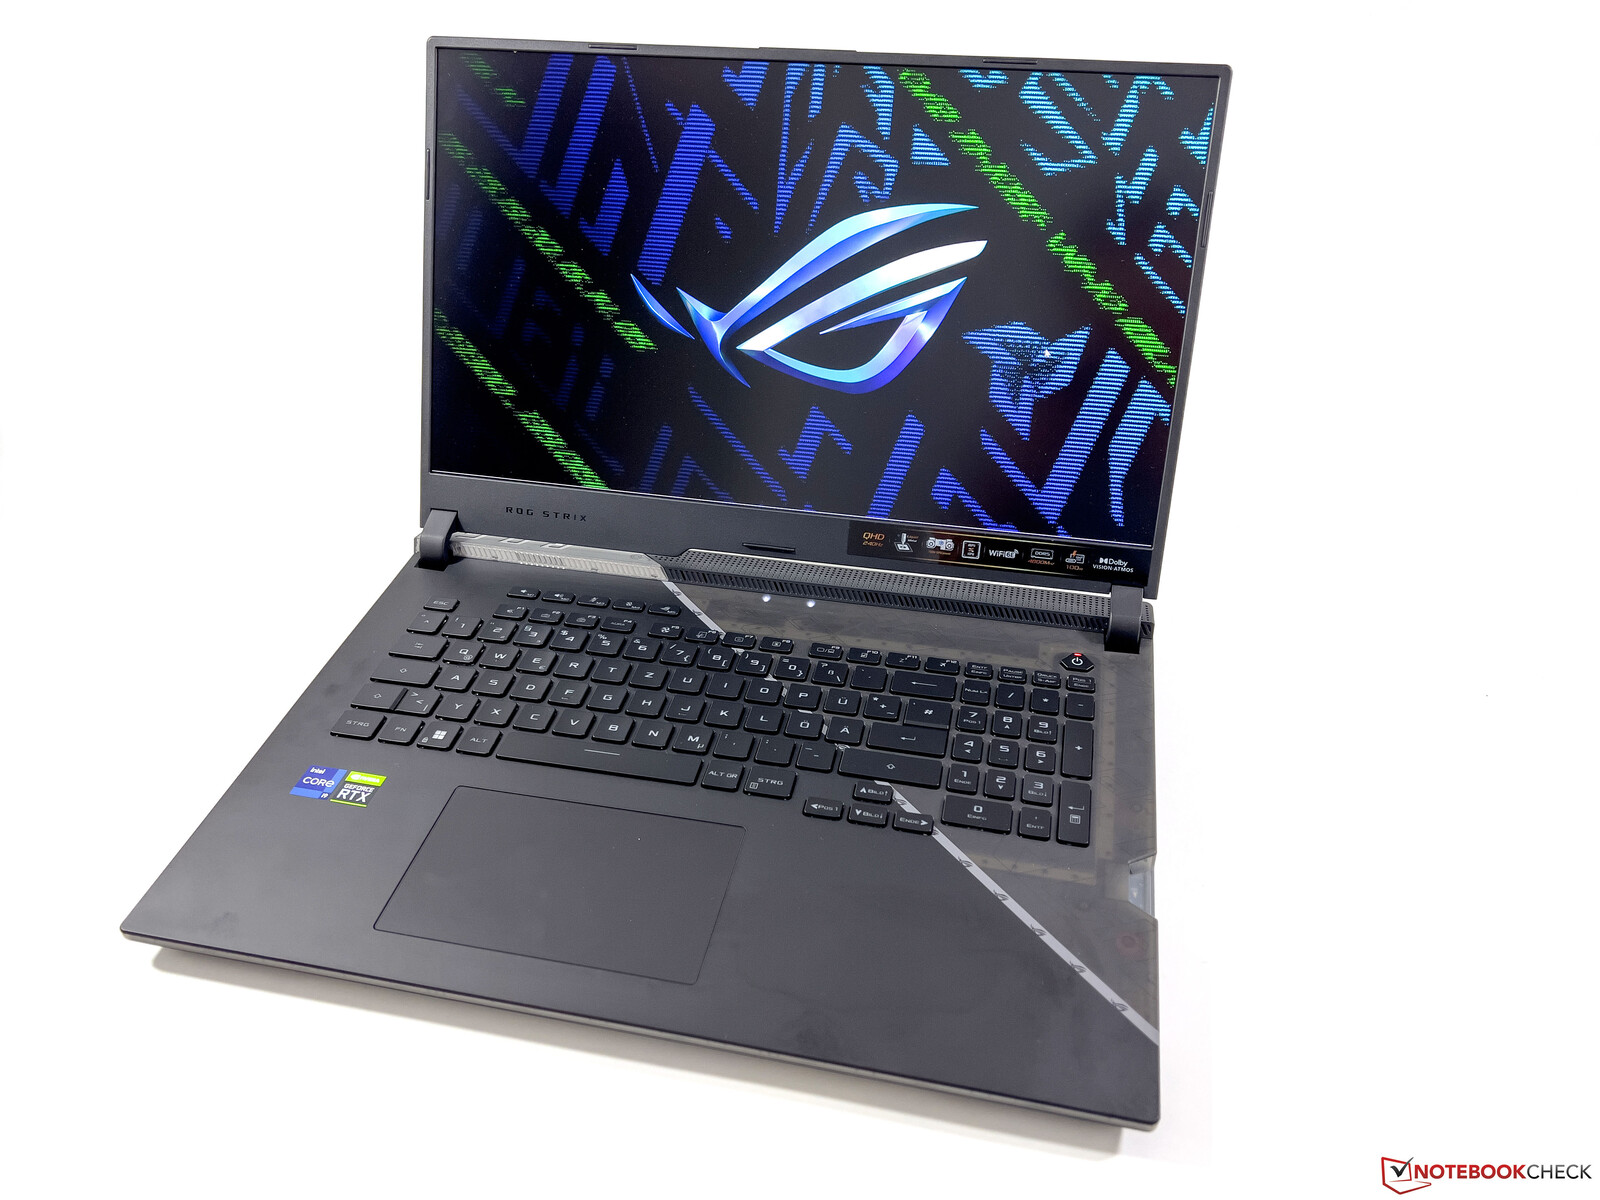
Funda - Portátil para juegos con un diseño que destaca y una amplia iluminación
El ROG Strix Scar 17 es claramente un portátil para juegos que no oculta en absoluto sus ambiciones. La carcasa es en gran medida idéntica a la del el G733QS del año pasadodel año pasado, y una parte de la unidad base vuelve a ser transparente. Además, hay elementos ampliamente iluminados y algunos elementos de diseño adicionales o trucos como la escritura especial en la tapa que sólo se hace visible cuando se ilumina con una luz ultravioleta
La calidad de la carcasa de plástico es buena en general, aunque las superficies siguen siendo propensas a las huellas dactilares y se puede oír algún ligero chirrido al abrir la pantalla, por ejemplo. La estabilidad de la gruesa unidad base es decente, pero todavía se puede presionar mínimamente la unidad base en la zona central del teclado. Aunque la tapa de la pantalla, relativamente delgada, hace un buen trabajo, la bisagra sigue sin poder evitar un ligero bamboleo después de mover el portátil, por ejemplo.
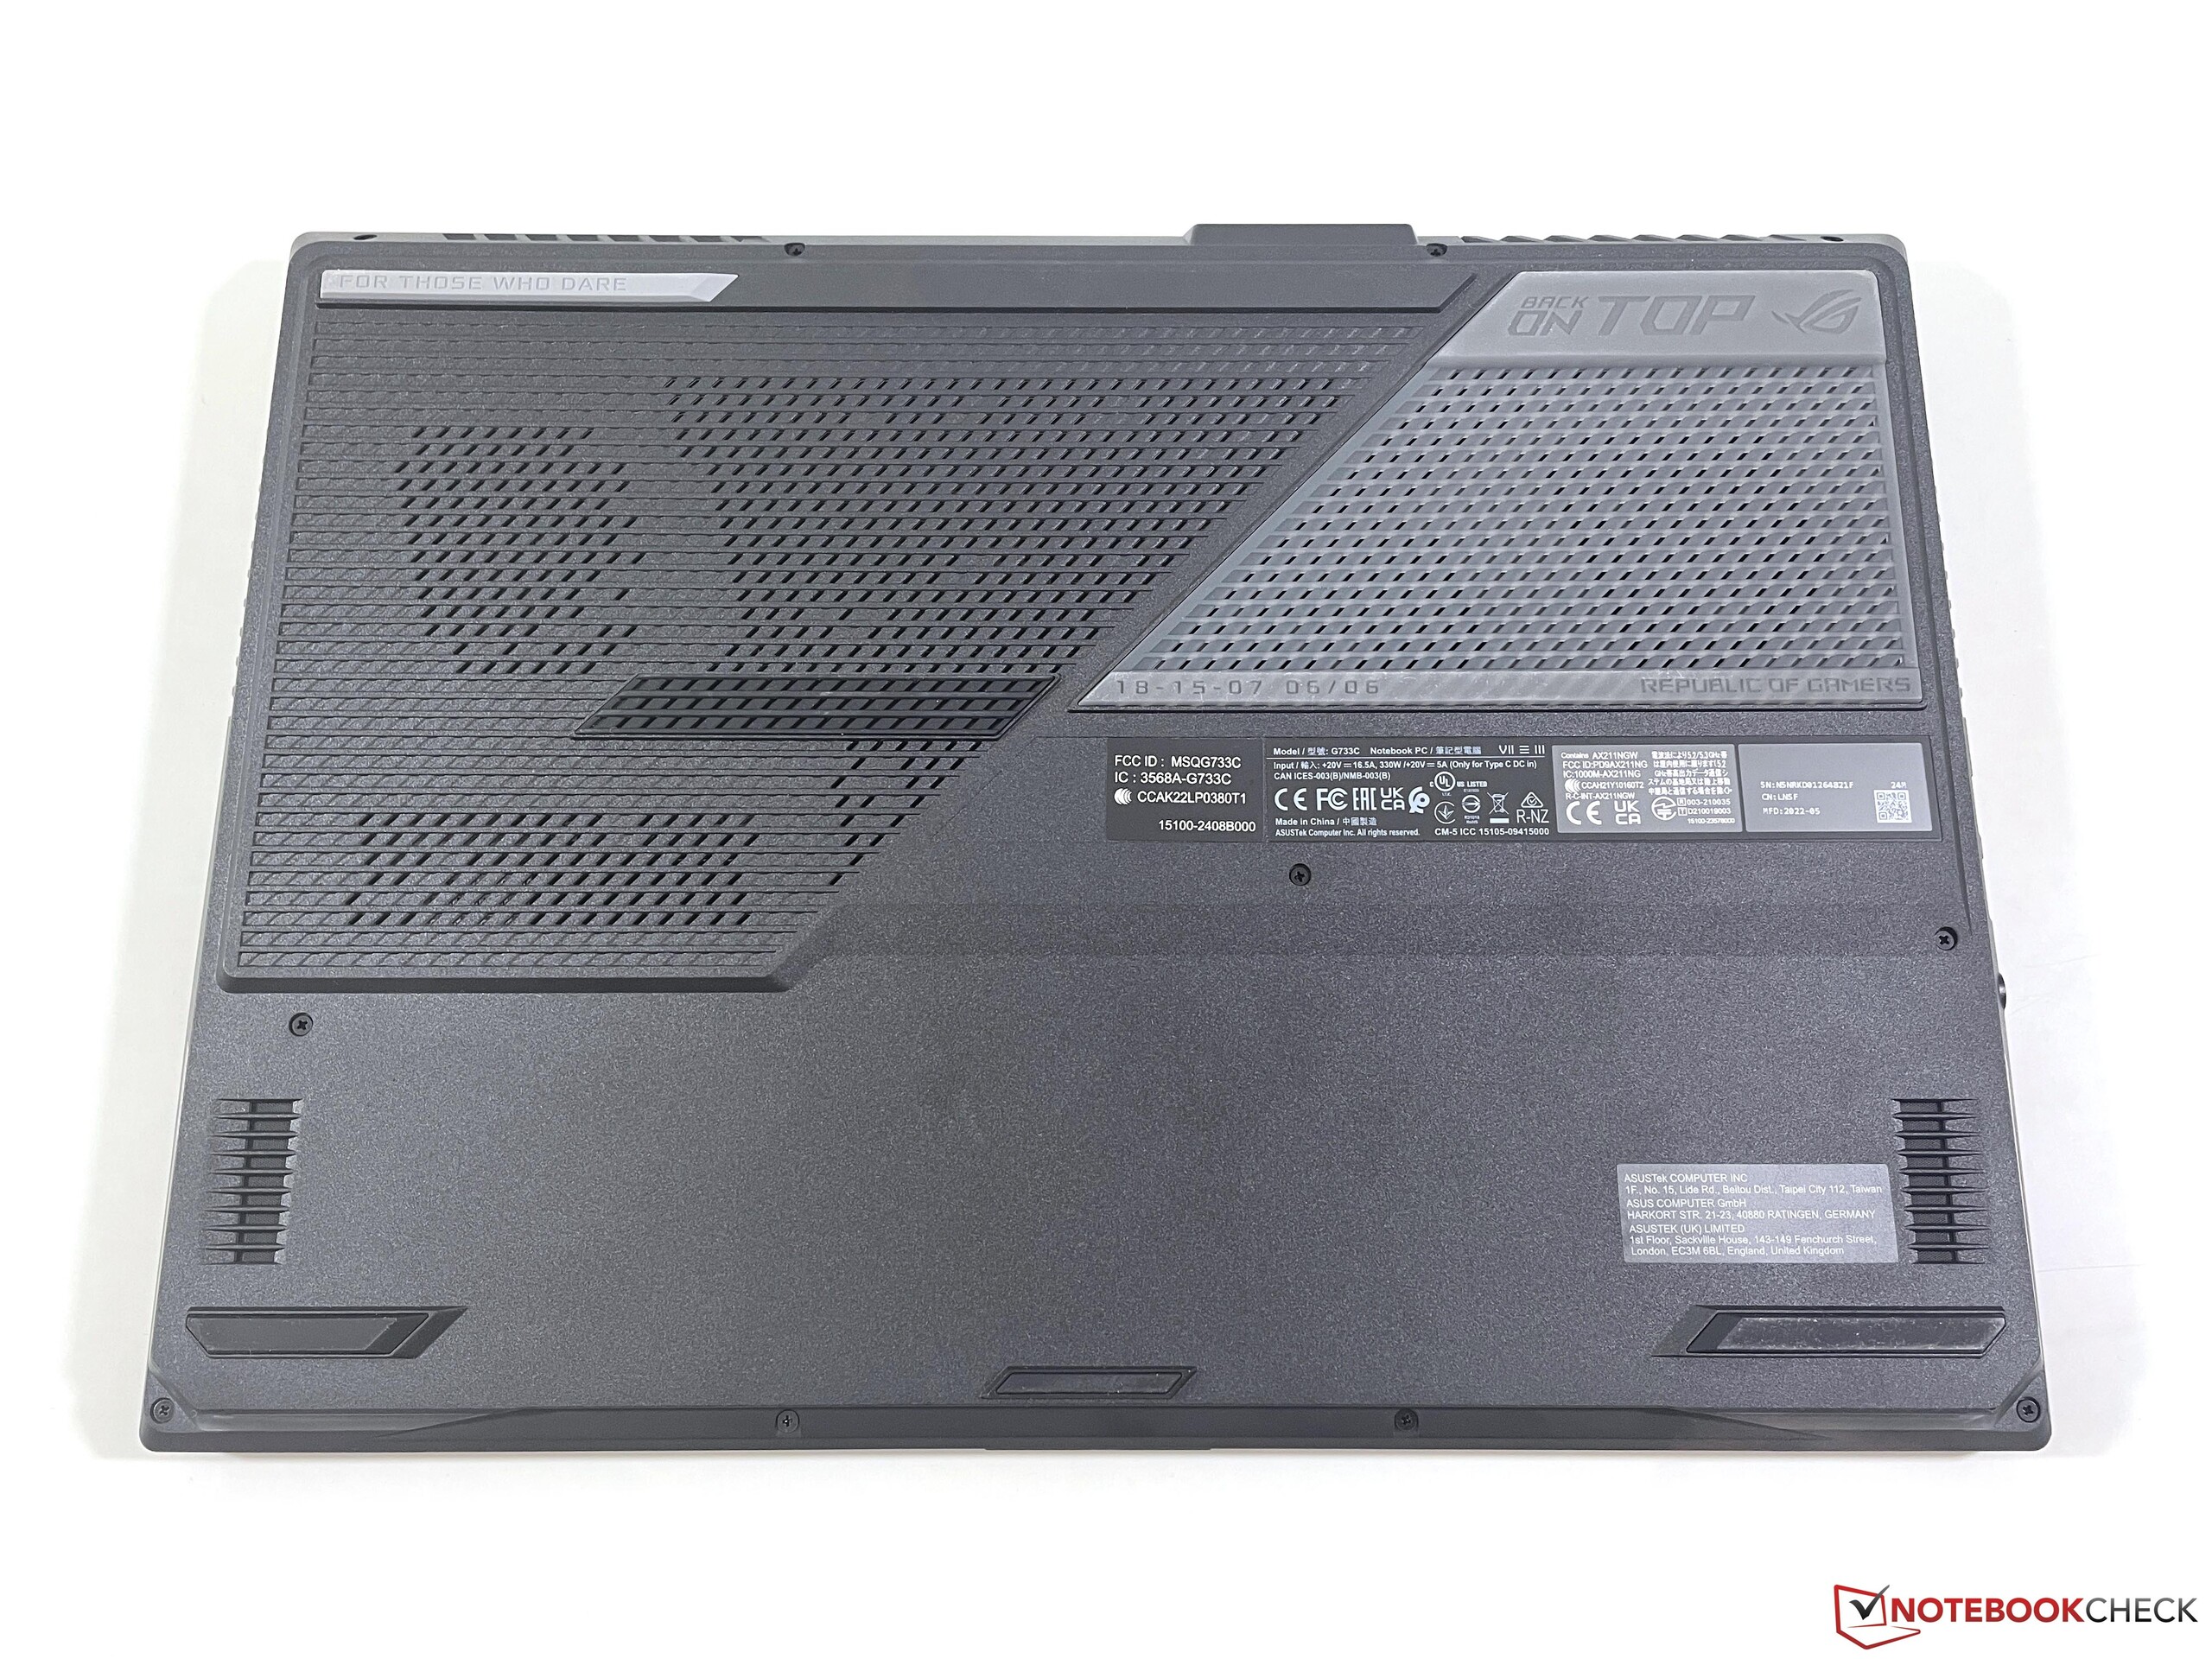
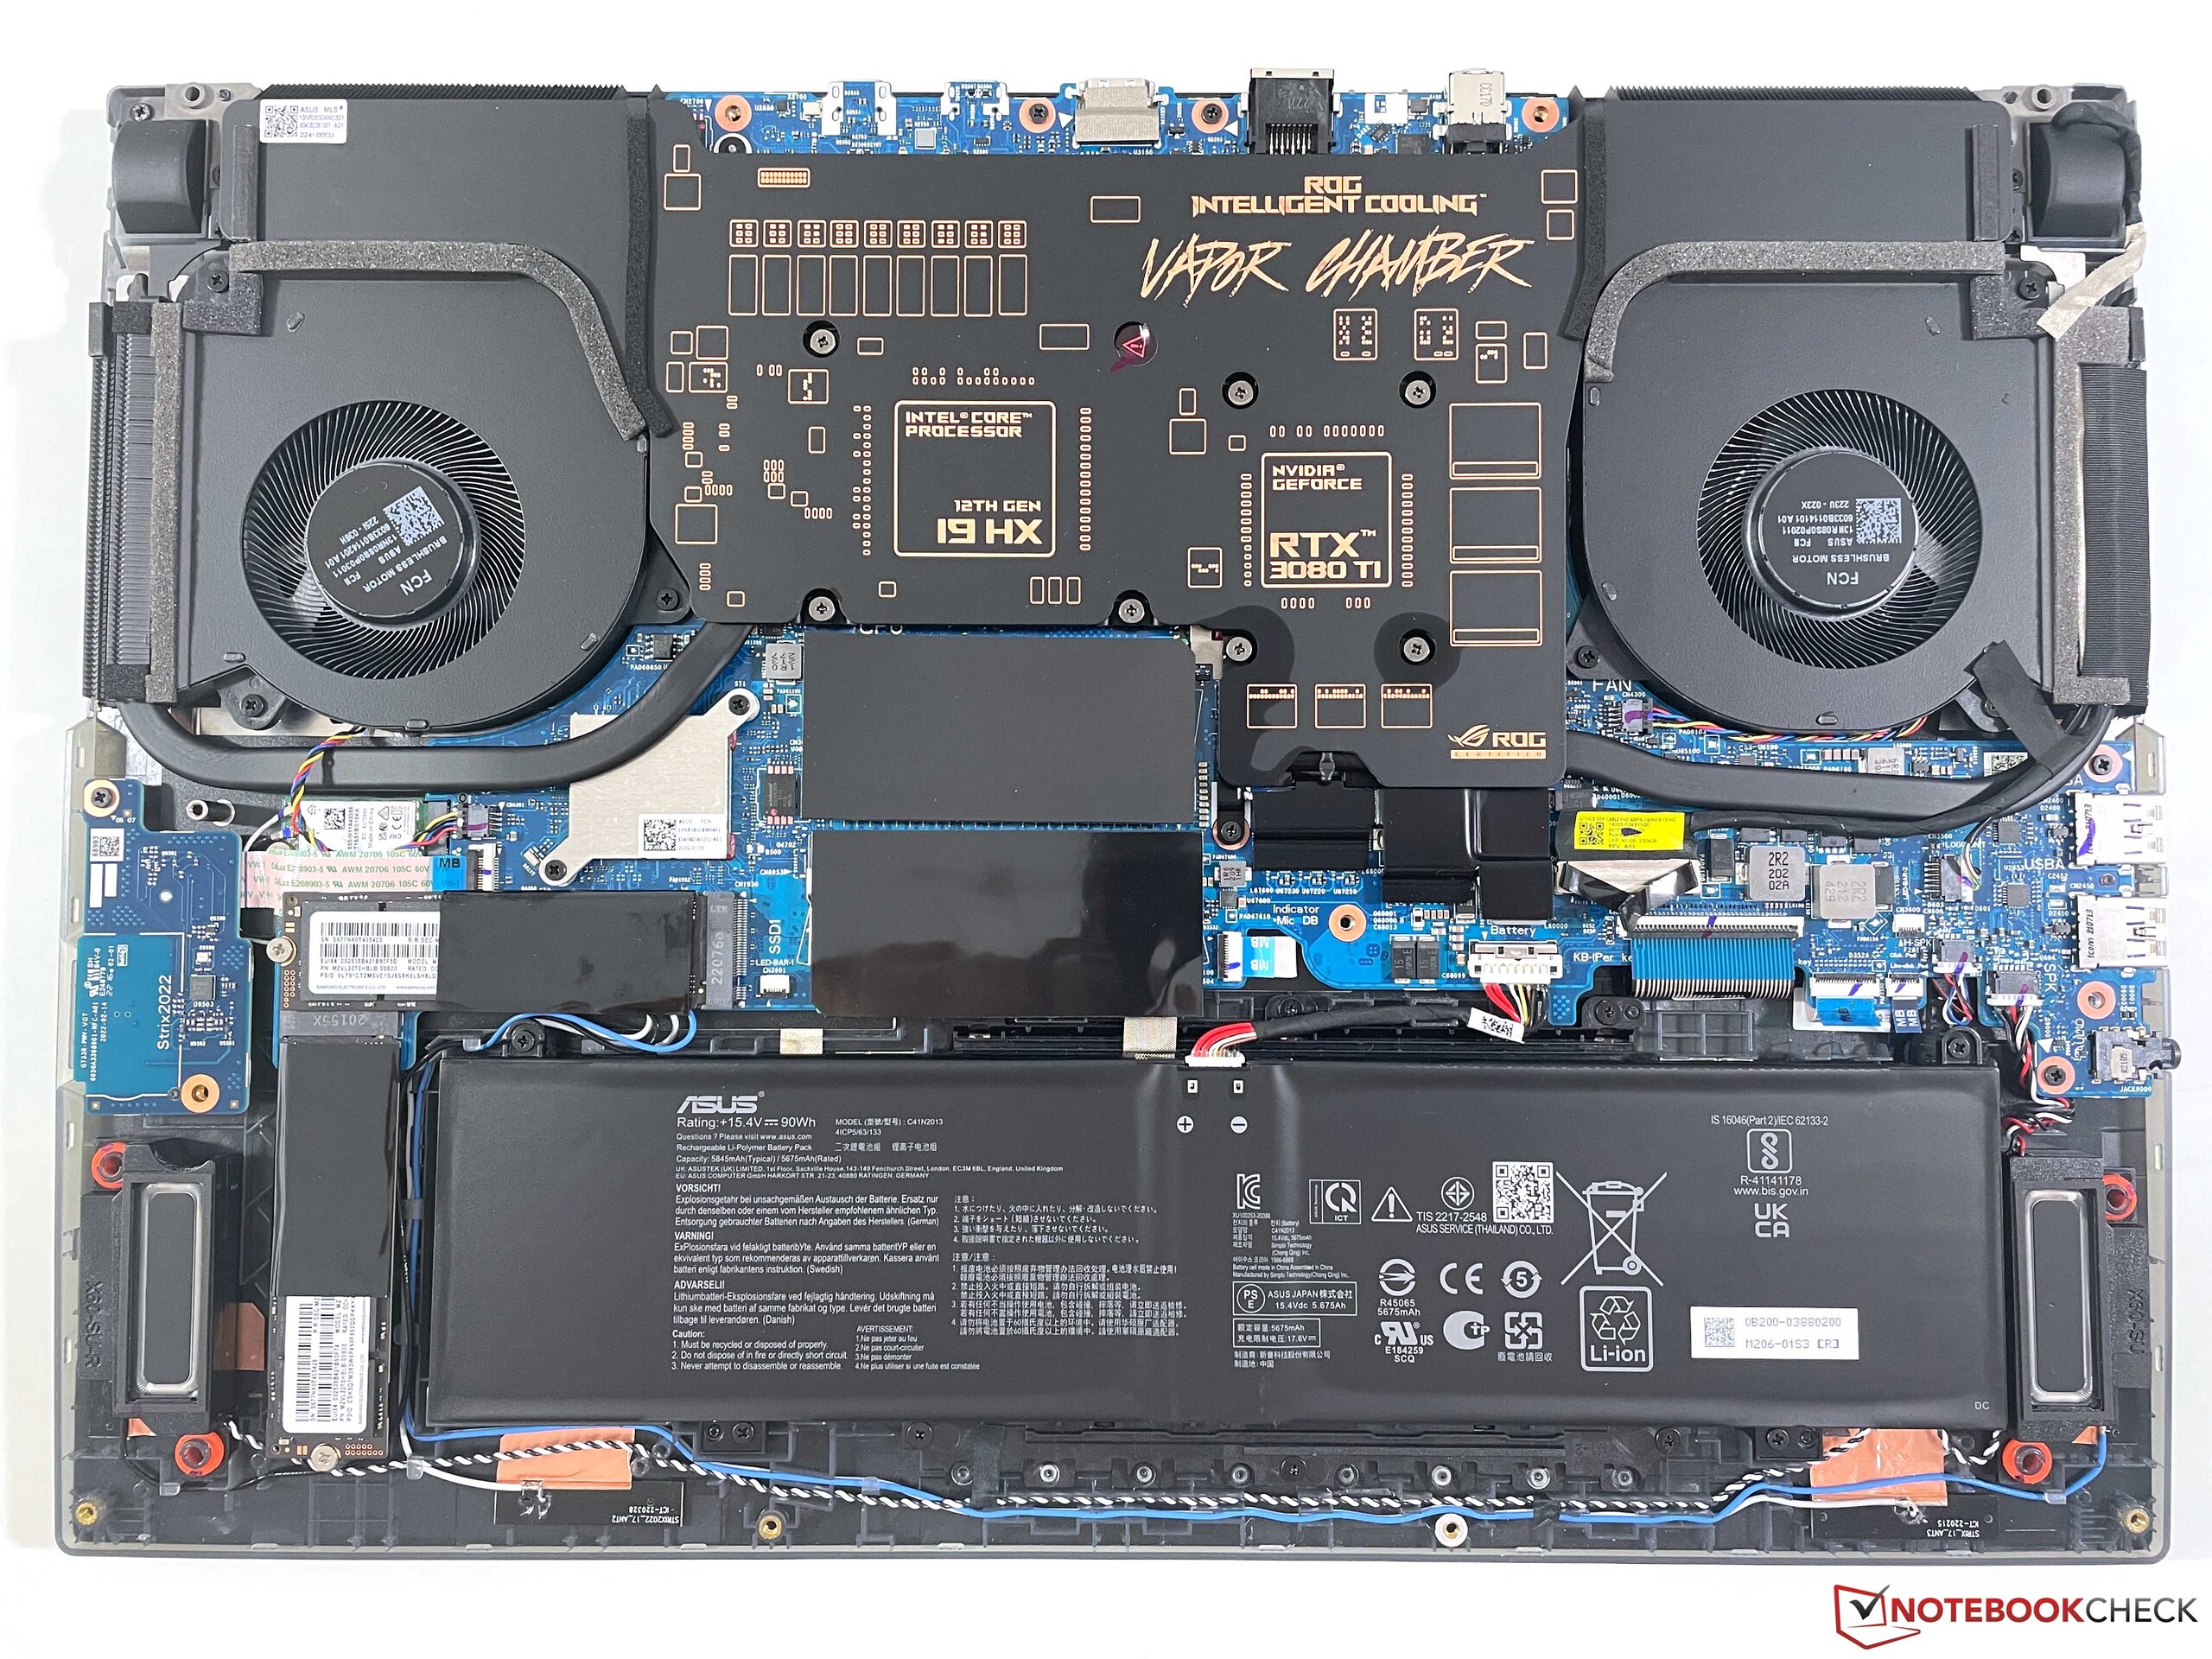
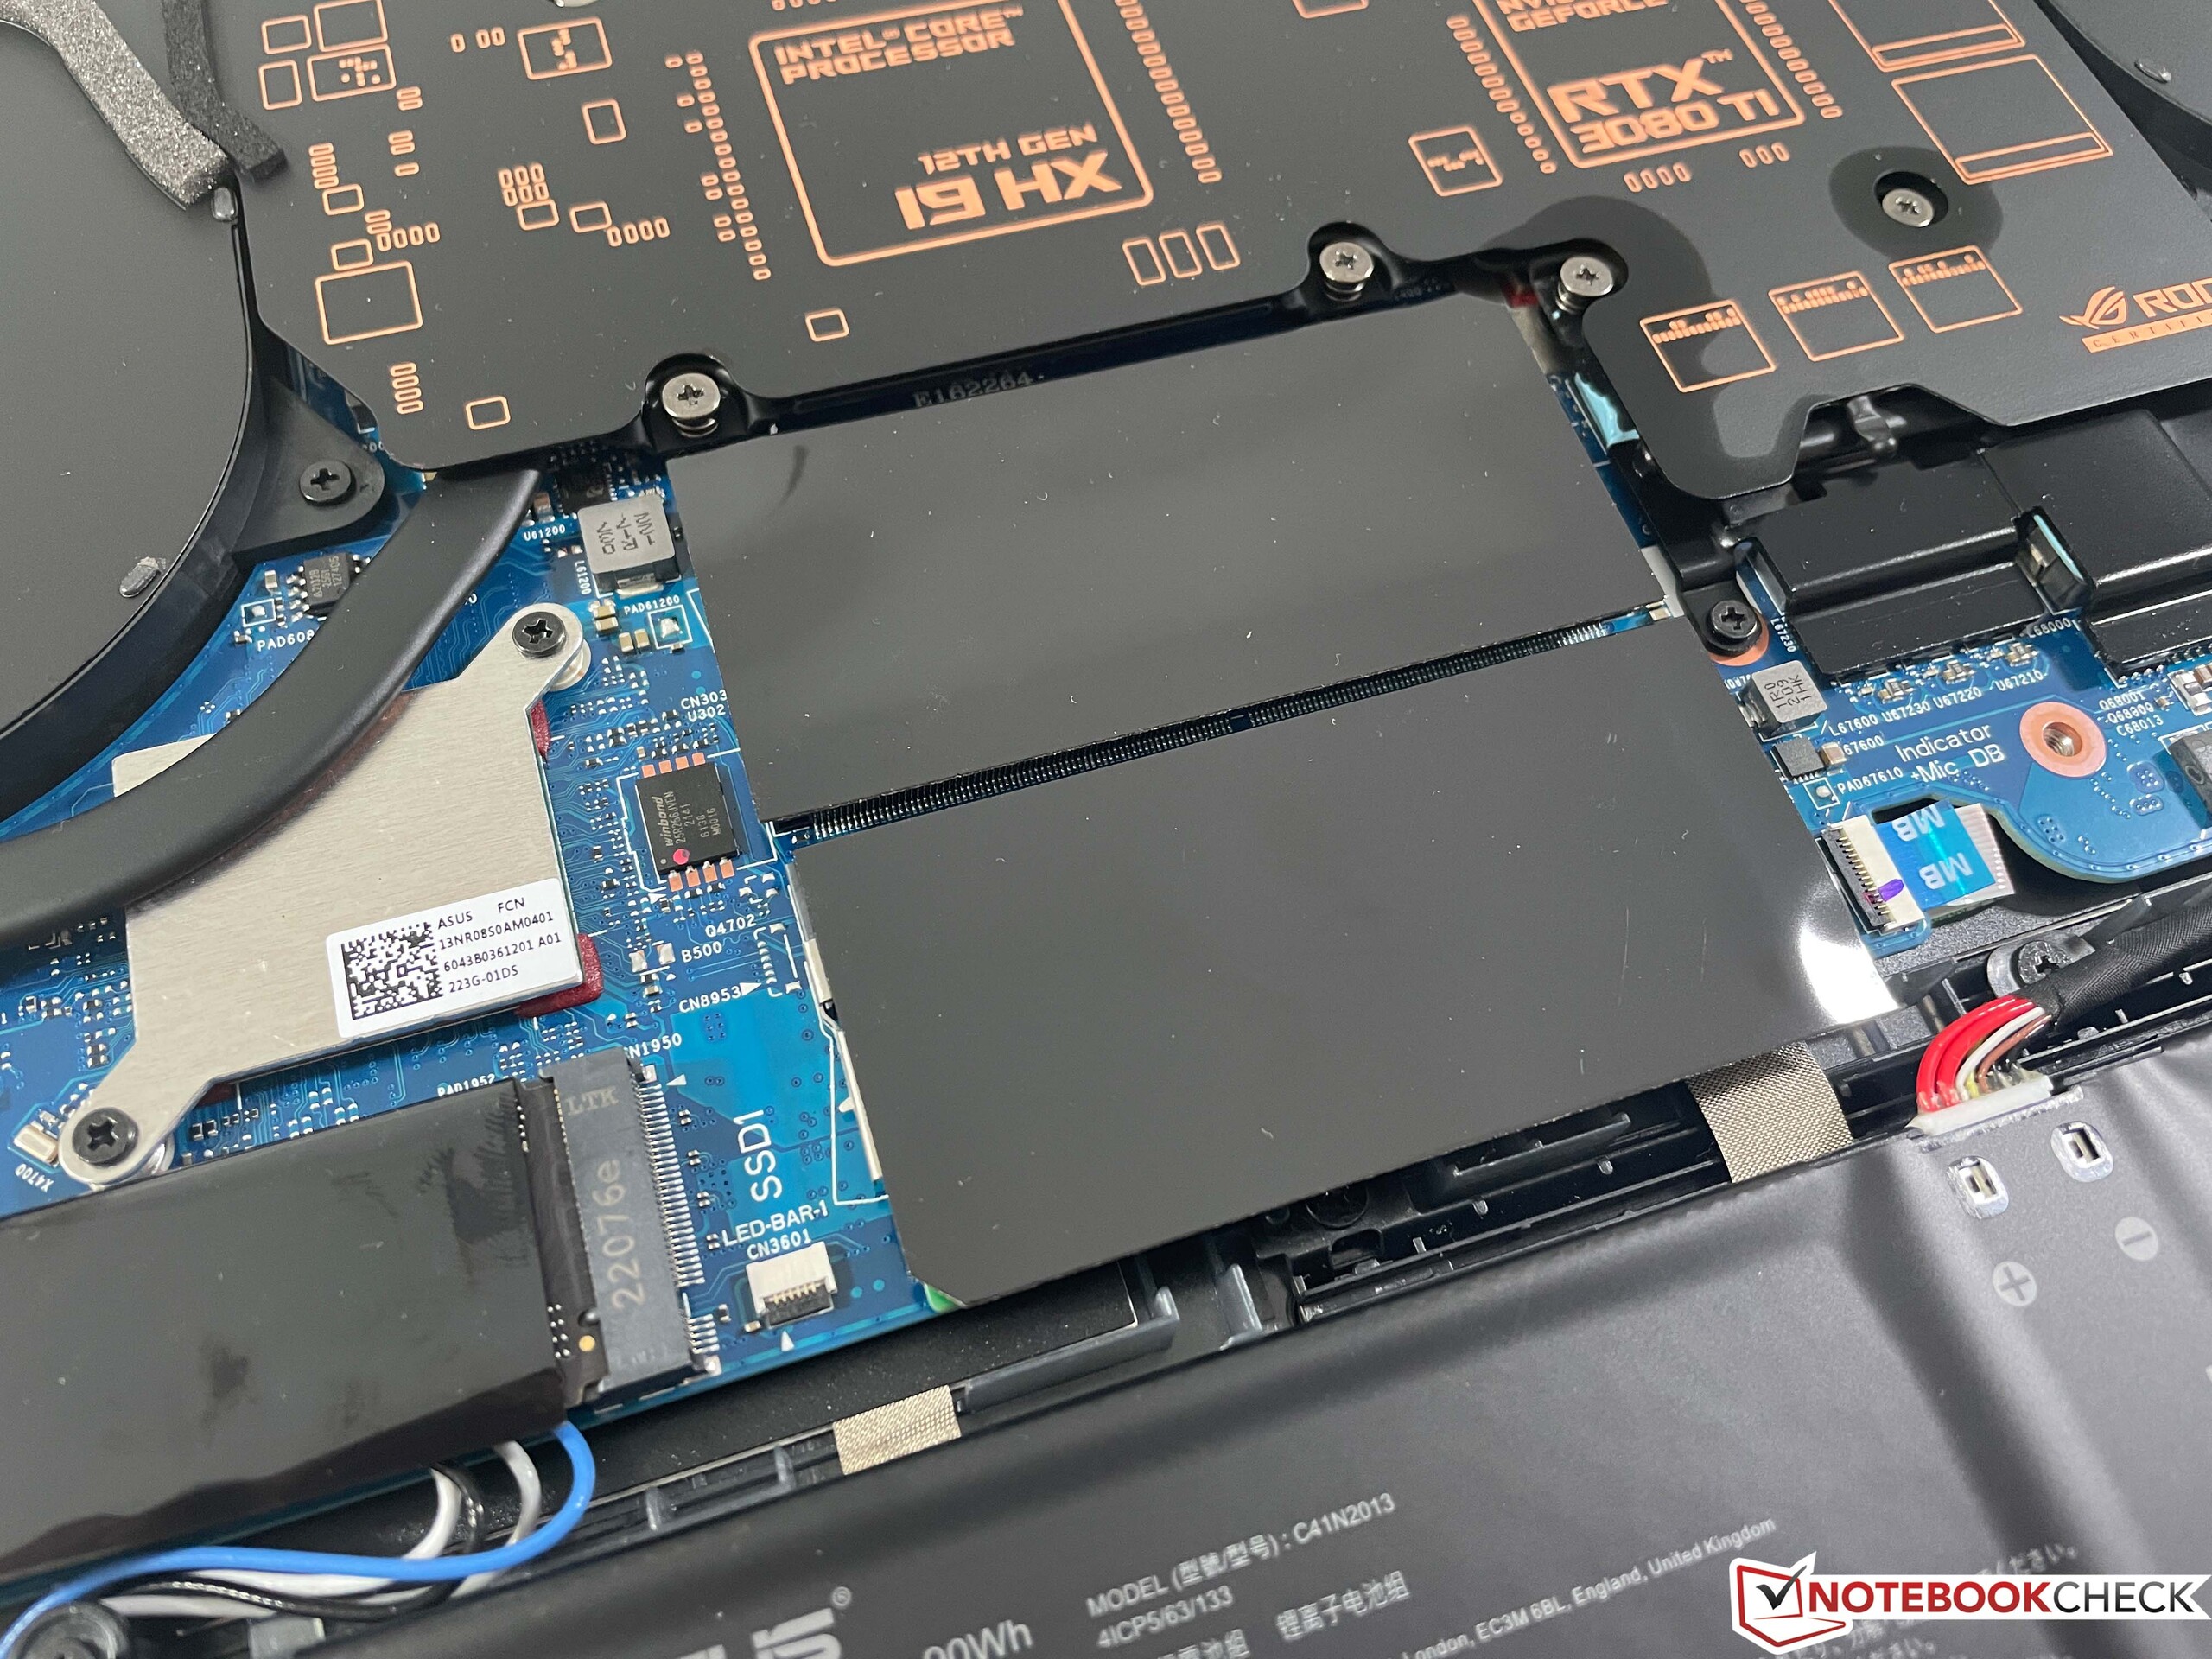
Aunque la tapa inferior de la carcasa se puede quitar, hay que tener cuidado al hacerlo. Como la iluminación está integrada en la pieza, primero hay que desconectar dos pequeños cables planos, antes de poder quitar la tapa. Con acceso a los ventiladores, los dos SSDs, los dos módulos de RAM, y el módulo WLAN, las opciones de mantenimiento son buenas.
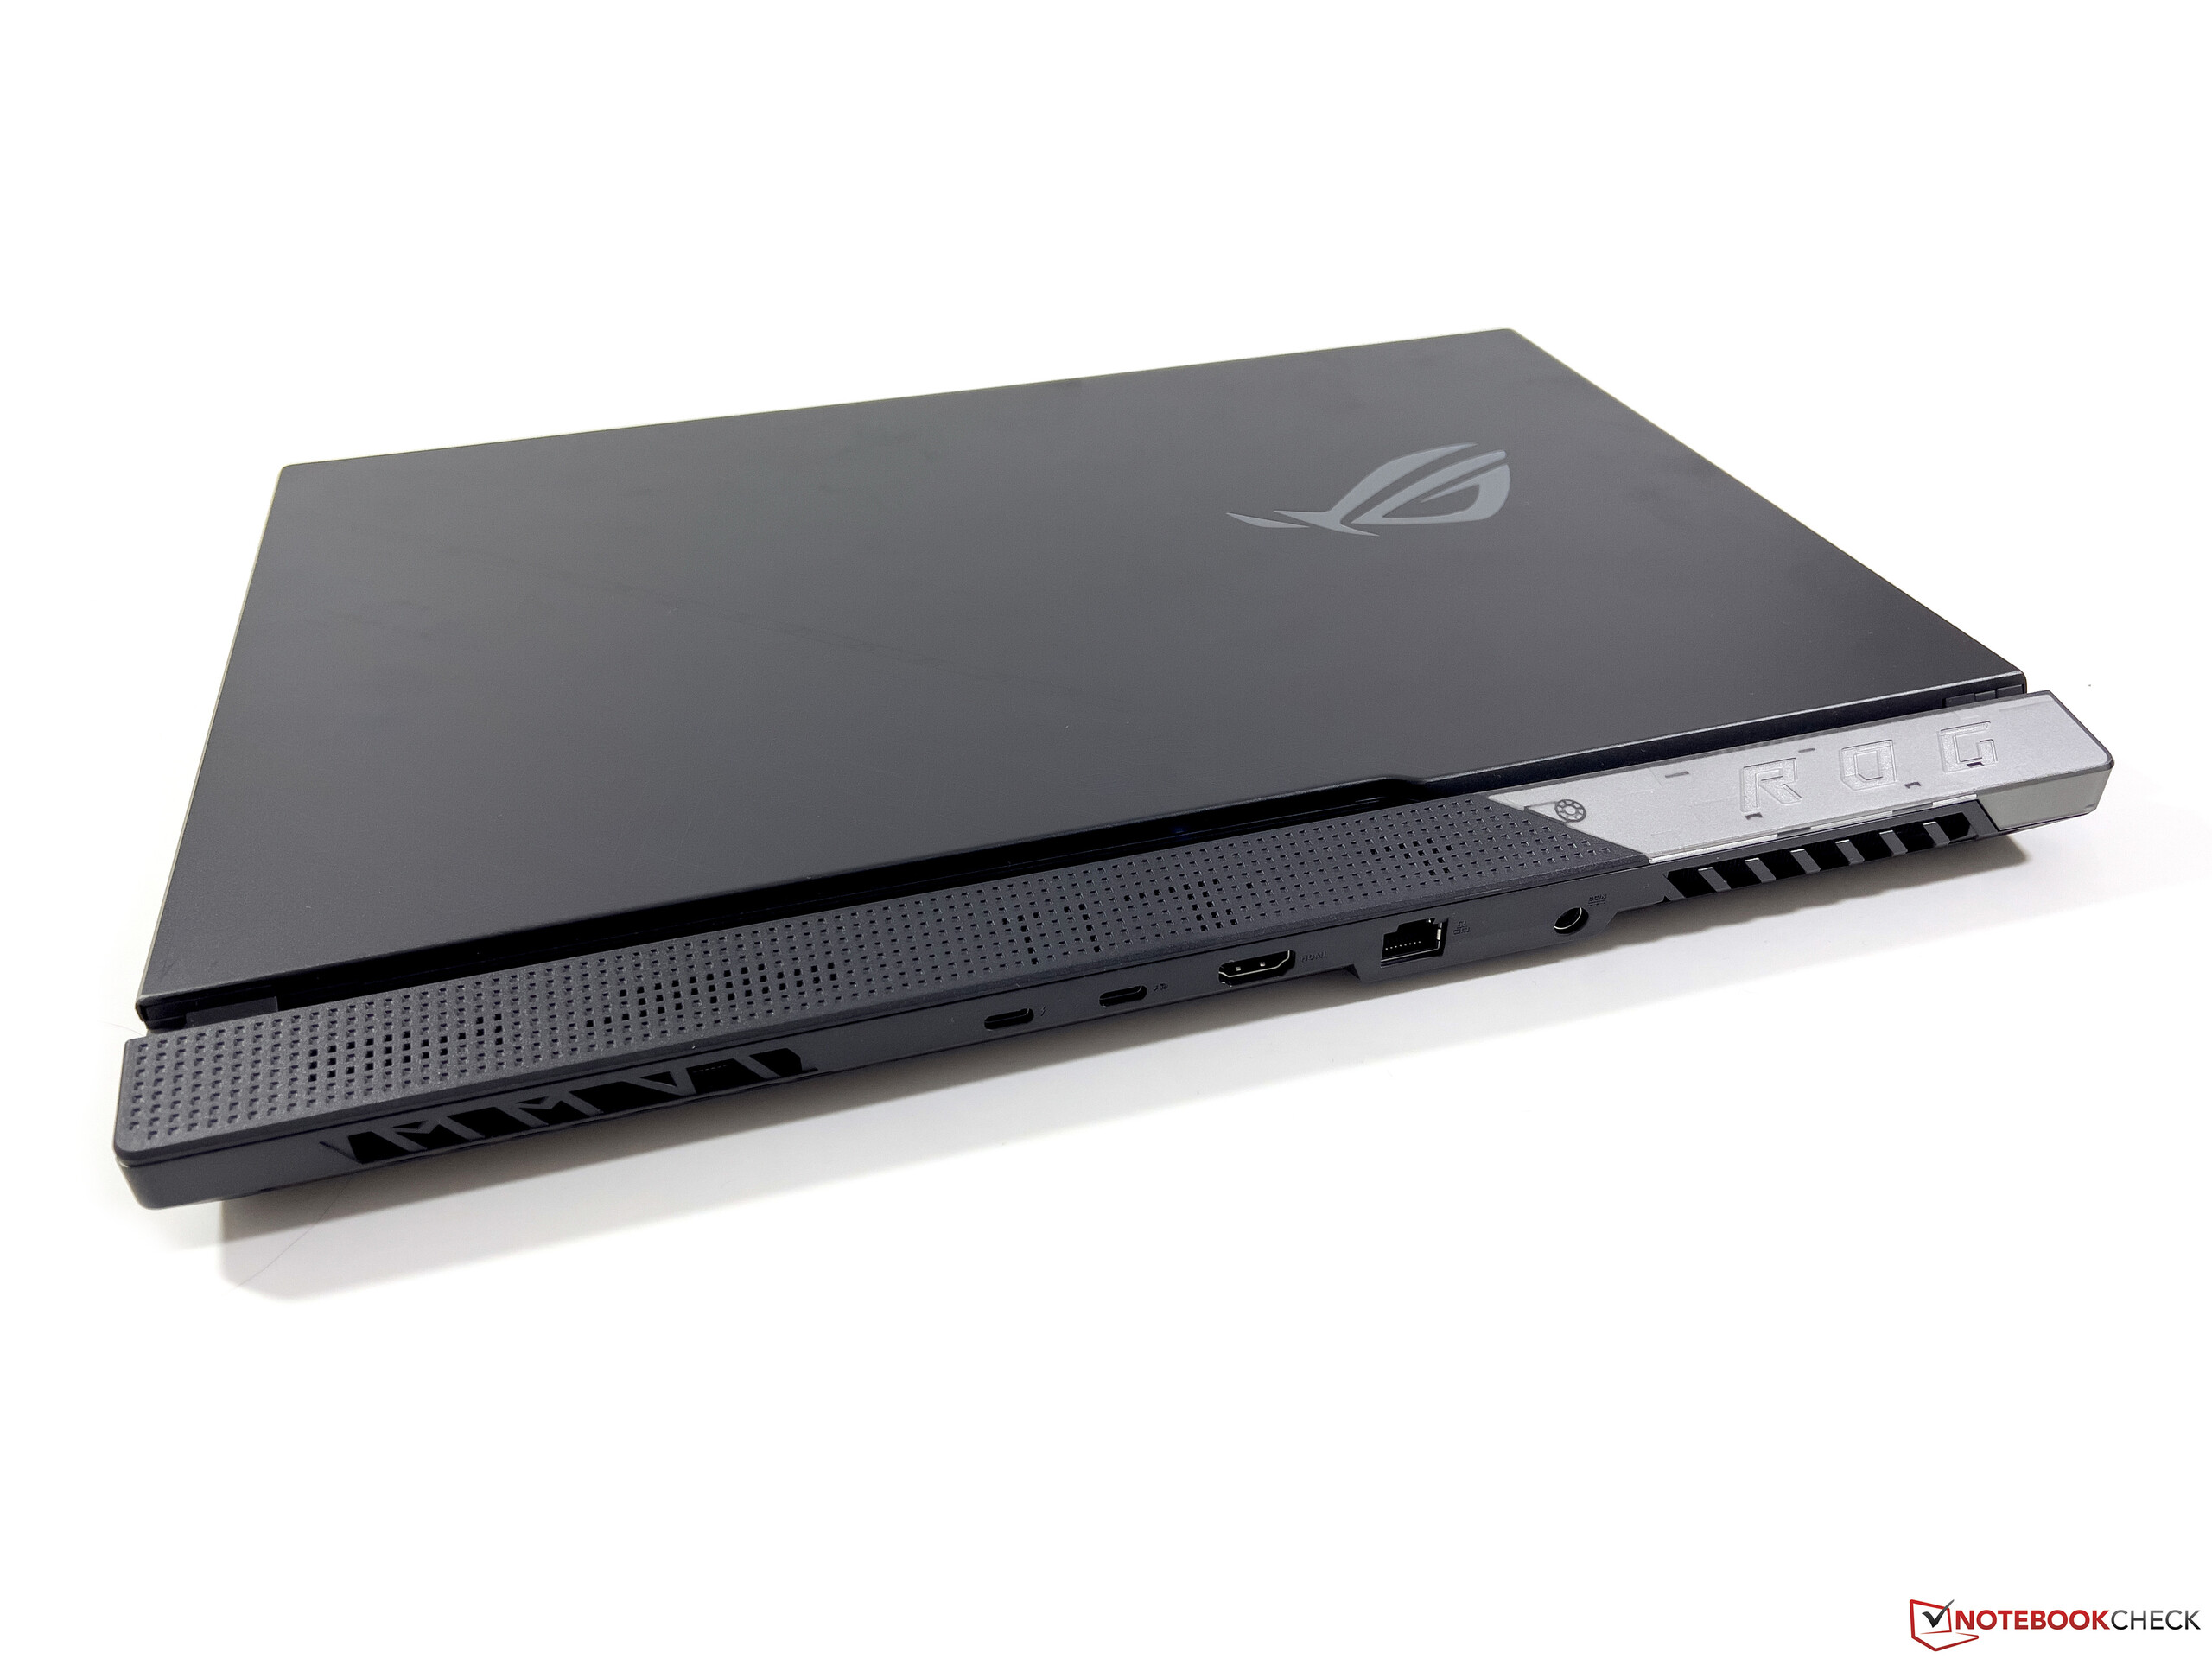
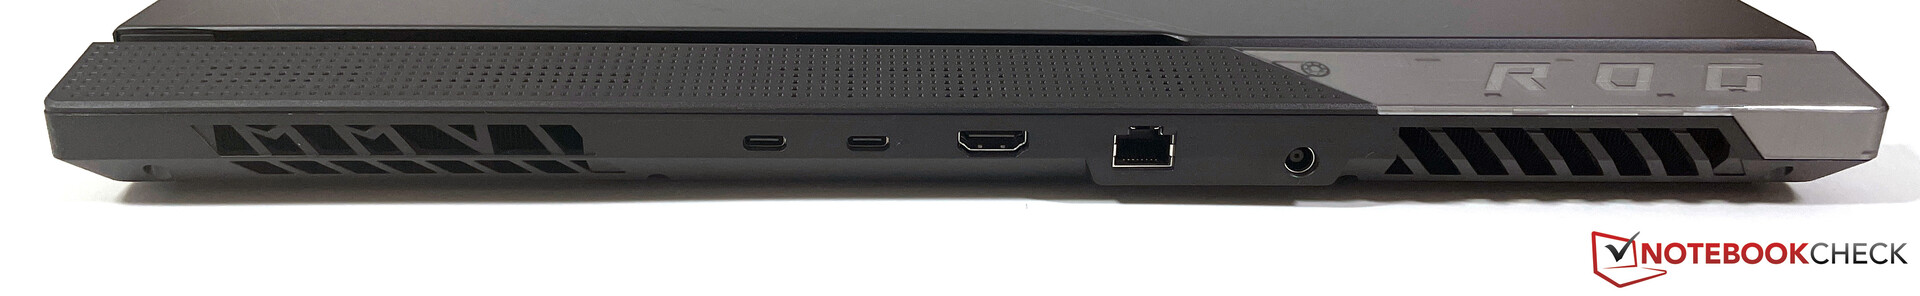
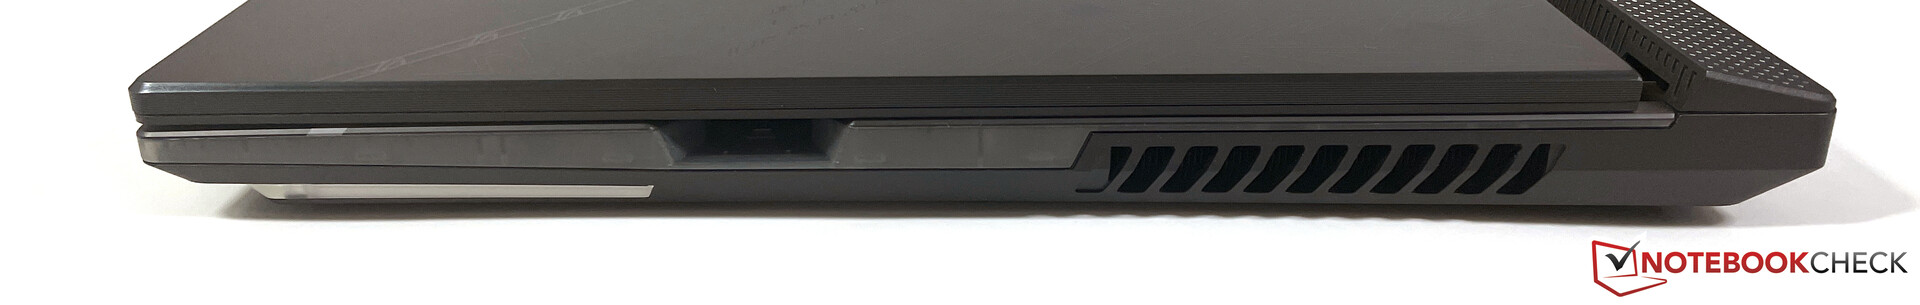
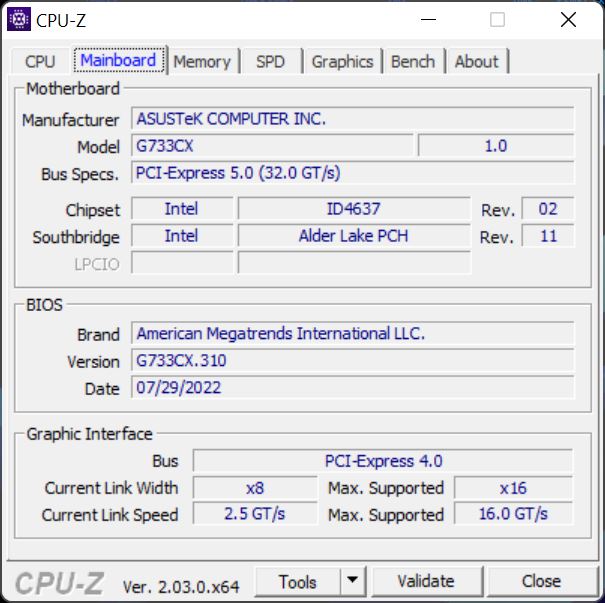
Equipo - ROG Strix Scar 17 con HDMI 2.1 y Wi-Fi 6E
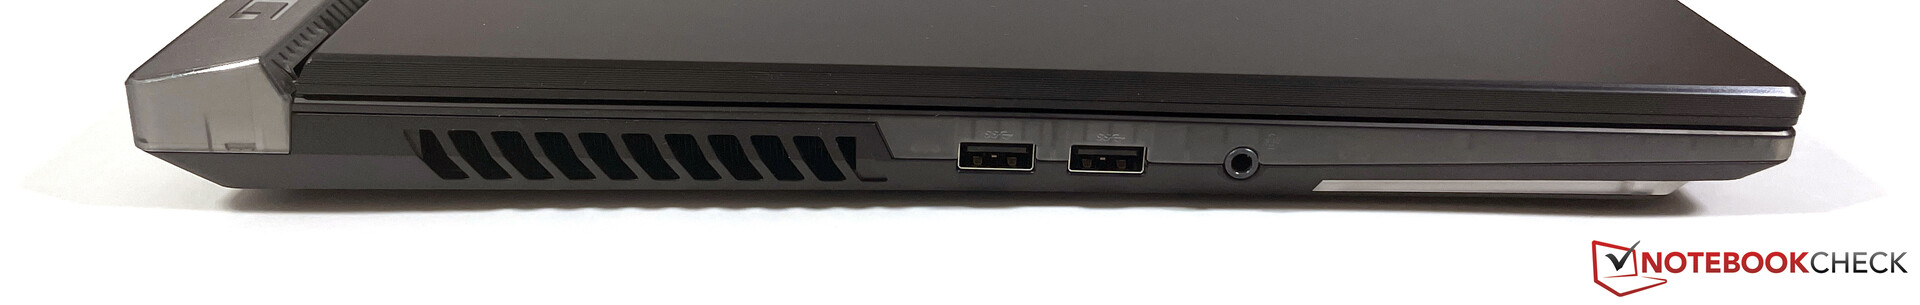
Además de una conexión Thunderbolt, el G733CX ofrece un puerto HDMI 2.1, y el puerto USB de la parte trasera también puede usarse para cargar en el camino (máx. 100 vatios). La mayoría de las conexiones están en la parte trasera, y sólo encontrarás dos puertos USB-A normales y el puerto de audio de 3,5 mm en el lado izquierdo. El lado derecho también ofrece una ranura para Asus Keystone, que permite almacenar la configuración y los datos del sistema.
El rendimiento WLAN con Intel AX211 es muy bueno, y también pudimos conectarnos a la red de 6 GHz de nuestro router de referencia Asus sin problemas. También hay una conexión Ethernet con 2,5 Gbit/s para conexiones por cable. Los usuarios del ROG Strix Scar 17 tienen que prescindir de la webcam, pero si es necesario, el fabricante ofrece la correspondiente webcam externa (ROG Eye S).
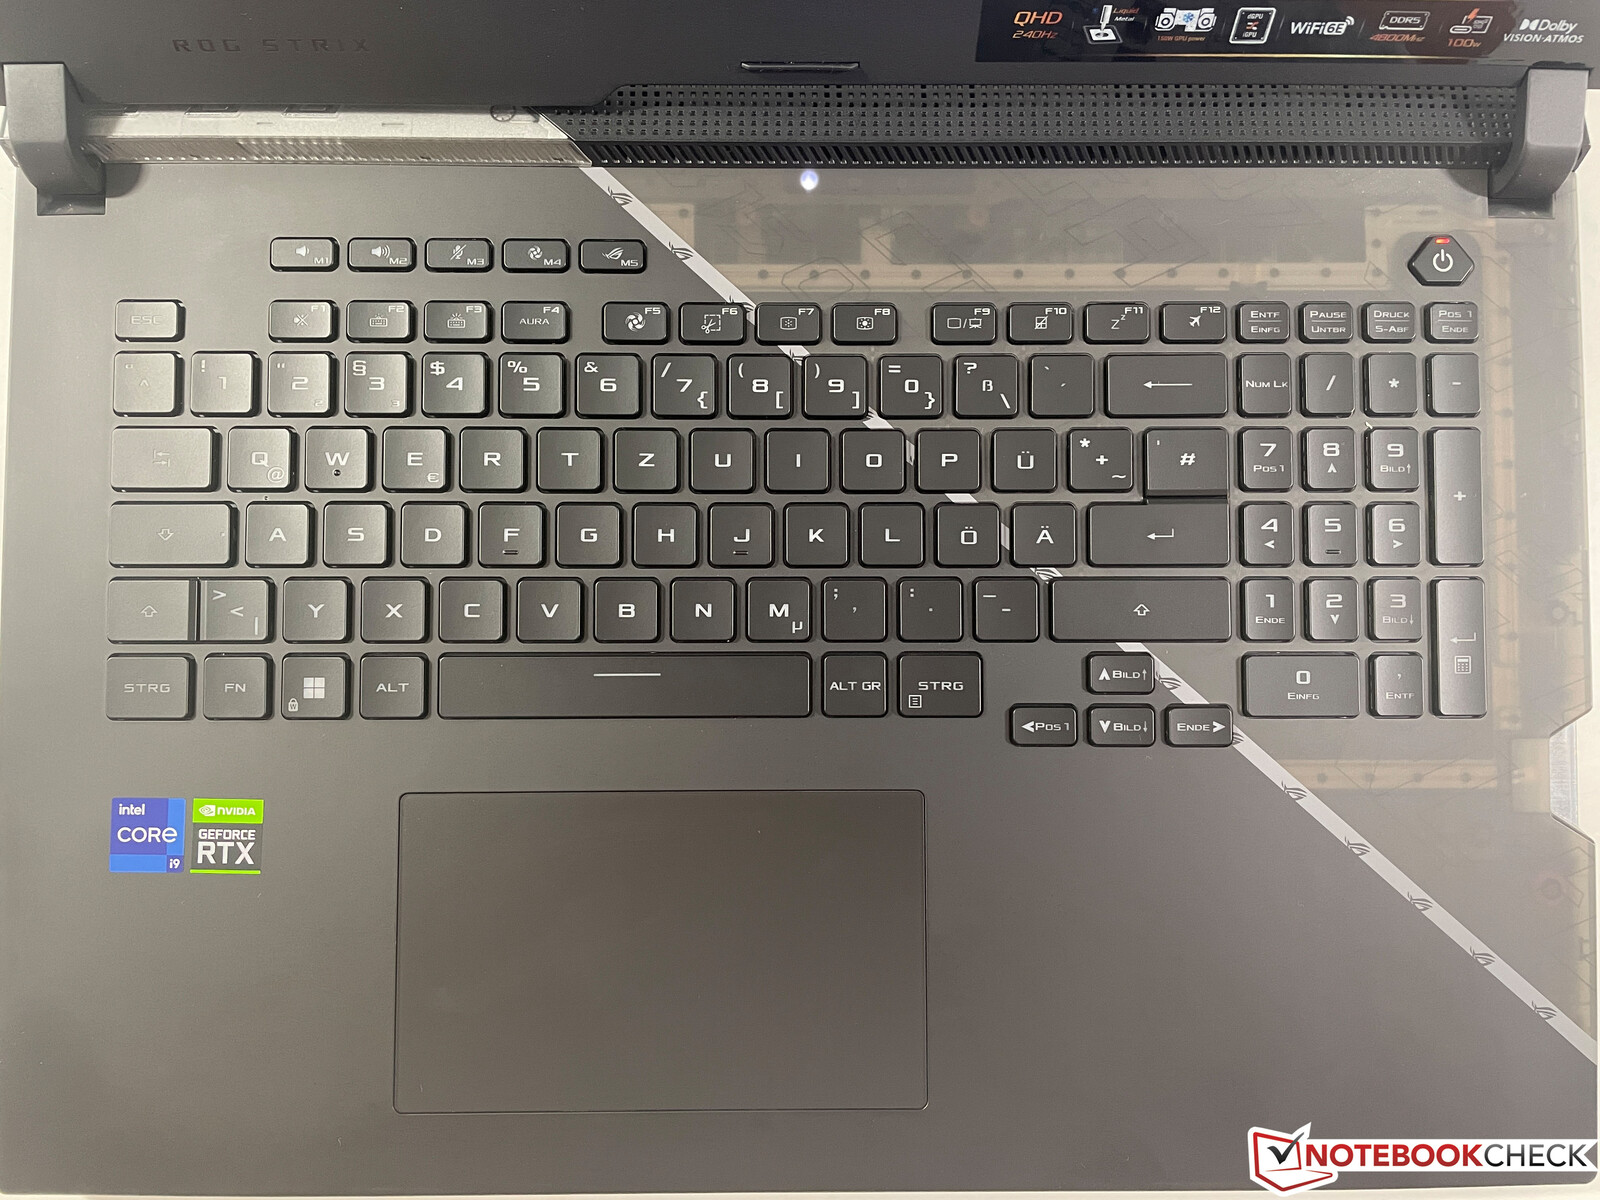
Dispositivos de entrada - Asus con un buen teclado
Asus ha vuelto a cambiar la distribución del teclado, utilizando ahora una distribución más convencional con teclas especiales más pequeñas. También hay un bloque numérico "regular" de nuevo, lo que también significa que las teclas de flecha se han movido ligeramente hacia la izquierda y ahora son más pequeñas. No a todos los usuarios les gustará esto. Sin embargo, la calidad del teclado es muy buena con el cubo largo de 2 mm, y se puede enloquecer con la iluminación, que permite configurar cada tecla por separado, incluidos los modos específicos del juego mediante la tecnología AuraSync. El gran ClickPad ofrece buenas características de deslizamiento y funciona de forma fiable, pero también es bastante ruidoso cuando lo pulsas.
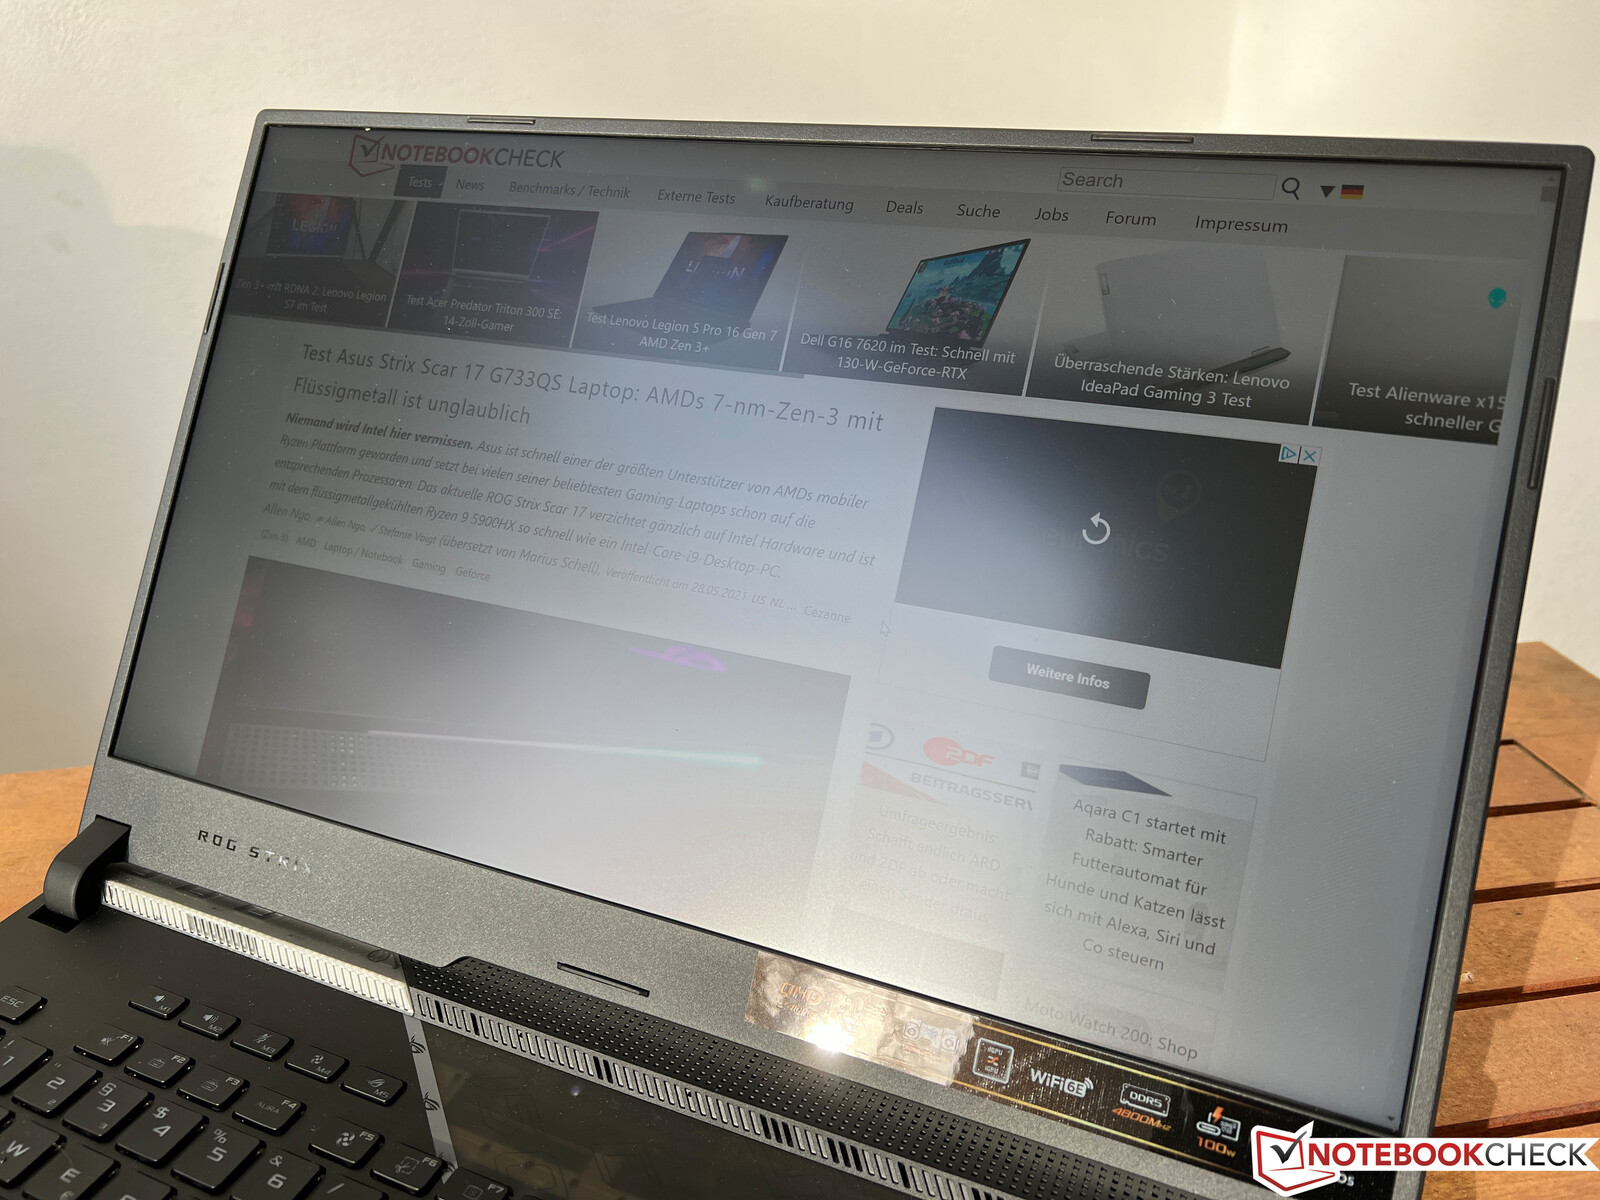
Pantalla - QHD con 240 Hz
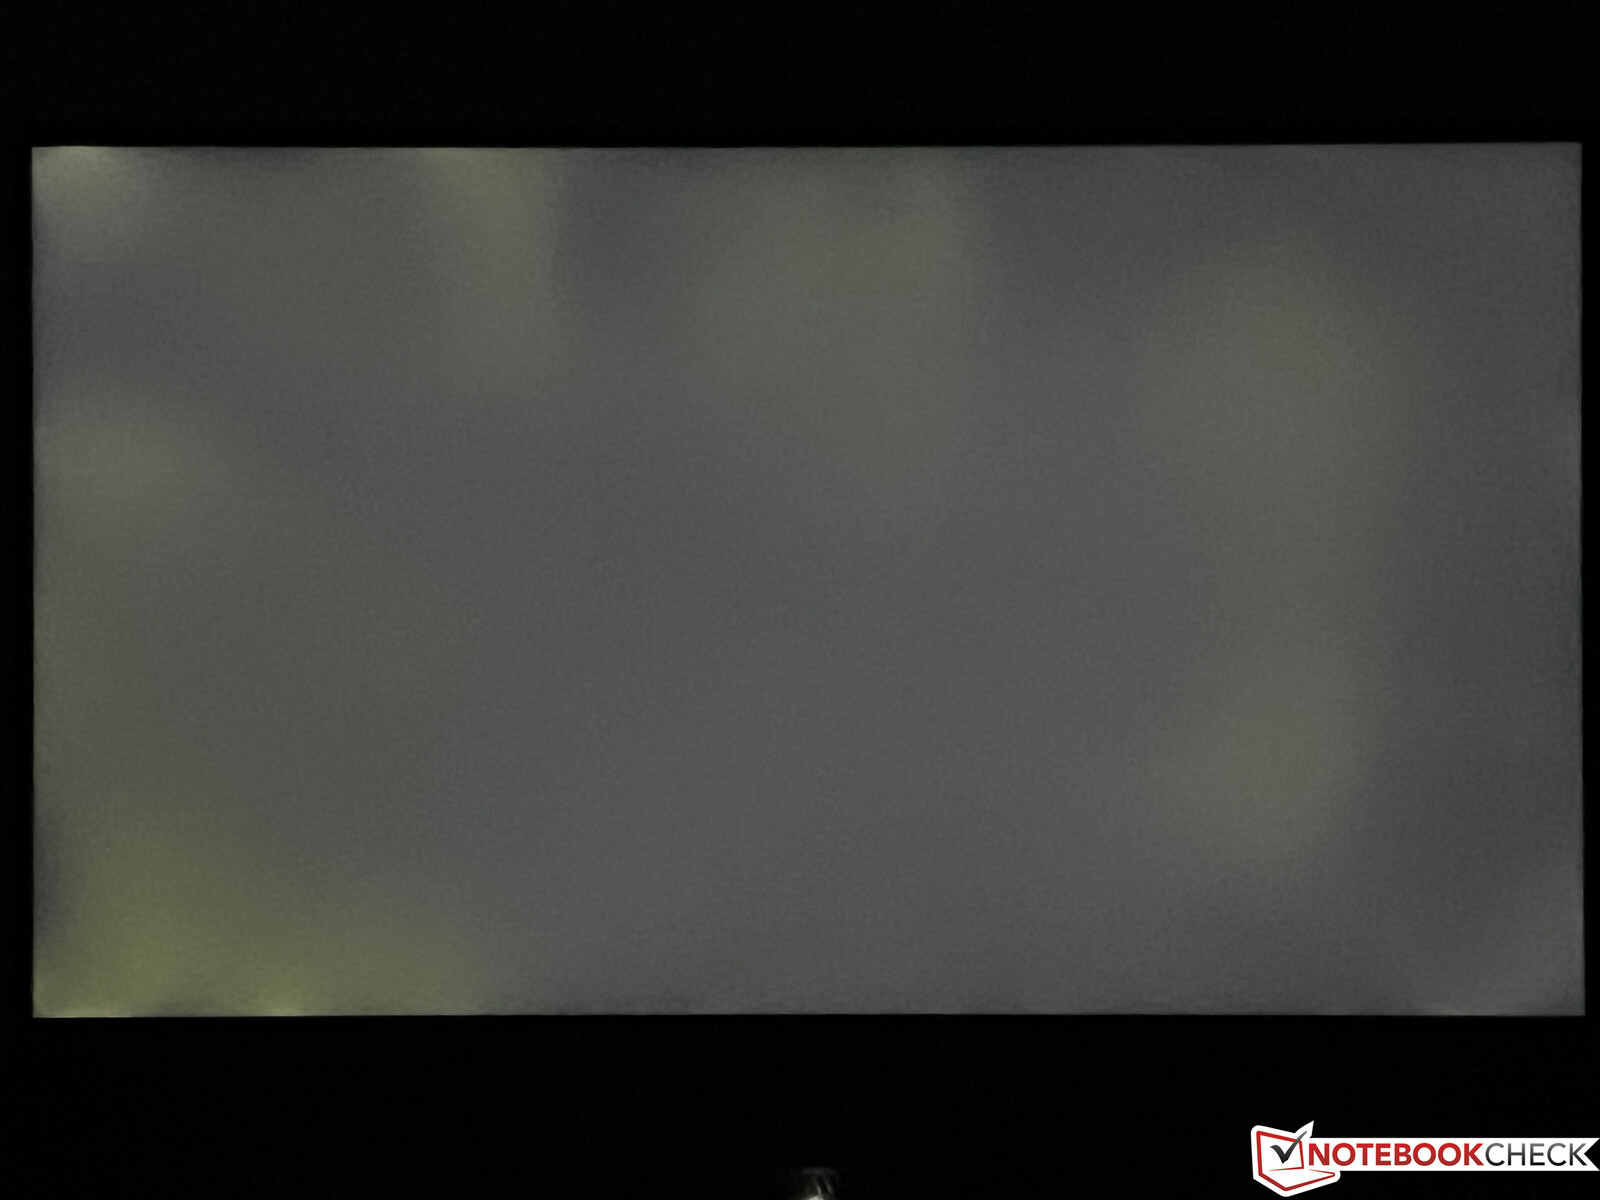
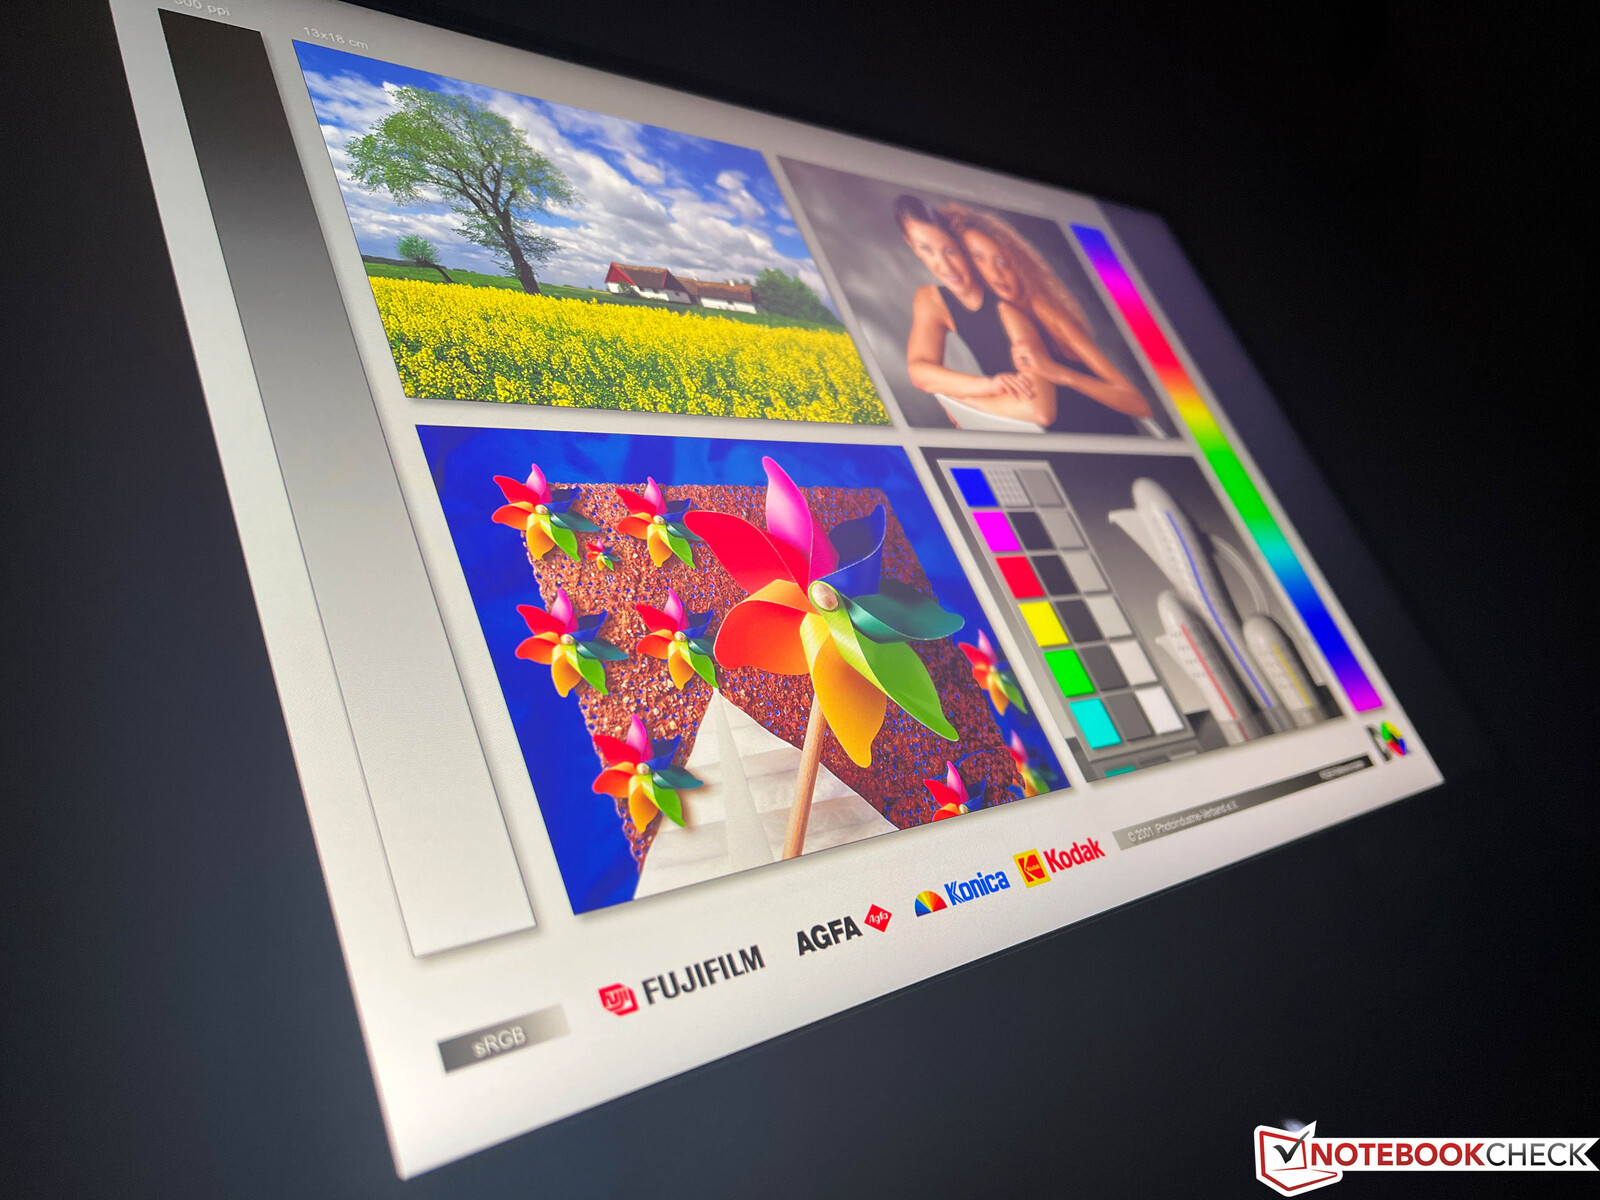
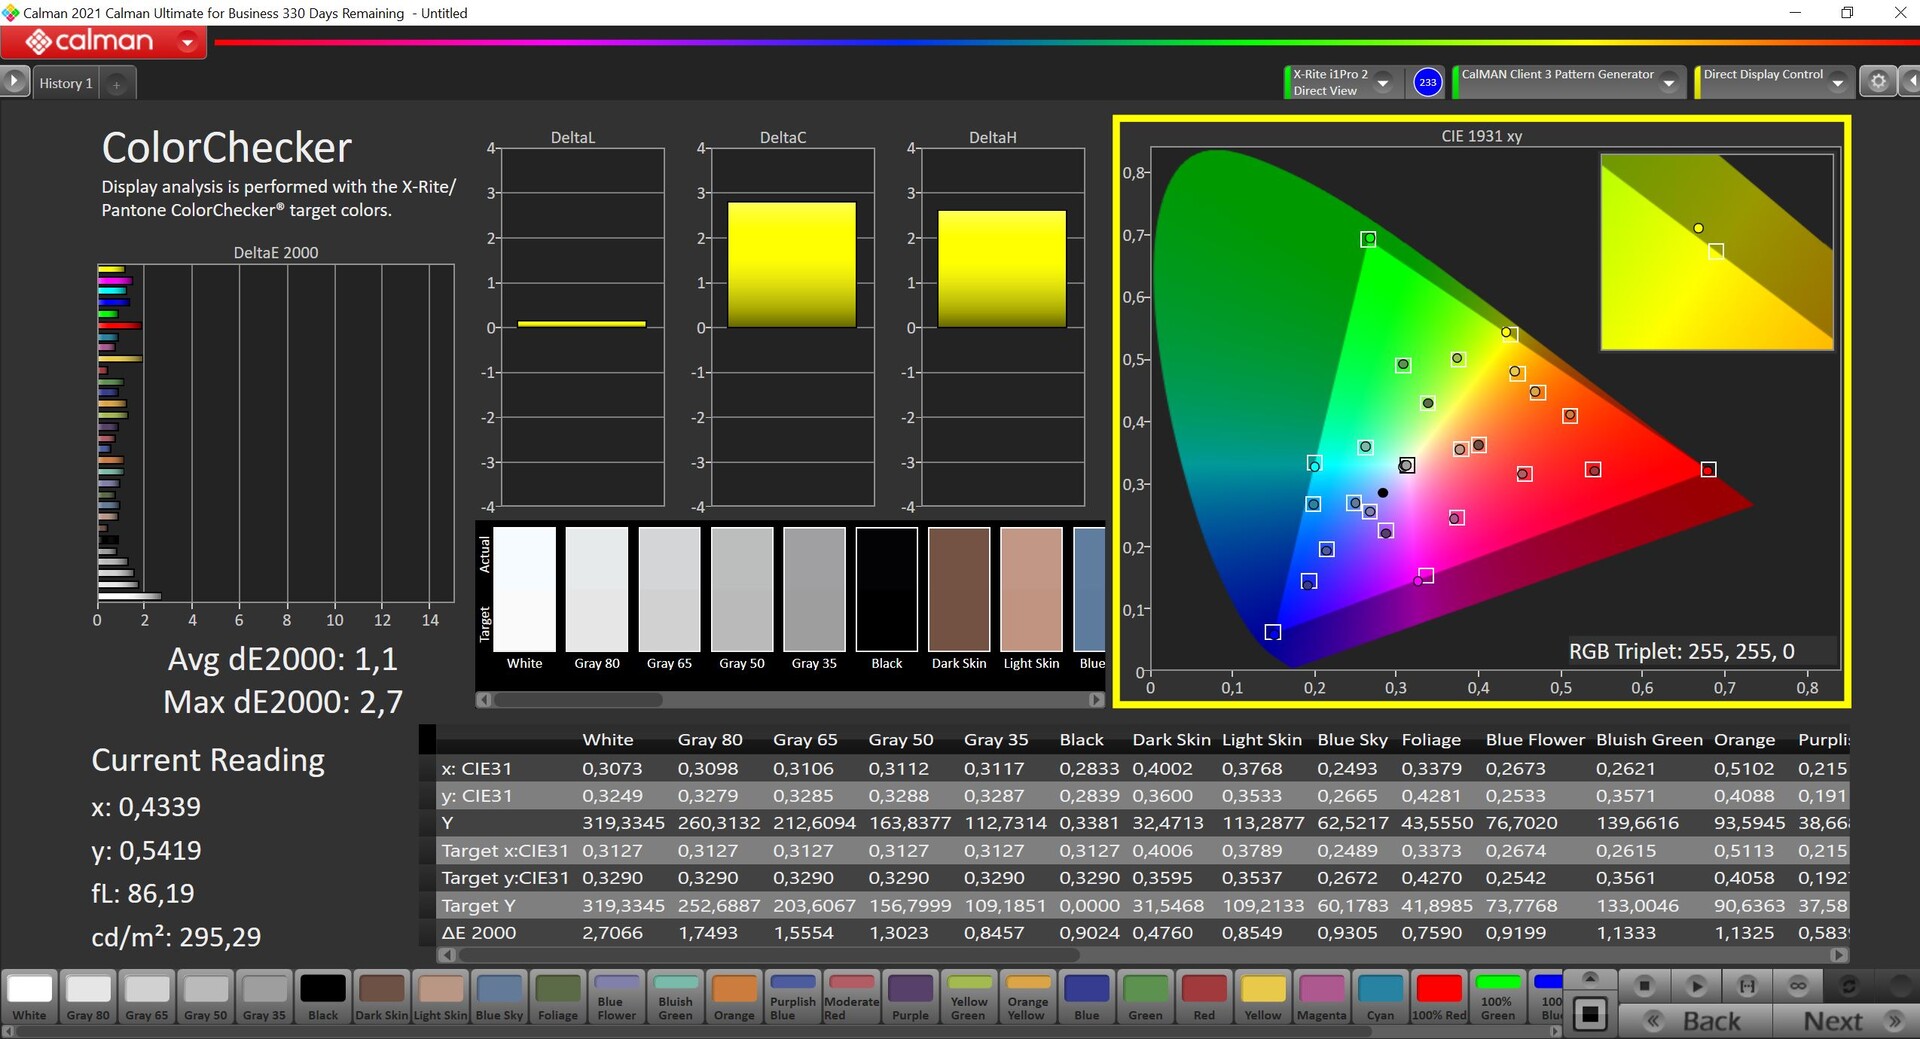
Además del panel Full-HD con 360 Hz que probamos en el Scar 17 G733QS del año pasadoasus también ofrece un panel QHD con una tasa de refresco de 240 Hz, que es el panel de nuestra unidad de pruebas. La impresión de imagen subjetiva del panel IPS mate (2560 x 1440 pixeles, 16:9) es muy buena, y además de Dolby Vision HDR, también soporta Adaptive Sync. Los tiempos de respuesta son extremadamente rápidos, y no se usa PWM. El brillo es de unos 300 cd/m² de media, que también es el mismo nivel que el panel Full-HD con 360 Hz. Por otro lado, el valor de negro es un poco alto, lo que también resulta en una relación de contraste mediocre de alrededor de 1,000:1.
| |||||||||||||||||||||||||
iluminación: 87 %
Brillo con batería: 320 cd/m²
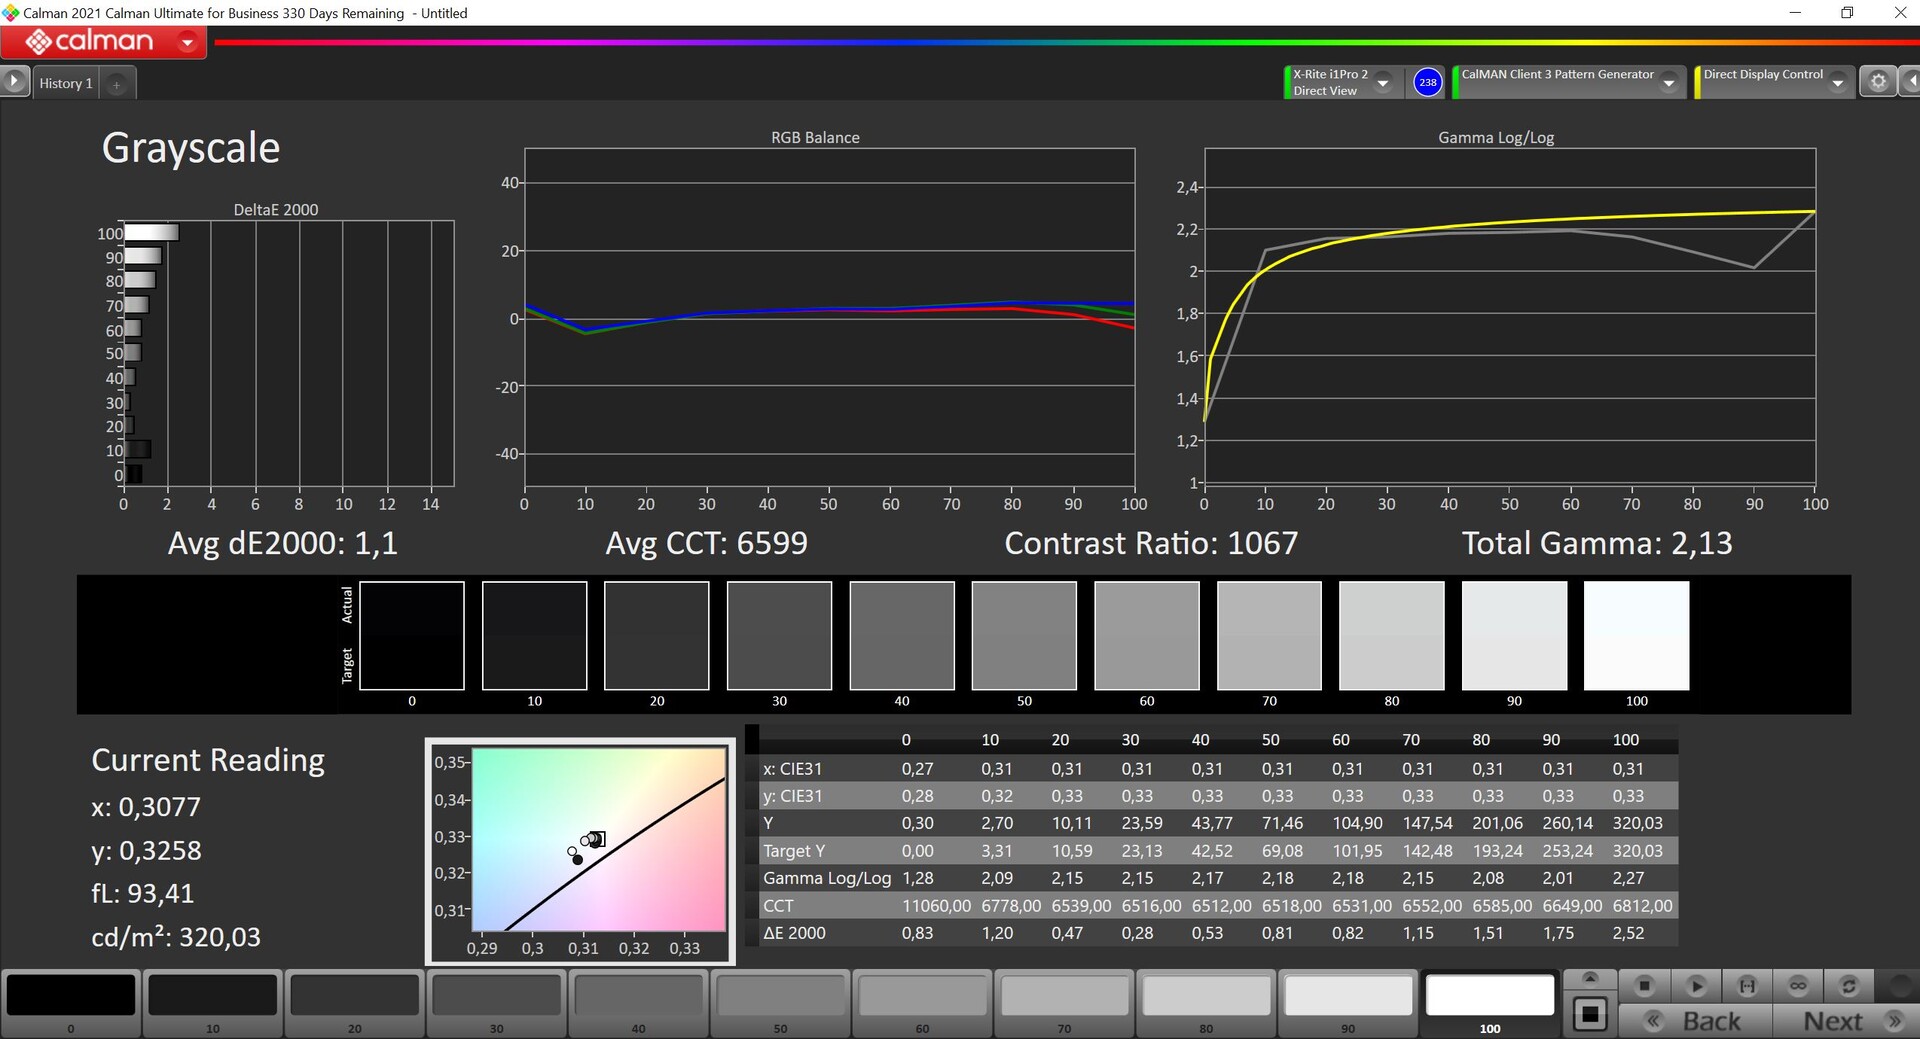
Contraste: 1067:1 (Negro: 0.3 cd/m²)
ΔE ColorChecker Calman: 1.1 | ∀{0.5-29.43 Ø4.73}
ΔE Greyscale Calman: 1.1 | ∀{0.09-98 Ø4.97}
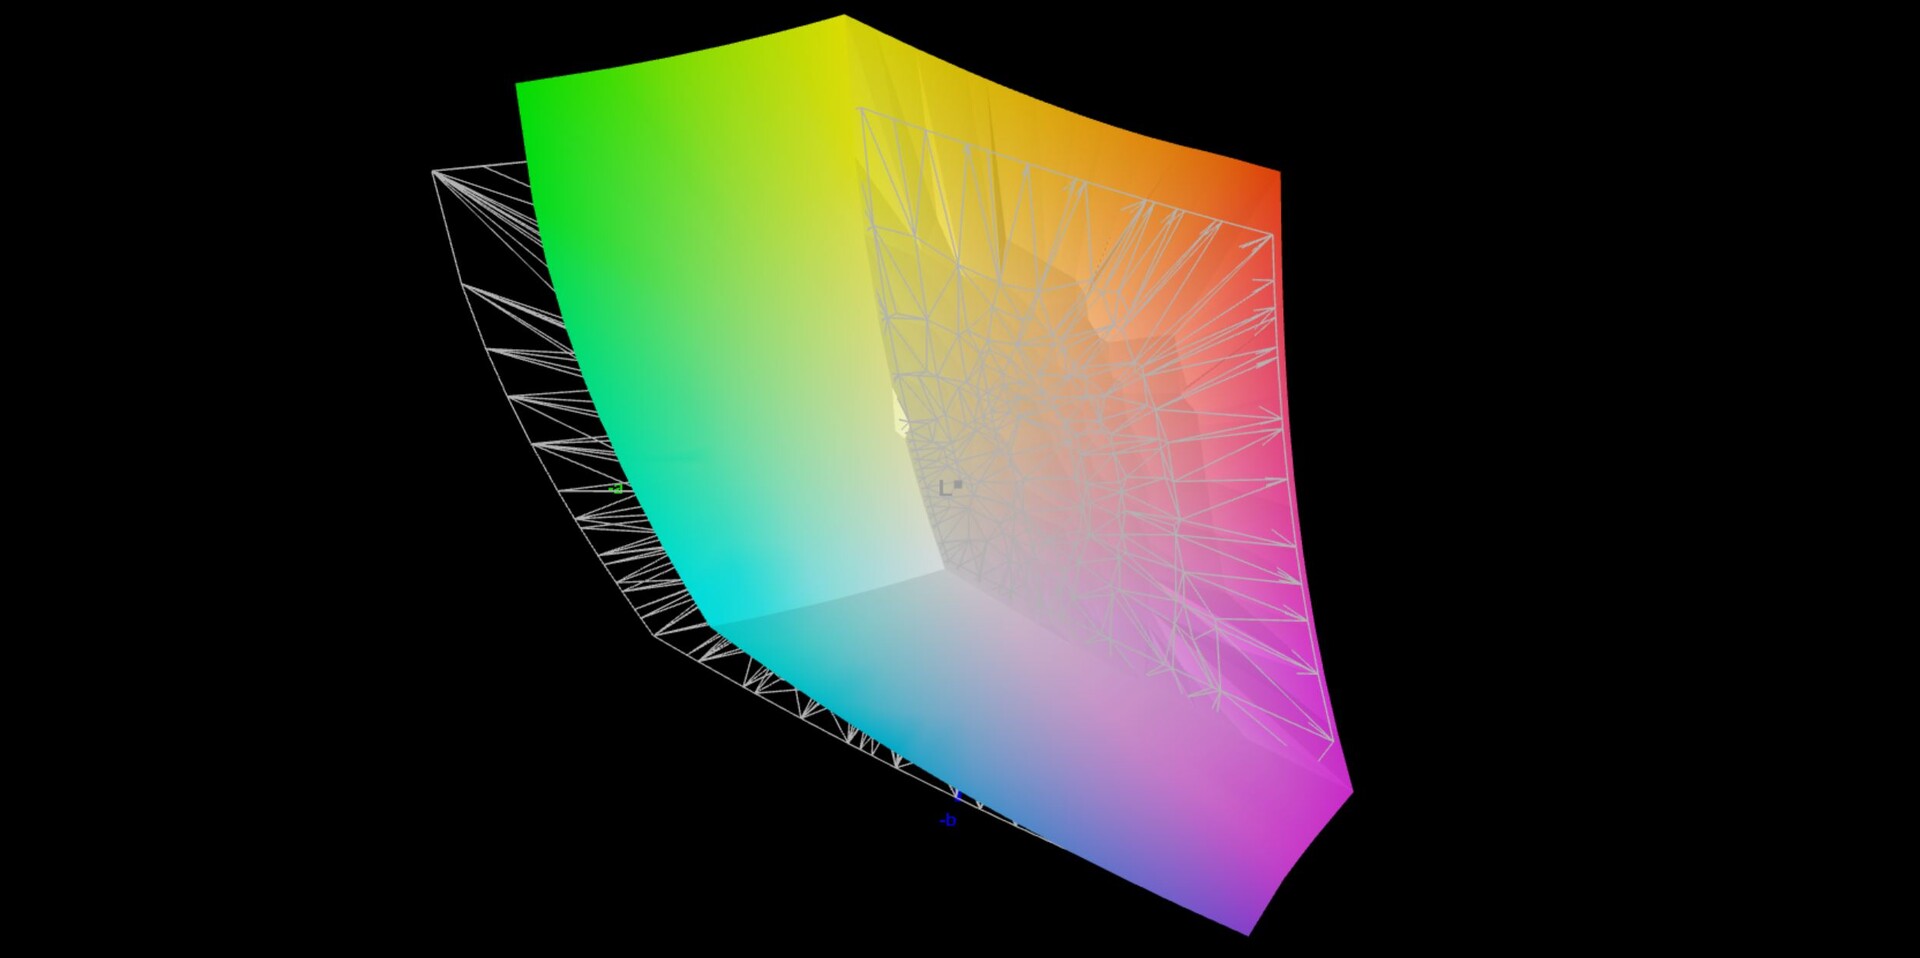
84.8% AdobeRGB 1998 (Argyll 3D)
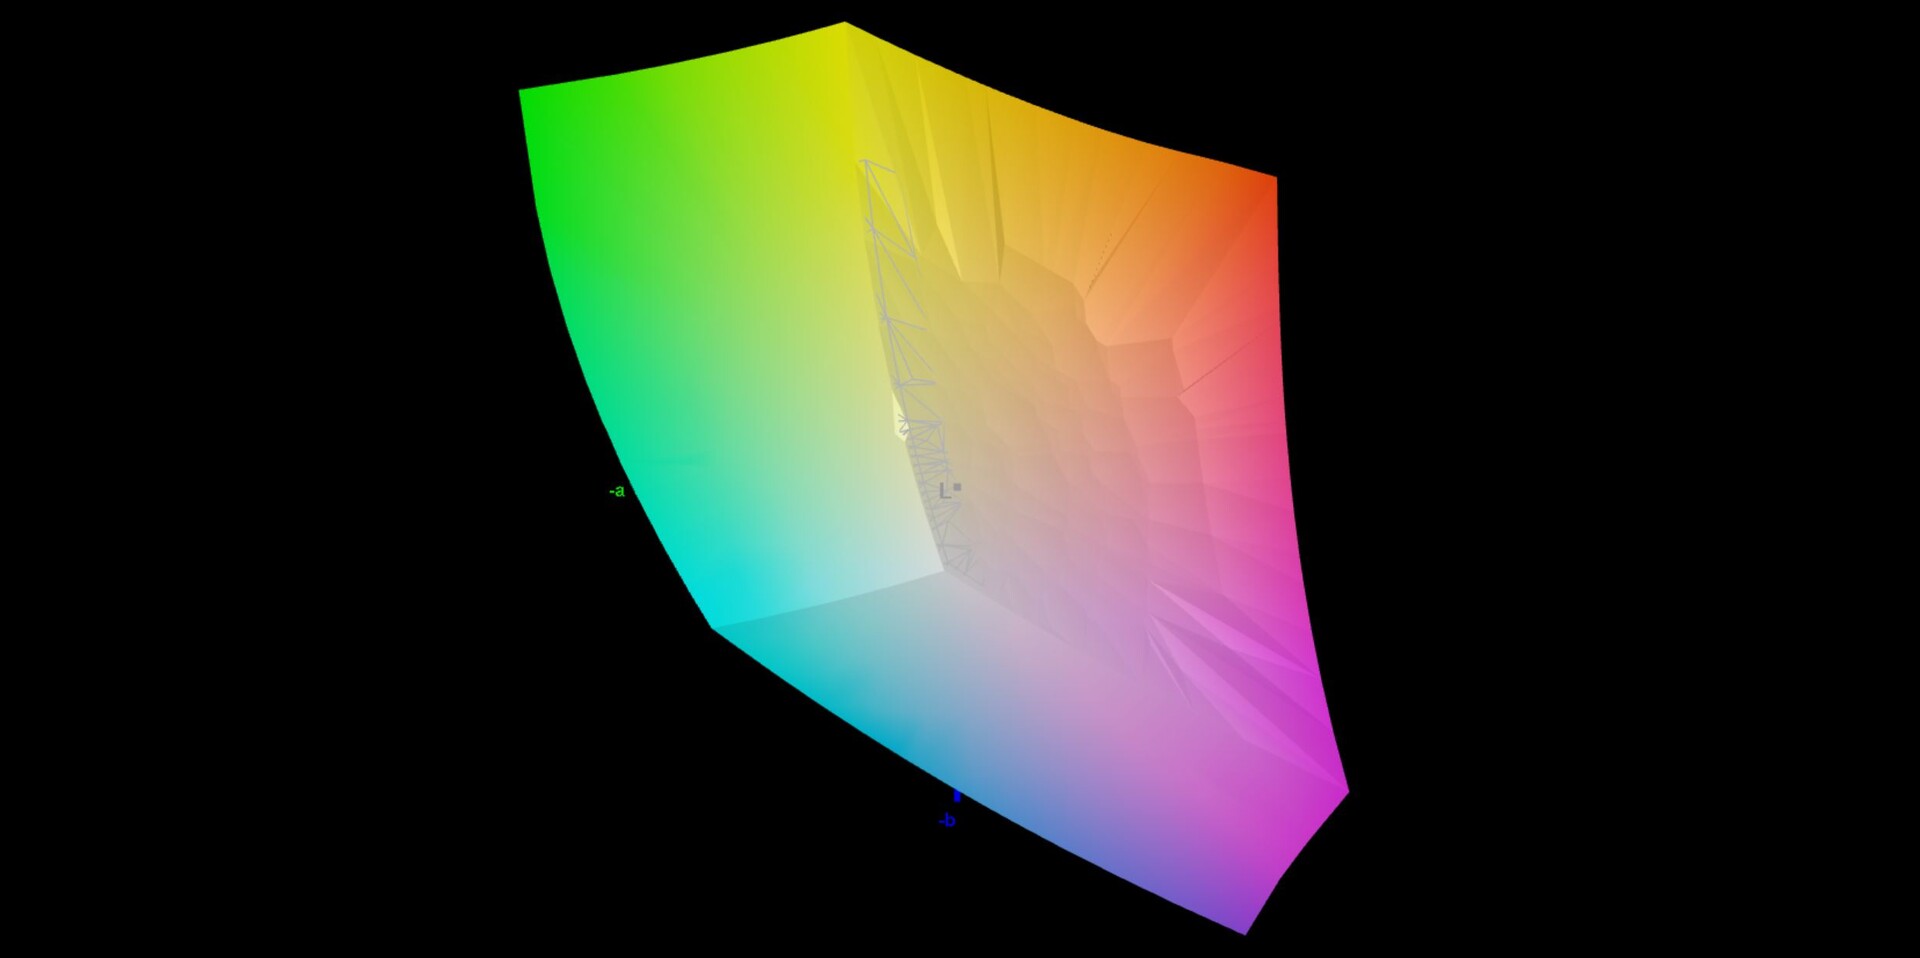
99.9% sRGB (Argyll 3D)
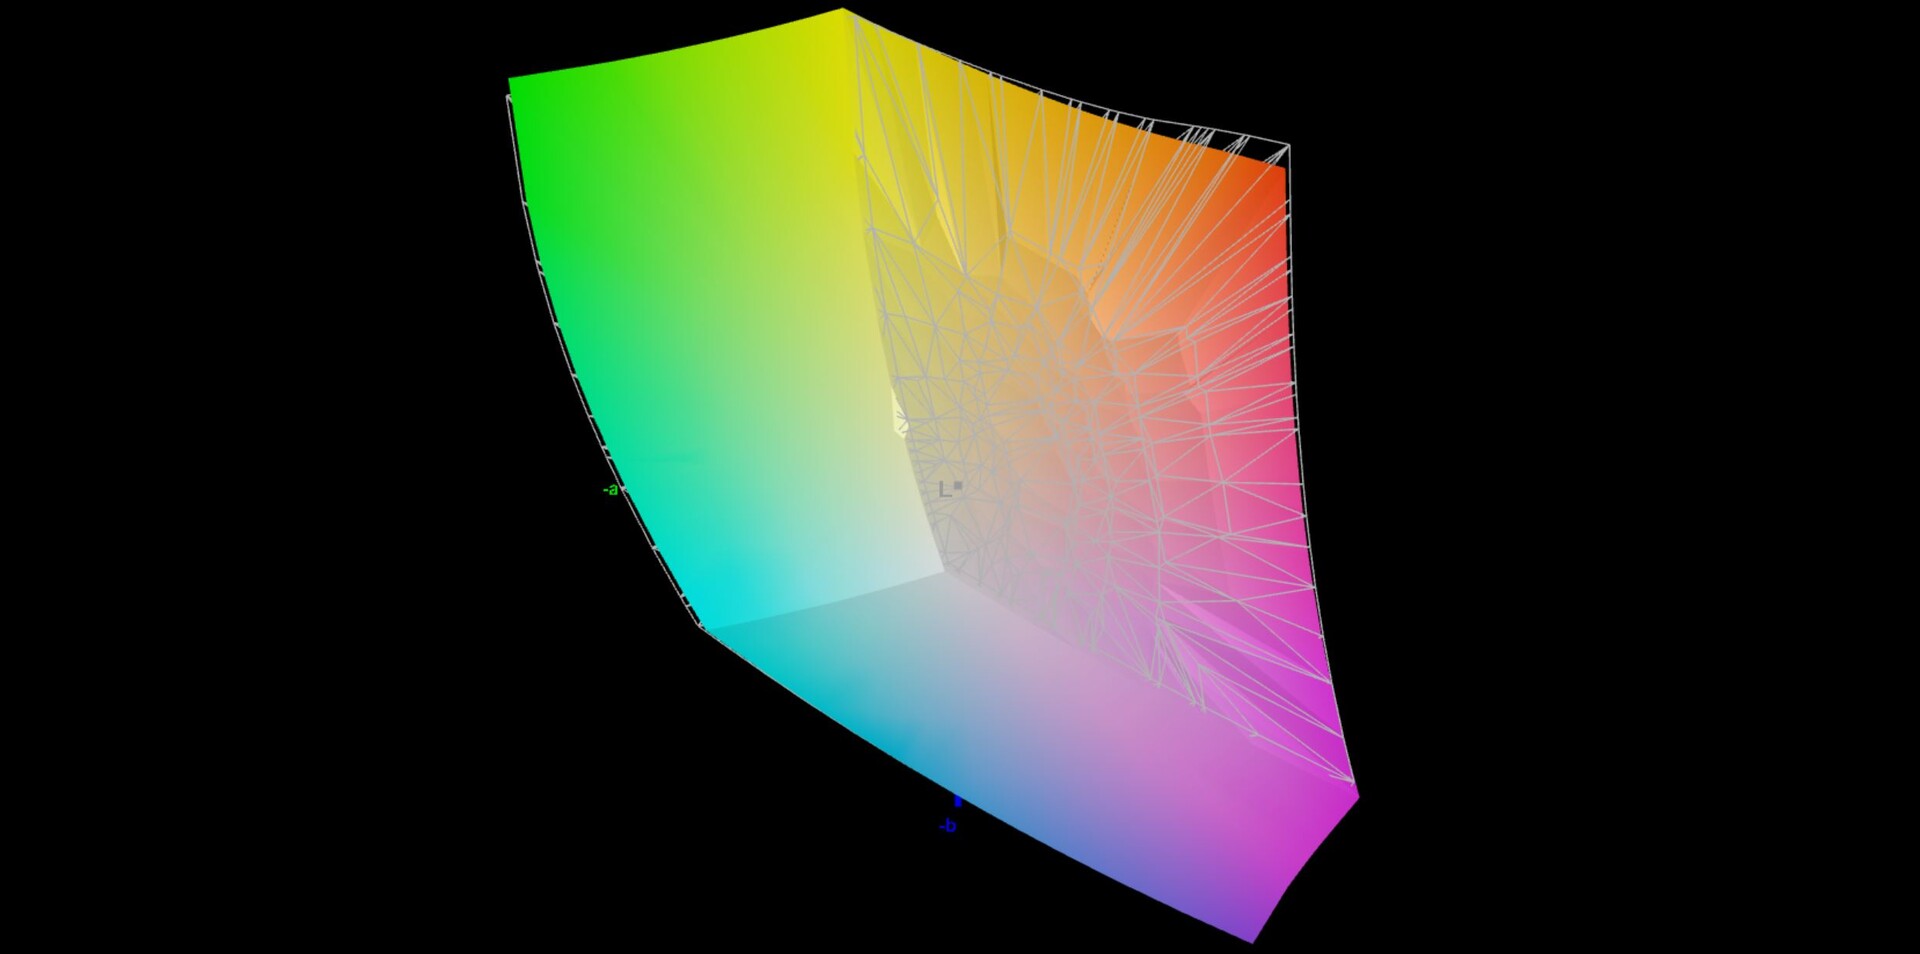
97.1% Display P3 (Argyll 3D)
Gamma: 2.13
CCT: 6599 K
| Asus ROG Strix Scar 17 SE G733CX-LL014W NE173QHM-NZ2, IPS, 2560x1440, 17.3" | Lenovo Legion 7 16IAX7-82TD004SGE NE160QDM-NY1, IPS, 2560x1600, 16" | MSI Titan GT77 12UHS Sharp SHP1544 LQ173M1JW08, IPS-Level, 1920x1080, 17.3" | Schenker XMG Neo 17 M22 BOE0A99, IPS, 2560x1600, 17" | Alienware x17 R2 P48E AU Optronics B173HAN, IPS, 1920x1080, 17.3" | Asus Strix Scar 17 G733QSA-XS99 AU Optronics B173HAN05.4, IPS, 1920x1080, 17.3" | |
|---|---|---|---|---|---|---|
| Display | -16% | -14% | -16% | -8% | -14% | |
| Display P3 Coverage (%) | 97.1 | 69.3 -29% | 70.8 -27% | 69 -29% | 79.2 -18% | 71 -27% |
| sRGB Coverage (%) | 99.9 | 98.2 -2% | 98.9 -1% | 99.8 0% | 99.8 0% | 99.4 -1% |
| AdobeRGB 1998 Coverage (%) | 84.8 | 70.8 -17% | 73 -14% | 69.6 -18% | 79.6 -6% | 72.2 -15% |
| Response Times | -38% | 48% | -25% | -55% | -12% | |
| Response Time Grey 50% / Grey 80% * (ms) | 5.7 ? | 12.6 ? -121% | 3.03 ? 47% | 10.8 ? -89% | 12.4 ? -118% | 6.6 ? -16% |
| Response Time Black / White * (ms) | 10.1 ? | 5.6 ? 45% | 5.28 ? 48% | 6.1 ? 40% | 9.2 ? 9% | 10.8 ? -7% |
| PWM Frequency (Hz) | ||||||
| Screen | -41% | -63% | -9% | -89% | -25% | |
| Brightness middle (cd/m²) | 320 | 547 71% | 280 -12% | 415 30% | 365.4 14% | 303.8 -5% |
| Brightness (cd/m²) | 303 | 523 73% | 275 -9% | 399 32% | 344 14% | 292 -4% |
| Brightness Distribution (%) | 87 | 88 1% | 79 -9% | 90 3% | 85 -2% | 85 -2% |
| Black Level * (cd/m²) | 0.3 | 0.44 -47% | 0.4 -33% | 0.43 -43% | 0.29 3% | 0.23 23% |
| Contrast (:1) | 1067 | 1243 16% | 700 -34% | 965 -10% | 1260 18% | 1321 24% |
| Colorchecker dE 2000 * | 1.1 | 2.1 -91% | 2.1 -91% | 1.44 -31% | 3.17 -188% | 1.87 -70% |
| Colorchecker dE 2000 max. * | 2.7 | 7 -159% | 5.83 -116% | 2.33 14% | 7.69 -185% | 3.26 -21% |
| Greyscale dE 2000 * | 1.1 | 3.2 -191% | 3.3 -200% | 1.8 -64% | 5.3 -382% | 2.7 -145% |
| Gamma | 2.13 103% | 2.23 99% | 2.13 103% | 2.132 103% | 2.18 101% | 2.26 97% |
| CCT | 6599 98% | 6979 93% | 7060 92% | 6327 103% | 5879 111% | 6436 101% |
| Colorchecker dE 2000 calibrated * | 0.9 | 1.58 | 0.89 | 0.51 | 1.45 | |
| Color Space (Percent of AdobeRGB 1998) (%) | 65.6 | |||||
| Color Space (Percent of sRGB) (%) | 99.4 | |||||
| Media total (Programa/Opciones) | -32% /
-35% | -10% /
-35% | -17% /
-13% | -51% /
-65% | -17% /
-20% |
* ... más pequeño es mejor
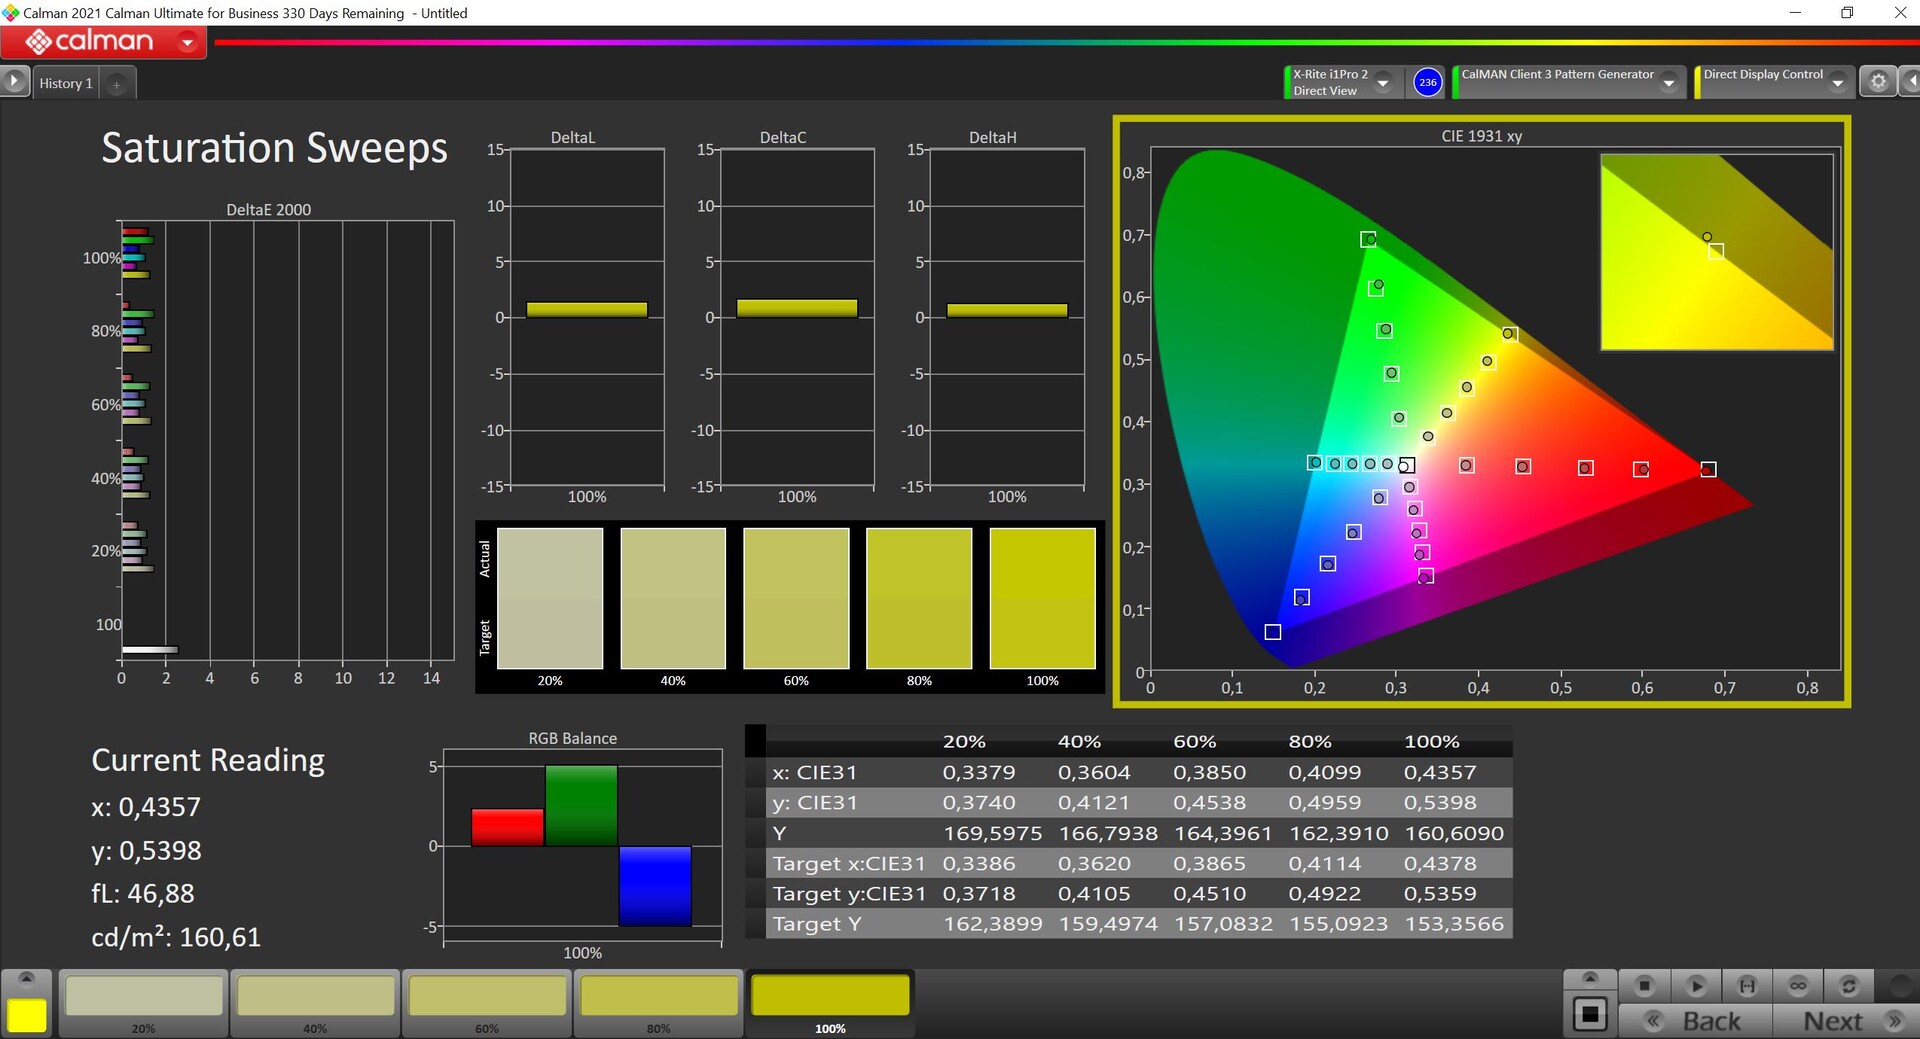
La pantalla cubre el espacio de color P3, y nuestro análisis con el software profesional CalMAN muestra que la pantalla ya es muy precisa en el estado de entrega. Tampoco hay tinte de color, y nuestra propia calibración no condujo a ninguna mejora adicional, por lo que no le ofrecemos un perfil aquí. Este panel QHD es adecuado para el procesamiento de imágenes y vídeos sin ninguna limitación.
Tiempos de respuesta del display
| ↔ Tiempo de respuesta de Negro a Blanco | ||
|---|---|---|
| 10.1 ms ... subida ↗ y bajada ↘ combinada | ↗ 5 ms subida | 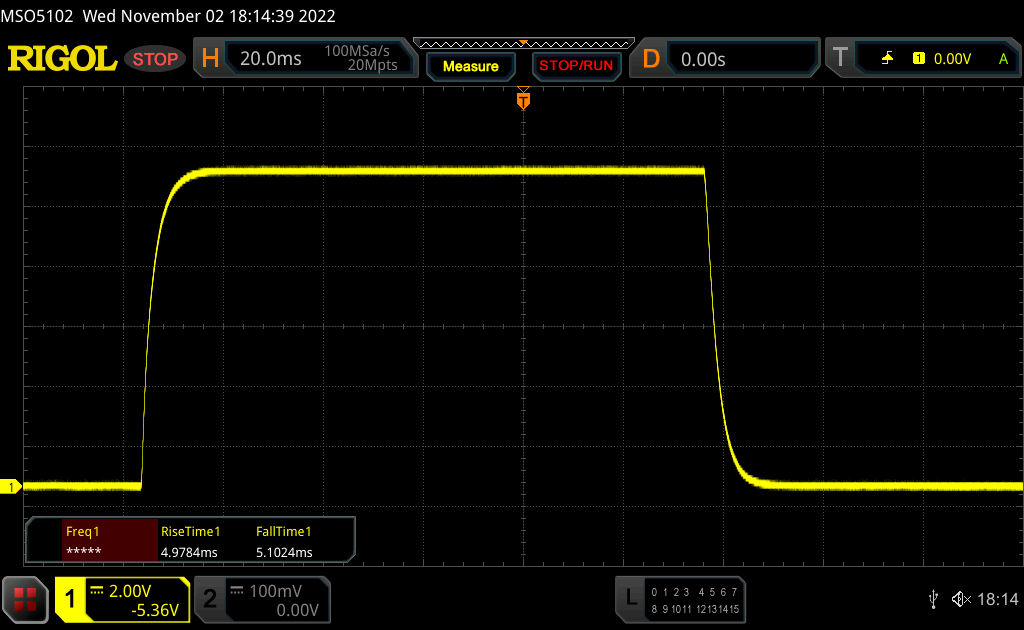 |
| ↘ 5.1 ms bajada | ||
| La pantalla mostró buenos tiempos de respuesta en nuestros tests pero podría ser demasiado lenta para los jugones competitivos. En comparación, todos los dispositivos de prueba van de ##min### (mínimo) a 240 (máximo) ms. » 28 % de todos los dispositivos son mejores. Esto quiere decir que el tiempo de respuesta medido es mejor que la media (19.9 ms) de todos los dispositivos testados. | ||
| ↔ Tiempo de respuesta 50% Gris a 80% Gris | ||
| 5.7 ms ... subida ↗ y bajada ↘ combinada | ↗ 2.7 ms subida | 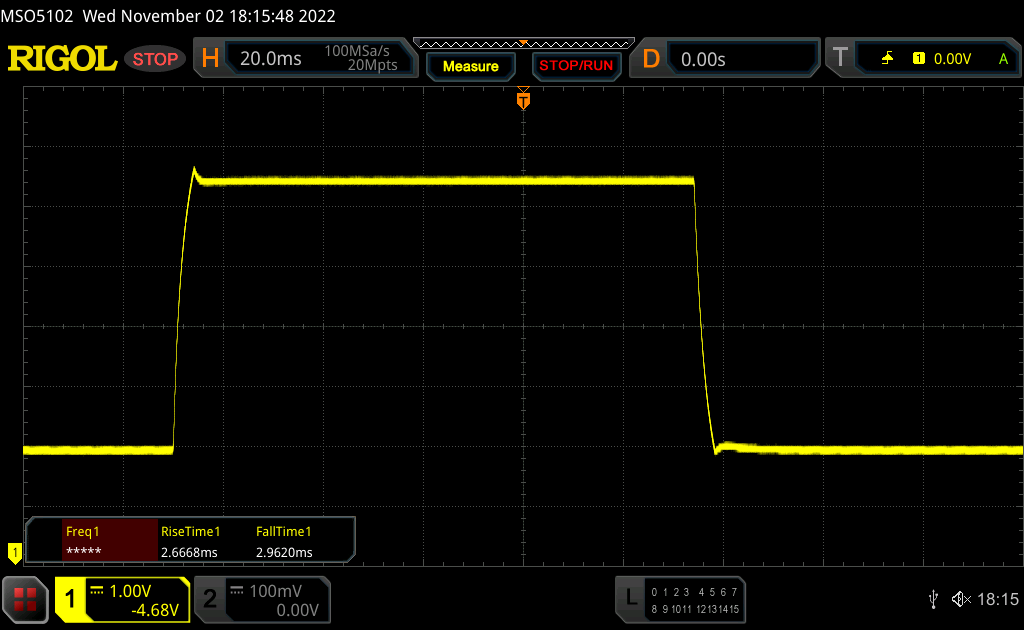 |
| ↘ 3 ms bajada | ||
| La pantalla mostró tiempos de respuesta muy rápidos en nuestros tests y debería ser adecuada para juegos frenéticos. En comparación, todos los dispositivos de prueba van de ##min### (mínimo) a 636 (máximo) ms. » 18 % de todos los dispositivos son mejores. Esto quiere decir que el tiempo de respuesta medido es mejor que la media (31.1 ms) de todos los dispositivos testados. | ||
Parpadeo de Pantalla / PWM (Pulse-Width Modulation)
| Parpadeo de Pantalla / PWM no detectado | 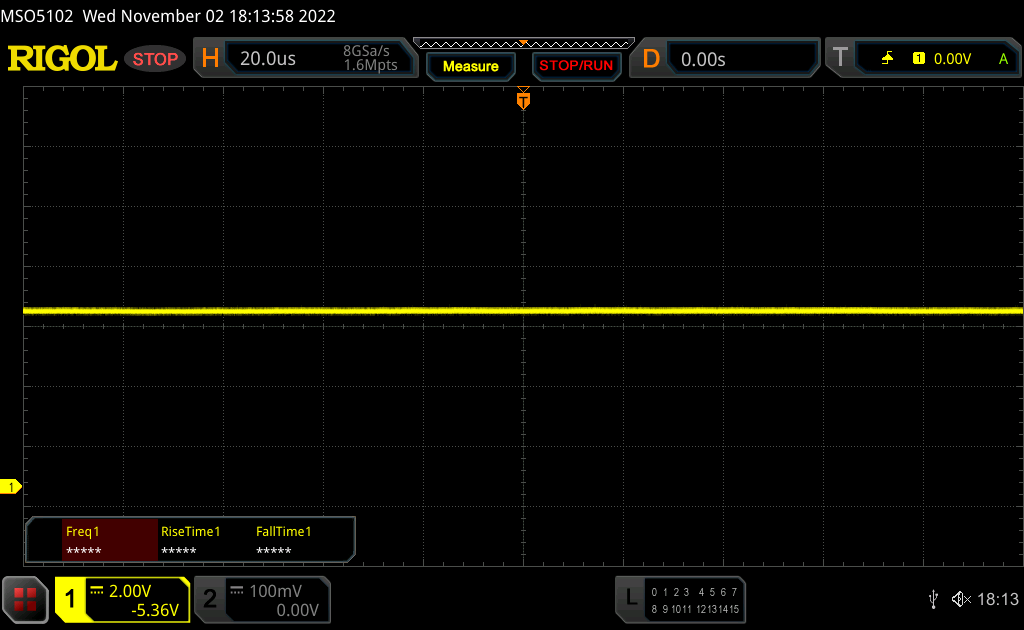 | ||
Comparación: 52 % de todos los dispositivos testados no usaron PWM para atenuar el display. Si se usó, medimos una media de 7798 (mínimo: 5 - máxmo: 343500) Hz. | |||
Rendimiento - Intel HX con los frenos aplicados
Condiciones de la prueba
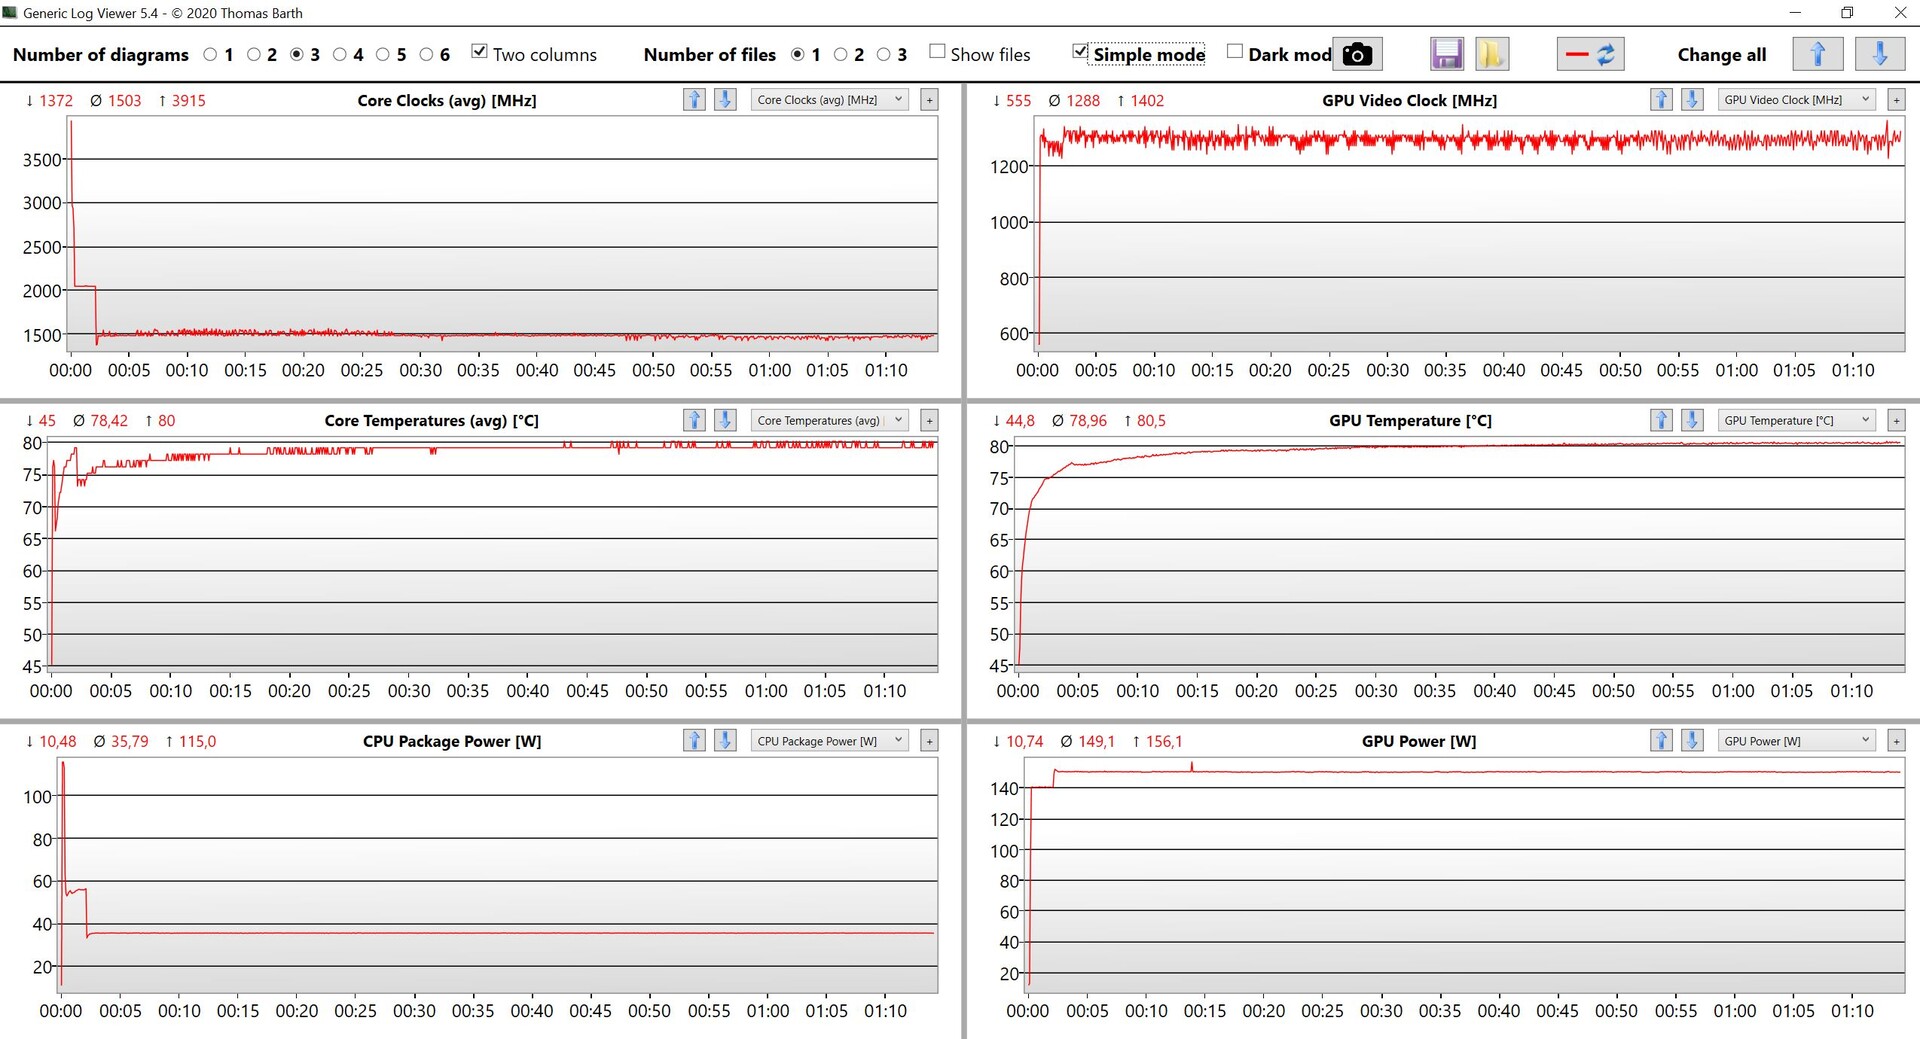
El software ROG ofrece amplias opciones de configuración y perfiles de energía. Por ejemplo, puedes desactivar completamente la GPU integrada (MUX) o establecer manualmente los valores de energía para la CPU y la GPU. Para nuestras pruebas y mediciones a continuación, usamos el perfil de Rendimiento, ya que esto ya hace que el rendimiento completo de la GPU esté disponible. Aunque el rendimiento de la CPU es ligeramente superior en modo Turbo, esto no justifica el ruido de ventilador significativamente mayor en nuestra opinión.
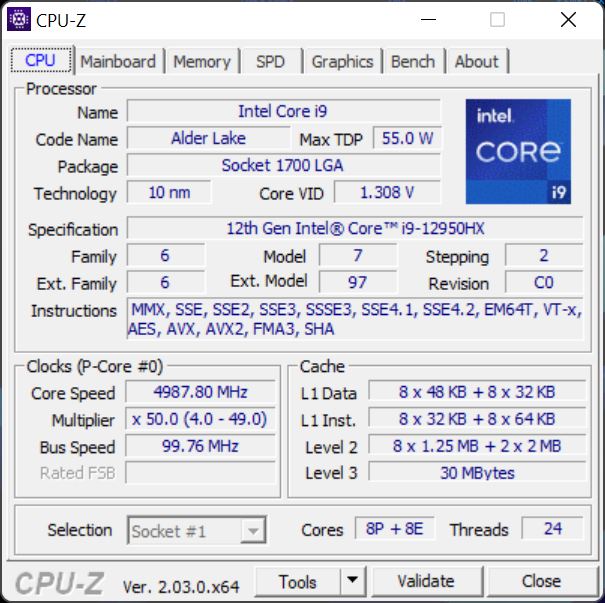
Procesador - Core i9-12950HX
ElIntel Core i9-12950HX es actualmente el procesador móvil más rápido de Intel. Aunque es capaz de consumir hasta 175 vatios, se queda lejos de este valor en nuestra unidad de pruebas. En su lugar, vemos un consumo máximo de 115 vatios (incluso en modo Turbo), y en algún momento el valor se nivela en 70 vatios (105 vatios en modo Turbo). Si bien el rendimiento de la CPU no es malo en absoluto, también podrías conseguirlo con un Core i9 normal, y la prima adicional por el chip HX no merece el gasto adicional
En funcionamiento en batería, el consumo de energía se limita a 35 vatios, lo que lleva a un rendimiento multinúcleo que se reduce en aproximadamente un 40%. Puedes encontrar más pruebas de rendimiento de la CPU en nuestra sección técnica correspondiente.
Cinebench R15 Multi Constant Load Test
Cinebench R23: Multi Core | Single Core
Cinebench R20: CPU (Multi Core) | CPU (Single Core)
Cinebench R15: CPU Multi 64Bit | CPU Single 64Bit
Blender: v2.79 BMW27 CPU
7-Zip 18.03: 7z b 4 | 7z b 4 -mmt1
Geekbench 5.5: Multi-Core | Single-Core
HWBOT x265 Benchmark v2.2: 4k Preset
LibreOffice : 20 Documents To PDF
R Benchmark 2.5: Overall mean
| CPU Performance rating | |
| Media de la clase Gaming | |
| Lenovo Legion 7 16IAX7-82TD004SGE | |
| MSI Titan GT77 12UHS | |
| Asus ROG Strix Scar 17 SE G733CX-LL014W | |
| Medio Intel Core i9-12950HX | |
| Alienware x17 R2 P48E | |
| Schenker XMG Neo 17 M22 | |
| Asus Strix Scar 17 G733QSA-XS99 | |
| Cinebench R23 / Multi Core | |
| Media de la clase Gaming (10488 - 40970, n=112, últimos 2 años) | |
| MSI Titan GT77 12UHS | |
| Lenovo Legion 7 16IAX7-82TD004SGE | |
| Asus ROG Strix Scar 17 SE G733CX-LL014W | |
| Medio Intel Core i9-12950HX (16277 - 23113, n=7) | |
| Alienware x17 R2 P48E | |
| Schenker XMG Neo 17 M22 | |
| Asus Strix Scar 17 G733QSA-XS99 | |
| Cinebench R23 / Single Core | |
| Media de la clase Gaming (1166 - 2356, n=112, últimos 2 años) | |
| Lenovo Legion 7 16IAX7-82TD004SGE | |
| MSI Titan GT77 12UHS | |
| Alienware x17 R2 P48E | |
| Asus ROG Strix Scar 17 SE G733CX-LL014W | |
| Medio Intel Core i9-12950HX (1465 - 1922, n=7) | |
| Schenker XMG Neo 17 M22 | |
| Asus Strix Scar 17 G733QSA-XS99 | |
| Cinebench R20 / CPU (Multi Core) | |
| Media de la clase Gaming (4029 - 16108, n=111, últimos 2 años) | |
| MSI Titan GT77 12UHS | |
| Lenovo Legion 7 16IAX7-82TD004SGE | |
| Medio Intel Core i9-12950HX (6625 - 8777, n=7) | |
| Asus ROG Strix Scar 17 SE G733CX-LL014W | |
| Alienware x17 R2 P48E | |
| Schenker XMG Neo 17 M22 | |
| Asus Strix Scar 17 G733QSA-XS99 | |
| Cinebench R20 / CPU (Single Core) | |
| Media de la clase Gaming (442 - 895, n=111, últimos 2 años) | |
| Lenovo Legion 7 16IAX7-82TD004SGE | |
| Asus ROG Strix Scar 17 SE G733CX-LL014W | |
| MSI Titan GT77 12UHS | |
| Alienware x17 R2 P48E | |
| Medio Intel Core i9-12950HX (703 - 741, n=7) | |
| Schenker XMG Neo 17 M22 | |
| Asus Strix Scar 17 G733QSA-XS99 | |
| Cinebench R15 / CPU Multi 64Bit | |
| Media de la clase Gaming (1578 - 6271, n=111, últimos 2 años) | |
| MSI Titan GT77 12UHS | |
| Lenovo Legion 7 16IAX7-82TD004SGE | |
| Asus ROG Strix Scar 17 SE G733CX-LL014W | |
| Medio Intel Core i9-12950HX (2464 - 3530, n=7) | |
| Alienware x17 R2 P48E | |
| Schenker XMG Neo 17 M22 | |
| Asus Strix Scar 17 G733QSA-XS99 | |
| Cinebench R15 / CPU Single 64Bit | |
| Media de la clase Gaming (188.8 - 343, n=111, últimos 2 años) | |
| Lenovo Legion 7 16IAX7-82TD004SGE | |
| MSI Titan GT77 12UHS | |
| Asus ROG Strix Scar 17 SE G733CX-LL014W | |
| Alienware x17 R2 P48E | |
| Medio Intel Core i9-12950HX (167 - 276, n=7) | |
| Schenker XMG Neo 17 M22 | |
| Asus Strix Scar 17 G733QSA-XS99 | |
| Blender / v2.79 BMW27 CPU | |
| Asus Strix Scar 17 G733QSA-XS99 | |
| Schenker XMG Neo 17 M22 | |
| Asus ROG Strix Scar 17 SE G733CX-LL014W | |
| Alienware x17 R2 P48E | |
| Medio Intel Core i9-12950HX (138 - 193, n=7) | |
| Media de la clase Gaming (80 - 330, n=109, últimos 2 años) | |
| Lenovo Legion 7 16IAX7-82TD004SGE | |
| MSI Titan GT77 12UHS | |
| 7-Zip 18.03 / 7z b 4 | |
| Media de la clase Gaming (33491 - 148086, n=110, últimos 2 años) | |
| Lenovo Legion 7 16IAX7-82TD004SGE | |
| MSI Titan GT77 12UHS | |
| Medio Intel Core i9-12950HX (65637 - 85019, n=7) | |
| Asus ROG Strix Scar 17 SE G733CX-LL014W | |
| Alienware x17 R2 P48E | |
| Schenker XMG Neo 17 M22 | |
| Asus Strix Scar 17 G733QSA-XS99 | |
| 7-Zip 18.03 / 7z b 4 -mmt1 | |
| Media de la clase Gaming (4199 - 7436, n=110, últimos 2 años) | |
| Lenovo Legion 7 16IAX7-82TD004SGE | |
| MSI Titan GT77 12UHS | |
| Asus ROG Strix Scar 17 SE G733CX-LL014W | |
| Medio Intel Core i9-12950HX (6022 - 6318, n=7) | |
| Schenker XMG Neo 17 M22 | |
| Alienware x17 R2 P48E | |
| Asus Strix Scar 17 G733QSA-XS99 | |
| Geekbench 5.5 / Multi-Core | |
| Media de la clase Gaming (6460 - 27010, n=110, últimos 2 años) | |
| Lenovo Legion 7 16IAX7-82TD004SGE | |
| MSI Titan GT77 12UHS | |
| Asus ROG Strix Scar 17 SE G733CX-LL014W | |
| Medio Intel Core i9-12950HX (14028 - 16009, n=7) | |
| Alienware x17 R2 P48E | |
| Schenker XMG Neo 17 M22 | |
| Asus Strix Scar 17 G733QSA-XS99 | |
| Geekbench 5.5 / Single-Core | |
| Media de la clase Gaming (986 - 2474, n=110, últimos 2 años) | |
| MSI Titan GT77 12UHS | |
| Medio Intel Core i9-12950HX (1847 - 1945, n=7) | |
| Alienware x17 R2 P48E | |
| Lenovo Legion 7 16IAX7-82TD004SGE | |
| Asus ROG Strix Scar 17 SE G733CX-LL014W | |
| Schenker XMG Neo 17 M22 | |
| Asus Strix Scar 17 G733QSA-XS99 | |
| HWBOT x265 Benchmark v2.2 / 4k Preset | |
| Media de la clase Gaming (11.5 - 44.3, n=110, últimos 2 años) | |
| MSI Titan GT77 12UHS | |
| Lenovo Legion 7 16IAX7-82TD004SGE | |
| Asus ROG Strix Scar 17 SE G733CX-LL014W | |
| Medio Intel Core i9-12950HX (18.6 - 26.5, n=7) | |
| Alienware x17 R2 P48E | |
| Schenker XMG Neo 17 M22 | |
| Asus Strix Scar 17 G733QSA-XS99 | |
| LibreOffice / 20 Documents To PDF | |
| Schenker XMG Neo 17 M22 | |
| Media de la clase Gaming (19 - 88.8, n=110, últimos 2 años) | |
| Asus Strix Scar 17 G733QSA-XS99 | |
| Alienware x17 R2 P48E | |
| Medio Intel Core i9-12950HX (34.7 - 45.4, n=7) | |
| MSI Titan GT77 12UHS | |
| Asus ROG Strix Scar 17 SE G733CX-LL014W | |
| Lenovo Legion 7 16IAX7-82TD004SGE | |
| R Benchmark 2.5 / Overall mean | |
| Asus Strix Scar 17 G733QSA-XS99 | |
| Schenker XMG Neo 17 M22 | |
| Medio Intel Core i9-12950HX (0.4251 - 0.4515, n=7) | |
| Alienware x17 R2 P48E | |
| Media de la clase Gaming (0.3439 - 0.759, n=111, últimos 2 años) | |
| Asus ROG Strix Scar 17 SE G733CX-LL014W | |
| Lenovo Legion 7 16IAX7-82TD004SGE | |
| MSI Titan GT77 12UHS | |
* ... más pequeño es mejor
AIDA64: FP32 Ray-Trace | FPU Julia | CPU SHA3 | CPU Queen | FPU SinJulia | FPU Mandel | CPU AES | CPU ZLib | FP64 Ray-Trace | CPU PhotoWorxx
| Performance rating | |
| Media de la clase Gaming | |
| MSI Titan GT77 12UHS | |
| Asus ROG Strix Scar 17 SE G733CX-LL014W | |
| Medio Intel Core i9-12950HX | |
| Schenker XMG Neo 17 M22 | |
| Asus Strix Scar 17 G733QSA-XS99 | |
| Lenovo Legion 7 16IAX7-82TD004SGE | |
| Alienware x17 R2 P48E | |
| AIDA64 / FP32 Ray-Trace | |
| Media de la clase Gaming (10227 - 85542, n=109, últimos 2 años) | |
| MSI Titan GT77 12UHS | |
| Medio Intel Core i9-12950HX (15499 - 22868, n=7) | |
| Asus ROG Strix Scar 17 SE G733CX-LL014W | |
| Schenker XMG Neo 17 M22 | |
| Asus Strix Scar 17 G733QSA-XS99 | |
| Lenovo Legion 7 16IAX7-82TD004SGE | |
| Alienware x17 R2 P48E | |
| AIDA64 / FPU Julia | |
| Media de la clase Gaming (51376 - 238426, n=109, últimos 2 años) | |
| MSI Titan GT77 12UHS | |
| Asus Strix Scar 17 G733QSA-XS99 | |
| Schenker XMG Neo 17 M22 | |
| Medio Intel Core i9-12950HX (77846 - 115907, n=7) | |
| Asus ROG Strix Scar 17 SE G733CX-LL014W | |
| Lenovo Legion 7 16IAX7-82TD004SGE | |
| Alienware x17 R2 P48E | |
| AIDA64 / CPU SHA3 | |
| Media de la clase Gaming (2180 - 9817, n=109, últimos 2 años) | |
| MSI Titan GT77 12UHS | |
| Lenovo Legion 7 16IAX7-82TD004SGE | |
| Asus ROG Strix Scar 17 SE G733CX-LL014W | |
| Medio Intel Core i9-12950HX (3426 - 5069, n=7) | |
| Alienware x17 R2 P48E | |
| Asus Strix Scar 17 G733QSA-XS99 | |
| Schenker XMG Neo 17 M22 | |
| AIDA64 / CPU Queen | |
| Media de la clase Gaming (49785 - 173351, n=100, últimos 2 años) | |
| Alienware x17 R2 P48E | |
| Asus ROG Strix Scar 17 SE G733CX-LL014W | |
| Medio Intel Core i9-12950HX (102752 - 104726, n=7) | |
| Asus Strix Scar 17 G733QSA-XS99 | |
| MSI Titan GT77 12UHS | |
| Schenker XMG Neo 17 M22 | |
| Lenovo Legion 7 16IAX7-82TD004SGE | |
| AIDA64 / FPU SinJulia | |
| Media de la clase Gaming (4424 - 33636, n=109, últimos 2 años) | |
| Lenovo Legion 7 16IAX7-82TD004SGE | |
| MSI Titan GT77 12UHS | |
| Schenker XMG Neo 17 M22 | |
| Asus Strix Scar 17 G733QSA-XS99 | |
| Medio Intel Core i9-12950HX (10134 - 12823, n=7) | |
| Asus ROG Strix Scar 17 SE G733CX-LL014W | |
| Alienware x17 R2 P48E | |
| AIDA64 / FPU Mandel | |
| Media de la clase Gaming (25115 - 128721, n=109, últimos 2 años) | |
| Asus Strix Scar 17 G733QSA-XS99 | |
| Schenker XMG Neo 17 M22 | |
| MSI Titan GT77 12UHS | |
| Medio Intel Core i9-12950HX (37146 - 57340, n=7) | |
| Asus ROG Strix Scar 17 SE G733CX-LL014W | |
| Lenovo Legion 7 16IAX7-82TD004SGE | |
| Alienware x17 R2 P48E | |
| AIDA64 / CPU AES | |
| MSI Titan GT77 12UHS | |
| Asus ROG Strix Scar 17 SE G733CX-LL014W | |
| Schenker XMG Neo 17 M22 | |
| Asus Strix Scar 17 G733QSA-XS99 | |
| Lenovo Legion 7 16IAX7-82TD004SGE | |
| Medio Intel Core i9-12950HX (72599 - 181128, n=7) | |
| Alienware x17 R2 P48E | |
| Media de la clase Gaming (39258 - 247074, n=109, últimos 2 años) | |
| AIDA64 / CPU ZLib | |
| Media de la clase Gaming (574 - 2531, n=109, últimos 2 años) | |
| Lenovo Legion 7 16IAX7-82TD004SGE | |
| MSI Titan GT77 12UHS | |
| Asus ROG Strix Scar 17 SE G733CX-LL014W | |
| Alienware x17 R2 P48E | |
| Medio Intel Core i9-12950HX (996 - 1417, n=7) | |
| Asus Strix Scar 17 G733QSA-XS99 | |
| Schenker XMG Neo 17 M22 | |
| AIDA64 / FP64 Ray-Trace | |
| Media de la clase Gaming (5509 - 45446, n=109, últimos 2 años) | |
| MSI Titan GT77 12UHS | |
| Medio Intel Core i9-12950HX (8455 - 12432, n=7) | |
| Asus ROG Strix Scar 17 SE G733CX-LL014W | |
| Asus Strix Scar 17 G733QSA-XS99 | |
| Schenker XMG Neo 17 M22 | |
| Lenovo Legion 7 16IAX7-82TD004SGE | |
| Alienware x17 R2 P48E | |
| AIDA64 / CPU PhotoWorxx | |
| Media de la clase Gaming (12271 - 89891, n=109, últimos 2 años) | |
| Asus ROG Strix Scar 17 SE G733CX-LL014W | |
| MSI Titan GT77 12UHS | |
| Medio Intel Core i9-12950HX (35479 - 42655, n=7) | |
| Lenovo Legion 7 16IAX7-82TD004SGE | |
| Alienware x17 R2 P48E | |
| Schenker XMG Neo 17 M22 | |
| Asus Strix Scar 17 G733QSA-XS99 | |
Rendimiento del sistema
La impresión subjetiva de rendimiento es excelente, lo que también se confirma con los buenos resultados de los benchmarks. No notamos ningún problema en absoluto durante las pruebas.
CrossMark: Overall | Productivity | Creativity | Responsiveness
| PCMark 10 / Score | |
| Lenovo Legion 7 16IAX7-82TD004SGE | |
| Media de la clase Gaming (5828 - 11574, n=95, últimos 2 años) | |
| MSI Titan GT77 12UHS | |
| Alienware x17 R2 P48E | |
| Asus ROG Strix Scar 17 SE G733CX-LL014W | |
| Medio Intel Core i9-12950HX, NVIDIA GeForce RTX 3080 Ti Laptop GPU (n=1) | |
| Asus Strix Scar 17 G733QSA-XS99 | |
| Schenker XMG Neo 17 M22 | |
| PCMark 10 / Essentials | |
| Alienware x17 R2 P48E | |
| Lenovo Legion 7 16IAX7-82TD004SGE | |
| MSI Titan GT77 12UHS | |
| Media de la clase Gaming (8810 - 12600, n=99, últimos 2 años) | |
| Asus Strix Scar 17 G733QSA-XS99 | |
| Asus ROG Strix Scar 17 SE G733CX-LL014W | |
| Medio Intel Core i9-12950HX, NVIDIA GeForce RTX 3080 Ti Laptop GPU (n=1) | |
| Schenker XMG Neo 17 M22 | |
| PCMark 10 / Productivity | |
| Lenovo Legion 7 16IAX7-82TD004SGE | |
| Media de la clase Gaming (6845 - 18766, n=97, últimos 2 años) | |
| MSI Titan GT77 12UHS | |
| Alienware x17 R2 P48E | |
| Asus ROG Strix Scar 17 SE G733CX-LL014W | |
| Medio Intel Core i9-12950HX, NVIDIA GeForce RTX 3080 Ti Laptop GPU (n=1) | |
| Asus Strix Scar 17 G733QSA-XS99 | |
| Schenker XMG Neo 17 M22 | |
| PCMark 10 / Digital Content Creation | |
| Lenovo Legion 7 16IAX7-82TD004SGE | |
| Media de la clase Gaming (7602 - 19657, n=97, últimos 2 años) | |
| MSI Titan GT77 12UHS | |
| Alienware x17 R2 P48E | |
| Asus ROG Strix Scar 17 SE G733CX-LL014W | |
| Medio Intel Core i9-12950HX, NVIDIA GeForce RTX 3080 Ti Laptop GPU (n=1) | |
| Asus Strix Scar 17 G733QSA-XS99 | |
| Schenker XMG Neo 17 M22 | |
| CrossMark / Overall | |
| Lenovo Legion 7 16IAX7-82TD004SGE | |
| Asus ROG Strix Scar 17 SE G733CX-LL014W | |
| Medio Intel Core i9-12950HX, NVIDIA GeForce RTX 3080 Ti Laptop GPU (n=1) | |
| MSI Titan GT77 12UHS | |
| Media de la clase Gaming (1366 - 2409, n=97, últimos 2 años) | |
| Alienware x17 R2 P48E | |
| Schenker XMG Neo 17 M22 | |
| CrossMark / Productivity | |
| Lenovo Legion 7 16IAX7-82TD004SGE | |
| MSI Titan GT77 12UHS | |
| Asus ROG Strix Scar 17 SE G733CX-LL014W | |
| Medio Intel Core i9-12950HX, NVIDIA GeForce RTX 3080 Ti Laptop GPU (n=1) | |
| Media de la clase Gaming (1386 - 2254, n=97, últimos 2 años) | |
| Alienware x17 R2 P48E | |
| Schenker XMG Neo 17 M22 | |
| CrossMark / Creativity | |
| Asus ROG Strix Scar 17 SE G733CX-LL014W | |
| Medio Intel Core i9-12950HX, NVIDIA GeForce RTX 3080 Ti Laptop GPU (n=1) | |
| Lenovo Legion 7 16IAX7-82TD004SGE | |
| MSI Titan GT77 12UHS | |
| Media de la clase Gaming (1343 - 2729, n=97, últimos 2 años) | |
| Alienware x17 R2 P48E | |
| Schenker XMG Neo 17 M22 | |
| CrossMark / Responsiveness | |
| Lenovo Legion 7 16IAX7-82TD004SGE | |
| MSI Titan GT77 12UHS | |
| Asus ROG Strix Scar 17 SE G733CX-LL014W | |
| Medio Intel Core i9-12950HX, NVIDIA GeForce RTX 3080 Ti Laptop GPU (n=1) | |
| Media de la clase Gaming (1226 - 2334, n=97, últimos 2 años) | |
| Alienware x17 R2 P48E | |
| Schenker XMG Neo 17 M22 | |
| PCMark 10 Score | 7208 puntos | |
ayuda | ||
| AIDA64 / Memory Copy | |
| Media de la clase Gaming (21750 - 129946, n=109, últimos 2 años) | |
| MSI Titan GT77 12UHS | |
| Lenovo Legion 7 16IAX7-82TD004SGE | |
| Asus ROG Strix Scar 17 SE G733CX-LL014W | |
| Medio Intel Core i9-12950HX (59731 - 64732, n=7) | |
| Alienware x17 R2 P48E | |
| Schenker XMG Neo 17 M22 | |
| Asus Strix Scar 17 G733QSA-XS99 | |
| AIDA64 / Memory Read | |
| Media de la clase Gaming (22956 - 118858, n=109, últimos 2 años) | |
| Lenovo Legion 7 16IAX7-82TD004SGE | |
| Asus ROG Strix Scar 17 SE G733CX-LL014W | |
| Medio Intel Core i9-12950HX (59744 - 70359, n=7) | |
| MSI Titan GT77 12UHS | |
| Alienware x17 R2 P48E | |
| Schenker XMG Neo 17 M22 | |
| Asus Strix Scar 17 G733QSA-XS99 | |
| AIDA64 / Memory Write | |
| Media de la clase Gaming (22297 - 135096, n=109, últimos 2 años) | |
| Asus ROG Strix Scar 17 SE G733CX-LL014W | |
| Lenovo Legion 7 16IAX7-82TD004SGE | |
| Medio Intel Core i9-12950HX (57750 - 67899, n=7) | |
| MSI Titan GT77 12UHS | |
| Schenker XMG Neo 17 M22 | |
| Alienware x17 R2 P48E | |
| Asus Strix Scar 17 G733QSA-XS99 | |
| AIDA64 / Memory Latency | |
| Media de la clase Gaming (75.3 - 259, n=109, últimos 2 años) | |
| Alienware x17 R2 P48E | |
| Schenker XMG Neo 17 M22 | |
| MSI Titan GT77 12UHS | |
| Medio Intel Core i9-12950HX (84.5 - 92.2, n=7) | |
| Lenovo Legion 7 16IAX7-82TD004SGE | |
| Asus ROG Strix Scar 17 SE G733CX-LL014W | |
| Asus Strix Scar 17 G733QSA-XS99 | |
* ... más pequeño es mejor
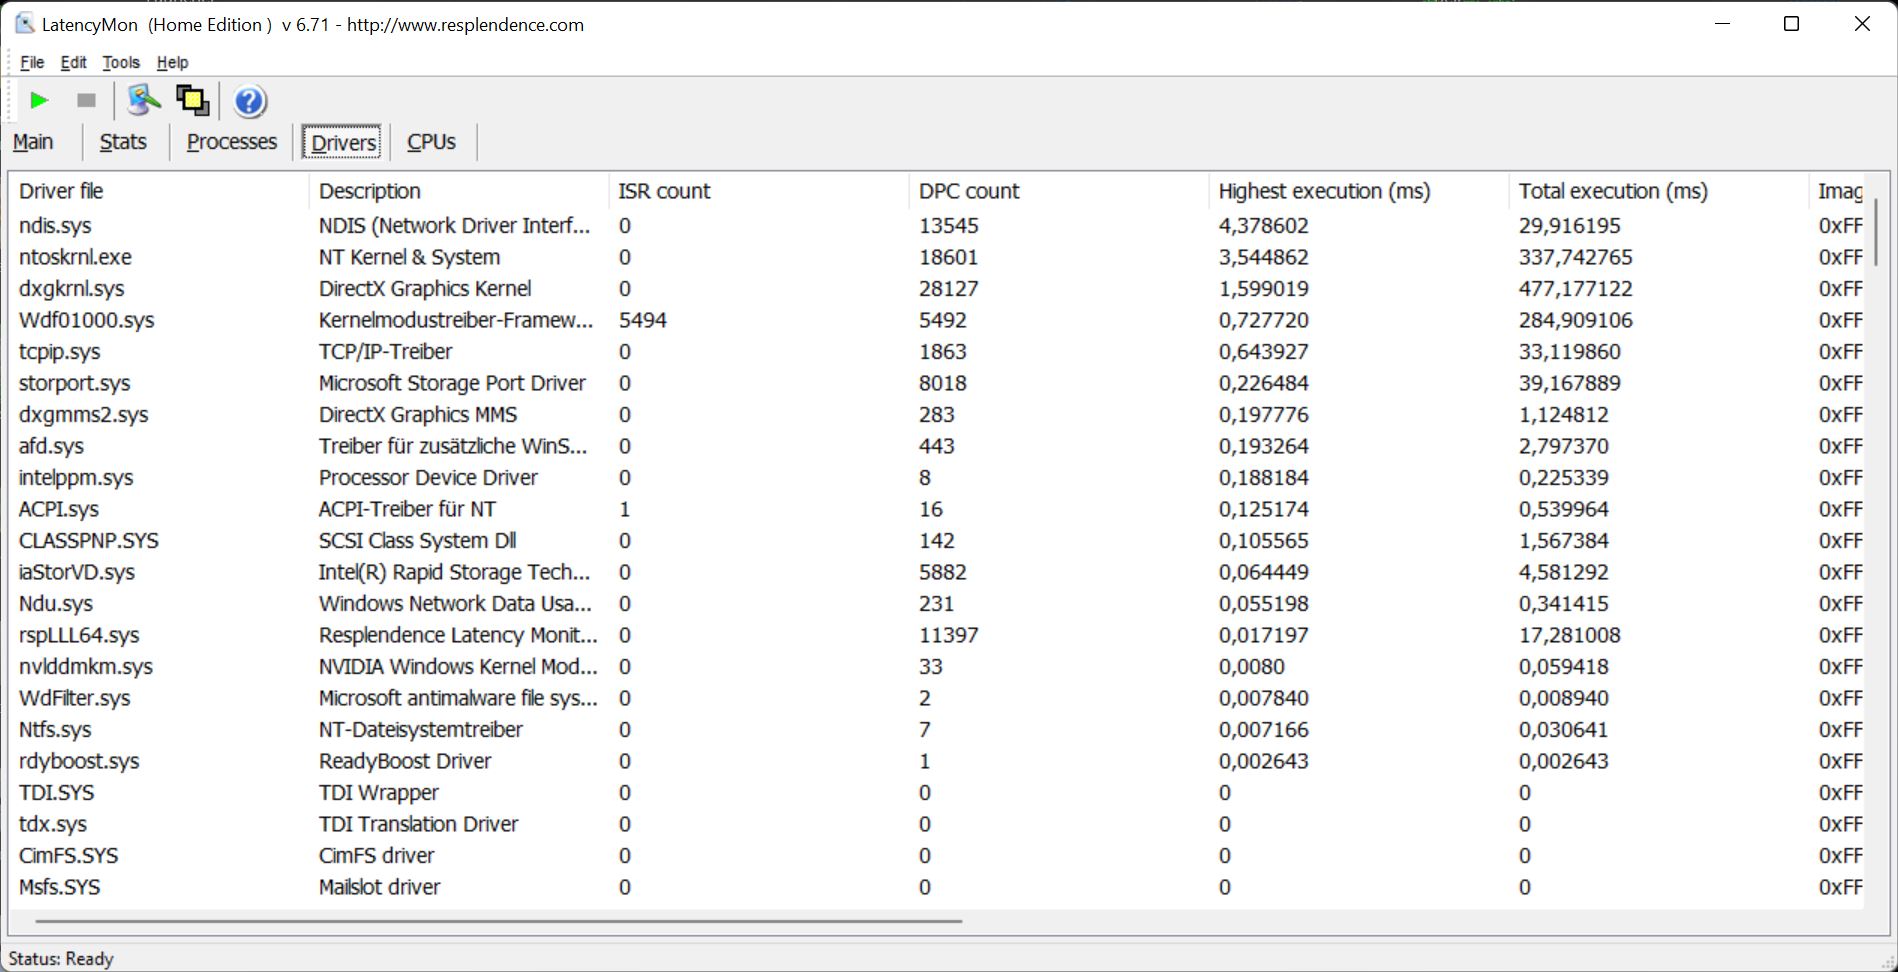
Latencias del CPD
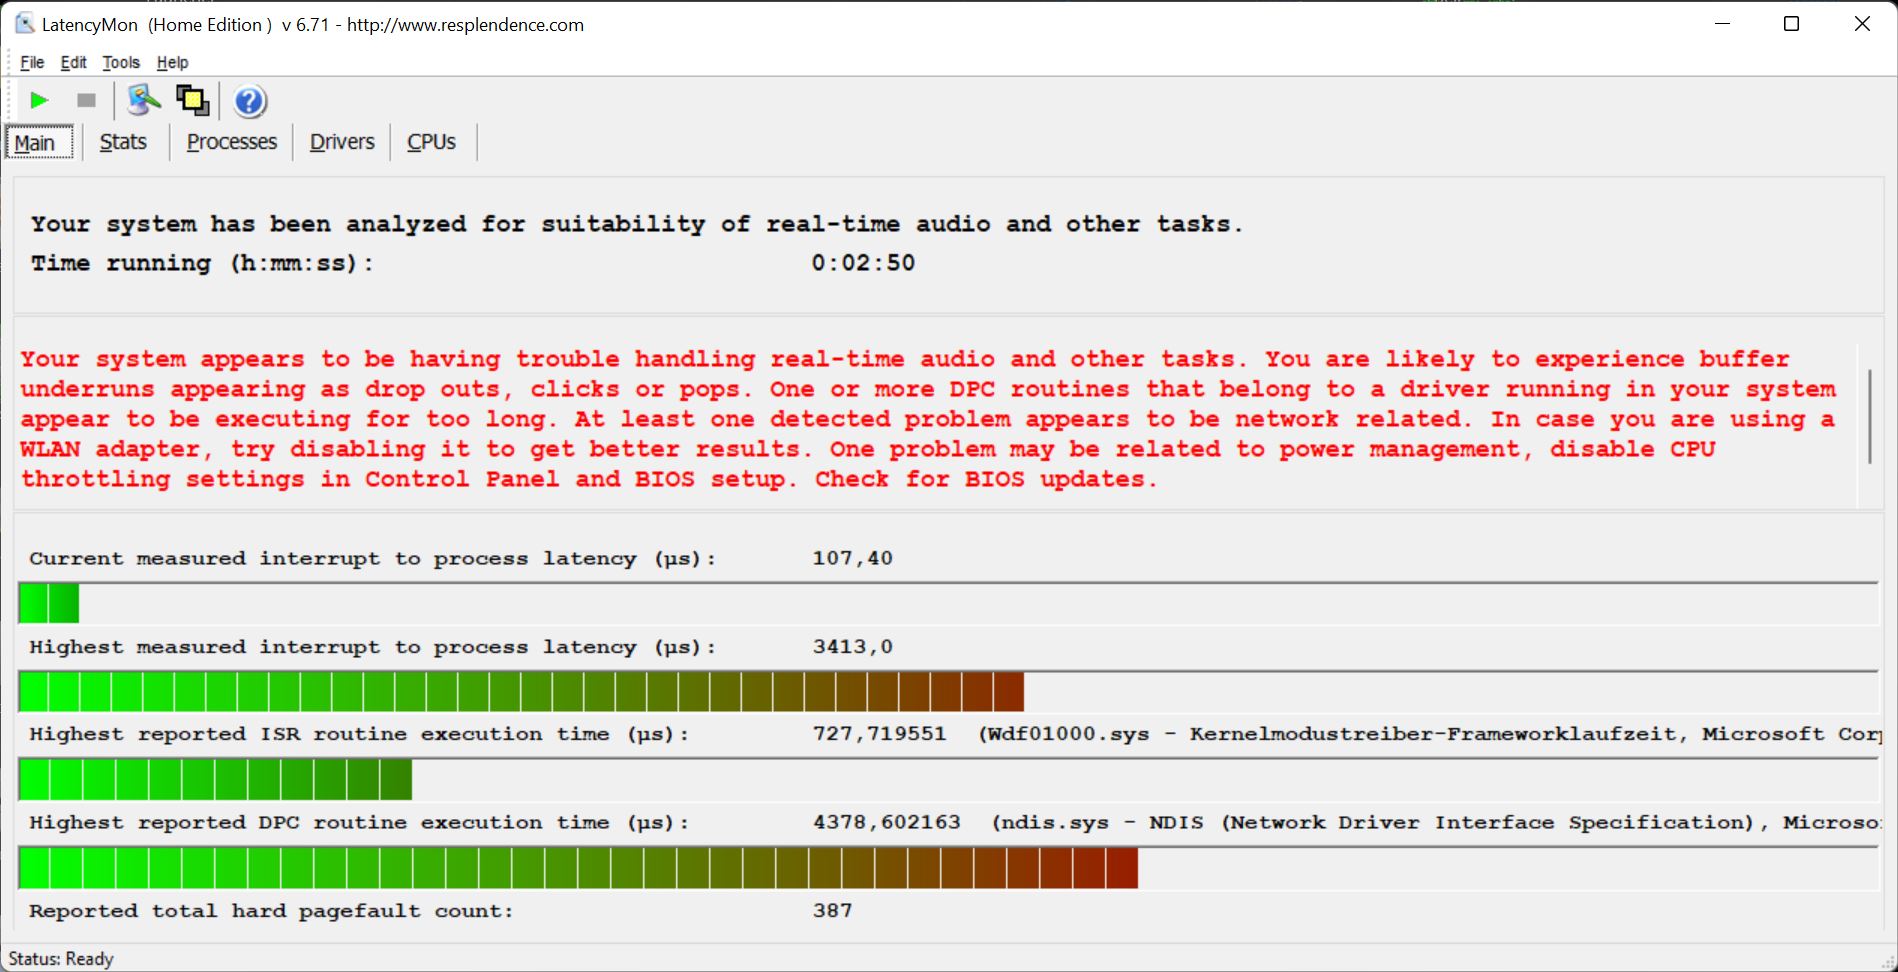
En nuestra prueba de latencia estandarizada (navegación por Internet, vídeo 4K de YouTube, carga de la CPU), nuestra unidad de prueba con su versión de BIOS tiene algunos problemas, por lo que no es adecuada para el procesamiento de vídeo y audio en tiempo real.
| DPC Latencies / LatencyMon - interrupt to process latency (max), Web, Youtube, Prime95 | |
| Schenker XMG Neo 17 M22 | |
| Asus ROG Strix Scar 17 SE G733CX-LL014W | |
| MSI Titan GT77 12UHS | |
| MSI Titan GT77 12UHS | |
| Lenovo Legion 7 16IAX7-82TD004SGE | |
| Alienware x17 R2 P48E | |
| Asus Strix Scar 17 G733QSA-XS99 | |
* ... más pequeño es mejor
Solución de almacenamiento
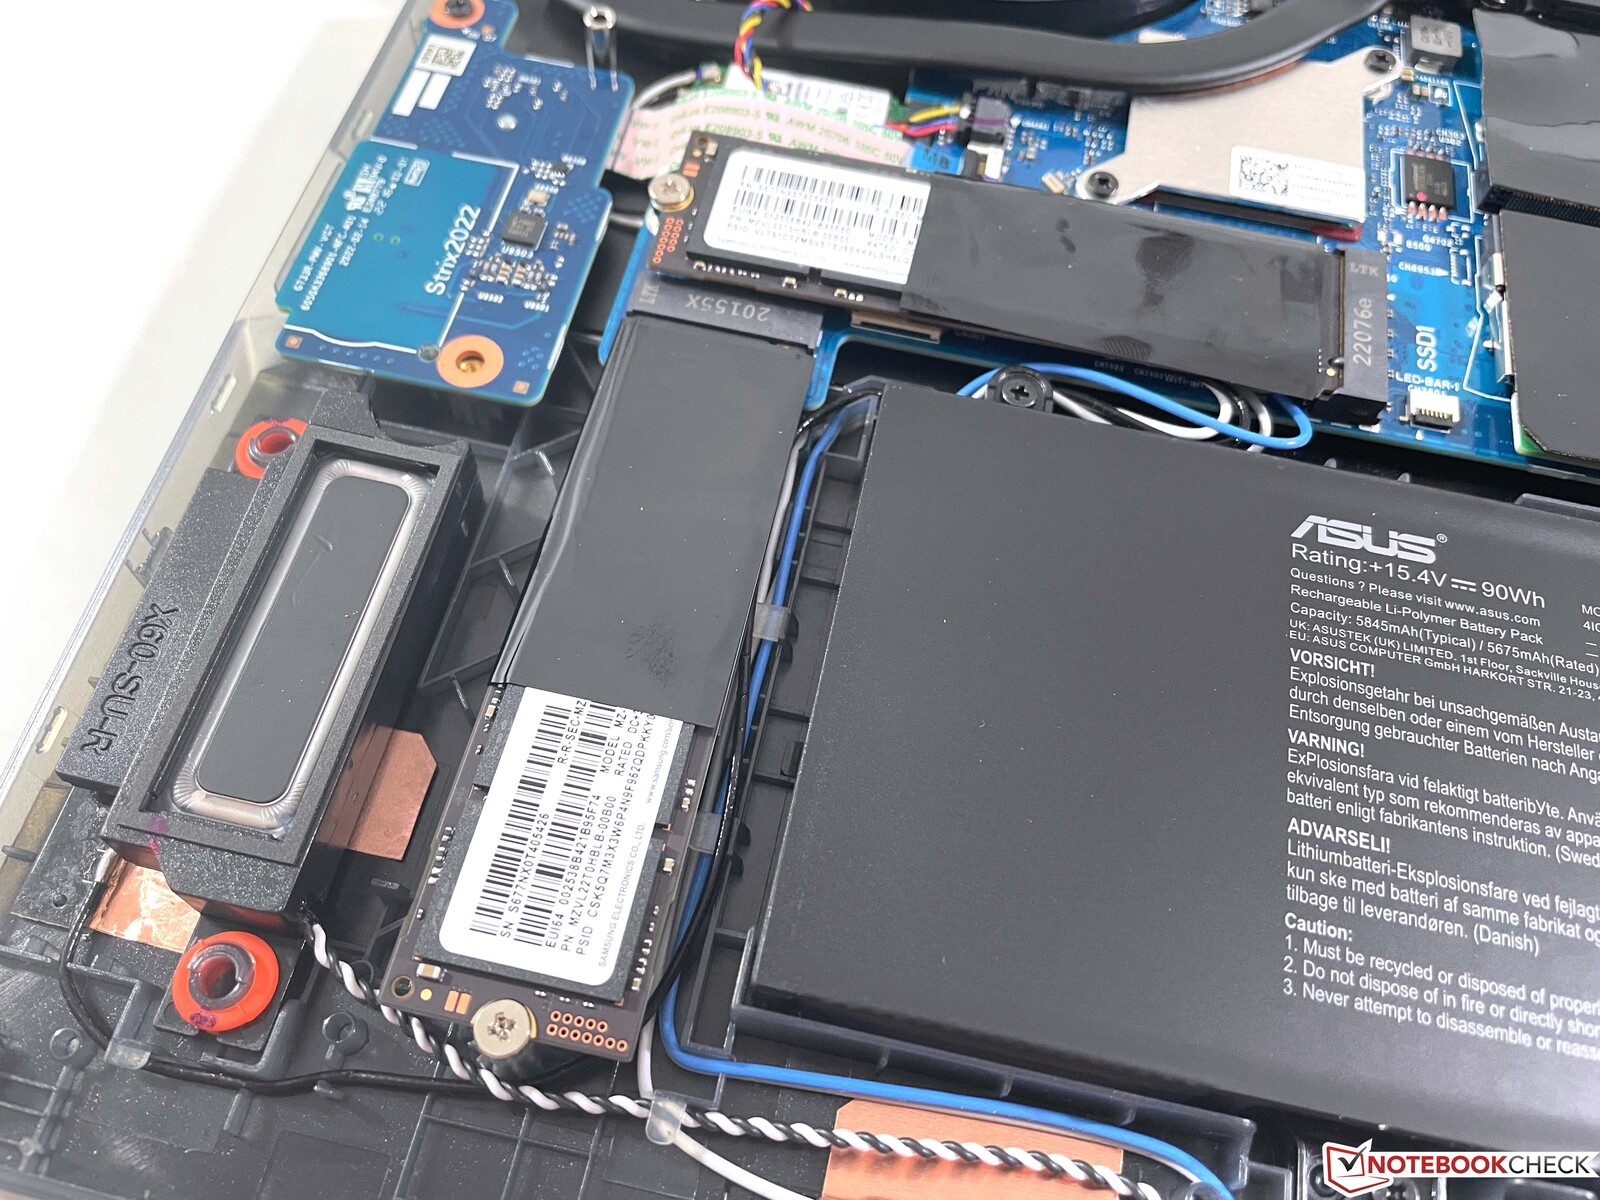
Asus utiliza dos rápidos SSDs de 2 TB de Samsung (PM91A) en una configuración RAID 0. Esto permite tasas de transferencia extremadamente altas de más de 10 GB/s. Sin embargo, el rendimiento no permanece estable bajo carga constante, sino que cae masivamente. Pero eso no debería causar ninguna limitación durante el juego diario. Puedes encontrar otros benchmarks de SSDs aquí.

* ... más pequeño es mejor
Disk Throttling: DiskSpd Read Loop, Queue Depth 8
Tarjeta gráfica
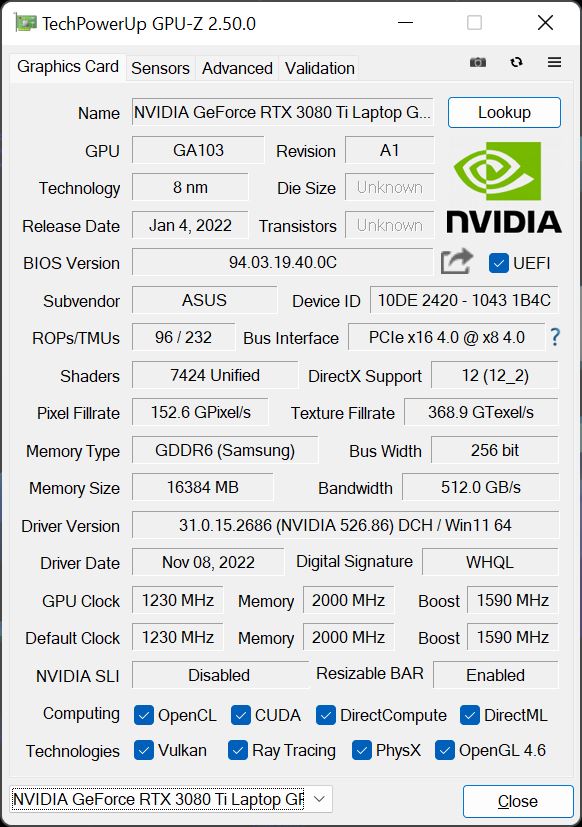
Asus utiliza laGeForce RTX 3080 Ti con un TGP de 150 vatios, y la GPU también puede usar 25 vatios adicionales de Dynamic Boost del procesador. También alcanza este valor (175 vatios) en el modo Performance, por lo que no es necesario usar el modo Turbo. También hay un MUX que permite desactivar completamente la GPU integrada (requiere un reinicio), lo que mejora las latencias mientras se juega pero no tiene mucho efecto en el rendimiento gráfico en sí
El rendimiento gráfico entra en el grupo de los mejores y también es superior a los valores medios de la RTX 3080 Ti en nuestra base de datos. Además, el rendimiento gráfico se mantiene completamente estable. El test de estrés 3DMark Time Spy se supera sin problemas, y tampoco hay caída de rendimiento en nuestro test de carga constante The Witcher 3. El rendimiento de juego es fácilmente suficiente para los detalles máximos en la resolución nativa QHD, incluso en juegos exigentes.
En funcionamiento de batería, la GPU puede consumir un máximo de 44 vatios, lo que corresponde a una caída de rendimiento de alrededor del 70%. Puedes encontrar más pruebas de rendimiento de la GPU en aquí.
| 3DMark 11 Performance | 35997 puntos | |
| 3DMark Fire Strike Score | 28793 puntos | |
| 3DMark Time Spy Score | 12904 puntos | |
ayuda | ||
| Blender / v3.3 Classroom OPTIX/RTX | |
| Medio NVIDIA GeForce RTX 3080 Ti Laptop GPU (20 - 28, n=13) | |
| Lenovo Legion 7 16IAX7-82TD004SGE | |
| Asus ROG Strix Scar 17 SE G733CX-LL014W | |
| MSI Titan GT77 12UHS | |
| Media de la clase Gaming (9 - 32, n=111, últimos 2 años) | |
| Blender / v3.3 Classroom CUDA | |
| Lenovo Legion 7 16IAX7-82TD004SGE | |
| Medio NVIDIA GeForce RTX 3080 Ti Laptop GPU (32 - 41, n=13) | |
| Asus ROG Strix Scar 17 SE G733CX-LL014W | |
| Media de la clase Gaming (15 - 228, n=111, últimos 2 años) | |
| MSI Titan GT77 12UHS | |
| Blender / v3.3 Classroom CPU | |
| Asus ROG Strix Scar 17 SE G733CX-LL014W | |
| Medio NVIDIA GeForce RTX 3080 Ti Laptop GPU (261 - 429, n=13) | |
| Lenovo Legion 7 16IAX7-82TD004SGE | |
| MSI Titan GT77 12UHS | |
| Media de la clase Gaming (122 - 565, n=107, últimos 2 años) | |
* ... más pequeño es mejor
| The Witcher 3 - 1920x1080 Ultra Graphics & Postprocessing (HBAO+) | |
| Media de la clase Gaming (95 - 240, n=8, últimos 2 años) | |
| MSI Titan GT77 12UHS | |
| Alienware x17 R2 P48E | |
| Schenker XMG Neo 17 M22 | |
| Asus ROG Strix Scar 17 SE G733CX-LL014W | |
| Lenovo Legion 7 16IAX7-82TD004SGE | |
| Medio NVIDIA GeForce RTX 3080 Ti Laptop GPU (30 - 130.6, n=43) | |
| Asus Strix Scar 17 G733QSA-XS99 | |
| F1 22 | |
| 1920x1080 Ultra High Preset AA:T AF:16x | |
| Schenker XMG Neo 17 M22 | |
| Medio NVIDIA GeForce RTX 3080 Ti Laptop GPU (78.9 - 91, n=4) | |
| MSI Titan GT77 12UHS | |
| Asus ROG Strix Scar 17 SE G733CX-LL014W | |
| Media de la clase Gaming (40.1 - 121.2, n=5, últimos 2 años) | |
| 2560x1440 Ultra High Preset AA:T AF:16x | |
| Schenker XMG Neo 17 M22 | |
| Medio NVIDIA GeForce RTX 3080 Ti Laptop GPU (52.9 - 62, n=2) | |
| Media de la clase Gaming (42 - 77.8, n=3, últimos 2 años) | |
| Asus ROG Strix Scar 17 SE G733CX-LL014W | |
The Witcher 3 FPS Chart
| bajo | medio | alto | ultra | QHD | |
|---|---|---|---|---|---|
| GTA V (2015) | 186.8 | 180.7 | 126.7 | 114.1 | |
| The Witcher 3 (2015) | 118.8 | ||||
| Dota 2 Reborn (2015) | 211 | 191 | 180.8 | 169.8 | |
| Final Fantasy XV Benchmark (2018) | 173.3 | 156.2 | 118.5 | 92.8 | |
| X-Plane 11.11 (2018) | 165.3 | 143.5 | 116.2 | ||
| Strange Brigade (2018) | 236 | 211 | 157.7 | ||
| F1 2021 (2021) | 236 | 211 | 132.8 | 106.2 | |
| Cyberpunk 2077 1.6 (2022) | 103 | 101 | 98 | 87 | 56 |
| F1 22 (2022) | 235 | 235 | 199.7 | 78.9 | 52.9 |
| Call of Duty Modern Warfare 2 2022 (2022) | 135 | 109 | 107 | 78 |
Emisiones y gestión de la energía
Niveles de ruido
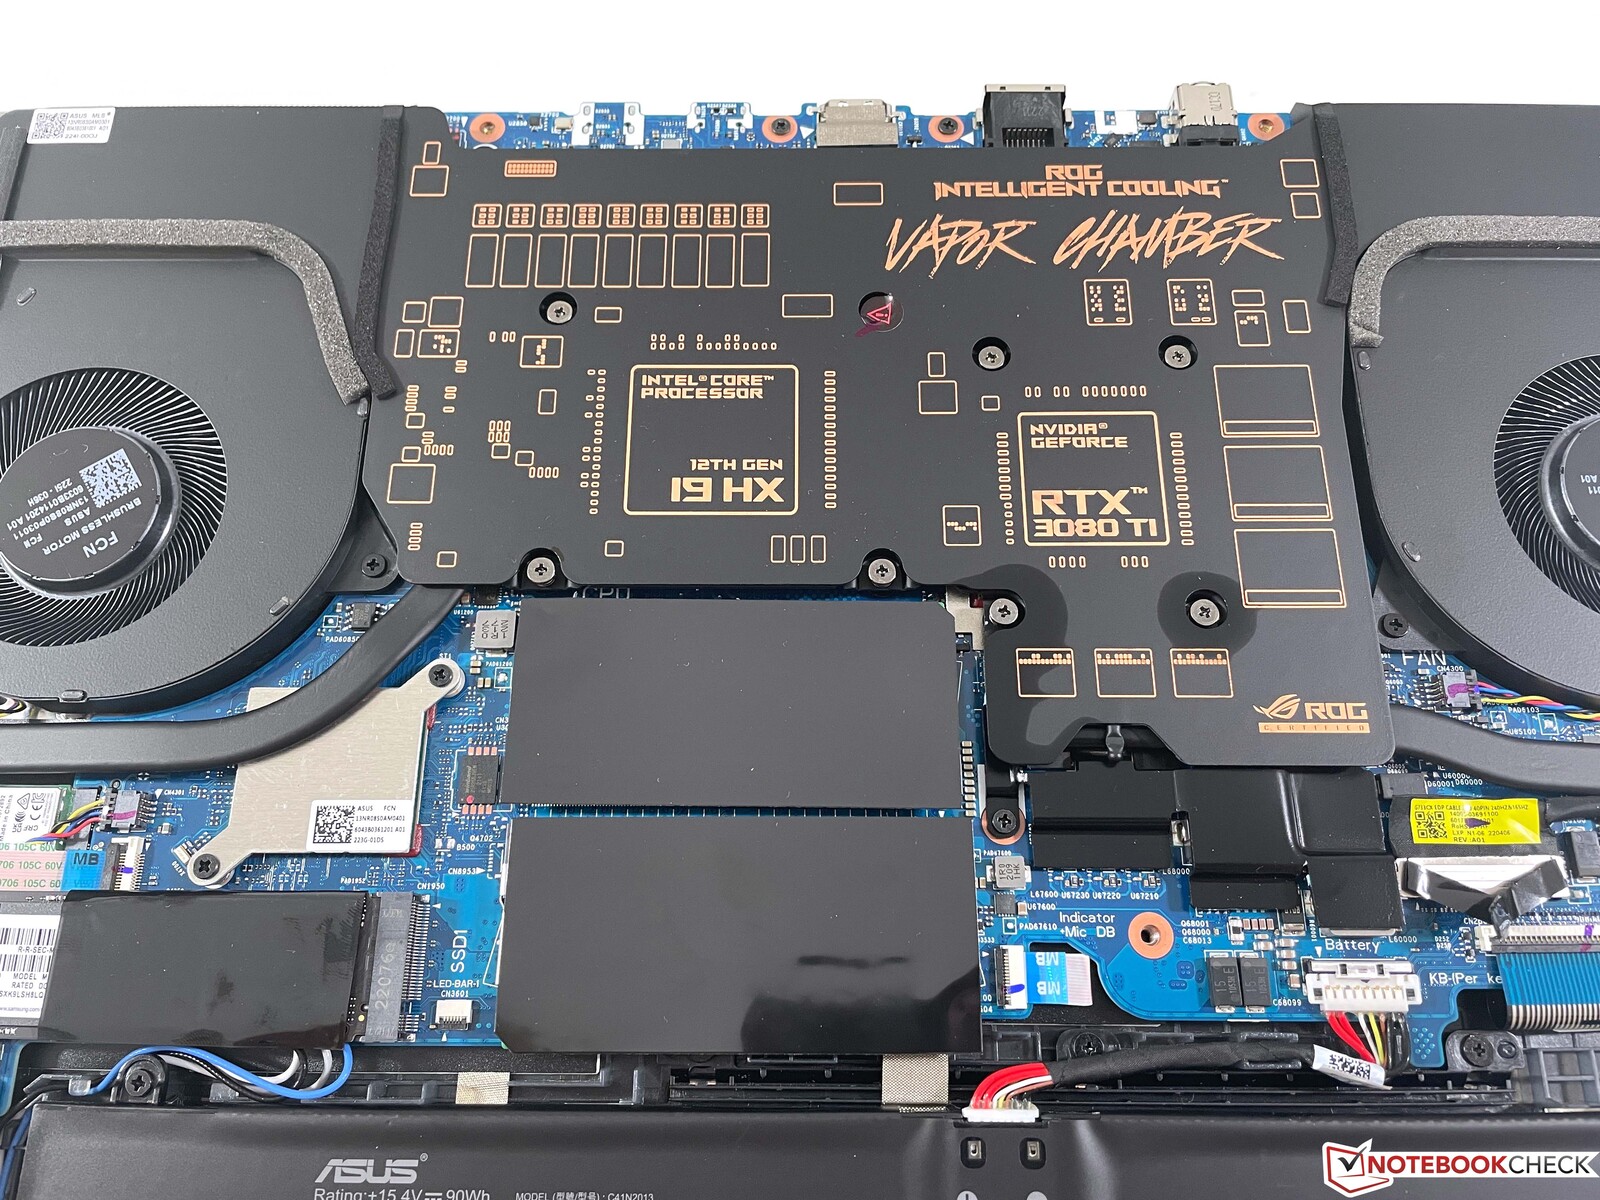
Asus utiliza aquí un sistema de refrigeración por cámara de vapor. En el modo de energía de Rendimiento, el dispositivo también permanece relativamente silencioso, y somos capaces de medir un máximo de 46 dB(A) durante la prueba de estrés así como mientras se juega. Esto, por supuesto, sigue siendo perceptible, pero nuestra unidad de prueba sigue siendo significativamente más silenciosa con esto que los competidores. En el modo Turbo, el rendimiento de juego es sólo insignificantemente mayor, pero los dos ventiladores en funcionamiento producen unos ruidosos 54 dB(A). Durante el funcionamiento en vacío, los ventiladores suelen permanecer apagados, pero casi siempre notamos algunos ruidos electrónicos silenciosos. Bajo carga, también hay algún quejido audible de la bobina procedente de la GPU, suponemos.
Ruido
| Ocioso |
| 23.9 / 23.9 / 23.9 dB(A) |
| Carga |
| 34.3 / 45.9 dB(A) |
 | ||
30 dB silencioso 40 dB(A) audible 50 dB(A) ruidosamente alto |
||
min: | ||
| Asus ROG Strix Scar 17 SE G733CX-LL014W GeForce RTX 3080 Ti Laptop GPU, i9-12950HX, Samsung PM9A1 MZVL22T0HBLB | Lenovo Legion 7 16IAX7-82TD004SGE GeForce RTX 3080 Ti Laptop GPU, i9-12900HX, Micron 3400 1TB MTFDKBA1T0TFH | MSI Titan GT77 12UHS GeForce RTX 3080 Ti Laptop GPU, i9-12900HX, Samsung PM9A1 MZVL21T0HCLR | Schenker XMG Neo 17 M22 GeForce RTX 3080 Ti Laptop GPU, R9 6900HX, Samsung SSD 980 Pro 1TB MZ-V8P1T0BW | Alienware x17 R2 P48E GeForce RTX 3080 Ti Laptop GPU, i9-12900HK, 2x Samsung PM9A1 1TB (RAID 0) | Asus Strix Scar 17 G733QSA-XS99 GeForce RTX 3080 Laptop GPU, R9 5900HX, 2x Samsung PM981a MZVLB1T0HBLR (RAID 0) | |
|---|---|---|---|---|---|---|
| Noise | -19% | -9% | -27% | 1% | -4% | |
| apagado / medio ambiente * (dB) | 23.9 | 24.5 -3% | 21.9 8% | 26 -9% | 22.7 5% | 25 -5% |
| Idle Minimum * (dB) | 23.9 | 24.5 -3% | 24.53 -3% | 26 -9% | 23.1 3% | 25.2 -5% |
| Idle Average * (dB) | 23.9 | 30 -26% | 24.53 -3% | 29 -21% | 23.1 3% | 25.2 -5% |
| Idle Maximum * (dB) | 23.9 | 32.5 -36% | 24.53 -3% | 40 -67% | 23.1 3% | 25.2 -5% |
| Load Average * (dB) | 34.3 | 43.9 -28% | 46.25 -35% | 47 -37% | 31.9 7% | 30.7 10% |
| Load Maximum * (dB) | 45.9 | 54.2 -18% | 54.25 -18% | 54 -18% | 52.5 -14% | 51.3 -12% |
| Witcher 3 ultra * (dB) | 48.8 | 56.86 | 52 | 52.5 | 51.3 |
* ... más pequeño es mejor
Temperatura
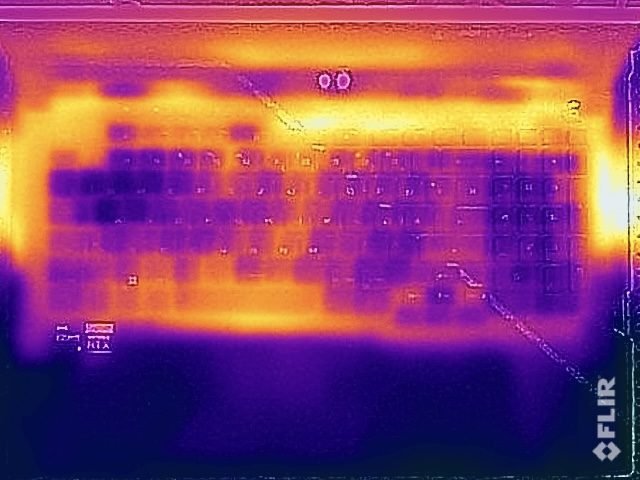
A pesar de los ventiladores relativamente silenciosos, las temperaturas superficiales no dan motivos de preocupación. Aunque medimos más de 50 °C en algunos puntos aislados bajo carga, el teclado permanece muy fresco y no hay limitaciones en absoluto durante el juego
Durante el test de estrés, la GPU recibe un trato preferente, funcionando de forma estable a 150 vatios en cuanto el procesador se nivela a unos 36 vatios. No hay reducción de rendimiento justo después del test de estrés.
(-) La temperatura máxima en la parte superior es de 48.8 °C / 120 F, frente a la media de 40.4 °C / 105 F, que oscila entre 21.2 y 68.8 °C para la clase Gaming.
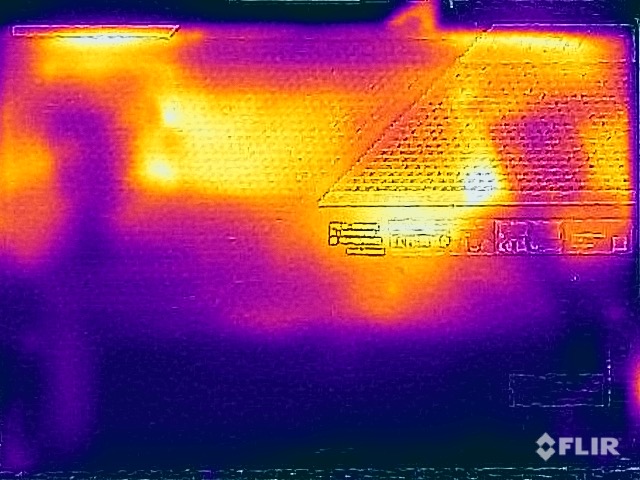
(-) El fondo se calienta hasta un máximo de 52.4 °C / 126 F, frente a la media de 43.2 °C / 110 F
(+) En reposo, la temperatura media de la parte superior es de 28.6 °C / 83# F, frente a la media del dispositivo de 33.9 °C / 93 F.
(±) Jugando a The Witcher 3, la temperatura media de la parte superior es de 35.1 °C / 95 F, frente a la media del dispositivo de 33.9 °C / 93 F.
(+) El reposamanos y el panel táctil están a una temperatura inferior a la de la piel, con un máximo de 26 °C / 78.8 F y, por tanto, son fríos al tacto.
(+) La temperatura media de la zona del reposamanos de dispositivos similares fue de 28.8 °C / 83.8 F (+2.8 °C / 5 F).
| Asus ROG Strix Scar 17 SE G733CX-LL014W Intel Core i9-12950HX, NVIDIA GeForce RTX 3080 Ti Laptop GPU | Lenovo Legion 7 16IAX7-82TD004SGE Intel Core i9-12900HX, NVIDIA GeForce RTX 3080 Ti Laptop GPU | MSI Titan GT77 12UHS Intel Core i9-12900HX, NVIDIA GeForce RTX 3080 Ti Laptop GPU | Schenker XMG Neo 17 M22 AMD Ryzen 9 6900HX, NVIDIA GeForce RTX 3080 Ti Laptop GPU | Alienware x17 R2 P48E Intel Core i9-12900HK, NVIDIA GeForce RTX 3080 Ti Laptop GPU | Asus Strix Scar 17 G733QSA-XS99 AMD Ryzen 9 5900HX, NVIDIA GeForce RTX 3080 Laptop GPU | |
|---|---|---|---|---|---|---|
| Heat | -8% | -3% | 1% | 7% | 4% | |
| Maximum Upper Side * (°C) | 48.8 | 44.4 9% | 40.8 16% | 49 -0% | 49.6 -2% | 40 18% |
| Maximum Bottom * (°C) | 52.4 | 60.8 -16% | 52.4 -0% | 52 1% | 42.4 19% | 39.8 24% |
| Idle Upper Side * (°C) | 30.4 | 33.8 -11% | 34.6 -14% | 30 1% | 29.2 4% | 34.6 -14% |
| Idle Bottom * (°C) | 34.1 | 38.8 -14% | 38.4 -13% | 33 3% | 32 6% | 38.4 -13% |
* ... más pequeño es mejor
Altavoces
El sistema de sonido consta de un total de cuatro módulos que producen un sonido potente y espacioso. Aunque los altavoces no son los más potentes del mercado, la calidad es muy buena en general. Sin embargo, debido al fuerte ruido del ventilador mientras se juega, seguimos recomendando unos auriculares.
Asus ROG Strix Scar 17 SE G733CX-LL014W análisis de audio
(±) | la sonoridad del altavoz es media pero buena (73.3 dB)
Graves 100 - 315 Hz
(±) | lubina reducida - en promedio 6.2% inferior a la mediana
(±) | la linealidad de los graves es media (7.5% delta a frecuencia anterior)
Medios 400 - 2000 Hz
(+) | medios equilibrados - a sólo 2% de la mediana
(+) | los medios son lineales (3.9% delta a la frecuencia anterior)
Altos 2 - 16 kHz
(+) | máximos equilibrados - a sólo 3.5% de la mediana
(±) | la linealidad de los máximos es media (9.3% delta a frecuencia anterior)
Total 100 - 16.000 Hz
(+) | el sonido global es lineal (13.6% de diferencia con la mediana)
En comparación con la misma clase
» 20% de todos los dispositivos probados de esta clase eran mejores, 7% similares, 73% peores
» El mejor tuvo un delta de 6%, la media fue 18%, el peor fue ###max##%
En comparación con todos los dispositivos probados
» 15% de todos los dispositivos probados eran mejores, 4% similares, 82% peores
» El mejor tuvo un delta de 4%, la media fue 24%, el peor fue ###max##%
MSI Titan GT77 12UHS análisis de audio
(+) | los altavoces pueden reproducir a un volumen relativamente alto (#83.4 dB)
Graves 100 - 315 Hz
(-) | casi sin bajos - de media 71.8% inferior a la mediana
(+) | el bajo es lineal (0% delta a la frecuencia anterior)
Medios 400 - 2000 Hz
(-) | casi sin medianas - de media 71.8% inferior a la mediana
(+) | los medios son lineales (0% delta a la frecuencia anterior)
Altos 2 - 16 kHz
(-) | casi sin máximos - de media 71.8% inferior a la mediana
(+) | los máximos son lineales (0% delta a la frecuencia anterior)
Total 100 - 16.000 Hz
(-) | el sonido global no es lineal (107.7% de diferencia con la mediana)
En comparación con la misma clase
» 100% de todos los dispositivos probados de esta clase eran mejores, 0% similares, 0% peores
» El mejor tuvo un delta de 6%, la media fue 18%, el peor fue ###max##%
En comparación con todos los dispositivos probados
» 96% de todos los dispositivos probados eran mejores, 0% similares, 4% peores
» El mejor tuvo un delta de 4%, la media fue 24%, el peor fue ###max##%
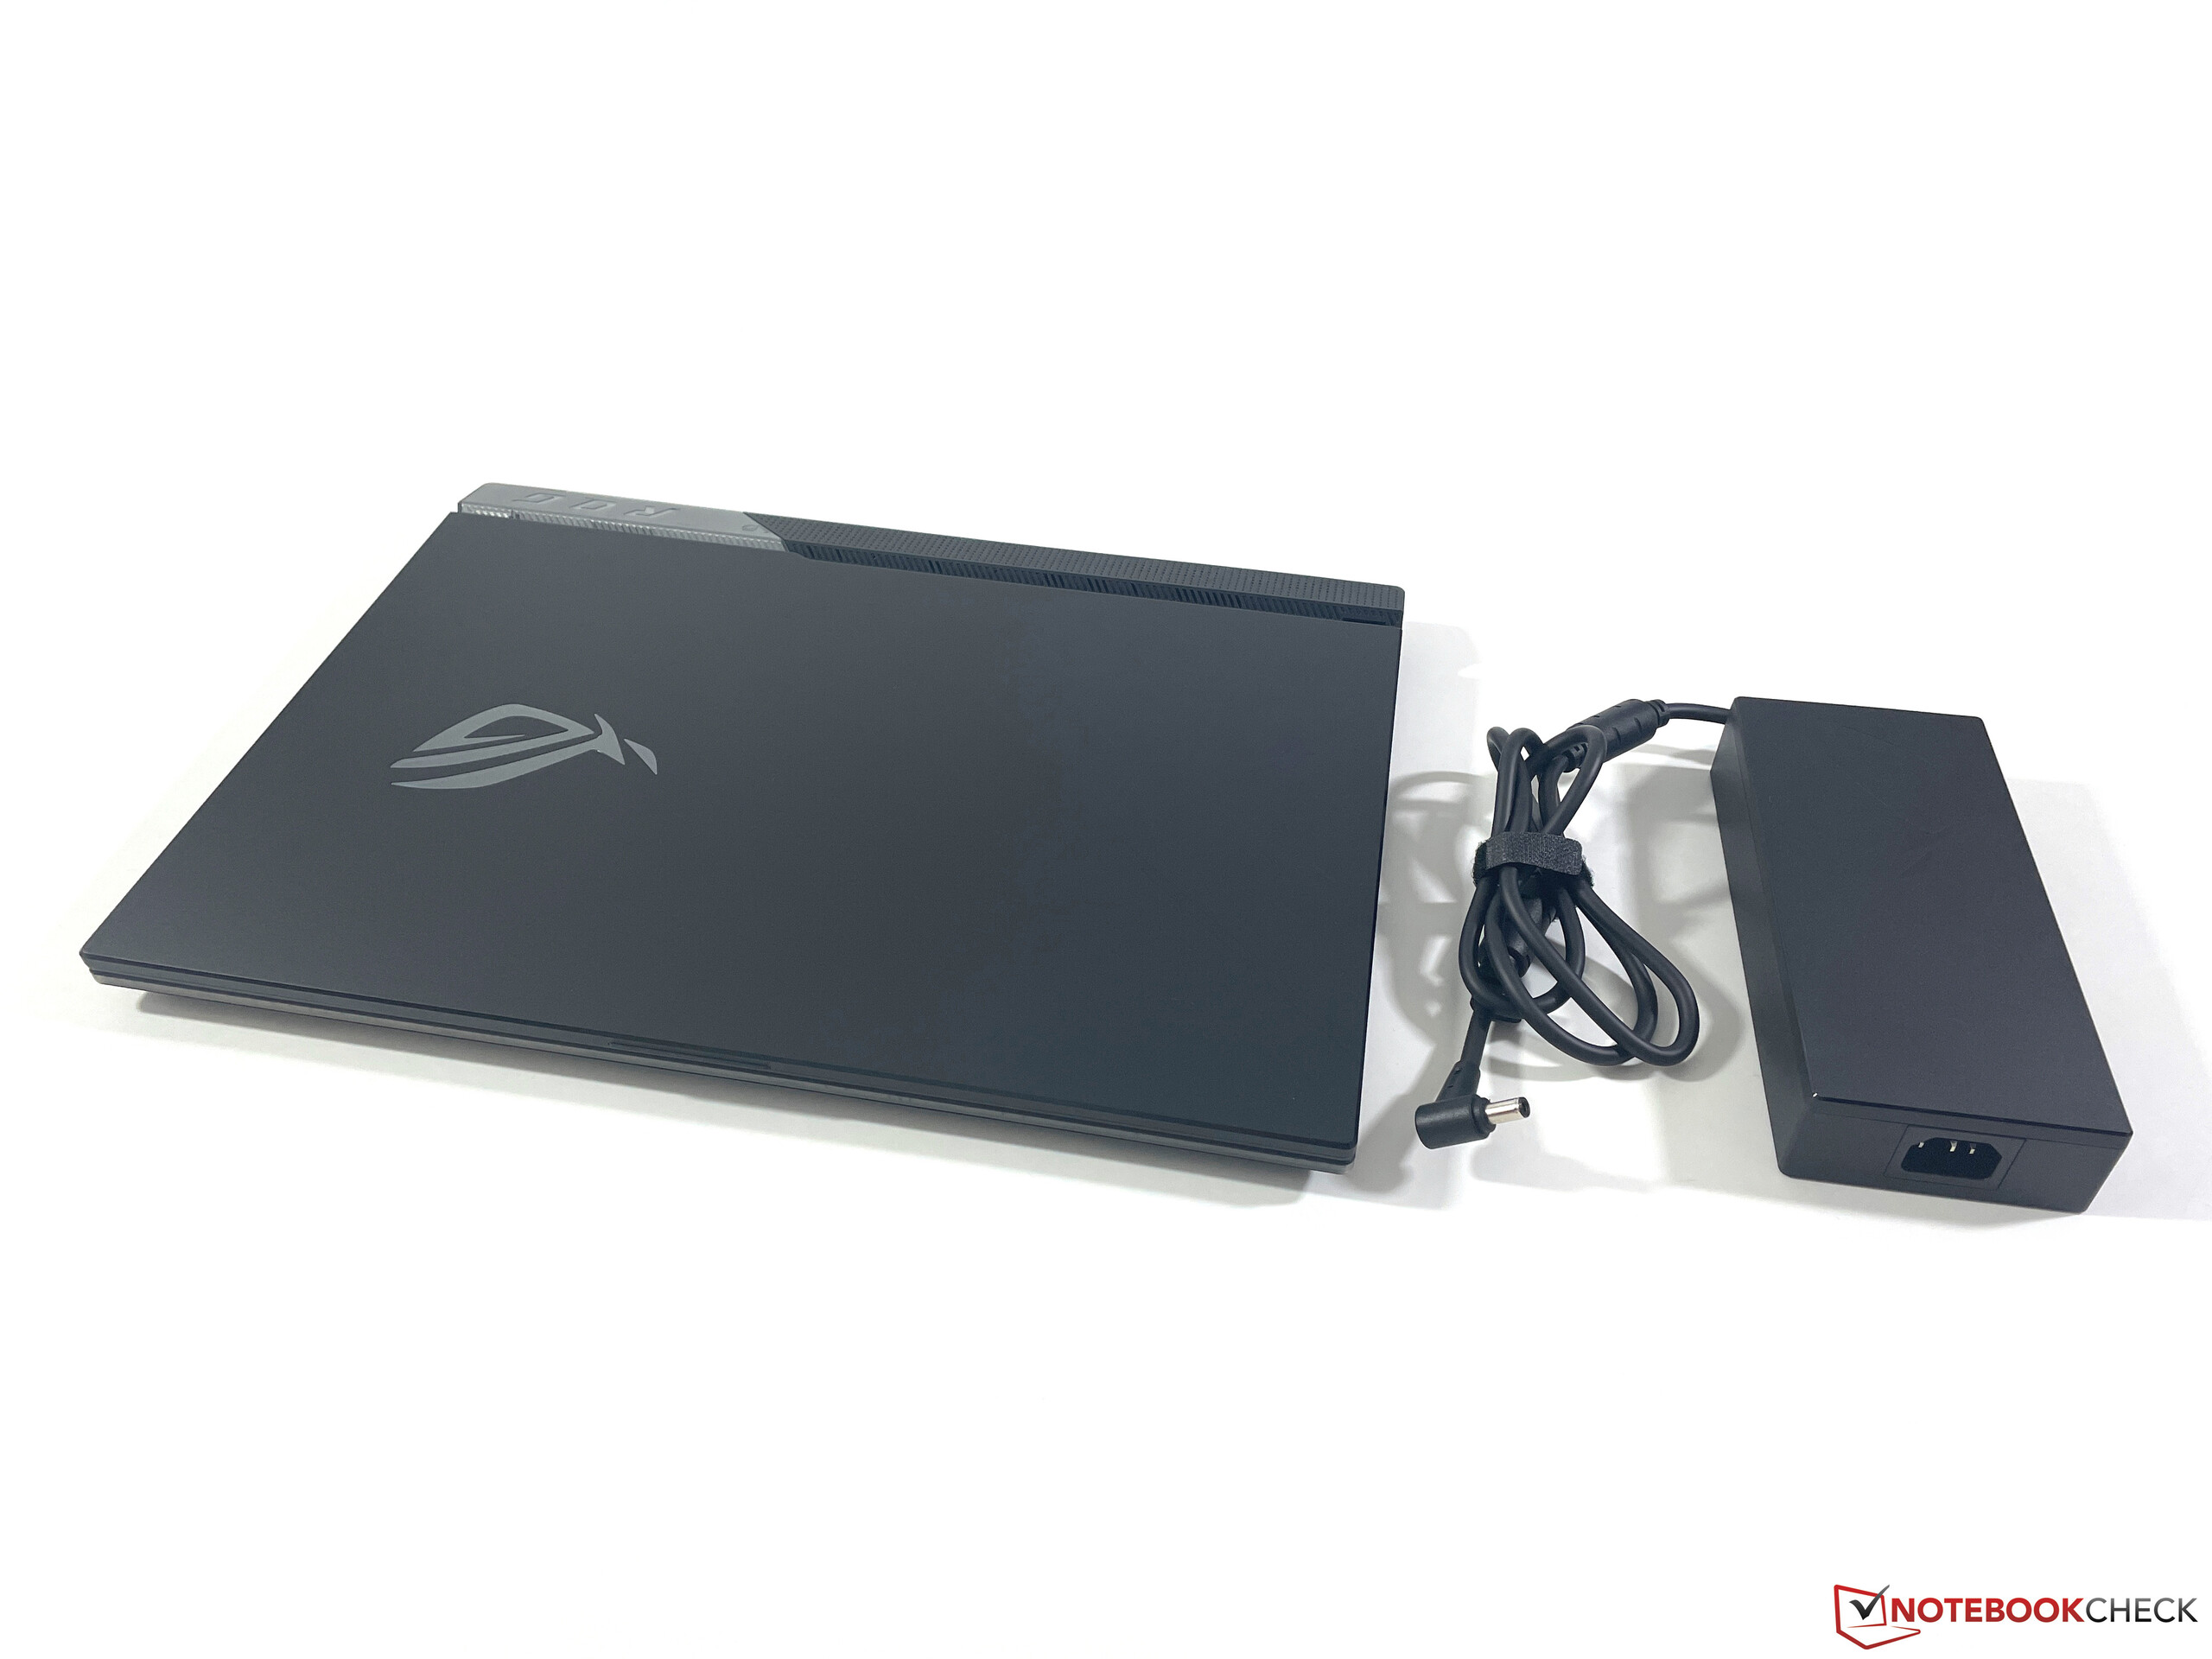
Consumo de energía
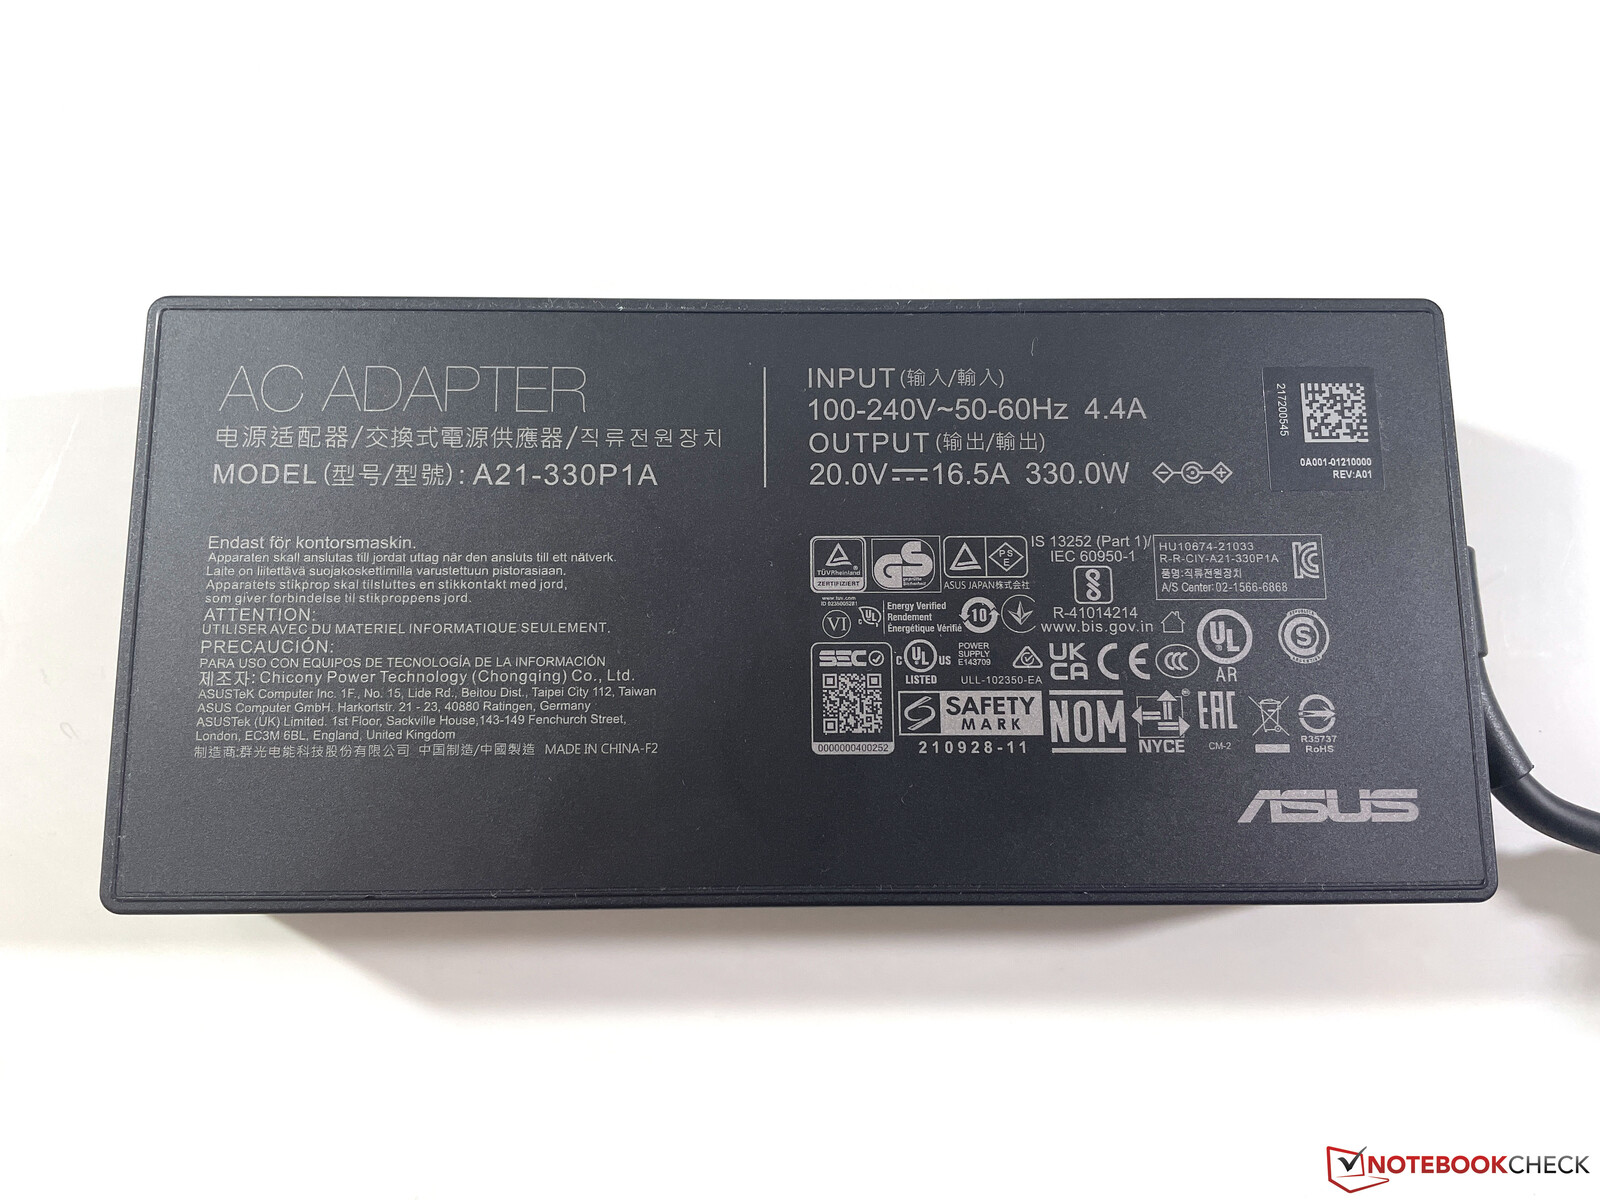
El ROG Strix Scar 17 SE no es un portátil muy eficiente, lo que no es muy sorprendente teniendo en cuenta el potente hardware. Ya medimos hasta 27 vatios durante el funcionamiento en reposo, y mientras se juega el valor aumenta a unos 230 vatios. La fuente de alimentación de 330 vatios es, por tanto, suficientemente grande. El consumo en espera también es bastante alto con 2,6 vatios, pero esto se debe a los efectos de iluminación que se activan por defecto.
| Off / Standby | |
| Ocioso | |
| Carga |
|
Clave:
min: | |
Power Consumption The Witcher 3 / Stress Test
Power Consumption With External Monitor
Duración de la batería
En nuestra prueba de duración de la WLAN a 150 cd/m², que corresponde al 48% del brillo máximo, nuestra unidad de prueba sólo dura unas 4 horas. Teniendo en cuenta los altos valores de consumo, esto no es muy sorprendente. Algunos de los competidores duran bastante más en este caso, si es que hay que salvar los tiempos lejos de la toma de corriente. Es posible jugar durante aproximadamente una hora, pero sólo con una importante reducción del rendimiento. La batería de 90 Wh tarda unos 100 minutos en recargarse por completo, con un 80% de la capacidad ya disponible tras unos 53 minutos.
Pro
Contra
Veredicto - Un rápido portátil para juegos totalmente equipado
El actual Asus ROG Strix Scar 17 SE ofrece realmente todo lo que el corazón de un jugador desea. Un rápido panel QHD con 240 Hz junto con la GeForce RTX 3080 Ti, que también ofrece suficiente potencia para la resolución nativa con los máximos detalles. Aunque el rendimiento de la CPU también es bueno para un portátil de juegos, el potencial del procesador HX no se puede aprovechar al máximo. Por tanto, deberías ahorrarte la prima adicional por el procesador más potente y elegir simplemente un Core i9 normal
Otras ventajas son los colores muy precisos, si tienes que trabajar en el procesamiento de vídeo directamente, por ejemplo, las moderadas temperaturas de la superficie, y los ventiladores relativamente silenciosos durante el juego. Aunque hay un modo Turbo disponible, que también se vuelve significativamente más ruidoso, esto no tiene mucho impacto en el rendimiento de juego, por lo que no merece la pena en nuestra opinión
El nuevo Asus ROG Strix Scar 17 SE ofrece mucho rendimiento y características de juego, pero deberías ahorrarte el sobreprecio del procesador Intel HX.
Los competidores en el mercado de los juegos ofrecen especificaciones de rendimiento similares, pero también pantallas más brillantes en las piezas y carcasas menos llamativas. Además, los ruidos electrónicos pueden resultar molestos a la larga.
Precio y disponibilidad
Nuestra configuración de prueba del ROG Strix Scar 17 SE está disponible en Amazon por $3899, y una configuración más pequeña con el Core i9-12900H normal también está disponible allí por $2278.
Asus ROG Strix Scar 17 SE G733CX-LL014W
- 11/18/2022 v7 (old)
Andreas Osthoff
Price comparison

