Análisis para el AMD Ryzen 9 7940HS procesador
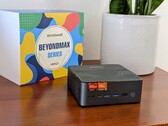
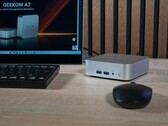
Análisis del mini PC Geekom A7 Max: Elegante todoterreno con Ryzen 9 7940HS y un rendimiento desaprovechado
Con el Geekom A7 Max, el fabricante lanza a la carrera un potente mini PC con AMD Ryzen 9 7940HS y Radeon 780M. RAM DDR5, una rápida SSD PCIe y numerosas conexiones suenan prometedoras. Pero, ¿puede el sistema compacto ofrecer este rendimiento a largo plazo - y cómo se comporta en términos de refrigeración, ruido y eficiencia en el uso diario?
AMD Ryzen 9 7940HS, Radeon 780M, 681 gReseña del mini PC M2 de BOSGAME: Corrige una de las principales quejas del M1 original
El M2 soluciona los problemas de audio de los que informamos en el M1 al tiempo que sube la opción del procesador base de Ryzen 7 a Ryzen 9. Sin embargo, creemos que el fabricante debería haber ido más allá para diferenciar mejor los dos modelos.
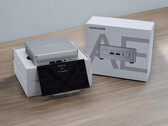
AMD Ryzen 9 7940HS, Radeon 780M, 819 gReseña del Geekom AE7: NUC mini-PC con AMD Ryzen 9 7940HS, RAM DDR5, interfaces modernas y un problema
El mini PC Geekom AE7 corresponde a los conocidos modelos NUC de Intel, que ahora comercializa Asus. Como CPU se utiliza un AMD Ryzen 9 7940HS, que promete mucho gracias a su potente iGPU. Lo más importante, sin embargo, es la potencia disponible para la CPU, que tiene un impacto significativo en el rendimiento. En este análisis, hemos sometido al Geekom AE7 a todos los puntos de referencia y al rendimiento del mini PC.
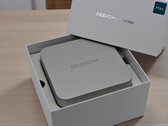
AMD Ryzen 9 7940HS, Radeon 780M, 578 gGeekom A7 con carcasa de 0,5l en revisión: Mini PC premium con AMD Ryzen 9 7940HS, 32 GB de RAM DDR5 y SSD de 2 TB
Visualmente, el Geekom A7 impresiona por su elegante diseño. Un vistazo a la ficha técnica también promete mucho porque se puede esperar mucho de un AMD Ryzen 9 7940HS. Como resultado, y también gracias al precio, el Geekom A7 se dirige al segmento premium. Analizamos si el mini PC está a la altura de esta afirmación en la prueba con numerosas mediciones y pruebas comparativas.
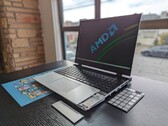
AMD Ryzen 9 7940HS, Radeon 780M, 417 gDebut del rendimiento de la Radeon RX 7700S: Análisis del Framework Laptop 16
Puede que el nombre sea genérico, pero el diseño es cualquier cosa menos eso. El respetuoso con el medio ambiente Laptop 16 toma todo lo bueno del Laptop 13.5 y lo sube de nivel con componentes aún más actualizables y personalizables, incluida una GPU Radeon RDNA 3 extraíble.
AMD Ryzen 9 7940HS, Radeon RX 7700S, 16", 2.4 kgAsus TUF Gaming A17 FA707XI-NS94: NVIDIA GeForce RTX 4070 Laptop GPU, 17.30", 2.5 kg
análise » Análisis del portátil Asus TUF Gaming A17 FA707XI: 140 W GeForce RTX 4070 por 1400 dólares
Asus ROG Flow X13 GV302XV: NVIDIA GeForce RTX 4060 Laptop GPU, 13.40", 1.3 kg
análise » Análisis del Asus ROG Flow X13 GV302XV (2023): Convertible gaming esbelto que pega fuerte con AMD Zen 4 Ryzen 9 7940HS y Nvidia RTX 4060 de 60 W
Minisforum Venus Series UM790 Pro: AMD Radeon 780M, 0.7 kg
análise » Análisis del Minisforum Venus Series UM790 Pro: Mejor que sus competidores gracias a un AMD Ryzen 9 7940HS y una Radeon 780M
Razer Blade 14 RTX 4070: NVIDIA GeForce RTX 4070 Laptop GPU, 14.00", 1.8 kg
análise » Análisis del portátil Razer Blade 14 Zen 4: Muchos cambios que importan
Asus TUF Gaming A16 FA617XS: AMD Radeon RX 7600S, 16.00", 2.2 kg
análise » Análisis del Asus TUF Gaming A16 Advantage Edition FA617XS: El portátil AMD con hasta 20 horas de autonomía
Asus ROG Zephyrus G14 GA402XY: AMD Radeon 780M, 14.00"
análise » Análisis de la iGPU AMD Radeon 780M - La nueva GPU RDNA-3 de AMD se enfrenta a sus competidores
análise » Análisis de AMD Ryzen 9 7940HS - Zen4 Phoenix es idealmente tan eficiente como Apple
análise » Asus ROG Zephyrus G14 - Portátil de juego compacto con AMD Zen4 Phoenix y RTX 4090
Acer Nitro 17 AN17-41-R3S4: NVIDIA GeForce RTX 4070 Laptop GPU, 17.30", 3.1 kg
análise externo » Acer Nitro 17 AN17-41-R3S4
Acer Nitro 16 AN16-41, R9 7940HS: NVIDIA GeForce RTX 4070 Laptop GPU, 16.00", 2.7 kg
análise externo » Acer Nitro 16 AN16-41, R9 7940HS
Asus VivoBook Pro 15 M6500XV: NVIDIA GeForce RTX 4060 Laptop GPU, 15.60", 1.8 kg
análise externo » Asus VivoBook Pro 15 M6500XV
Framework Laptop 16: AMD Radeon RX 7700S, 16.00", 2.4 kg
análise externo » Framework Laptop 16
HP Omen 16-xf0000ng: NVIDIA GeForce RTX 4070 Laptop GPU, 16.10", 2.4 kg
análise externo » HP Omen 16-xf0000ng
Asus ROG Zephyrus G14 GA402XI: NVIDIA GeForce RTX 4070 Laptop GPU, 14.00", 1.7 kg
análise externo » Asus ROG Zephyrus G14 GA402XI
Asus TUF Gaming A15 FA507XI: NVIDIA GeForce RTX 4070 Laptop GPU, 15.60", 2.2 kg
análise externo » Asus TUF Gaming A15 FA507XI
Acer Swift X SFX16-61G: NVIDIA GeForce RTX 4050 Laptop GPU, 16.00", 2 kg
análise externo » Acer Swift X SFX16-61G
Asus ROG Zephyrus G14 GA402XZ: NVIDIA GeForce RTX 4080 Laptop GPU, 14.00", 1.7 kg
análise externo » Asus ROG Zephyrus G14 GA402XZ
Asus TUF Gaming A17 FA707XI: NVIDIA GeForce RTX 4070 Laptop GPU, 17.30", 2.6 kg
análise externo » Asus TUF Gaming A17 FA707XI
Asus ROG Flow X13 GV302XI: NVIDIA GeForce RTX 4070 Laptop GPU, 13.40", 1.3 kg
análise externo » Asus ROG Flow X13 GV302XI
Razer Blade 14 RTX 4060: NVIDIA GeForce RTX 4060 Laptop GPU, 14.00", 1.8 kg
análise externo » Razer Blade 14 RTX 4060
Asus ROG Zephyrus G14 GA402XV: NVIDIA GeForce RTX 4060 Laptop GPU, 14.00", 1.7 kg
análise externo » Asus ROG Zephyrus G14 GA402XV
Asus TUF Gaming A15 FA507XV: NVIDIA GeForce RTX 4060 Laptop GPU, 15.60", 2.2 kg
análise externo » Asus TUF Gaming A15 FA507XV
Razer Blade 14 RTX 4070: NVIDIA GeForce RTX 4070 Laptop GPU, 14.00", 1.8 kg
análise externo » Razer Blade 14 RTX 4070
Asus ROG Flow X13 GV302XV: NVIDIA GeForce RTX 4060 Laptop GPU, 13.40", 1.3 kg
análise externo » Asus ROG Flow X13 GV302XV
Asus TUF Gaming A16 FA617XS: AMD Radeon RX 7600S, 16.00", 2.2 kg
análise externo » Asus TUF Gaming A16 FA617XS
Asus ROG Zephyrus G14 GA402XY: NVIDIA GeForce RTX 4090 Laptop GPU, 14.00", 1.7 kg
análise externo » Asus ROG Zephyrus G14 GA402XY
Framework Laptop 16: AMD Radeon RX 7700S, 16.00", 2.4 kg
» 500 dólares por 4 GB de VRAM: Nvidia GeForce RTX 5070 de 12 GB es extremadamente cara
Geekom A7 Max, R9 7940HS: AMD Radeon 780M, 0.7 kg
» Mini PC con AMD Ryzen 9: ¿Merece la pena el Geekom A7 Max Edition 2026?
Framework Laptop 16: AMD Radeon RX 7700S, 16.00", 2.4 kg
» El Framework 12 se anuncia como un portátil 2 en 1 "básico" reparable con un diseño resistente
» Framework Laptop 16 admite ahora cuatro unidades SSD M.2 para hasta 16 TB de almacenamiento
» El sistema Framework Laptop Brick amplía el portátil con pies Lego, ruedas, soportes para cables y mucho más