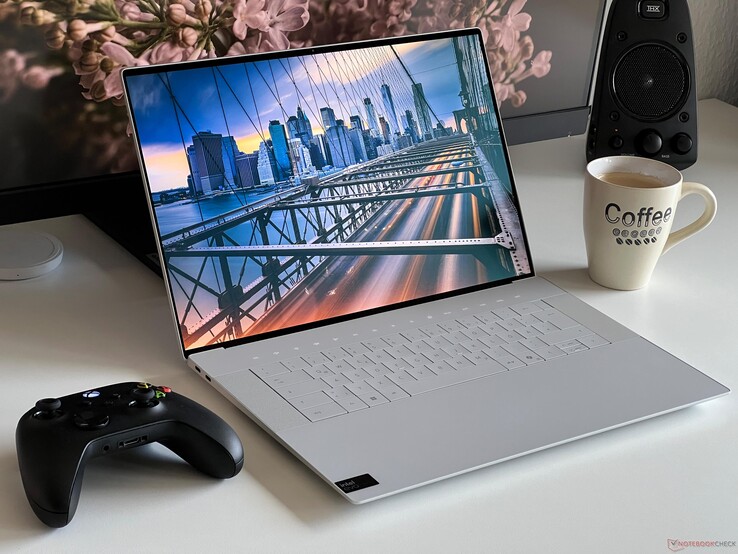
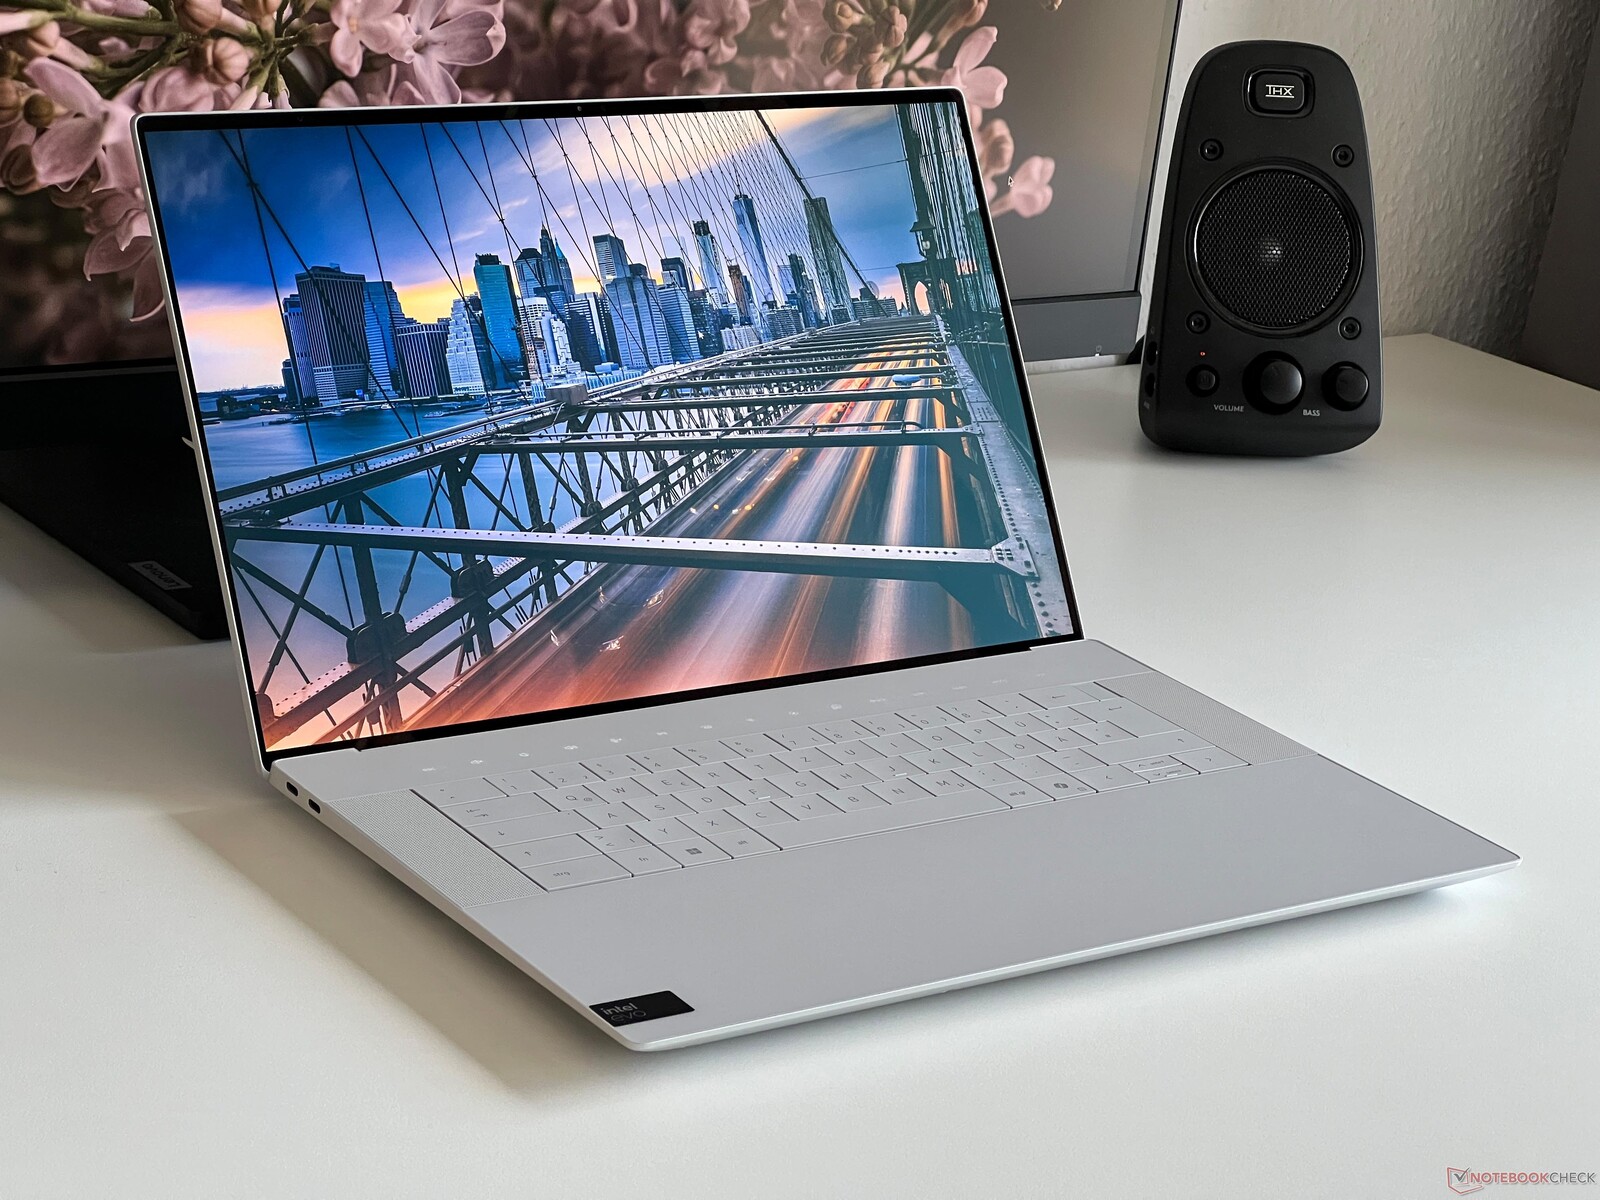
Análisis del Dell XPS 16 9640 - El portátil multimedia con OLED 4K y una molesta barra táctil
Dell ha sustituido su conocido portátil multimedia, el XPS 15, por dos nuevos modelos: En primer lugar, el más compacto XPS 14 que ya probamos a fondo-y cuyo concepto nos desveló bastantes dudas. Hoy echaremos un vistazo al modelo más grande de 16 pulgadas, el XPS 16. En general, su receta es idéntica y, aparte de los nuevos procesadores Meteor Lake de Intel, hace uso de tarjetas gráficas dedicadas de Nvidia, pero esta vez también de los modelos más potentes, hasta el portátil RTX 4070. Existen algunas diferencias adicionales, de las que hablaremos con más detalle en el transcurso de este análisis.
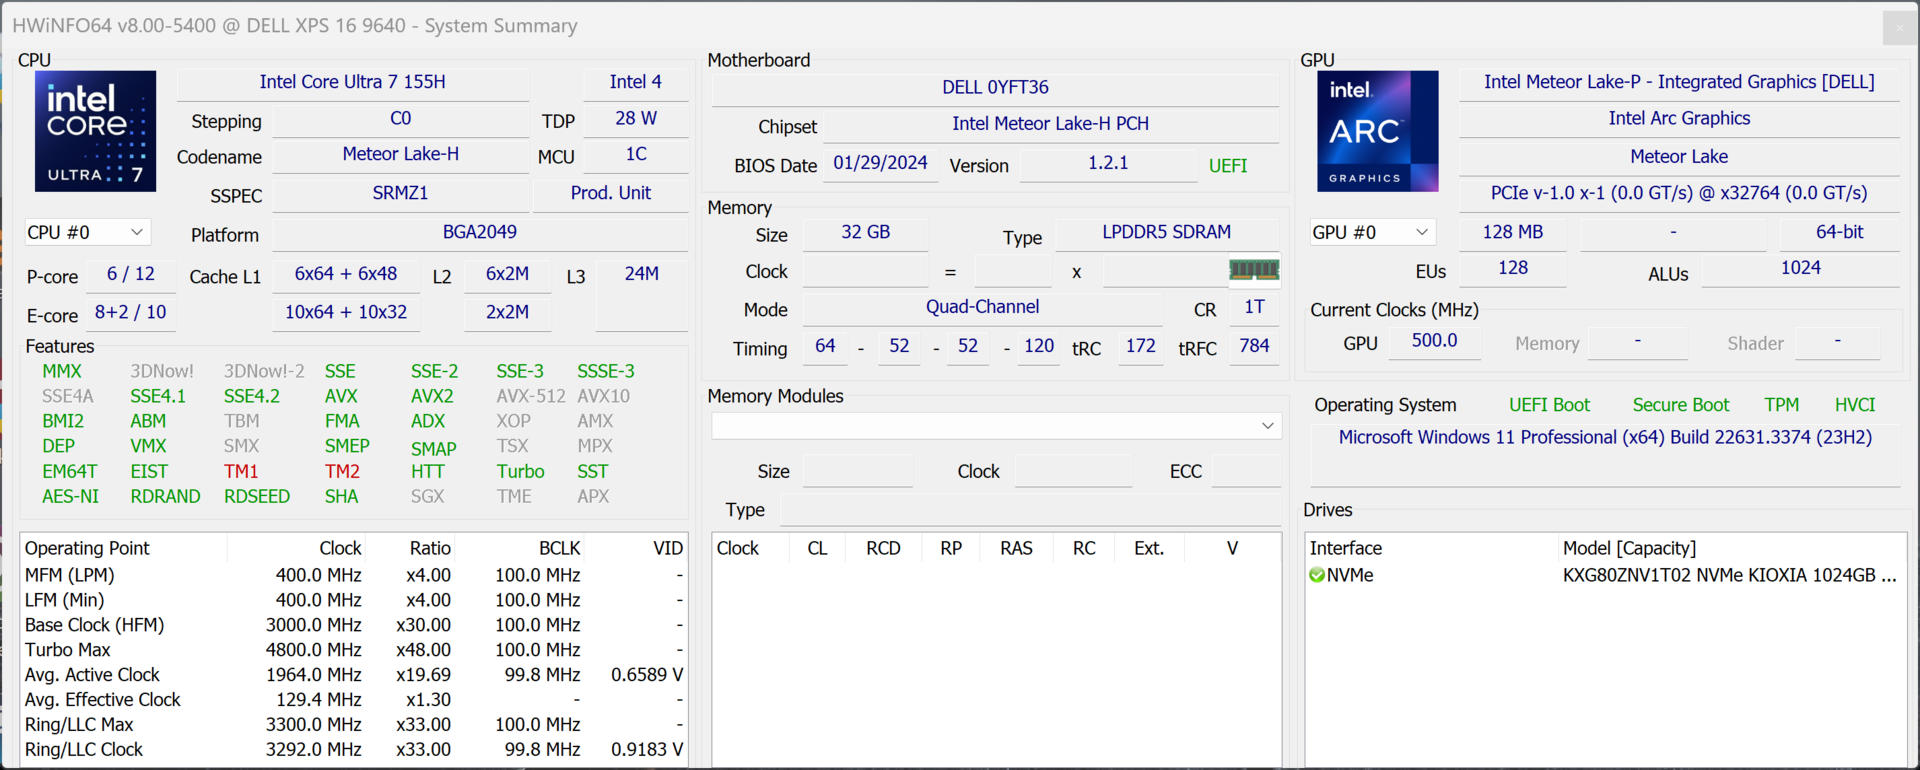
Nuestro dispositivo de prueba es una configuración bien equipada que incluye el Core Ultra 7 155H, el RTX 4070 Laptop, 32 GB de RAM, una unidad SSD de 1 TB, así como una pantalla táctil OLED de alta resolución por 2.899 dólares. Como resultado, el XPS 16 compite con otros portátiles multimedia de alta calidad e híbridos gaming/multimedia como el ROG Zephyrus G16.
Posibles contendientes en la comparación
Valoración | Fecha | Modelo | Peso | Altura | Tamaño | Resolución | Precio |
|---|---|---|---|---|---|---|---|
| 88.6 % v7 (old) | 04/2024 | Dell XPS 16 9640 Ultra 7 155H, GeForce RTX 4070 Laptop GPU | 2.3 kg | 18.7 mm | 16.30" | 3840x2400 | |
| 90.4 % v7 (old) | 03/2024 | Samsung Galaxy Book4 Ultra Ultra 7 155H, GeForce RTX 4050 Laptop GPU | 1.8 kg | 17 mm | 16.00" | 2880x1800 | |
| 90 % v7 (old) | 03/2024 | Honor MagicBook Pro 16 2024 Ultra 7 155H, GeForce RTX 4060 Laptop GPU | 1.9 kg | 17.9 mm | 16.00" | 3072x1920 | |
| 92.3 % v7 (old) | 02/2024 | Asus ROG Zephyrus G16 2024 GU605M Ultra 7 155H, GeForce RTX 4070 Laptop GPU | 1.8 kg | 16.4 mm | 16.00" | 2560x1600 | |
| 88.4 % v7 (old) | 08/2023 | Lenovo Yoga Pro 9 16-IRP G8 i7-13705H, GeForce RTX 4060 Laptop GPU | 2.2 kg | 18.2 mm | 16.00" | 3200x2000 | |
| 88.6 % v7 (old) | 07/2023 | Schenker VISION 16 Pro (M23) i7-13700H, GeForce RTX 4070 Laptop GPU | 1.6 kg | 17.1 mm | 16.00" | 2560x1600 | |
| 90.3 % v7 (old) | 04/2023 | Dell XPS 15 9530 RTX 4070 i7-13700H, GeForce RTX 4070 Laptop GPU | 1.9 kg | 18 mm | 15.60" | 3456x2160 |
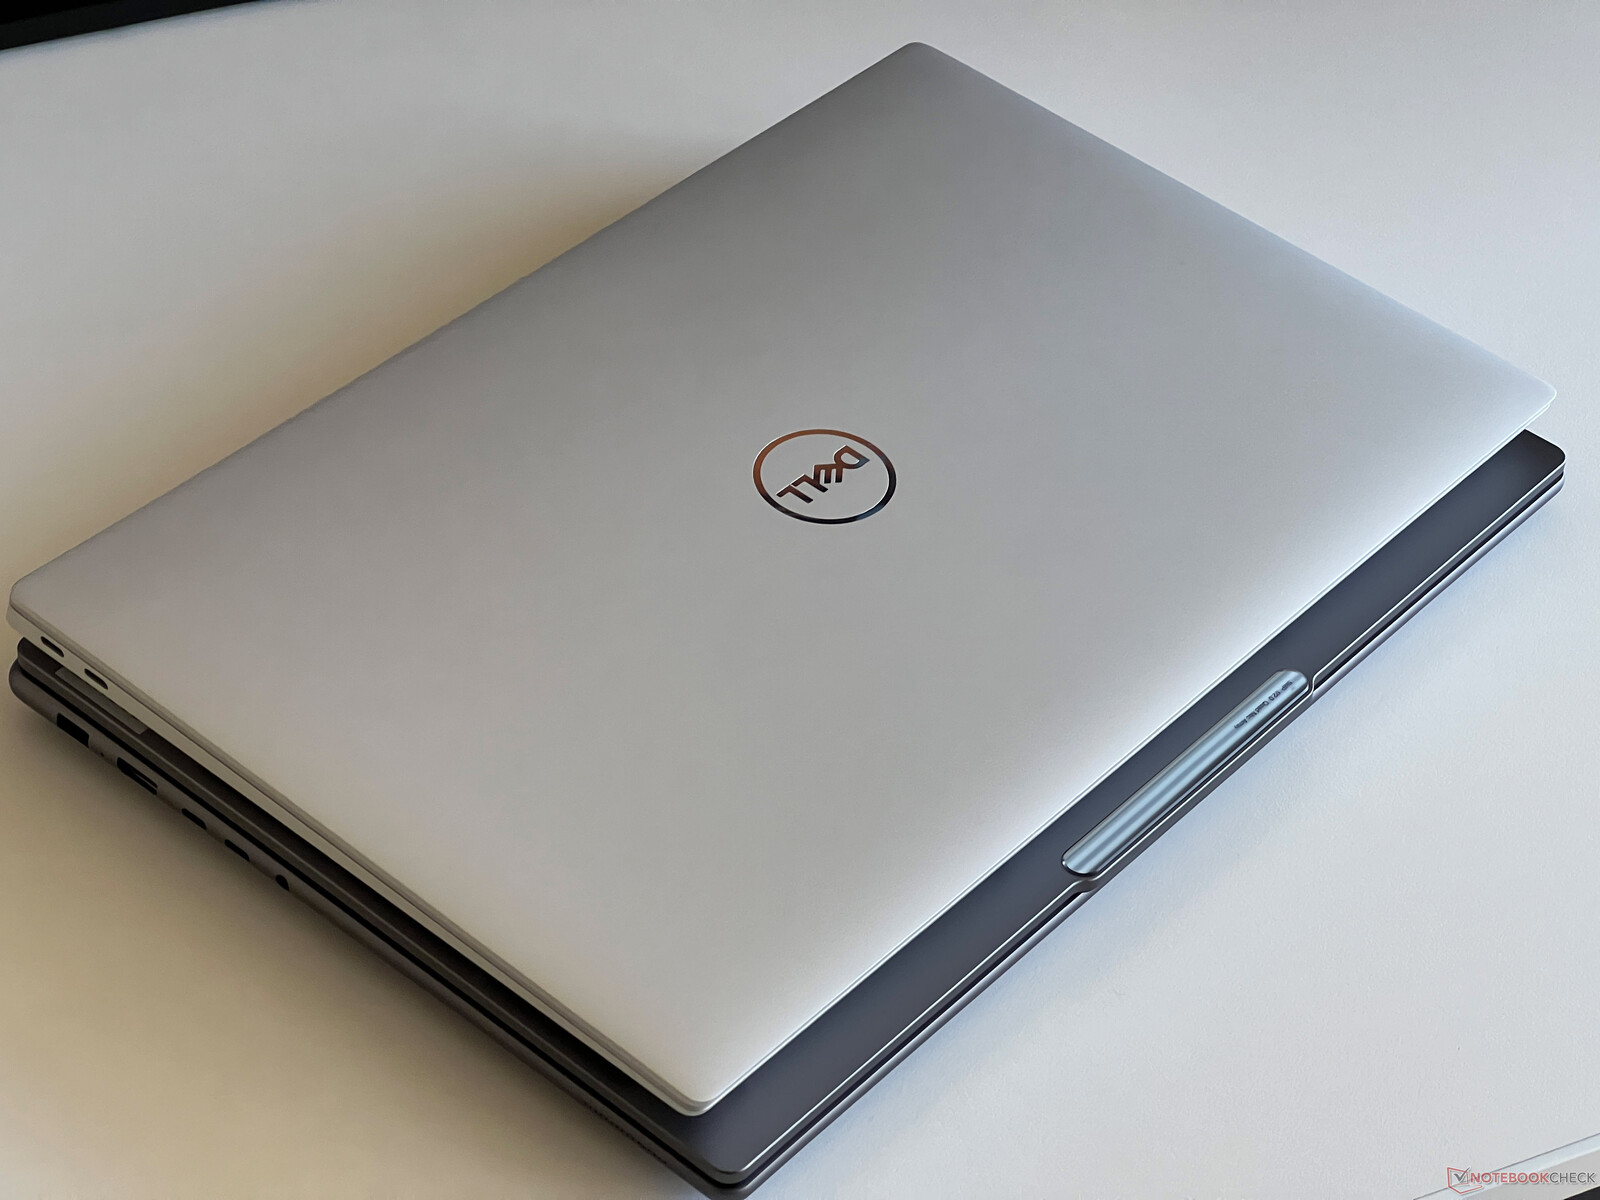
Caja - Estable caja de aluminio
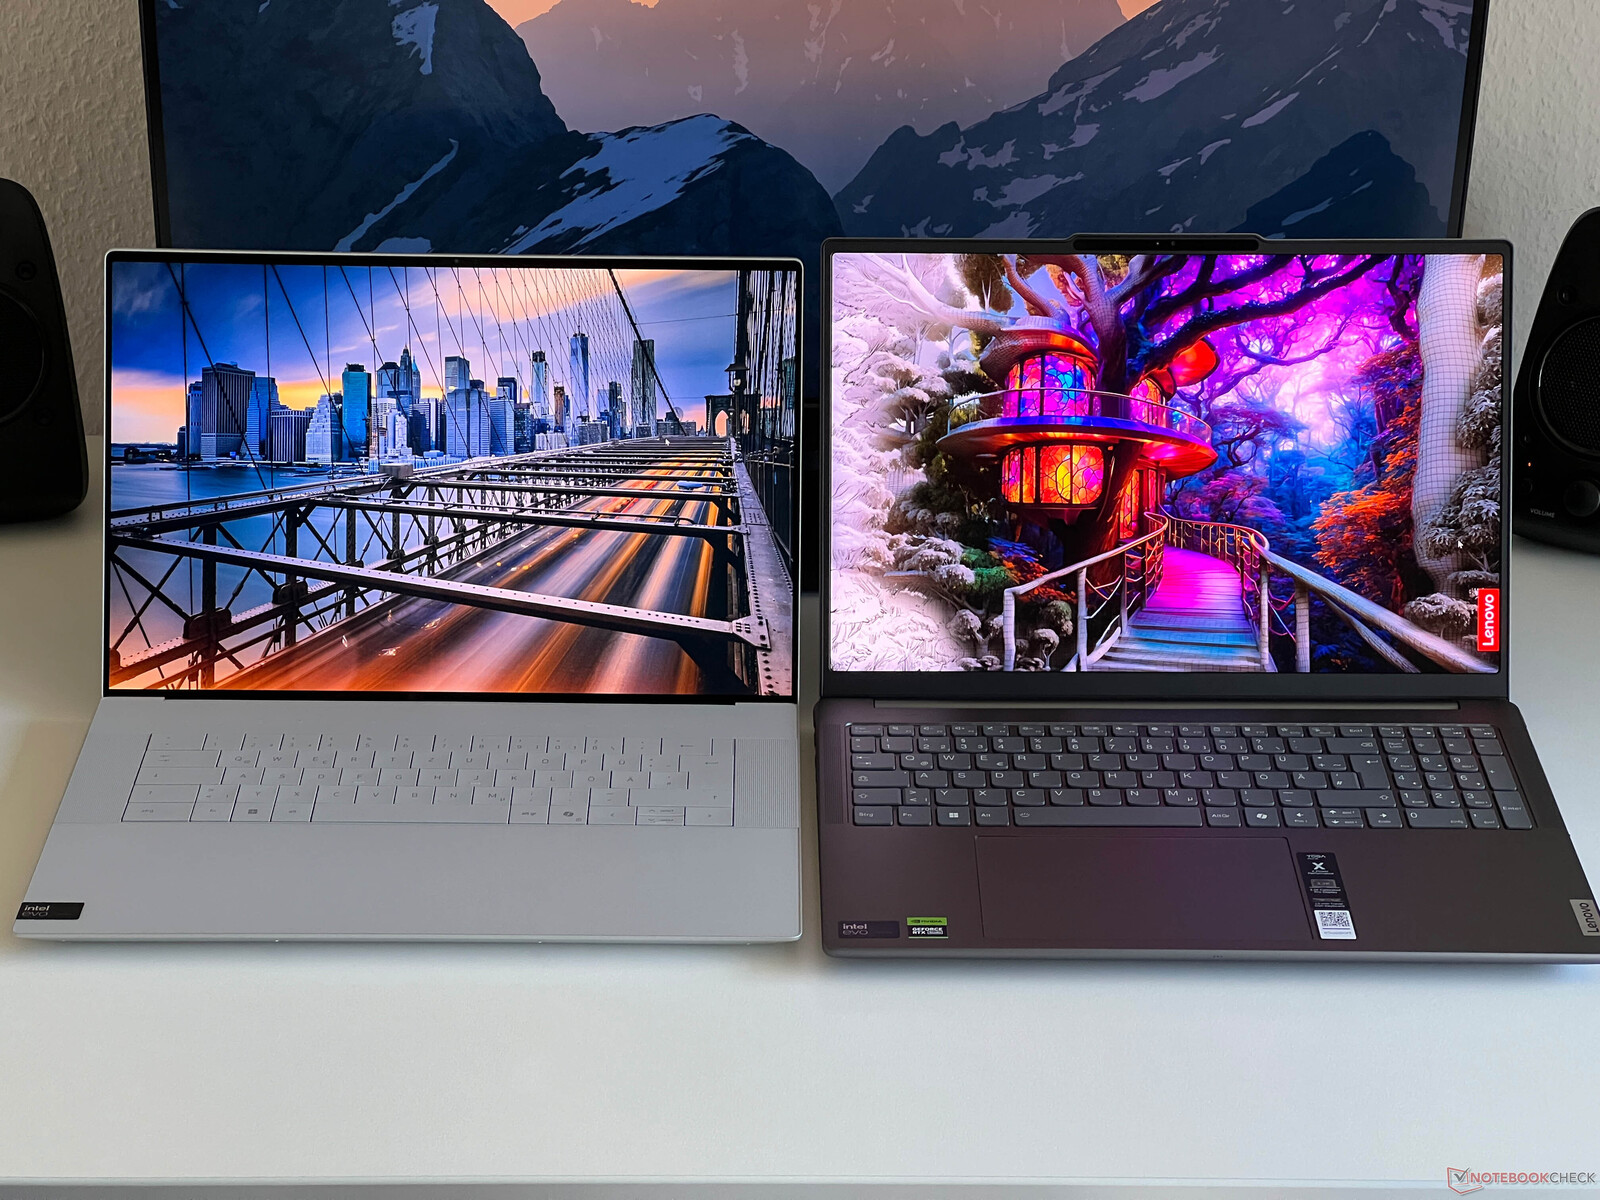
Dell ha utilizado el mismo diseño básico para las tres variantes de la actual serie XPS, inspirándose en el XPS 13 Plus y su gran reposamanos de cristal continuo y su inusual teclado que incluye una barra táctil. El diseño es atractivo y, aparte de nuestra versión clara, Dell también ofrece una versión gris oscuro del portátil. Sus biseles son delgados por los cuatro costados, lo que le confiere un aspecto moderno. Debido a su mayor tamaño, el XPS 16 no parece tan voluminoso como el xPS 14 más pequeño.
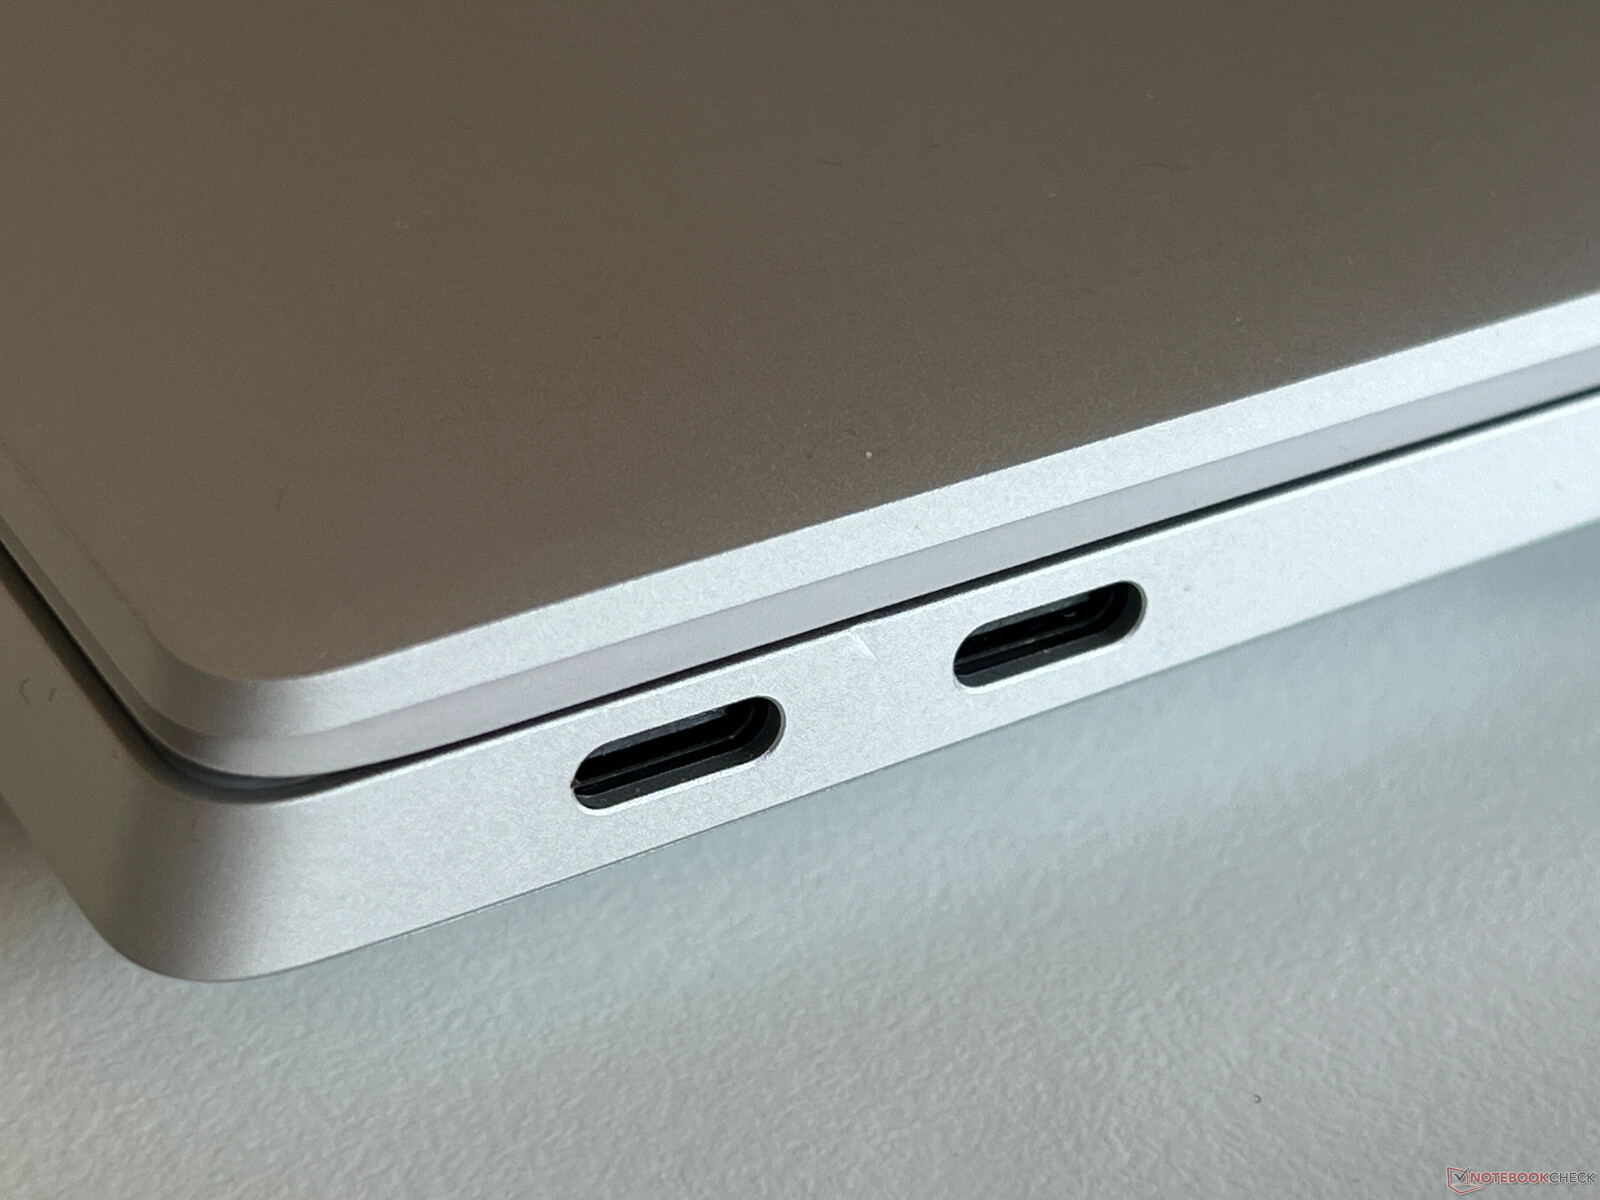
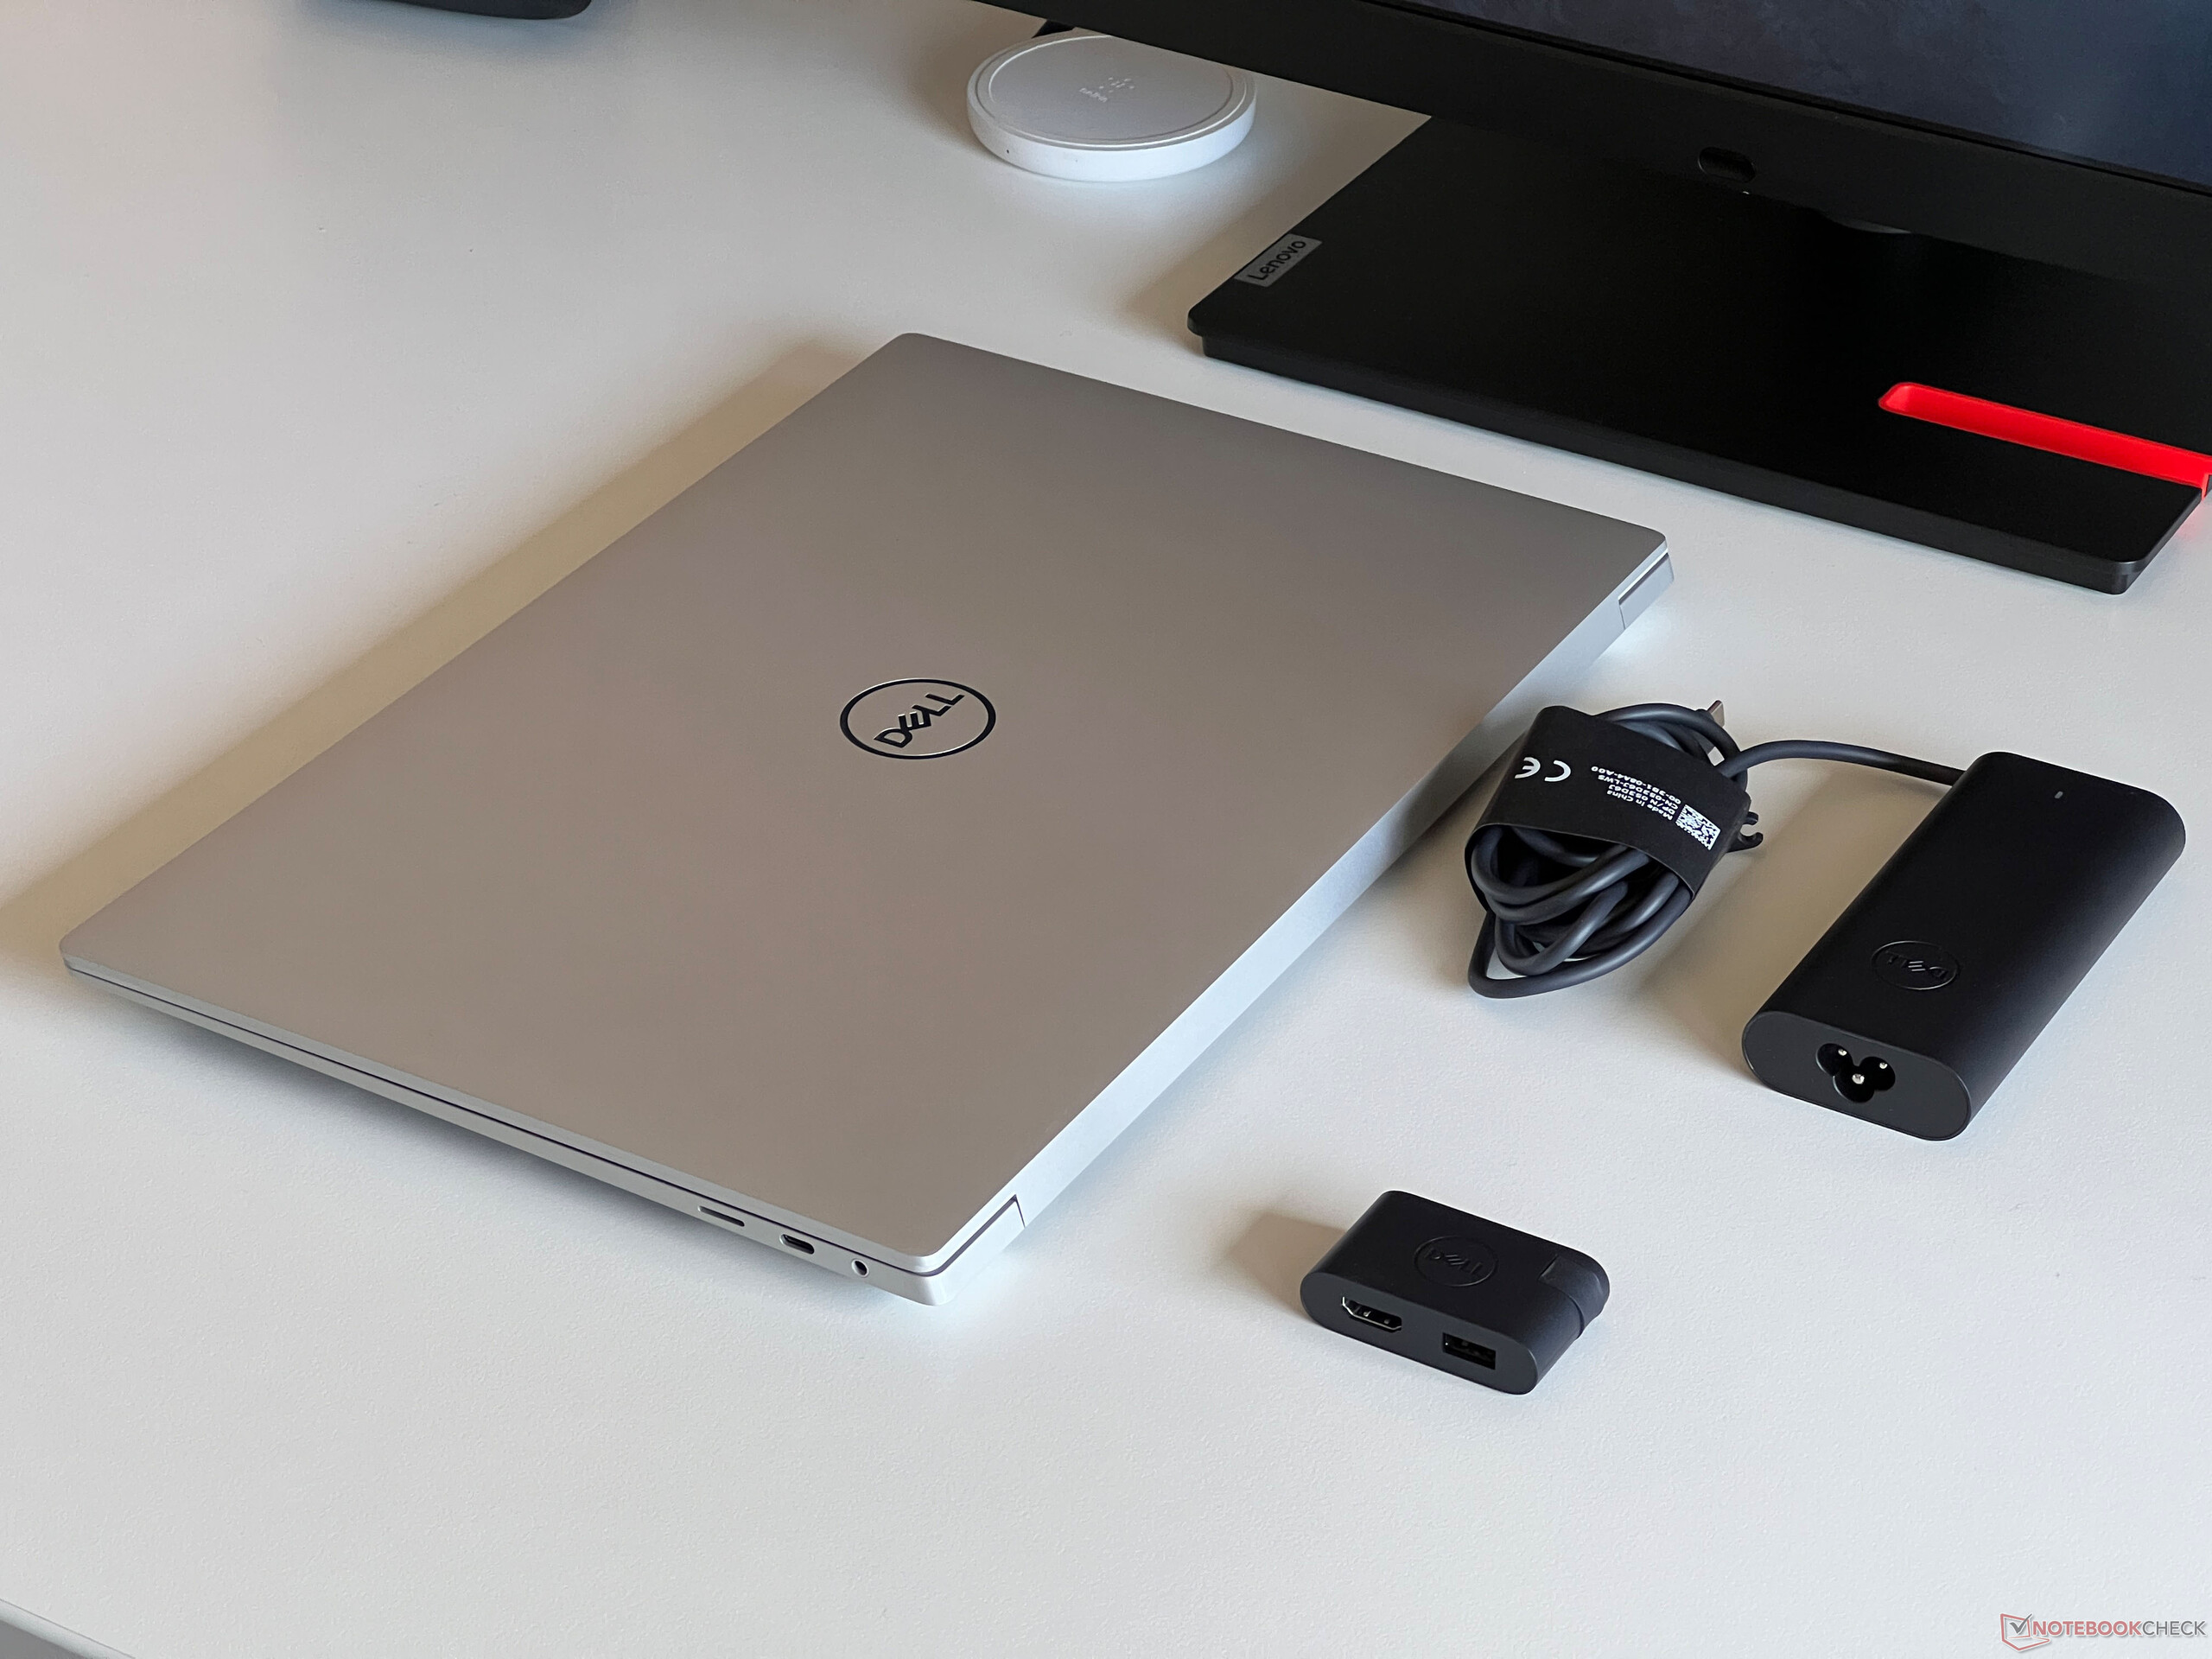
La carcasa es muy robusta y en general está muy bien construida, sin embargo, observamos un pequeño defecto entre los dos puertos USB-C en el lado izquierdo de nuestro dispositivo de prueba. La pantalla también es muy estable y la tapa sólo rebota ligeramente cuando se ajusta el ángulo de apertura (máx. 135 grados). Sin embargo, debido a la forma del borde frontal, es difícil abrir la tapa con una sola mano.
Como ya se ha mencionado, el nuevo diseño del modelo de 16 pulgadas parece más bonito que el del XPS 14 y no hay grandes diferencias con respecto a la competencia, especialmente en lo que se refiere a su tamaño y al grosor de su carcasa. En comparación con el actual Yoga Pro 9 16 2024 (ver imágenes comparativas más abajo), el XPS se beneficia de unos biseles más finos. Sin embargo, con 2,313 kg, el XPS 16 sigue siendo el dispositivo más pesado de nuestro grupo de comparación.
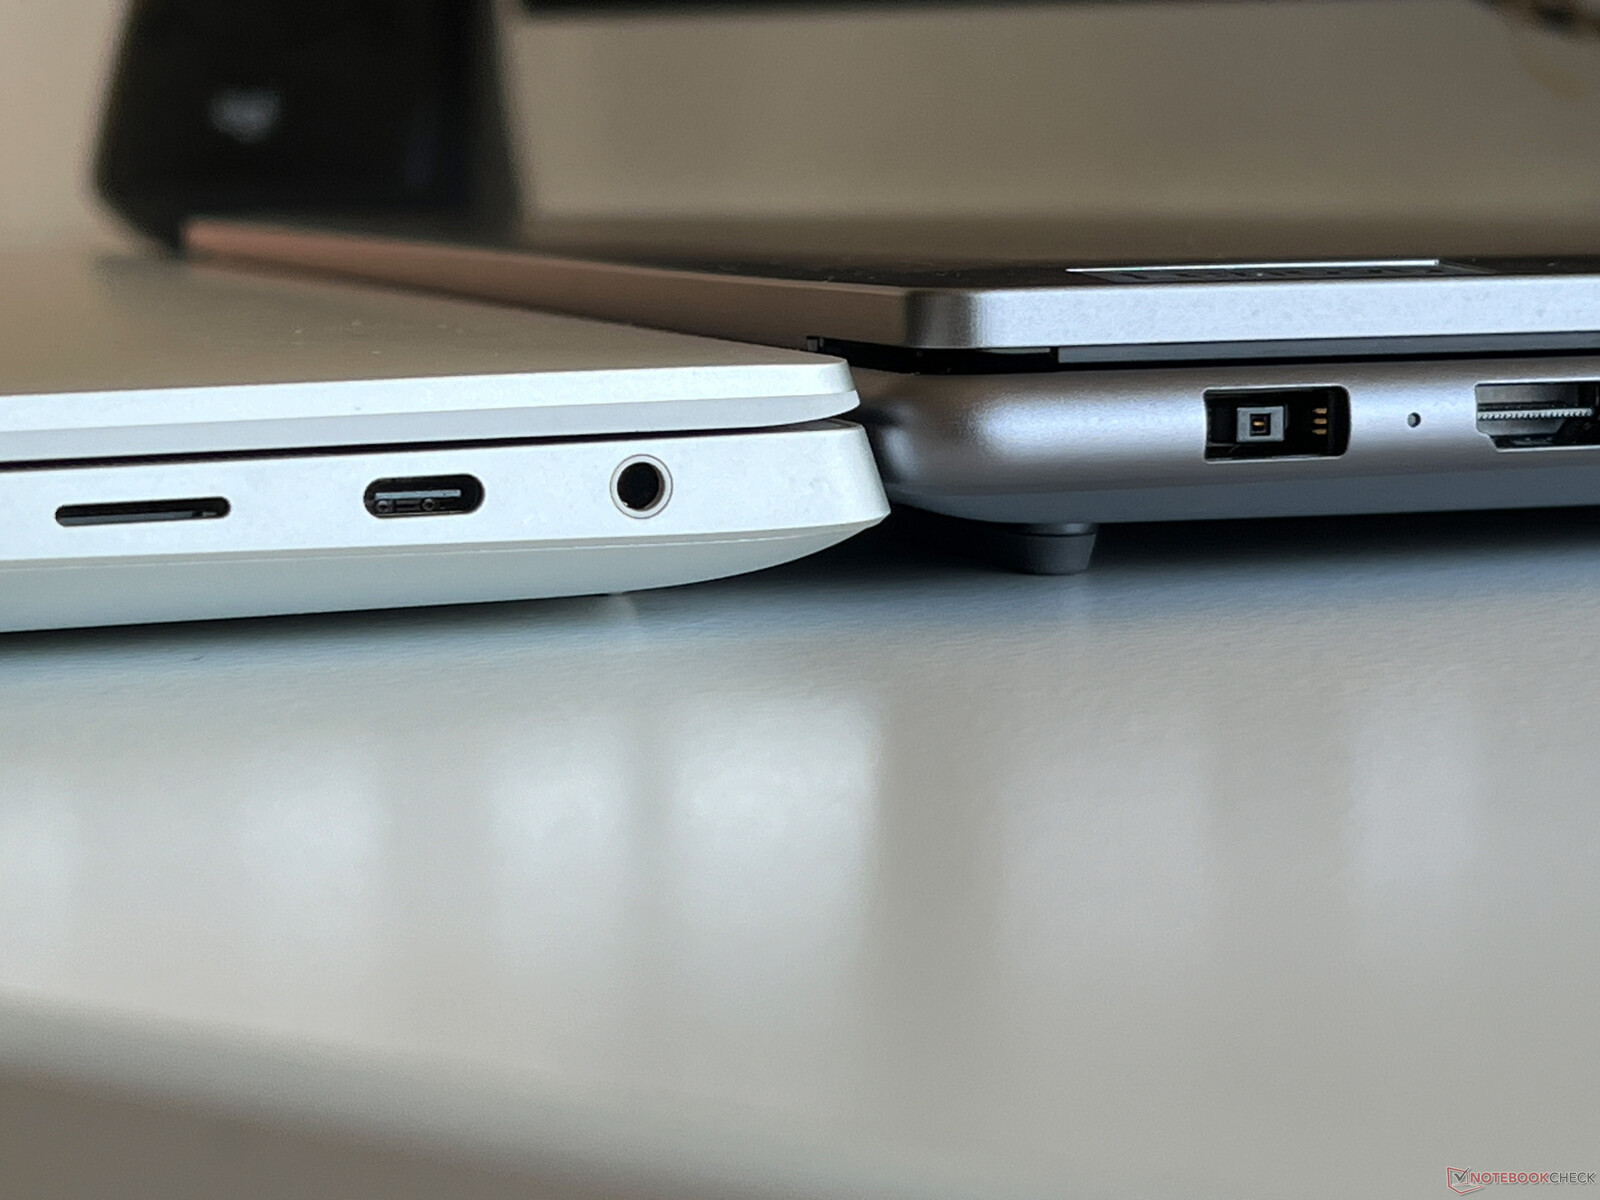
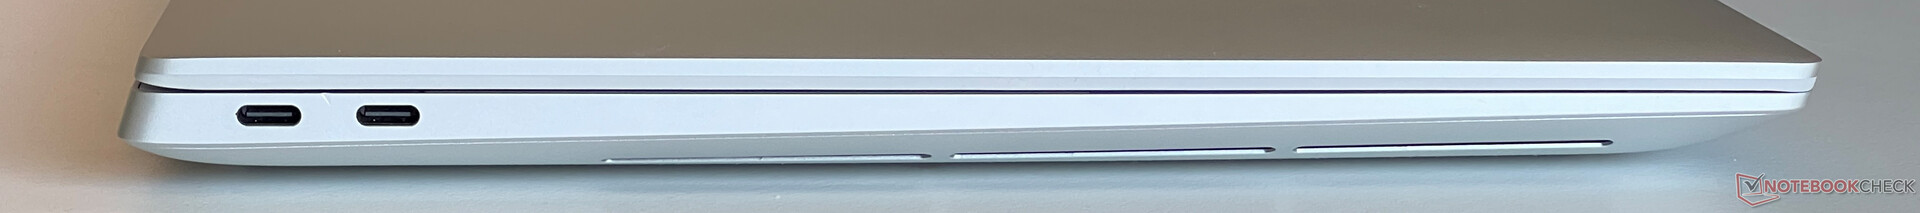
Conectividad - El XPS 16 más rápido sólo con 2x Thunderbolt 4
El XPS 16 presenta las mismas opciones de conectividad que el más pequeño XPS 14, con Dell dejando el espacio adicional sin utilizar. Hay un total de 3 puertos USB-C y un lector de tarjetas, y eso es todo. Para empeorar las cosas, sólo los dos puertos en el lado izquierdo de los modelos que cuentan con el rápido portátil RTX 4070 soportan Thunderbolt 4, mientras que en el lado derecho sólo se admite USB-C 3.2 Gen 2. Por el contrario, los tres puertos de las variantes más lentas admiten Thunderbolt 4. Además, todas las salidas USB-C se conectan a través de la iGPU. El volumen de suministro también incluye una pequeña estación de acoplamiento con un puerto USB-A y una salida HDMI.
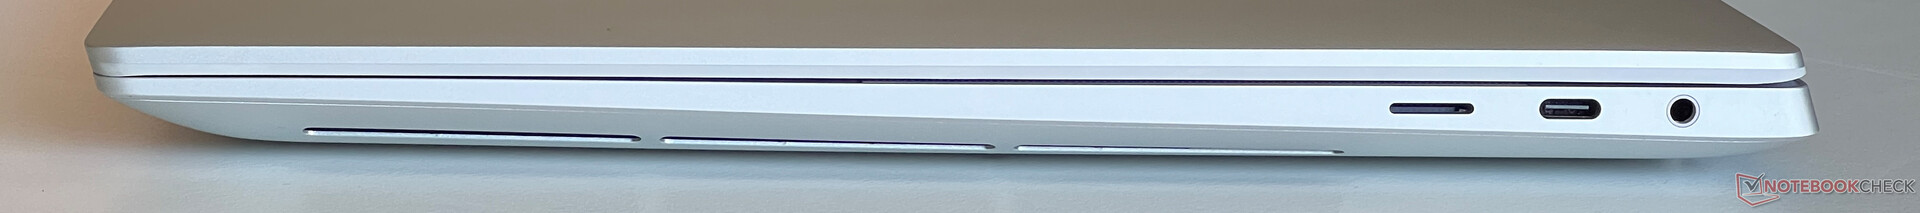
Lector de tarjetas SD
El lector de tarjetas microSD (mecanismo de resorte) está situado en el lado derecho del aparato y admite las tarjetas de memoria compactas casi por completo. Junto con nuestra tarjeta de referencia (Angelbird AV Pro V60), sus tasas de transferencia alcanzaron un máximo de unos 204 MB/s y al copiar archivos de imagen, medimos unos buenos 148 MB/s.
| SD Card Reader | |
| average JPG Copy Test (av. of 3 runs) | |
| Dell XPS 15 9530 RTX 4070 (Toshiba Exceria Pro SDXC 64 GB UHS-II) | |
| Dell XPS 16 9640 (Angelbird AV Pro V60) | |
| Media de la clase Multimedia (23 - 531, n=36, últimos 2 años) | |
| Samsung Galaxy Book4 Ultra (Angelbird AV Pro V60) | |
| Asus ROG Zephyrus G16 2024 GU605M | |
| Lenovo Yoga Pro 9 16-IRP G8 (Angelibird AV Pro V60) | |
| Schenker VISION 16 Pro (M23) (Angelbird AV Pro V60) | |
| maximum AS SSD Seq Read Test (1GB) | |
| Dell XPS 16 9640 (Angelbird AV Pro V60) | |
| Media de la clase Multimedia (37.3 - 1455, n=35, últimos 2 años) | |
| Dell XPS 15 9530 RTX 4070 (Toshiba Exceria Pro SDXC 64 GB UHS-II) | |
| Asus ROG Zephyrus G16 2024 GU605M | |
| Samsung Galaxy Book4 Ultra (Angelbird AV Pro V60) | |
| Lenovo Yoga Pro 9 16-IRP G8 (Angelibird AV Pro V60) | |
| Schenker VISION 16 Pro (M23) (Angelbird AV Pro V60) | |
Comunicación
A diferencia del XPS 14dell ha instalado un módulo Wi-Fi-7 de Intel en el XPS 16. También es compatible con Bluetooth 5.4. Aún no podemos probar su rendimiento Wi-Fi 7, pero en combinación con nuestro router de referencia de Asus, su rendimiento fue un poco peor que, por ejemplo, el XPS 14 con su módulo Wi-Fi 6E. Aun así, no debería notar ninguna limitación y, durante el transcurso de nuestra prueba, no observamos ningún problema de conexión.
| Networking | |
| Dell XPS 16 9640 | |
| iperf3 transmit AXE11000 | |
| iperf3 receive AXE11000 | |
| Samsung Galaxy Book4 Ultra | |
| iperf3 transmit AXE11000 | |
| iperf3 receive AXE11000 | |
| Honor MagicBook Pro 16 2024 | |
| iperf3 transmit AXE11000 | |
| iperf3 receive AXE11000 | |
| Asus ROG Zephyrus G16 2024 GU605M | |
| iperf3 transmit AXE11000 | |
| iperf3 receive AXE11000 | |
| Lenovo Yoga Pro 9 16-IRP G8 | |
| iperf3 transmit AXE11000 | |
| iperf3 receive AXE11000 | |
| Schenker VISION 16 Pro (M23) | |
| iperf3 transmit AXE11000 | |
| iperf3 receive AXE11000 | |
| Dell XPS 15 9530 RTX 4070 | |
| iperf3 transmit AXE11000 | |
| iperf3 receive AXE11000 | |
Cámara web
Dell ha instalado una webcam de 1080p en el marco superior de la pantalla, además de una cámara de infrarrojos para el reconocimiento facial a través de Windows Hello. La calidad de la webcam es buena en condiciones de buena iluminación. Además, la cámara admite efectos de estudio (enfoque suave de fondo, seguimiento ocular, encuadre automático) como parte del sistema operativo, lo que significa que funciona independientemente de la aplicación que se esté utilizando en ese momento.


Mantenimiento
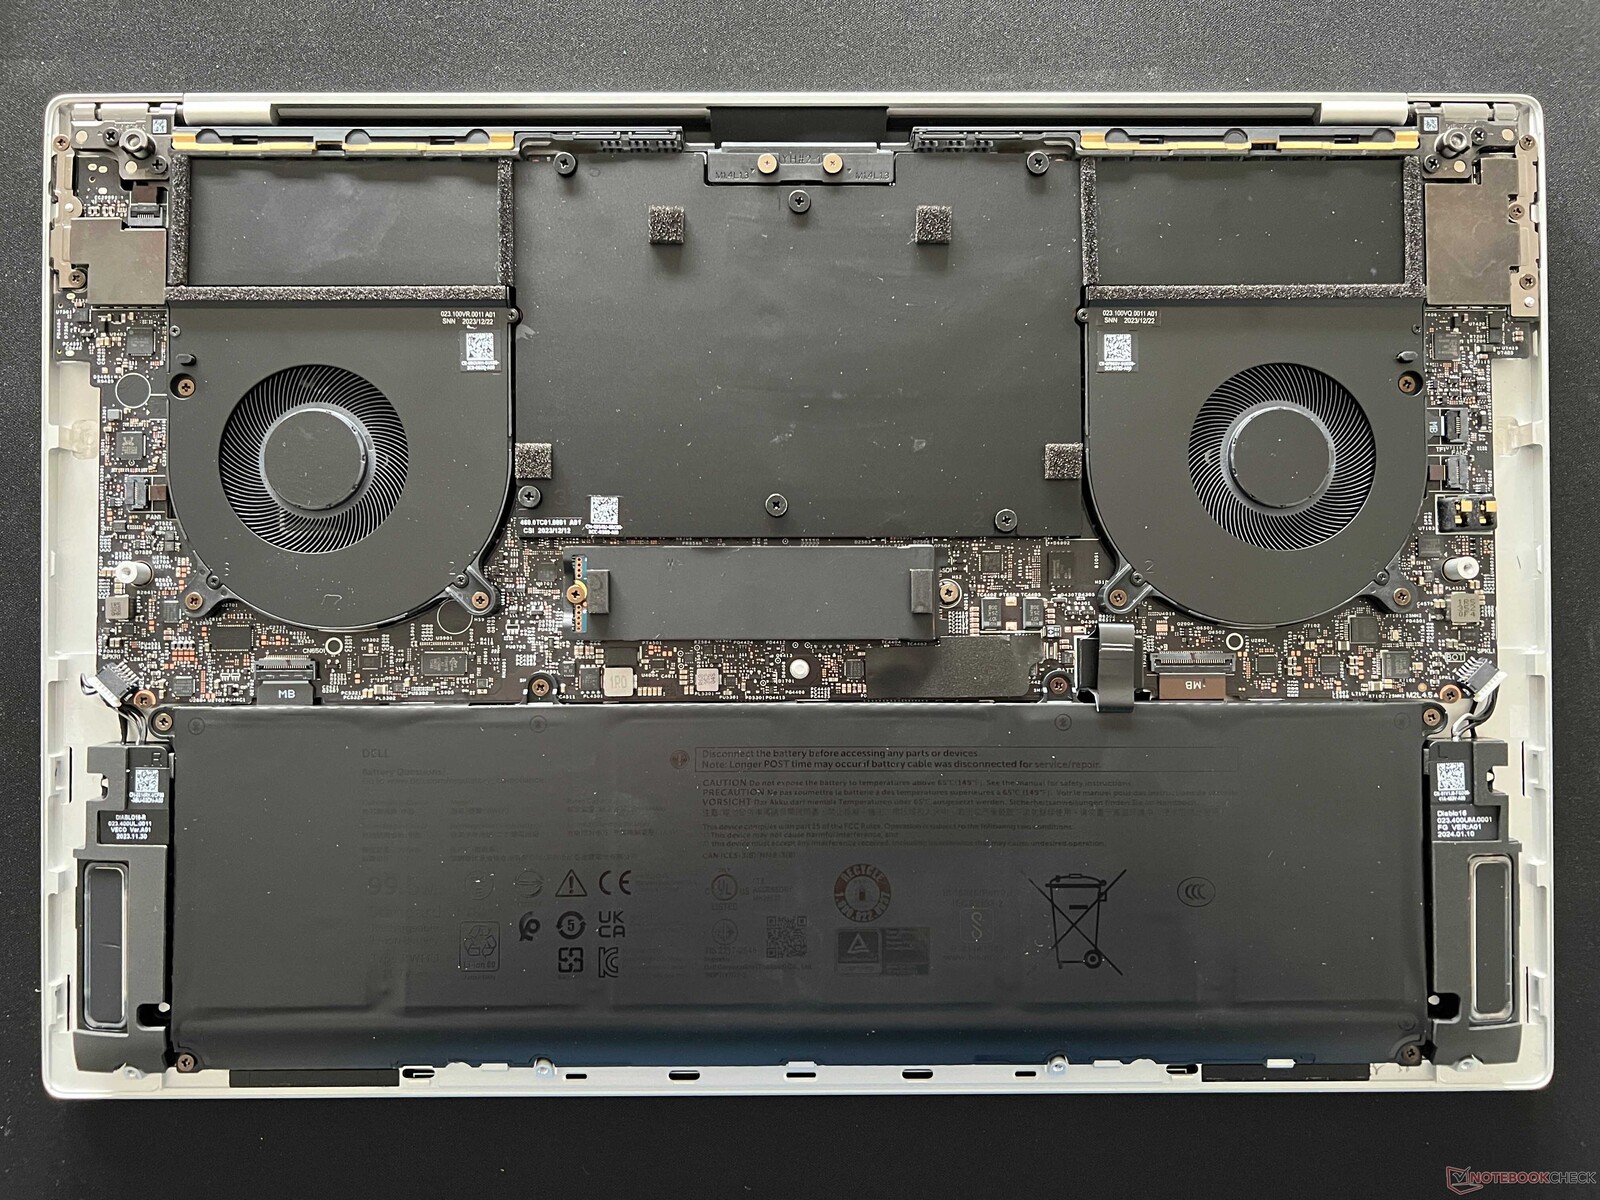
La tapa inferior de la carcasa está fijada mediante tornillos Torx (T5) y puede retirarse fácilmente. La estructura interna está dominada por la unidad de refrigeración y la batería. Sólo puede realizar tareas de mantenimiento en la SSD M.2-2280 y limpiar los ventiladores del portátil; además, puede cambiar la batería si es necesario. Todos los demás componentes, incluidos el módulo WLAN y la RAM, están soldados.
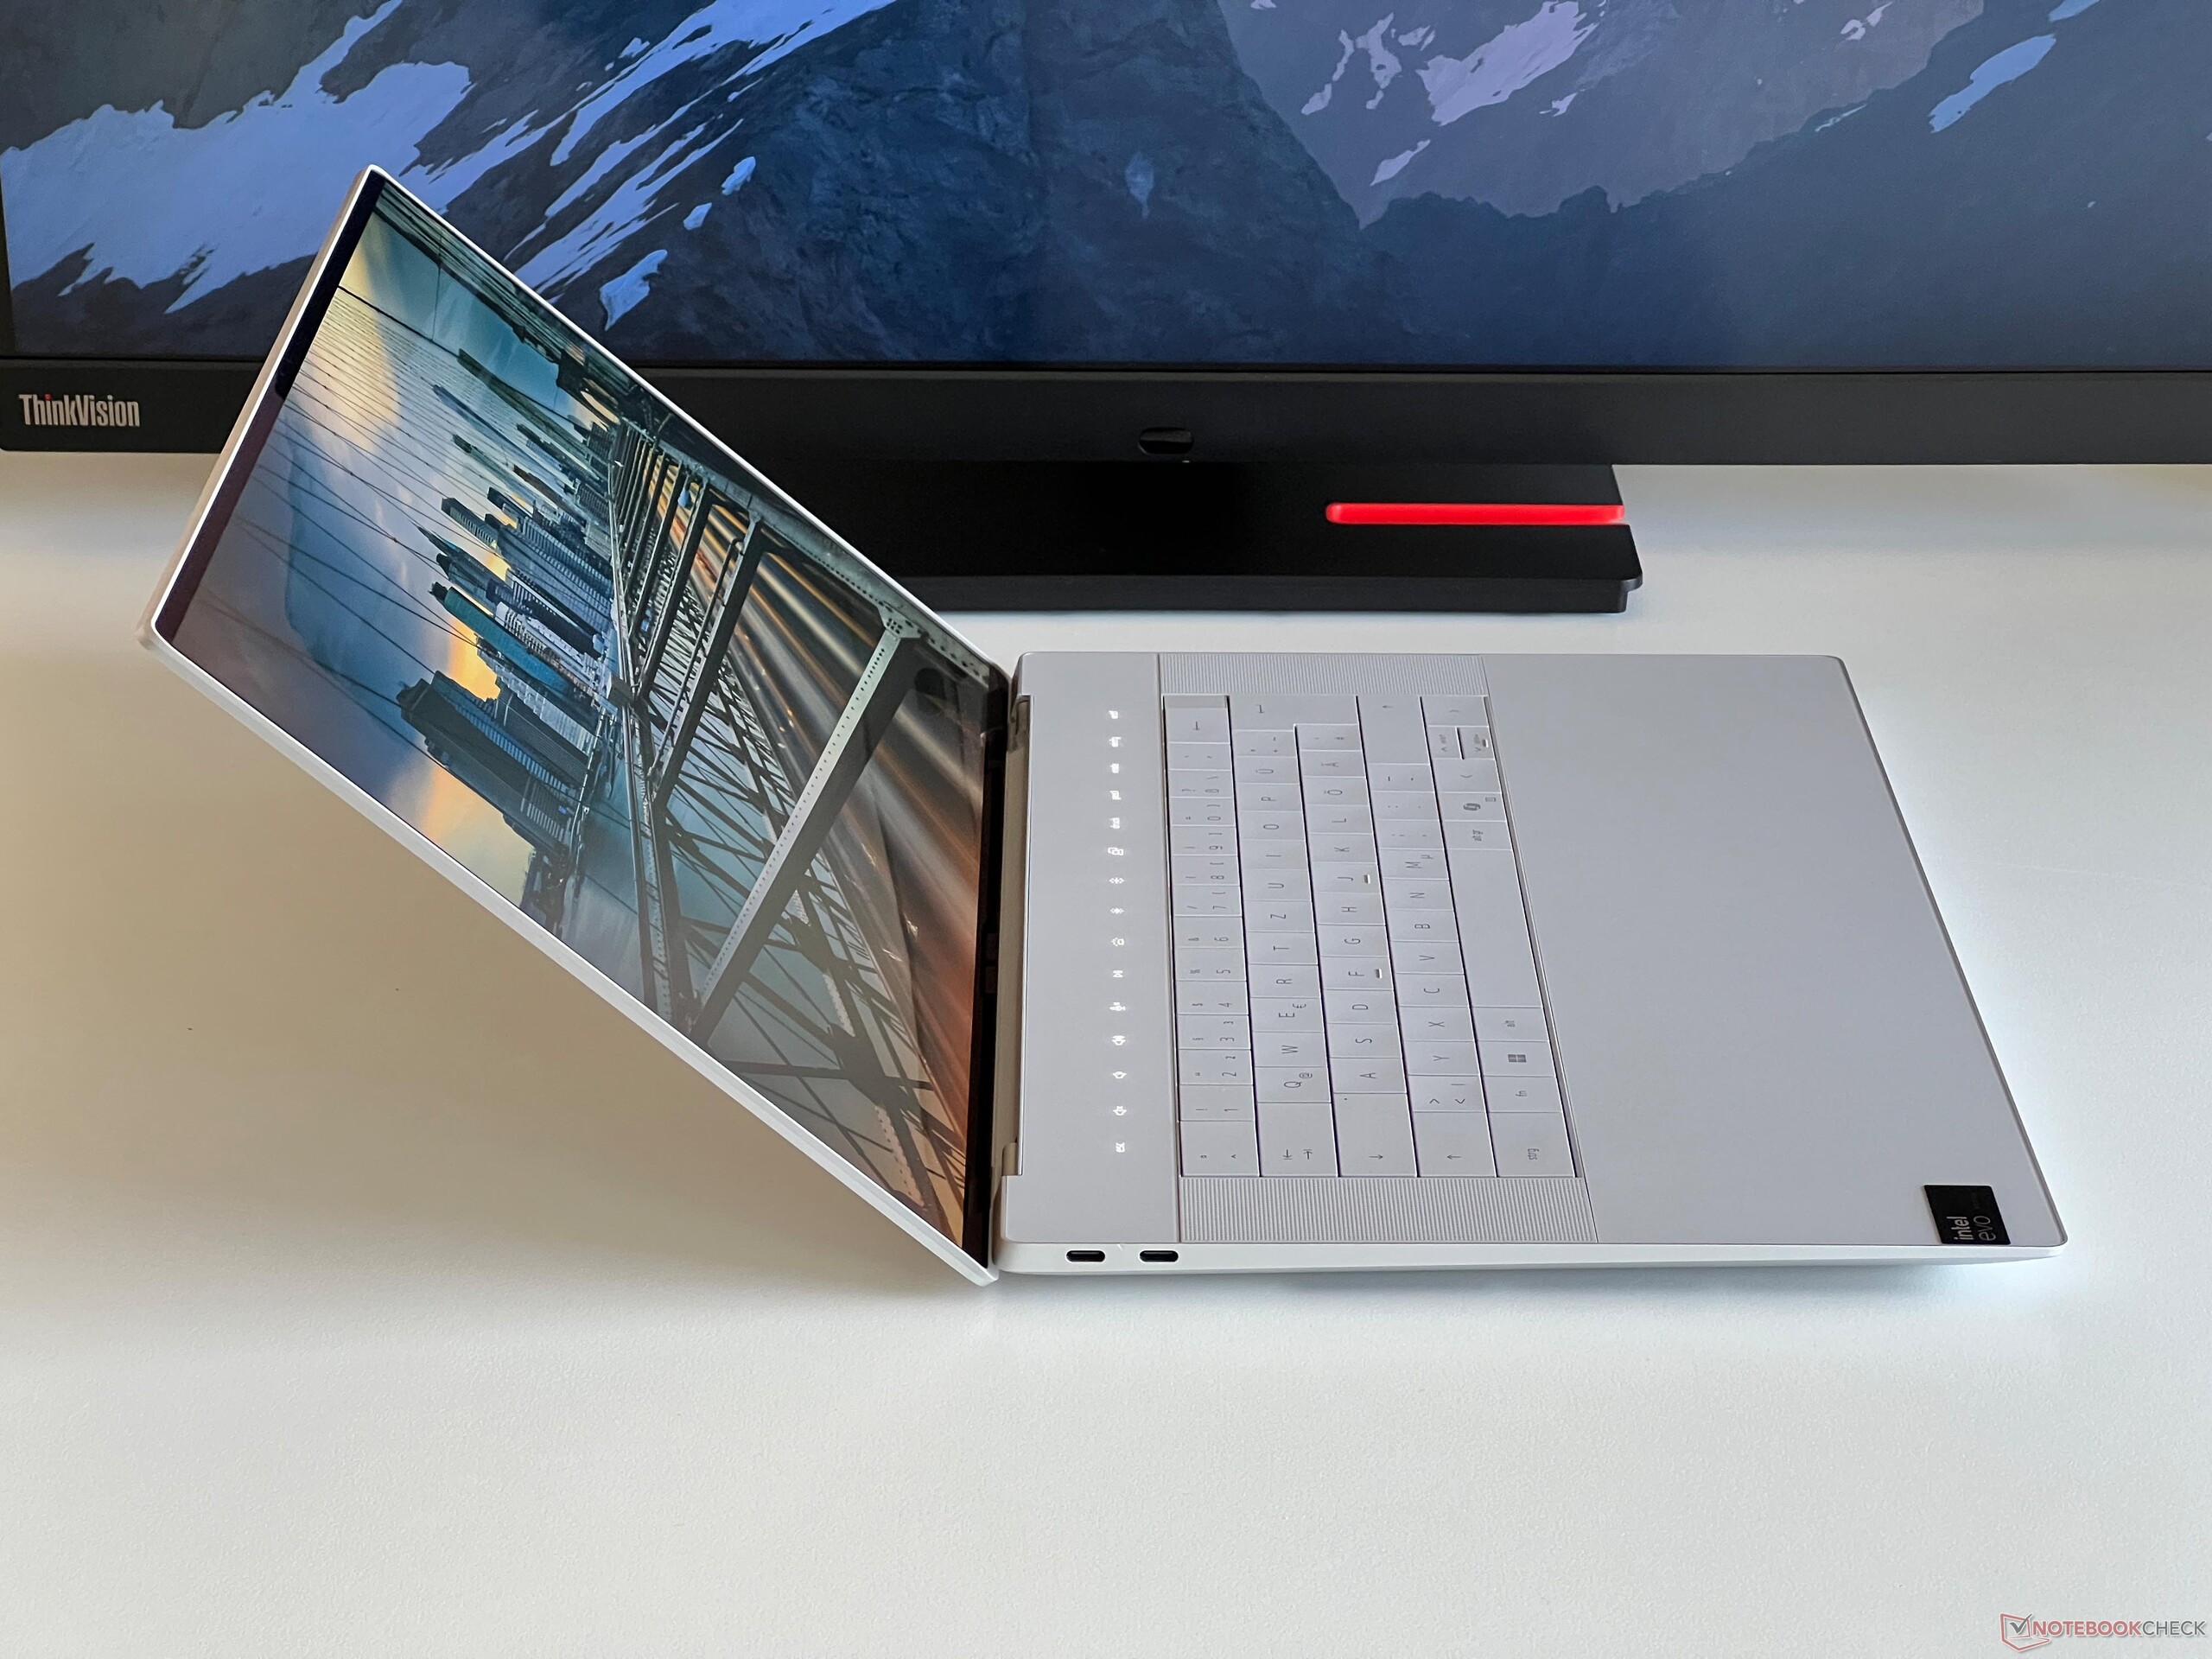
Dispositivos de entrada - Teclado al que cuesta acostumbrarse y teclas de función molestas
Como ya se ha señalado en el XPS 14dell también utiliza el mismo diseño de teclado que el antiguo XPS 13 Plus para su modelo XPS 16 de mayor tamaño, que no presenta espacios entre las teclas individuales. No tiene teclado numérico, en su lugar, el espacio junto al teclado se utiliza para los altavoces del portátil. Las teclas en sí son ligeramente cóncavas y resulta muy cómodo escribir en ellas, ya que las pulsaciones son precisas. Sin embargo, notamos algún problema ocasional, ya que a menudo pulsamos la tecla equivocada por accidente, por lo que definitivamente se necesita algo de tiempo para acostumbrarse a este teclado. También nos resultó molesto pulsar las diminutas teclas de flecha verticales con los dedos grandes, y el ruido de pulsación de las teclas más grandes es mucho más fuerte (barra espaciadora, tecla Intro). El botón de encendido se encuentra en la parte superior derecha (incluye un escáner de huellas dactilares) donde normalmente se esperaría que estuviera la tecla de borrado, lo que nos lleva al siguiente problema.
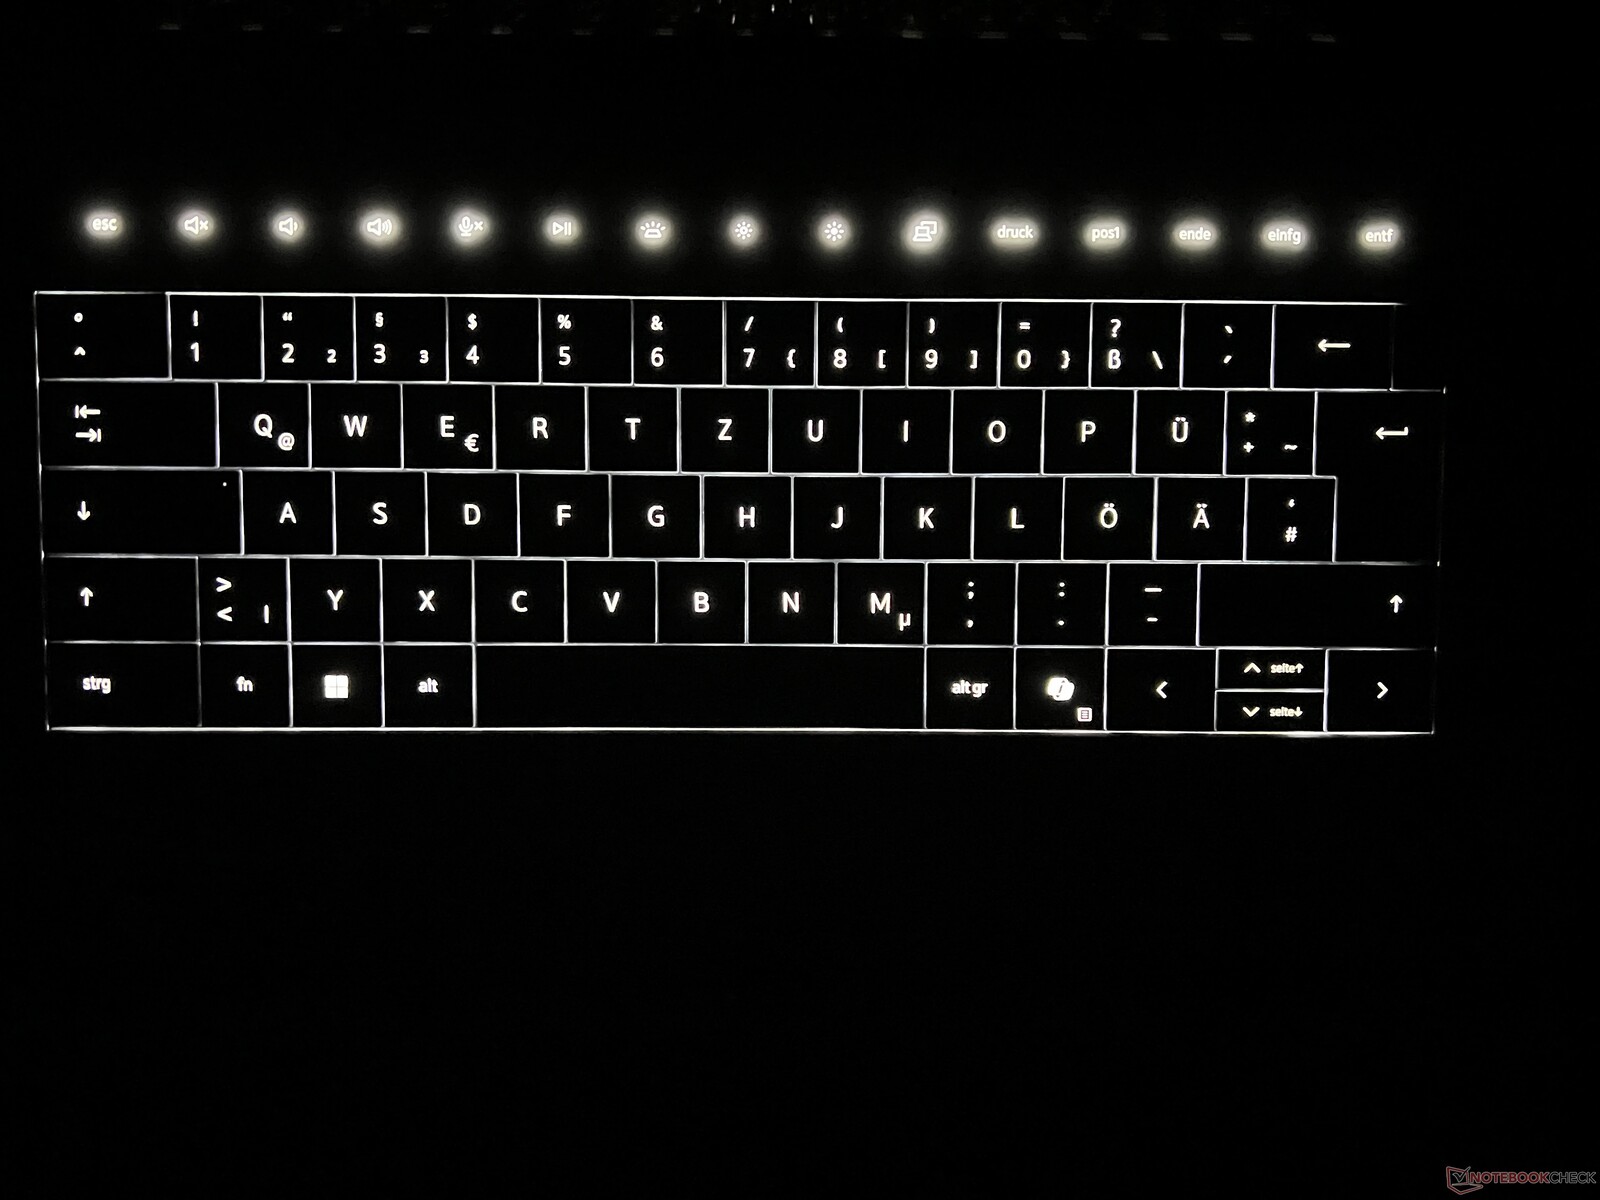
Las teclas de función están instaladas en forma de barra táctil, lo que no sólo no añade ningún valor adicional al dispositivo para los usuarios, sino que además resulta bastante molesto. Como resultado, ni siquiera puede pulsar la tecla de borrado a ciegas y siempre tiene que mirar las teclas. La retroiluminación es igual de molesta, ya que se apaga durante los periodos de inactividad pero no cuando se ve un vídeo durante horas, aunque no se toque ni una sola tecla. Además, cuando se desactiva la retroiluminación, no sabe dónde pulsar, lo que significa que podría pulsar las teclas equivocadas hasta que se reactive la iluminación. La propia retroiluminación blanca se adapta constantemente a través de un sensor y no se puede influir en la intensidad en absoluto, o al menos no pudimos encontrar la opción de hacerlo. Al sensor tampoco le interesa si previamente ha desactivado la retroiluminación manualmente y en cuanto cambian las condiciones de iluminación, se reactiva.
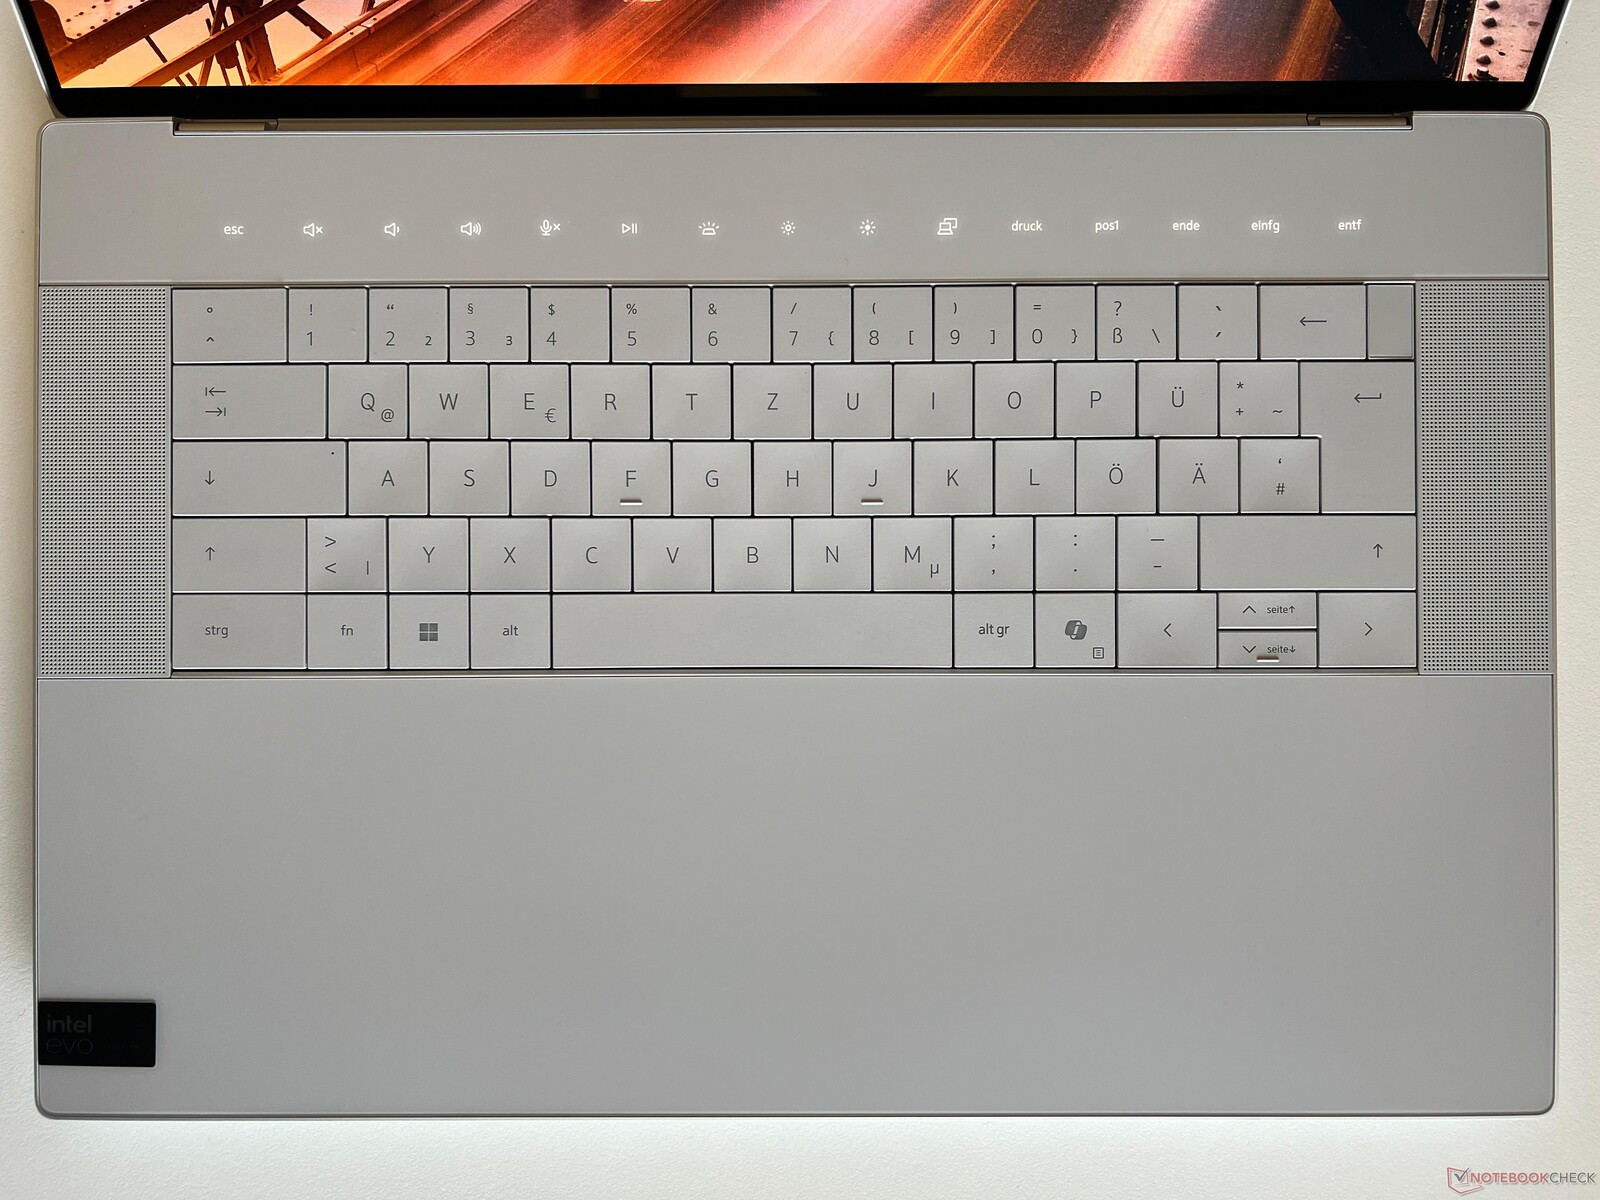
El panel táctil está totalmente integrado en el reposamanos y no hay límites visibles. El touchpad utiliza toda la altura del reposamanos y su anchura se extiende desde el centro de la tecla Fn izquierda hasta el centro de la tecla de flecha izquierda. En general, funciona bien y es agradable y suave con un clic uniforme, pero ocasionalmente nos encontramos con algunos problemas si abandonábamos la zona o iniciábamos movimientos ligeramente fuera del área real del touchpad. En contraste con la barra táctil, sin embargo, esto es sólo un punto de crítica menor. El panel OLED opcional también está equipado con una pantalla táctil capacitiva y funciona perfectamente.
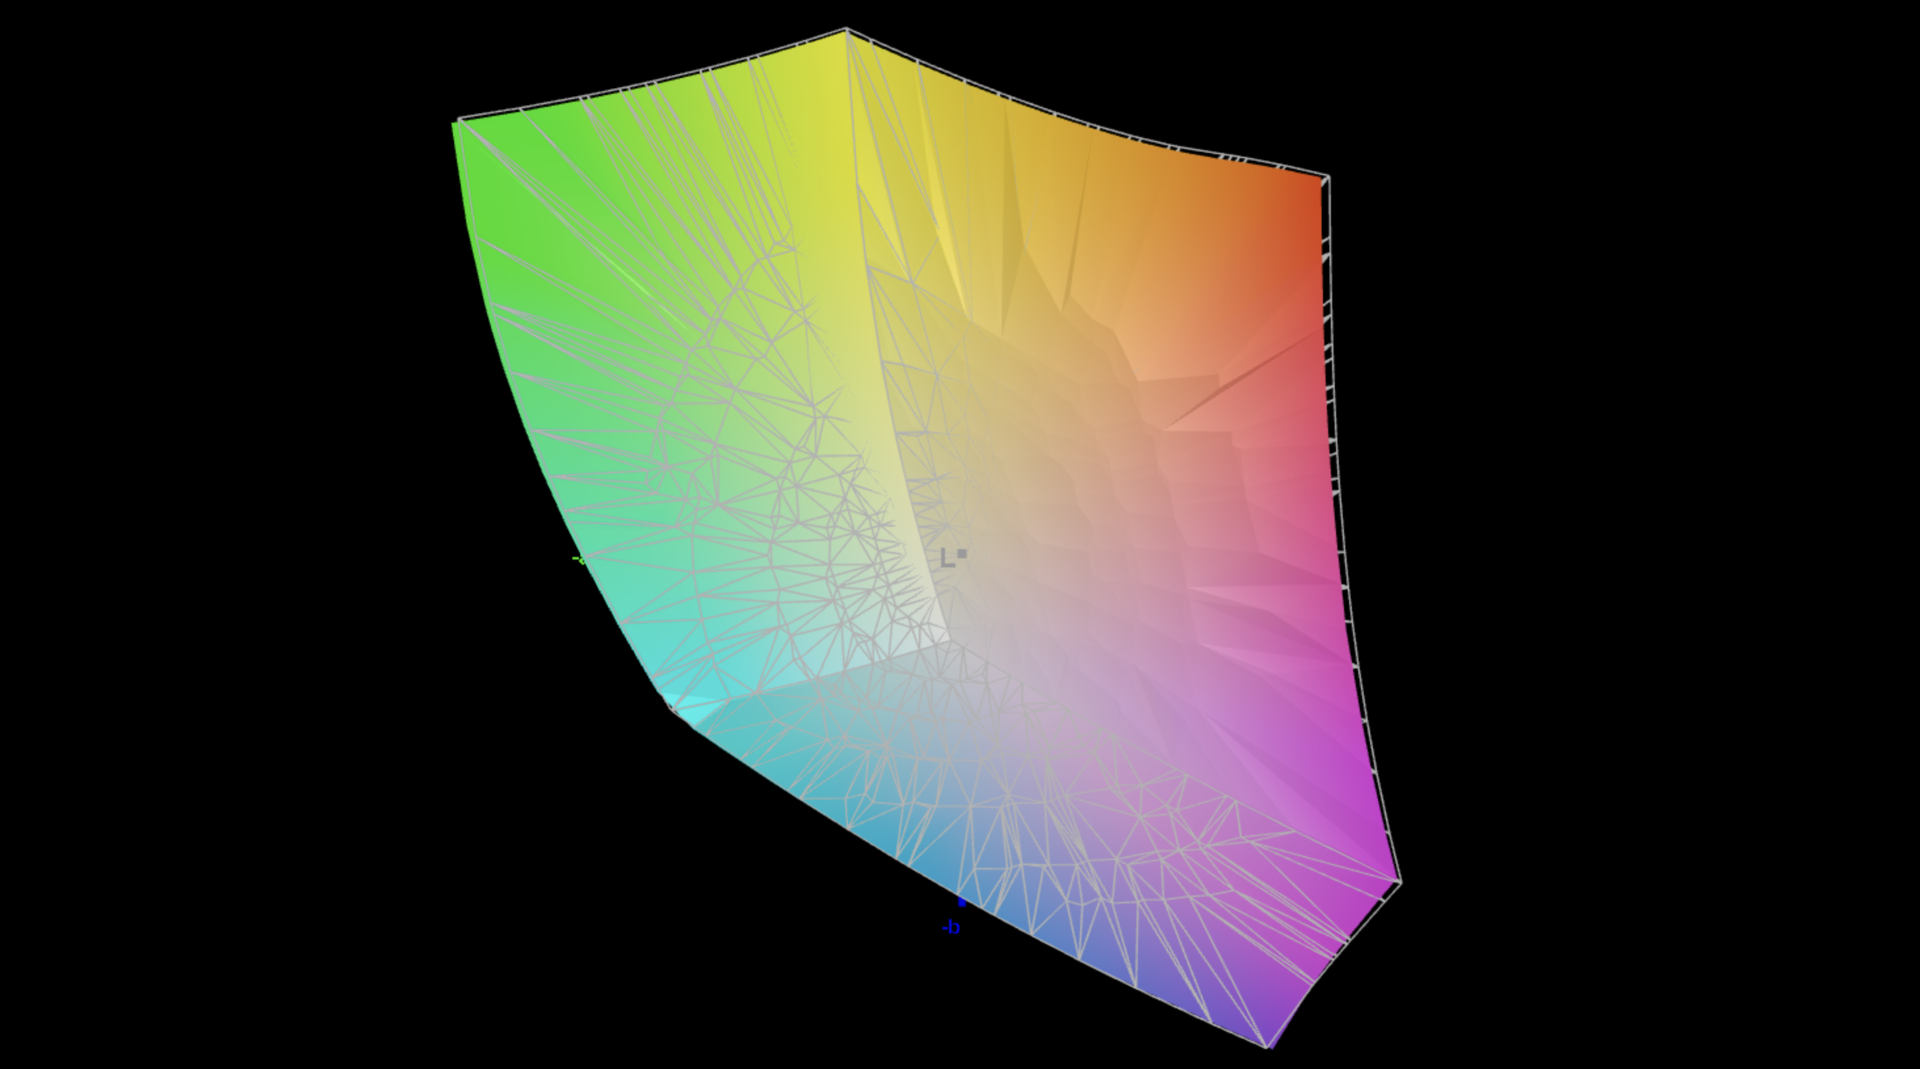
Pantalla - OLED 4K a 90 Hz
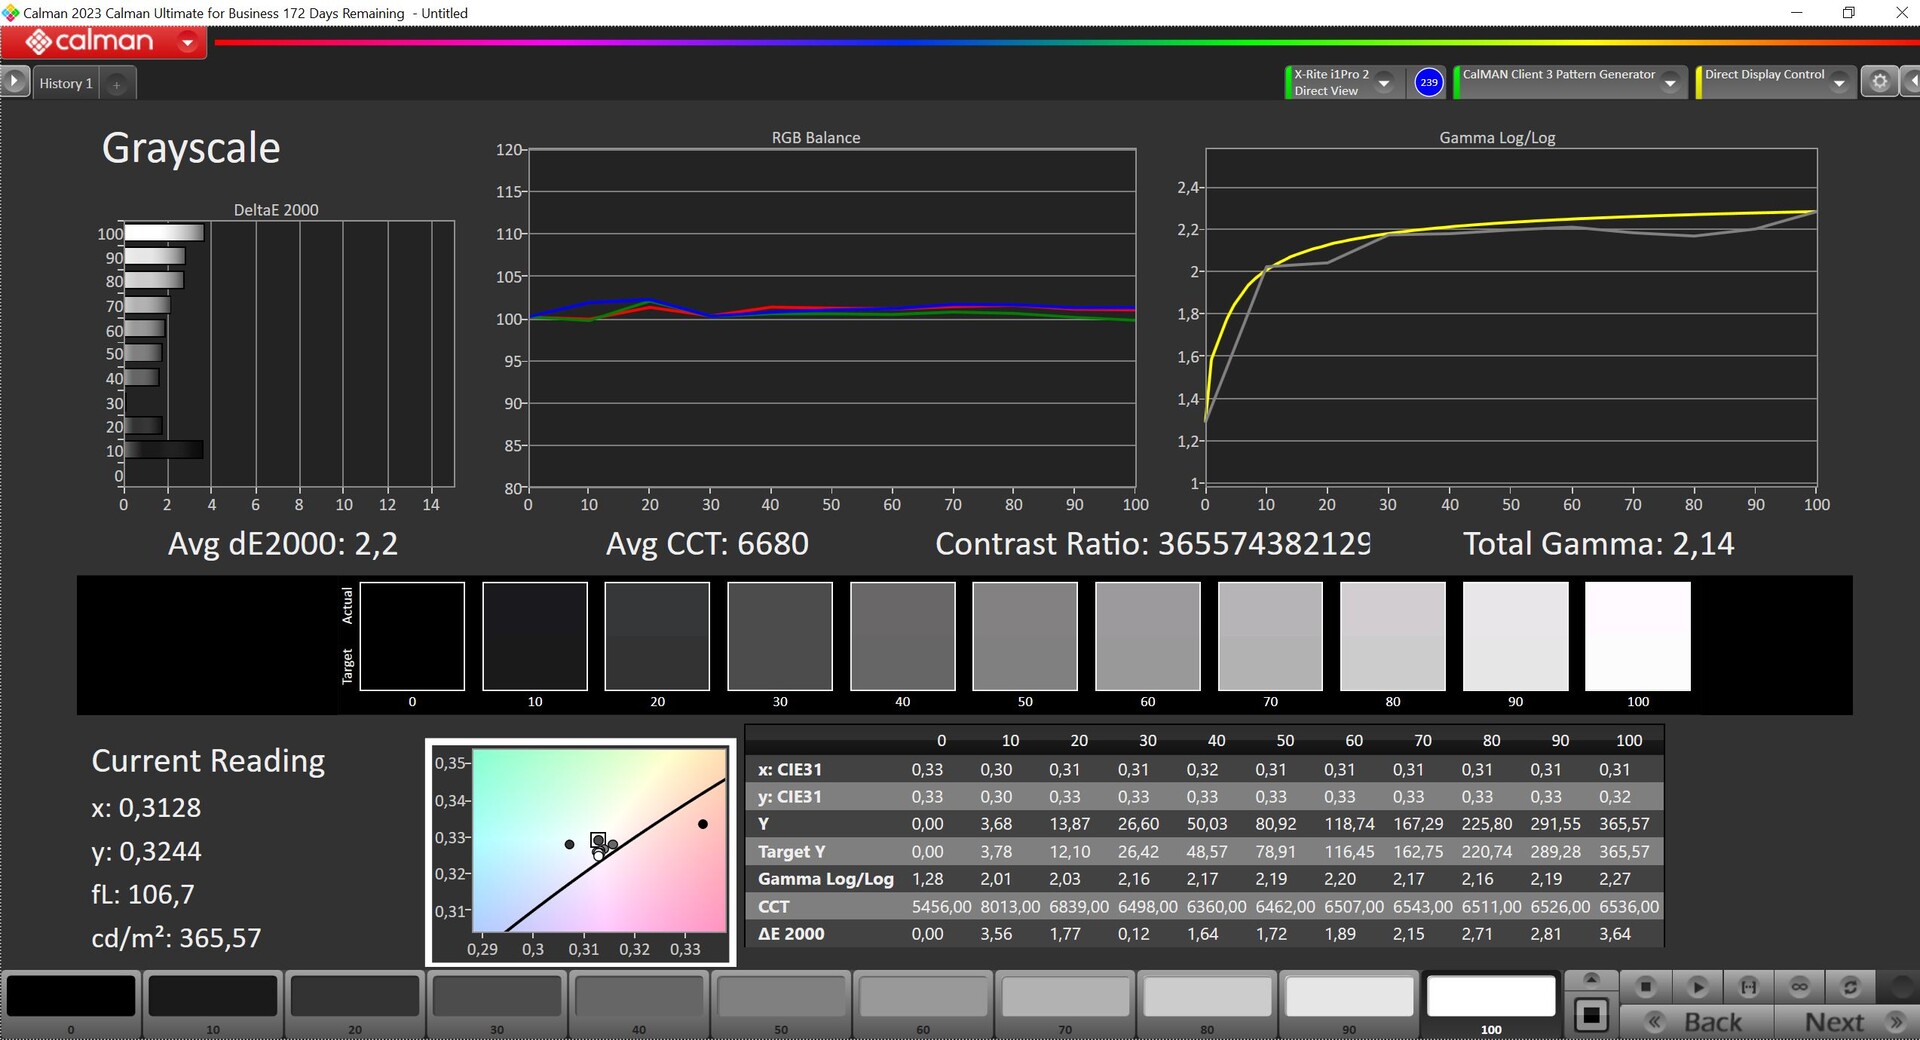
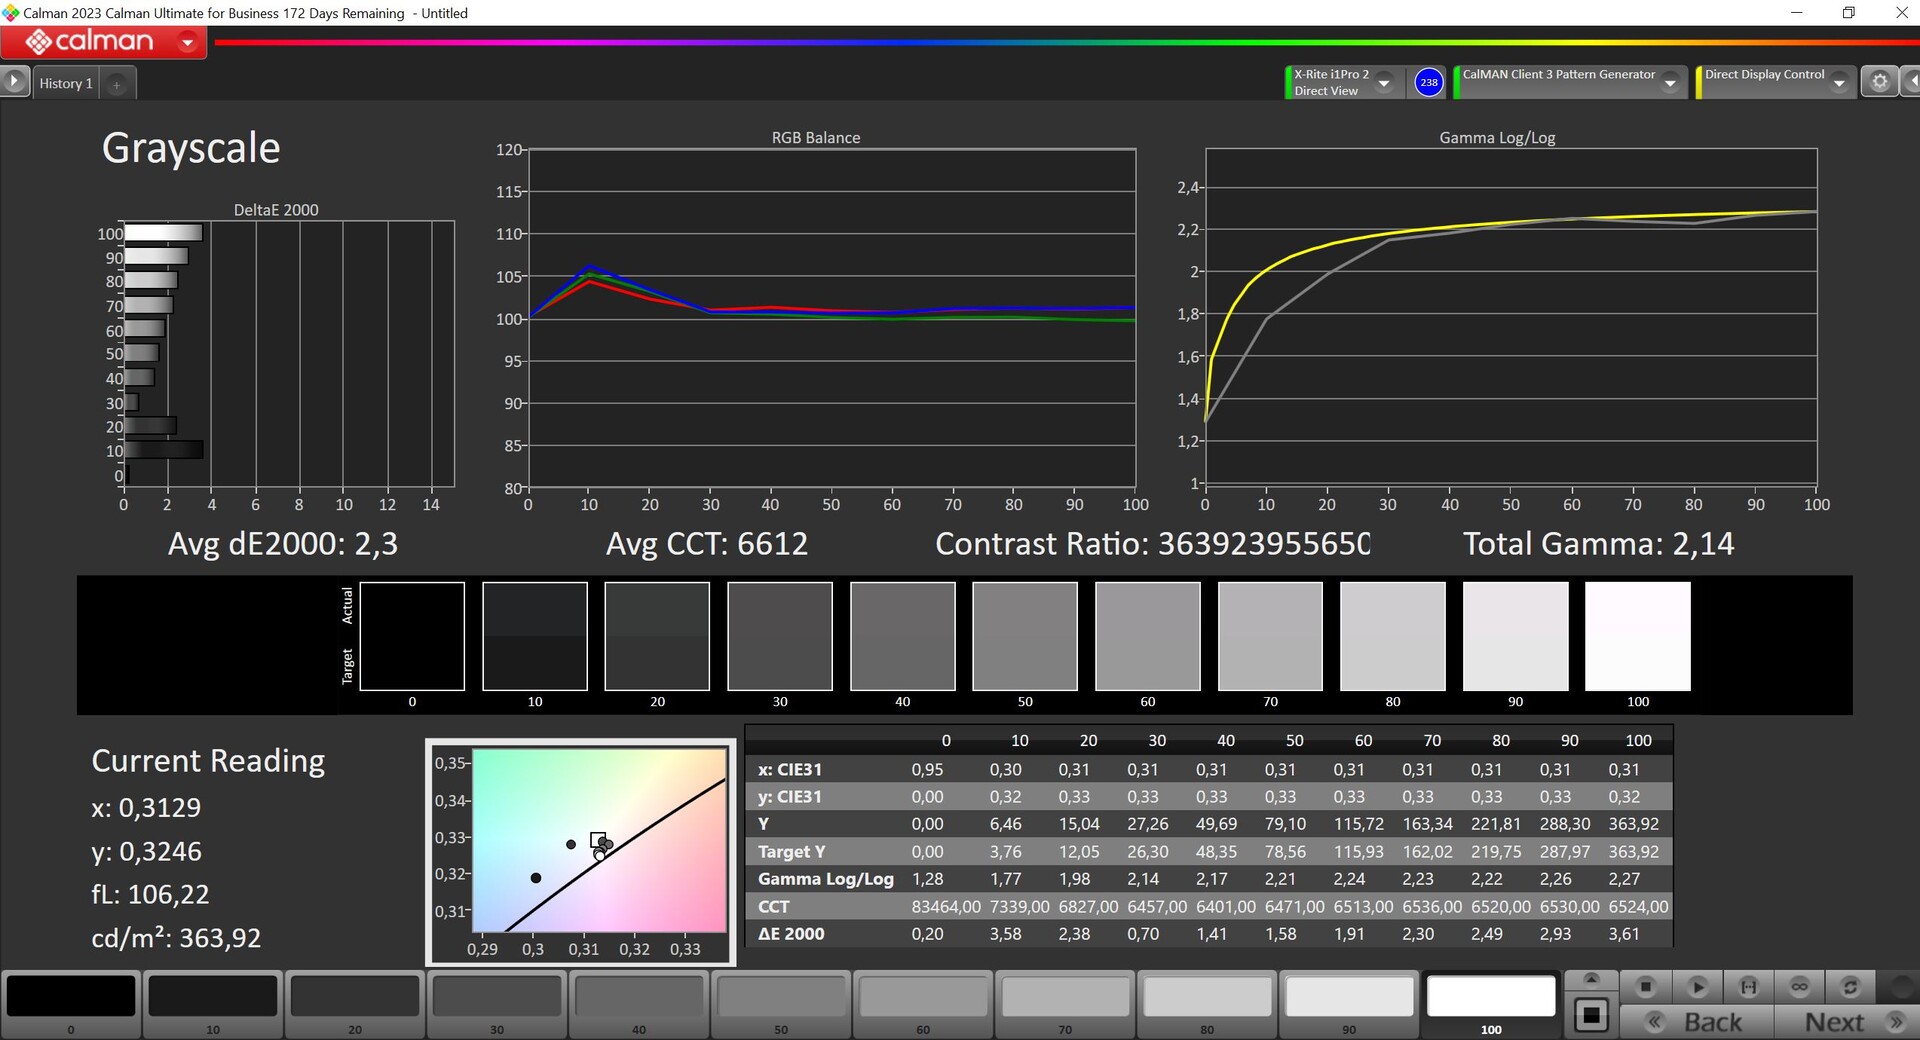
Dell ofrece dos paneles diferentes de 16,3 pulgadas con superficie reflectante para su nuevo XPS 16. De serie se instala un modelo de 1080p (500 cd/m²) sin pantalla táctil, pero por 300 dólares adicionales, puede obtener una pantalla táctil OLED de Samsung con una resolución de 3.840 x 2.400 píxeles, que es también la que lleva instalada nuestro dispositivo de prueba. A pesar de su buena calidad de imagen subjetiva, el panel del XPS 16 muestra algunas desventajas en comparación con la última generación OLED de Samsung (que está instalada en el Galaxy Book4 Ultra, por ejemplo), a pesar de su mayor resolución. En primer lugar, su frecuencia de refresco es de sólo 90 Hz en lugar de 120 Hz y puede apreciarse un efecto de trama cuando se visualizan contenidos brillantes. El Dell XPS 16 también se queda ligeramente atrás en lo que respecta a su brillo SDR máximo, con una media de ~367 cd/m². Su valor de negro es 0, lo que lleva a una relación de contraste extremadamente alta. Observamos un máximo de 580 cd/m² en modo HDR (que debe activarse manualmente). Pudimos detectar PWM con una frecuencia de 360 Hz en todos los niveles de brillo de 0-90%.
| |||||||||||||||||||||||||
iluminación: 96 %
Brillo con batería: 366 cd/m²
Contraste: ∞:1 (Negro: 0 cd/m²)
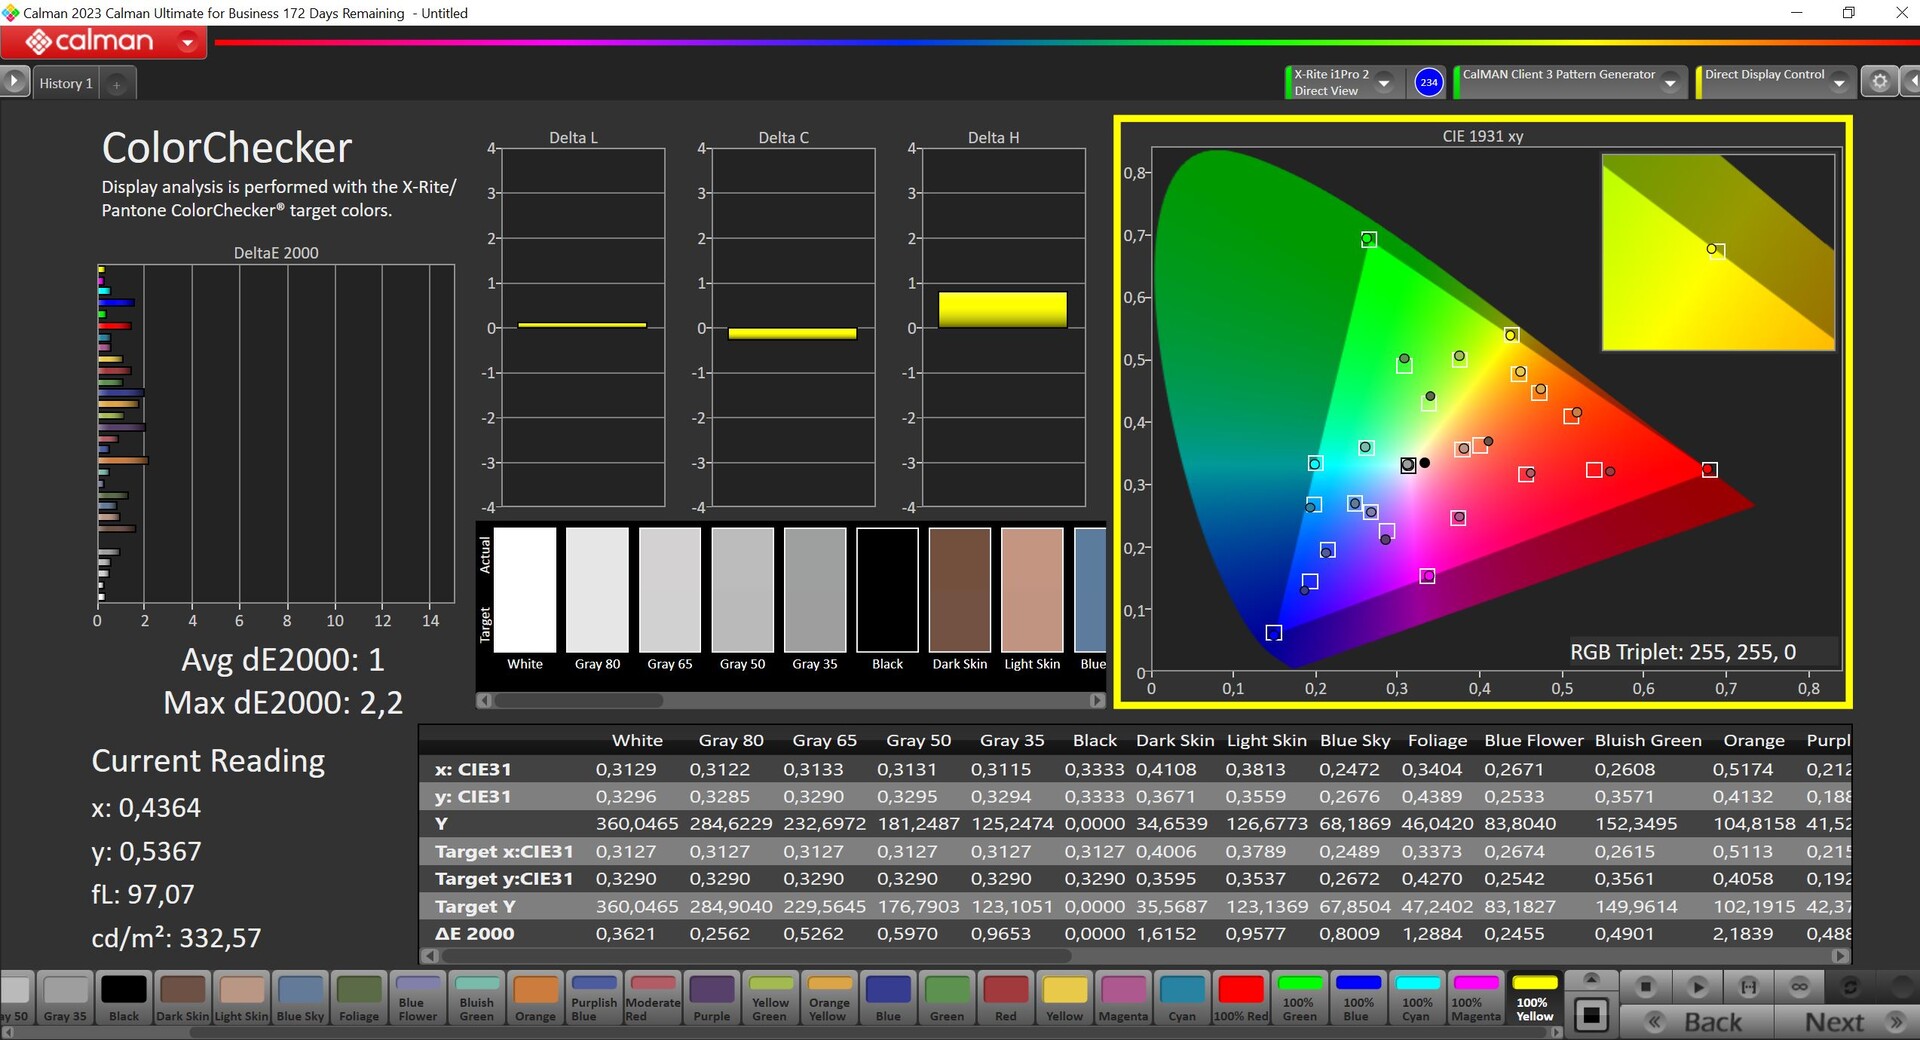
ΔE ColorChecker Calman: 1.3 | ∀{0.5-29.43 Ø4.71}
calibrated: 1
ΔE Greyscale Calman: 2.2 | ∀{0.09-98 Ø4.96}
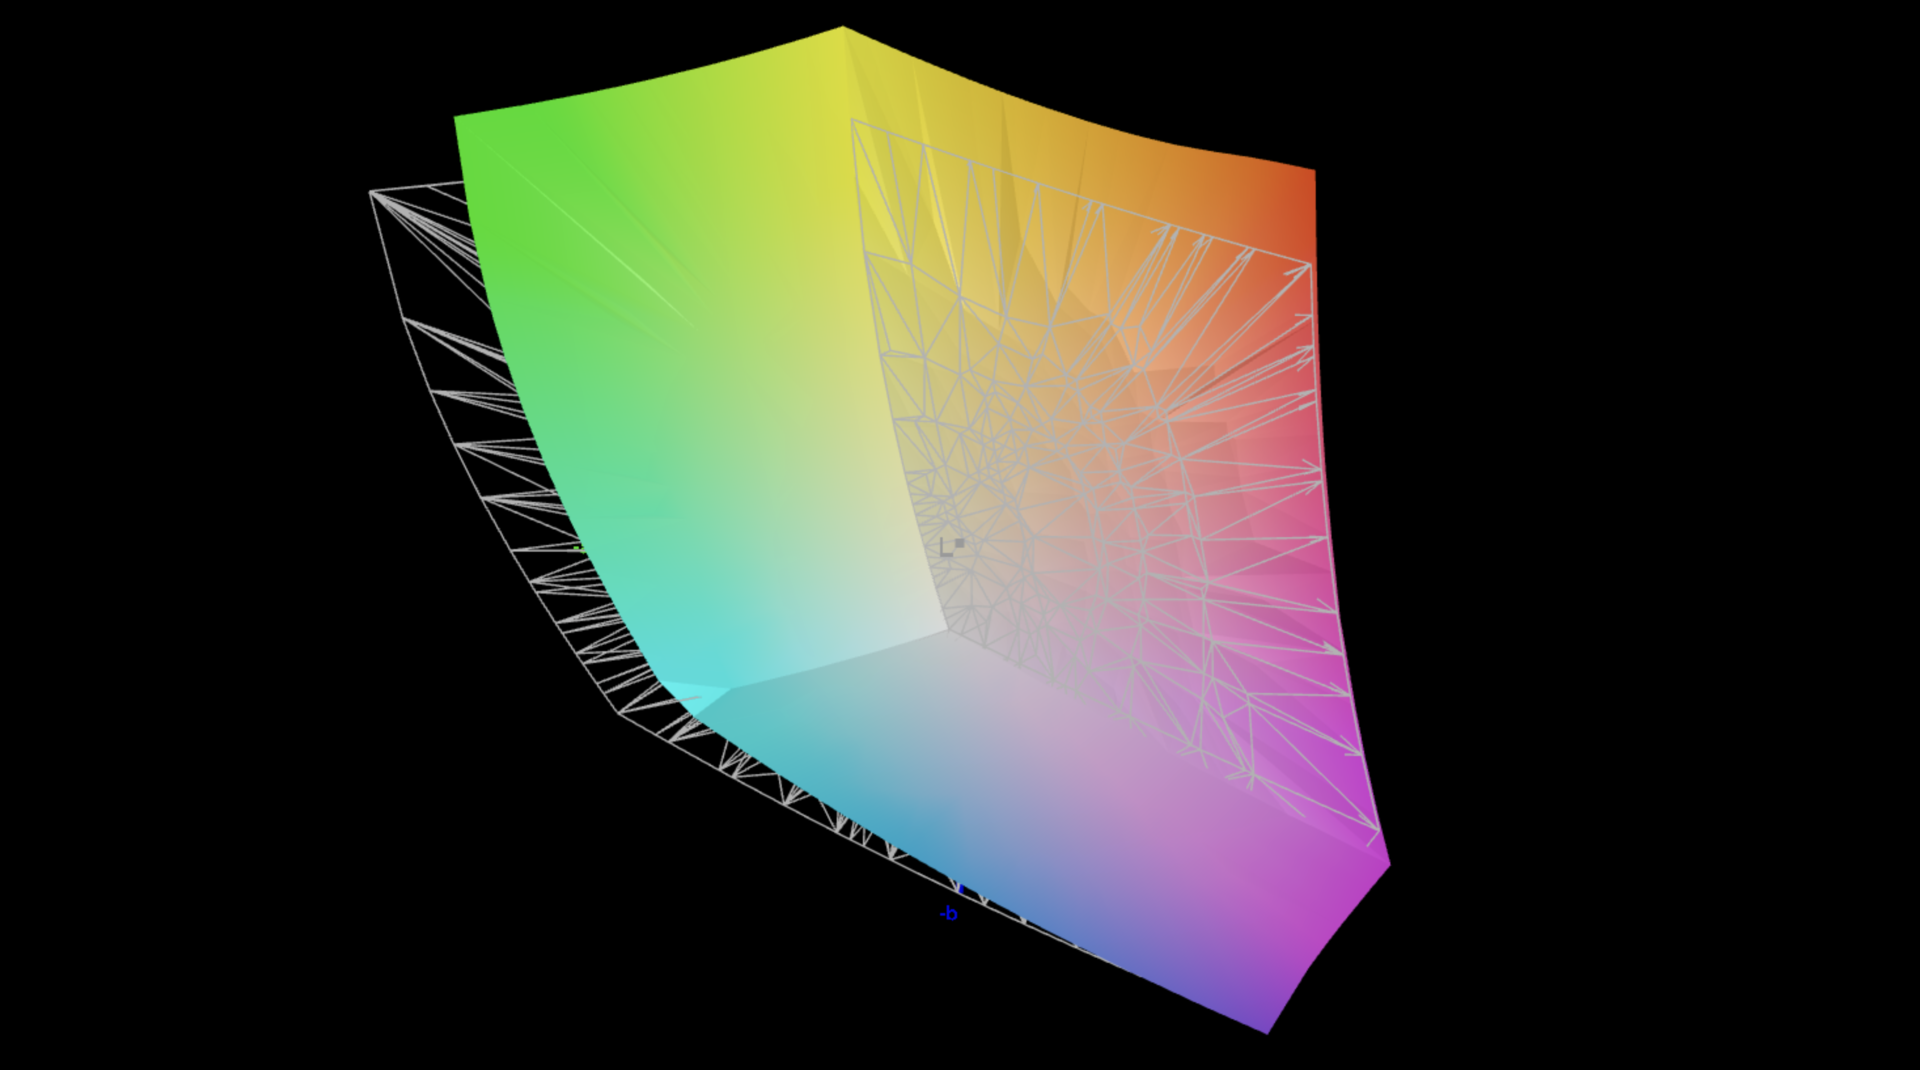
87.8% AdobeRGB 1998 (Argyll 3D)
100% sRGB (Argyll 3D)
98.3% Display P3 (Argyll 3D)
Gamma: 2.14
CCT: 6680 K
| Dell XPS 16 9640 SDC4196, OLED, 3840x2400, 16.3" | Samsung Galaxy Book4 Ultra ATNA60CL07-0, OLED, 2880x1800, 16" | Honor MagicBook Pro 16 2024 TL160MDMP01, IPS, 3072x1920, 16" | Asus ROG Zephyrus G16 2024 GU605M ATNA60DL01-0, OLED, 2560x1600, 16" | Lenovo Yoga Pro 9 16-IRP G8 LEN160-3.2K, Mini-LED, 3200x2000, 16" | Schenker VISION 16 Pro (M23) NE160QDM-NZ1, IPS, 2560x1600, 16" | Dell XPS 15 9530 RTX 4070 Samsung 156XG01, OLED, 3456x2160, 15.6" | |
|---|---|---|---|---|---|---|---|
| Display | 0% | 1% | 4% | 2% | -17% | 5% | |
| Display P3 Coverage (%) | 98.3 | 98.6 0% | 98.8 1% | 99.9 2% | 97 -1% | 68.8 -30% | 99.8 2% |
| sRGB Coverage (%) | 100 | 99.9 0% | 100 0% | 100 0% | 99.8 0% | 98.8 -1% | 100 0% |
| AdobeRGB 1998 Coverage (%) | 87.8 | 88.5 1% | 89.1 1% | 96.9 10% | 95.1 8% | 70 -20% | 98.4 12% |
| Response Times | 27% | -614% | 72% | -1295% | -1212% | -117% | |
| Response Time Grey 50% / Grey 80% * (ms) | 0.82 ? | 0.54 ? 34% | 6.3 ? -668% | 0.22 ? 73% | 14 ? -1607% | 13.7 ? -1571% | 1.68 ? -105% |
| Response Time Black / White * (ms) | 0.85 ? | 0.69 ? 19% | 5.6 ? -559% | 0.25 ? 71% | 9.2 ? -982% | 8.1 ? -853% | 1.94 ? -128% |
| PWM Frequency (Hz) | 360 ? | 240 ? | 960 ? | 5800 ? | 239 | ||
| Screen | 6% | 5% | 4% | 22% | -58% | -64% | |
| Brightness middle (cd/m²) | 366 | 390 7% | 551 51% | 416 14% | 539 47% | 384 5% | 389.5 6% |
| Brightness (cd/m²) | 367 | 393 7% | 524 43% | 418 14% | 546 49% | 371 1% | 392 7% |
| Brightness Distribution (%) | 96 | 98 2% | 91 -5% | 96 0% | 96 0% | 88 -8% | 98 2% |
| Black Level * (cd/m²) | 0.52 | 0.18 | 0.3 | ||||
| Colorchecker dE 2000 * | 1.3 | 1.4 -8% | 1.7 -31% | 1.6 -23% | 1.4 -8% | 3.4 -162% | 4.95 -281% |
| Colorchecker dE 2000 max. * | 3.6 | 2.7 25% | 4.1 -14% | 2.1 42% | 2.1 42% | 9.2 -156% | 8.65 -140% |
| Colorchecker dE 2000 calibrated * | 1 | 1 -0% | 1.3 -30% | 1.53 -53% | |||
| Greyscale dE 2000 * | 2.2 | 2.1 5% | 2.4 -9% | 2.7 -23% | 2.2 -0% | 3.4 -55% | 2 9% |
| Gamma | 2.14 103% | 2.27 97% | 2.2 100% | 2.16 102% | 2.19 100% | 2.16 102% | 2.27 97% |
| CCT | 6680 97% | 6431 101% | 6842 95% | 6331 103% | 6479 100% | 7462 87% | 6265 104% |
| Contrast (:1) | 1060 | 2994 | 1280 | ||||
| Media total (Programa/Opciones) | 11% /
8% | -203% /
-99% | 27% /
16% | -424% /
-223% | -429% /
-240% | -59% /
-56% |
* ... más pequeño es mejor
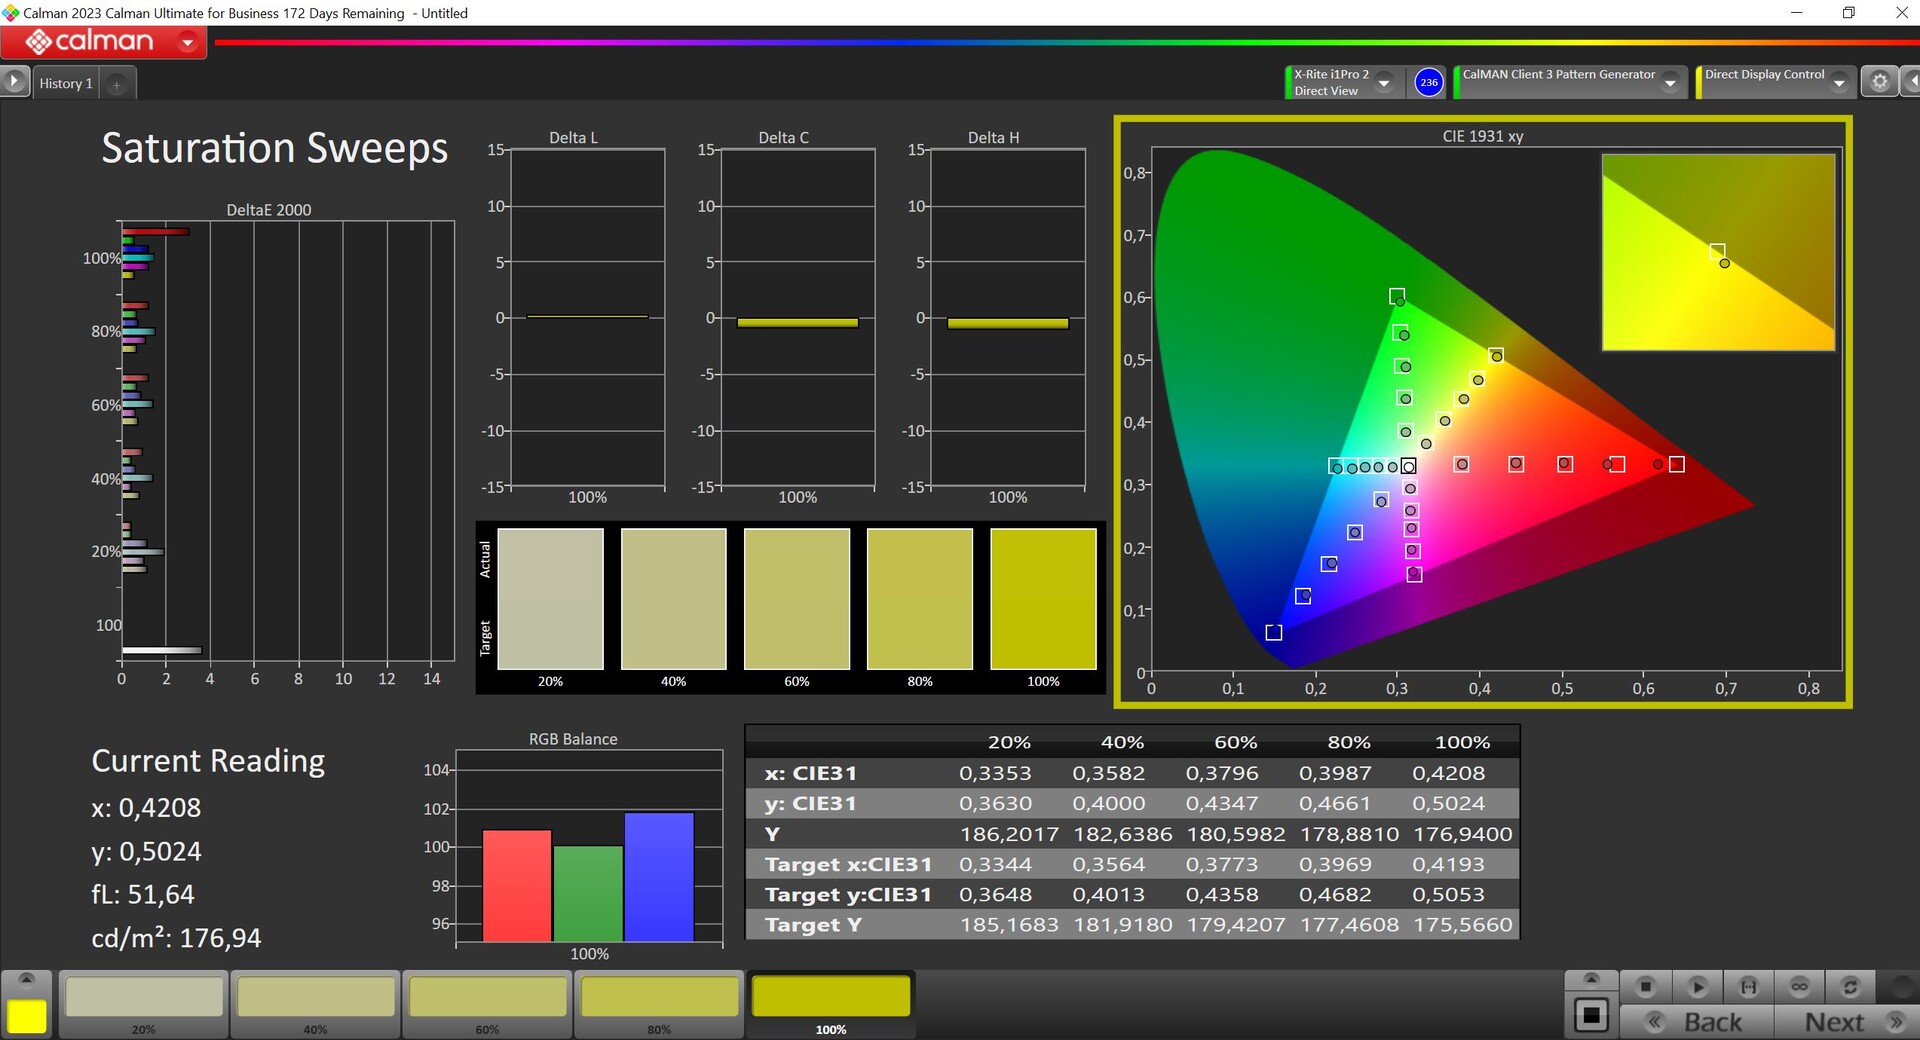
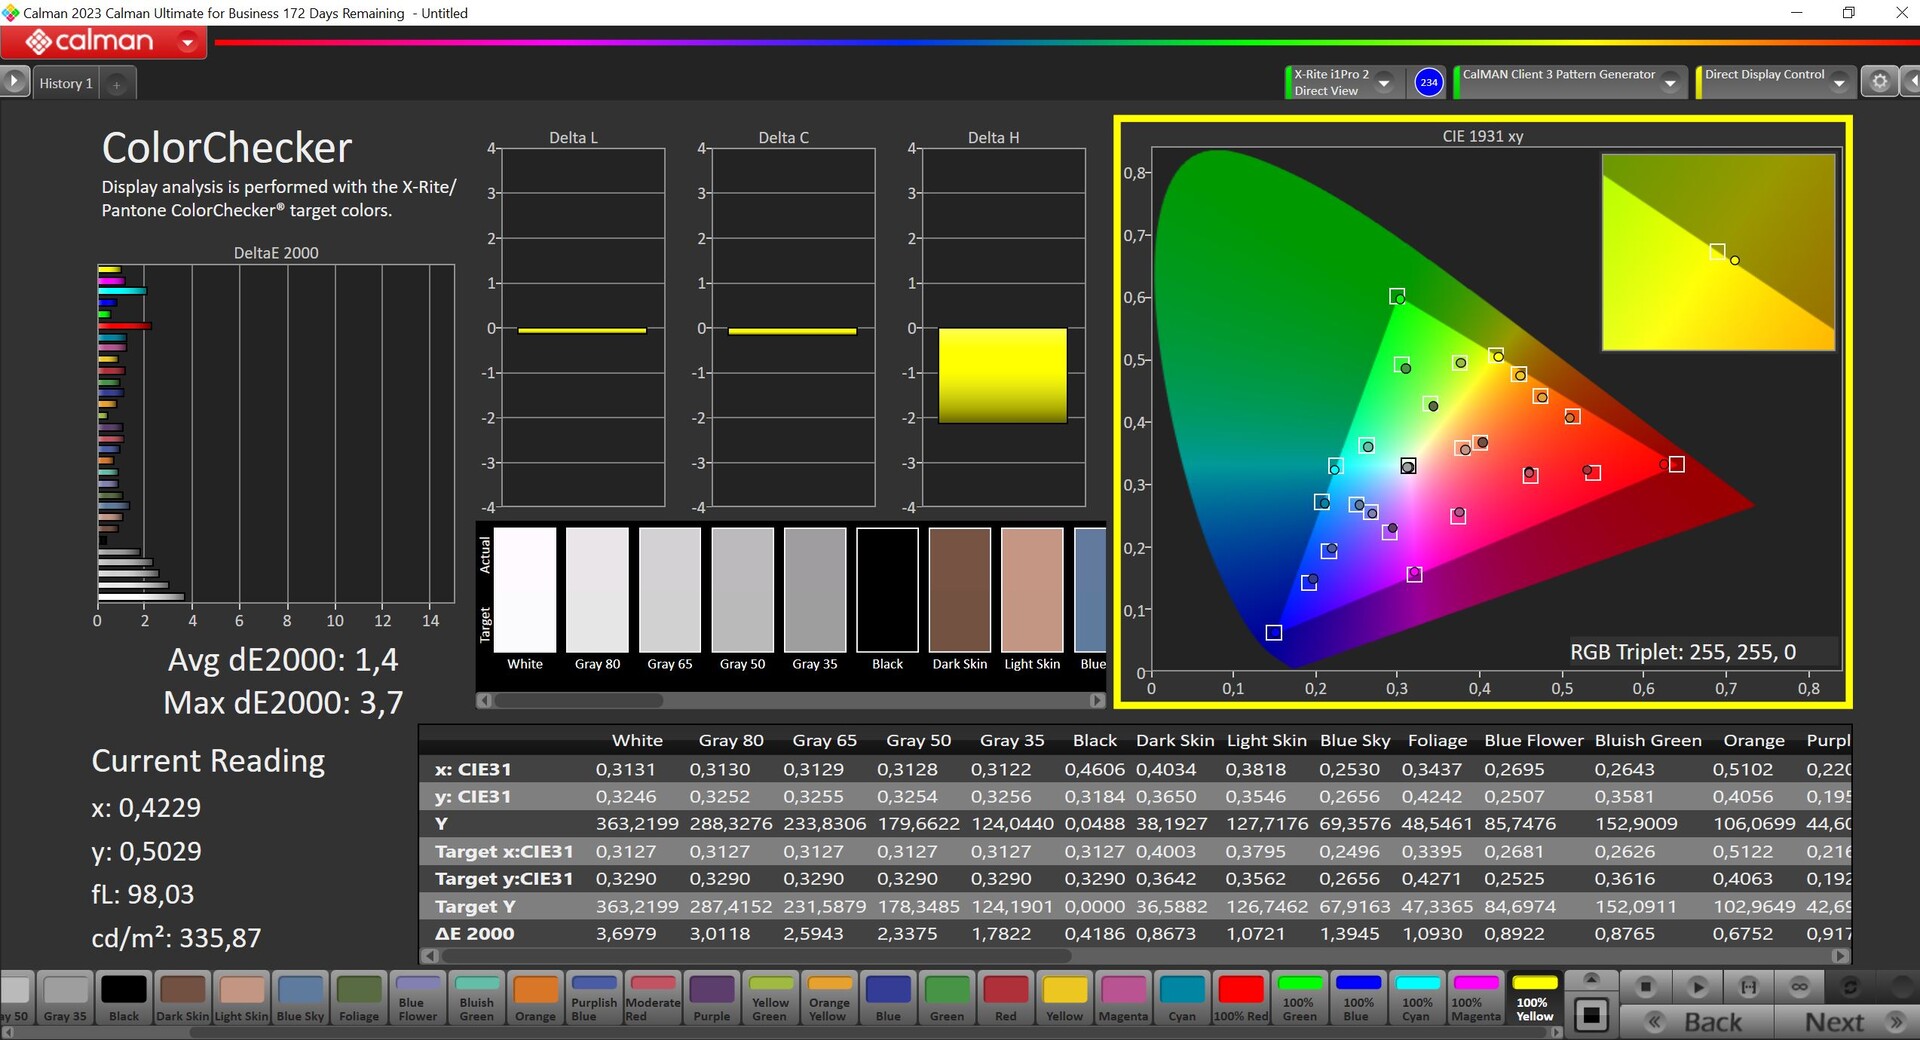
Analizamos el panel utilizando el software profesional CalMAN (X-Rite i1 Pro 2). Dell ofrece diferentes perfiles de color y el perfil preseleccionado Vivid ya ofrece colores muy precisos; sólo los tonos grises muestran aún algunas ligeras desviaciones. Utilizando nuestra propia calibración (puede descargar el perfil correspondiente de forma gratuita más arriba), pudimos mejorar aún más la representación. Si le gusta editar fotos, entonces disfrutará del preciso perfil Internet, que limita el espacio de color a sRGB.


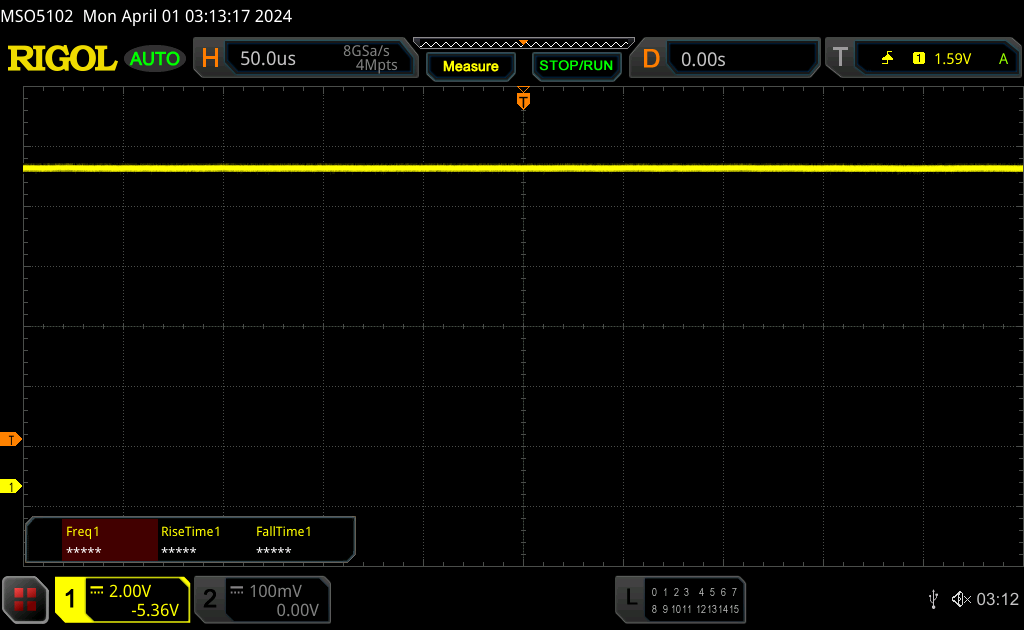
Tiempos de respuesta del display
| ↔ Tiempo de respuesta de Negro a Blanco | ||
|---|---|---|
| 0.85 ms ... subida ↗ y bajada ↘ combinada | ↗ 0.46 ms subida |  |
| ↘ 0.39 ms bajada | ||
| La pantalla mostró tiempos de respuesta muy rápidos en nuestros tests y debería ser adecuada para juegos frenéticos. En comparación, todos los dispositivos de prueba van de ##min### (mínimo) a 240 (máximo) ms. » 3 % de todos los dispositivos son mejores. Esto quiere decir que el tiempo de respuesta medido es mejor que la media (19.8 ms) de todos los dispositivos testados. | ||
| ↔ Tiempo de respuesta 50% Gris a 80% Gris | ||
| 0.82 ms ... subida ↗ y bajada ↘ combinada | ↗ 0.43 ms subida |  |
| ↘ 0.39 ms bajada | ||
| La pantalla mostró tiempos de respuesta muy rápidos en nuestros tests y debería ser adecuada para juegos frenéticos. En comparación, todos los dispositivos de prueba van de ##min### (mínimo) a 636 (máximo) ms. » 3 % de todos los dispositivos son mejores. Esto quiere decir que el tiempo de respuesta medido es mejor que la media (30.9 ms) de todos los dispositivos testados. | ||
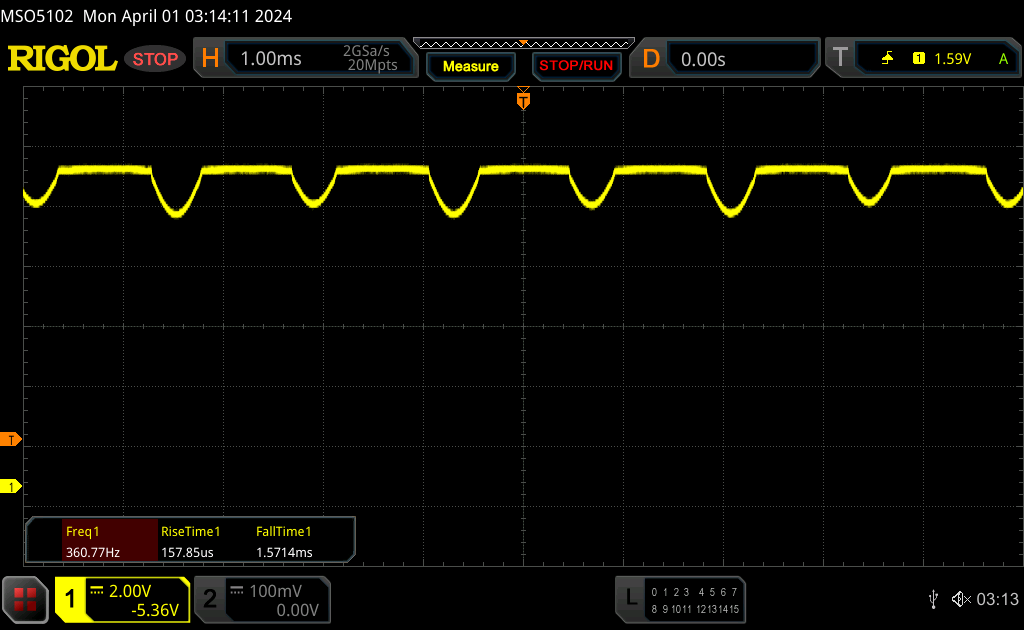
Parpadeo de Pantalla / PWM (Pulse-Width Modulation)
| Parpadeo de Pantalla / PWM detectado | 360 Hz | ≤ 90 % de brillo |  |
La retroiluminación del display parpadea a 360 Hz (seguramente usa PWM - Pulse-Width Modulation) a un brillo del 90 % e inferior. Sobre este nivel de brillo no debería darse parpadeo / PWM. La frecuencia de 360 Hz es relativamente alta, por lo que la mayoría de gente no debería ver parpadeo o tener fatiga visual. Sin embargo, hay informes de que algunas personas pueden seguir viendo parpadeos a 500 Hz y superior, por lo que cuidado. Comparación: 52 % de todos los dispositivos testados no usaron PWM para atenuar el display. Si se usó, medimos una media de 7748 (mínimo: 5 - máxmo: 343500) Hz. | |||
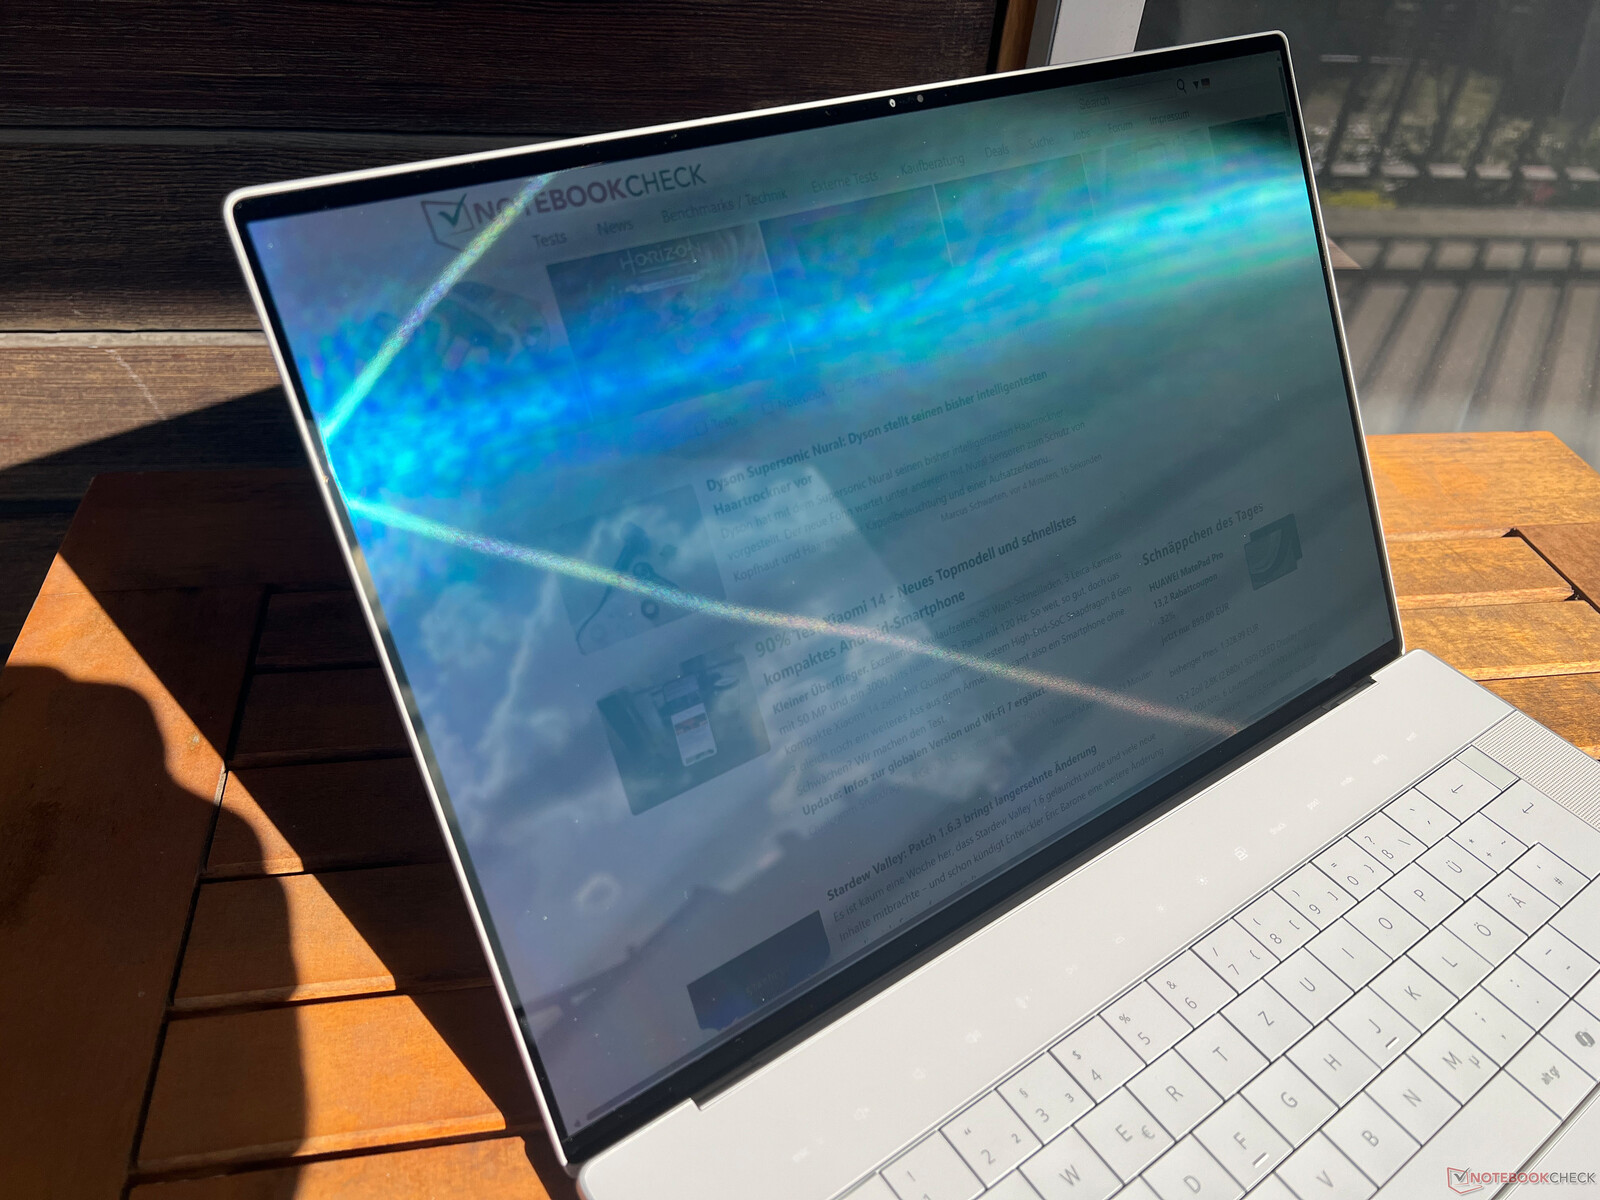
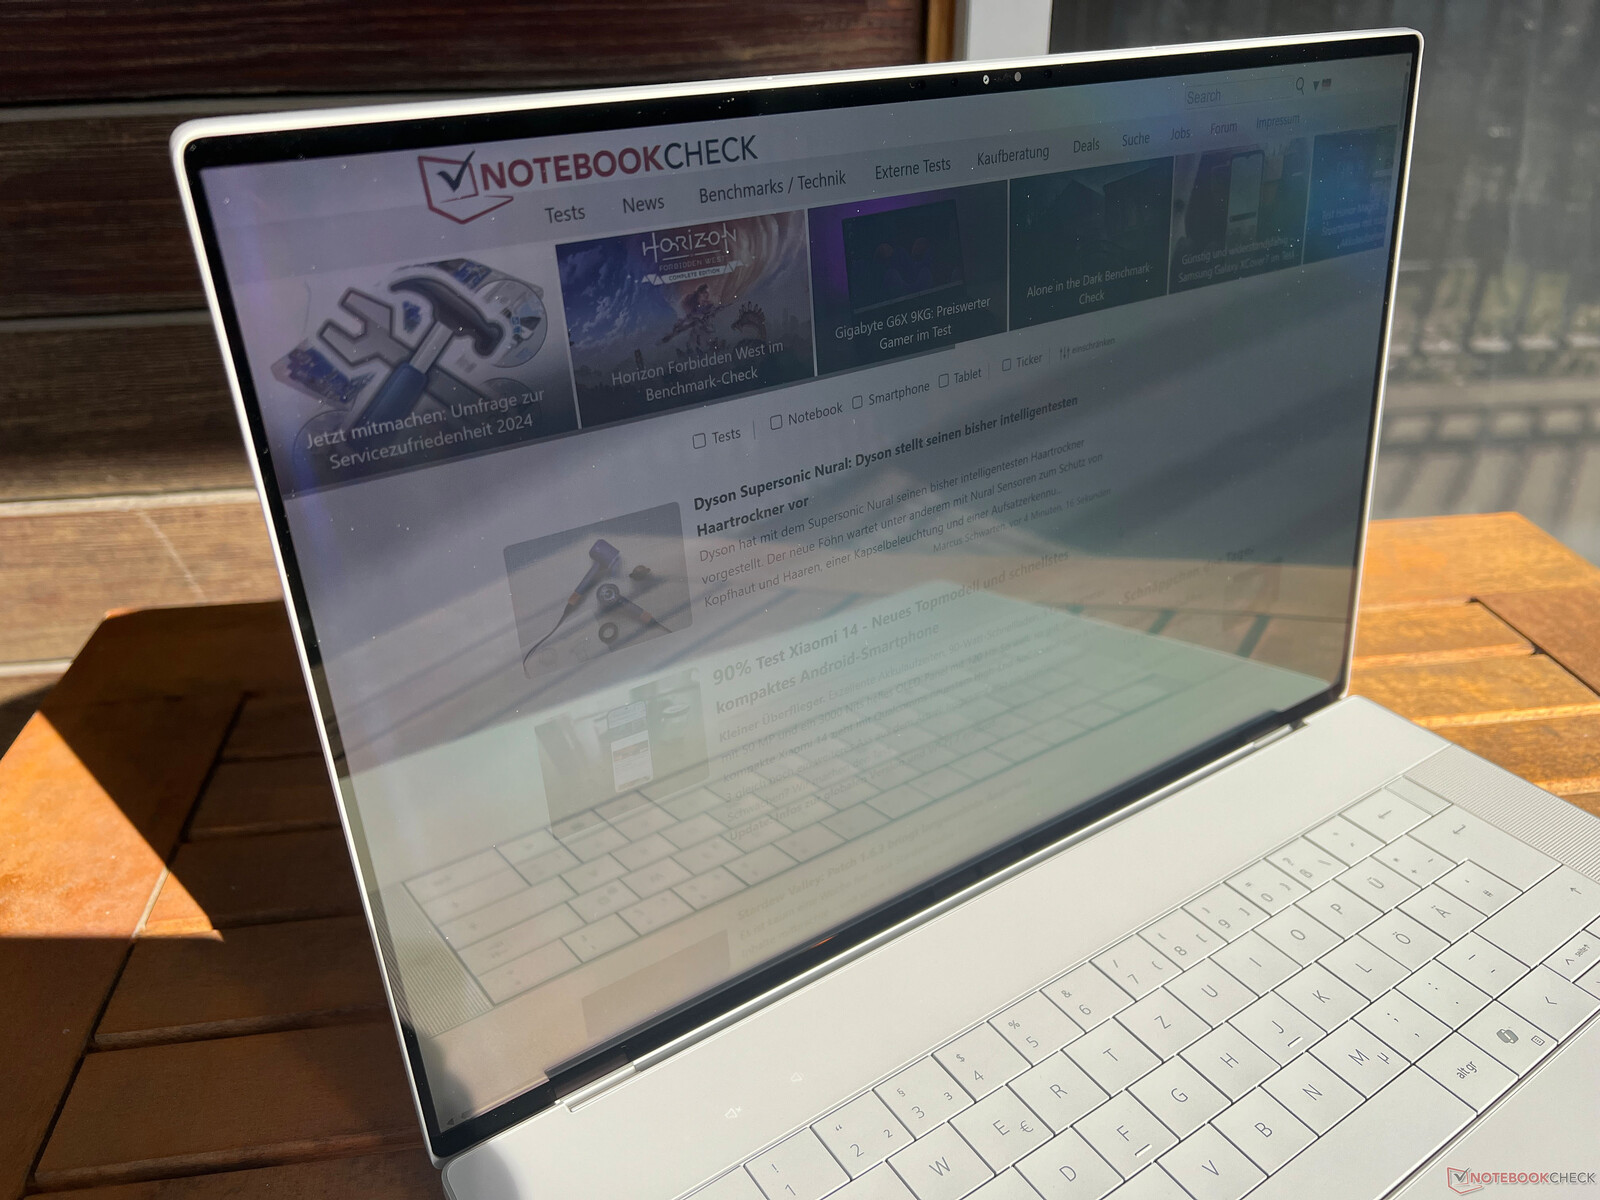
La pantalla táctil es muy reflectante y los reflejos también pueden ser un problema en interiores. En exteriores, también tendrá que intentar evitar los reflejos de fuentes de luz o superficies brillantes. Es posible utilizar el portátil en días nublados, pero puede resultar problemático en días brillantes con mucha luz solar. La estabilidad de su ángulo de visión es en general muy buena, pero si hay grandes desviaciones del centro de la pantalla, puede apreciarse el típico brillo azul OLED.

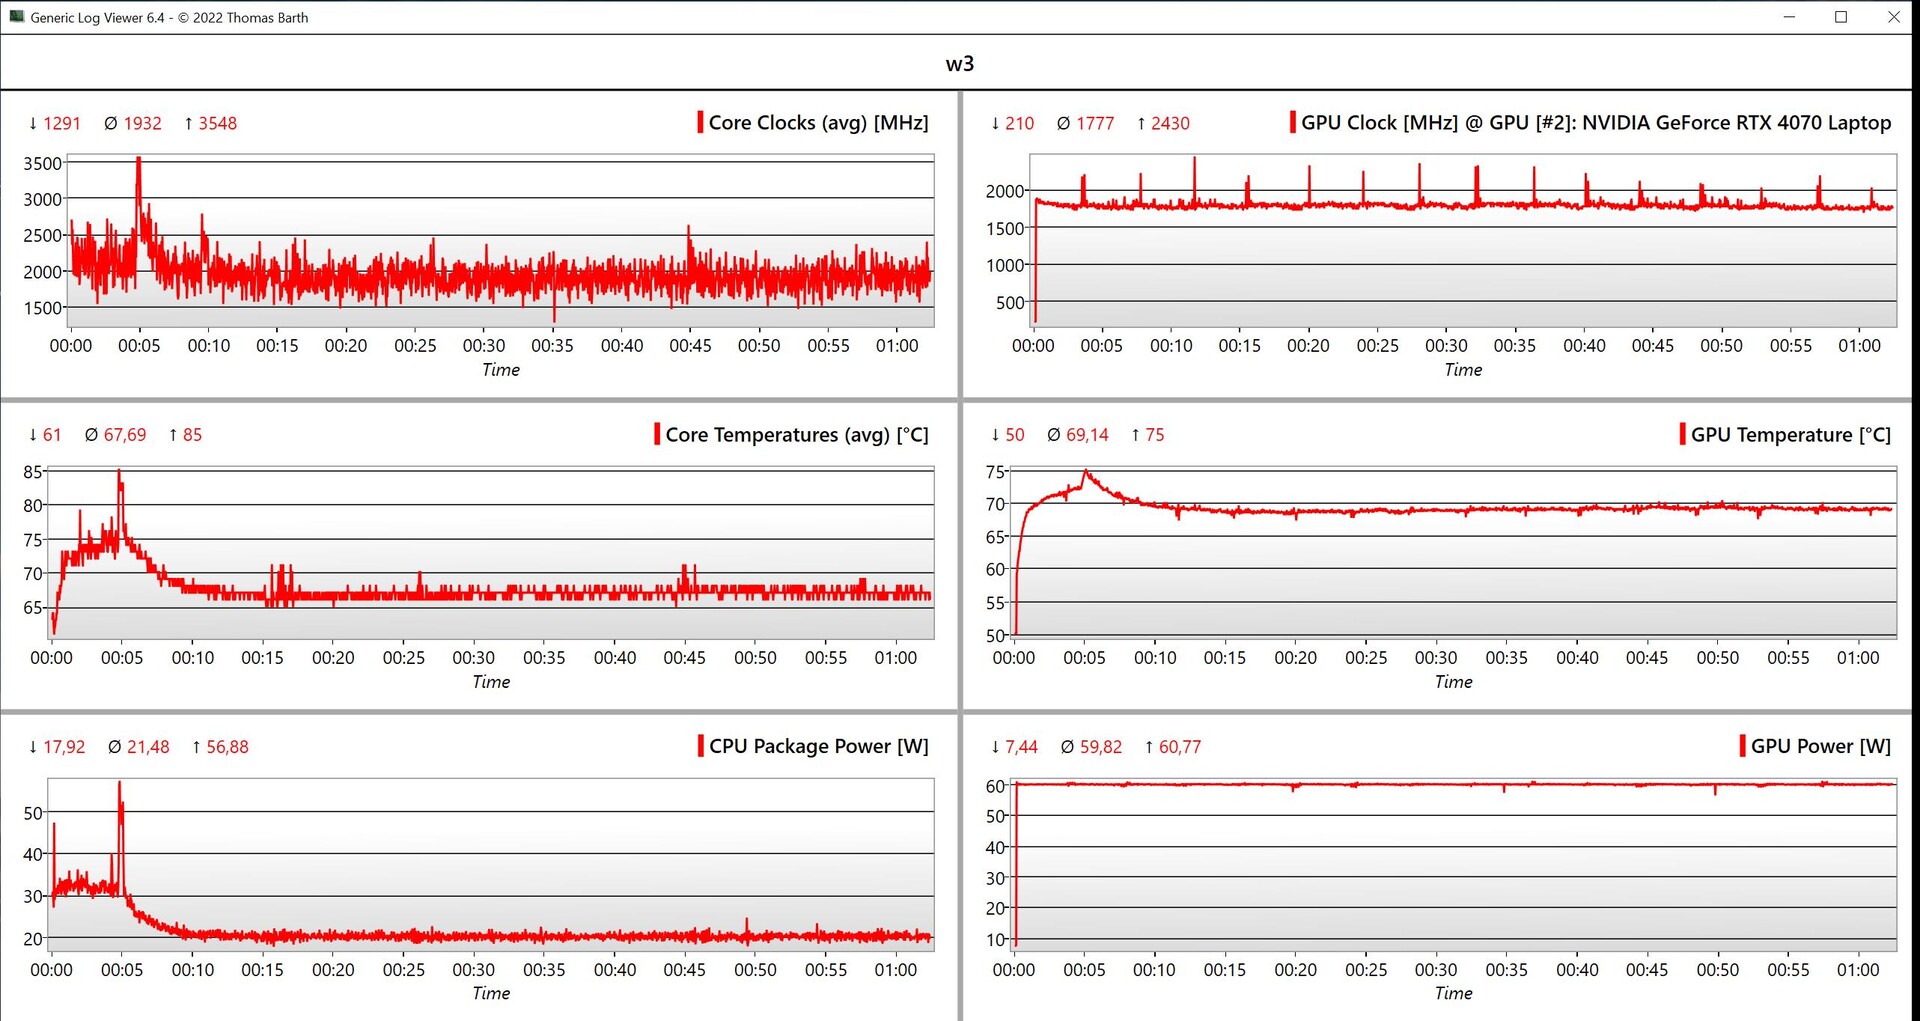
Rendimiento - El XPS 16 con Advanced Optimus y hasta 64 GB de RAM
Al igual que con el XPS 14el nuevo XPS 16 puede configurarse sin tarjeta gráfica dedicada, pero sólo junto con 16 GB de RAM (LPDDR5x-6400). la RAM de 32 GB solo está disponible junto con GPU dedicadas, y la RAM más rápida LPDDR5x-7467 solo puede seleccionarse junto con la tarjeta gráfica Portátil RTX 4070. Si desea 64 GB de RAM, también tendrá que elegir el modelo Core Ultra 9 185H y al menos el Portátil RTX 4060. El XPS 16 está equipado con un conmutador MUX y conmutación gráfica Advanced Optimus.
Condiciones de prueba
Dell permite a los usuarios seleccionar varios perfiles de energía que también pueden combinarse con los ajustes de rendimiento de Windows. El perfil predeterminado es Optimizado, pero el pleno rendimiento de la tarjeta gráfica sólo está disponible utilizando el modo Ultra Rendimiento. Dado que las emisiones de ruido del ventilador son muy similares utilizando estos dos perfiles, seleccionamos el modo Ultra Performance para nuestros puntos de referencia y mediciones.
| Perfil energético | Carga de la CPU | CB R23 Multi | Carga de la GPU | Time Spy gráficos | Cyberpunk 2077 QHD Ultra |
emisiones máximas de ruido del ventilador |
|---|---|---|---|---|---|---|
| Silencioso | 80 -> 75 vatios | 18.296 puntos | 50 vatios | 8.186 puntos | 30,8fps | 43,3 dB(A) |
| Optimizado | 80 -> 75 vatios | 18.248 puntos | 50 vatios | 8.532 puntos | 37,4fps | 48,1 dB(A) |
| Ultra Rendimiento | 100 -> 85 vatios | 18.518 puntos | 60 vatios | 9.638 puntos | 39,6fps | 49,7 dB(A) |
Durante nuestra prueba, nos encontramos con un error durante el proceso de cambio de gráficos, ya que V-Sync siempre estaba activo en el modo de pantalla completa. En modo ventana y al seleccionar manualmente la GPU Nvidia en el controlador gráfico, el problema no se produjo. Al conectar un monitor externo, la conmutación Optimus normal está activa (ya que todos los puertos Thunderbolt funcionan a través de la GPU Intel) y el problema también puede encontrarse aquí.
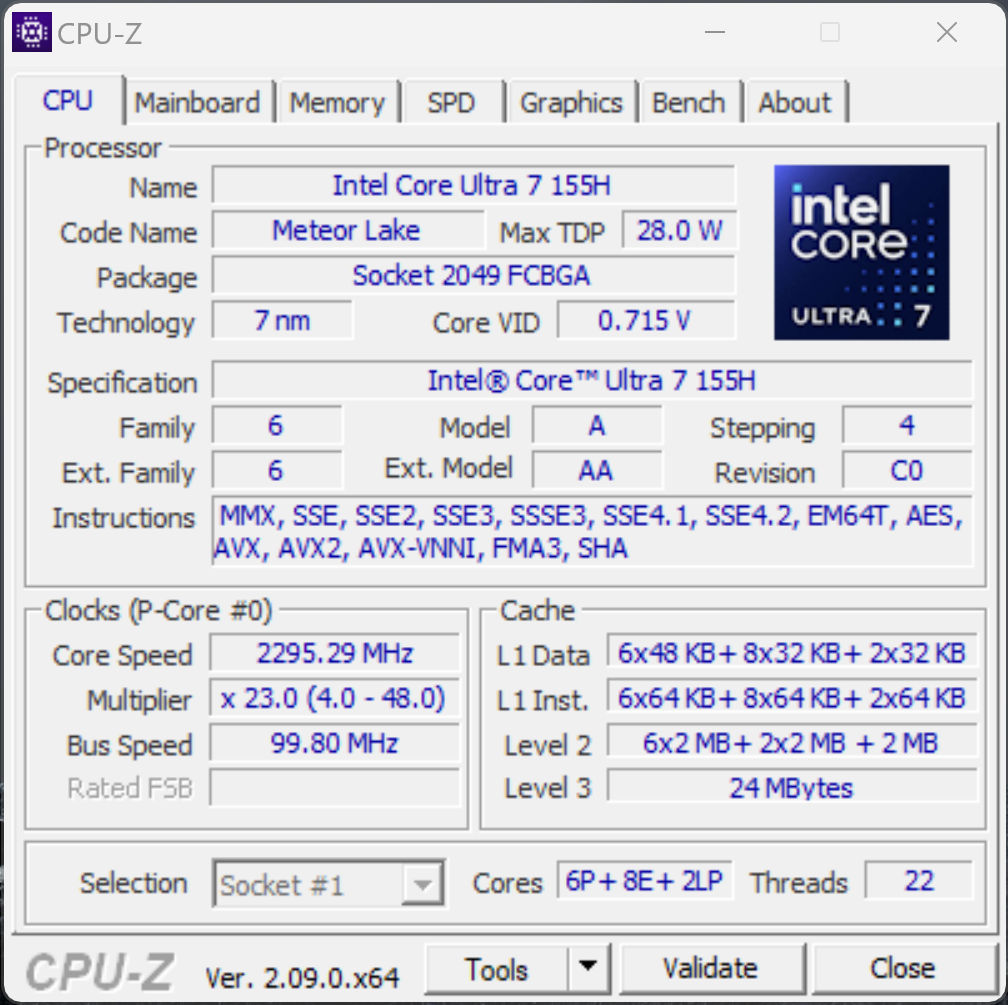
Procesador - Core Ultra 7 155H
El Core Ultra 7 155H forma parte de la actual generación Meteor Lake de Intel y sustituye al antiguo Core i7-13700H. Tiene 16 núcleos (22 hilos) y alcanza una velocidad máxima de reloj del núcleo de 4,8 GHz. Además, su rendimiento general multinúcleo también es excelente, gracias a sus elevados límites de potencia (100/85 vatios). Sin embargo, no hay prácticamente ninguna ventaja de rendimiento respecto a los antiguos chips Raptor Lake y las diferencias entre los distintos dispositivos se deben a los diferentes límites de potencia. Por otro lado, cuando se trata del rendimiento de un solo núcleo, los nuevos chips Meteor Lake tienen una ligera desventaja sobre los antiguos modelos Raptor Lake, como el 13700H. En uso con batería, el procesador puede consumir 75/45 vatios (con lo que los 75 vatios pueden mantenerse durante bastante tiempo) y su rendimiento multinúcleo solo desciende en torno a un 4 %. A su vez, las diferencias son mayores bajo periodos de carga más prolongados. Encontrará más pruebas comparativas de CPU en nuestra sección de tecnología.
Cinebench R15 Multi continuous test
Cinebench R23: Multi Core | Single Core
Cinebench R20: CPU (Multi Core) | CPU (Single Core)
Cinebench R15: CPU Multi 64Bit | CPU Single 64Bit
Blender: v2.79 BMW27 CPU
7-Zip 18.03: 7z b 4 | 7z b 4 -mmt1
Geekbench 6.7: Multi-Core | Single-Core
Geekbench 5.5: Multi-Core | Single-Core
HWBOT x265 Benchmark v2.2: 4k Preset
LibreOffice : 20 Documents To PDF
R Benchmark 2.5: Overall mean
| CPU Performance rating | |
| Lenovo Yoga Pro 9 16-IRP G8 | |
| Honor MagicBook Pro 16 2024 | |
| Dell XPS 16 9640 | |
| Media de la clase Multimedia | |
| Asus ROG Zephyrus G16 2024 GU605M | |
| Dell XPS 15 9530 RTX 4070 -2! | |
| Samsung Galaxy Book4 Ultra | |
| Schenker VISION 16 Pro (M23) -2! | |
| Medio Intel Core Ultra 7 155H | |
| Cinebench R23 / Multi Core | |
| Lenovo Yoga Pro 9 16-IRP G8 | |
| Honor MagicBook Pro 16 2024 | |
| Dell XPS 16 9640 | |
| Asus ROG Zephyrus G16 2024 GU605M | |
| Media de la clase Multimedia (4861 - 33362, n=65, últimos 2 años) | |
| Samsung Galaxy Book4 Ultra | |
| Dell XPS 15 9530 RTX 4070 | |
| Medio Intel Core Ultra 7 155H (9769 - 19007, n=52) | |
| Schenker VISION 16 Pro (M23) | |
| Cinebench R23 / Single Core | |
| Media de la clase Multimedia (1128 - 2459, n=64, últimos 2 años) | |
| Schenker VISION 16 Pro (M23) | |
| Lenovo Yoga Pro 9 16-IRP G8 | |
| Dell XPS 15 9530 RTX 4070 | |
| Dell XPS 16 9640 | |
| Samsung Galaxy Book4 Ultra | |
| Honor MagicBook Pro 16 2024 | |
| Medio Intel Core Ultra 7 155H (1496 - 1815, n=52) | |
| Asus ROG Zephyrus G16 2024 GU605M | |
| Cinebench R20 / CPU (Multi Core) | |
| Lenovo Yoga Pro 9 16-IRP G8 | |
| Honor MagicBook Pro 16 2024 | |
| Dell XPS 16 9640 | |
| Asus ROG Zephyrus G16 2024 GU605M | |
| Media de la clase Multimedia (1887 - 12912, n=56, últimos 2 años) | |
| Samsung Galaxy Book4 Ultra | |
| Dell XPS 15 9530 RTX 4070 | |
| Medio Intel Core Ultra 7 155H (3798 - 7409, n=50) | |
| Schenker VISION 16 Pro (M23) | |
| Cinebench R20 / CPU (Single Core) | |
| Lenovo Yoga Pro 9 16-IRP G8 | |
| Schenker VISION 16 Pro (M23) | |
| Media de la clase Multimedia (425 - 853, n=56, últimos 2 años) | |
| Dell XPS 15 9530 RTX 4070 | |
| Asus ROG Zephyrus G16 2024 GU605M | |
| Samsung Galaxy Book4 Ultra | |
| Honor MagicBook Pro 16 2024 | |
| Dell XPS 16 9640 | |
| Medio Intel Core Ultra 7 155H (601 - 696, n=50) | |
| Cinebench R15 / CPU Multi 64Bit | |
| Lenovo Yoga Pro 9 16-IRP G8 | |
| Honor MagicBook Pro 16 2024 | |
| Dell XPS 16 9640 | |
| Asus ROG Zephyrus G16 2024 GU605M | |
| Dell XPS 15 9530 RTX 4070 | |
| Media de la clase Multimedia (856 - 5224, n=60, últimos 2 años) | |
| Samsung Galaxy Book4 Ultra | |
| Medio Intel Core Ultra 7 155H (1932 - 2880, n=56) | |
| Schenker VISION 16 Pro (M23) | |
| Cinebench R15 / CPU Single 64Bit | |
| Media de la clase Multimedia (184.8 - 326, n=58, últimos 2 años) | |
| Schenker VISION 16 Pro (M23) | |
| Lenovo Yoga Pro 9 16-IRP G8 | |
| Dell XPS 15 9530 RTX 4070 | |
| Honor MagicBook Pro 16 2024 | |
| Asus ROG Zephyrus G16 2024 GU605M | |
| Dell XPS 16 9640 | |
| Samsung Galaxy Book4 Ultra | |
| Medio Intel Core Ultra 7 155H (99.6 - 268, n=52) | |
| Blender / v2.79 BMW27 CPU | |
| Media de la clase Multimedia (100 - 557, n=57, últimos 2 años) | |
| Medio Intel Core Ultra 7 155H (175 - 381, n=47) | |
| Schenker VISION 16 Pro (M23) | |
| Samsung Galaxy Book4 Ultra | |
| Dell XPS 15 9530 RTX 4070 | |
| Asus ROG Zephyrus G16 2024 GU605M | |
| Honor MagicBook Pro 16 2024 | |
| Dell XPS 16 9640 | |
| Lenovo Yoga Pro 9 16-IRP G8 | |
| 7-Zip 18.03 / 7z b 4 | |
| Lenovo Yoga Pro 9 16-IRP G8 | |
| Dell XPS 16 9640 | |
| Honor MagicBook Pro 16 2024 | |
| Asus ROG Zephyrus G16 2024 GU605M | |
| Samsung Galaxy Book4 Ultra | |
| Schenker VISION 16 Pro (M23) | |
| Dell XPS 15 9530 RTX 4070 | |
| Medio Intel Core Ultra 7 155H (41739 - 70254, n=50) | |
| Media de la clase Multimedia (26062 - 130368, n=54, últimos 2 años) | |
| 7-Zip 18.03 / 7z b 4 -mmt1 | |
| Schenker VISION 16 Pro (M23) | |
| Dell XPS 15 9530 RTX 4070 | |
| Lenovo Yoga Pro 9 16-IRP G8 | |
| Media de la clase Multimedia (3666 - 7545, n=55, últimos 2 años) | |
| Samsung Galaxy Book4 Ultra | |
| Honor MagicBook Pro 16 2024 | |
| Dell XPS 16 9640 | |
| Asus ROG Zephyrus G16 2024 GU605M | |
| Medio Intel Core Ultra 7 155H (4594 - 5621, n=50) | |
| Geekbench 6.7 / Multi-Core | |
| Media de la clase Multimedia (4983 - 29415, n=67, últimos 2 años) | |
| Lenovo Yoga Pro 9 16-IRP G8 | |
| Dell XPS 16 9640 | |
| Asus ROG Zephyrus G16 2024 GU605M | |
| Honor MagicBook Pro 16 2024 | |
| Samsung Galaxy Book4 Ultra | |
| Medio Intel Core Ultra 7 155H (7732 - 13656, n=55) | |
| Geekbench 6.7 / Single-Core | |
| Media de la clase Multimedia (1534 - 4335, n=66, últimos 2 años) | |
| Lenovo Yoga Pro 9 16-IRP G8 | |
| Honor MagicBook Pro 16 2024 | |
| Samsung Galaxy Book4 Ultra | |
| Dell XPS 16 9640 | |
| Asus ROG Zephyrus G16 2024 GU605M | |
| Medio Intel Core Ultra 7 155H (1901 - 2473, n=52) | |
| Geekbench 5.5 / Multi-Core | |
| Lenovo Yoga Pro 9 16-IRP G8 | |
| Dell XPS 16 9640 | |
| Dell XPS 15 9530 RTX 4070 | |
| Honor MagicBook Pro 16 2024 | |
| Media de la clase Multimedia (4652 - 20422, n=55, últimos 2 años) | |
| Asus ROG Zephyrus G16 2024 GU605M | |
| Samsung Galaxy Book4 Ultra | |
| Medio Intel Core Ultra 7 155H (10017 - 13556, n=52) | |
| Schenker VISION 16 Pro (M23) | |
| Geekbench 5.5 / Single-Core | |
| Media de la clase Multimedia (805 - 2974, n=55, últimos 2 años) | |
| Dell XPS 15 9530 RTX 4070 | |
| Schenker VISION 16 Pro (M23) | |
| Samsung Galaxy Book4 Ultra | |
| Honor MagicBook Pro 16 2024 | |
| Lenovo Yoga Pro 9 16-IRP G8 | |
| Dell XPS 16 9640 | |
| Asus ROG Zephyrus G16 2024 GU605M | |
| Medio Intel Core Ultra 7 155H (1462 - 1824, n=52) | |
| HWBOT x265 Benchmark v2.2 / 4k Preset | |
| Lenovo Yoga Pro 9 16-IRP G8 | |
| Dell XPS 16 9640 | |
| Honor MagicBook Pro 16 2024 | |
| Asus ROG Zephyrus G16 2024 GU605M | |
| Media de la clase Multimedia (5.26 - 36.1, n=55, últimos 2 años) | |
| Dell XPS 15 9530 RTX 4070 | |
| Samsung Galaxy Book4 Ultra | |
| Schenker VISION 16 Pro (M23) | |
| Medio Intel Core Ultra 7 155H (9.93 - 21.2, n=50) | |
| LibreOffice / 20 Documents To PDF | |
| Asus ROG Zephyrus G16 2024 GU605M | |
| Medio Intel Core Ultra 7 155H (37.5 - 79.2, n=49) | |
| Media de la clase Multimedia (23.9 - 146.7, n=56, últimos 2 años) | |
| Lenovo Yoga Pro 9 16-IRP G8 | |
| Schenker VISION 16 Pro (M23) | |
| Honor MagicBook Pro 16 2024 | |
| Samsung Galaxy Book4 Ultra | |
| Dell XPS 16 9640 | |
| Dell XPS 15 9530 RTX 4070 | |
| R Benchmark 2.5 / Overall mean | |
| Dell XPS 16 9640 | |
| Medio Intel Core Ultra 7 155H (0.4457 - 0.53, n=49) | |
| Samsung Galaxy Book4 Ultra | |
| Asus ROG Zephyrus G16 2024 GU605M | |
| Media de la clase Multimedia (0.3604 - 0.947, n=55, últimos 2 años) | |
| Honor MagicBook Pro 16 2024 | |
| Lenovo Yoga Pro 9 16-IRP G8 | |
| Dell XPS 15 9530 RTX 4070 | |
| Schenker VISION 16 Pro (M23) | |
* ... más pequeño es mejor
AIDA64: FP32 Ray-Trace | FPU Julia | CPU SHA3 | CPU Queen | FPU SinJulia | FPU Mandel | CPU AES | CPU ZLib | FP64 Ray-Trace | CPU PhotoWorxx
| Performance rating | |
| Honor MagicBook Pro 16 2024 | |
| Lenovo Yoga Pro 9 16-IRP G8 | |
| Dell XPS 16 9640 | |
| Asus ROG Zephyrus G16 2024 GU605M | |
| Media de la clase Multimedia | |
| Samsung Galaxy Book4 Ultra | |
| Schenker VISION 16 Pro (M23) | |
| Dell XPS 15 9530 RTX 4070 | |
| Medio Intel Core Ultra 7 155H | |
| AIDA64 / FP32 Ray-Trace | |
| Lenovo Yoga Pro 9 16-IRP G8 | |
| Media de la clase Multimedia (2214 - 50388, n=53, últimos 2 años) | |
| Honor MagicBook Pro 16 2024 | |
| Dell XPS 16 9640 | |
| Asus ROG Zephyrus G16 2024 GU605M | |
| Dell XPS 15 9530 RTX 4070 | |
| Samsung Galaxy Book4 Ultra | |
| Schenker VISION 16 Pro (M23) | |
| Medio Intel Core Ultra 7 155H (6670 - 18470, n=50) | |
| AIDA64 / FPU Julia | |
| Honor MagicBook Pro 16 2024 | |
| Lenovo Yoga Pro 9 16-IRP G8 | |
| Dell XPS 16 9640 | |
| Asus ROG Zephyrus G16 2024 GU605M | |
| Media de la clase Multimedia (12867 - 201874, n=53, últimos 2 años) | |
| Samsung Galaxy Book4 Ultra | |
| Schenker VISION 16 Pro (M23) | |
| Medio Intel Core Ultra 7 155H (40905 - 93181, n=50) | |
| Dell XPS 15 9530 RTX 4070 | |
| AIDA64 / CPU SHA3 | |
| Honor MagicBook Pro 16 2024 | |
| Lenovo Yoga Pro 9 16-IRP G8 | |
| Dell XPS 16 9640 | |
| Media de la clase Multimedia (626 - 8623, n=53, últimos 2 años) | |
| Asus ROG Zephyrus G16 2024 GU605M | |
| Samsung Galaxy Book4 Ultra | |
| Medio Intel Core Ultra 7 155H (1940 - 4436, n=50) | |
| Schenker VISION 16 Pro (M23) | |
| Dell XPS 15 9530 RTX 4070 | |
| AIDA64 / CPU Queen | |
| Lenovo Yoga Pro 9 16-IRP G8 | |
| Dell XPS 15 9530 RTX 4070 | |
| Schenker VISION 16 Pro (M23) | |
| Asus ROG Zephyrus G16 2024 GU605M | |
| Dell XPS 16 9640 | |
| Samsung Galaxy Book4 Ultra | |
| Honor MagicBook Pro 16 2024 | |
| Medio Intel Core Ultra 7 155H (64698 - 94181, n=50) | |
| Media de la clase Multimedia (13483 - 181505, n=40, últimos 2 años) | |
| AIDA64 / FPU SinJulia | |
| Lenovo Yoga Pro 9 16-IRP G8 | |
| Asus ROG Zephyrus G16 2024 GU605M | |
| Honor MagicBook Pro 16 2024 | |
| Dell XPS 16 9640 | |
| Samsung Galaxy Book4 Ultra | |
| Medio Intel Core Ultra 7 155H (5639 - 10647, n=50) | |
| Schenker VISION 16 Pro (M23) | |
| Dell XPS 15 9530 RTX 4070 | |
| Media de la clase Multimedia (886 - 28794, n=53, últimos 2 años) | |
| AIDA64 / FPU Mandel | |
| Dell XPS 16 9640 | |
| Honor MagicBook Pro 16 2024 | |
| Media de la clase Multimedia (6395 - 105740, n=53, últimos 2 años) | |
| Lenovo Yoga Pro 9 16-IRP G8 | |
| Asus ROG Zephyrus G16 2024 GU605M | |
| Samsung Galaxy Book4 Ultra | |
| Medio Intel Core Ultra 7 155H (18236 - 47685, n=50) | |
| Dell XPS 15 9530 RTX 4070 | |
| Schenker VISION 16 Pro (M23) | |
| AIDA64 / CPU AES | |
| Honor MagicBook Pro 16 2024 | |
| Lenovo Yoga Pro 9 16-IRP G8 | |
| Dell XPS 16 9640 | |
| Asus ROG Zephyrus G16 2024 GU605M | |
| Medio Intel Core Ultra 7 155H (45713 - 152179, n=50) | |
| Samsung Galaxy Book4 Ultra | |
| Schenker VISION 16 Pro (M23) | |
| Media de la clase Multimedia (8171 - 126790, n=53, últimos 2 años) | |
| Dell XPS 15 9530 RTX 4070 | |
| AIDA64 / CPU ZLib | |
| Honor MagicBook Pro 16 2024 | |
| Lenovo Yoga Pro 9 16-IRP G8 | |
| Dell XPS 16 9640 | |
| Asus ROG Zephyrus G16 2024 GU605M | |
| Samsung Galaxy Book4 Ultra | |
| Media de la clase Multimedia (143.8 - 2022, n=53, últimos 2 años) | |
| Medio Intel Core Ultra 7 155H (557 - 1250, n=50) | |
| Schenker VISION 16 Pro (M23) | |
| Dell XPS 15 9530 RTX 4070 | |
| AIDA64 / FP64 Ray-Trace | |
| Media de la clase Multimedia (1014 - 26875, n=53, últimos 2 años) | |
| Lenovo Yoga Pro 9 16-IRP G8 | |
| Dell XPS 16 9640 | |
| Honor MagicBook Pro 16 2024 | |
| Asus ROG Zephyrus G16 2024 GU605M | |
| Dell XPS 15 9530 RTX 4070 | |
| Schenker VISION 16 Pro (M23) | |
| Samsung Galaxy Book4 Ultra | |
| Medio Intel Core Ultra 7 155H (3569 - 9802, n=50) | |
| AIDA64 / CPU PhotoWorxx | |
| Lenovo Yoga Pro 9 16-IRP G8 | |
| Dell XPS 16 9640 | |
| Samsung Galaxy Book4 Ultra | |
| Media de la clase Multimedia (8187 - 88154, n=53, últimos 2 años) | |
| Asus ROG Zephyrus G16 2024 GU605M | |
| Medio Intel Core Ultra 7 155H (32719 - 54223, n=50) | |
| Honor MagicBook Pro 16 2024 | |
| Schenker VISION 16 Pro (M23) | |
| Dell XPS 15 9530 RTX 4070 | |
Rendimiento del sistema
En el uso diario, el nuevo XPS 16 9640 es un dispositivo muy sensible y tampoco notamos anomalías en los benchmarks sintéticos. No tuvimos ningún problema con el portátil durante nuestra prueba.
CrossMark: Overall | Productivity | Creativity | Responsiveness
WebXPRT 3: Overall
WebXPRT 4: Overall
Mozilla Kraken 1.1: Total
| PCMark 10 / Score | |
| Media de la clase Multimedia (4325 - 10386, n=51, últimos 2 años) | |
| Medio Intel Core Ultra 7 155H, NVIDIA GeForce RTX 4070 Laptop GPU (7084 - 7761, n=4) | |
| Schenker VISION 16 Pro (M23) | |
| Lenovo Yoga Pro 9 16-IRP G8 | |
| Dell XPS 15 9530 RTX 4070 | |
| Asus ROG Zephyrus G16 2024 GU605M | |
| Dell XPS 16 9640 | |
| Samsung Galaxy Book4 Ultra | |
| Honor MagicBook Pro 16 2024 | |
| PCMark 10 / Essentials | |
| Dell XPS 15 9530 RTX 4070 | |
| Lenovo Yoga Pro 9 16-IRP G8 | |
| Schenker VISION 16 Pro (M23) | |
| Media de la clase Multimedia (8025 - 11664, n=50, últimos 2 años) | |
| Samsung Galaxy Book4 Ultra | |
| Dell XPS 16 9640 | |
| Medio Intel Core Ultra 7 155H, NVIDIA GeForce RTX 4070 Laptop GPU (10038 - 10393, n=4) | |
| Asus ROG Zephyrus G16 2024 GU605M | |
| Honor MagicBook Pro 16 2024 | |
| PCMark 10 / Productivity | |
| Media de la clase Multimedia (7323 - 18233, n=50, últimos 2 años) | |
| Schenker VISION 16 Pro (M23) | |
| Medio Intel Core Ultra 7 155H, NVIDIA GeForce RTX 4070 Laptop GPU (9192 - 9518, n=4) | |
| Asus ROG Zephyrus G16 2024 GU605M | |
| Dell XPS 16 9640 | |
| Samsung Galaxy Book4 Ultra | |
| Lenovo Yoga Pro 9 16-IRP G8 | |
| Dell XPS 15 9530 RTX 4070 | |
| Honor MagicBook Pro 16 2024 | |
| PCMark 10 / Digital Content Creation | |
| Medio Intel Core Ultra 7 155H, NVIDIA GeForce RTX 4070 Laptop GPU (10100 - 13035, n=4) | |
| Lenovo Yoga Pro 9 16-IRP G8 | |
| Schenker VISION 16 Pro (M23) | |
| Honor MagicBook Pro 16 2024 | |
| Dell XPS 15 9530 RTX 4070 | |
| Asus ROG Zephyrus G16 2024 GU605M | |
| Media de la clase Multimedia (3651 - 16240, n=50, últimos 2 años) | |
| Dell XPS 16 9640 | |
| Samsung Galaxy Book4 Ultra | |
| CrossMark / Overall | |
| Schenker VISION 16 Pro (M23) | |
| Dell XPS 15 9530 RTX 4070 | |
| Media de la clase Multimedia (866 - 2728, n=59, últimos 2 años) | |
| Dell XPS 16 9640 | |
| Lenovo Yoga Pro 9 16-IRP G8 | |
| Medio Intel Core Ultra 7 155H, NVIDIA GeForce RTX 4070 Laptop GPU (1687 - 1848, n=4) | |
| Samsung Galaxy Book4 Ultra | |
| Honor MagicBook Pro 16 2024 | |
| Asus ROG Zephyrus G16 2024 GU605M | |
| CrossMark / Productivity | |
| Schenker VISION 16 Pro (M23) | |
| Media de la clase Multimedia (931 - 2489, n=59, últimos 2 años) | |
| Dell XPS 15 9530 RTX 4070 | |
| Dell XPS 16 9640 | |
| Lenovo Yoga Pro 9 16-IRP G8 | |
| Honor MagicBook Pro 16 2024 | |
| Medio Intel Core Ultra 7 155H, NVIDIA GeForce RTX 4070 Laptop GPU (1589 - 1750, n=4) | |
| Samsung Galaxy Book4 Ultra | |
| Asus ROG Zephyrus G16 2024 GU605M | |
| CrossMark / Creativity | |
| Media de la clase Multimedia (907 - 3465, n=59, últimos 2 años) | |
| Dell XPS 15 9530 RTX 4070 | |
| Lenovo Yoga Pro 9 16-IRP G8 | |
| Dell XPS 16 9640 | |
| Schenker VISION 16 Pro (M23) | |
| Asus ROG Zephyrus G16 2024 GU605M | |
| Medio Intel Core Ultra 7 155H, NVIDIA GeForce RTX 4070 Laptop GPU (1860 - 2014, n=4) | |
| Samsung Galaxy Book4 Ultra | |
| Honor MagicBook Pro 16 2024 | |
| CrossMark / Responsiveness | |
| Schenker VISION 16 Pro (M23) | |
| Dell XPS 16 9640 | |
| Dell XPS 15 9530 RTX 4070 | |
| Honor MagicBook Pro 16 2024 | |
| Medio Intel Core Ultra 7 155H, NVIDIA GeForce RTX 4070 Laptop GPU (1424 - 1683, n=4) | |
| Lenovo Yoga Pro 9 16-IRP G8 | |
| Media de la clase Multimedia (605 - 2024, n=59, últimos 2 años) | |
| Samsung Galaxy Book4 Ultra | |
| Asus ROG Zephyrus G16 2024 GU605M | |
| WebXPRT 3 / Overall | |
| Media de la clase Multimedia (136.4 - 596, n=62, últimos 2 años) | |
| Dell XPS 15 9530 RTX 4070 | |
| Schenker VISION 16 Pro (M23) | |
| Lenovo Yoga Pro 9 16-IRP G8 | |
| Honor MagicBook Pro 16 2024 | |
| Asus ROG Zephyrus G16 2024 GU605M | |
| Dell XPS 16 9640 | |
| Samsung Galaxy Book4 Ultra | |
| Medio Intel Core Ultra 7 155H, NVIDIA GeForce RTX 4070 Laptop GPU (264 - 294, n=4) | |
| WebXPRT 4 / Overall | |
| Media de la clase Multimedia (167.3 - 402, n=64, últimos 2 años) | |
| Dell XPS 15 9530 RTX 4070 | |
| Schenker VISION 16 Pro (M23) | |
| Lenovo Yoga Pro 9 16-IRP G8 | |
| Honor MagicBook Pro 16 2024 | |
| Samsung Galaxy Book4 Ultra | |
| Asus ROG Zephyrus G16 2024 GU605M | |
| Dell XPS 16 9640 | |
| Medio Intel Core Ultra 7 155H, NVIDIA GeForce RTX 4070 Laptop GPU (247 - 257, n=4) | |
| Mozilla Kraken 1.1 / Total | |
| Medio Intel Core Ultra 7 155H, NVIDIA GeForce RTX 4070 Laptop GPU (546 - 568, n=3) | |
| Asus ROG Zephyrus G16 2024 GU605M | |
| Honor MagicBook Pro 16 2024 | |
| Lenovo Yoga Pro 9 16-IRP G8 | |
| Dell XPS 15 9530 RTX 4070 | |
| Schenker VISION 16 Pro (M23) | |
| Media de la clase Multimedia (228 - 835, n=65, últimos 2 años) | |
| Samsung Galaxy Book4 Ultra | |
* ... más pequeño es mejor
| PCMark 10 Score | 7084 puntos | |
ayuda | ||
| AIDA64 / Memory Copy | |
| Dell XPS 16 9640 | |
| Samsung Galaxy Book4 Ultra | |
| Asus ROG Zephyrus G16 2024 GU605M | |
| Honor MagicBook Pro 16 2024 | |
| Medio Intel Core Ultra 7 155H (62397 - 96791, n=50) | |
| Media de la clase Multimedia (11299 - 132135, n=53, últimos 2 años) | |
| Lenovo Yoga Pro 9 16-IRP G8 | |
| Dell XPS 15 9530 RTX 4070 | |
| Schenker VISION 16 Pro (M23) | |
| AIDA64 / Memory Read | |
| Samsung Galaxy Book4 Ultra | |
| Asus ROG Zephyrus G16 2024 GU605M | |
| Dell XPS 16 9640 | |
| Media de la clase Multimedia (11624 - 174586, n=53, últimos 2 años) | |
| Medio Intel Core Ultra 7 155H (60544 - 90647, n=50) | |
| Lenovo Yoga Pro 9 16-IRP G8 | |
| Honor MagicBook Pro 16 2024 | |
| Schenker VISION 16 Pro (M23) | |
| Dell XPS 15 9530 RTX 4070 | |
| AIDA64 / Memory Write | |
| Lenovo Yoga Pro 9 16-IRP G8 | |
| Media de la clase Multimedia (11755 - 134998, n=53, últimos 2 años) | |
| Honor MagicBook Pro 16 2024 | |
| Samsung Galaxy Book4 Ultra | |
| Dell XPS 16 9640 | |
| Asus ROG Zephyrus G16 2024 GU605M | |
| Medio Intel Core Ultra 7 155H (58692 - 93451, n=50) | |
| Dell XPS 15 9530 RTX 4070 | |
| Schenker VISION 16 Pro (M23) | |
| AIDA64 / Memory Latency | |
| Medio Intel Core Ultra 7 155H (116.2 - 233, n=50) | |
| Honor MagicBook Pro 16 2024 | |
| Samsung Galaxy Book4 Ultra | |
| Asus ROG Zephyrus G16 2024 GU605M | |
| Dell XPS 16 9640 | |
| Media de la clase Multimedia (7 - 535, n=52, últimos 2 años) | |
| Lenovo Yoga Pro 9 16-IRP G8 | |
| Dell XPS 15 9530 RTX 4070 | |
| Schenker VISION 16 Pro (M23) | |
* ... más pequeño es mejor
Latencia del CPD
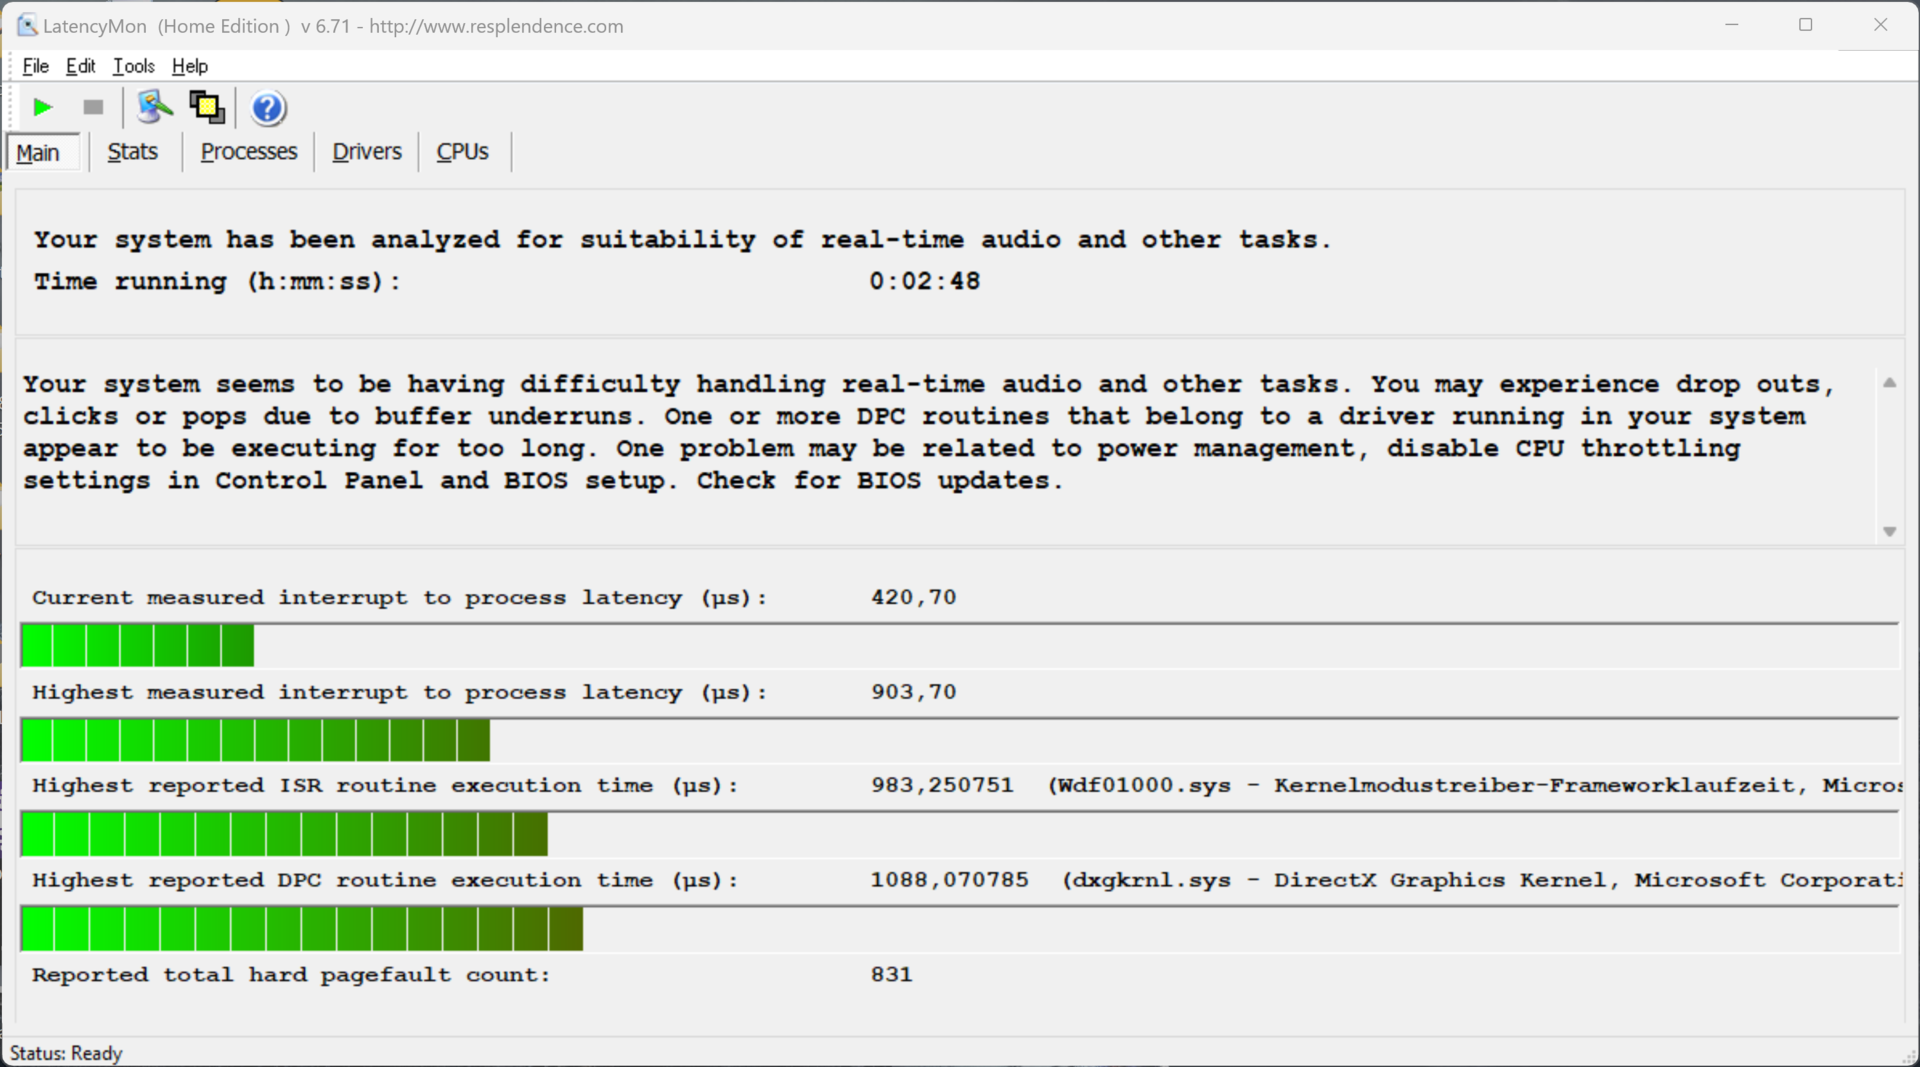
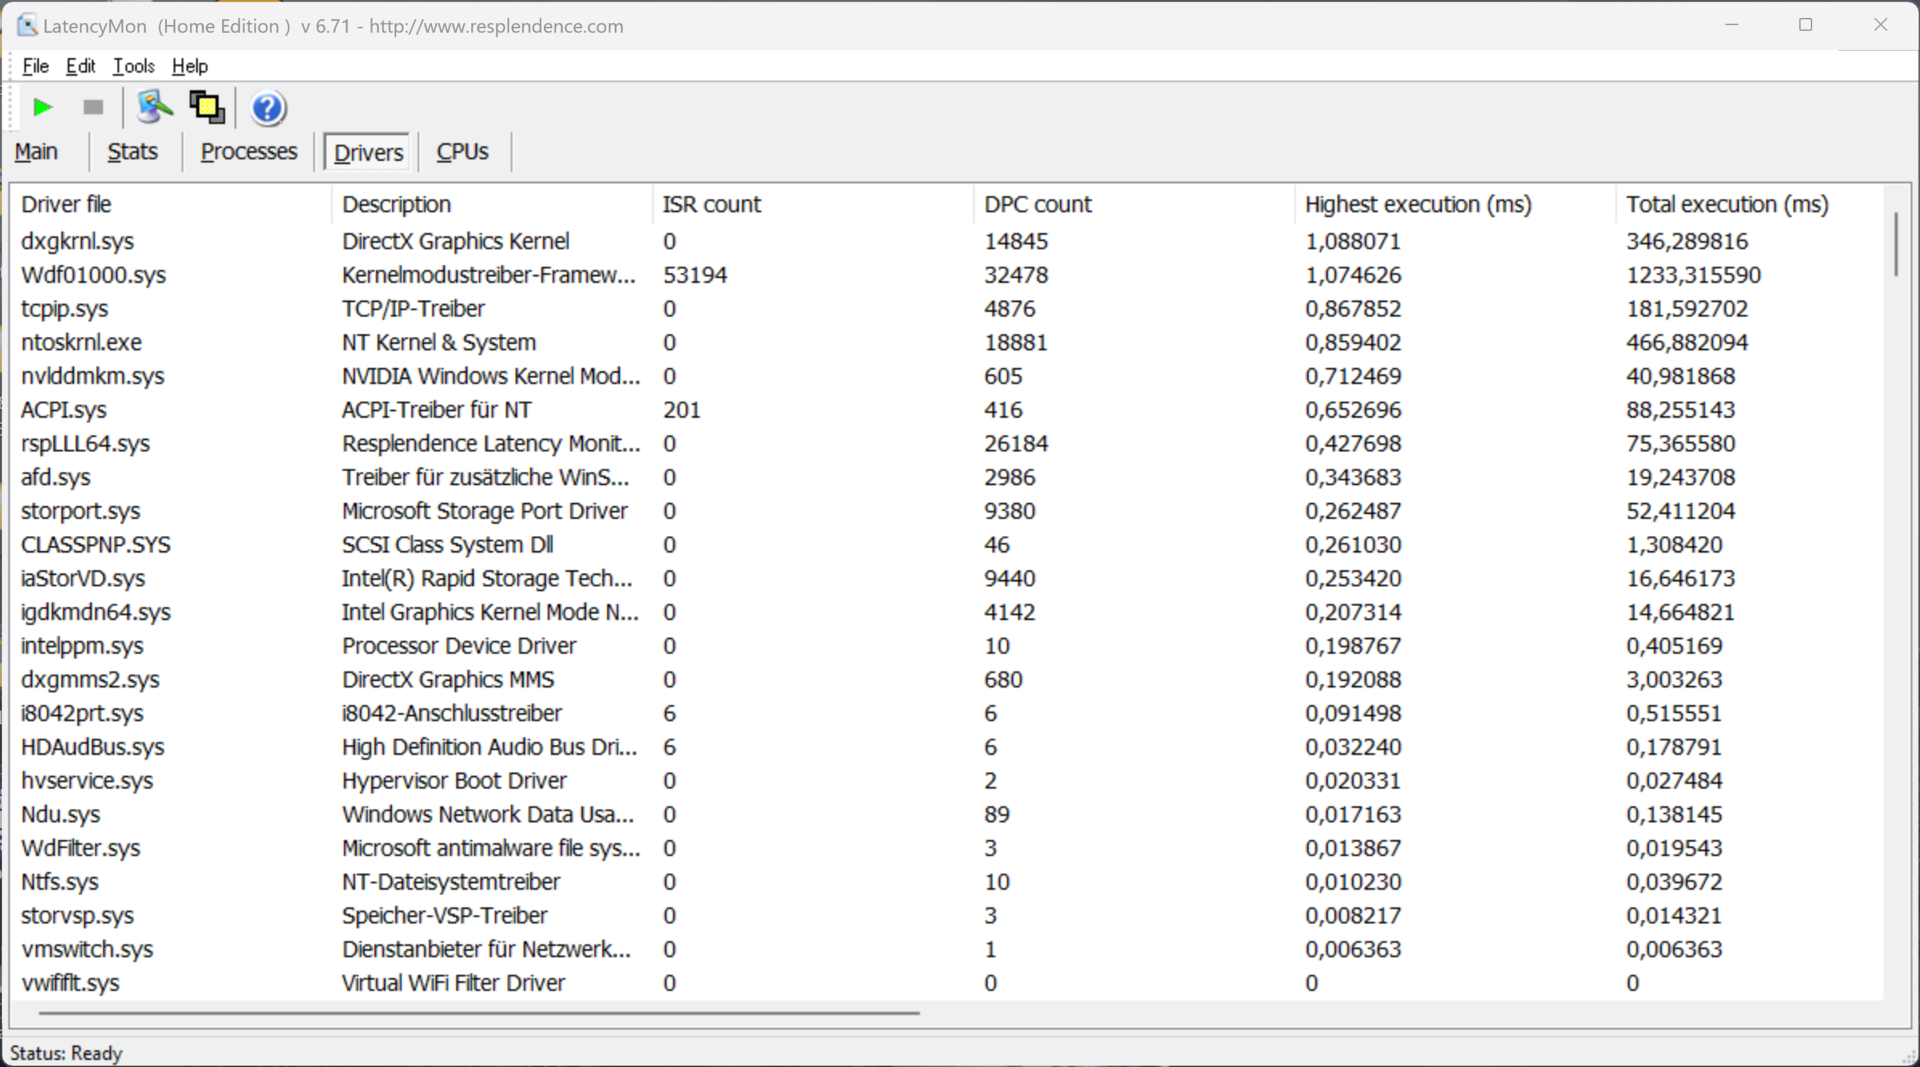
En nuestra prueba de latencia estandarizada (navegación por Internet, reproducción 4K de YouTube, carga de la CPU), nuestro dispositivo de prueba con la versión actual de la BIOS sólo mostró ligeras limitaciones al utilizar aplicaciones de audio en tiempo real.
| DPC Latencies / LatencyMon - interrupt to process latency (max), Web, Youtube, Prime95 | |
| Lenovo Yoga Pro 9 16-IRP G8 | |
| Asus ROG Zephyrus G16 2024 GU605M | |
| Honor MagicBook Pro 16 2024 | |
| Dell XPS 15 9530 RTX 4070 | |
| Dell XPS 16 9640 | |
| Schenker VISION 16 Pro (M23) | |
| Samsung Galaxy Book4 Ultra | |
* ... más pequeño es mejor
Dispositivo de almacenamiento
En nuestro dispositivo de prueba se ha instalado una versión de 1 TB del Kioxia XG8, con 834 GB disponibles para los usuarios tras el primer arranque del portátil. El rendimiento de la SSD PCIe-4.0 es muy bueno y, sobre todo, muy estable. No hay ranura para una SSD adicional. Encontrará más pruebas de rendimiento de la SSD aquí.

* ... más pequeño es mejor
Reading continuous performance: DiskSpd Read Loop, Queue Depth 8
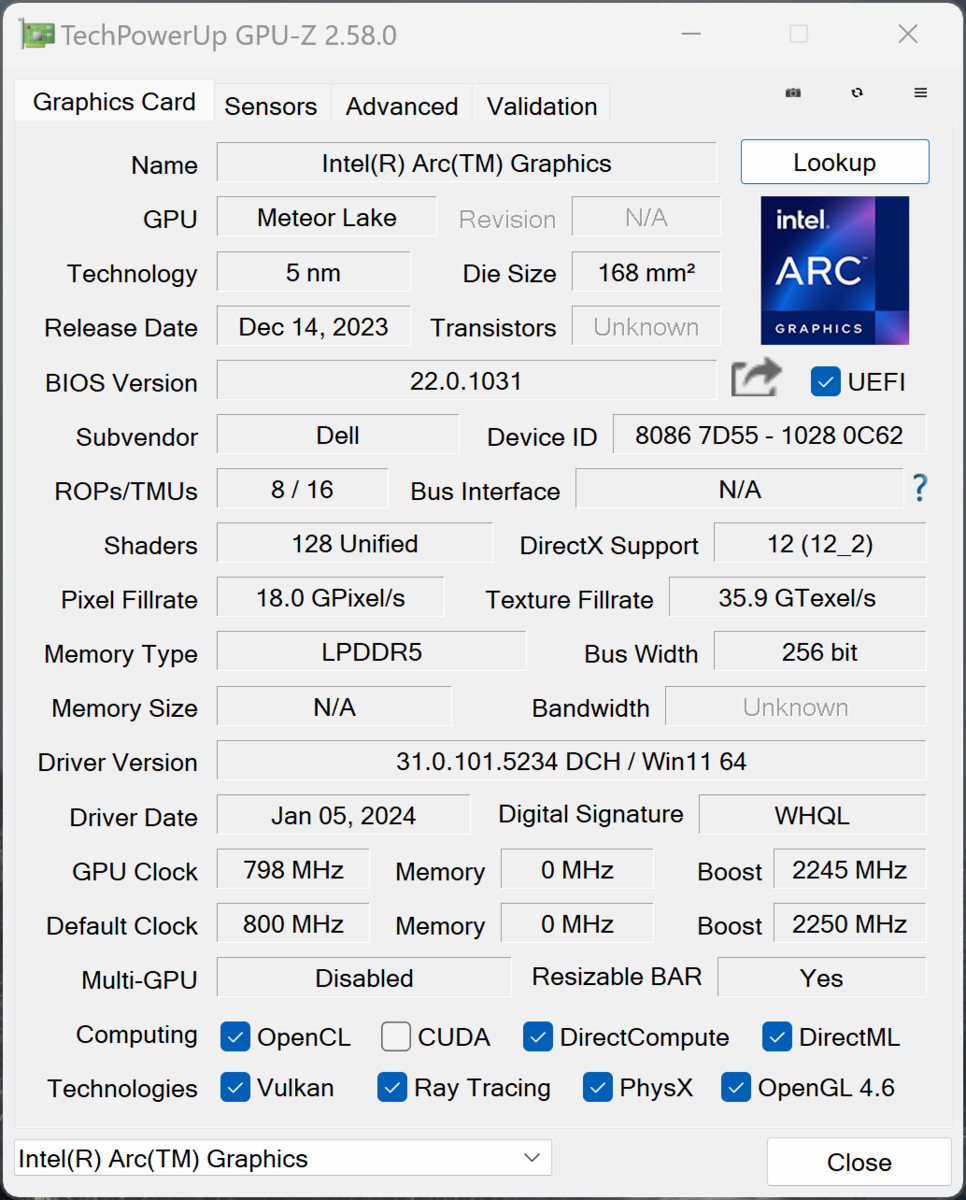
Tarjeta gráfica
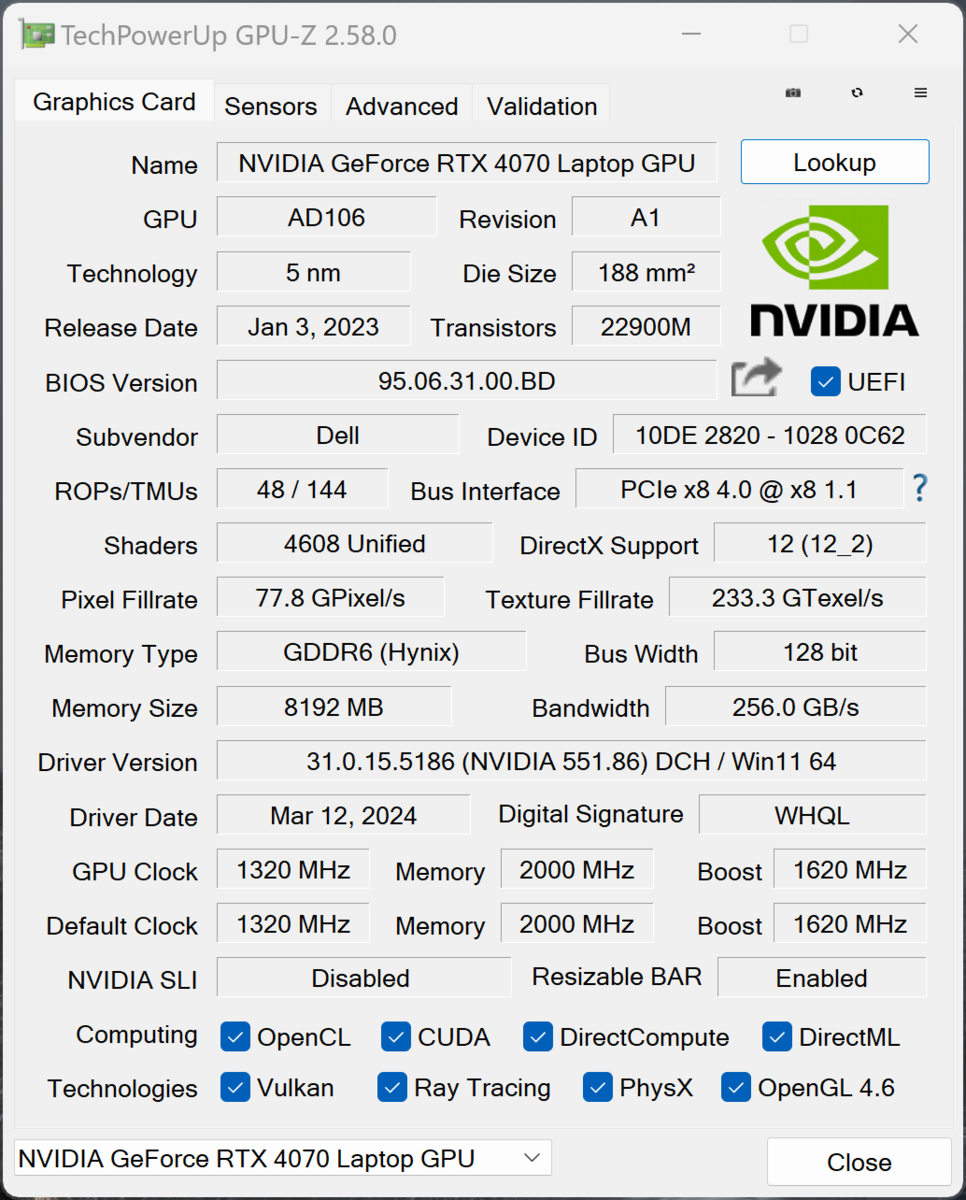
Nuestro dispositivo de prueba está equipado con la GeForce Portátil RTX 4070 con 8 GB de VRAM, por lo que su TGP es de 50-60 vatios dependiendo del perfil de energía seleccionado. El XPS 16 dispone de un conmutador MUX y admite la conmutación de gráficos a través de Advanced Optimus; los cálculos gráficos sencillos son gestionados por el procesador integrado Gráficos Intel Arc.
Como resultado, su rendimiento es mejor que el del antiguo XPS 15 con la versión de 50 vatios del portátil RTX 4070, pero los competidores dentro de este segmento ofrecen modelos más rápidos y, como resultado, también más rendimiento de la GPU. El Yoga Pro 9 16 con la versión de 100 vatios del Portátil RTX 4060por ejemplo, no es mucho más lento. En este aspecto, se podría haber hecho mucho más.
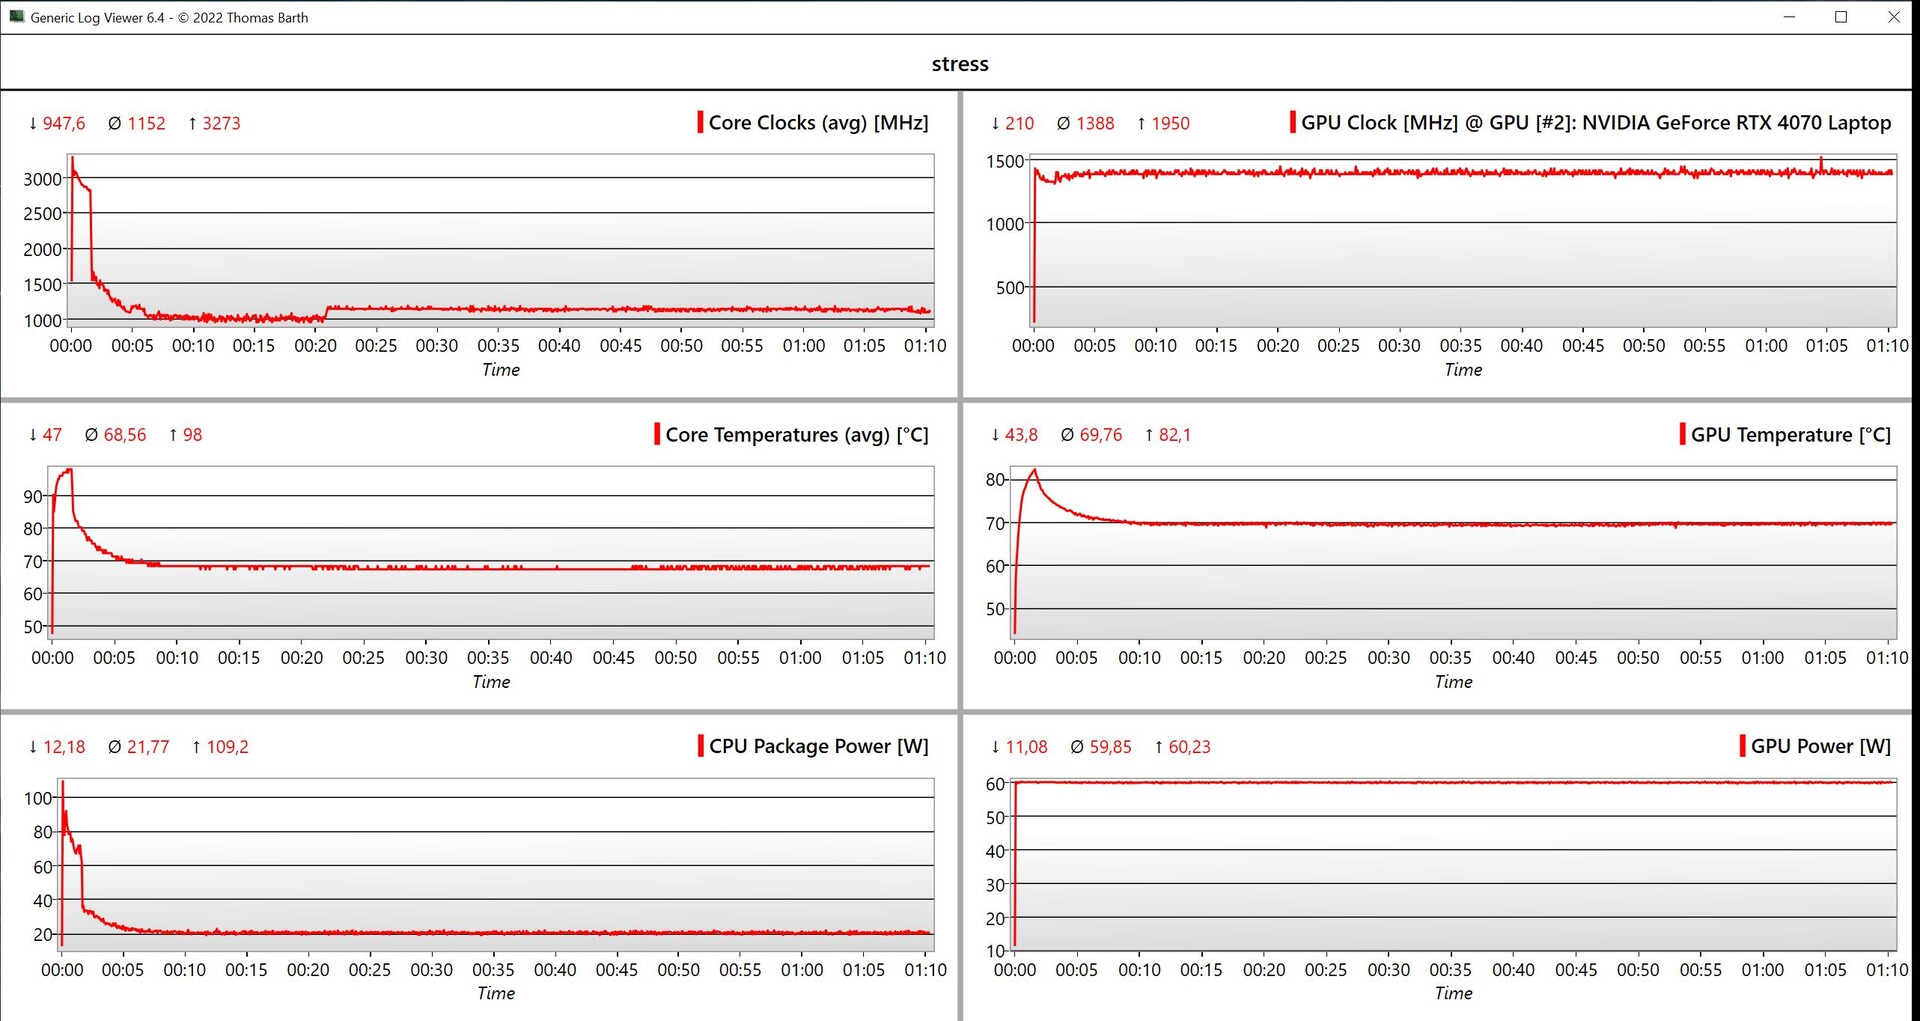
Su rendimiento gráfico se mantiene estable bajo carga continua, pero la GPU puede consumir un máximo de 50 vatios en modo batería, lo que supone una reducción del rendimiento de algo menos del 10 %. Puede encontrar más pruebas comparativas de la GPU aquí.
| 3DMark 11 Performance | 29315 puntos | |
| 3DMark Fire Strike Score | 21848 puntos | |
| 3DMark Time Spy Score | 9774 puntos | |
ayuda | ||
| Blender / v3.3 Classroom OPTIX/RTX | |
| Media de la clase Multimedia (12 - 105, n=21, últimos 2 años) | |
| Samsung Galaxy Book4 Ultra | |
| Dell XPS 15 9530 RTX 4070 | |
| Lenovo Yoga Pro 9 16-IRP G8 | |
| Schenker VISION 16 Pro (M23) | |
| Honor MagicBook Pro 16 2024 | |
| Asus ROG Zephyrus G16 2024 GU605M | |
| Medio NVIDIA GeForce RTX 4070 Laptop GPU (18 - 30, n=68) | |
| Dell XPS 16 9640 | |
| Blender / v3.3 Classroom CUDA | |
| Media de la clase Multimedia (20 - 186, n=21, últimos 2 años) | |
| Samsung Galaxy Book4 Ultra | |
| Dell XPS 15 9530 RTX 4070 | |
| Lenovo Yoga Pro 9 16-IRP G8 | |
| Honor MagicBook Pro 16 2024 | |
| Dell XPS 16 9640 | |
| Schenker VISION 16 Pro (M23) | |
| Medio NVIDIA GeForce RTX 4070 Laptop GPU (32 - 50, n=67) | |
| Asus ROG Zephyrus G16 2024 GU605M | |
| Blender / v3.3 Classroom CPU | |
| Media de la clase Multimedia (134.5 - 1042, n=61, últimos 2 años) | |
| Schenker VISION 16 Pro (M23) | |
| Samsung Galaxy Book4 Ultra | |
| Dell XPS 15 9530 RTX 4070 | |
| Asus ROG Zephyrus G16 2024 GU605M | |
| Honor MagicBook Pro 16 2024 | |
| Lenovo Yoga Pro 9 16-IRP G8 | |
| Dell XPS 16 9640 | |
| Medio NVIDIA GeForce RTX 4070 Laptop GPU (158 - 440, n=67) | |
* ... más pequeño es mejor
Rendimiento en juegos
Con el portátil RTX 4070, el rendimiento en juegos del XPS 16 9640 no es tan malo: todos los juegos que probamos se podían jugar sin problemas en resolución QHD con el máximo de detalles. Sin embargo, para la resolución nativa de la pantalla de 3.840 x 2.400 píxeles, hay que reducir los detalles o hacer uso de tecnologías de escalado como DLSS de Nvidia. En comparación con la competencia, el XPS vuelve a ser inferior a los modelos equipados con el portátil RTX 4070 y las versiones rápidas del portátil RTX 4060 (Honor MagicBook Pro, Lenovo Yoga Pro 9 16). Su rendimiento en juegos se mantiene estable incluso durante las sesiones más largas.
| The Witcher 3 - 1920x1080 Ultra Graphics & Postprocessing (HBAO+) | |
| Schenker VISION 16 Pro (M23) | |
| Asus ROG Zephyrus G16 2024 GU605M | |
| Lenovo Yoga Pro 9 16-IRP G8 | |
| Dell XPS 16 9640 | |
| Honor MagicBook Pro 16 2024 | |
| Dell XPS 15 9530 RTX 4070 | |
| Samsung Galaxy Book4 Ultra | |
| Media de la clase Multimedia (11 - 107, n=5, últimos 2 años) | |
| Baldur's Gate 3 | |
| 1920x1080 Ultra Preset AA:T | |
| Medio NVIDIA GeForce RTX 4070 Laptop GPU (66.7 - 128.5, n=30) | |
| Dell XPS 16 9640 | |
| Media de la clase Multimedia (7.8 - 158.7, n=62, últimos 2 años) | |
| 2560x1440 Ultra Preset AA:T | |
| Medio NVIDIA GeForce RTX 4070 Laptop GPU (54.4 - 89.6, n=25) | |
| Media de la clase Multimedia (28.7 - 121, n=24, últimos 2 años) | |
| Dell XPS 16 9640 | |
| Horizon Forbidden West | |
| 1920x1080 Very High Preset AA:T | |
| Medio NVIDIA GeForce RTX 4070 Laptop GPU (53.2 - 76.7, n=10) | |
| Dell XPS 16 9640 | |
| Media de la clase Multimedia (n=1últimos 2 años) | |
| 2560x1440 Very High Preset AA:T | |
| Medio NVIDIA GeForce RTX 4070 Laptop GPU (40.3 - 59.1, n=9) | |
| Dell XPS 16 9640 | |
Witcher 3 FPS diagram
| bajo | medio | alto | ultra | QHD | 4K | |
|---|---|---|---|---|---|---|
| GTA V (2015) | 177 | 170.7 | 103.6 | 81.3 | ||
| The Witcher 3 (2015) | 399 | 327 | 195 | 87.8 | 73 | |
| Dota 2 Reborn (2015) | 89.8 | 89.6 | 89.5 | 89.7 | 115.7 | |
| Final Fantasy XV Benchmark (2018) | 150.2 | 123.2 | 93.1 | 70 | ||
| X-Plane 11.11 (2018) | 125.1 | 108.5 | 84.7 | 68.9 | ||
| Far Cry 5 (2018) | 140 | 126 | 122 | 115 | 94 | |
| Strange Brigade (2018) | 423 | 258 | 202 | 175 | 116 | |
| F1 23 (2023) | 214 | 189.7 | 175.1 | 55.5 | 35.2 | |
| Baldur's Gate 3 (2023) | 135.7 | 107.1 | 93.5 | 91.8 | 63.8 | |
| Cyberpunk 2077 (2023) | 112 | 87.6 | 74.7 | 64.3 | 39.6 | |
| Horizon Forbidden West (2024) | 96.6 | 83.7 | 58.5 | 53.2 | 40.3 |
Emisiones - Dell ha instalado una cámara de vapor en la XPS 16
Emisiones sonoras
A diferencia del xPS 14 más pequeño's refrigerador convencional, Dell ha instalado una unidad de refrigeración Vapor Chamber con dos ventiladores en el XPS 16 más grande. Especialmente bajo carga baja, los ventiladores suelen permanecer desactivados o simplemente muy silenciosos-pero bajo carga más alta, sigue siendo ruidoso con bastante rapidez. Nos sorprendió especialmente la pequeña diferencia entre los perfiles Optimizado (máx. 48,1 dB(A)) y Ultra Rendimiento (máx. 49,7 dB(A)), siendo ambos demasiado ruidosos para poder jugar sin necesidad de auriculares. Con un máximo de 43,3 dB(A), el perfil Quiet no es realmente muy silencioso. Bastantes competidores, como el MagicBook Pro o el Zephyrus G16ofrecen un mejor rendimiento con menores emisiones de ruido. No notamos ningún ruido electrónico adicional procedente de nuestra muestra de prueba.
Ruido
| Ocioso |
| 24.5 / 24.5 / 27.5 dB(A) |
| Carga |
| 39.6 / 49.7 dB(A) |
 | ||
30 dB silencioso 40 dB(A) audible 50 dB(A) ruidosamente alto |
||
min: | ||
| Dell XPS 16 9640 GeForce RTX 4070 Laptop GPU, Ultra 7 155H, Kioxia XG8 KXG80ZNV1T02 | Samsung Galaxy Book4 Ultra GeForce RTX 4050 Laptop GPU, Ultra 7 155H, Samsung PM9A1 MZVL2512HCJQ | Honor MagicBook Pro 16 2024 GeForce RTX 4060 Laptop GPU, Ultra 7 155H, WD PC SN740 SDDPNQD-1T00 | Asus ROG Zephyrus G16 2024 GU605M GeForce RTX 4070 Laptop GPU, Ultra 7 155H, WD PC SN560 SDDPNQE-1T00 | Lenovo Yoga Pro 9 16-IRP G8 GeForce RTX 4060 Laptop GPU, i7-13705H, Samsung PM9A1 MZVL21T0HCLR | Schenker VISION 16 Pro (M23) GeForce RTX 4070 Laptop GPU, i7-13700H, Samsung 990 Pro 1 TB | Dell XPS 15 9530 RTX 4070 GeForce RTX 4070 Laptop GPU, i7-13700H, SK hynix PC801 HFS001TEJ9X101N | |
|---|---|---|---|---|---|---|---|
| Noise | 7% | 8% | 1% | -3% | -10% | 13% | |
| apagado / medio ambiente * (dB) | 24.5 | 24.2 1% | 24 2% | 23.9 2% | 24.7 -1% | 25.9 -6% | 23.1 6% |
| Idle Minimum * (dB) | 24.5 | 24.2 1% | 24 2% | 23.9 2% | 24.7 -1% | 25.9 -6% | 23.1 6% |
| Idle Average * (dB) | 24.5 | 24.2 1% | 24 2% | 27.8 -13% | 26.2 -7% | 25.9 -6% | 23.1 6% |
| Idle Maximum * (dB) | 27.5 | 24.2 12% | 27.2 1% | 30.1 -9% | 26.2 5% | 32 -16% | 24.2 12% |
| Load Average * (dB) | 39.6 | 37.9 4% | 29 27% | 34.2 14% | 39.7 -0% | 47.2 -19% | 27.1 32% |
| Witcher 3 ultra * (dB) | 49.7 | 41.7 16% | 42.1 15% | 46.4 7% | 53.2 -7% | 53.1 -7% | 40.1 19% |
| Load Maximum * (dB) | 49.7 | 41.7 16% | 45 9% | 46.4 7% | 53.2 -7% | 53.1 -7% | 44.6 10% |
* ... más pequeño es mejor
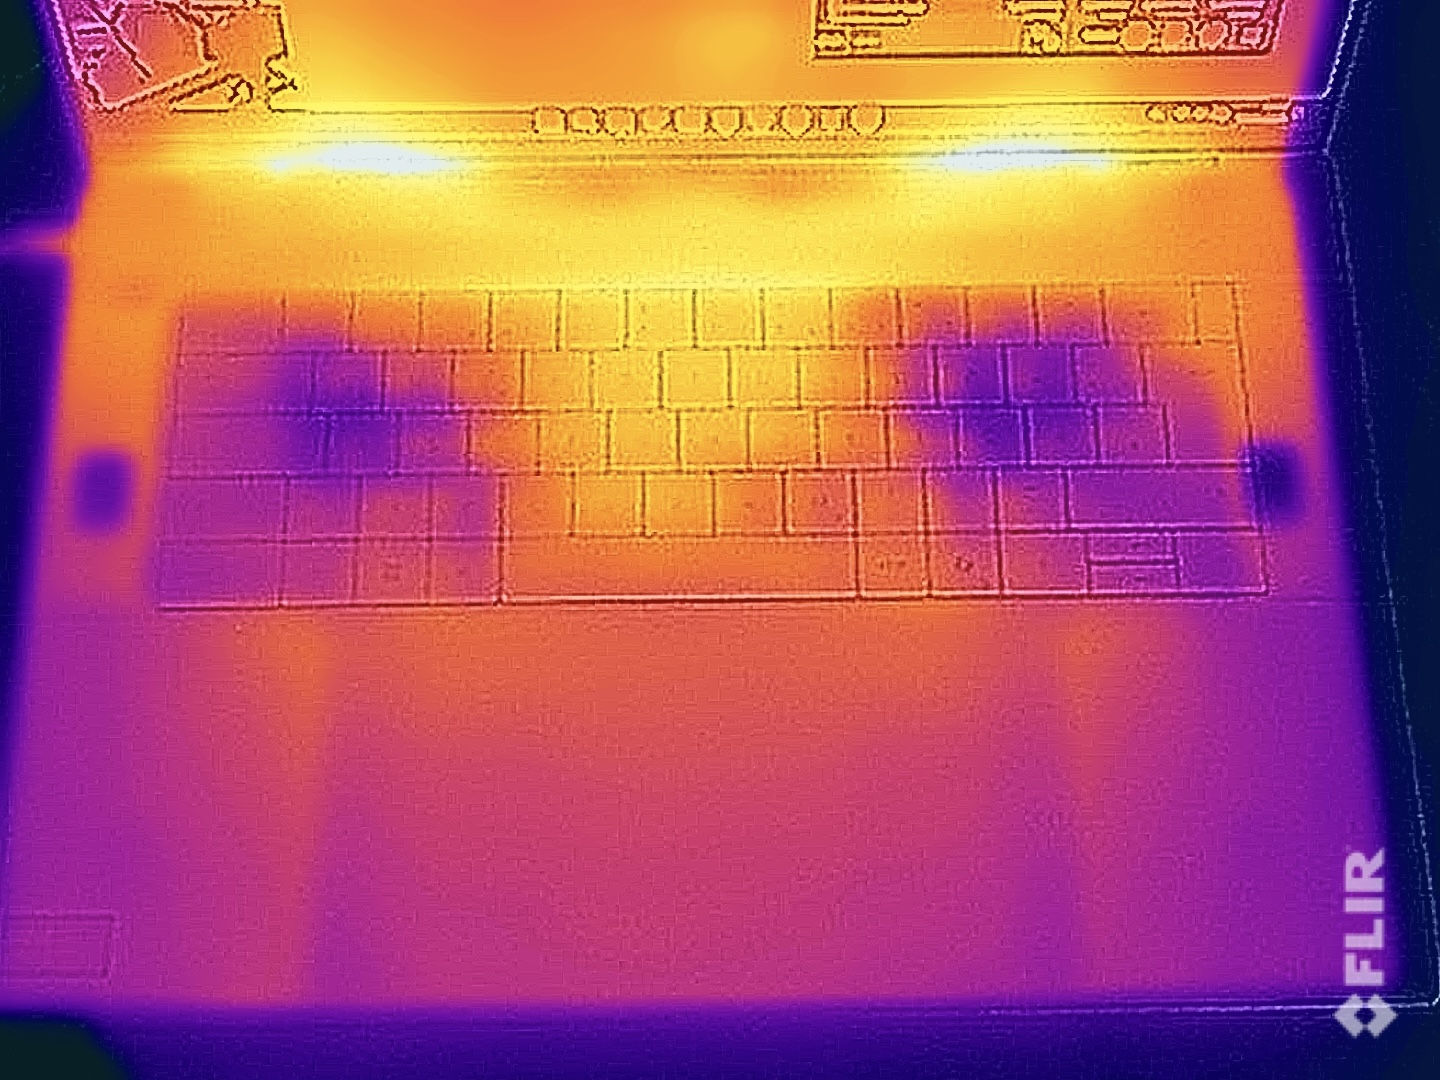
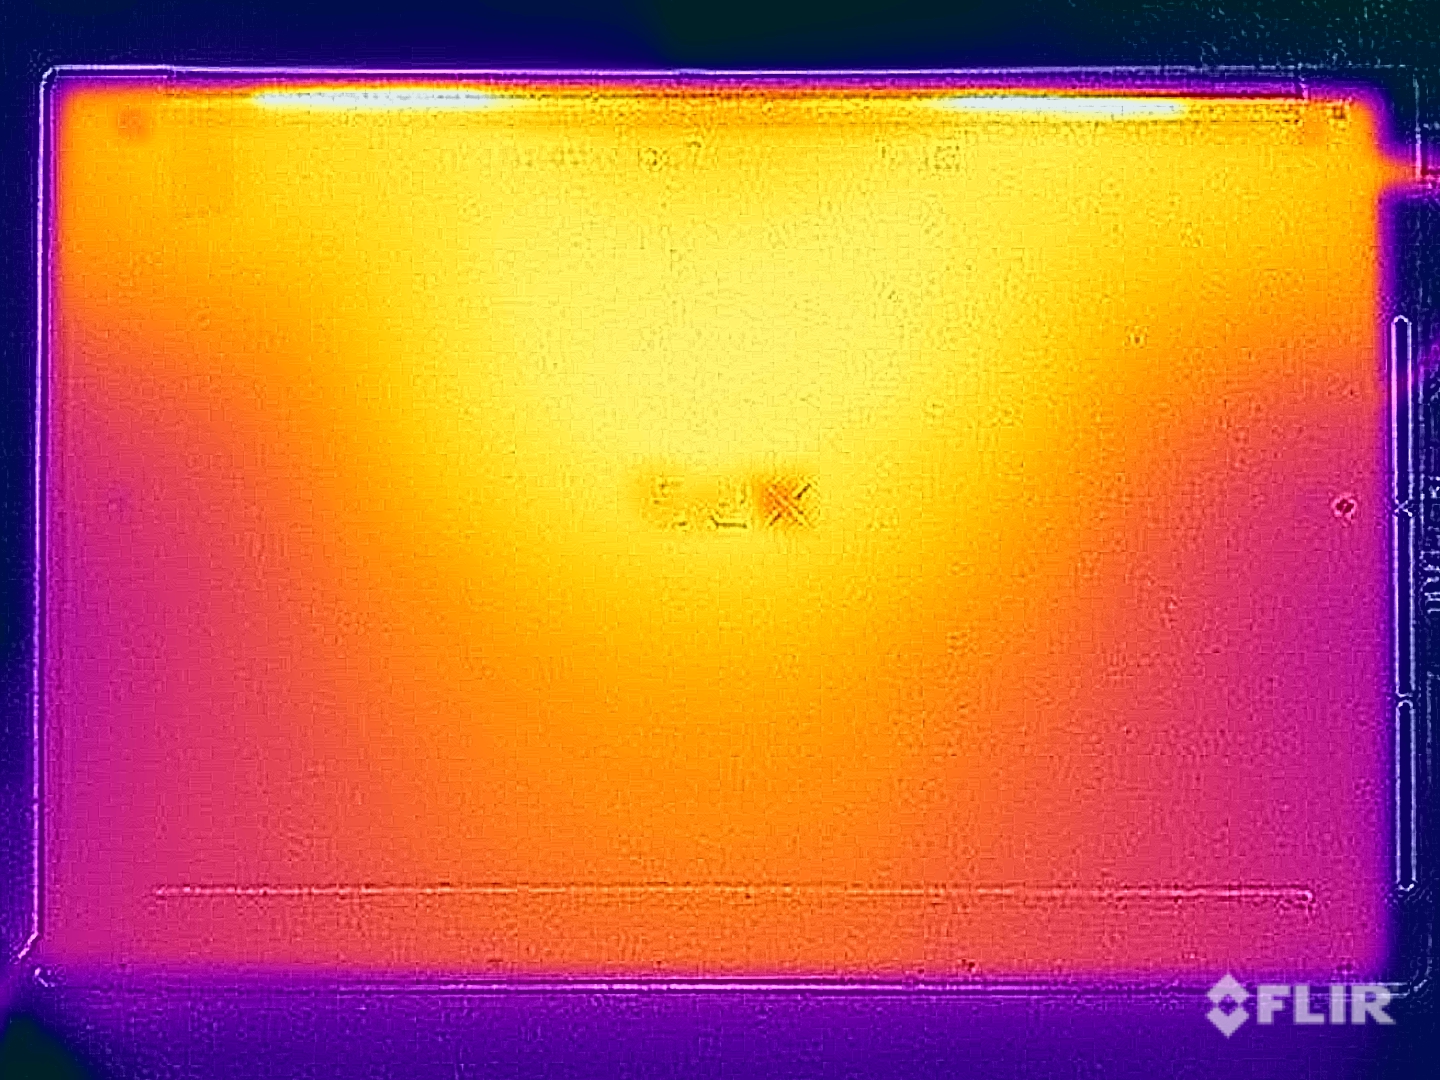
Temperatura
Las temperaturas superficiales del portátil demuestran que Dell podría aumentar el rendimiento de los componentes o reducir la velocidad de los ventiladores, ya que incluso durante la prueba de estrés, nunca medimos más de 40 °C. La carcasa de aluminio apenas se calienta durante las tareas sencillas y en reposo. En la prueba de estrés con carga combinada de CPU y GPU, la tarjeta gráfica se mantuvo estable a 60 vatios, mientras que el procesador tuvo que conformarse con sólo 20 vatios.
(+) La temperatura máxima en la parte superior es de 39.4 °C / 103 F, frente a la media de 36.8 °C / 98 F, que oscila entre 21 y 71 °C para la clase Multimedia.
(+) El fondo se calienta hasta un máximo de 36.9 °C / 98 F, frente a la media de 39.1 °C / 102 F
(+) En reposo, la temperatura media de la parte superior es de 26.3 °C / 79# F, frente a la media del dispositivo de 31.3 °C / 88 F.
(±) Jugando a The Witcher 3, la temperatura media de la parte superior es de 34 °C / 93 F, frente a la media del dispositivo de 31.3 °C / 88 F.
(+) El reposamanos y el panel táctil están a una temperatura inferior a la de la piel, con un máximo de 30.2 °C / 86.4 F y, por tanto, son fríos al tacto.
(±) La temperatura media de la zona del reposamanos de dispositivos similares fue de 28.7 °C / 83.7 F (-1.5 °C / -2.7 F).
| Dell XPS 16 9640 Intel Core Ultra 7 155H, NVIDIA GeForce RTX 4070 Laptop GPU | Samsung Galaxy Book4 Ultra Intel Core Ultra 7 155H, NVIDIA GeForce RTX 4050 Laptop GPU | Honor MagicBook Pro 16 2024 Intel Core Ultra 7 155H, NVIDIA GeForce RTX 4060 Laptop GPU | Asus ROG Zephyrus G16 2024 GU605M Intel Core Ultra 7 155H, NVIDIA GeForce RTX 4070 Laptop GPU | Lenovo Yoga Pro 9 16-IRP G8 Intel Core i7-13705H, NVIDIA GeForce RTX 4060 Laptop GPU | Schenker VISION 16 Pro (M23) Intel Core i7-13700H, NVIDIA GeForce RTX 4070 Laptop GPU | Dell XPS 15 9530 RTX 4070 Intel Core i7-13700H, NVIDIA GeForce RTX 4070 Laptop GPU | |
|---|---|---|---|---|---|---|---|
| Heat | 5% | 3% | -17% | -10% | -15% | -18% | |
| Maximum Upper Side * (°C) | 39.4 | 38.5 2% | 39.7 -1% | 50.3 -28% | 41.6 -6% | 46.7 -19% | 45.6 -16% |
| Maximum Bottom * (°C) | 36.9 | 41.2 -12% | 42.9 -16% | 48 -30% | 50 -36% | 54.1 -47% | 42 -14% |
| Idle Upper Side * (°C) | 28.2 | 23.5 17% | 23.7 16% | 28.8 -2% | 26.8 5% | 26.5 6% | 34.4 -22% |
| Idle Bottom * (°C) | 27.4 | 24.1 12% | 23.5 14% | 29.8 -9% | 27.9 -2% | 26.8 2% | 33.2 -21% |
* ... más pequeño es mejor
Altavoces
El sistema de sonido del XPS 16 consta de cuatro altavoces con una potencia total de 10 vatios. El sonido resultante es bueno y difícilmente le decepcionará, pero competidores como el ROG Zephyrus G16 demuestran que podría ser incluso mejor. Según nuestro análisis, el nuevo XPS 16 también queda ligeramente por detrás del antiguo XPS 15.
Dell XPS 16 9640 análisis de audio
(+) | los altavoces pueden reproducir a un volumen relativamente alto (#83.4 dB)
Graves 100 - 315 Hz
(±) | lubina reducida - en promedio 11.2% inferior a la mediana
(±) | la linealidad de los graves es media (8.9% delta a frecuencia anterior)
Medios 400 - 2000 Hz
(+) | medios equilibrados - a sólo 4.5% de la mediana
(+) | los medios son lineales (3% delta a la frecuencia anterior)
Altos 2 - 16 kHz
(+) | máximos equilibrados - a sólo 1.4% de la mediana
(+) | los máximos son lineales (2% delta a la frecuencia anterior)
Total 100 - 16.000 Hz
(+) | el sonido global es lineal (10% de diferencia con la mediana)
En comparación con la misma clase
» 13% de todos los dispositivos probados de esta clase eran mejores, 2% similares, 84% peores
» El mejor tuvo un delta de 5%, la media fue 17%, el peor fue ###max##%
En comparación con todos los dispositivos probados
» 4% de todos los dispositivos probados eran mejores, 1% similares, 94% peores
» El mejor tuvo un delta de 4%, la media fue 23%, el peor fue ###max##%
Asus ROG Zephyrus G16 2024 GU605M análisis de audio
(+) | los altavoces pueden reproducir a un volumen relativamente alto (#83.3 dB)
Graves 100 - 315 Hz
(+) | buen bajo - sólo 3.8% lejos de la mediana
(±) | la linealidad de los graves es media (8.1% delta a frecuencia anterior)
Medios 400 - 2000 Hz
(+) | medios equilibrados - a sólo 3.5% de la mediana
(+) | los medios son lineales (2.4% delta a la frecuencia anterior)
Altos 2 - 16 kHz
(+) | máximos equilibrados - a sólo 2.2% de la mediana
(+) | los máximos son lineales (3.7% delta a la frecuencia anterior)
Total 100 - 16.000 Hz
(+) | el sonido global es lineal (7.3% de diferencia con la mediana)
En comparación con la misma clase
» 1% de todos los dispositivos probados de esta clase eran mejores, 0% similares, 99% peores
» El mejor tuvo un delta de 6%, la media fue 18%, el peor fue ###max##%
En comparación con todos los dispositivos probados
» 1% de todos los dispositivos probados eran mejores, 0% similares, 99% peores
» El mejor tuvo un delta de 4%, la media fue 23%, el peor fue ###max##%
Lenovo Yoga Pro 9 16-IRP G8 análisis de audio
(±) | la sonoridad del altavoz es media pero buena (80.5 dB)
Graves 100 - 315 Hz
(+) | buen bajo - sólo 4.9% lejos de la mediana
(±) | la linealidad de los graves es media (9.1% delta a frecuencia anterior)
Medios 400 - 2000 Hz
(+) | medios equilibrados - a sólo 3.2% de la mediana
(+) | los medios son lineales (6.5% delta a la frecuencia anterior)
Altos 2 - 16 kHz
(+) | máximos equilibrados - a sólo 2.9% de la mediana
(+) | los máximos son lineales (3% delta a la frecuencia anterior)
Total 100 - 16.000 Hz
(+) | el sonido global es lineal (8.4% de diferencia con la mediana)
En comparación con la misma clase
» 9% de todos los dispositivos probados de esta clase eran mejores, 2% similares, 89% peores
» El mejor tuvo un delta de 5%, la media fue 17%, el peor fue ###max##%
En comparación con todos los dispositivos probados
» 2% de todos los dispositivos probados eran mejores, 1% similares, 97% peores
» El mejor tuvo un delta de 4%, la media fue 23%, el peor fue ###max##%
Dell XPS 15 9530 RTX 4070 análisis de audio
(+) | los altavoces pueden reproducir a un volumen relativamente alto (#83.4 dB)
Graves 100 - 315 Hz
(+) | buen bajo - sólo 3.9% lejos de la mediana
(+) | el bajo es lineal (6.8% delta a la frecuencia anterior)
Medios 400 - 2000 Hz
(+) | medios equilibrados - a sólo 4.4% de la mediana
(+) | los medios son lineales (4.1% delta a la frecuencia anterior)
Altos 2 - 16 kHz
(+) | máximos equilibrados - a sólo 1.1% de la mediana
(+) | los máximos son lineales (3.3% delta a la frecuencia anterior)
Total 100 - 16.000 Hz
(+) | el sonido global es lineal (6.4% de diferencia con la mediana)
En comparación con la misma clase
» 4% de todos los dispositivos probados de esta clase eran mejores, 1% similares, 95% peores
» El mejor tuvo un delta de 5%, la media fue 17%, el peor fue ###max##%
En comparación con todos los dispositivos probados
» 1% de todos los dispositivos probados eran mejores, 0% similares, 99% peores
» El mejor tuvo un delta de 4%, la media fue 23%, el peor fue ###max##%
Gestión de la energía - Mucha resistencia gracias a una batería de 99,5 Wh
Consumo de energía
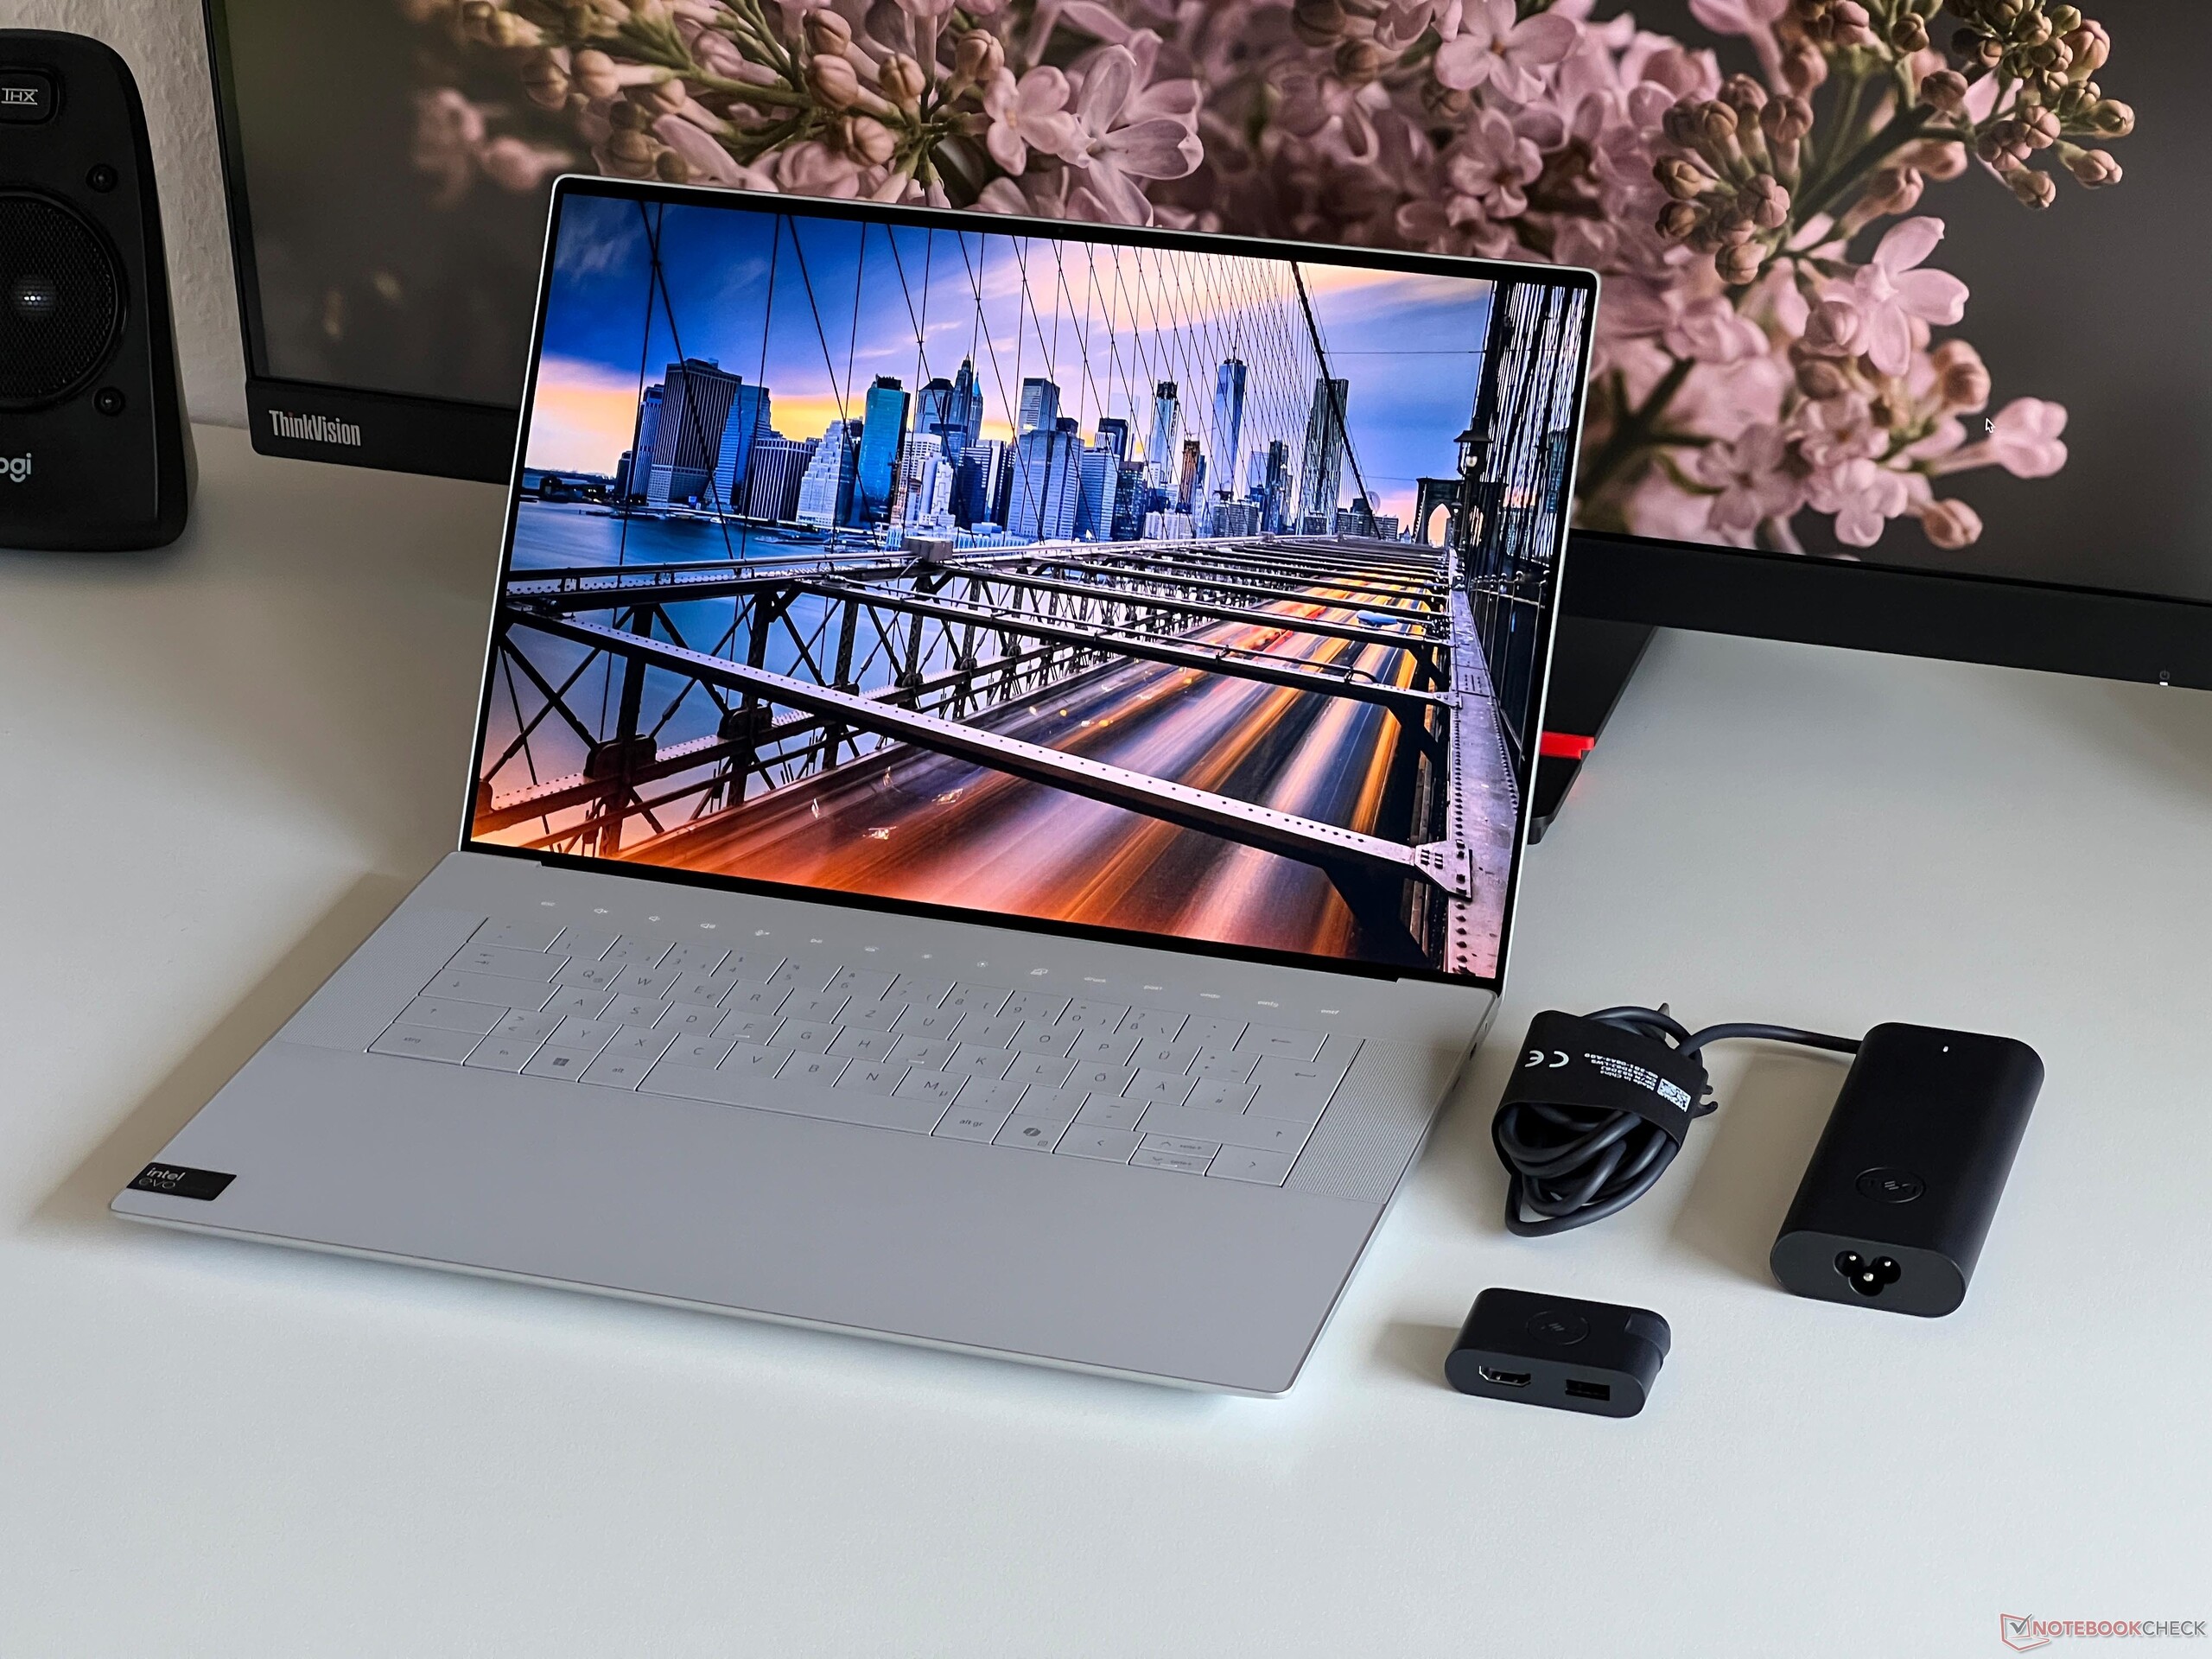
En nuestras mediciones de consumo, la pantalla táctil OLED de alta resolución demostró ser sorprendentemente frugal, ya que a pesar de la imagen de fondo estándar oscura, un consumo máximo de 10,6 vatios no es mucho para una pantalla de 16,3 pulgadas. No observamos sorpresas bajo carga. Durante la prueba de estrés, su consumo rondó brevemente los 138 vatios, pero luego se estabilizó en 125 vatios al cabo de 1,5 minutos y más tarde en 115 vatios. Puede que no haya mucho margen pero, en general, la compacta fuente de alimentación de 130 vatios tiene un tamaño suficiente.
| Off / Standby | |
| Ocioso | |
| Carga |
|
Clave:
min: | |
| Dell XPS 16 9640 Ultra 7 155H, GeForce RTX 4070 Laptop GPU, Kioxia XG8 KXG80ZNV1T02, OLED, 3840x2400, 16.3" | Samsung Galaxy Book4 Ultra Ultra 7 155H, GeForce RTX 4050 Laptop GPU, Samsung PM9A1 MZVL2512HCJQ, OLED, 2880x1800, 16" | Honor MagicBook Pro 16 2024 Ultra 7 155H, GeForce RTX 4060 Laptop GPU, WD PC SN740 SDDPNQD-1T00, IPS, 3072x1920, 16" | Asus ROG Zephyrus G16 2024 GU605M Ultra 7 155H, GeForce RTX 4070 Laptop GPU, WD PC SN560 SDDPNQE-1T00, OLED, 2560x1600, 16" | Lenovo Yoga Pro 9 16-IRP G8 i7-13705H, GeForce RTX 4060 Laptop GPU, Samsung PM9A1 MZVL21T0HCLR, Mini-LED, 3200x2000, 16" | Schenker VISION 16 Pro (M23) i7-13700H, GeForce RTX 4070 Laptop GPU, Samsung 990 Pro 1 TB, IPS, 2560x1600, 16" | Dell XPS 15 9530 RTX 4070 i7-13700H, GeForce RTX 4070 Laptop GPU, SK hynix PC801 HFS001TEJ9X101N, OLED, 3456x2160, 15.6" | Medio NVIDIA GeForce RTX 4070 Laptop GPU | Media de la clase Multimedia | |
|---|---|---|---|---|---|---|---|---|---|
| Power Consumption | 22% | -20% | -11% | -58% | -16% | -57% | -73% | 9% | |
| Idle Minimum * (Watt) | 7.7 | 4.8 38% | 5.2 32% | 8.3 -8% | 10.9 -42% | 8.6 -12% | 20 -160% | 13.2 ? -71% | 5.62 ? 27% |
| Idle Average * (Watt) | 10.3 | 7.5 27% | 14.4 -40% | 12.5 -21% | 22.6 -119% | 12 -17% | 20.7 -101% | 18.2 ? -77% | 10.2 ? 1% |
| Idle Maximum * (Watt) | 10.6 | 7.9 25% | 15.4 -45% | 12.8 -21% | 23.5 -122% | 12.4 -17% | 22.4 -111% | 24.6 ? -132% | 12.5 ? -18% |
| Load Average * (Watt) | 76.5 | 79.3 -4% | 105.4 -38% | 71.3 7% | 84.6 -11% | 80 -5% | 77.1 -1% | 97 ? -27% | 65 ? 15% |
| Witcher 3 ultra * (Watt) | 126.4 | 79.2 37% | 107.6 15% | 127.5 -1% | 159.5 -26% | 147.7 -17% | 95.4 25% | ||
| Load Maximum * (Watt) | 138.5 | 125 10% | 195.2 -41% | 169.1 -22% | 177.3 -28% | 173.1 -25% | 133.4 4% | 221 ? -60% | 111.9 ? 19% |
* ... más pequeño es mejor
Power consumption Witcher 3 / stress test
Power consumption with external monitor
Tiempos de ejecución
Dell ha instalado la mayor batería posible en el nuevo XPS 16, que tiene una capacidad de 99,5 Wh y, en total, sus tiempos de ejecución son muy buenos. En nuestra prueba WLAN a 150 cd/m² (corresponde al 57 % del brillo SDR máximo del dispositivo de prueba), medimos 10:29 horas a 60 Hz (09:56 horas a 90 Hz) y algo más de 8 horas a brillo máximo y 60 Hz (~07:20 horas a 90 Hz). Durante la prueba de vídeo a 150 cd/m², observamos unas muy buenas 16,5 horas y aquí, el procesador Meteor Lake se beneficia de sus dos núcleos de baja eficiencia energética. Un vídeo HDR a pleno brillo pudo reproducirse durante algo más de 6,5 horas y a plena carga, la prueba terminó tras algo menos de 1,5 horas.
El XPS 16 ofrece dos velocidades de carga: En modo normal, la batería tarda 151 minutos (80 % tras 93 minutos) en cargarse por completo al encender el dispositivo; en modo exprés, tarda 97 minutos (80 % tras 50 minutos).
| Dell XPS 16 9640 Ultra 7 155H, GeForce RTX 4070 Laptop GPU, 99.5 Wh | Samsung Galaxy Book4 Ultra Ultra 7 155H, GeForce RTX 4050 Laptop GPU, 76 Wh | Honor MagicBook Pro 16 2024 Ultra 7 155H, GeForce RTX 4060 Laptop GPU, 75 Wh | Asus ROG Zephyrus G16 2024 GU605M Ultra 7 155H, GeForce RTX 4070 Laptop GPU, 90 Wh | Lenovo Yoga Pro 9 16-IRP G8 i7-13705H, GeForce RTX 4060 Laptop GPU, 75 Wh | Schenker VISION 16 Pro (M23) i7-13700H, GeForce RTX 4070 Laptop GPU, 80 Wh | Dell XPS 15 9530 RTX 4070 i7-13700H, GeForce RTX 4070 Laptop GPU, 86 Wh | Media de la clase Multimedia | |
|---|---|---|---|---|---|---|---|---|
| Duración de Batería | -0% | -13% | -27% | -49% | -31% | -12% | 10% | |
| H.264 (h) | 16.5 | 17.9 8% | 13.1 -21% | 11.2 -32% | 7.5 -55% | 7.8 -53% | 16.8 ? 2% | |
| WiFi v1.3 (h) | 10.5 | 10.9 4% | 12.2 16% | 7.3 -30% | 6.4 -39% | 7.8 -26% | 8 -24% | 12.3 ? 17% |
| Load (h) | 1.5 | 1.3 -13% | 1 -33% | 1.2 -20% | 0.7 -53% | 1.3 -13% | 1.5 0% | 1.645 ? 10% |
Pro
Contra
Veredicto - El nuevo diseño XPS funciona mejor como dispositivo de 16 pulgadas
En total, el nuevo Dell XPS 16 causa mejor impresión que el modelo más pequeño de 14 pulgadas. A pesar de su gran peso, el diseño del portátil no se siente terriblemente voluminoso y su huella se beneficia en comparación con la competencia gracias también a sus biseles delgados. Aun así, hay que tener en cuenta que este modelo también pone el diseño en primer plano, lo que lleva en particular a la pantalla de 60 vatios Portátil RTX 4070sea mediocre. A su vez, el rendimiento de su CPU es bueno, aunque los procesadores Meteor Lake no ofrezcan ninguna ventaja sobre los antiguos modelos Raptor-Lake.
La pantalla táctil OLED 4K del dispositivo muestra una buena calidad de imagen con colores precisos pero, en comparación con los paneles OLED más actuales, se puede notar un claro efecto de trama al ver contenidos claros; además, su frecuencia de refresco de 90 Hz ya no está totalmente actualizada. Sus nuevos dispositivos de entrada tampoco son los mejores, ya que cuesta acostumbrarse a su teclado y la barra táctil en particular es más bien un inconveniente en el uso diario. En lo que respecta a la conectividad, tendrá que conformarse con tres puertos USB-C -como en el XPS 14 más pequeño-, mientras que el XPS 16 más caro con el portátil RTX 4070 sólo parece tener 2x Thunderbolt y los dos modelos más débiles cuentan con 3x Thunderbolt 4.
El Dell XPS 16 se centra en el diseño a la vez que ofrece un buen rendimiento de la CPU, sin embargo, la ergonomía de sus dispositivos de entrada y el rendimiento de la GPU se resienten por ello. Además, con un precio de 2.899 dólares, es extremadamente caro.
No tenemos nada negativo que decir sobre los altavoces y los tiempos de ejecución del portátil y, en general, su construcción y la estabilidad de la carcasa son buenas, aunque nuestra muestra de prueba mostró un pequeño defecto de construcción entre los dos puertos USB-C. Sus temperaturas superficiales se mantienen muy bajas incluso bajo carga, sin embargo, los ventiladores son muy ruidosos y no notamos grandes diferencias entre todos los perfiles de energía. Las opciones de configuración muestran bastantes limitaciones, especialmente en lo que se refiere a la RAM. Puede seleccionar un máximo de 64 GB de RAM, pero sólo en combinación con el Core Ultra 9 185H.
Sólo hay que tener clara una cosa, y es que el rendimiento no es el único punto de venta del XPS 16: la competencia ofrece mucho más rendimiento, especialmente en lo que se refiere al campo de las GPU. Al mismo tiempo, a 2.899 dólares, el precio del Dell XPS 16 es extremadamente alto y muchos de sus competidores ofrecen una mejor relación precio-rendimiento.
Precio y disponibilidad
La nueva XPS 16 9640 puede encargarse actualmente directamente a Dell, con precios a partir de 1.699 dólares.
Dell XPS 16 9640
- 04/09/2024 v7 (old)
Andreas Osthoff
Transparencia
La selección de los dispositivos que se van a reseñar corre a cargo de nuestro equipo editorial. La muestra de prueba fue proporcionada al autor en calidad de préstamo por el fabricante o el minorista a los efectos de esta reseña. El prestamista no tuvo ninguna influencia en esta reseña, ni el fabricante recibió una copia de la misma antes de su publicación. No había ninguna obligación de publicar esta reseña. Como empresa de medios independiente, Notebookcheck no está sujeta a la autoridad de fabricantes, minoristas o editores.
Así es como prueba Notebookcheck
Cada año, Notebookcheck revisa de forma independiente cientos de portátiles y smartphones utilizando procedimientos estandarizados para asegurar que todos los resultados son comparables. Hemos desarrollado continuamente nuestros métodos de prueba durante unos 20 años y hemos establecido los estándares de la industria en el proceso. En nuestros laboratorios de pruebas, técnicos y editores experimentados utilizan equipos de medición de alta calidad. Estas pruebas implican un proceso de validación en varias fases. Nuestro complejo sistema de clasificación se basa en cientos de mediciones y puntos de referencia bien fundamentados, lo que mantiene la objetividad.Price comparison

