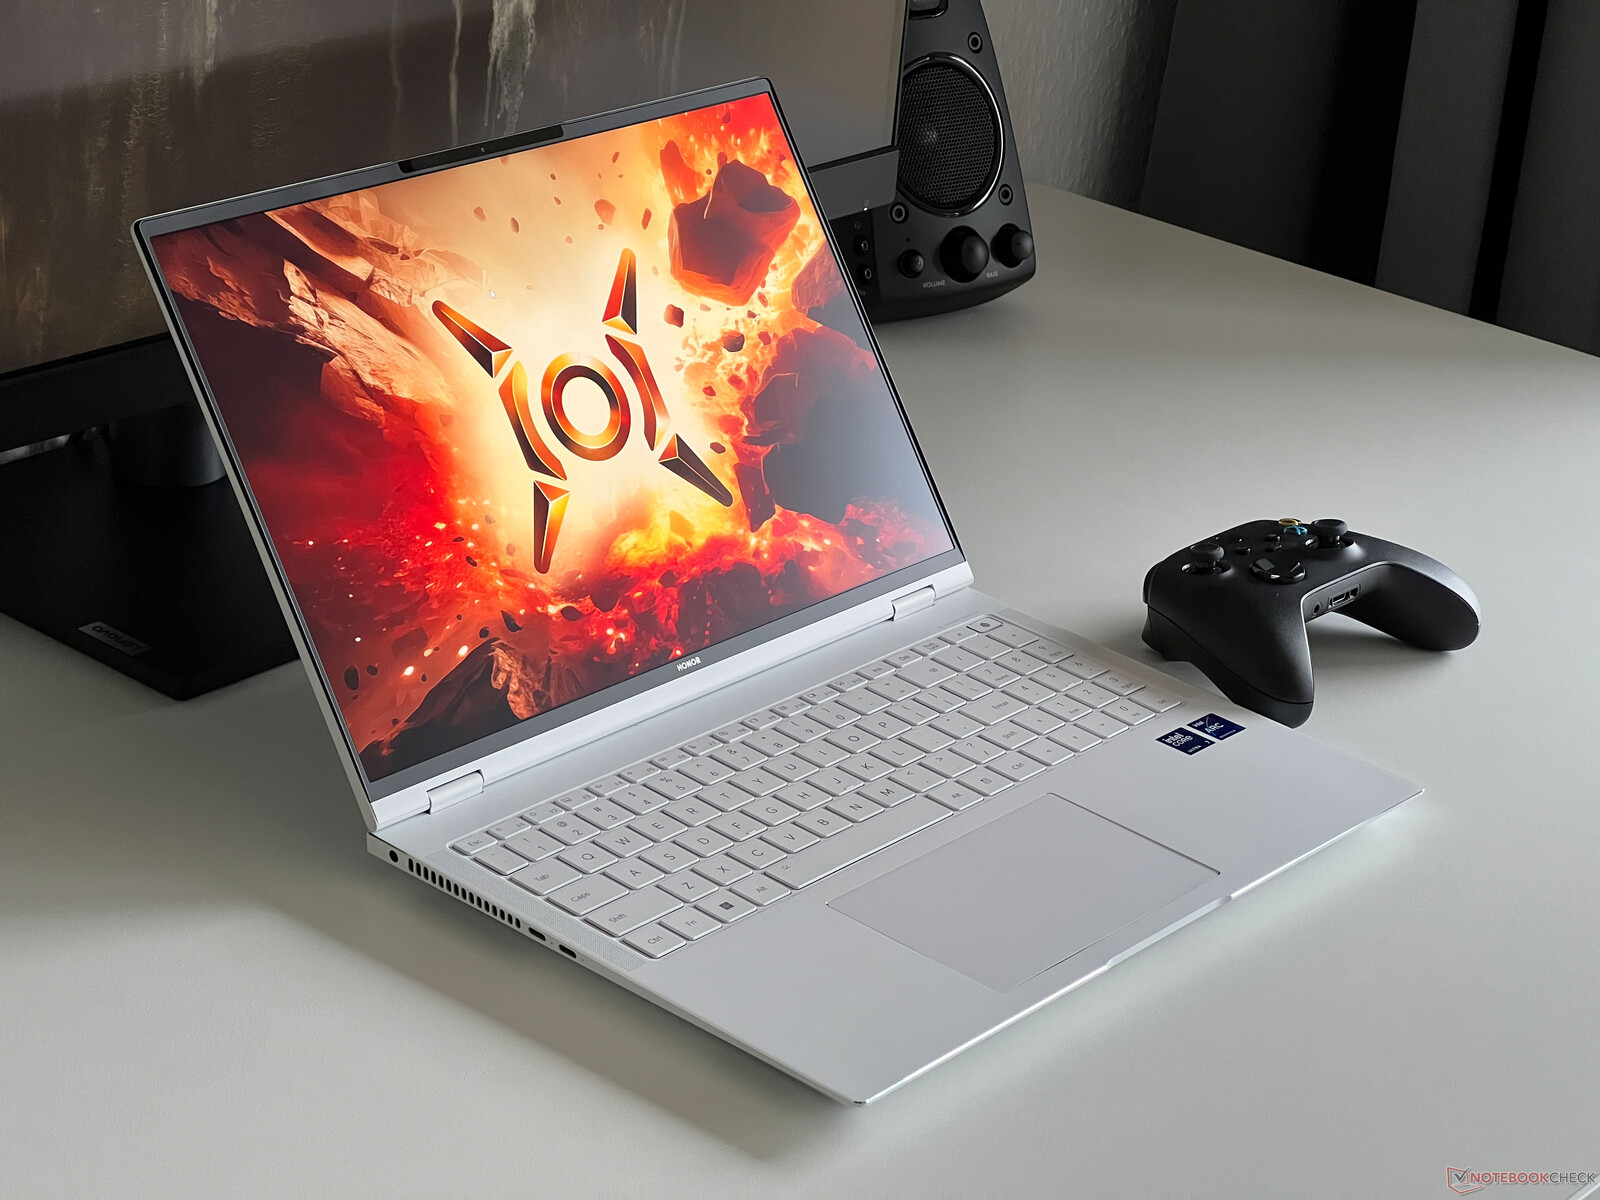
Honor MagicBook Pro 16 2024 - Un portátil multimedia con panel IPS de 165 Hz y RTX 4060
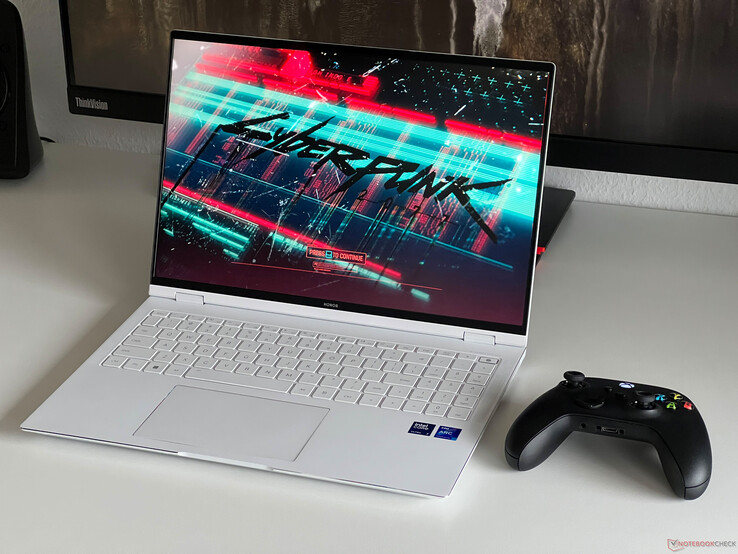
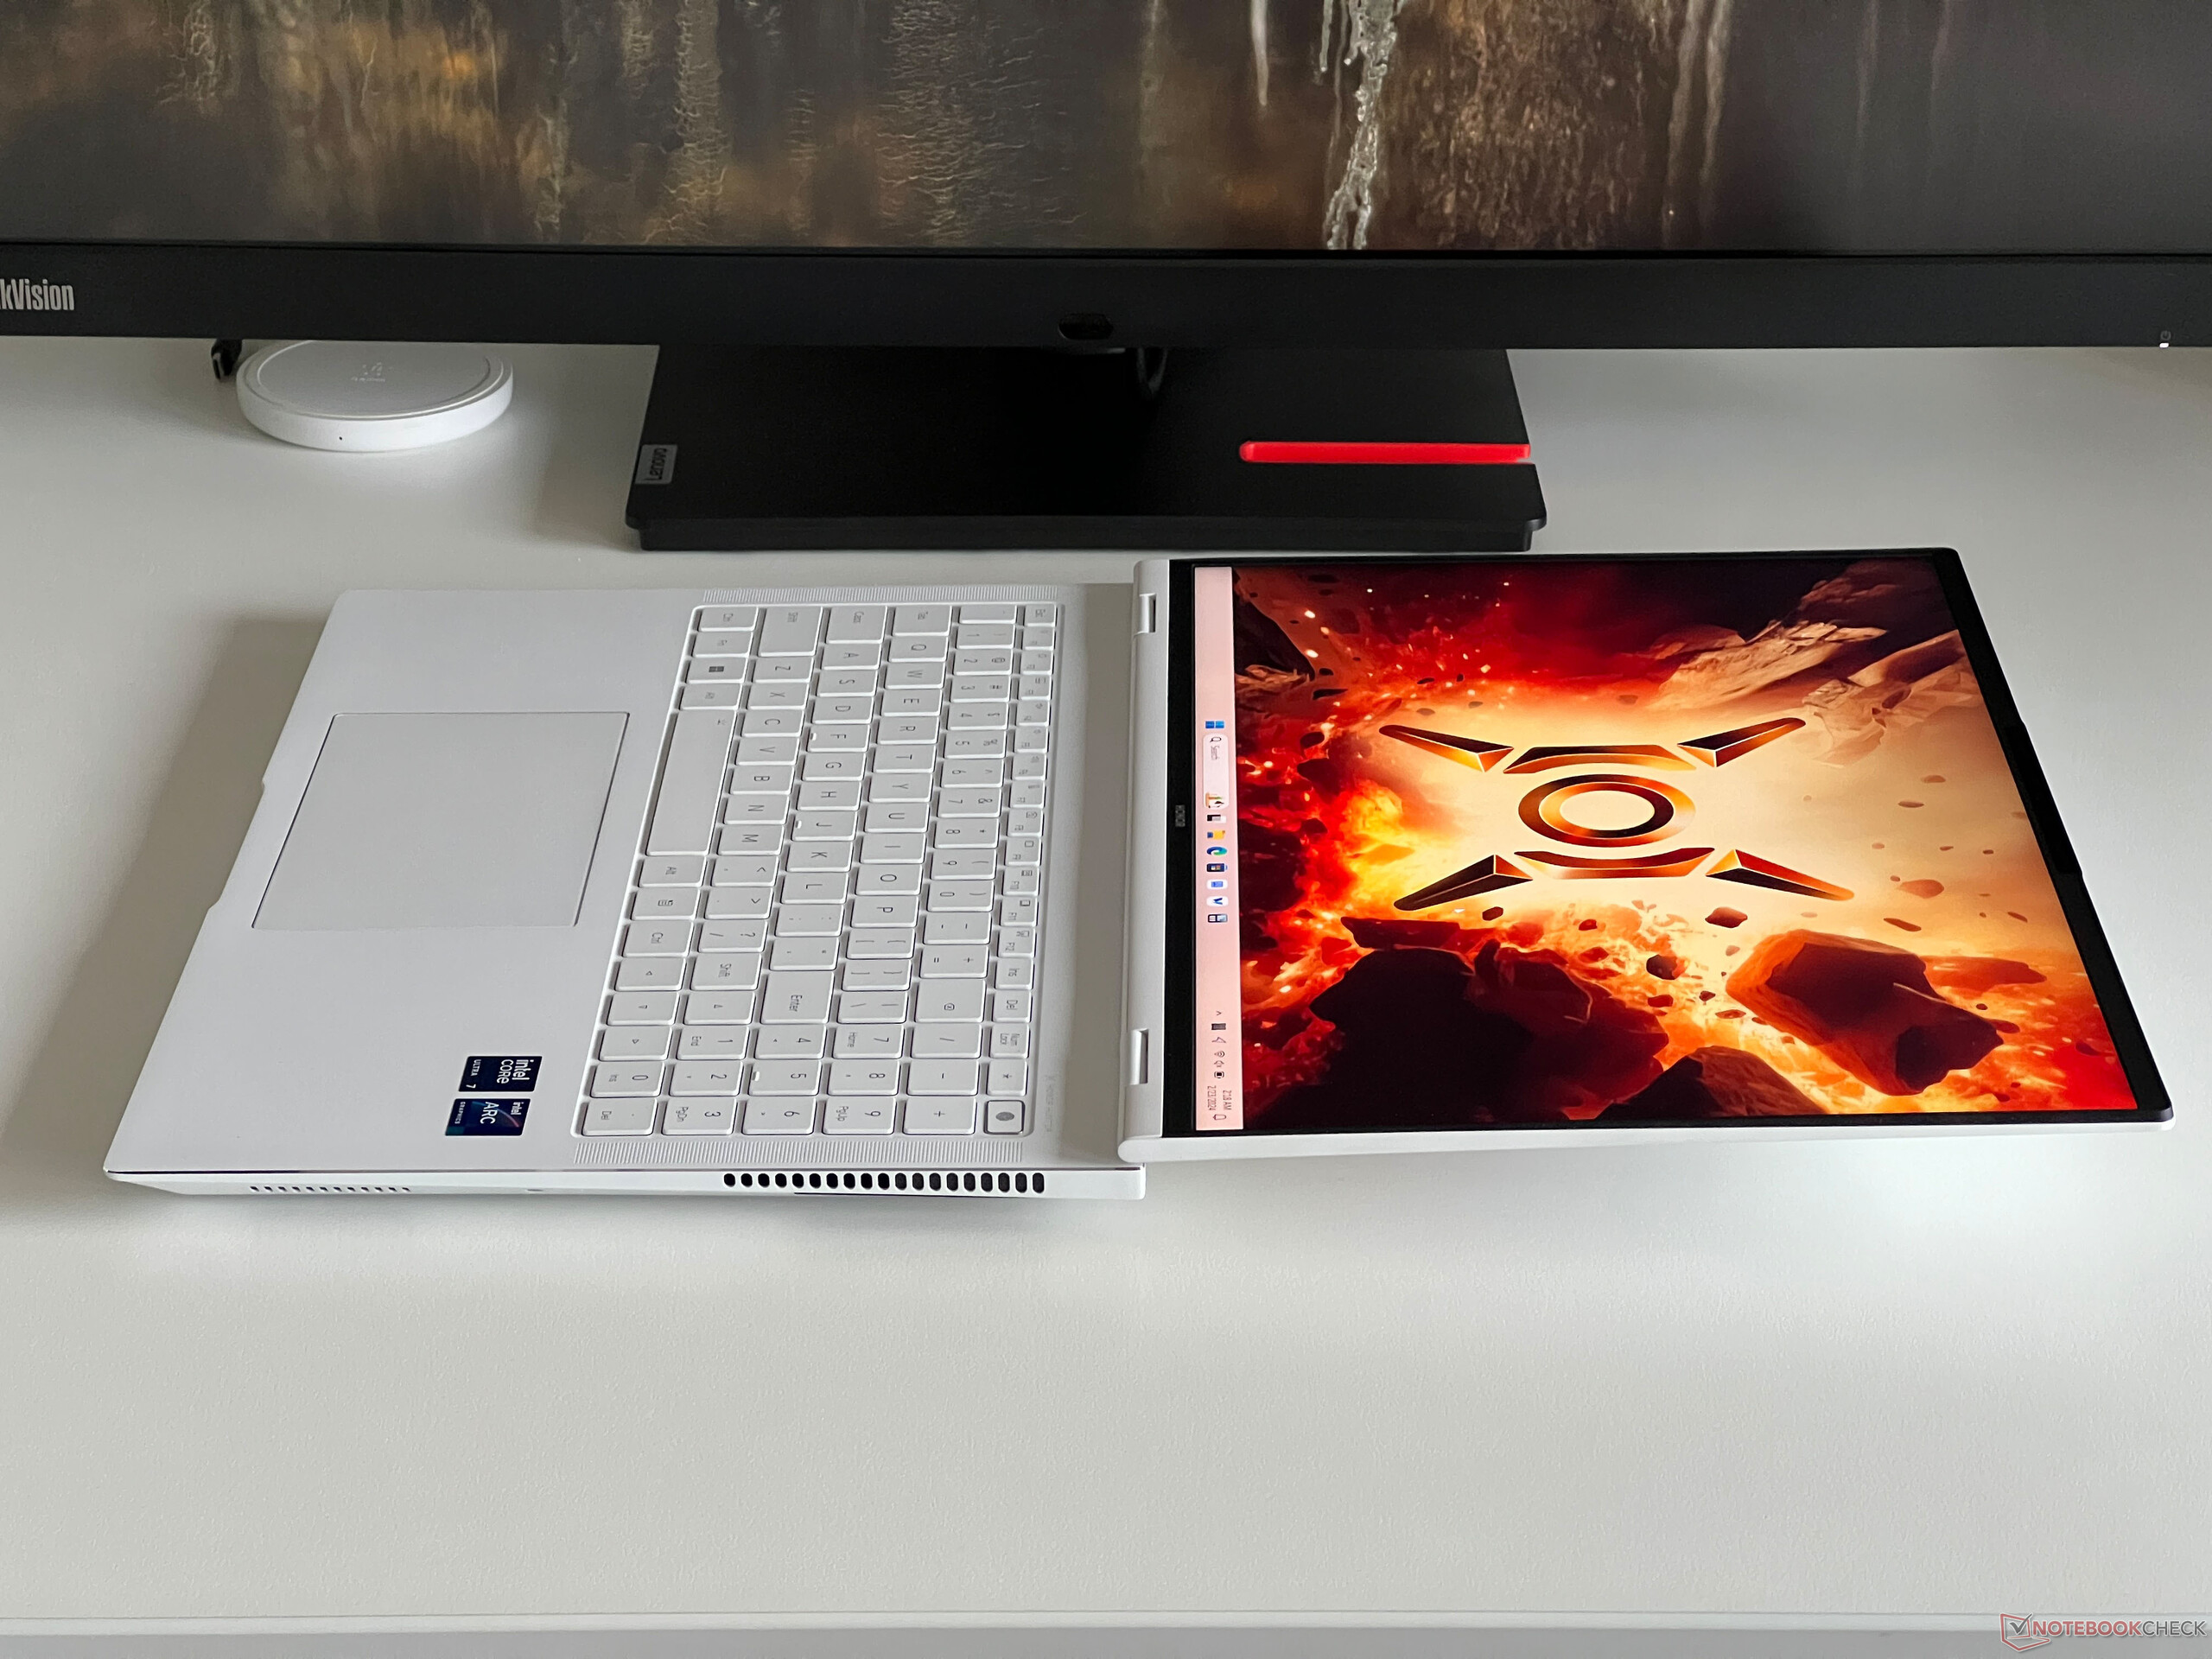
El nombre MagicBook Pro 16 evoca inmediatamente la idea de un portátil multimedia con una buena relación calidad-precio. Sin embargo, con el modelo 2024, Honor está adoptando un nuevo enfoque al presentarnos un portátil multimedia que viene con un procesador Intel Meteor Lake actualizado, así como con la versión para portátiles de la Nvidia GeForce RTX 4060. Tenemos la suerte de que se nos haya permitido revisar a fondo el nuevo MagicBook Pro 16 antes de que salga oficialmente a la calle. Además del Core Ultra 7 155H y el GeForce Portátil RTX 4060tenemos 32 GB de RAM, una unidad SSD de 1 TB y una pantalla IPS mate de 500 cd/m², 165 Hz y cobertura P3. En el momento de la prueba, no podemos dar un precio para esta configuración.
Posibles contendientes en la comparación
Valoración | Fecha | Modelo | Peso | Altura | Tamaño | Resolución | Precio |
|---|---|---|---|---|---|---|---|
| 90 % v7 (old) | 03/2024 | Honor MagicBook Pro 16 2024 Ultra 7 155H, GeForce RTX 4060 Laptop GPU | 1.9 kg | 17.9 mm | 16.00" | 3072x1920 | |
| 89.6 % v7 (old) | 01/2024 | Framework Laptop 16 R9 7940HS, Radeon RX 7700S | 2.4 kg | 20.95 mm | 16.00" | 2560x1600 | |
| 88.6 % v7 (old) | 12/2023 | Lenovo ThinkPad Z16 Gen 2 R9 PRO 7940HS, Radeon RX 6550M | 1.8 kg | 15.8 mm | 16.00" | 3840x2400 | |
| 87.1 % v7 (old) | 08/2023 | Dell Inspiron 16 Plus 7630 i7-13700H, GeForce RTX 4060 Laptop GPU | 2.2 kg | 19.95 mm | 16.00" | 2560x1600 | |
| 88.4 % v7 (old) | 08/2023 | Lenovo Yoga Pro 9 16-IRP G8 i7-13705H, GeForce RTX 4060 Laptop GPU | 2.2 kg | 18.2 mm | 16.00" | 3200x2000 | |
| 88.6 % v7 (old) | 07/2023 | Schenker VISION 16 Pro (M23) i7-13700H, GeForce RTX 4070 Laptop GPU | 1.6 kg | 17.1 mm | 16.00" | 2560x1600 | |
| 86.2 % v7 (old) | 07/2023 | Asus Vivobook Pro 16X K6604JV-MX016W i9-13980HX, GeForce RTX 4060 Laptop GPU | 2.1 kg | 22.8 mm | 16.00" | 3200x2000 |
Funda - El MagicBook Pro viene con una funda de plástico
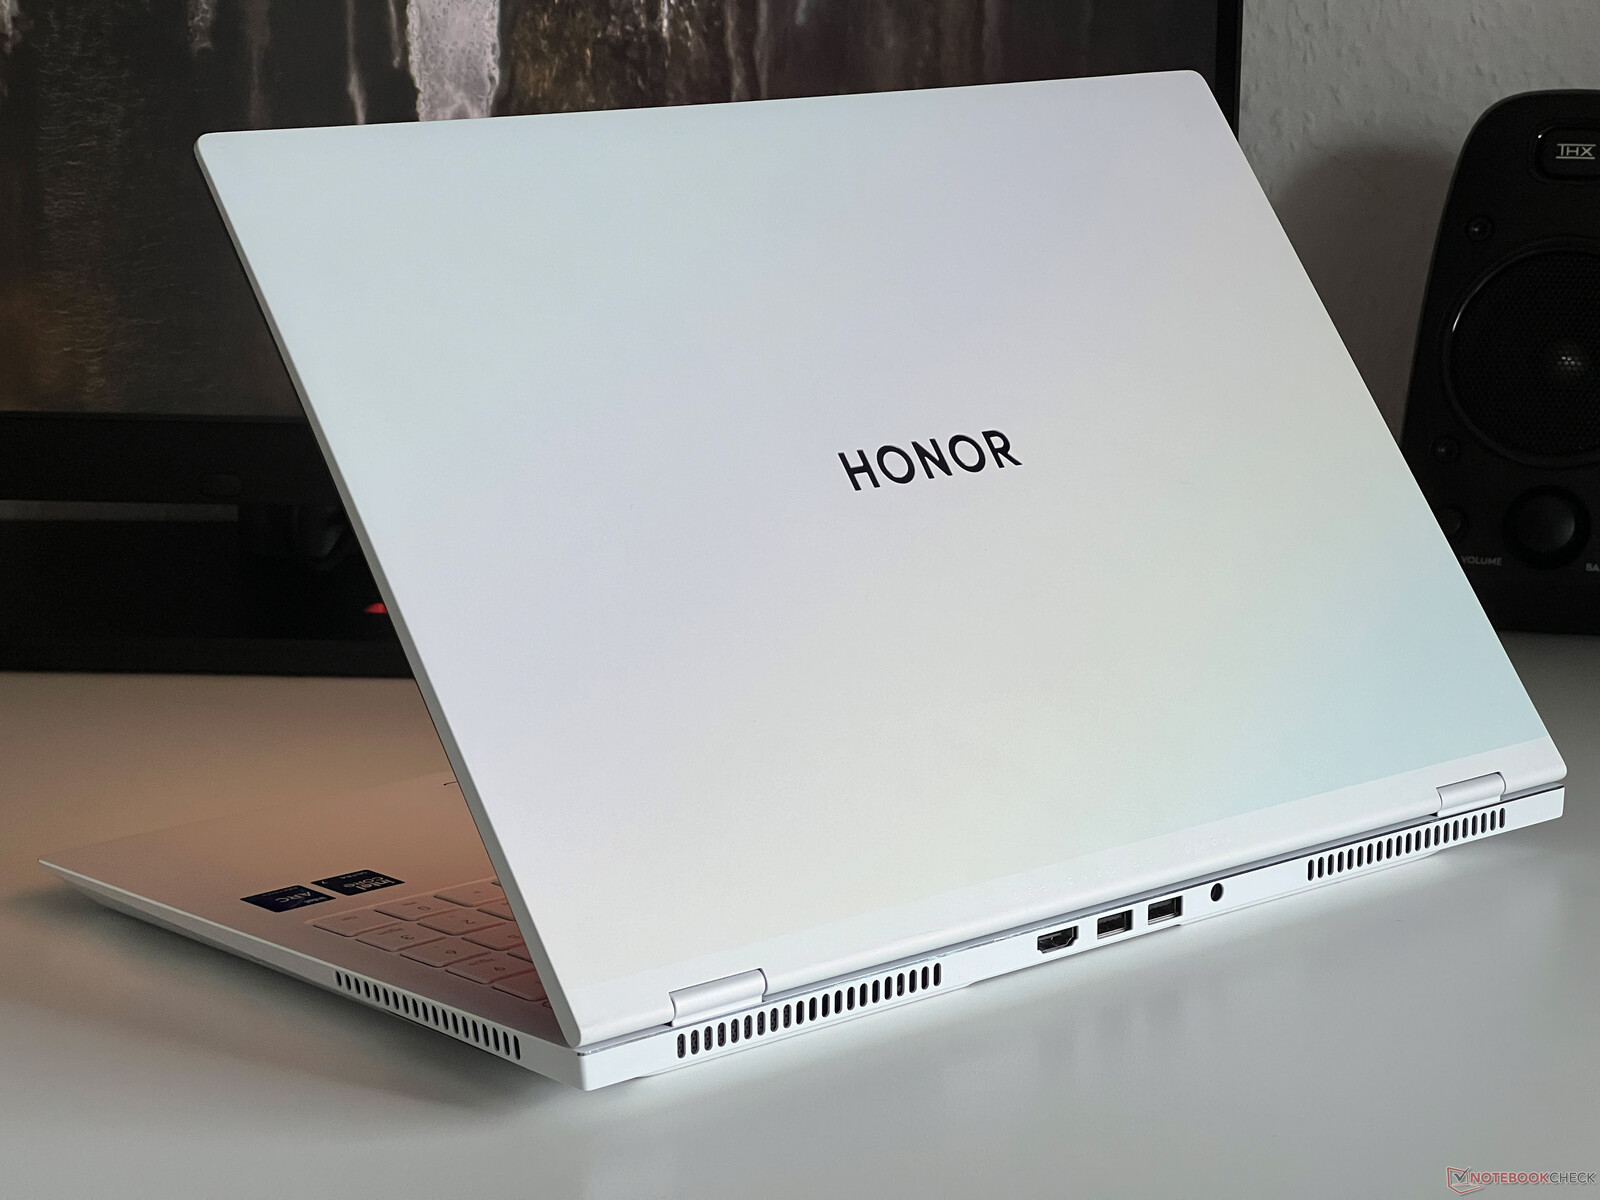
El MagicBook Pro 16 está disponible en blanco o morado, aunque se ha aplicado un color metálico a las tapas de la pantalla. Aparte de eso, el dispositivo es muy discreto y, aparte del embellecedor que rodea la unidad base, las dos entradas de aire negras y el marco negro de la pantalla, no hay elementos de diseño.
La carcasa es completamente de plástico y, aunque el acabado es muy bueno, nuestro dispositivo de revisión evidenció ligeros crujidos al manipularlo. La estabilidad parece ser muy buena, ya que la zona central del teclado permanece sólida incluso cuando se aplica presión. Esto también se aplica a la fina tapa de la pantalla, ya que no pudimos provocar ninguna distorsión de la imagen. Las bisagras permiten un ángulo de apertura máximo de 180 grados y la tapa puede abrirse con una sola mano, aunque, al hacerlo, la propia tapa tiende a tambalearse ligeramente.
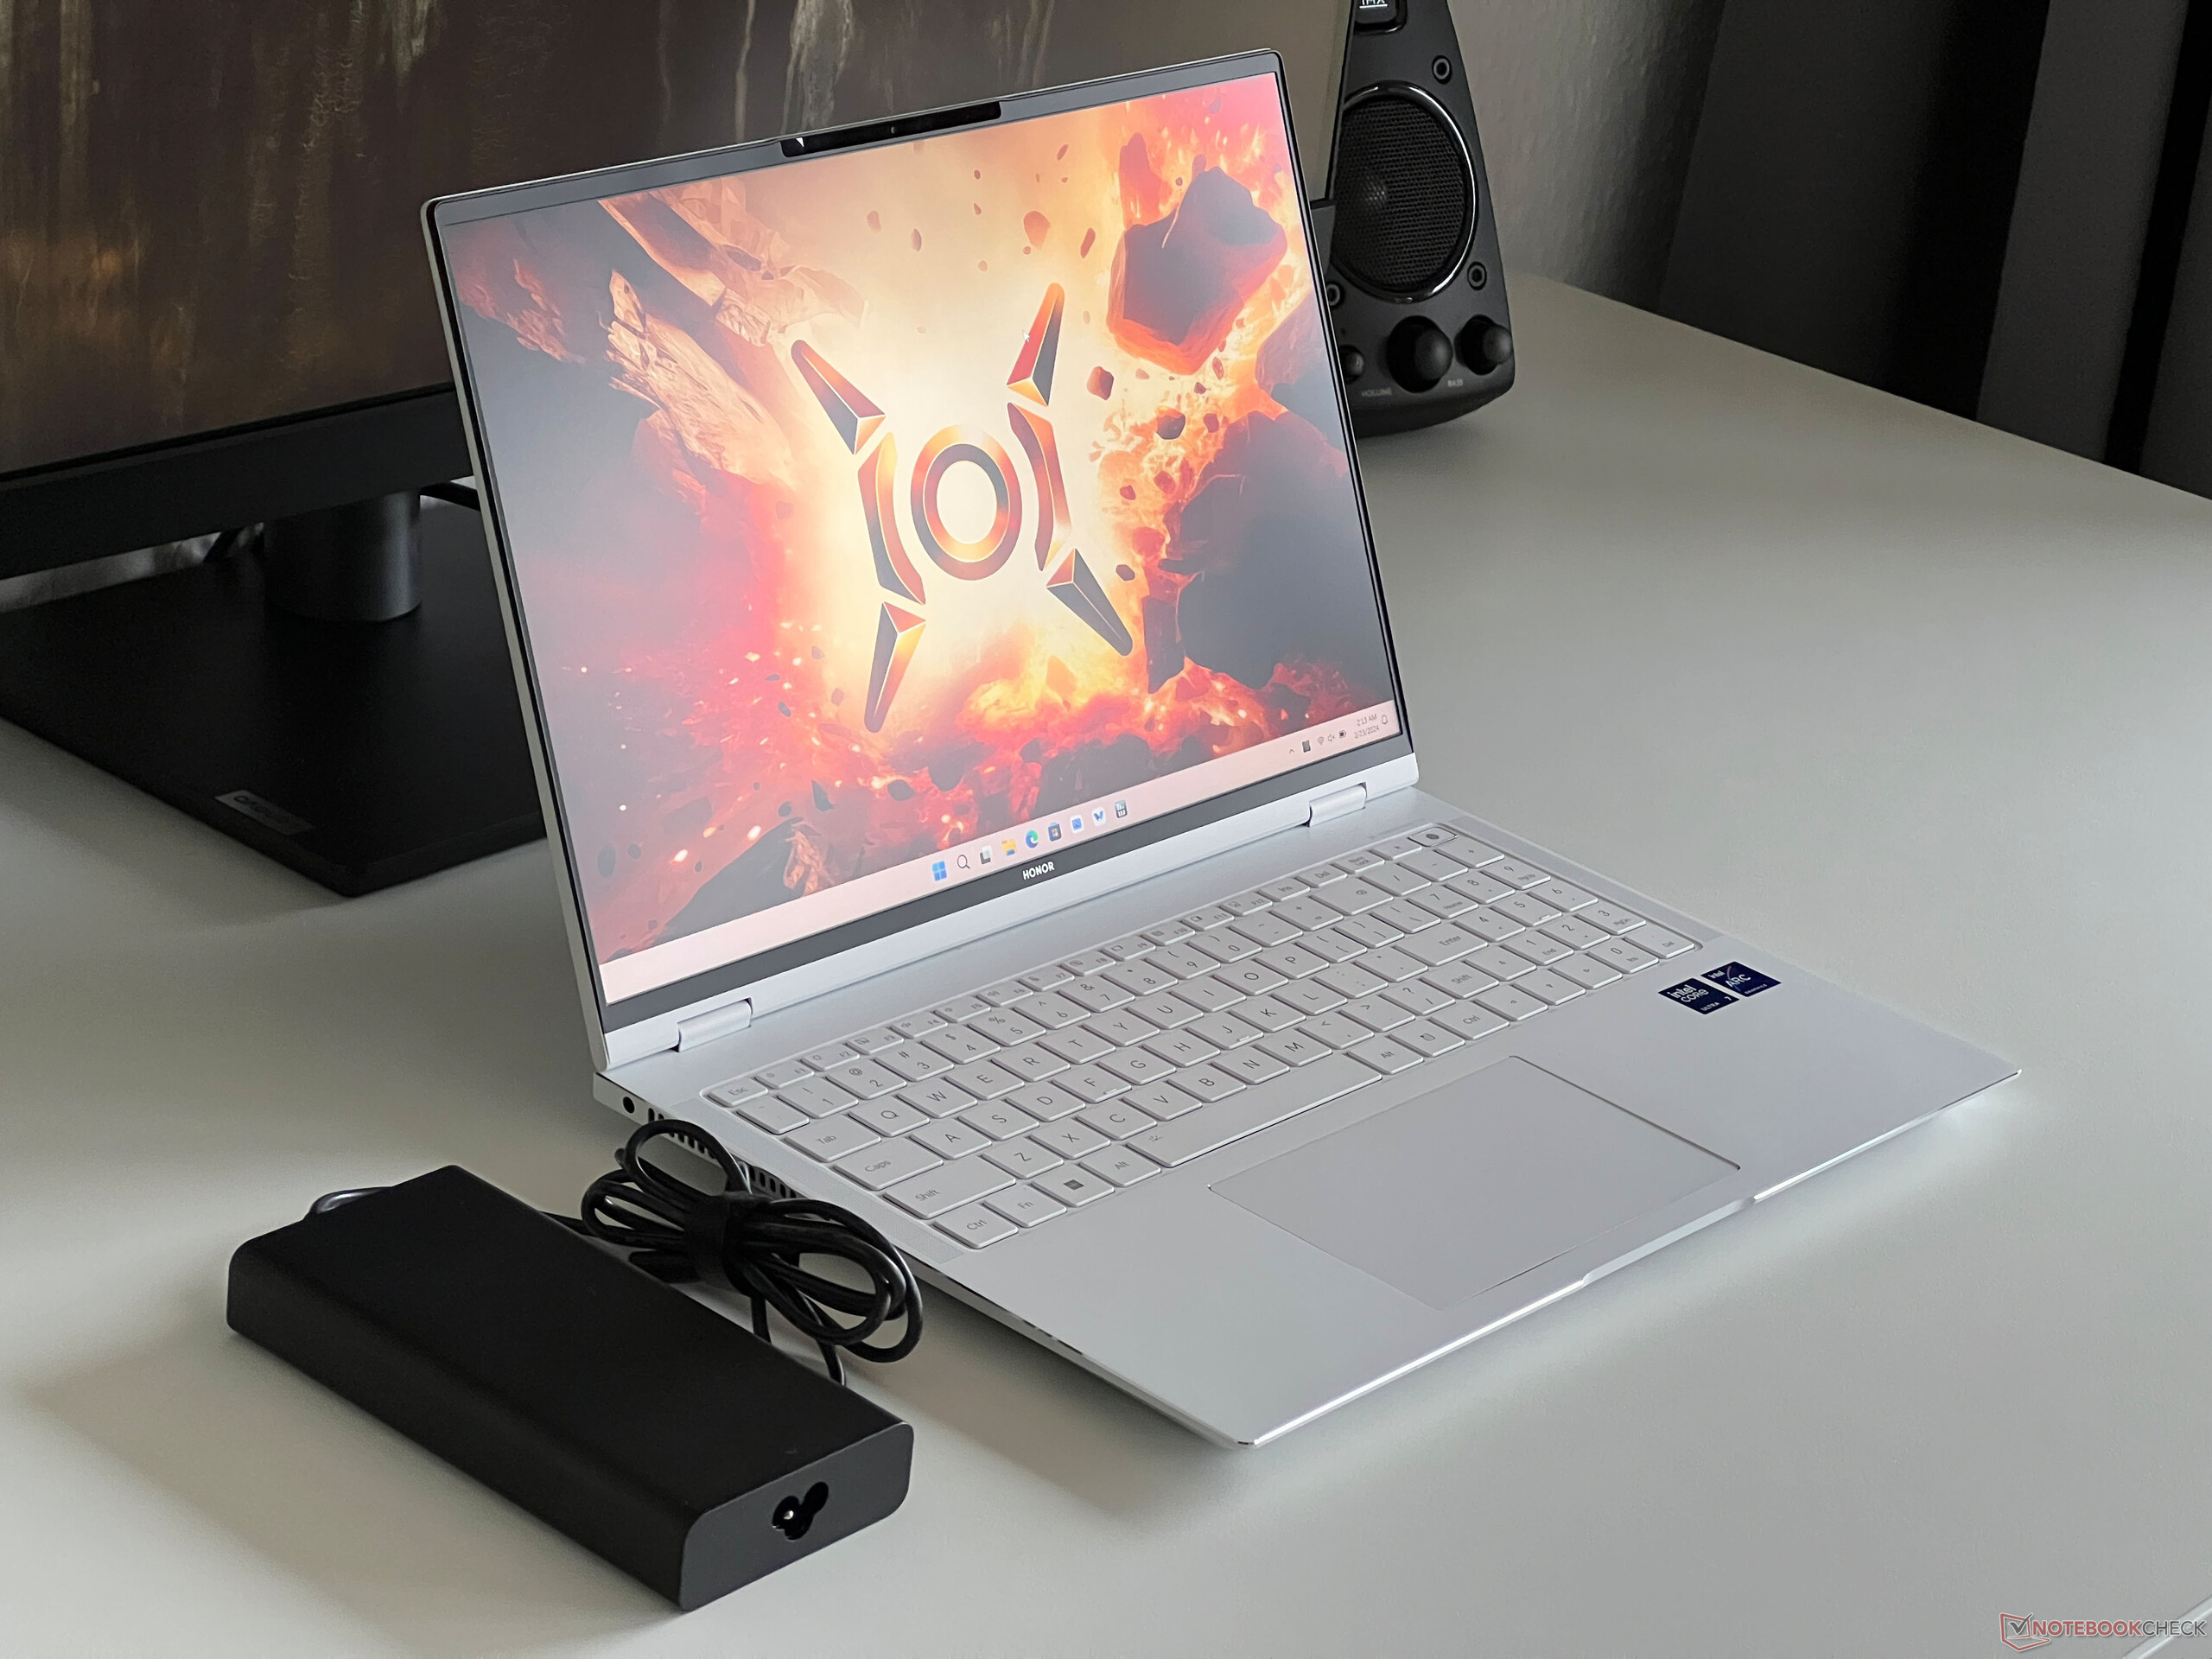
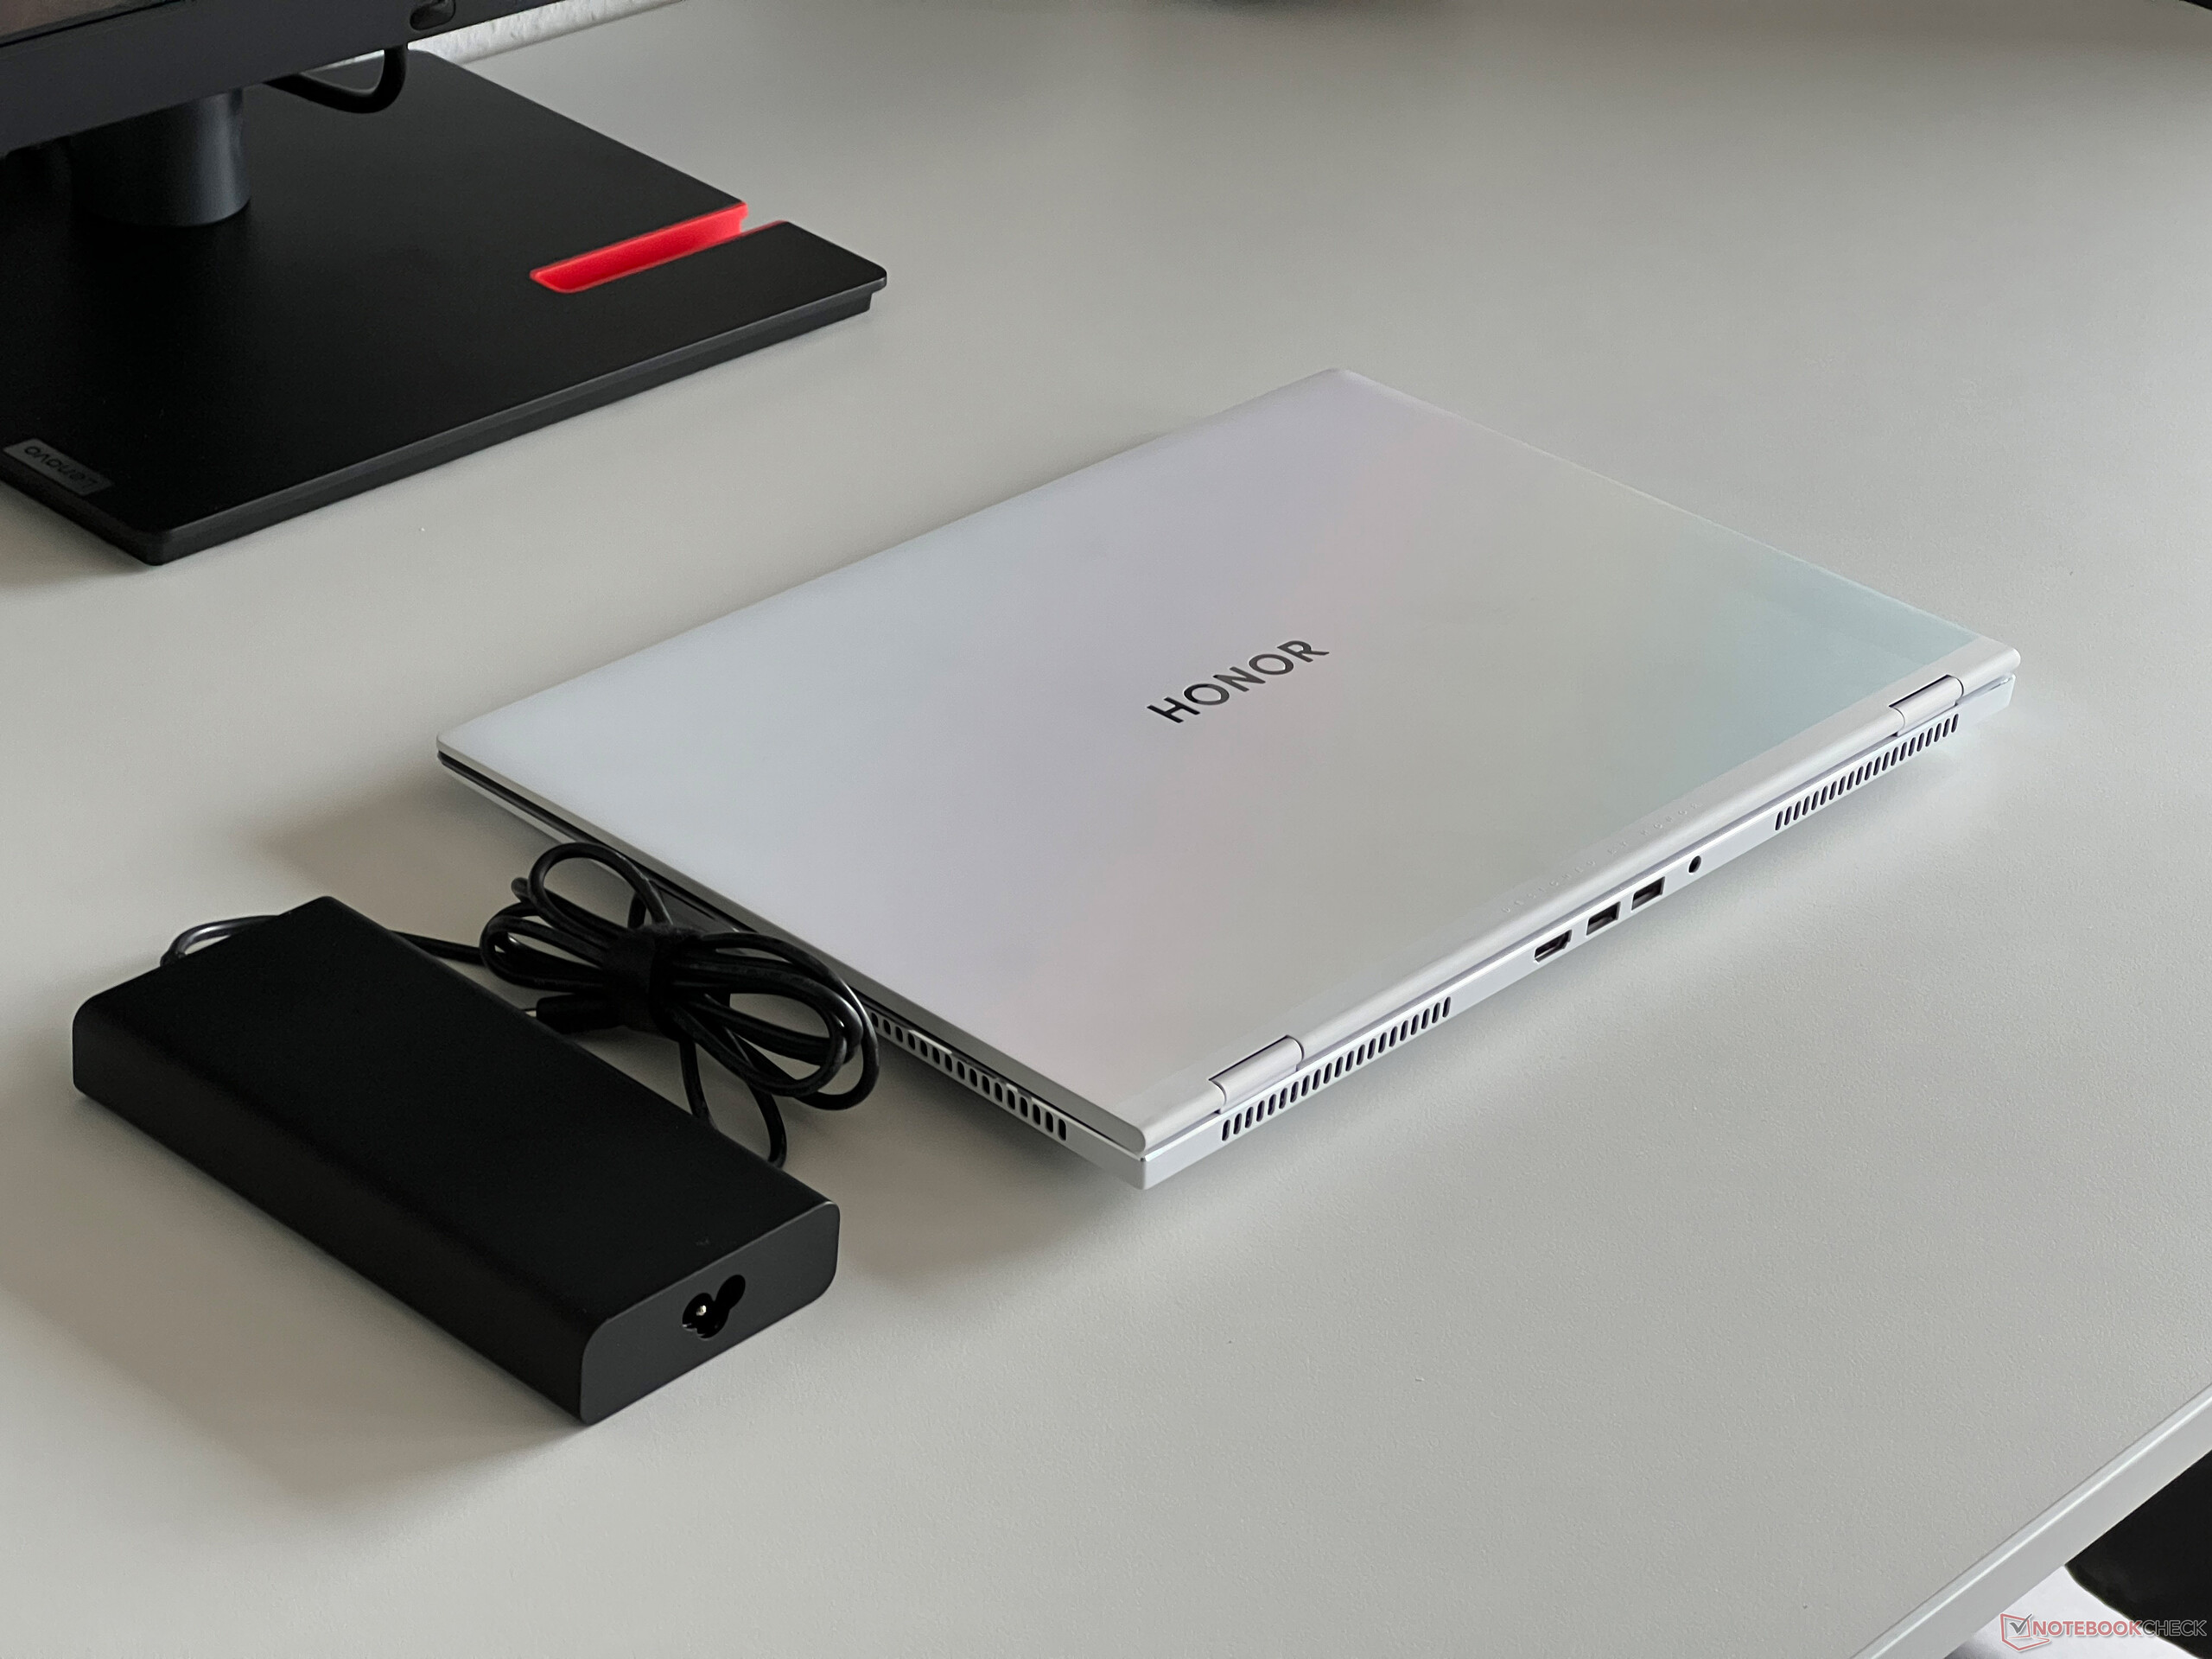
Dentro del campo de los dispositivos de comparación, el MagicBook Pro 16 pertenece a las máquinas más compactas y, con casi 1,8 cm, también a las más delgadas. El portátil de 1,9 kg y la fuente de alimentación de 200 vatios aportan otros 719 gramos a la balanza.
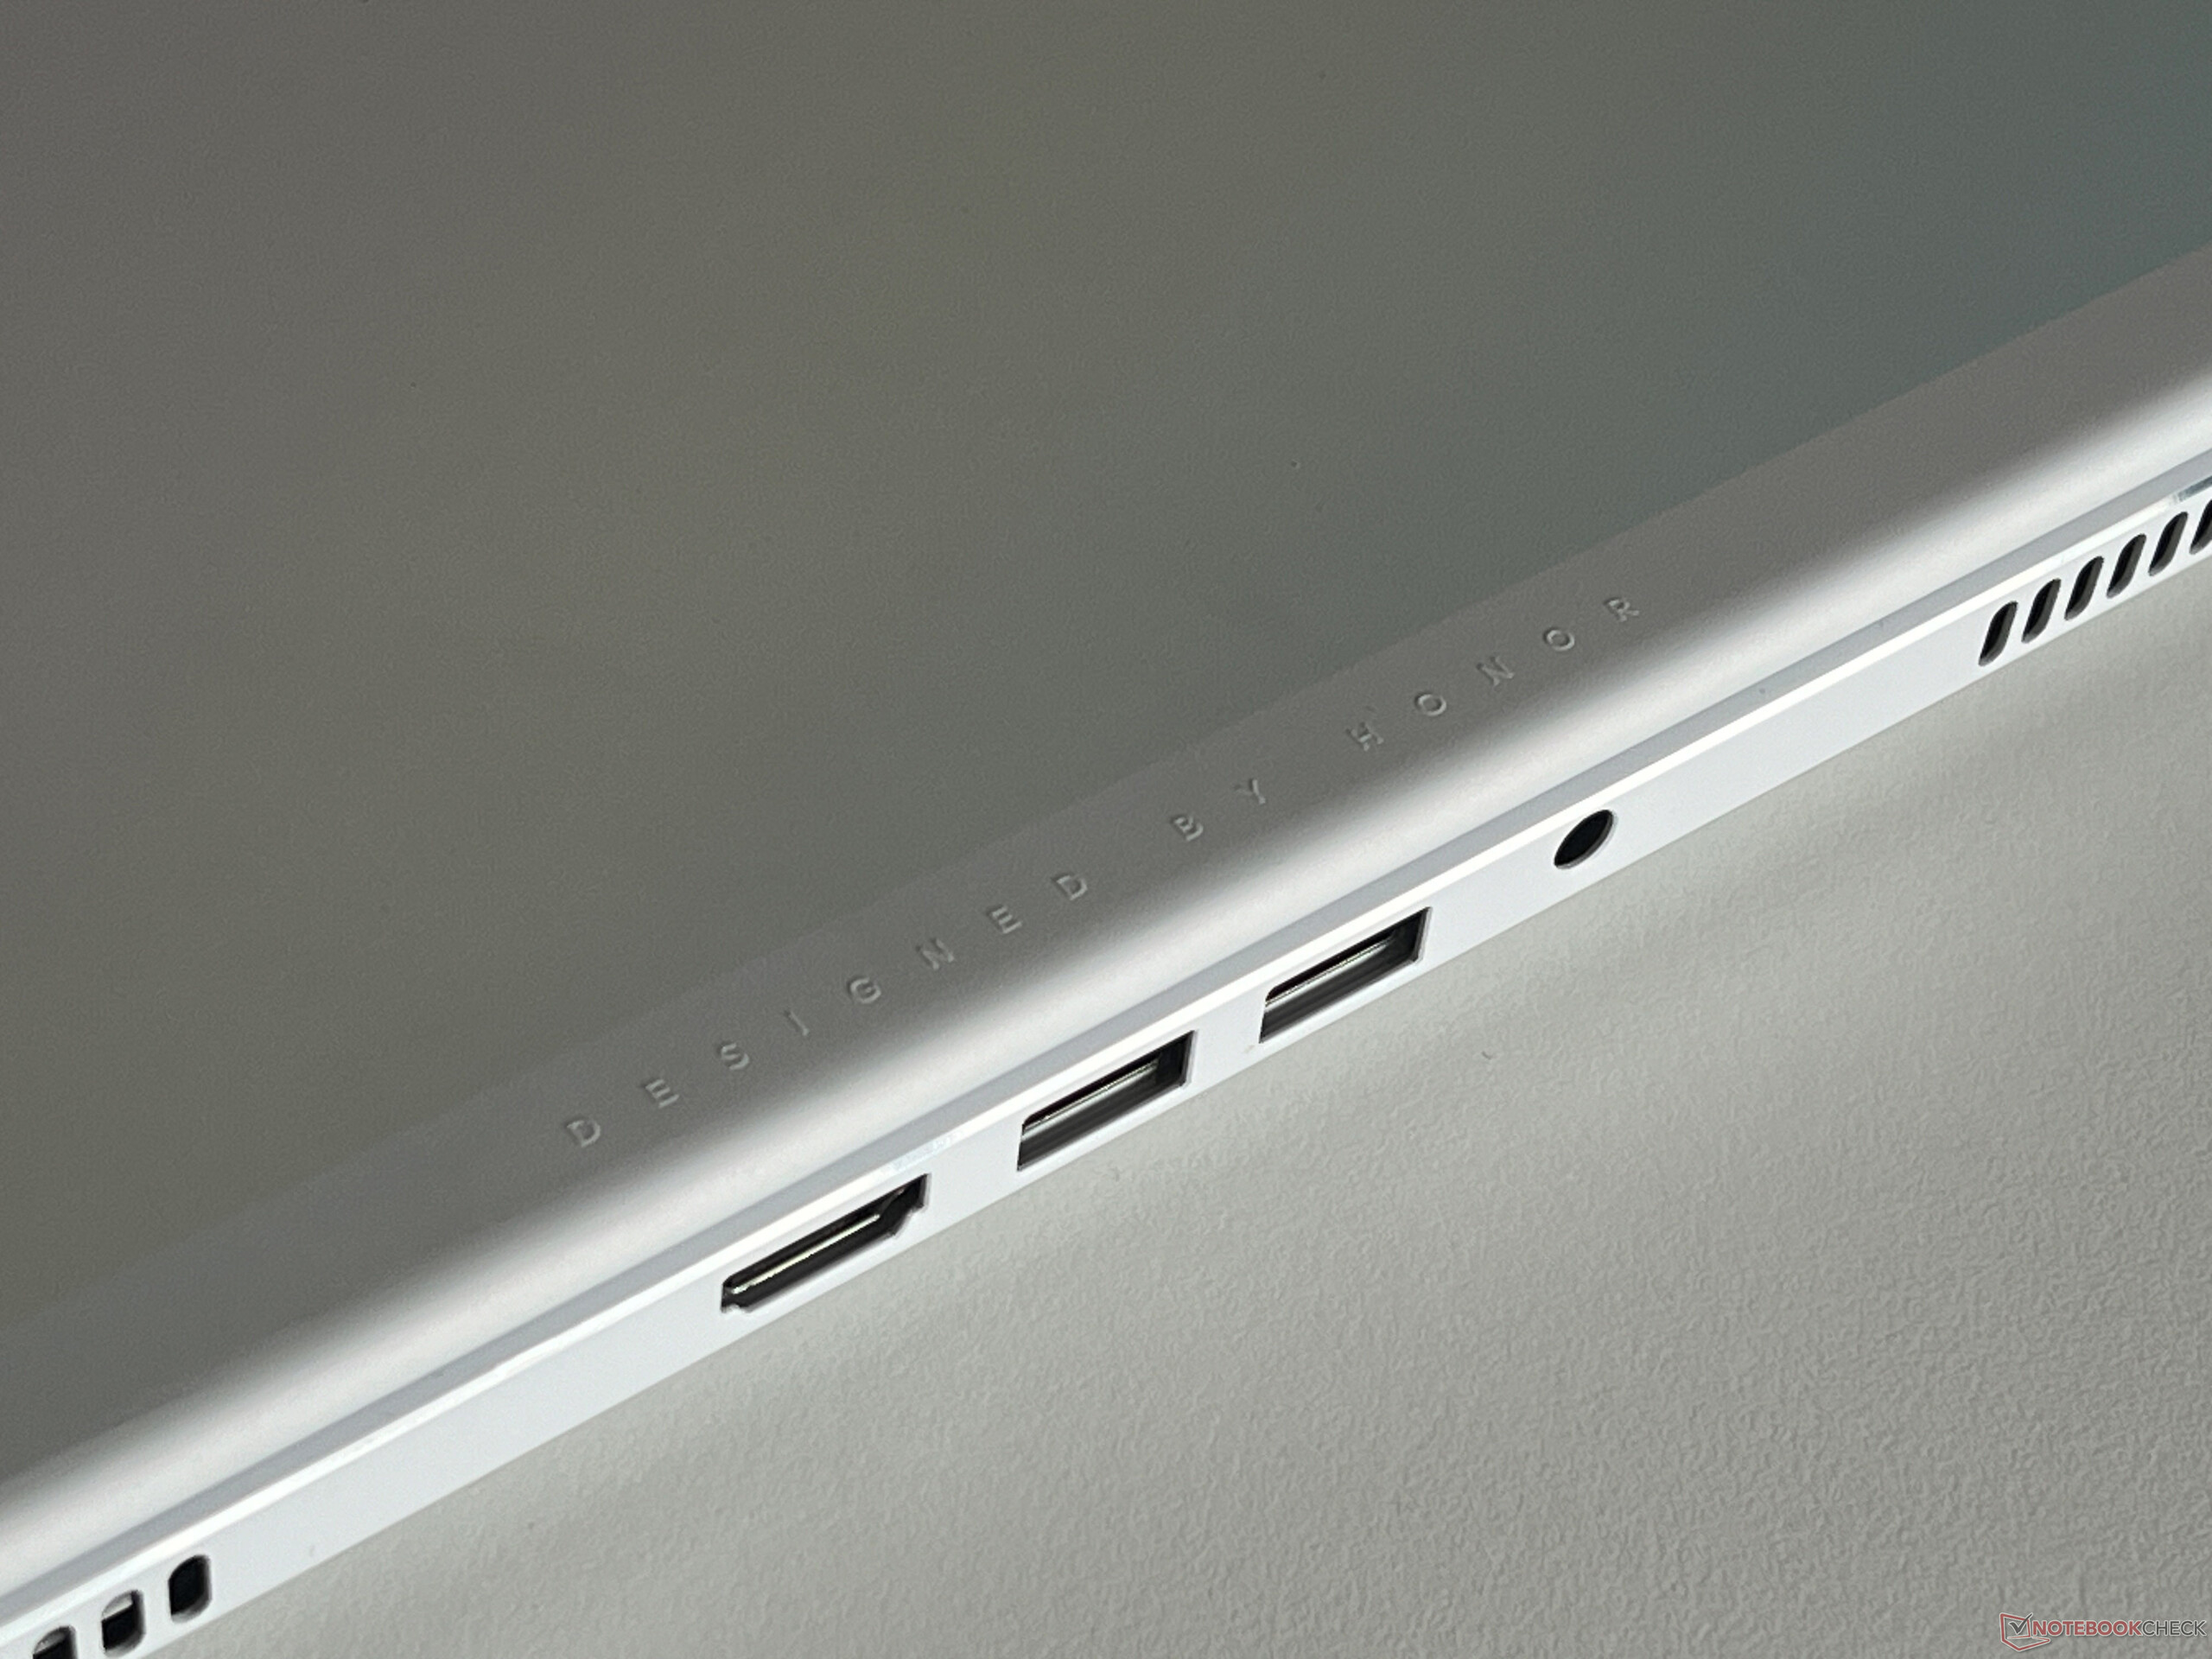
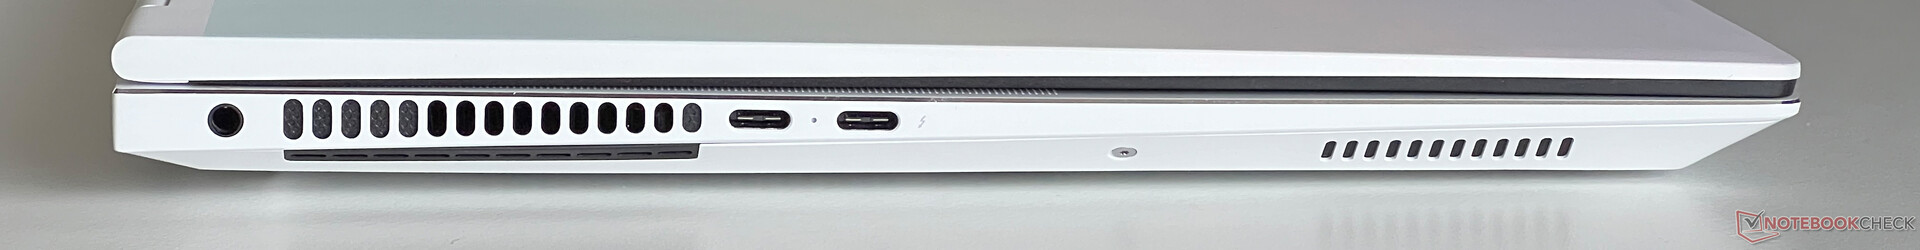
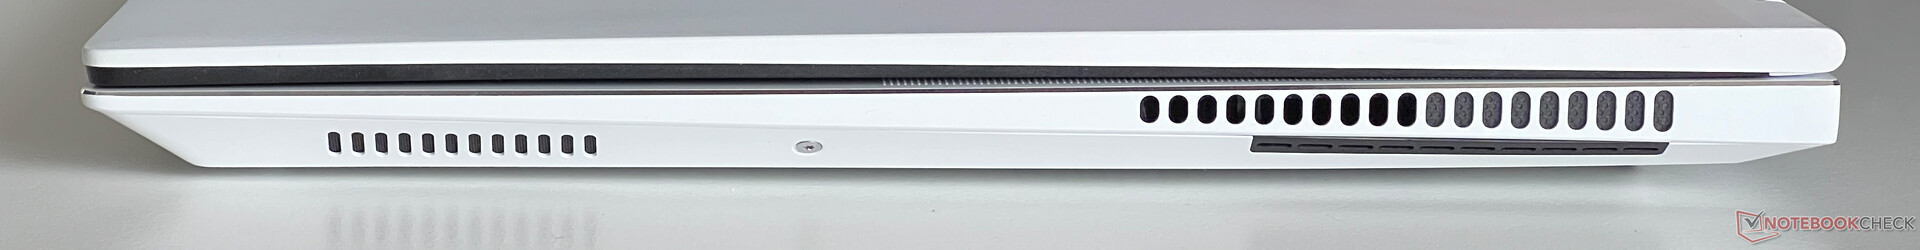
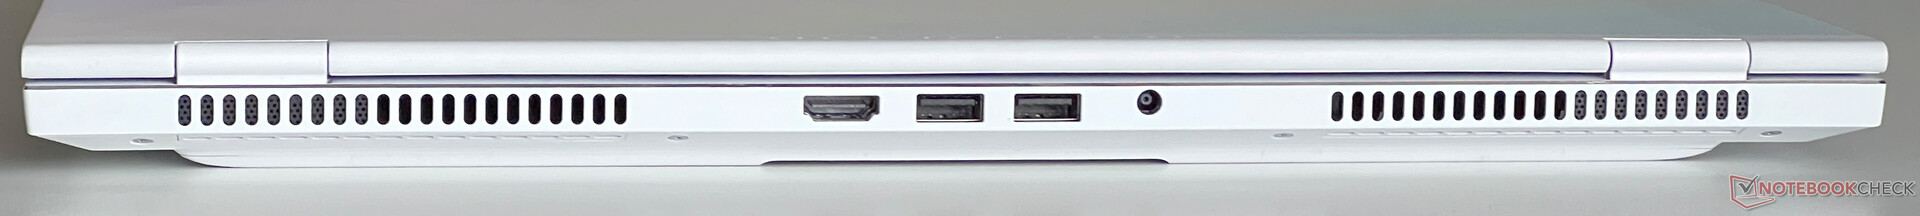
Características - Honor ha instalado Thunderbolt 4
La posición de los puertos es inusual. Además de los dos puertos USB-C (1x Thunderbolt 4) en el lado izquierdo, todos los demás puertos se encuentran en el centro de la parte trasera del dispositivo. Hubiéramos preferido tener los dos puertos USB-A en el lado derecho del dispositivo. La salida HDMI, así como los dos conectores USB-C, se conectan a través de la iGPU, lo que significa que cuando se utiliza una pantalla externa, la GPU Nvidia no está necesariamente en funcionamiento. La salida HDMI admite salida 4K a 60 Hz pero no frecuencias superiores y tampoco G-Sync.
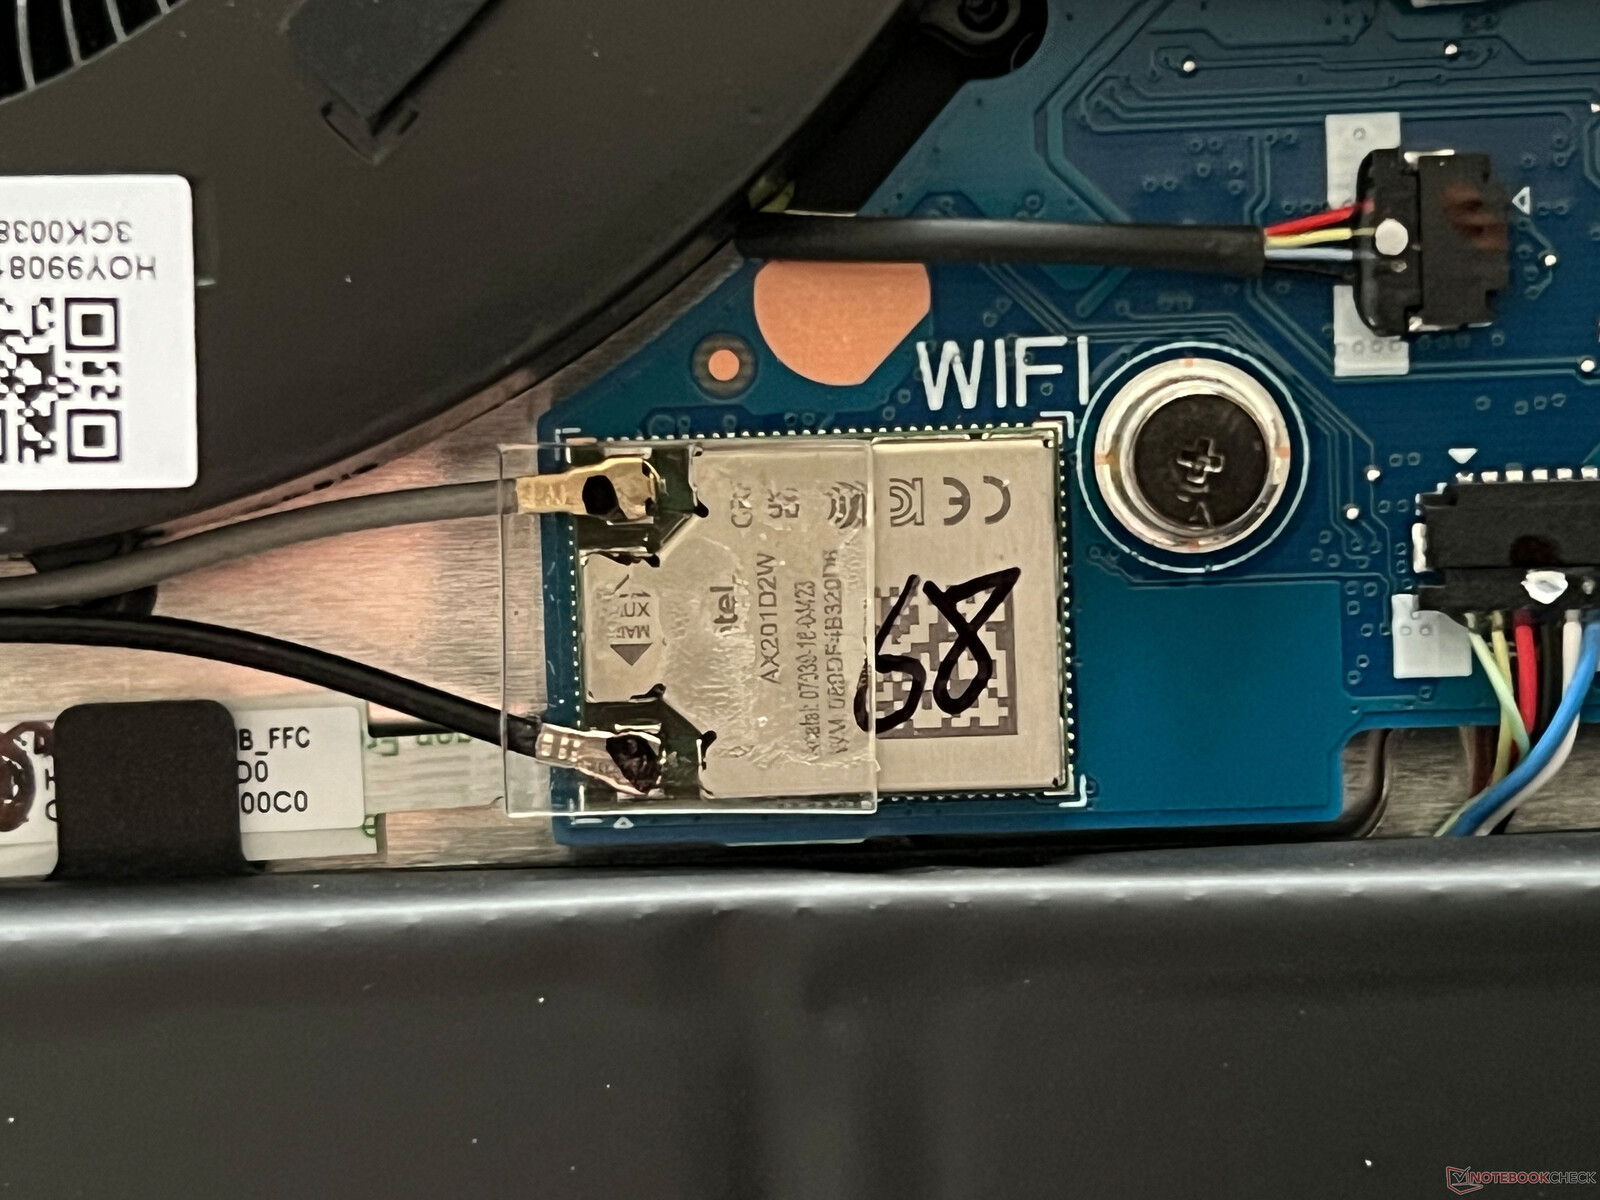
Comunicación
El módulo Wi-Fi es el conocido Intel AX201, lo que significa que el MagicBook Pro no soporta ni Wi-Fi 6E ni Wi-Fi 7. Sin embargo, actualmente no existen grandes limitaciones y las velocidades de transferencia en nuestra prueba con el router de referencia Asus son muy altas y estables. Cualquiera que utilice dispositivos adicionales Honor también puede enviar fácilmente archivos entre los dos dispositivos o, por ejemplo, mostrar el contenido del smartphone en el PC.
| Networking | |
| Honor MagicBook Pro 16 2024 | |
| iperf3 transmit AXE11000 | |
| iperf3 receive AXE11000 | |
| Framework Laptop 16 | |
| iperf3 transmit AXE11000 | |
| iperf3 receive AXE11000 | |
| iperf3 transmit AXE11000 6GHz | |
| iperf3 receive AXE11000 6GHz | |
| Lenovo ThinkPad Z16 Gen 2 | |
| iperf3 transmit AXE11000 | |
| iperf3 receive AXE11000 | |
| iperf3 transmit AXE11000 6GHz | |
| iperf3 receive AXE11000 6GHz | |
| Dell Inspiron 16 Plus 7630 | |
| iperf3 transmit AXE11000 | |
| iperf3 receive AXE11000 | |
| iperf3 transmit AXE11000 6GHz | |
| iperf3 receive AXE11000 6GHz | |
| Lenovo Yoga Pro 9 16-IRP G8 | |
| iperf3 transmit AXE11000 | |
| iperf3 receive AXE11000 | |
| Schenker VISION 16 Pro (M23) | |
| iperf3 transmit AXE11000 | |
| iperf3 receive AXE11000 | |
| Asus Vivobook Pro 16X K6604JV-MX016W | |
| iperf3 transmit AXE11000 | |
| iperf3 receive AXE11000 | |
| iperf3 transmit AXE11000 6GHz | |
| iperf3 receive AXE11000 6GHz | |
Cámara web
La webcam 1080p es compatible con los efectos de estudio de Windows (enfoque suave, contacto visual, seguimiento de la cabeza) y la calidad de la cámara puede describirse como media.


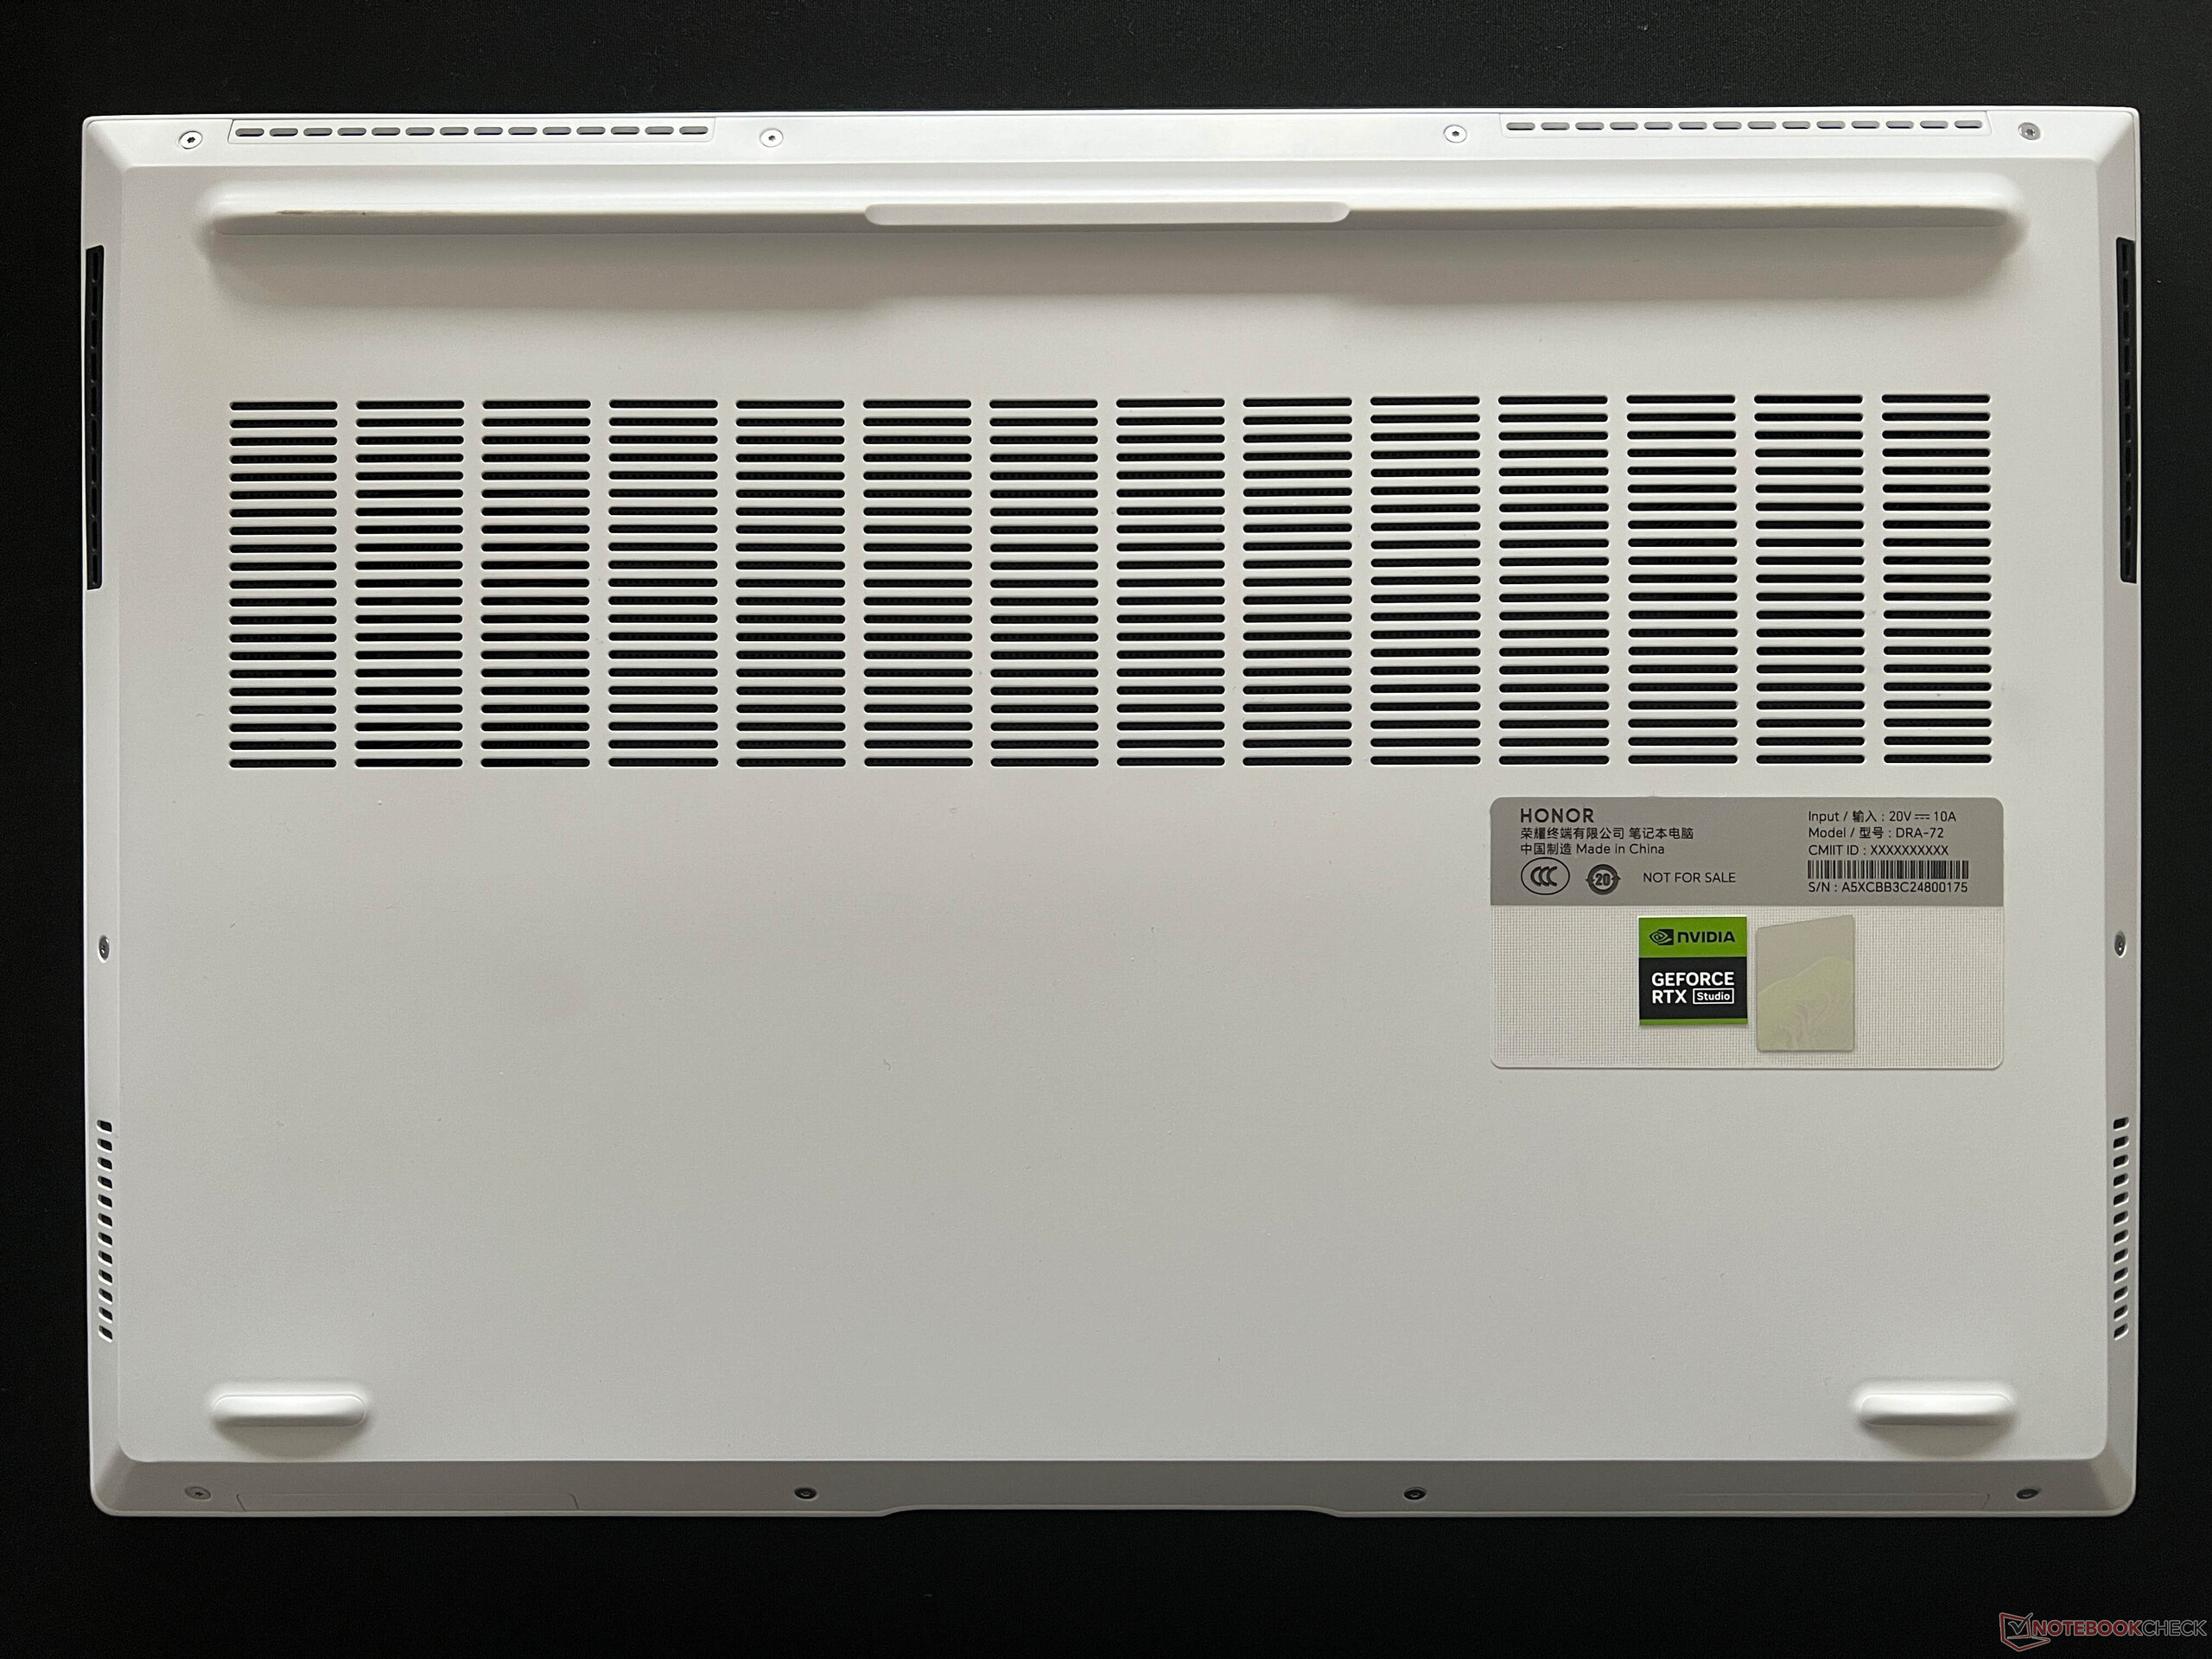
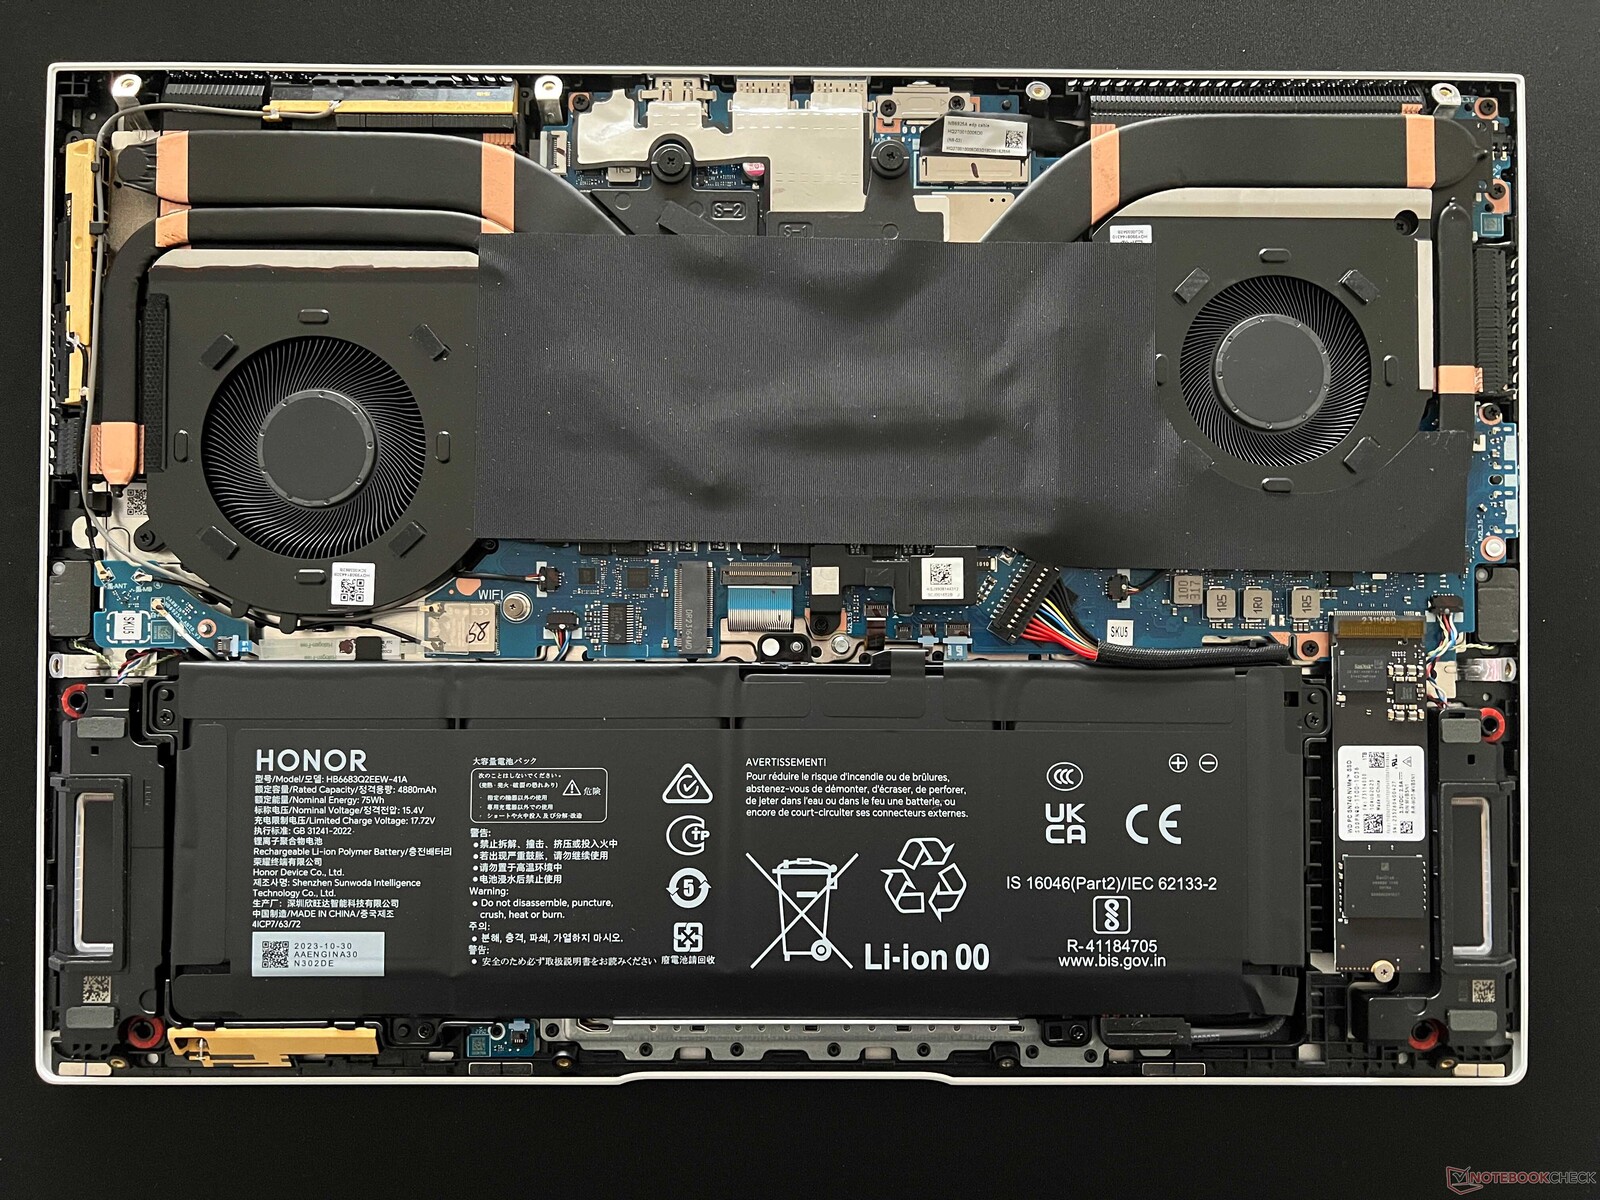
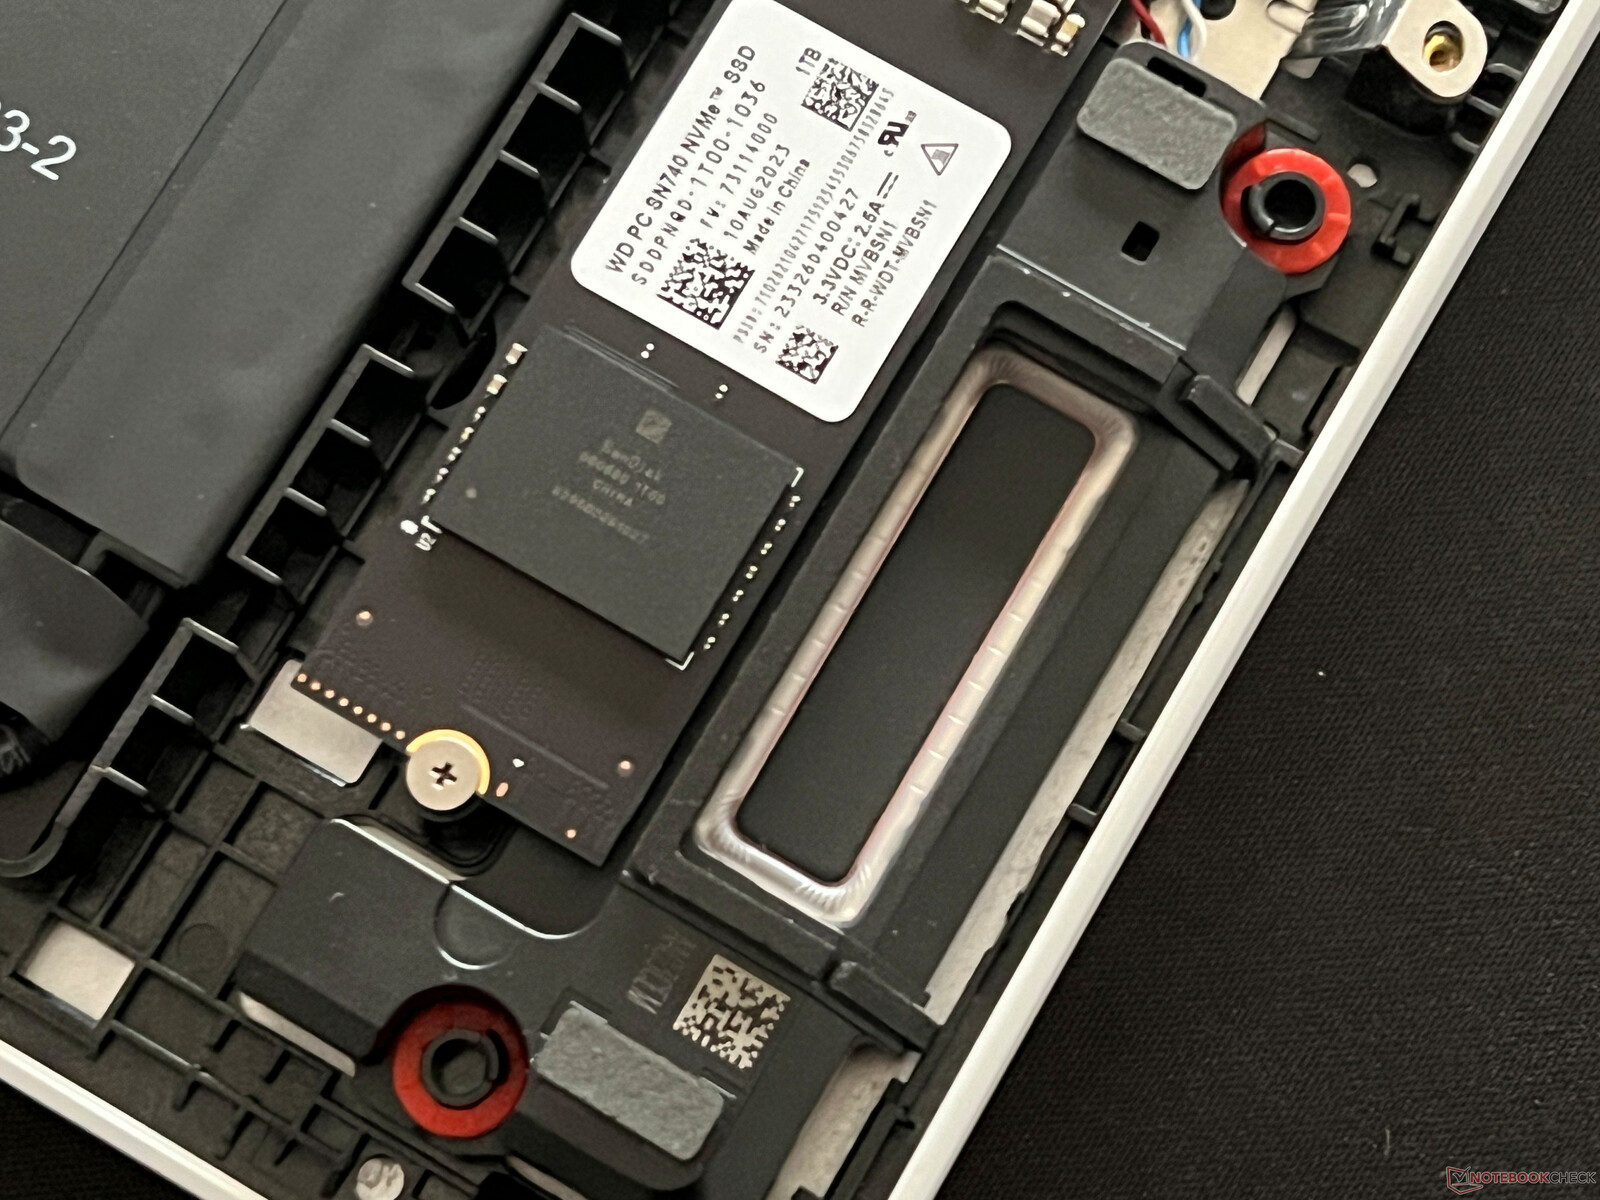
Mantenimiento
La tapa inferior de la carcasa está fijada con unos tornillos Torx (T6) y puede retirarse fácilmente. En el interior del dispositivo, ambos ventiladores pueden limpiarse y tanto la batería como el SSD pueden sustituirse. Sin embargo, todos los demás componentes, incluidos la memoria RAM y el módulo Wi-Fi, están soldados.
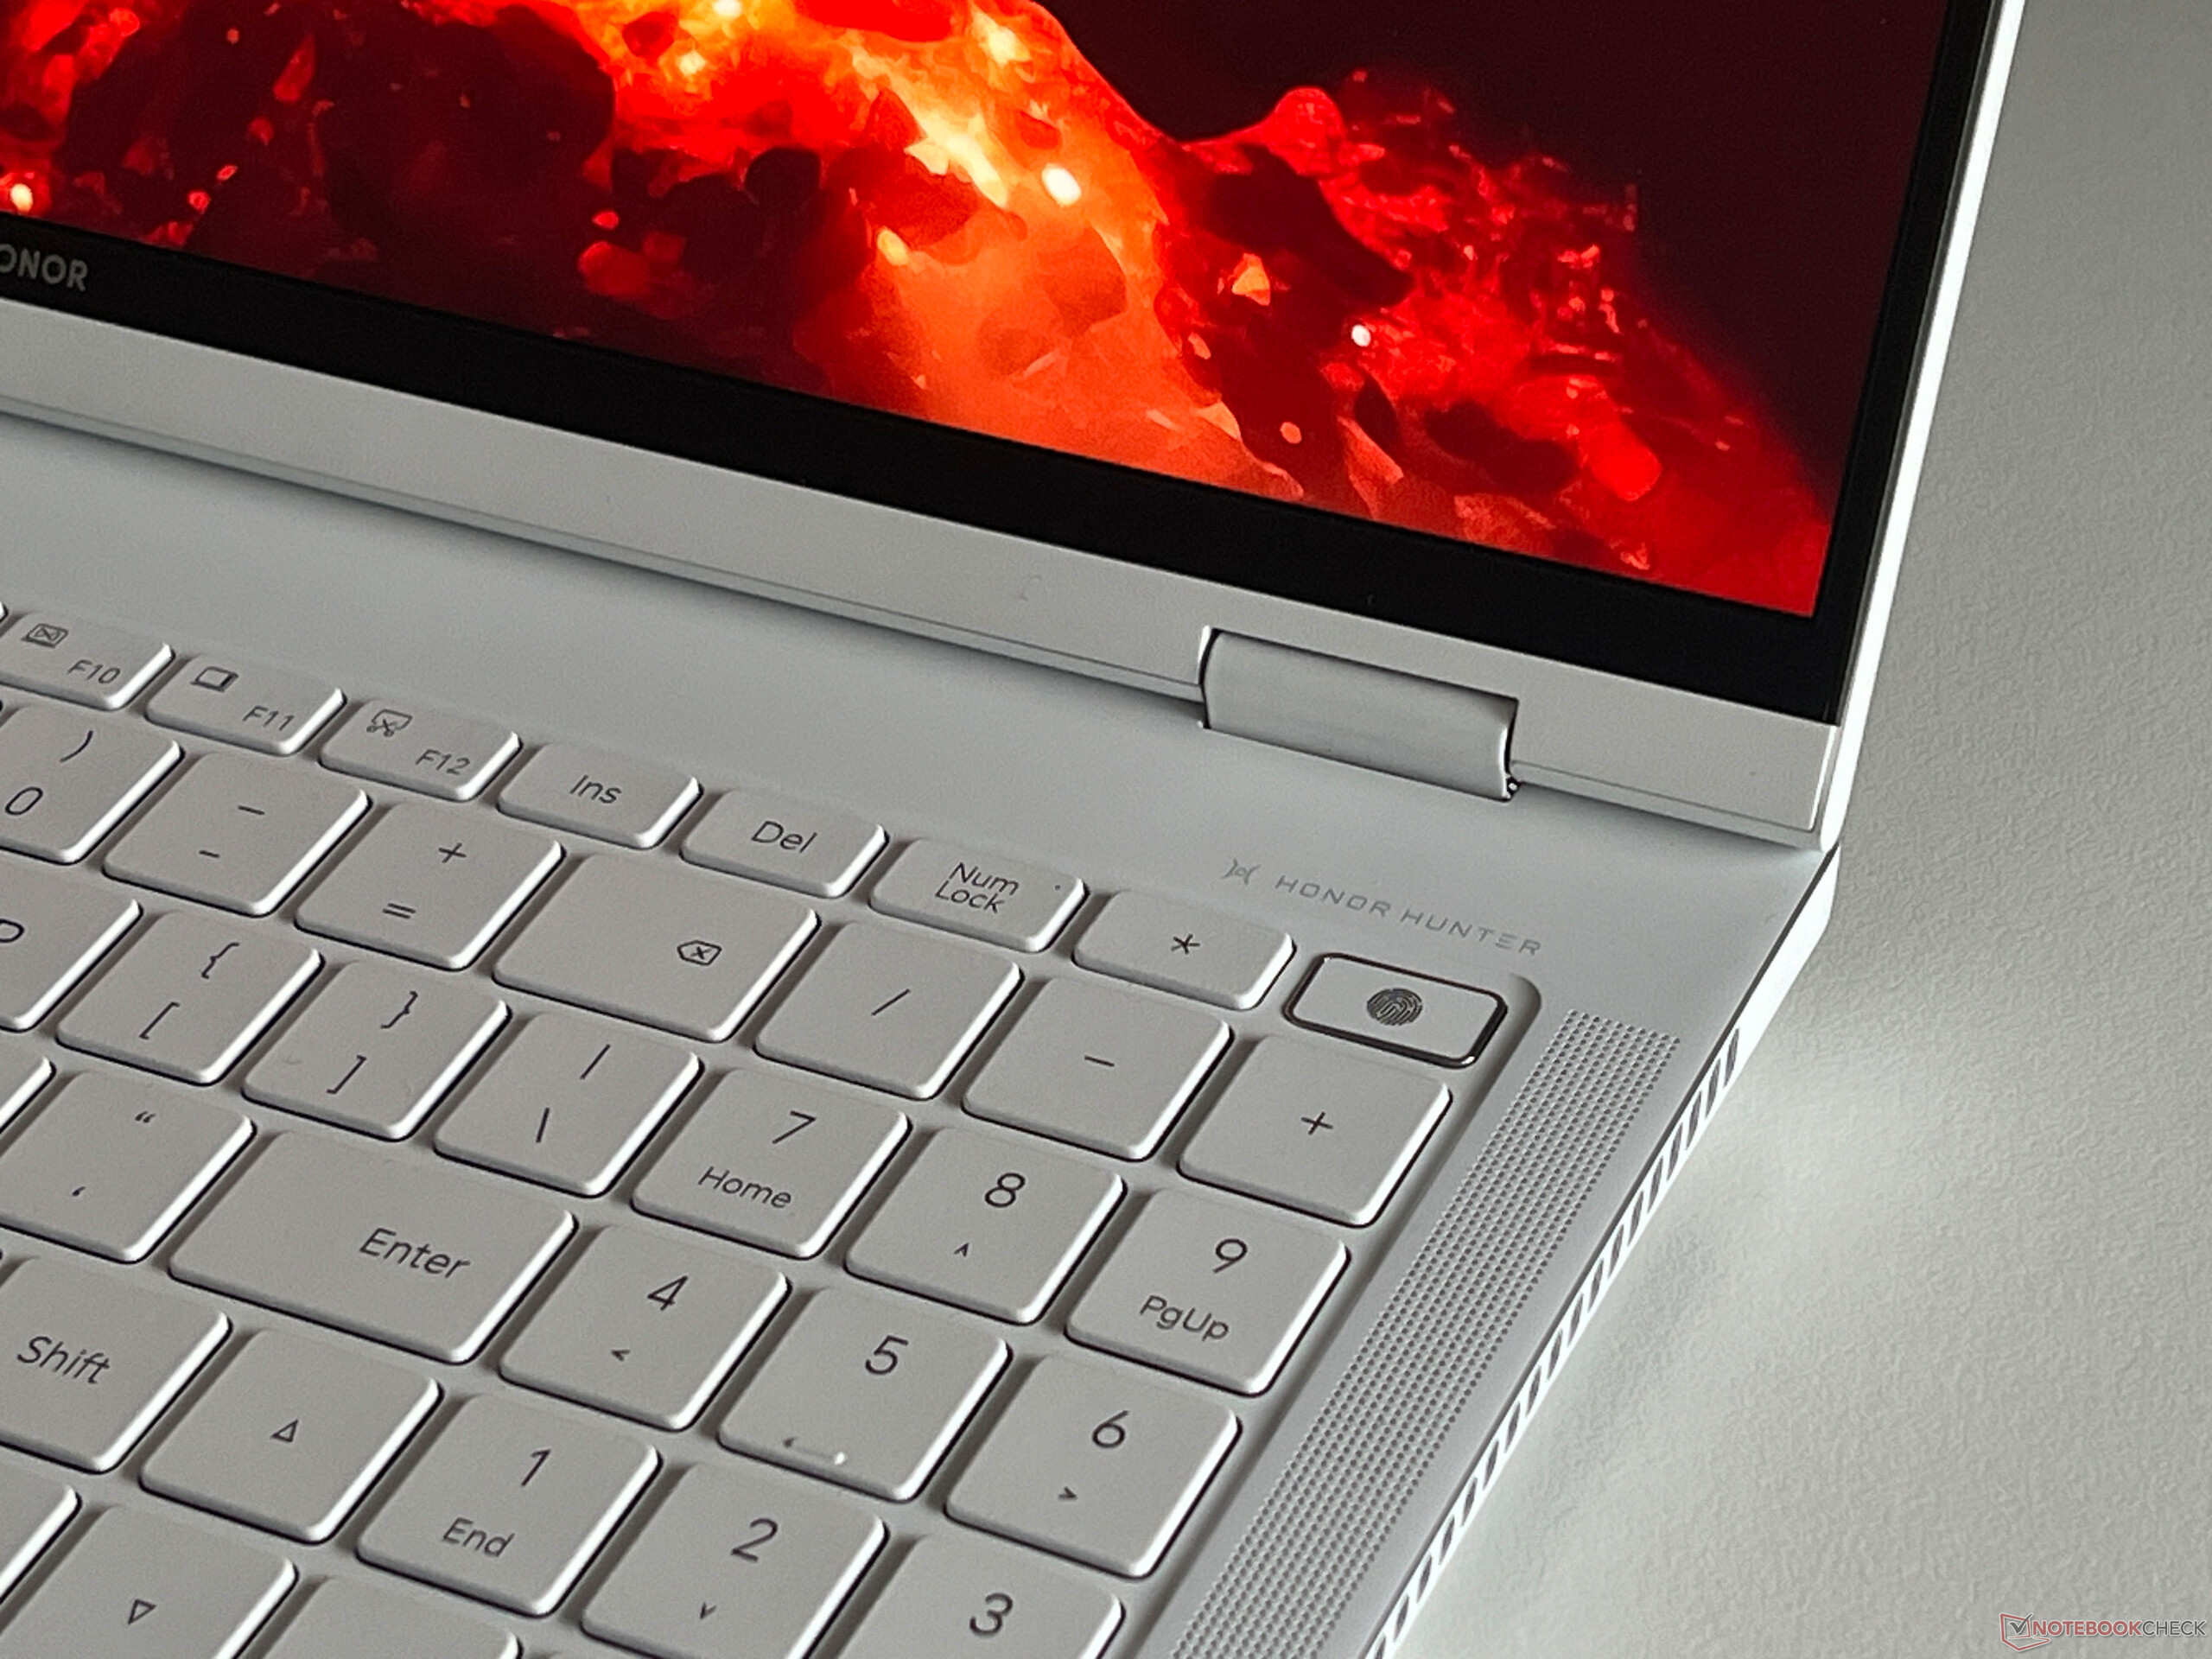
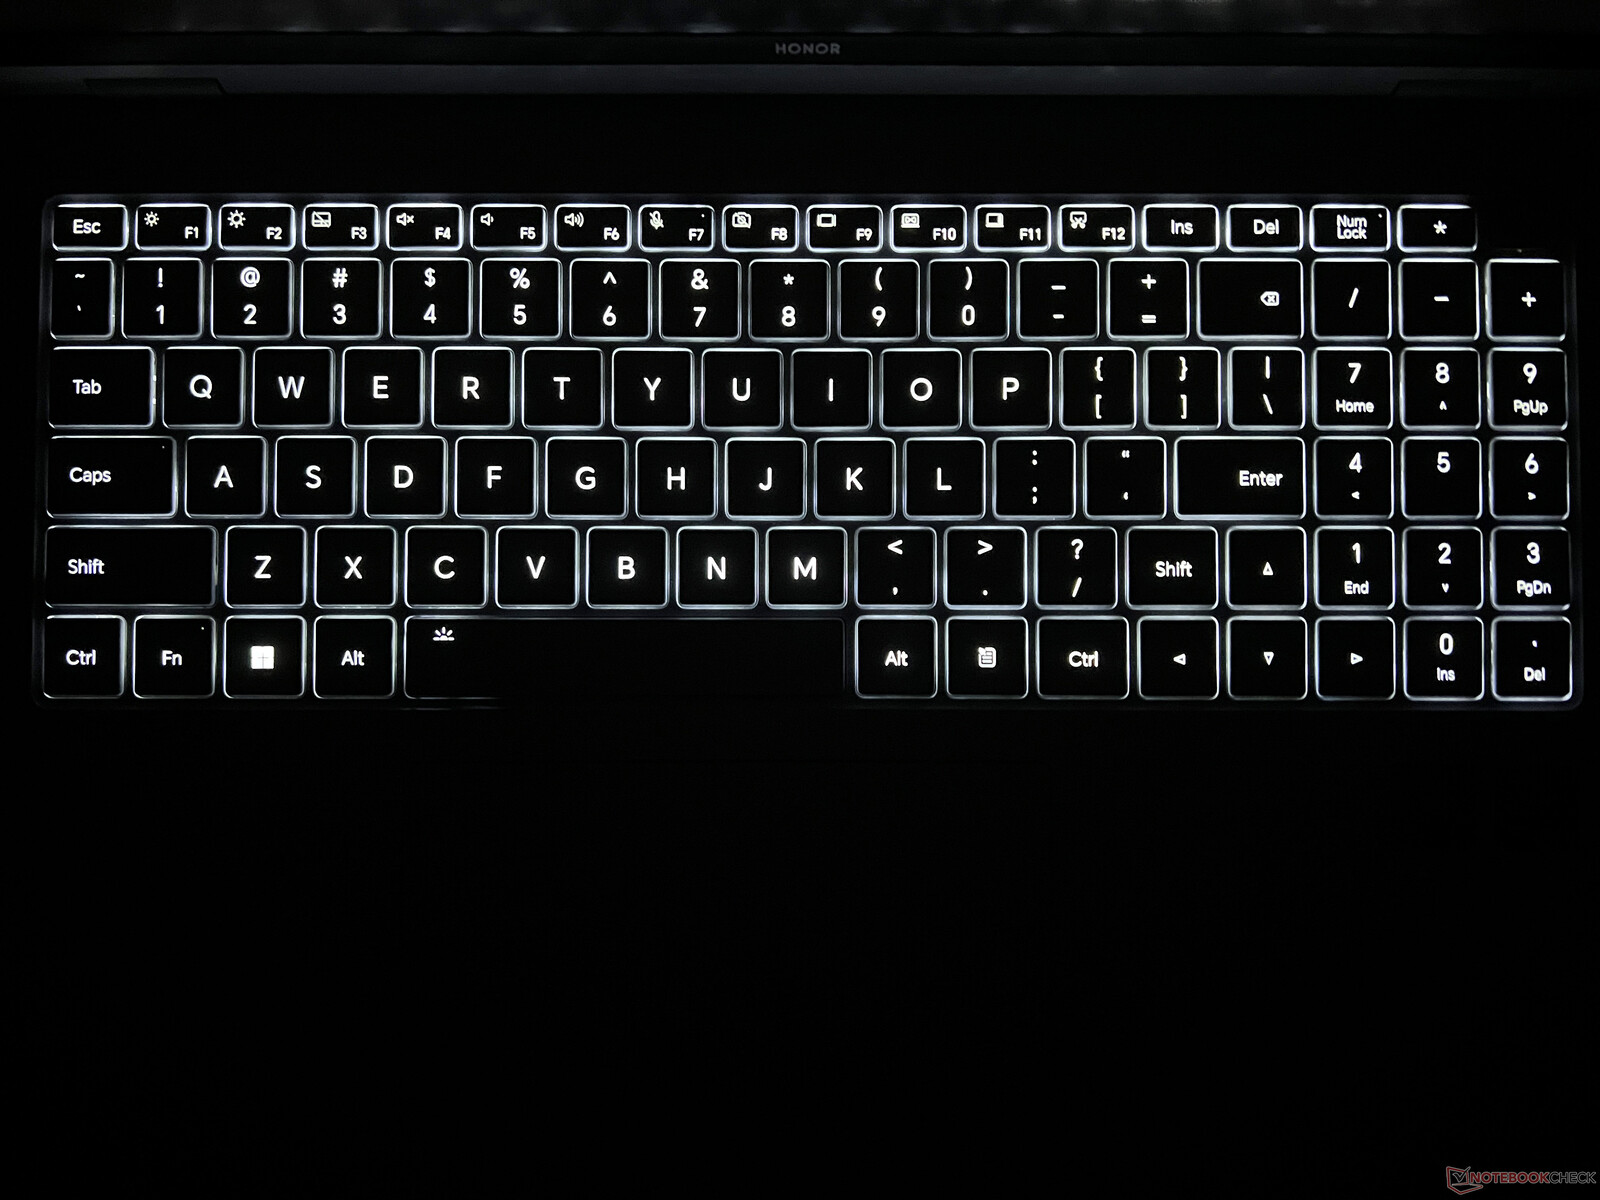
Dispositivos de entrada - Un teclado numérico y un incómodo clickpad
El MagicBook Pro 16 ofrece un teclado grande con teclado numérico y retroiluminación blanca. Ésta puede activarse automáticamente, pero el contraste entre las teclas blancas y la iluminación es muy bajo, lo que significa que su visibilidad en condiciones de poca luz puede ser aún peor. Pero ese es un problema general que se encuentra en los teclados de colores claros. Aparte de eso, la experiencia de tecleo es muy cómoda y hace que incluso los textos más largos sean pan comido. El botón de encendido está en la parte superior derecha y, además de estar integrado en el teclado, alberga el escáner de huellas dactilares.
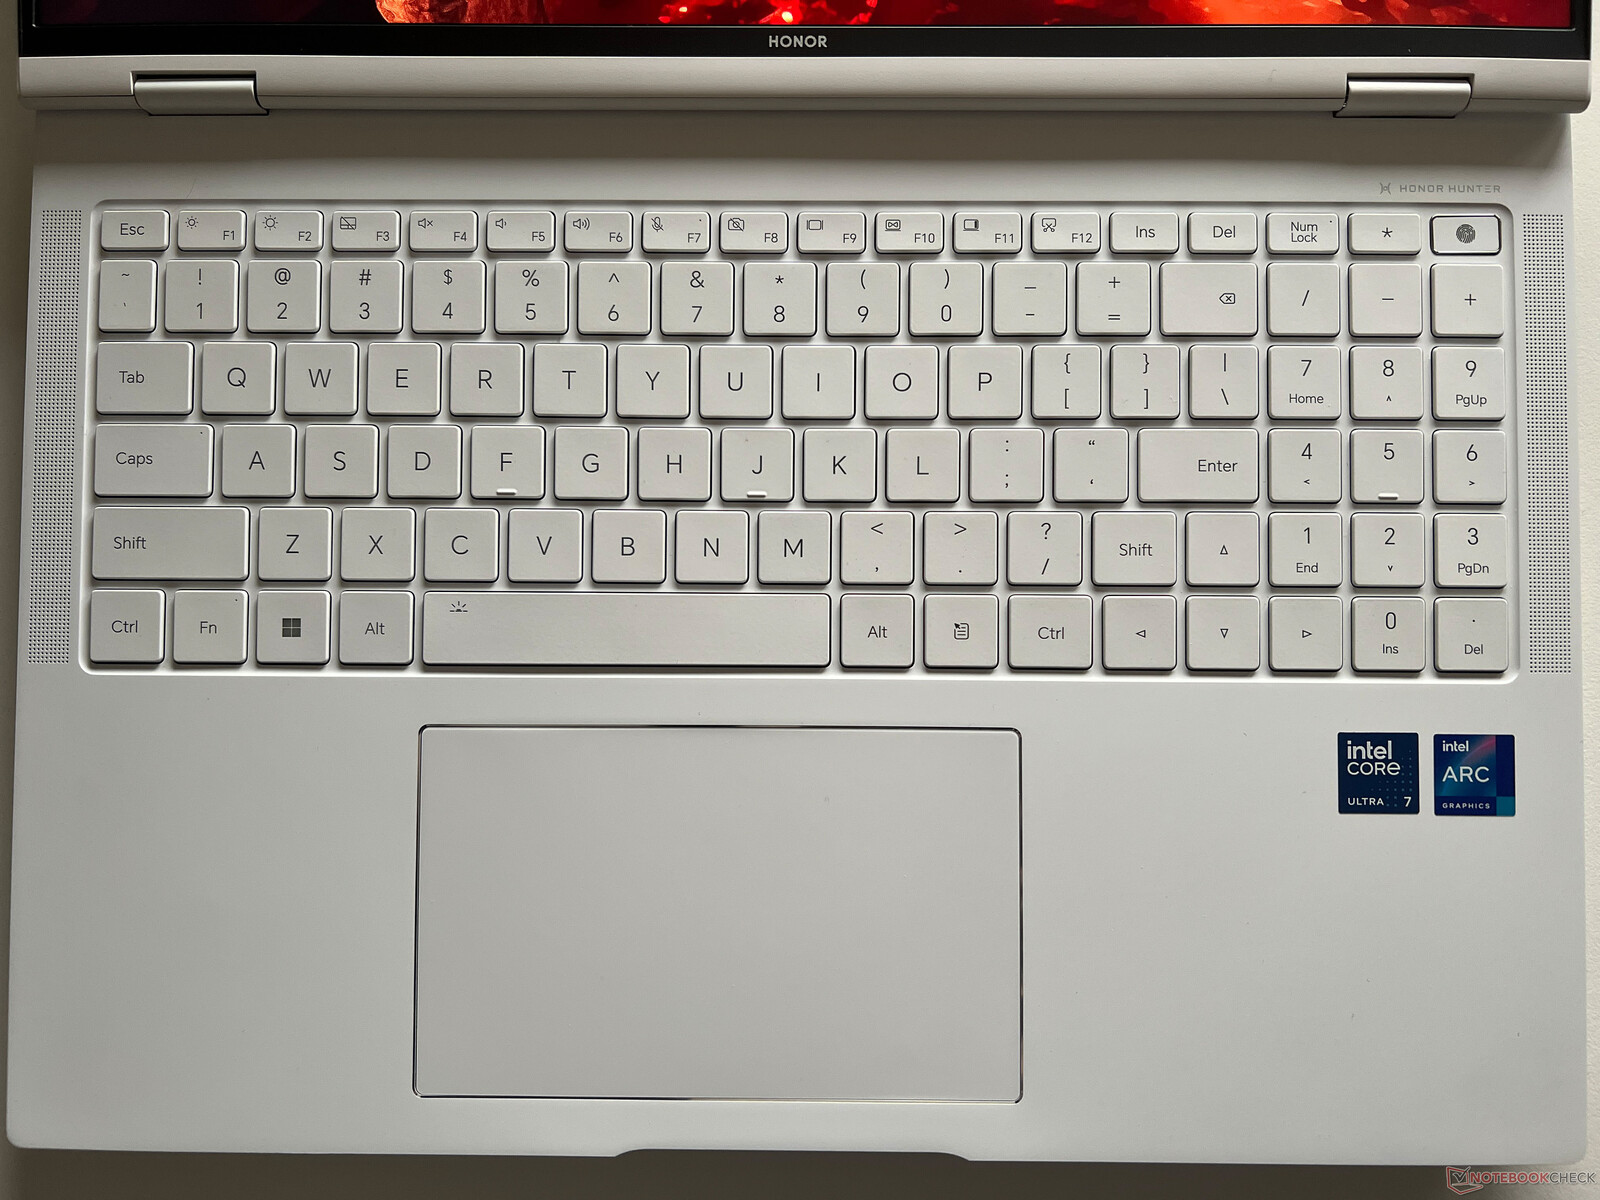
Con 13,5 x 8,2 cm, el gran clickpad ofrece espacio suficiente para el movimiento del ratón y los gestos con hasta cuatro dedos, pero la experiencia de deslizamiento sobre la superficie de plástico no es perfecta. Durante las pruebas, también tuvimos problemas ocasionales con el pad, ya que las entradas sólo se registraban tras un pequeño retardo. Eso fue muy molesto pero, como sólo ocurre de vez en cuando, creemos que es sólo un problema del controlador. En la zona inferior, el pad se puede pulsar físicamente pero esto viene acompañado de fuertes chasquidos.
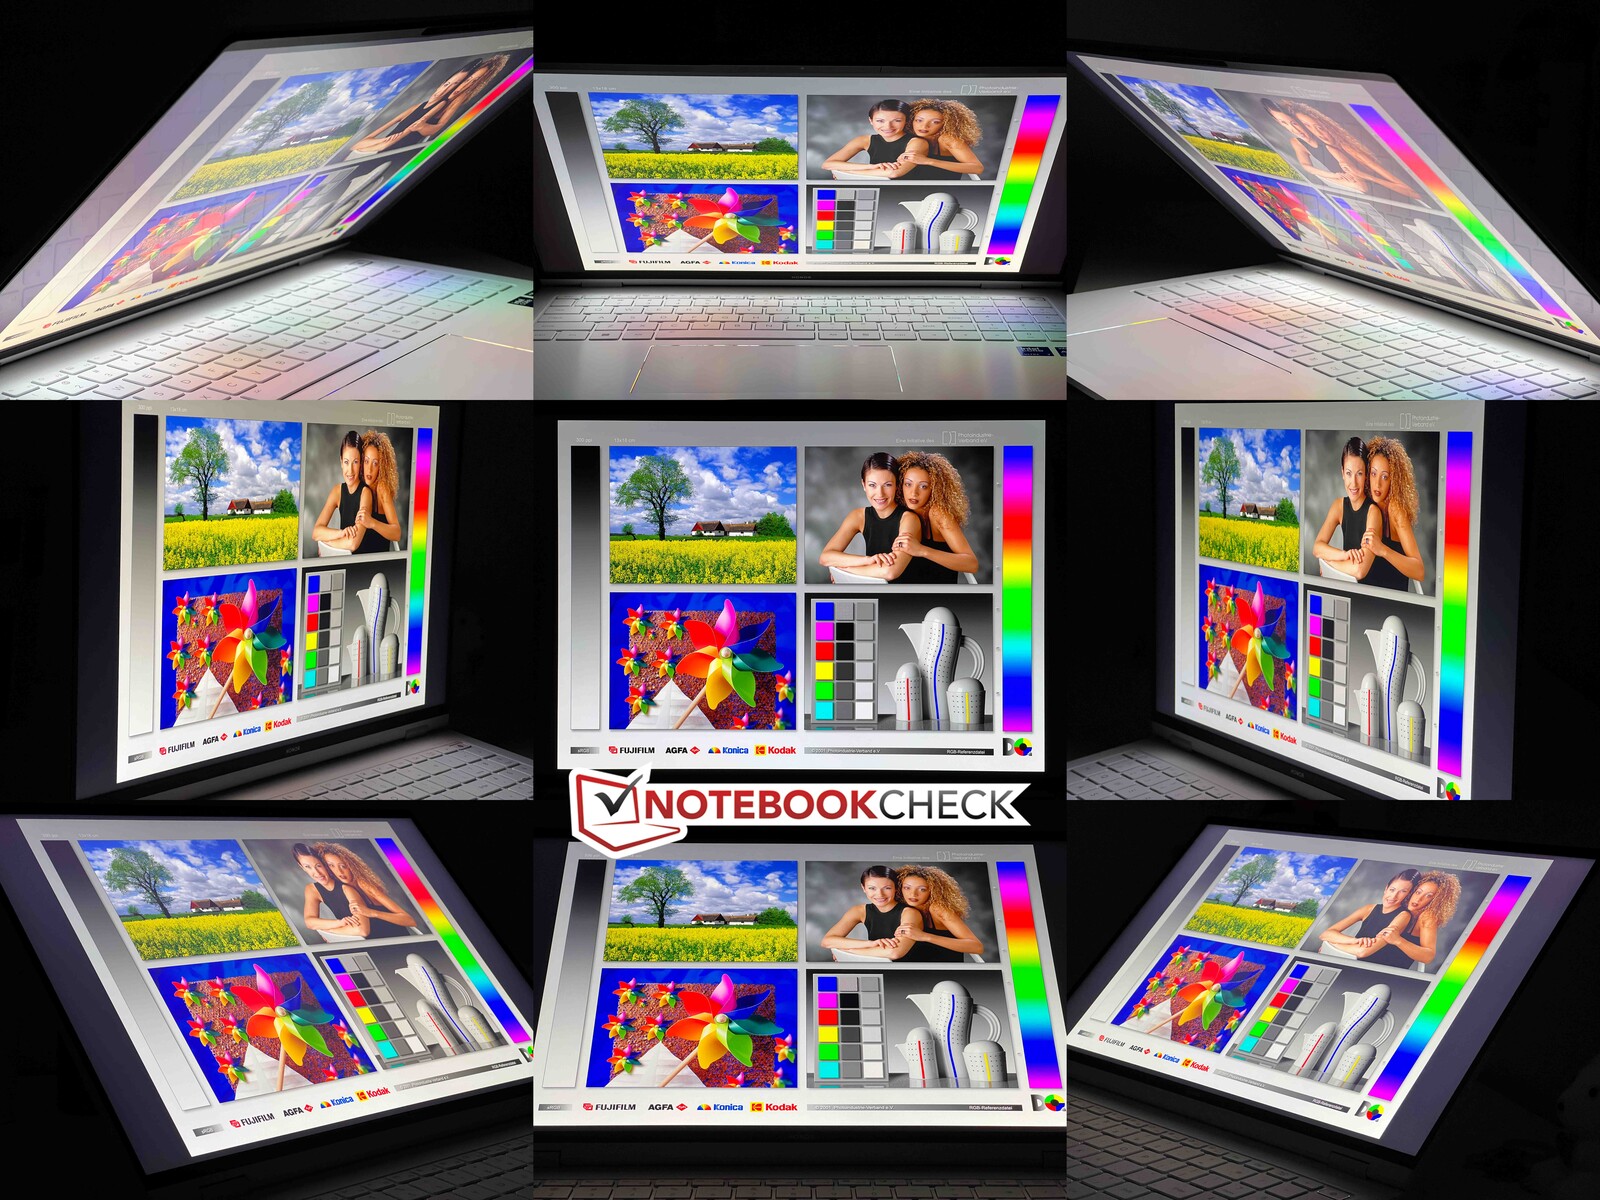
Pantalla - IPS a 165 Hz
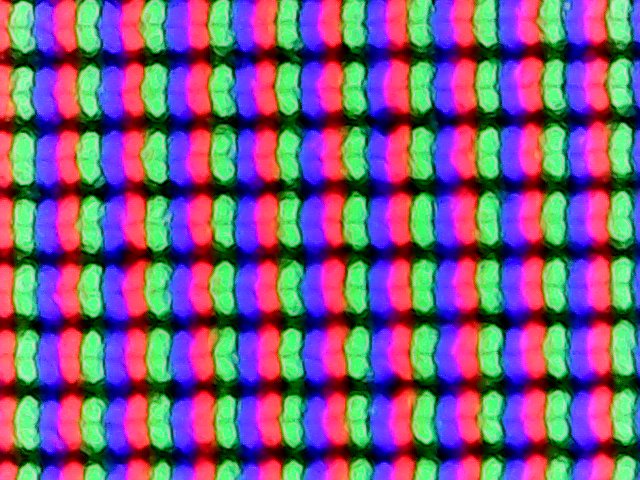
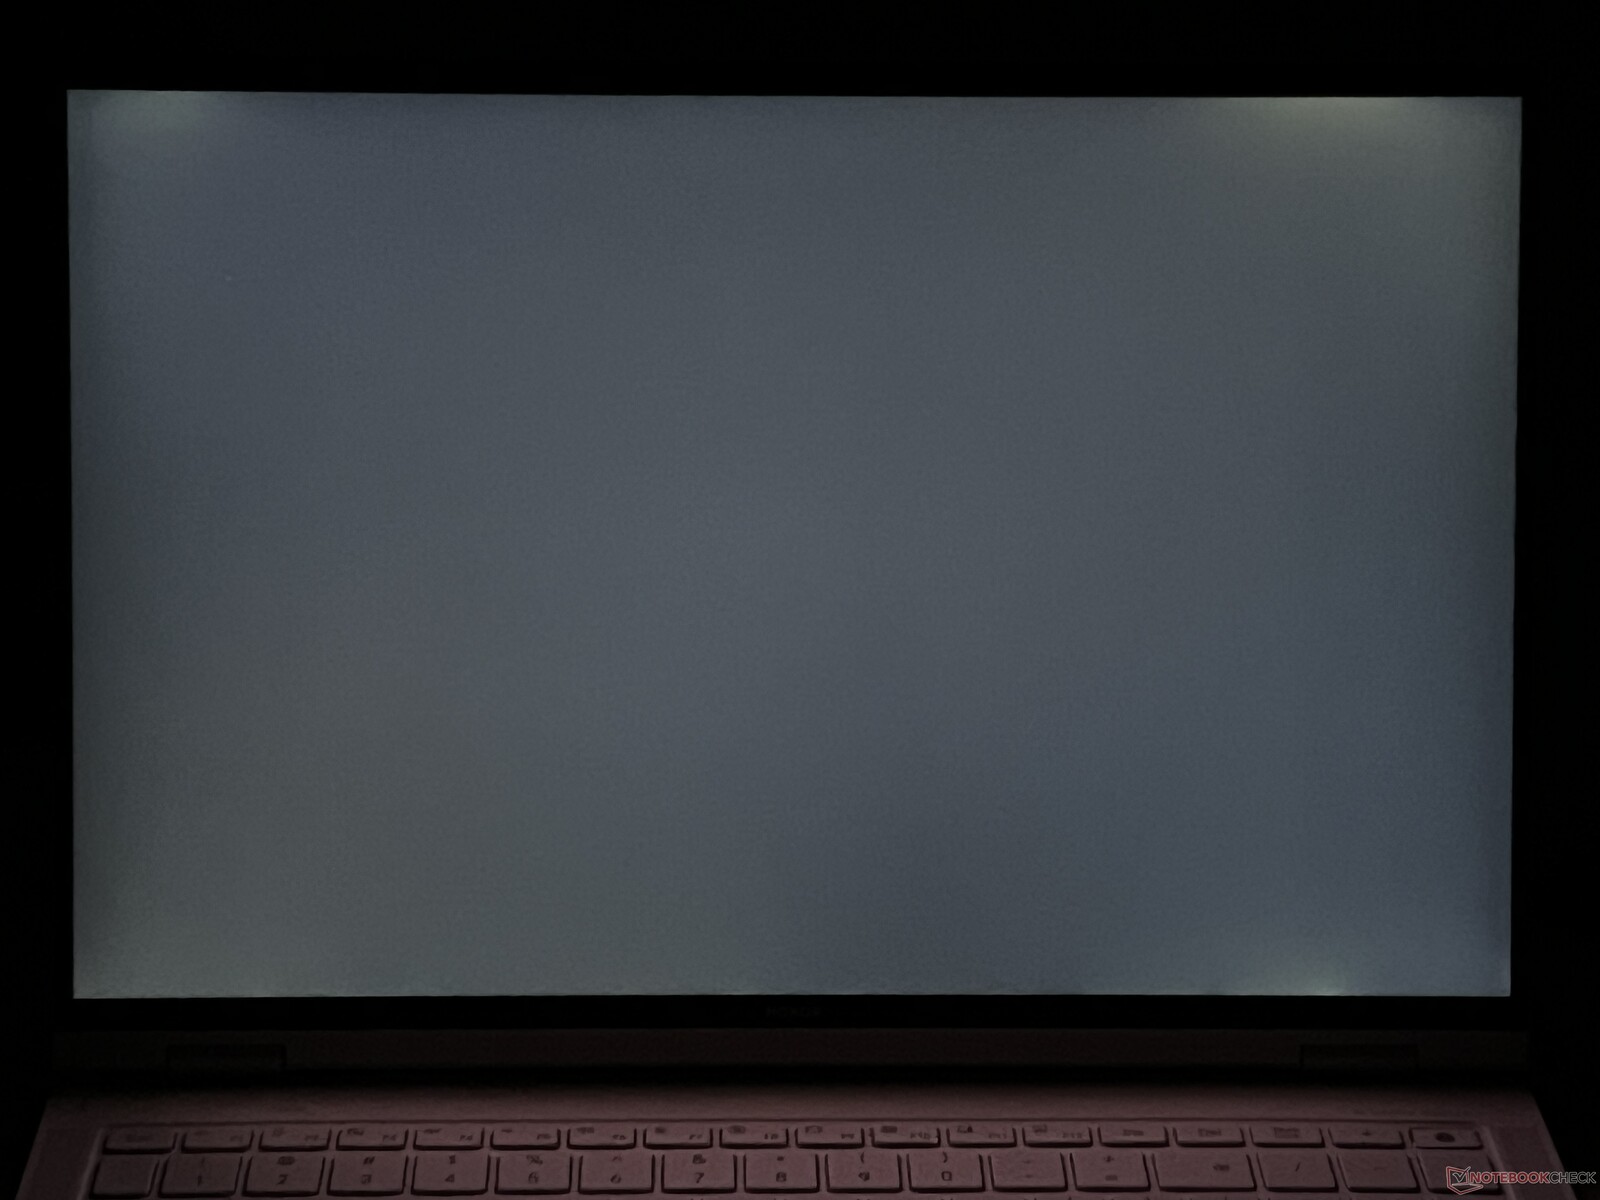
La pantalla es un panel mate IPS 16:10 con una resolución de 3.072 x 1.920 píxeles. La calidad de imagen subjetiva es muy buena, pero los colores no son tan vibrantes como los que se pueden encontrar en los paneles OLED. A pesar de su superficie mate, las zonas brillantes no aparecen granuladas y el PWM está ausente. En las escenas oscuras, se aprecia un ligero sangrado de luz en los bordes, pero no resulta molesto en el uso cotidiano. Los tiempos de respuesta son agradablemente rápidos y no hay problemas a la hora de jugar.
Medimos un brillo máximo de más de 550 cd/m² (una media de 524cd/m²) y la ventaja en comparación con los paneles OLED actuales (~360-400 cd/m² en funcionamiento SDR) es que siempre tendrá acceso a este brillo. Sin embargo, el gran inconveniente es el aumento del nivel de negro de 0,52 cd/m² y esto significa que el contenido negro se parece más al gris oscuro que al negro. Eso también afecta al contraste máximo que sólo se sitúa en poco más de 1.000:1.
| |||||||||||||||||||||||||
iluminación: 91 %
Brillo con batería: 550 cd/m²
Contraste: 1060:1 (Negro: 0.52 cd/m²)
ΔE ColorChecker Calman: 1.7 | ∀{0.5-29.43 Ø4.71}
calibrated: 1
ΔE Greyscale Calman: 2.4 | ∀{0.09-98 Ø4.96}
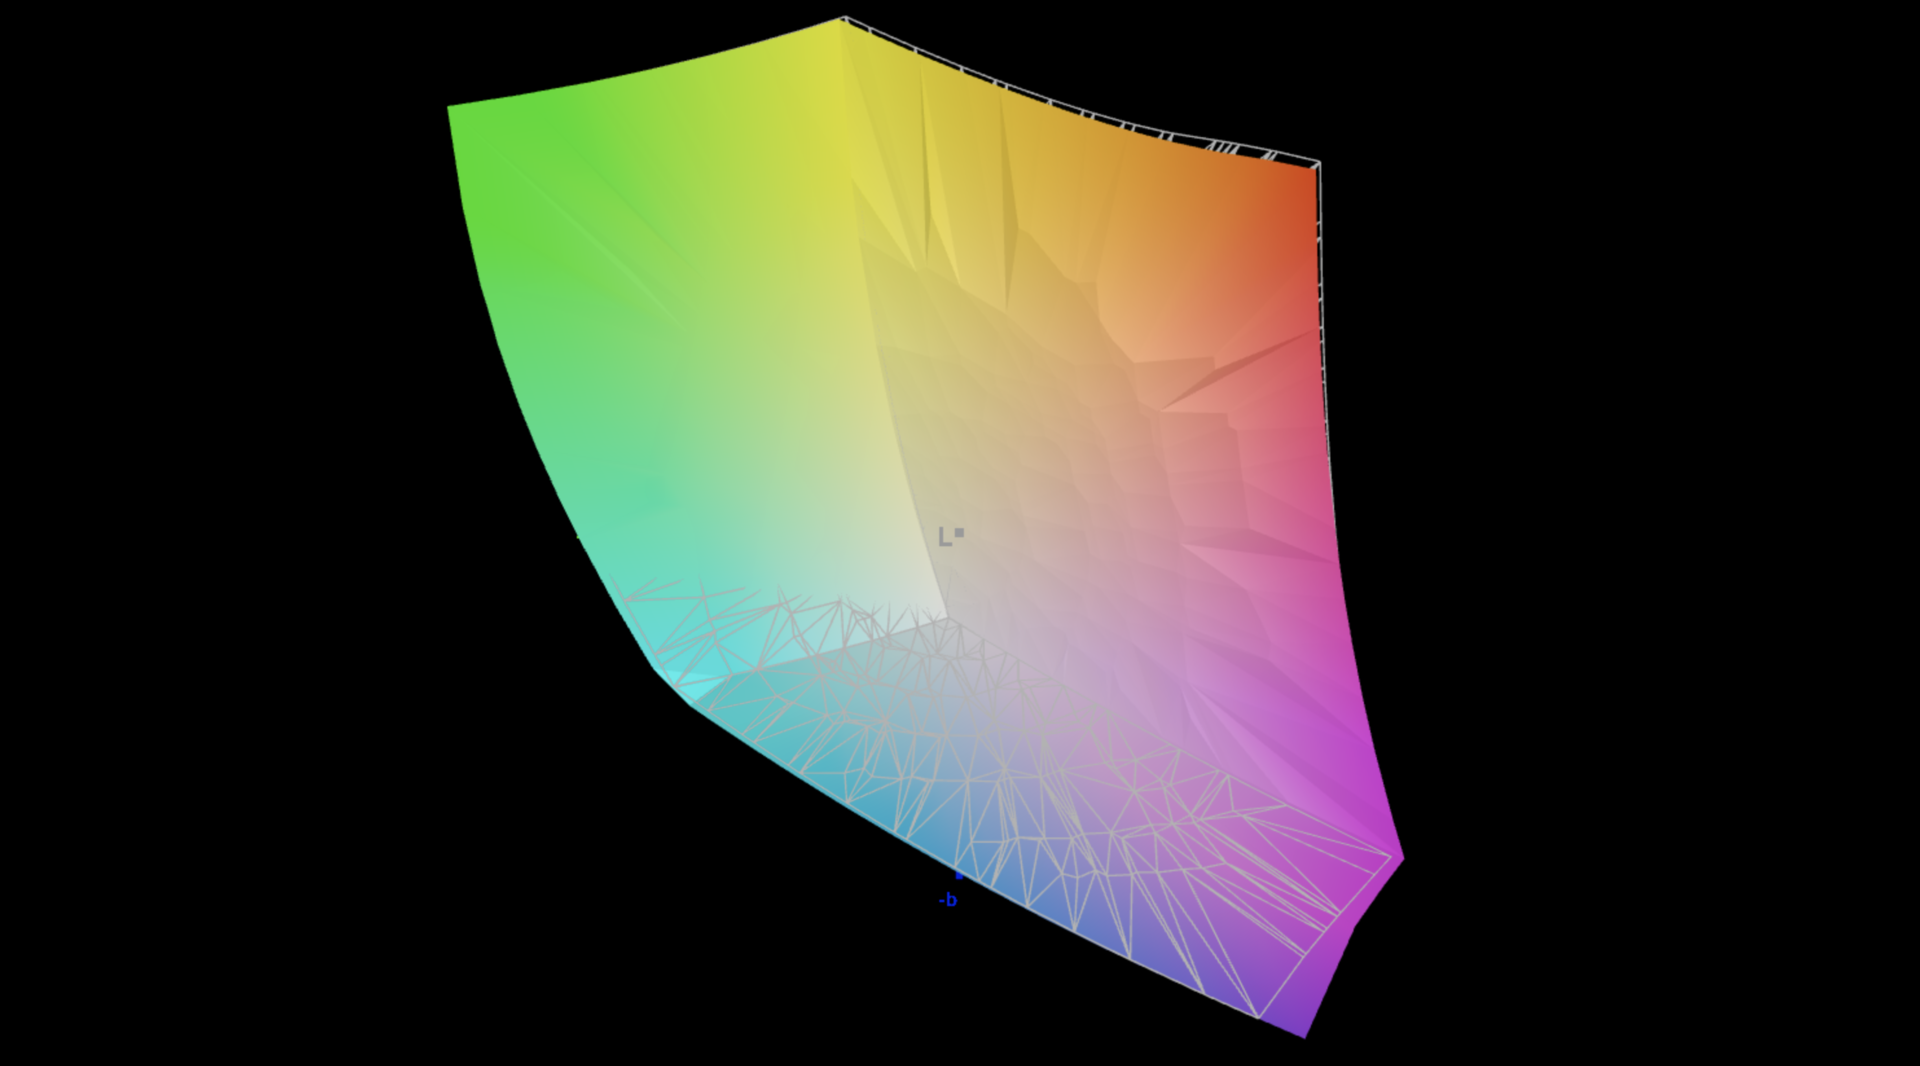
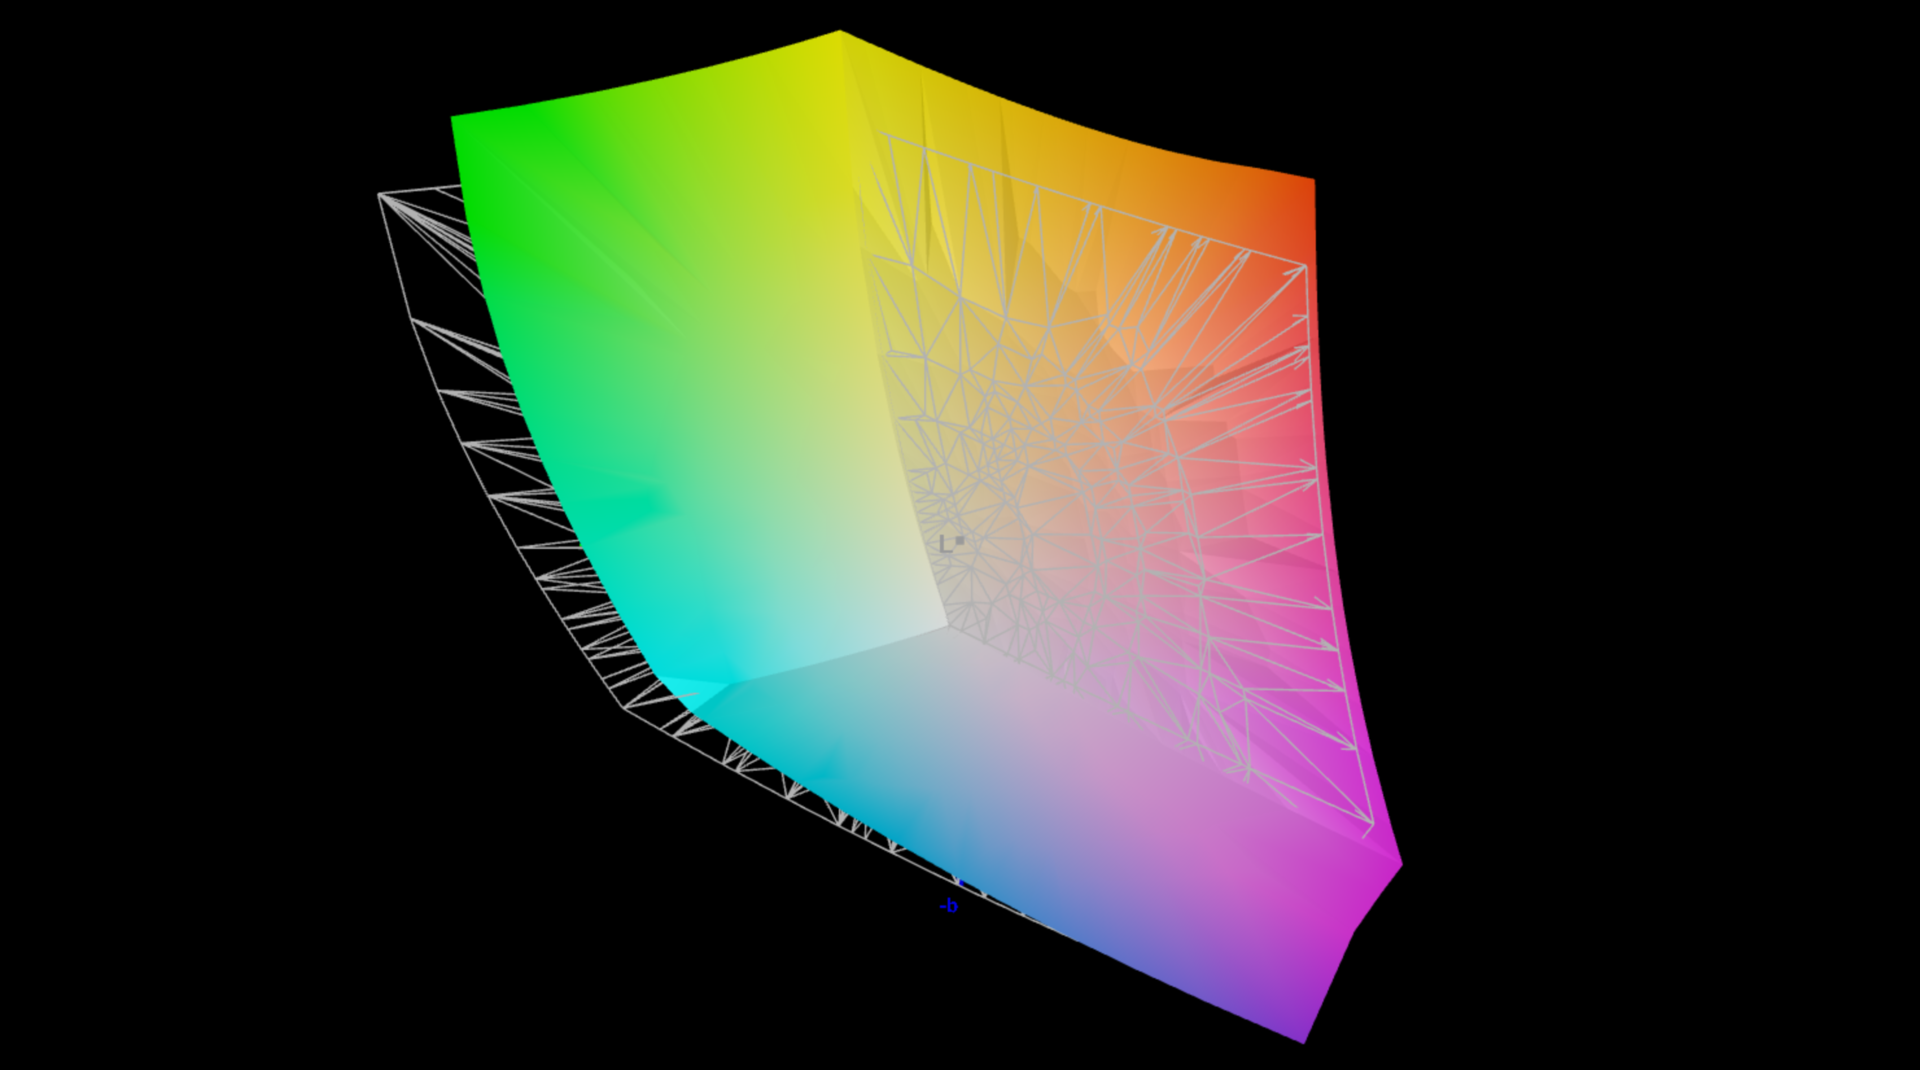
89.1% AdobeRGB 1998 (Argyll 3D)
100% sRGB (Argyll 3D)
98.8% Display P3 (Argyll 3D)
Gamma: 2.2
CCT: 6842 K
| Honor MagicBook Pro 16 2024 TL160MDMP01, IPS, 3072x1920, 16" | Framework Laptop 16 2560x1600, 16" | Lenovo ThinkPad Z16 Gen 2 Samsung ATNA60YV04-0, OLED, 3840x2400, 16" | Dell Inspiron 16 Plus 7630 LG Philips 160WQ2, IPS, 2560x1600, 16" | Lenovo Yoga Pro 9 16-IRP G8 LEN160-3.2K, Mini-LED, 3200x2000, 16" | Schenker VISION 16 Pro (M23) NE160QDM-NZ1, IPS, 2560x1600, 16" | Asus Vivobook Pro 16X K6604JV-MX016W Samsung SDC4178 ATNA60BX01-1, OLED, 3200x2000, 16" | |
|---|---|---|---|---|---|---|---|
| Display | -1% | 3% | -16% | 2% | -17% | 3% | |
| Display P3 Coverage (%) | 98.8 | 97.7 -1% | 99.7 1% | 70.1 -29% | 97 -2% | 68.8 -30% | 98.4 0% |
| sRGB Coverage (%) | 100 | 99.7 0% | 100 0% | 99.6 0% | 99.8 0% | 98.8 -1% | 99.7 0% |
| AdobeRGB 1998 Coverage (%) | 89.1 | 87 -2% | 96.7 9% | 72.3 -19% | 95.1 7% | 70 -21% | 95.8 8% |
| Response Times | -117% | 68% | -394% | -93% | -81% | 75% | |
| Response Time Grey 50% / Grey 80% * (ms) | 6.3 ? | 14.6 ? -132% | 1.86 ? 70% | 35 ? -456% | 14 ? -122% | 13.7 ? -117% | 1.6 ? 75% |
| Response Time Black / White * (ms) | 5.6 ? | 11.3 ? -102% | 1.89 ? 66% | 24.2 ? -332% | 9.2 ? -64% | 8.1 ? -45% | 1.4 ? 75% |
| PWM Frequency (Hz) | 60 ? | 5800 ? | 120 ? | ||||
| Screen | 7% | 1% | -32% | 41% | -33% | 46% | |
| Brightness middle (cd/m²) | 551 | 504.8 -8% | 390.1 -29% | 299.4 -46% | 539 -2% | 384 -30% | 347 -37% |
| Brightness (cd/m²) | 524 | 490 -6% | 393 -25% | 290 -45% | 546 4% | 371 -29% | 346 -34% |
| Brightness Distribution (%) | 91 | 84 -8% | 97 7% | 92 1% | 96 5% | 88 -3% | 97 7% |
| Black Level * (cd/m²) | 0.52 | 0.41 21% | 0.21 60% | 0.18 65% | 0.3 42% | 0.06 88% | |
| Contrast (:1) | 1060 | 1231 16% | 1426 35% | 2994 182% | 1280 21% | 5783 446% | |
| Colorchecker dE 2000 * | 1.7 | 1.23 28% | 1.41 17% | 4.25 -150% | 1.4 18% | 3.4 -100% | 1.89 -11% |
| Colorchecker dE 2000 max. * | 4.1 | 3.74 9% | 3.43 16% | 6.71 -64% | 2.1 49% | 9.2 -124% | 3.26 20% |
| Colorchecker dE 2000 calibrated * | 1 | 1.1 -10% | 0.52 48% | 1.3 -30% | 1.97 -97% | ||
| Greyscale dE 2000 * | 2.4 | 2 17% | 2 17% | 5.5 -129% | 2.2 8% | 3.4 -42% | 1.55 35% |
| Gamma | 2.2 100% | 2.22 99% | 2.22 99% | 2.35 94% | 2.19 100% | 2.16 102% | 2.39 92% |
| CCT | 6842 95% | 6670 97% | 6324 103% | 6368 102% | 6479 100% | 7462 87% | 6458 101% |
| Media total (Programa/Opciones) | -37% /
-13% | 24% /
14% | -147% /
-80% | -17% /
11% | -44% /
-36% | 41% /
41% |
* ... más pequeño es mejor
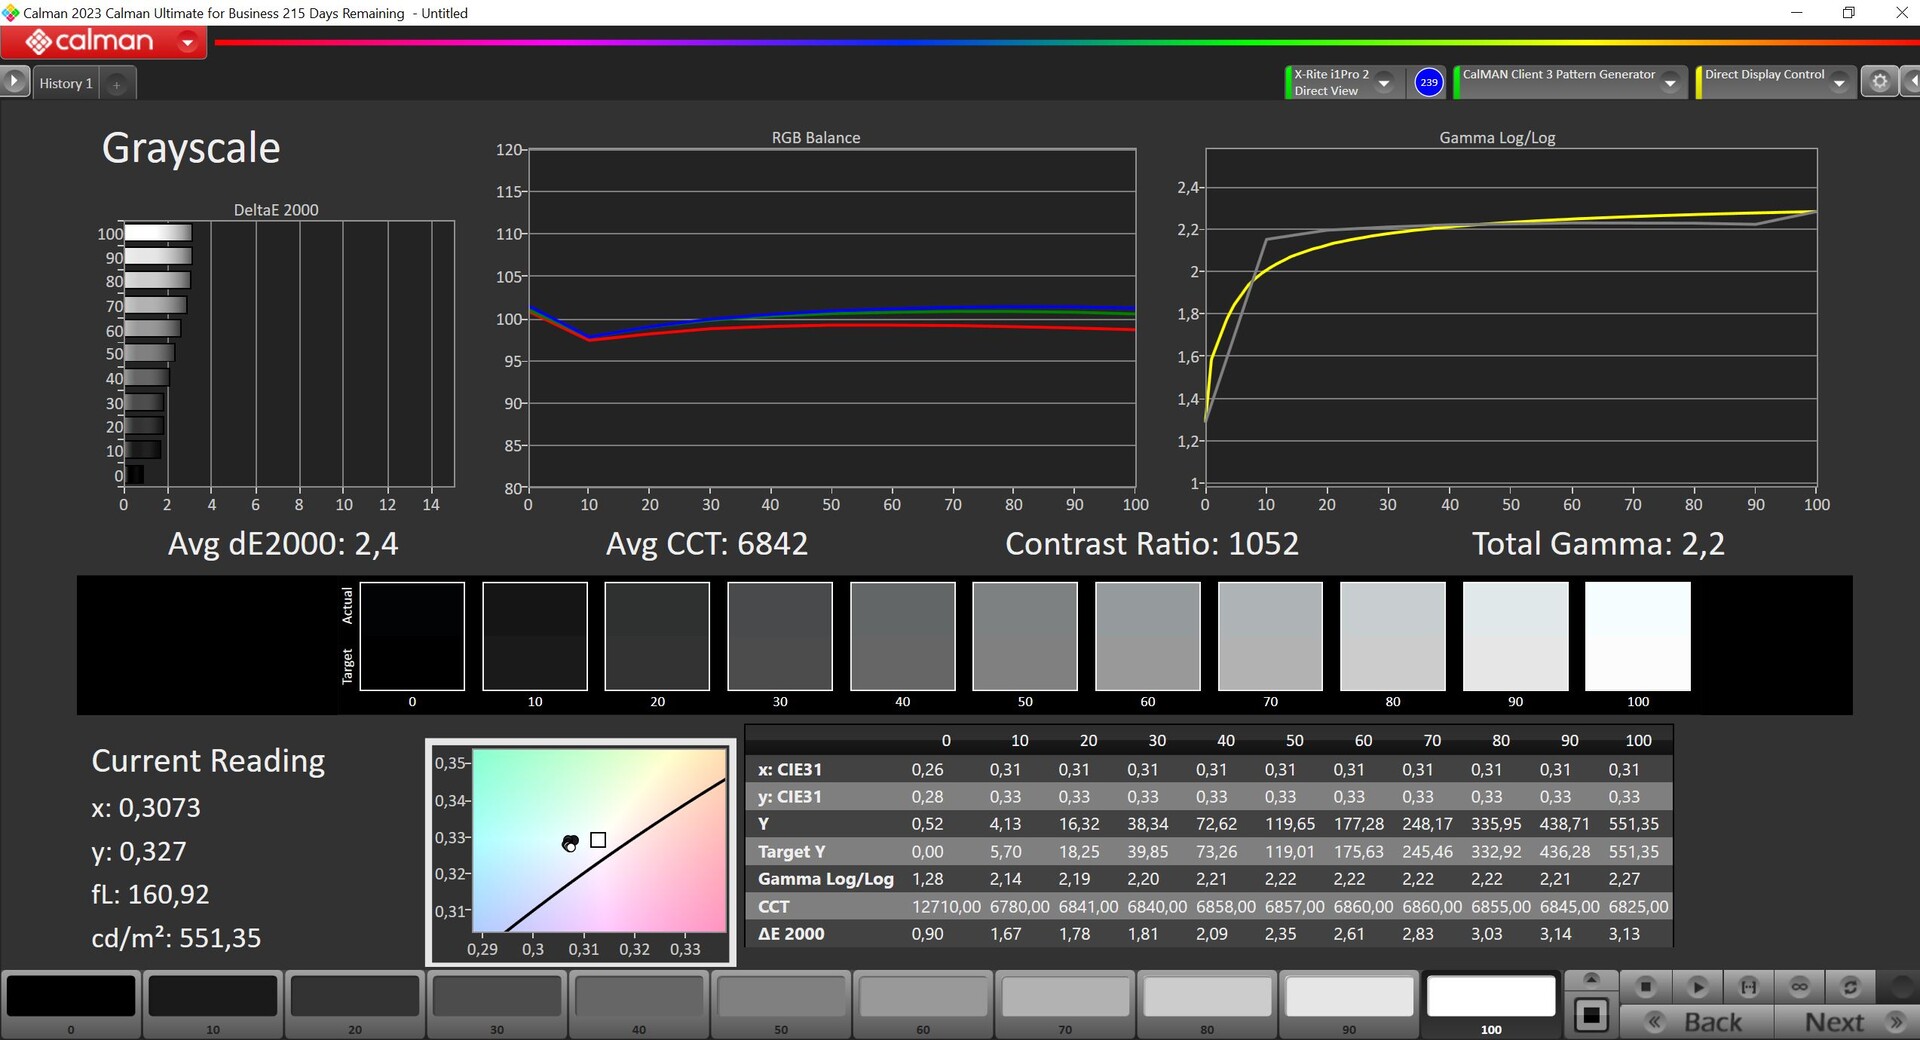
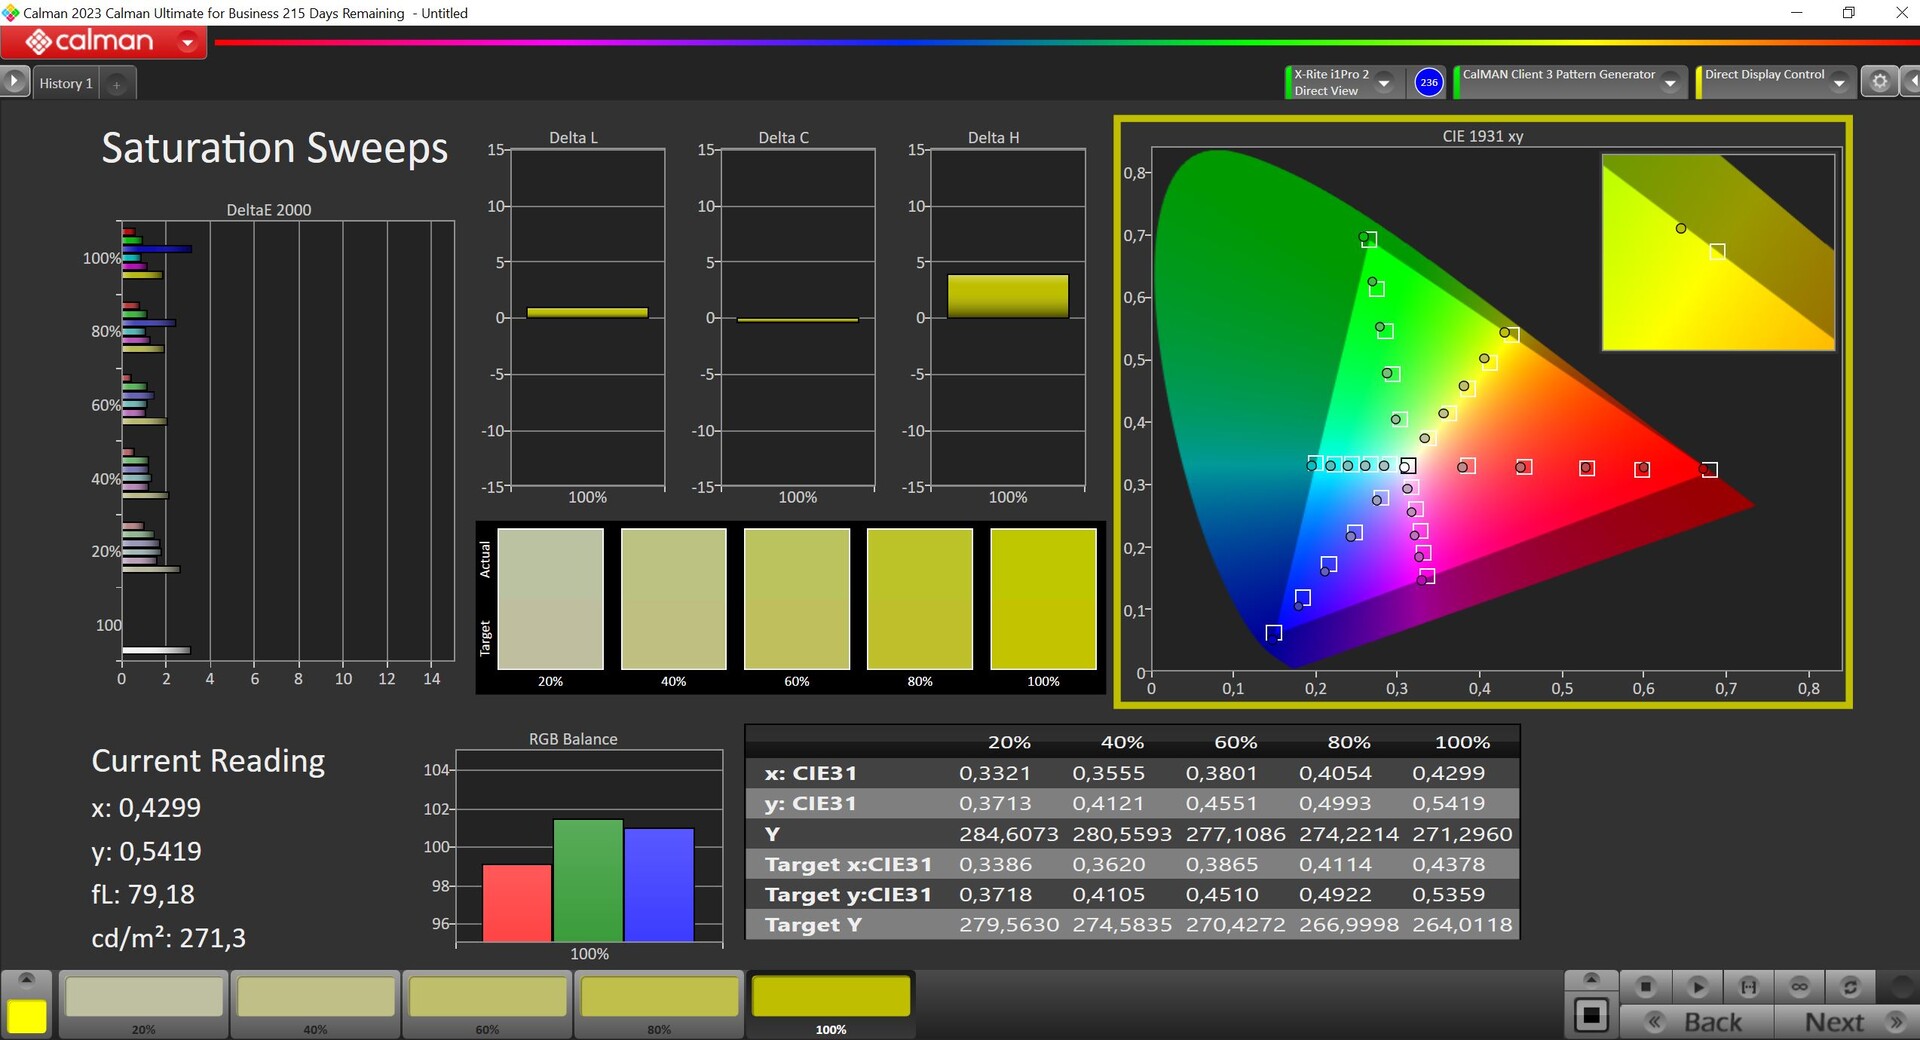

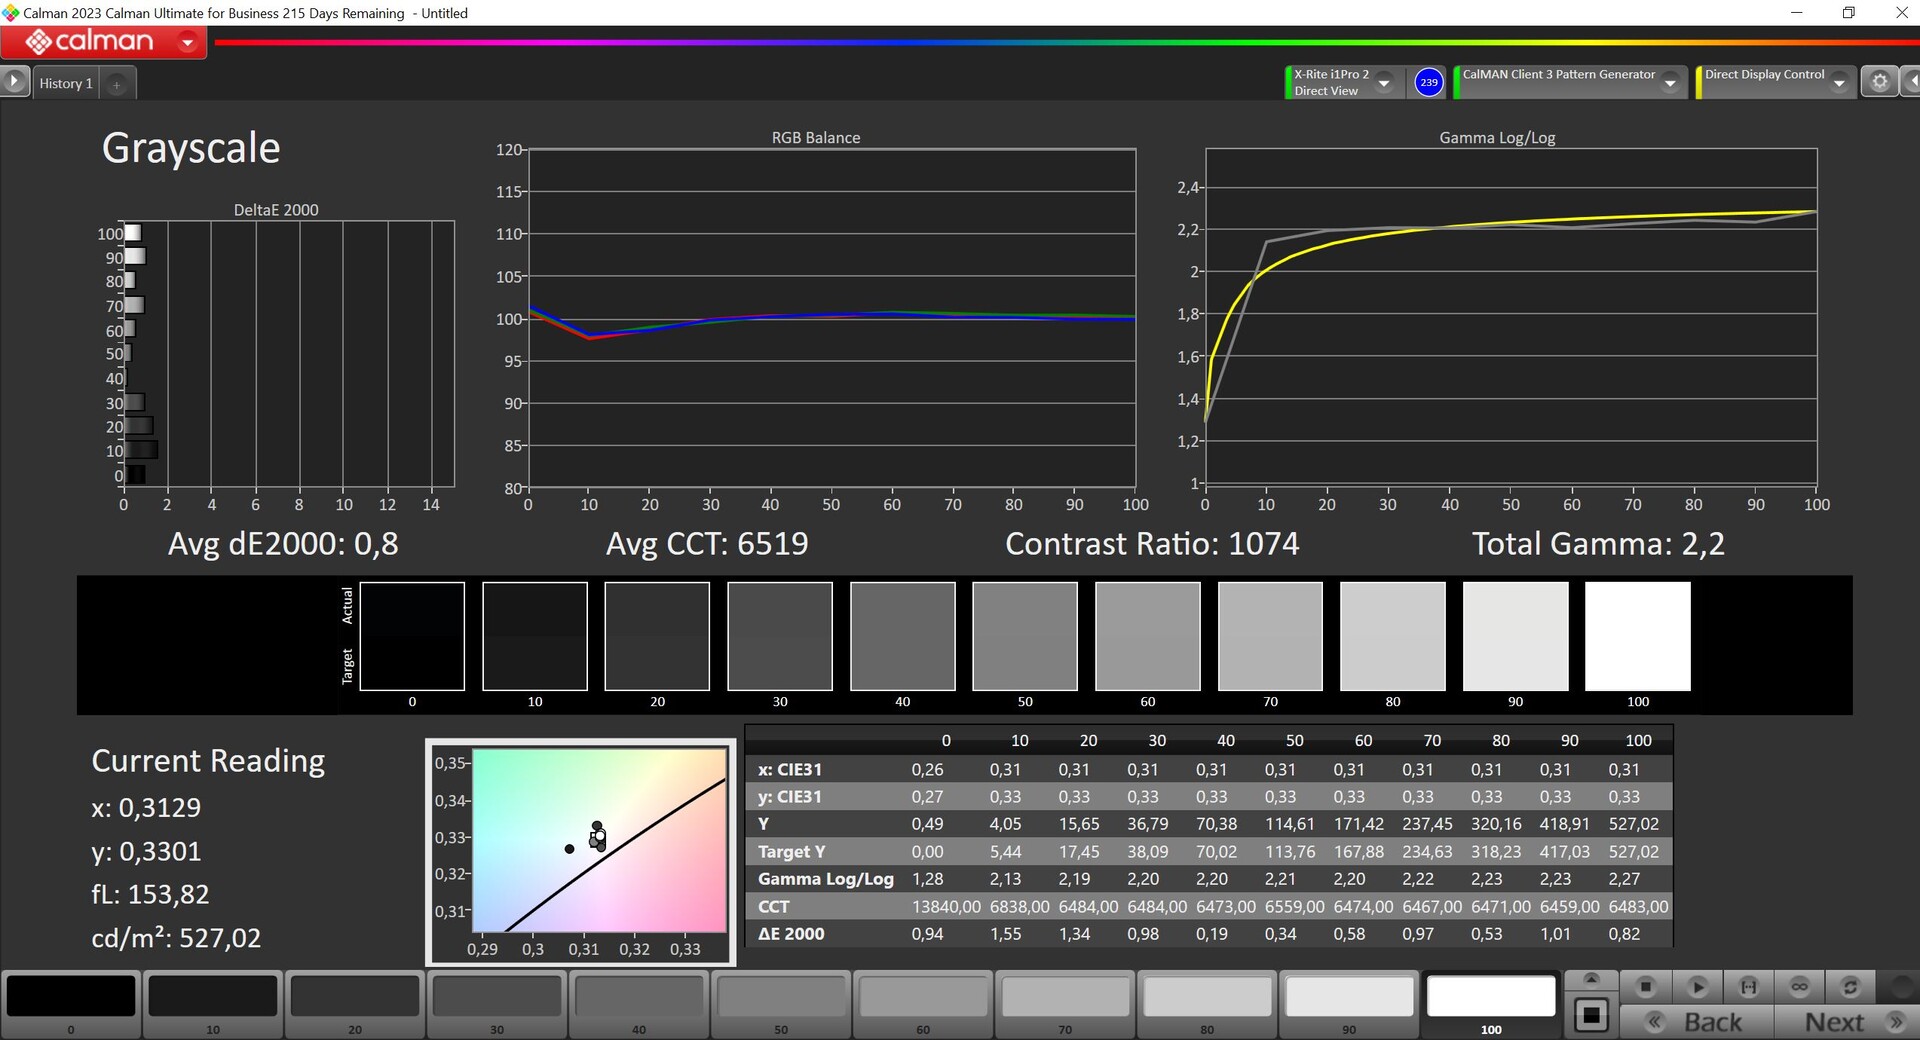
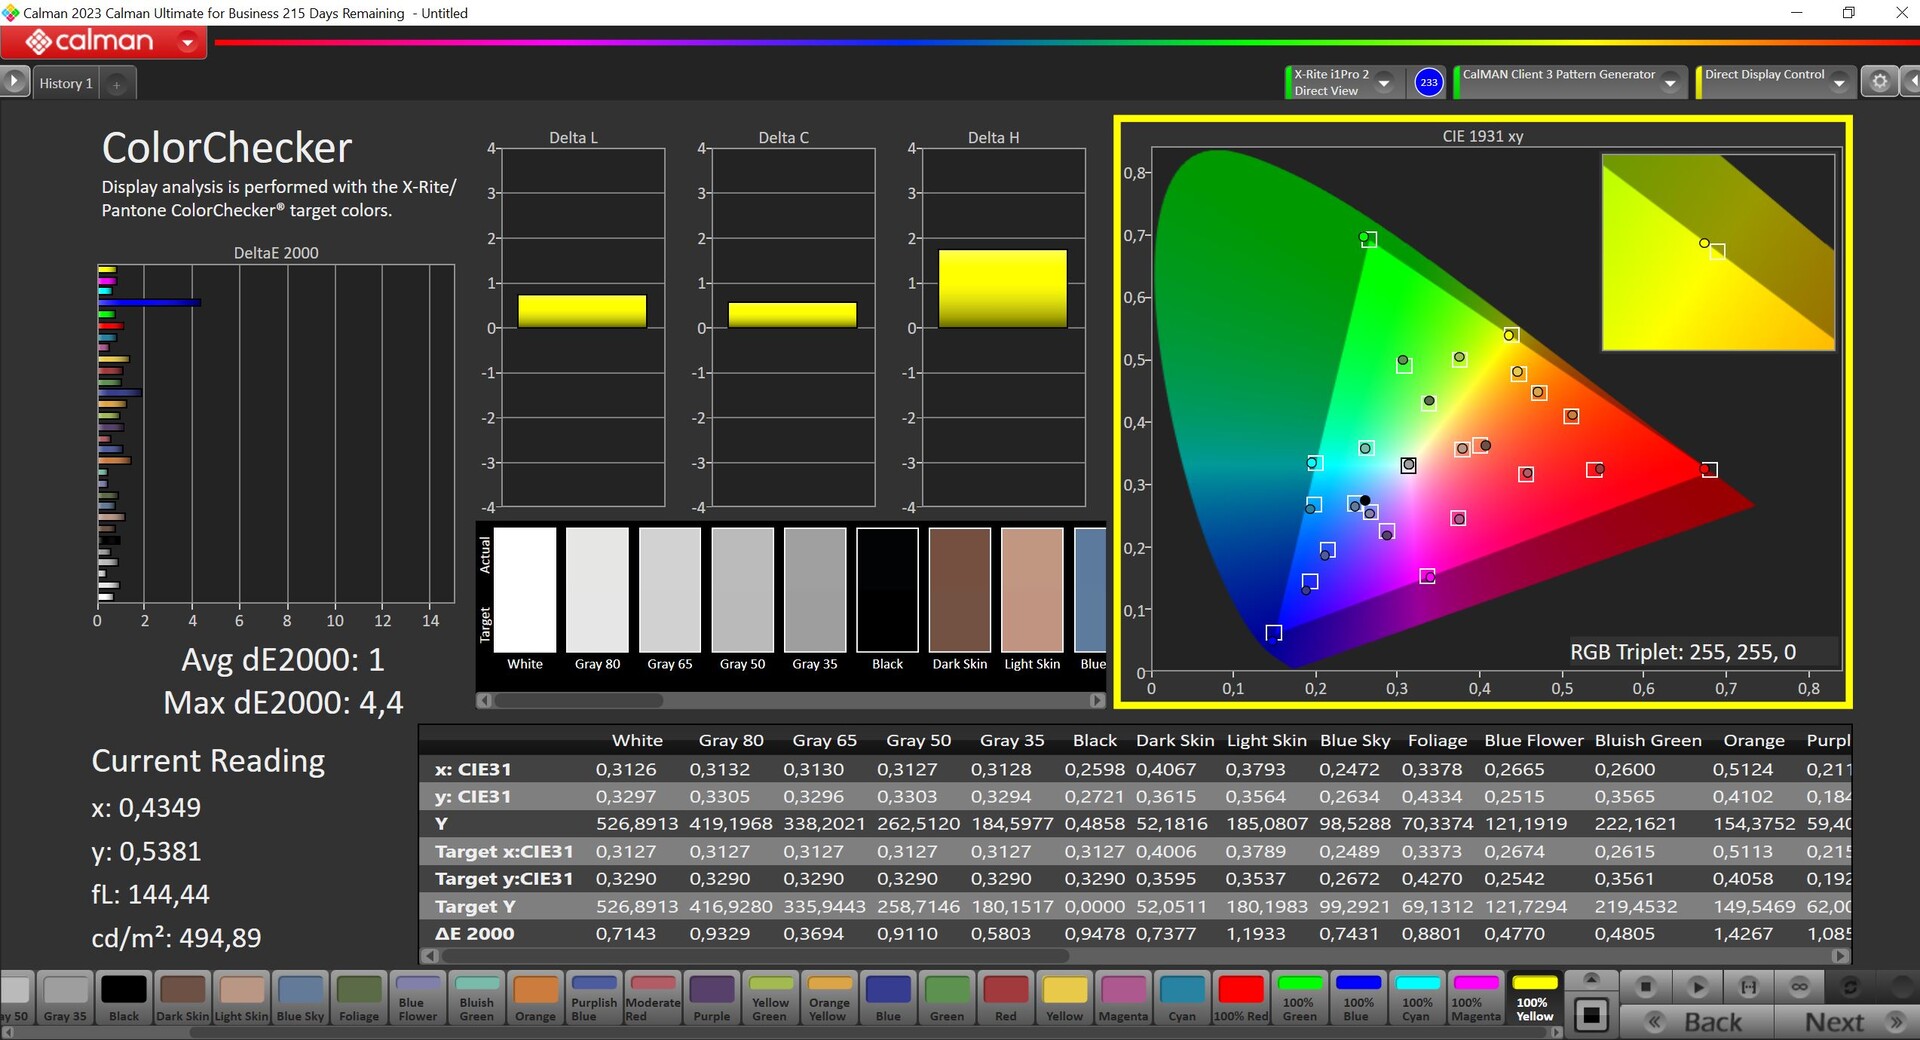
Honor no ofrece ningún perfil de color, lo que significa que tampoco existe la opción de poder restringir el espacio de color de P3 a sRGB. Hemos analizado el panel con el software profesional CalMAN y las desviaciones de la escala de grises son muy bajas. Sin embargo, hay un ligero matiz azul emparejado con una temperatura de color que está un poco en el lado frío, pero esto no es particularmente problemático. En cuanto a los colores, sólo el azul está un poco por encima del valor objetivo de 3 y esto puede considerarse un rendimiento sólido. Con nuestra calibración, (el correspondiente perfil gratuito y descargable se puede encontrar más arriba) conseguimos tener bajo control tanto el tono como la temperatura del color y las desviaciones medias de color resultantes son menores con el único inconveniente que sigue siendo el color azul.


Tiempos de respuesta del display
| ↔ Tiempo de respuesta de Negro a Blanco | ||
|---|---|---|
| 5.6 ms ... subida ↗ y bajada ↘ combinada | ↗ 1.6 ms subida | 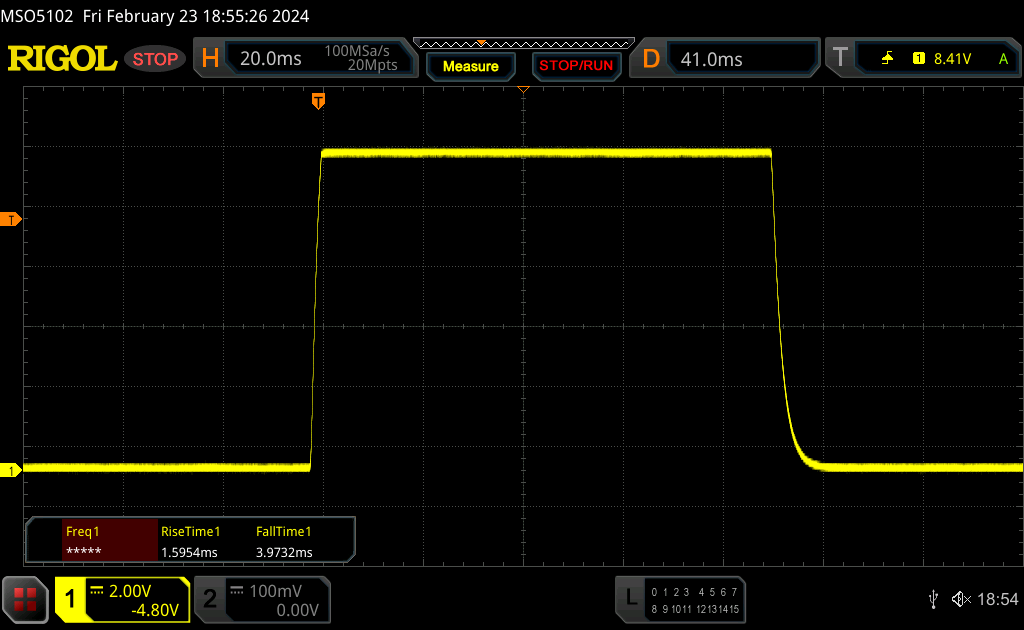 |
| ↘ 4 ms bajada | ||
| La pantalla mostró tiempos de respuesta muy rápidos en nuestros tests y debería ser adecuada para juegos frenéticos. En comparación, todos los dispositivos de prueba van de ##min### (mínimo) a 240 (máximo) ms. » 18 % de todos los dispositivos son mejores. Esto quiere decir que el tiempo de respuesta medido es mejor que la media (19.8 ms) de todos los dispositivos testados. | ||
| ↔ Tiempo de respuesta 50% Gris a 80% Gris | ||
| 6.3 ms ... subida ↗ y bajada ↘ combinada | ↗ 2.5 ms subida | 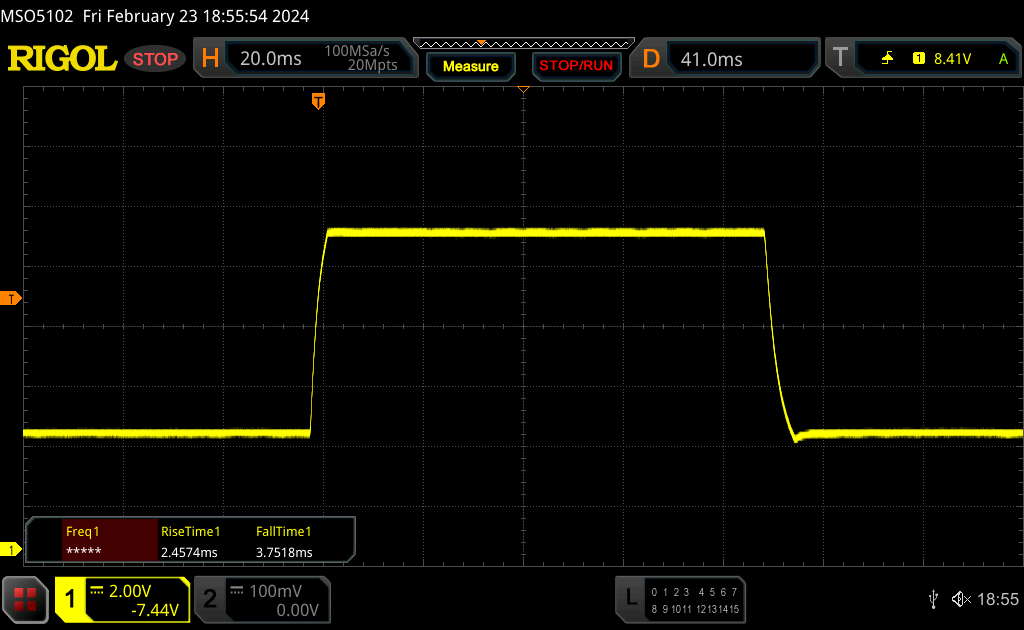 |
| ↘ 3.8 ms bajada | ||
| La pantalla mostró tiempos de respuesta muy rápidos en nuestros tests y debería ser adecuada para juegos frenéticos. En comparación, todos los dispositivos de prueba van de ##min### (mínimo) a 636 (máximo) ms. » 19 % de todos los dispositivos son mejores. Esto quiere decir que el tiempo de respuesta medido es mejor que la media (31 ms) de todos los dispositivos testados. | ||
Parpadeo de Pantalla / PWM (Pulse-Width Modulation)
| Parpadeo de Pantalla / PWM no detectado | 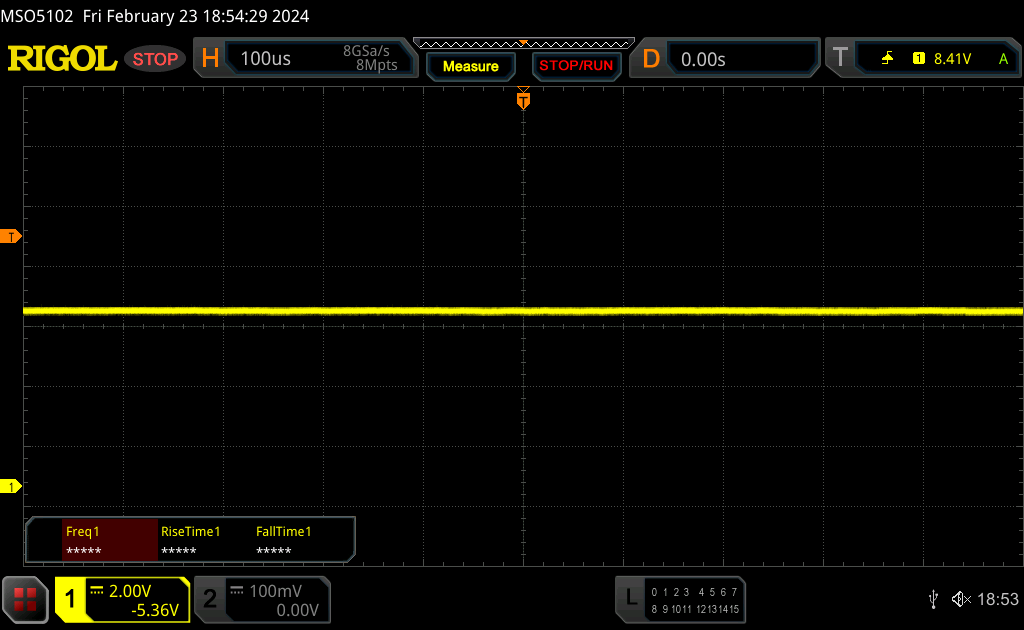 | ||
Comparación: 52 % de todos los dispositivos testados no usaron PWM para atenuar el display. Si se usó, medimos una media de 7757 (mínimo: 5 - máxmo: 343500) Hz. | |||
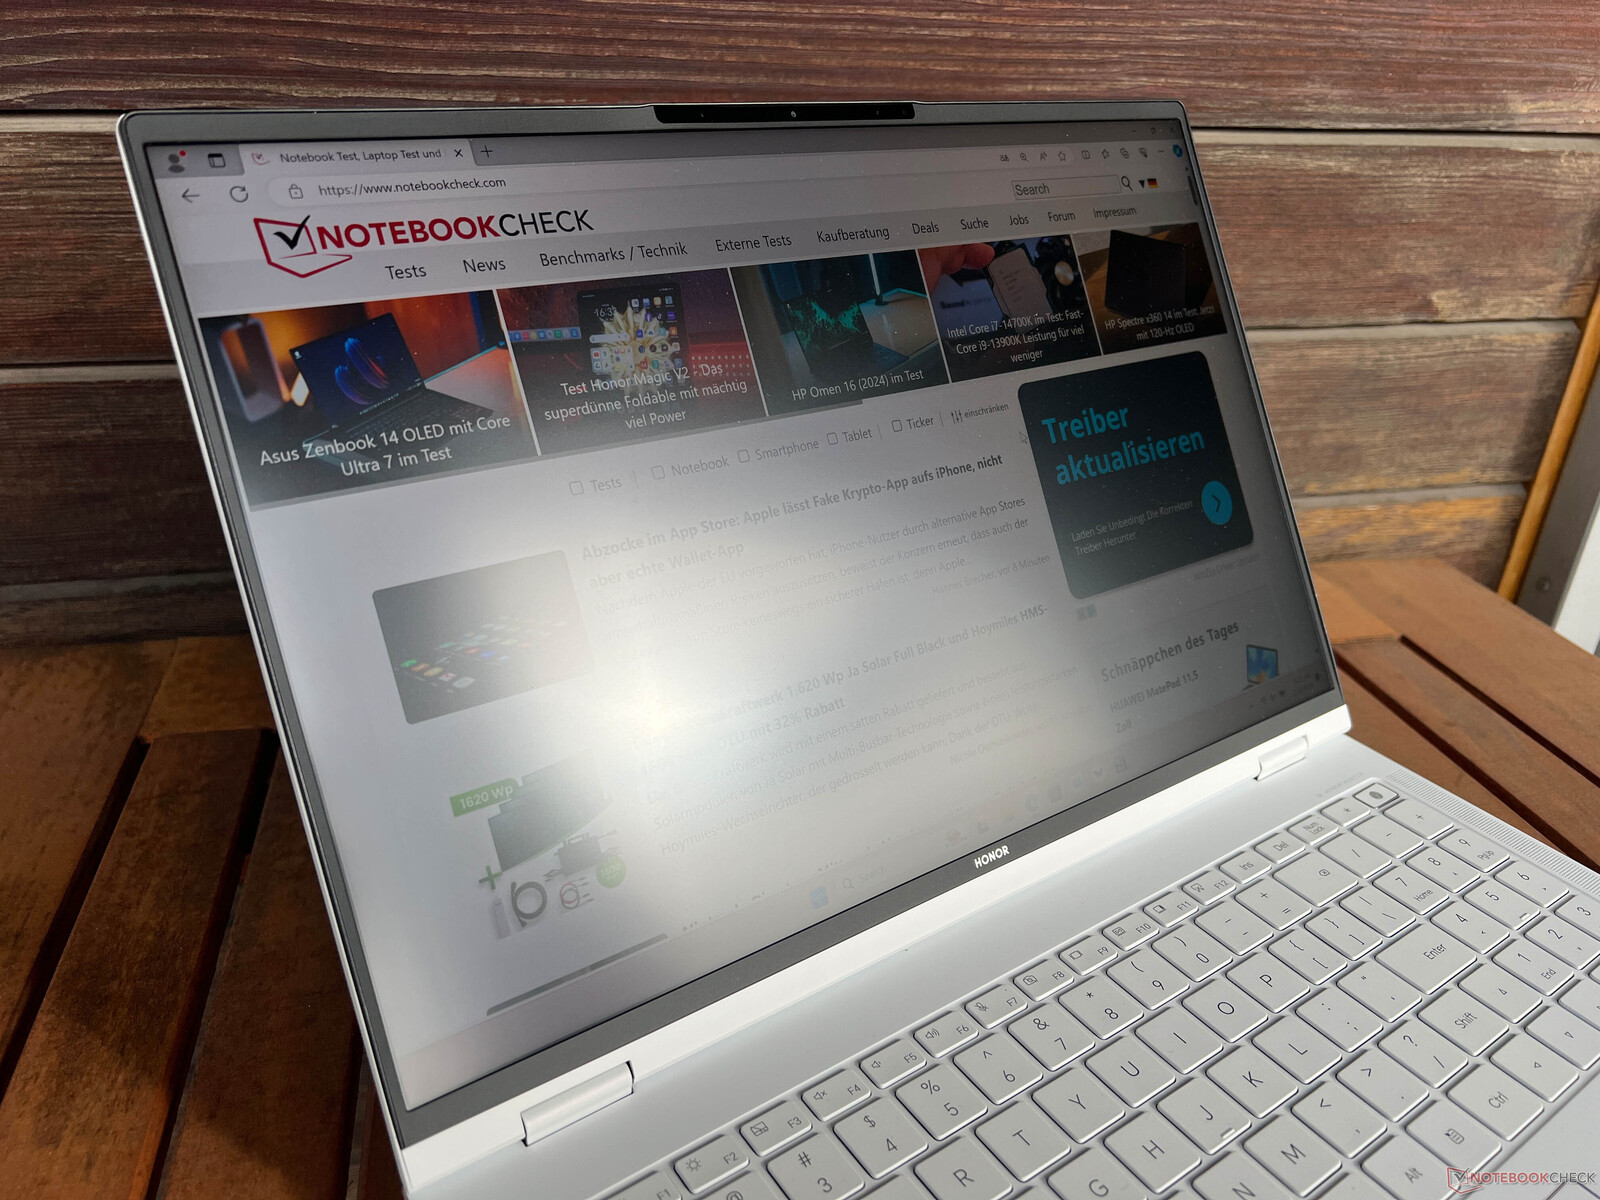
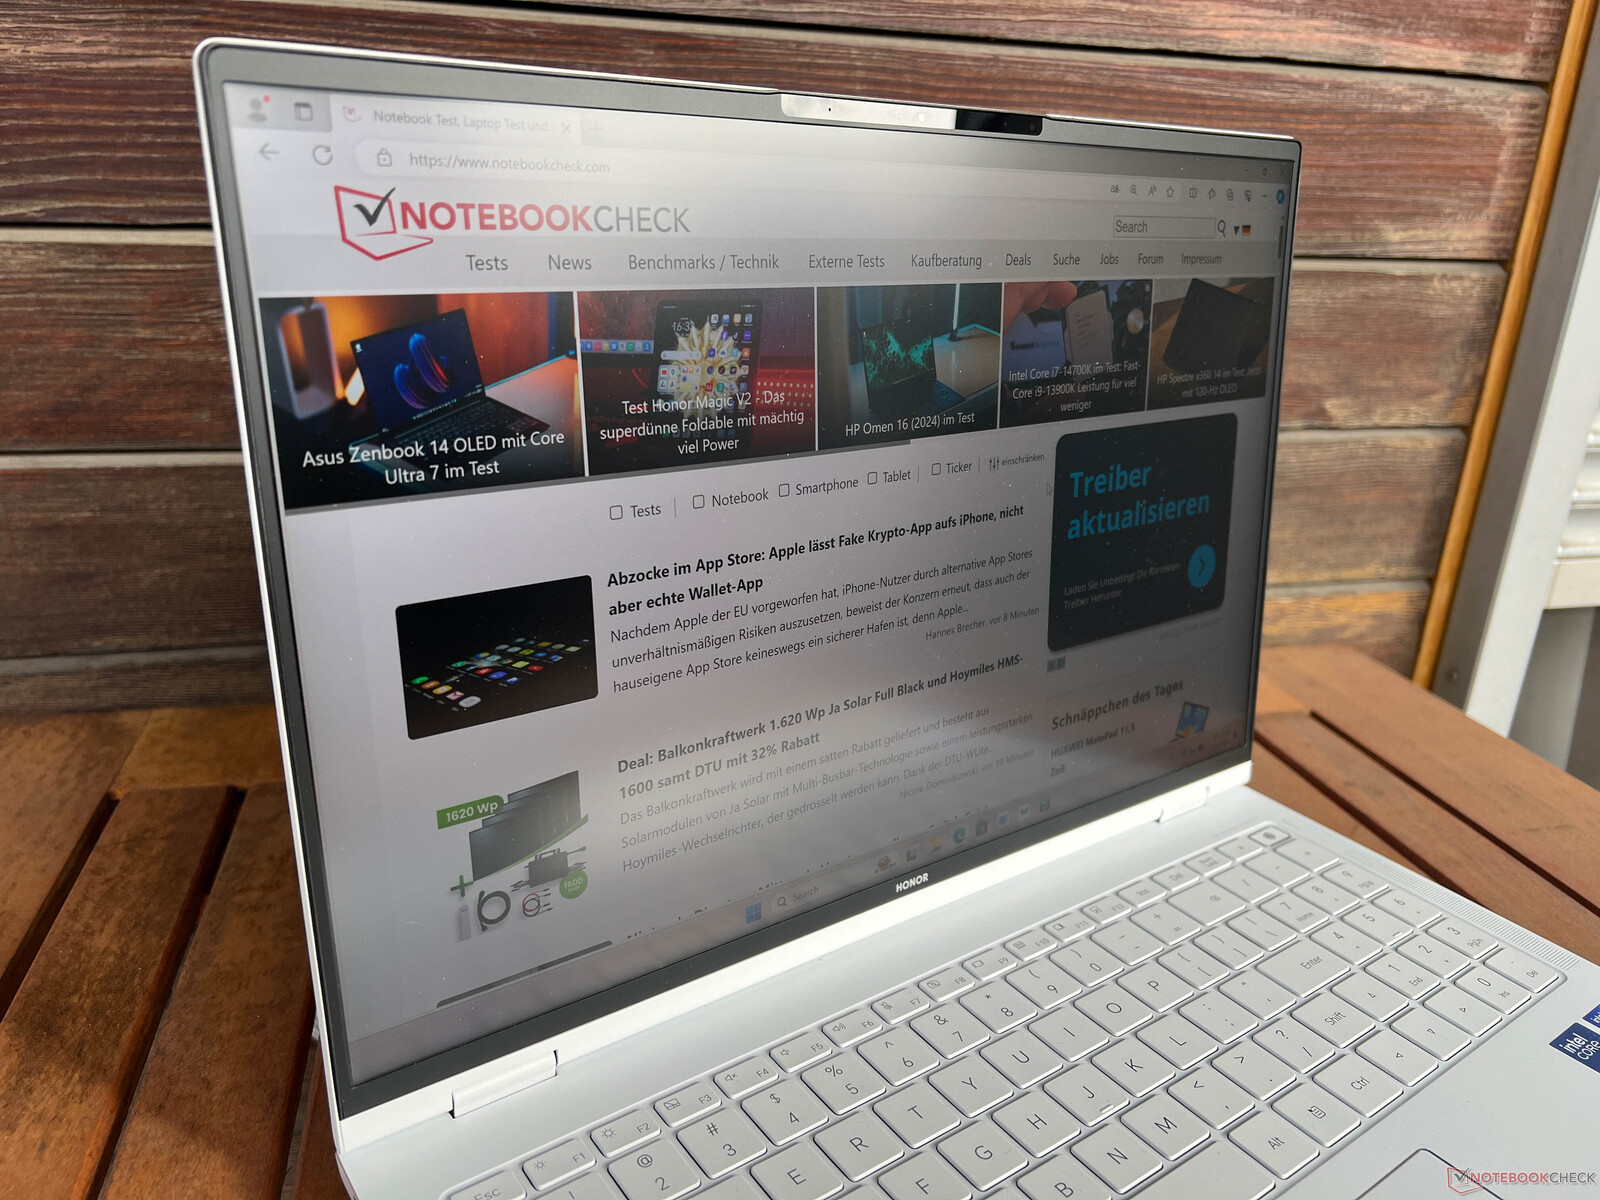
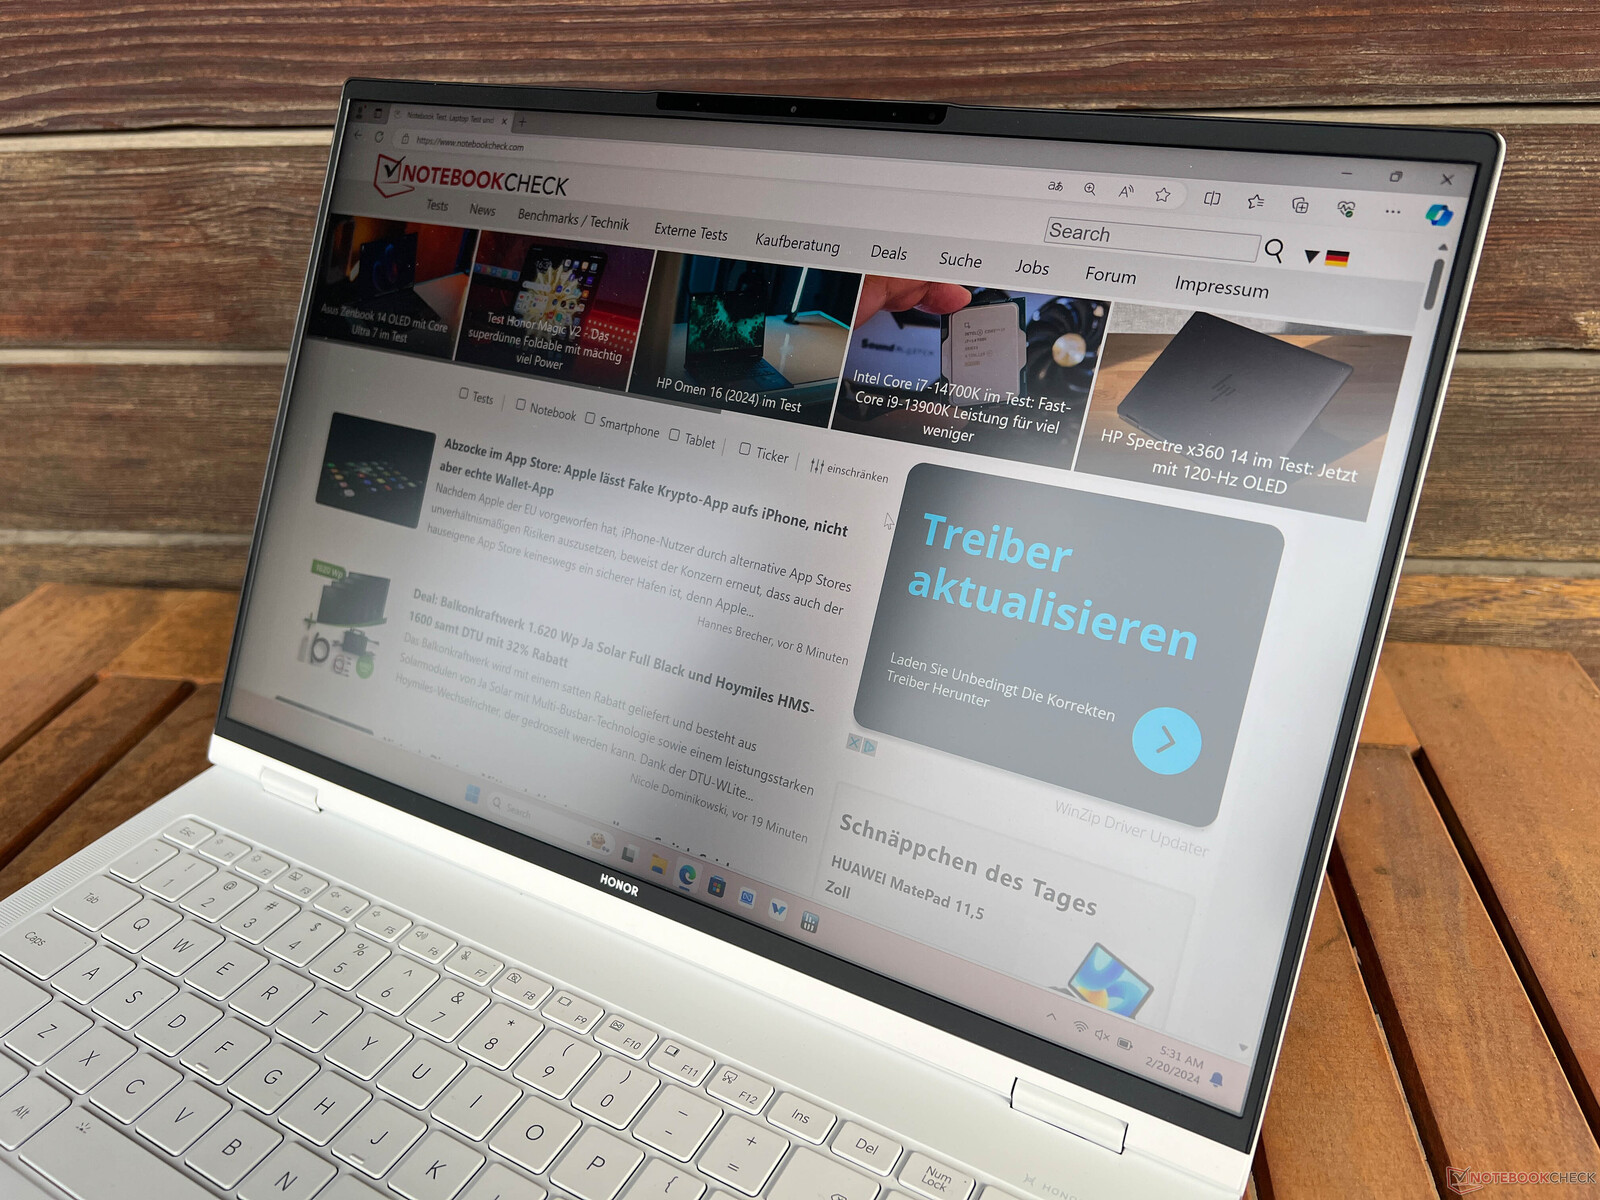
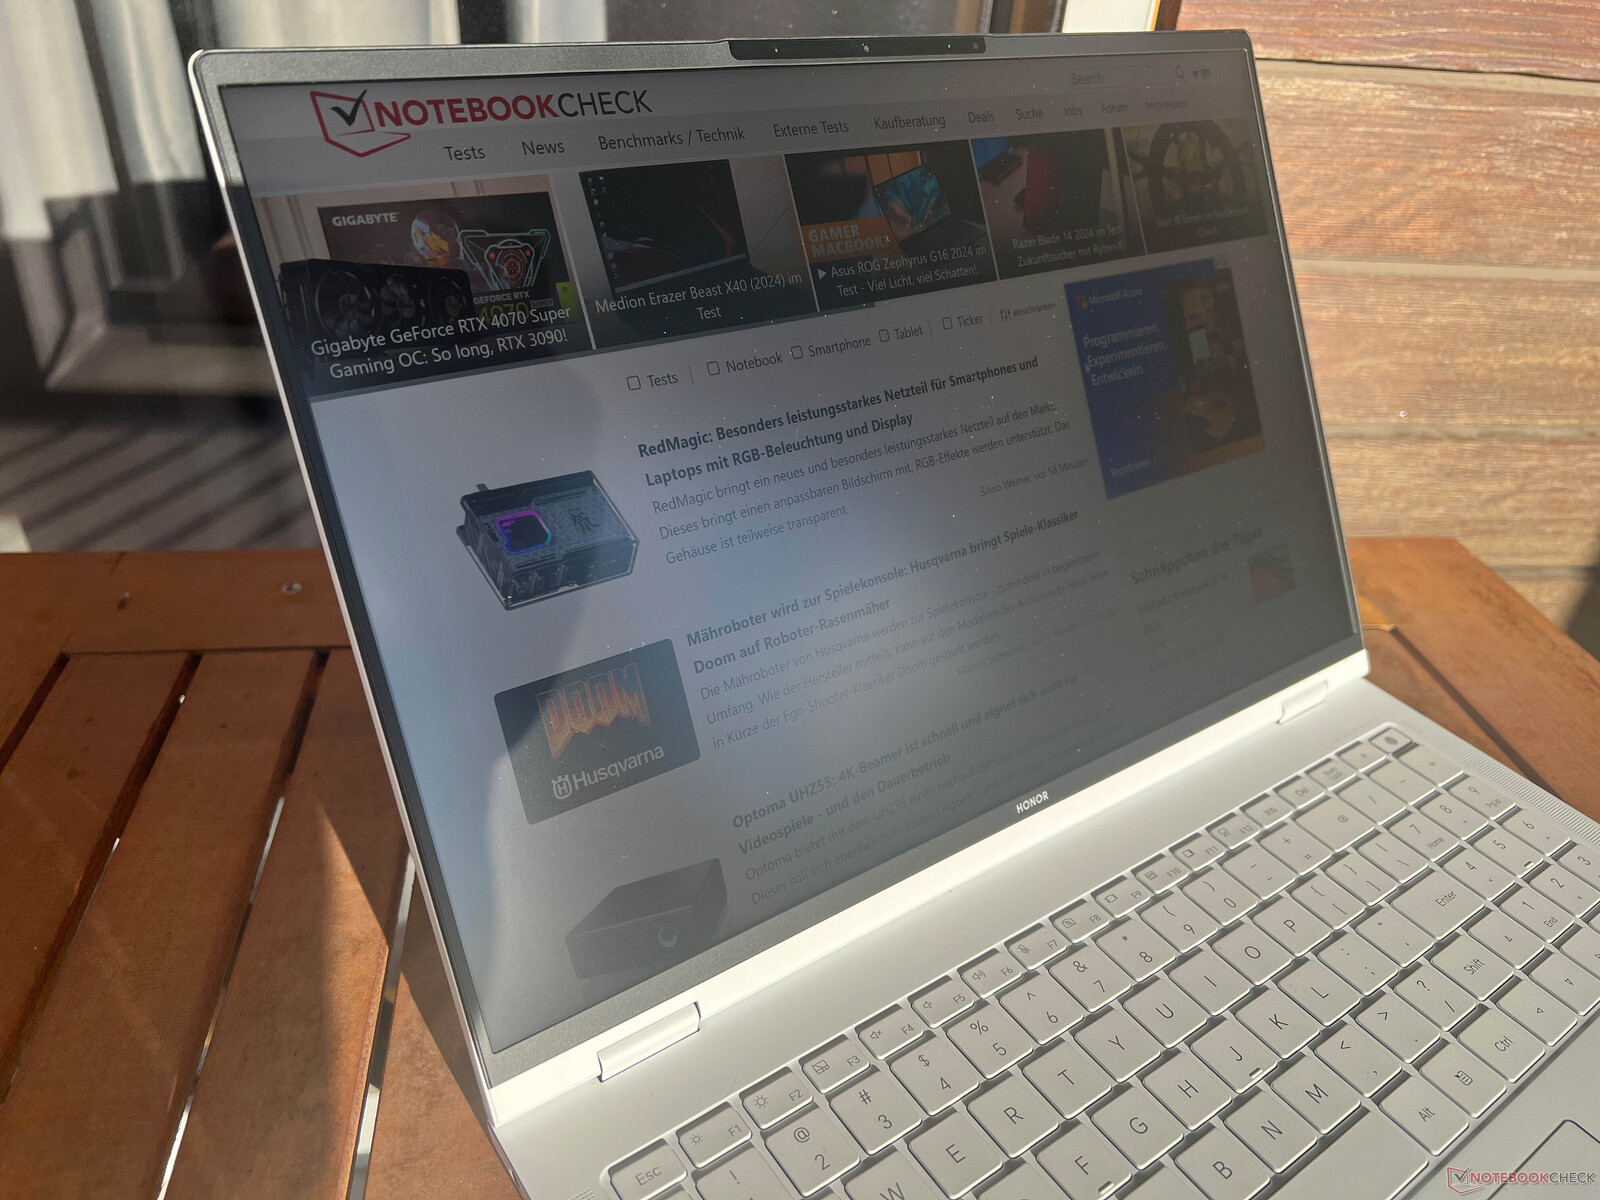
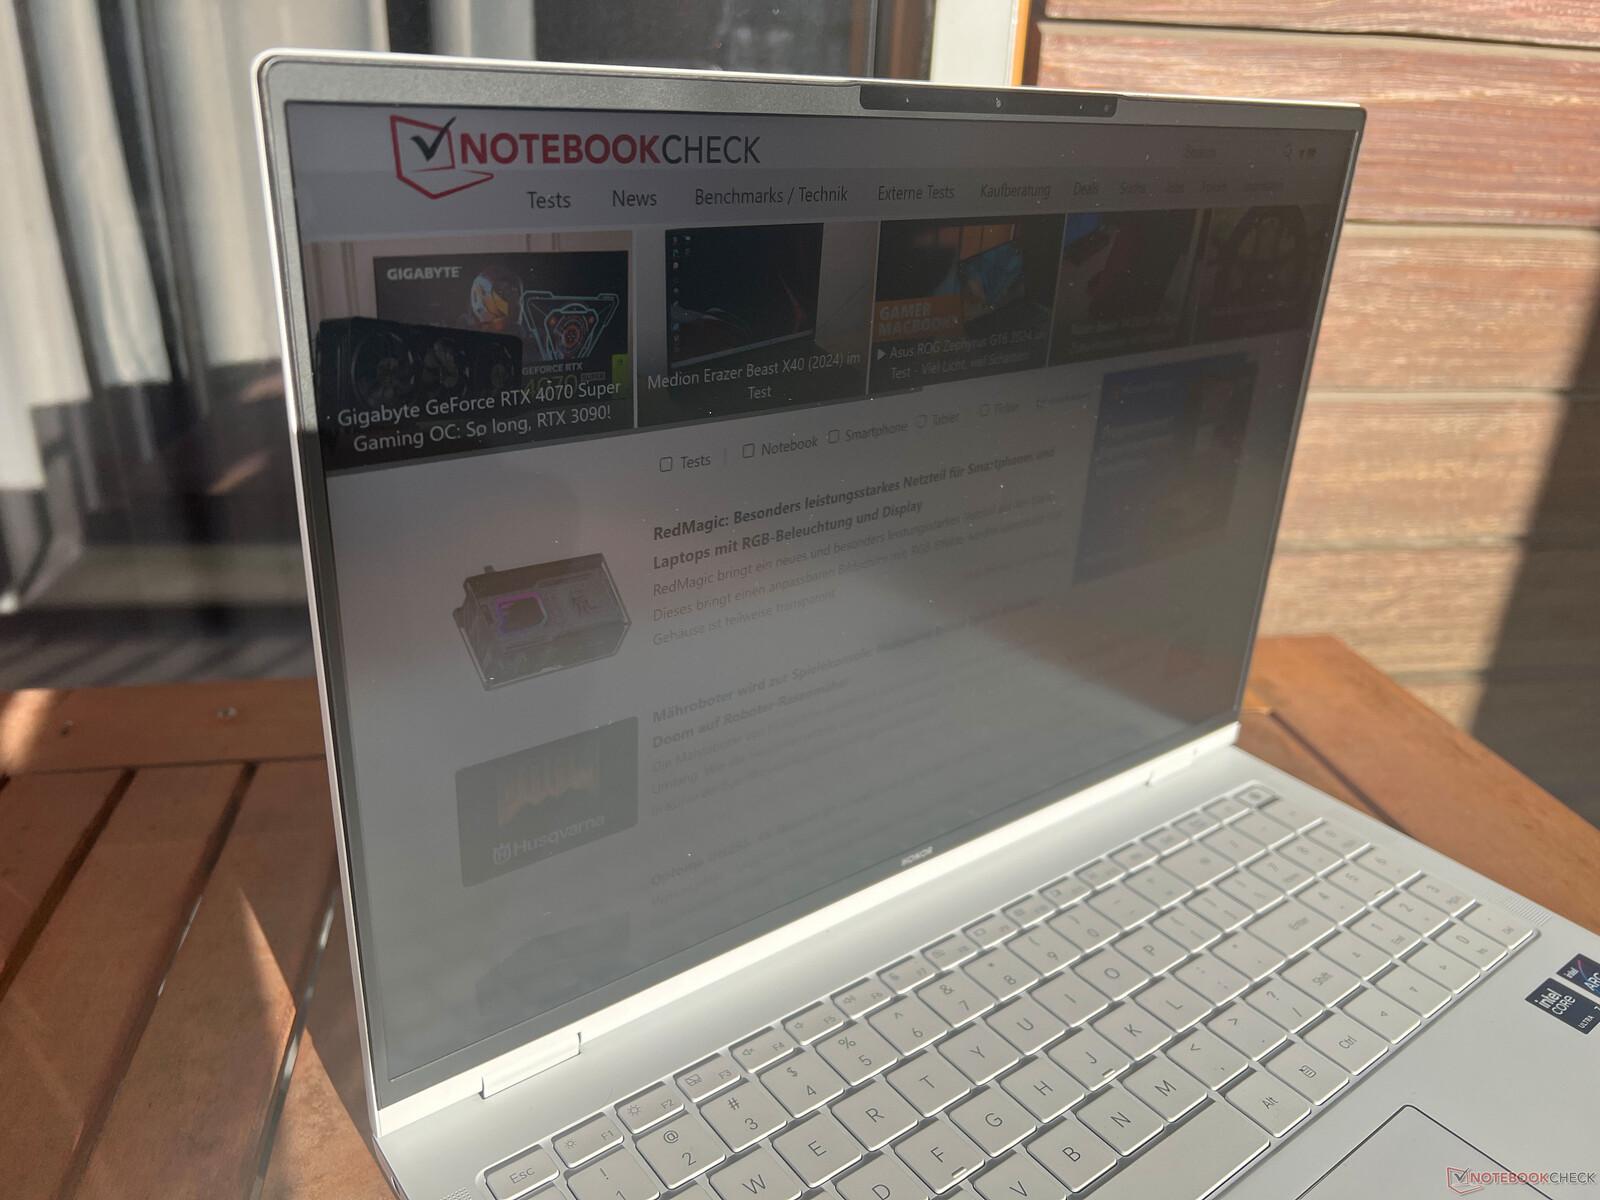
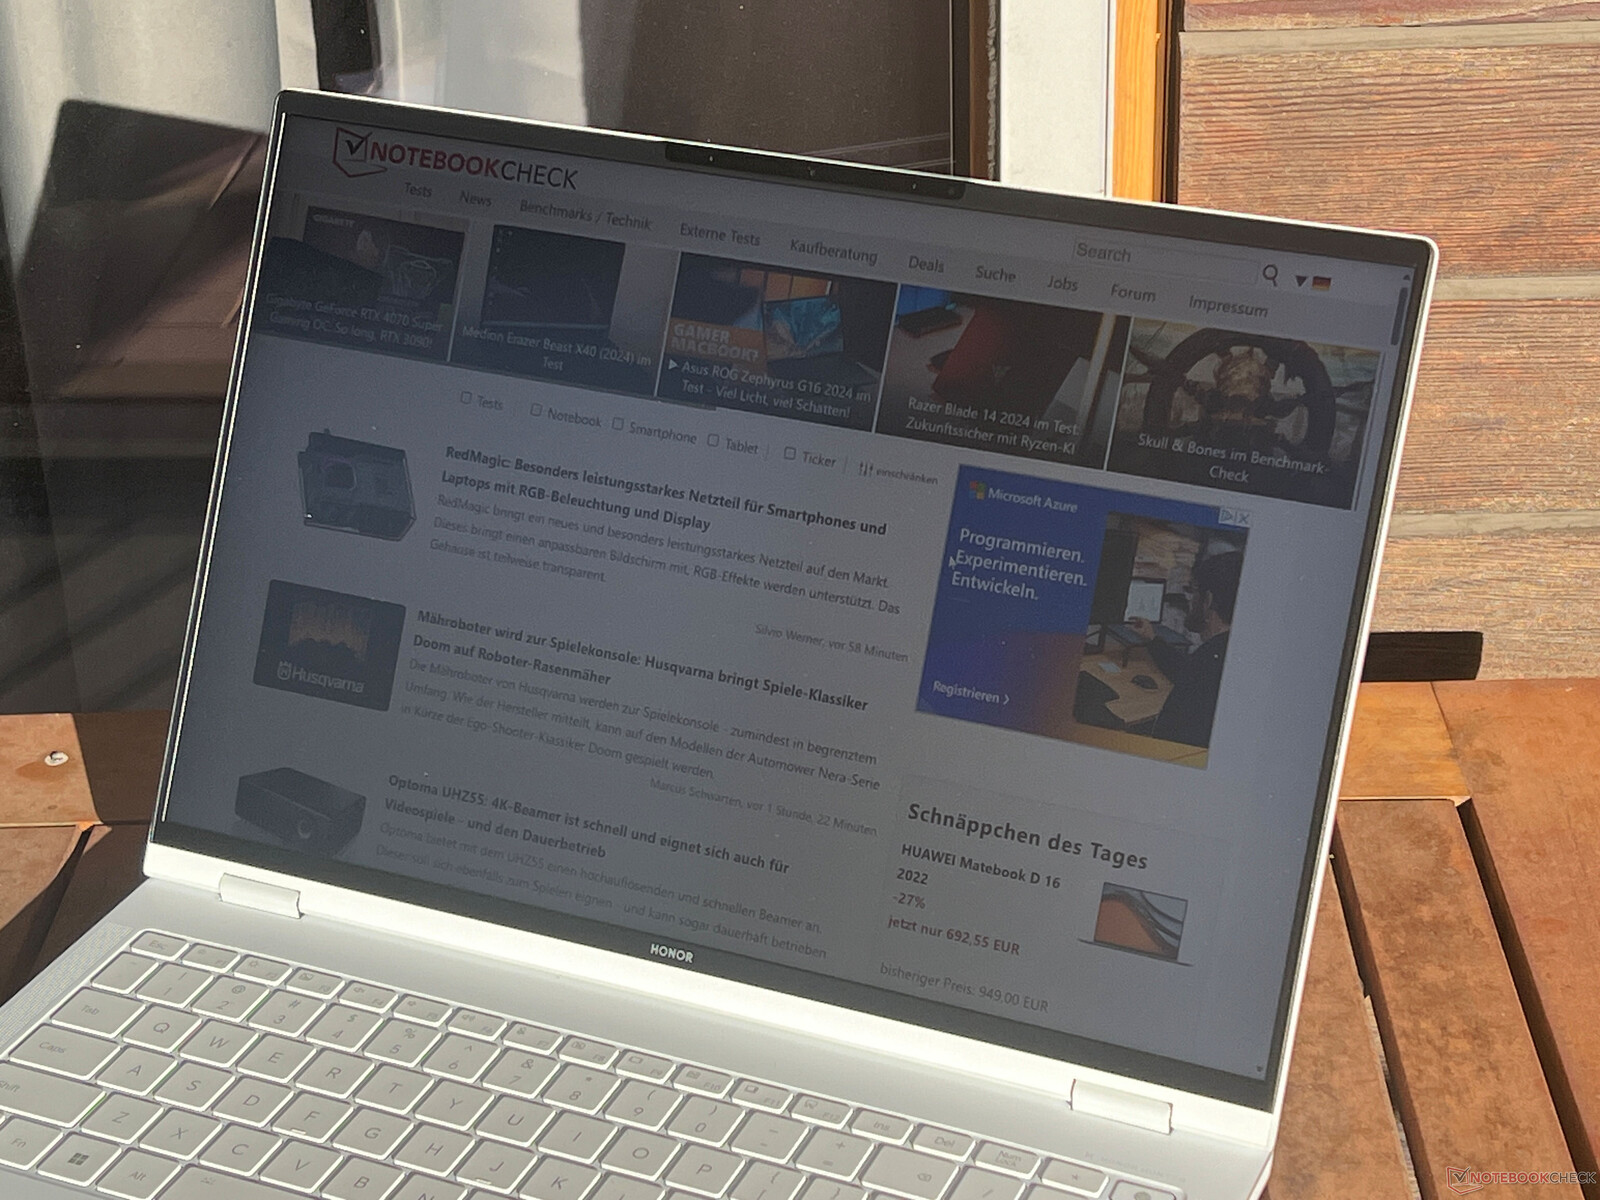
La combinación de un panel mate y su alto brillo es, por supuesto, una ventaja en exteriores. Esto significa incluso que el uso en exteriores en días soleados es posible siempre que evite la luz solar directa. La estabilidad del ángulo de visión es buena, con sólo un ligero brillo de la imagen presente cuando se mira la pantalla desde arriba en ángulo.
Rendimiento - Meteor Lake y RTX 4060 portátil
Condiciones de la prueba
Honor ofrece dos perfiles energéticos: Inteligente y de alto rendimiento. Como es norma, el modo inteligente está activo y el modo de alto rendimiento sólo está disponible cuando se enchufa a la pared. En la tabla siguiente, hemos enumerado los valores TDP/TGP respectivos. Hemos realizado las siguientes mediciones utilizando el modo inteligente.
| Perfil energético | Carga de la CPU | CB R23 Multi | Carga de la GPU | Time Spy Gráficos | Cyberpunk 2077 QHD Ultra | volumen máx. del ventilador |
|---|---|---|---|---|---|---|
| Inteligente | 90->60 vatios | 19.007 puntos | 65 vatios | 9.026 puntos | 36,5fps | 45 dB(A) |
| Alto rendimiento | 90->78 vatios | 19.112 puntos | 115 vatios | 11.153 puntos | 46,3fps | 53,2 dB(A) |
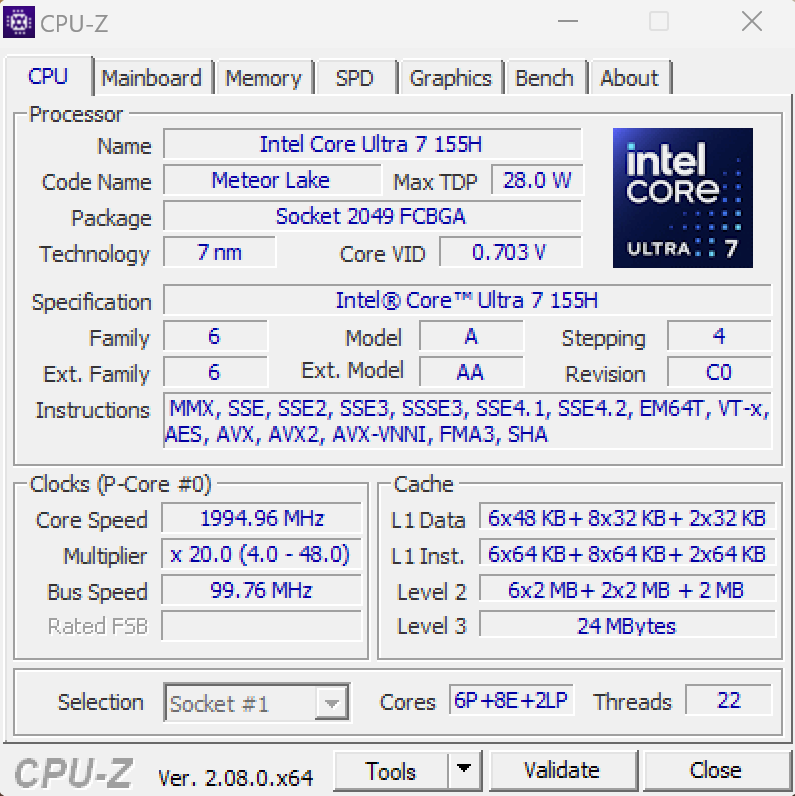
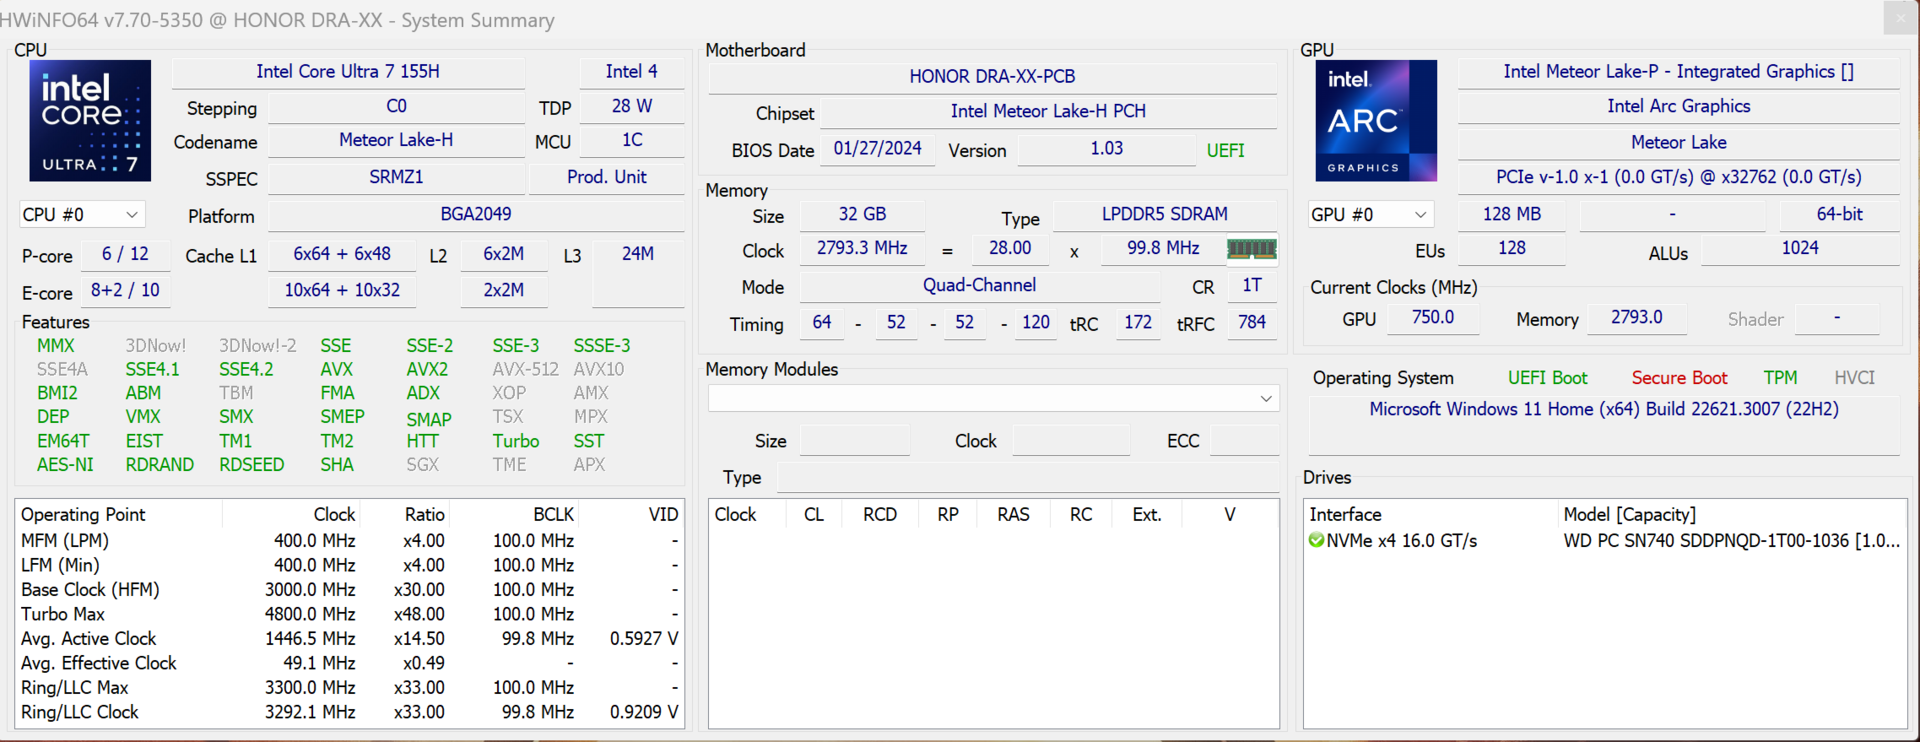
Procesador - Core Ultra 7 155H
El nuevo Core Ultra 7 155H ofrece 16 núcleos (22 hilos) y es el sucesor del Core i7-13700H. En el caso del MagicBook Pro, el procesador puede consumir un máximo de 90 vatios bajando posteriormente a 60 vatios. Esto significa que el rendimiento general está al mismo nivel que el antiguo Core i7-13705H que se encuentra en el Lenovo Yoga Pro 9 16 así como el Ryzen 9 7940HS.
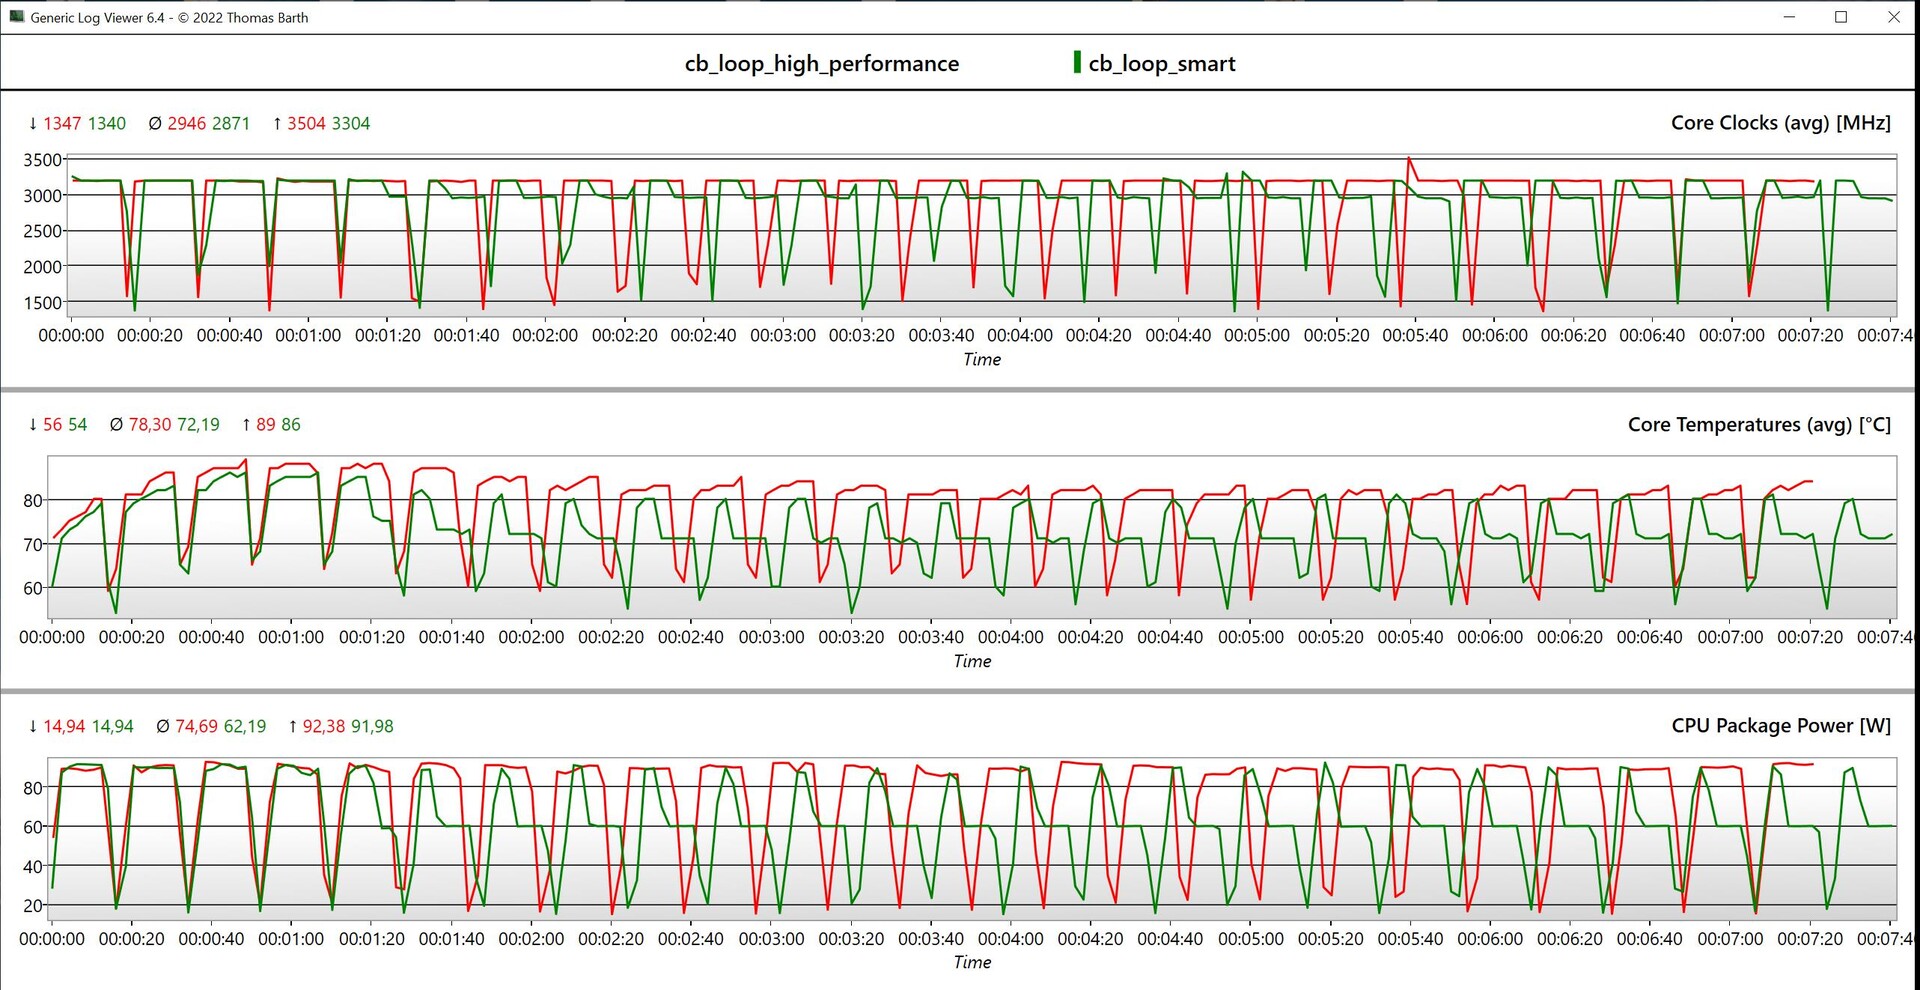
Cinebench R15 multi continuous test
Además, en nuestra CB R15 multilazo, el rendimiento también se mostró estable incluso cuando se sometió a carga durante periodos más largos. Con el modo de alto rendimiento, el rendimiento máximo se mantiene igual y, con periodos de carga más largos, los resultados son un poco más altos. En el modo de batería, el consumo máximo se sitúa brevemente en 60 vatios y luego baja rápidamente a 45 vatios. Por ello, el rendimiento multinúcleo es alrededor de un 20 % inferior en este ámbito. En nuestra sección de tecnología.
Cinebench R23: Multi Core | Single Core
Cinebench R20: CPU (Multi Core) | CPU (Single Core)
Cinebench R15: CPU Multi 64Bit | CPU Single 64Bit
Blender: v2.79 BMW27 CPU
7-Zip 18.03: 7z b 4 | 7z b 4 -mmt1
Geekbench 6.7: Multi-Core | Single-Core
Geekbench 5.5: Multi-Core | Single-Core
HWBOT x265 Benchmark v2.2: 4k Preset
LibreOffice : 20 Documents To PDF
R Benchmark 2.5: Overall mean
| CPU Performance rating | |
| Asus Vivobook Pro 16X K6604JV-MX016W -2! | |
| Lenovo Yoga Pro 9 16-IRP G8 | |
| Framework Laptop 16 | |
| Lenovo ThinkPad Z16 Gen 2 | |
| Honor MagicBook Pro 16 2024 | |
| Media de la clase Multimedia | |
| Dell Inspiron 16 Plus 7630 | |
| Schenker VISION 16 Pro (M23) -2! | |
| Medio Intel Core Ultra 7 155H | |
| Cinebench R23 / Multi Core | |
| Asus Vivobook Pro 16X K6604JV-MX016W | |
| Lenovo Yoga Pro 9 16-IRP G8 | |
| Honor MagicBook Pro 16 2024 | |
| Lenovo ThinkPad Z16 Gen 2 | |
| Media de la clase Multimedia (4861 - 33362, n=76, últimos 2 años) | |
| Framework Laptop 16 | |
| Dell Inspiron 16 Plus 7630 | |
| Medio Intel Core Ultra 7 155H (9769 - 19007, n=52) | |
| Schenker VISION 16 Pro (M23) | |
| Cinebench R23 / Single Core | |
| Media de la clase Multimedia (1128 - 2459, n=68, últimos 2 años) | |
| Schenker VISION 16 Pro (M23) | |
| Lenovo Yoga Pro 9 16-IRP G8 | |
| Dell Inspiron 16 Plus 7630 | |
| Asus Vivobook Pro 16X K6604JV-MX016W | |
| Lenovo ThinkPad Z16 Gen 2 | |
| Honor MagicBook Pro 16 2024 | |
| Framework Laptop 16 | |
| Medio Intel Core Ultra 7 155H (1496 - 1815, n=52) | |
| Cinebench R20 / CPU (Multi Core) | |
| Asus Vivobook Pro 16X K6604JV-MX016W | |
| Lenovo Yoga Pro 9 16-IRP G8 | |
| Honor MagicBook Pro 16 2024 | |
| Lenovo ThinkPad Z16 Gen 2 | |
| Media de la clase Multimedia (1887 - 12912, n=59, últimos 2 años) | |
| Framework Laptop 16 | |
| Dell Inspiron 16 Plus 7630 | |
| Medio Intel Core Ultra 7 155H (3798 - 7409, n=50) | |
| Schenker VISION 16 Pro (M23) | |
| Cinebench R20 / CPU (Single Core) | |
| Lenovo Yoga Pro 9 16-IRP G8 | |
| Media de la clase Multimedia (425 - 853, n=59, últimos 2 años) | |
| Schenker VISION 16 Pro (M23) | |
| Dell Inspiron 16 Plus 7630 | |
| Asus Vivobook Pro 16X K6604JV-MX016W | |
| Lenovo ThinkPad Z16 Gen 2 | |
| Honor MagicBook Pro 16 2024 | |
| Framework Laptop 16 | |
| Medio Intel Core Ultra 7 155H (601 - 696, n=50) | |
| Cinebench R15 / CPU Multi 64Bit | |
| Asus Vivobook Pro 16X K6604JV-MX016W | |
| Lenovo Yoga Pro 9 16-IRP G8 | |
| Honor MagicBook Pro 16 2024 | |
| Lenovo ThinkPad Z16 Gen 2 | |
| Framework Laptop 16 | |
| Media de la clase Multimedia (856 - 5224, n=63, últimos 2 años) | |
| Medio Intel Core Ultra 7 155H (1932 - 2880, n=56) | |
| Dell Inspiron 16 Plus 7630 | |
| Schenker VISION 16 Pro (M23) | |
| Cinebench R15 / CPU Single 64Bit | |
| Asus Vivobook Pro 16X K6604JV-MX016W | |
| Media de la clase Multimedia (184.8 - 326, n=61, últimos 2 años) | |
| Lenovo ThinkPad Z16 Gen 2 | |
| Framework Laptop 16 | |
| Schenker VISION 16 Pro (M23) | |
| Lenovo Yoga Pro 9 16-IRP G8 | |
| Honor MagicBook Pro 16 2024 | |
| Dell Inspiron 16 Plus 7630 | |
| Medio Intel Core Ultra 7 155H (99.6 - 268, n=52) | |
| Blender / v2.79 BMW27 CPU | |
| Media de la clase Multimedia (100 - 557, n=60, últimos 2 años) | |
| Medio Intel Core Ultra 7 155H (175 - 381, n=47) | |
| Schenker VISION 16 Pro (M23) | |
| Dell Inspiron 16 Plus 7630 | |
| Framework Laptop 16 | |
| Lenovo ThinkPad Z16 Gen 2 | |
| Honor MagicBook Pro 16 2024 | |
| Lenovo Yoga Pro 9 16-IRP G8 | |
| Asus Vivobook Pro 16X K6604JV-MX016W | |
| 7-Zip 18.03 / 7z b 4 | |
| Asus Vivobook Pro 16X K6604JV-MX016W | |
| Lenovo Yoga Pro 9 16-IRP G8 | |
| Framework Laptop 16 | |
| Honor MagicBook Pro 16 2024 | |
| Lenovo ThinkPad Z16 Gen 2 | |
| Schenker VISION 16 Pro (M23) | |
| Dell Inspiron 16 Plus 7630 | |
| Medio Intel Core Ultra 7 155H (41739 - 70254, n=50) | |
| Media de la clase Multimedia (26062 - 130368, n=57, últimos 2 años) | |
| 7-Zip 18.03 / 7z b 4 -mmt1 | |
| Asus Vivobook Pro 16X K6604JV-MX016W | |
| Framework Laptop 16 | |
| Schenker VISION 16 Pro (M23) | |
| Lenovo ThinkPad Z16 Gen 2 | |
| Lenovo Yoga Pro 9 16-IRP G8 | |
| Media de la clase Multimedia (3666 - 7545, n=58, últimos 2 años) | |
| Dell Inspiron 16 Plus 7630 | |
| Honor MagicBook Pro 16 2024 | |
| Medio Intel Core Ultra 7 155H (4594 - 5621, n=50) | |
| Geekbench 6.7 / Multi-Core | |
| Media de la clase Multimedia (4983 - 29415, n=71, últimos 2 años) | |
| Lenovo Yoga Pro 9 16-IRP G8 | |
| Dell Inspiron 16 Plus 7630 | |
| Framework Laptop 16 | |
| Honor MagicBook Pro 16 2024 | |
| Lenovo ThinkPad Z16 Gen 2 | |
| Medio Intel Core Ultra 7 155H (7732 - 13656, n=55) | |
| Geekbench 6.7 / Single-Core | |
| Media de la clase Multimedia (1534 - 4335, n=70, últimos 2 años) | |
| Dell Inspiron 16 Plus 7630 | |
| Framework Laptop 16 | |
| Lenovo ThinkPad Z16 Gen 2 | |
| Lenovo Yoga Pro 9 16-IRP G8 | |
| Honor MagicBook Pro 16 2024 | |
| Medio Intel Core Ultra 7 155H (1901 - 2473, n=52) | |
| Geekbench 5.5 / Multi-Core | |
| Asus Vivobook Pro 16X K6604JV-MX016W | |
| Lenovo Yoga Pro 9 16-IRP G8 | |
| Honor MagicBook Pro 16 2024 | |
| Media de la clase Multimedia (4652 - 20422, n=58, últimos 2 años) | |
| Dell Inspiron 16 Plus 7630 | |
| Framework Laptop 16 | |
| Lenovo ThinkPad Z16 Gen 2 | |
| Medio Intel Core Ultra 7 155H (10017 - 13556, n=52) | |
| Schenker VISION 16 Pro (M23) | |
| Geekbench 5.5 / Single-Core | |
| Asus Vivobook Pro 16X K6604JV-MX016W | |
| Media de la clase Multimedia (805 - 2974, n=58, últimos 2 años) | |
| Framework Laptop 16 | |
| Lenovo ThinkPad Z16 Gen 2 | |
| Dell Inspiron 16 Plus 7630 | |
| Schenker VISION 16 Pro (M23) | |
| Honor MagicBook Pro 16 2024 | |
| Lenovo Yoga Pro 9 16-IRP G8 | |
| Medio Intel Core Ultra 7 155H (1462 - 1824, n=52) | |
| HWBOT x265 Benchmark v2.2 / 4k Preset | |
| Asus Vivobook Pro 16X K6604JV-MX016W | |
| Lenovo Yoga Pro 9 16-IRP G8 | |
| Framework Laptop 16 | |
| Honor MagicBook Pro 16 2024 | |
| Lenovo ThinkPad Z16 Gen 2 | |
| Media de la clase Multimedia (5.26 - 36.1, n=58, últimos 2 años) | |
| Schenker VISION 16 Pro (M23) | |
| Medio Intel Core Ultra 7 155H (9.93 - 21.2, n=50) | |
| Dell Inspiron 16 Plus 7630 | |
| LibreOffice / 20 Documents To PDF | |
| Asus Vivobook Pro 16X K6604JV-MX016W | |
| Media de la clase Multimedia (23.9 - 146.7, n=59, últimos 2 años) | |
| Medio Intel Core Ultra 7 155H (37.5 - 79.2, n=49) | |
| Lenovo Yoga Pro 9 16-IRP G8 | |
| Schenker VISION 16 Pro (M23) | |
| Honor MagicBook Pro 16 2024 | |
| Lenovo ThinkPad Z16 Gen 2 | |
| Dell Inspiron 16 Plus 7630 | |
| Framework Laptop 16 | |
| R Benchmark 2.5 / Overall mean | |
| Medio Intel Core Ultra 7 155H (0.4457 - 0.53, n=49) | |
| Media de la clase Multimedia (0.3604 - 0.947, n=58, últimos 2 años) | |
| Honor MagicBook Pro 16 2024 | |
| Lenovo Yoga Pro 9 16-IRP G8 | |
| Lenovo ThinkPad Z16 Gen 2 | |
| Framework Laptop 16 | |
| Schenker VISION 16 Pro (M23) | |
| Dell Inspiron 16 Plus 7630 | |
| Asus Vivobook Pro 16X K6604JV-MX016W | |
* ... más pequeño es mejor
AIDA64: FP32 Ray-Trace | FPU Julia | CPU SHA3 | CPU Queen | FPU SinJulia | FPU Mandel | CPU AES | CPU ZLib | FP64 Ray-Trace | CPU PhotoWorxx
| Performance rating | |
| Framework Laptop 16 | |
| Lenovo ThinkPad Z16 Gen 2 | |
| Asus Vivobook Pro 16X K6604JV-MX016W | |
| Honor MagicBook Pro 16 2024 | |
| Lenovo Yoga Pro 9 16-IRP G8 | |
| Media de la clase Multimedia | |
| Schenker VISION 16 Pro (M23) | |
| Medio Intel Core Ultra 7 155H | |
| Dell Inspiron 16 Plus 7630 | |
| AIDA64 / FP32 Ray-Trace | |
| Lenovo ThinkPad Z16 Gen 2 | |
| Framework Laptop 16 | |
| Asus Vivobook Pro 16X K6604JV-MX016W | |
| Media de la clase Multimedia (2214 - 50388, n=55, últimos 2 años) | |
| Lenovo Yoga Pro 9 16-IRP G8 | |
| Honor MagicBook Pro 16 2024 | |
| Dell Inspiron 16 Plus 7630 | |
| Schenker VISION 16 Pro (M23) | |
| Medio Intel Core Ultra 7 155H (6670 - 18470, n=50) | |
| AIDA64 / FPU Julia | |
| Lenovo ThinkPad Z16 Gen 2 | |
| Framework Laptop 16 | |
| Asus Vivobook Pro 16X K6604JV-MX016W | |
| Honor MagicBook Pro 16 2024 | |
| Lenovo Yoga Pro 9 16-IRP G8 | |
| Media de la clase Multimedia (12867 - 201874, n=56, últimos 2 años) | |
| Schenker VISION 16 Pro (M23) | |
| Medio Intel Core Ultra 7 155H (40905 - 93181, n=50) | |
| Dell Inspiron 16 Plus 7630 | |
| AIDA64 / CPU SHA3 | |
| Asus Vivobook Pro 16X K6604JV-MX016W | |
| Lenovo ThinkPad Z16 Gen 2 | |
| Framework Laptop 16 | |
| Honor MagicBook Pro 16 2024 | |
| Lenovo Yoga Pro 9 16-IRP G8 | |
| Media de la clase Multimedia (626 - 8623, n=56, últimos 2 años) | |
| Medio Intel Core Ultra 7 155H (1940 - 4436, n=50) | |
| Schenker VISION 16 Pro (M23) | |
| Dell Inspiron 16 Plus 7630 | |
| AIDA64 / CPU Queen | |
| Asus Vivobook Pro 16X K6604JV-MX016W | |
| Lenovo ThinkPad Z16 Gen 2 | |
| Framework Laptop 16 | |
| Lenovo Yoga Pro 9 16-IRP G8 | |
| Dell Inspiron 16 Plus 7630 | |
| Schenker VISION 16 Pro (M23) | |
| Honor MagicBook Pro 16 2024 | |
| Medio Intel Core Ultra 7 155H (64698 - 94181, n=50) | |
| Media de la clase Multimedia (13483 - 181505, n=43, últimos 2 años) | |
| AIDA64 / FPU SinJulia | |
| Lenovo ThinkPad Z16 Gen 2 | |
| Framework Laptop 16 | |
| Asus Vivobook Pro 16X K6604JV-MX016W | |
| Lenovo Yoga Pro 9 16-IRP G8 | |
| Honor MagicBook Pro 16 2024 | |
| Medio Intel Core Ultra 7 155H (5639 - 10647, n=50) | |
| Schenker VISION 16 Pro (M23) | |
| Media de la clase Multimedia (886 - 28794, n=56, últimos 2 años) | |
| Dell Inspiron 16 Plus 7630 | |
| AIDA64 / FPU Mandel | |
| Lenovo ThinkPad Z16 Gen 2 | |
| Framework Laptop 16 | |
| Asus Vivobook Pro 16X K6604JV-MX016W | |
| Honor MagicBook Pro 16 2024 | |
| Media de la clase Multimedia (6395 - 105740, n=55, últimos 2 años) | |
| Lenovo Yoga Pro 9 16-IRP G8 | |
| Medio Intel Core Ultra 7 155H (18236 - 47685, n=50) | |
| Dell Inspiron 16 Plus 7630 | |
| Schenker VISION 16 Pro (M23) | |
| AIDA64 / CPU AES | |
| Framework Laptop 16 | |
| Honor MagicBook Pro 16 2024 | |
| Asus Vivobook Pro 16X K6604JV-MX016W | |
| Lenovo ThinkPad Z16 Gen 2 | |
| Lenovo Yoga Pro 9 16-IRP G8 | |
| Medio Intel Core Ultra 7 155H (45713 - 152179, n=50) | |
| Schenker VISION 16 Pro (M23) | |
| Media de la clase Multimedia (8171 - 126790, n=56, últimos 2 años) | |
| Dell Inspiron 16 Plus 7630 | |
| AIDA64 / CPU ZLib | |
| Asus Vivobook Pro 16X K6604JV-MX016W | |
| Honor MagicBook Pro 16 2024 | |
| Lenovo Yoga Pro 9 16-IRP G8 | |
| Lenovo ThinkPad Z16 Gen 2 | |
| Media de la clase Multimedia (143.8 - 2022, n=56, últimos 2 años) | |
| Medio Intel Core Ultra 7 155H (557 - 1250, n=50) | |
| Schenker VISION 16 Pro (M23) | |
| Framework Laptop 16 | |
| Dell Inspiron 16 Plus 7630 | |
| AIDA64 / FP64 Ray-Trace | |
| Lenovo ThinkPad Z16 Gen 2 | |
| Framework Laptop 16 | |
| Asus Vivobook Pro 16X K6604JV-MX016W | |
| Media de la clase Multimedia (1014 - 26875, n=56, últimos 2 años) | |
| Lenovo Yoga Pro 9 16-IRP G8 | |
| Honor MagicBook Pro 16 2024 | |
| Dell Inspiron 16 Plus 7630 | |
| Schenker VISION 16 Pro (M23) | |
| Medio Intel Core Ultra 7 155H (3569 - 9802, n=50) | |
| AIDA64 / CPU PhotoWorxx | |
| Lenovo Yoga Pro 9 16-IRP G8 | |
| Media de la clase Multimedia (8187 - 88154, n=56, últimos 2 años) | |
| Medio Intel Core Ultra 7 155H (32719 - 54223, n=50) | |
| Honor MagicBook Pro 16 2024 | |
| Schenker VISION 16 Pro (M23) | |
| Asus Vivobook Pro 16X K6604JV-MX016W | |
| Framework Laptop 16 | |
| Dell Inspiron 16 Plus 7630 | |
| Lenovo ThinkPad Z16 Gen 2 | |
Rendimiento del sistema
Aunque los resultados de los benchmarks sintéticos son medios, en el uso diario, el MagicBook Pro 16 es un portátil muy sensible que puede ejecutar las entradas sin ningún retraso perceptible. Sólo experimentamos un breve retraso al cambiar a la GPU Nvidia (por ejemplo, al arrancar un juego) y esto es normal cuando se cambia a Optimus avanzado. A quien le moleste, puede activar el interruptor Optimus normal en los controladores Nvidia.
CrossMark: Overall | Productivity | Creativity | Responsiveness
WebXPRT 3: Overall
WebXPRT 4: Overall
Mozilla Kraken 1.1: Total
| PCMark 10 / Score | |
| Framework Laptop 16 | |
| Lenovo ThinkPad Z16 Gen 2 | |
| Media de la clase Multimedia (4325 - 10386, n=54, últimos 2 años) | |
| Dell Inspiron 16 Plus 7630 | |
| Schenker VISION 16 Pro (M23) | |
| Lenovo Yoga Pro 9 16-IRP G8 | |
| Medio Intel Core Ultra 7 155H, NVIDIA GeForce RTX 4060 Laptop GPU (6751 - 7370, n=5) | |
| Asus Vivobook Pro 16X K6604JV-MX016W | |
| Honor MagicBook Pro 16 2024 | |
| PCMark 10 / Essentials | |
| Framework Laptop 16 | |
| Lenovo ThinkPad Z16 Gen 2 | |
| Dell Inspiron 16 Plus 7630 | |
| Lenovo Yoga Pro 9 16-IRP G8 | |
| Schenker VISION 16 Pro (M23) | |
| Asus Vivobook Pro 16X K6604JV-MX016W | |
| Media de la clase Multimedia (8025 - 11664, n=53, últimos 2 años) | |
| Medio Intel Core Ultra 7 155H, NVIDIA GeForce RTX 4060 Laptop GPU (9476 - 10446, n=5) | |
| Honor MagicBook Pro 16 2024 | |
| PCMark 10 / Productivity | |
| Media de la clase Multimedia (7323 - 18233, n=53, últimos 2 años) | |
| Framework Laptop 16 | |
| Lenovo ThinkPad Z16 Gen 2 | |
| Schenker VISION 16 Pro (M23) | |
| Dell Inspiron 16 Plus 7630 | |
| Asus Vivobook Pro 16X K6604JV-MX016W | |
| Lenovo Yoga Pro 9 16-IRP G8 | |
| Medio Intel Core Ultra 7 155H, NVIDIA GeForce RTX 4060 Laptop GPU (8079 - 9477, n=5) | |
| Honor MagicBook Pro 16 2024 | |
| PCMark 10 / Digital Content Creation | |
| Framework Laptop 16 | |
| Dell Inspiron 16 Plus 7630 | |
| Lenovo ThinkPad Z16 Gen 2 | |
| Lenovo Yoga Pro 9 16-IRP G8 | |
| Schenker VISION 16 Pro (M23) | |
| Medio Intel Core Ultra 7 155H, NVIDIA GeForce RTX 4060 Laptop GPU (9811 - 11620, n=5) | |
| Honor MagicBook Pro 16 2024 | |
| Media de la clase Multimedia (3651 - 16240, n=53, últimos 2 años) | |
| Asus Vivobook Pro 16X K6604JV-MX016W | |
| CrossMark / Overall | |
| Asus Vivobook Pro 16X K6604JV-MX016W | |
| Schenker VISION 16 Pro (M23) | |
| Media de la clase Multimedia (866 - 2728, n=62, últimos 2 años) | |
| Dell Inspiron 16 Plus 7630 | |
| Lenovo Yoga Pro 9 16-IRP G8 | |
| Honor MagicBook Pro 16 2024 | |
| Medio Intel Core Ultra 7 155H, NVIDIA GeForce RTX 4060 Laptop GPU (1540 - 1746, n=5) | |
| Framework Laptop 16 | |
| Lenovo ThinkPad Z16 Gen 2 | |
| CrossMark / Productivity | |
| Asus Vivobook Pro 16X K6604JV-MX016W | |
| Schenker VISION 16 Pro (M23) | |
| Media de la clase Multimedia (931 - 2489, n=62, últimos 2 años) | |
| Dell Inspiron 16 Plus 7630 | |
| Lenovo Yoga Pro 9 16-IRP G8 | |
| Honor MagicBook Pro 16 2024 | |
| Medio Intel Core Ultra 7 155H, NVIDIA GeForce RTX 4060 Laptop GPU (1436 - 1684, n=5) | |
| Framework Laptop 16 | |
| Lenovo ThinkPad Z16 Gen 2 | |
| CrossMark / Creativity | |
| Asus Vivobook Pro 16X K6604JV-MX016W | |
| Media de la clase Multimedia (907 - 3465, n=62, últimos 2 años) | |
| Lenovo Yoga Pro 9 16-IRP G8 | |
| Dell Inspiron 16 Plus 7630 | |
| Schenker VISION 16 Pro (M23) | |
| Framework Laptop 16 | |
| Medio Intel Core Ultra 7 155H, NVIDIA GeForce RTX 4060 Laptop GPU (1811 - 1929, n=5) | |
| Honor MagicBook Pro 16 2024 | |
| Lenovo ThinkPad Z16 Gen 2 | |
| CrossMark / Responsiveness | |
| Schenker VISION 16 Pro (M23) | |
| Asus Vivobook Pro 16X K6604JV-MX016W | |
| Honor MagicBook Pro 16 2024 | |
| Dell Inspiron 16 Plus 7630 | |
| Lenovo Yoga Pro 9 16-IRP G8 | |
| Media de la clase Multimedia (605 - 2024, n=62, últimos 2 años) | |
| Medio Intel Core Ultra 7 155H, NVIDIA GeForce RTX 4060 Laptop GPU (1165 - 1631, n=5) | |
| Framework Laptop 16 | |
| Lenovo ThinkPad Z16 Gen 2 | |
| WebXPRT 3 / Overall | |
| Framework Laptop 16 | |
| Media de la clase Multimedia (136.4 - 596, n=65, últimos 2 años) | |
| Lenovo ThinkPad Z16 Gen 2 | |
| Dell Inspiron 16 Plus 7630 | |
| Schenker VISION 16 Pro (M23) | |
| Lenovo Yoga Pro 9 16-IRP G8 | |
| Honor MagicBook Pro 16 2024 | |
| Medio Intel Core Ultra 7 155H, NVIDIA GeForce RTX 4060 Laptop GPU (274 - 290, n=5) | |
| Asus Vivobook Pro 16X K6604JV-MX016W | |
| WebXPRT 4 / Overall | |
| Media de la clase Multimedia (167.3 - 402, n=67, últimos 2 años) | |
| Schenker VISION 16 Pro (M23) | |
| Dell Inspiron 16 Plus 7630 | |
| Framework Laptop 16 | |
| Lenovo Yoga Pro 9 16-IRP G8 | |
| Honor MagicBook Pro 16 2024 | |
| Lenovo ThinkPad Z16 Gen 2 | |
| Asus Vivobook Pro 16X K6604JV-MX016W | |
| Medio Intel Core Ultra 7 155H, NVIDIA GeForce RTX 4060 Laptop GPU (236 - 262, n=5) | |
| Mozilla Kraken 1.1 / Total | |
| Medio Intel Core Ultra 7 155H, NVIDIA GeForce RTX 4060 Laptop GPU (519 - 585, n=5) | |
| Lenovo ThinkPad Z16 Gen 2 | |
| Honor MagicBook Pro 16 2024 | |
| Asus Vivobook Pro 16X K6604JV-MX016W | |
| Lenovo Yoga Pro 9 16-IRP G8 | |
| Dell Inspiron 16 Plus 7630 | |
| Schenker VISION 16 Pro (M23) | |
| Framework Laptop 16 | |
| Media de la clase Multimedia (228 - 835, n=68, últimos 2 años) | |
* ... más pequeño es mejor
| PCMark 10 Score | 6800 puntos | |
ayuda | ||
| AIDA64 / Memory Copy | |
| Honor MagicBook Pro 16 2024 | |
| Medio Intel Core Ultra 7 155H (62397 - 96791, n=50) | |
| Media de la clase Multimedia (11299 - 132135, n=56, últimos 2 años) | |
| Framework Laptop 16 | |
| Lenovo Yoga Pro 9 16-IRP G8 | |
| Asus Vivobook Pro 16X K6604JV-MX016W | |
| Lenovo ThinkPad Z16 Gen 2 | |
| Schenker VISION 16 Pro (M23) | |
| Dell Inspiron 16 Plus 7630 | |
| AIDA64 / Memory Read | |
| Media de la clase Multimedia (11624 - 174586, n=56, últimos 2 años) | |
| Medio Intel Core Ultra 7 155H (60544 - 90647, n=50) | |
| Lenovo Yoga Pro 9 16-IRP G8 | |
| Honor MagicBook Pro 16 2024 | |
| Asus Vivobook Pro 16X K6604JV-MX016W | |
| Schenker VISION 16 Pro (M23) | |
| Dell Inspiron 16 Plus 7630 | |
| Framework Laptop 16 | |
| Lenovo ThinkPad Z16 Gen 2 | |
| AIDA64 / Memory Write | |
| Lenovo Yoga Pro 9 16-IRP G8 | |
| Lenovo ThinkPad Z16 Gen 2 | |
| Framework Laptop 16 | |
| Media de la clase Multimedia (11755 - 134998, n=56, últimos 2 años) | |
| Honor MagicBook Pro 16 2024 | |
| Medio Intel Core Ultra 7 155H (58692 - 93451, n=50) | |
| Asus Vivobook Pro 16X K6604JV-MX016W | |
| Schenker VISION 16 Pro (M23) | |
| Dell Inspiron 16 Plus 7630 | |
| AIDA64 / Memory Latency | |
| Medio Intel Core Ultra 7 155H (116.2 - 233, n=50) | |
| Honor MagicBook Pro 16 2024 | |
| Media de la clase Multimedia (7 - 535, n=55, últimos 2 años) | |
| Lenovo ThinkPad Z16 Gen 2 | |
| Lenovo Yoga Pro 9 16-IRP G8 | |
| Dell Inspiron 16 Plus 7630 | |
| Framework Laptop 16 | |
| Asus Vivobook Pro 16X K6604JV-MX016W | |
| Schenker VISION 16 Pro (M23) | |
* ... más pequeño es mejor
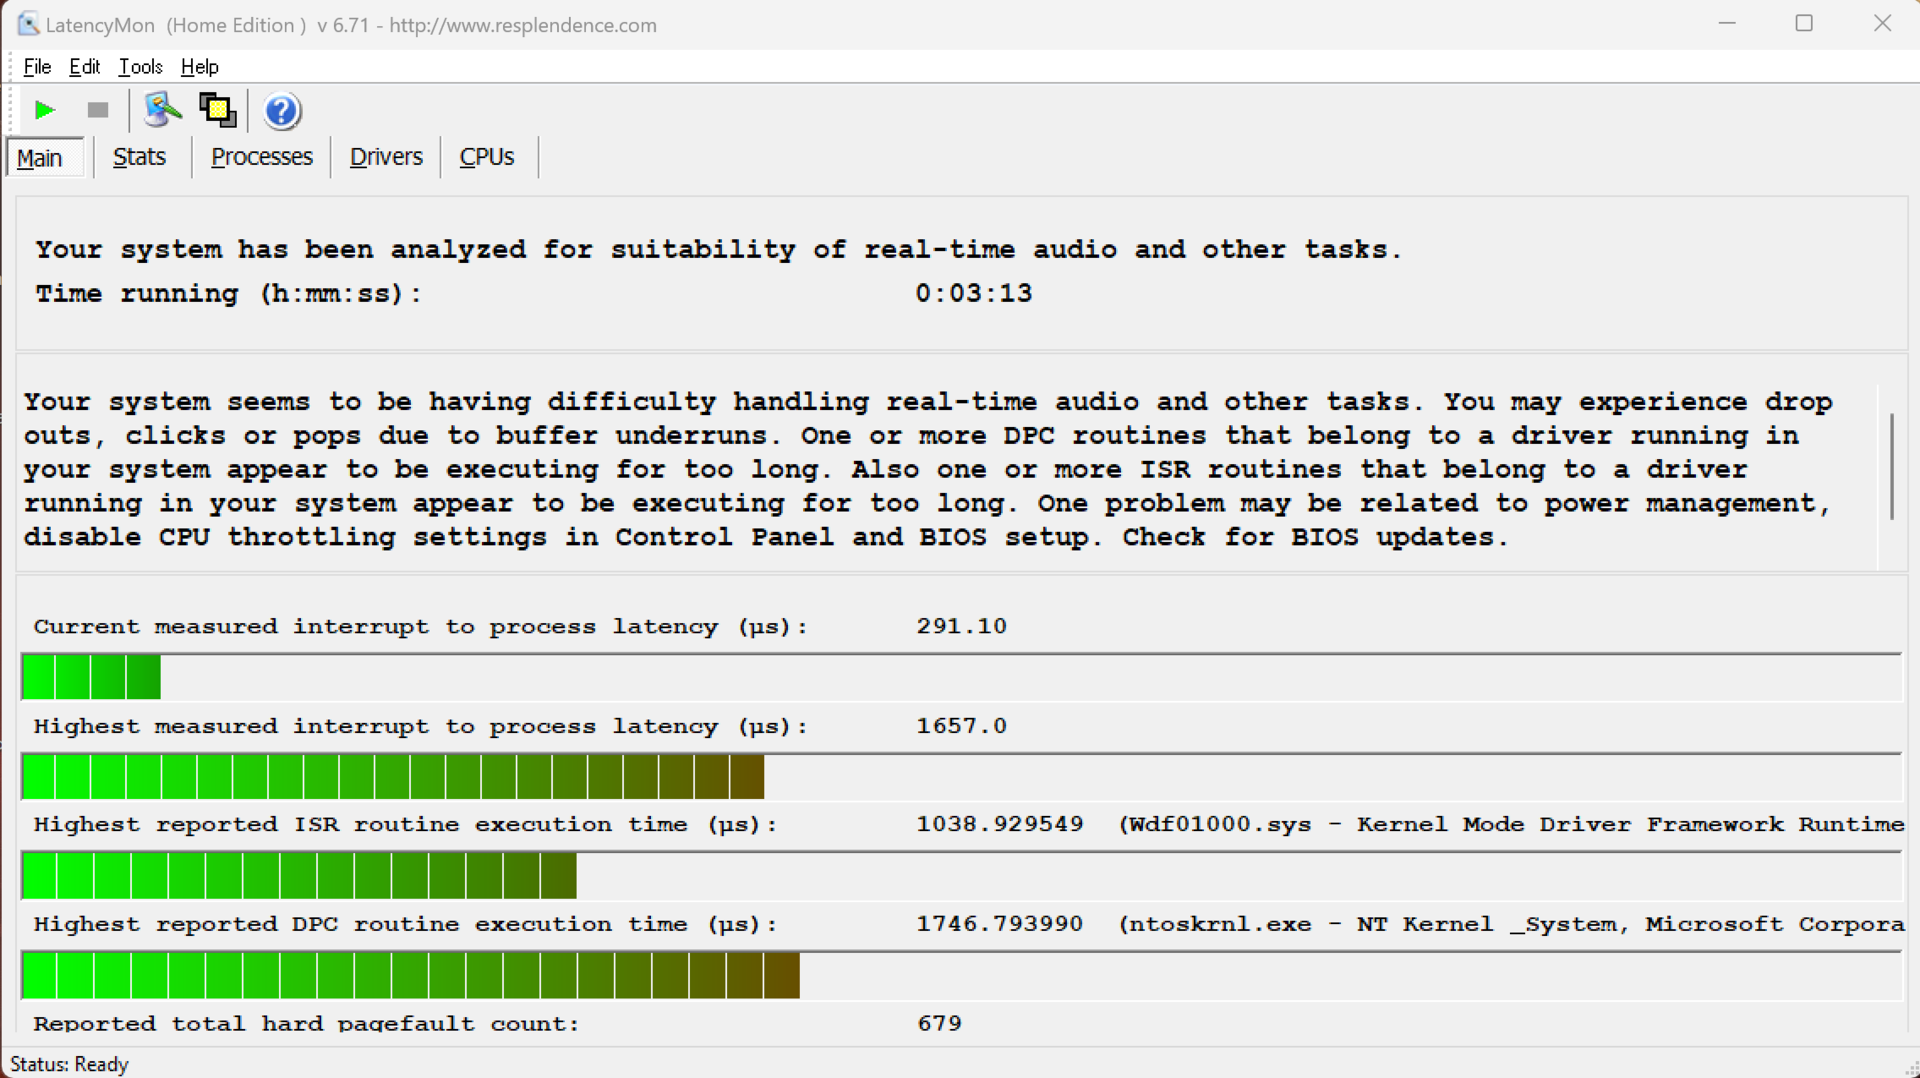
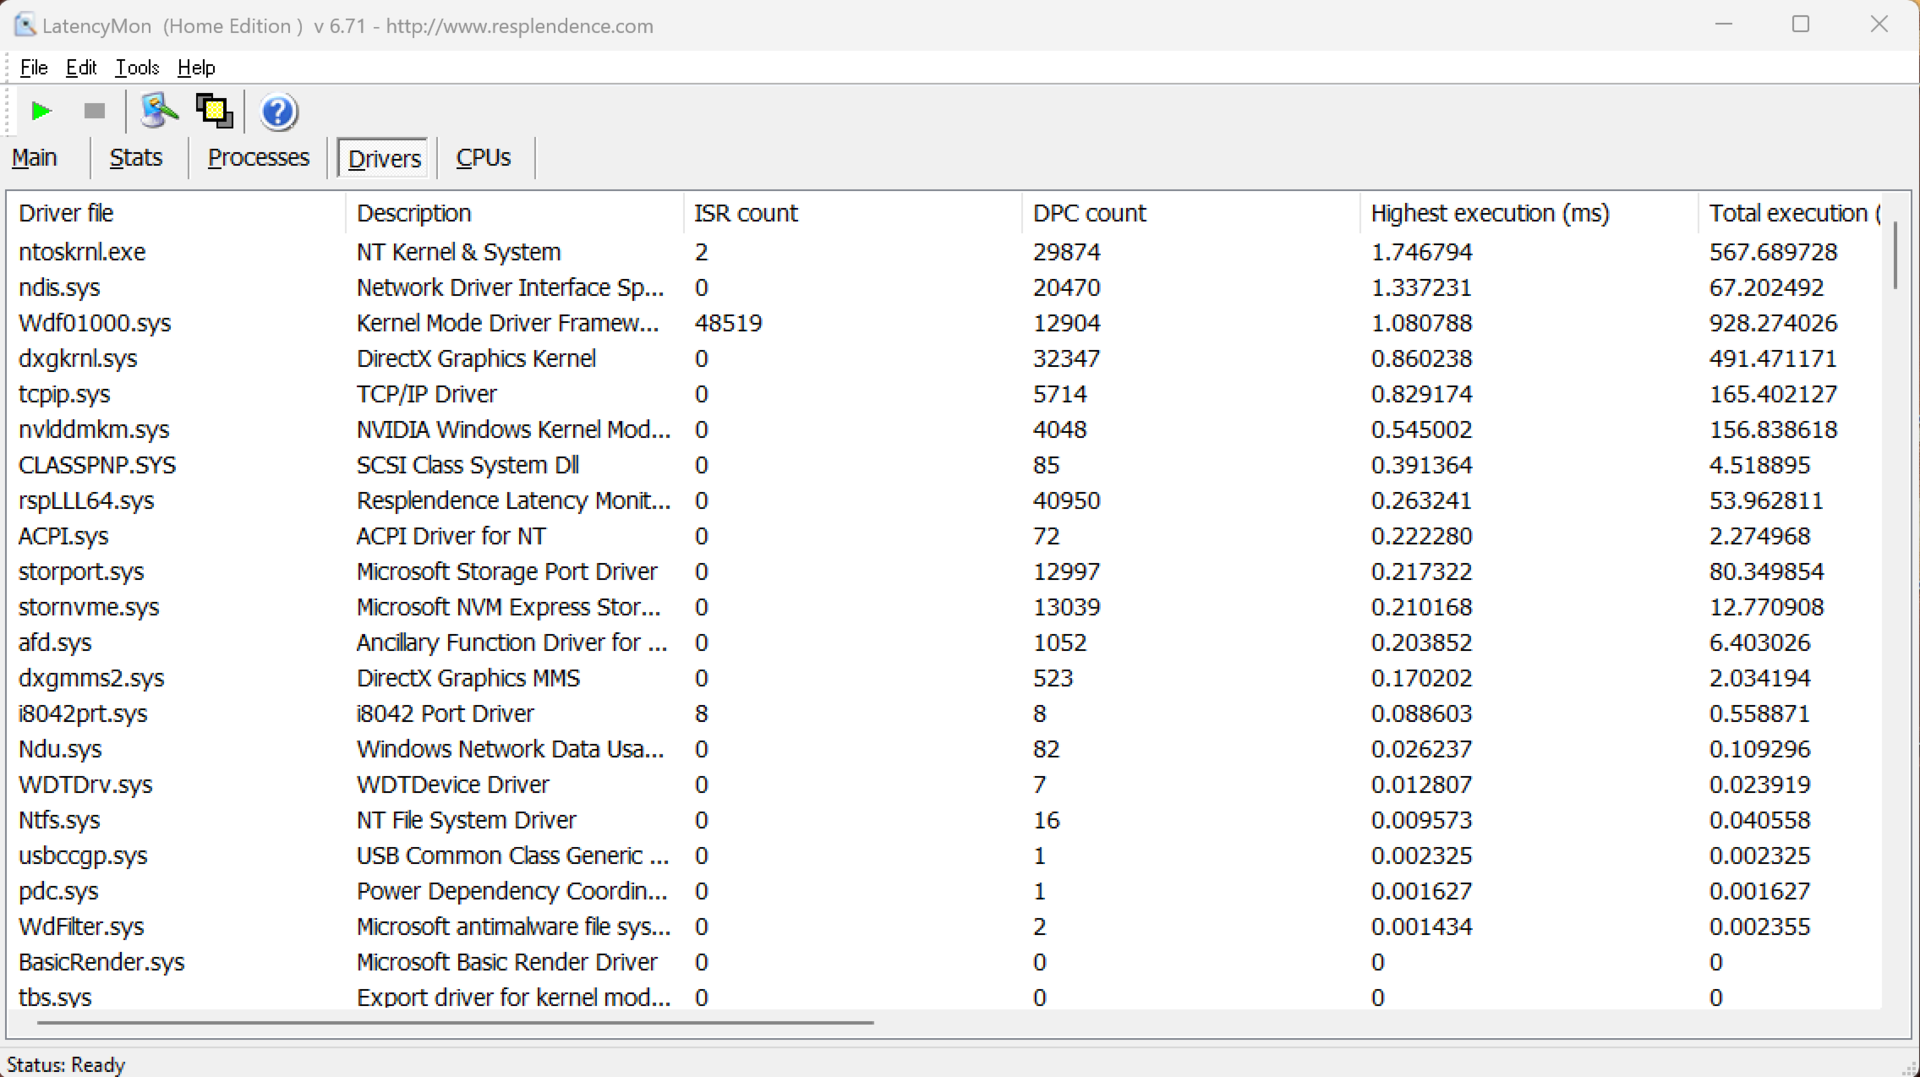
Latencias del CPD
En nuestra prueba de latencia estandarizada (navegación por Internet, reproducción 4K de YouTube, carga de la CPU), el dispositivo de revisión mostró ligeras limitaciones a la hora de utilizar aplicaciones de audio en tiempo real con la versión actual de la BIOS.
| DPC Latencies / LatencyMon - interrupt to process latency (max), Web, Youtube, Prime95 | |
| Lenovo Yoga Pro 9 16-IRP G8 | |
| Asus Vivobook Pro 16X K6604JV-MX016W | |
| Honor MagicBook Pro 16 2024 | |
| Lenovo ThinkPad Z16 Gen 2 | |
| Framework Laptop 16 | |
| Dell Inspiron 16 Plus 7630 | |
| Schenker VISION 16 Pro (M23) | |
* ... más pequeño es mejor
Almacenamiento masivo
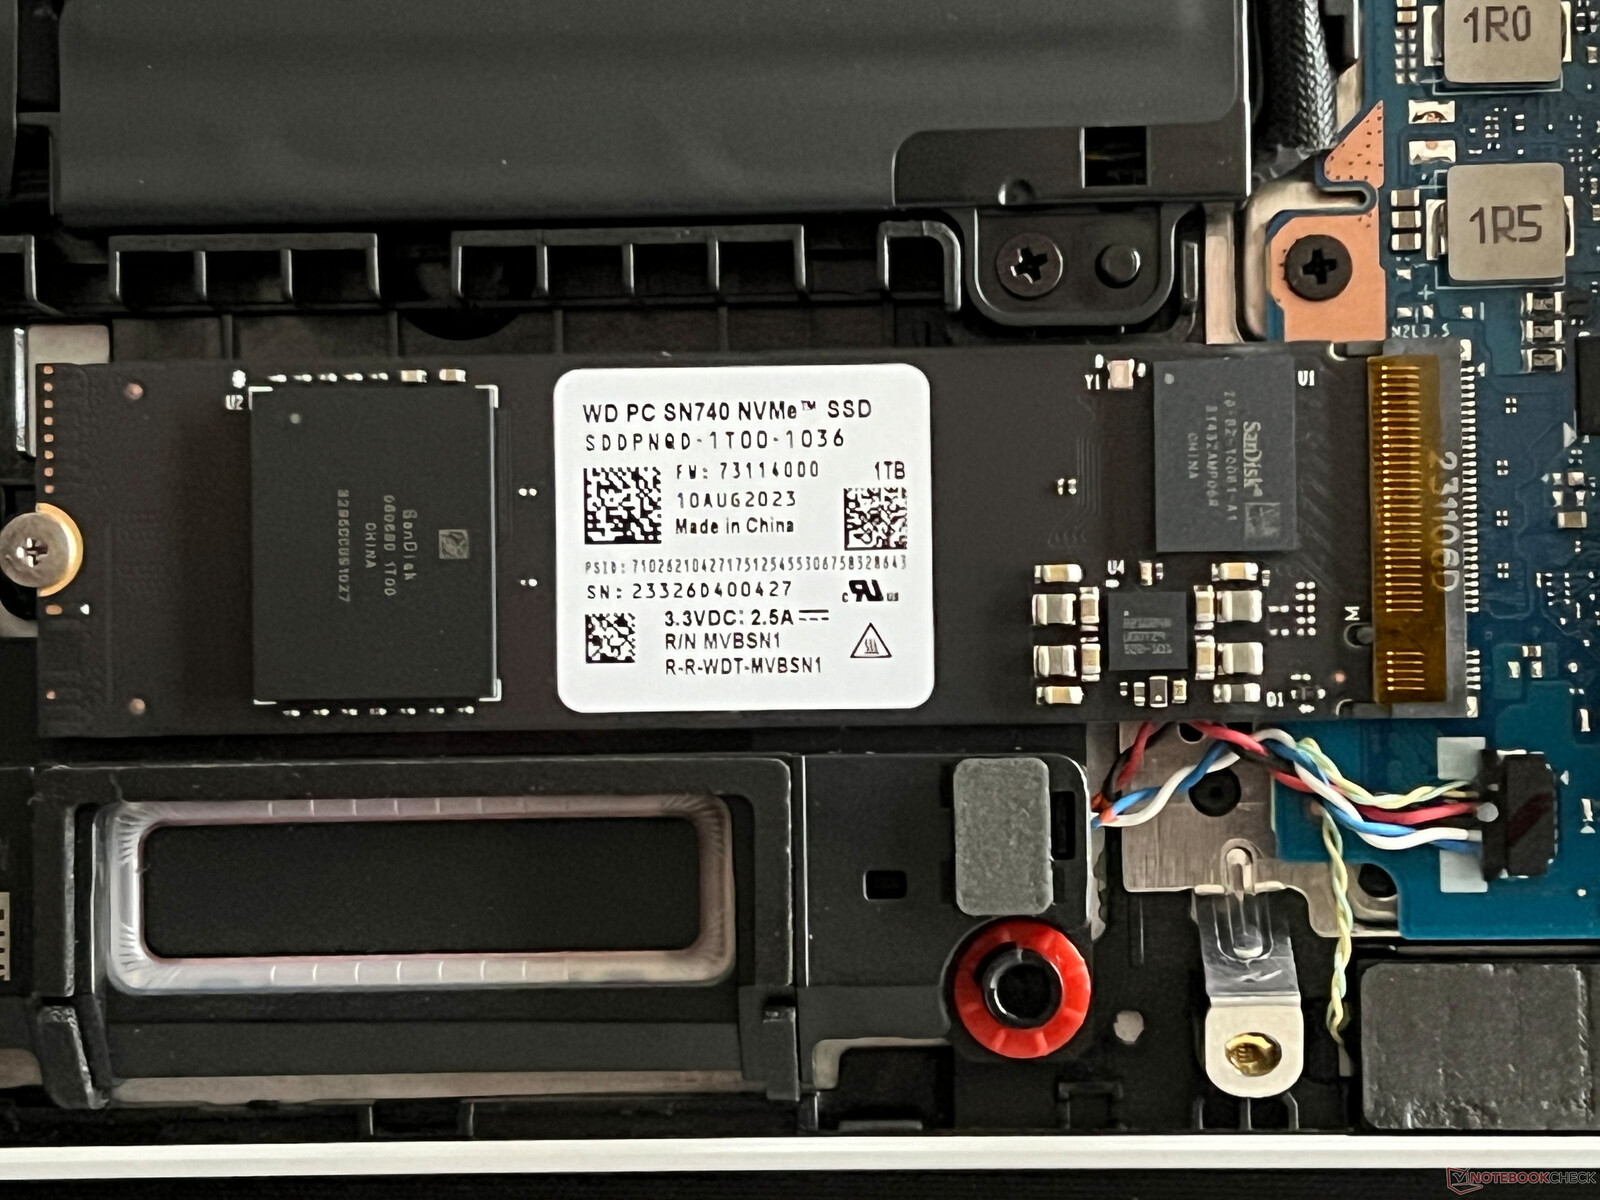
La unidad SSD PCIe 4.0 que se encuentra en nuestro dispositivo de análisis procede de Western Digital (SN740) y ofrece 1 GB de capacidad de almacenamiento, aunque el usuario sólo tiene acceso a 847 GB en el primer arranque. Sin embargo, al igual que en los dispositivos anteriores de Honor, la SSD está particionada y 221 GB están disponibles en la unidad del sistema, mientras que los 626 GB restantes están disponibles en la unidad D. Esto es innecesario y puede dar lugar rápidamente a problemas a la hora de instalar juegos si no se tiene cuidado con el directorio de destino. El rendimiento de la SSD es muy bueno pero no completamente estable bajo carga continua. Encontrará más pruebas de rendimiento de la SSD aquí.

* ... más pequeño es mejor
Continuous Performance: DiskSpd Read Loop, Queue Depth 8
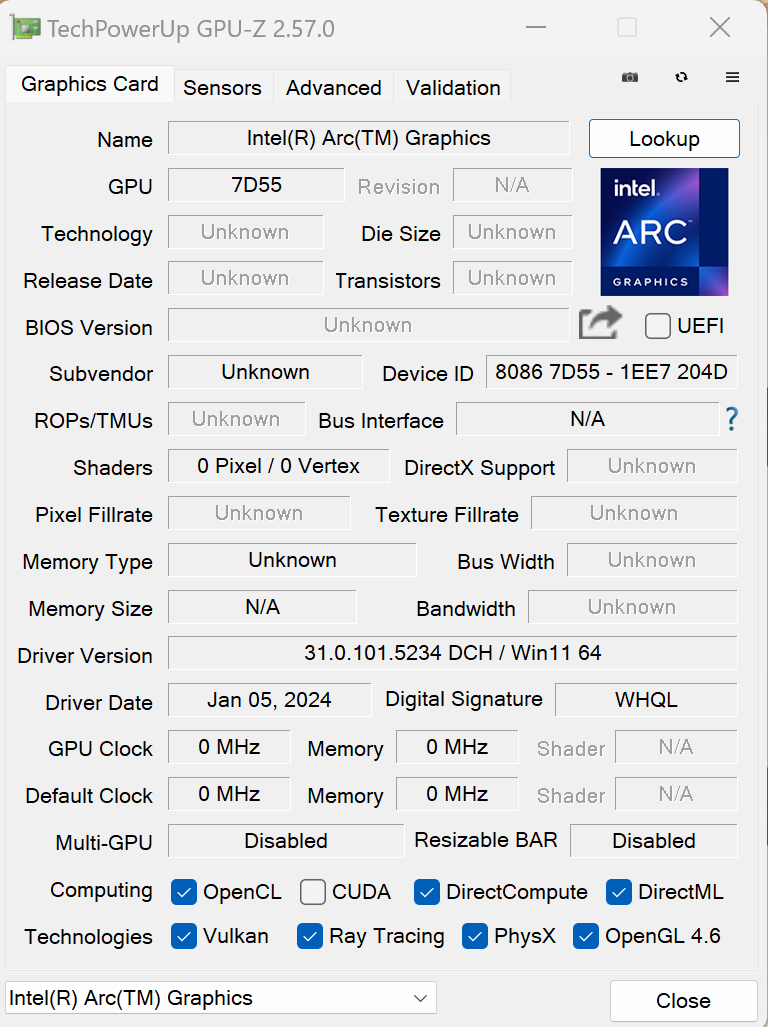
Tarjeta gráfica
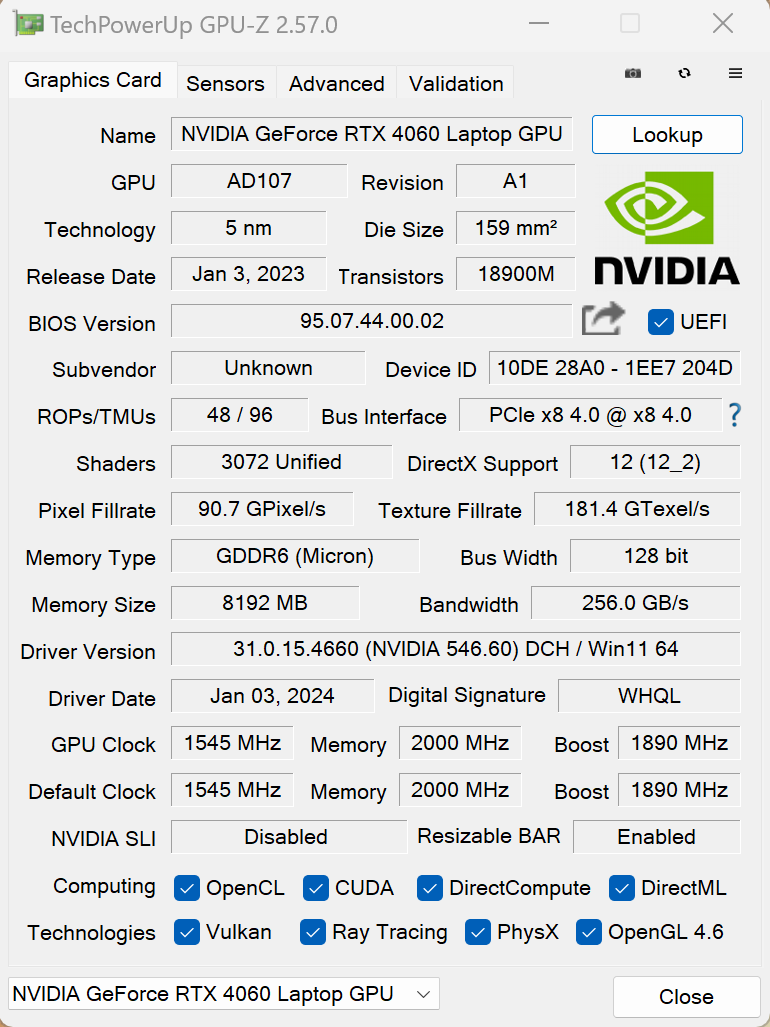
La Arc iGPU se encarga de las aplicaciones cotidianas, incluida la reproducción de vídeos de alta resolución, y además el dispositivo cambia automáticamente a su GeForce Portátil RTX 4060 cuando se ejecutan aplicaciones exigentes (Advanced Optimus). Básicamente, estamos ante una variante muy rápida del portátil RTX 4060 de 115 vatios, aunque sólo en modo de alto rendimiento. En modo inteligente es de 65 vatios y, del mismo modo, esto es suficiente para obtener buenos valores de rendimiento. En el modo de alto rendimiento, el dispositivo se abre paso a codazos al frente del pelotón de dispositivos de la competencia y esto puede apreciarse en el resultado de Time Spy. En este ámbito, el MagicBook puede seguir el ritmo de la competencia que está equipada con la variante más débil del Portátil RTX 4070.
El rendimiento de la GPU se mantiene completamente estable, incluso bajo largos periodos de carga (con ambos perfiles de energía) y supera sin problemas la prueba de estrés de Time Spy (99,1 %). En el modo de batería, la GPU puede consumir un máximo de 50 vatios, razón por la cual el rendimiento de la GPU es un 15 % inferior en este ámbito (en comparación con el modo inteligente). Encontrará más pruebas de rendimiento de la GPU aquí.
| 3DMark 11 Performance | 28416 puntos | |
| 3DMark Fire Strike Score | 21094 puntos | |
| 3DMark Time Spy Score | 9230 puntos | |
ayuda | ||
| Blender / v3.3 Classroom OPTIX/RTX | |
| Media de la clase Multimedia (12 - 105, n=23, últimos 2 años) | |
| Dell Inspiron 16 Plus 7630 | |
| Asus Vivobook Pro 16X K6604JV-MX016W | |
| Lenovo Yoga Pro 9 16-IRP G8 | |
| Schenker VISION 16 Pro (M23) | |
| Honor MagicBook Pro 16 2024 | |
| Medio NVIDIA GeForce RTX 4060 Laptop GPU (19 - 28, n=53) | |
| Blender / v3.3 Classroom CUDA | |
| Media de la clase Multimedia (20 - 186, n=23, últimos 2 años) | |
| Dell Inspiron 16 Plus 7630 | |
| Asus Vivobook Pro 16X K6604JV-MX016W | |
| Lenovo Yoga Pro 9 16-IRP G8 | |
| Medio NVIDIA GeForce RTX 4060 Laptop GPU (39 - 53, n=53) | |
| Honor MagicBook Pro 16 2024 | |
| Schenker VISION 16 Pro (M23) | |
| Blender / v3.3 Classroom CPU | |
| Dell Inspiron 16 Plus 7630 | |
| Media de la clase Multimedia (134.5 - 1042, n=63, últimos 2 años) | |
| Schenker VISION 16 Pro (M23) | |
| Honor MagicBook Pro 16 2024 | |
| Framework Laptop 16 | |
| Medio NVIDIA GeForce RTX 4060 Laptop GPU (189 - 452, n=53) | |
| Lenovo Yoga Pro 9 16-IRP G8 | |
| Lenovo ThinkPad Z16 Gen 2 | |
| Asus Vivobook Pro 16X K6604JV-MX016W | |
* ... más pequeño es mejor
Rendimiento en juegos
En general, el rendimiento en juegos es muy bueno y es posible jugar sin problemas a juegos exigentes a 1080p y con los ajustes de detalle máximos. A resoluciones aún mayores o con trazado de rayos, no es posible ignorar las tecnologías de aumento de escala como DLSS de Nvidia. Además, la siguiente tabla muestra las diferencias entre ambos perfiles de energía. Utilizando el modo inteligente, también es posible, dentro de lo razonable, jugar sin tener que echar mano de los auriculares.
| Perfil energético | Far Cry 5 | Witcher 3 | Cyberpunk 2077 | Modern Warfare 3 | Star Wars Jedi Survivor |
|---|---|---|---|---|---|
| Inteligente | 80fps | 68fps | 36,5fps | 51fps | 30,6fps |
| Alto rendimiento | 103fps | 79fps | 46.3fps | 59fps | 33.7fps |
| The Witcher 3 - 1920x1080 Ultra Graphics & Postprocessing (HBAO+) | |
| Schenker VISION 16 Pro (M23) | |
| Asus Vivobook Pro 16X K6604JV-MX016W | |
| Dell Inspiron 16 Plus 7630 | |
| Lenovo Yoga Pro 9 16-IRP G8 | |
| Framework Laptop 16 | |
| Honor MagicBook Pro 16 2024 | |
| Media de la clase Multimedia (11 - 121, n=10, últimos 2 años) | |
| Lenovo ThinkPad Z16 Gen 2 | |
| GTA V - 1920x1080 Highest AA:4xMSAA + FX AF:16x | |
| Lenovo Yoga Pro 9 16-IRP G8 | |
| Asus Vivobook Pro 16X K6604JV-MX016W | |
| Honor MagicBook Pro 16 2024 | |
| Schenker VISION 16 Pro (M23) | |
| Framework Laptop 16 | |
| Media de la clase Multimedia (7.92 - 141.6, n=58, últimos 2 años) | |
| F1 2021 - 1920x1080 Ultra High Preset + Raytracing AA:T AF:16x | |
| Schenker VISION 16 Pro (M23) | |
| Medio NVIDIA GeForce RTX 4060 Laptop GPU (109.4 - 146.7, n=5) | |
| Lenovo Yoga Pro 9 16-IRP G8 | |
| Honor MagicBook Pro 16 2024 | |
| F1 23 - 1920x1080 Ultra High Preset AA:T AF:16x | |
| Medio NVIDIA GeForce RTX 4060 Laptop GPU (43.8 - 119.9, n=13) | |
| Lenovo Yoga Pro 9 16-IRP G8 | |
| Asus Vivobook Pro 16X K6604JV-MX016W | |
| Honor MagicBook Pro 16 2024 | |
| Media de la clase Multimedia (11 - 70.3, n=4, últimos 2 años) | |
| Call of Duty Modern Warfare 3 2023 - 1920x1080 Ultra Preset | |
| Medio NVIDIA GeForce RTX 4060 Laptop GPU (81 - 99, n=5) | |
| Media de la clase Multimedia (34 - 127, n=3, últimos 2 años) | |
| Honor MagicBook Pro 16 2024 | |
| Star Wars Jedi Survivor - 1920x1080 Epic Preset | |
| Schenker VISION 16 Pro (M23) | |
| Lenovo Yoga Pro 9 16-IRP G8 | |
| Medio NVIDIA GeForce RTX 4060 Laptop GPU (45.5 - 66.7, n=10) | |
| Asus Vivobook Pro 16X K6604JV-MX016W | |
| Honor MagicBook Pro 16 2024 | |
Witcher 3 FPS diagram
| bajo | medio | alto | ultra | QHD | |
|---|---|---|---|---|---|
| GTA V (2015) | 179.2 | 172.9 | 100.4 | 76.4 | |
| The Witcher 3 (2015) | 177 | 81.5 | 68 | ||
| Dota 2 Reborn (2015) | 174 | 155.5 | 149.7 | 139.5 | |
| Final Fantasy XV Benchmark (2018) | 117.3 | 84.3 | 63.9 | ||
| X-Plane 11.11 (2018) | 135.6 | 120.2 | 91.4 | ||
| Far Cry 5 (2018) | 159 | 127 | 119 | 112 | 80 |
| Strange Brigade (2018) | 191 | 165 | 112 | ||
| F1 2021 (2021) | 212 | 109.4 | 78.6 | ||
| F1 22 (2022) | 152.8 | 54.8 | 34.7 | ||
| Star Wars Jedi Survivor (2023) | 60.6 | 53.3 | 50.1 | 47.8 | 30.6 |
| F1 23 (2023) | 149.2 | 45 | 29 | ||
| Cyberpunk 2077 (2023) | 96.7 | 79.6 | 68.6 | 60.1 | 36.7 |
| Call of Duty Modern Warfare 3 2023 (2023) | 116 | 106 | 81 | 75 | 51 |
| Avatar Frontiers of Pandora (2023) | 46 | 36 | 32 | 25 | 17 |
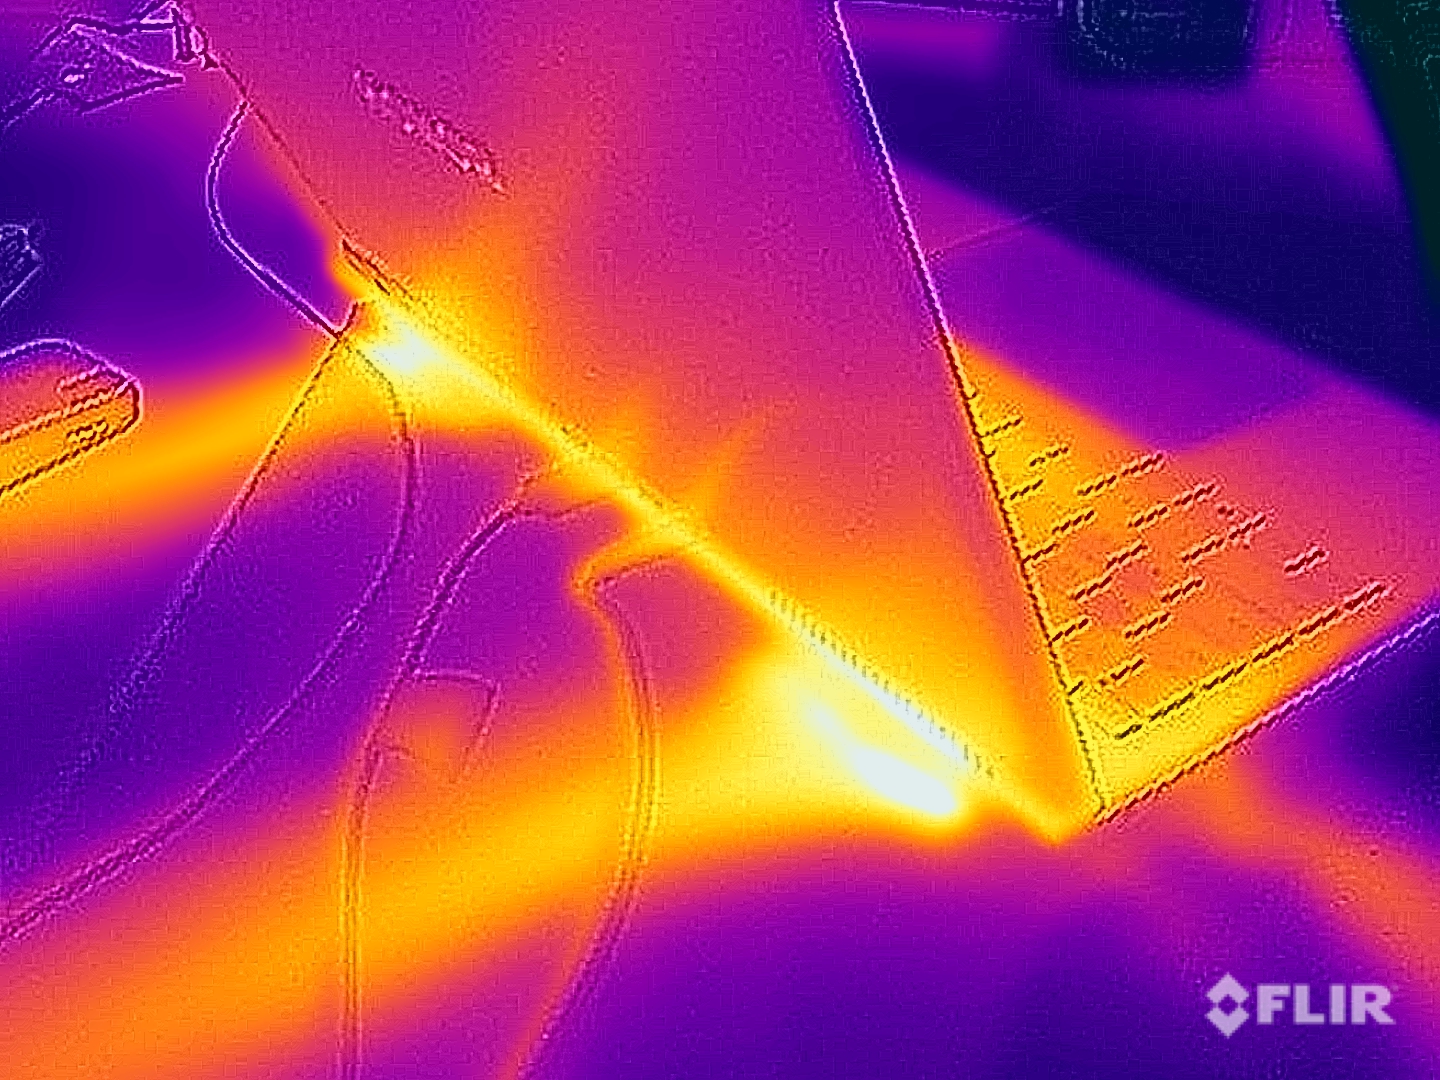
Emisiones - Honor ha instalado una potente refrigeración
Emisiones sonoras
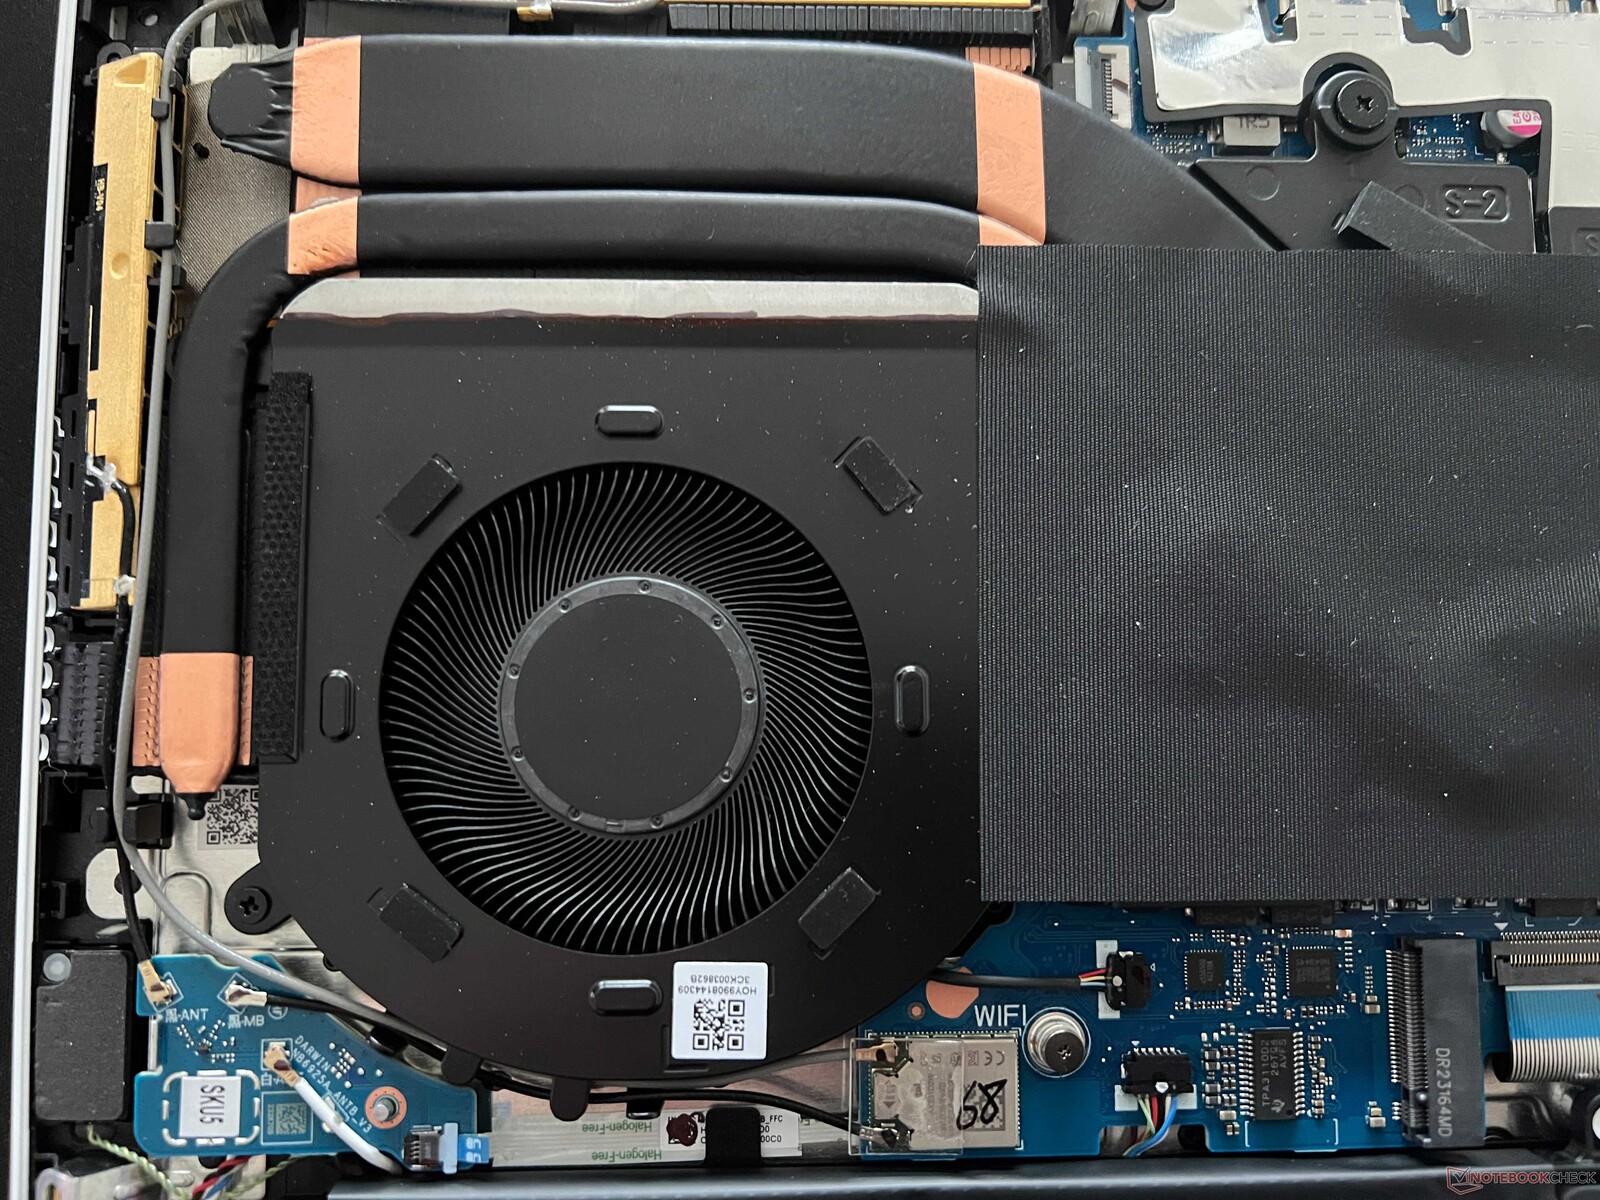
Para sus componentes de refrigeración, Honor utiliza múltiples tubos de calor y dos grandes ventiladores. En uso en reposo y ejecutando tareas sencillas, el dispositivo es silencioso en su mayor parte o sólo hay un ligero nivel de ruido de unos 27 dB(A). Los picos de carga breves también se pueden manejar normalmente sin que los ventiladores se aceleren. Al jugar y durante la prueba de estrés, a 42-45 dB(A), los ventiladores se hacen oír entonces, pero el zumbido no es molesto y, lo que es igual de importante, permanecen constantes. Gracias a los buenos altavoces, también se puede jugar así sin auriculares. Con 50-53,7 dB(A) en modo de alto rendimiento, el volumen aumenta considerablemente. No había otros ruidos electrónicos presentes en el dispositivo de revisión.
| Perfil energético | 3DMark 06 | Witcher 3 | Cyberpunk 2077 Phantom Liberty | prueba de estrés |
|---|---|---|---|---|
| Inteligente | 29 dB(A) | 42,1 dB(A) | 45 dB(A) | 45 dB(A) |
| Alto rendimiento | 34,4 dB(A) | 47,2 dB(A) | 50,4 dB(A) | 53,7 dB(A) |
Ruido
| Ocioso |
| 24 / 24 / 27.2 dB(A) |
| Carga |
| 29 / 45 dB(A) |
 | ||
30 dB silencioso 40 dB(A) audible 50 dB(A) ruidosamente alto |
||
min: | ||
| Honor MagicBook Pro 16 2024 GeForce RTX 4060 Laptop GPU, Ultra 7 155H, WD PC SN740 SDDPNQD-1T00 | Framework Laptop 16 Radeon RX 7700S, R9 7940HS, WDC PC SN810 1TB | Lenovo ThinkPad Z16 Gen 2 Radeon RX 6550M, R9 PRO 7940HS, Kioxia XG8 KXG8AZNV1T02 | Dell Inspiron 16 Plus 7630 GeForce RTX 4060 Laptop GPU, i7-13700H, WD PC SN740 SDDPTQD-1T00 | Lenovo Yoga Pro 9 16-IRP G8 GeForce RTX 4060 Laptop GPU, i7-13705H, Samsung PM9A1 MZVL21T0HCLR | Schenker VISION 16 Pro (M23) GeForce RTX 4070 Laptop GPU, i7-13700H, Samsung 990 Pro 1 TB | Asus Vivobook Pro 16X K6604JV-MX016W GeForce RTX 4060 Laptop GPU, i9-13980HX, Solidigm P41 Plus SSDPFKNU010TZ | |
|---|---|---|---|---|---|---|---|
| Noise | -4% | -9% | -6% | -13% | -21% | -24% | |
| apagado / medio ambiente * (dB) | 24 | 23.8 1% | 22.6 6% | 23.2 3% | 24.7 -3% | 25.9 -8% | 25.2 -5% |
| Idle Minimum * (dB) | 24 | 23.9 -0% | 22.9 5% | 23.2 3% | 24.7 -3% | 25.9 -8% | 26.6 -11% |
| Idle Average * (dB) | 24 | 23.9 -0% | 29.4 -22% | 23.2 3% | 26.2 -9% | 25.9 -8% | 26.6 -11% |
| Idle Maximum * (dB) | 27.2 | 23.9 12% | 29.4 -8% | 23.2 15% | 26.2 4% | 32 -18% | 29.2 -7% |
| Load Average * (dB) | 29 | 28.5 2% | 29.5 -2% | 35.1 -21% | 39.7 -37% | 47.2 -63% | 53.4 -84% |
| Witcher 3 ultra * (dB) | 42.1 | 51.9 -23% | 52 -24% | 52.5 -25% | 53.2 -26% | 53.1 -26% | |
| Load Maximum * (dB) | 45 | 53.7 -19% | 52 -16% | 52.5 -17% | 53.2 -18% | 53.1 -18% | 56.9 -26% |
* ... más pequeño es mejor
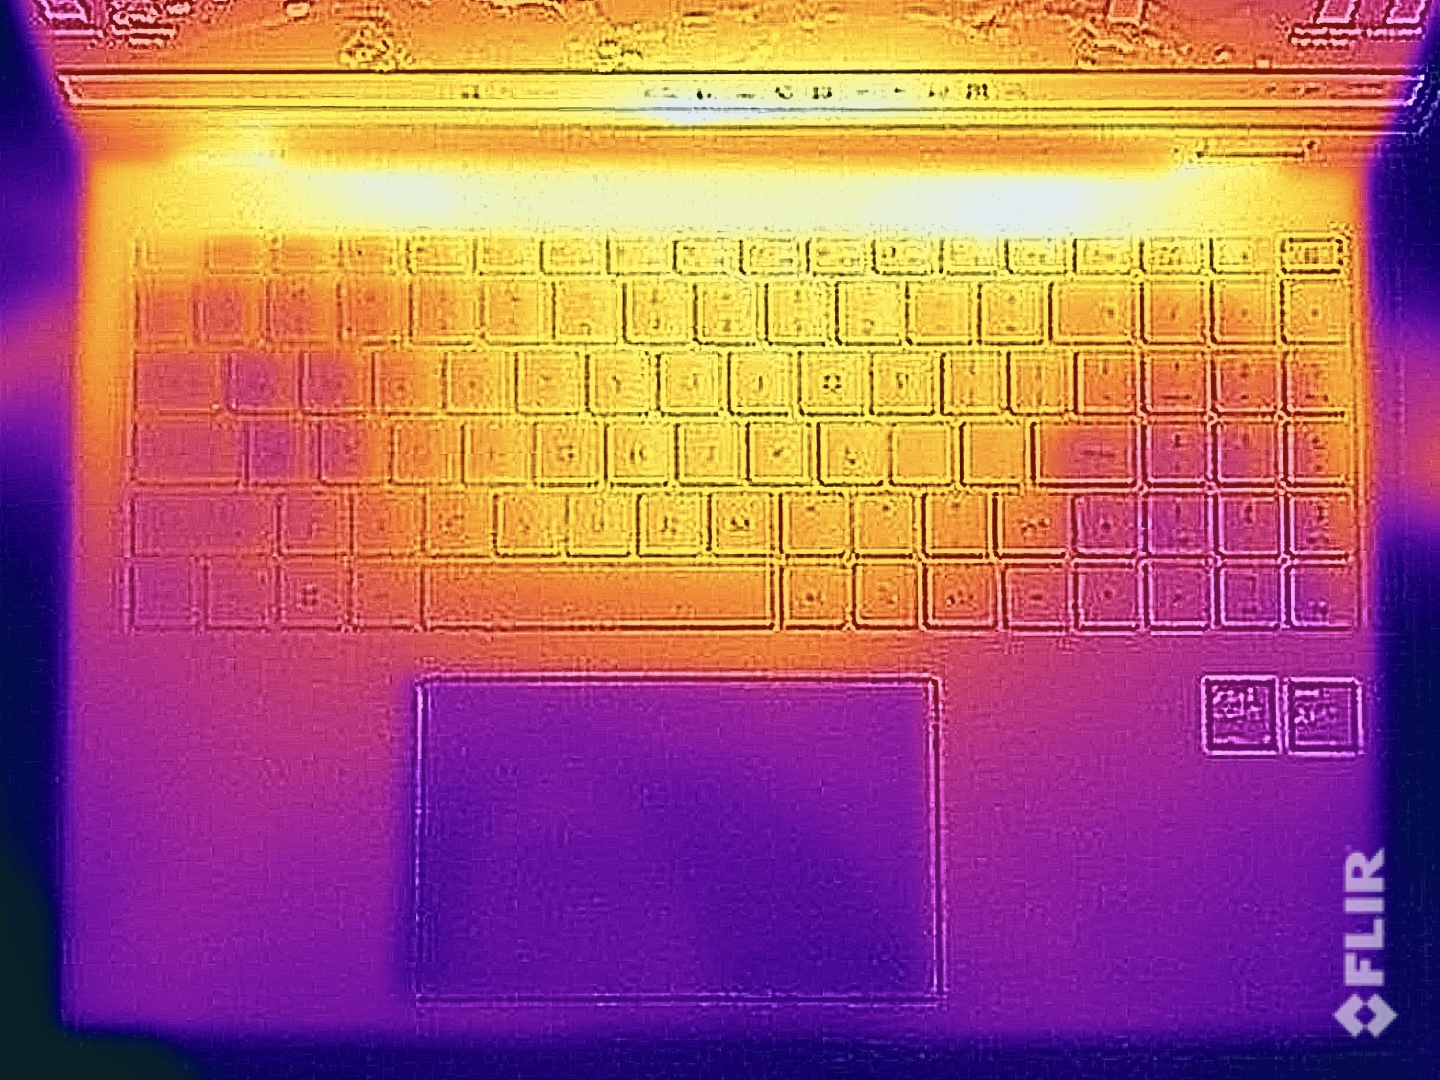
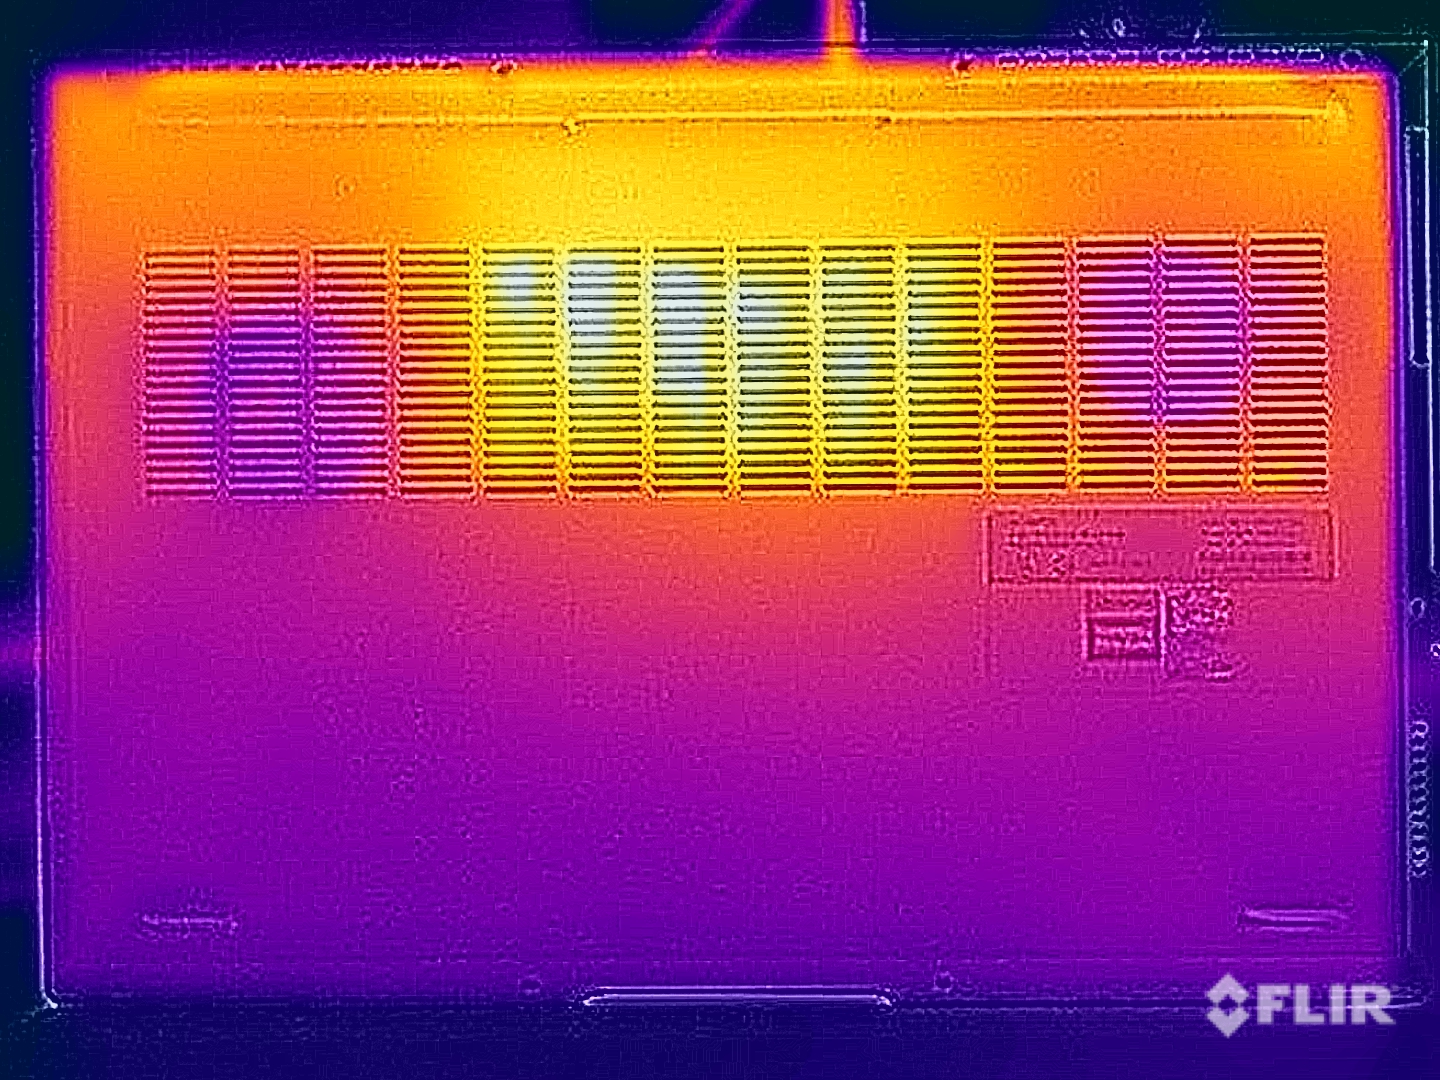
Temperatura
Las temperaturas superficiales del MagicBook Pro 16 no son motivo de preocupación. En uso en reposo, la carcasa se mantiene muy fría e, incluso bajo carga, las temperaturas no superan los 40 °C en la parte inferior del dispositivo y son considerablemente inferiores a 40 °C en la zona del teclado, lo que tampoco es motivo de preocupación. También medimos las temperaturas utilizando el modo opcional de alto rendimiento. Aunque son unos grados más altas, también pueden considerarse buenos valores, a la vista del buen rendimiento (véase la siguiente sección).
(+) La temperatura máxima en la parte superior es de 39.7 °C / 103 F, frente a la media de 36.8 °C / 98 F, que oscila entre 21 y 71 °C para la clase Multimedia.
(±) El fondo se calienta hasta un máximo de 42.9 °C / 109 F, frente a la media de 39.1 °C / 102 F
(+) En reposo, la temperatura media de la parte superior es de 22.9 °C / 73# F, frente a la media del dispositivo de 31.3 °C / 88 F.
(±) Jugando a The Witcher 3, la temperatura media de la parte superior es de 32.6 °C / 91 F, frente a la media del dispositivo de 31.3 °C / 88 F.
(+) El reposamanos y el panel táctil están a una temperatura inferior a la de la piel, con un máximo de 26.3 °C / 79.3 F y, por tanto, son fríos al tacto.
(+) La temperatura media de la zona del reposamanos de dispositivos similares fue de 28.7 °C / 83.7 F (+2.4 °C / 4.4 F).
Temperatures in high-performance mode
(±) La temperatura máxima en la parte superior es de 40 °C / 104 F, frente a la media de 36.8 °C / 98 F, que oscila entre 21 y 71 °C para la clase Multimedia.
(-) El fondo se calienta hasta un máximo de 45.3 °C / 114 F, frente a la media de 39.1 °C / 102 F
(+) El reposamanos y el panel táctil están a una temperatura inferior a la de la piel, con un máximo de 26.8 °C / 80.2 F y, por tanto, son fríos al tacto.
(±) La temperatura media de la zona del reposamanos de dispositivos similares fue de 28.7 °C / 83.7 F (+1.9 °C / 3.5 F).
| Honor MagicBook Pro 16 2024 Intel Core Ultra 7 155H, NVIDIA GeForce RTX 4060 Laptop GPU | Framework Laptop 16 AMD Ryzen 9 7940HS, AMD Radeon RX 7700S | Lenovo ThinkPad Z16 Gen 2 AMD Ryzen 9 PRO 7940HS, AMD Radeon RX 6550M | Dell Inspiron 16 Plus 7630 Intel Core i7-13700H, NVIDIA GeForce RTX 4060 Laptop GPU | Lenovo Yoga Pro 9 16-IRP G8 Intel Core i7-13705H, NVIDIA GeForce RTX 4060 Laptop GPU | Schenker VISION 16 Pro (M23) Intel Core i7-13700H, NVIDIA GeForce RTX 4070 Laptop GPU | Asus Vivobook Pro 16X K6604JV-MX016W Intel Core i9-13980HX, NVIDIA GeForce RTX 4060 Laptop GPU | |
|---|---|---|---|---|---|---|---|
| Heat | -13% | 4% | -29% | -14% | -18% | -30% | |
| Maximum Upper Side * (°C) | 39.7 | 42.4 -7% | 43 -8% | 47.8 -20% | 41.6 -5% | 46.7 -18% | 39.7 -0% |
| Maximum Bottom * (°C) | 42.9 | 40.8 5% | 41.6 3% | 42.2 2% | 50 -17% | 54.1 -26% | 60 -40% |
| Idle Upper Side * (°C) | 23.7 | 31.4 -32% | 21.2 11% | 35.2 -49% | 26.8 -13% | 26.5 -12% | 30.9 -30% |
| Idle Bottom * (°C) | 23.5 | 27.8 -18% | 21.4 9% | 35 -49% | 27.9 -19% | 26.8 -14% | 34.7 -48% |
* ... más pequeño es mejor
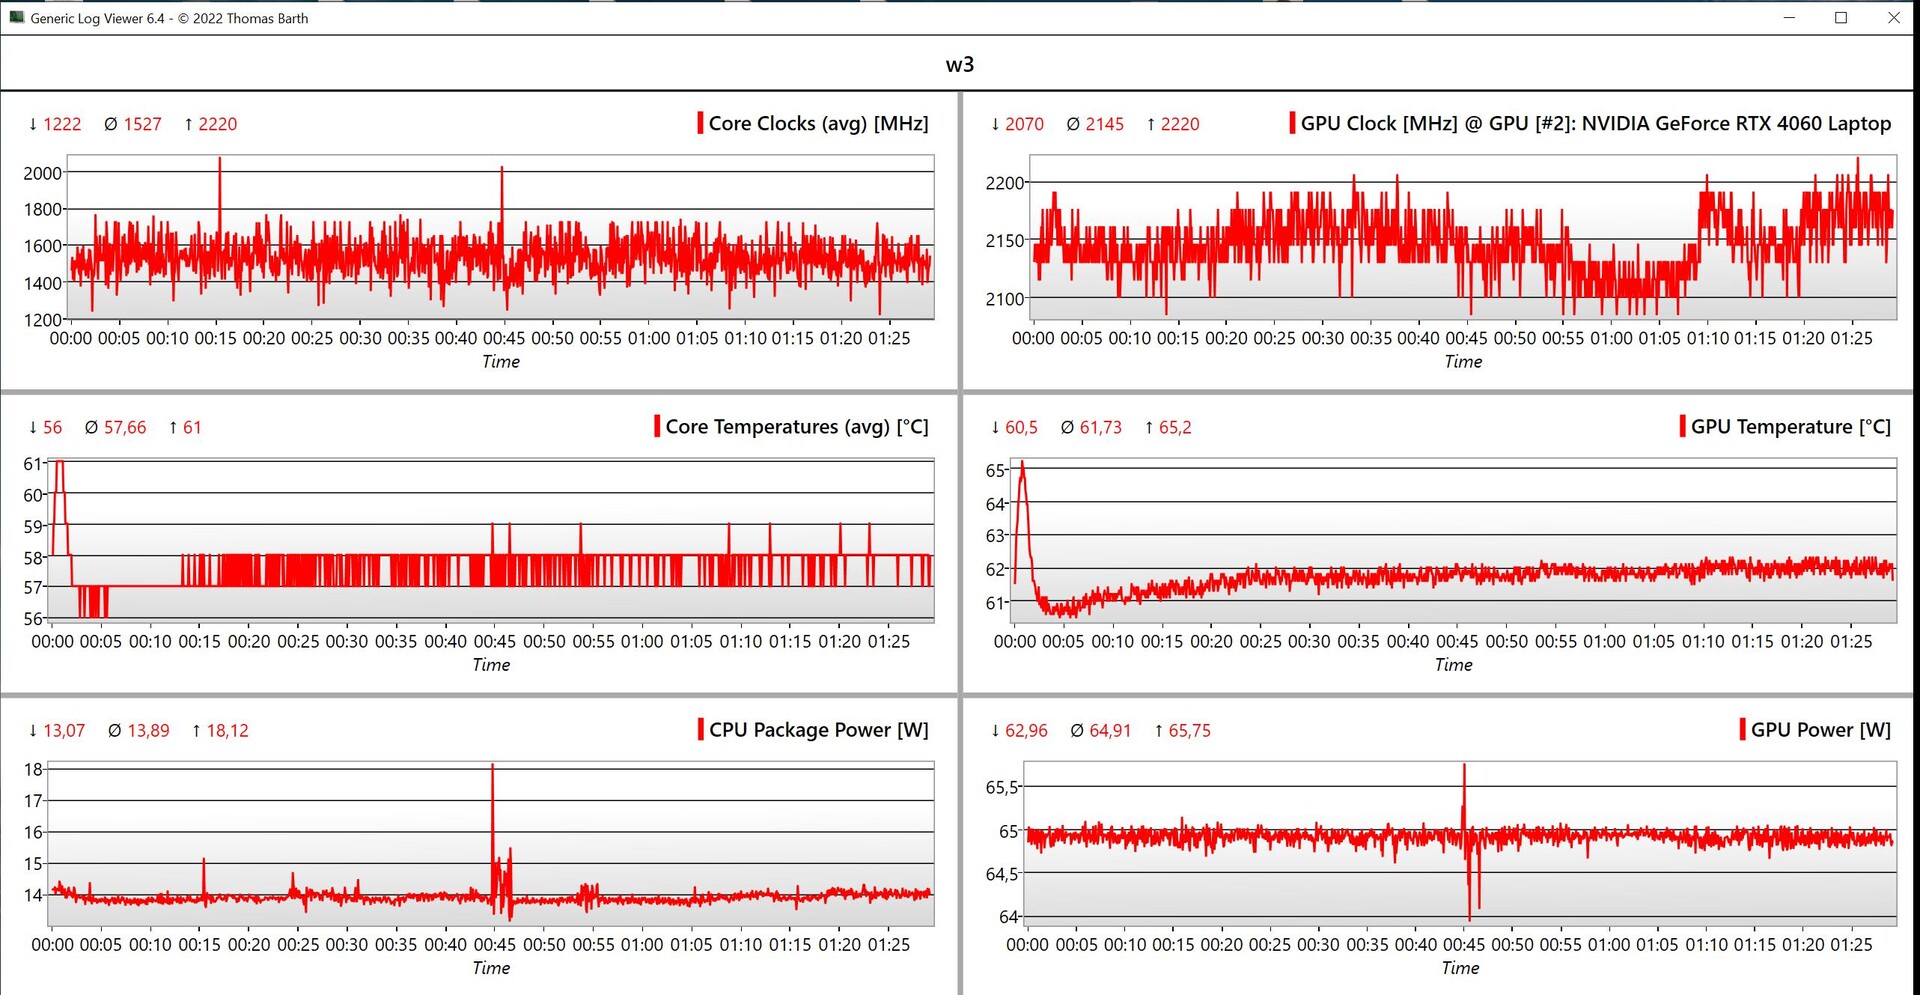
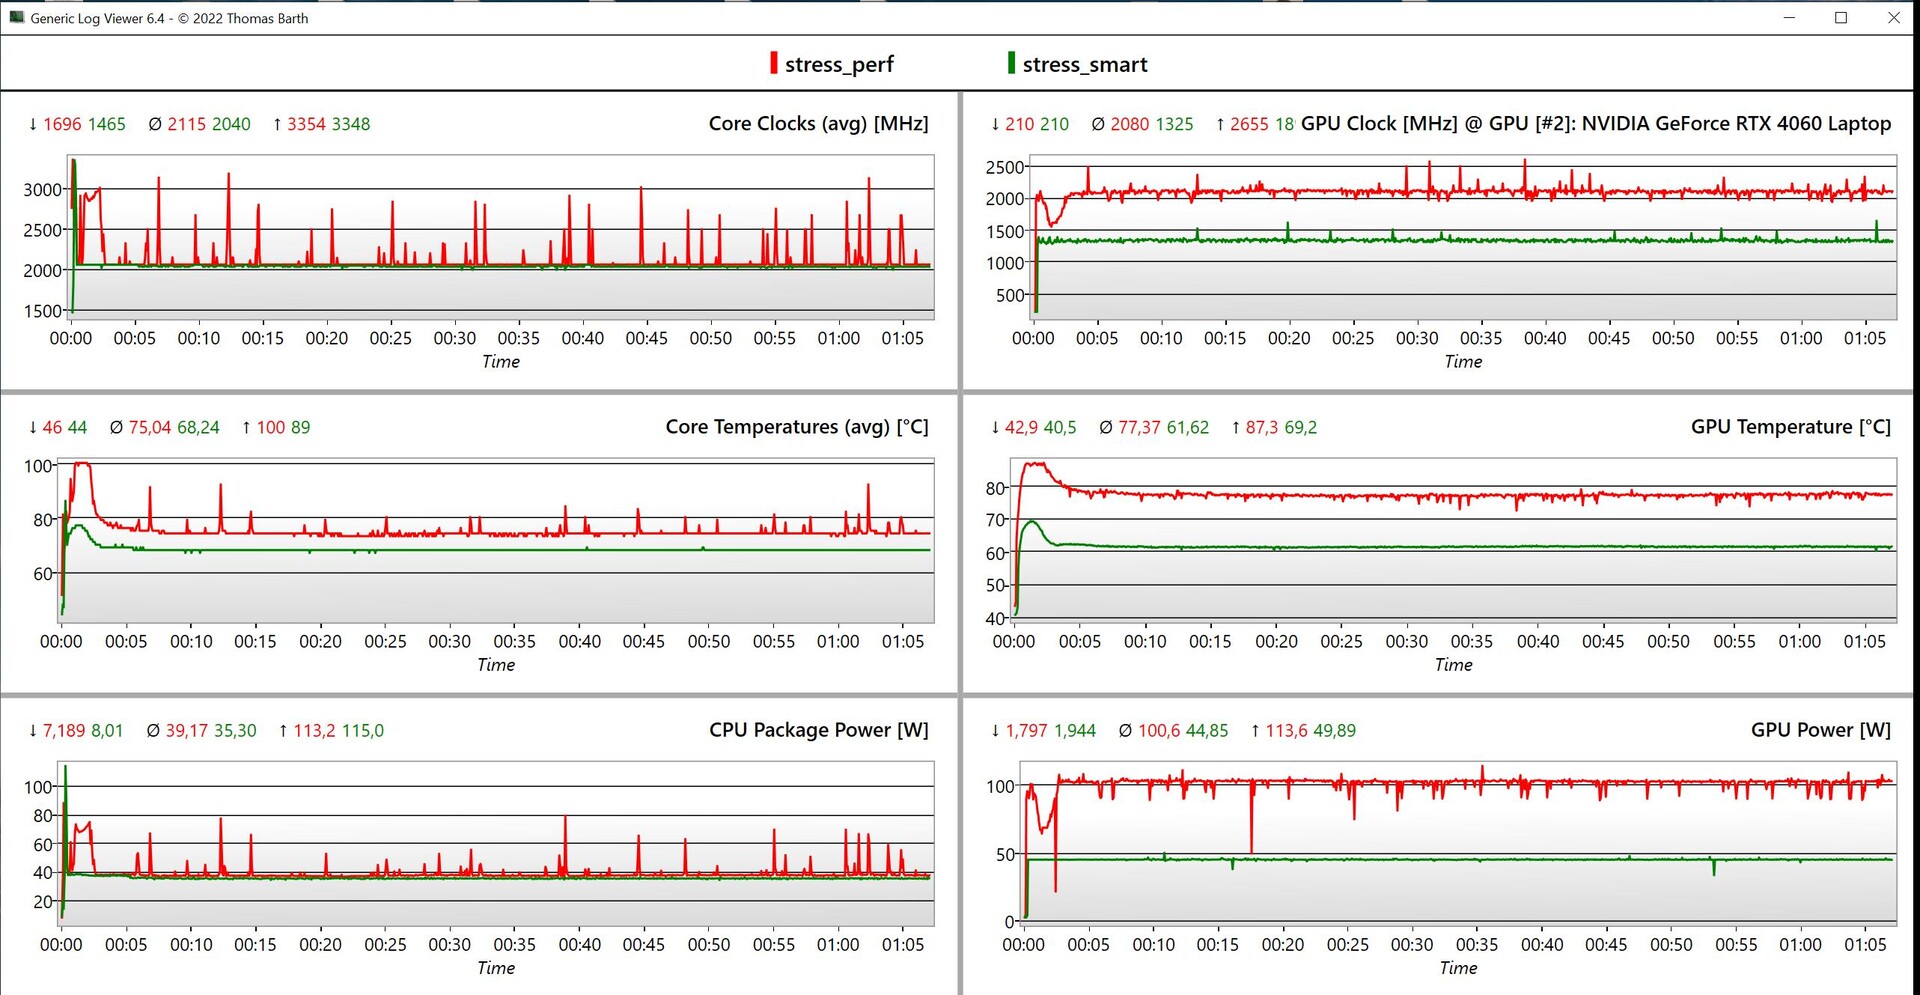
Prueba de esfuerzo
En la prueba de estrés, el MagicBook Pro 16 rindió muy bien. Utilizando el modo inteligente, la CPU y la GPU se establecieron en 35 y 45 vatios, respectivamente, y casi 40 vatios (CPU) y 100 vatios (GPU) en el modo de alto rendimiento. Por supuesto, en este caso, los ventiladores se vuelven más ruidosos pero las temperaturas siguen siendo totalmente aceptables. En el modo de batería, el consumo de la prueba de estrés bajó a 25 vatios para la CPU y 50 vatios para la GPU.
Altavoces
El sistema de sonido consta de 6 altavoces que en general proporcionan un buen sonido y están más o menos al mismo nivel que otros dispositivos multimedia como el Lenovo Yoga Pro 9 16. Se puede hacer más, sobre todo en lo que se refiere a los graves pero eso son gemidos de alto nivel
Honor MagicBook Pro 16 2024 análisis de audio
(±) | la sonoridad del altavoz es media pero buena (81.3 dB)
Graves 100 - 315 Hz
(±) | lubina reducida - en promedio 6.8% inferior a la mediana
(±) | la linealidad de los graves es media (9% delta a frecuencia anterior)
Medios 400 - 2000 Hz
(+) | medios equilibrados - a sólo 2.1% de la mediana
(+) | los medios son lineales (5.2% delta a la frecuencia anterior)
Altos 2 - 16 kHz
(+) | máximos equilibrados - a sólo 2.1% de la mediana
(+) | los máximos son lineales (6.5% delta a la frecuencia anterior)
Total 100 - 16.000 Hz
(+) | el sonido global es lineal (8.7% de diferencia con la mediana)
En comparación con la misma clase
» 11% de todos los dispositivos probados de esta clase eran mejores, 2% similares, 87% peores
» El mejor tuvo un delta de 5%, la media fue 17%, el peor fue ###max##%
En comparación con todos los dispositivos probados
» 3% de todos los dispositivos probados eran mejores, 1% similares, 97% peores
» El mejor tuvo un delta de 4%, la media fue 23%, el peor fue ###max##%
Lenovo Yoga Pro 9 16-IRP G8 análisis de audio
(±) | la sonoridad del altavoz es media pero buena (80.5 dB)
Graves 100 - 315 Hz
(+) | buen bajo - sólo 4.9% lejos de la mediana
(±) | la linealidad de los graves es media (9.1% delta a frecuencia anterior)
Medios 400 - 2000 Hz
(+) | medios equilibrados - a sólo 3.2% de la mediana
(+) | los medios son lineales (6.5% delta a la frecuencia anterior)
Altos 2 - 16 kHz
(+) | máximos equilibrados - a sólo 2.9% de la mediana
(+) | los máximos son lineales (3% delta a la frecuencia anterior)
Total 100 - 16.000 Hz
(+) | el sonido global es lineal (8.4% de diferencia con la mediana)
En comparación con la misma clase
» 9% de todos los dispositivos probados de esta clase eran mejores, 2% similares, 89% peores
» El mejor tuvo un delta de 5%, la media fue 17%, el peor fue ###max##%
En comparación con todos los dispositivos probados
» 2% de todos los dispositivos probados eran mejores, 1% similares, 97% peores
» El mejor tuvo un delta de 4%, la media fue 23%, el peor fue ###max##%
Gestión de la energía - Buena resistencia
Consumo de energía
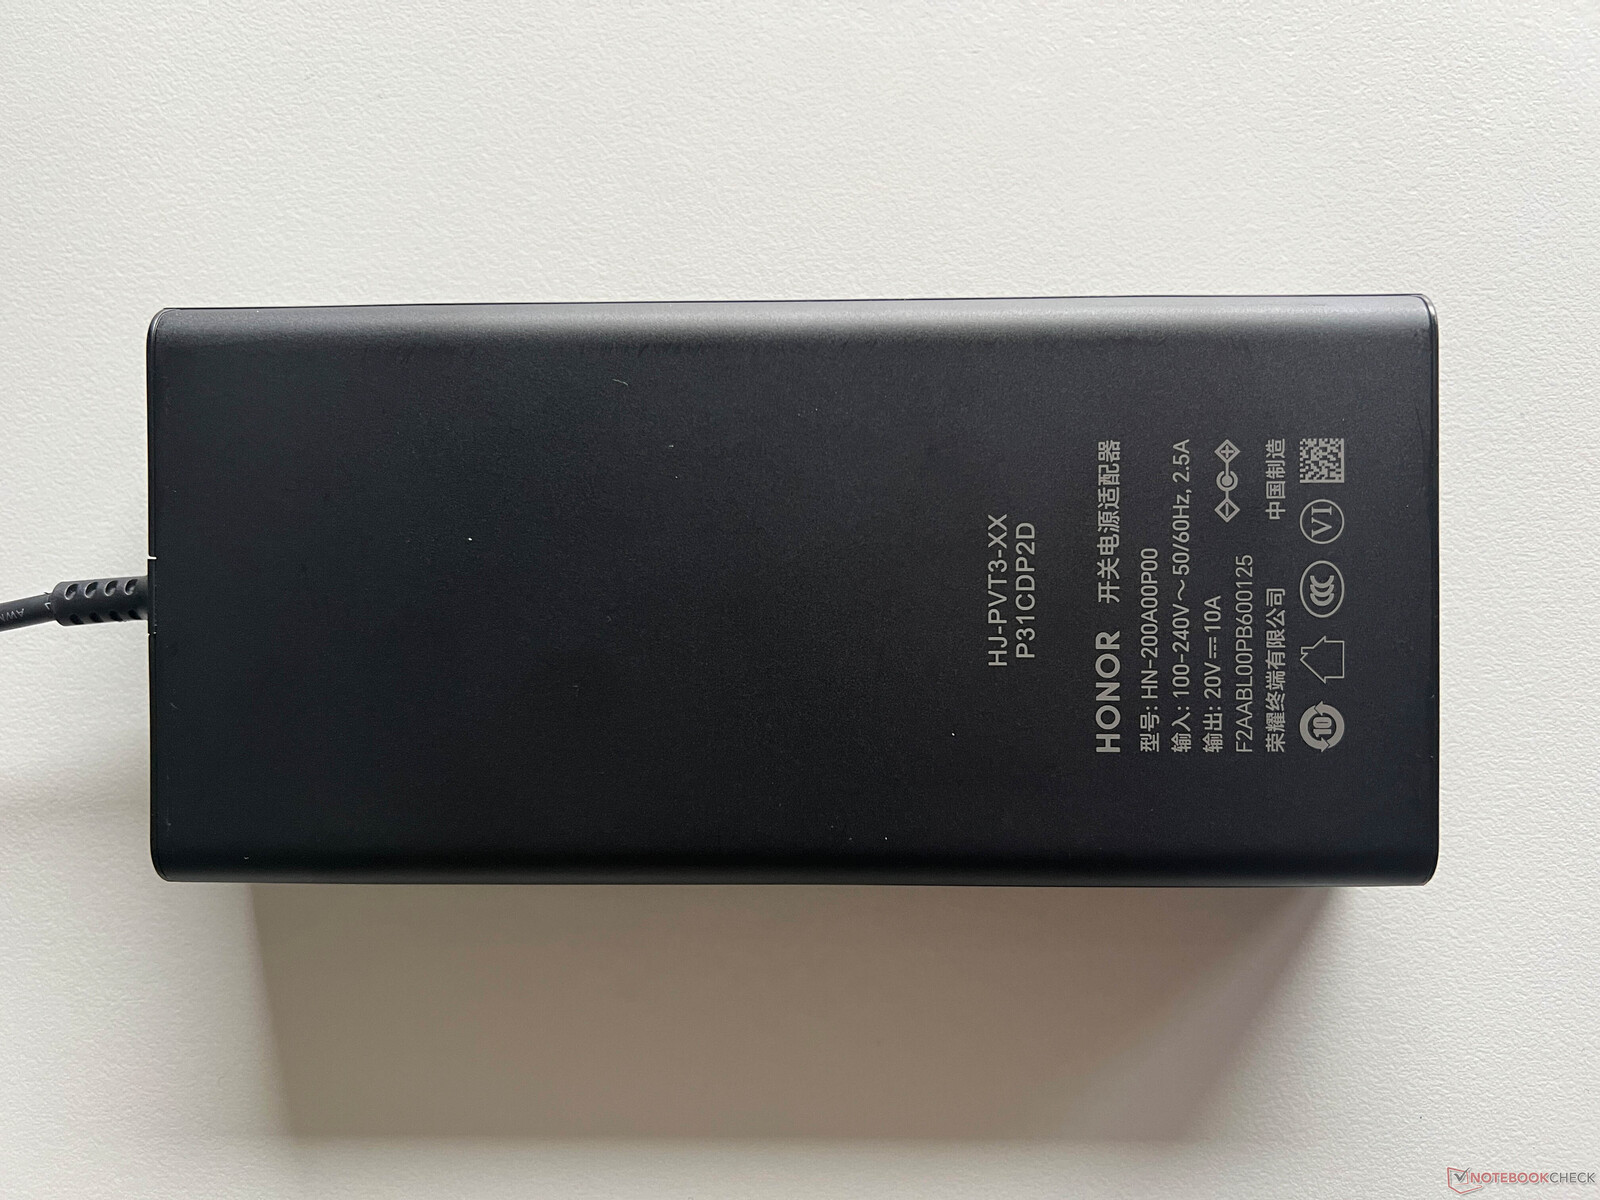
Funcionando en reposo a pleno brillo, la pantalla IPS requiere hasta 15 vatios, lo que es muy aceptable teniendo en cuenta el alto brillo y la resolución. En la prueba de estrés, medimos brevemente un máximo de 196 vatios aunque estos valores se estabilizaron rápidamente en 115 vatios. En el modo de alto rendimiento, también registramos un máximo de 196 vatios pero este valor permaneció más tiempo en este nivel y luego se estabilizó en unos 170 vatios. En ambos casos, la fuente de alimentación de 200 vatios suministrada es más que suficiente.
| Off / Standby | |
| Ocioso | |
| Carga |
|
Clave:
min: | |
| Honor MagicBook Pro 16 2024 Ultra 7 155H, GeForce RTX 4060 Laptop GPU, WD PC SN740 SDDPNQD-1T00, IPS, 3072x1920, 16" | Framework Laptop 16 R9 7940HS, Radeon RX 7700S, WDC PC SN810 1TB, , 2560x1600, 16" | Lenovo ThinkPad Z16 Gen 2 R9 PRO 7940HS, Radeon RX 6550M, Kioxia XG8 KXG8AZNV1T02, OLED, 3840x2400, 16" | Dell Inspiron 16 Plus 7630 i7-13700H, GeForce RTX 4060 Laptop GPU, WD PC SN740 SDDPTQD-1T00, IPS, 2560x1600, 16" | Lenovo Yoga Pro 9 16-IRP G8 i7-13705H, GeForce RTX 4060 Laptop GPU, Samsung PM9A1 MZVL21T0HCLR, Mini-LED, 3200x2000, 16" | Schenker VISION 16 Pro (M23) i7-13700H, GeForce RTX 4070 Laptop GPU, Samsung 990 Pro 1 TB, IPS, 2560x1600, 16" | Asus Vivobook Pro 16X K6604JV-MX016W i9-13980HX, GeForce RTX 4060 Laptop GPU, Solidigm P41 Plus SSDPFKNU010TZ, OLED, 3200x2000, 16" | Medio NVIDIA GeForce RTX 4060 Laptop GPU | Media de la clase Multimedia | |
|---|---|---|---|---|---|---|---|---|---|
| Power Consumption | -26% | 7% | -37% | -40% | -5% | -50% | -32% | 24% | |
| Idle Minimum * (Watt) | 5.2 | 9.5 -83% | 7.5 -44% | 15.6 -200% | 10.9 -110% | 8.6 -65% | 13.8 -165% | 11.5 ? -121% | 5.72 ? -10% |
| Idle Average * (Watt) | 14.4 | 17 -18% | 9.6 33% | 17.7 -23% | 22.6 -57% | 12 17% | 16 -11% | 16 ? -11% | 10.2 ? 29% |
| Idle Maximum * (Watt) | 15.4 | 17.2 -12% | 18.5 -20% | 20.6 -34% | 23.5 -53% | 12.4 19% | 19 -23% | 20.3 ? -32% | 12.4 ? 19% |
| Load Average * (Watt) | 105.4 | 96.2 9% | 57.1 46% | 87.4 17% | 84.6 20% | 80 24% | 147 -39% | 92.9 ? 12% | 65.5 ? 38% |
| Witcher 3 ultra * (Watt) | 107.6 | 171.9 -60% | 115.8 -8% | 121.7 -13% | 159.5 -48% | 147.7 -37% | 147.8 -37% | ||
| Load Maximum * (Watt) | 195.2 | 175.7 10% | 131.7 33% | 138 29% | 177.3 9% | 173.1 11% | 244 -25% | 210 ? -8% | 114 ? 42% |
* ... más pequeño es mejor
Power consumption Witcher 3 / stress test
Power consumption with an external monitor
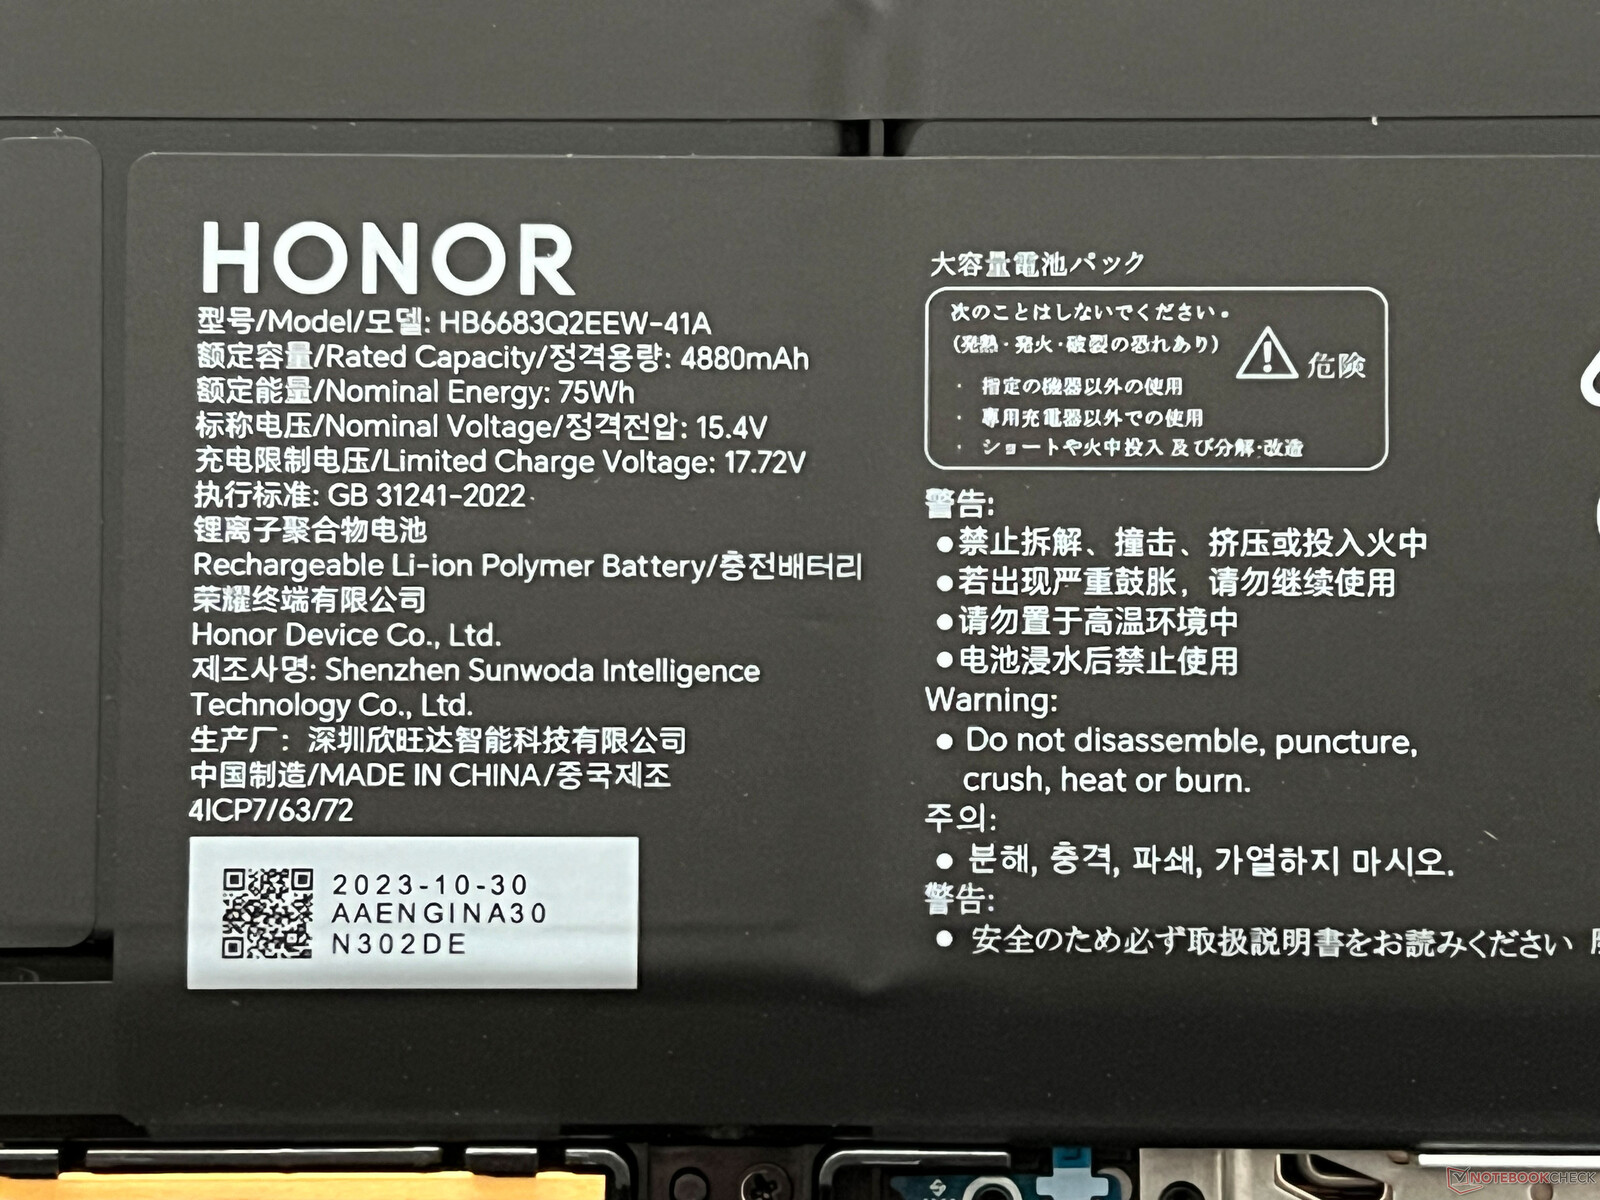
Duración de las pilas
La batería de 75 Wh permite tiempos de funcionamiento muy buenos con el brillo adaptativo ajustado a 150 cd/m² (lo que representa el 55% del brillo máximo del dispositivo de revisión). A 60 Hz, nuestra prueba Wi-Fi funcionó durante más de 12 horas y, a 165 Hz, funcionó durante 9 horas y 20 minutos. Si utiliza el brillo máximo de la pantalla, puede obtener unas 6 horas y aquí es donde la frecuencia más alta ya no tiene una gran influencia (359 minutos a 165 Hz). Nuestra prueba de vídeo (ajustada a 150 cd/m²) duró más de 13 horas pero, bajo carga máxima y con el brillo al máximo, es posible agotar completamente la batería en 58 minutos. Un ciclo de carga completo, con el aparato encendido, sólo tarda 62 minutos y se accede al 80 % tras sólo 34 minutos.
| Honor MagicBook Pro 16 2024 Ultra 7 155H, GeForce RTX 4060 Laptop GPU, 75 Wh | Framework Laptop 16 R9 7940HS, Radeon RX 7700S, 85 Wh | Lenovo ThinkPad Z16 Gen 2 R9 PRO 7940HS, Radeon RX 6550M, 72 Wh | Dell Inspiron 16 Plus 7630 i7-13700H, GeForce RTX 4060 Laptop GPU, 86 Wh | Lenovo Yoga Pro 9 16-IRP G8 i7-13705H, GeForce RTX 4060 Laptop GPU, 75 Wh | Schenker VISION 16 Pro (M23) i7-13700H, GeForce RTX 4070 Laptop GPU, 80 Wh | Asus Vivobook Pro 16X K6604JV-MX016W i9-13980HX, GeForce RTX 4060 Laptop GPU, 90 Wh | Media de la clase Multimedia | |
|---|---|---|---|---|---|---|---|---|
| Duración de Batería | 13% | 10% | 9% | -40% | -15% | -19% | 31% | |
| H.264 (h) | 13.1 | 7.5 -43% | 7.8 -40% | 5.3 -60% | 16.4 ? 25% | |||
| WiFi v1.3 (h) | 12.2 | 9.1 -25% | 6 -51% | 9.4 -23% | 6.4 -48% | 7.8 -36% | 6.5 -47% | 12.2 ? 0% |
| Load (h) | 1 | 1.5 50% | 1.7 70% | 1.4 40% | 0.7 -30% | 1.3 30% | 1.5 50% | 1.668 ? 67% |
Pro
Contra
Veredicto - El MagicBook Pro 16 es un portátil multimedia sorprendentemente bueno
Con el nuevo MagicBook Pro 16, Honor abre nuevos caminos y lanza al mercado un potente portátil multimedia interesante tanto para los creadores de contenidos como para los jugadores. En particular, en lo que respecta a la refrigeración, el dispositivo resulta impresionante incluso en el primer funcionamiento. Utilizando el modo inteligente, se ha encontrado un buen equilibrio entre el rendimiento y el volumen del ventilador, lo que significa que puede jugar sin auriculares. En el modo de alto rendimiento, la carga de rendimiento combinada CPU/GPU es muy pronunciada y se produce a costa del volumen del ventilador. En ambos casos, las temperaturas superficiales no son motivo de preocupación. Los títulos exigentes se benefician de la combinación del nuevo Core Ultra 7 155H y el GeForce Portátil RTX 4060 junto con Advanced Optimus y se adaptan bien a un portátil multimedia.
En cuanto a la pantalla, Honor no ha apostado por mini LED u OLED sino que ha optado por un panel IPS clásico con una alta resolución de 3.072 x 1.920 píxeles. La superficie es mate, por lo que los colores no son muy vibrantes, lo que significa que tendrá que vivir con algunas limitaciones, especialmente en las áreas de niveles de negro y relación de contraste. Sin embargo, la ventaja es que el PWM está ausente y el brillo total del panel de más de 500 nits es accesible en funcionamiento SDR normal. Asimismo, los tiempos de respuesta son agradablemente rápidos. A quien le guste editar fotos y vídeos le molestará que no haya perfil sRGB.
El nuevo Honor MagicBook Pro 16 es un portátil multimedia muy equilibrado con componentes potentes y una refrigeración eficaz. El brillante panel IPS mate no sufre de PWM y ofrece una alta frecuencia de 165 Hz, así como rápidos tiempos de respuesta.
Otras ventajas son el cómodo teclado y su pad numérico, el sistema de sonido de 6 altavoces, así como el rendimiento Wi-Fi, aunque tenga que prescindir de los estándares actuales (Wi-Fi 6E, Wi-Fi 7). En términos de puertos, habría sido posible más (por ejemplo, HDMI 2.1 con G-Sync), pero, al menos con Thunderbolt 4 y HDMI 2.0, los estándares más importantes están cubiertos. La ubicación de los puertos USB-A en la parte trasera del aparato no es perfecta y éstos habrían encajado mejor en el lado derecho del aparato.
Tampoco nos convenció del todo la carcasa de plástico, ya que es responsable de algunos chirridos, aunque la estabilidad en sí es muy buena. Además, aunque no es posible ampliar la RAM, nuestra configuración de 32 GB de la revisión debería ser suficiente para la mayoría de los usuarios. En las pruebas, en unas pocas ocasiones, el clickpad no funcionó correctamente, pero como esto sólo ocurre esporádicamente, suponemos que tiene algo que ver con problemas de controladores. Esperemos que esto se solucione antes de que el dispositivo salga al mercado.
Y aquí es donde llegamos a nuestro siguiente problema. Por desgracia, actualmente no tenemos ninguna información sobre la disponibilidad (presumiblemente a partir del segundo trimestre) o el precio, por lo que es difícil hacer comparaciones con dispositivos de la competencia como el Lenovo Yoga Pro 9i 16, por el momento. Añadiremos la información lo antes posible.
Precio y disponibilidad
Se espera que el nuevo Honor MagicBook Pro 16 2024 esté disponible en todo el mundo a partir del segundo trimestre. En estos momentos, aún no podemos indicar el PVP.
Honor MagicBook Pro 16 2024
- 02/28/2024 v7 (old)
Andreas Osthoff
Transparencia
La selección de los dispositivos que se van a reseñar corre a cargo de nuestro equipo editorial. La muestra de prueba fue proporcionada al autor en calidad de préstamo por el fabricante o el minorista a los efectos de esta reseña. El prestamista no tuvo ninguna influencia en esta reseña, ni el fabricante recibió una copia de la misma antes de su publicación. No había ninguna obligación de publicar esta reseña. Como empresa de medios independiente, Notebookcheck no está sujeta a la autoridad de fabricantes, minoristas o editores.
Así es como prueba Notebookcheck
Cada año, Notebookcheck revisa de forma independiente cientos de portátiles y smartphones utilizando procedimientos estandarizados para asegurar que todos los resultados son comparables. Hemos desarrollado continuamente nuestros métodos de prueba durante unos 20 años y hemos establecido los estándares de la industria en el proceso. En nuestros laboratorios de pruebas, técnicos y editores experimentados utilizan equipos de medición de alta calidad. Estas pruebas implican un proceso de validación en varias fases. Nuestro complejo sistema de clasificación se basa en cientos de mediciones y puntos de referencia bien fundamentados, lo que mantiene la objetividad.Price comparison

