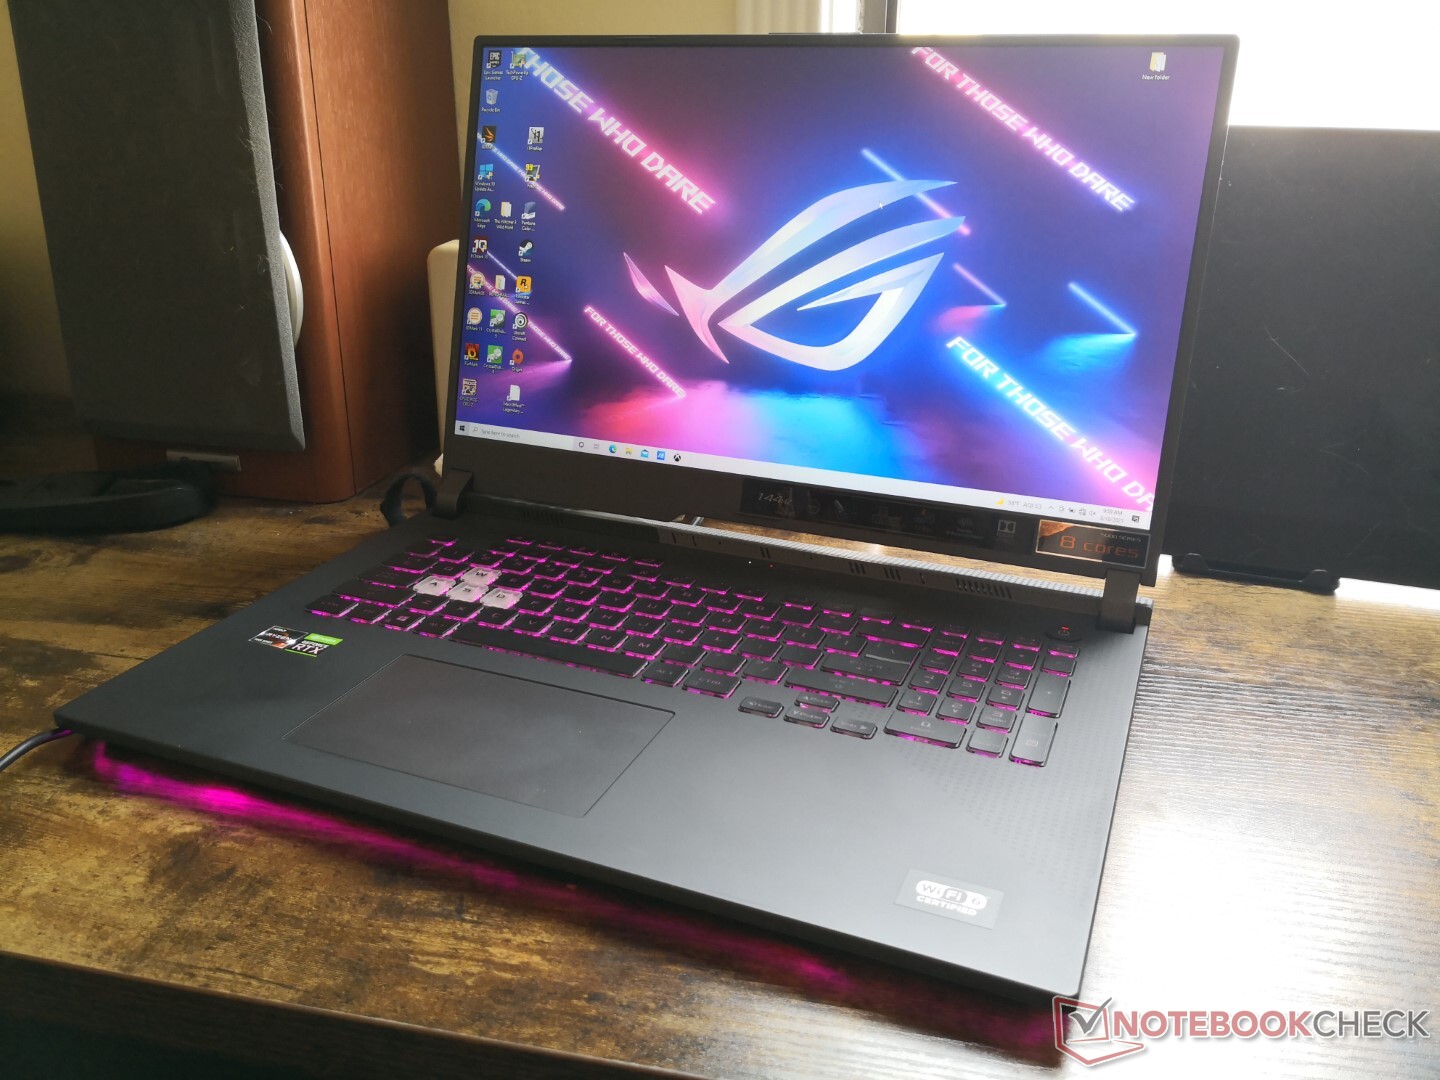
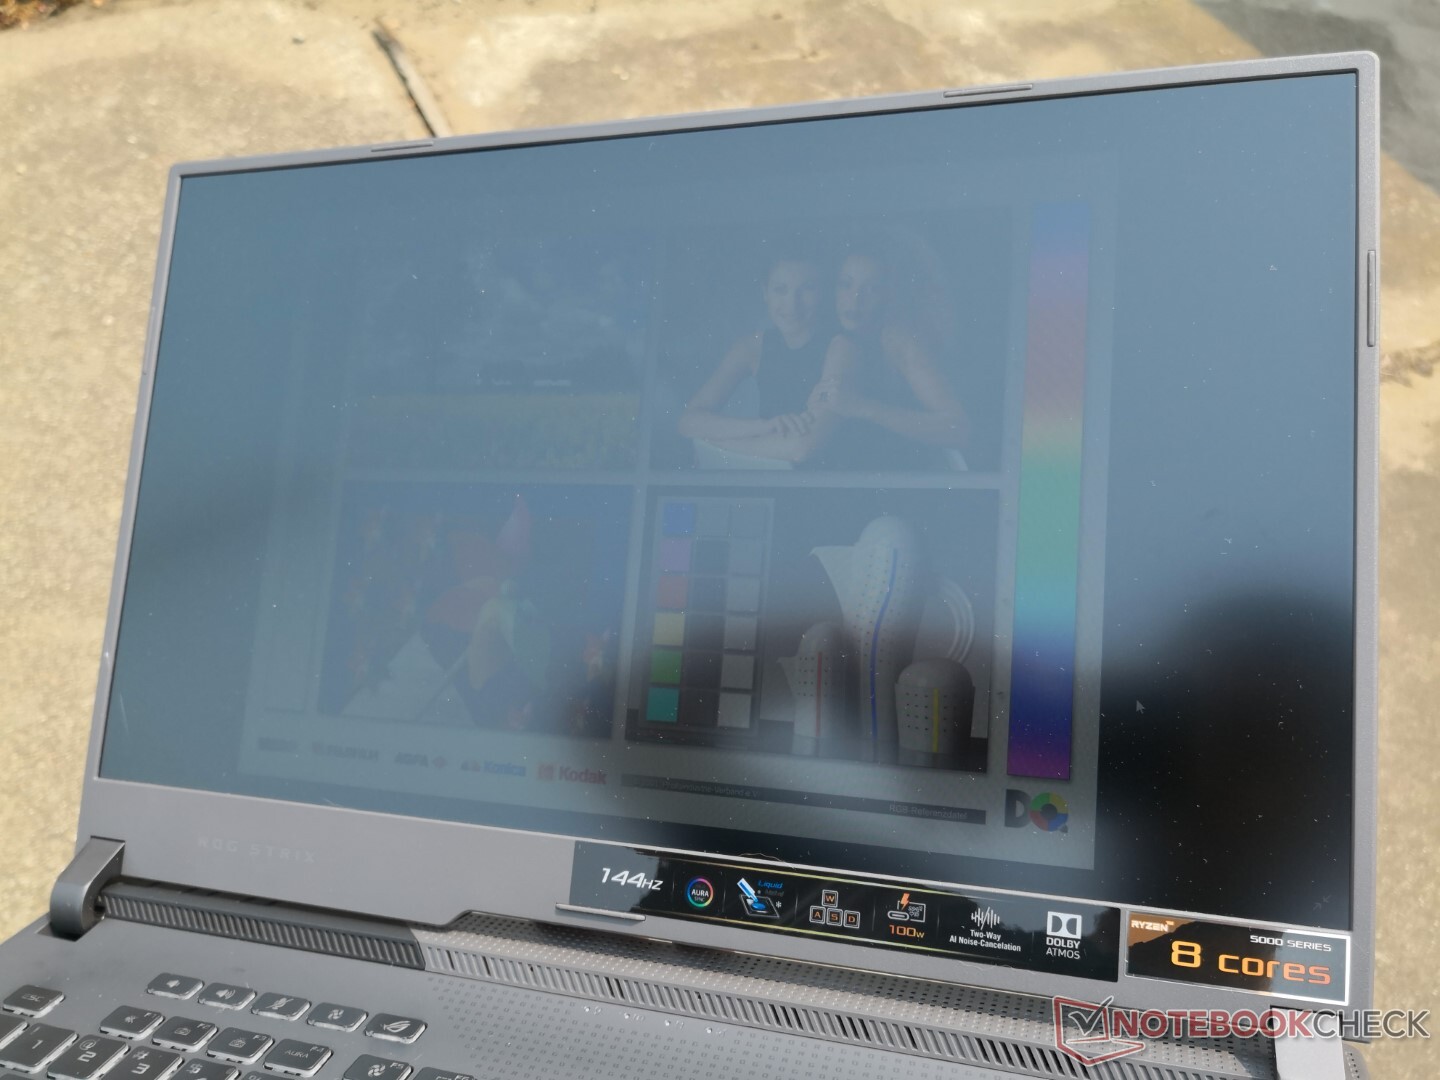
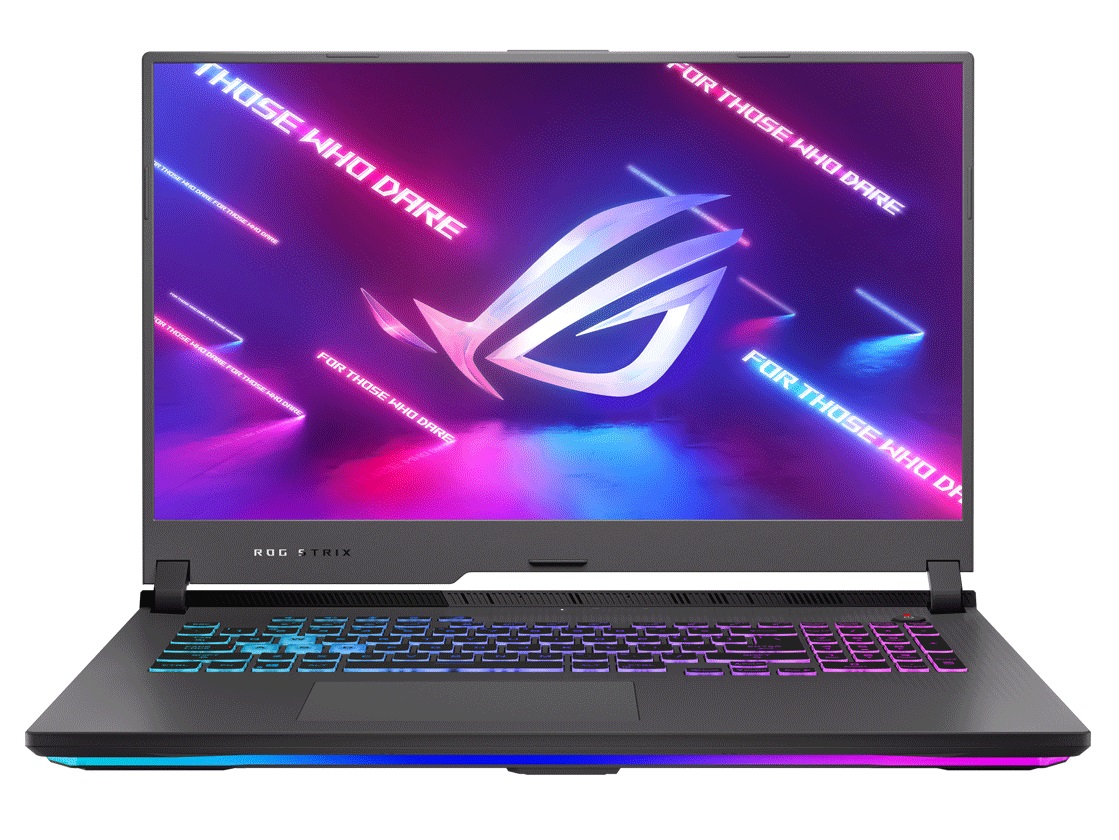
Análisis del portátil Asus ROG Strix G17 G713QE: la GeForce RTX 3050 Ti arrastra a un gran sistema

La serie ROG Strix G17 G713 sucede a la serie Serie G712 del año pasado sustituyendo a Intel por AMD y actualizando la mayoría de los modelos a la gráfica GeForce Ampere. Las opciones de configuración son amplias, con nada menos que 16 (¡!) modelos individuales , todos ellos detallados aquí en la página oficial de productos de Asus. Las opciones son enormes y van desde la CPU Zen 2 Ryzen 7 4800H hasta la Zen 3 Ryzen 9 5900HX y las gráficas GeForce GTX 1650 de 65 W hasta la GeForce RTX 3070 de 130 W. Las opciones de pantalla también varían mucho, desde el panel básico de 144 Hz FHD hasta el QHD de 165 Hz o el FHD de 300 Hz con colores más intensos. Incluso las capacidades de la batería, el grosor y los adaptadores de CA son diferentes según la gráfica.
Nuestra unidad de prueba de hoy es un SKU de gama media equipado con la CPU Ryzen 7 5800H, GPU RTX 3050 Ti de 95 W, y pantalla FHD de 144 Hz. Los competidores en este espacio incluyen otros portátiles para juegos de 17,3 pulgadas de nivel básico a medio como el MSI Katana GF76, Acer Nitro 5, La serie G de Dello Lenovo Legion 5.
Más opiniones de Asus:
potential competitors in comparison
Valoración | Fecha | Modelo | Peso | Altura | Tamaño | Resolución | Precio |
|---|---|---|---|---|---|---|---|
| 83.4 % v7 (old) | 08/2021 | Asus ROG Strix G17 G713QE-RB74 R7 5800H, GeForce RTX 3050 Ti Laptop GPU | 2.5 kg | 24.6 mm | 17.30" | 1920x1080 | |
| 81.1 % v7 (old) | 08/2021 | Acer Nitro 5 AN517-53-54DQ i5-11300H, GeForce RTX 3050 4GB Laptop GPU | 2.6 kg | 25 mm | 17.30" | 1920x1080 | |
| 80.4 % v7 (old) | 06/2021 | MSI Katana GF76 11UE i7-11800H, GeForce RTX 3060 Laptop GPU | 2.7 kg | 25.2 mm | 17.30" | 1920x1080 | |
| 86.6 % v7 (old) | 05/2021 | Asus Strix Scar 17 G733QSA-XS99 R9 5900HX, GeForce RTX 3080 Laptop GPU | 2.8 kg | 28.3 mm | 17.30" | 1920x1080 | |
| 83.3 % v7 (old) | 02/2021 | MSI Alpha 17 A4DEK R7 4800H, Radeon RX 5600M | 2.6 kg | 28 mm | 17.30" | 1920x1080 | |
| 83.1 % v7 (old) | 10/2020 | Asus Strix G17 G712LWS i7-10750H, GeForce RTX 2070 Super Mobile | 2.8 kg | 26.5 mm | 17.30" | 1920x1080 |
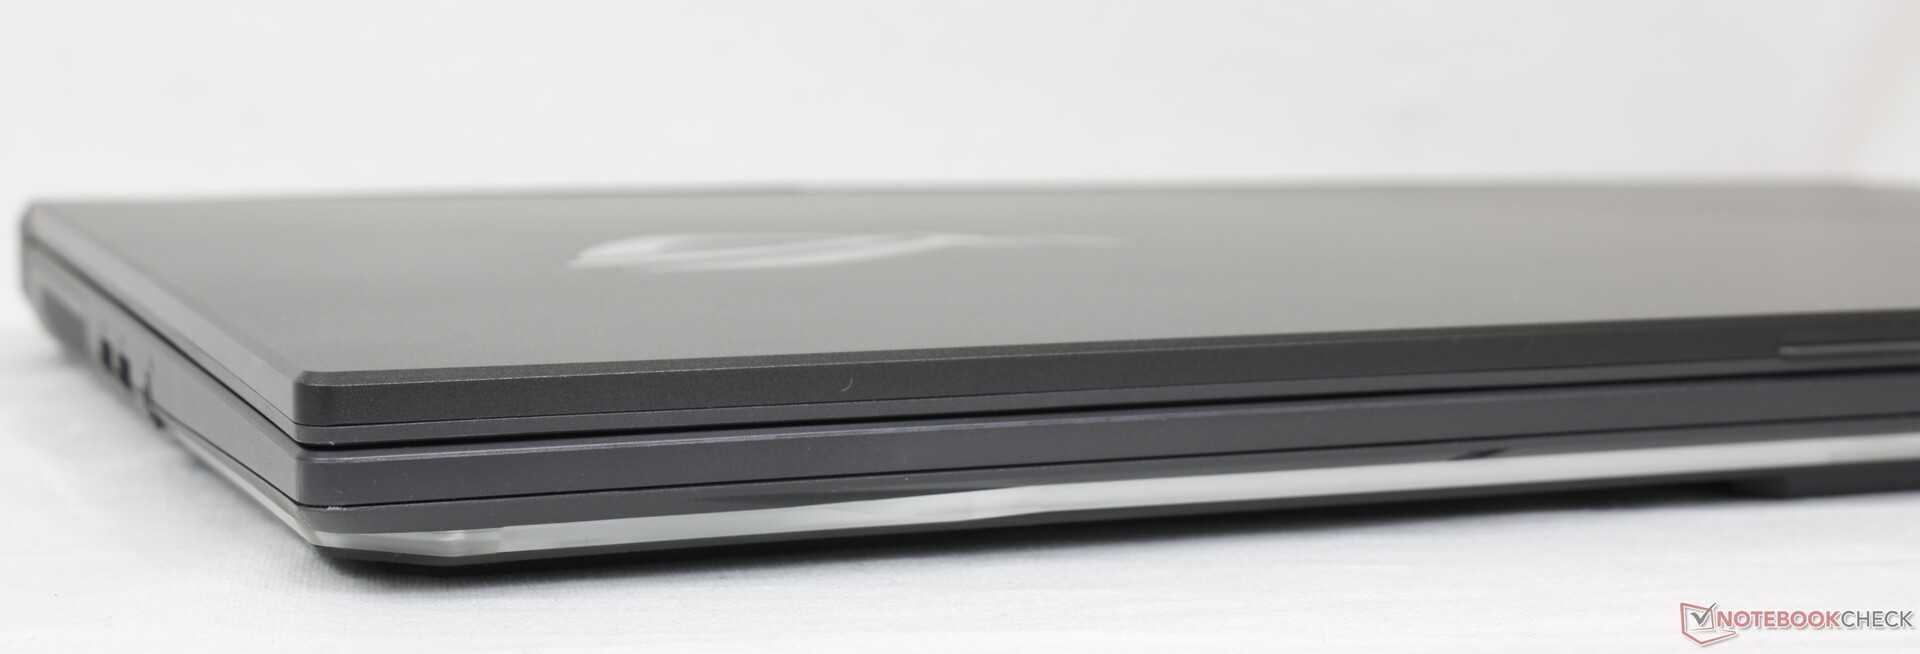
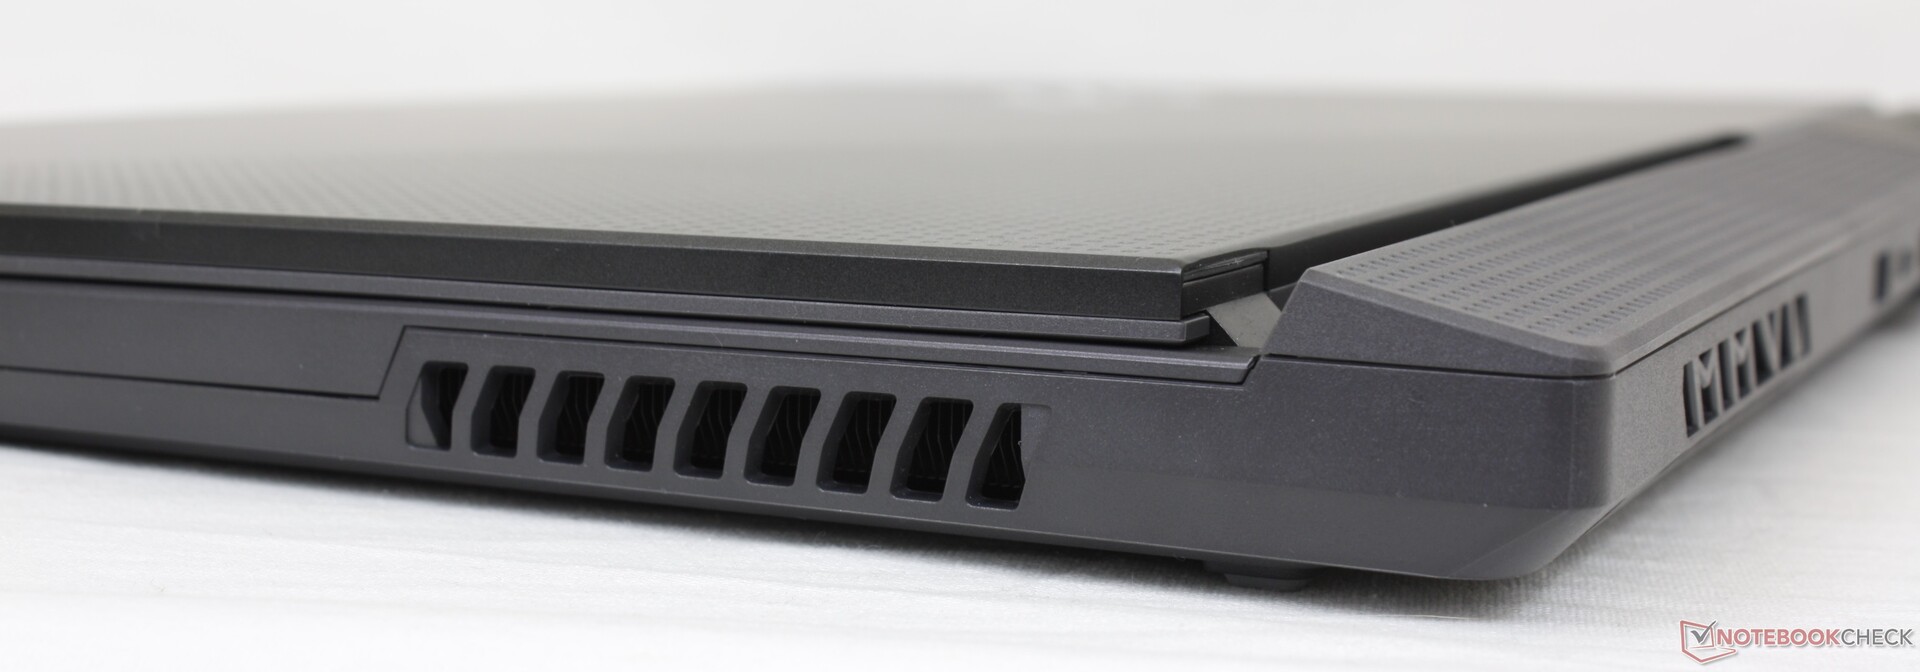
Caso - Familiar, pero diferente
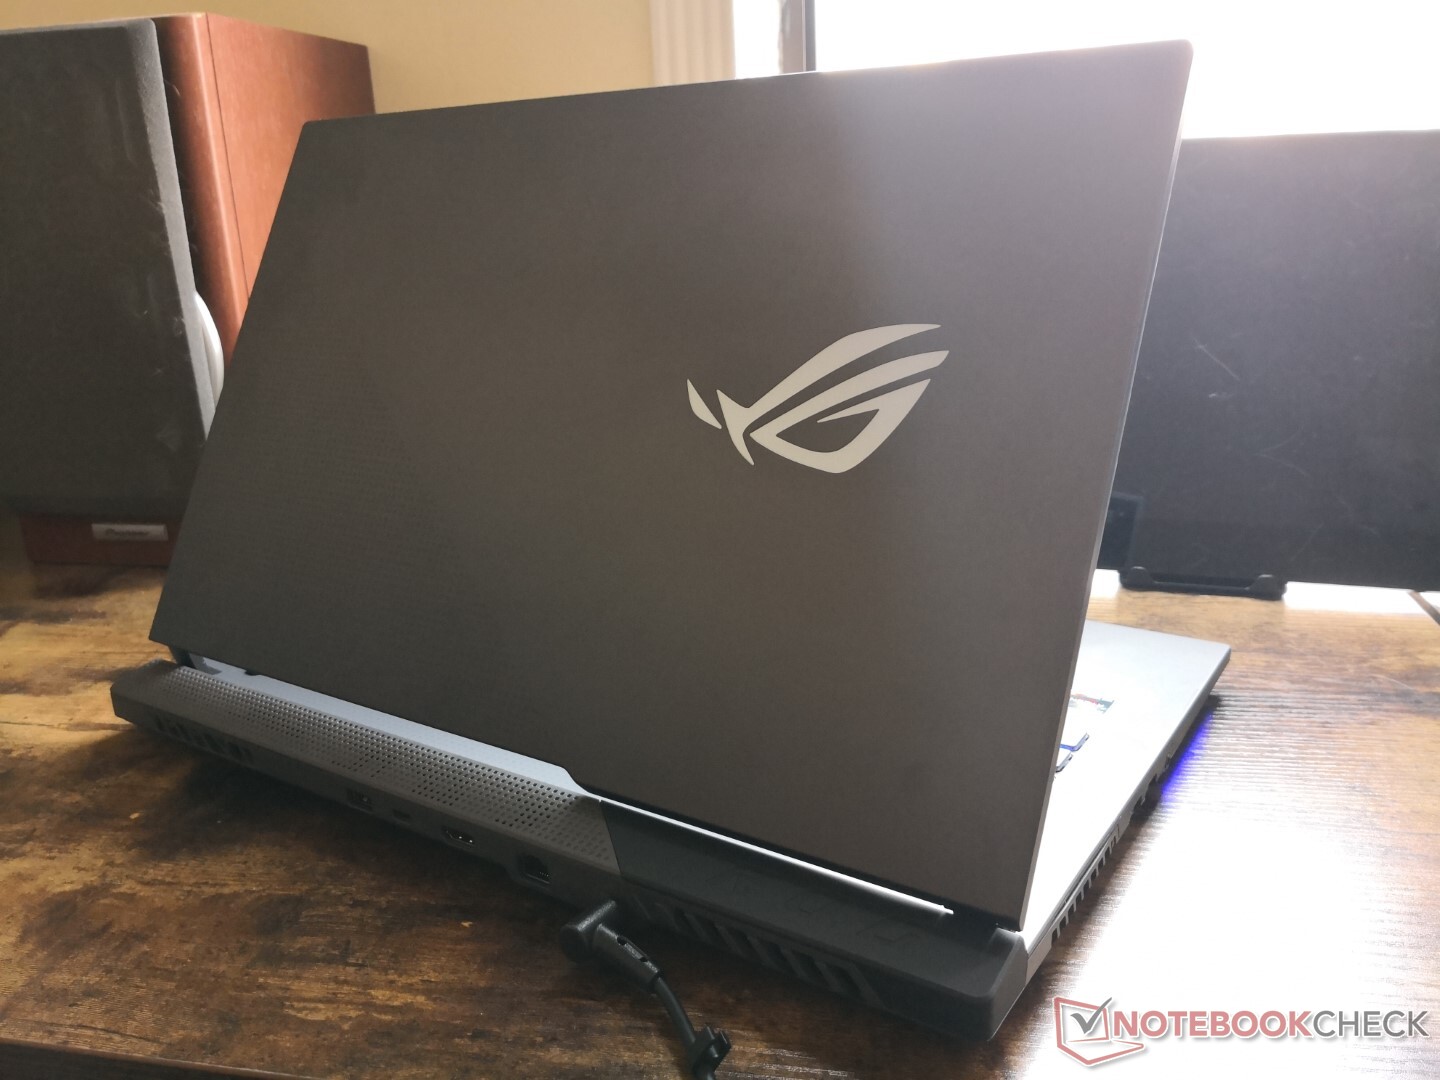
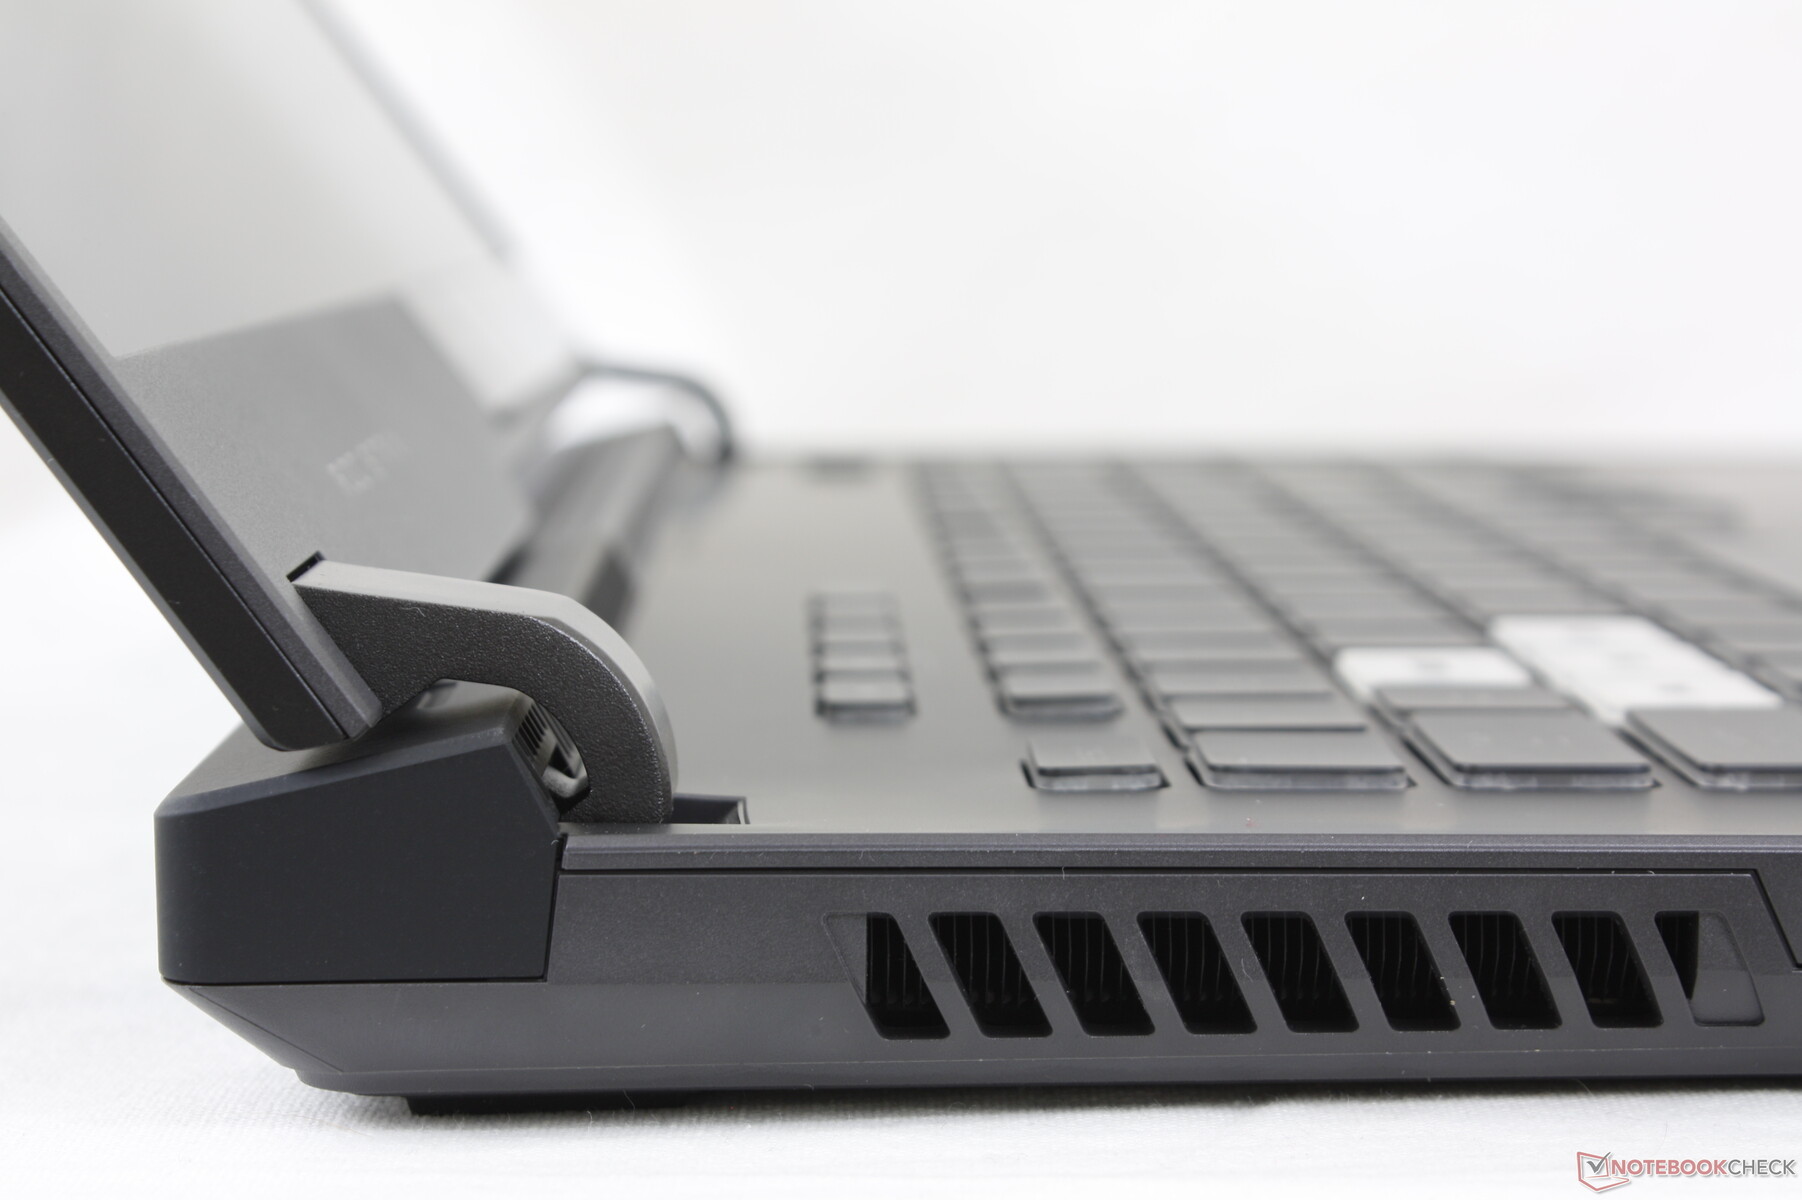
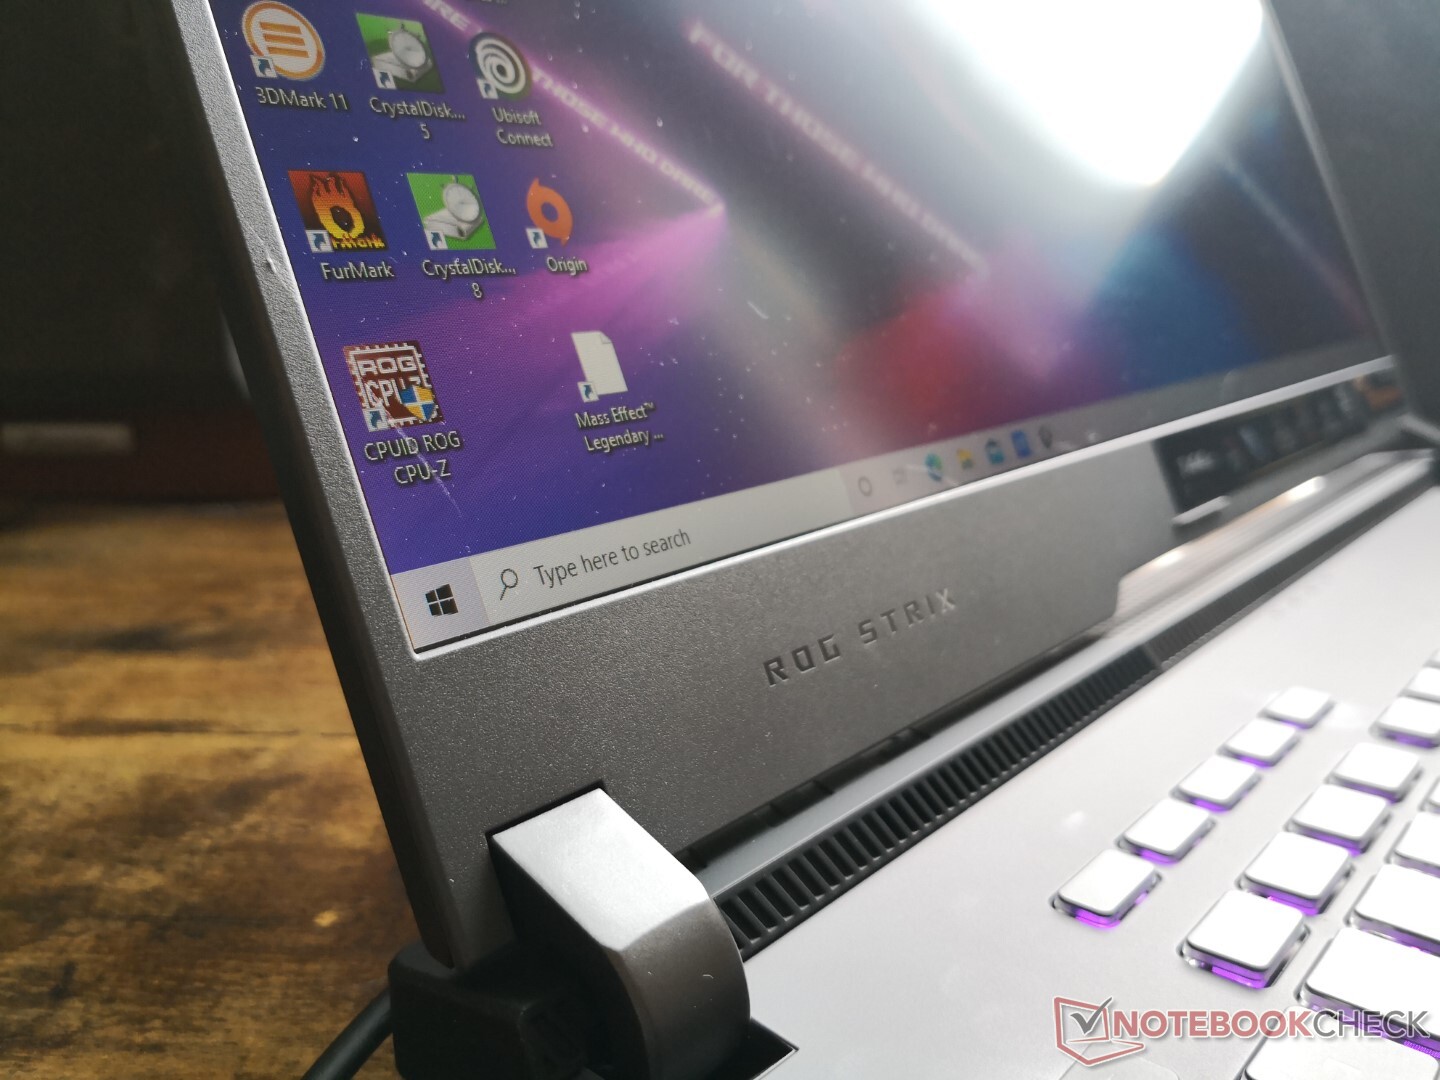
Puede ser difícil distinguir los diferentes modelos ROG Strix ya que comparten el mismo diseño visual. La parte trasera extendida en forma de "motor de reacción", las grandes bisagras visibles, el grueso bisel de la barbilla, la cubierta del teclado ligeramente recubierta de goma y la falta de una cámara web integrada no han cambiado con respecto a las generaciones anteriores. Las principales diferencias se centran en el estilo, ya que algunas partes del chasis son ahora más planas y suaves para conseguir un aspecto más elegante. El borde derecho y la tapa exterior, por ejemplo, están adornados con un nuevo patrón ROG que no está presente en los modelos anteriores.
La rigidez del chasis no ha mejorado respecto al G712 del año pasado. Sin embargo, sigue siendo más fuerte que las series MSI GF o GP, especialmente en lo que respecta a las bisagras.
Por desgracia, el G713 se presenta en dos versiones que difieren tanto en peso como en dimensiones según la configuración. Nuestra unidad específica es la versión más pequeña, con un grosor y un peso de 2,46 cm y 2,5 kg, respectivamente, mientras que las configuraciones con el RTX 3060 o más rápido son más gruesas (2,83 cm) y más pesadas (2,7+ kg). Se trata de un sistema robusto que se sitúa entre el más delgado Zephyrus S17 y el más grueso Lenovo Legion 5.
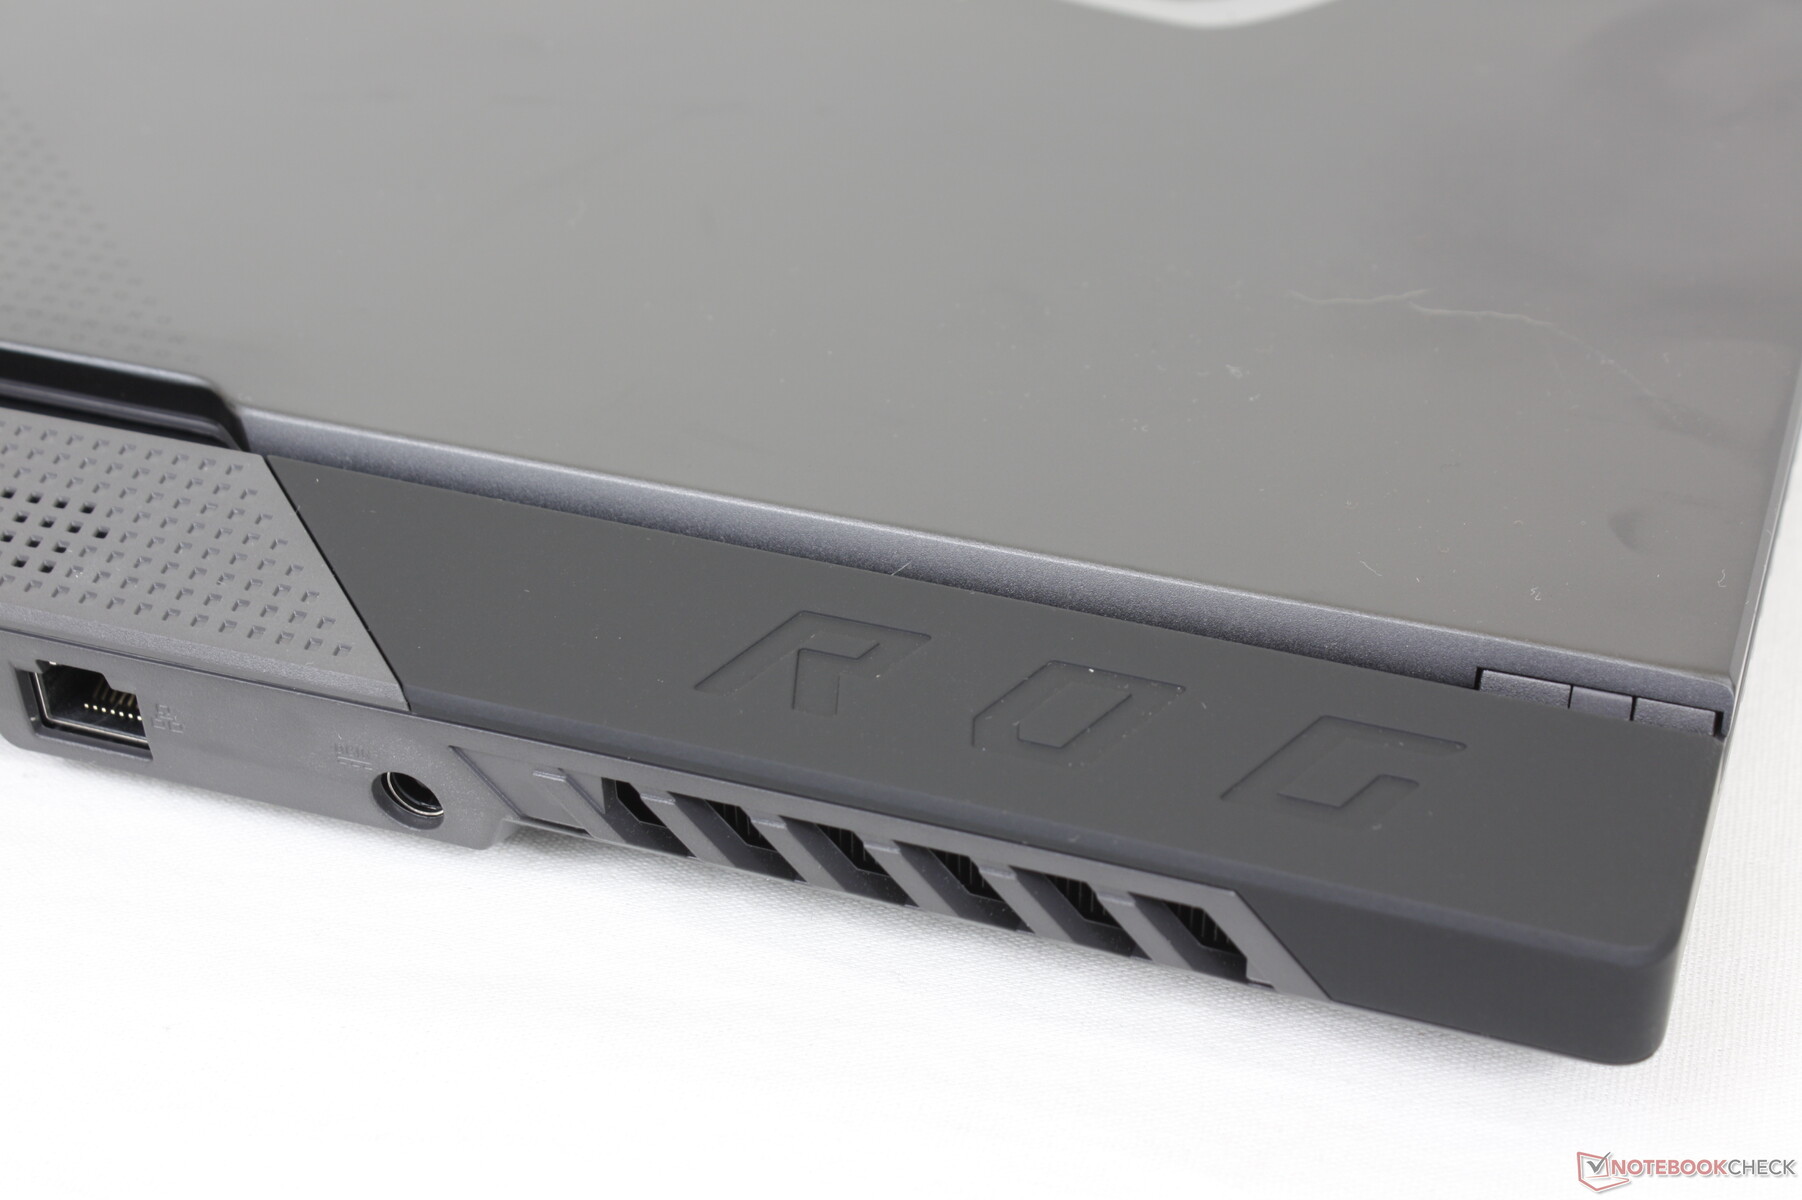
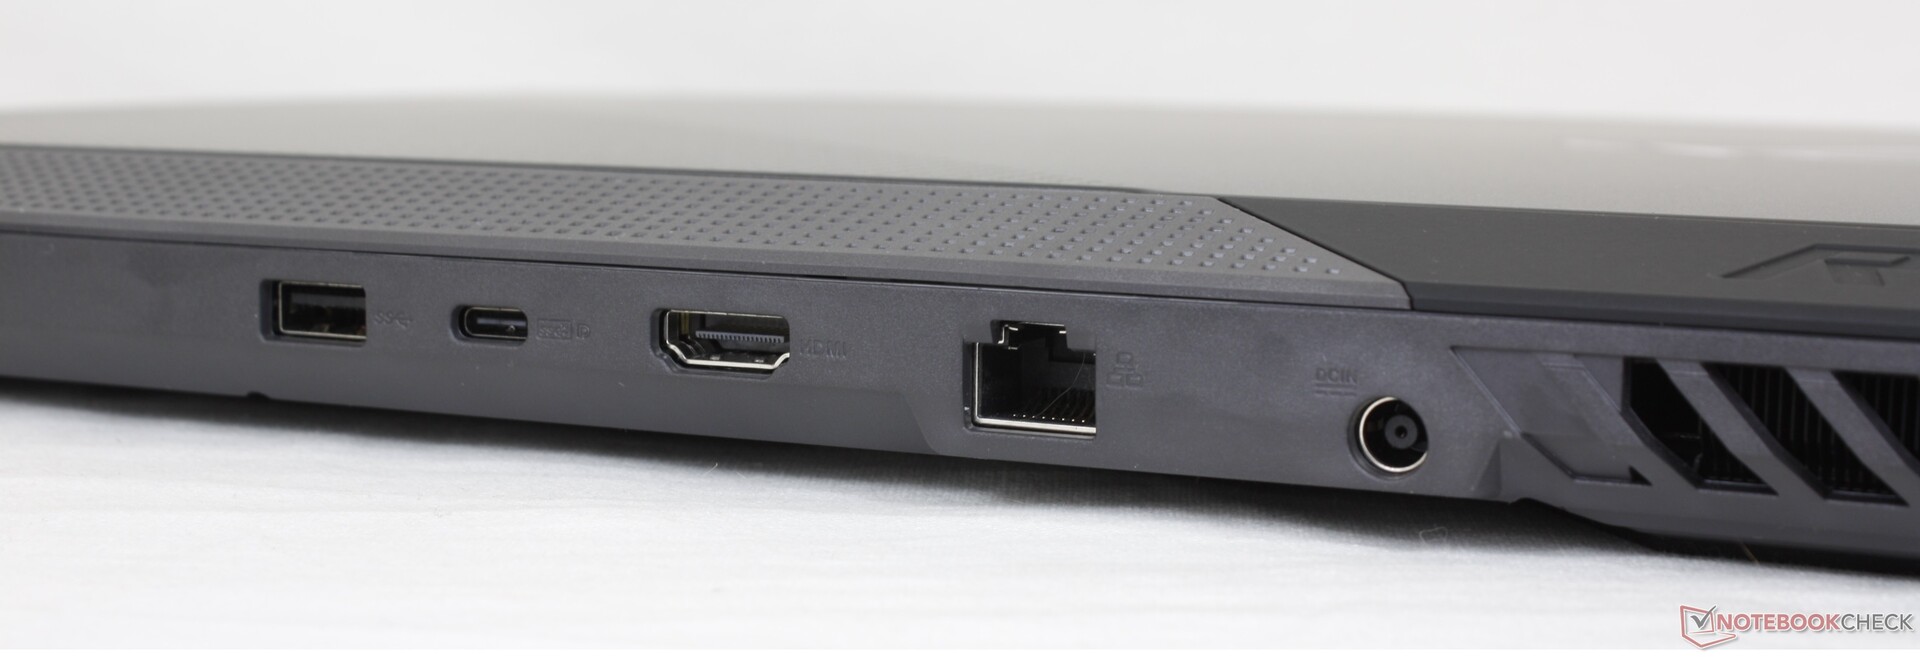
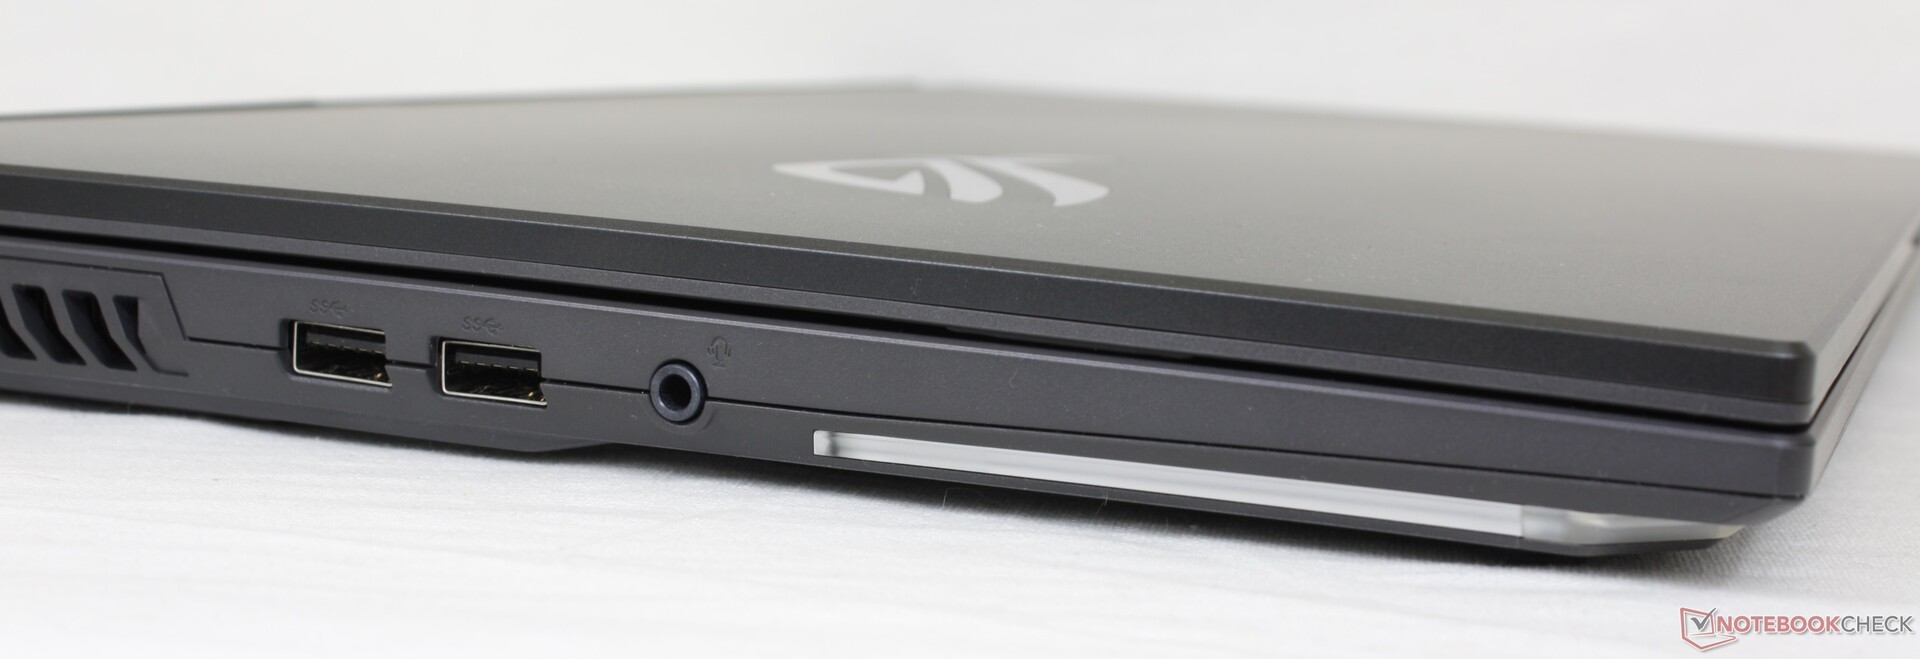
Conectividad - Sin Thunderbolt
Los puertos son idénticos a los del más caro G733QS pero sin Asus Keystone ya que al fabricante le gusta reservar la característica sólo para sus modelos insignia. La posición de los puertos puede ser desfavorable para algunos usuarios, ya que no hay puertos a lo largo del borde derecho mientras que los puertos de la parte trasera pueden ser difíciles de alcanzar.
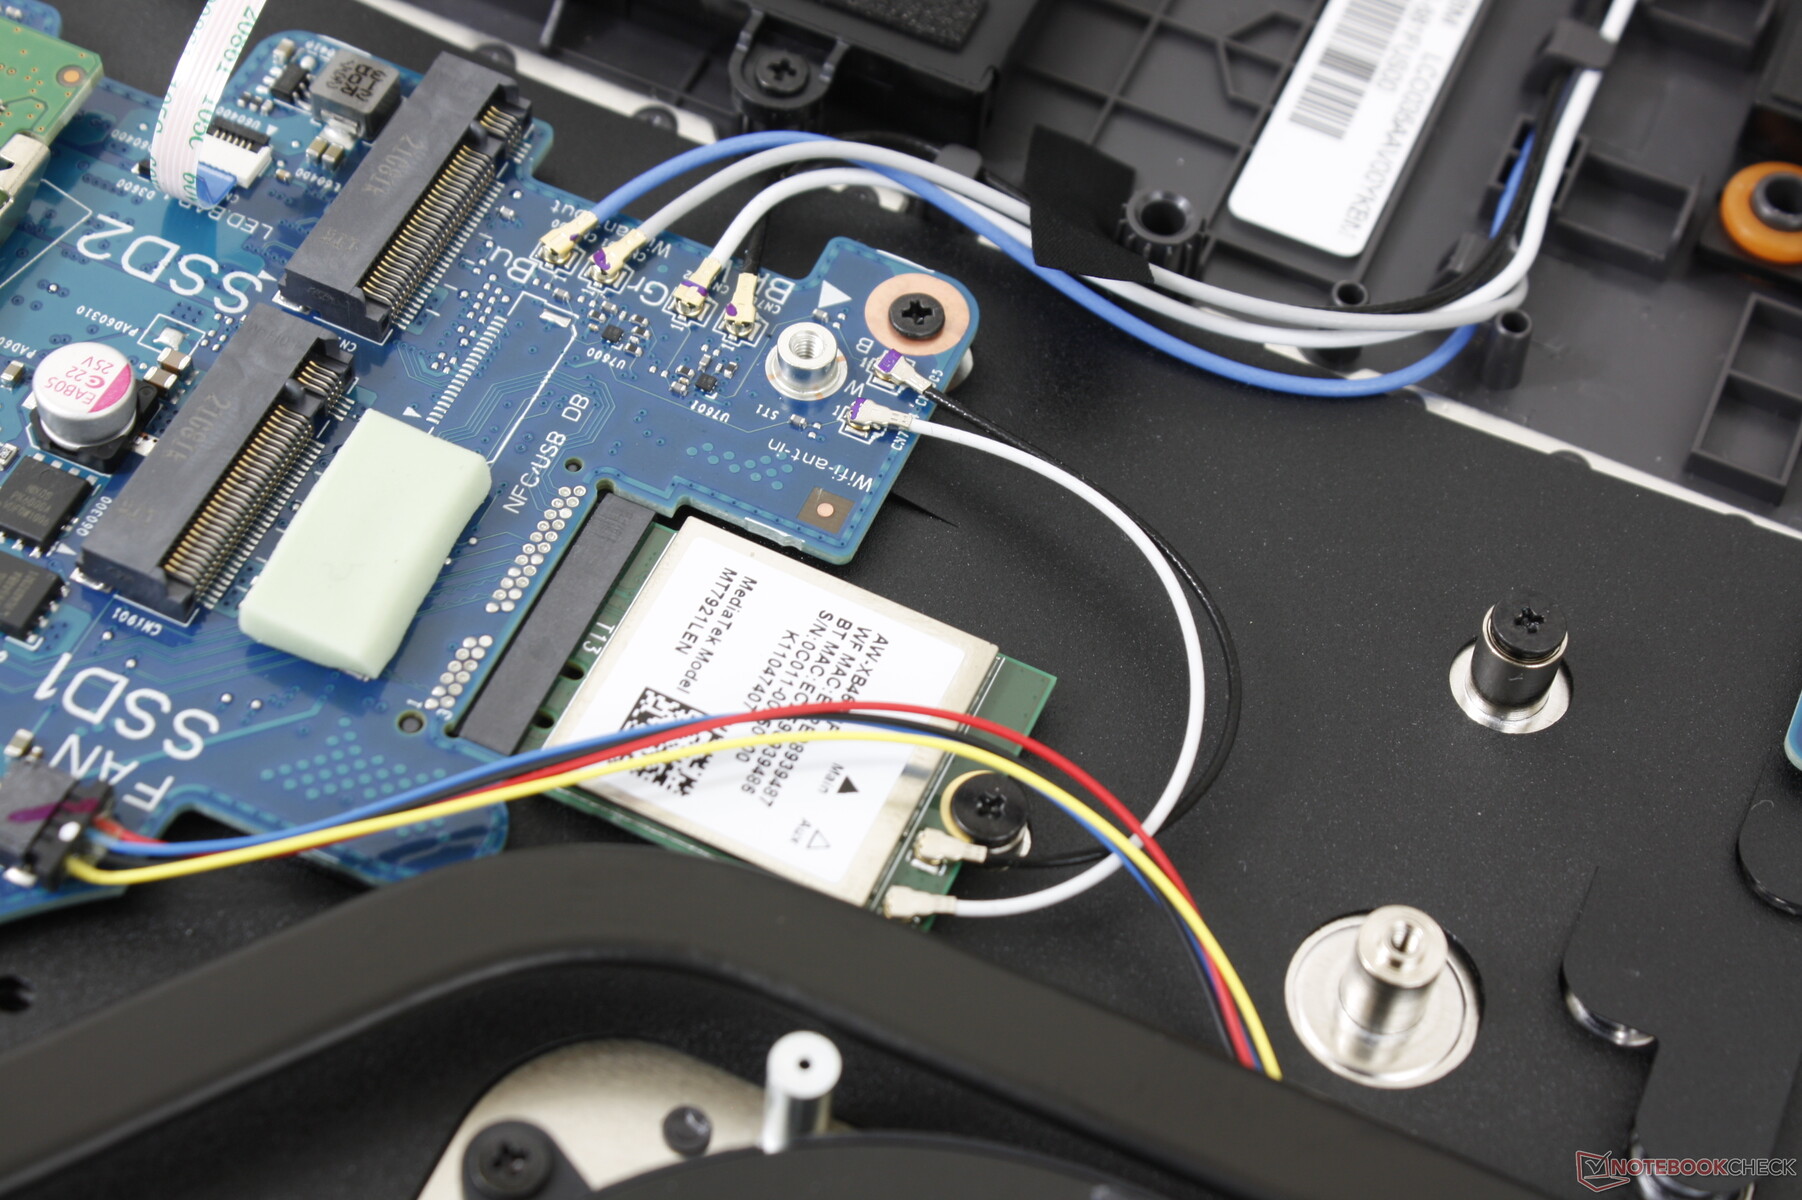
Comunicación
El MediaTek MT7921 con Wi-Fi 6 compite con la serie Intel AX200/201, más común. Aunque es fiable en términos de navegación y streaming de vídeo, su rendimiento no es tan rápido como el de la solución de Intel, que alcanza regularmente más de 1 Gbps.
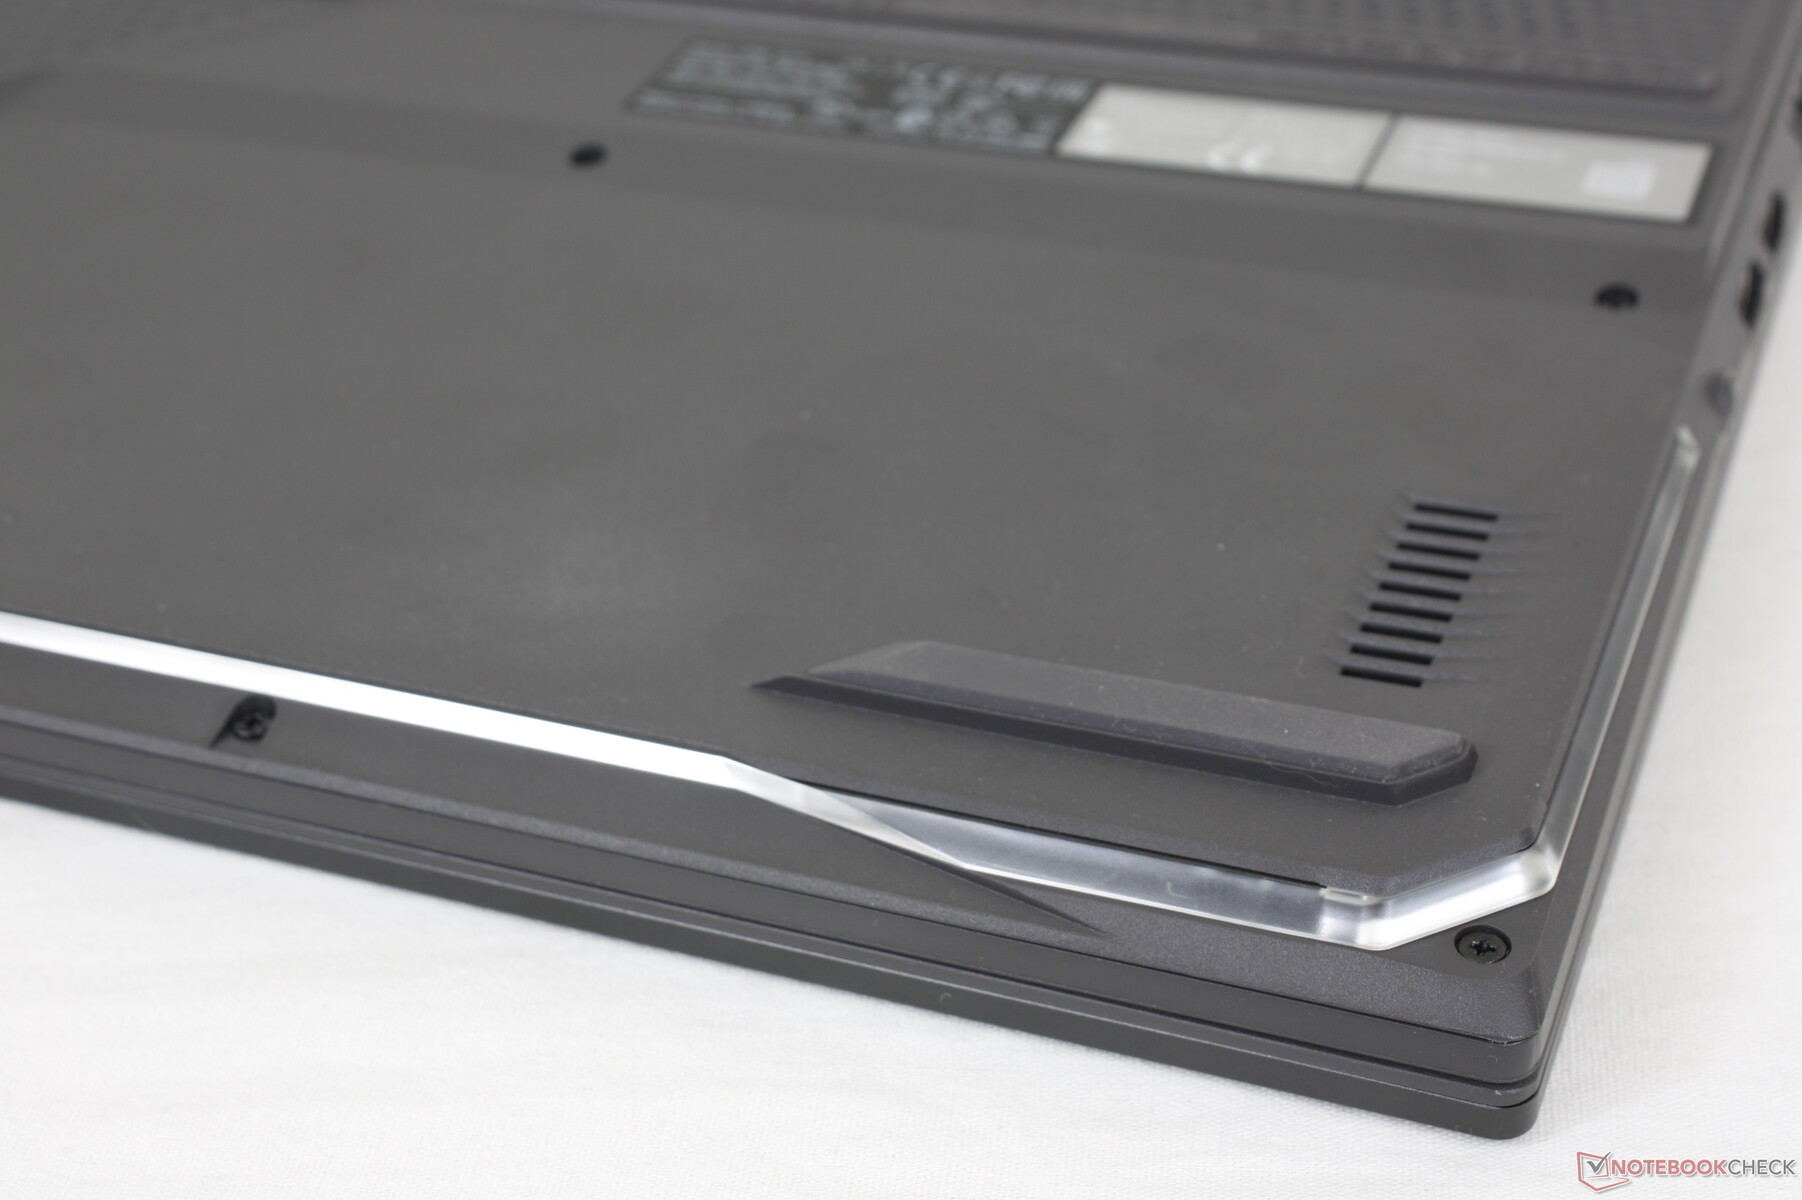
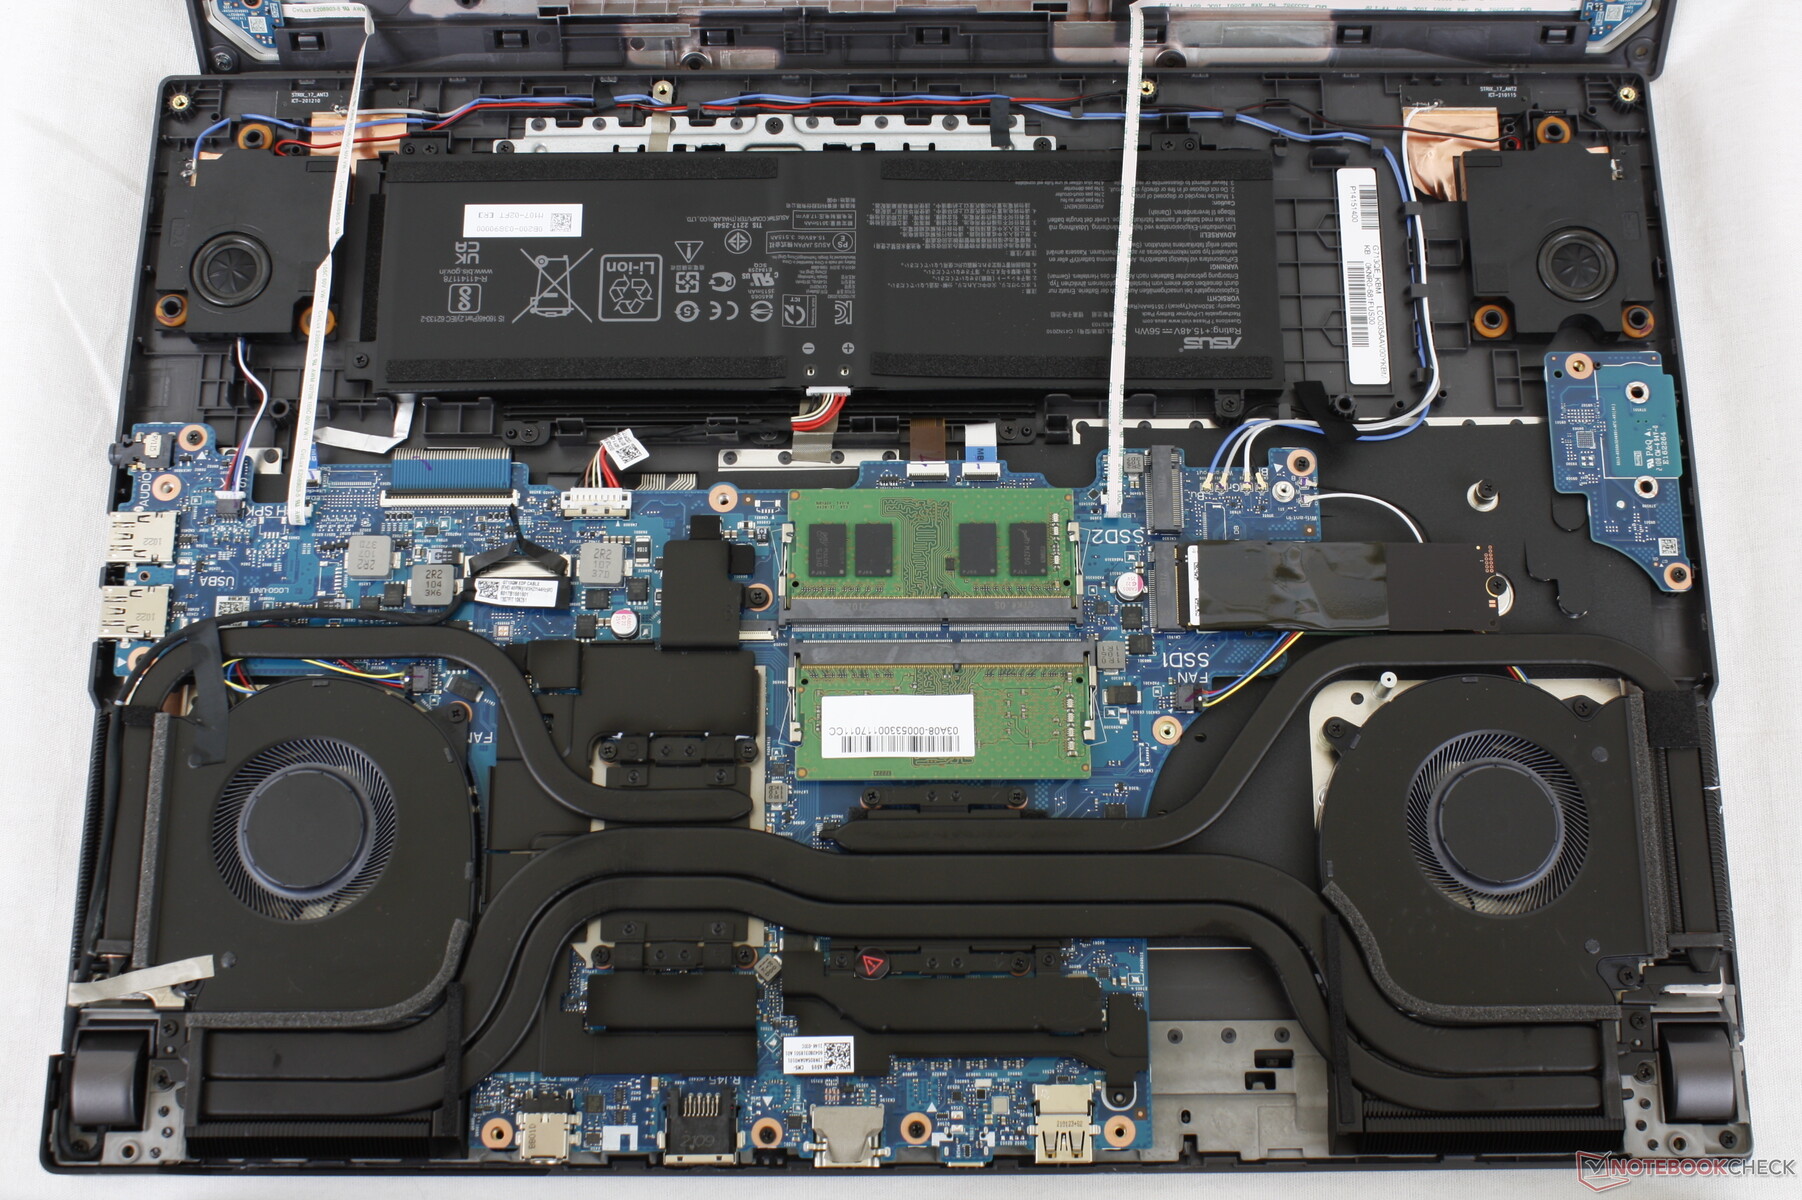
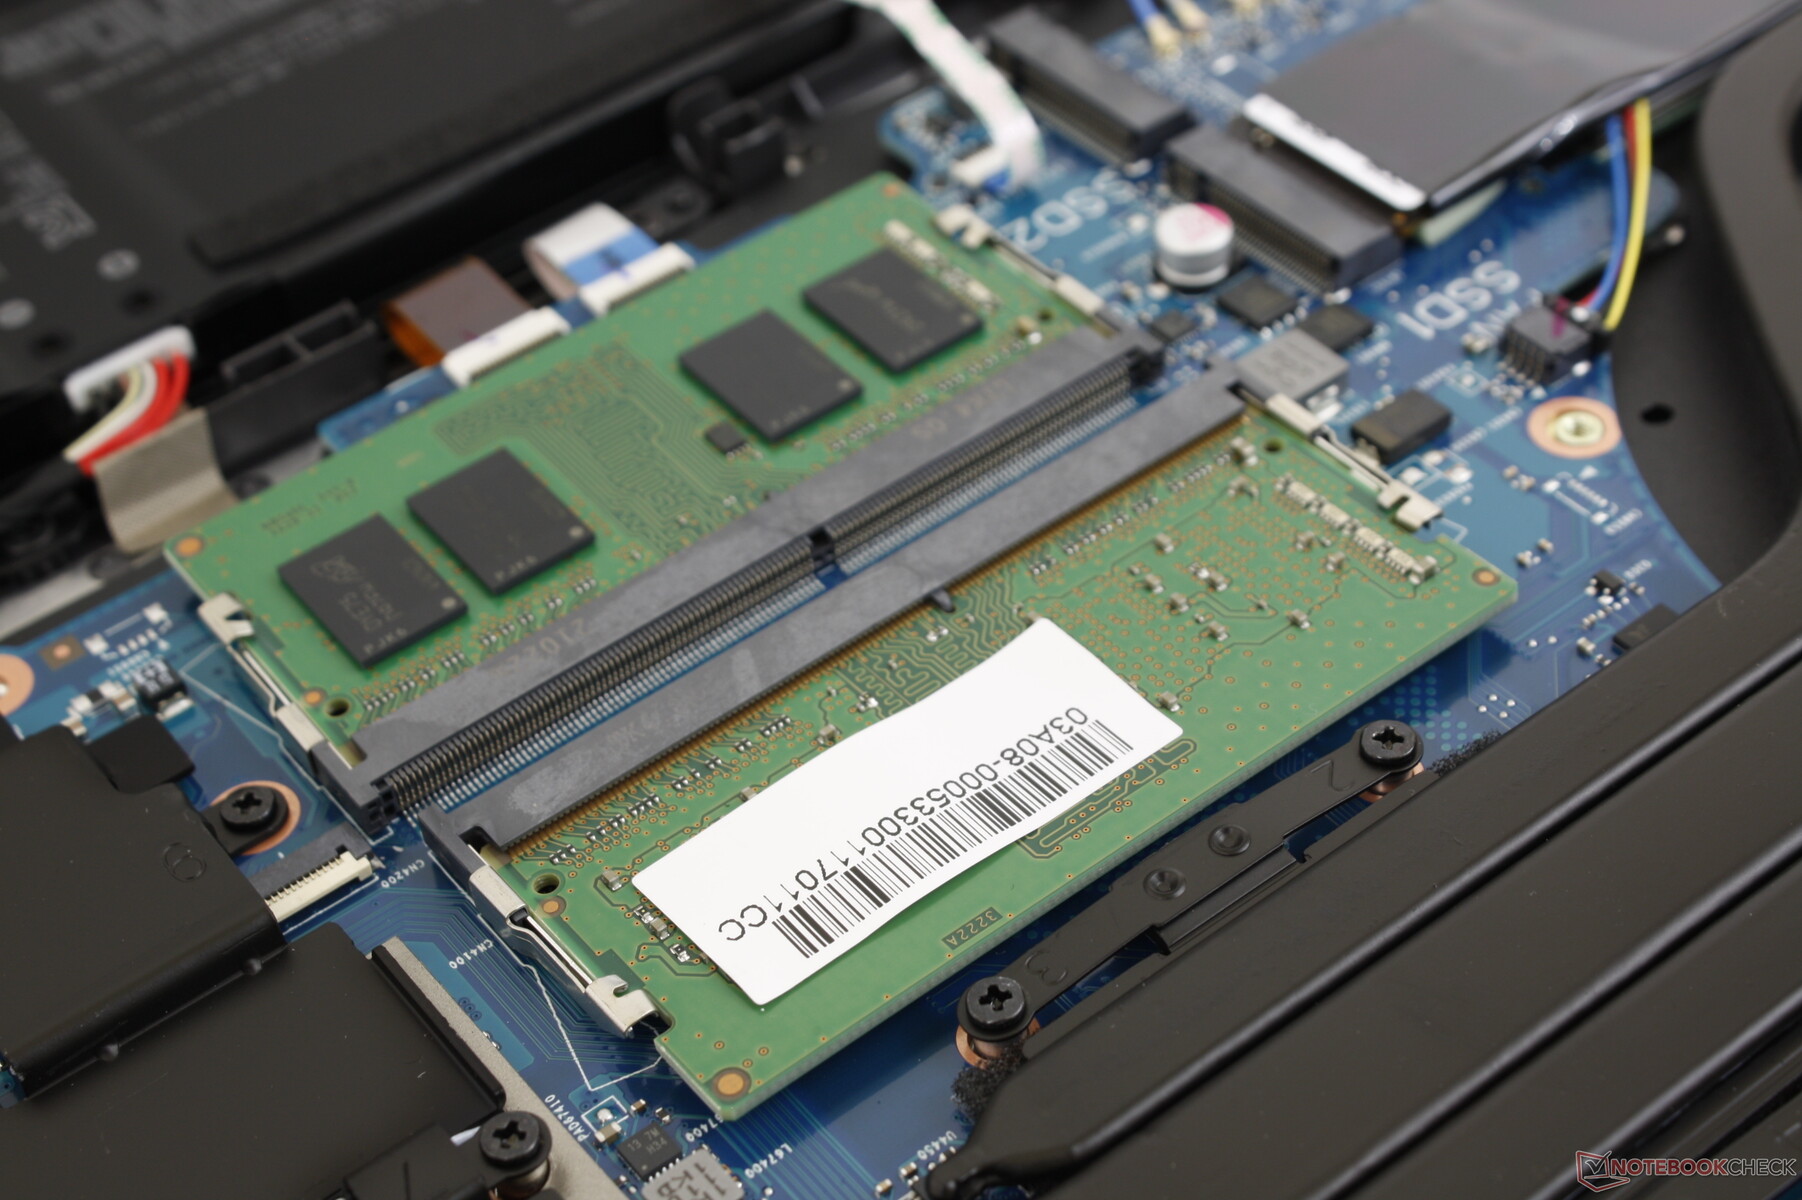
Mantenimiento - Actualizaciones sencillas
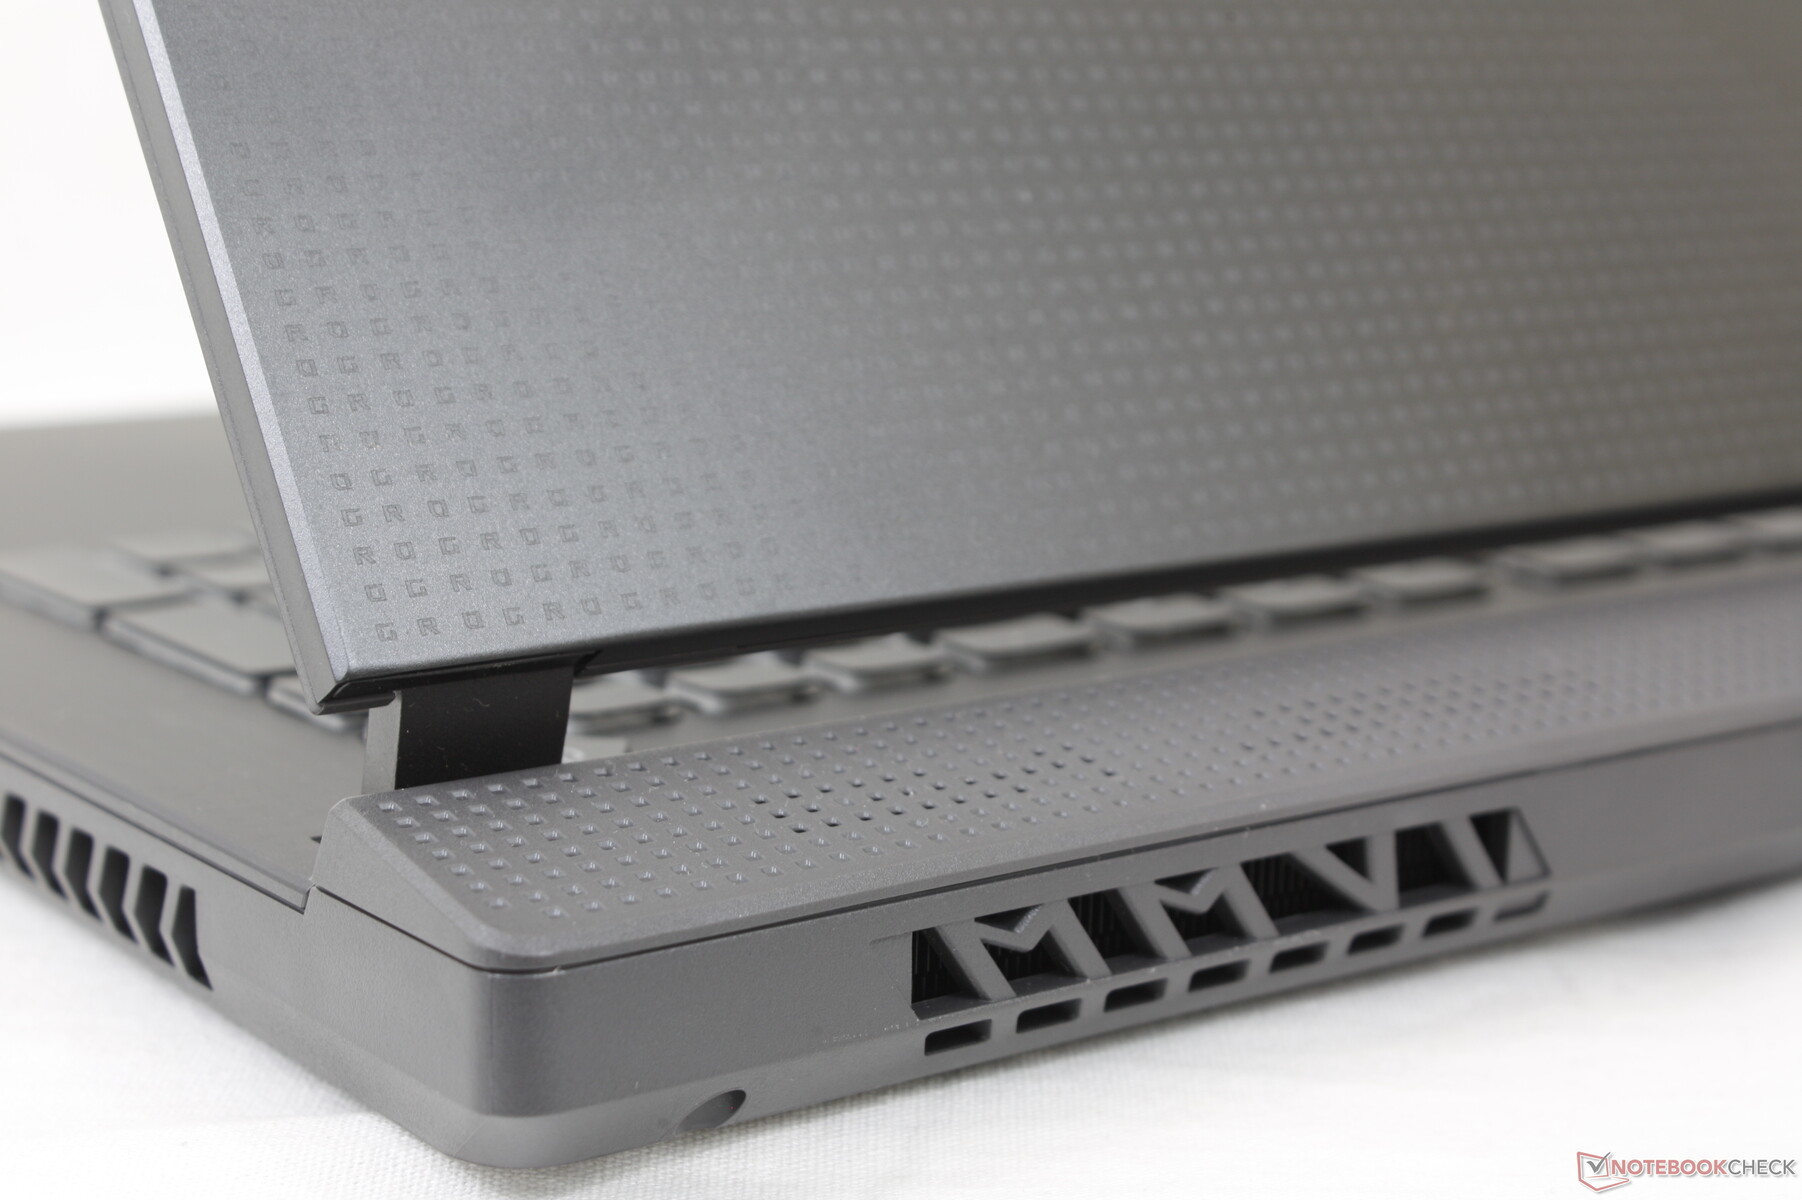
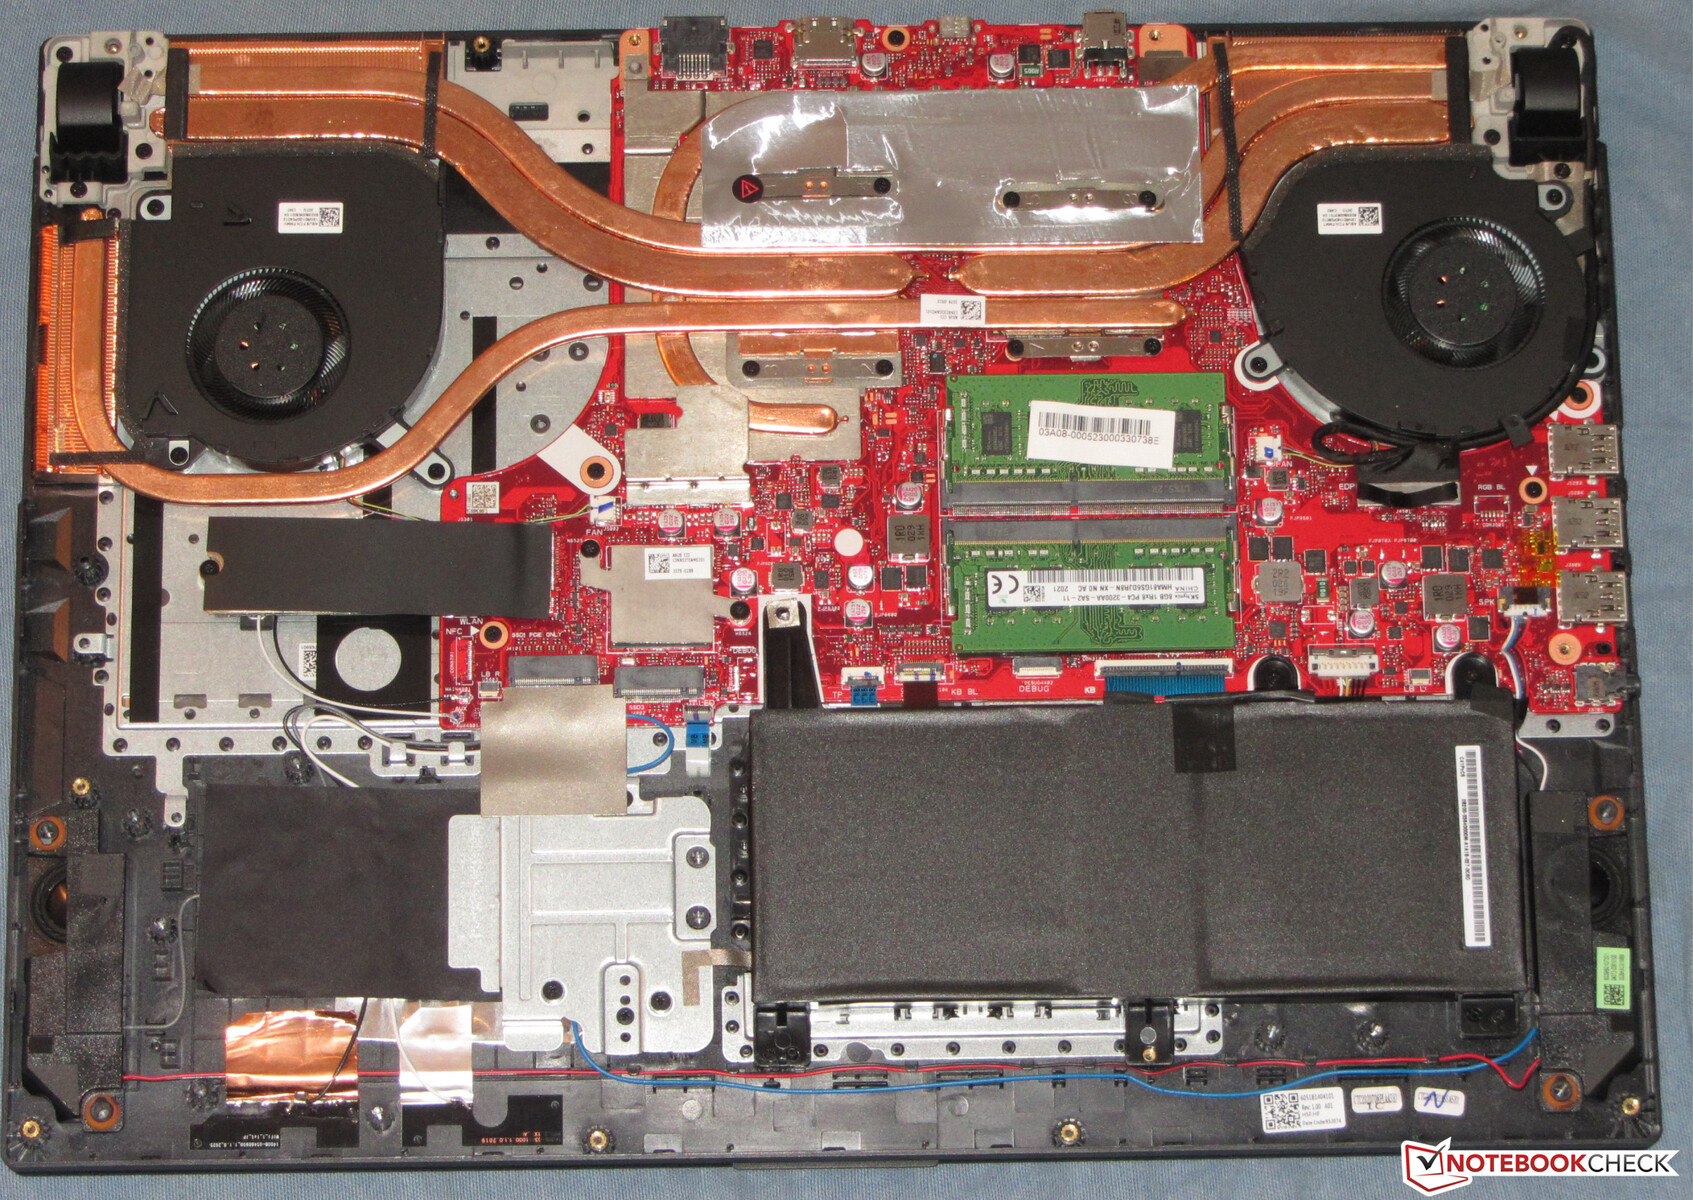
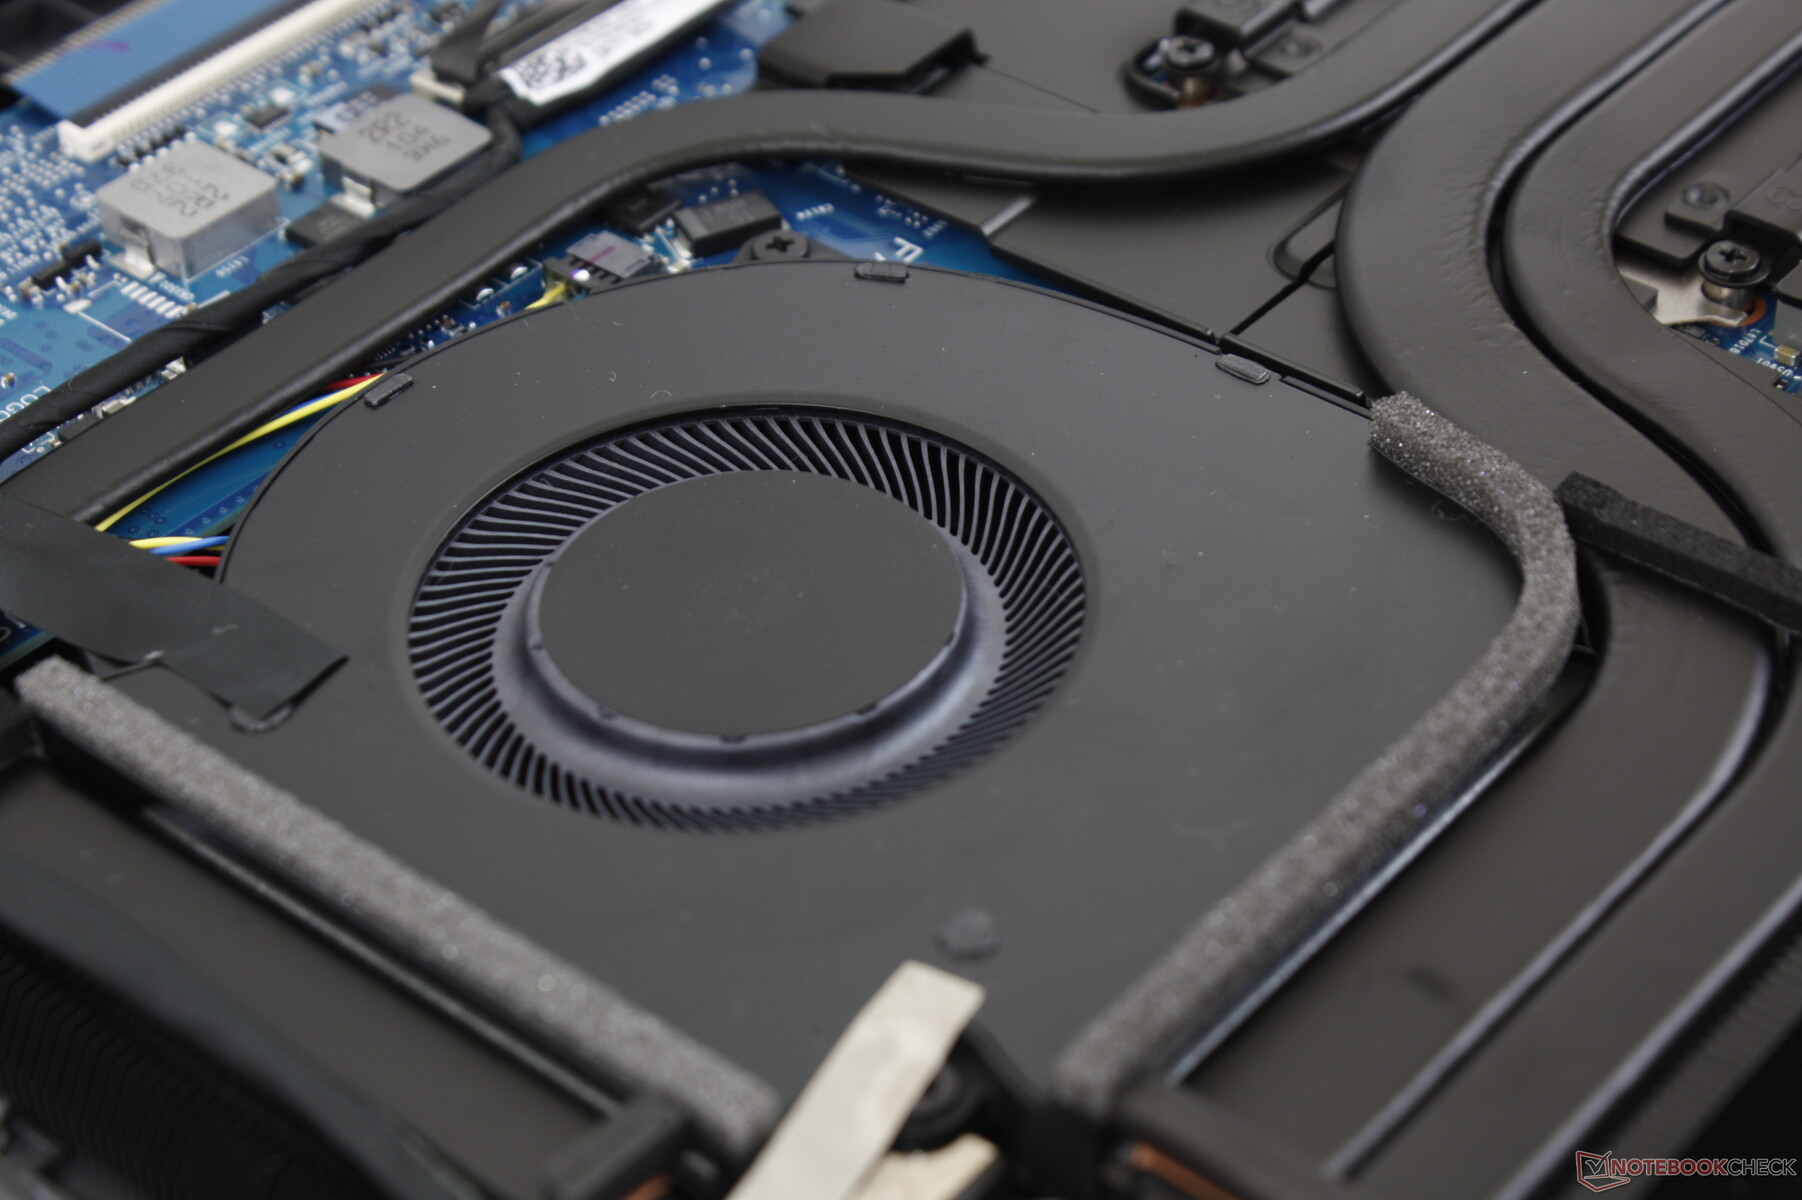
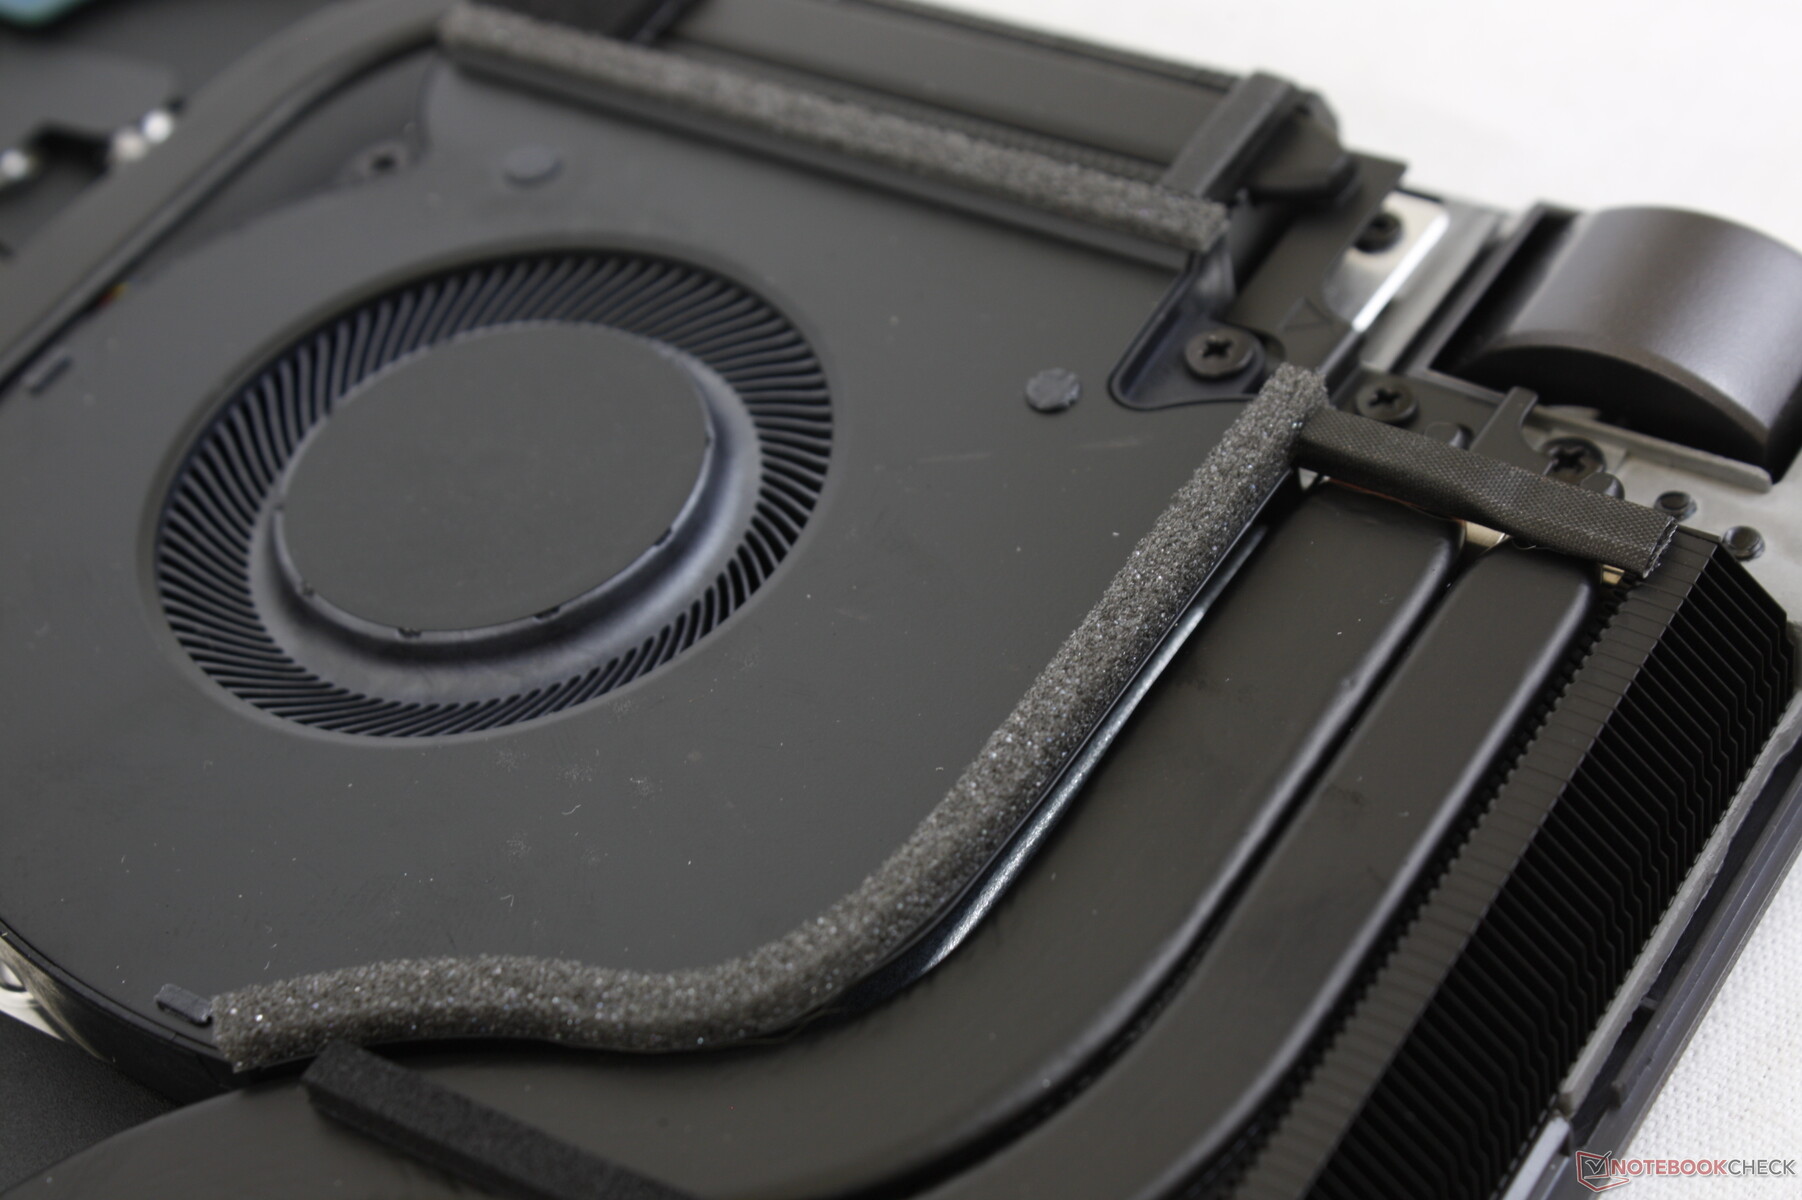
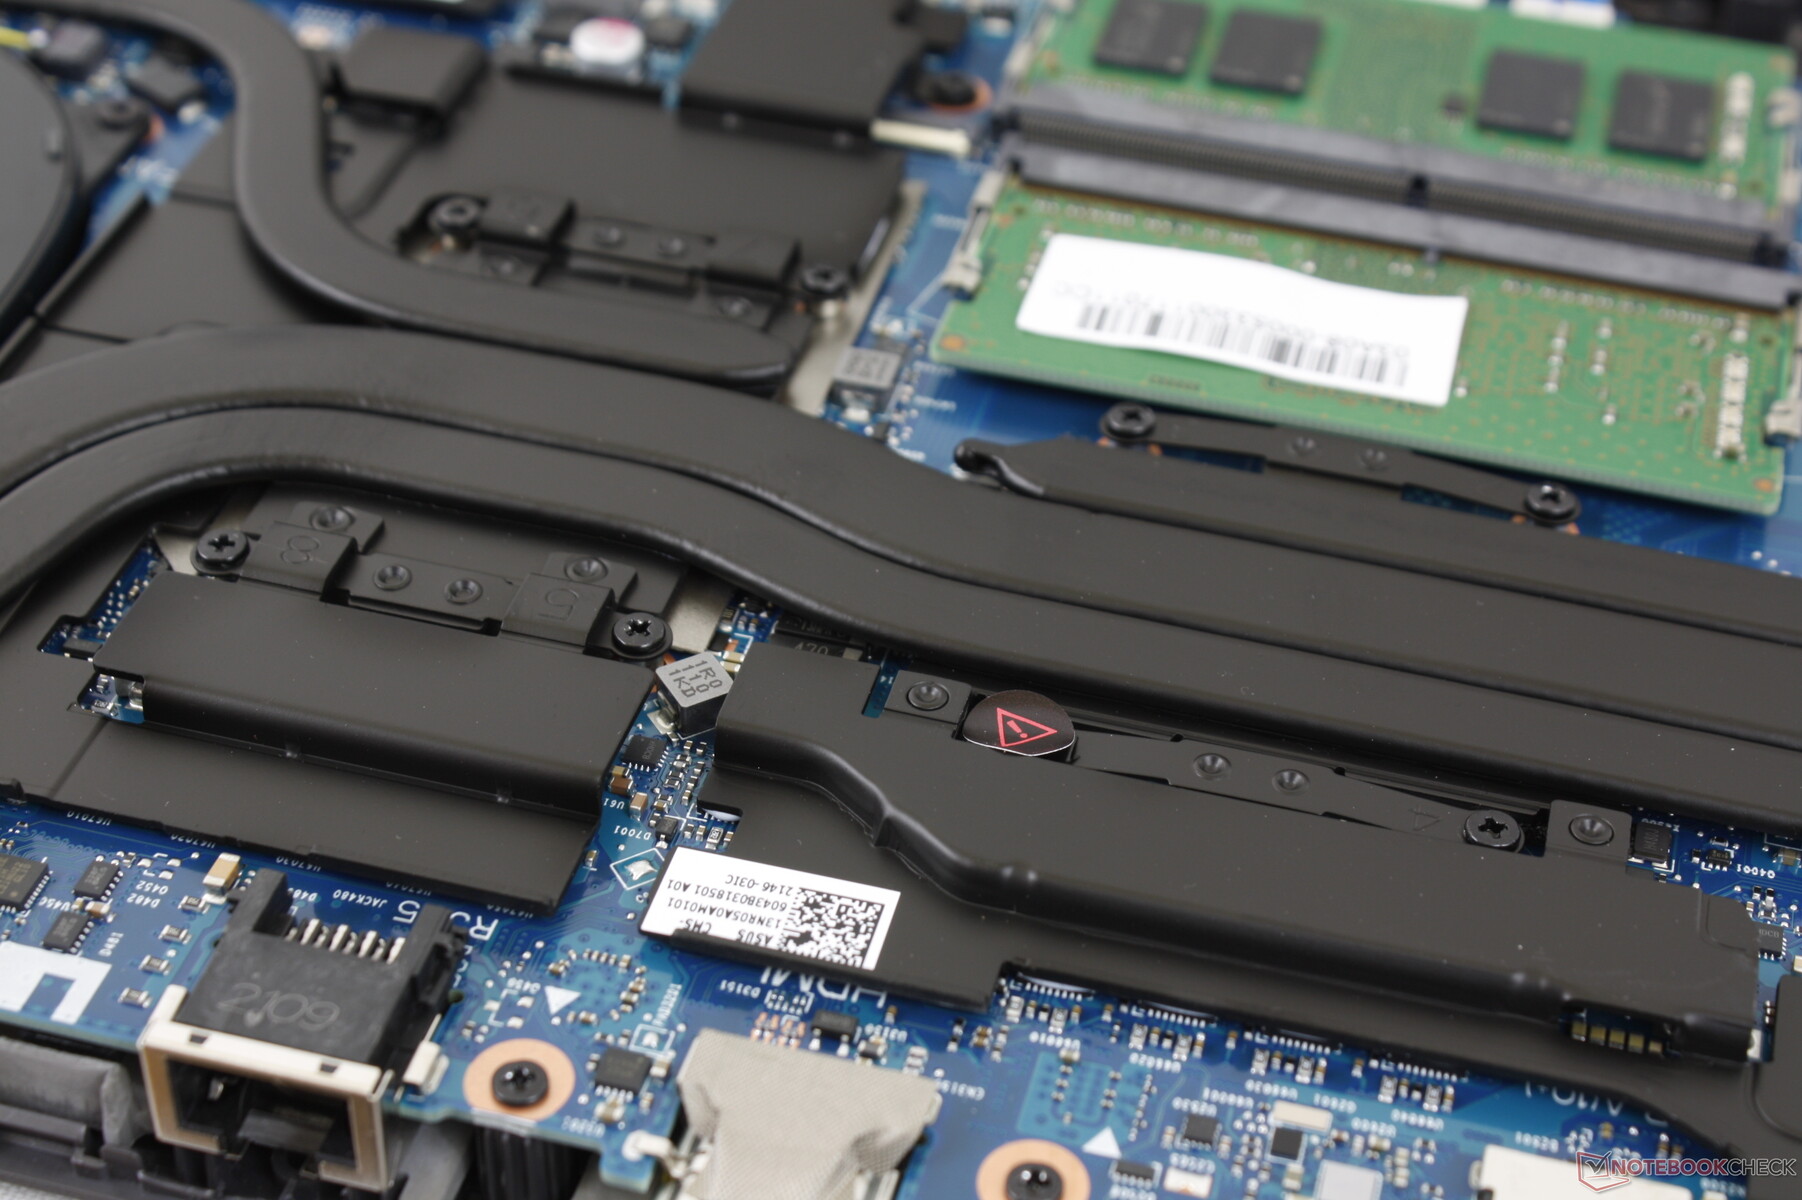
El panel inferior está fuertemente unido a la base, por lo que se necesita un borde afilado para desmontarlo. Internamente, el sistema difiere significativamente del G712 en cuanto a la batería, los altavoces y el tamaño de la solución de refrigeración.
Asegúrese de no dañar las dos frágiles cintas que conectan el panel inferior con la placa base. Estas cintas no están presentes en la mayoría de los otros portátiles, ya que el G713 tiene LEDs personalizables a lo largo del borde frontal.
Accesorios y garantía
No hay extras en la caja, aparte del adaptador de CA y la documentación. Se aplica la habitual garantía limitada de un año del fabricante.
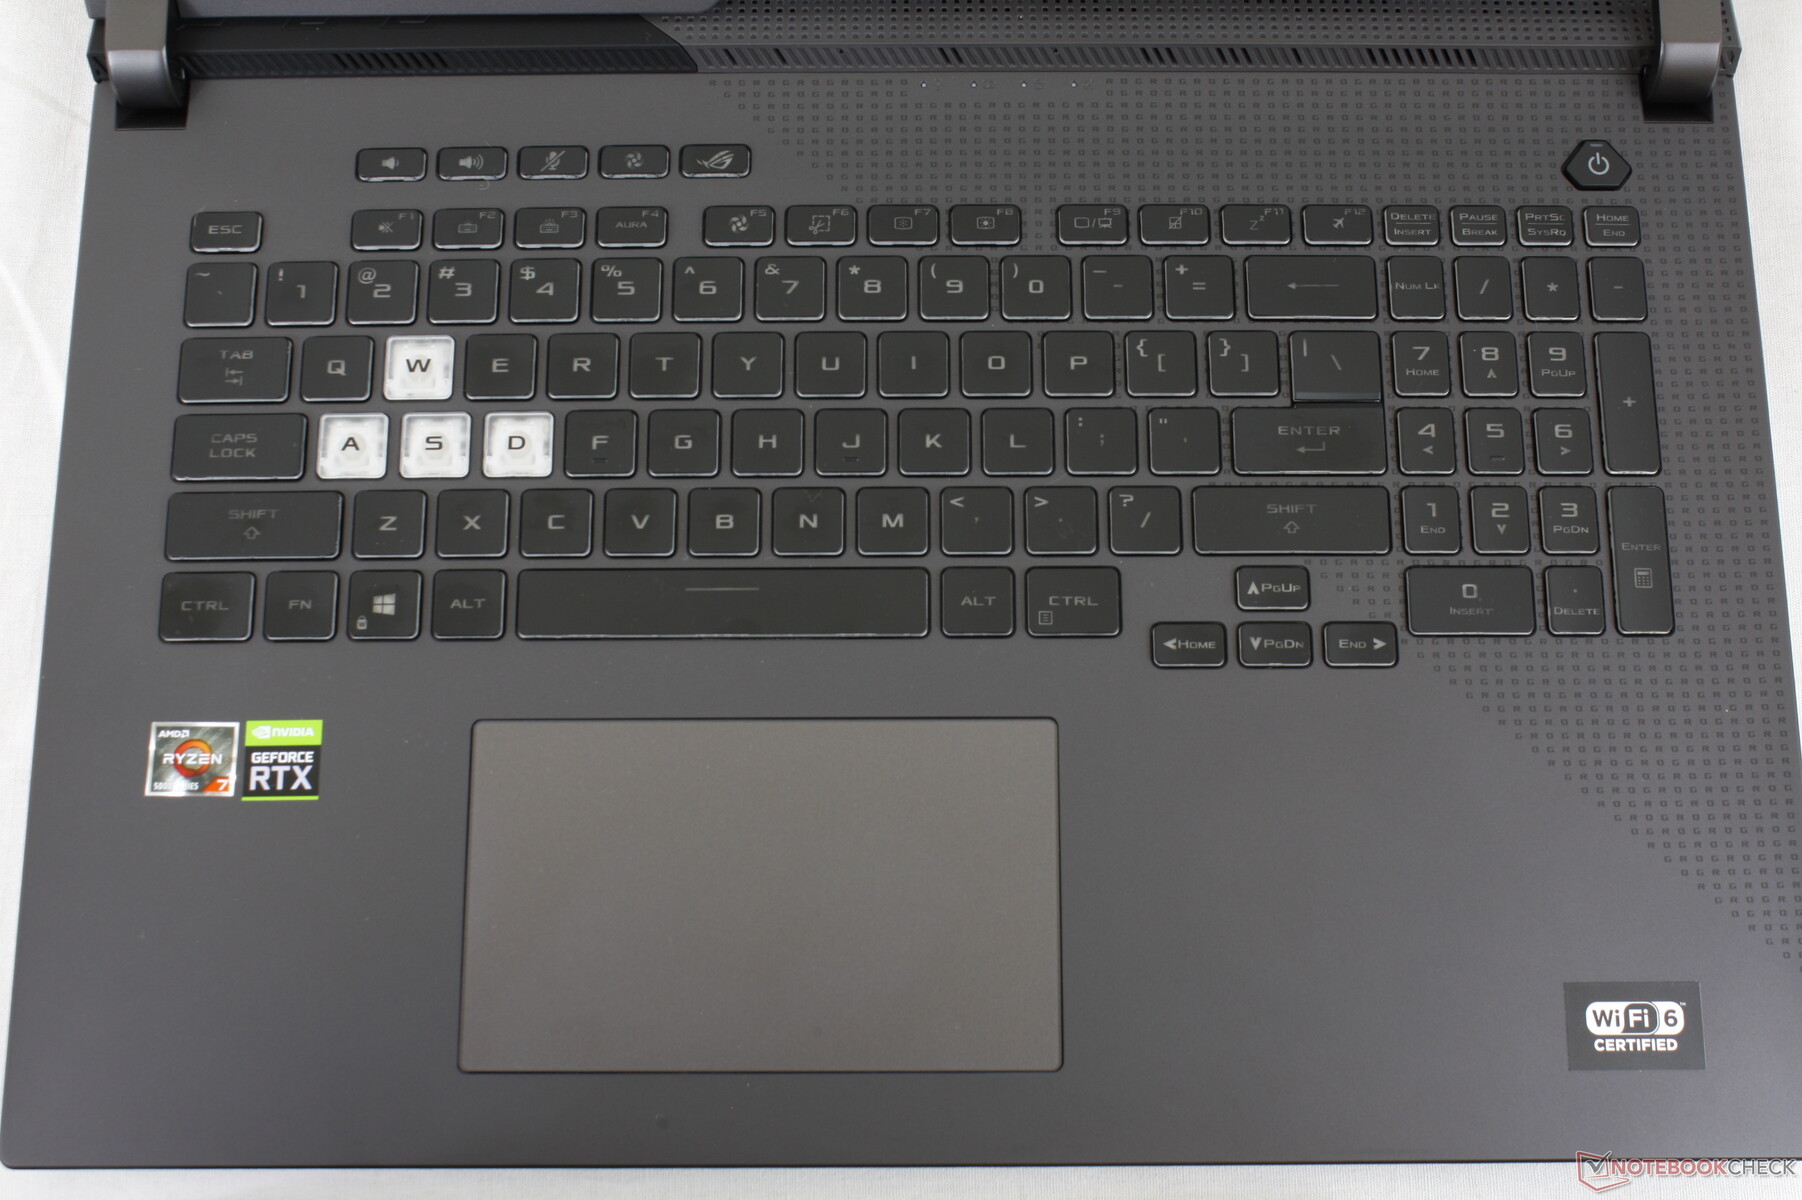
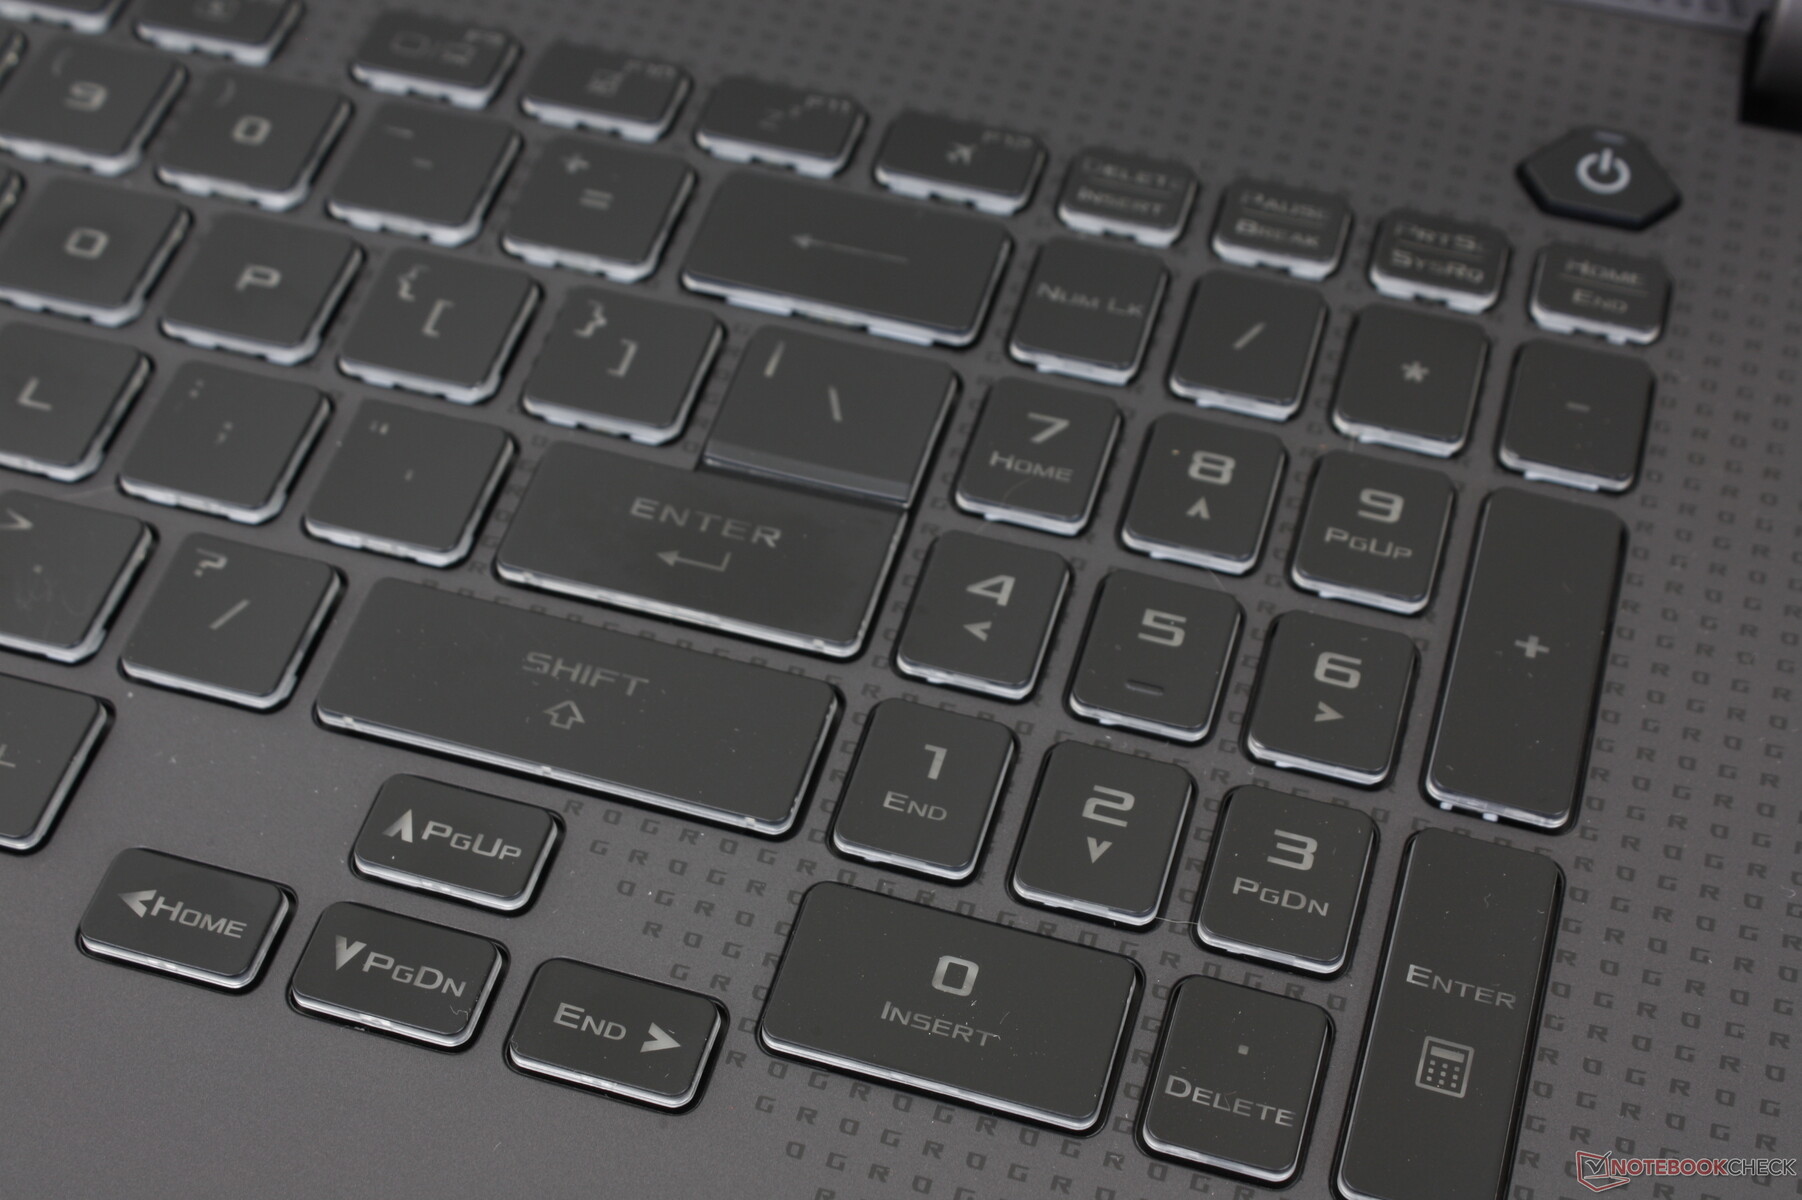
Dispositivos de entrada - Alto y clicado
Teclado
Salvo los modelos más recientes con interruptores mecánicos, la experiencia de tecleo en la mayoría de los portátiles ROG Strix es casi idéntica ya que todos utilizan diseños de chasis similares. Las teclas tienen una respuesta más profunda y satisfactoria que en un portátil Razer, pero con un ruido más fuerte que en el MSI Katana. El teclado numérico y las teclas de flecha siguen siendo más pequeños y estrechos que las teclas QWERTY principales
La iluminación RGB de cuatro zonas está disponible en la mayoría de los modelos, mientras que los modelos de gama alta tienen iluminación RGB por tecla.
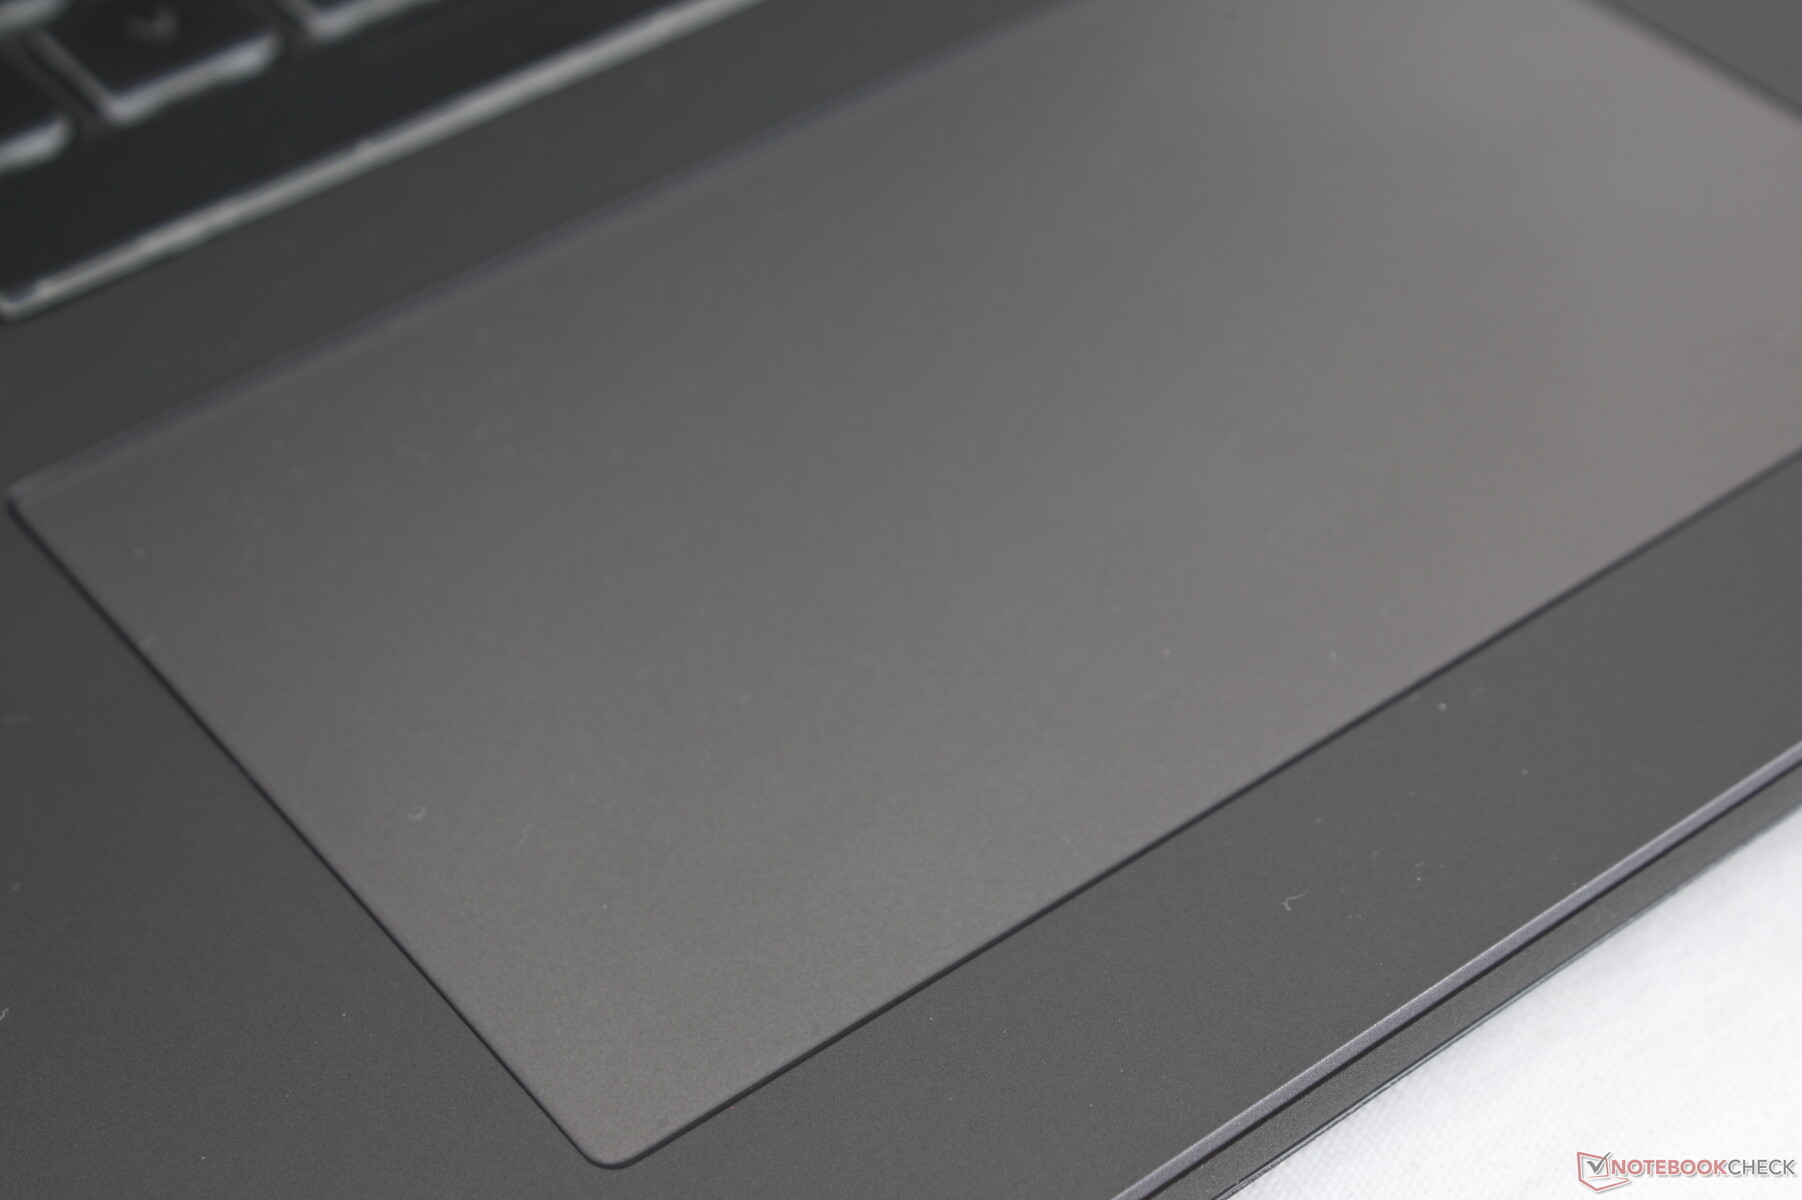
Panel táctil
El clickpad es más grande que el del G733 (13 x 7,7 cm frente a 10,8 x 6 cm) ya que Asus ha dejado de lado los botones dedicados del ratón en favor de una mayor superficie. El deslizamiento en el clickpad es suave y con muy poca adherencia a bajas velocidades. Mientras tanto, las teclas de clic integradas son fuertes y relativamente firmes para un clic satisfactorio cuando se presionan.

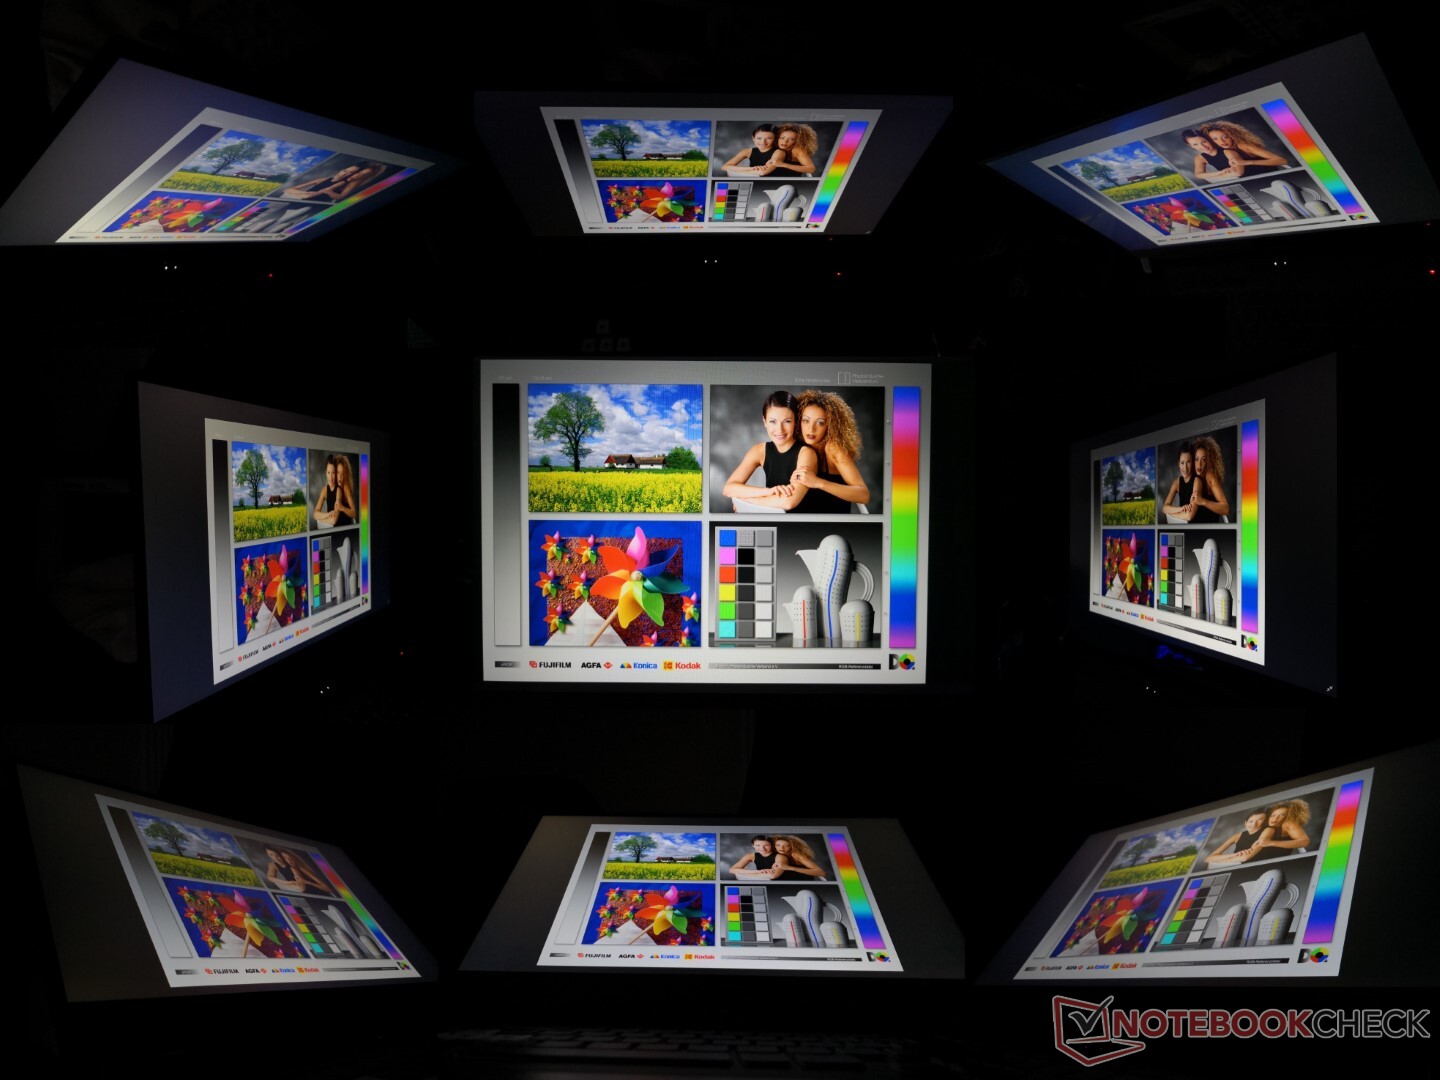
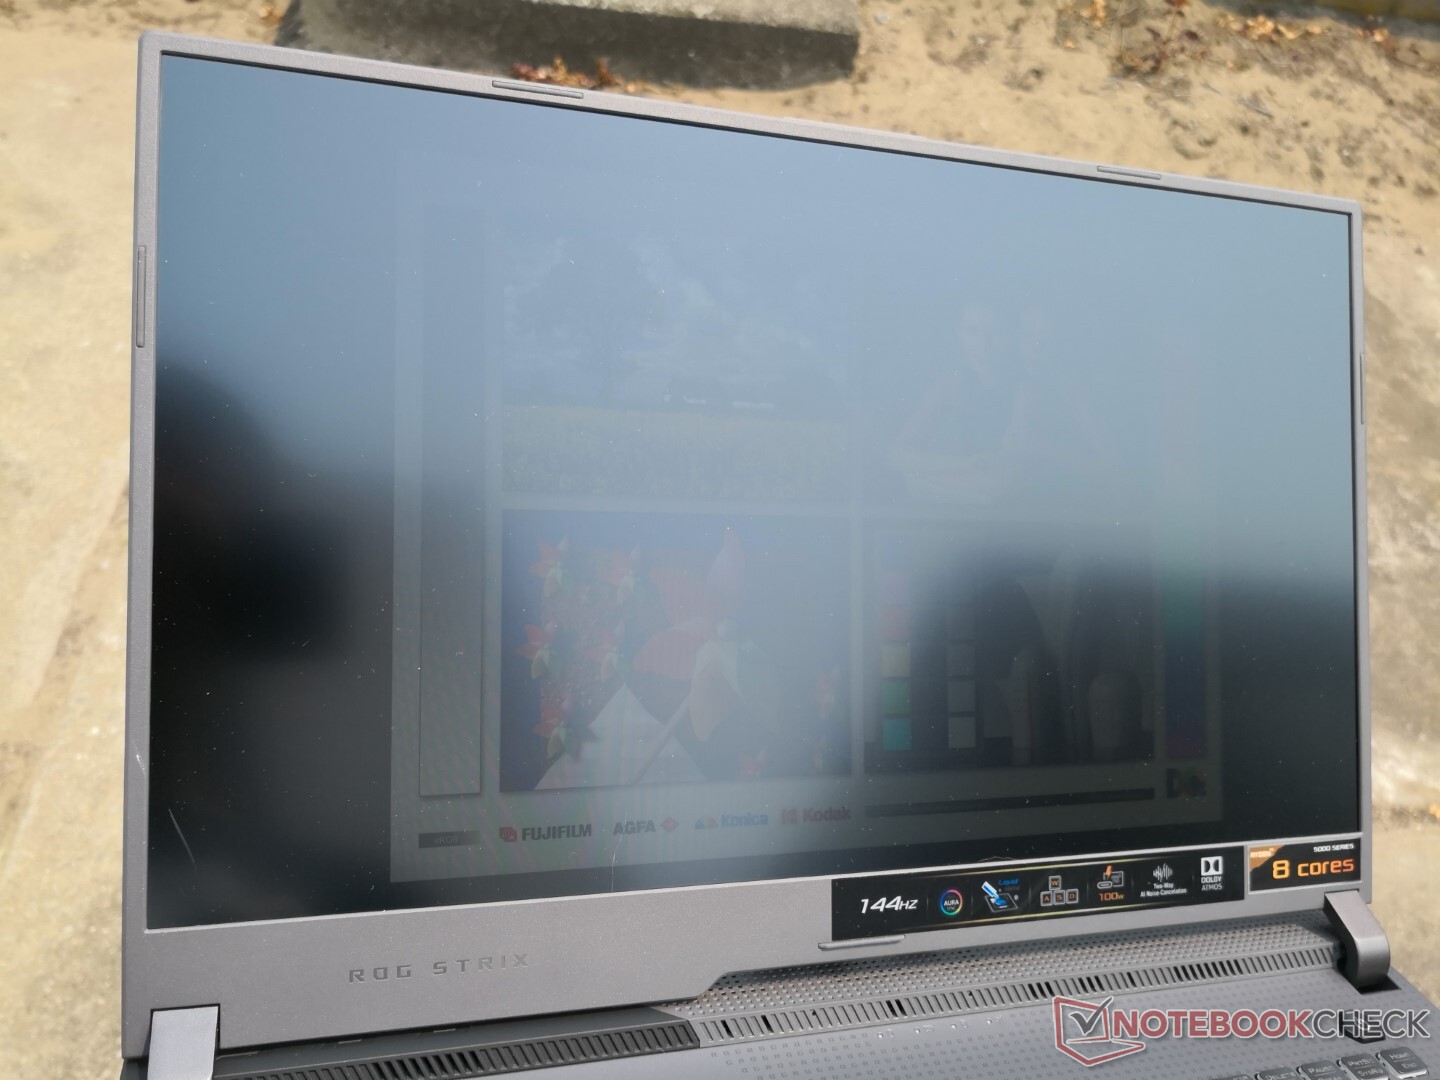
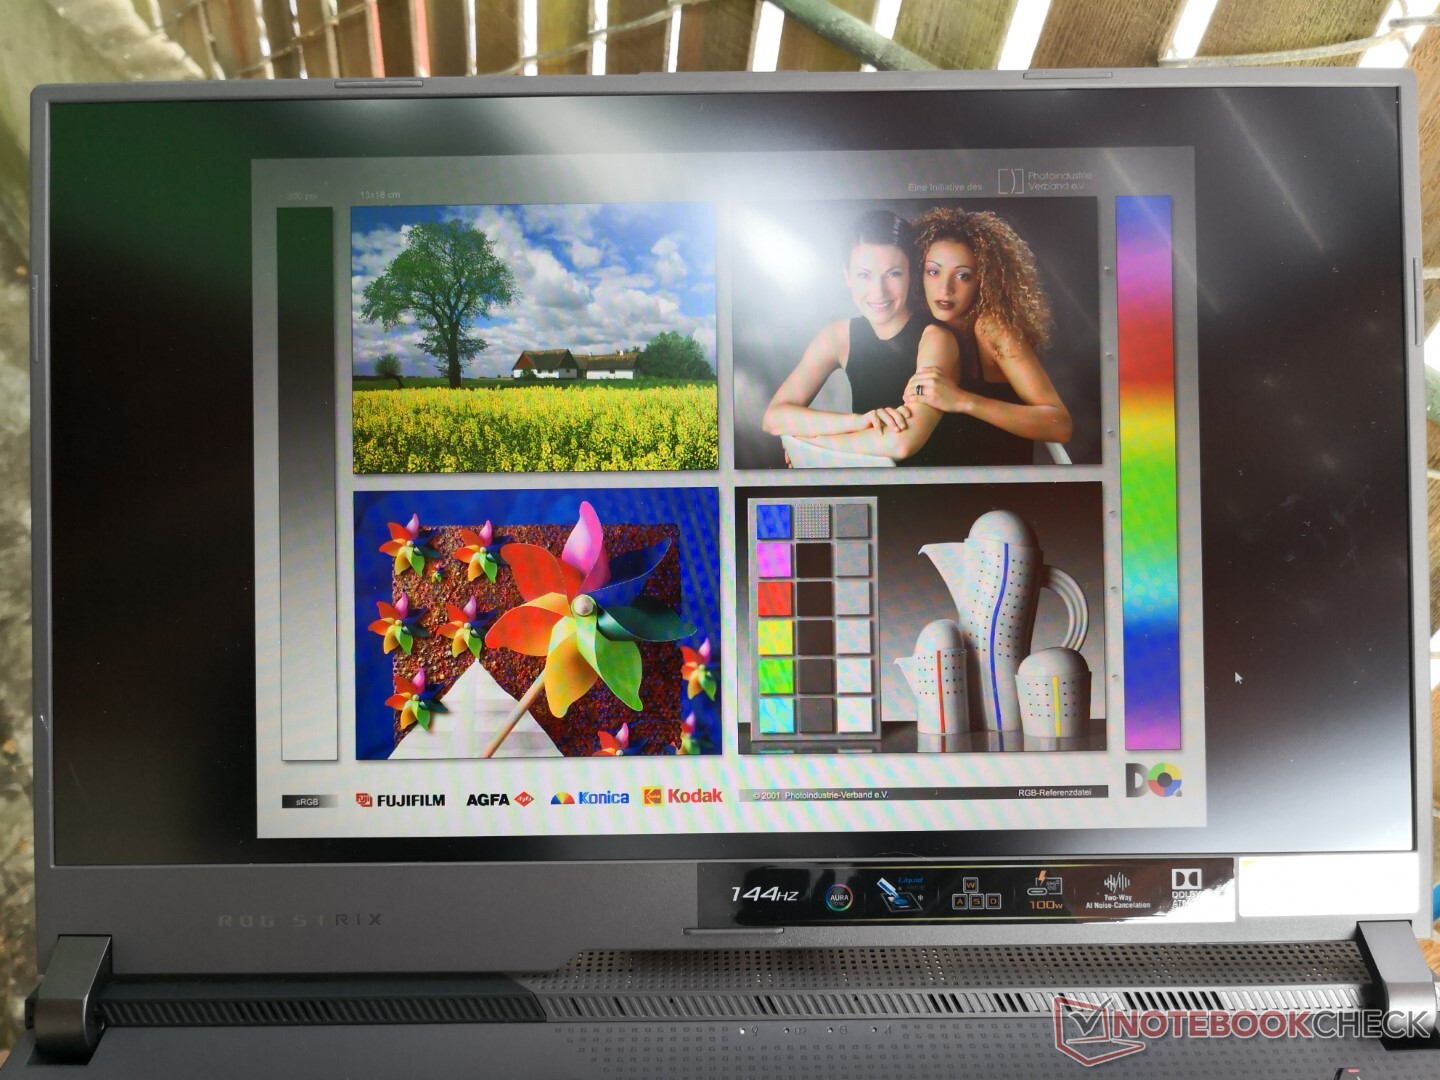
Pantalla - Alta tasa de refresco, colores poco intensos
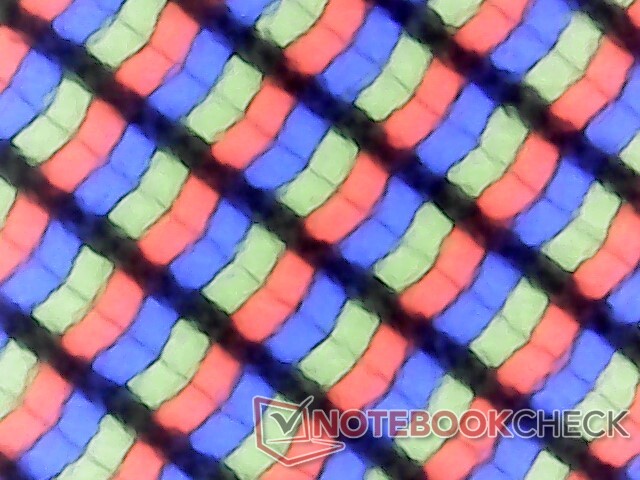
Nuestra configuración Asus utiliza el mismo panel IPS AU Optronics B173HAN04.9 que se encuentra en el competidor MSI Katana para que las características sean similares entre ellos. Este panel 1080p destaca por su tasa de refresco nativa de 144 Hz y su soporte FreeSync, pero se queda un poco corto en los tiempos de respuesta y la precisión del color.
Asus ofrece al menos otras dos opciones de panel (1080p 300 Hz y 1440p 165 Hz), cada una de ellas con características diferentes a nuestra unidad 1080p 144 Hz, incluyendo tiempos de respuesta más rápidos y/o colores más profundos. Por lo tanto, nuestras mediciones a continuación reflejan sólo la opción 1080p 144 Hz.
| |||||||||||||||||||||||||
iluminación: 92 %
Brillo con batería: 270.5 cd/m²
Contraste: 1424:1 (Negro: 0.19 cd/m²)
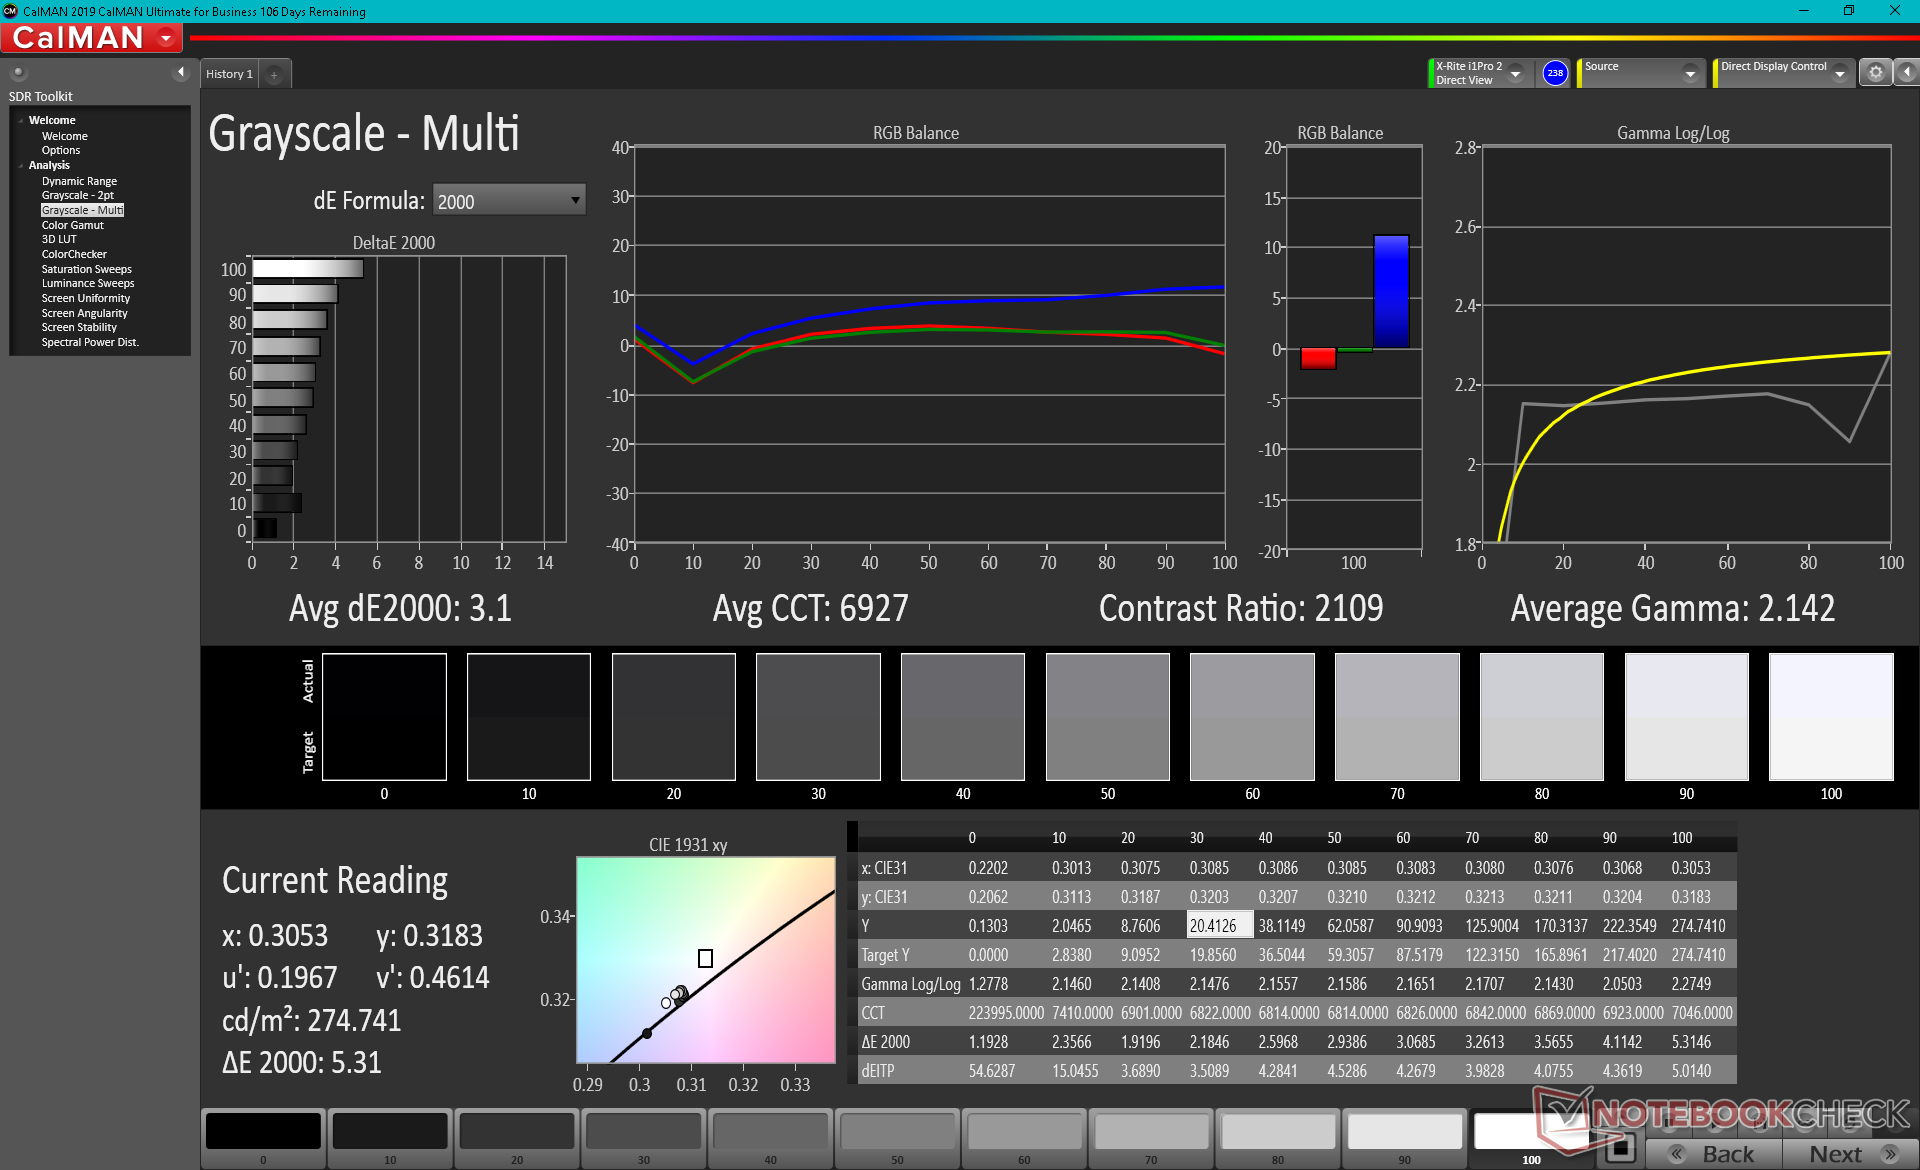
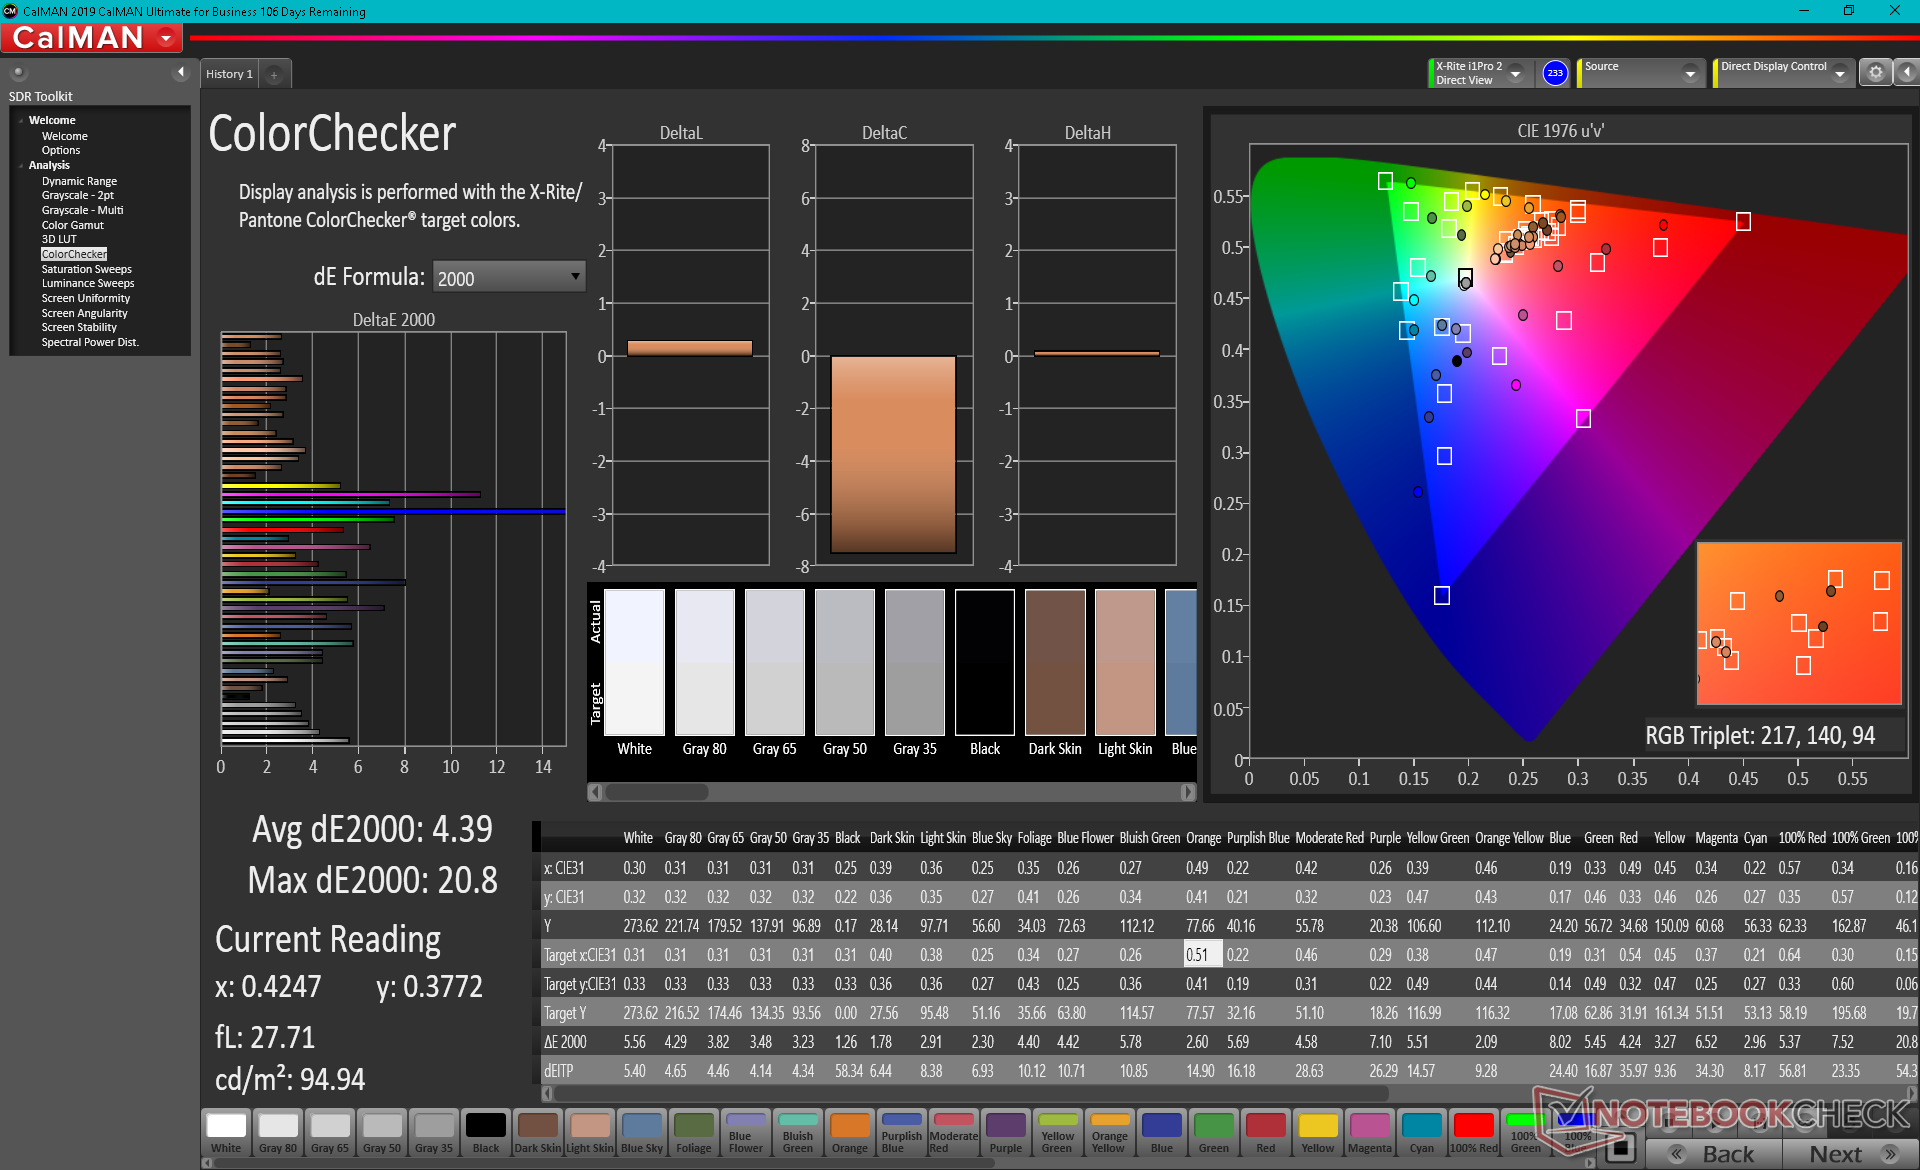
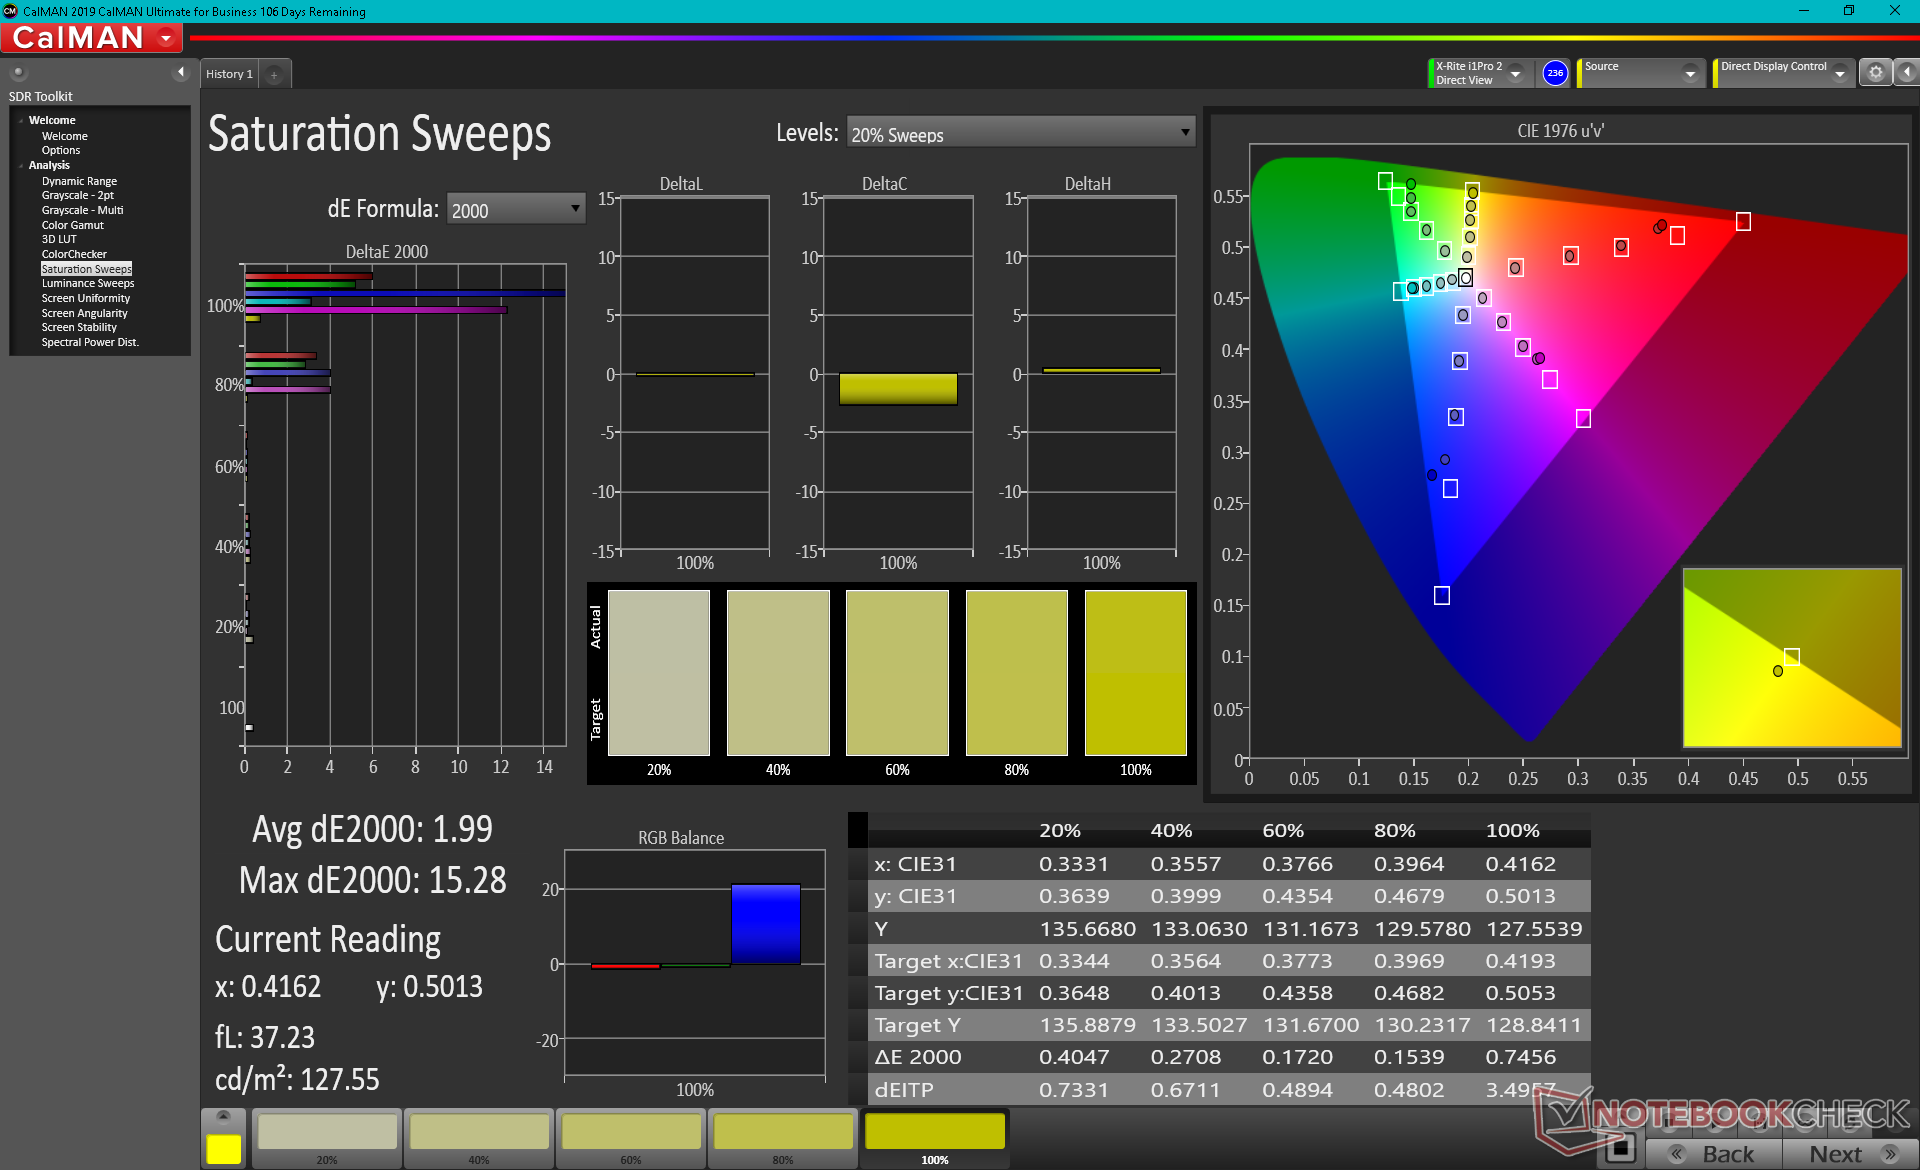
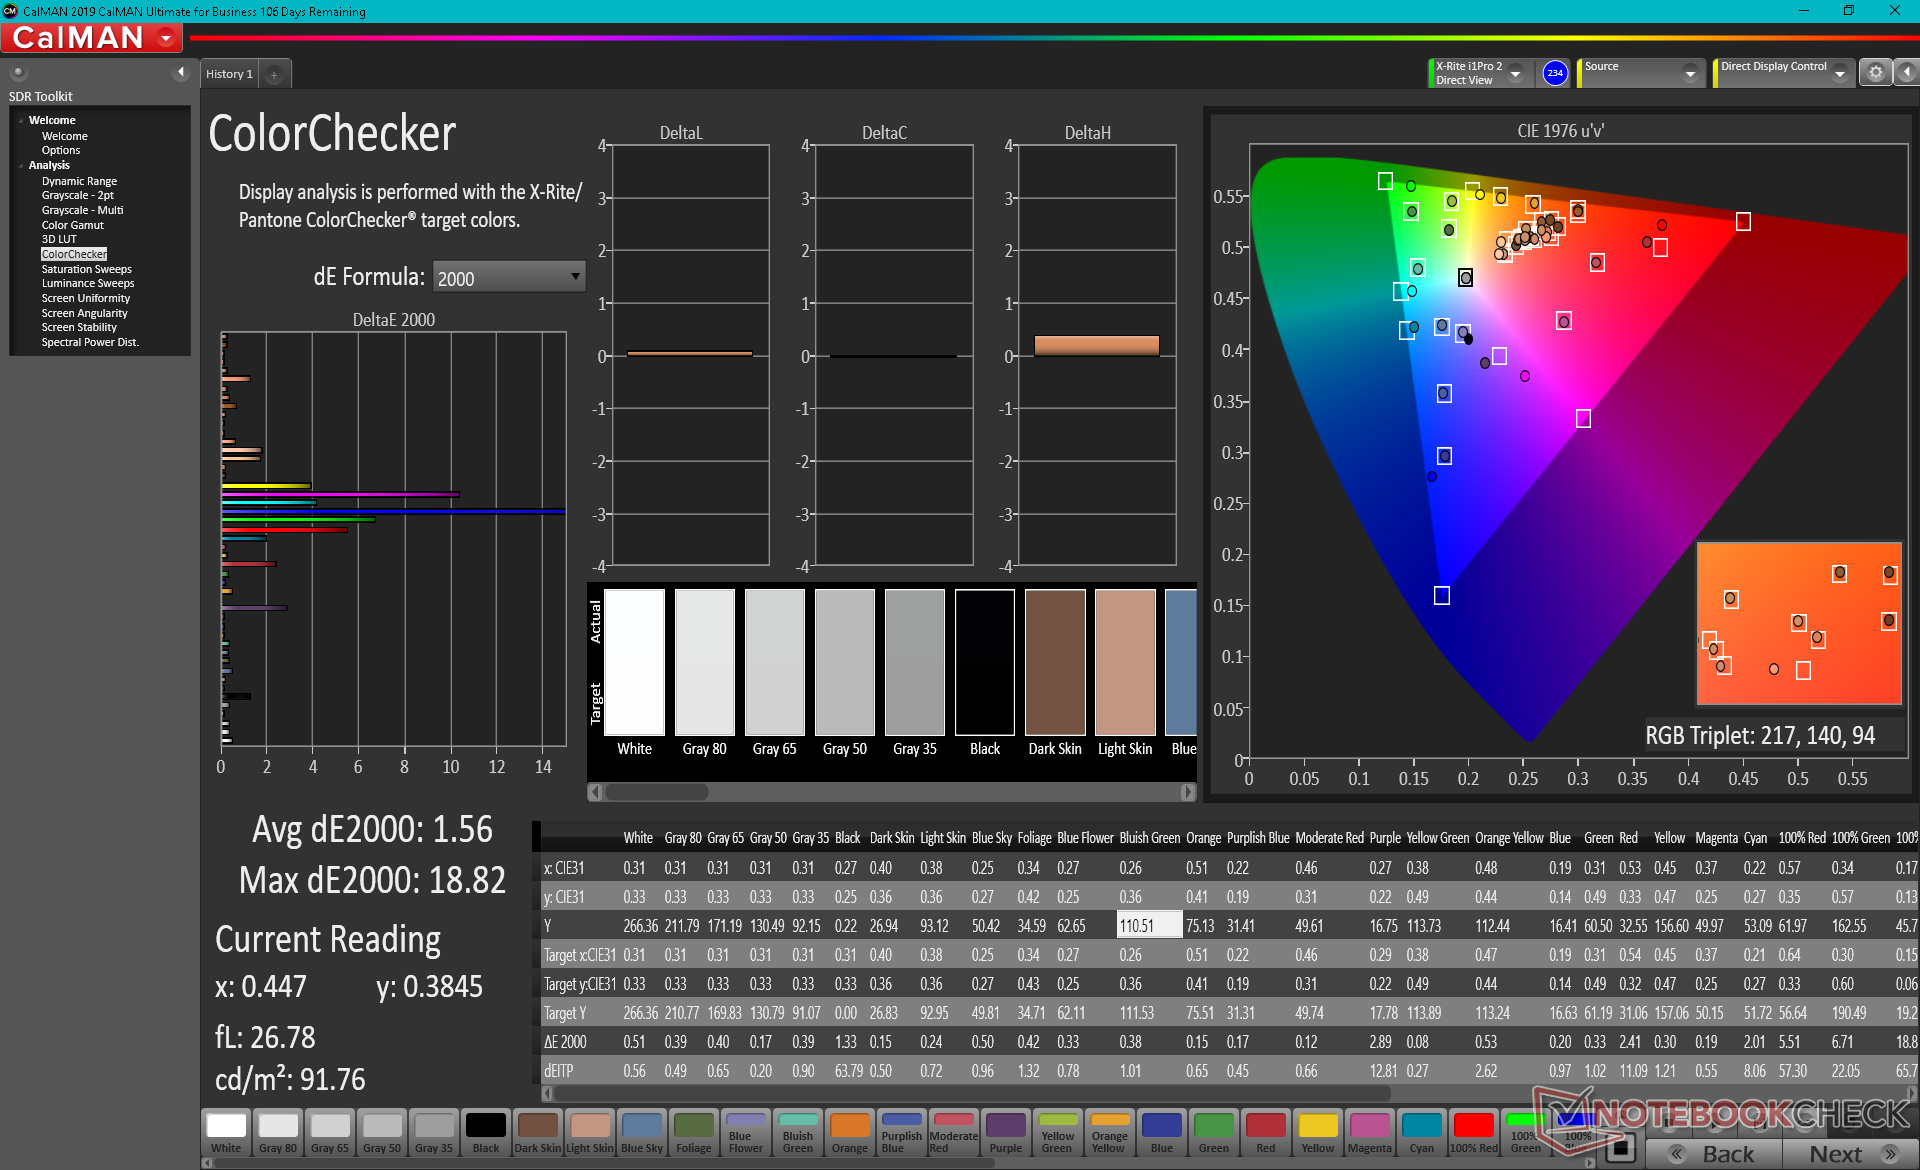
ΔE ColorChecker Calman: 4.39 | ∀{0.5-29.43 Ø4.73}
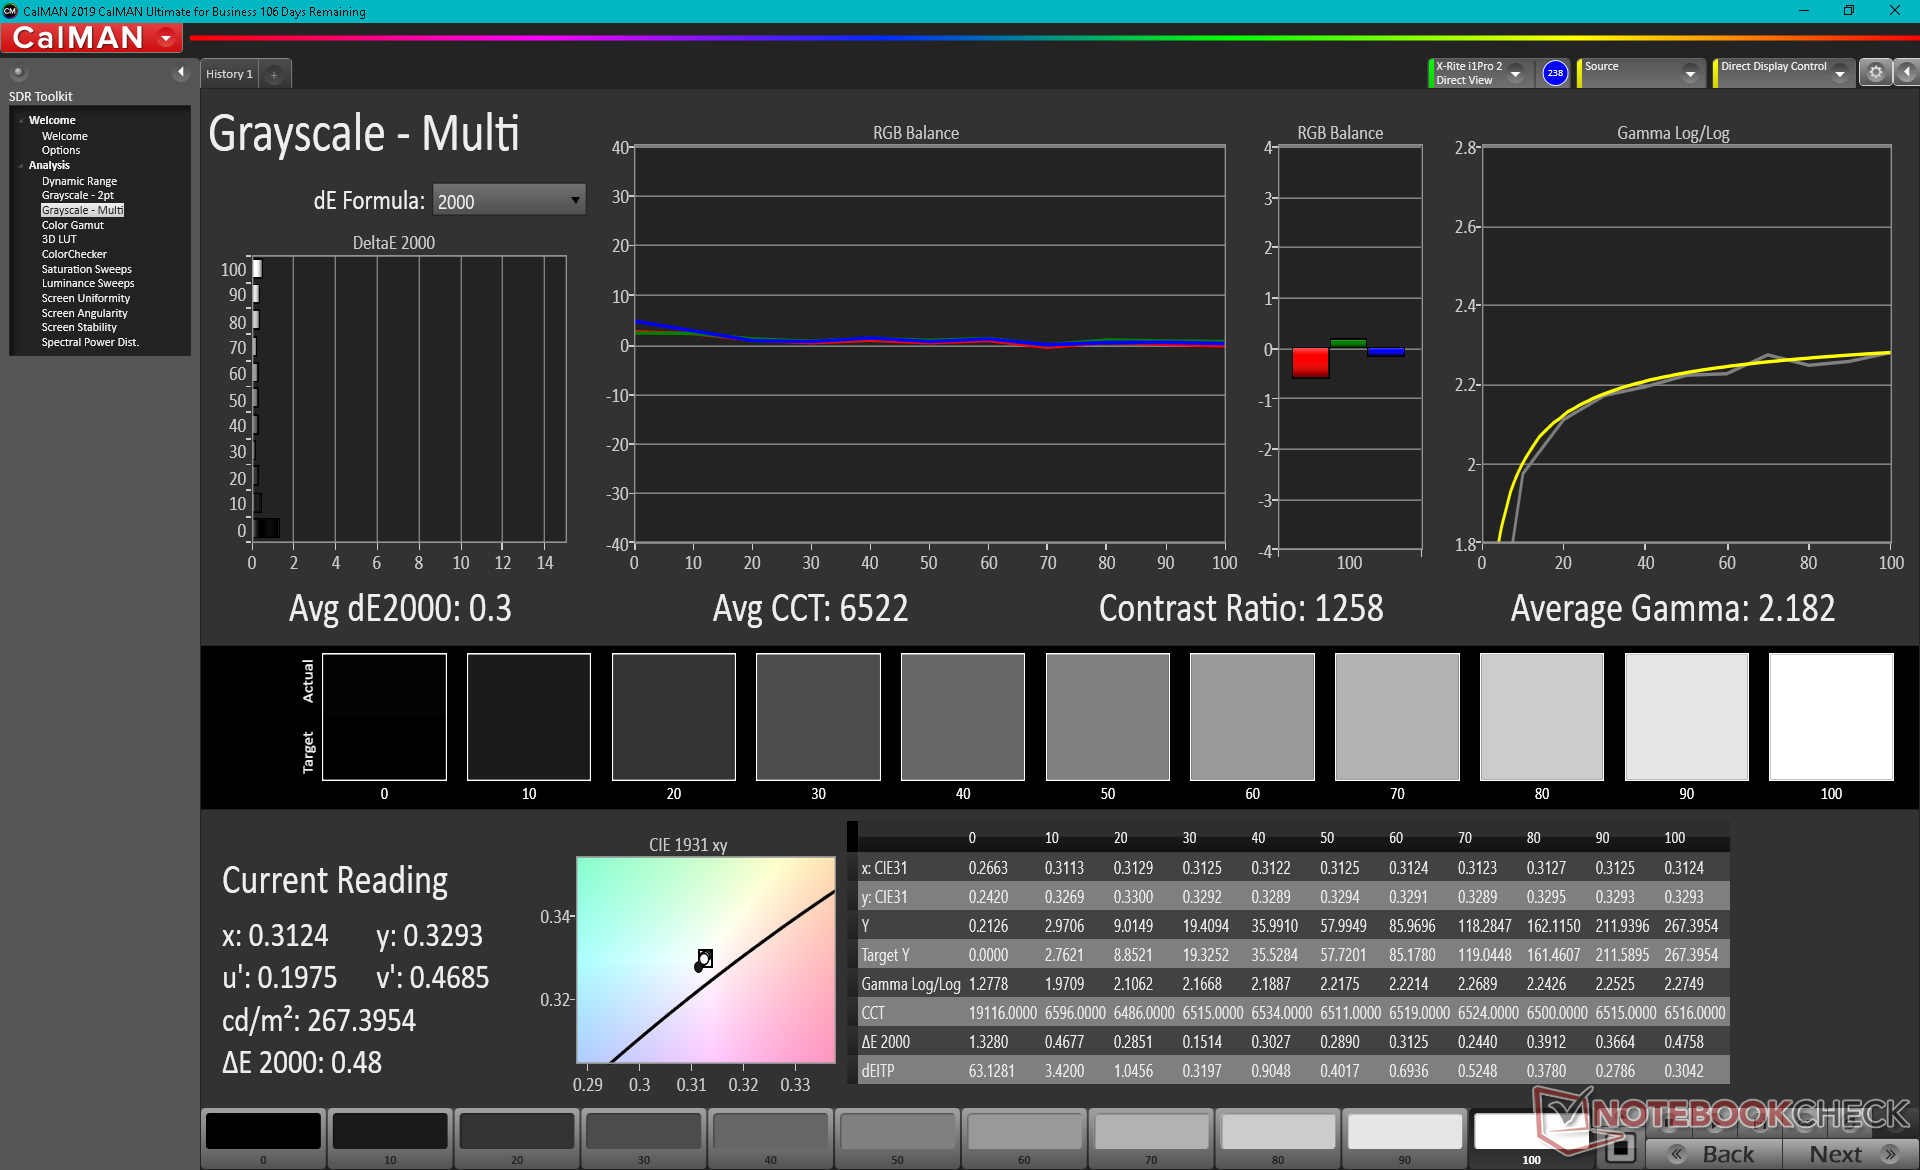
calibrated: 1.56
ΔE Greyscale Calman: 3.1 | ∀{0.09-98 Ø4.97}
41.6% AdobeRGB 1998 (Argyll 3D)
60.3% sRGB (Argyll 3D)
40.2% Display P3 (Argyll 3D)
Gamma: 2.14
CCT: 6927 K
| Asus ROG Strix G17 G713QE-RB74 AU Optronics B173HAN04.9, IPS, 17.3", 1920x1080 | Acer Nitro 5 AN517-53-54DQ BOE NV173FHM-NX4 (BOE09B4), IPS, 17.3", 1920x1080 | MSI Katana GF76 11UE AU Optronics B173HAN04.9, IPS, 17.3", 1920x1080 | Asus Strix Scar 17 G733QSA-XS99 AU Optronics B173HAN05.4, IPS, 17.3", 1920x1080 | MSI Alpha 17 A4DEK AU Optronics AUO978F, IPS, 17.3", 1920x1080 | Asus Strix G17 G712LWS LG Philips LP173WFG-SPB3, IPS, 17.3", 1920x1080 | |
|---|---|---|---|---|---|---|
| Display | -9% | -1% | 72% | -2% | 61% | |
| Display P3 Coverage (%) | 40.2 | 36.7 -9% | 39.8 -1% | 71 77% | 39.55 -2% | 65.2 62% |
| sRGB Coverage (%) | 60.3 | 55 -9% | 59.5 -1% | 99.4 65% | 59.2 -2% | 96.8 61% |
| AdobeRGB 1998 Coverage (%) | 41.6 | 37.9 -9% | 41.12 -1% | 72.2 74% | 40.86 -2% | 66.4 60% |
| Response Times | 5% | -36% | 60% | -51% | 46% | |
| Response Time Grey 50% / Grey 80% * (ms) | 26.8 ? | 24.8 ? 7% | 36.8 ? -37% | 6.6 ? 75% | 40 ? -49% | 14.4 ? 46% |
| Response Time Black / White * (ms) | 19.2 ? | 18.8 ? 2% | 26 ? -35% | 10.8 ? 44% | 29.2 ? -52% | 10.4 ? 46% |
| PWM Frequency (Hz) | ||||||
| Screen | -23% | -18% | 16% | -21% | 5% | |
| Brightness middle (cd/m²) | 270.5 | 286 6% | 260 -4% | 303.8 12% | 254 -6% | 323 19% |
| Brightness (cd/m²) | 269 | 261 -3% | 251 -7% | 292 9% | 254 -6% | 300 12% |
| Brightness Distribution (%) | 92 | 83 -10% | 85 -8% | 85 -8% | 93 1% | 89 -3% |
| Black Level * (cd/m²) | 0.19 | 0.23 -21% | 0.26 -37% | 0.23 -21% | 0.23 -21% | 0.31 -63% |
| Contrast (:1) | 1424 | 1243 -13% | 1000 -30% | 1321 -7% | 1104 -22% | 1042 -27% |
| Colorchecker dE 2000 * | 4.39 | 4.92 -12% | 3.9 11% | 1.87 57% | 4.12 6% | 3.01 31% |
| Colorchecker dE 2000 max. * | 20.8 | 19.29 7% | 20.64 1% | 3.26 84% | 19.66 5% | 7.65 63% |
| Colorchecker dE 2000 calibrated * | 1.56 | 4.73 -203% | 3.71 -138% | 1.45 7% | 3.78 -142% | 1 36% |
| Greyscale dE 2000 * | 3.1 | 1.9 39% | 1.6 48% | 2.7 13% | 3.2 -3% | 3.8 -23% |
| Gamma | 2.14 103% | 2.175 101% | 2.068 106% | 2.26 97% | 2.179 101% | 2.154 102% |
| CCT | 6927 94% | 6782 96% | 6511 100% | 6436 101% | 6754 96% | 7507 87% |
| Color Space (Percent of AdobeRGB 1998) (%) | 65.6 | 41 | 66 | |||
| Color Space (Percent of sRGB) (%) | 99.4 | 59 | 90 | |||
| Media total (Programa/Opciones) | -9% /
-16% | -18% /
-17% | 49% /
34% | -25% /
-21% | 37% /
23% |
* ... más pequeño es mejor
La gama es estrecha, con sólo el 60% de sRGB, lo que indica que es una pantalla no apta para la edición profesional de gráficos. De hecho, este tipo de paneles son habituales en los portátiles de juego económicos en los que los tiempos de respuesta suelen tener prioridad sobre la precisión del color. Asus ofrece paneles de gama alta con cobertura completa sRGB o P3 en esta serie G713 en particular para cubrir todas las bases.
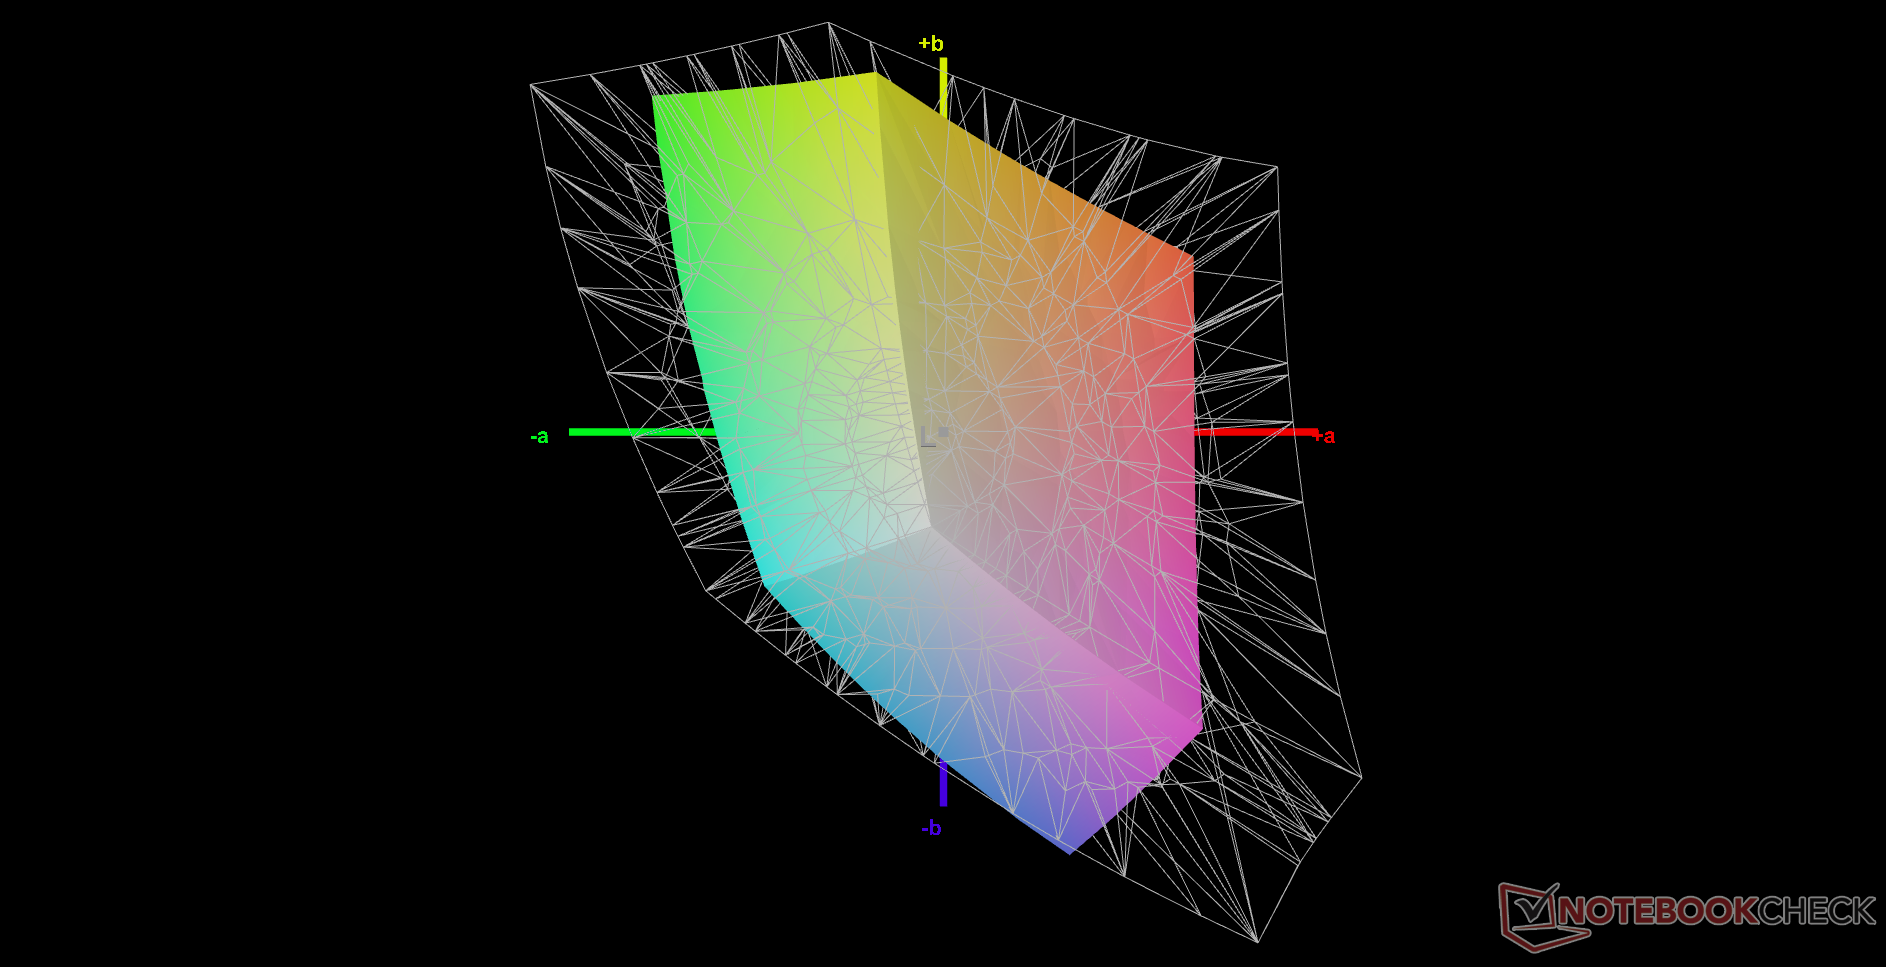
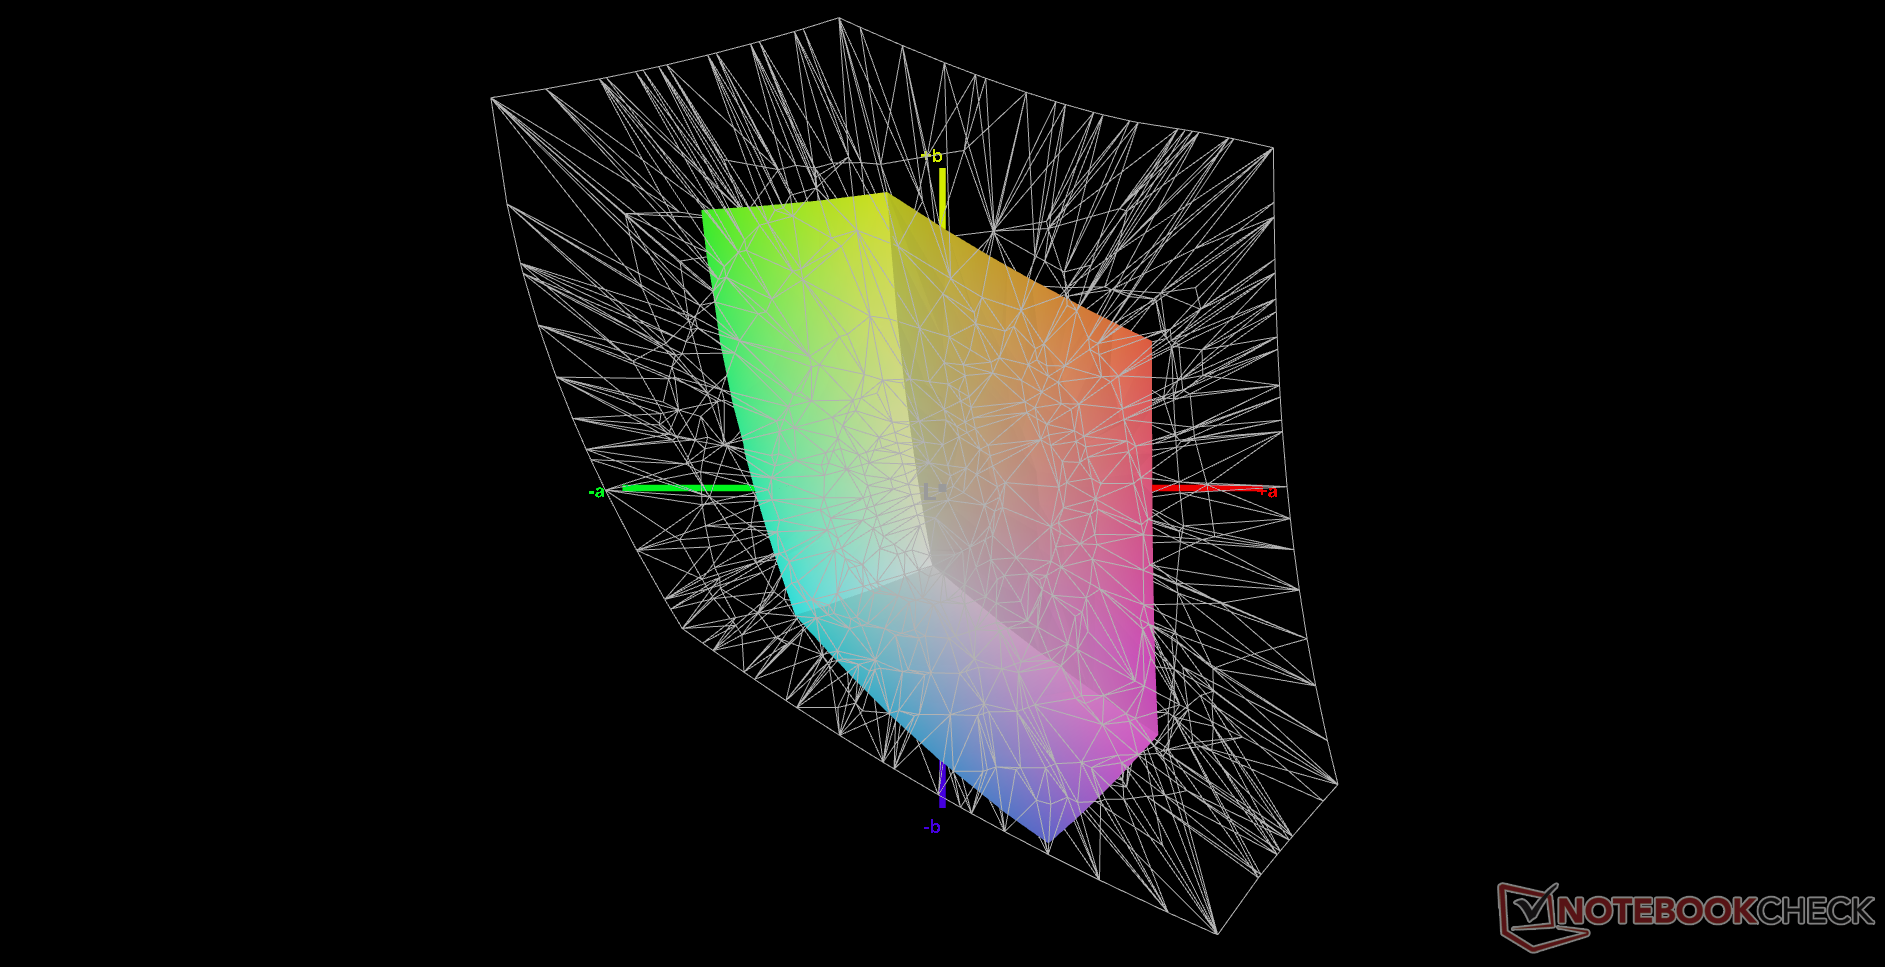
Aunque no está mal al sacarlo de la caja, los colores y la escala de grises tienen margen de mejora. Calibrando la pantalla nosotros mismos mejoraríamos los valores medios de escala de grises y color DeltaE de 3,1 y 4,39 a sólo 0,3 y 1,56, respectivamente. Sin embargo, los colores se vuelven inevitablemente mucho más imprecisos a niveles de saturación más altos debido al limitado espacio de color mencionado anteriormente.
Tiempos de respuesta del display
| ↔ Tiempo de respuesta de Negro a Blanco | ||
|---|---|---|
| 19.2 ms ... subida ↗ y bajada ↘ combinada | ↗ 10.8 ms subida | 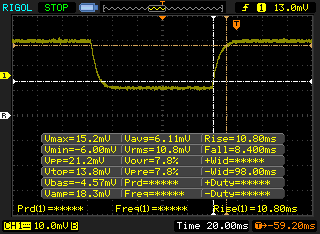 |
| ↘ 8.4 ms bajada | ||
| La pantalla mostró buenos tiempos de respuesta en nuestros tests pero podría ser demasiado lenta para los jugones competitivos. En comparación, todos los dispositivos de prueba van de ##min### (mínimo) a 240 (máximo) ms. » 42 % de todos los dispositivos son mejores. Eso quiere decir que el tiempo de respuesta es similar al dispositivo testado medio (19.9 ms). | ||
| ↔ Tiempo de respuesta 50% Gris a 80% Gris | ||
| 26.8 ms ... subida ↗ y bajada ↘ combinada | ↗ 14 ms subida | 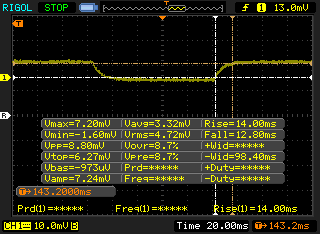 |
| ↘ 12.8 ms bajada | ||
| La pantalla mostró tiempos de respuesta relativamente lentos en nuestros tests pero podría ser demasiado lenta para los jugones. En comparación, todos los dispositivos de prueba van de ##min### (mínimo) a 636 (máximo) ms. » 36 % de todos los dispositivos son mejores. Esto quiere decir que el tiempo de respuesta medido es mejor que la media (31.1 ms) de todos los dispositivos testados. | ||
Parpadeo de Pantalla / PWM (Pulse-Width Modulation)
| Parpadeo de Pantalla / PWM no detectado | 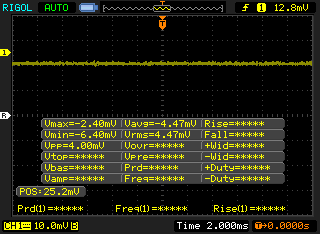 | ||
Comparación: 52 % de todos los dispositivos testados no usaron PWM para atenuar el display. Si se usó, medimos una media de 7791 (mínimo: 5 - máxmo: 343500) Hz. | |||
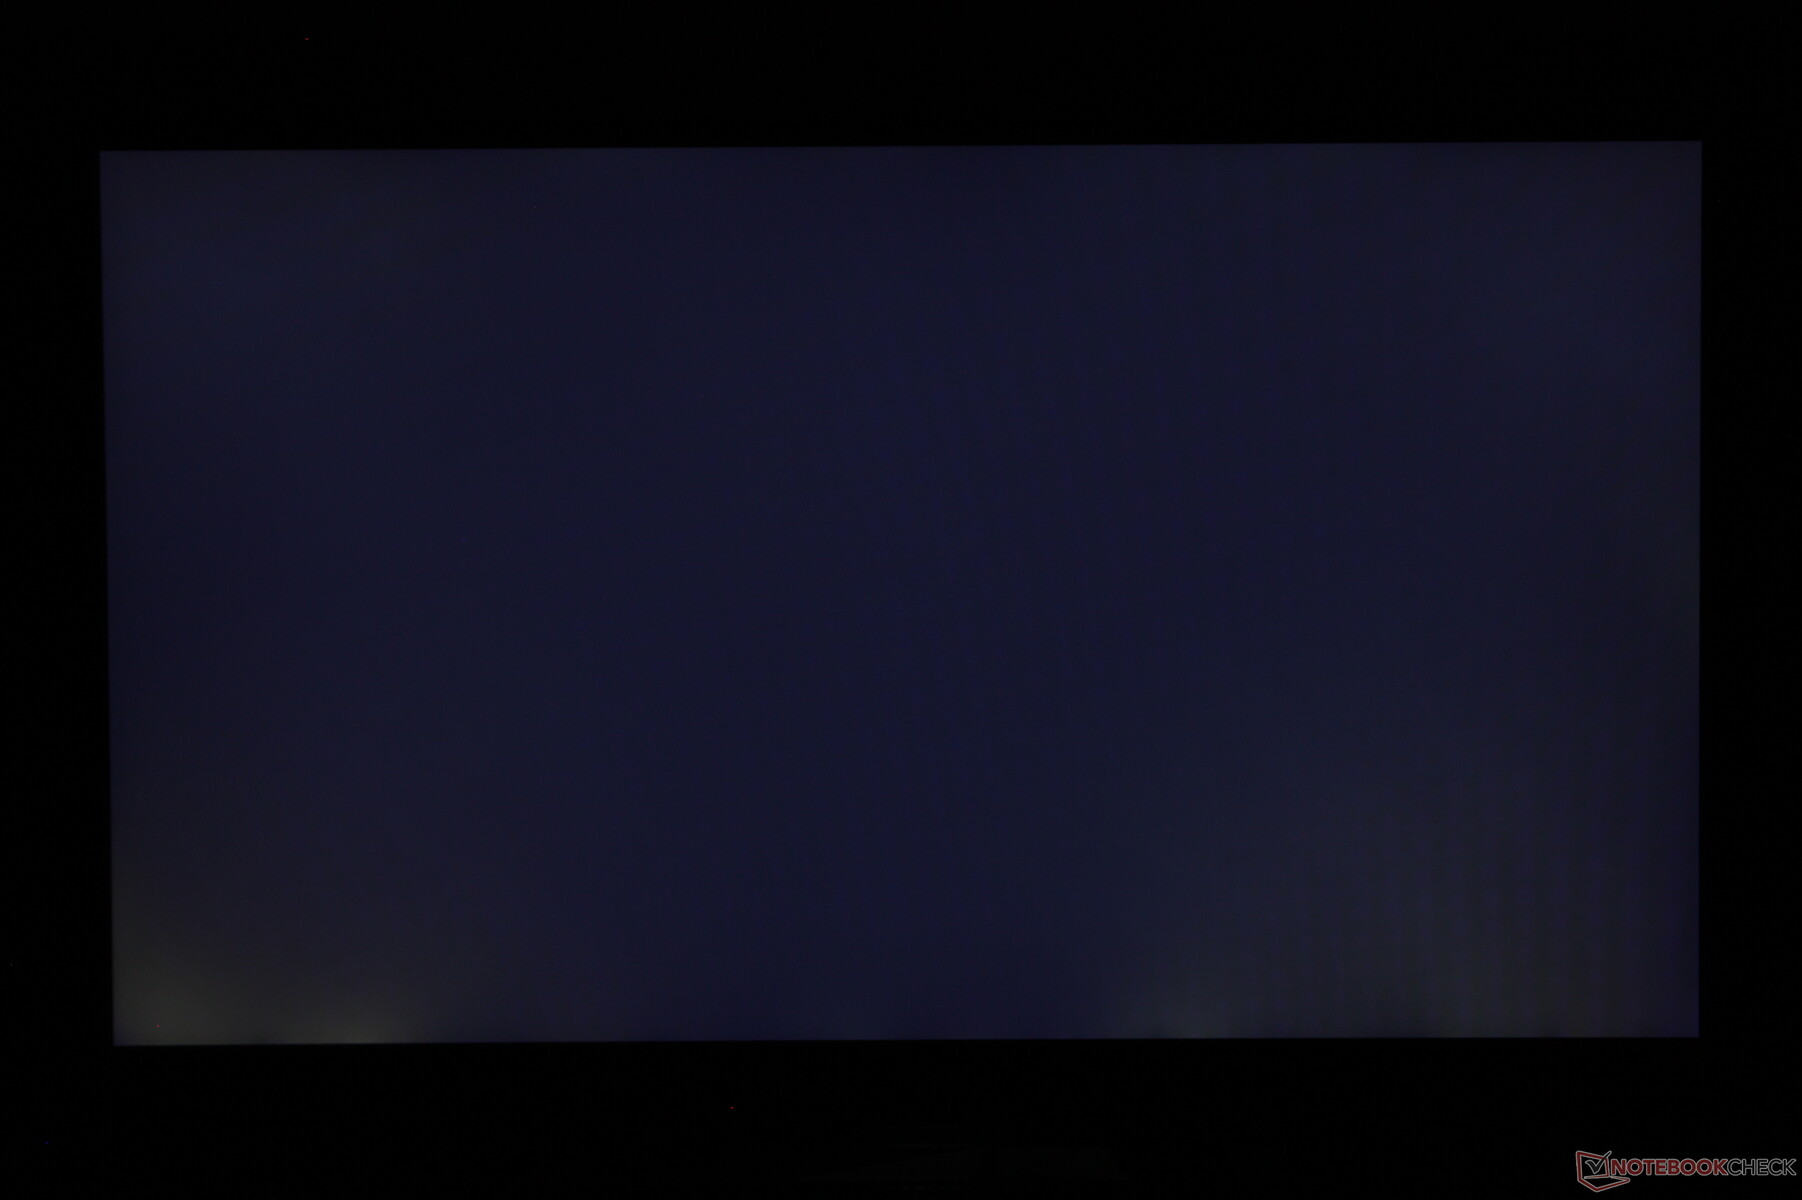
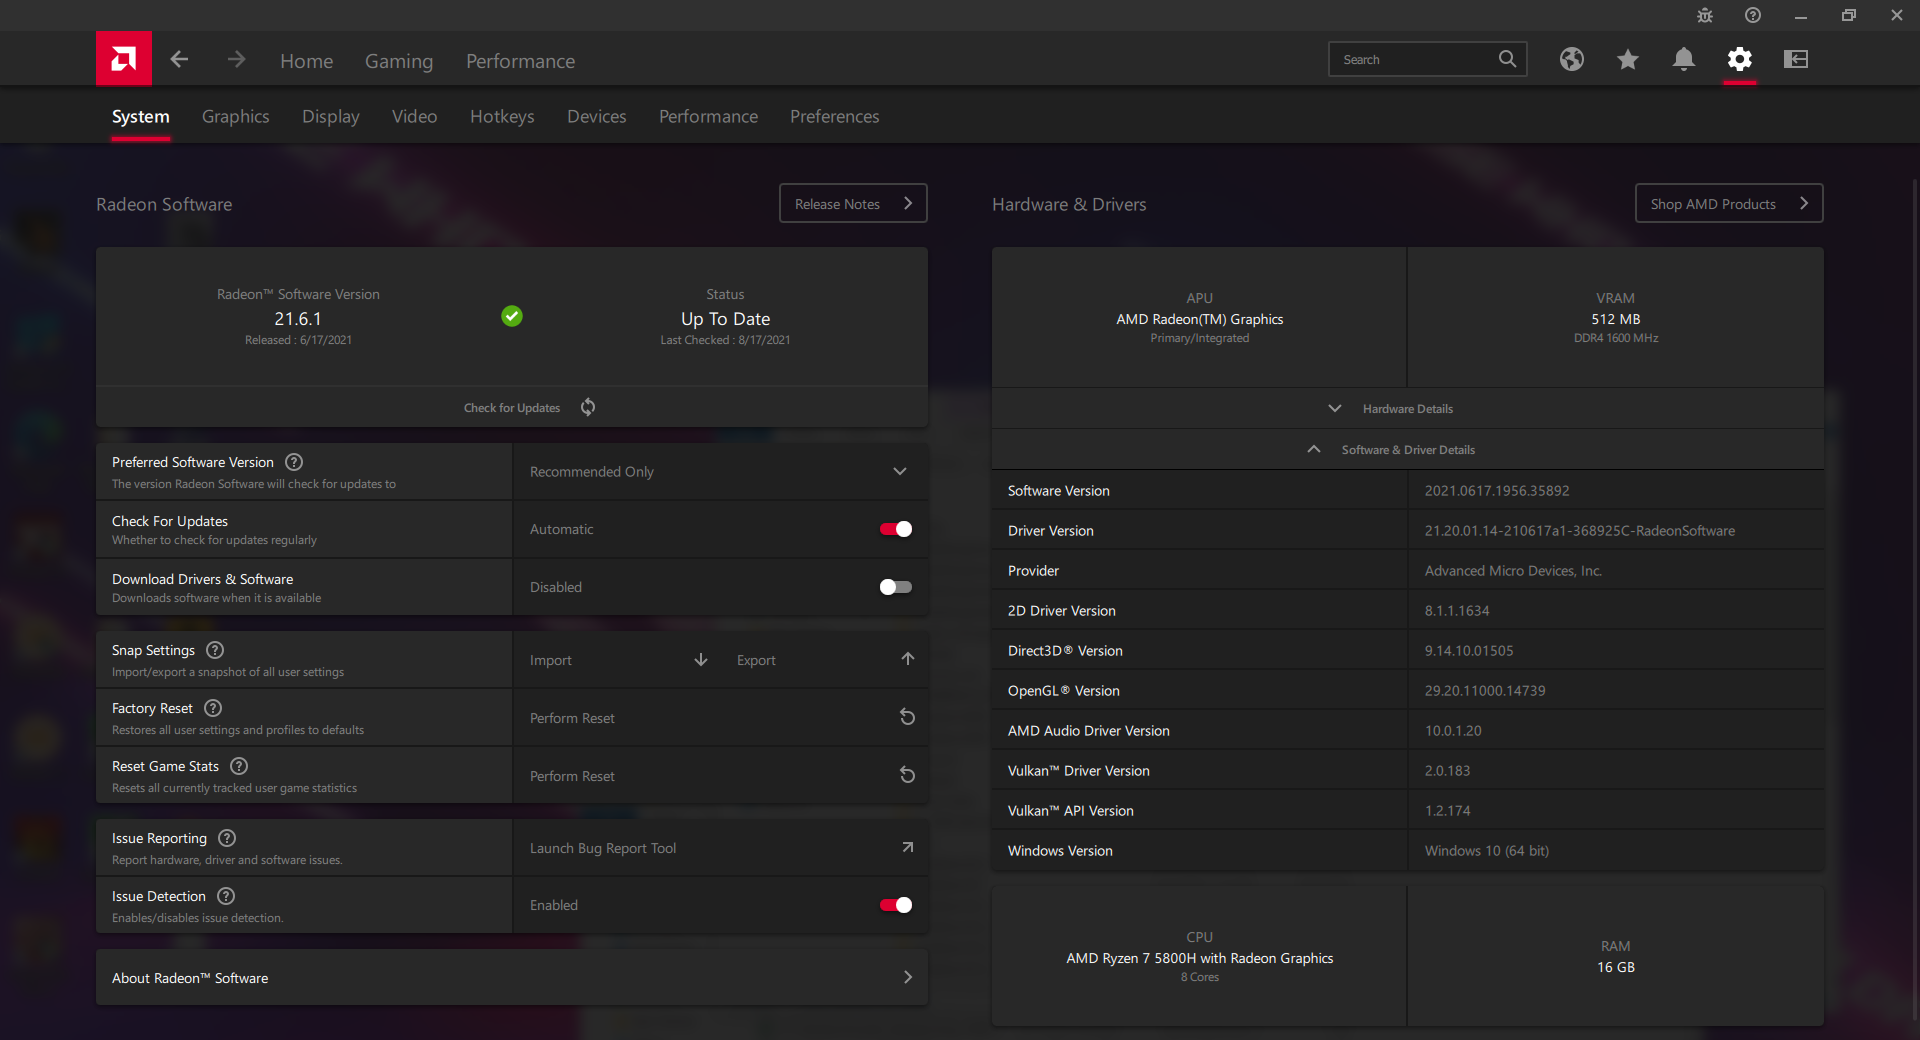
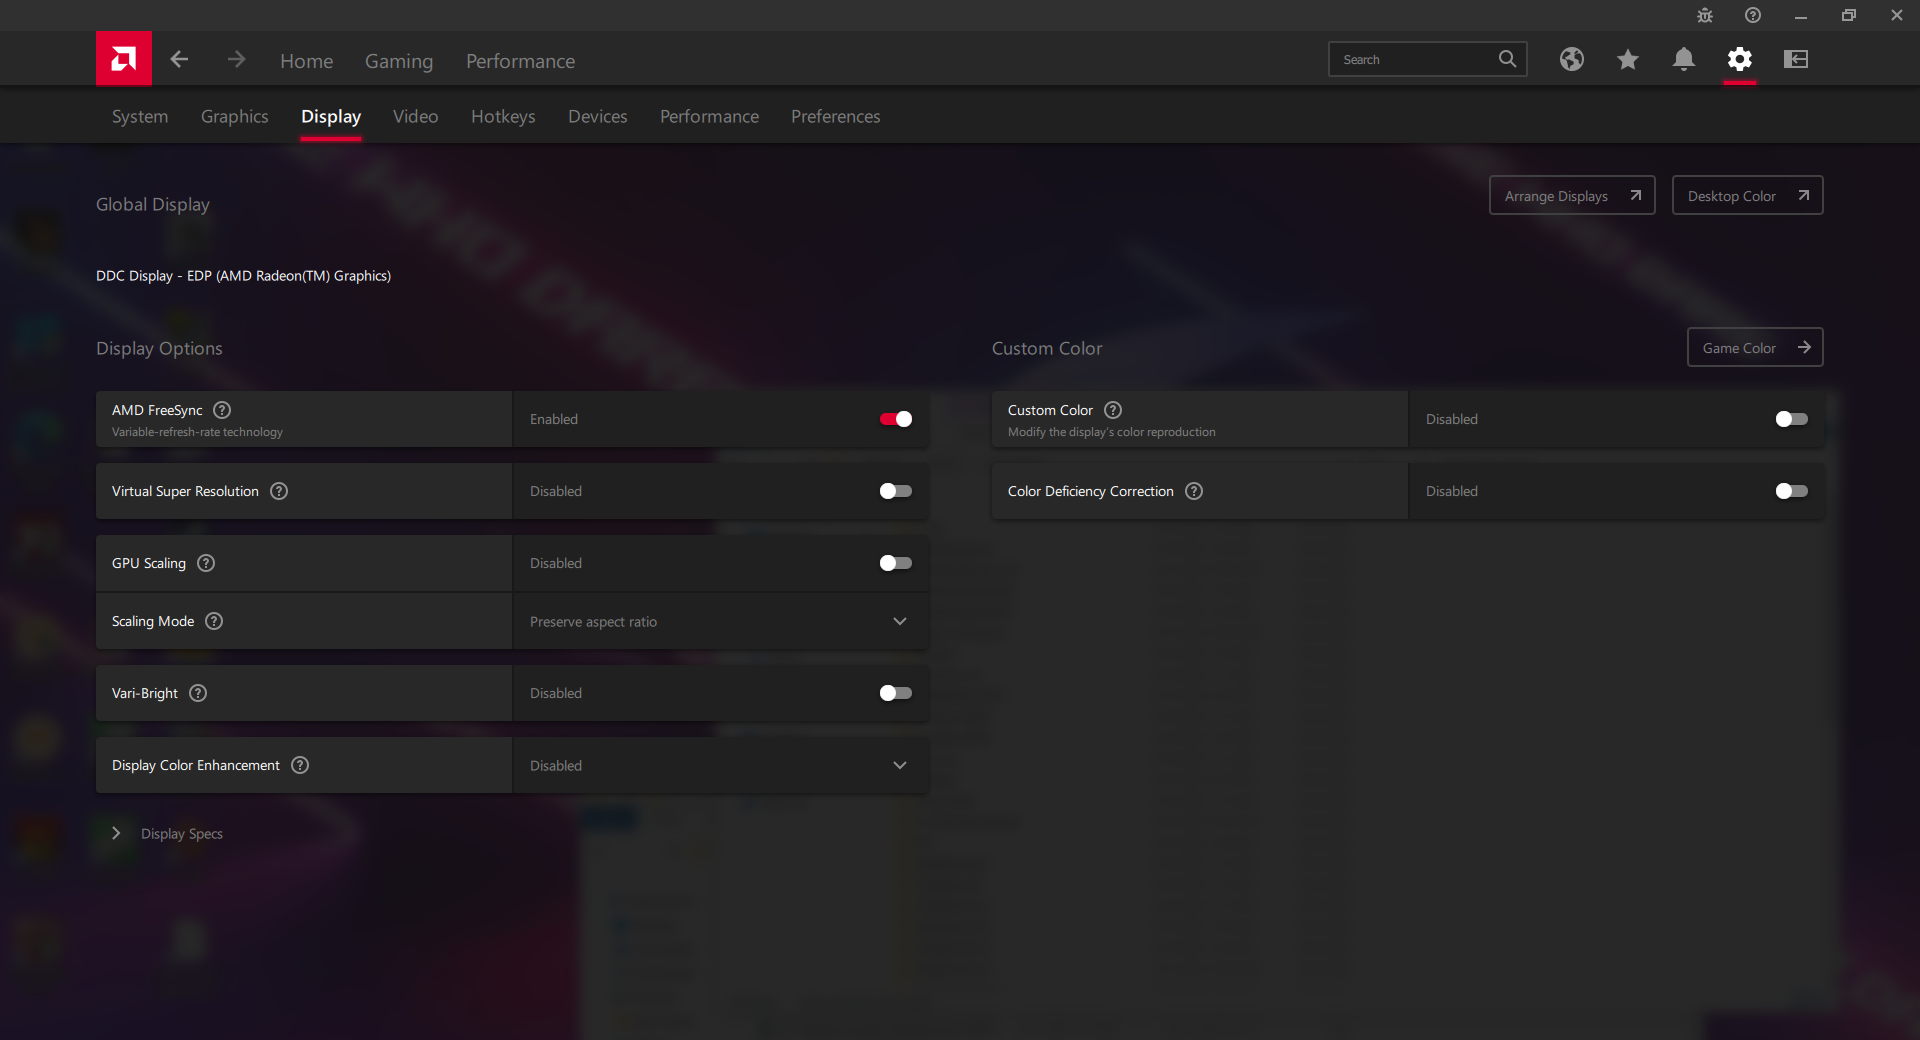
El brillo máximo está en la media para un portátil de juegos de 17,3 pulgadas, por lo que la visibilidad en exteriores no es nada especial en el G713. Recuerda desactivar AMD Vari-Bright a través del software AMD Radeon o el brillo máximo caerá a sólo 175 nits cuando esté en batería.
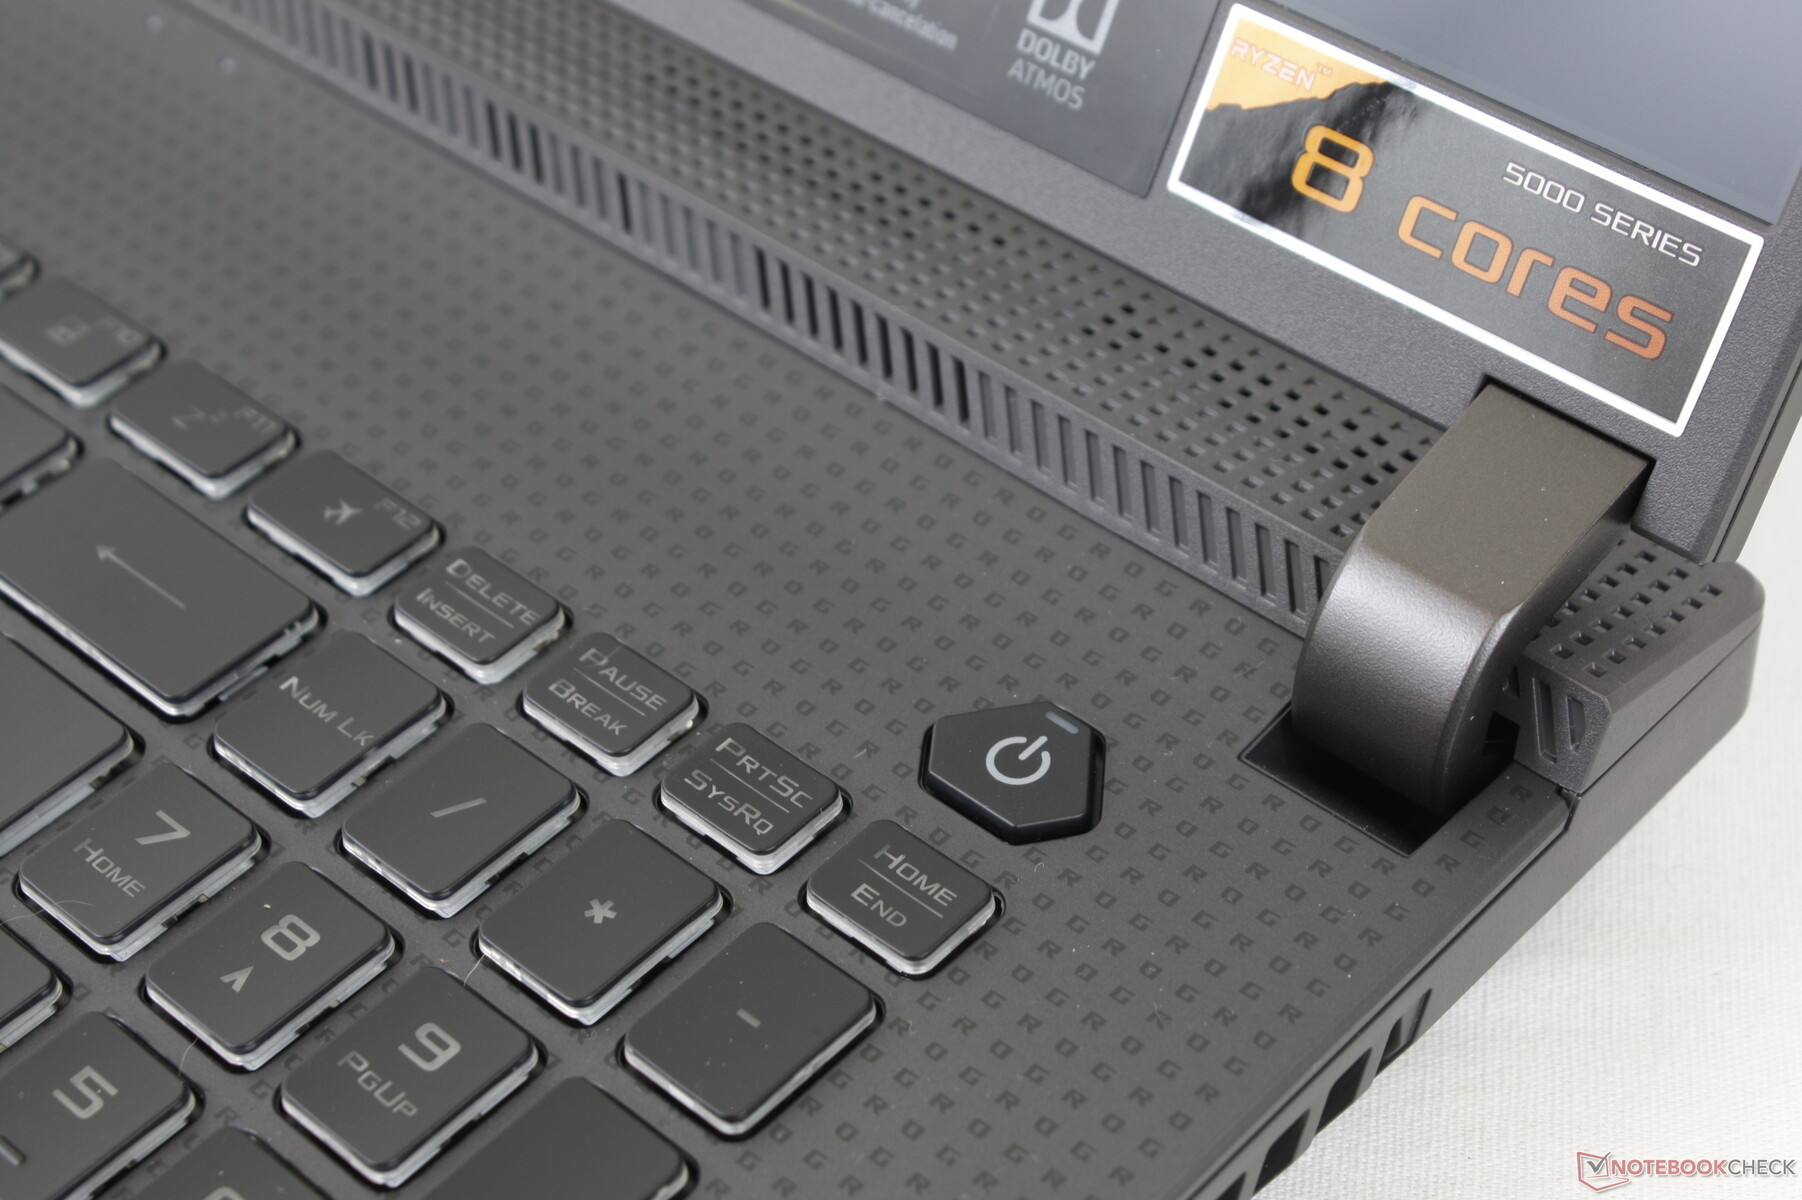
Rendimiento - Procesador Core i9
Todas las configuraciones del G713 por el momento vienen sólo con CPUs AMD para bien o para mal. Aunque las series Zen 2 y Zen 3 pueden superar a menudo a las mejores CPUs Core-H de Intel, carecen de soporte para PCIe 4 y Thunderbolt 4, lo que puede molestar a algunos jugadores.
En cuanto a los gráficos, las GPUs van desde la GeForce GTX 1650 hasta la RTX 3070 para atraer a una amplia gama de presupuestos. La barra ajustable y FreeSync son compatibles, mientras que Advanced Optimus no lo es. Se puede encontrar un interruptor manual para desactivar la GPU Nvidia discreta a través del software Asus Armoury Crate.
Nuestra unidad se puso en modo Turbo antes de ejecutar cualquier prueba de rendimiento para obtener las mejores puntuaciones posibles.

Procesador
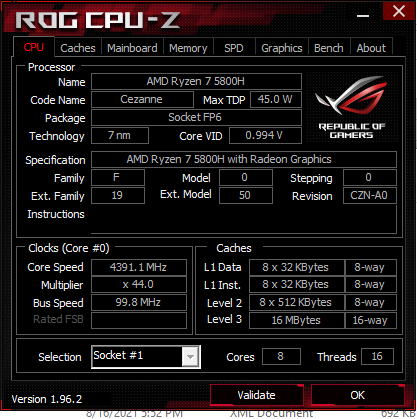
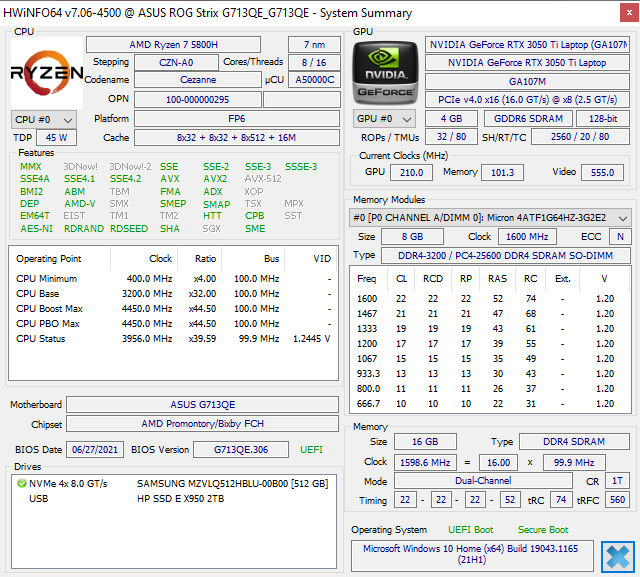
El rendimiento bruto de la CPU es excelente para competir con los procesadores Core i9 11th gen Tiger Lake-H de Intel. El competidor Core i9-11900Hde Intel, por ejemplo, ofrece un rendimiento multihilo similar, pero un rendimiento monohilo ligeramente superior, como es habitual cuando se comparan las CPU de Intel y AMD. De generación en generación, el Ryzen 7 5800H es sólo marginalmente más rápido que el Ryzen 7 4800H ya que la serie Zen 2 H ya supuso un gran salto respecto al Ryzen 7 3750H
La sostenibilidad del rendimiento también es excelente, sin caídas en las puntuaciones a lo largo del tiempo cuando se ejecuta CineBench R15 xT en un bucle continuo. Sin embargo, es difícil recomendar el Ryzen 9 5900HX sobre el Ryzen 7 5800H ya que su rendimiento es casi idéntico.
Cinebench R15 Multi Loop
Cinebench R23: Multi Core | Single Core
Cinebench R15: CPU Multi 64Bit | CPU Single 64Bit
Blender: v2.79 BMW27 CPU
7-Zip 18.03: 7z b 4 -mmt1 | 7z b 4
Geekbench 5.5: Single-Core | Multi-Core
HWBOT x265 Benchmark v2.2: 4k Preset
LibreOffice : 20 Documents To PDF
R Benchmark 2.5: Overall mean
| Cinebench R23 / Multi Core | |
| Asus Strix Scar 17 G733QSA-XS99 | |
| Asus ROG Strix G17 G713QE-RB74 | |
| Asus ROG Zephyrus S17 GX703HSD | |
| Acer Nitro 5 AN517-41-R9S5 | |
| Medio AMD Ryzen 7 5800H (8812 - 13214, n=29) | |
| Medion Erazer Beast X20 | |
| Huawei MateBook D 16-53011VFJ | |
| Cinebench R23 / Single Core | |
| Asus ROG Zephyrus S17 GX703HSD | |
| Asus Strix Scar 17 G733QSA-XS99 | |
| Acer Nitro 5 AN517-41-R9S5 | |
| Asus ROG Strix G17 G713QE-RB74 | |
| Medio AMD Ryzen 7 5800H (1294 - 1441, n=29) | |
| Medion Erazer Beast X20 | |
| Huawei MateBook D 16-53011VFJ | |
Cinebench R23: Multi Core | Single Core
Cinebench R15: CPU Multi 64Bit | CPU Single 64Bit
Blender: v2.79 BMW27 CPU
7-Zip 18.03: 7z b 4 -mmt1 | 7z b 4
Geekbench 5.5: Single-Core | Multi-Core
HWBOT x265 Benchmark v2.2: 4k Preset
LibreOffice : 20 Documents To PDF
R Benchmark 2.5: Overall mean
* ... más pequeño es mejor
Rendimiento del sistema
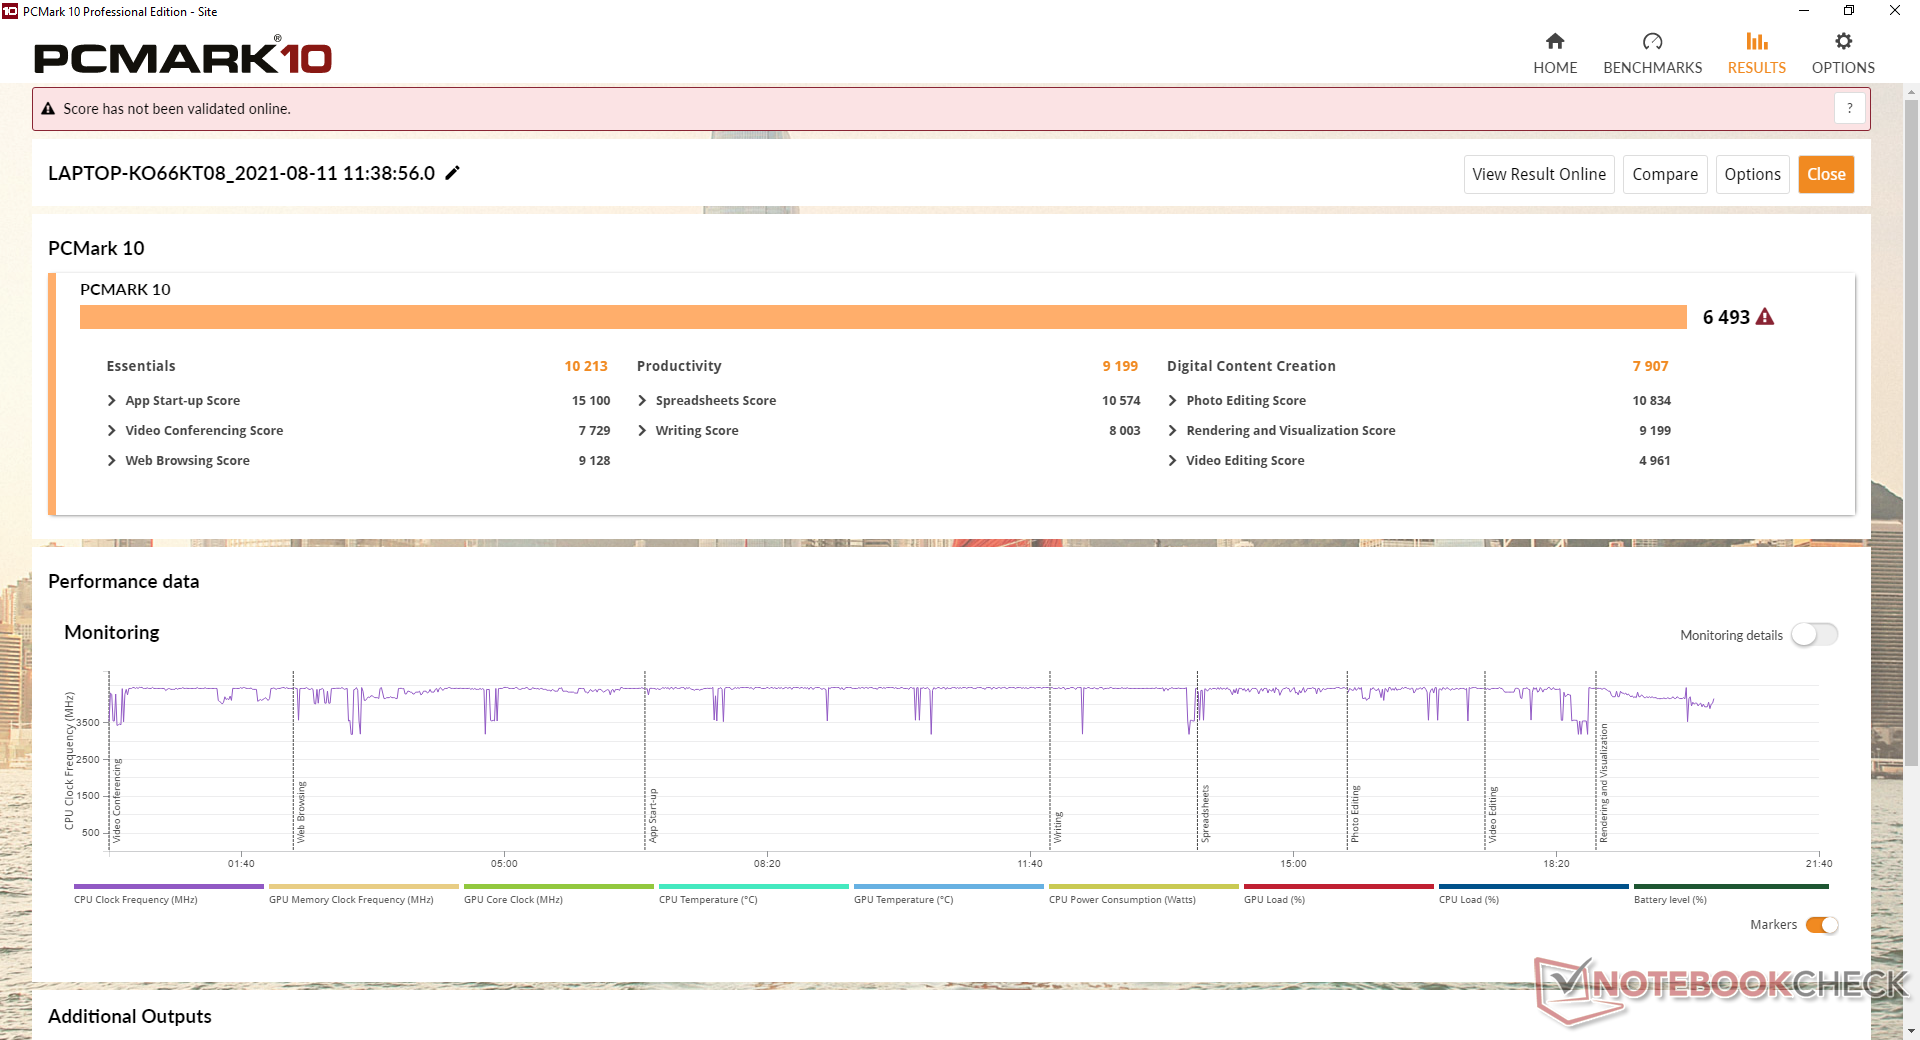
Los resultados de PCMark 10 son ligeramente más altos de lo esperado, probablemente debido a la rapidísima CPU Ryzen 7, pero la RTX 3050 Ti, más lenta, hace que todo baje. Al menos los resultados son consistentemente más altos que los del MSI Alpha 17 impulsado sólo por hardware AMD.
| PCMark 10 / Score | |
| Asus Strix Scar 17 G733QSA-XS99 | |
| MSI Katana GF76 11UE | |
| Asus ROG Strix G17 G713QE-RB74 | |
| Medio AMD Ryzen 7 5800H, NVIDIA GeForce RTX 3050 Ti Laptop GPU (6098 - 6493, n=2) | |
| MSI Alpha 17 A4DEK | |
| Acer Nitro 5 AN517-53-54DQ | |
| Asus Strix G17 G712LWS | |
| PCMark 10 / Essentials | |
| Asus Strix Scar 17 G733QSA-XS99 | |
| Asus ROG Strix G17 G713QE-RB74 | |
| Medio AMD Ryzen 7 5800H, NVIDIA GeForce RTX 3050 Ti Laptop GPU (9631 - 10213, n=2) | |
| MSI Katana GF76 11UE | |
| Asus Strix G17 G712LWS | |
| Acer Nitro 5 AN517-53-54DQ | |
| MSI Alpha 17 A4DEK | |
| PCMark 10 / Productivity | |
| Asus Strix Scar 17 G733QSA-XS99 | |
| Asus ROG Strix G17 G713QE-RB74 | |
| Medio AMD Ryzen 7 5800H, NVIDIA GeForce RTX 3050 Ti Laptop GPU (8625 - 9199, n=2) | |
| MSI Katana GF76 11UE | |
| Acer Nitro 5 AN517-53-54DQ | |
| Asus Strix G17 G712LWS | |
| MSI Alpha 17 A4DEK | |
| PCMark 10 / Digital Content Creation | |
| Asus Strix Scar 17 G733QSA-XS99 | |
| MSI Katana GF76 11UE | |
| MSI Alpha 17 A4DEK | |
| Asus ROG Strix G17 G713QE-RB74 | |
| Medio AMD Ryzen 7 5800H, NVIDIA GeForce RTX 3050 Ti Laptop GPU (7408 - 7907, n=2) | |
| Acer Nitro 5 AN517-53-54DQ | |
| Asus Strix G17 G712LWS | |
| PCMark 10 Score | 6493 puntos | |
ayuda | ||
Latencia del CPD
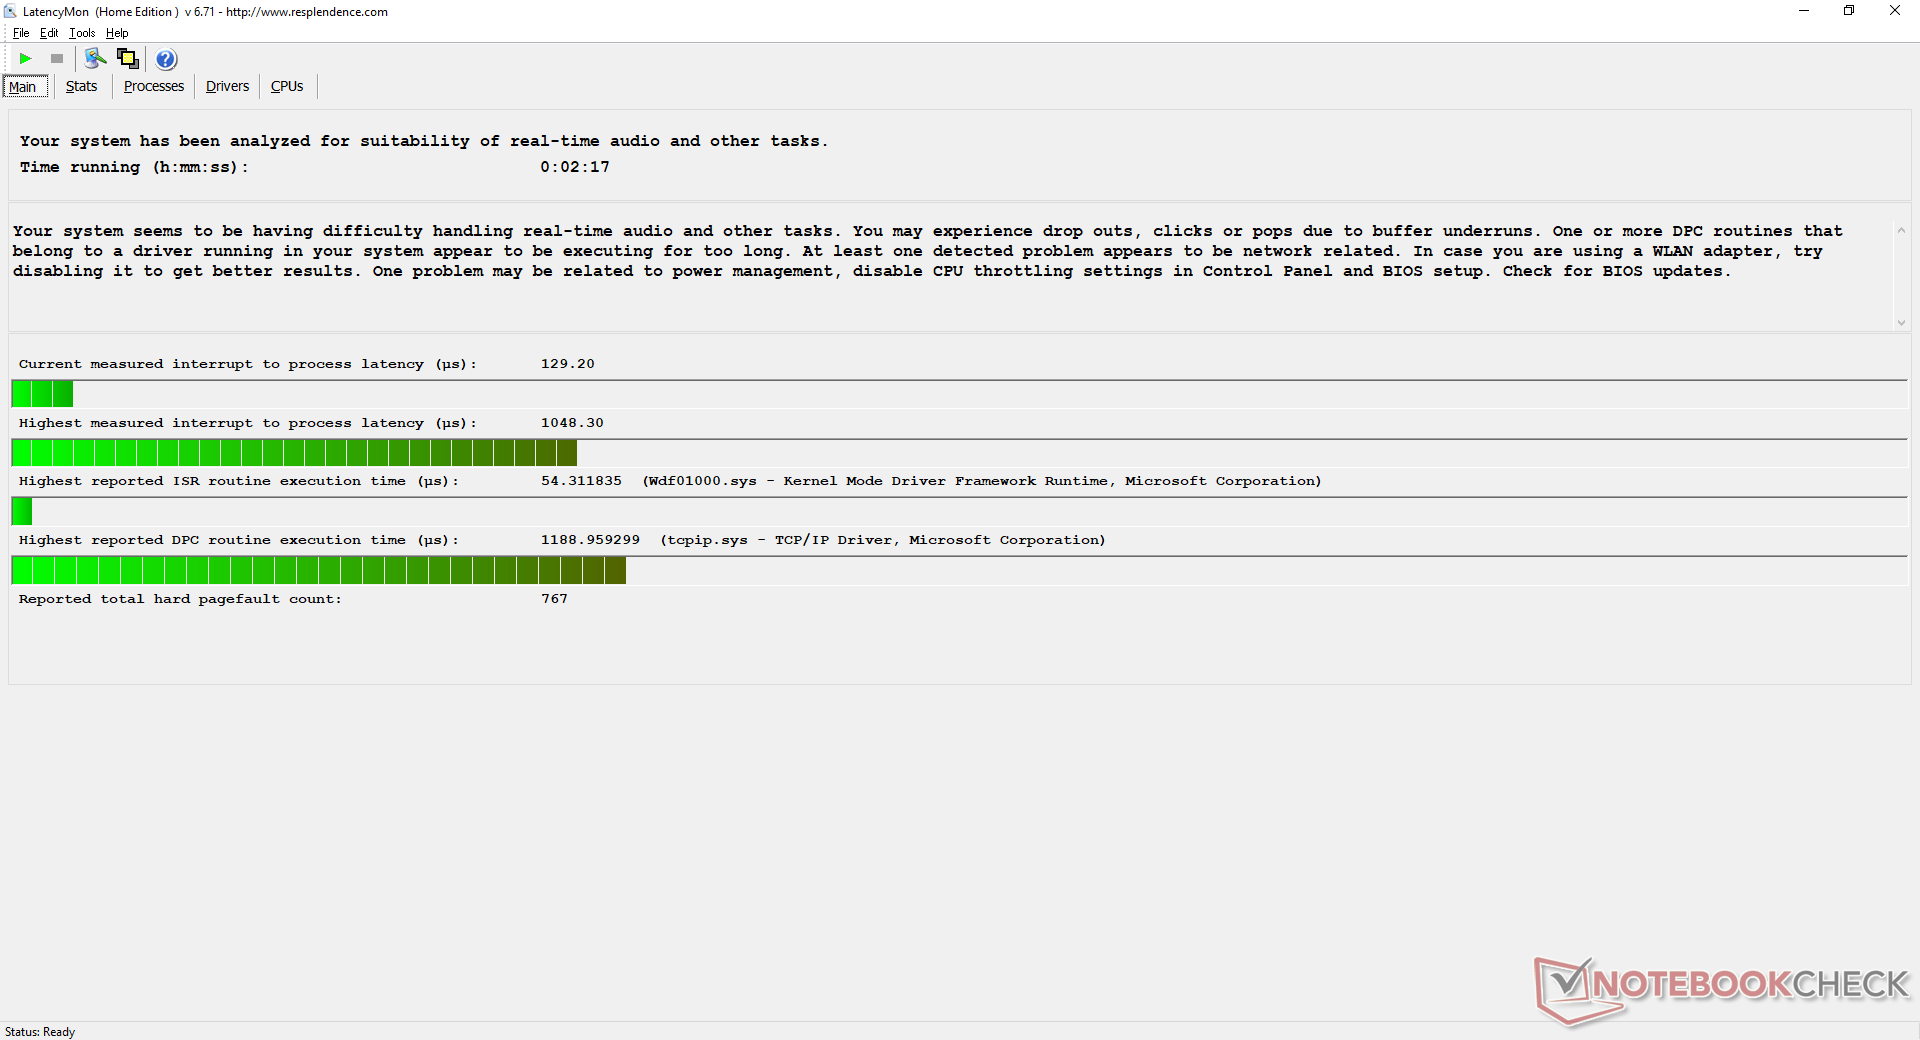
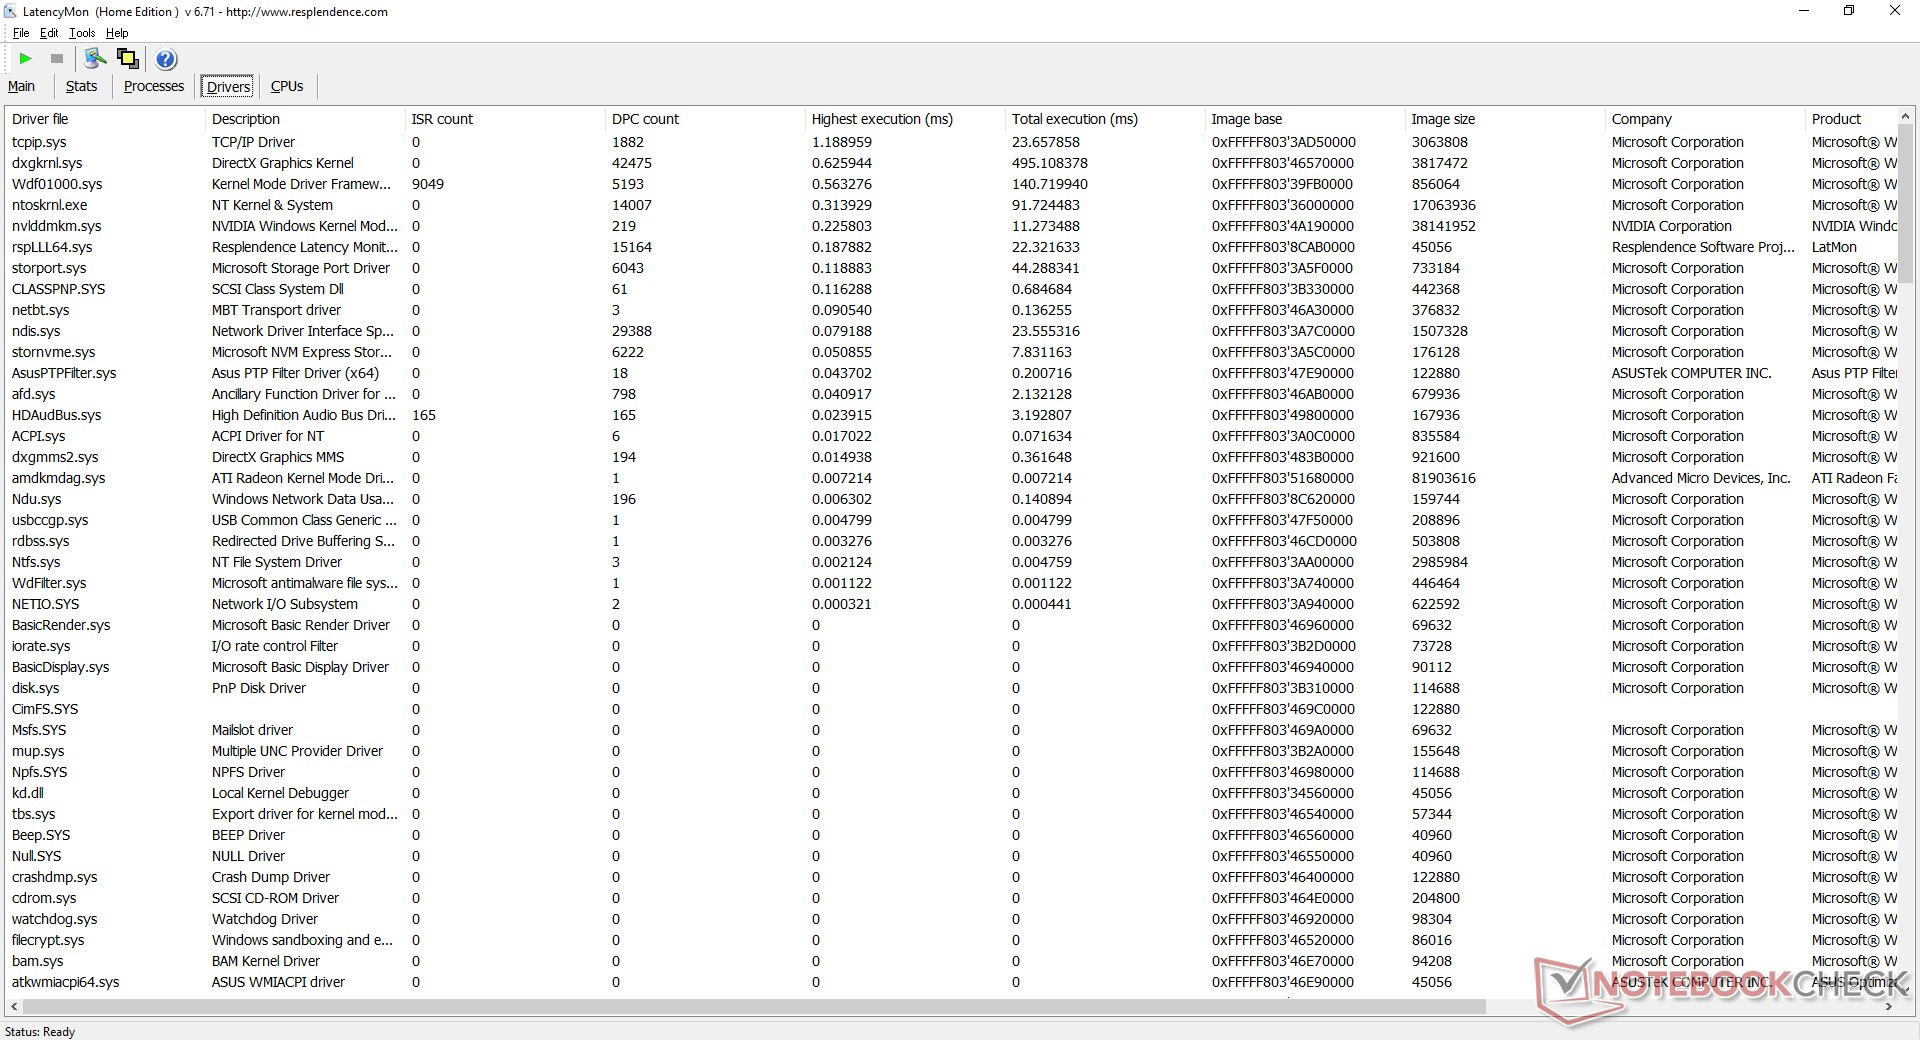
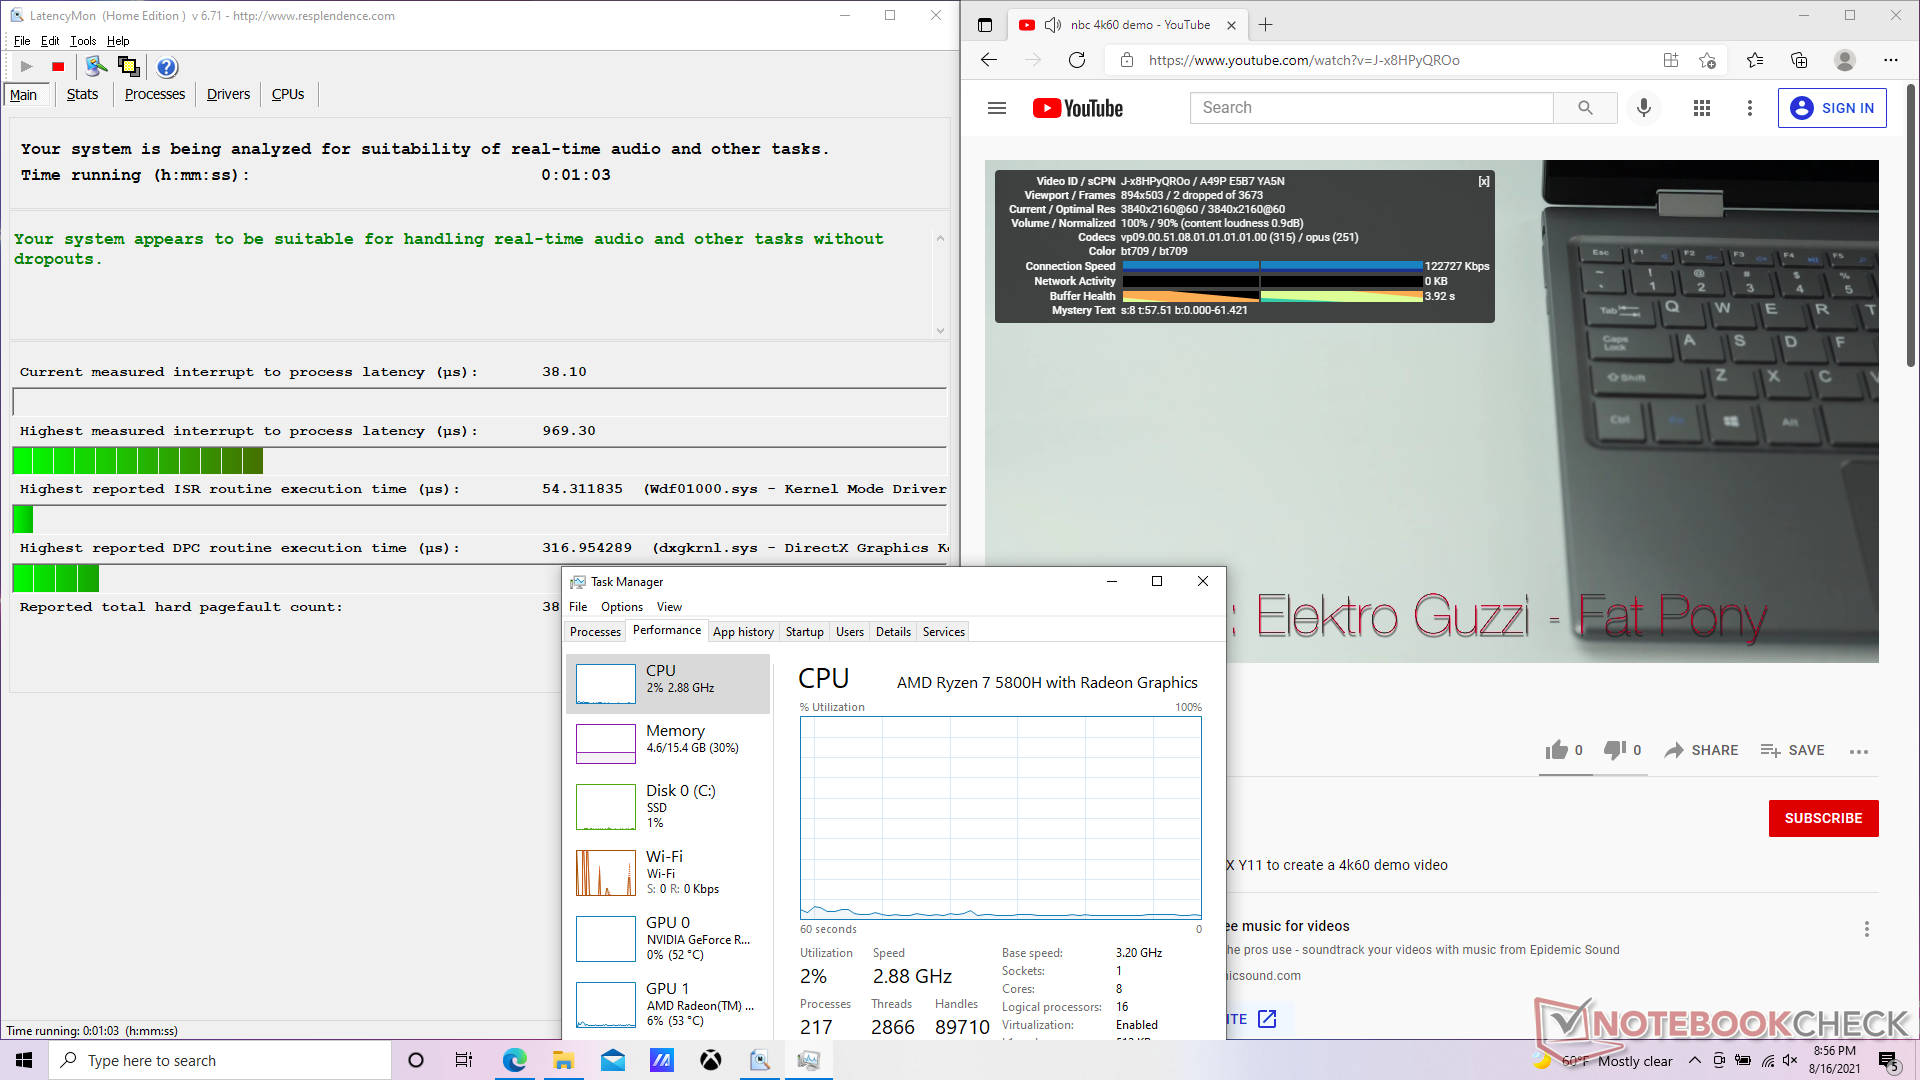
LatencyMon muestra problemas menores de latencia al abrir varias pestañas del navegador en nuestra página de inicio. La reproducción de vídeo 4K a 60 FPS es, por lo demás, fluida, con sólo 2 fotogramas perdidos durante nuestro vídeo de prueba de un minuto.
| DPC Latencies / LatencyMon - interrupt to process latency (max), Web, Youtube, Prime95 | |
| MSI Alpha 17 A4DEK | |
| MSI Katana GF76 11UE | |
| Asus Strix G17 G712LWS | |
| Acer Nitro 5 AN517-53-54DQ | |
| Asus ROG Strix G17 G713QE-RB74 | |
| Asus Strix Scar 17 G733QSA-XS99 | |
* ... más pequeño es mejor
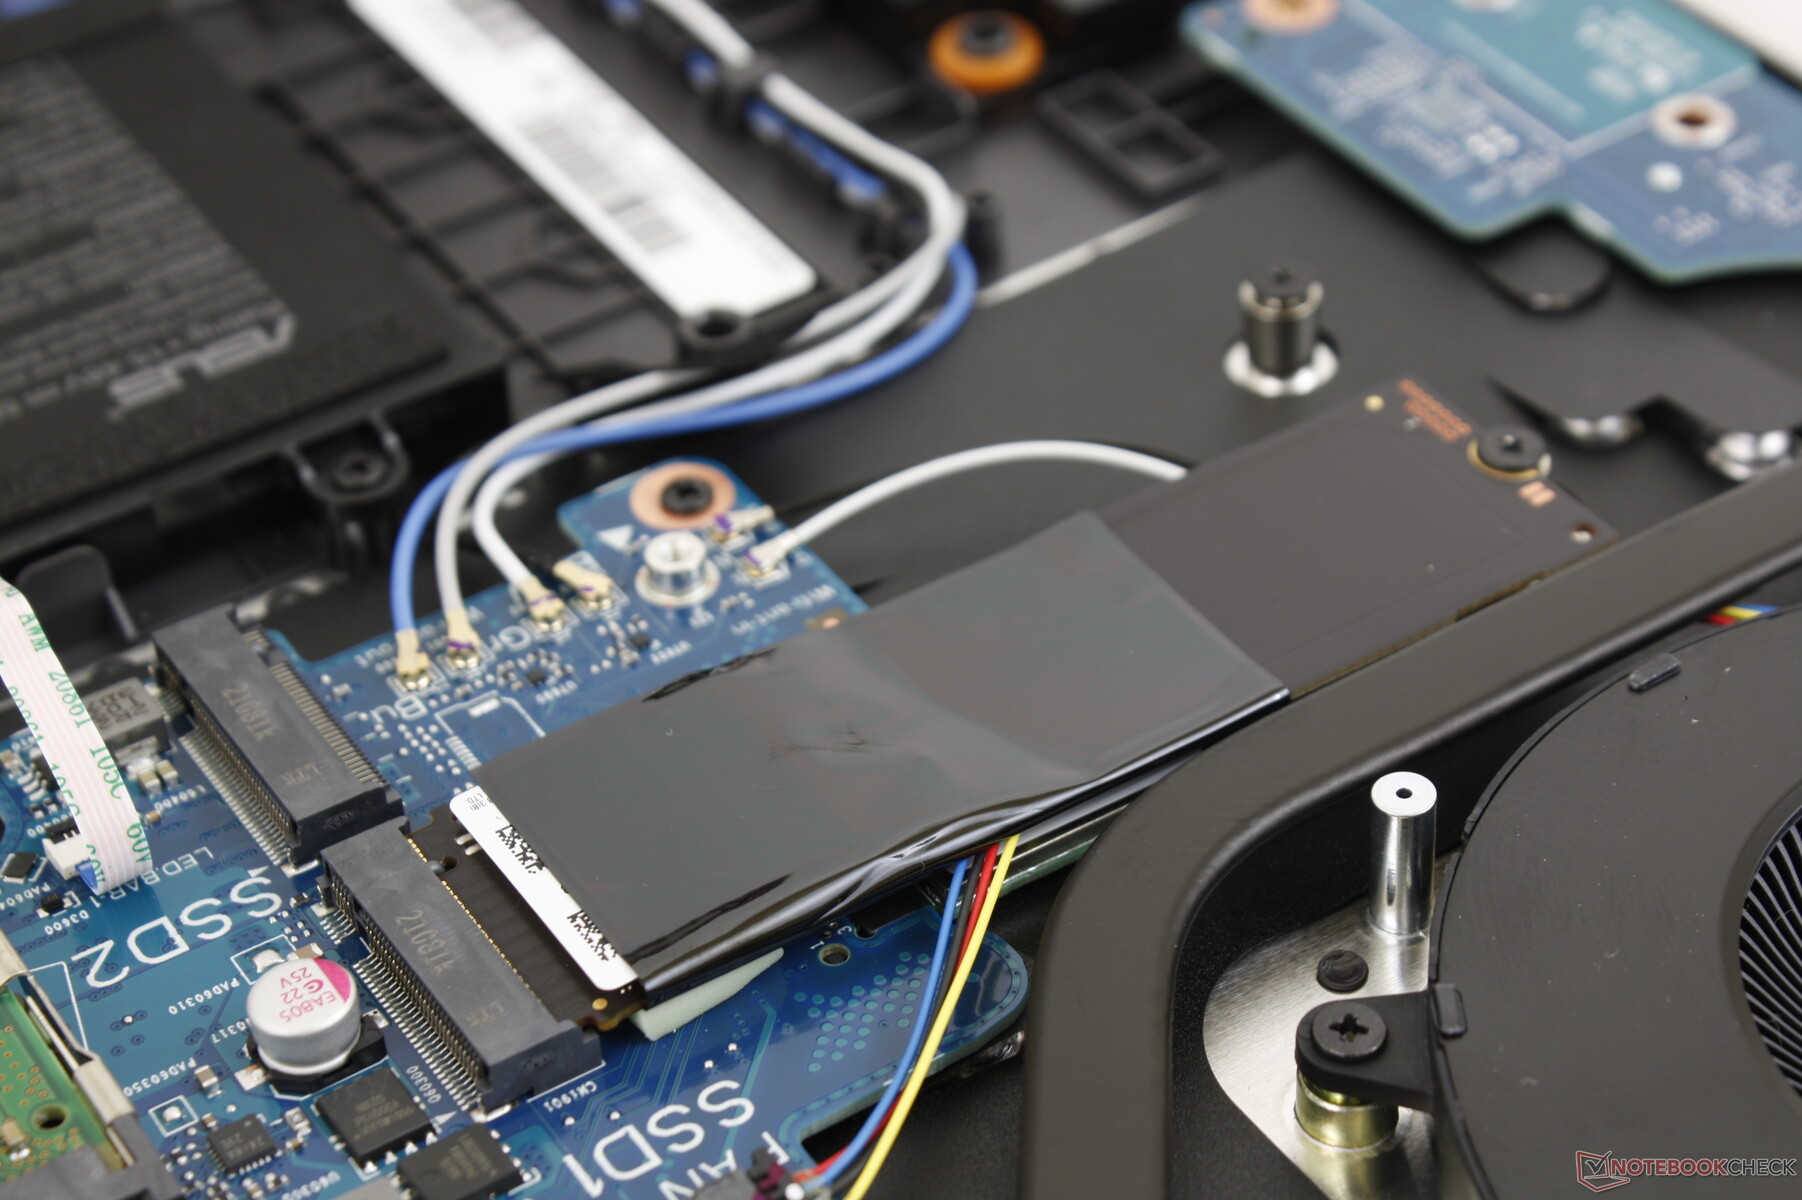
Dispositivos de almacenamiento - No hay unidades de 2,5 pulgadas
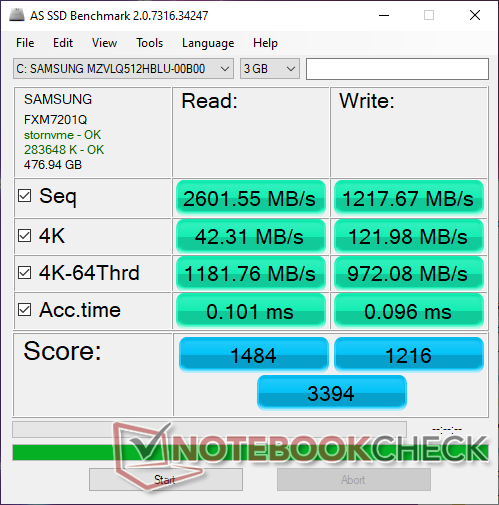
El Samsung PM991a MZVLQ512HBLU es un SSD PCIe 3 NVMe de gama media alta con velocidades teóricas de lectura y escritura secuencial de 3100 MB/s y 1800 MB/s, respectivamente, para ser más lento que el PM981a que puede alcanzar velocidades de hasta 3500 MB/s y 2900 MB/s. Los propietarios pueden instalar hasta dos SSD M.2 NVMe internas.
| Asus ROG Strix G17 G713QE-RB74 Samsung PM991 MZVLQ512HBLU | Acer Nitro 5 AN517-53-54DQ SK Hynix BC711 HFM512GD3HX015N | MSI Katana GF76 11UE Kingston OM8PCP3512F-AB | Asus Strix G17 G712LWS Intel SSD 660p 1TB SSDPEKNW010T8 | Lenovo IdeaPad 5 Pro 16IHU6 Samsung SSD PM981a MZVLB512HBJQ | |
|---|---|---|---|---|---|
| AS SSD | 60% | -42% | -11% | 43% | |
| Seq Read (MB/s) | 2602 | 2859 10% | 1704 -35% | 1778 -32% | 2541 -2% |
| Seq Write (MB/s) | 1218 | 2693 121% | 716 -41% | 1478 21% | 2555 110% |
| 4K Read (MB/s) | 42.31 | 68.8 63% | 37.77 -11% | 49.76 18% | 56 32% |
| 4K Write (MB/s) | 122 | 154.5 27% | 66 -46% | 117.9 -3% | 129.6 6% |
| 4K-64 Read (MB/s) | 1182 | 1860 57% | 441.2 -63% | 591 -50% | 1633 38% |
| 4K-64 Write (MB/s) | 972 | 1680 73% | 735 -24% | 875 -10% | 1863 92% |
| Access Time Read * (ms) | 0.101 | 0.043 57% | 0.191 -89% | 0.082 19% | 0.077 24% |
| Access Time Write * (ms) | 0.096 | 0.028 71% | 0.053 45% | 0.041 57% | 0.029 70% |
| Score Read (Points) | 1484 | 2214 49% | 649 -56% | 818 -45% | 1944 31% |
| Score Write (Points) | 1216 | 2104 73% | 872 -28% | 1140 -6% | 2248 85% |
| Score Total (Points) | 3394 | 5451 61% | 1816 -46% | 2377 -30% | 5192 53% |
| Copy ISO MB/s (MB/s) | 1538 | 912 -41% | 1495 -3% | 2246 46% | |
| Copy Program MB/s (MB/s) | 805 | 278.9 -65% | 446 -45% | 861 7% | |
| Copy Game MB/s (MB/s) | 1418 | 144.6 -90% | 697 -51% | 1552 9% | |
| CrystalDiskMark 5.2 / 6 | 58% | -19% | 4% | 43% | |
| Write 4K (MB/s) | 120.8 | 206.1 71% | 107.3 -11% | 141.1 17% | 203 68% |
| Read 4K (MB/s) | 44.19 | 77.8 76% | 45.46 3% | 60.9 38% | 52.3 18% |
| Write Seq (MB/s) | 1518 | 2842 87% | 978 -36% | 1681 11% | 2138 41% |
| Read Seq (MB/s) | 1828 | 2552 40% | 1255 -31% | 1602 -12% | 1974 8% |
| Write 4K Q32T1 (MB/s) | 492.5 | 583 18% | 579 18% | 406.6 -17% | 640 30% |
| Read 4K Q32T1 (MB/s) | 390.7 | 663 70% | 299.6 -23% | 470.2 20% | 707 81% |
| Write Seq Q32T1 (MB/s) | 1602 | 3014 88% | 978 -39% | 1759 10% | 2973 86% |
| Read Seq Q32T1 (MB/s) | 3086 | 3556 15% | 1977 -36% | 1932 -37% | 3559 15% |
| Media total (Programa/Opciones) | 59% /
59% | -31% /
-34% | -4% /
-6% | 43% /
43% |
* ... más pequeño es mejor

Disk Throttling: DiskSpd Read Loop, Queue Depth 8
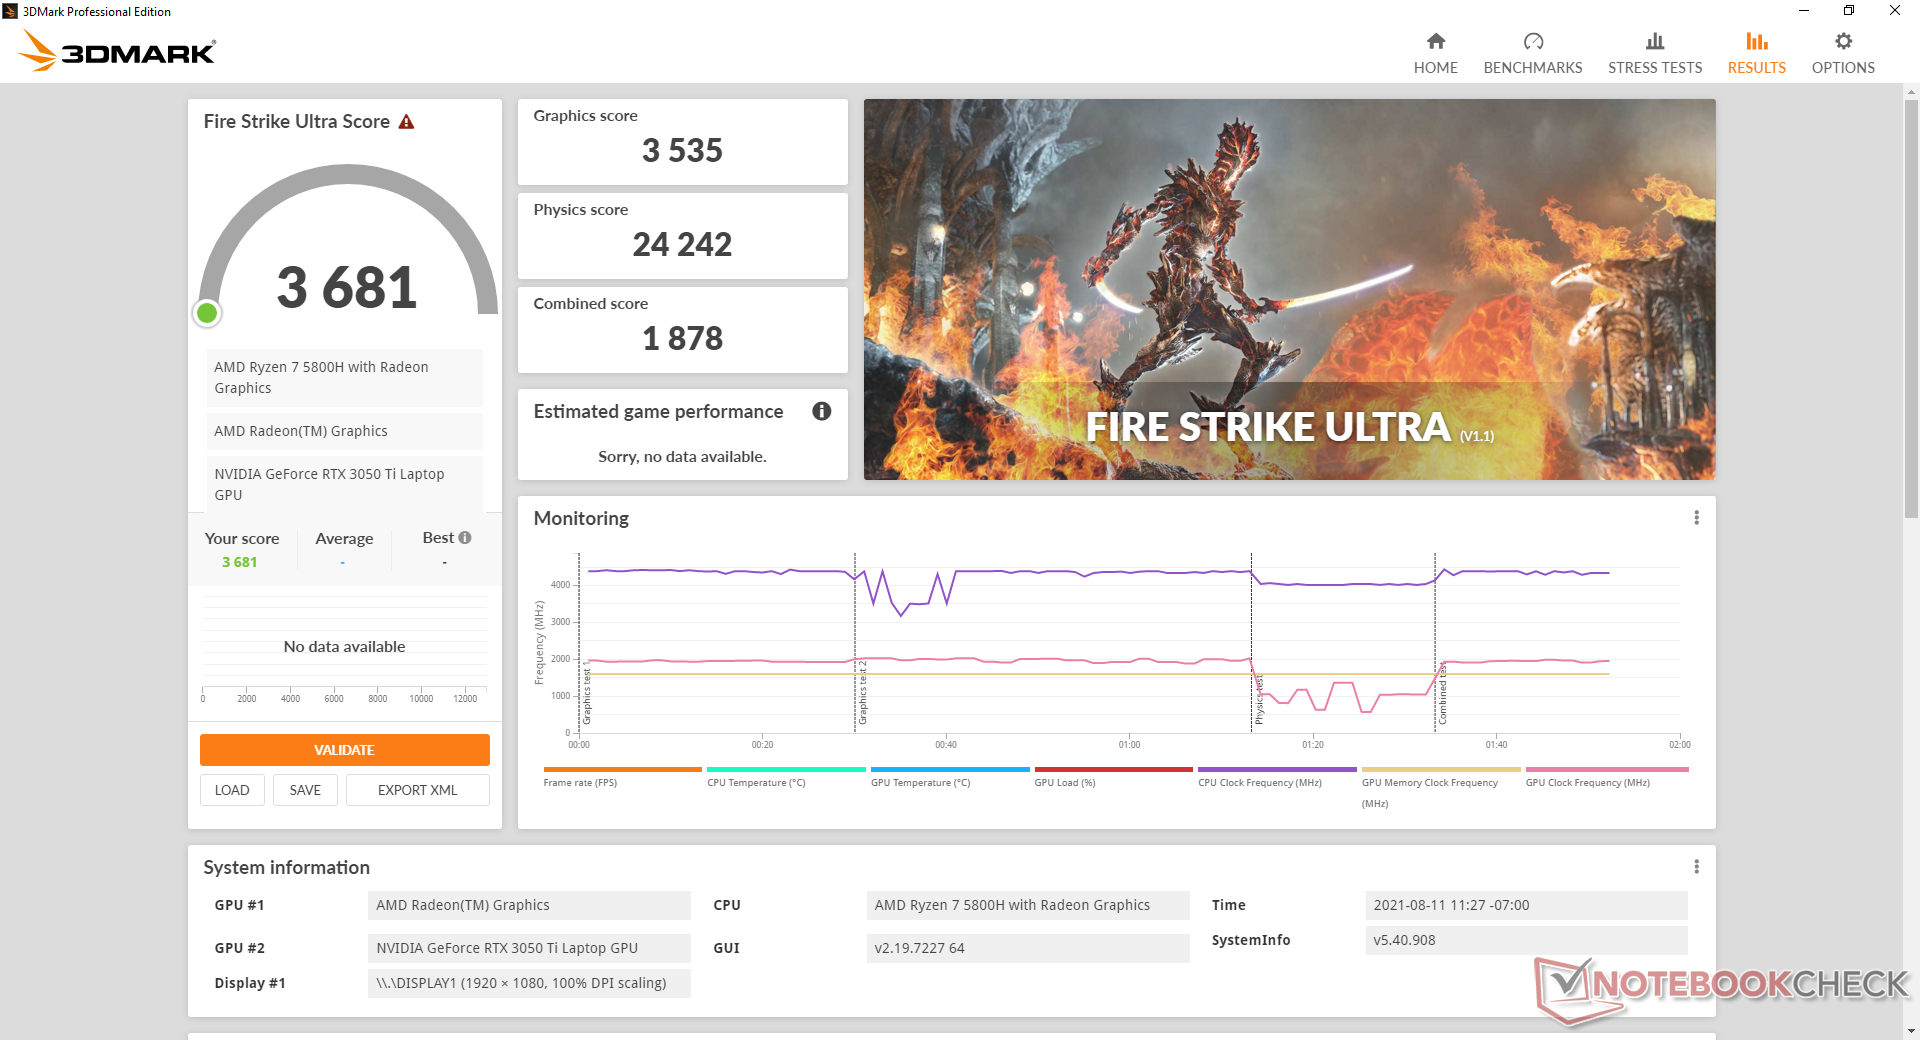
Rendimiento de la GPU: más lenta que la GeForce GTX 1660 Ti
El rendimiento gráfico es decepcionante para una tarjeta gráfica basada en RTX. Los resultados de 3DMark son entre un 16 y un 25 por ciento más rápidos que la RTX 3050 en la Acer Nitro 5 para estar a la par con la menos costosa GeForce GTX 1660 Ti en el mejor de los casos. De hecho, la GTX 1660 Ti sigue superando a nuestra RTX 3050 Ti en la mayoría de los escenarios de juego, especialmente en los ajustes más altos de 1080p. La actualización a la RTX 3060 supondrá para los usuarios una mejora gráfica de entre el 40 y el 50 por ciento.
El rendimiento gráfico se reducirá ligeramente si no se ejecuta en el modo Turbo de Asus, como se ejemplifica en nuestra sección de pruebas de estrés a continuación.
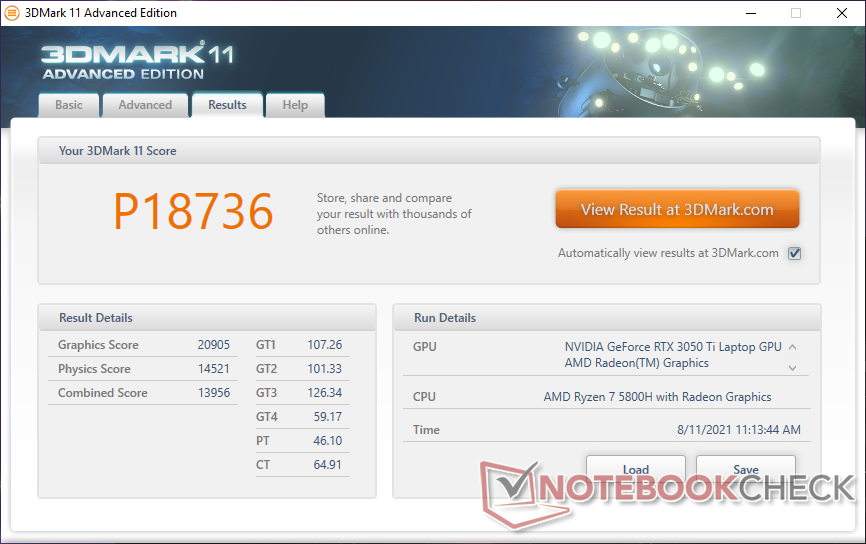
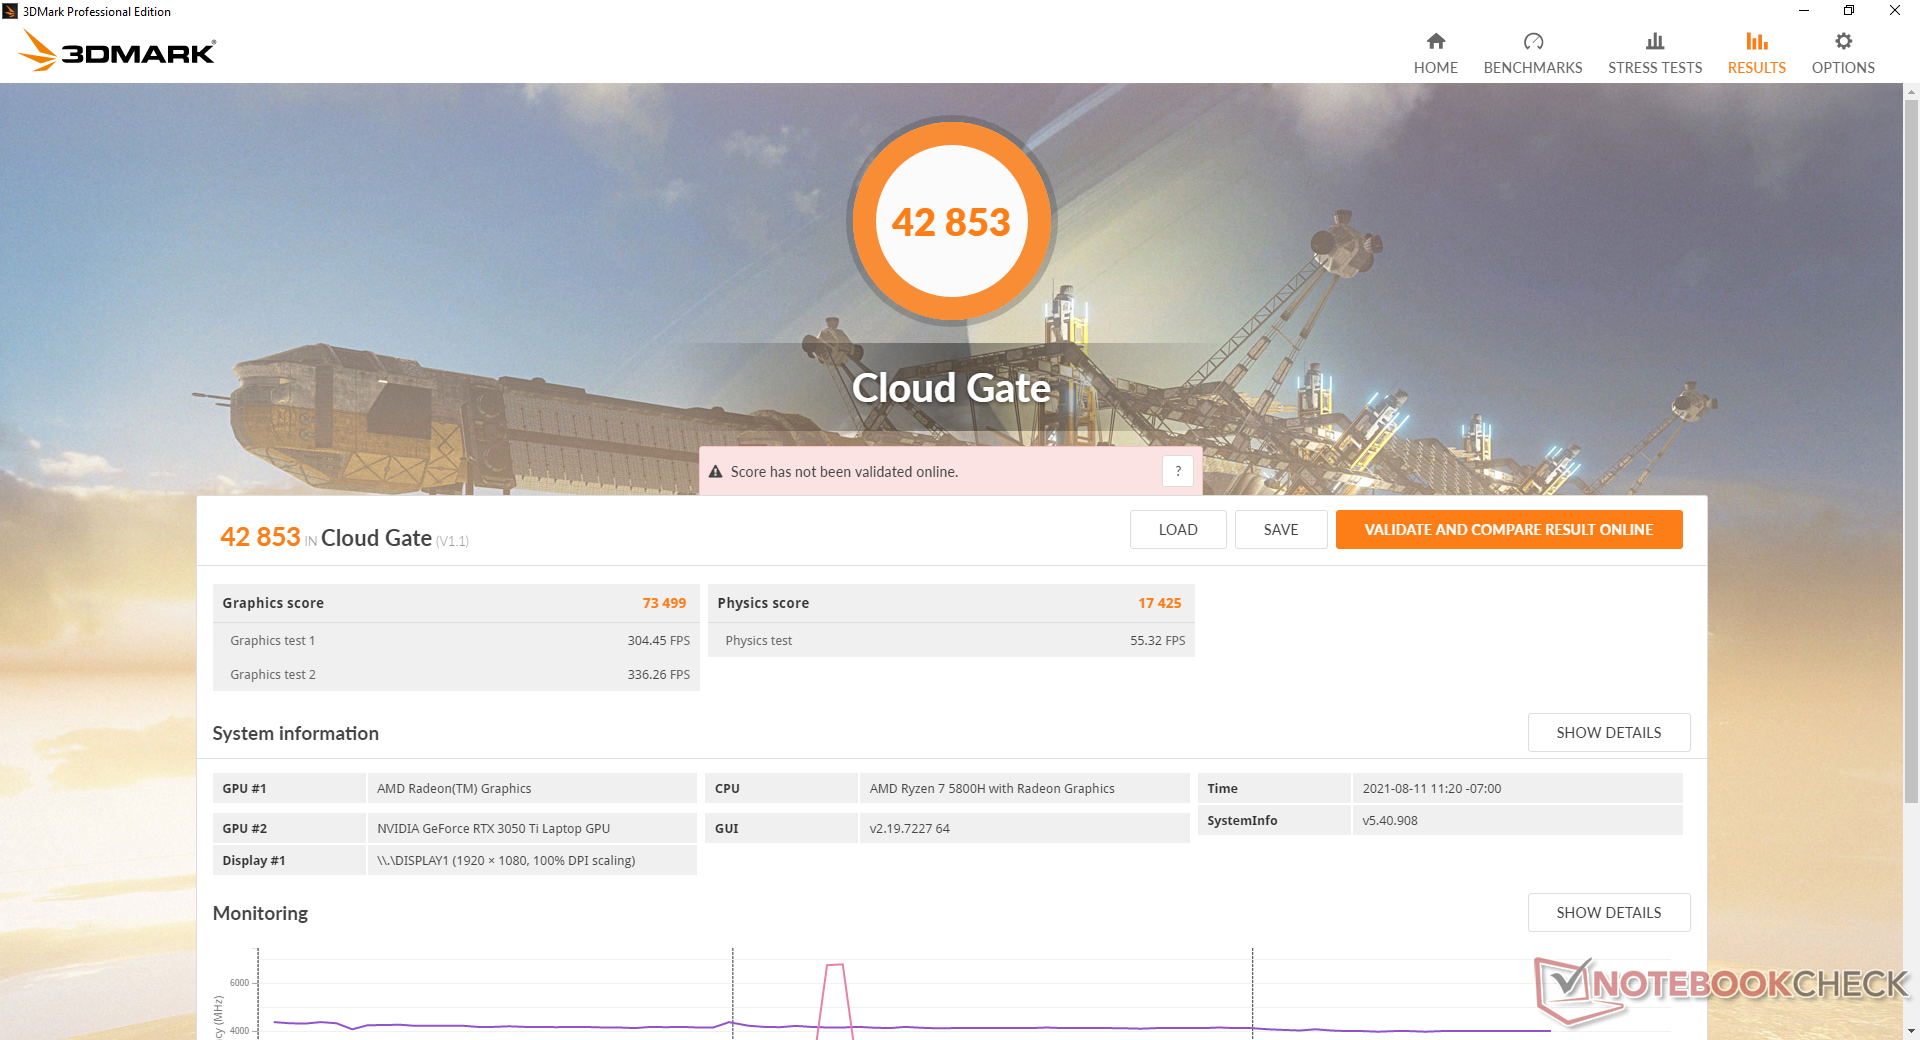
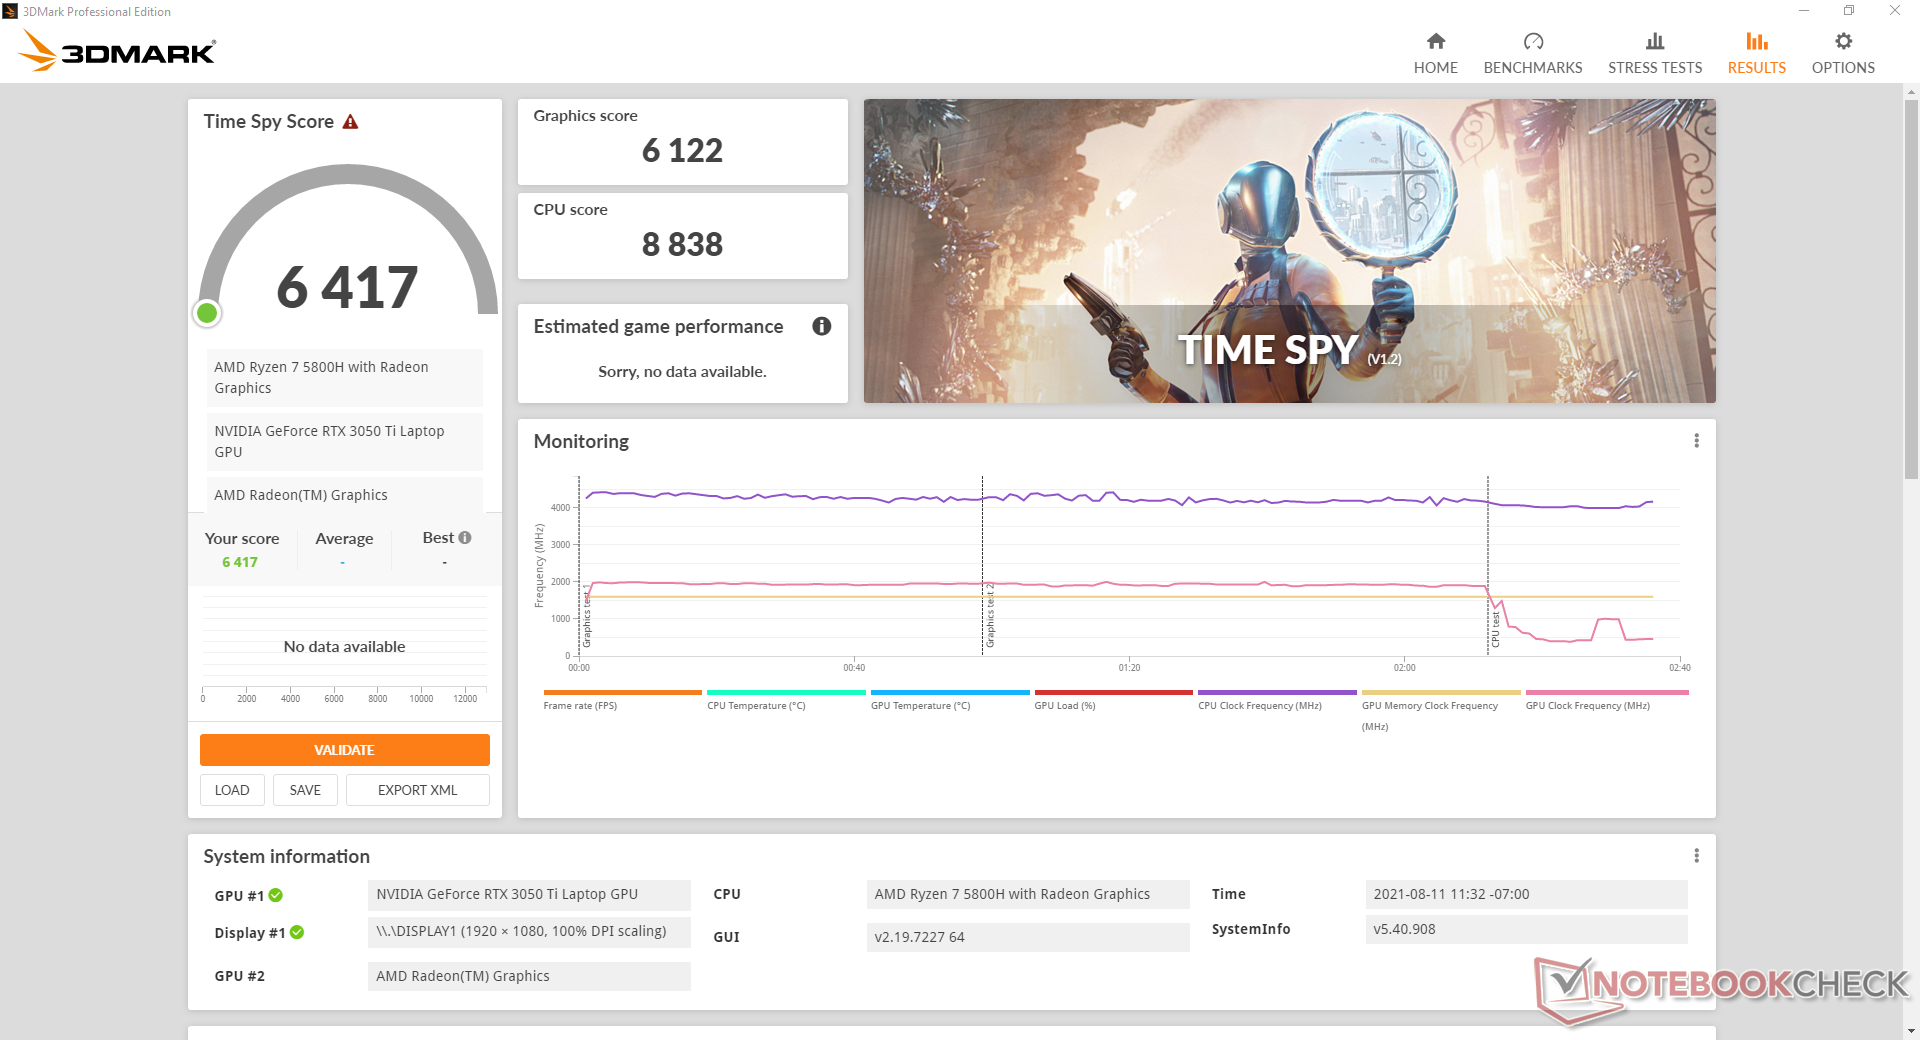
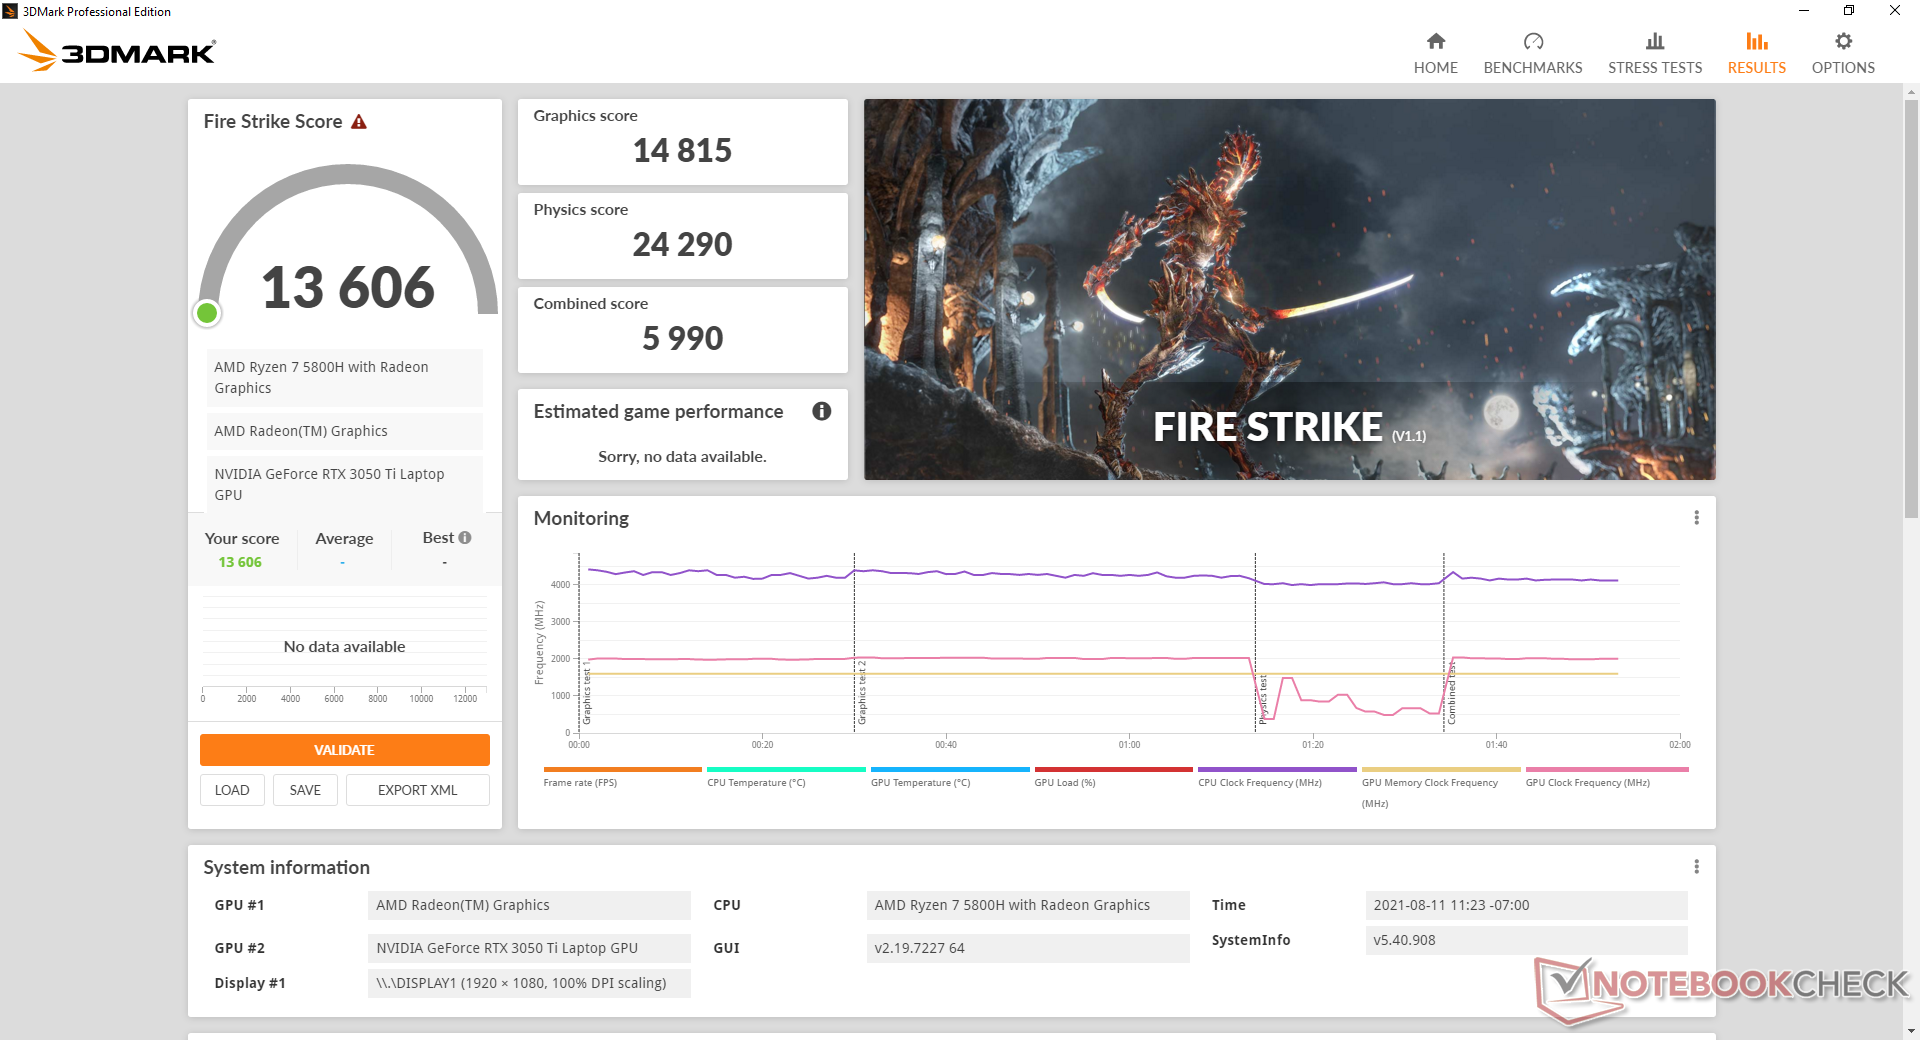
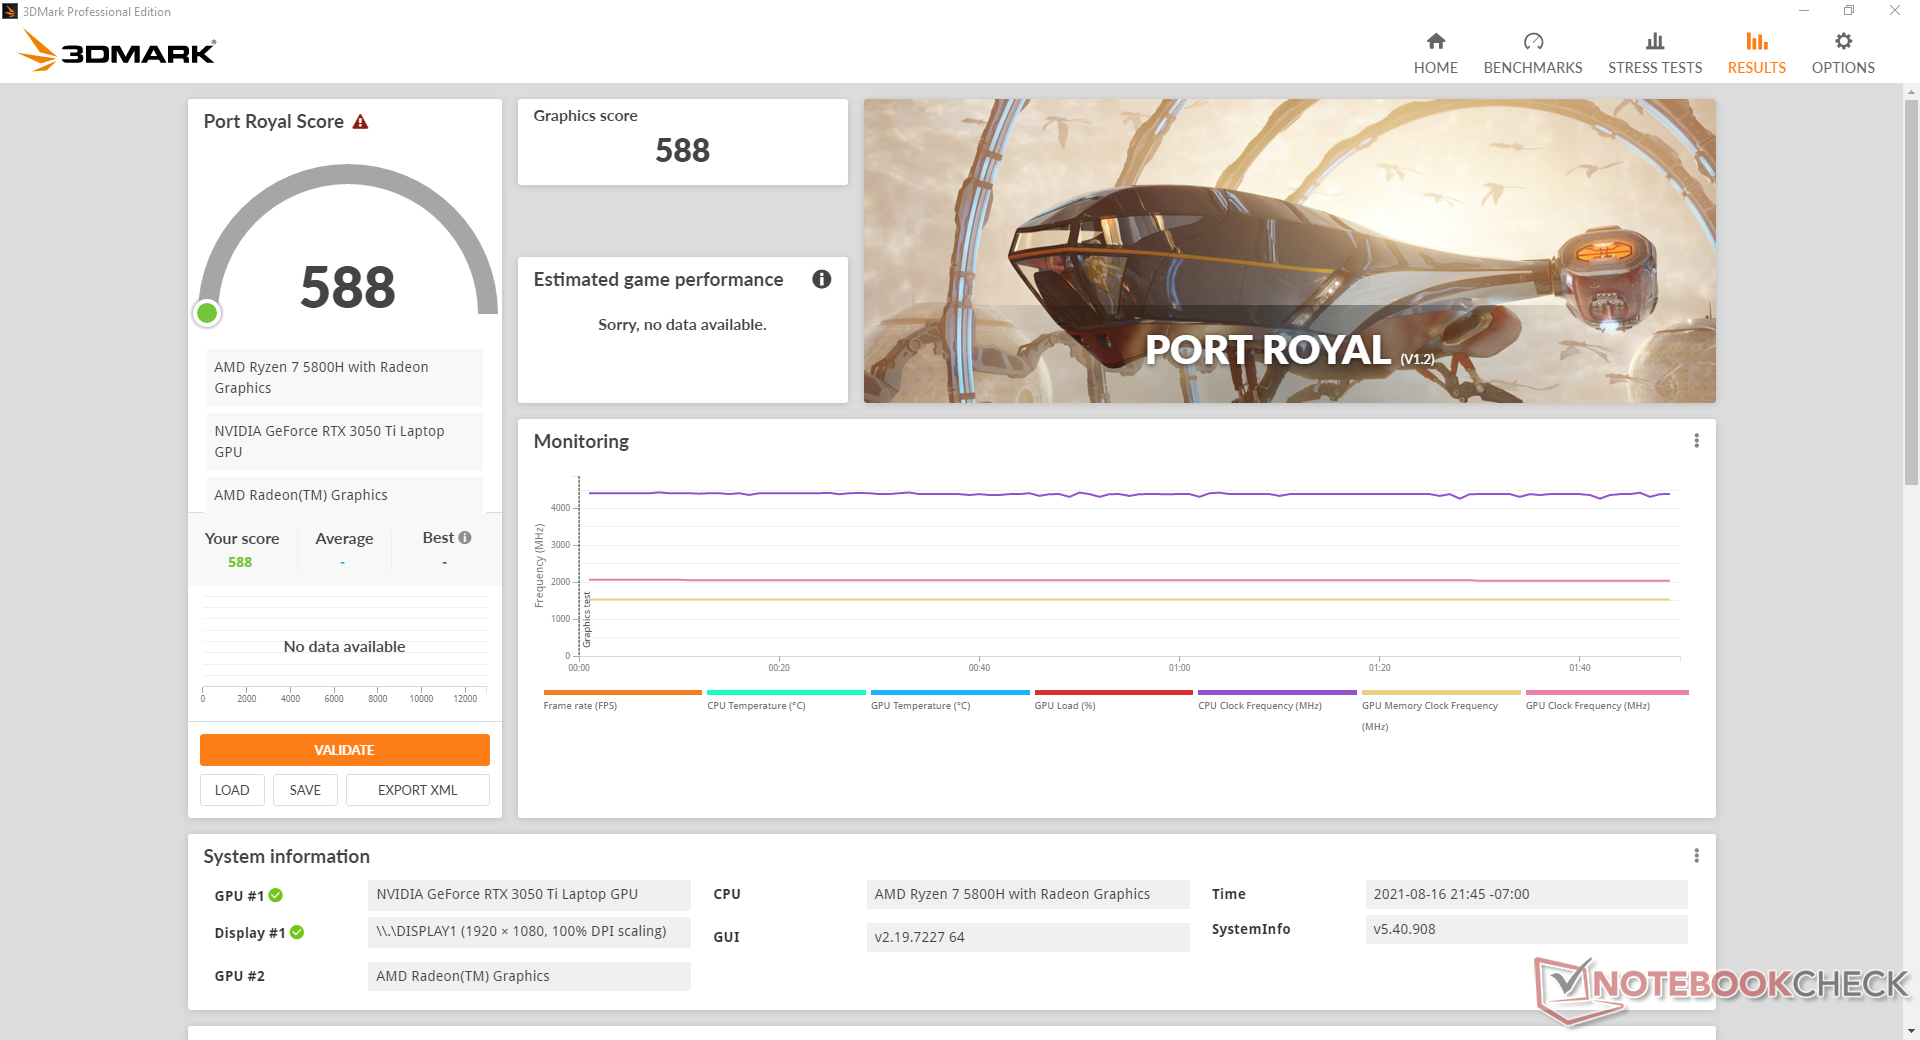
| 3DMark 11 Performance | 18736 puntos | |
| 3DMark Cloud Gate Standard Score | 42853 puntos | |
| 3DMark Fire Strike Score | 13606 puntos | |
| 3DMark Time Spy Score | 6417 puntos | |
ayuda | ||
La ejecución de Witcher 3 durante una hora completa muestra un rendimiento estable, excepto por una caída inesperada a la gama baja de 20 FPS. La caída indica una actividad de fondo que interrumpe el juego y que puede estar relacionada con el software preinstalado de Asus u otras ventanas emergentes. Afortunadamente, esto no ocurre de forma periódica.
Witcher 3 FPS Chart
| bajo | medio | alto | ultra | |
|---|---|---|---|---|
| GTA V (2015) | 172 | 122 | 72.2 | |
| The Witcher 3 (2015) | 262.3 | 104.2 | 58.4 | |
| Dota 2 Reborn (2015) | 134 | 131 | 111 | 107 |
| Final Fantasy XV Benchmark (2018) | 132 | 81.8 | 56.6 | |
| X-Plane 11.11 (2018) | 94.1 | 81.6 | 68.4 | |
| Far Cry 5 (2018) | 125 | 101 | 94 | 89 |
| Strange Brigade (2018) | 227 | 134 | 114 | 100 |
| Shadow of the Tomb Raider (2018) | 115 | 92 | 83 | 72 |
| Far Cry New Dawn (2019) | 94 | 80 | 78 | 70 |
| Metro Exodus (2019) | 126.3 | 71.2 | 55.3 | 43.5 |
| Borderlands 3 (2019) | 123.5 | 88 | 56.8 | 36.8 |
| Gears Tactics (2020) | 125.9 | 136.4 | 90.6 | 64.7 |
| Horizon Zero Dawn (2020) | 52 | 47 | 44 | 41 |
| Watch Dogs Legion (2020) | 44 | 46 | 42 | 28 |
| Dirt 5 (2020) | 111.8 | 77.4 | 67.3 | 53.3 |
| Assassin´s Creed Valhalla (2020) | 84 | 53 | 34 | 24 |
| Immortals Fenyx Rising (2020) | 89 | 73 | 58 | 54 |
| Hitman 3 (2021) | 121.3 | 95.3 | 82.7 | 79.8 |
| F1 2021 (2021) | 200 | 141 | 125 | 69 |
Emissions — Loud Only When Gaming
Ruido del sistema
El ruido de los ventiladores está estrechamente ligado a los perfiles de potencia del Armoury Crate. Esta vez, sin embargo, Asus parece haber mejorado el comportamiento de los ventiladores. Mientras que los ventiladores de los modelos Strix más antiguos aumentaban las revoluciones al máximo automáticamente cuando se ponían en modo Turbo, parecen ser más silenciosos sin importar el modo hasta que se necesita la potencia extra. Los usuarios pueden transmitir vídeos y realizar otras tareas ligeras en modo Turbo sin que los ventiladores pulsen constantemente.
Hay una diferencia notable en el ruido de los ventiladores entre el modo Rendimiento y el modo Turbo. Jugar en el modo Rendimiento produce un ruido de ventilador constante de 46,4 dB(A), mientras que el modo Turbo lo eleva a 49,9 dB(A). Los ventiladores más ruidosos vienen acompañados de un rendimiento gráfico más rápido, como se muestra en nuestra sección de pruebas de estrés más abajo.
| Asus ROG Strix G17 G713QE-RB74 GeForce RTX 3050 Ti Laptop GPU, R7 5800H, Samsung PM991 MZVLQ512HBLU | Acer Nitro 5 AN517-53-54DQ GeForce RTX 3050 4GB Laptop GPU, i5-11300H, SK Hynix BC711 HFM512GD3HX015N | MSI Katana GF76 11UE GeForce RTX 3060 Laptop GPU, i7-11800H, Kingston OM8PCP3512F-AB | Asus Strix Scar 17 G733QSA-XS99 GeForce RTX 3080 Laptop GPU, R9 5900HX, 2x Samsung PM981a MZVLB1T0HBLR (RAID 0) | MSI Alpha 17 A4DEK Radeon RX 5600M, R7 4800H, Kingston OM8PCP3512F-AB | Asus Strix G17 G712LWS GeForce RTX 2070 Super Mobile, i7-10750H, Intel SSD 660p 1TB SSDPEKNW010T8 | |
|---|---|---|---|---|---|---|
| Noise | -8% | -23% | 1% | -12% | -22% | |
| apagado / medio ambiente * (dB) | 24.9 | 25 -0% | 25 -0% | 25 -0% | 25 -0% | 25 -0% |
| Idle Minimum * (dB) | 25.1 | 25 -0% | 33 -31% | 25.2 -0% | 31 -24% | 32 -27% |
| Idle Average * (dB) | 25.1 | 31 -24% | 34 -35% | 25.2 -0% | 32 -27% | 34 -35% |
| Idle Maximum * (dB) | 25.1 | 33 -31% | 35 -39% | 25.2 -0% | 33 -31% | 37 -47% |
| Load Average * (dB) | 36.3 | 43 -18% | 53 -46% | 30.7 15% | 38 -5% | 51 -40% |
| Witcher 3 ultra * (dB) | 49.9 | 44 12% | 49 2% | 51.3 -3% | 46 8% | 50 -0% |
| Load Maximum * (dB) | 49.9 | 47 6% | 57 -14% | 51.3 -3% | 54 -8% | 53 -6% |
* ... más pequeño es mejor
Ruido
| Ocioso |
| 25.1 / 25.1 / 25.1 dB(A) |
| Carga |
| 36.3 / 49.9 dB(A) |
 | ||
30 dB silencioso 40 dB(A) audible 50 dB(A) ruidosamente alto |
||
min: | ||
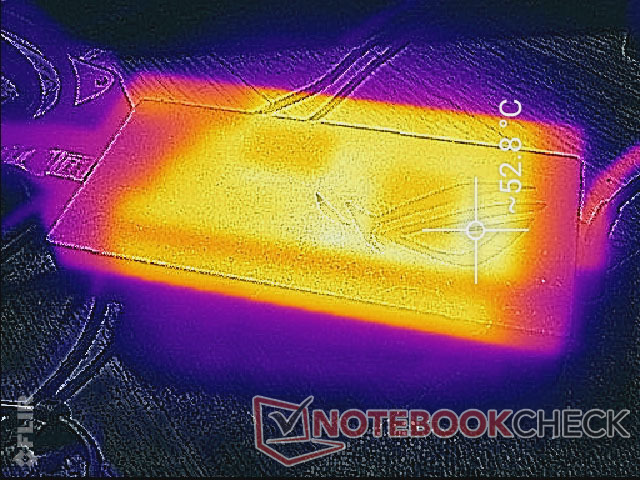
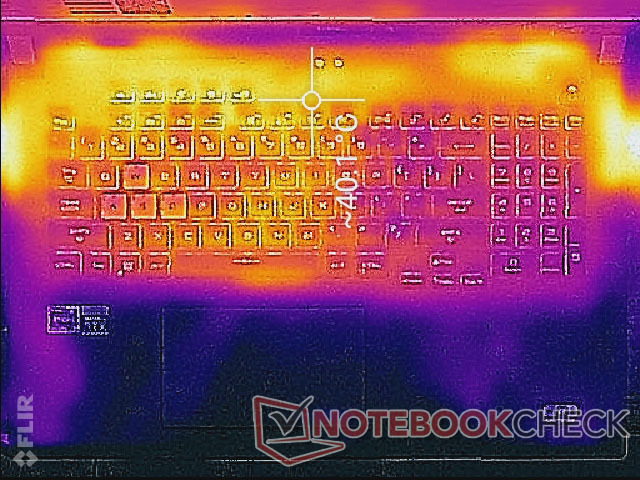
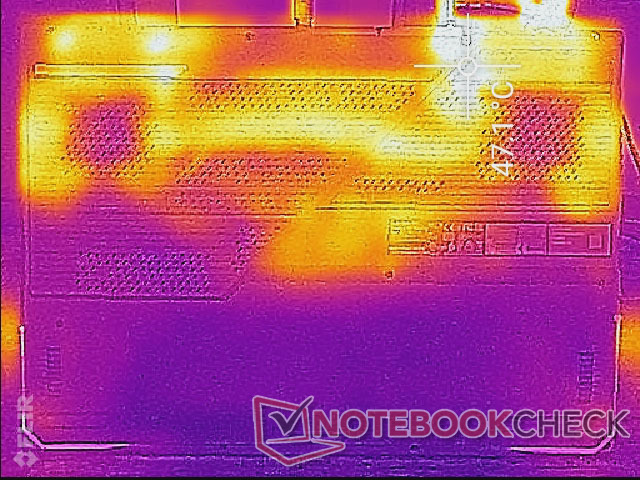
Temperatura - Casi siempre cálida
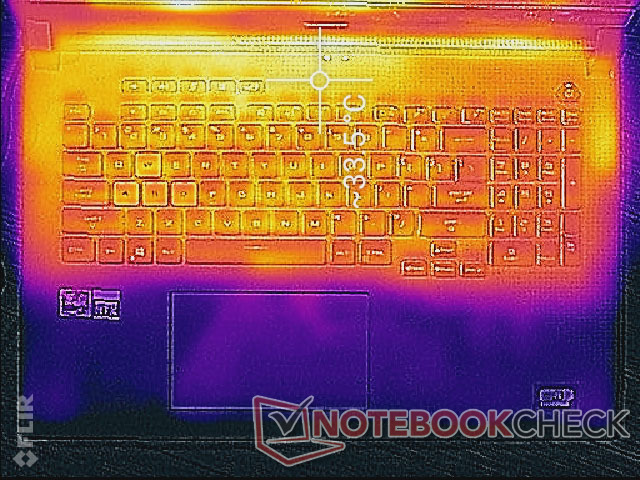
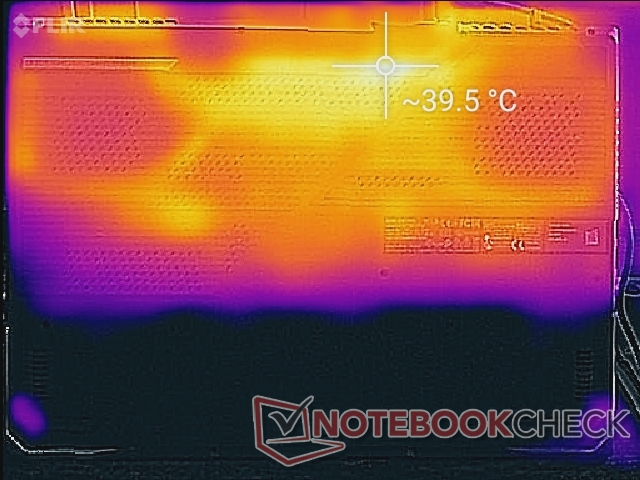
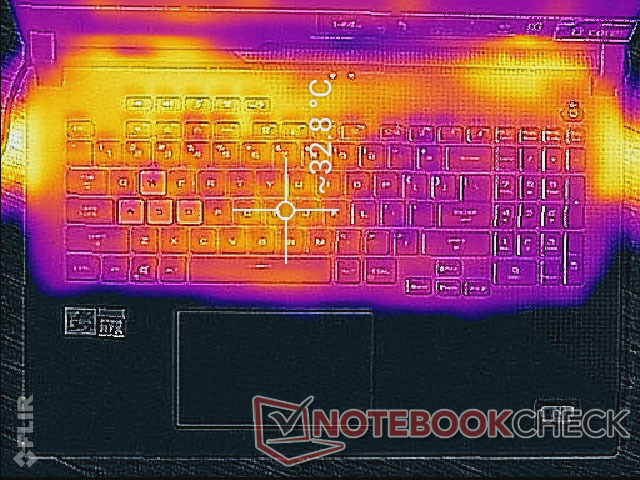
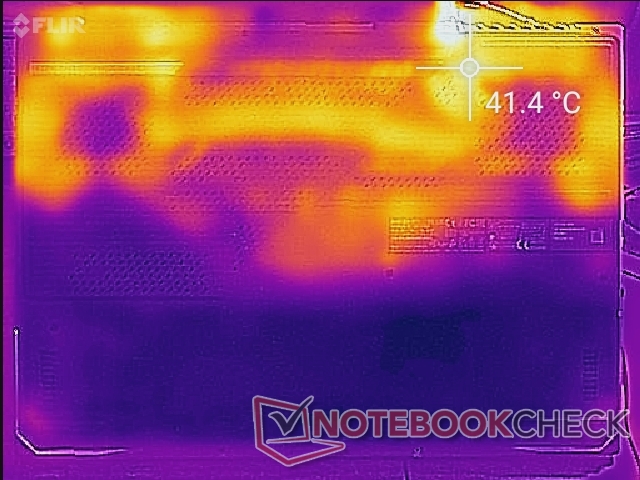
Las temperaturas de la superficie son frías en los cuadrantes delanteros y se van calentando hacia la parte trasera. Dado que a los ventiladores internos les gusta estar inactivos cuando las cargas de procesamiento son bajas, los puntos calientes están en el lado más cálido, hasta 33 C y 40 C en los puntos calientes superiores e inferiores, respectivamente
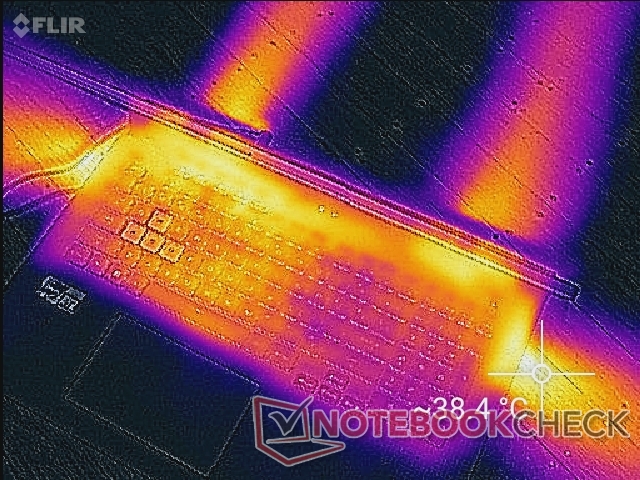
(±) La temperatura máxima en la parte superior es de 43.8 °C / 111 F, frente a la media de 40.4 °C / 105 F, que oscila entre 21.2 y 68.8 °C para la clase Gaming.
(-) El fondo se calienta hasta un máximo de 47.2 °C / 117 F, frente a la media de 43.2 °C / 110 F
(+) En reposo, la temperatura media de la parte superior es de 29.5 °C / 85# F, frente a la media del dispositivo de 33.9 °C / 93 F.
(+) Jugando a The Witcher 3, la temperatura media de la parte superior es de 28.8 °C / 84 F, frente a la media del dispositivo de 33.9 °C / 93 F.
(+) El reposamanos y el panel táctil están a una temperatura inferior a la de la piel, con un máximo de 29.6 °C / 85.3 F y, por tanto, son fríos al tacto.
(±) La temperatura media de la zona del reposamanos de dispositivos similares fue de 28.8 °C / 83.8 F (-0.8 °C / -1.5 F).
Prueba de esfuerzo - Excelente sostenibilidad del refuerzo de la CPU
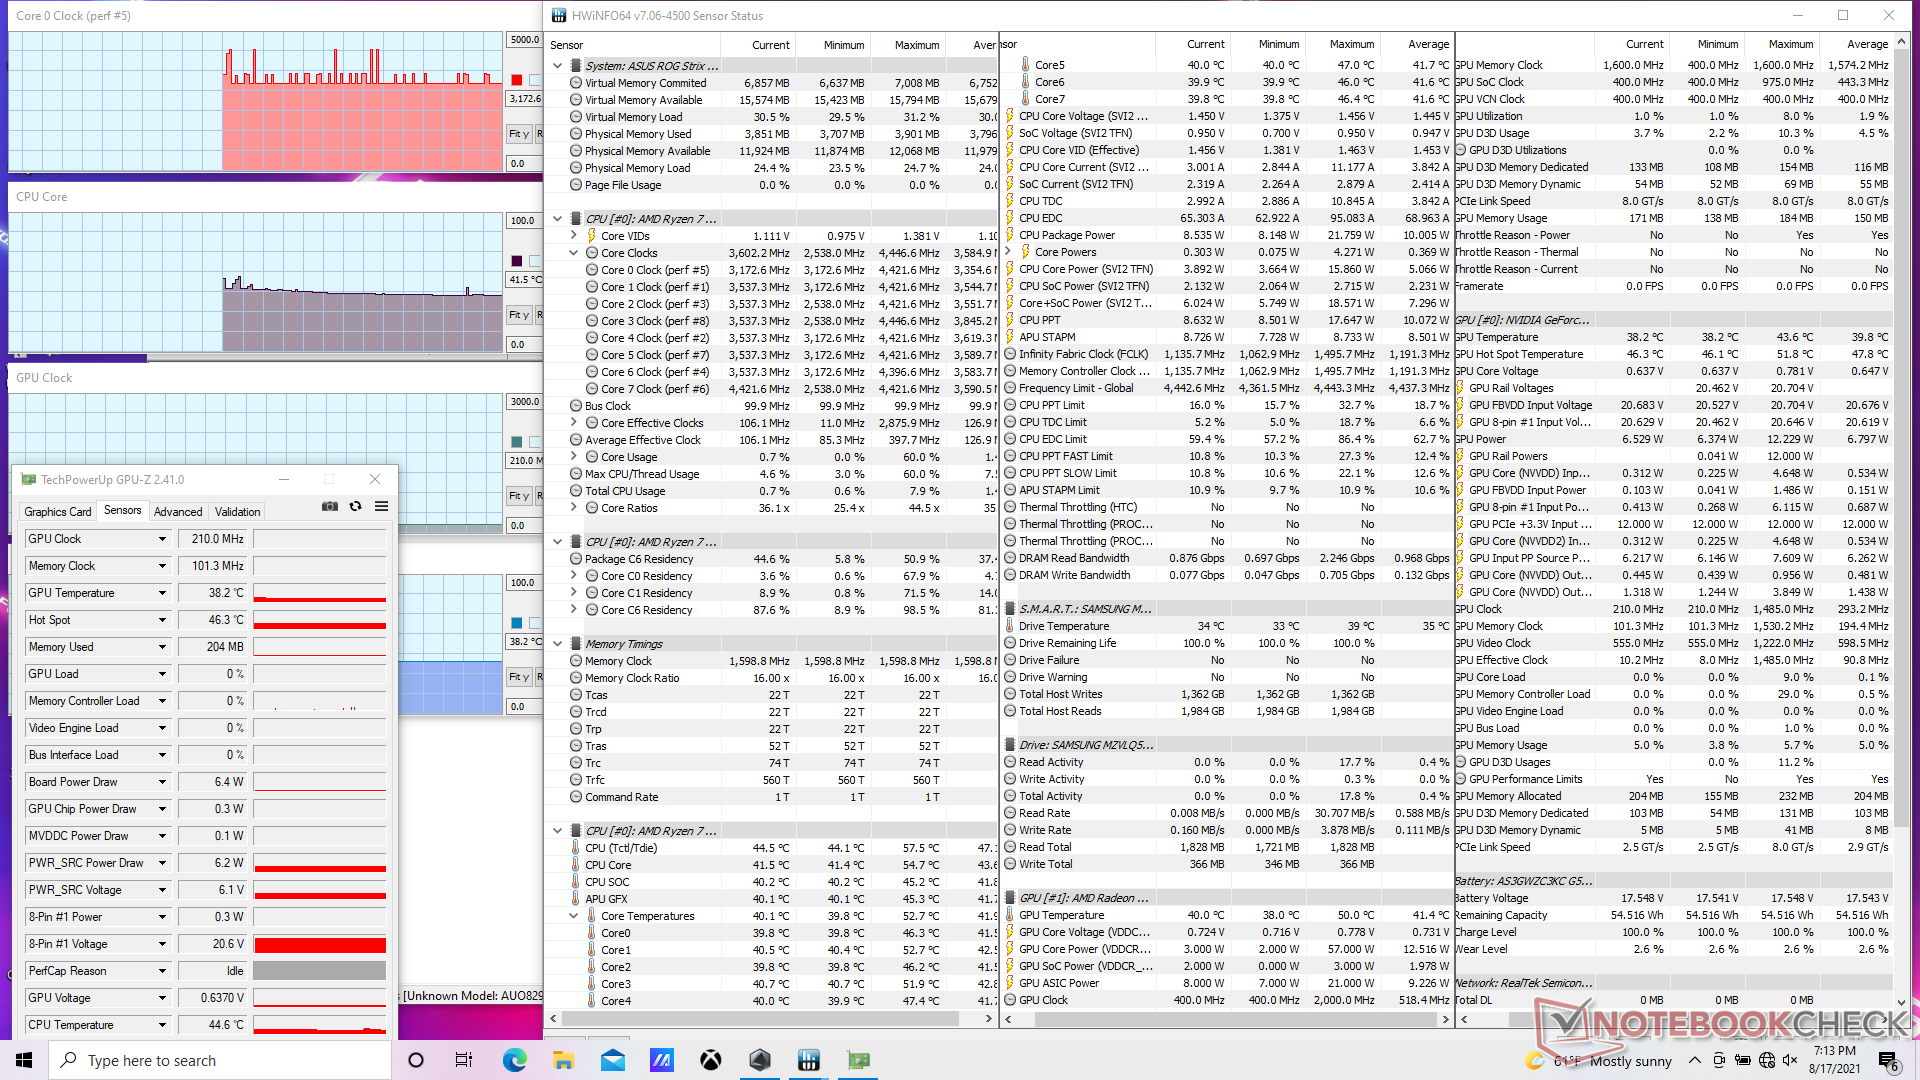
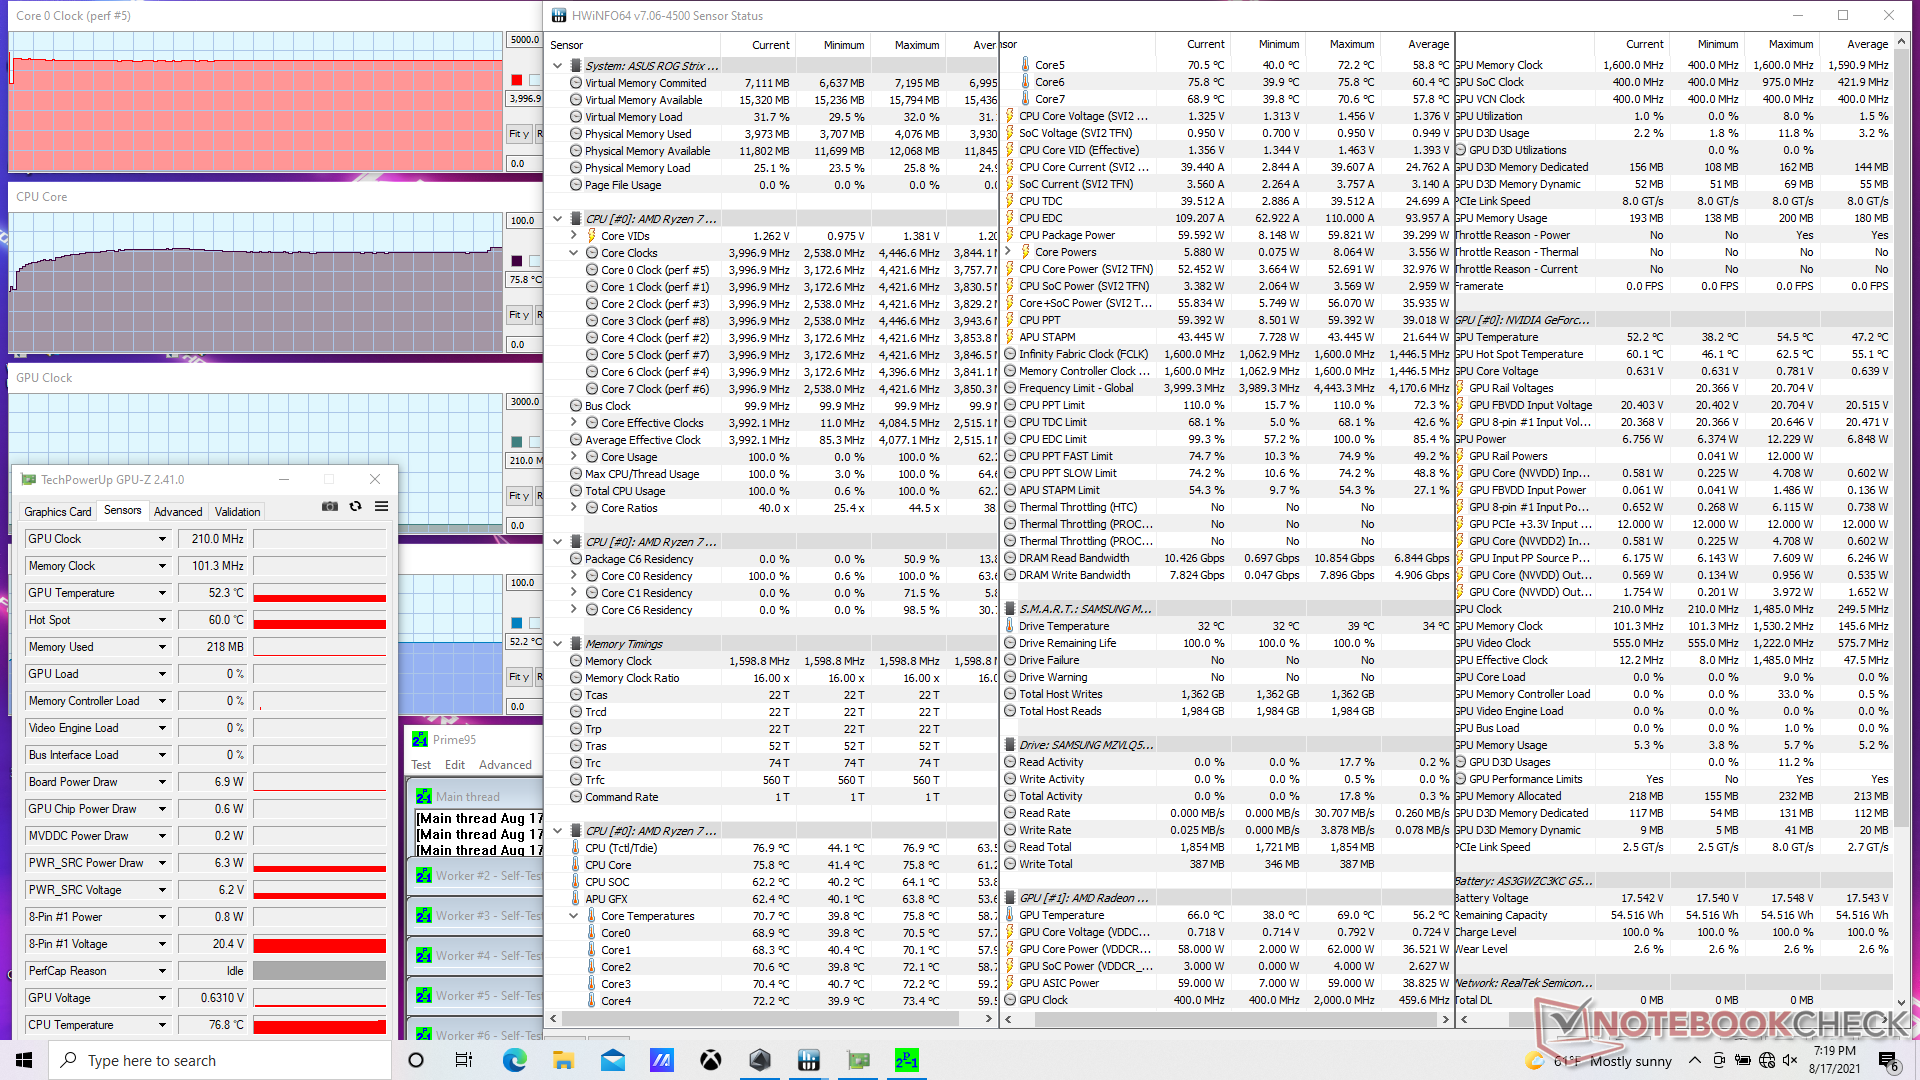
Bajo el estrés de Prime95, la CPU se elevó a 4,1 GHz momentáneamente antes de estabilizarse en 4 GHz y 76 C. La velocidad máxima de Boost del Ryzen 7 5800H es de 4,4 GHz, por lo que los 4 GHz estables son respetables. La CPU alcanza un máximo de 84 C cuando se somete a cargas extremas durante mucho tiempo.
La CPU y la GPU se estabilizan a 72 C y 78 C, respectivamente, cuando se ejecutan Witcher 3. Curiosamente, estas temperaturas se mantienen más o menos igual sin importar la configuración del modo Turbo, pero la mayoría de los jugadores querrán activar el modo Turbo de todos modos, ya que las velocidades de reloj de la GPU y la memoria se vuelven ligeramente más rápidas (de 1845 MHz a 1972 MHz en la GPU y de 1500 MHz a 1530 MHz en la memoria) a costa de ventiladores más ruidosos. El consumo máximo de energía de la GPU también salta de 80 W a 90 W cuando está en modo Turbo, lo que se acerca al anuncio de Asus de una GPU TGP de 95 W.
Funcionar con batería limitará el rendimiento gráfico, especialmente porque el modo Turbo sólo está disponible cuando está conectado a la red eléctrica. Un test 3DMark 11 en batería devolvería unas puntuaciones de Física y Gráficos de 13986 y 12434 puntos, respectivamente, comparado con los 14521 y 20905 puntos cuando está conectado a la red.
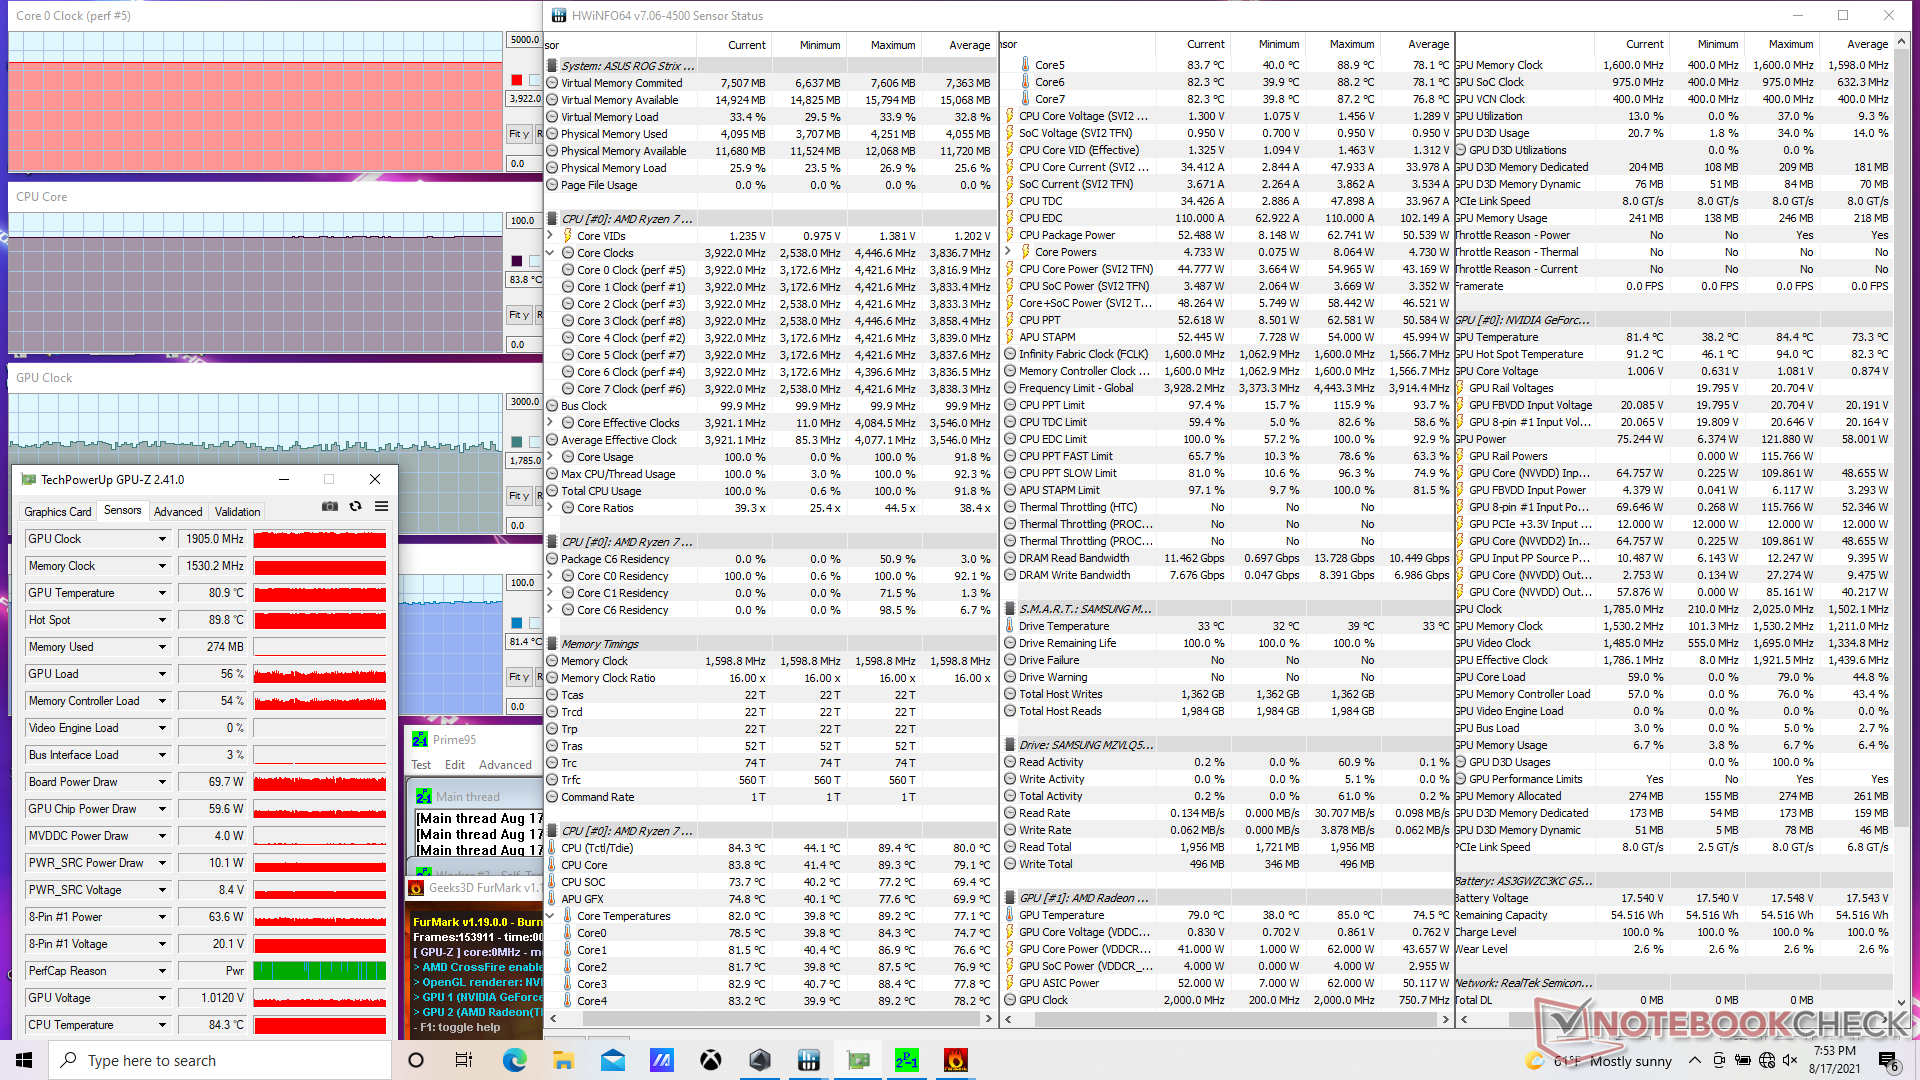
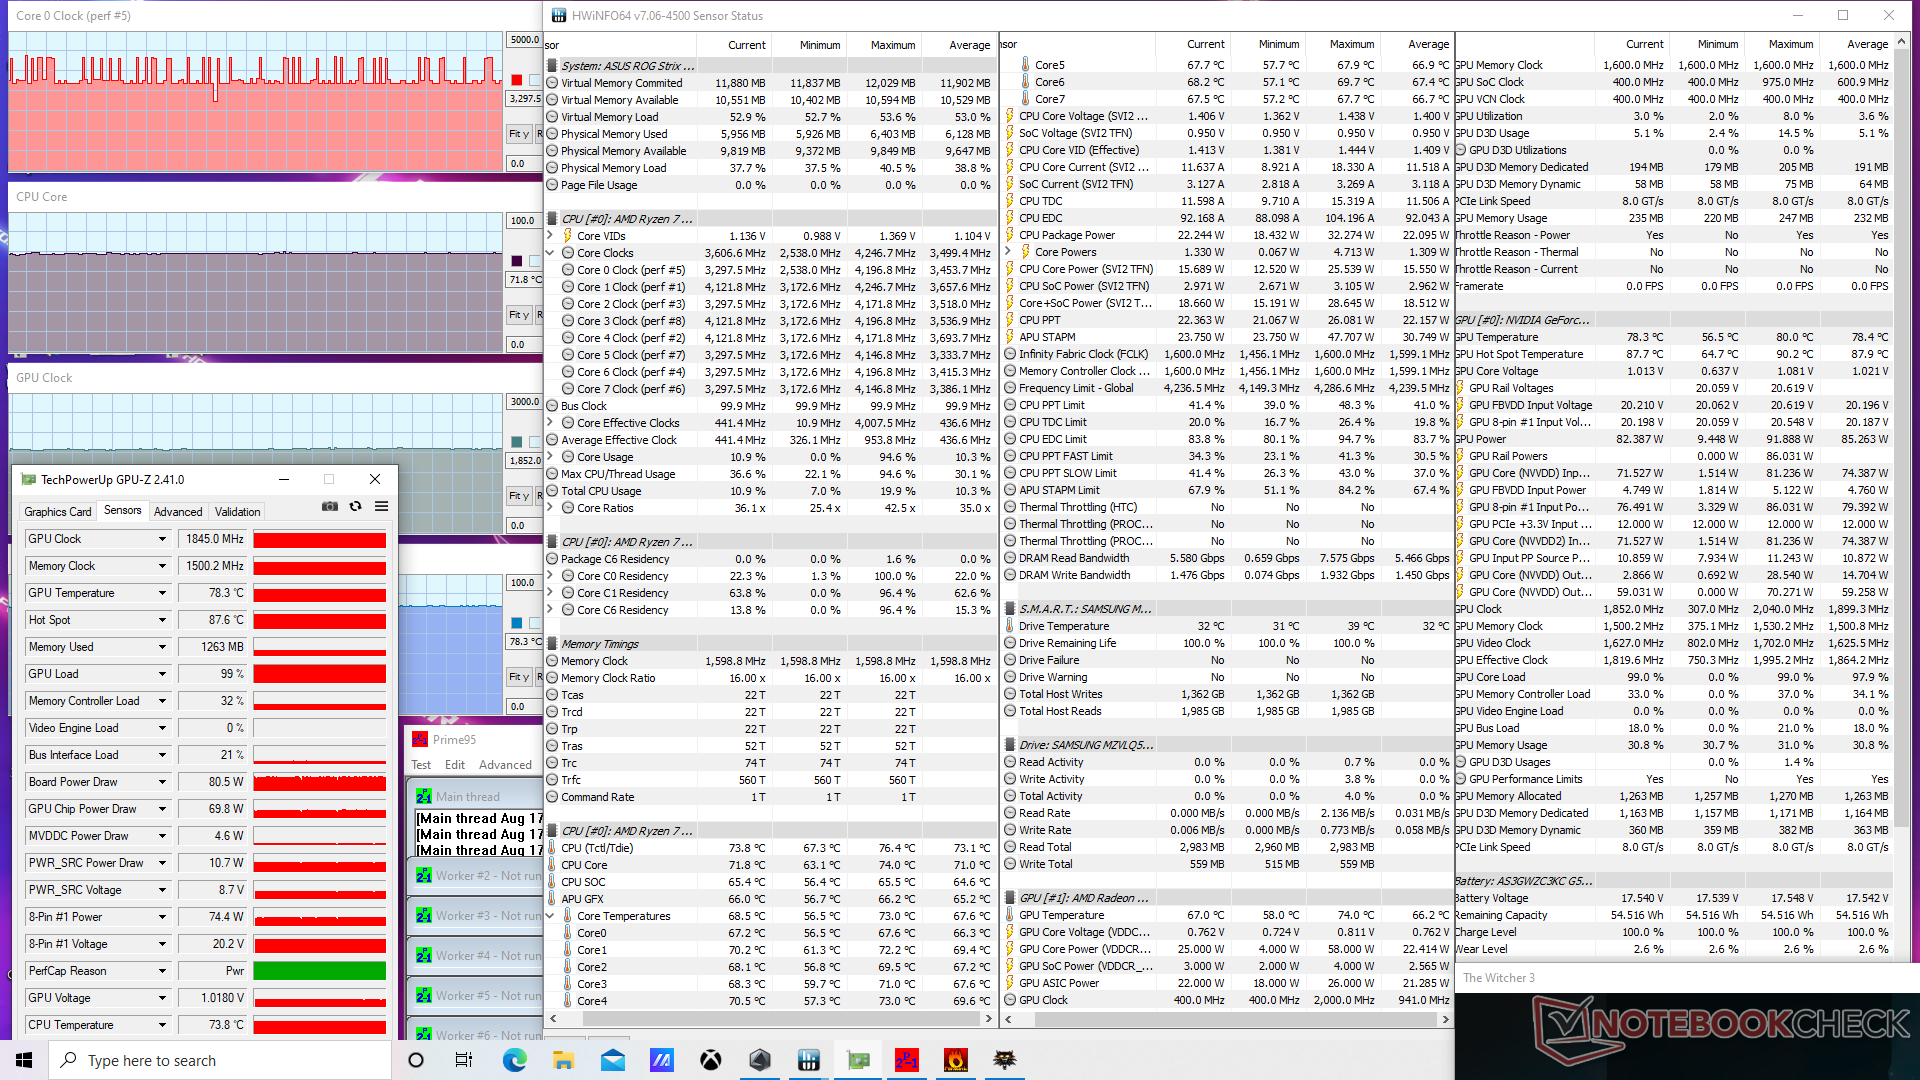
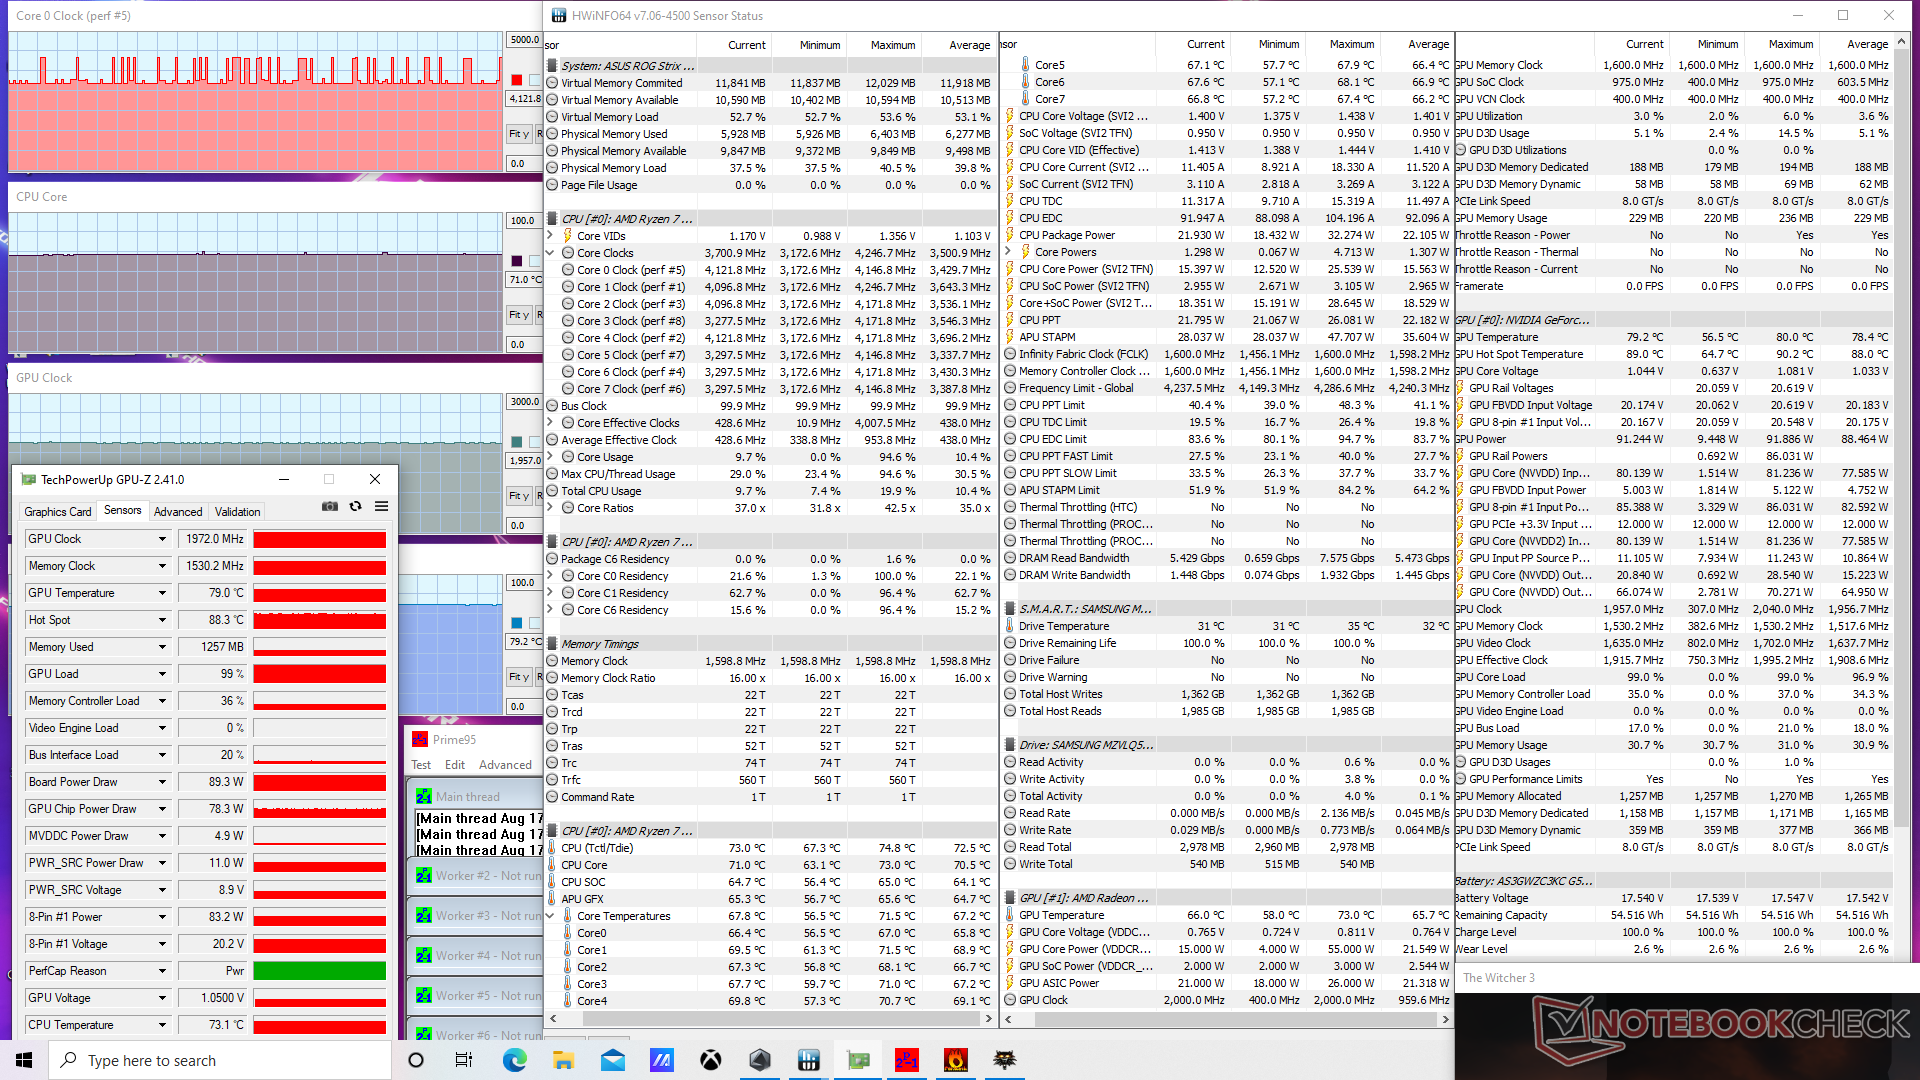
| Relojde la CPU(GHz) | Reloj dela GPU(MHz) | Temperatura media de la CPU (°C) | Temperaturamediade la GPU (°C) | |
| Sistema en reposo | 42 | 38 | ||
| Estrés de Prime95(Turbo activado) | 4.0 | -- | 76 | 52 |
| Estrés de Prime95+ FurMark (Turbo activado) | 3,9 | 1905 | 84 | 81 |
| Witcher 3 Estrés (Turbo off) | 3,3 - 4,1 | 1845 | 72 | 78 |
| Witcher 3 Estrés (Turbo on) | 3,3 - 4,1 | 1972 | 71 | 79 |
Altavoces
Los altavoces estéreo de 2 W son relativamente débiles. Incluso los altavoces del más pequeño de 13 pulgadas HP Pavilion Aero 13 son más fuertes y tienen un rango más amplio que los de nuestro Strix G17.


Asus ROG Strix G17 G713QE-RB74 análisis de audio
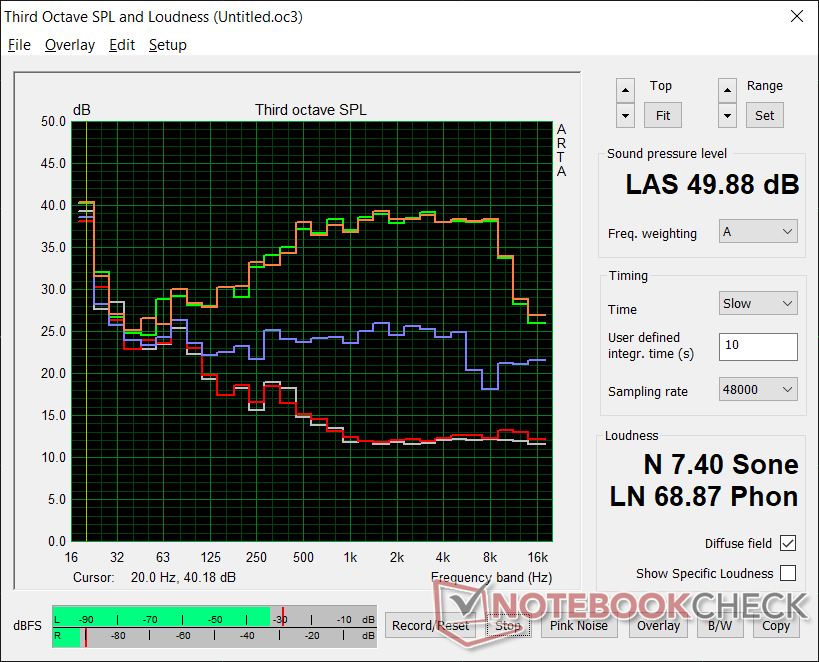
(±) | la sonoridad del altavoz es media pero buena (73.5 dB)
Graves 100 - 315 Hz
(±) | lubina reducida - en promedio 13% inferior a la mediana
(±) | la linealidad de los graves es media (9.8% delta a frecuencia anterior)
Medios 400 - 2000 Hz
(±) | medias más altas - de media 5.6% más altas que la mediana
(+) | los medios son lineales (6.5% delta a la frecuencia anterior)
Altos 2 - 16 kHz
(+) | máximos equilibrados - a sólo 3.4% de la mediana
(±) | la linealidad de los máximos es media (12% delta a frecuencia anterior)
Total 100 - 16.000 Hz
(±) | la linealidad del sonido global es media (16.9% de diferencia con la mediana)
En comparación con la misma clase
» 44% de todos los dispositivos probados de esta clase eran mejores, 11% similares, 45% peores
» El mejor tuvo un delta de 6%, la media fue 18%, el peor fue ###max##%
En comparación con todos los dispositivos probados
» 30% de todos los dispositivos probados eran mejores, 8% similares, 62% peores
» El mejor tuvo un delta de 4%, la media fue 24%, el peor fue ###max##%
Apple MacBook 12 (Early 2016) 1.1 GHz análisis de audio
(+) | los altavoces pueden reproducir a un volumen relativamente alto (#83.6 dB)
Graves 100 - 315 Hz
(±) | lubina reducida - en promedio 11.3% inferior a la mediana
(±) | la linealidad de los graves es media (14.2% delta a frecuencia anterior)
Medios 400 - 2000 Hz
(+) | medios equilibrados - a sólo 2.4% de la mediana
(+) | los medios son lineales (5.5% delta a la frecuencia anterior)
Altos 2 - 16 kHz
(+) | máximos equilibrados - a sólo 2% de la mediana
(+) | los máximos son lineales (4.5% delta a la frecuencia anterior)
Total 100 - 16.000 Hz
(+) | el sonido global es lineal (10.2% de diferencia con la mediana)
En comparación con la misma clase
» 7% de todos los dispositivos probados de esta clase eran mejores, 2% similares, 91% peores
» El mejor tuvo un delta de 5%, la media fue 18%, el peor fue ###max##%
En comparación con todos los dispositivos probados
» 5% de todos los dispositivos probados eran mejores, 1% similares, 94% peores
» El mejor tuvo un delta de 4%, la media fue 24%, el peor fue ###max##%
Energy Management — Poor GPU Performance-per-Watt
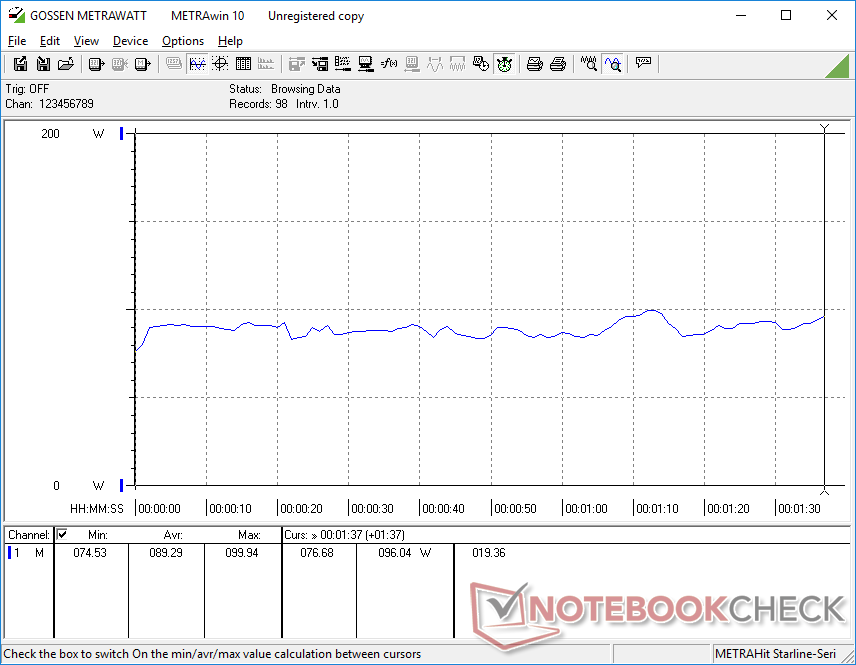
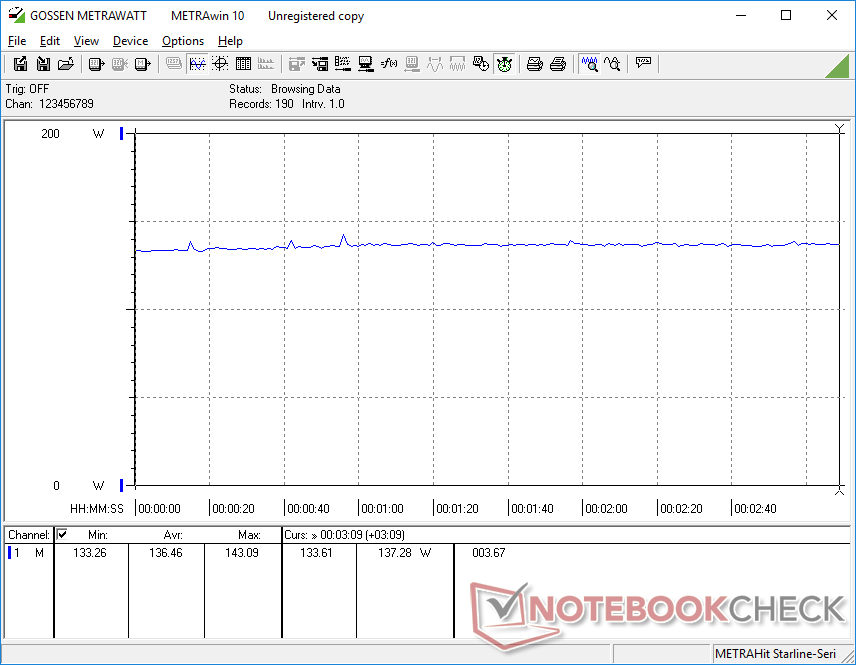
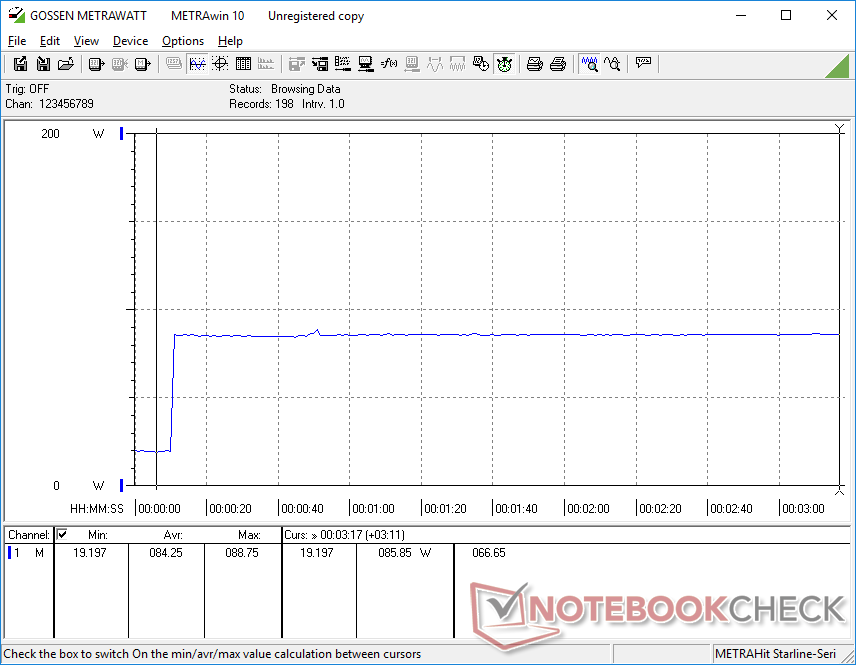
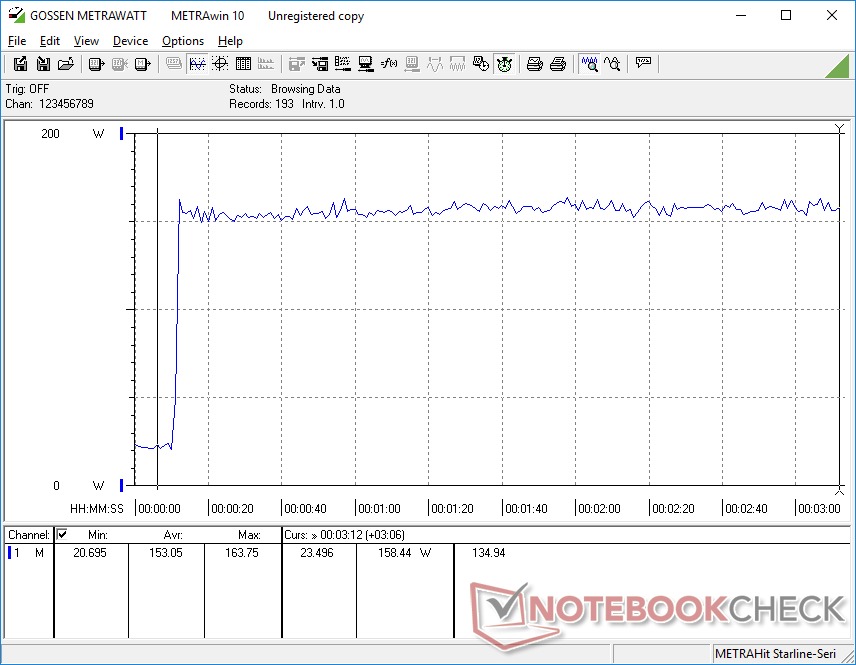
Consumo de energía
El consumo general de energía se acerca a lo que observamos en el MSI Katana con la GPU RTX 3060 más rápida. Ejecutando Witcher 3 consumiría alrededor de un 9 por ciento menos de energía en nuestro Asus a pesar de su déficit de rendimiento gráfico del 30 por ciento para mostrar un menor rendimiento por vatio de la RTX 3050 Ti
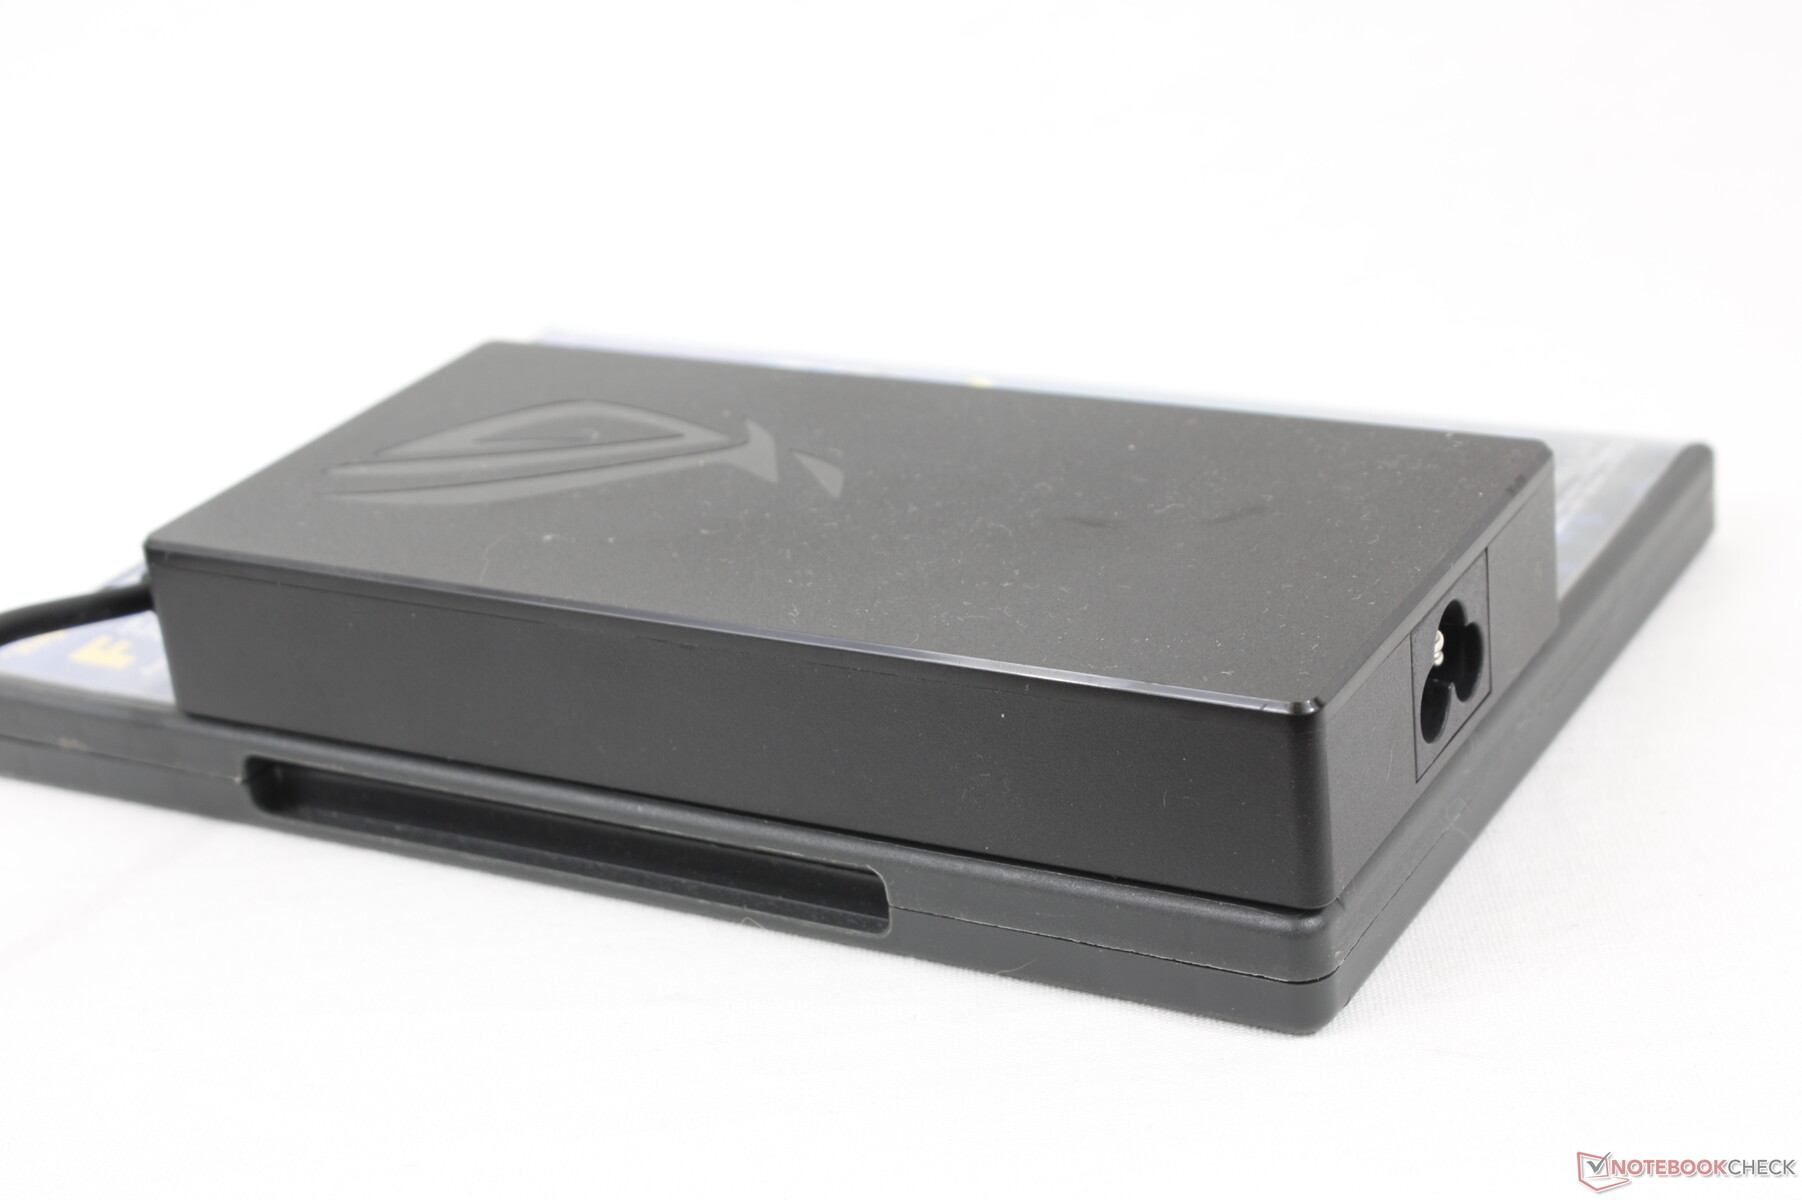
Podemos registrar un consumo máximo de 163 W con el adaptador de CA de 200 W de tamaño medio (~15.2 x 7.3 x 2.3 cm). Nuestra configuración no tiene problemas para cargar y ejecutar juegos simultáneamente. Otros modelos pueden venir con adaptadores más pequeños de 160 W o más grandes de 240 W dependiendo de la opción gráfica.
| Off / Standby | |
| Ocioso | |
| Carga |
|
Clave:
min: | |
| Asus ROG Strix G17 G713QE-RB74 R7 5800H, GeForce RTX 3050 Ti Laptop GPU, Samsung PM991 MZVLQ512HBLU, IPS, 1920x1080, 17.3" | Acer Nitro 5 AN517-53-54DQ i5-11300H, GeForce RTX 3050 4GB Laptop GPU, SK Hynix BC711 HFM512GD3HX015N, IPS, 1920x1080, 17.3" | MSI Katana GF76 11UE i7-11800H, GeForce RTX 3060 Laptop GPU, Kingston OM8PCP3512F-AB, IPS, 1920x1080, 17.3" | Asus Strix Scar 17 G733QSA-XS99 R9 5900HX, GeForce RTX 3080 Laptop GPU, 2x Samsung PM981a MZVLB1T0HBLR (RAID 0), IPS, 1920x1080, 17.3" | MSI Alpha 17 A4DEK R7 4800H, Radeon RX 5600M, Kingston OM8PCP3512F-AB, IPS, 1920x1080, 17.3" | Asus Strix G17 G712LWS i7-10750H, GeForce RTX 2070 Super Mobile, Intel SSD 660p 1TB SSDPEKNW010T8, IPS, 1920x1080, 17.3" | |
|---|---|---|---|---|---|---|
| Power Consumption | 28% | -4% | -25% | 2% | -26% | |
| Idle Minimum * (Watt) | 9.2 | 4 57% | 9 2% | 10.9 -18% | 9 2% | 10 -9% |
| Idle Average * (Watt) | 12.6 | 9 29% | 13 -3% | 14.7 -17% | 12 5% | 14 -11% |
| Idle Maximum * (Watt) | 23.3 | 15 36% | 20 14% | 26.8 -15% | 18 23% | 25 -7% |
| Load Average * (Watt) | 89.3 | 85 5% | 102 -14% | 106.7 -19% | 76 15% | 134 -50% |
| Witcher 3 ultra * (Watt) | 136 | 104 24% | 149 -10% | 192.4 -41% | 136 -0% | 186 -37% |
| Load Maximum * (Watt) | 162.7 | 135 17% | 187 -15% | 228.4 -40% | 222 -36% | 230 -41% |
* ... más pequeño es mejor
Power Consumption Witcher 3 / Stresstest
Duración de la batería
La capacidad de la batería es menor que la de la última generación del G712 (56 Wh frente a 66 Wh), pero la duración sigue siendo la misma, entre 5,5 y 6 horas de uso real de la WLAN con el perfil de energía equilibrado y la GPU integrada activa. El Strix Scar 17 G733, más caro, puede durar varias horas más debido a su batería mucho más grande de 90 Wh. Las configuraciones de gama alta del G713 vienen con la batería más grande de 90 Wh en lugar de la básica de 56 Wh para una mayor duración de la batería.
La carga de vacío a lleno tarda aproximadamente 1,5 horas. La recarga por USB-C PD es compatible, aunque a un ritmo más lento.
| Asus ROG Strix G17 G713QE-RB74 R7 5800H, GeForce RTX 3050 Ti Laptop GPU, 56 Wh | Acer Nitro 5 AN517-53-54DQ i5-11300H, GeForce RTX 3050 4GB Laptop GPU, 57 Wh | MSI Katana GF76 11UE i7-11800H, GeForce RTX 3060 Laptop GPU, 53 Wh | Asus Strix Scar 17 G733QSA-XS99 R9 5900HX, GeForce RTX 3080 Laptop GPU, 90 Wh | MSI Alpha 17 A4DEK R7 4800H, Radeon RX 5600M, 65 Wh | Asus Strix G17 G712LWS i7-10750H, GeForce RTX 2070 Super Mobile, 66 Wh | |
|---|---|---|---|---|---|---|
| Duración de Batería | 35% | -26% | 34% | 18% | 6% | |
| Reader / Idle (h) | 11.1 | 17.4 57% | 4.8 -57% | 13.3 20% | 10.5 -5% | 9.1 -18% |
| WiFi v1.3 (h) | 6 | 7.2 20% | 3.7 -38% | 9.3 55% | 7.3 22% | 5.5 -8% |
| Load (h) | 1.1 | 1.4 27% | 1.3 18% | 1.4 27% | 1.5 36% | 1.6 45% |
| Witcher 3 ultra (h) | 0.8 |
Pro
Contra
Veredicto - Elija su configuración con cuidado
Como ya se ha dicho, hay nada menos que 16 configuraciones del Asus ROG Strix G17 G713 con distintos grosores, pesos, adaptadores de CA, pantallas, capacidades de batería, iluminación RGB y mucho más. Los potenciales compradores deben seleccionar sus respectivas SKUs con cuidado mirando las especificaciones en la web oficial de Asus que detallan todas las diferencias entre ellos.
Para nuestra configuración de análisis en particular, tanto la CPU AMD Zen 3 como la rápida tasa de refresco de pantalla de 144 Hz merecen ser elogiadas. Sin embargo, las RTX 3050 y RTX 3050 Ti son más difíciles de recomendar, ya que sus niveles de rendimiento están por detrás de la antigua GTX 1660 Ti en el mejor de los casos. La actualización a la RTX 3060 o superior proporcionará unas piernas más largas y un rendimiento por vatio significativamente mayor
Por desgracia, optar por la RTX 3060 o superior conlleva algunos inconvenientes, ya que estas unidades son más gruesas, pesadas y con adaptadores de CA más grandes que nuestra RTX 3050 Ti. La convención de nomenclatura de Asus es especialmente confusa en este sentido, ya que la serie G713 consta en realidad de dos modelos distintos y aún así comparten casi los mismos nombres de venta. La fuerte base, las rígidas bisagras y la fácil actualización son, sin embargo, mejores que la mayoría de portátiles de juego económicos, incluyendo el HP Pavilion Gaming, Lenovo Legion 5, MSI Katana, o Dell G5 series a costa de un mayor espacio
Precio y disponibilidad
El Asus ROG Strix G17 G713 está ampliamente disponible a través de la mayoría de los minoristas, incluyendo Amazon, Best Buy, Walmarty Newegg con la RTX 3060 o superior a partir de $1500 USD. Nuestra configuración específica con la RTX 3050 Ti, sin embargo, aún no está disponible en el momento de escribir este artículo.
Asus ROG Strix G17 G713QE-RB74
- 08/20/2021 v7 (old)
Allen Ngo
Price comparison

