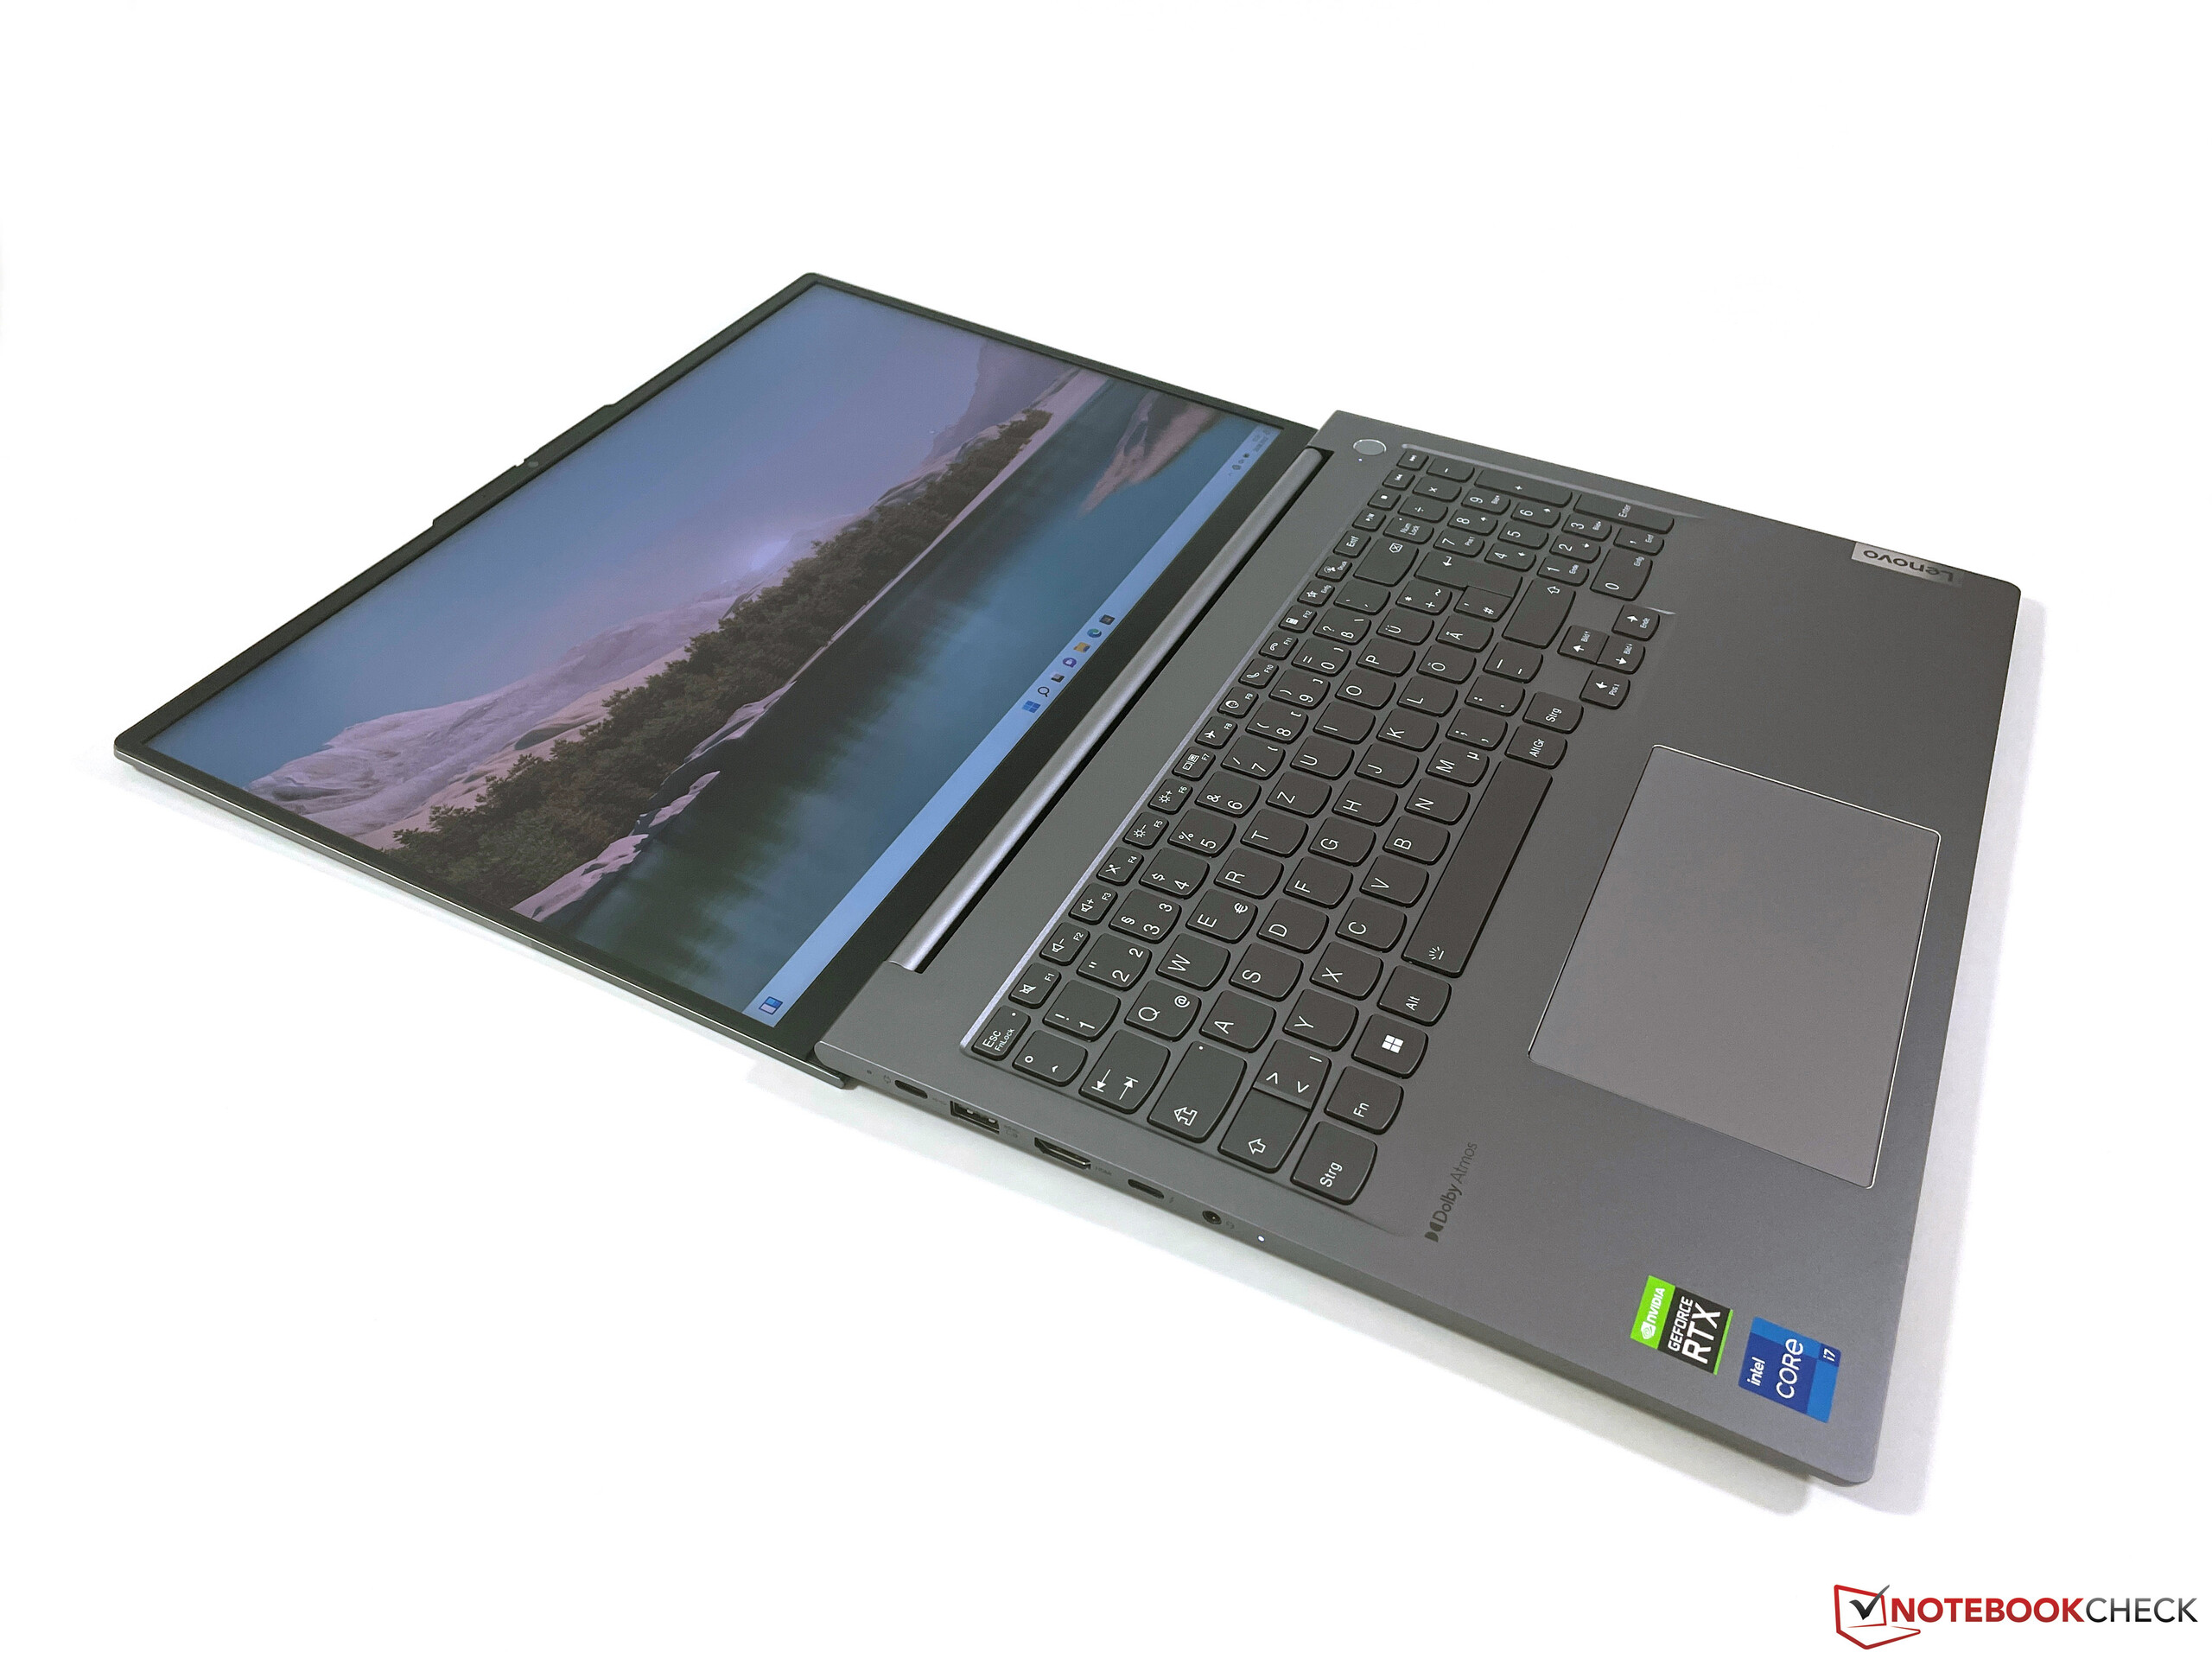
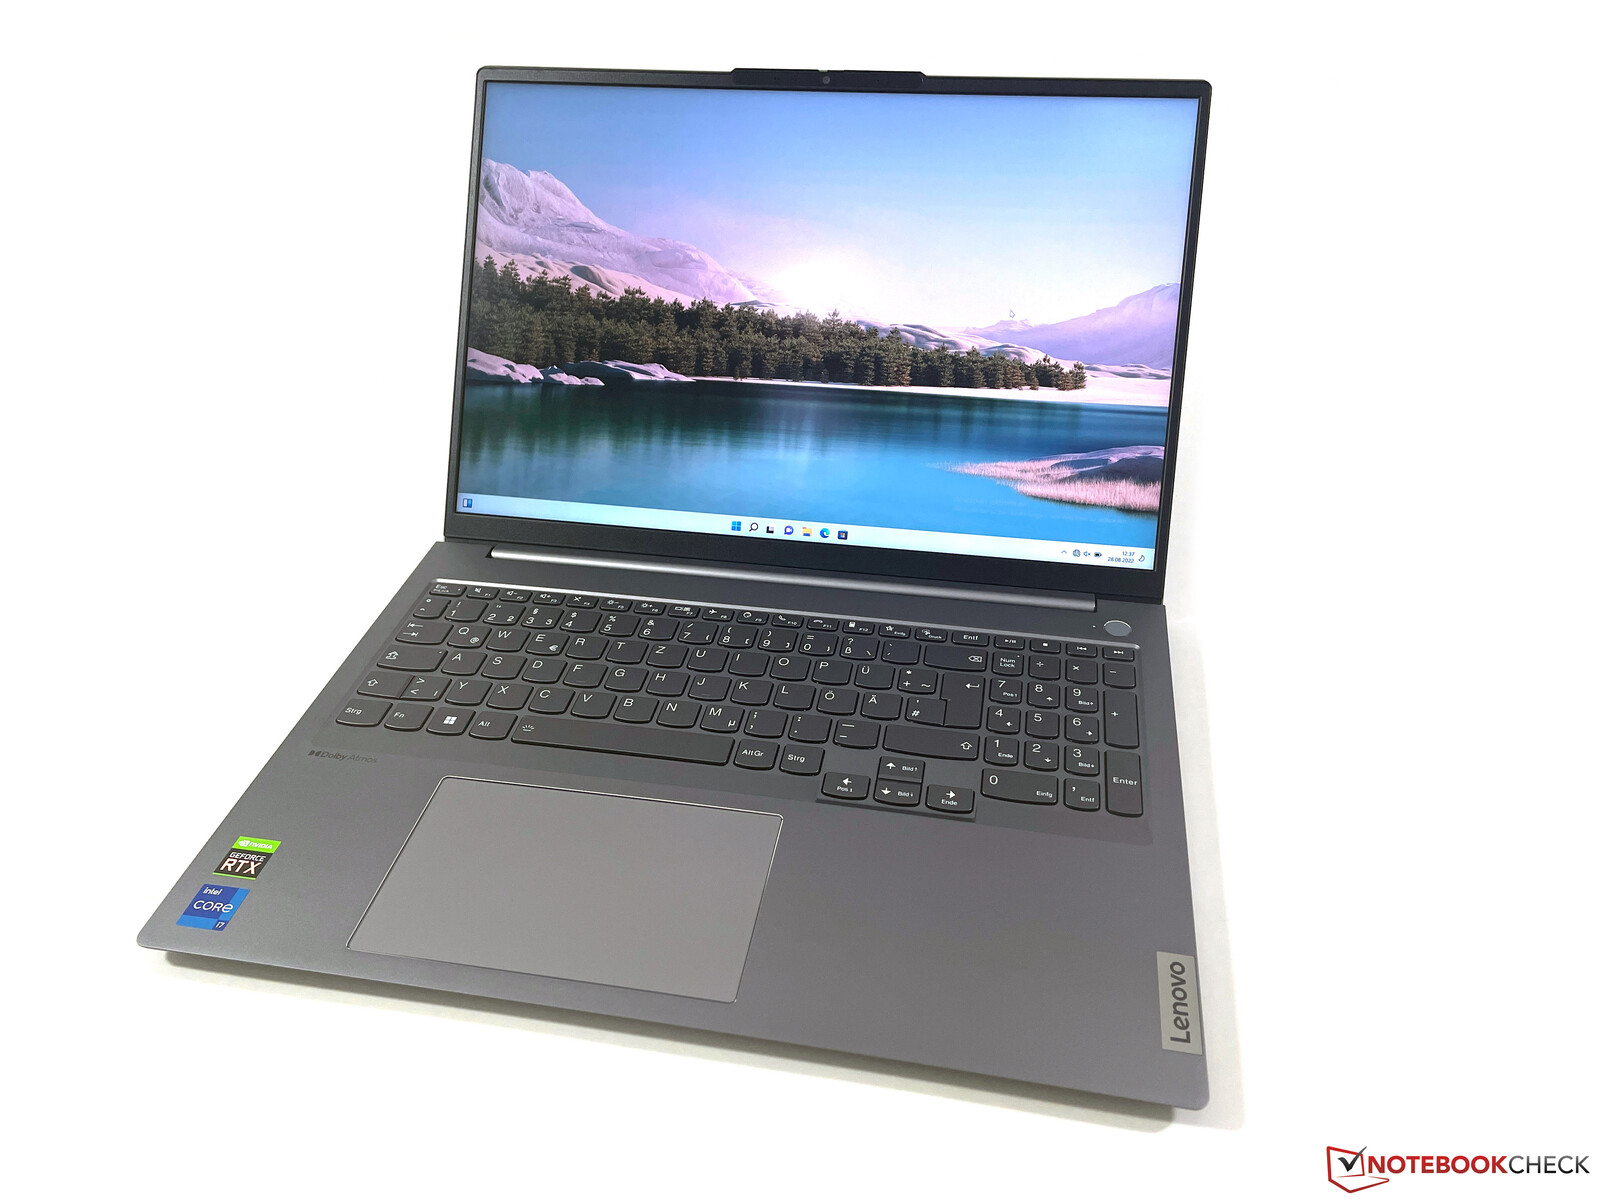
Análisis del Lenovo ThinkBook 16 G4+: Un buen portátil multimedia con mucha potencia
Con el ThinkBook 16 G4+, Lenovo presenta un portátil multimedia de 16 pulgadas con potentes componentes y muchas características modernas por un PVP de 1.200 euros. Además del último procesador Intel Core i7-12700H, está la GeForce RTX 2050 dedicada de Nvidia, así como características modernas como Thunderbolt 4, Wi-Fi 6E o PCIe 4.0. La pantalla es un panel IPS WQHD mate y hay un gran SSD de 1 TB, junto a 16 GB de RAM. Nuestro modelo de análisis es un modelo de campus sin sistema operativo.
Posibles contendientes en la comparación
Valoración | Fecha | Modelo | Peso | Altura | Tamaño | Resolución | Precio |
|---|---|---|---|---|---|---|---|
| 88.4 % v7 (old) | 09/2022 | Lenovo ThinkBook 16 G4+ IAP i7-12700H, GeForce RTX 2050 Mobile | 1.8 kg | 16.5 mm | 16.00" | 2560x1600 | |
| 87.4 % v7 (old) | 08/2022 | Dell Inspiron 16 Plus 7620 i7-12700H, GeForce RTX 3050 Ti Laptop GPU | 2.1 kg | 18.99 mm | 16.00" | 3072x1920 | |
| 86.2 % v7 (old) | 07/2022 | Acer Swift X SFX16-51G-5388 i5-11320H, GeForce RTX 3050 4GB Laptop GPU | 1.8 kg | 18.9 mm | 16.10" | 1920x1080 | |
v (old) | 12/2021 | Asus Vivobook Pro 16X-M7600QE R9 5900HX, GeForce RTX 3050 Ti Laptop GPU | 1.9 kg | 19 mm | 16.10" | 3840x2400 | |
| 83.6 % v7 (old) | 07/2022 | Huawei MateBook D 16 2022 i7-12700H, Iris Xe G7 96EUs | 1.7 kg | 18.4 mm | 16.00" | 1920x1200 | |
| 79.8 % v7 (old) | 08/2022 | Samsung Galaxy Book2 15 i7-1260P, A350M | 1.6 kg | 15 mm | 15.60" | 1920x1080 |
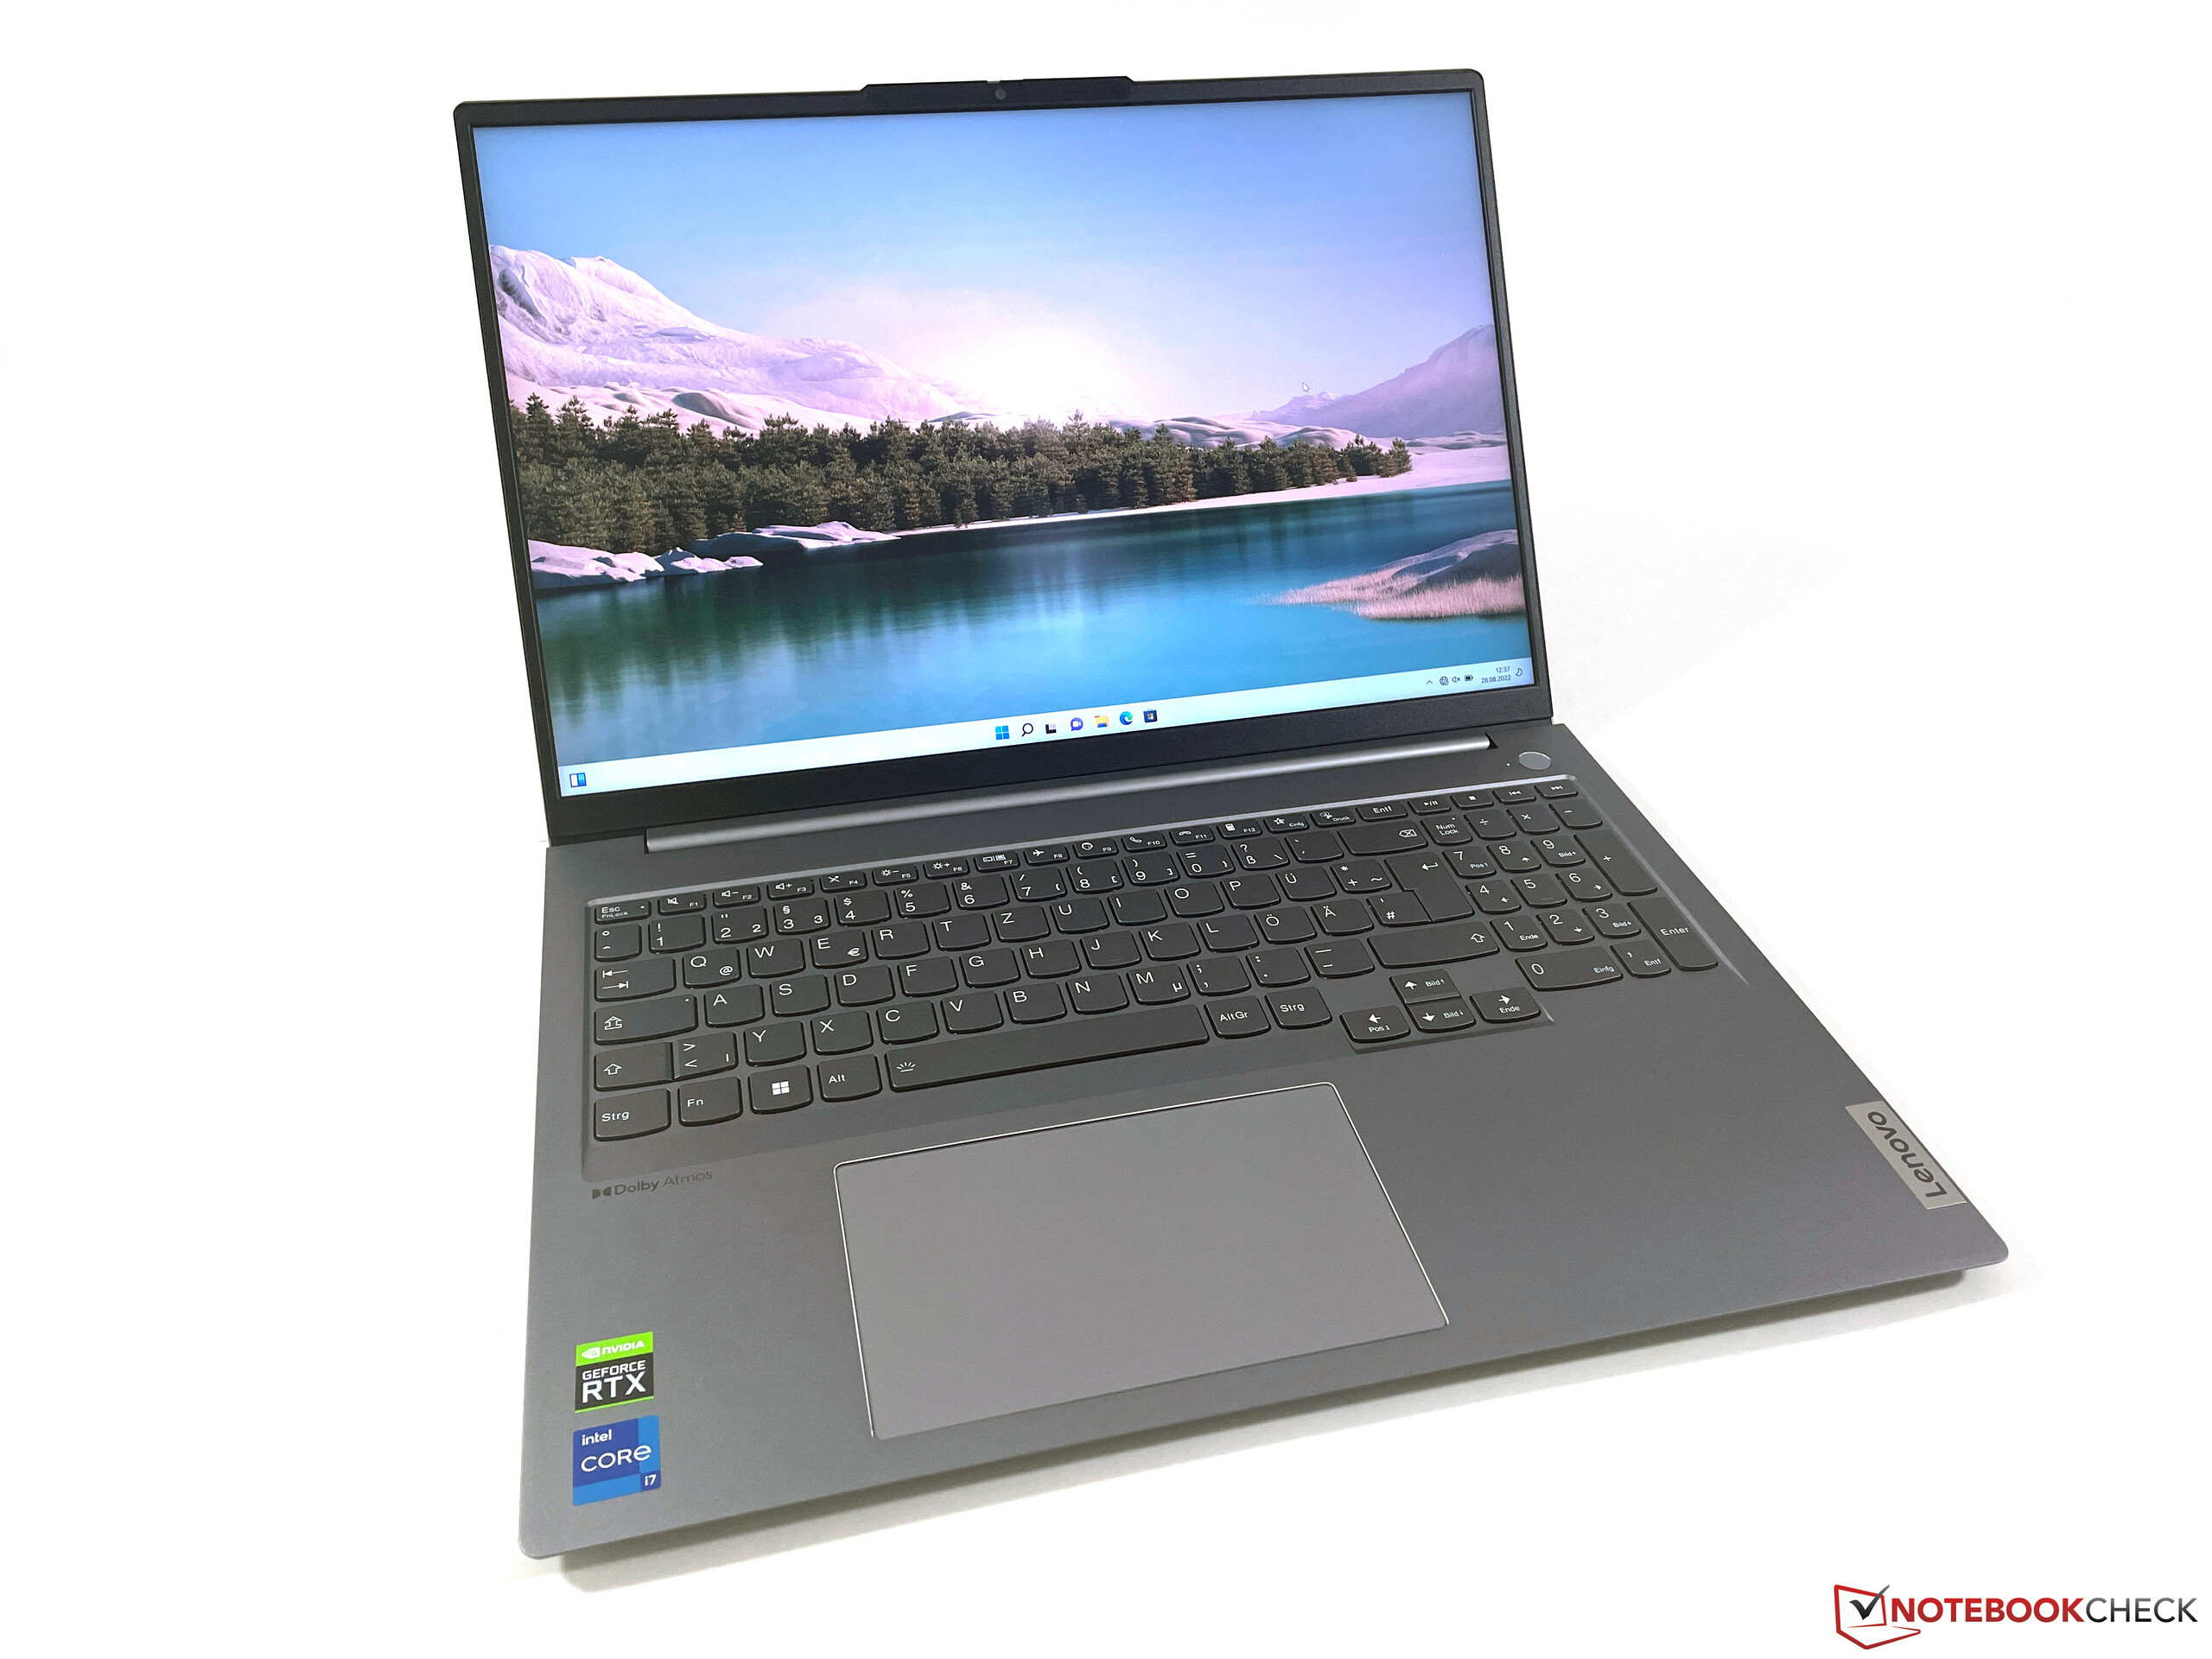
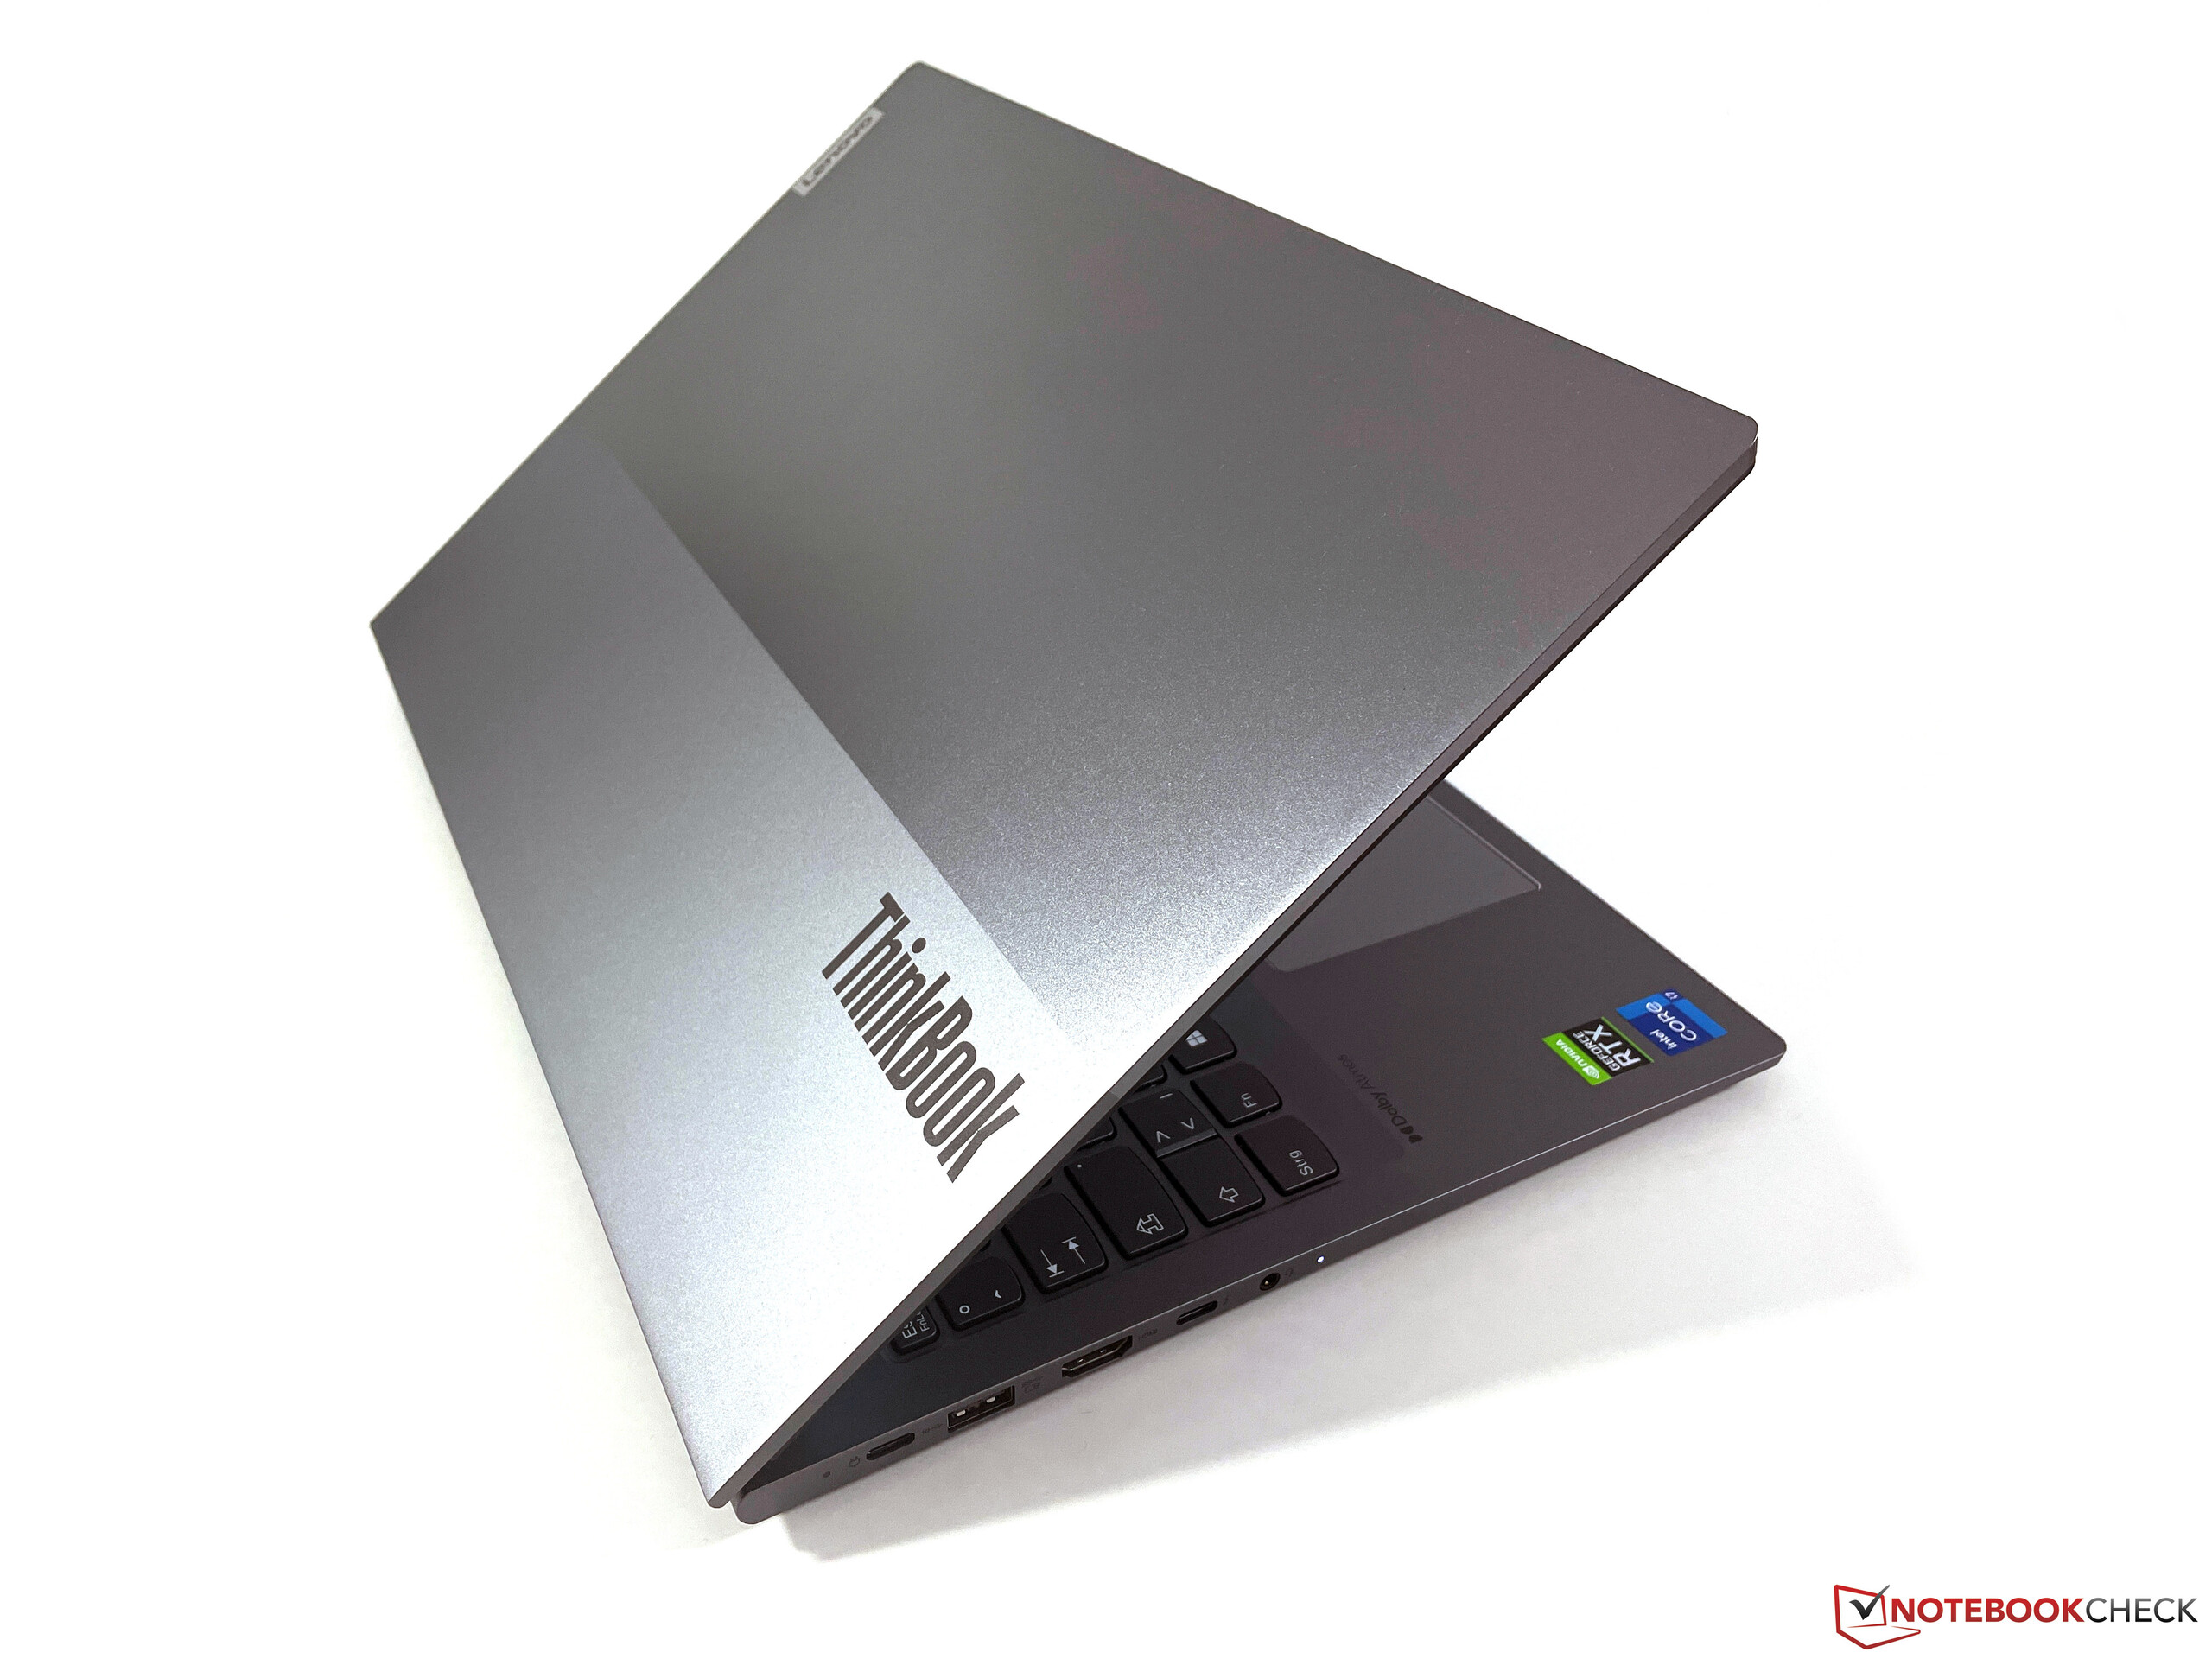
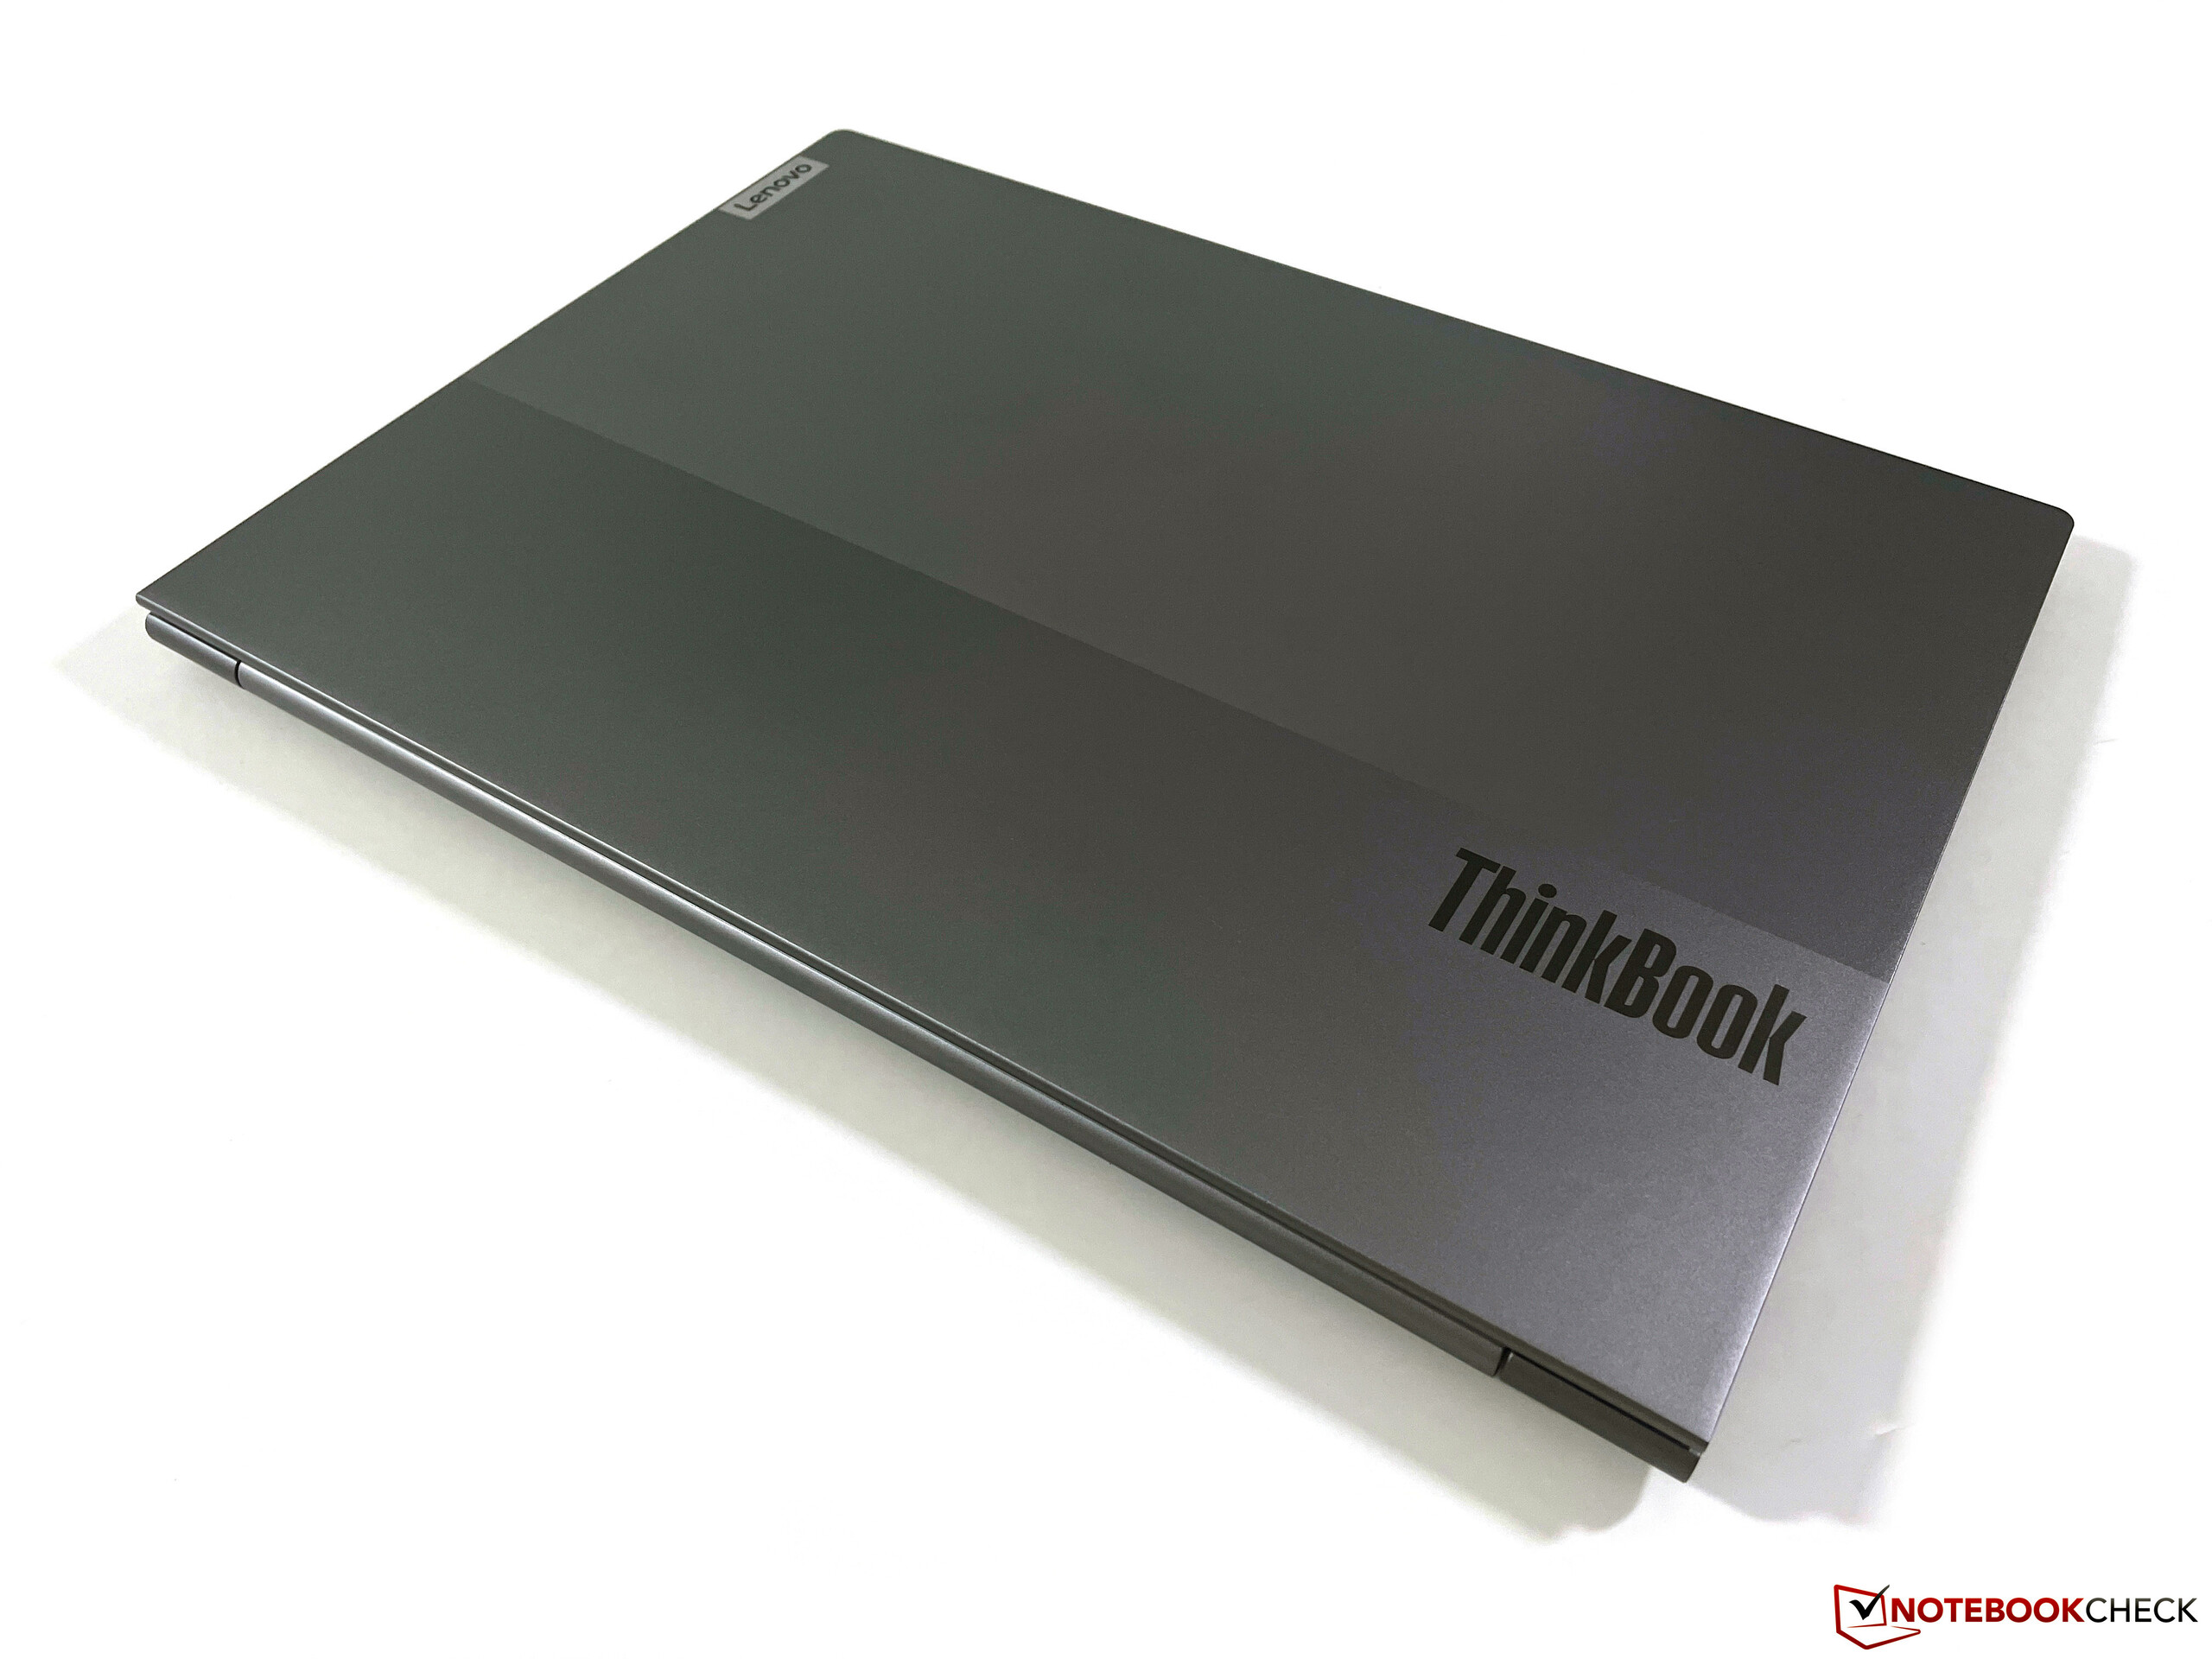
Carcasa - Lenovo utiliza el aluminio
Lenovo utiliza principalmente aluminio para la carcasa (es decir, la tapa y la unidad base) y las superficies están arenadas y anodizadas. Las superficies lisas se sienten agradables y transmiten una impresión de alta calidad. Las huellas dactilares se ven con relativa rapidez, pero también se pueden eliminar fácilmente. Visualmente, la carcasa de color plateado tiene un aspecto elegante y encaja bien en entornos profesionales. El único acento visual es la tapa de la pantalla en dos tonos diferentes de gris.
En términos de mano de obra, el ThinkBook da una impresión fundamentalmente buena, pero todavía hay margen de mejora. Pudimos obtener silenciosos crujidos de la unidad base y el área del teclado también puede ser presionada. La tapa de la pantalla demuestra ser más estable - no pudimos provocar ningún error de imagen, pero la pantalla se tambalea claramente cuando se cambia el ángulo de apertura. Es posible un máximo de 180 grados y las bisagras están bien ajustadas, ya que la apertura con una sola mano no presenta ningún problema.
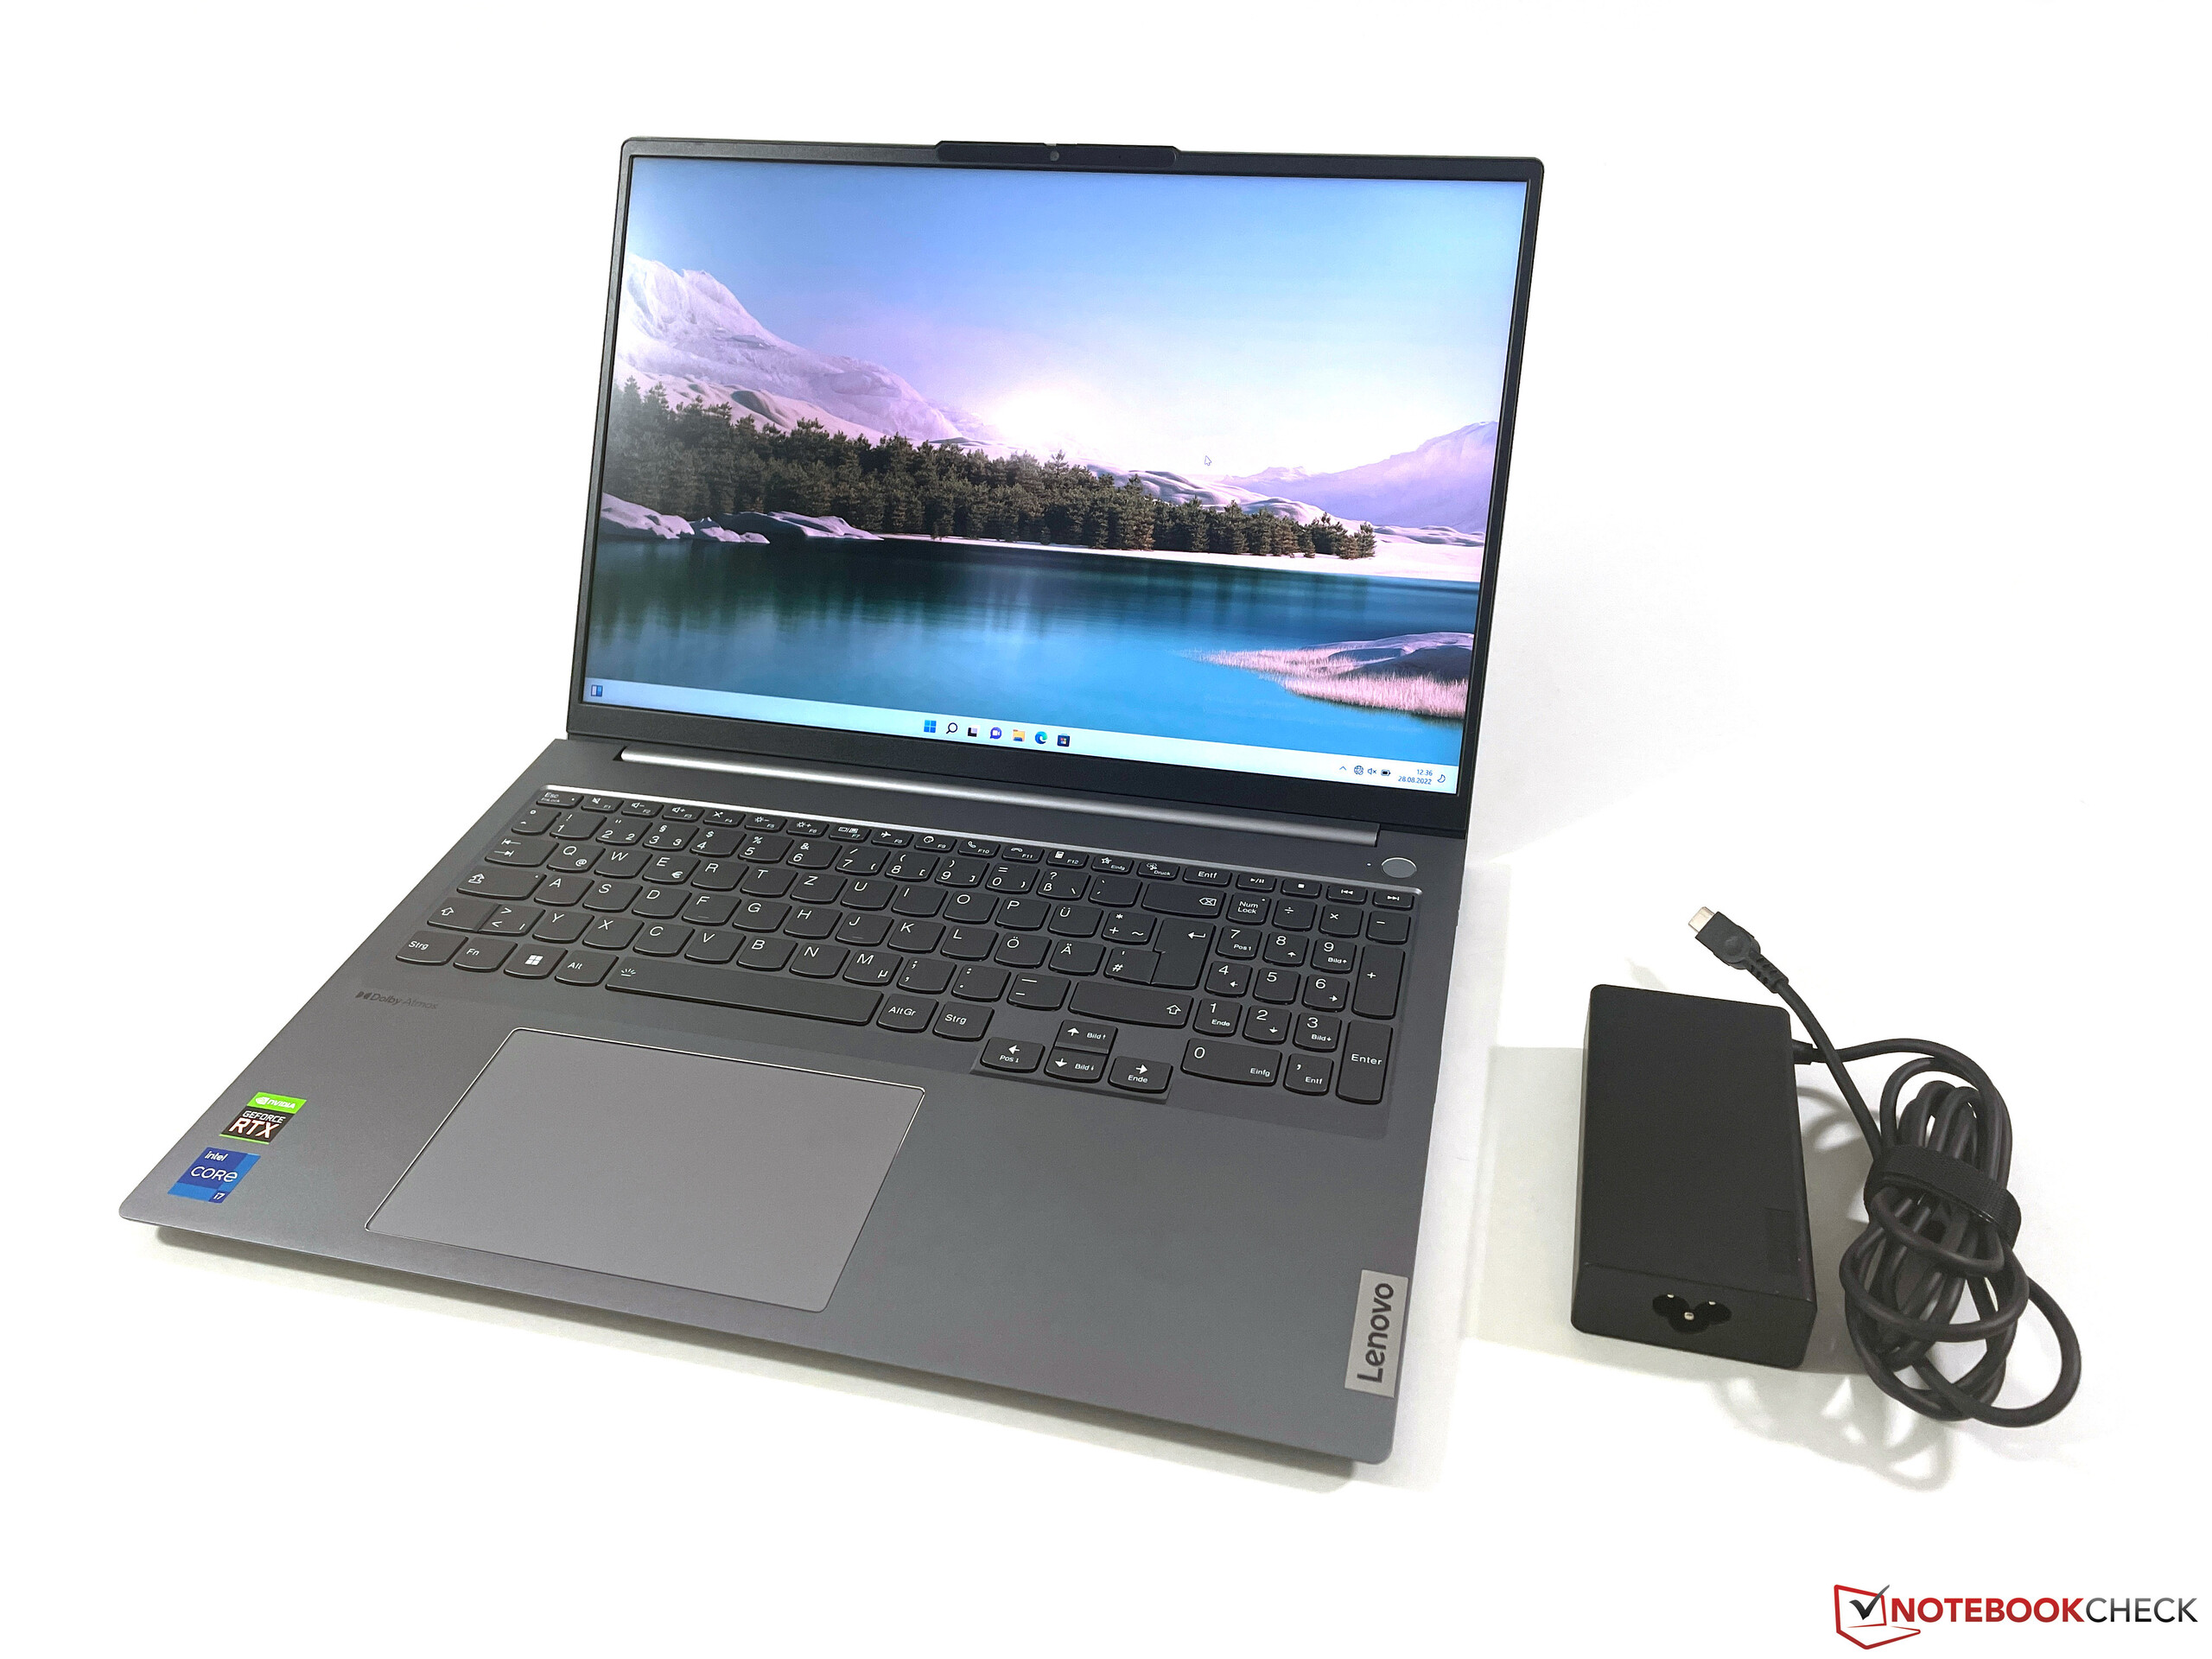
Con la excepción delAcer Swift Xlos dispositivos de 16 pulgadas en el campo de la comparación son muy similares en términos de tamaño. Sin embargo, el ThinkBook es un poco más delgado que la mayoría de los rivales con sólo 1,65 cm. El peso asciende a 1,82 kg, sin incluir los 400 gramos adicionales del adaptador de corriente.
Equipo - ThinkBook con Thunderbolt 4
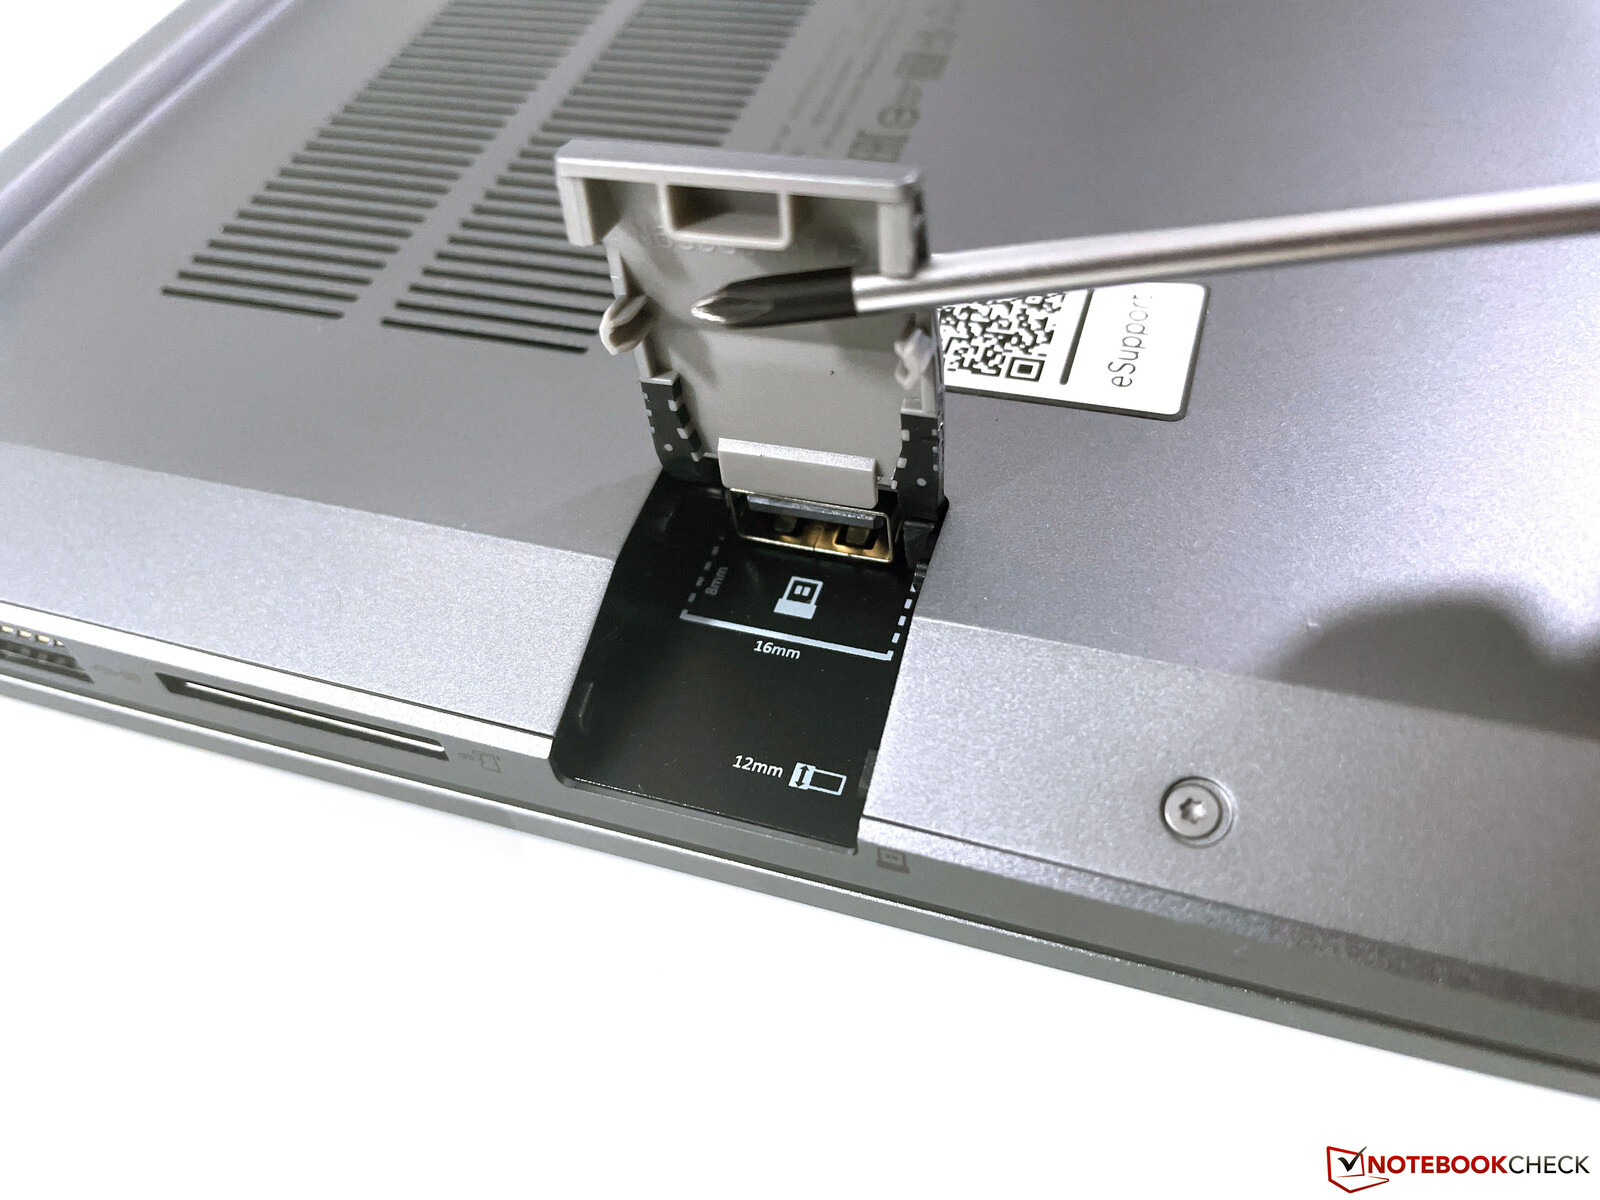
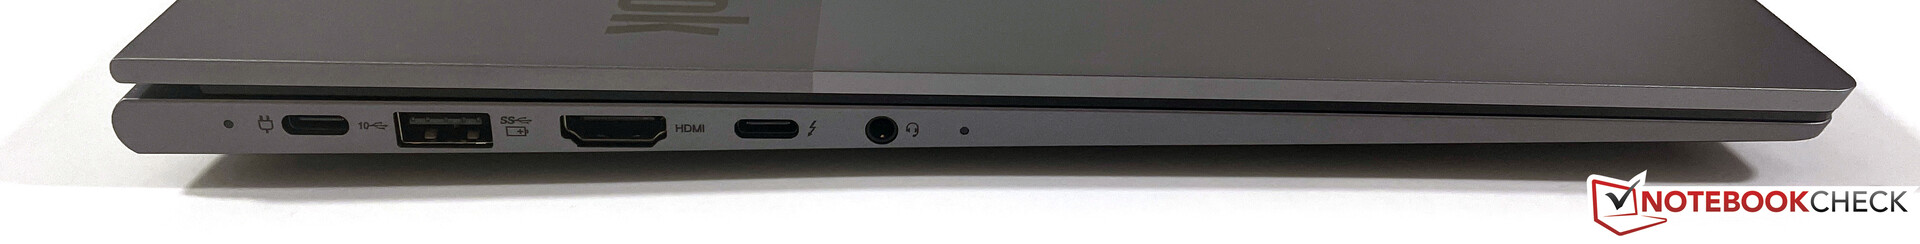
El ThinkBook 16 G4+ ofrece prácticamente todos los puertos que puedas desear. Además de un moderno puerto Thunderbolt 4, también hay puertos USB-A normales, una salida HDMI completa y un puerto Gigabit Ethernet. Incluso hay un puerto USB oculto bajo una solapa en el lado derecho, que sólo se ajusta al estándar 2.0, pero es perfecto para dongles conectados permanentemente, como dispositivos de entrada externos.
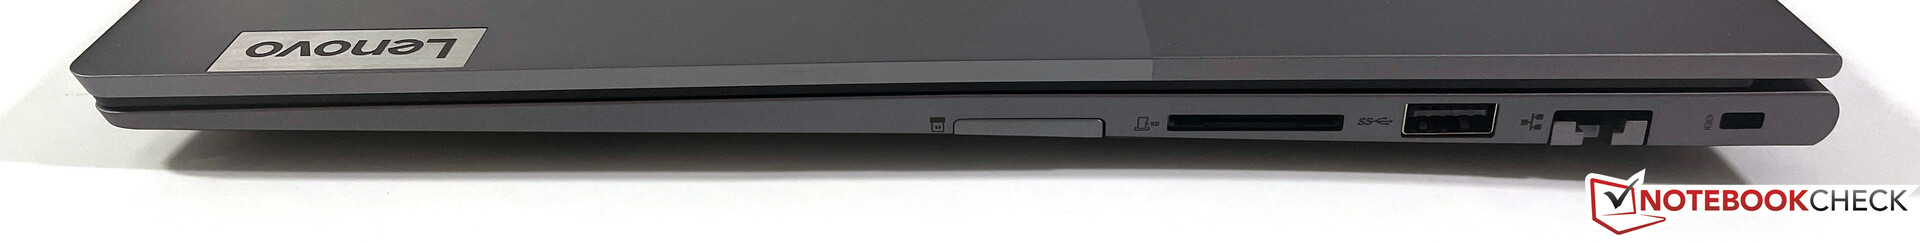
Lector de tarjetas SD
Hay un lector de tarjetas SD en el lado derecho que no acomoda completamente las tarjetas de memoria (sobresalen unos 2 cm). Medimos tasas de transferencia de casi 90 MB/s a través de nuestra tarjeta de referencia (Angelbird AV Pro V60 UHS-II), lo que sitúa al ThinkBook por delante de los competidores cuyos lectores de tarjetas sólo funcionan por USB 2.0.
| SD Card Reader | |
| average JPG Copy Test (av. of 3 runs) | |
| Media de la clase Multimedia (23 - 531, n=43, últimos 2 años) | |
| Lenovo ThinkBook 16 G4+ IAP (Angelbird AV Pro V60) | |
| Asus Vivobook Pro 16X-M7600QE (AV Pro SD microSD 128 GB V60) | |
| Dell Inspiron 16 Plus 7620 (Toshiba Exceria Pro SDXC 64 GB UHS-II) | |
| Samsung Galaxy Book2 15 (Angelbird AV Pro V60) | |
| maximum AS SSD Seq Read Test (1GB) | |
| Media de la clase Multimedia (27.9 - 1455, n=42, últimos 2 años) | |
| Lenovo ThinkBook 16 G4+ IAP (Angelbird AV Pro V60) | |
| Asus Vivobook Pro 16X-M7600QE (AV Pro SD microSD 128 GB V60) | |
| Dell Inspiron 16 Plus 7620 (Toshiba Exceria Pro SDXC 64 GB UHS-II) | |
| Samsung Galaxy Book2 15 (Angelbird AV Pro V60) | |
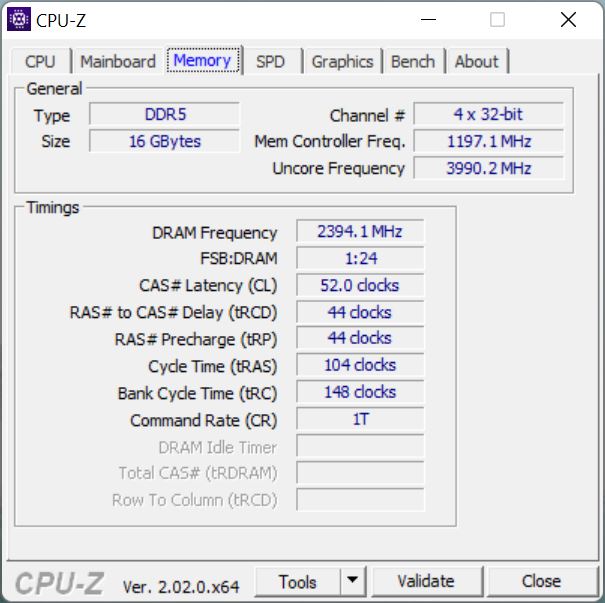
Comunicación
Además del módulo Gigabit Ethernet (Intel I219-V), Lenovo instala el modernísimo módulo Intel AX211E Wi-Fi 6E, que teóricamente soporta las últimas redes de 6 GHz. Sin embargo, no pudimos conectarnos a la red de 6 GHz de nuestro router de referencia de Asus. Sin embargo, las tasas de transferencia fueron muy altas y estables en la red de 5 GHz, por lo que no hay limitaciones reales en la práctica.
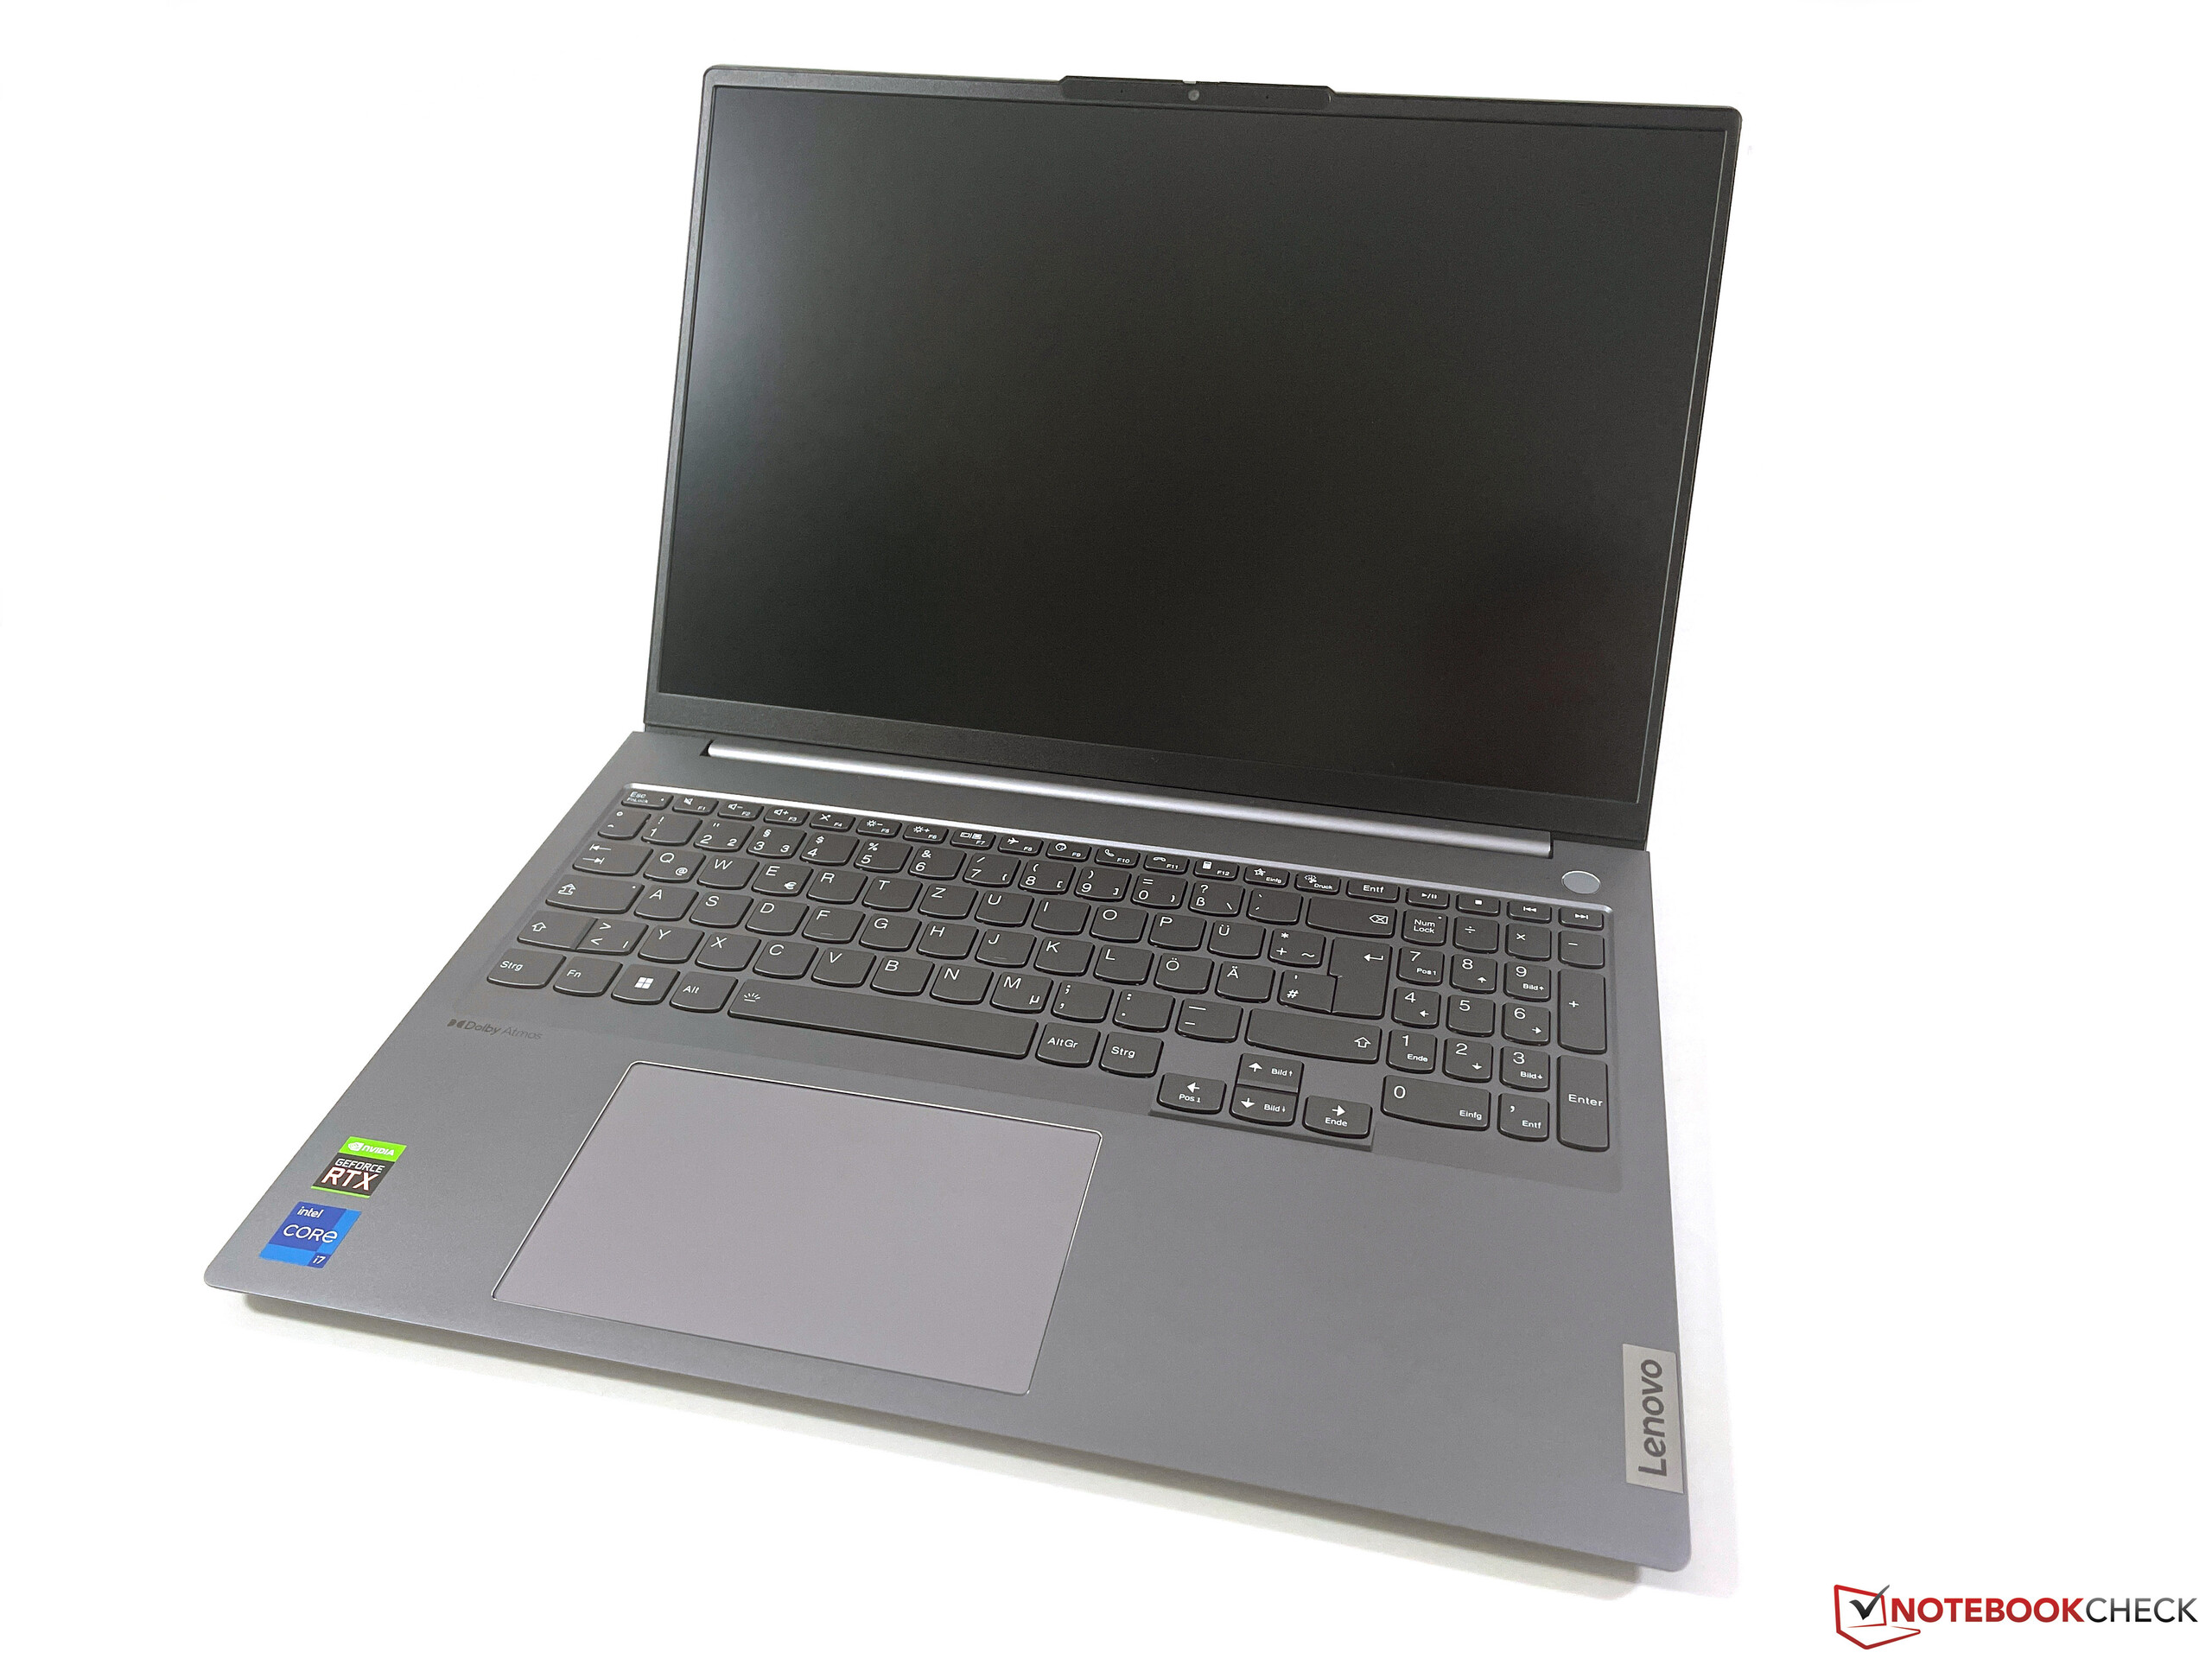
Cámara web
El ThinkBook ofrece una cámara web de 1080p con obturador mecánico que ofrece mejores imágenes que los anteriores módulos de 720p. Además, hay una cámara IR para el reconocimiento facial a través de Windows Hello.


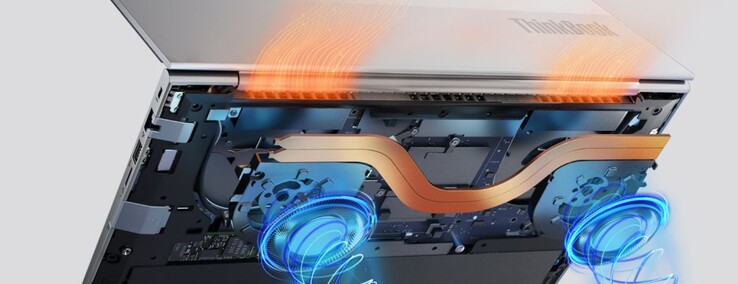
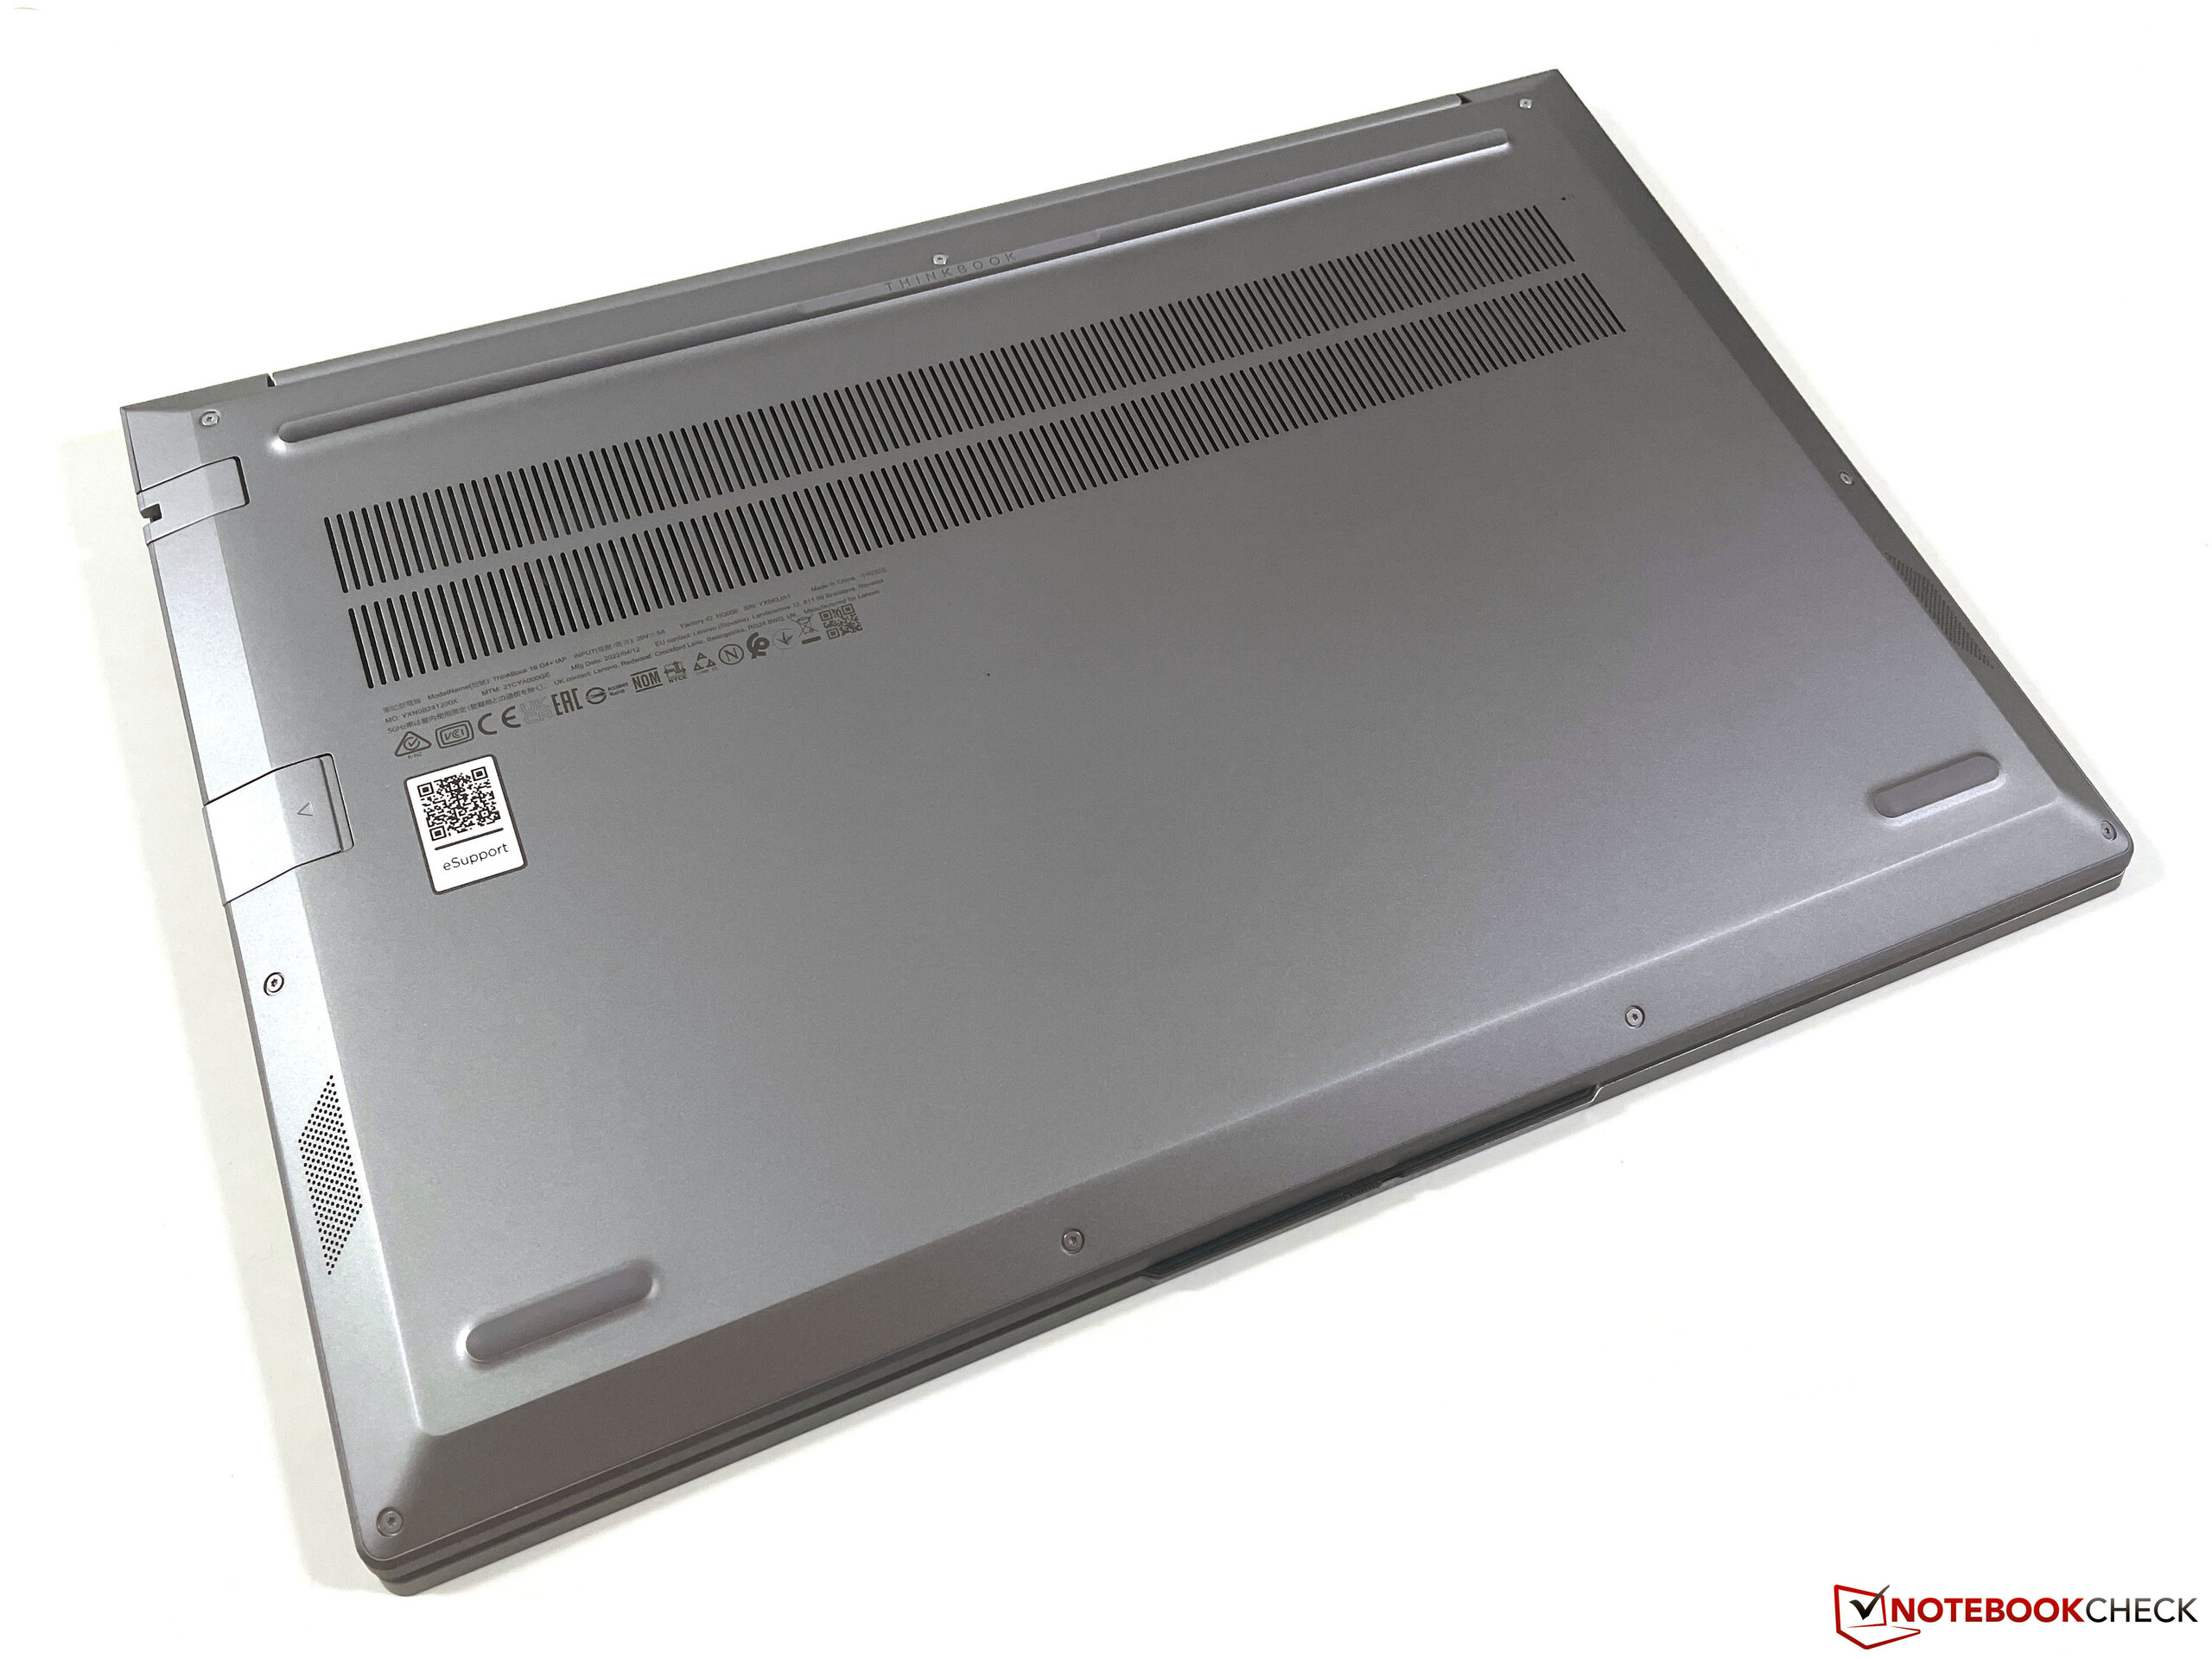
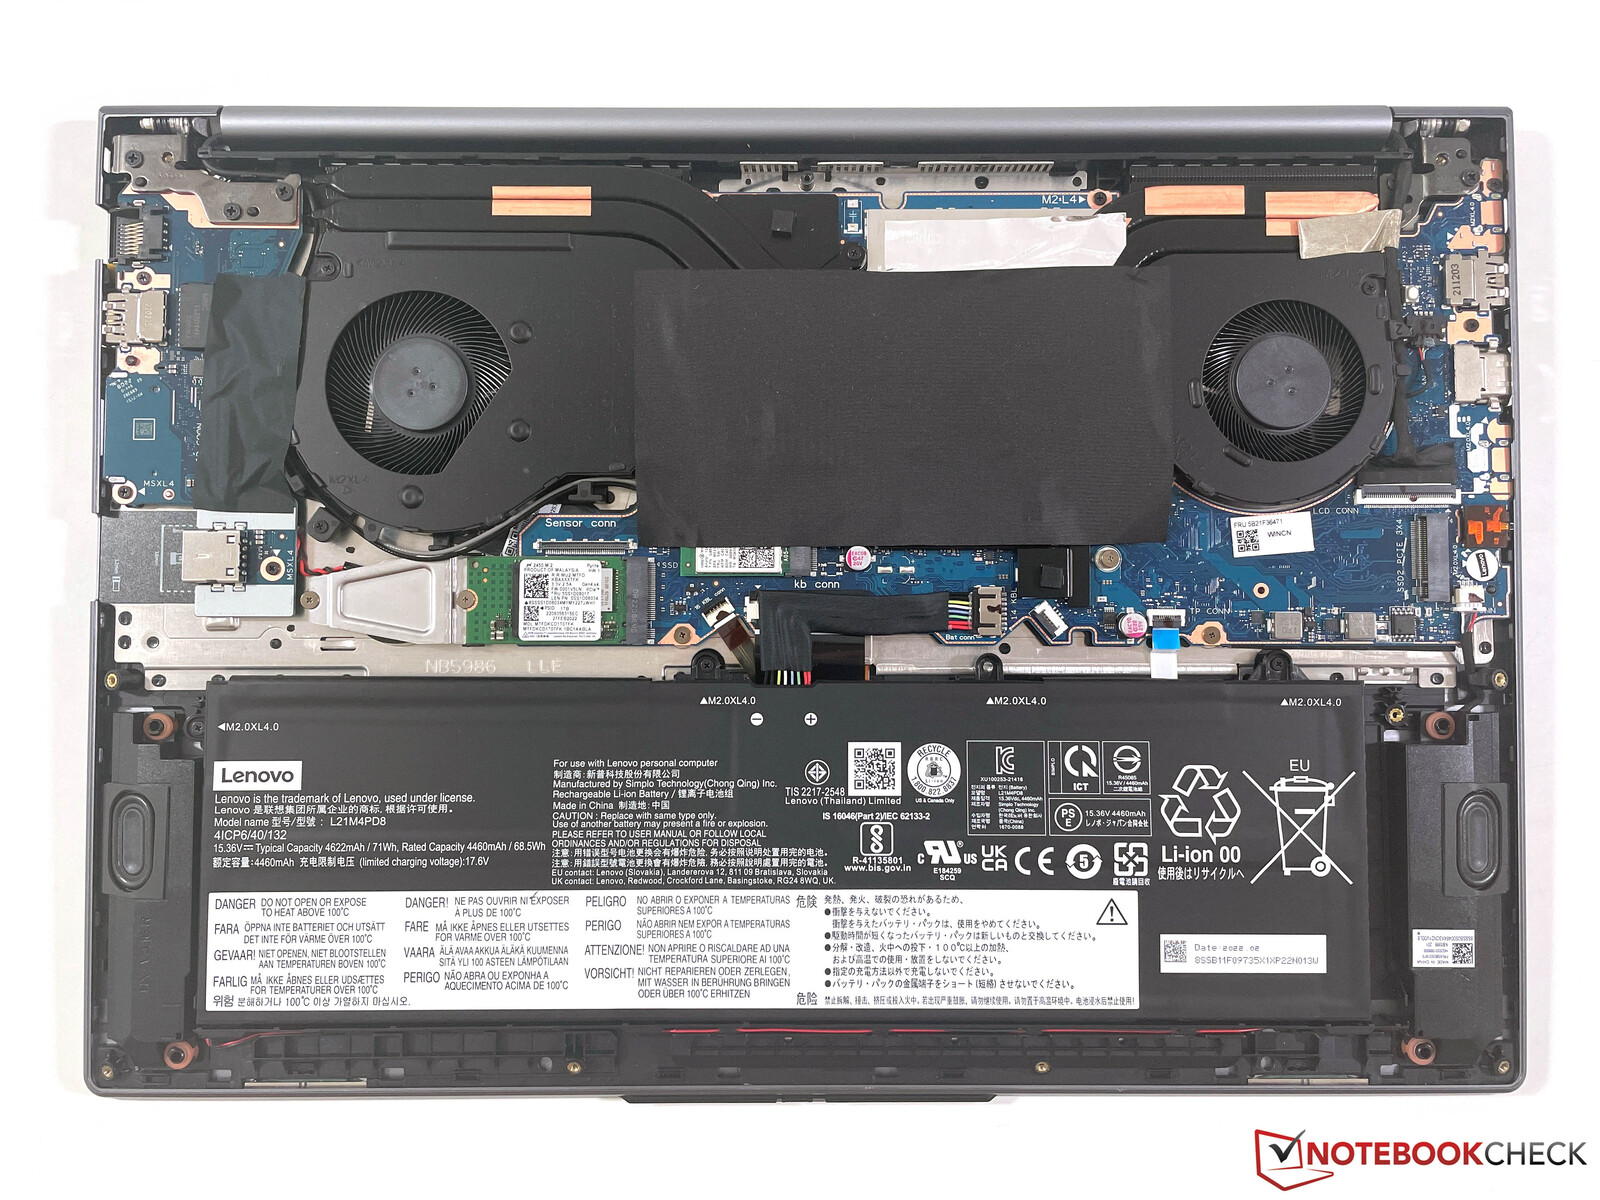
Mantenimiento
La placa base está sujeta con un total de 10 tornillos Torx (T5) y se puede retirar fácilmente. Después, puedes limpiar los dos ventiladores y acceder a las dos ranuras M.2-2280 para SSDs. El módulo WLAN está parcialmente pegado, pero en principio puede ser reemplazado. Sólo la RAM está soldada y no se puede actualizar.
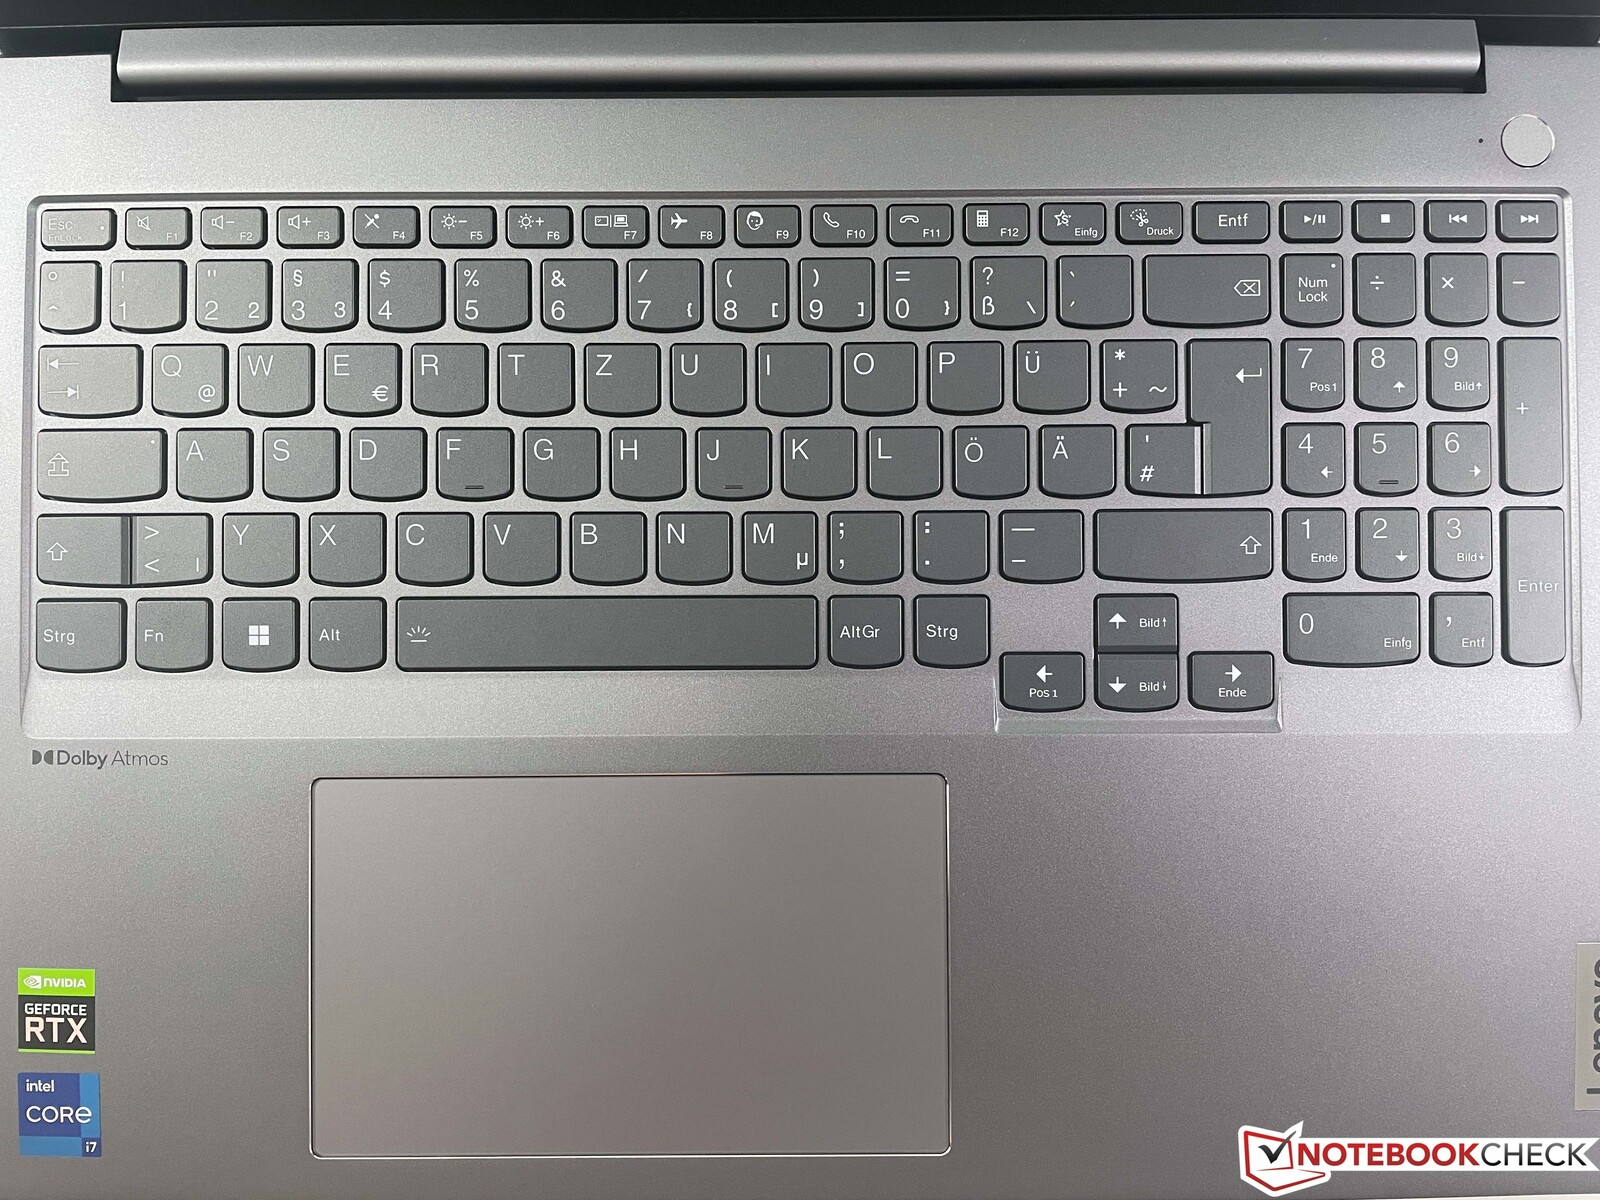
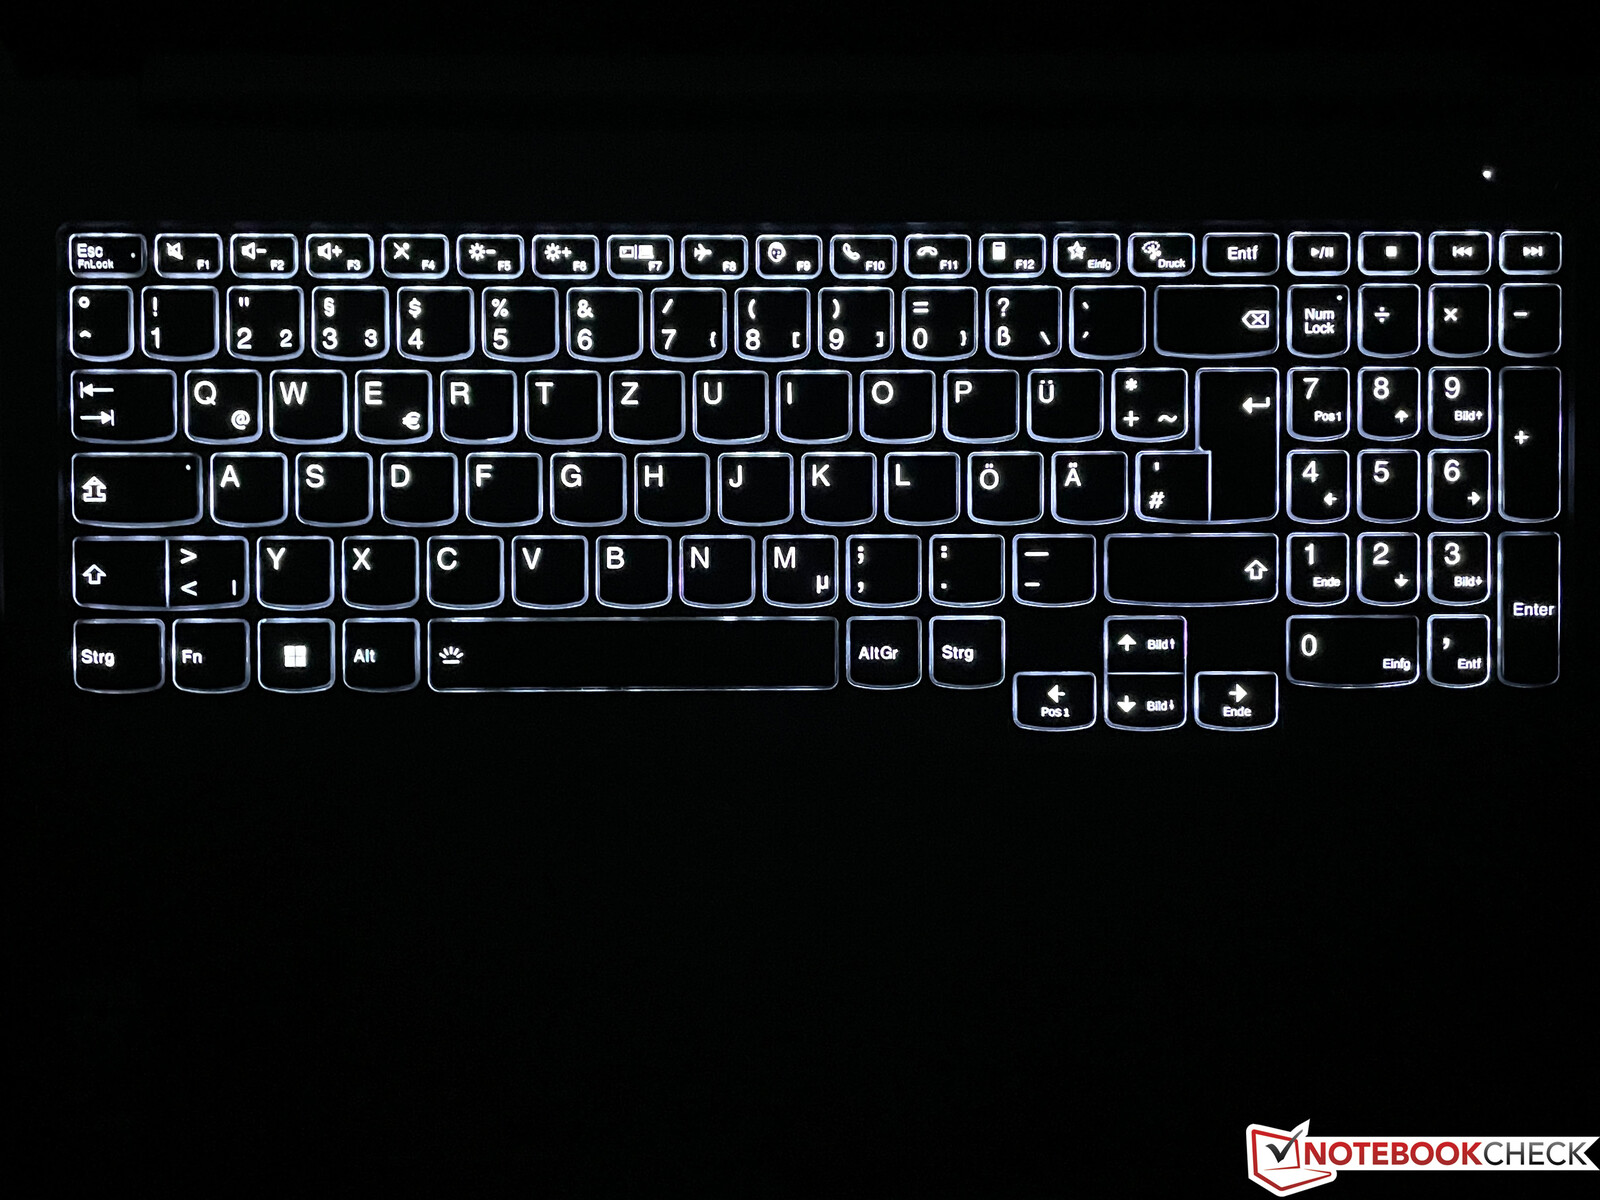
Dispositivos de entrada - Portátil multimedia con un teclado medio
El teclado gris oscuro ofrece una retroiluminación blanca de dos niveles, así como un teclado numérico dedicado en el lado derecho, aunque las teclas son un poco más estrechas aquí. En cuanto a la sensación de tecleo, el ThinkBook está más en la línea de los IdeaPads del fabricante que de los ThinkPads. El recorrido de las teclas es bastante corto, pero al menos la respuesta es muy precisa y las teclas tampoco traquetean. En nuestra opinión, Lenovo desperdicia algo de potencial aquí; hay entradas más cómodas si escribes frecuentemente textos muy largos. El botón de encendido está situado a la derecha sobre el teclado e incluye un escáner de huellas dactilares.
El gran ClickPad se ha desplazado ligeramente hacia la izquierda y, con 12 x 7,5 cm, ofrece suficiente espacio para la navegación con el puntero, así como para los gestos con hasta cuatro dedos. Esto funciona muy bien gracias al estándar de Microsoft Precision y el pad tampoco hace ruido. La mitad inferior se puede presionar físicamente, pero esto se caracteriza por ruidos de chasquidos fuertes y baratos, por lo que sólo se debe tocar el pad (tap to click).
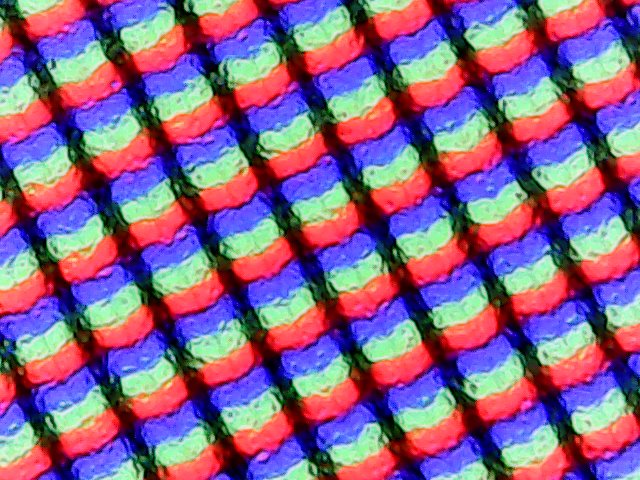
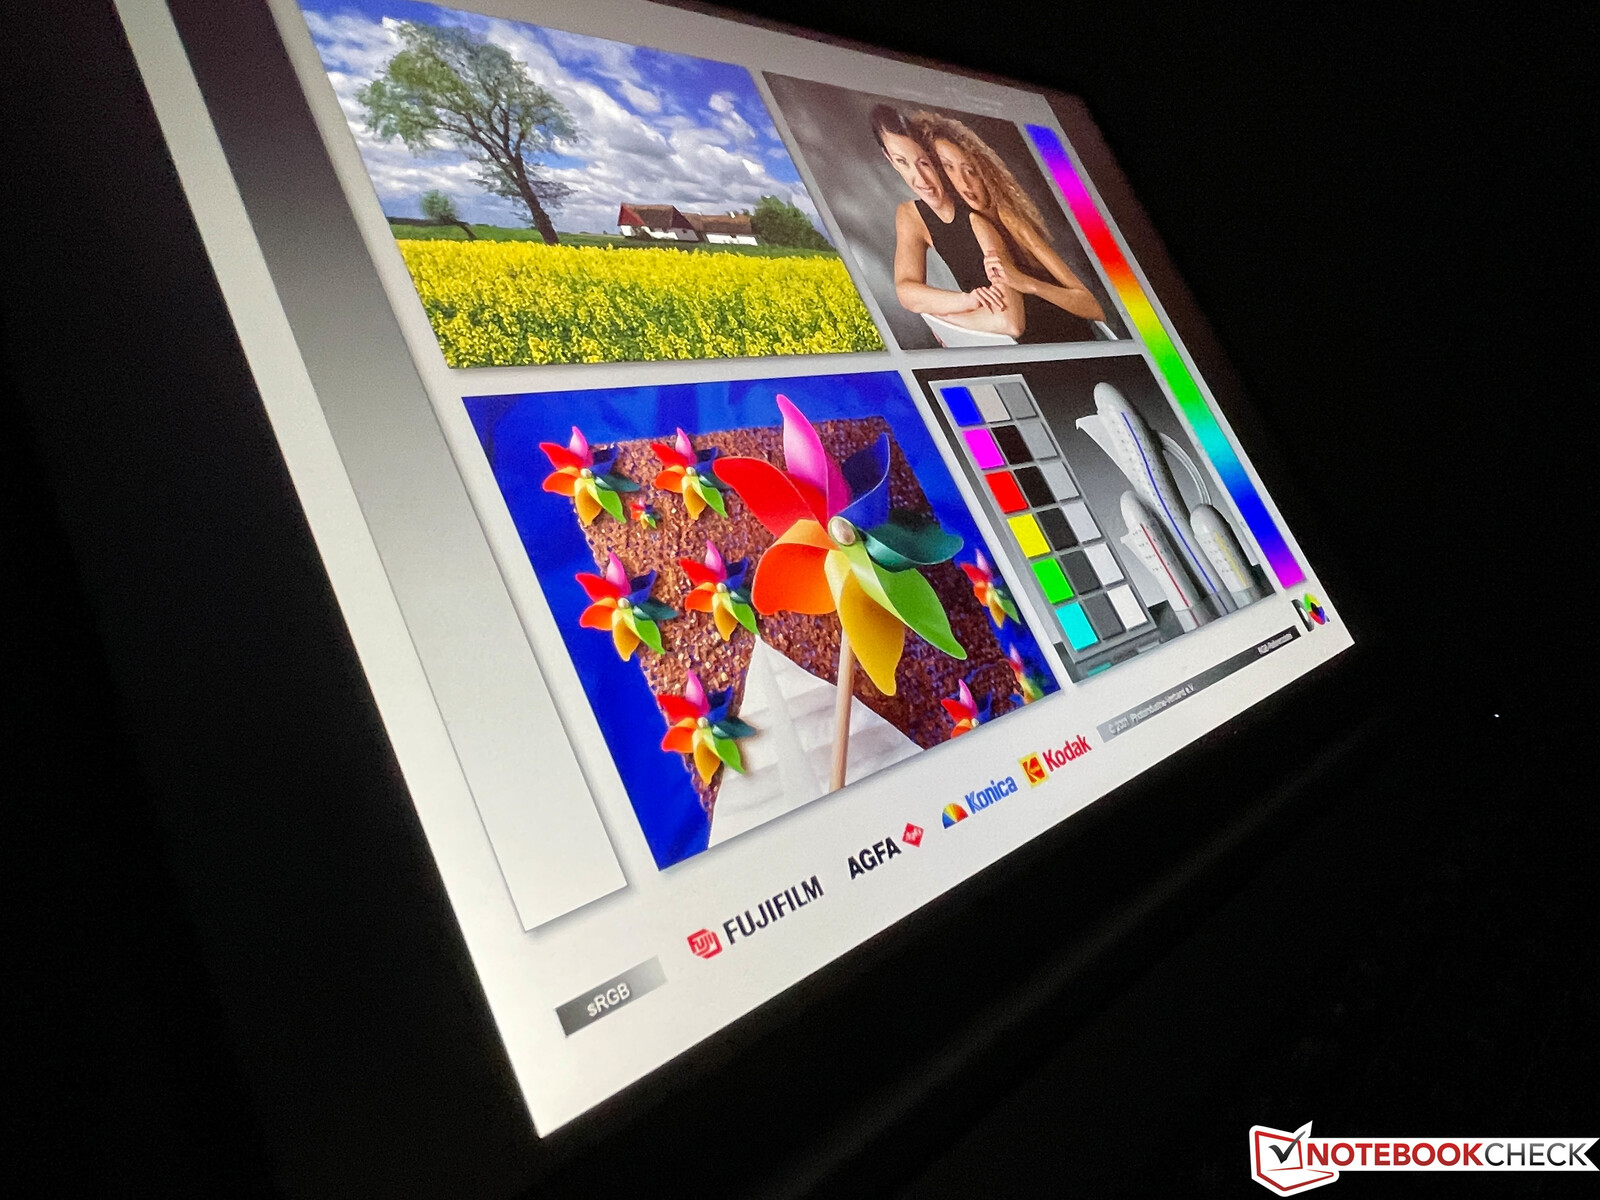
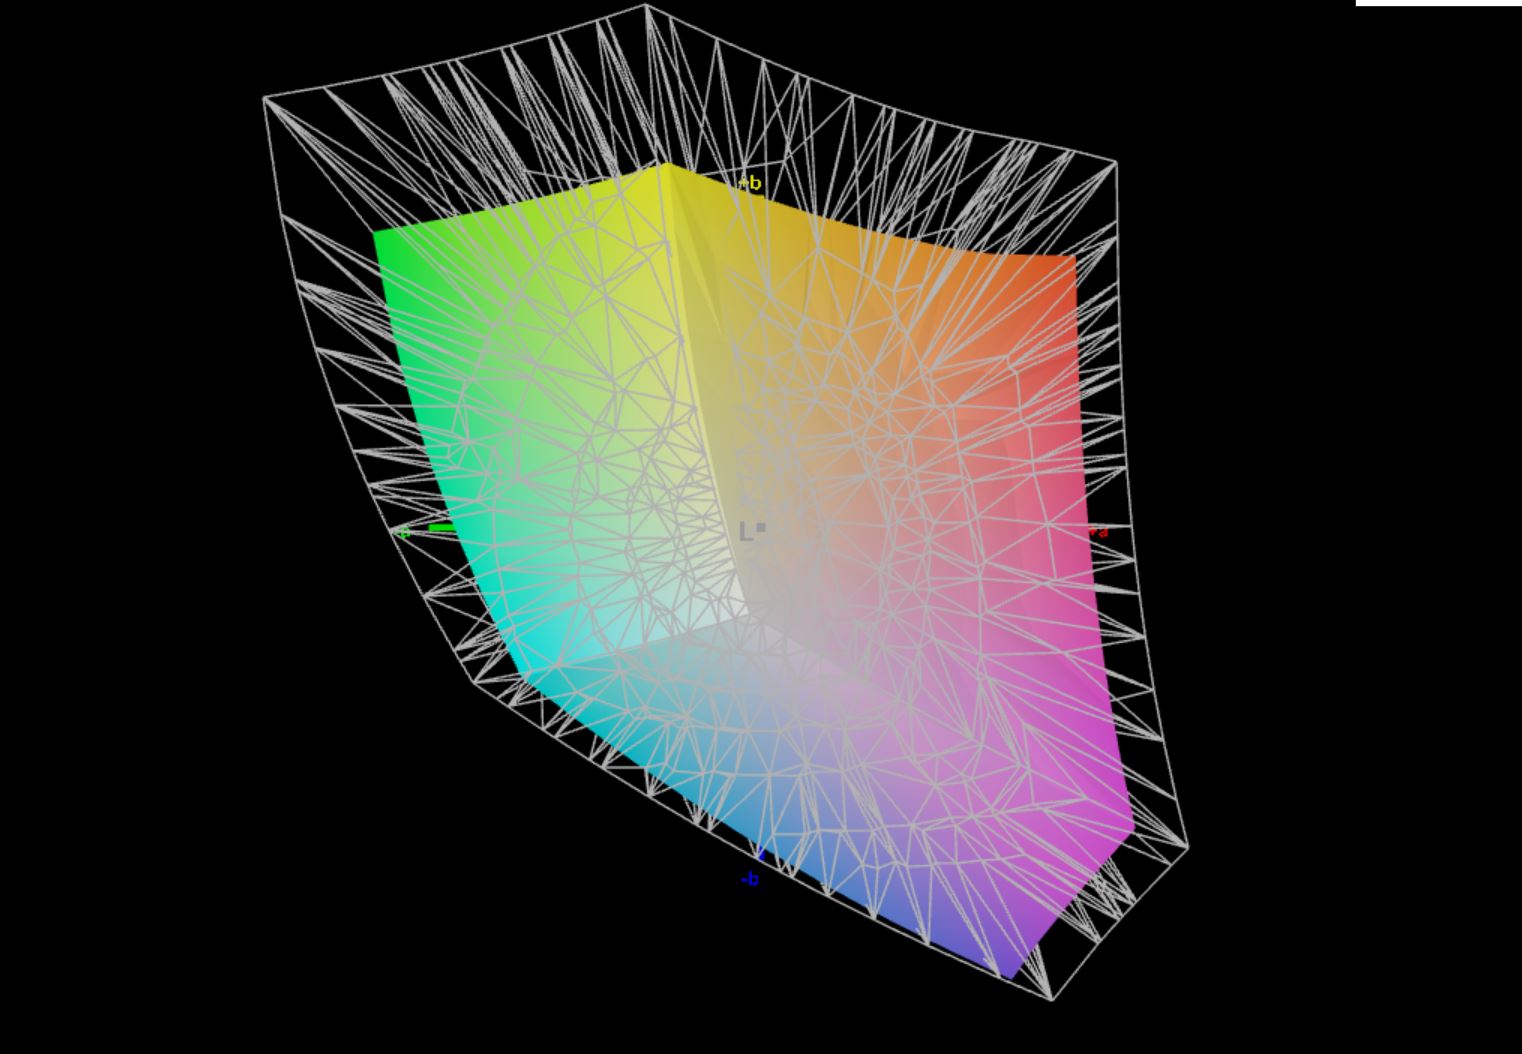
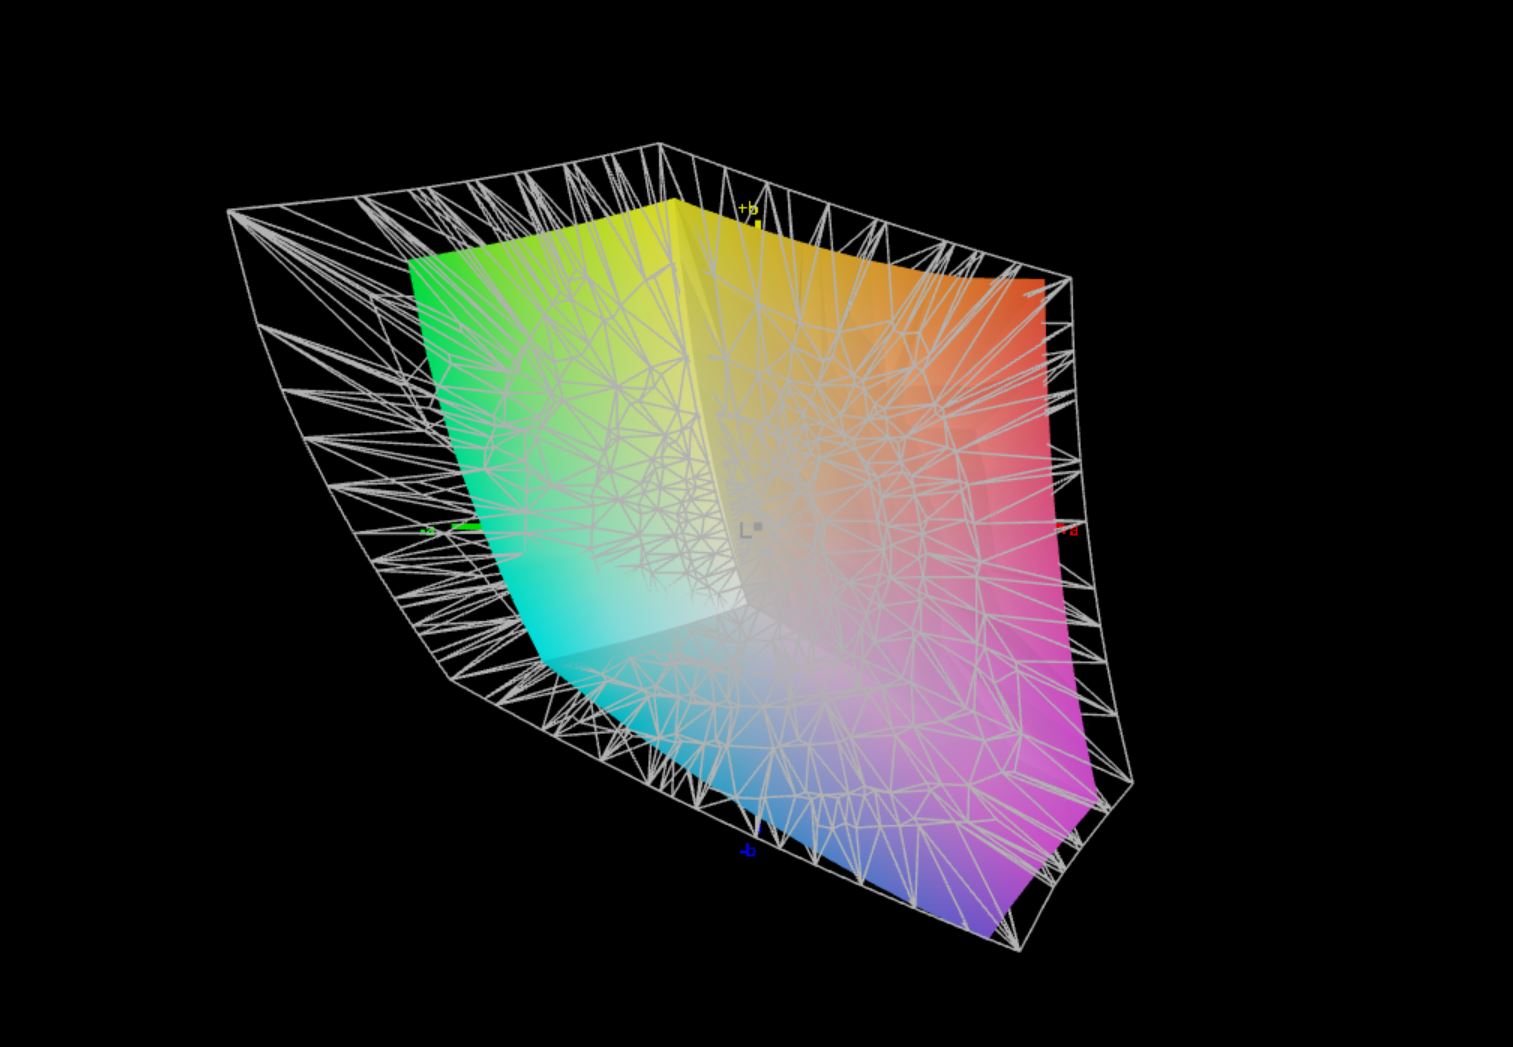
Pantalla - Panel IPS WQHD mate
Lenovo equipa el ThinkBook 16 G4+ con un panel WQHD mate en formato 16:10, pero hay dos versiones diferentes de la pantalla IPS. Nuestro modelo de pruebas usa un panel de 60 Hz, pero según la hoja de especificaciones, también hay un modelo de 120 Hz con calibración de color de fábrica como opción.
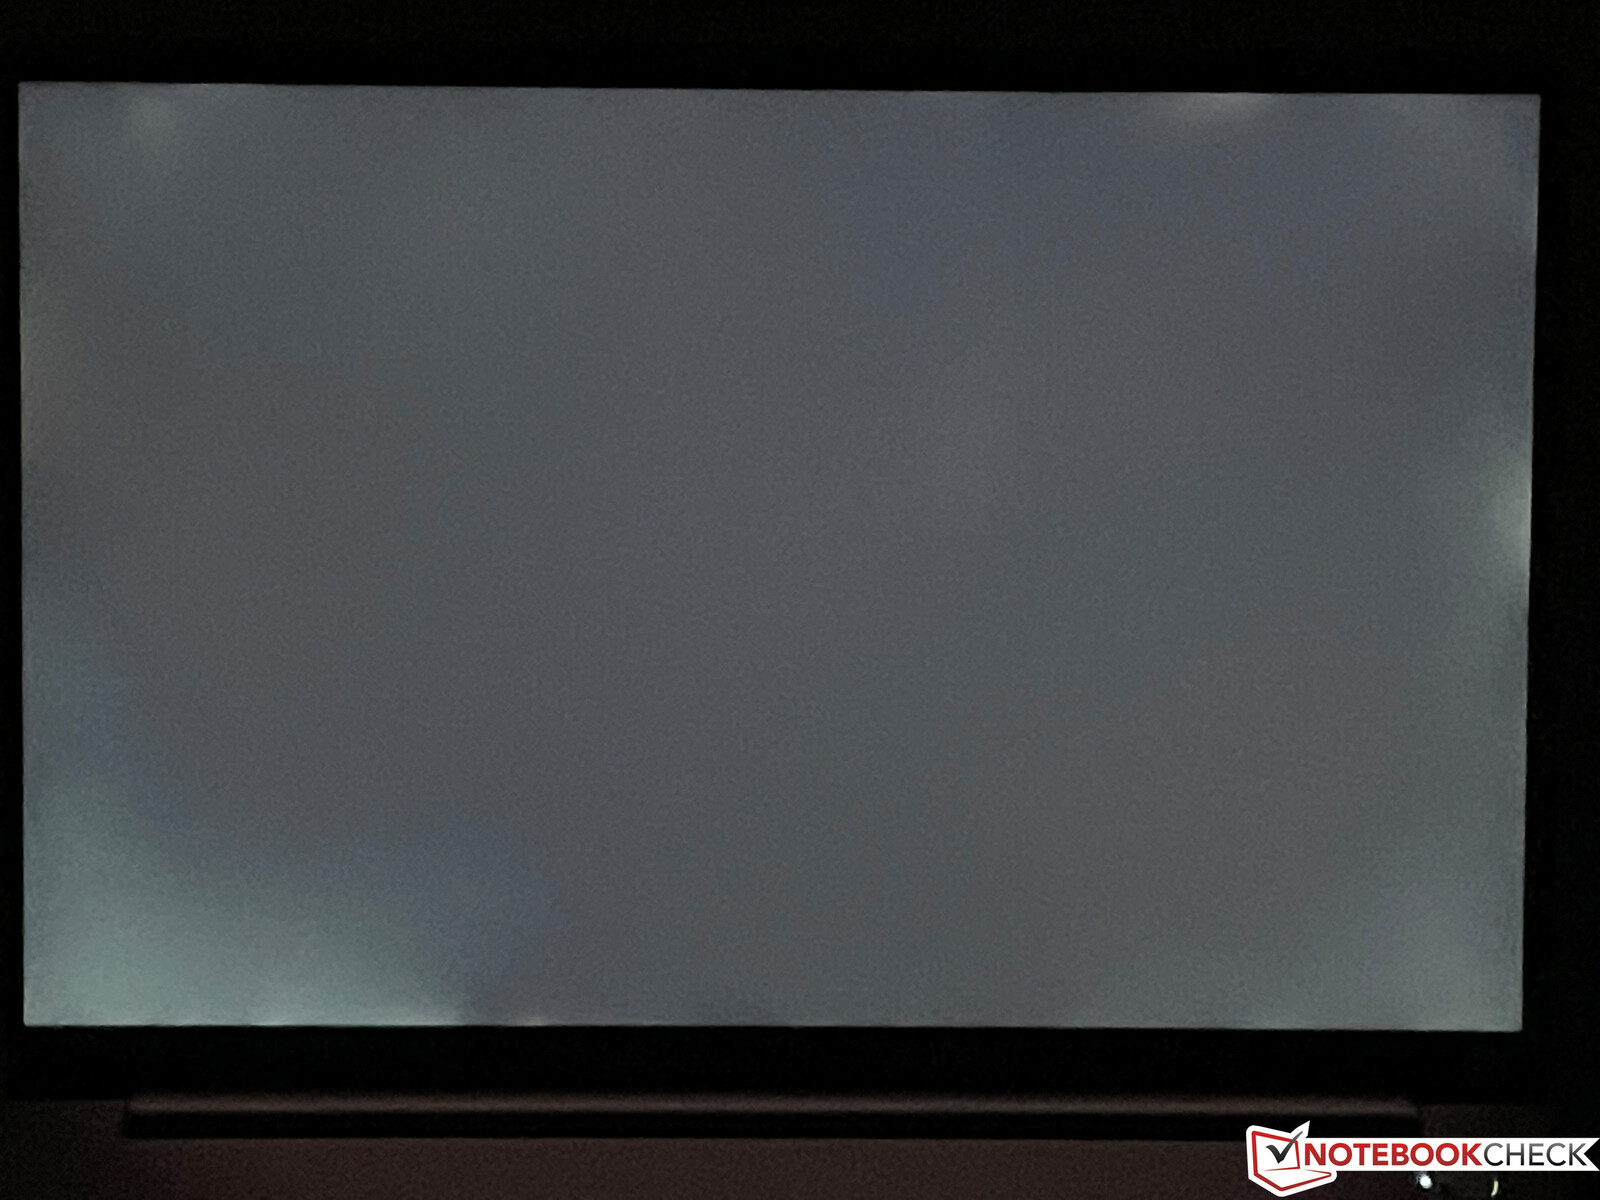
Nuestra impresión subjetiva de la imagen del panel mate es muy buena. El contenido se muestra con claridad, los colores son vivos y las áreas brillantes no tienen grano. Determinamos una muy buena relación de contraste de casi 1700:1 (valor de negro 0,23), que ciertamente también contribuye a la impresión de imagen vívida. Lenovo especifica un brillo de 350 cd/m², que nuestro panel supera con creces. No hay parpadeo PWM y los tiempos de respuesta son discretos, pero hay halos claramente visibles en fondos oscuros a niveles de brillo altos. La estabilidad de los ángulos de visión del display IPS es muy buena, pero el contenido HDR no es compatible.
| |||||||||||||||||||||||||
iluminación: 91 %
Brillo con batería: 372 cd/m²
Contraste: 1613:1 (Negro: 0.23 cd/m²)
ΔE ColorChecker Calman: 2.6 | ∀{0.5-29.43 Ø4.73}
calibrated: 1.3
ΔE Greyscale Calman: 3.7 | ∀{0.09-98 Ø4.97}
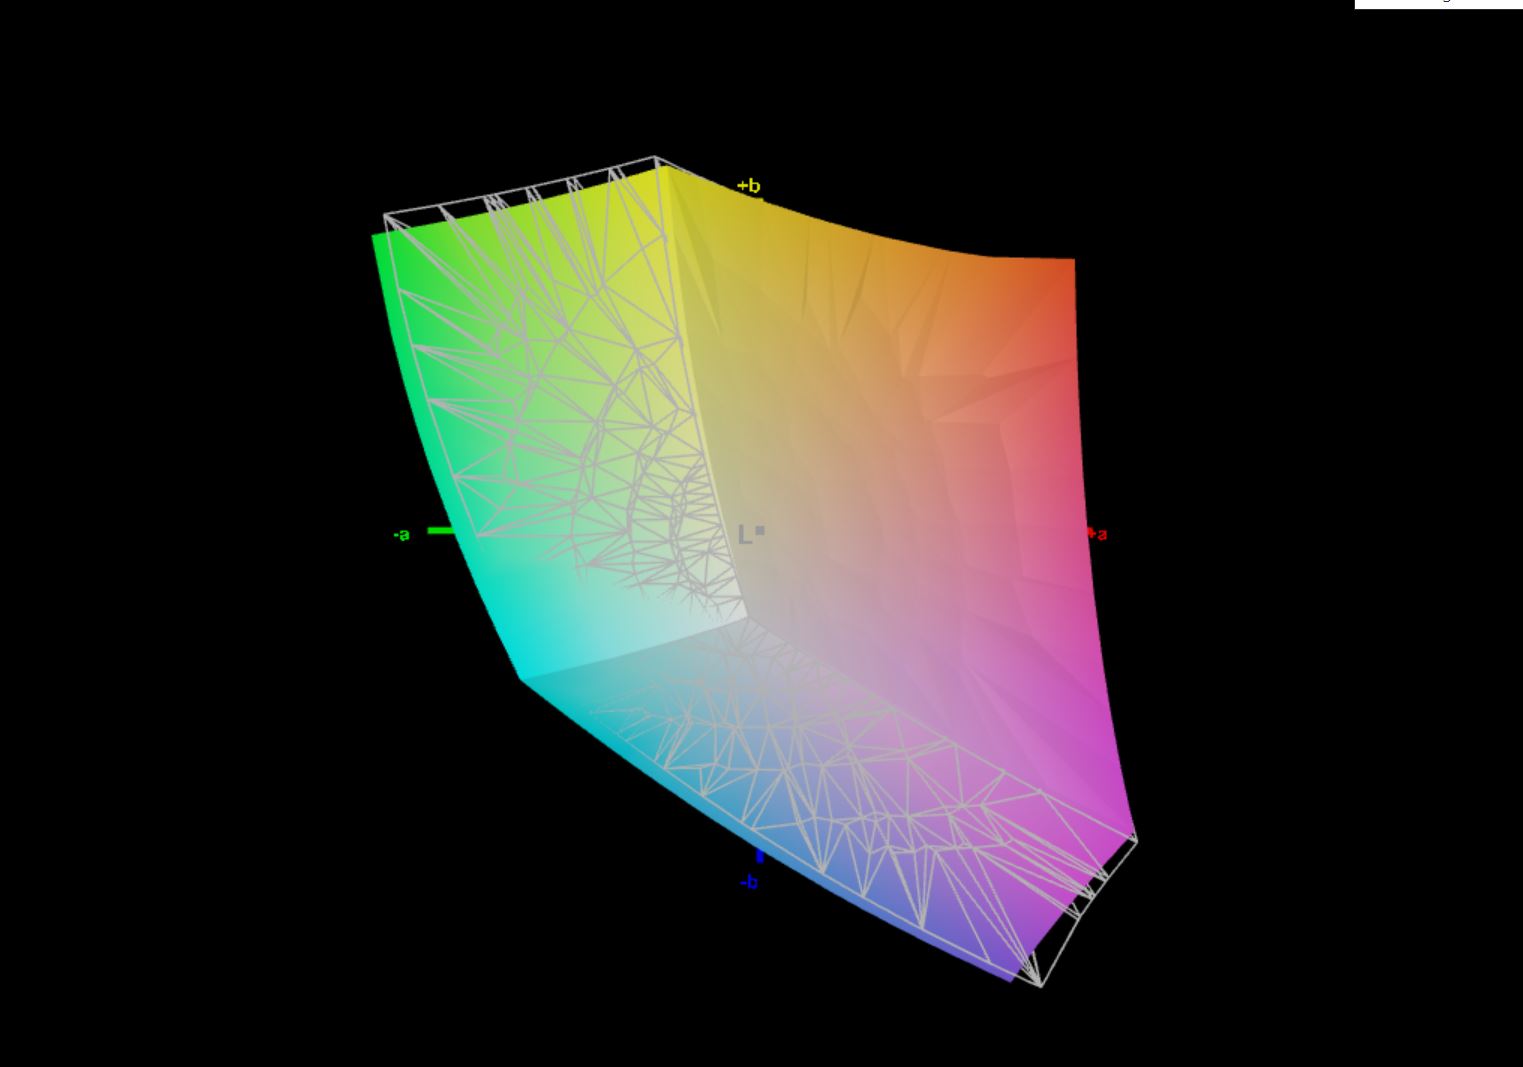
71.7% AdobeRGB 1998 (Argyll 3D)
97.5% sRGB (Argyll 3D)
69.6% Display P3 (Argyll 3D)
Gamma: 2.32
CCT: 7271 K
| Lenovo ThinkBook 16 G4+ IAP LEN160WQXGA, IPS, 2560x1600, 16" | Dell Inspiron 16 Plus 7620 BOE NE16N41, IPS, 3072x1920, 16" | Acer Swift X SFX16-51G-5388 Chi Mei N161HCA-EA3, , 1920x1080, 16.1" | Asus Vivobook Pro 16X-M7600QE Samsung ATNA60YV02-0, OLED, 3840x2400, 16.1" | Huawei MateBook D 16 2022 BOE NV160WUM-NH0, IPS, 1920x1200, 16" | Samsung Galaxy Book2 15 NE156FHM-NS0, IPS, 1920x1080, 15.6" | |
|---|---|---|---|---|---|---|
| Display | 2% | -5% | 27% | -4% | -27% | |
| Display P3 Coverage (%) | 69.6 | 70.8 2% | 65.1 -6% | 99.8 43% | 66.2 -5% | 49.6 -29% |
| sRGB Coverage (%) | 97.5 | 99.5 2% | 95.65 -2% | 100 3% | 96.4 -1% | 74.8 -23% |
| AdobeRGB 1998 Coverage (%) | 71.7 | 73.2 2% | 66.75 -7% | 96.9 35% | 68.3 -5% | 51.3 -28% |
| Response Times | -42% | -6% | 91% | -2% | -24% | |
| Response Time Grey 50% / Grey 80% * (ms) | 32.7 ? | 38 ? -16% | 30 ? 8% | 2 ? 94% | 30.5 ? 7% | 32.3 ? 1% |
| Response Time Black / White * (ms) | 16.8 ? | 28 ? -67% | 20 ? -19% | 2 ? 88% | 18.7 ? -11% | 25 ? -49% |
| PWM Frequency (Hz) | 60 ? | |||||
| Screen | 8% | 11% | 14% | -19% | -71% | |
| Brightness middle (cd/m²) | 371 | 288.9 -22% | 276 -26% | 392 6% | 319 -14% | 337 -9% |
| Brightness (cd/m²) | 357 | 276 -23% | 264 -26% | 396 11% | 317 -11% | 325 -9% |
| Brightness Distribution (%) | 91 | 92 1% | 85 -7% | 98 8% | 90 -1% | 89 -2% |
| Black Level * (cd/m²) | 0.23 | 0.26 -13% | 0.16 30% | 0.23 -0% | 0.4 -74% | |
| Contrast (:1) | 1613 | 1111 -31% | 1725 7% | 1387 -14% | 843 -48% | |
| Colorchecker dE 2000 * | 2.6 | 1.88 28% | 1.8 31% | 1.74 33% | 3.4 -31% | 4.7 -81% |
| Colorchecker dE 2000 max. * | 4.4 | 4.37 1% | 3.77 14% | 3.18 28% | 8.1 -84% | 15.7 -257% |
| Colorchecker dE 2000 calibrated * | 1.3 | 0.42 68% | 0.63 52% | 1.85 -42% | 0.8 38% | 2.8 -115% |
| Greyscale dE 2000 * | 3.7 | 1.4 62% | 2.76 25% | 1.77 52% | 5.7 -54% | 5.4 -46% |
| Gamma | 2.32 95% | 2.3 96% | 2.37 93% | 2.22 99% | 2.1 105% | 2.07 106% |
| CCT | 7271 89% | 6634 98% | 6564 99% | 6483 100% | 7433 87% | 7727 84% |
| Media total (Programa/Opciones) | -11% /
-0% | 0% /
5% | 44% /
30% | -8% /
-13% | -41% /
-55% |
* ... más pequeño es mejor
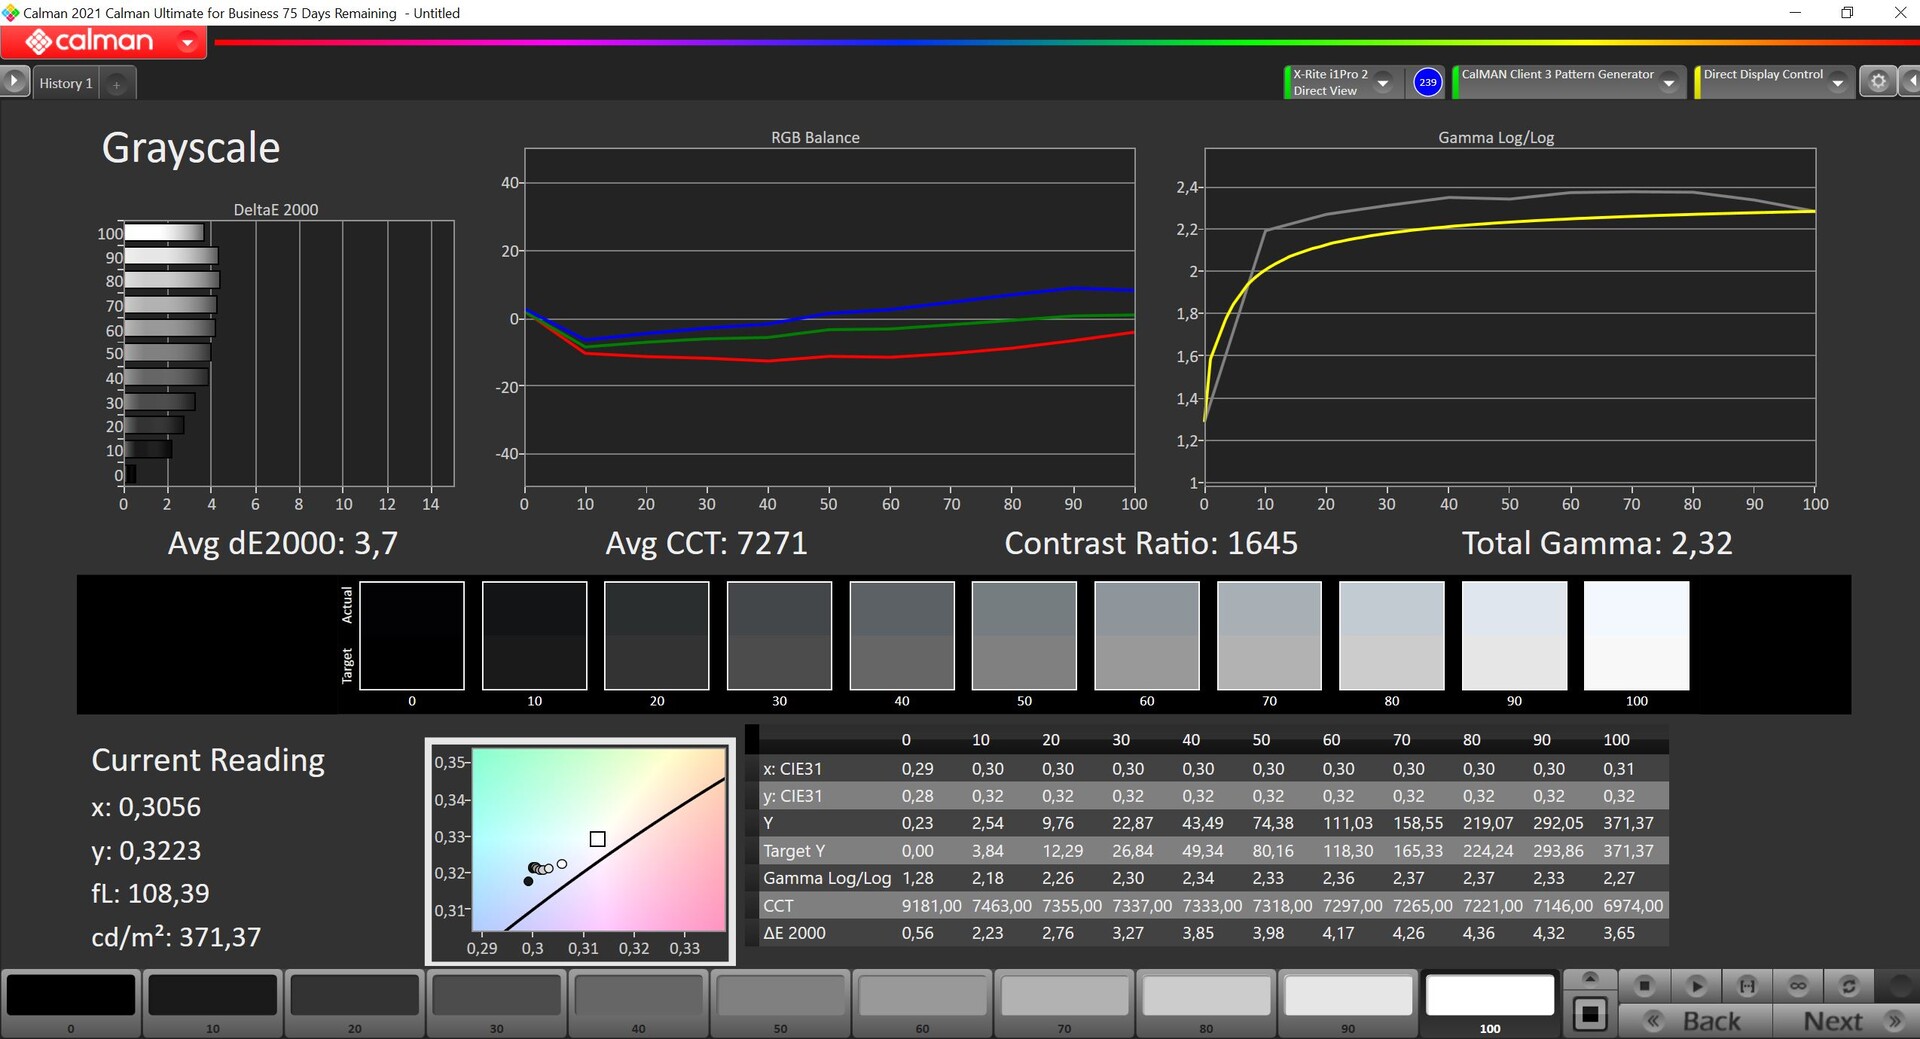
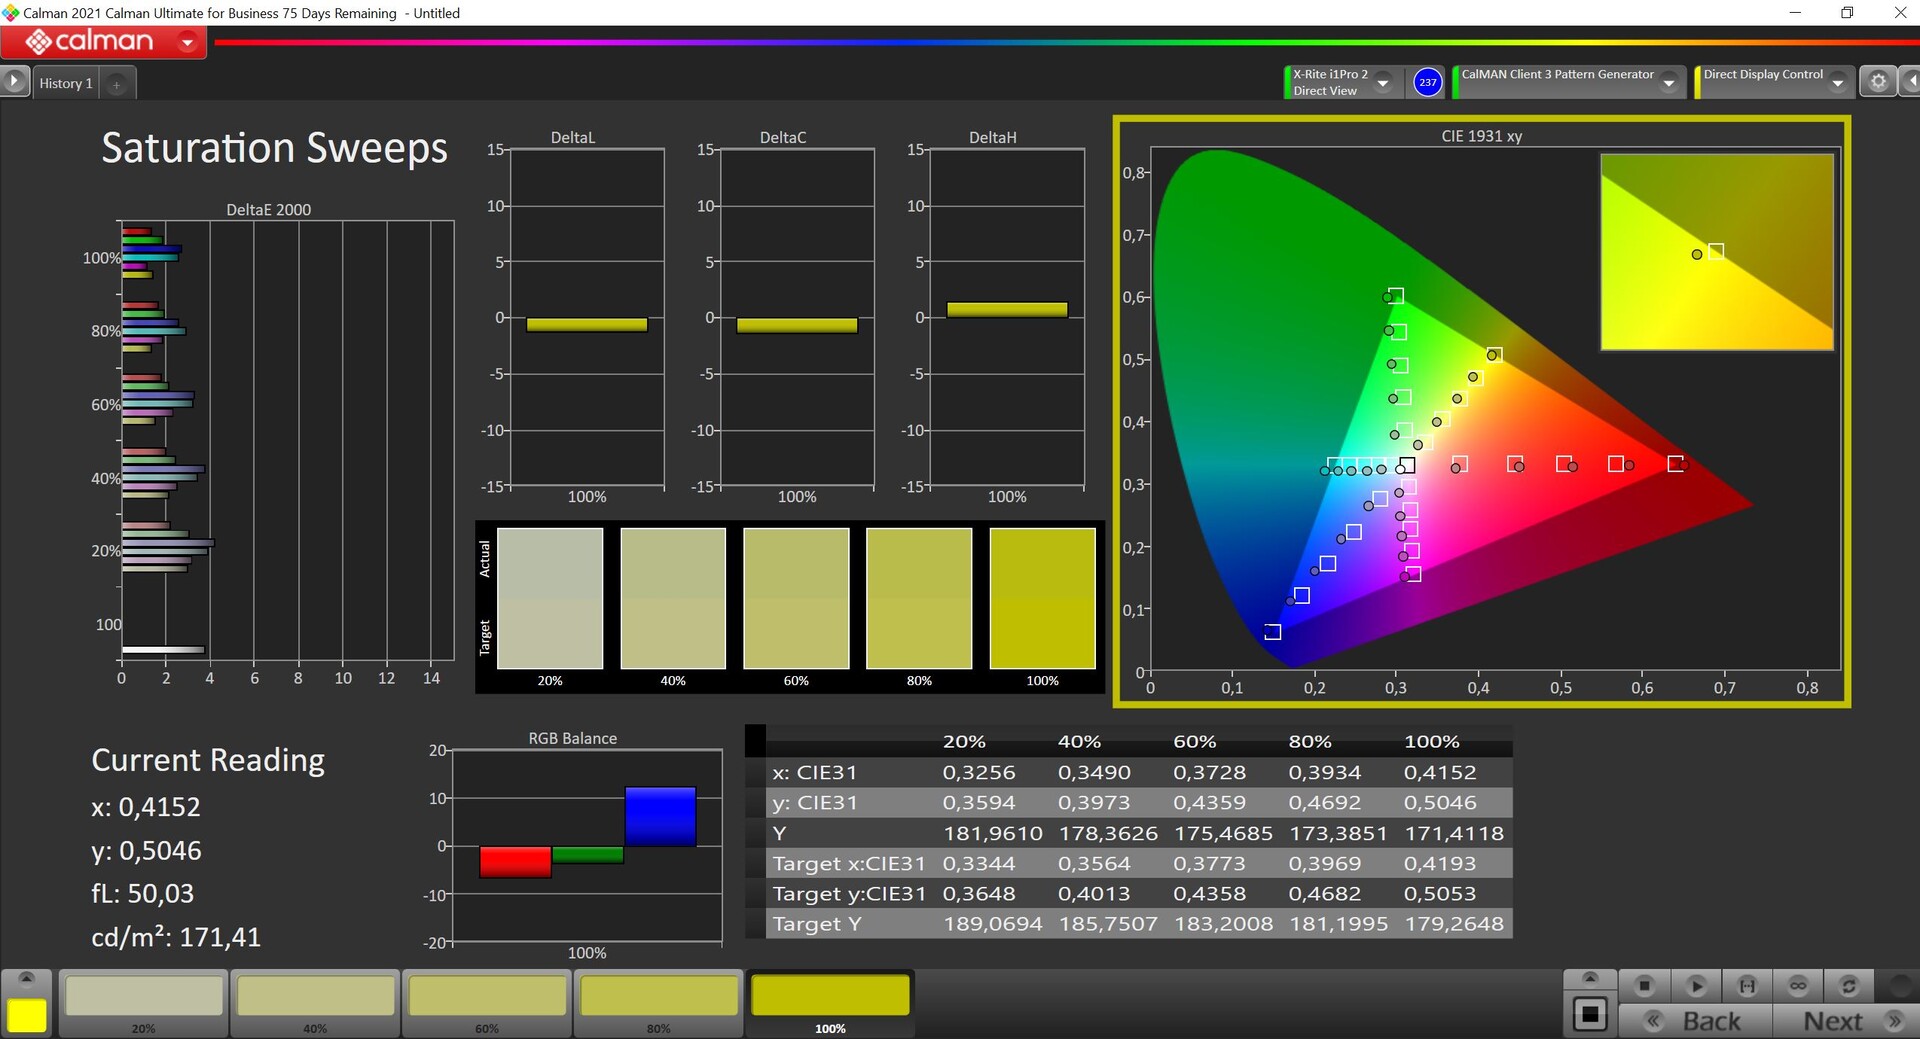
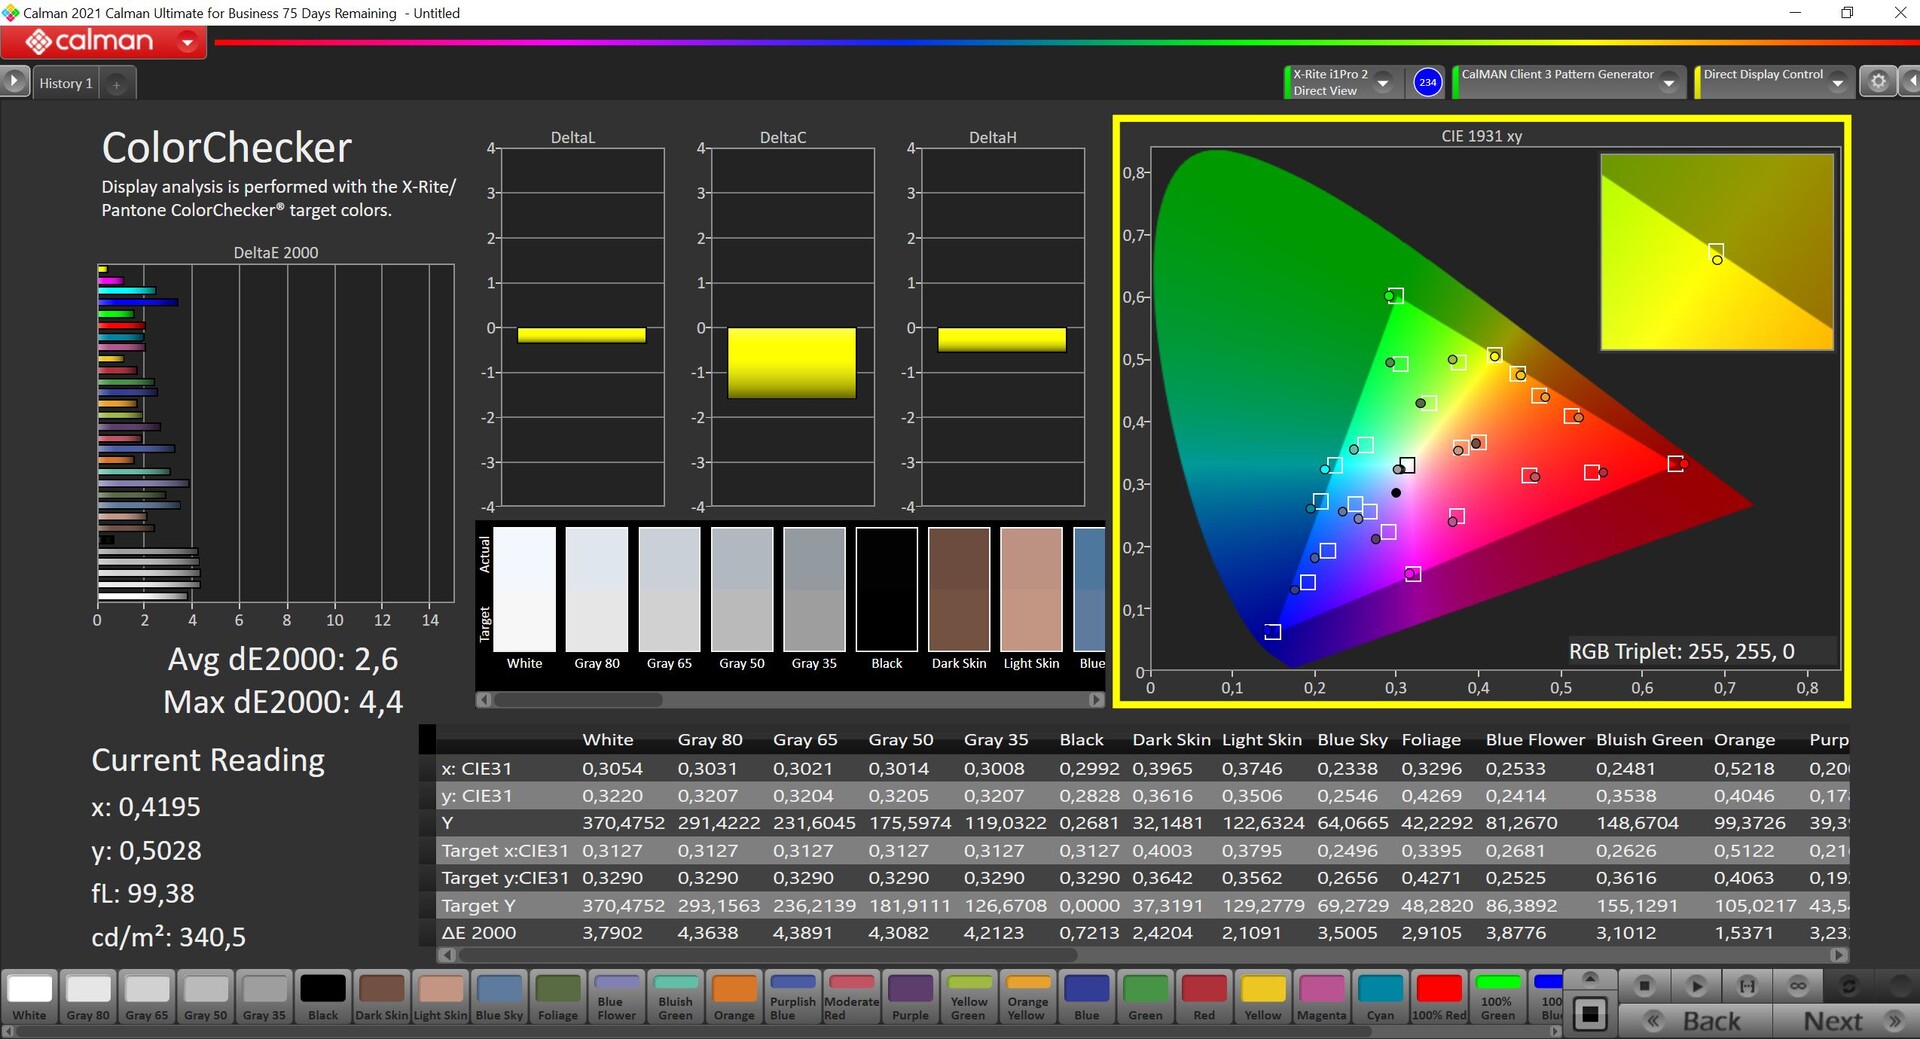
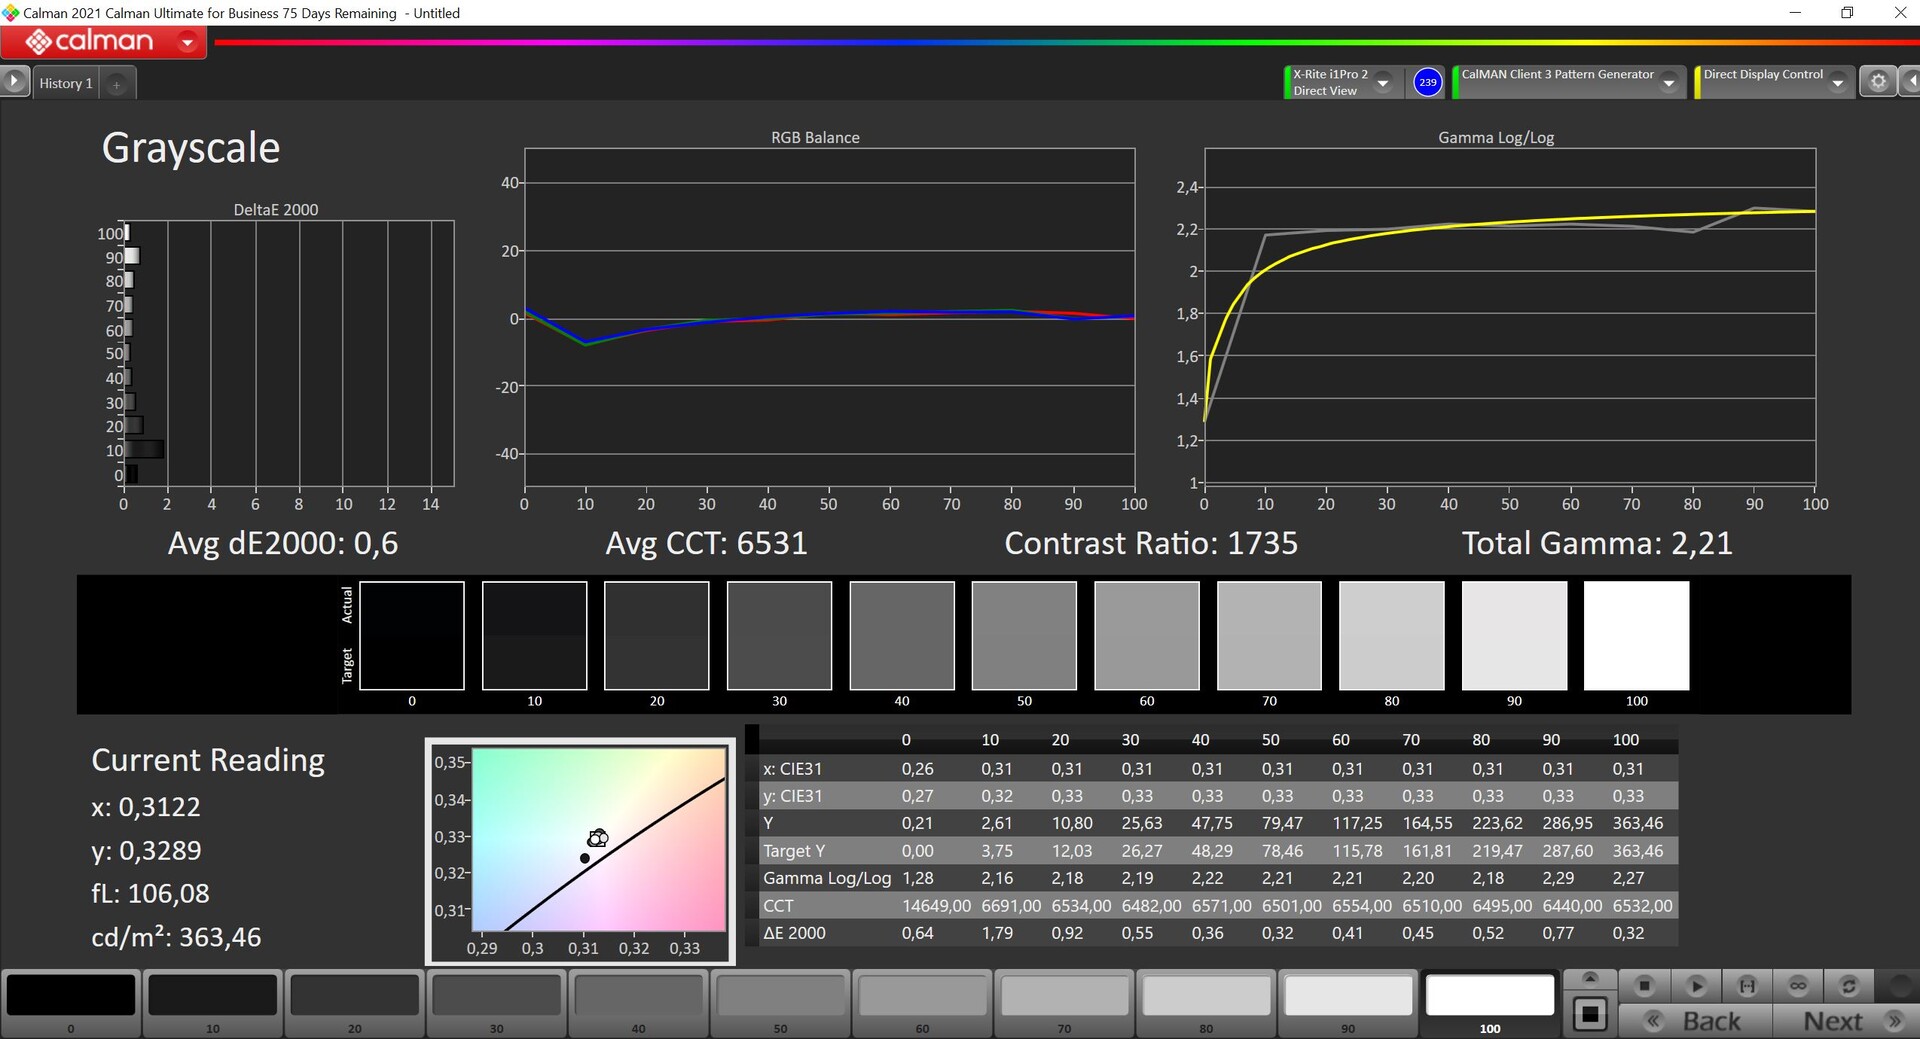
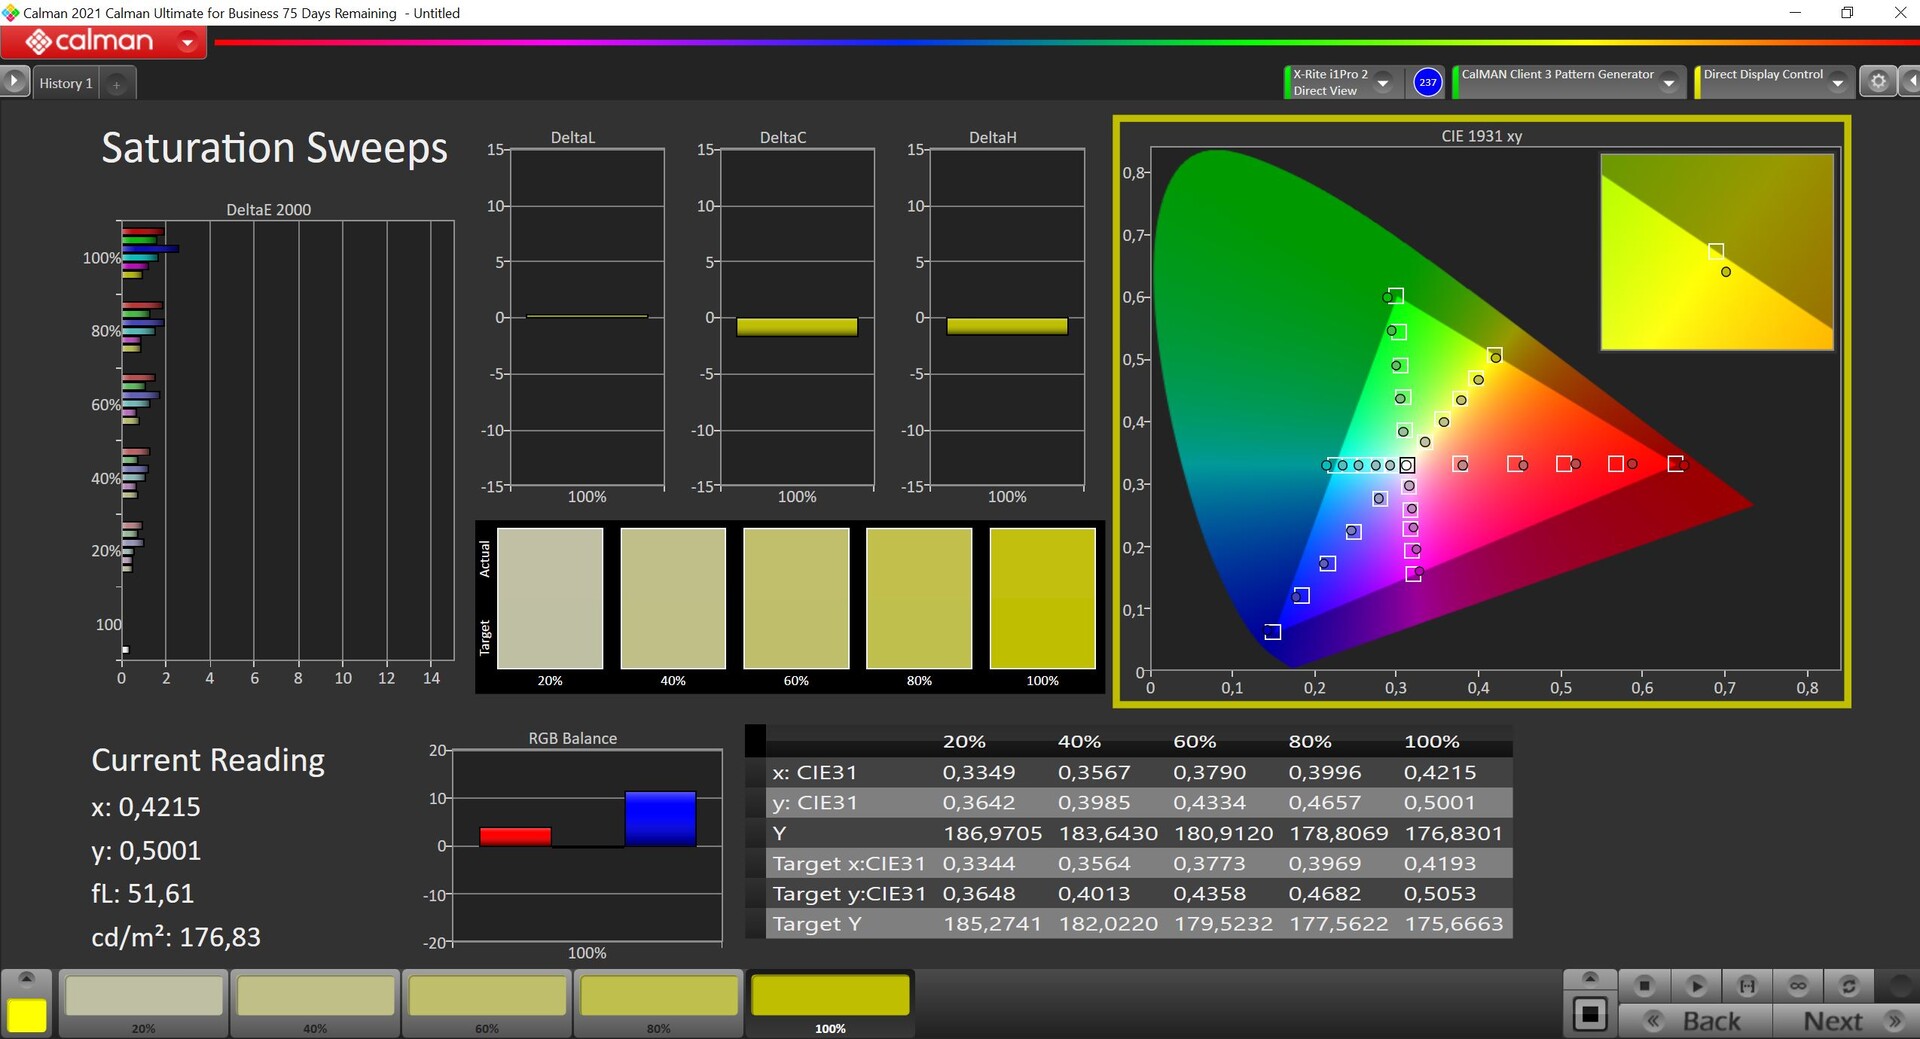
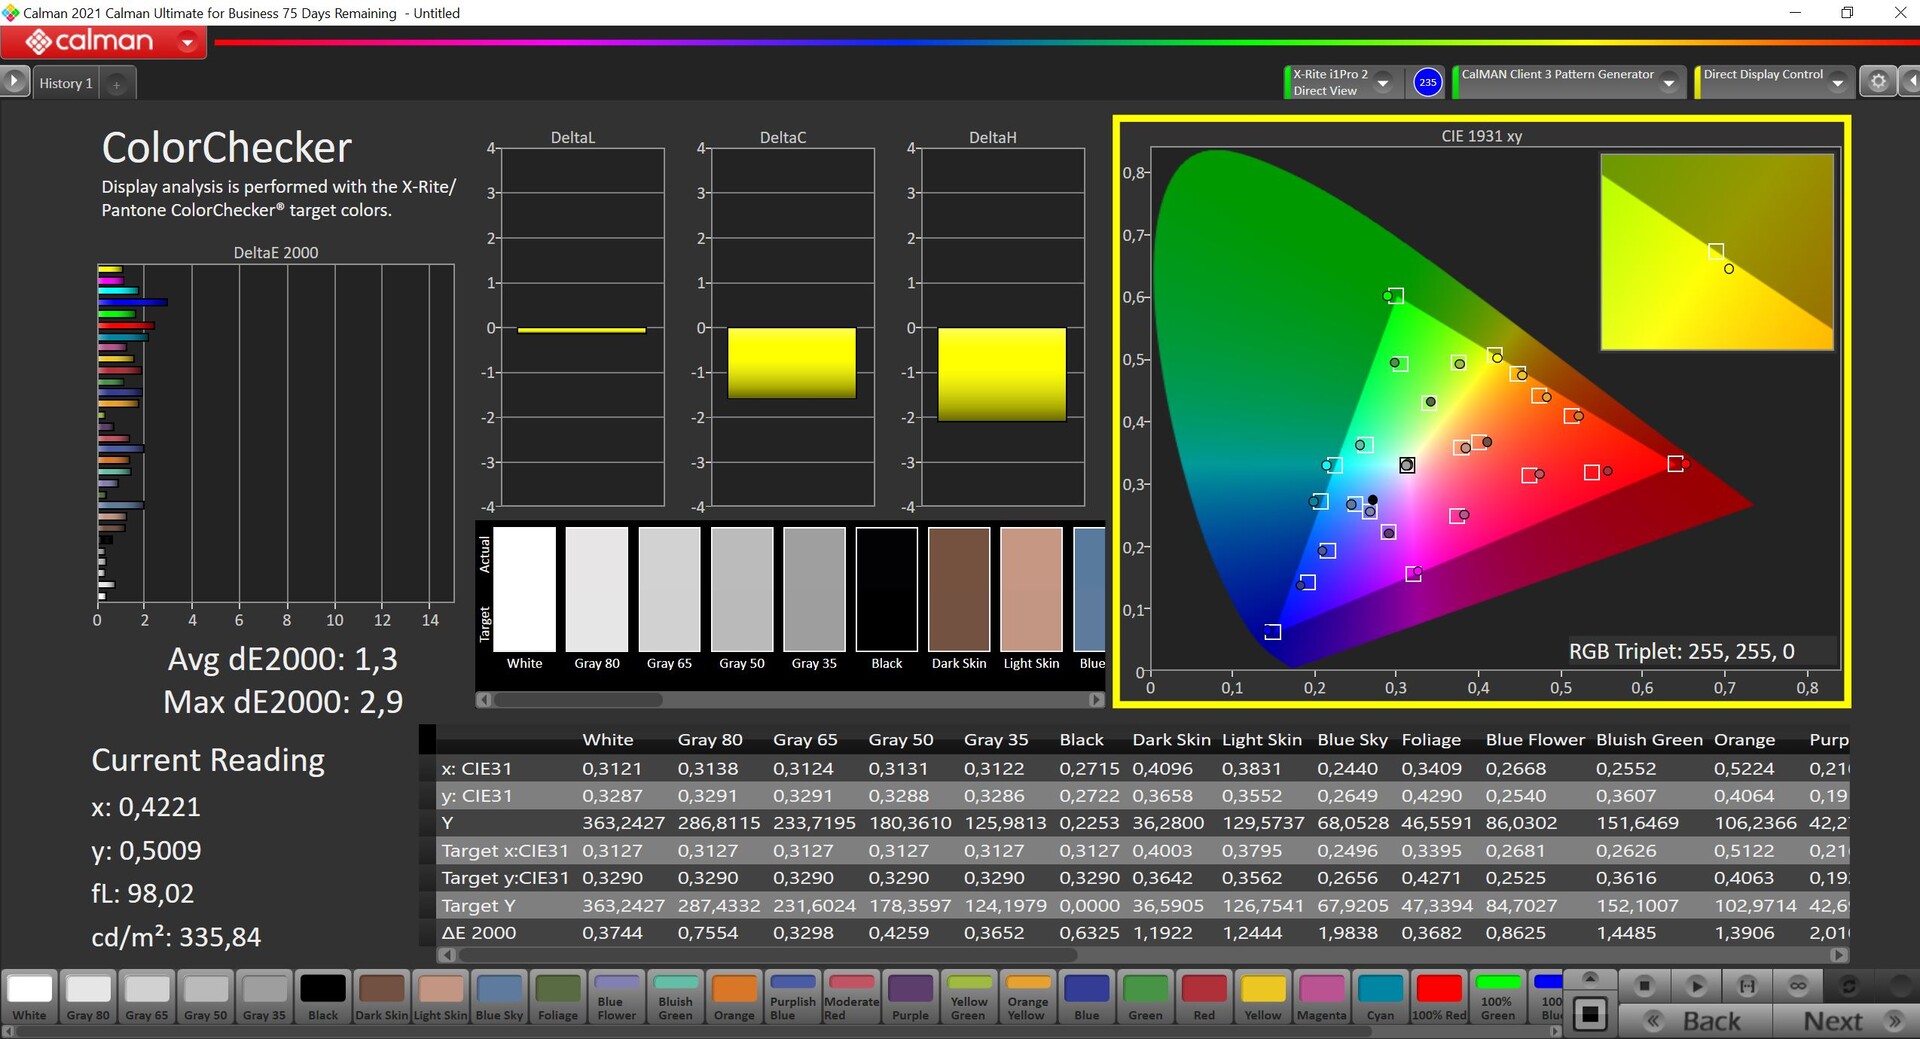
Nuestro análisis con el software profesional CalMAN (X-Rite i1 Pro 2) revela un tinte ligeramente azulado junto con una temperatura de color ligeramente demasiado fría. Por otro lado, las desviaciones de la escala de grises y también de los colores en comparación con el espacio de color de referencia sRGB son ya bastante bajas. Si no quieres editar imágenes, no tienes por qué calibrar el panel, pero aún hay mucho potencial aquí y, tras nuestra calibración, los resultados son mucho mejores y todos los colores están por debajo de la importante desviación DeltaE-2000 de 3. Junto con la cobertura sRGB casi completa, la edición de imagen/vídeo también es posible
Tiempos de respuesta del display
| ↔ Tiempo de respuesta de Negro a Blanco | ||
|---|---|---|
| 16.8 ms ... subida ↗ y bajada ↘ combinada | ↗ 6.4 ms subida | 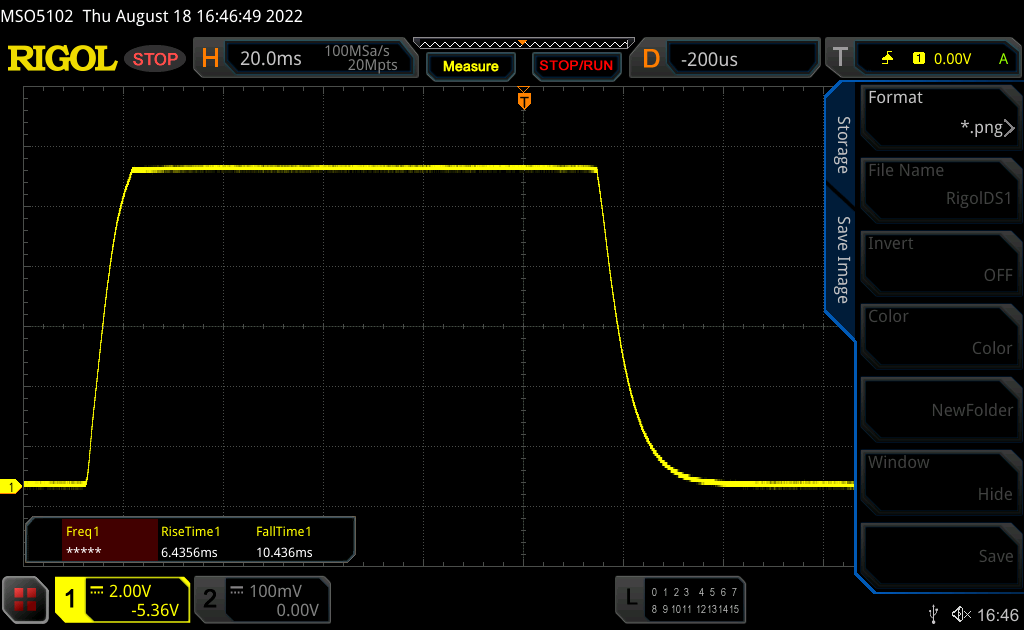 |
| ↘ 10.4 ms bajada | ||
| La pantalla mostró buenos tiempos de respuesta en nuestros tests pero podría ser demasiado lenta para los jugones competitivos. En comparación, todos los dispositivos de prueba van de ##min### (mínimo) a 240 (máximo) ms. » 38 % de todos los dispositivos son mejores. Esto quiere decir que el tiempo de respuesta medido es mejor que la media (19.9 ms) de todos los dispositivos testados. | ||
| ↔ Tiempo de respuesta 50% Gris a 80% Gris | ||
| 32.7 ms ... subida ↗ y bajada ↘ combinada | ↗ 15.7 ms subida | 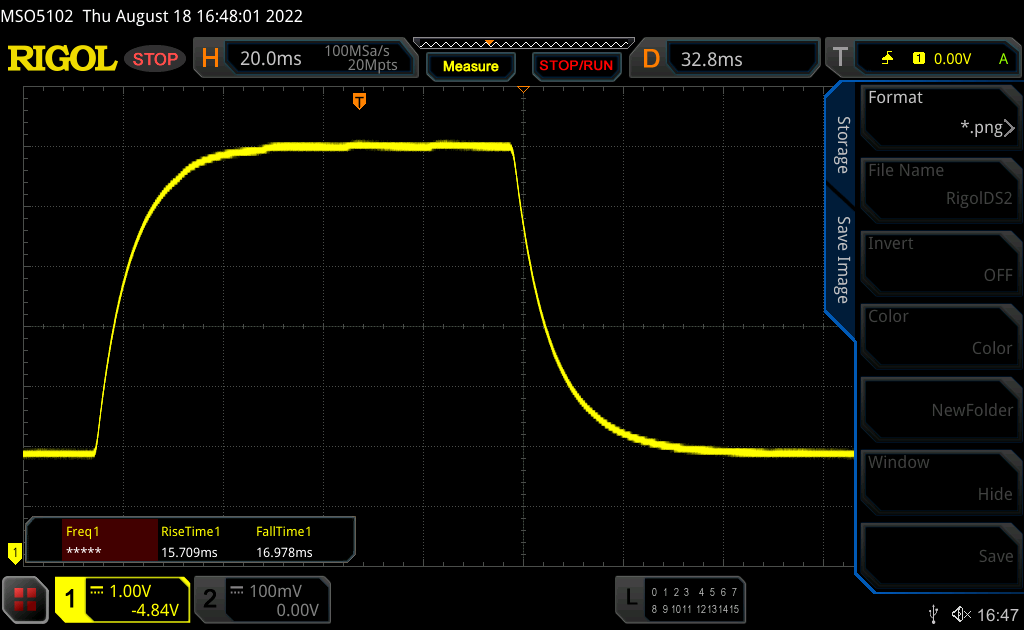 |
| ↘ 17 ms bajada | ||
| La pantalla mostró tiempos de respuesta lentos en nuestros tests y podría ser demasiado lenta para los jugones. En comparación, todos los dispositivos de prueba van de ##min### (mínimo) a 636 (máximo) ms. » 44 % de todos los dispositivos son mejores. Eso quiere decir que el tiempo de respuesta es similar al dispositivo testado medio (31.1 ms). | ||
Parpadeo de Pantalla / PWM (Pulse-Width Modulation)
| Parpadeo de Pantalla / PWM no detectado |  | ||
Comparación: 52 % de todos los dispositivos testados no usaron PWM para atenuar el display. Si se usó, medimos una media de 7801 (mínimo: 5 - máxmo: 343500) Hz. | |||
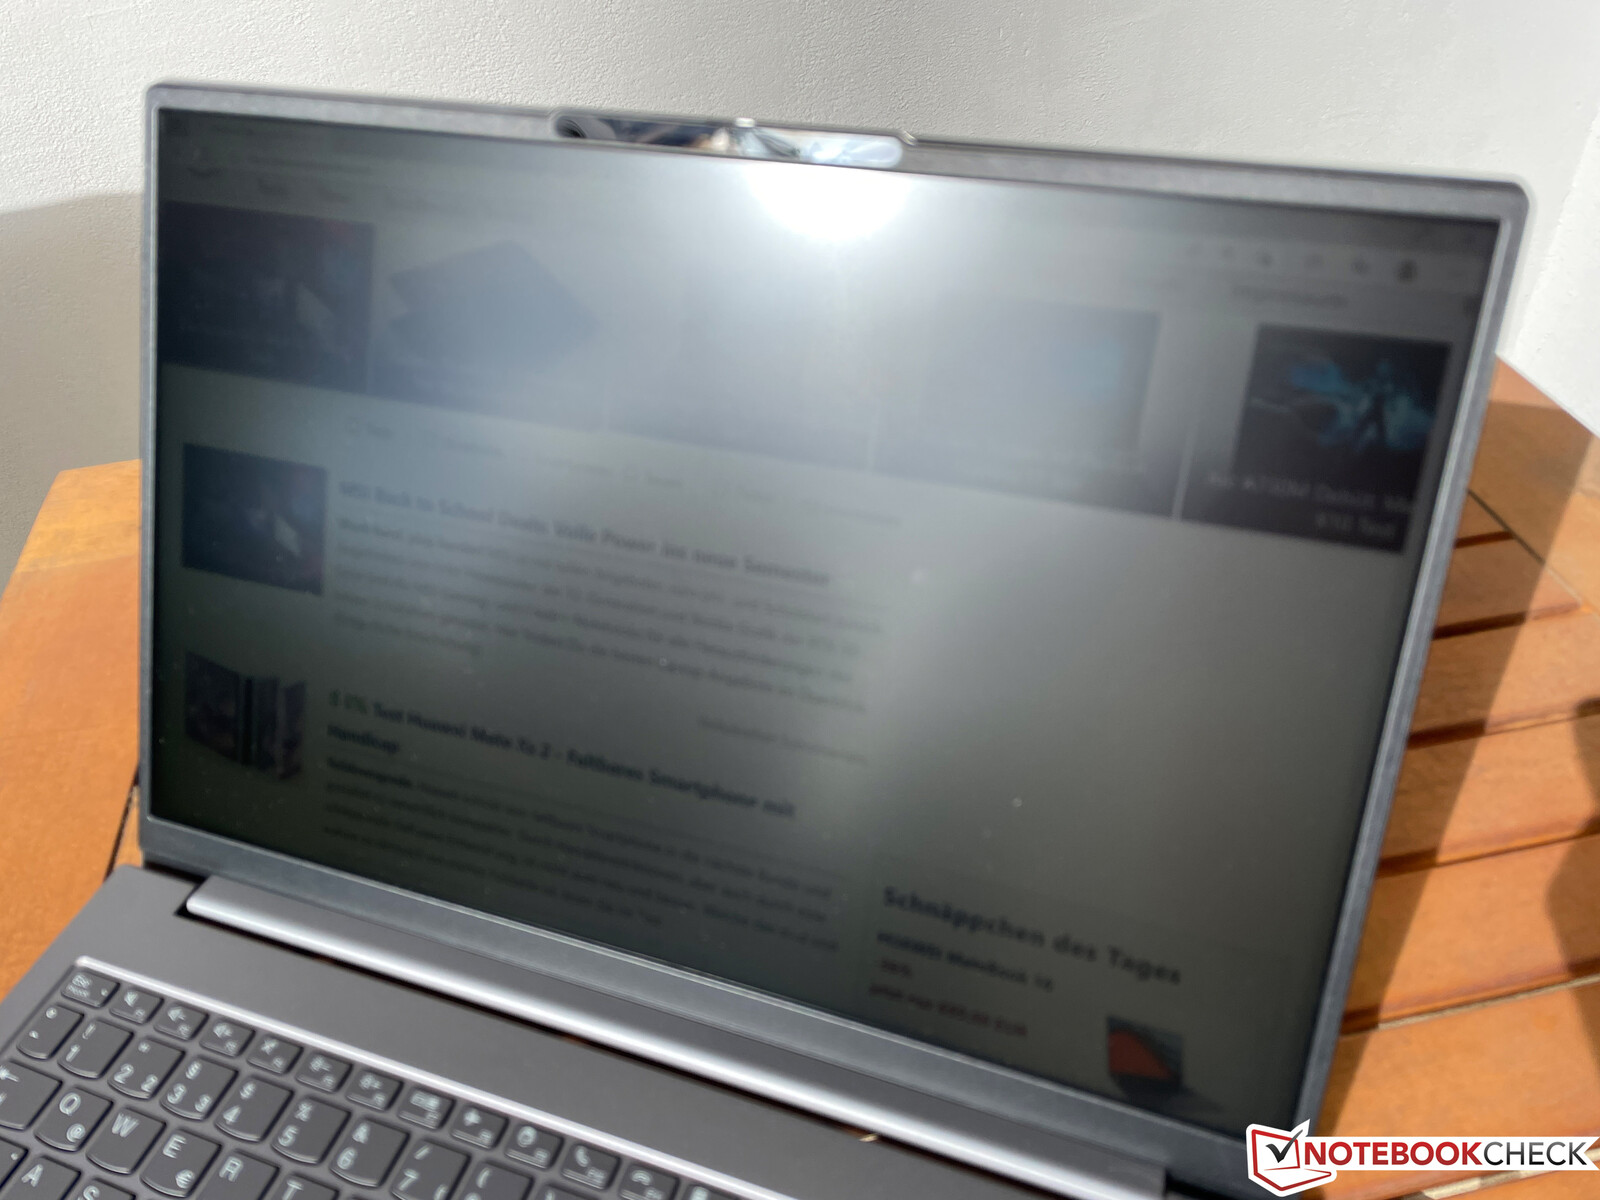
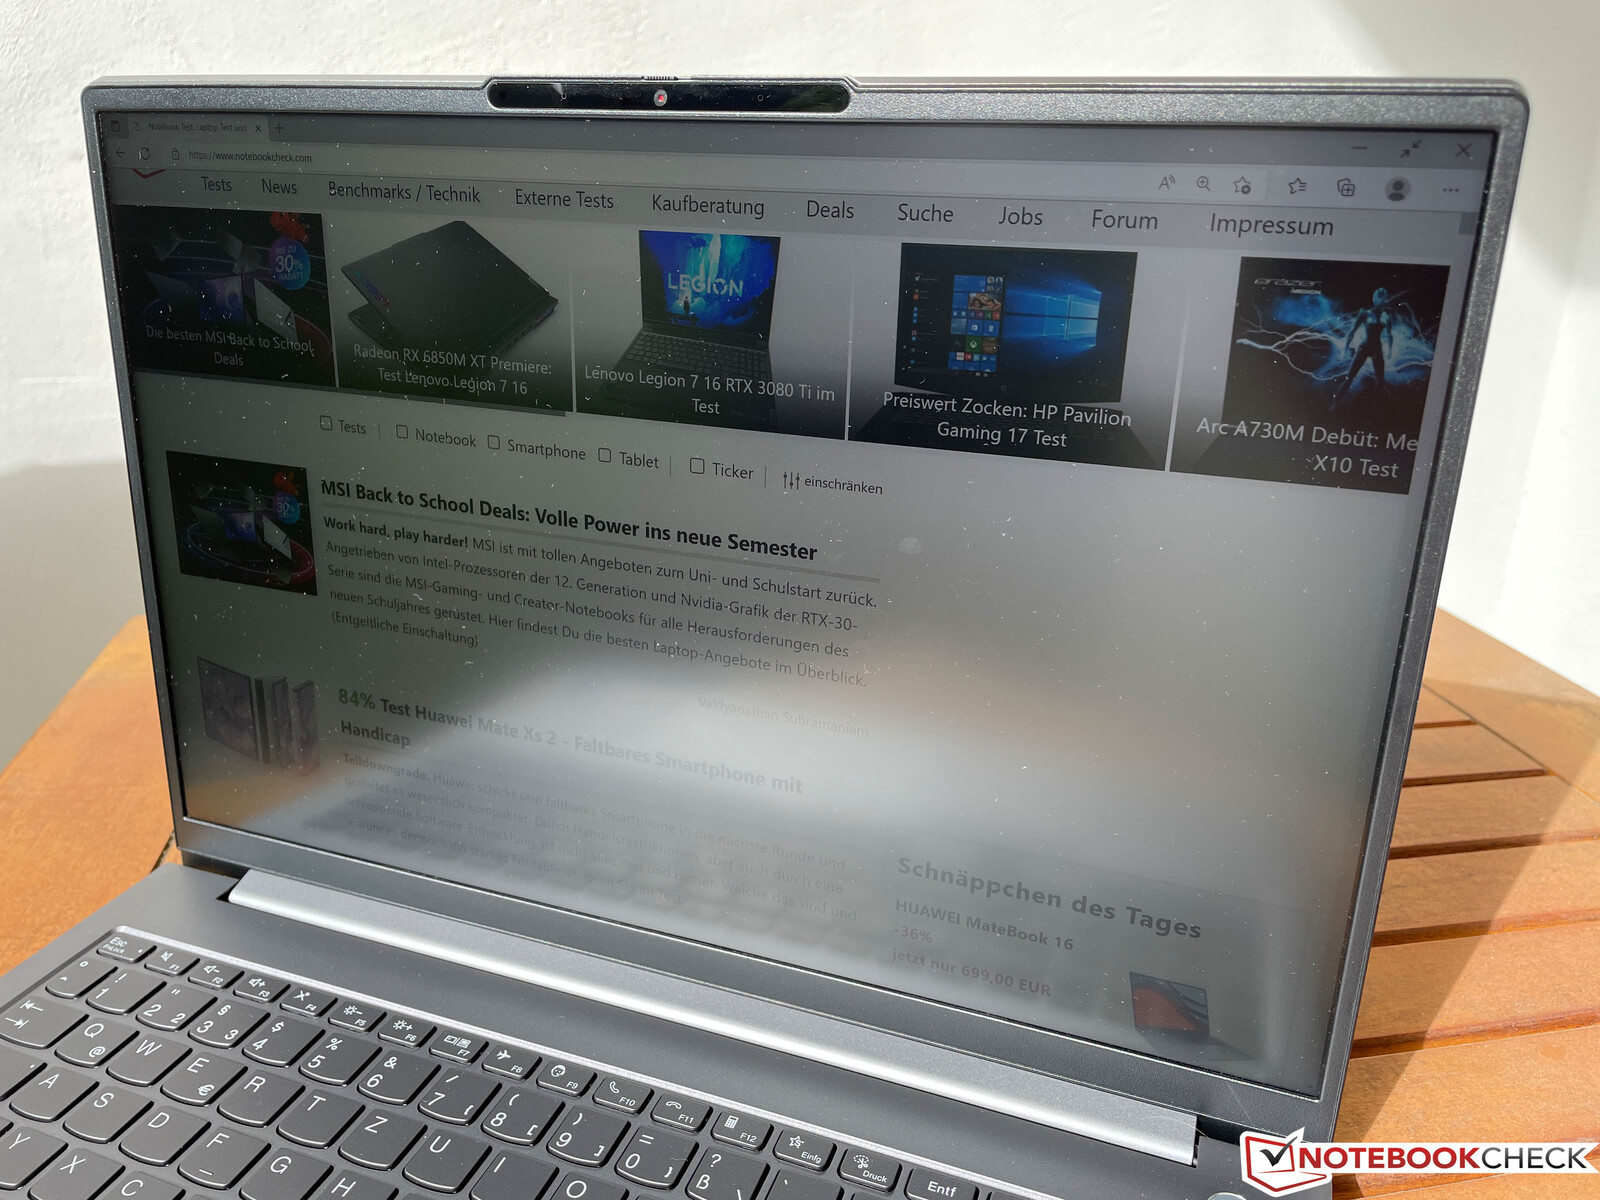
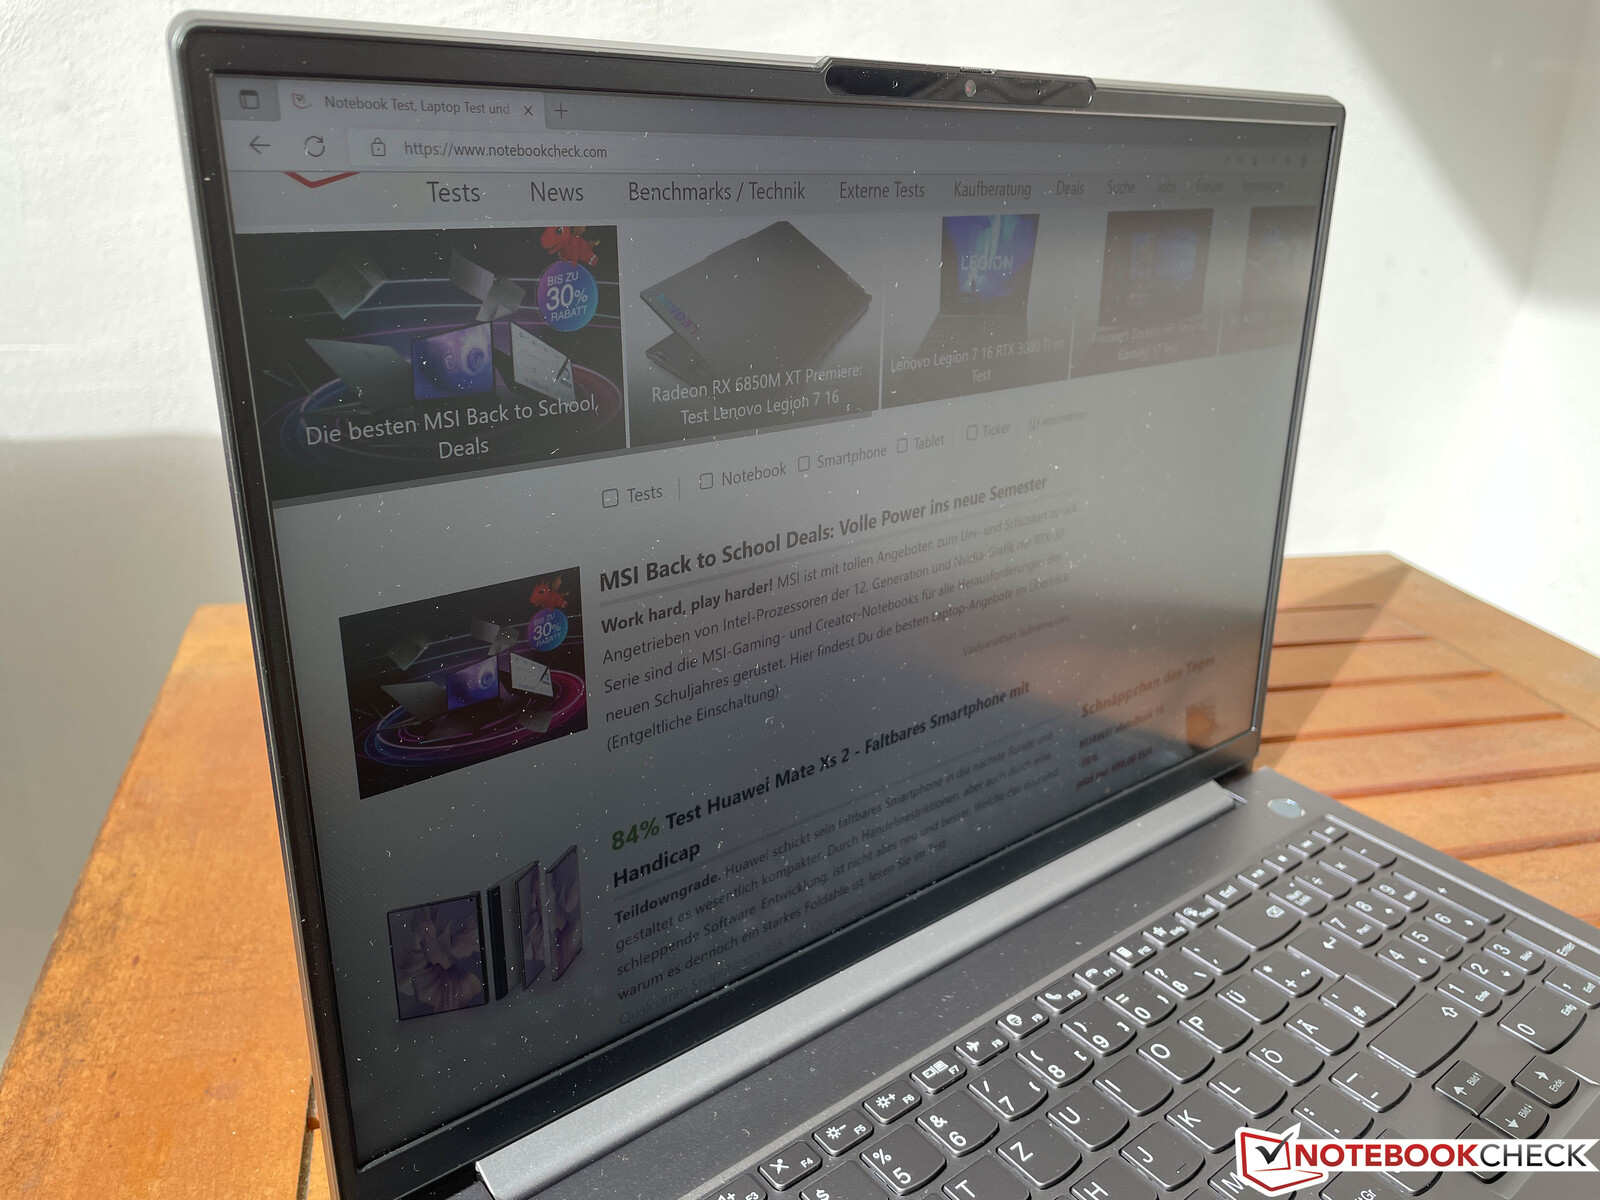
La superficie mate de la pantalla ayuda en exteriores, por supuesto, y puedes trabajar cómodamente en días nublados, pero la pantalla necesita ser un poco más brillante en días muy luminosos.
Rendimiento - Alder Lake y GeForce RTX
Condiciones de la prueba
Como es habitual, Lenovo ofrece sus propios ajustes de energía que se pueden establecer a través del software Vantage preinstalado o la combinación de teclas Fn+P. Hemos listado los respectivos valores TDP/TGP para la CPU y la GPU en la siguiente tabla. Usamos la configuración de Alto Rendimiento para las pruebas.
| Modo de rendimiento | Carga de la CPU | Carga de la GPU | Test de estrés | Volumen máximo del ventilador |
|---|---|---|---|---|
| Ahorro de batería | 64 -> 20 vatios | 20 vatios | CPU: 20 vatiosGPU : 20 vatios |
30,5 dB(A) |
| Refrigeración inteligente | 72 -> 35 vatios | 36 vatios | CPU: 24 vatiosGPU : 36 vatios |
43,7 dB(A) |
| Alto rendimiento | 80 -> 55 vatios | 60 vatios | CPU: 20 vatiosGPU : 50 vatios |
47 dB(A) |
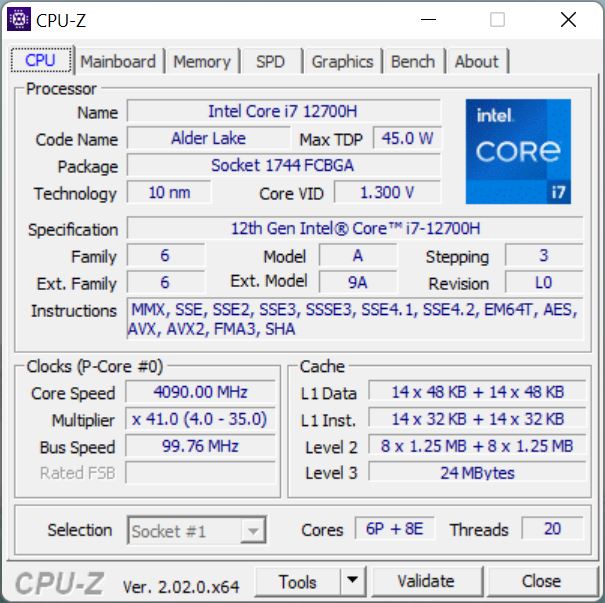
Procesador
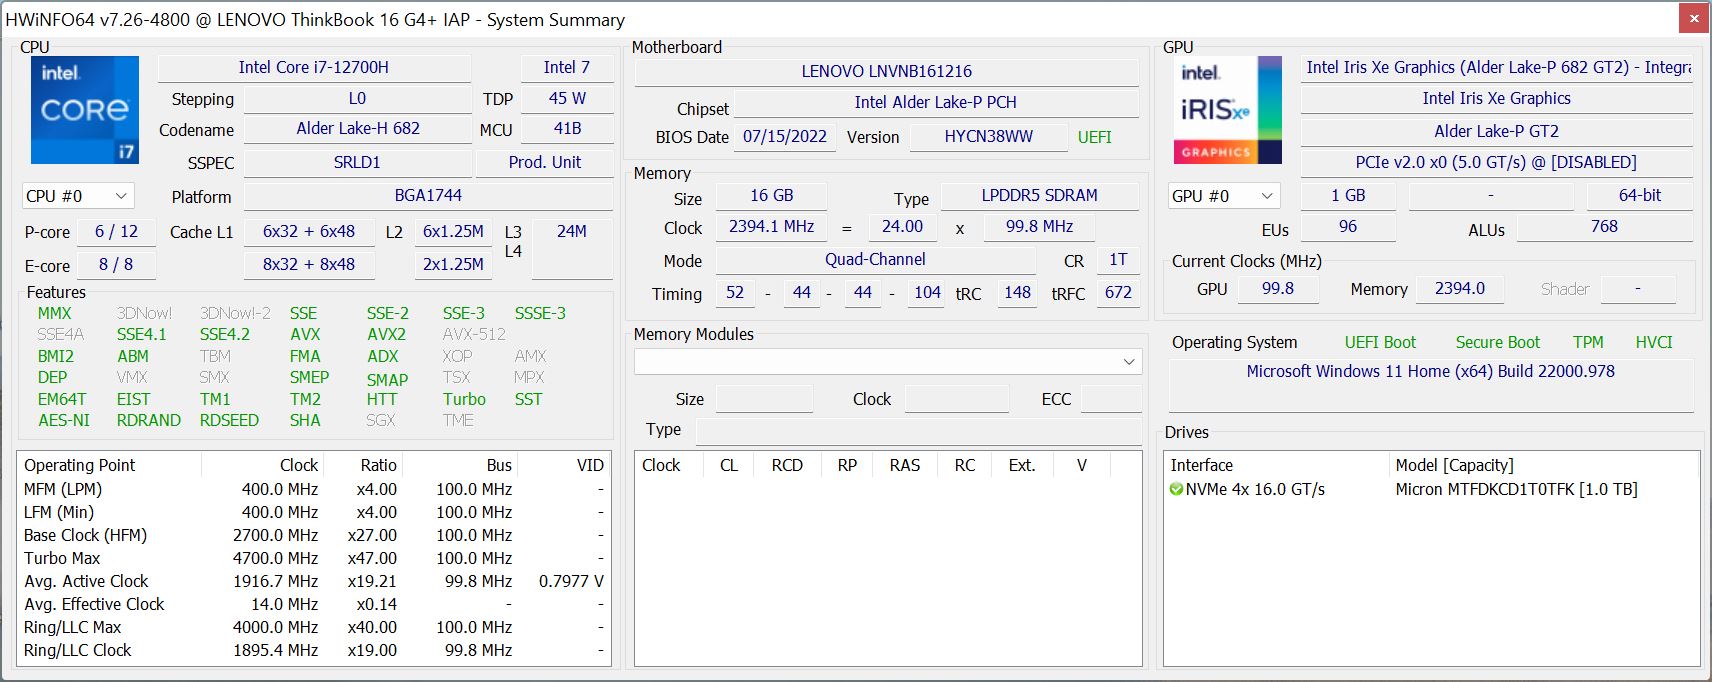
El Core i7-12700Hes un procesador rápido de la actual generación Alder Lake de Intel que se basa en una arquitectura híbrida con 6 núcleos de rendimiento rápido y 8 de eficiencia. Gracias a los altos límites de potencia, el rendimiento del ThinkBook 16 G4+ es muy bueno y el rendimiento de la CPU es mejor que el de los rivales. Incluso bajo carga sostenida, el procesador se mantiene en 55 vatios y ofrece buenos resultados. Sin embargo, el consumo máximo está limitado a 70 vatios en modo batería y luego alcanza rápidamente los 64 vatios, por lo que el rendimiento multinúcleo es un ~12% inferior cuando no está enchufado. Hay más pruebas de rendimiento de la CPU disponibles aquí.
Cinebench R15 Multi Sustained Load
Cinebench R23: Multi Core | Single Core
Cinebench R20: CPU (Multi Core) | CPU (Single Core)
Cinebench R15: CPU Multi 64Bit | CPU Single 64Bit
Blender: v2.79 BMW27 CPU
7-Zip 18.03: 7z b 4 | 7z b 4 -mmt1
Geekbench 5.5: Multi-Core | Single-Core
HWBOT x265 Benchmark v2.2: 4k Preset
LibreOffice : 20 Documents To PDF
R Benchmark 2.5: Overall mean
| CPU Performance rating | |
| Media de la clase Multimedia | |
| Lenovo ThinkBook 16 G4+ IAP | |
| Medio Intel Core i7-12700H | |
| Dell Inspiron 16 Plus 7620 | |
| Huawei MateBook D 16 2022 | |
| Asus Vivobook Pro 16X-M7600QE | |
| Samsung Galaxy Book2 15 | |
| Acer Swift X SFX16-51G-5388 | |
| Cinebench R23 / Multi Core | |
| Media de la clase Multimedia (4861 - 33362, n=81, últimos 2 años) | |
| Lenovo ThinkBook 16 G4+ IAP | |
| Medio Intel Core i7-12700H (4032 - 19330, n=64) | |
| Dell Inspiron 16 Plus 7620 | |
| Asus Vivobook Pro 16X-M7600QE | |
| Asus Vivobook Pro 16X-M7600QE | |
| Huawei MateBook D 16 2022 | |
| Samsung Galaxy Book2 15 | |
| Acer Swift X SFX16-51G-5388 | |
| Cinebench R23 / Single Core | |
| Media de la clase Multimedia (1128 - 2459, n=73, últimos 2 años) | |
| Lenovo ThinkBook 16 G4+ IAP | |
| Huawei MateBook D 16 2022 | |
| Samsung Galaxy Book2 15 | |
| Dell Inspiron 16 Plus 7620 | |
| Medio Intel Core i7-12700H (778 - 1826, n=63) | |
| Asus Vivobook Pro 16X-M7600QE | |
| Asus Vivobook Pro 16X-M7600QE | |
| Acer Swift X SFX16-51G-5388 | |
| Cinebench R20 / CPU (Multi Core) | |
| Media de la clase Multimedia (1887 - 12912, n=64, últimos 2 años) | |
| Lenovo ThinkBook 16 G4+ IAP | |
| Medio Intel Core i7-12700H (1576 - 7407, n=64) | |
| Dell Inspiron 16 Plus 7620 | |
| Asus Vivobook Pro 16X-M7600QE | |
| Asus Vivobook Pro 16X-M7600QE | |
| Huawei MateBook D 16 2022 | |
| Samsung Galaxy Book2 15 | |
| Acer Swift X SFX16-51G-5388 | |
| Cinebench R20 / CPU (Single Core) | |
| Media de la clase Multimedia (425 - 853, n=64, últimos 2 años) | |
| Lenovo ThinkBook 16 G4+ IAP | |
| Samsung Galaxy Book2 15 | |
| Dell Inspiron 16 Plus 7620 | |
| Medio Intel Core i7-12700H (300 - 704, n=64) | |
| Huawei MateBook D 16 2022 | |
| Asus Vivobook Pro 16X-M7600QE | |
| Asus Vivobook Pro 16X-M7600QE | |
| Acer Swift X SFX16-51G-5388 | |
| Cinebench R15 / CPU Multi 64Bit | |
| Media de la clase Multimedia (856 - 5224, n=68, últimos 2 años) | |
| Medio Intel Core i7-12700H (1379 - 2916, n=70) | |
| Lenovo ThinkBook 16 G4+ IAP | |
| Dell Inspiron 16 Plus 7620 | |
| Huawei MateBook D 16 2022 | |
| Huawei MateBook D 16 2022 | |
| Asus Vivobook Pro 16X-M7600QE | |
| Asus Vivobook Pro 16X-M7600QE | |
| Samsung Galaxy Book2 15 | |
| Acer Swift X SFX16-51G-5388 | |
| Cinebench R15 / CPU Single 64Bit | |
| Media de la clase Multimedia (184.8 - 326, n=66, últimos 2 años) | |
| Lenovo ThinkBook 16 G4+ IAP | |
| Huawei MateBook D 16 2022 | |
| Dell Inspiron 16 Plus 7620 | |
| Medio Intel Core i7-12700H (113 - 263, n=65) | |
| Samsung Galaxy Book2 15 | |
| Asus Vivobook Pro 16X-M7600QE | |
| Asus Vivobook Pro 16X-M7600QE | |
| Acer Swift X SFX16-51G-5388 | |
| Blender / v2.79 BMW27 CPU | |
| Acer Swift X SFX16-51G-5388 | |
| Samsung Galaxy Book2 15 | |
| Huawei MateBook D 16 2022 | |
| Asus Vivobook Pro 16X-M7600QE | |
| Asus Vivobook Pro 16X-M7600QE | |
| Media de la clase Multimedia (100 - 557, n=65, últimos 2 años) | |
| Dell Inspiron 16 Plus 7620 | |
| Medio Intel Core i7-12700H (168 - 732, n=63) | |
| Lenovo ThinkBook 16 G4+ IAP | |
| 7-Zip 18.03 / 7z b 4 | |
| Lenovo ThinkBook 16 G4+ IAP | |
| Medio Intel Core i7-12700H (22844 - 73067, n=63) | |
| Dell Inspiron 16 Plus 7620 | |
| Media de la clase Multimedia (29095 - 130368, n=62, últimos 2 años) | |
| Asus Vivobook Pro 16X-M7600QE | |
| Asus Vivobook Pro 16X-M7600QE | |
| Huawei MateBook D 16 2022 | |
| Samsung Galaxy Book2 15 | |
| Acer Swift X SFX16-51G-5388 | |
| 7-Zip 18.03 / 7z b 4 -mmt1 | |
| Media de la clase Multimedia (3666 - 7545, n=63, últimos 2 años) | |
| Asus Vivobook Pro 16X-M7600QE | |
| Asus Vivobook Pro 16X-M7600QE | |
| Huawei MateBook D 16 2022 | |
| Lenovo ThinkBook 16 G4+ IAP | |
| Medio Intel Core i7-12700H (2743 - 5972, n=63) | |
| Dell Inspiron 16 Plus 7620 | |
| Samsung Galaxy Book2 15 | |
| Acer Swift X SFX16-51G-5388 | |
| Geekbench 5.5 / Multi-Core | |
| Media de la clase Multimedia (4652 - 20422, n=62, últimos 2 años) | |
| Lenovo ThinkBook 16 G4+ IAP | |
| Dell Inspiron 16 Plus 7620 | |
| Medio Intel Core i7-12700H (5144 - 13745, n=64) | |
| Huawei MateBook D 16 2022 | |
| Asus Vivobook Pro 16X-M7600QE | |
| Asus Vivobook Pro 16X-M7600QE | |
| Samsung Galaxy Book2 15 | |
| Acer Swift X SFX16-51G-5388 | |
| Geekbench 5.5 / Single-Core | |
| Media de la clase Multimedia (805 - 2974, n=62, últimos 2 años) | |
| Huawei MateBook D 16 2022 | |
| Lenovo ThinkBook 16 G4+ IAP | |
| Samsung Galaxy Book2 15 | |
| Dell Inspiron 16 Plus 7620 | |
| Medio Intel Core i7-12700H (803 - 1851, n=64) | |
| Asus Vivobook Pro 16X-M7600QE | |
| Asus Vivobook Pro 16X-M7600QE | |
| Acer Swift X SFX16-51G-5388 | |
| HWBOT x265 Benchmark v2.2 / 4k Preset | |
| Media de la clase Multimedia (5.26 - 36.1, n=63, últimos 2 años) | |
| Lenovo ThinkBook 16 G4+ IAP | |
| Medio Intel Core i7-12700H (4.67 - 21.8, n=64) | |
| Dell Inspiron 16 Plus 7620 | |
| Asus Vivobook Pro 16X-M7600QE | |
| Asus Vivobook Pro 16X-M7600QE | |
| Huawei MateBook D 16 2022 | |
| Samsung Galaxy Book2 15 | |
| Acer Swift X SFX16-51G-5388 | |
| LibreOffice / 20 Documents To PDF | |
| Asus Vivobook Pro 16X-M7600QE | |
| Asus Vivobook Pro 16X-M7600QE | |
| Acer Swift X SFX16-51G-5388 | |
| Media de la clase Multimedia (23.9 - 146.7, n=64, últimos 2 años) | |
| Lenovo ThinkBook 16 G4+ IAP | |
| Dell Inspiron 16 Plus 7620 | |
| Medio Intel Core i7-12700H (34.2 - 95.3, n=63) | |
| Samsung Galaxy Book2 15 | |
| Huawei MateBook D 16 2022 | |
| R Benchmark 2.5 / Overall mean | |
| Acer Swift X SFX16-51G-5388 | |
| Asus Vivobook Pro 16X-M7600QE | |
| Asus Vivobook Pro 16X-M7600QE | |
| Dell Inspiron 16 Plus 7620 | |
| Medio Intel Core i7-12700H (0.4441 - 1.052, n=63) | |
| Samsung Galaxy Book2 15 | |
| Media de la clase Multimedia (0.3604 - 0.947, n=63, últimos 2 años) | |
| Lenovo ThinkBook 16 G4+ IAP | |
| Huawei MateBook D 16 2022 | |
* ... más pequeño es mejor
AIDA64: FP32 Ray-Trace | FPU Julia | CPU SHA3 | CPU Queen | FPU SinJulia | FPU Mandel | CPU AES | CPU ZLib | FP64 Ray-Trace | CPU PhotoWorxx
| Performance rating | |
| Media de la clase Multimedia | |
| Asus Vivobook Pro 16X-M7600QE | |
| Lenovo ThinkBook 16 G4+ IAP | |
| Dell Inspiron 16 Plus 7620 | |
| Medio Intel Core i7-12700H | |
| Huawei MateBook D 16 2022 | |
| Samsung Galaxy Book2 15 | |
| Acer Swift X SFX16-51G-5388 | |
| AIDA64 / FP32 Ray-Trace | |
| Media de la clase Multimedia (2214 - 50388, n=60, últimos 2 años) | |
| Lenovo ThinkBook 16 G4+ IAP | |
| Asus Vivobook Pro 16X-M7600QE | |
| Asus Vivobook Pro 16X-M7600QE | |
| Dell Inspiron 16 Plus 7620 | |
| Huawei MateBook D 16 2022 | |
| Medio Intel Core i7-12700H (2585 - 17957, n=64) | |
| Acer Swift X SFX16-51G-5388 | |
| Samsung Galaxy Book2 15 | |
| AIDA64 / FPU Julia | |
| Asus Vivobook Pro 16X-M7600QE | |
| Asus Vivobook Pro 16X-M7600QE | |
| Media de la clase Multimedia (12867 - 201874, n=61, últimos 2 años) | |
| Lenovo ThinkBook 16 G4+ IAP | |
| Dell Inspiron 16 Plus 7620 | |
| Huawei MateBook D 16 2022 | |
| Medio Intel Core i7-12700H (12439 - 90760, n=64) | |
| Acer Swift X SFX16-51G-5388 | |
| Samsung Galaxy Book2 15 | |
| AIDA64 / CPU SHA3 | |
| Media de la clase Multimedia (653 - 8623, n=61, últimos 2 años) | |
| Lenovo ThinkBook 16 G4+ IAP | |
| Asus Vivobook Pro 16X-M7600QE | |
| Asus Vivobook Pro 16X-M7600QE | |
| Medio Intel Core i7-12700H (833 - 4242, n=64) | |
| Dell Inspiron 16 Plus 7620 | |
| Huawei MateBook D 16 2022 | |
| Acer Swift X SFX16-51G-5388 | |
| Samsung Galaxy Book2 15 | |
| AIDA64 / CPU Queen | |
| Lenovo ThinkBook 16 G4+ IAP | |
| Asus Vivobook Pro 16X-M7600QE | |
| Asus Vivobook Pro 16X-M7600QE | |
| Medio Intel Core i7-12700H (57923 - 103202, n=63) | |
| Huawei MateBook D 16 2022 | |
| Dell Inspiron 16 Plus 7620 | |
| Media de la clase Multimedia (13483 - 181505, n=49, últimos 2 años) | |
| Samsung Galaxy Book2 15 | |
| Acer Swift X SFX16-51G-5388 | |
| AIDA64 / FPU SinJulia | |
| Asus Vivobook Pro 16X-M7600QE | |
| Asus Vivobook Pro 16X-M7600QE | |
| Lenovo ThinkBook 16 G4+ IAP | |
| Media de la clase Multimedia (1240 - 28794, n=61, últimos 2 años) | |
| Medio Intel Core i7-12700H (3249 - 9939, n=64) | |
| Dell Inspiron 16 Plus 7620 | |
| Huawei MateBook D 16 2022 | |
| Samsung Galaxy Book2 15 | |
| Acer Swift X SFX16-51G-5388 | |
| AIDA64 / FPU Mandel | |
| Asus Vivobook Pro 16X-M7600QE | |
| Asus Vivobook Pro 16X-M7600QE | |
| Media de la clase Multimedia (6395 - 105740, n=60, últimos 2 años) | |
| Lenovo ThinkBook 16 G4+ IAP | |
| Dell Inspiron 16 Plus 7620 | |
| Medio Intel Core i7-12700H (7135 - 44760, n=64) | |
| Huawei MateBook D 16 2022 | |
| Acer Swift X SFX16-51G-5388 | |
| Samsung Galaxy Book2 15 | |
| AIDA64 / CPU AES | |
| Asus Vivobook Pro 16X-M7600QE | |
| Asus Vivobook Pro 16X-M7600QE | |
| Huawei MateBook D 16 2022 | |
| Medio Intel Core i7-12700H (31839 - 144360, n=64) | |
| Lenovo ThinkBook 16 G4+ IAP | |
| Media de la clase Multimedia (13243 - 126790, n=61, últimos 2 años) | |
| Dell Inspiron 16 Plus 7620 | |
| Acer Swift X SFX16-51G-5388 | |
| Samsung Galaxy Book2 15 | |
| AIDA64 / CPU ZLib | |
| Lenovo ThinkBook 16 G4+ IAP | |
| Media de la clase Multimedia (167.2 - 2022, n=61, últimos 2 años) | |
| Dell Inspiron 16 Plus 7620 | |
| Medio Intel Core i7-12700H (305 - 1171, n=64) | |
| Asus Vivobook Pro 16X-M7600QE | |
| Asus Vivobook Pro 16X-M7600QE | |
| Huawei MateBook D 16 2022 | |
| Samsung Galaxy Book2 15 | |
| Acer Swift X SFX16-51G-5388 | |
| AIDA64 / FP64 Ray-Trace | |
| Media de la clase Multimedia (1014 - 26875, n=61, últimos 2 años) | |
| Asus Vivobook Pro 16X-M7600QE | |
| Asus Vivobook Pro 16X-M7600QE | |
| Lenovo ThinkBook 16 G4+ IAP | |
| Dell Inspiron 16 Plus 7620 | |
| Medio Intel Core i7-12700H (1437 - 9692, n=64) | |
| Huawei MateBook D 16 2022 | |
| Acer Swift X SFX16-51G-5388 | |
| Samsung Galaxy Book2 15 | |
| AIDA64 / CPU PhotoWorxx | |
| Media de la clase Multimedia (12860 - 88154, n=61, últimos 2 años) | |
| Samsung Galaxy Book2 15 | |
| Lenovo ThinkBook 16 G4+ IAP | |
| Huawei MateBook D 16 2022 | |
| Acer Swift X SFX16-51G-5388 | |
| Dell Inspiron 16 Plus 7620 | |
| Medio Intel Core i7-12700H (12863 - 52207, n=64) | |
| Asus Vivobook Pro 16X-M7600QE | |
| Asus Vivobook Pro 16X-M7600QE | |
Rendimiento del sistema
En el uso diario, el ThinkBook 16 G4+ es un portátil extremadamente sensible y, dados los potentes componentes, uno no debería preocuparse por los cuellos de botella de rendimiento en los próximos años. No pudimos ejecutar PCMark 10 sintético en nuestro modelo de pruebas porque siempre se bloqueaba a pesar de varias reinstalaciones del programa y también de los drivers. Este fue el único problema que encontramos durante las pruebas y los resultados en los otros benchmarks son muy buenos, como se esperaba.
WebXPRT 3: Overall
WebXPRT 4: Overall
Jetstream 2: 2.0 Total
Mozilla Kraken 1.1: Total
Octane V2: Total Score
LibreOffice : 20 Documents To PDF
| CrossMark / Overall | |
| Huawei MateBook D 16 2022 | |
| Media de la clase Multimedia (866 - 2728, n=67, últimos 2 años) | |
| Lenovo ThinkBook 16 G4+ IAP | |
| Medio Intel Core i7-12700H, NVIDIA GeForce RTX 2050 Mobile (n=1) | |
| Dell Inspiron 16 Plus 7620 | |
| Acer Swift X SFX16-51G-5388 | |
| CrossMark / Productivity | |
| Huawei MateBook D 16 2022 | |
| Media de la clase Multimedia (931 - 2489, n=67, últimos 2 años) | |
| Lenovo ThinkBook 16 G4+ IAP | |
| Medio Intel Core i7-12700H, NVIDIA GeForce RTX 2050 Mobile (n=1) | |
| Dell Inspiron 16 Plus 7620 | |
| Acer Swift X SFX16-51G-5388 | |
| CrossMark / Creativity | |
| Media de la clase Multimedia (907 - 3465, n=67, últimos 2 años) | |
| Huawei MateBook D 16 2022 | |
| Lenovo ThinkBook 16 G4+ IAP | |
| Medio Intel Core i7-12700H, NVIDIA GeForce RTX 2050 Mobile (n=1) | |
| Dell Inspiron 16 Plus 7620 | |
| Acer Swift X SFX16-51G-5388 | |
| CrossMark / Responsiveness | |
| Huawei MateBook D 16 2022 | |
| Lenovo ThinkBook 16 G4+ IAP | |
| Medio Intel Core i7-12700H, NVIDIA GeForce RTX 2050 Mobile (n=1) | |
| Dell Inspiron 16 Plus 7620 | |
| Media de la clase Multimedia (605 - 2024, n=67, últimos 2 años) | |
| Acer Swift X SFX16-51G-5388 | |
| WebXPRT 3 / Overall | |
| Media de la clase Multimedia (136.4 - 596, n=70, últimos 2 años) | |
| Huawei MateBook D 16 2022 | |
| Dell Inspiron 16 Plus 7620 | |
| Lenovo ThinkBook 16 G4+ IAP | |
| Medio Intel Core i7-12700H, NVIDIA GeForce RTX 2050 Mobile (n=1) | |
| Asus Vivobook Pro 16X-M7600QE | |
| Samsung Galaxy Book2 15 | |
| Acer Swift X SFX16-51G-5388 | |
| WebXPRT 4 / Overall | |
| Media de la clase Multimedia (167.3 - 402, n=71, últimos 2 años) | |
| Huawei MateBook D 16 2022 | |
| Lenovo ThinkBook 16 G4+ IAP | |
| Medio Intel Core i7-12700H, NVIDIA GeForce RTX 2050 Mobile (n=1) | |
| Dell Inspiron 16 Plus 7620 | |
| Samsung Galaxy Book2 15 | |
| Acer Swift X SFX16-51G-5388 | |
| Jetstream 2 / 2.0 Total | |
| Media de la clase Multimedia (261 - 481, n=36, últimos 2 años) | |
| Dell Inspiron 16 Plus 7620 | |
| Lenovo ThinkBook 16 G4+ IAP | |
| Medio Intel Core i7-12700H, NVIDIA GeForce RTX 2050 Mobile (n=1) | |
| Huawei MateBook D 16 2022 | |
| Samsung Galaxy Book2 15 | |
| Acer Swift X SFX16-51G-5388 | |
| Mozilla Kraken 1.1 / Total | |
| Acer Swift X SFX16-51G-5388 | |
| Asus Vivobook Pro 16X-M7600QE | |
| Asus Vivobook Pro 16X-M7600QE | |
| Samsung Galaxy Book2 15 | |
| Dell Inspiron 16 Plus 7620 | |
| Huawei MateBook D 16 2022 | |
| Lenovo ThinkBook 16 G4+ IAP | |
| Medio Intel Core i7-12700H, NVIDIA GeForce RTX 2050 Mobile (n=1) | |
| Media de la clase Multimedia (228 - 835, n=74, últimos 2 años) | |
| Octane V2 / Total Score | |
| Media de la clase Multimedia (64079 - 153175, n=35, últimos 2 años) | |
| Huawei MateBook D 16 2022 | |
| Lenovo ThinkBook 16 G4+ IAP | |
| Medio Intel Core i7-12700H, NVIDIA GeForce RTX 2050 Mobile (n=1) | |
| Samsung Galaxy Book2 15 | |
| Acer Swift X SFX16-51G-5388 | |
| LibreOffice / 20 Documents To PDF | |
| Asus Vivobook Pro 16X-M7600QE | |
| Asus Vivobook Pro 16X-M7600QE | |
| Acer Swift X SFX16-51G-5388 | |
| Media de la clase Multimedia (23.9 - 146.7, n=64, últimos 2 años) | |
| Lenovo ThinkBook 16 G4+ IAP | |
| Medio Intel Core i7-12700H, NVIDIA GeForce RTX 2050 Mobile (n=1) | |
| Dell Inspiron 16 Plus 7620 | |
| Samsung Galaxy Book2 15 | |
| Huawei MateBook D 16 2022 | |
* ... más pequeño es mejor
» No benchmarks for this notebook found!
| AIDA64 / Memory Copy | |
| Media de la clase Multimedia (21158 - 132135, n=61, últimos 2 años) | |
| Lenovo ThinkBook 16 G4+ IAP | |
| Samsung Galaxy Book2 15 | |
| Huawei MateBook D 16 2022 | |
| Acer Swift X SFX16-51G-5388 | |
| Dell Inspiron 16 Plus 7620 | |
| Medio Intel Core i7-12700H (25615 - 80511, n=64) | |
| Asus Vivobook Pro 16X-M7600QE | |
| Asus Vivobook Pro 16X-M7600QE | |
| AIDA64 / Memory Read | |
| Media de la clase Multimedia (19699 - 174586, n=61, últimos 2 años) | |
| Lenovo ThinkBook 16 G4+ IAP | |
| Dell Inspiron 16 Plus 7620 | |
| Samsung Galaxy Book2 15 | |
| Medio Intel Core i7-12700H (25586 - 79442, n=64) | |
| Huawei MateBook D 16 2022 | |
| Acer Swift X SFX16-51G-5388 | |
| Asus Vivobook Pro 16X-M7600QE | |
| Asus Vivobook Pro 16X-M7600QE | |
| AIDA64 / Memory Write | |
| Media de la clase Multimedia (17733 - 134998, n=61, últimos 2 años) | |
| Samsung Galaxy Book2 15 | |
| Acer Swift X SFX16-51G-5388 | |
| Huawei MateBook D 16 2022 | |
| Lenovo ThinkBook 16 G4+ IAP | |
| Dell Inspiron 16 Plus 7620 | |
| Medio Intel Core i7-12700H (23679 - 88660, n=64) | |
| Asus Vivobook Pro 16X-M7600QE | |
| Asus Vivobook Pro 16X-M7600QE | |
| AIDA64 / Memory Latency | |
| Media de la clase Multimedia (7 - 535, n=60, últimos 2 años) | |
| Acer Swift X SFX16-51G-5388 | |
| Lenovo ThinkBook 16 G4+ IAP | |
| Huawei MateBook D 16 2022 | |
| Dell Inspiron 16 Plus 7620 | |
| Medio Intel Core i7-12700H (76.2 - 133.9, n=62) | |
| Asus Vivobook Pro 16X-M7600QE | |
| Asus Vivobook Pro 16X-M7600QE | |
| Samsung Galaxy Book2 15 | |
* ... más pequeño es mejor
Latencia del CPD
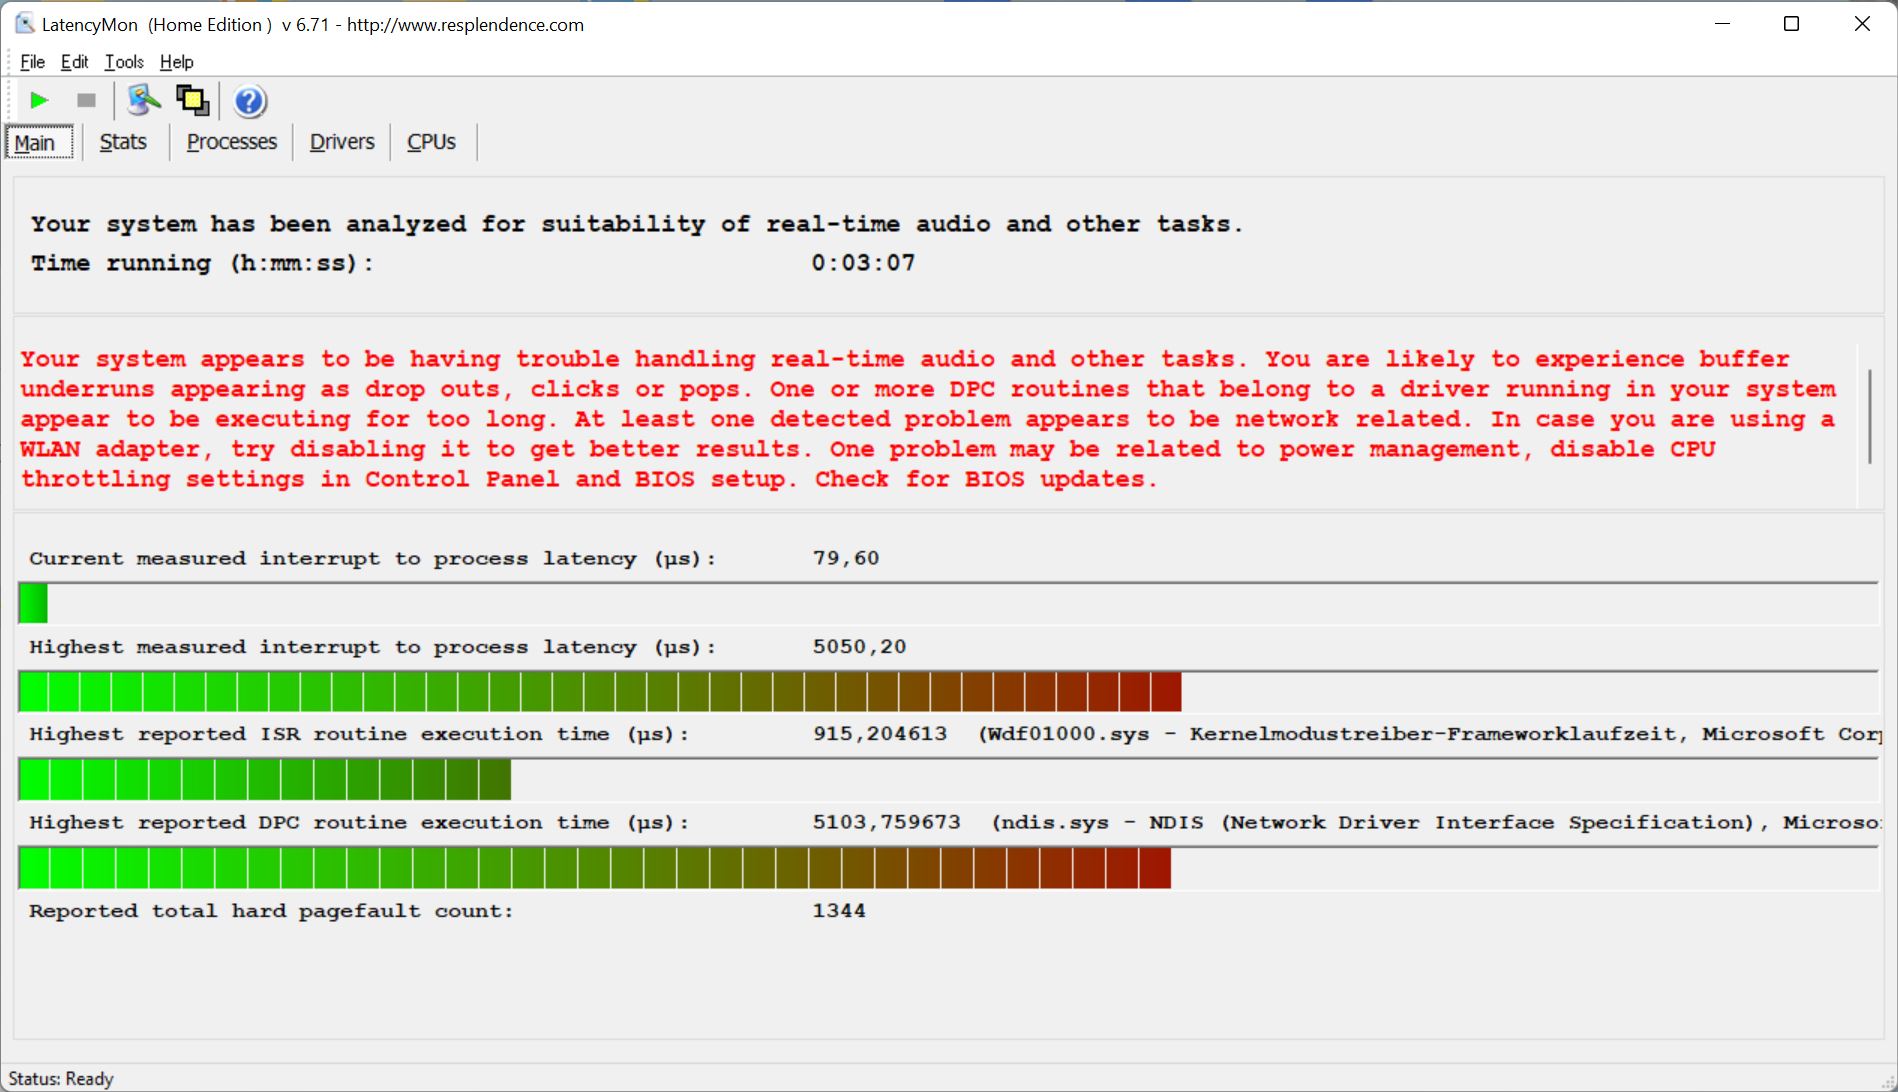
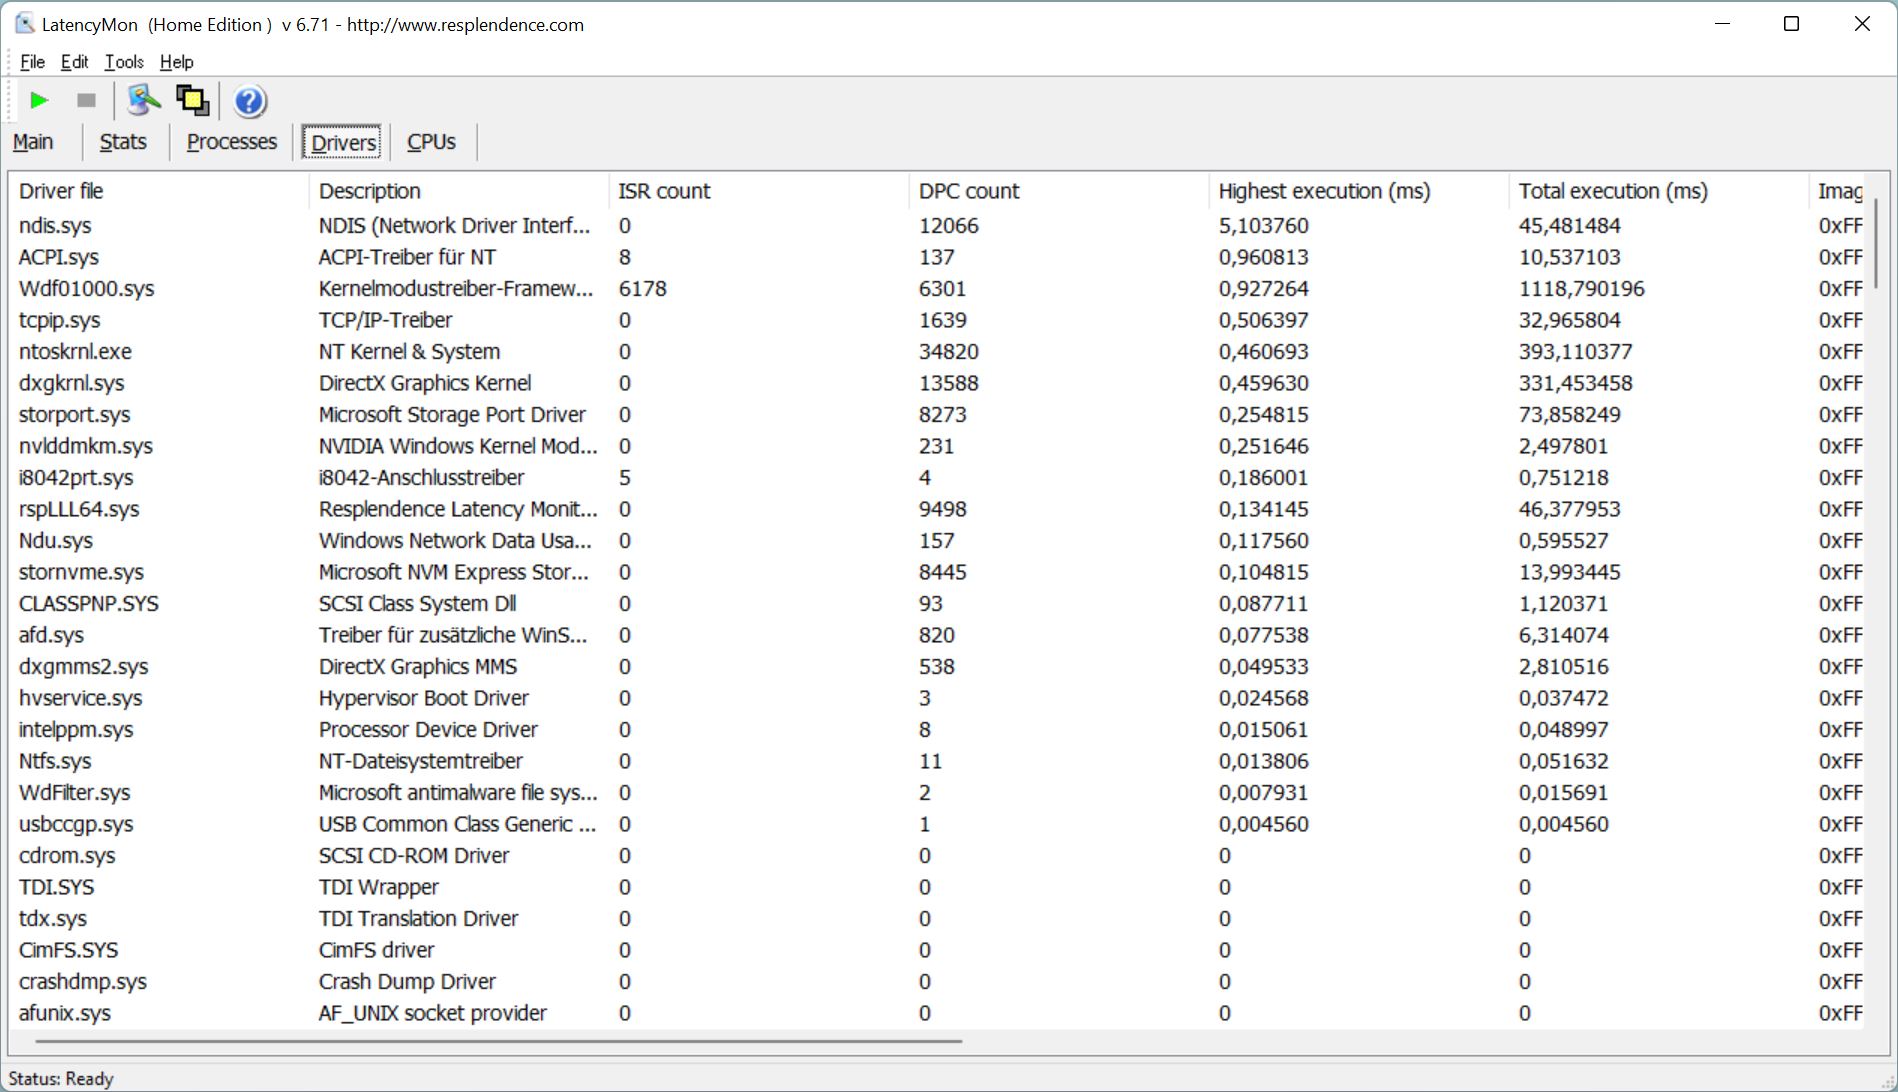
En nuestra prueba de latencia estandarizada (navegación web, reproducción de YouTube en 4K, carga de la CPU), el ThinkBook 16 G4+ muestra graves limitaciones con la versión actual y, por lo tanto, no es adecuado para utilizar aplicaciones de audio en tiempo real.
| DPC Latencies / LatencyMon - interrupt to process latency (max), Web, Youtube, Prime95 | |
| Acer Swift X SFX16-51G-5388 | |
| Lenovo ThinkBook 16 G4+ IAP | |
| Asus Vivobook Pro 16X-M7600QE | |
| Dell Inspiron 16 Plus 7620 | |
| Samsung Galaxy Book2 15 | |
| Huawei MateBook D 16 2022 | |
* ... más pequeño es mejor
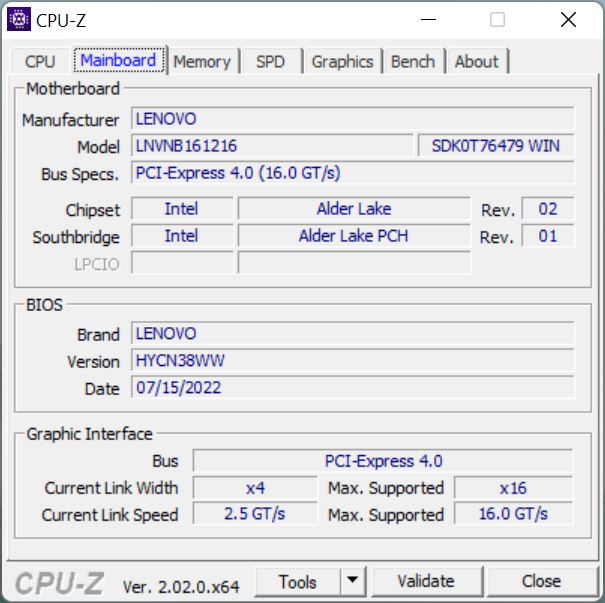
Massenspeicher
El ThinkBook 16 G4+ ofrece dos ranuras M.2-2280 para SSDs, una de las cuales usa una rápida conexión PCIe 4.0, la otra PCIe 3.0. En nuestro modelo de pruebas hay un compacto Micron 2450 (M.2-2242), que ya es un SSD PCIe 4.0, pero esta unidad no es la más rápida, ya que el fabricante especifica una tasa de transferencia máxima de 3.6 GB/s. El resultado final es que tienes un SSD PCIe 4.0 con velocidad PCIe 3.0. No obstante, esto no presenta restricciones reales en la práctica y el rendimiento se mantiene estable incluso bajo una carga prolongada. El SSD ofrece una capacidad de 1 TB, por lo que 916 GB siguen estando disponibles tras el primer arranque. Hay más pruebas de rendimiento de SSD disponiblesaquí.

* ... más pequeño es mejor
Sustained Read Performance: DiskSpd Read Loop, Queue Depth 8
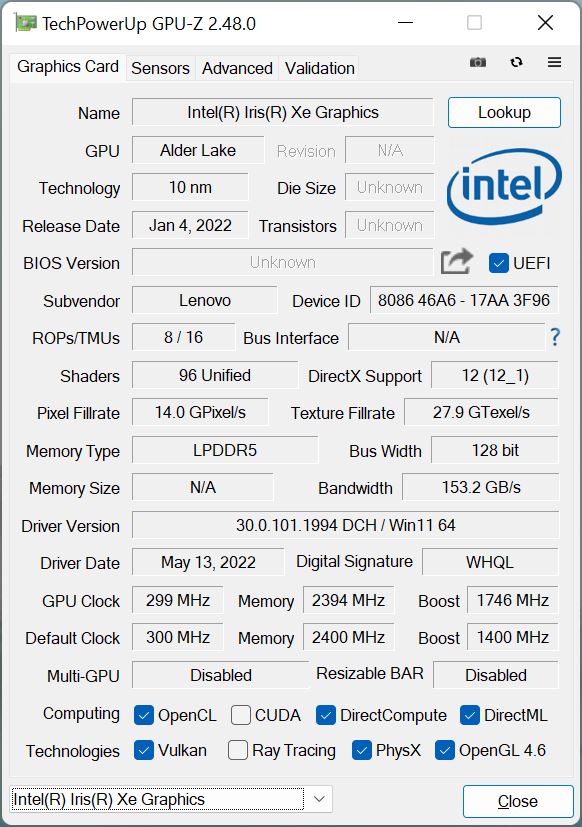
Tarjeta gráfica
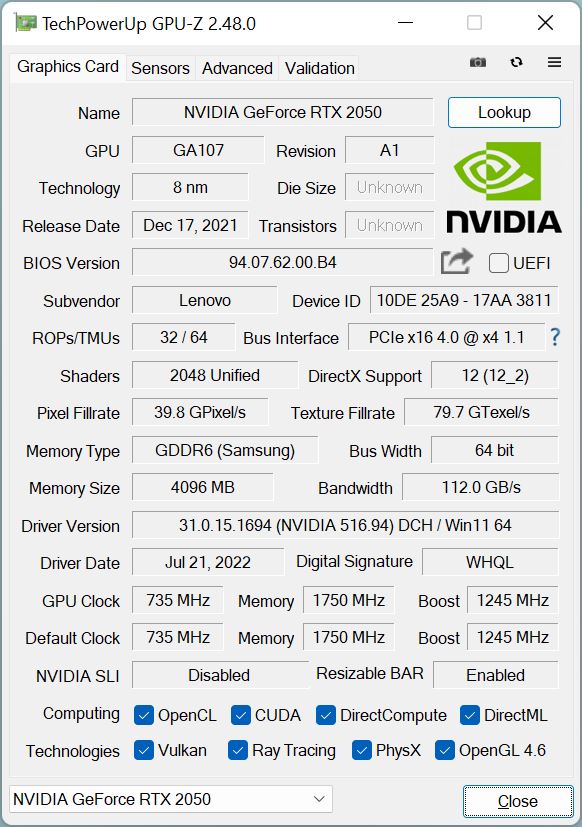
En el uso cotidiano, los cálculos gráficos suelen estar a cargo del procesador integradoIris Xe Graphics G7 integradoel procesador dedicado Nvidia GeForce RTX 2050sólo se enciende automáticamente cuando hay una mayor carga. En principio, esta GPU es una GeForce MX570pero también soporta RayTracing y DLSS. El TGP está ajustado a un máximo de 50 vatios, por lo que otros 10 vatios pueden ser utilizados por el procesador. Observamos un reloj de núcleo máximo de 1.762 MHz.
En las pruebas sintéticas, la RTX 2050 suele quedar justo por detrás de la RTX 3050que funciona con un poco más de eficiencia. Además, la GPU es más del doble de rápida que la Iris Xe Graphics G7 en pruebas exigentes. No hay caída de rendimiento bajo carga prolongada, ya que el exigente test de estrés Time Spy se supera fácilmente con un 99.7%.
Sin embargo, el consumo de energía de la GPU está limitado a 30 vatios en modo batería, lo que conlleva una reducción del rendimiento del 15%. Hay más pruebas de rendimiento de la GPU en nuestrasección de tecnología.
| V-Ray 5 Benchmark - GPU CUDA | |
| Media de la clase Multimedia (277 - 1482, n=7, últimos 2 años) | |
| Acer Swift X SFX16-51G-5388 | |
| Medio NVIDIA GeForce RTX 2050 Mobile (169 - 214, n=3) | |
* ... más pequeño es mejor
| 3DMark Vantage P Result | 52669 puntos | |
| 3DMark 11 Performance | 15277 puntos | |
| 3DMark Cloud Gate Standard Score | 40781 puntos | |
| 3DMark Fire Strike Score | 9274 puntos | |
| 3DMark Time Spy Score | 4300 puntos | |
ayuda | ||
Rendimiento de los juegos
El rendimiento en juegos de laRTX 2050es bueno, y el ThinkBook 16 G4+ vuelve a quedar por detrás de la RTX 3050 Ti y en muchos casos también de la RTX 3050. Así, muchos títulos pueden jugarse sin problemas en Full HD y con detalles altos, y la resolución WQHD nativa también es posible en algunos casos. La reducción de detalles en FHD sólo es necesaria para títulos exigentes como Cyberpoint 2077. Nuestro bucle Witcher 3 muestra que el rendimiento no cae durante las sesiones de juego más largas. Hay más pruebas de juego disponibles aquí.
| The Witcher 3 | |
| 1920x1080 High Graphics & Postprocessing (Nvidia HairWorks Off) | |
| Dell Inspiron 16 Plus 7620 | |
| Media de la clase Multimedia (22 - 224, n=13, últimos 2 años) | |
| Lenovo ThinkBook 16 G4+ IAP | |
| Asus Vivobook Pro 16X-M7600QE | |
| Medio NVIDIA GeForce RTX 2050 Mobile (46.7 - 78, n=8) | |
| Acer Swift X SFX16-51G-5388 | |
| Samsung Galaxy Book2 15 | |
| Huawei MateBook D 16 2022 | |
| 1920x1080 Ultra Graphics & Postprocessing (HBAO+) | |
| Dell Inspiron 16 Plus 7620 | |
| Media de la clase Multimedia (11 - 121, n=13, últimos 2 años) | |
| Asus Vivobook Pro 16X-M7600QE | |
| Lenovo ThinkBook 16 G4+ IAP | |
| Medio NVIDIA GeForce RTX 2050 Mobile (24.3 - 39.6, n=9) | |
| Acer Swift X SFX16-51G-5388 | |
| Samsung Galaxy Book2 15 | |
| Huawei MateBook D 16 2022 | |
| Cyberpunk 2077 1.6 | |
| 1920x1080 High Preset | |
| Dell Inspiron 16 Plus 7620 | |
| Lenovo ThinkBook 16 G4+ IAP | |
| Medio NVIDIA GeForce RTX 2050 Mobile (19.1 - 31, n=4) | |
| Samsung Galaxy Book2 15 | |
| 1920x1080 Ultra Preset | |
| Dell Inspiron 16 Plus 7620 | |
| Lenovo ThinkBook 16 G4+ IAP | |
| Medio NVIDIA GeForce RTX 2050 Mobile (16.8 - 27.4, n=4) | |
| Samsung Galaxy Book2 15 | |
| F1 2021 | |
| 1920x1080 High Preset AA:T AF:16x | |
| Asus Vivobook Pro 16X-M7600QE | |
| Lenovo ThinkBook 16 G4+ IAP | |
| Medio NVIDIA GeForce RTX 2050 Mobile (66.2 - 107.6, n=3) | |
| Samsung Galaxy Book2 15 | |
| Huawei MateBook D 16 2022 | |
| 1920x1080 Ultra High Preset + Raytracing AA:T AF:16x | |
| Asus Vivobook Pro 16X-M7600QE | |
| Medio NVIDIA GeForce RTX 2050 Mobile (36.1 - 52.3, n=3) | |
| Lenovo ThinkBook 16 G4+ IAP | |
| Huawei MateBook D 16 2022 | |
| Samsung Galaxy Book2 15 | |
Witcher 3 FPS Chart
| bajo | medio | alto | ultra | QHD | |
|---|---|---|---|---|---|
| GTA V (2015) | 179.1 | 175.3 | 108.1 | 52.9 | 37.3 |
| The Witcher 3 (2015) | 216 | 139 | 77 | 38.3 | |
| Dota 2 Reborn (2015) | 167.4 | 153.9 | 140 | 129.6 | |
| Final Fantasy XV Benchmark (2018) | 109.1 | 61 | 41.8 | 29 | |
| X-Plane 11.11 (2018) | 139.6 | 106.4 | 90.1 | ||
| Far Cry 5 (2018) | 118 | 68 | 62 | 60 | 39 |
| Strange Brigade (2018) | 196.9 | 86.8 | 71.5 | 63.1 | 46.5 |
| F1 2021 (2021) | 229 | 130.6 | 99.5 | 44.1 | 28.2 |
| Cyberpunk 2077 1.6 (2022) | 49 | 41 | 31 | 25 |
Emisiones - Los juegos requieren auriculares
Ruido
Al ralentí o con poca carga, los dos ventiladores permanecen casi siempre desactivados, incluso en el modo de alto rendimiento . Sin embargo, alcanzan rápidamente la velocidad máxima bajo cargas más altas en este modo, lo que corresponde a un nivel de ruido de 47 dB(A). Esto ya es claramente audible, por lo que recomendamos auriculares cuando se juega. En el modo de refrigeración inteligente , el portátil es sólo ligeramente más silencioso, con algo menos de 44 dB(A) cuando se juega. Si no necesitas mucho rendimiento, puedes cambiar fácilmente al modo de ahorro de batería, ya que los ventiladores rara vez entran en acción y apenas son audibles, pero este modo es poco adecuado para jugar debido a la reducción de potencia. No se detectaron ruidos electrónicos.
Ruido
| Ocioso |
| 24.2 / 24.2 / 24.2 dB(A) |
| Carga |
| 47 / 47 dB(A) |
 | ||
30 dB silencioso 40 dB(A) audible 50 dB(A) ruidosamente alto |
||
min: | ||
| Lenovo ThinkBook 16 G4+ IAP GeForce RTX 2050 Mobile, i7-12700H, Micron 2450 1TB MTFDKCD1T0TFK | Dell Inspiron 16 Plus 7620 GeForce RTX 3050 Ti Laptop GPU, i7-12700H, Kioxia BG5 KBG50ZNS512G | Acer Swift X SFX16-51G-5388 GeForce RTX 3050 4GB Laptop GPU, i5-11320H, Samsung PM991 MZVLQ512HBLU | Asus Vivobook Pro 16X-M7600QE GeForce RTX 3050 Ti Laptop GPU, R9 5900HX, SK Hynix HFM001TD3JX013N | Huawei MateBook D 16 2022 Iris Xe G7 96EUs, i7-12700H, Silicon Motion PCIe-8 SSD | Samsung Galaxy Book2 15 A350M, i7-1260P, Samsung PM991 MZVLQ512HBLU | |
|---|---|---|---|---|---|---|
| Noise | -6% | -3% | -5% | 2% | -4% | |
| apagado / medio ambiente * (dB) | 24.2 | 23.3 4% | 25.4 -5% | 26 -7% | 24.2 -0% | 24.3 -0% |
| Idle Minimum * (dB) | 24.2 | 25.7 -6% | 25.4 -5% | 27 -12% | 24.2 -0% | 24.3 -0% |
| Idle Average * (dB) | 24.2 | 26.1 -8% | 25.4 -5% | 27 -12% | 25.8 -7% | 24.3 -0% |
| Idle Maximum * (dB) | 24.2 | 30.6 -26% | 27.8 -15% | 27.5 -14% | 30.5 -26% | 29.8 -23% |
| Load Average * (dB) | 47 | 46.2 2% | 41 13% | 41.7 11% | 39.8 15% | 47.5 -1% |
| Witcher 3 ultra * (dB) | 47 | 49.2 -5% | 39.8 15% | 47.5 -1% | ||
| Load Maximum * (dB) | 47 | 49.4 -5% | 47 -0% | 45.3 4% | 39.8 15% | 47.5 -1% |
* ... más pequeño es mejor
Temperatura
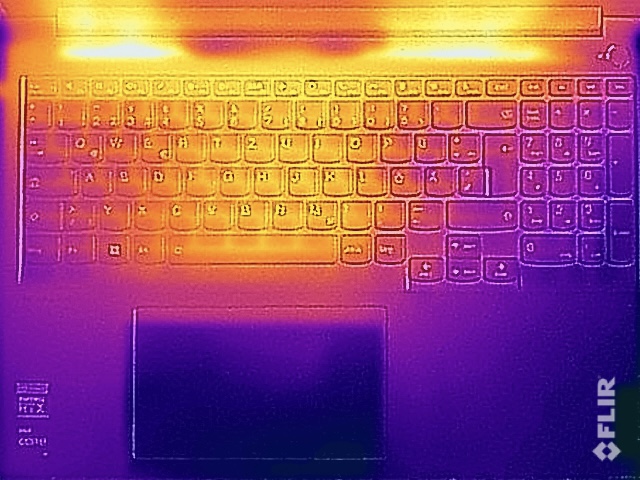
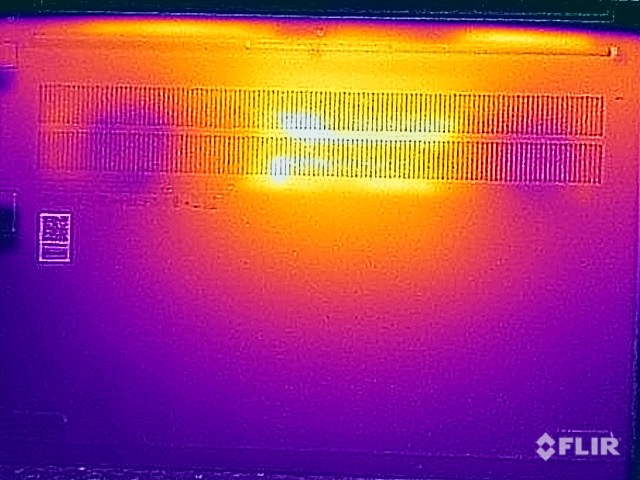
La carcasa de aluminio no se calienta en absoluto con poca carga. Sólo se calienta significativamente durante los juegos o las pruebas de estrés. En la parte superior de la unidad base, registramos unos 42 °C en la zona media/superior del teclado, lo que también se nota al teclear, pero no es desagradable. En la parte inferior, hay un punto caliente en la zona central trasera de la carcasa, donde medimos unos 50 °C. Aquí debería evitarse el contacto directo de la piel con superficies metálicas.
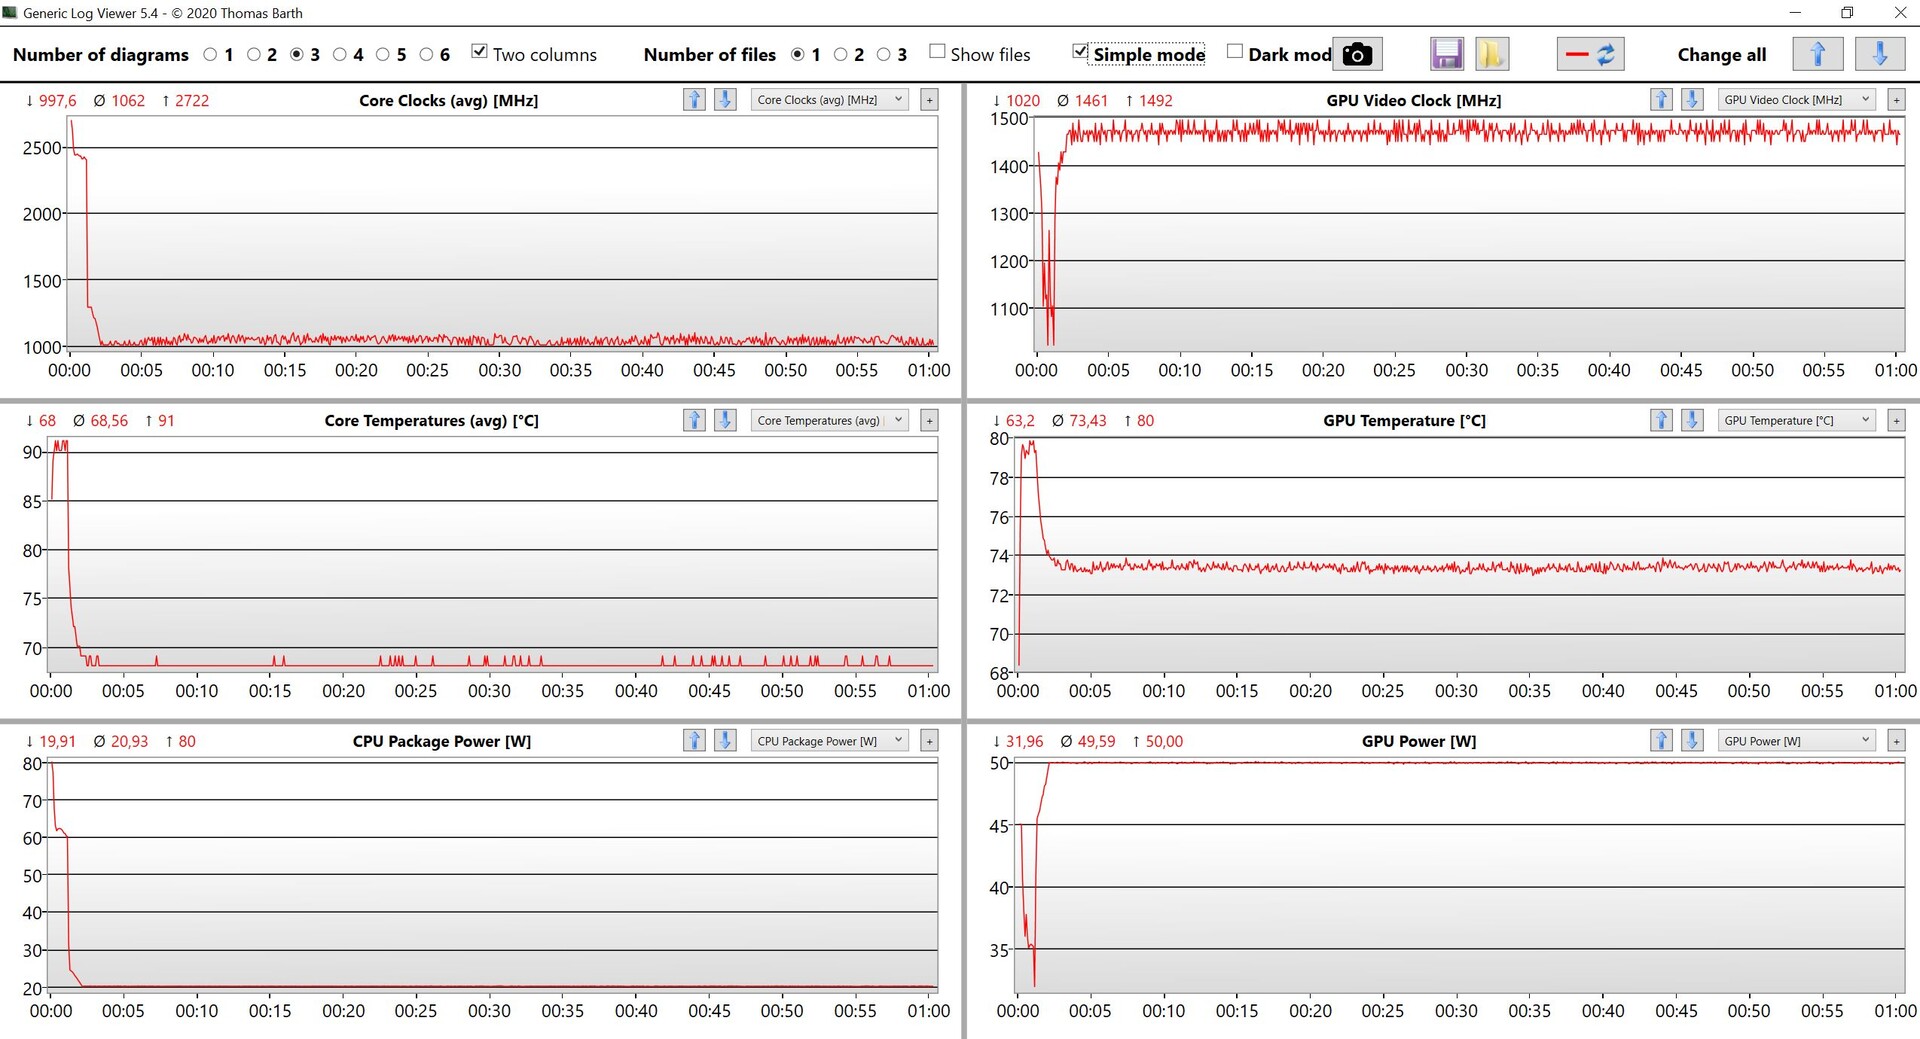
En las pruebas de estrés, el procesador empieza a plena potencia y luego se nivela a 20 vatios tras unos minutos, mientras que la tarjeta gráfica se estabiliza a 50 vatios y se mantiene en este nivel. Por tanto, la GPU tiene prioridad en el modo de alto rendimiento, mientras que el procesador puede consumir un poco más de energía en el modo de refrigeración inteligente (24/36 vatios).
(±) La temperatura máxima en la parte superior es de 42.9 °C / 109 F, frente a la media de 36.8 °C / 98 F, que oscila entre 21 y 71 °C para la clase Multimedia.
(-) El fondo se calienta hasta un máximo de 50.6 °C / 123 F, frente a la media de 39.1 °C / 102 F
(+) En reposo, la temperatura media de la parte superior es de 25.3 °C / 78# F, frente a la media del dispositivo de 31.3 °C / 88 F.
(±) Jugando a The Witcher 3, la temperatura media de la parte superior es de 36.1 °C / 97 F, frente a la media del dispositivo de 31.3 °C / 88 F.
(+) El reposamanos y el panel táctil están a una temperatura inferior a la de la piel, con un máximo de 28.3 °C / 82.9 F y, por tanto, son fríos al tacto.
(±) La temperatura media de la zona del reposamanos de dispositivos similares fue de 28.7 °C / 83.7 F (+0.4 °C / 0.8 F).
| Lenovo ThinkBook 16 G4+ IAP Intel Core i7-12700H, NVIDIA GeForce RTX 2050 Mobile | Dell Inspiron 16 Plus 7620 Intel Core i7-12700H, NVIDIA GeForce RTX 3050 Ti Laptop GPU | Acer Swift X SFX16-51G-5388 Intel Core i5-11320H, NVIDIA GeForce RTX 3050 4GB Laptop GPU | Asus Vivobook Pro 16X-M7600QE AMD Ryzen 9 5900HX, NVIDIA GeForce RTX 3050 Ti Laptop GPU | Huawei MateBook D 16 2022 Intel Core i7-12700H, Intel Iris Xe Graphics G7 96EUs | Samsung Galaxy Book2 15 Intel Core i7-1260P, Intel Arc A350M | |
|---|---|---|---|---|---|---|
| Heat | -7% | -13% | 3% | -3% | 1% | |
| Maximum Upper Side * (°C) | 42.9 | 46 -7% | 52.4 -22% | 39.4 8% | 41.8 3% | 44.6 -4% |
| Maximum Bottom * (°C) | 50.6 | 45.8 9% | 50 1% | 43.6 14% | 47.3 7% | 47.5 6% |
| Idle Upper Side * (°C) | 26 | 29.2 -12% | 30.3 -17% | 27.6 -6% | 28.3 -9% | 25.8 1% |
| Idle Bottom * (°C) | 26.5 | 31 -17% | 30.4 -15% | 27.5 -4% | 30.2 -14% | 26.1 2% |
* ... más pequeño es mejor
Altavoces
Lenovo equipa el ThinkBook 16 G4+ con dos altavoces estéreo (2x 2 vatios), que están situados en la zona frontal de la unidad base y dirigen el sonido hacia abajo. En cuanto al sonido, los módulos están en la media y son comparables a los de su competidor directo, el Dell Inspiron 16 Plusya que ambos modelos carecen de potencia y bajos. Para la música de fondo o los vídeos ocasionales, la calidad del sonido es suficiente e incluso es muy buena para la reproducción de la voz (por ejemplo, en conferencias) gracias a la reproducción lineal de los agudos/agudos. Sin embargo, para los juegos o las veladas cinematográficas se deberían utilizar altavoces externos o auriculares.
Lenovo ThinkBook 16 G4+ IAP análisis de audio
(±) | la sonoridad del altavoz es media pero buena (77.6 dB)
Graves 100 - 315 Hz
(-) | casi sin bajos - de media 17.3% inferior a la mediana
(±) | la linealidad de los graves es media (10.3% delta a frecuencia anterior)
Medios 400 - 2000 Hz
(+) | medios equilibrados - a sólo 4.6% de la mediana
(+) | los medios son lineales (4.6% delta a la frecuencia anterior)
Altos 2 - 16 kHz
(+) | máximos equilibrados - a sólo 1.6% de la mediana
(+) | los máximos son lineales (6.2% delta a la frecuencia anterior)
Total 100 - 16.000 Hz
(±) | la linealidad del sonido global es media (15.7% de diferencia con la mediana)
En comparación con la misma clase
» 39% de todos los dispositivos probados de esta clase eran mejores, 5% similares, 56% peores
» El mejor tuvo un delta de 5%, la media fue 17%, el peor fue ###max##%
En comparación con todos los dispositivos probados
» 24% de todos los dispositivos probados eran mejores, 5% similares, 71% peores
» El mejor tuvo un delta de 4%, la media fue 24%, el peor fue ###max##%
Dell Inspiron 16 Plus 7620 análisis de audio
(+) | los altavoces pueden reproducir a un volumen relativamente alto (#87.8 dB)
Graves 100 - 315 Hz
(-) | casi sin bajos - de media 22.2% inferior a la mediana
(±) | la linealidad de los graves es media (9.7% delta a frecuencia anterior)
Medios 400 - 2000 Hz
(+) | medios equilibrados - a sólo 3.3% de la mediana
(+) | los medios son lineales (5.3% delta a la frecuencia anterior)
Altos 2 - 16 kHz
(+) | máximos equilibrados - a sólo 2.5% de la mediana
(+) | los máximos son lineales (4.7% delta a la frecuencia anterior)
Total 100 - 16.000 Hz
(+) | el sonido global es lineal (13.4% de diferencia con la mediana)
En comparación con la misma clase
» 28% de todos los dispositivos probados de esta clase eran mejores, 5% similares, 68% peores
» El mejor tuvo un delta de 5%, la media fue 17%, el peor fue ###max##%
En comparación con todos los dispositivos probados
» 14% de todos los dispositivos probados eran mejores, 4% similares, 83% peores
» El mejor tuvo un delta de 4%, la media fue 24%, el peor fue ###max##%
Gestión de la energía - ThinkBook con una resistencia decente
Consumo de energía
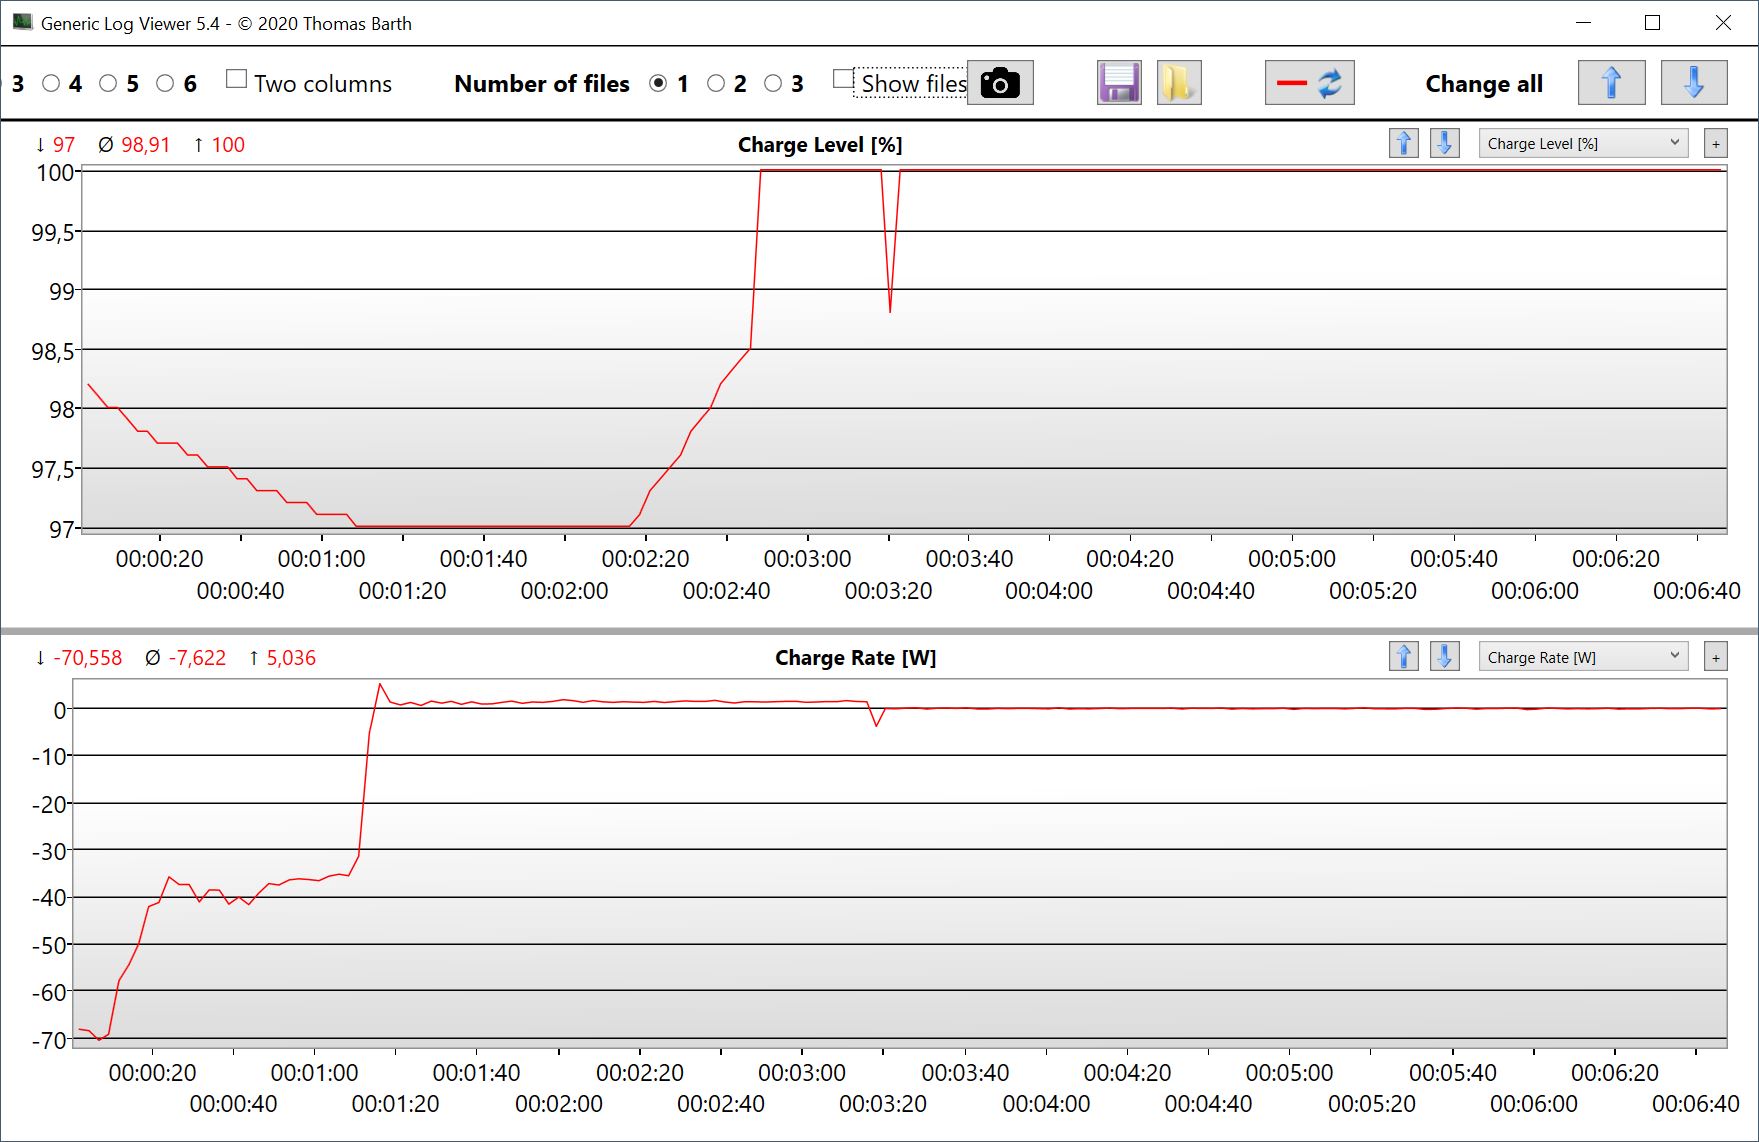
Los valores de consumo en inactivo del ThinkBook son perfectamente aceptables a la vista del gran panel WQHD con un máximo de ~12 vatios. Sin embargo, la fuente de alimentación de 100 vatios incluida se convierte rápidamente en un factor limitante bajo carga. En casos extremos, la herramienta HWiNFO da un consumo total máximo de 162 vatios al principio del test de estrés y, al evaluar los datos, vemos que también hay que extraer hasta 70 vatios de la batería durante un breve periodo de tiempo. La situación se estabiliza al cabo de unos minutos, pero ciertamente esto no favorece la vida de la batería si hay que extraerla una y otra vez bajo carga.
| Off / Standby | |
| Ocioso | |
| Carga |
|
Clave:
min: | |
| Lenovo ThinkBook 16 G4+ IAP i7-12700H, GeForce RTX 2050 Mobile, Micron 2450 1TB MTFDKCD1T0TFK, IPS, 2560x1600, 16" | Dell Inspiron 16 Plus 7620 i7-12700H, GeForce RTX 3050 Ti Laptop GPU, Kioxia BG5 KBG50ZNS512G, IPS, 3072x1920, 16" | Acer Swift X SFX16-51G-5388 i5-11320H, GeForce RTX 3050 4GB Laptop GPU, Samsung PM991 MZVLQ512HBLU, , 1920x1080, 16.1" | Asus Vivobook Pro 16X-M7600QE R9 5900HX, GeForce RTX 3050 Ti Laptop GPU, SK Hynix HFM001TD3JX013N, OLED, 3840x2400, 16.1" | Huawei MateBook D 16 2022 i7-12700H, Iris Xe G7 96EUs, Silicon Motion PCIe-8 SSD, IPS, 1920x1200, 16" | Samsung Galaxy Book2 15 i7-1260P, A350M, Samsung PM991 MZVLQ512HBLU, IPS, 1920x1080, 15.6" | Medio NVIDIA GeForce RTX 2050 Mobile | Media de la clase Multimedia | |
|---|---|---|---|---|---|---|---|---|
| Power Consumption | -29% | 0% | -22% | 12% | 30% | 11% | 1% | |
| Idle Minimum * (Watt) | 5 | 6.8 -36% | 7 -40% | 8.2 -64% | 6.1 -22% | 4 20% | 5.11 ? -2% | 5.71 ? -14% |
| Idle Average * (Watt) | 11.2 | 9.6 14% | 10.1 10% | 16.2 -45% | 10.6 5% | 7.8 30% | 9.15 ? 18% | 10.1 ? 10% |
| Idle Maximum * (Watt) | 11.6 | 17 -47% | 15 -29% | 19.7 -70% | 11.5 1% | 8.5 27% | 11.2 ? 3% | 12.4 ? -7% |
| Load Average * (Watt) | 89.3 | 117.5 -32% | 63.3 29% | 65.8 26% | 65.5 27% | 59.1 34% | 70.6 ? 21% | 65 ? 27% |
| Witcher 3 ultra * (Watt) | 83 | 113.1 -36% | 63.3 24% | 65.6 21% | 61.2 26% | 56.7 32% | ||
| Load Maximum * (Watt) | 102 | 137.4 -35% | 94 8% | 104 -2% | 68.4 33% | 62.4 39% | 87.4 ? 14% | 112.2 ? -10% |
* ... más pequeño es mejor
Power consumption Witcher 3 / Stress test
Power cosumption with an external monitor
Duración de la batería
La batería de 71 Wh permite duraciones decentes, ya que nuestro modelo de pruebas duró entre 6:43 horas y 8:09 horas en pruebas WLAN, dependiendo del brillo de la pantalla. Algo más de 12 horas son posibles incluso con la reproducción de vídeo a 150 cd/m² (correspondiente al 71% del brillo máximo). Esta gran diferencia con la prueba WLAN muestra una vez más que las actuales CPUs Alder Lake no funcionan de forma particularmente eficiente, ni siquiera bajo carga mononúcleo (es decir, cuando se navega por internet).
El proceso de carga completo con el dispositivo encendido tarda unos 100 minutos con una curva de carga lineal, pero también hay una opción de carga exprés que sólo tarda 73 minutos (el 60% ya está disponible tras 28 minutos).
| Lenovo ThinkBook 16 G4+ IAP i7-12700H, GeForce RTX 2050 Mobile, 71 Wh | Dell Inspiron 16 Plus 7620 i7-12700H, GeForce RTX 3050 Ti Laptop GPU, 86 Wh | Acer Swift X SFX16-51G-5388 i5-11320H, GeForce RTX 3050 4GB Laptop GPU, 58.7 Wh | Asus Vivobook Pro 16X-M7600QE R9 5900HX, GeForce RTX 3050 Ti Laptop GPU, 96 Wh | Huawei MateBook D 16 2022 i7-12700H, Iris Xe G7 96EUs, 60 Wh | Samsung Galaxy Book2 15 i7-1260P, A350M, 54 Wh | Media de la clase Multimedia | |
|---|---|---|---|---|---|---|---|
| Duración de Batería | -2% | -11% | 6% | -13% | -5% | 29% | |
| H.264 (h) | 12.6 | 8.4 -33% | 10.6 -16% | 16.4 ? 30% | |||
| WiFi v1.3 (h) | 8.2 | 9.6 17% | 8.1 -1% | 11.3 38% | 7.1 -13% | 8.2 0% | 12 ? 46% |
| Load (h) | 1.5 | 1.2 -20% | 1.5 0% | 1.1 -27% | 1.5 0% | 1.675 ? 12% |
Pro
Contra
Veredicto - El ThinkBook 16 G4+ es un muy buen portátil multimedia

El Lenovo ThinkBook 16 G4+ es un portátil multimedia muy sólido que tiene pocos puntos de crítica, aparte del débil suministro de energía durante las cargas máximas. La unidad base podría ser un poco más estable y Lenovo también tiene margen de mejora en el teclado, pero estos puntos no nos disuadirían de comprarlo.
La gran pantalla IPS de 16 pulgadas ofrece una muy buena calidad de imagen sin PWM y las superficies brillantes no aparecen granuladas a pesar de la superficie mate. Aunque carece de características adicionales como HDR, una mayor tasa de refresco o un espacio de color ampliado, el panel es sin embargo perfectamente suficiente para su propósito. Los valores de rendimiento, gracias a la combinación de un Intel Core i7-12700H y una Nvidia GeForce RTX 2050son muy buenos. Incluso los juegos no son un problema con el ThinkBook.
En el ThinkBook 16 G4+, Lenovo ofrece un muy buen portátil multimedia que no tiene puntos débiles importantes e impresiona con su amplia conectividad, alto rendimiento y buena pantalla IPS en el uso diario.
Los dispositivos de la competencia, como el Dell Inspiron 16 Plus o el Acer Swift Xofrecen GPUs ligeramente más rápidas y eficientes como la RTX 3050 y RTX 3050 Tipero tienen problemas con las pantallas más oscuras. En general, el ThinkBook 16 G4+ es un portátil muy sólido que, en conjunto, se sitúa por delante de sus rivales.
Precio y disponibilidad
La disponibilidad del Lenovo ThinkBook 16 G4+ parece ser escasa en todo el mundo. Por ejemplo, el sitio web oficial de Lenovo lista el portátil en Francia (1.079,00€), Italia (1.659,00€), Singapur (SG$1,504.07) y Emiratos Árabes Unidos.
Esta lista no es exhaustiva. Los precios son a fecha de 20.09.2022 y están sujetos a cambios
Lenovo ThinkBook 16 G4+ IAP
- 09/20/2022 v7 (old)
Andreas Osthoff
Price comparison

