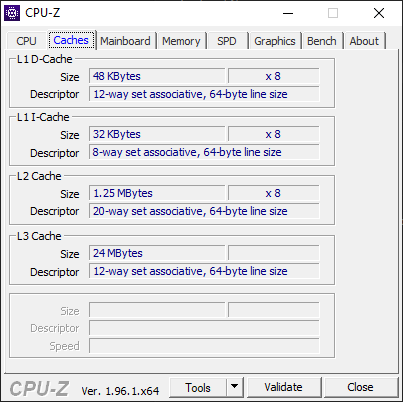
Análisis del Razer Blade 15 Advanced Model 11th Gen Intel (2021): Pequeños cambios, grandes ganancias en la CPU
Aunque la Blade 15 ya fue ya fue renovado a principios de este año con CPUs Intel Coffee Lake-H de 10ª generación y una pantalla de 360 Hz, Razer se apresuró a actualizar la serie una vez que Intel puso a disposición sus SKU de procesadores Tiger Lake-H de 11ª generación. El resultado final es un modelo visualmente similar pero con varias actualizaciones internas que los entusiastas y los jugadores apreciarán.
Recomendamos consultar nuestro análisis de los primeros modelos 2021 y modelos Blade 15 de 2020 ya que esta versión de 11ª generación comparte la misma pantalla de 360 Hz, el teclado y el esqueleto que sus predecesores inmediatos. Esta página se centrará en las diferencias de rendimiento que los usuarios pueden esperar entre las opciones del Intel Blade 15 de 10ª y 11ª generación.
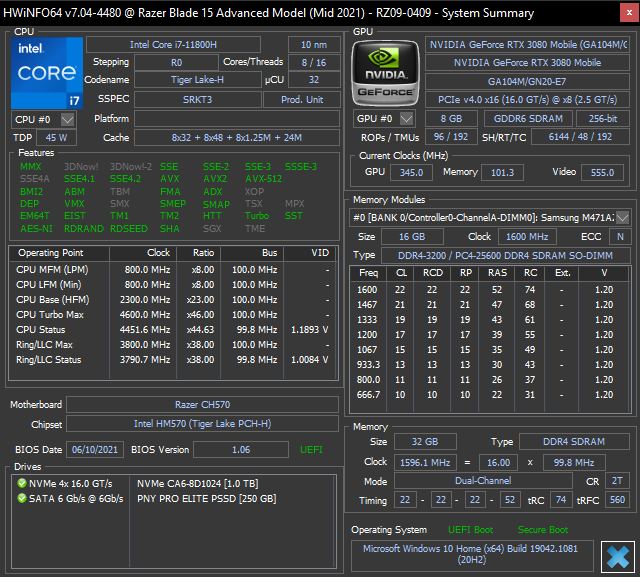
Nuestra configuración exacta con el Core i7-11800H, pantalla de 360 Hz, 1 TB PCIe 4 SSD, 32 GB de RAM, y GeForce RTX 3080 se puede encontrar en línea por $3100 USD. También hay otros SKUs disponibles en diferentes resoluciones, tasas de refresco, capacidades de RAM/SSD y GPUs RTX. Una opción en particular incluye el Core i9-11900H para convertirlo en el primer modelo Blade 15 con una opción de Core i9
Entre las alternativas al Blade 15 se encuentran otros portátiles de juego ultradelgados como el MSI GS66, Asus Zephyrus S series, Serie Aoruso el Dell Alienware X15
Más reseñas de Razer:
potential competitors in comparison
Valoración | Fecha | Modelo | Peso | Altura | Tamaño | Resolución | Precio |
|---|---|---|---|---|---|---|---|
| 88.9 % v7 (old) | 07/2021 | Razer Blade 15 Advanced (Mid 2021) i7-11800H, GeForce RTX 3080 Laptop GPU | 2 kg | 16.99 mm | 15.60" | 1920x1080 | |
| 85.9 % v7 (old) | 06/2021 | Asus TUF Gaming F15 FX506HM i7-11800H, GeForce RTX 3060 Laptop GPU | 2.3 kg | 24.9 mm | 15.60" | 1920x1080 | |
| 84.7 % v7 (old) | 06/2021 | Alienware m15 R5 Ryzen Edition R7 5800H, GeForce RTX 3060 Laptop GPU | 2.5 kg | 22.85 mm | 15.60" | 1920x1080 | |
| 86.4 % v7 (old) | 06/2021 | Aorus 15P YD i7-11800H, GeForce RTX 3080 Laptop GPU | 2.2 kg | 27 mm | 15.60" | 1920x1080 | |
| 83.3 % v7 (old) | 02/2020 | Schenker XMG Pro 15 i7-9750H, GeForce RTX 2070 Mobile | 2.5 kg | 30 mm | 15.60" | 1920x1080 |
Funda - Delgada y ligera con un rendimiento ultra alto
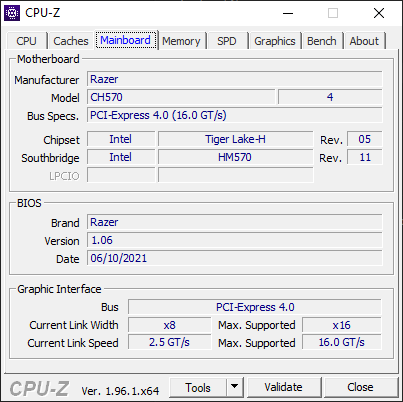
Dado que el chasis sigue siendo idéntico año tras año, estas son las principales diferencias entre el Blade 15 de 10ª generación y la nueva versión de 11ª generación
- Intel 11th gen Tiger Lake-H Opciones de CPU Core i7-11800H y Core i9-10900H
- Mayor objetivo de Turbo Boost de la CPU PL2 (de 90 W a 160 W)
- La GPU se ha actualizado de 95 W TGP a 105 W TGP
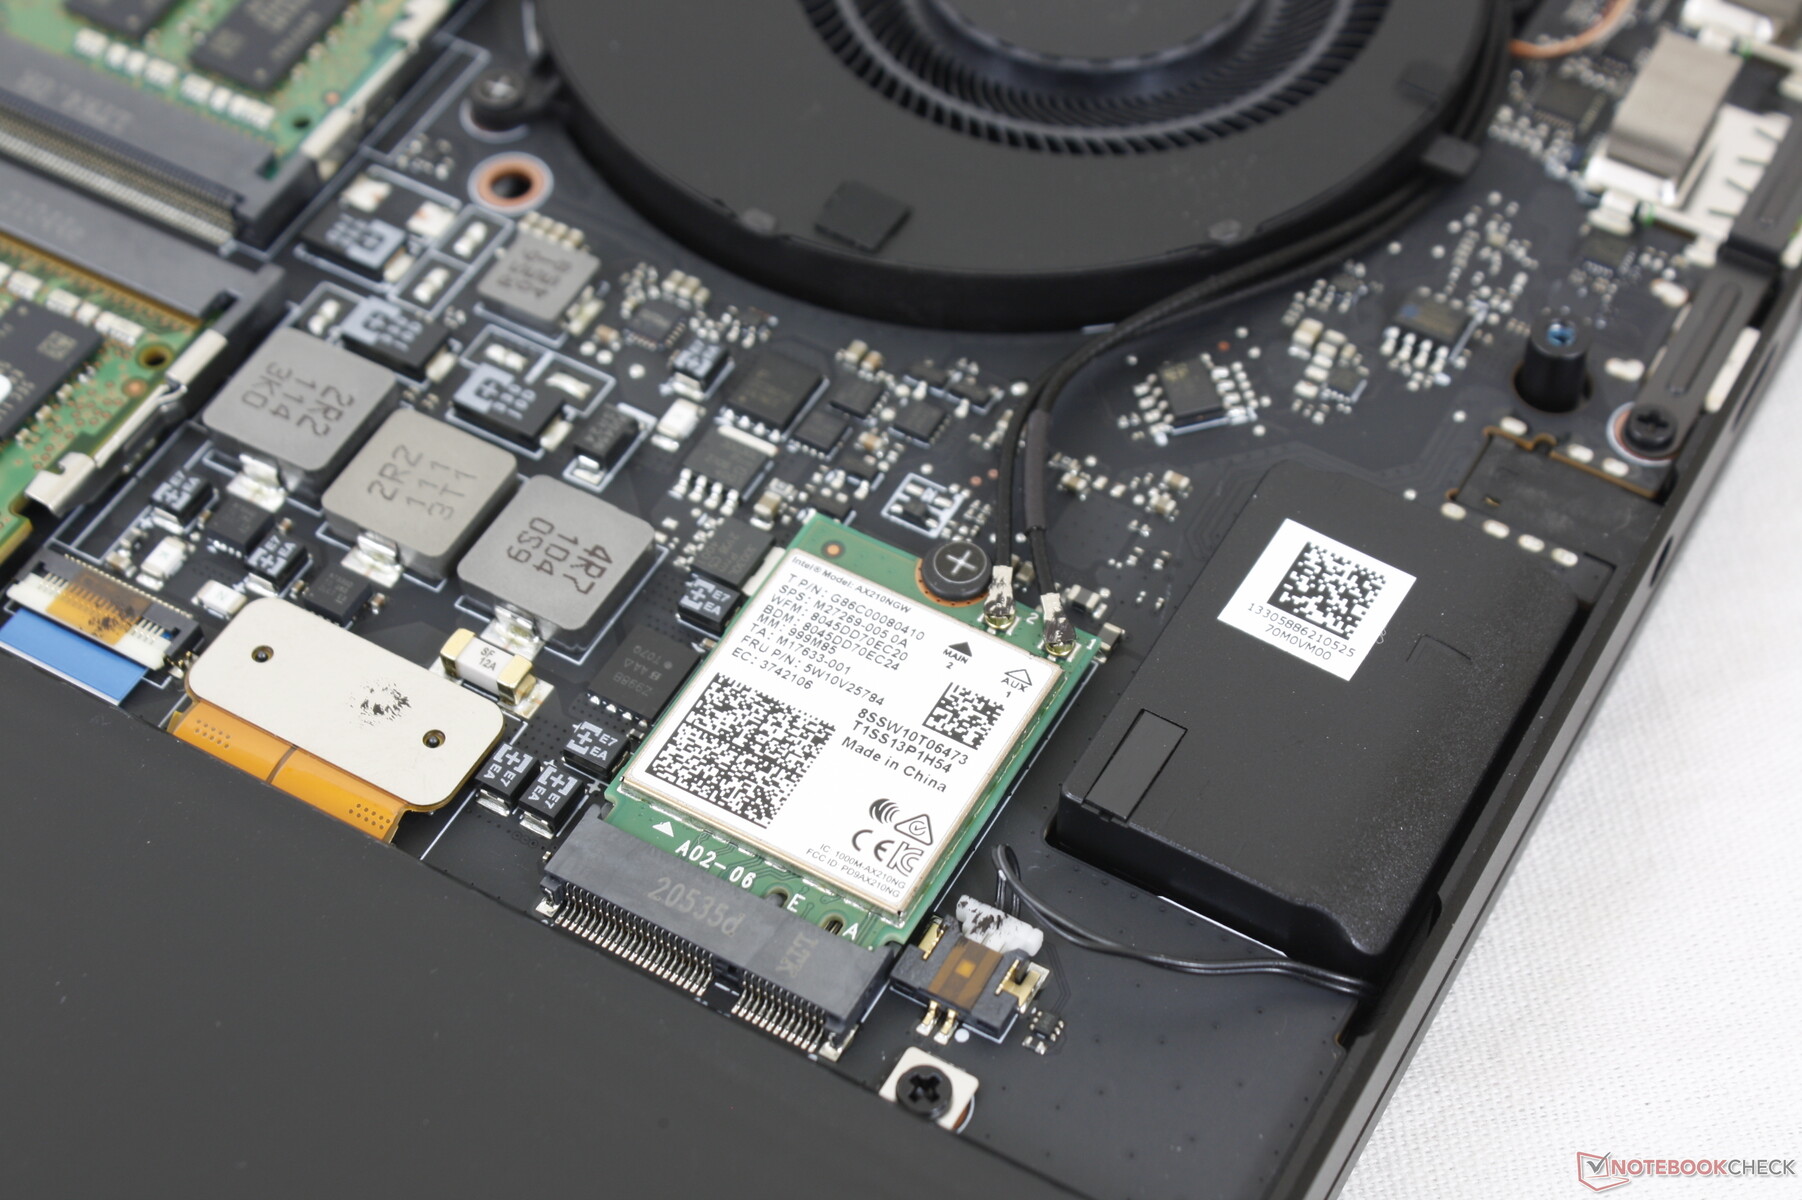
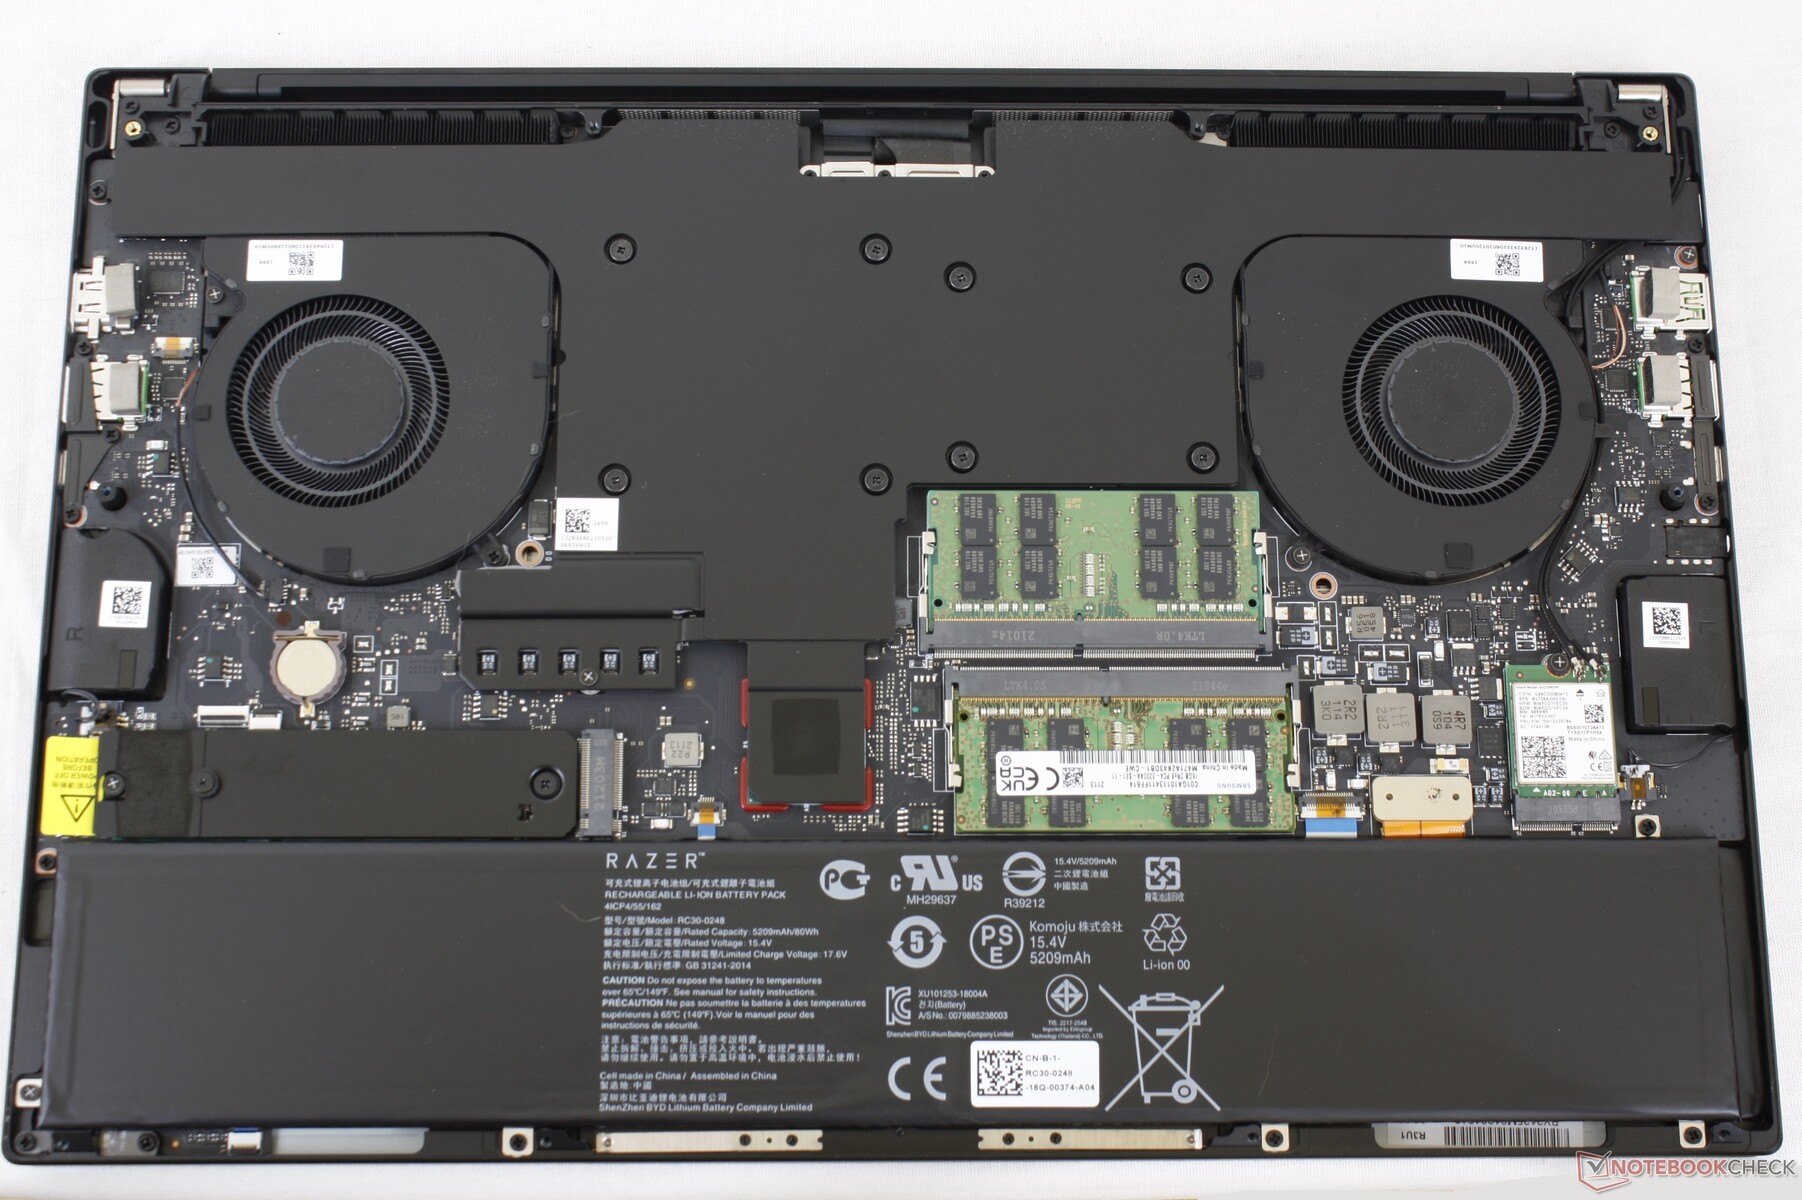
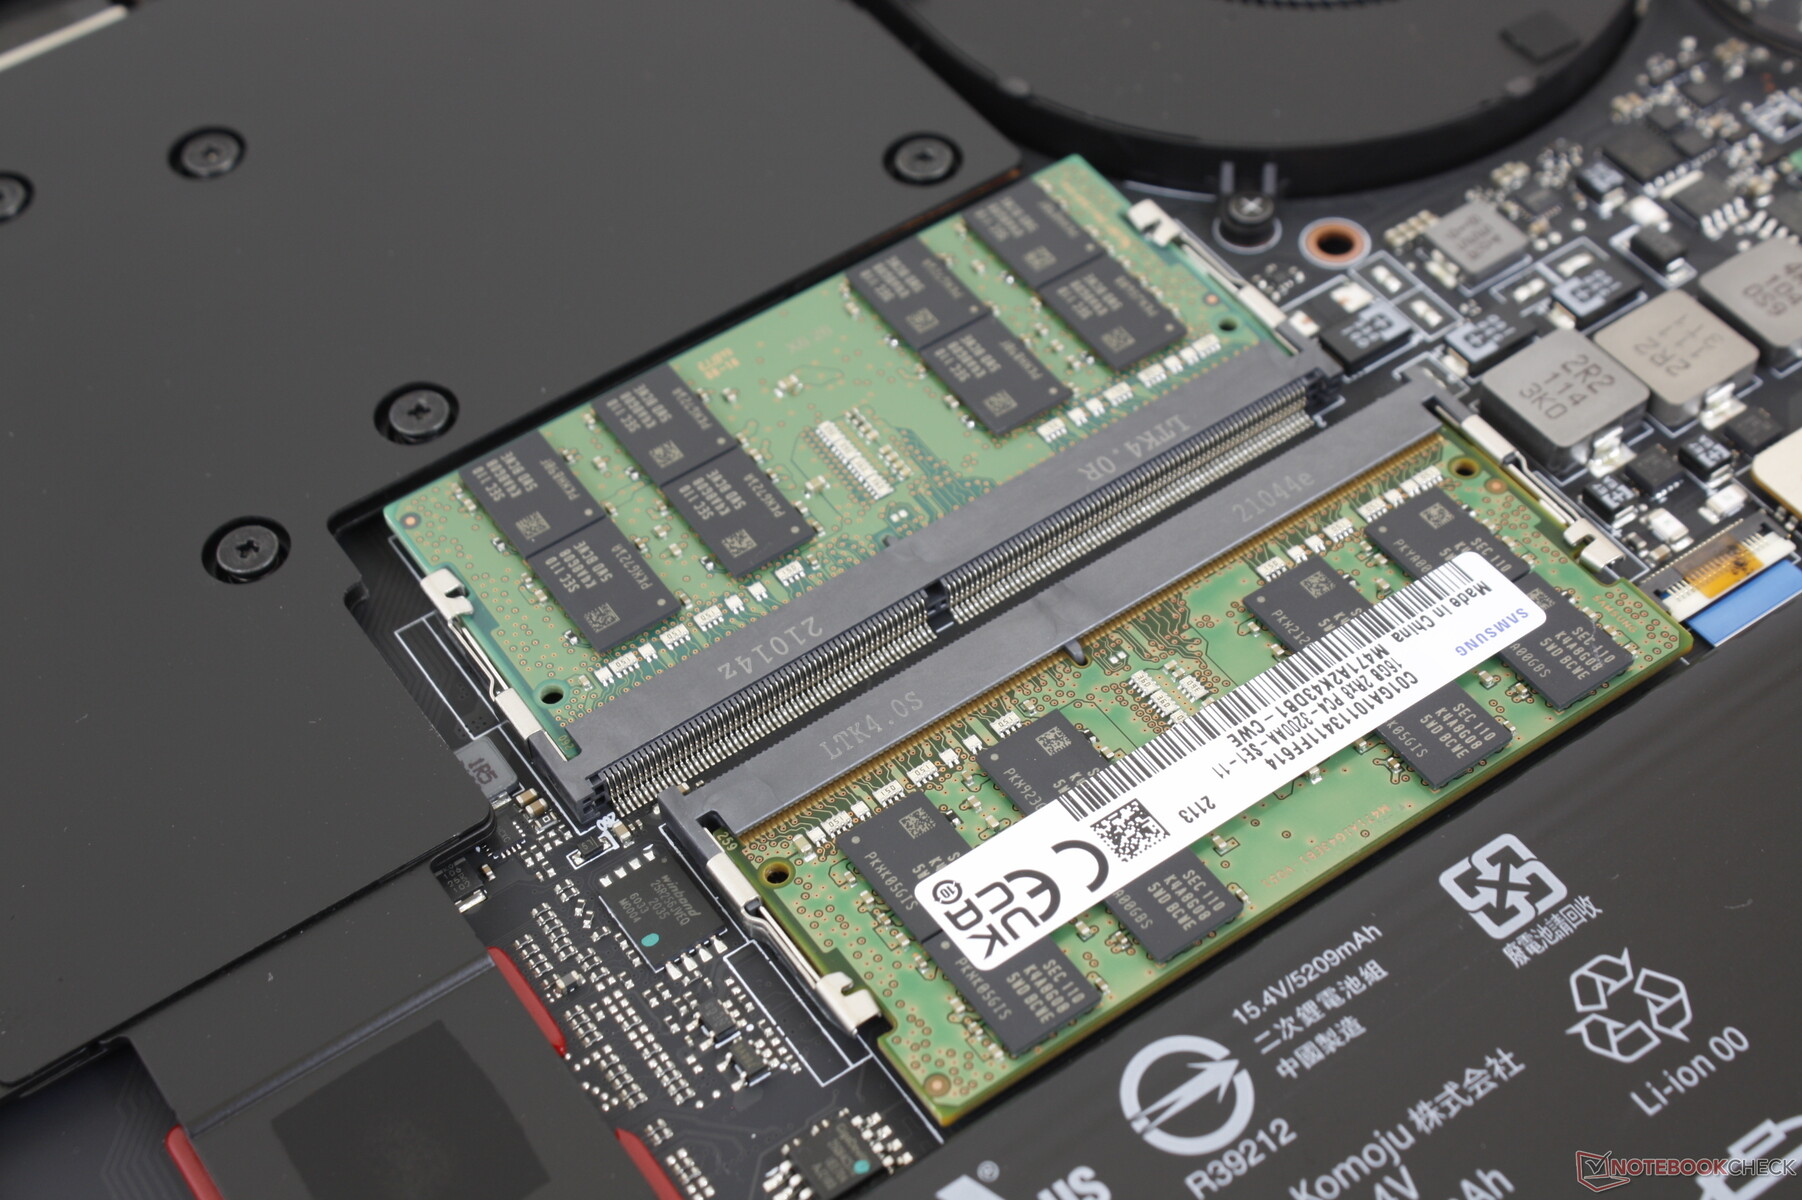
- Compatibilidad total con hasta dos SSD PCI 4 NVMe
- Compatibilidad total con Thunderbolt 4
- La cámara web se ha actualizado de 1 MP a 2 MP (o de 720p a 1080p)
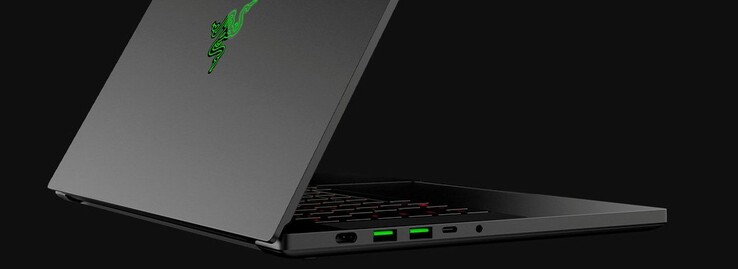
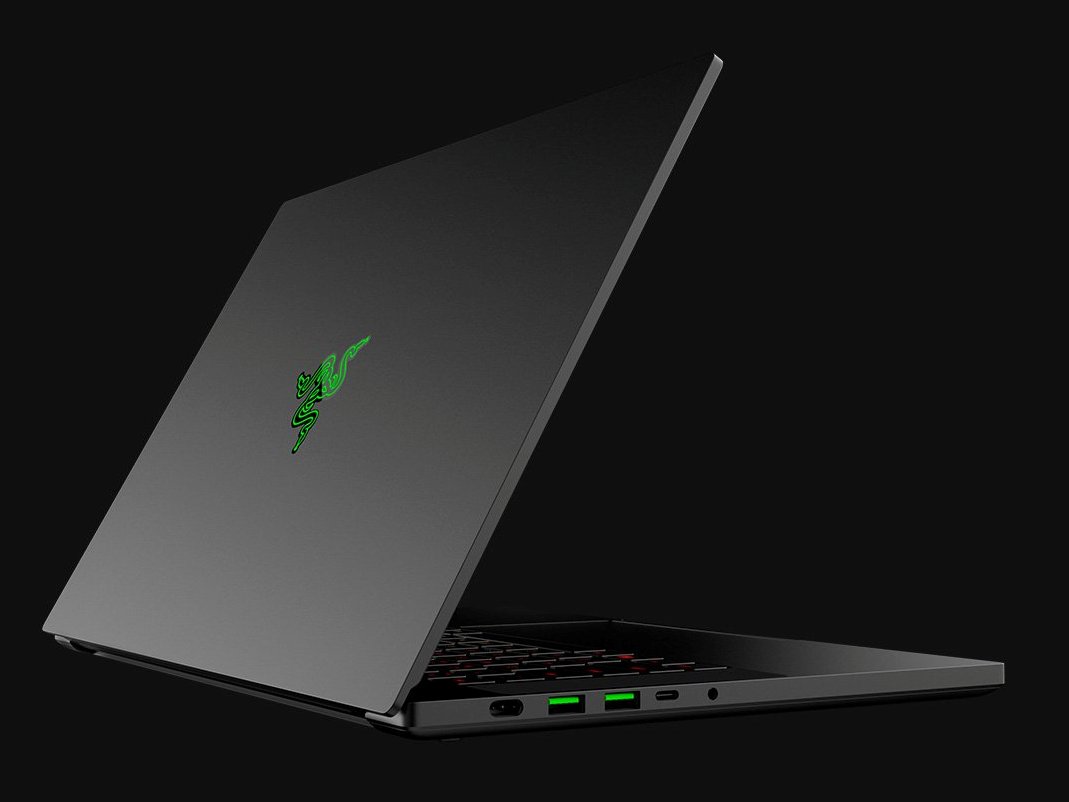
Ambos puertos USB-C soportan Power Delivery, carga, datos y DisplayPort-out. Sin embargo, no pudimos conseguir que la salida DisplayPort funcionara en nuestra unidad de pruebas, por lo que recomendamos a los usuarios que vuelvan a comprobarlo tras la compra.
Comunicación
Cámara web
Sigue sin haber obturador de cámara a pesar de la actualización de 720p a 1080p. Además, los usuarios sólo pueden grabar a un máximo de 30 FPS sin modo de 60 FPS.

 GeForce RTX 3080 Laptop GPU, i7-11800H, SSSTC CA6-8D1024")
 GeForce RTX 3080 Laptop GPU, i7-11800H, SSSTC CA6-8D1024")
Mantenimiento
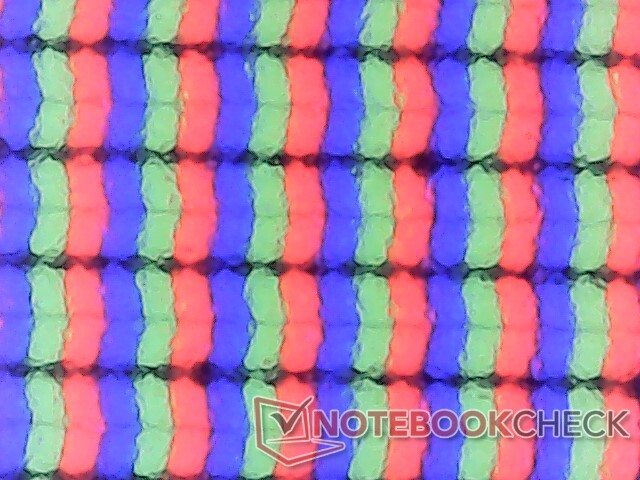
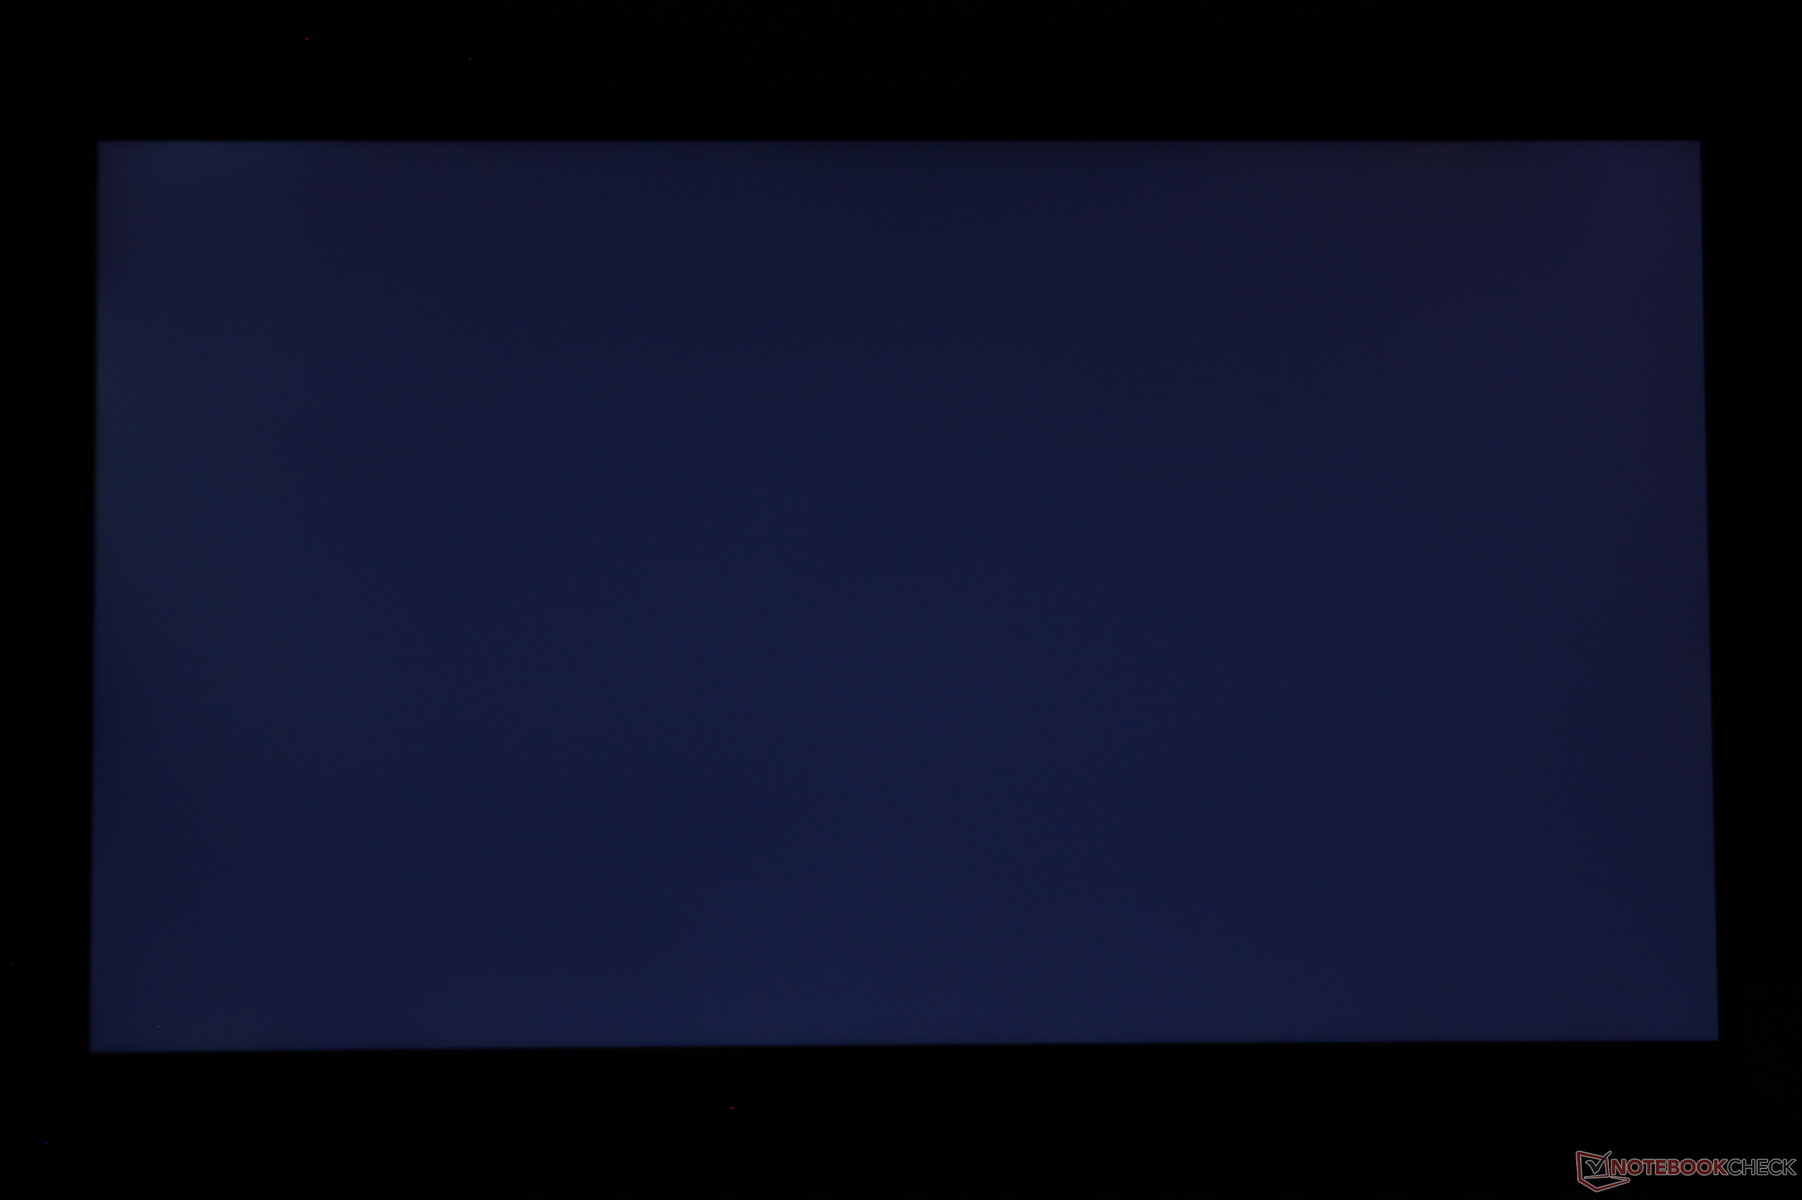
Mostrar
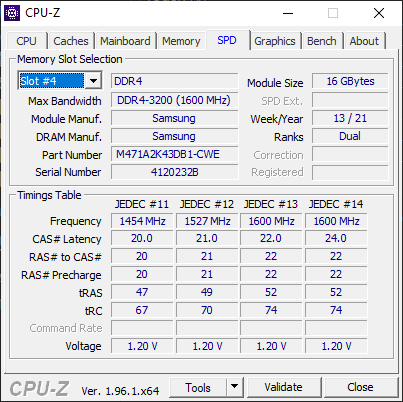
Nuestro modelo de mediados de 2021 viene con el mismo panel IPS TL156VDXP02-0 que se encuentra en el modelo de principios de 2021. La mayoría de los atributos son los mismos, pero con una diferencia interesante: los tiempos de respuesta de gris a gris son notablemente más rápidos en este modelo más reciente, incluso después de comprobarlo dos veces. No estamos seguros de si se trata de un cambio deliberado del fabricante o si hubo un error de medición en nuestro primer modelo 2021 10th gen, pero ciertamente apreciamos los rápidos tiempos de respuesta.
G-Sync no es compatible con la pantalla interna.
| |||||||||||||||||||||||||
iluminación: 92 %
Brillo con batería: 353.4 cd/m²
Contraste: 1140:1 (Negro: 0.31 cd/m²)
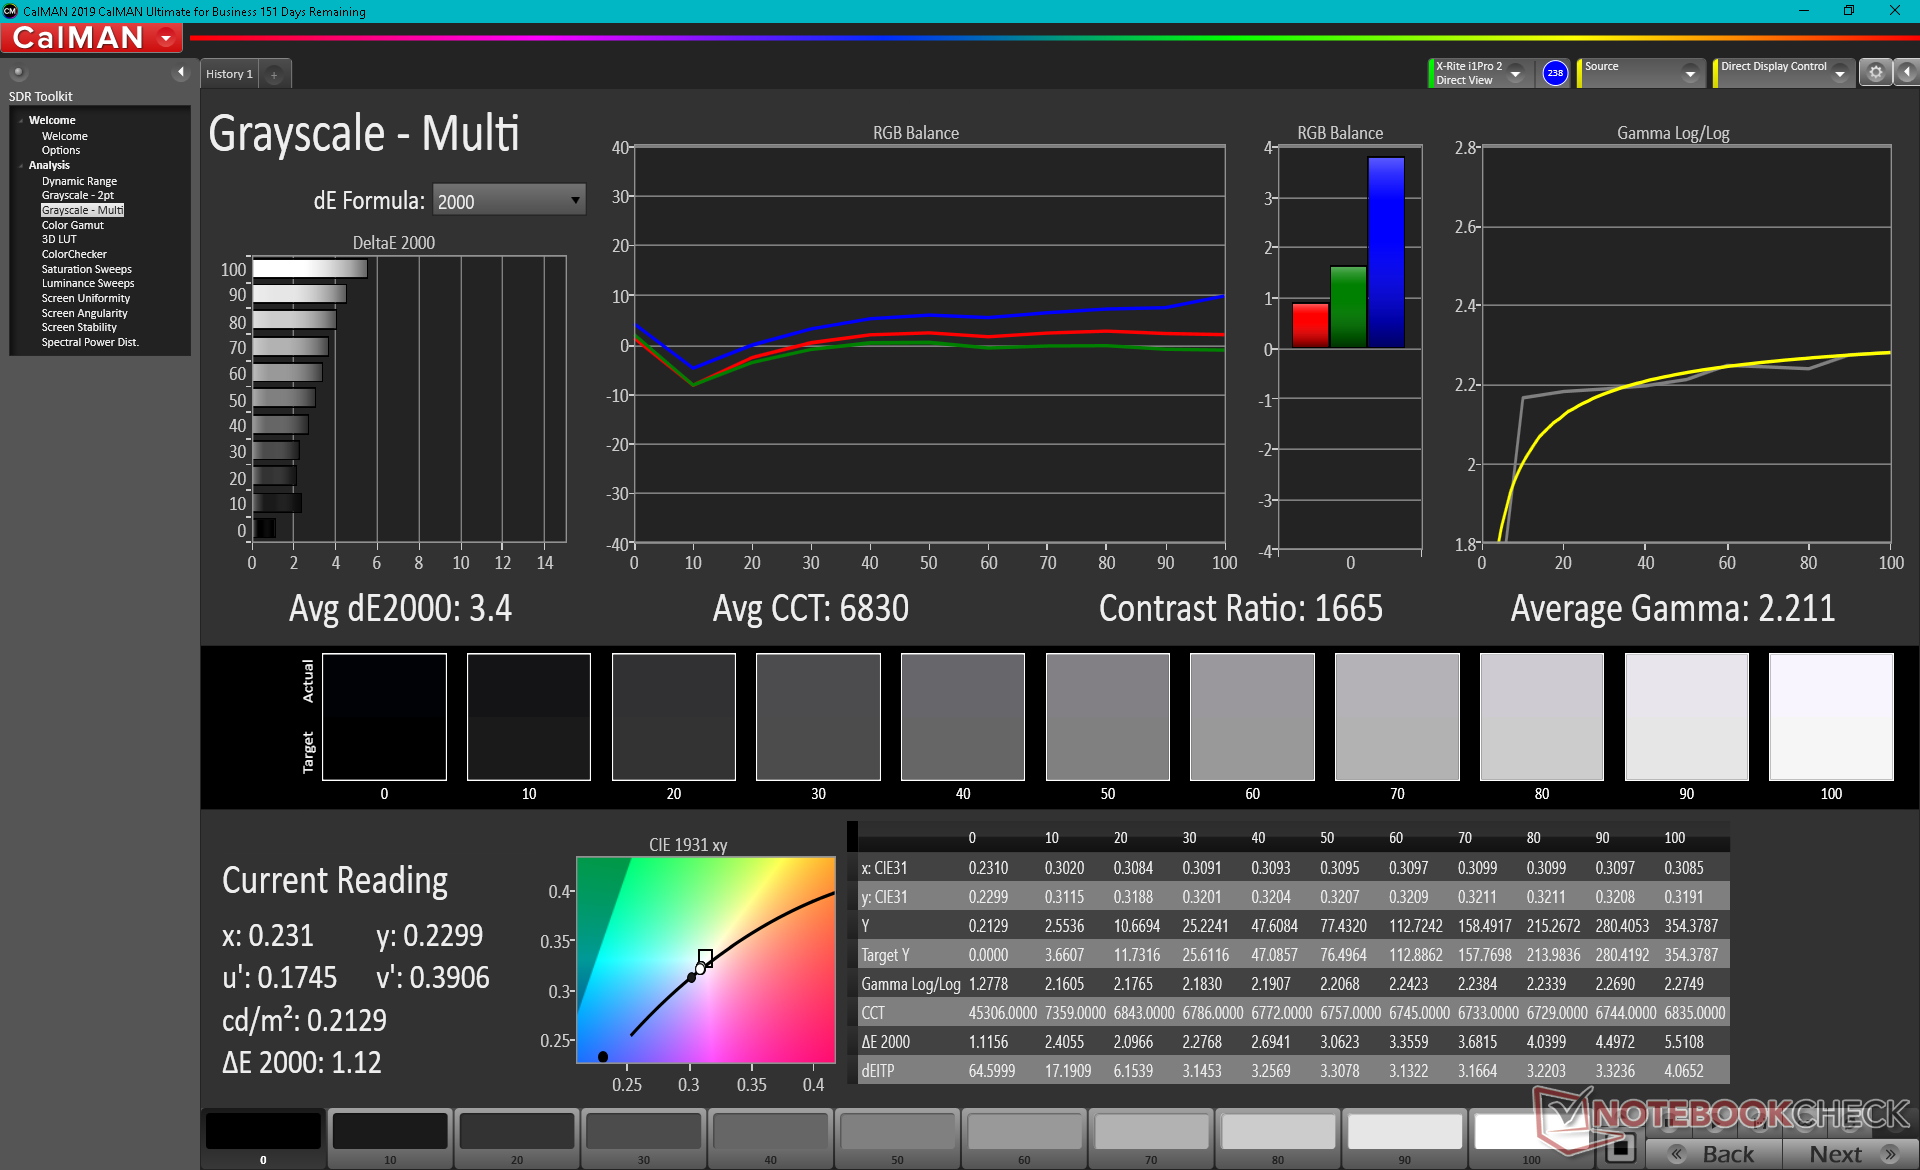
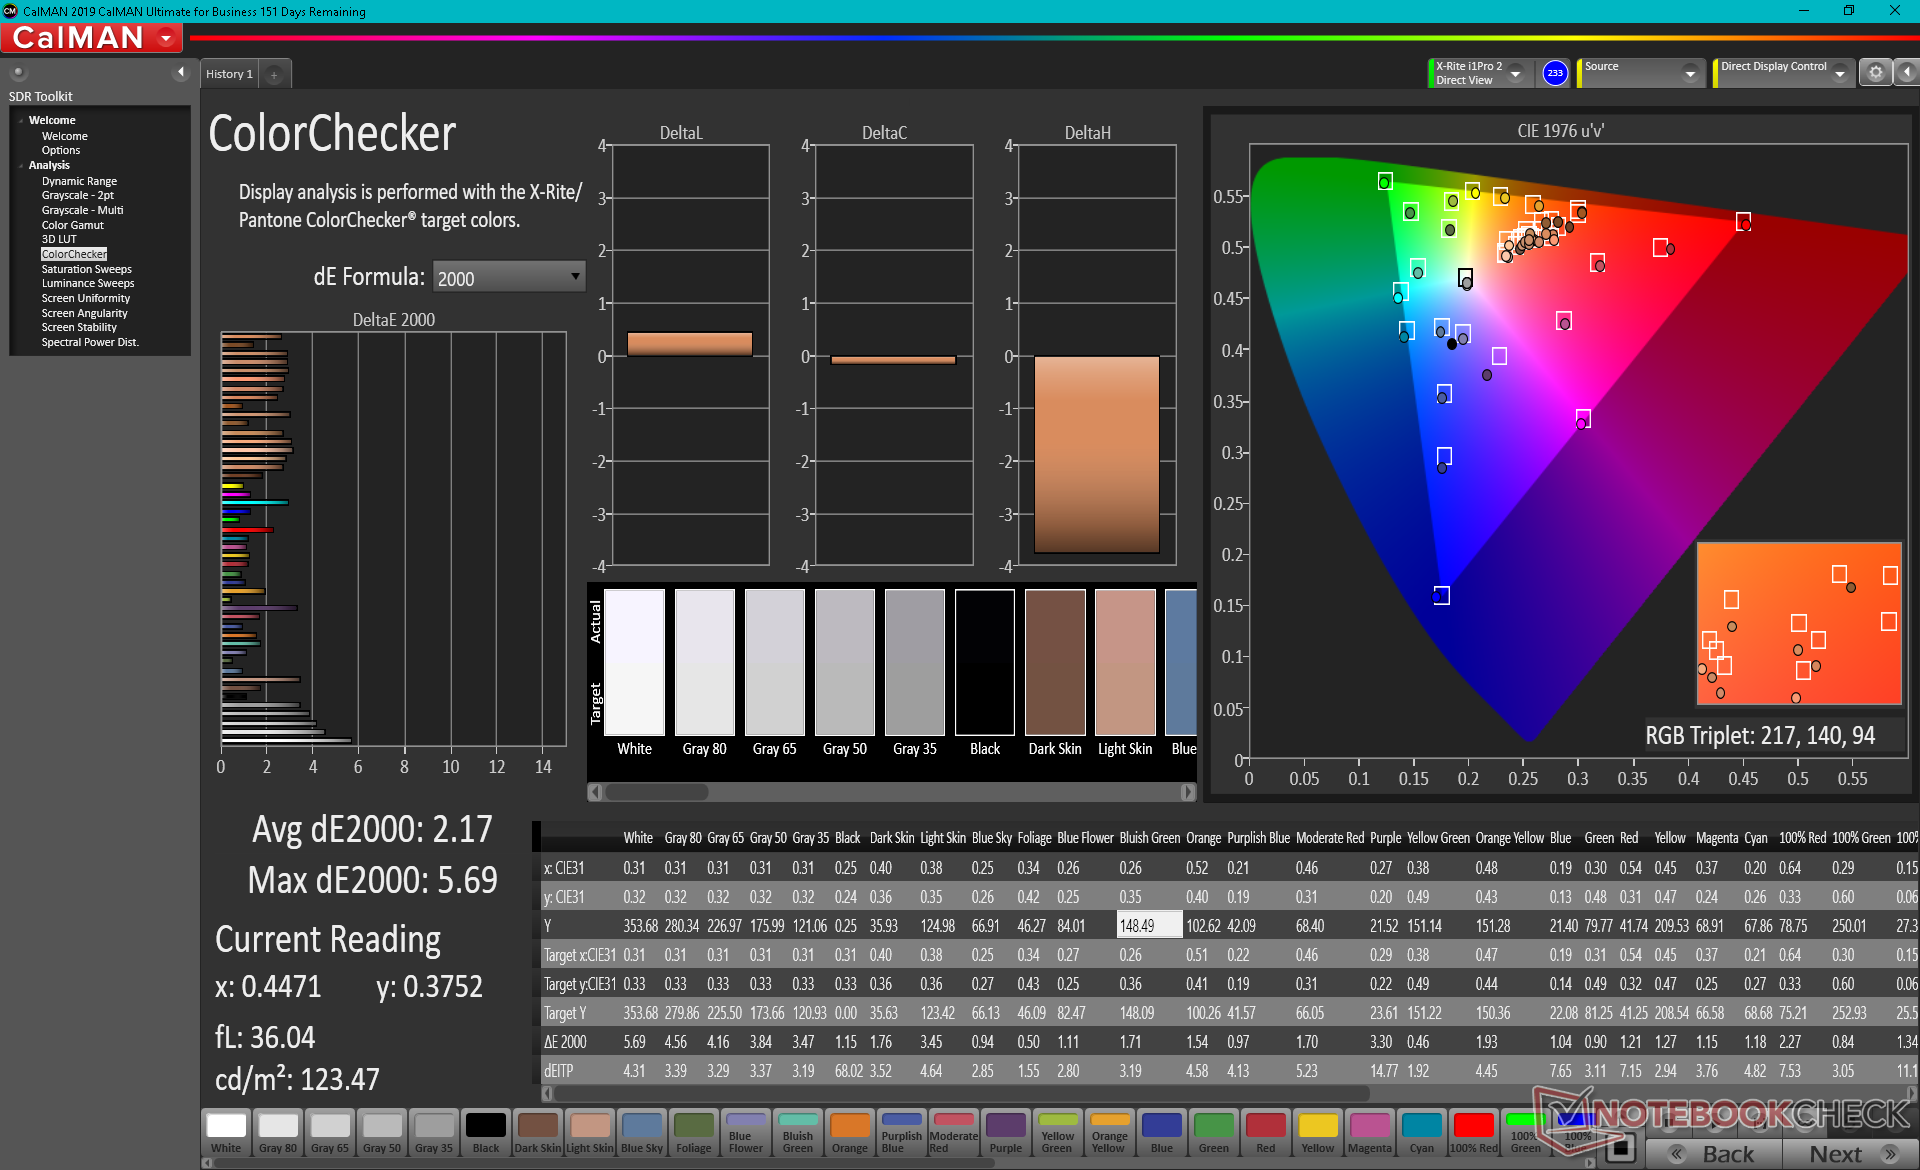
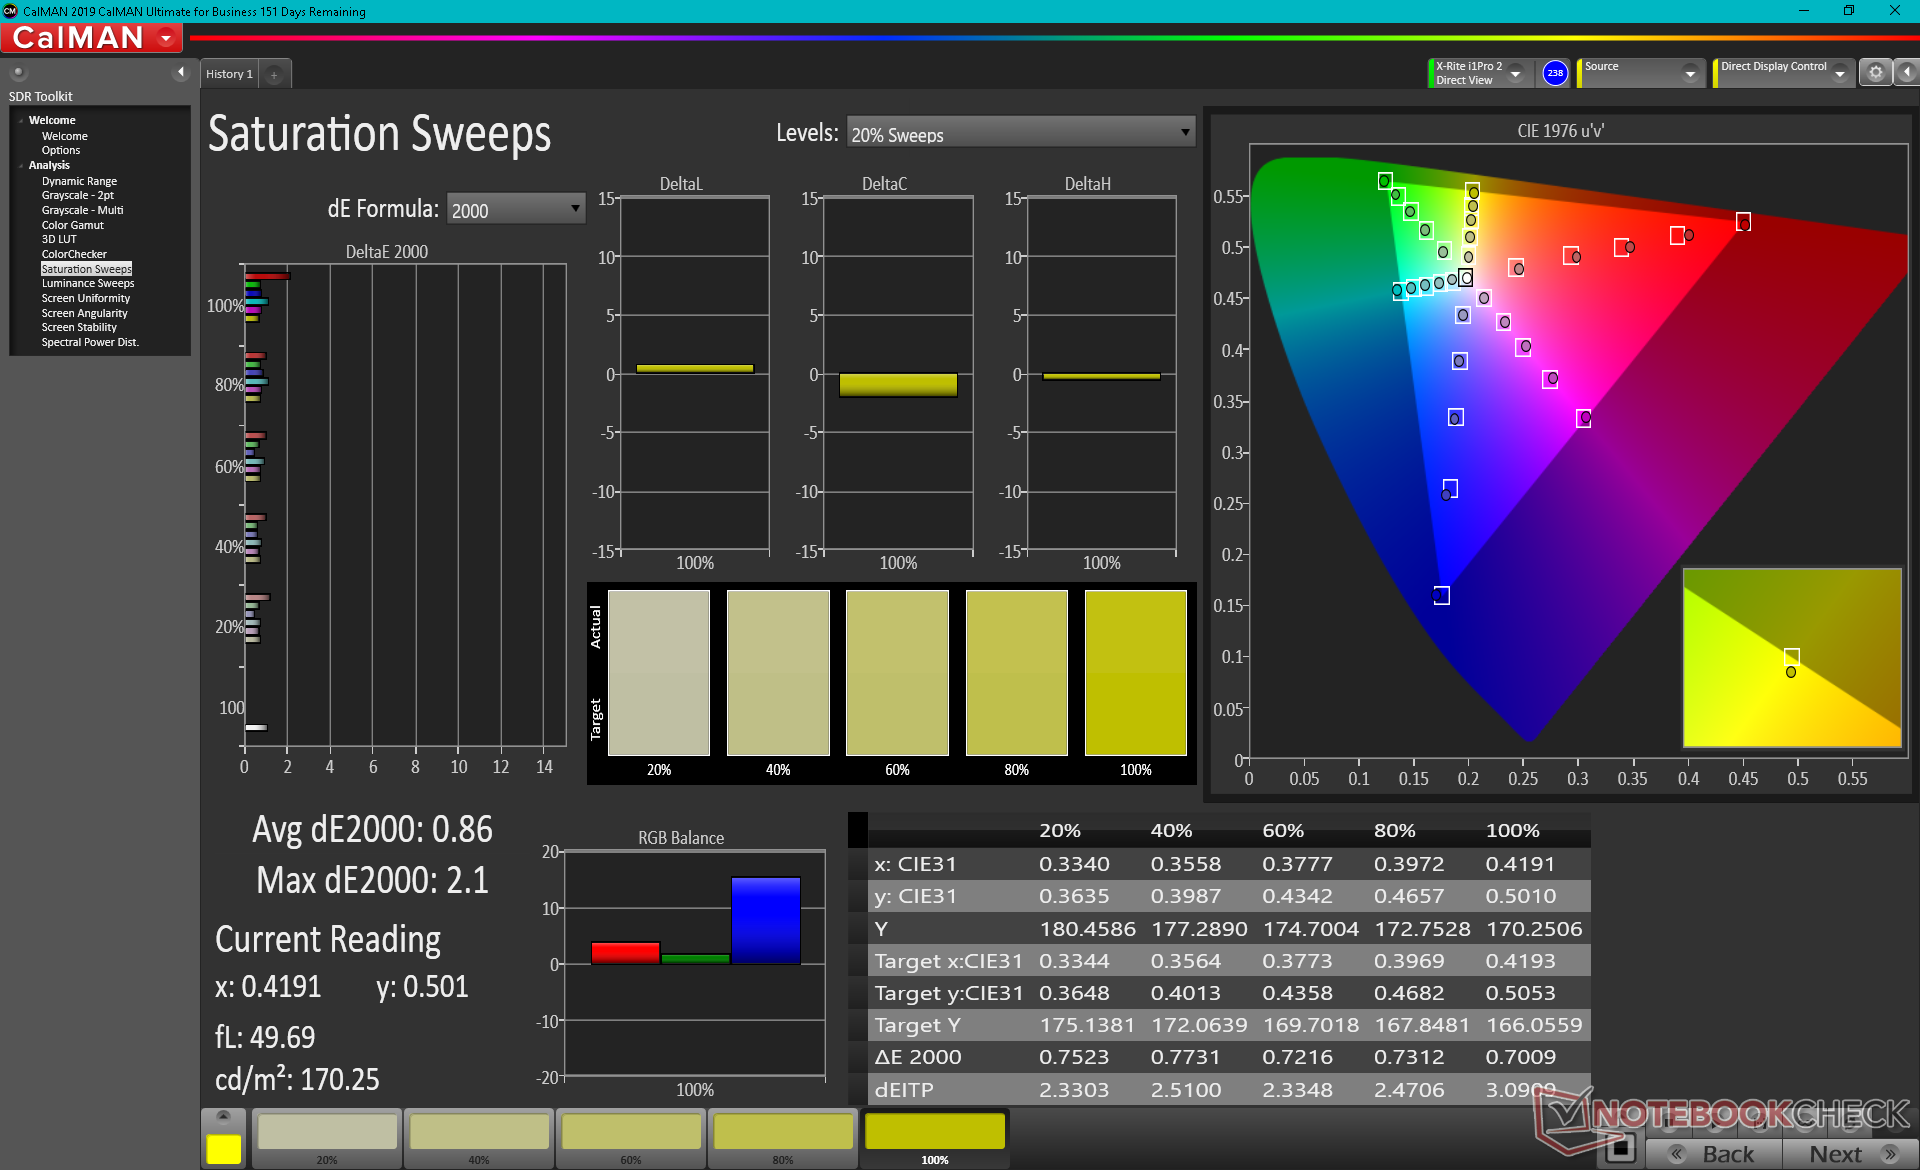
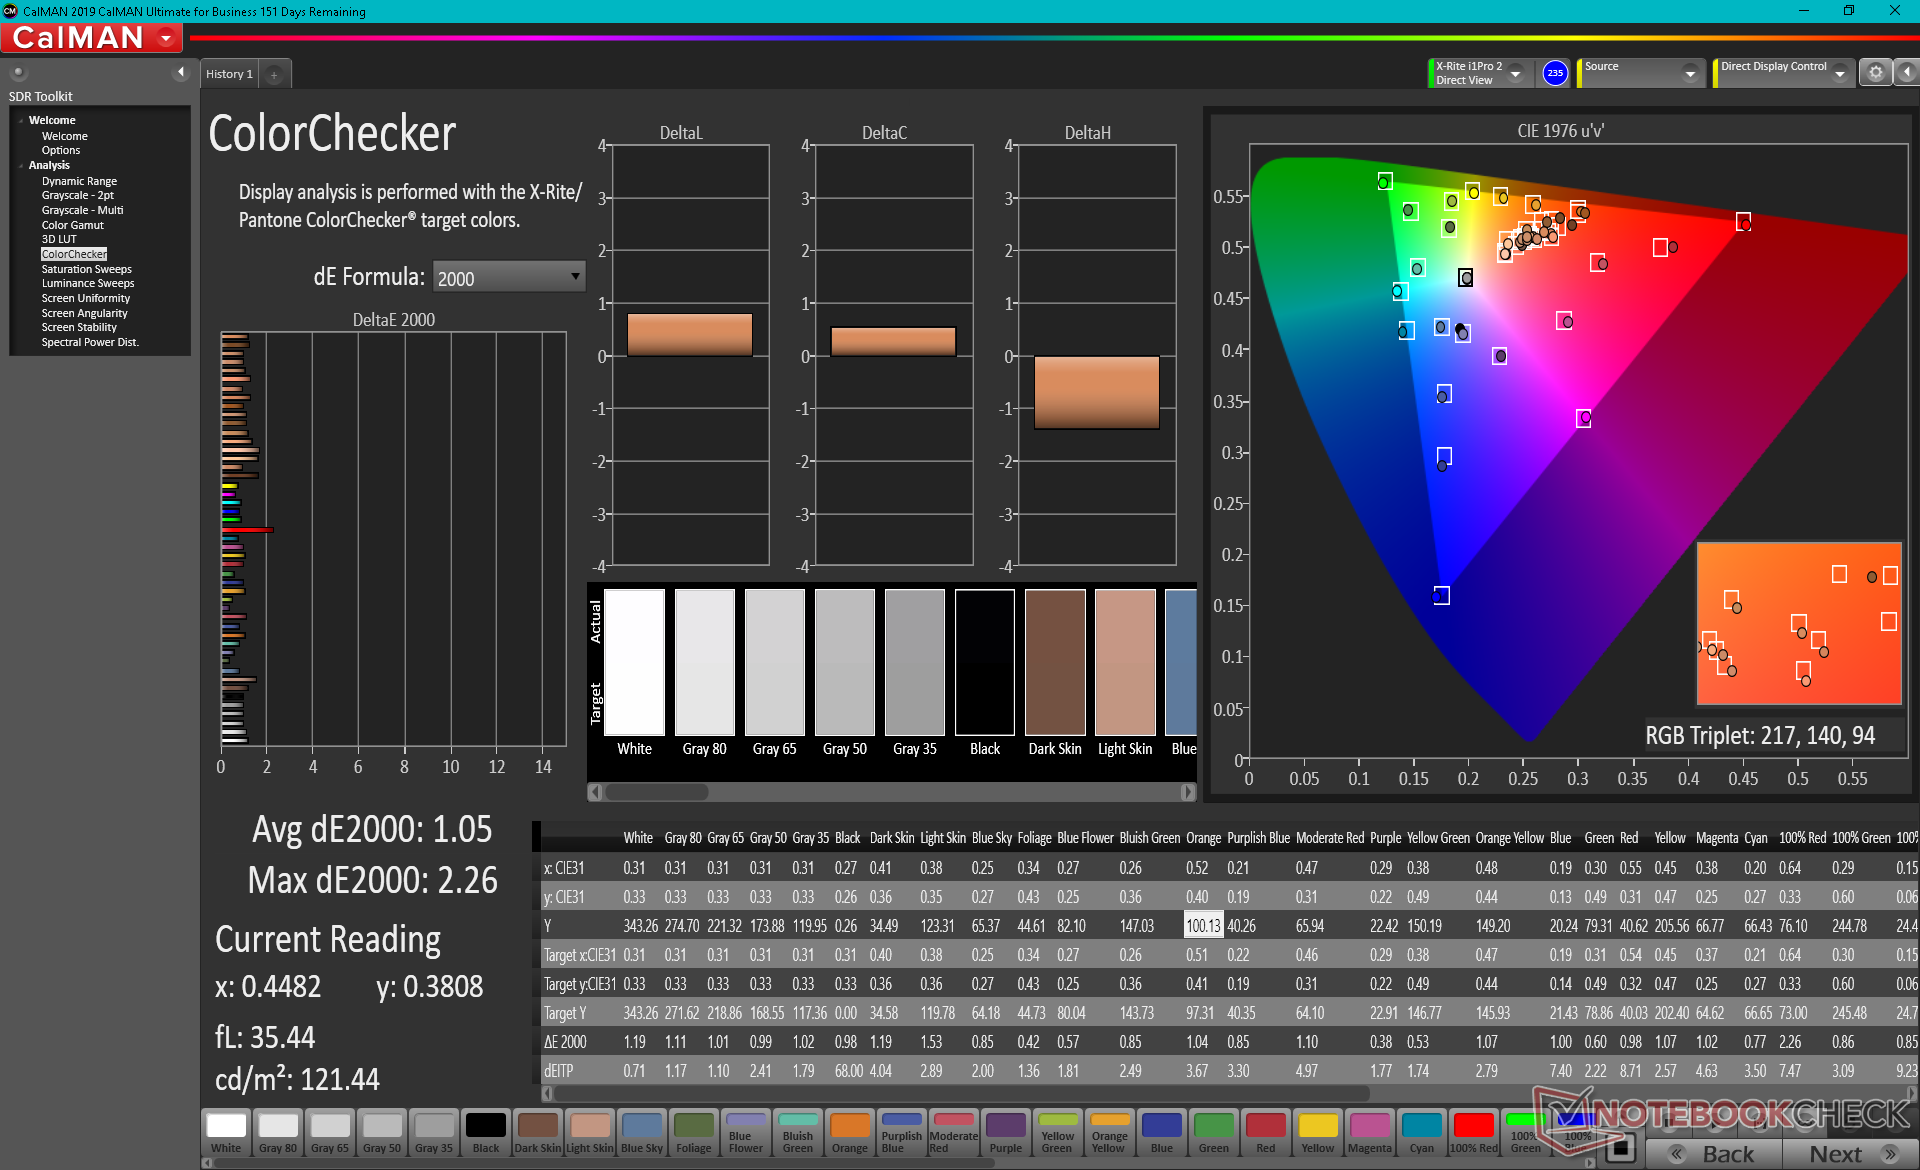
ΔE ColorChecker Calman: 2.17 | ∀{0.5-29.43 Ø4.71}
calibrated: 1.05
ΔE Greyscale Calman: 3.4 | ∀{0.09-98 Ø4.96}
69% AdobeRGB 1998 (Argyll 3D)
97.1% sRGB (Argyll 3D)
66.9% Display P3 (Argyll 3D)
Gamma: 2.2
CCT: 6830 K
| Razer Blade 15 Advanced (Mid 2021) TL156VDXP02-0, IPS, 15.6", 1920x1080 | Razer Blade 15 Advanced Model Early 2021 TL156VDXP02-0, IPS, 15.6", 1920x1080 | Razer Blade 15 RTX 2080 Super Max-Q AU Optronics B156HAN12.0, IPS, 15.6", 1920x1080 | Asus TUF Gaming F15 FX506HM Chi Mei N156HRA-EA1, IPS, 15.6", 1920x1080 | Alienware m15 R5 Ryzen Edition B156HAN, IPS, 15.6", 1920x1080 | Aorus 15P YD BOE09B9, IPS, 15.6", 1920x1080 | |
|---|---|---|---|---|---|---|
| Display | -1% | 3% | -36% | 4% | ||
| Display P3 Coverage (%) | 66.9 | 65.9 -1% | 70.2 5% | 41.9 -37% | 70.2 5% | |
| sRGB Coverage (%) | 97.1 | 96.4 -1% | 99 2% | 62.9 -35% | 98.5 1% | |
| AdobeRGB 1998 Coverage (%) | 69 | 68 -1% | 71.4 3% | 43.3 -37% | 72.4 5% | |
| Response Times | -143% | -17% | -346% | 11% | -115% | |
| Response Time Grey 50% / Grey 80% * (ms) | 4.2 ? | 16 ? -281% | 6 ? -43% | 28.4 ? -576% | 4 ? 5% | 14 ? -233% |
| Response Time Black / White * (ms) | 10 ? | 10.4 ? -4% | 9 ? 10% | 21.6 ? -116% | 8.4 ? 16% | 9.6 ? 4% |
| PWM Frequency (Hz) | ||||||
| Screen | 20% | 3% | -74% | -4% | -26% | |
| Brightness middle (cd/m²) | 353.4 | 338 -4% | 347 -2% | 268.3 -24% | 329 -7% | 337 -5% |
| Brightness (cd/m²) | 340 | 334 -2% | 328 -4% | 257 -24% | 321 -6% | 316 -7% |
| Brightness Distribution (%) | 92 | 94 2% | 89 -3% | 84 -9% | 92 0% | 85 -8% |
| Black Level * (cd/m²) | 0.31 | 0.24 23% | 0.285 8% | 0.34 -10% | 0.27 13% | 0.31 -0% |
| Contrast (:1) | 1140 | 1408 24% | 1218 7% | 789 -31% | 1219 7% | 1087 -5% |
| Colorchecker dE 2000 * | 2.17 | 1.39 36% | 2.35 -8% | 5.05 -133% | 2.78 -28% | 3.87 -78% |
| Colorchecker dE 2000 max. * | 5.69 | 3.31 42% | 4.15 27% | 15.43 -171% | 4.88 14% | 8.09 -42% |
| Colorchecker dE 2000 calibrated * | 1.05 | 0.97 8% | 1.16 -10% | 3.21 -206% | 1.63 -55% | 1.15 -10% |
| Greyscale dE 2000 * | 3.4 | 1.6 53% | 3.04 11% | 5.5 -62% | 2.5 26% | 6.1 -79% |
| Gamma | 2.2 100% | 2.291 96% | 2.35 94% | 2.35 94% | 2.106 104% | 2.132 103% |
| CCT | 6830 95% | 6626 98% | 6658 98% | 7392 88% | 6201 105% | 6891 94% |
| Color Space (Percent of AdobeRGB 1998) (%) | 68 | 65 | 76 | 72 | ||
| Color Space (Percent of sRGB) (%) | 89 | 99 | 99 | 94 | ||
| Media total (Programa/Opciones) | -41% /
-8% | -4% /
0% | -152% /
-105% | 4% /
-1% | -46% /
-32% |
* ... más pequeño es mejor
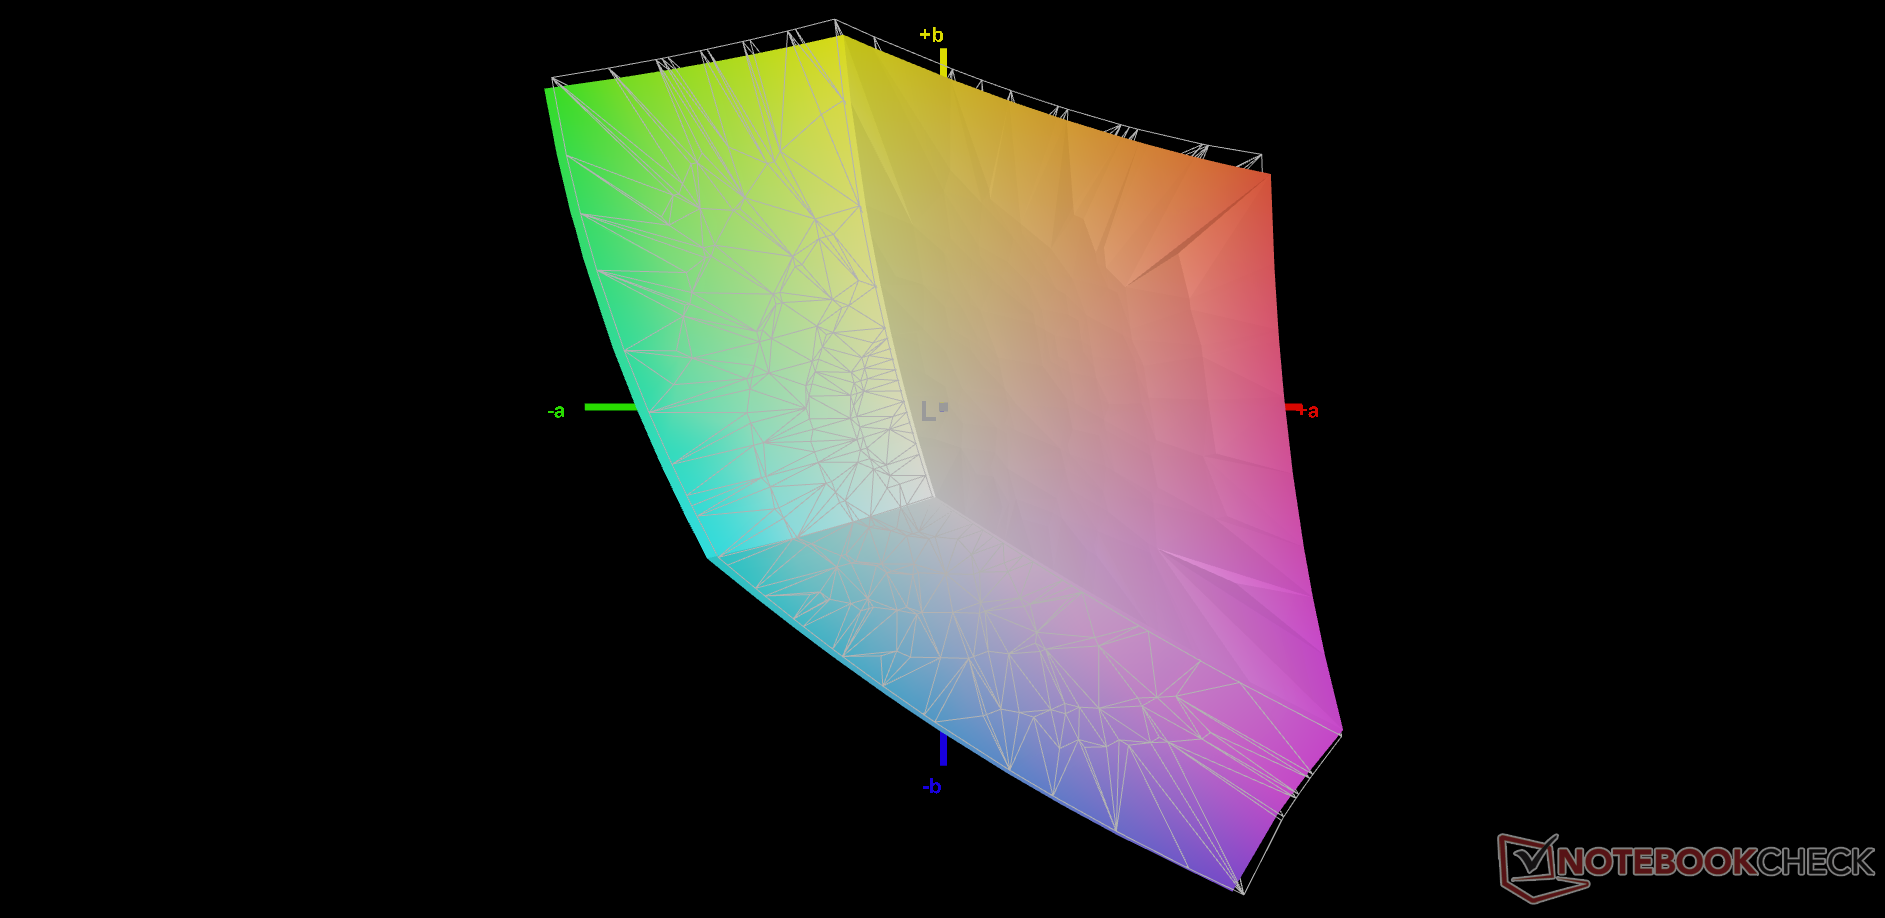
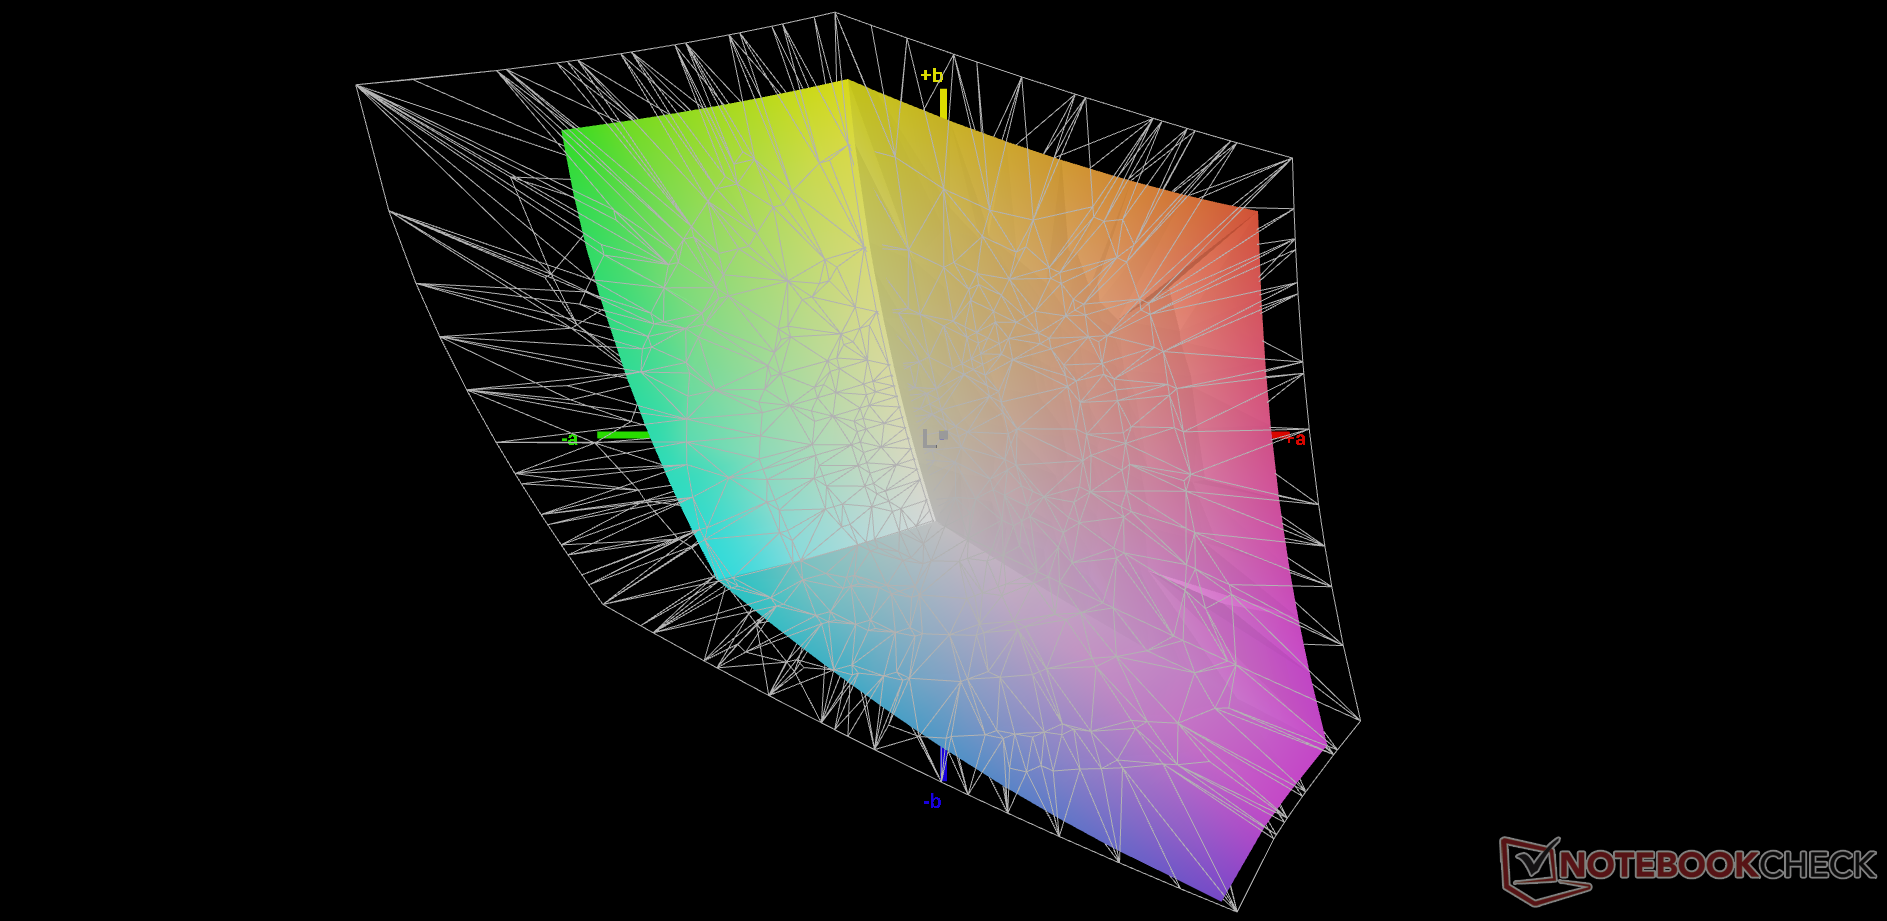
La pantalla viene calibrada de fábrica, pero no parece ser perfecta. Nuestras mediciones independientes con el colorímetro X-Rite muestran valores medios de deltaE en escala de grises y color de 3,5 y 2,17, respectivamente, lo que sugiere que puede haber margen de mejora. Hemos podido reducir los valores deltaE a sólo 1,1 y 1,05 después de calibrar la pantalla nosotros mismos.
Tiempos de respuesta del display
| ↔ Tiempo de respuesta de Negro a Blanco | ||
|---|---|---|
| 10 ms ... subida ↗ y bajada ↘ combinada | ↗ 5.2 ms subida | 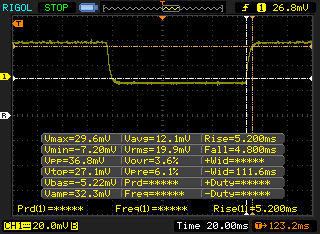 |
| ↘ 4.8 ms bajada | ||
| La pantalla mostró buenos tiempos de respuesta en nuestros tests pero podría ser demasiado lenta para los jugones competitivos. En comparación, todos los dispositivos de prueba van de ##min### (mínimo) a 240 (máximo) ms. » 27 % de todos los dispositivos son mejores. Esto quiere decir que el tiempo de respuesta medido es mejor que la media (19.8 ms) de todos los dispositivos testados. | ||
| ↔ Tiempo de respuesta 50% Gris a 80% Gris | ||
| 4.2 ms ... subida ↗ y bajada ↘ combinada | ↗ 2.6 ms subida | 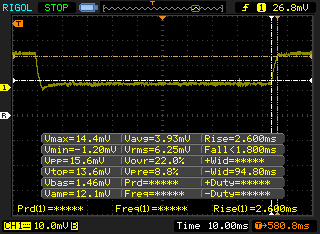 |
| ↘ 1.6 ms bajada | ||
| La pantalla mostró tiempos de respuesta muy rápidos en nuestros tests y debería ser adecuada para juegos frenéticos. En comparación, todos los dispositivos de prueba van de ##min### (mínimo) a 636 (máximo) ms. » 16 % de todos los dispositivos son mejores. Esto quiere decir que el tiempo de respuesta medido es mejor que la media (31 ms) de todos los dispositivos testados. | ||
Parpadeo de Pantalla / PWM (Pulse-Width Modulation)
| Parpadeo de Pantalla / PWM no detectado | 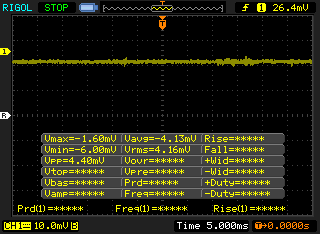 | ||
Comparación: 52 % de todos los dispositivos testados no usaron PWM para atenuar el display. Si se usó, medimos una media de 7754 (mínimo: 5 - máxmo: 343500) Hz. | |||

Rendimiento
Procesador
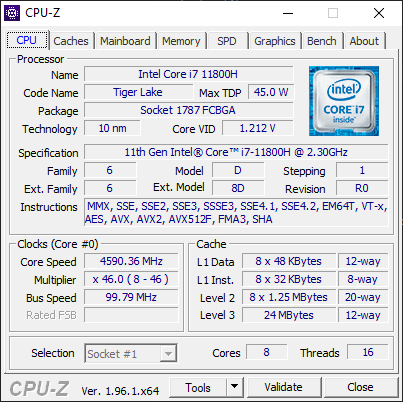
El rendimiento de la CPU está significativamente por delante del Core i7-10875H del Blade 15 de 10ª generación en un 20% y un 80% en las pruebas de un solo hilo y de varios hilos, respectivamente. El procesador del Blade 15 de 10ª generación tenía un rendimiento inferior, por lo que es bueno ver que el Blade 15 de 11ª generación vuelve a estar en el buen camino en términos de rendimiento de la CPU. Las puntuaciones están dentro de puntos porcentuales de un solo dígito del portátil medio Core i7-11800H de nuestra base de datos, mientras que el i7-10875H del antiguo Blade 15 se quedaba atrás hasta en un 20%.
La actualización a la unidad Core i9-11900H probablemente aumentaría el rendimiento en unos pocos puntos porcentuales si nuestro Asus ROG Zephyrus S17 GX703HSD sirve de indicación.
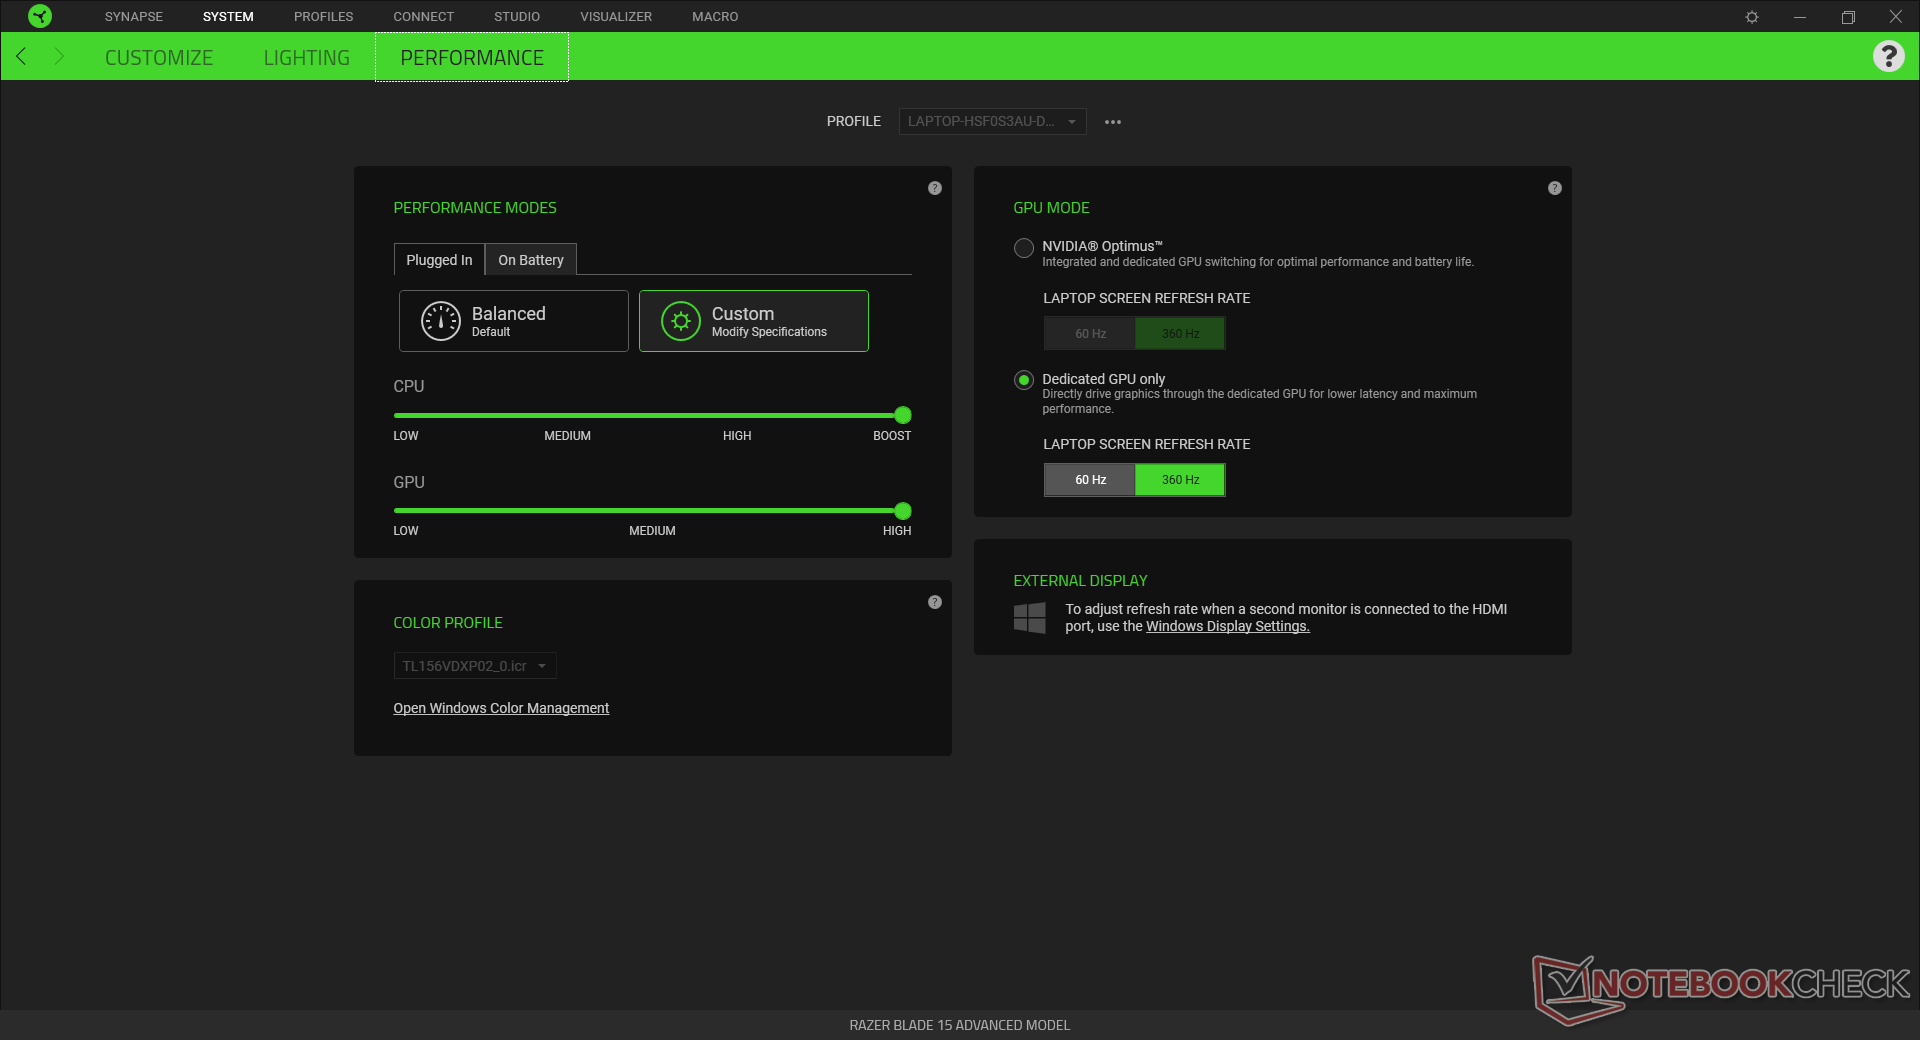
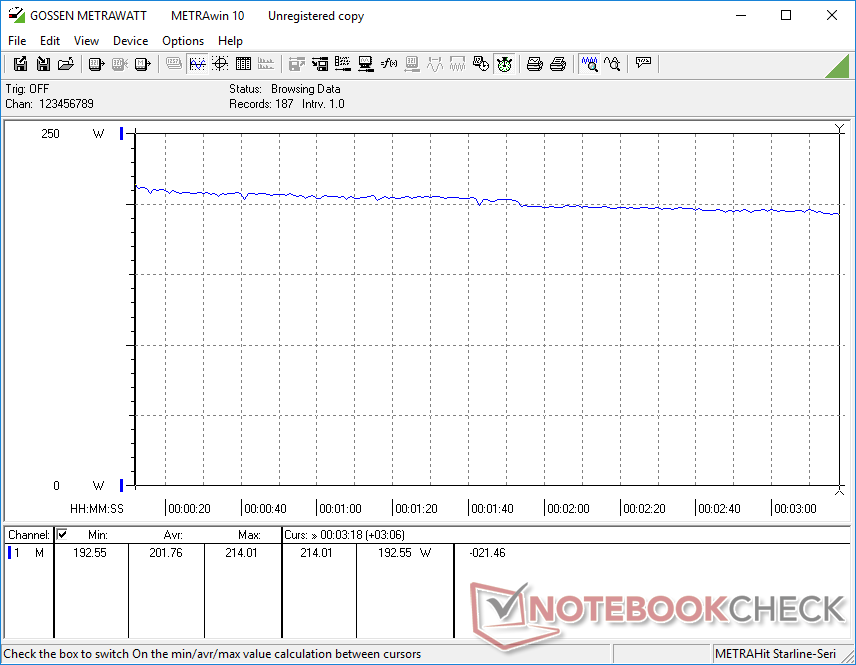
La sostenibilidad del rendimiento es excelente, sin fluctuaciones en las puntuaciones ni en las velocidades de reloj a lo largo del tiempo, como muestra nuestro gráfico de bucle CineBench R15 xT que aparece a continuación. Todas las pruebas se realizaron con el sistema configurado en 'Boost' y 'High' a través de Razer Synapse.
Cinebench R15 Multi Loop
Cinebench R23: Multi Core | Single Core
Cinebench R15: CPU Multi 64Bit | CPU Single 64Bit
Blender: v2.79 BMW27 CPU
7-Zip 18.03: 7z b 4 -mmt1 | 7z b 4
Geekbench 5.5: Single-Core | Multi-Core
HWBOT x265 Benchmark v2.2: 4k Preset
LibreOffice : 20 Documents To PDF
R Benchmark 2.5: Overall mean
* ... más pequeño es mejor
Rendimiento del sistema
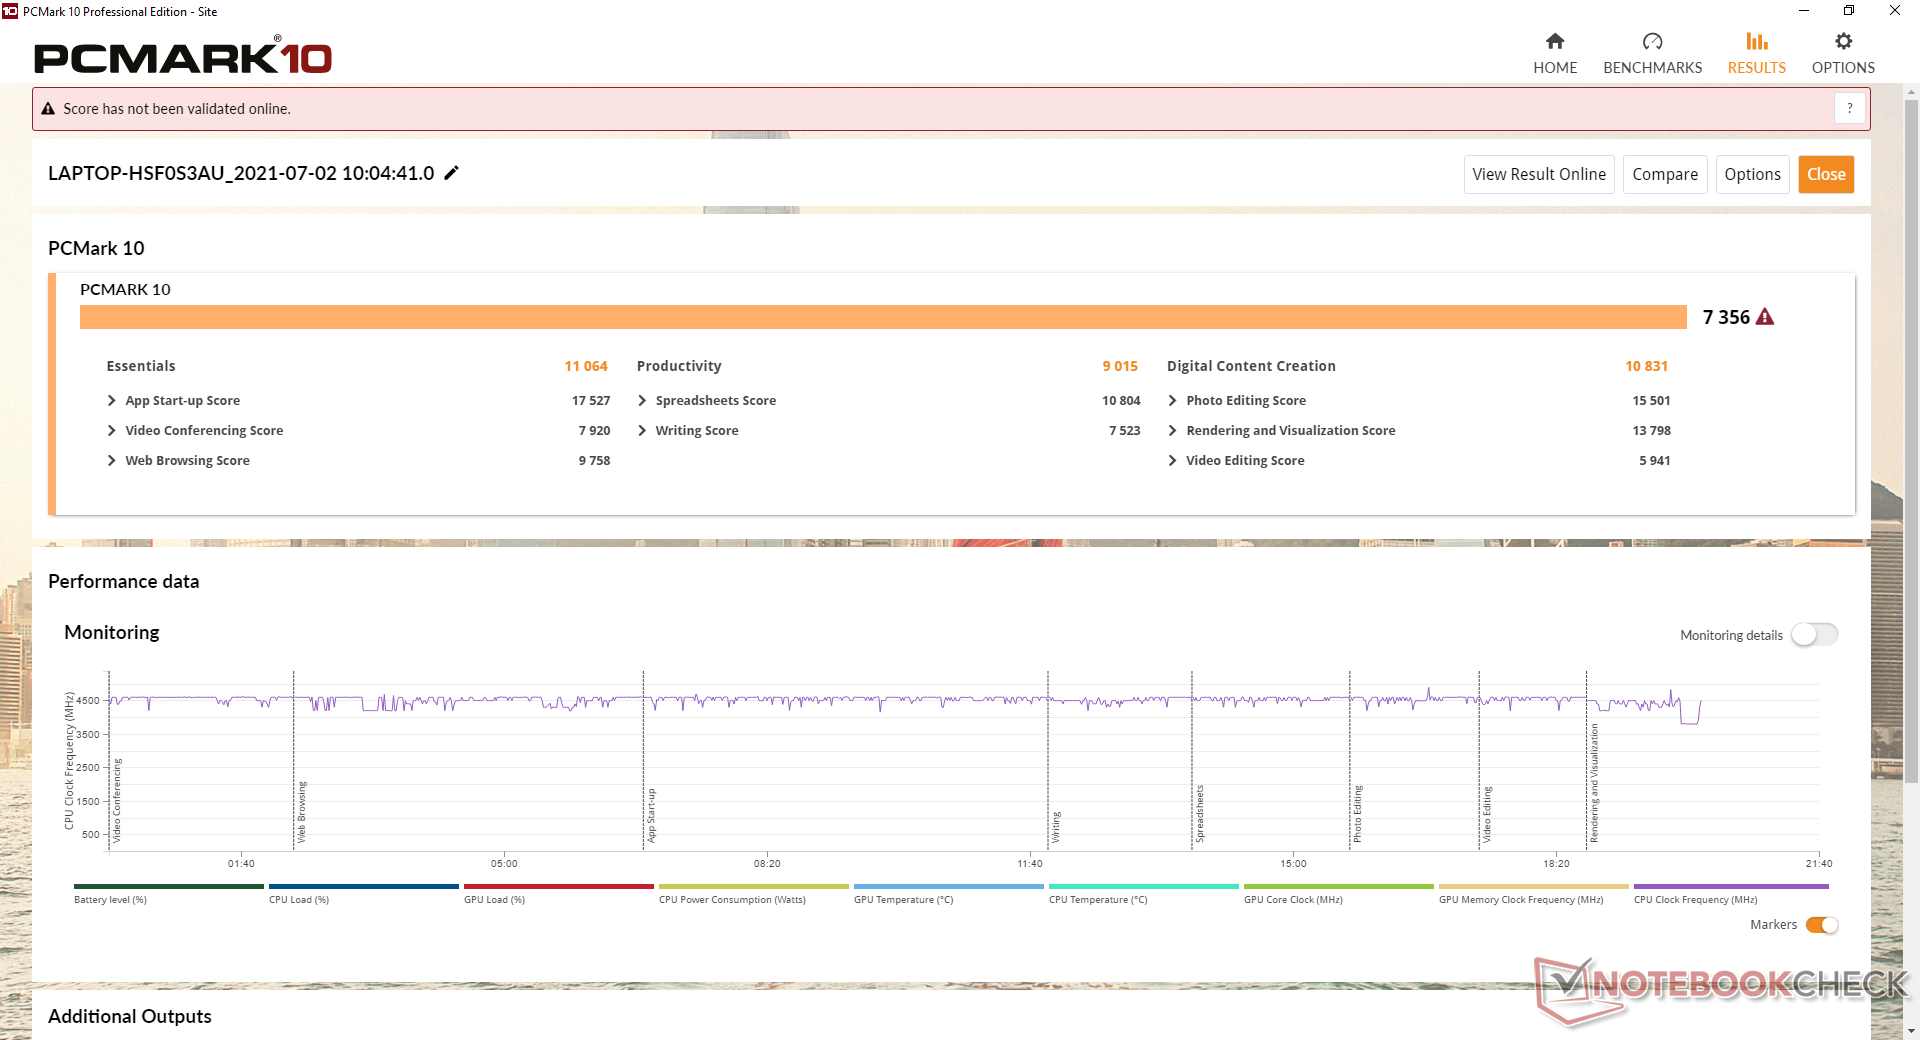
Las puntuaciones de PCMark están constantemente por delante del Blade 15 de 10ª generación por puntos porcentuales de dos dígitos en muchos casos. Sospechamos que el SSD PCIe 4 superrápido juega un papel importante aquí, ya que la prueba tiende a favorecer a los sistemas con un rendimiento de almacenamiento rápido.
| PCMark 10 / Score | |
| Razer Blade 15 Advanced (Mid 2021) | |
| Aorus 15P YD | |
| Medio Intel Core i7-11800H, NVIDIA GeForce RTX 3080 Laptop GPU (6673 - 7470, n=11) | |
| Asus TUF Gaming F15 FX506HM | |
| Alienware m15 R5 Ryzen Edition | |
| Razer Blade 15 Advanced Model Early 2021 | |
| Razer Blade 15 RTX 2080 Super Max-Q | |
| PCMark 10 / Essentials | |
| Razer Blade 15 Advanced (Mid 2021) | |
| Aorus 15P YD | |
| Asus TUF Gaming F15 FX506HM | |
| Medio Intel Core i7-11800H, NVIDIA GeForce RTX 3080 Laptop GPU (9862 - 11064, n=11) | |
| Alienware m15 R5 Ryzen Edition | |
| Razer Blade 15 Advanced Model Early 2021 | |
| Razer Blade 15 RTX 2080 Super Max-Q | |
| PCMark 10 / Productivity | |
| Aorus 15P YD | |
| Medio Intel Core i7-11800H, NVIDIA GeForce RTX 3080 Laptop GPU (8278 - 9803, n=11) | |
| Razer Blade 15 Advanced (Mid 2021) | |
| Alienware m15 R5 Ryzen Edition | |
| Asus TUF Gaming F15 FX506HM | |
| Razer Blade 15 Advanced Model Early 2021 | |
| Razer Blade 15 RTX 2080 Super Max-Q | |
| PCMark 10 / Digital Content Creation | |
| Razer Blade 15 Advanced (Mid 2021) | |
| Medio Intel Core i7-11800H, NVIDIA GeForce RTX 3080 Laptop GPU (9881 - 11323, n=11) | |
| Aorus 15P YD | |
| Asus TUF Gaming F15 FX506HM | |
| Alienware m15 R5 Ryzen Edition | |
| Razer Blade 15 Advanced Model Early 2021 | |
| Razer Blade 15 RTX 2080 Super Max-Q | |
| PCMark 10 Score | 7356 puntos | |
ayuda | ||
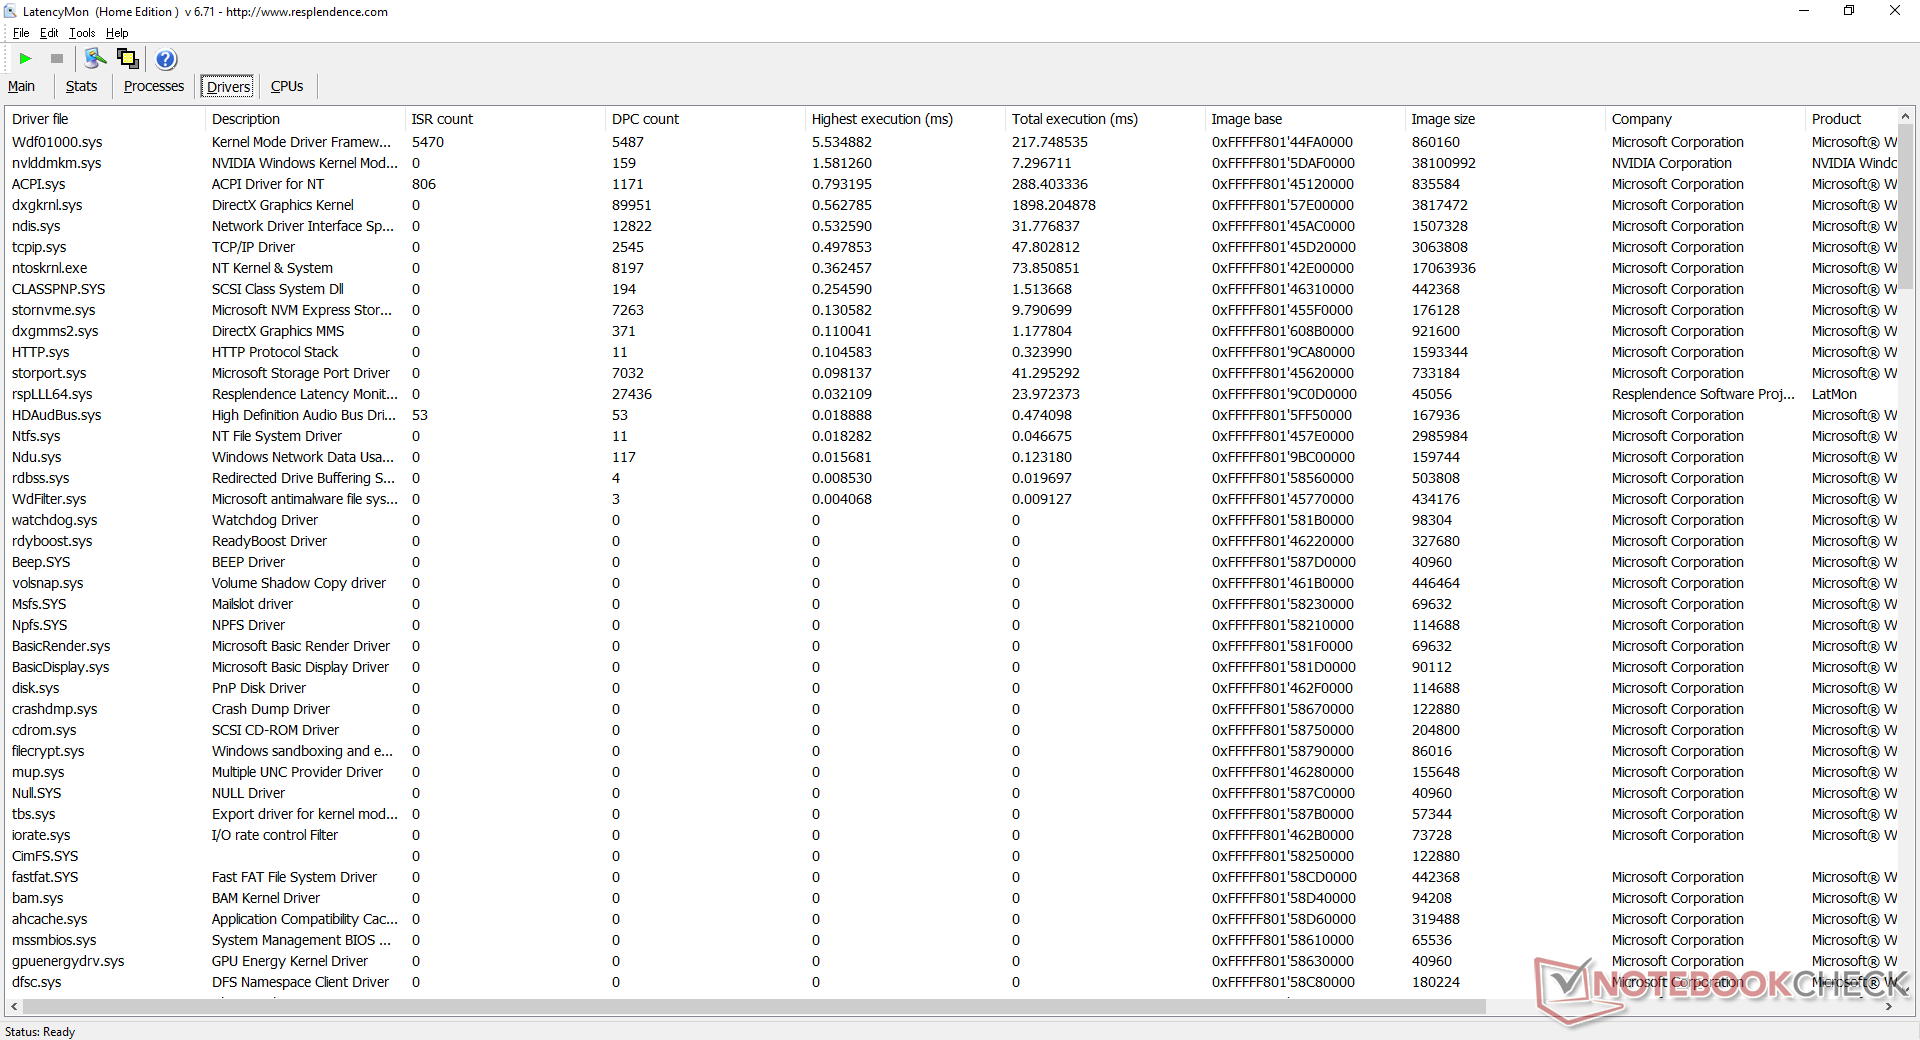
Latencia del CPD
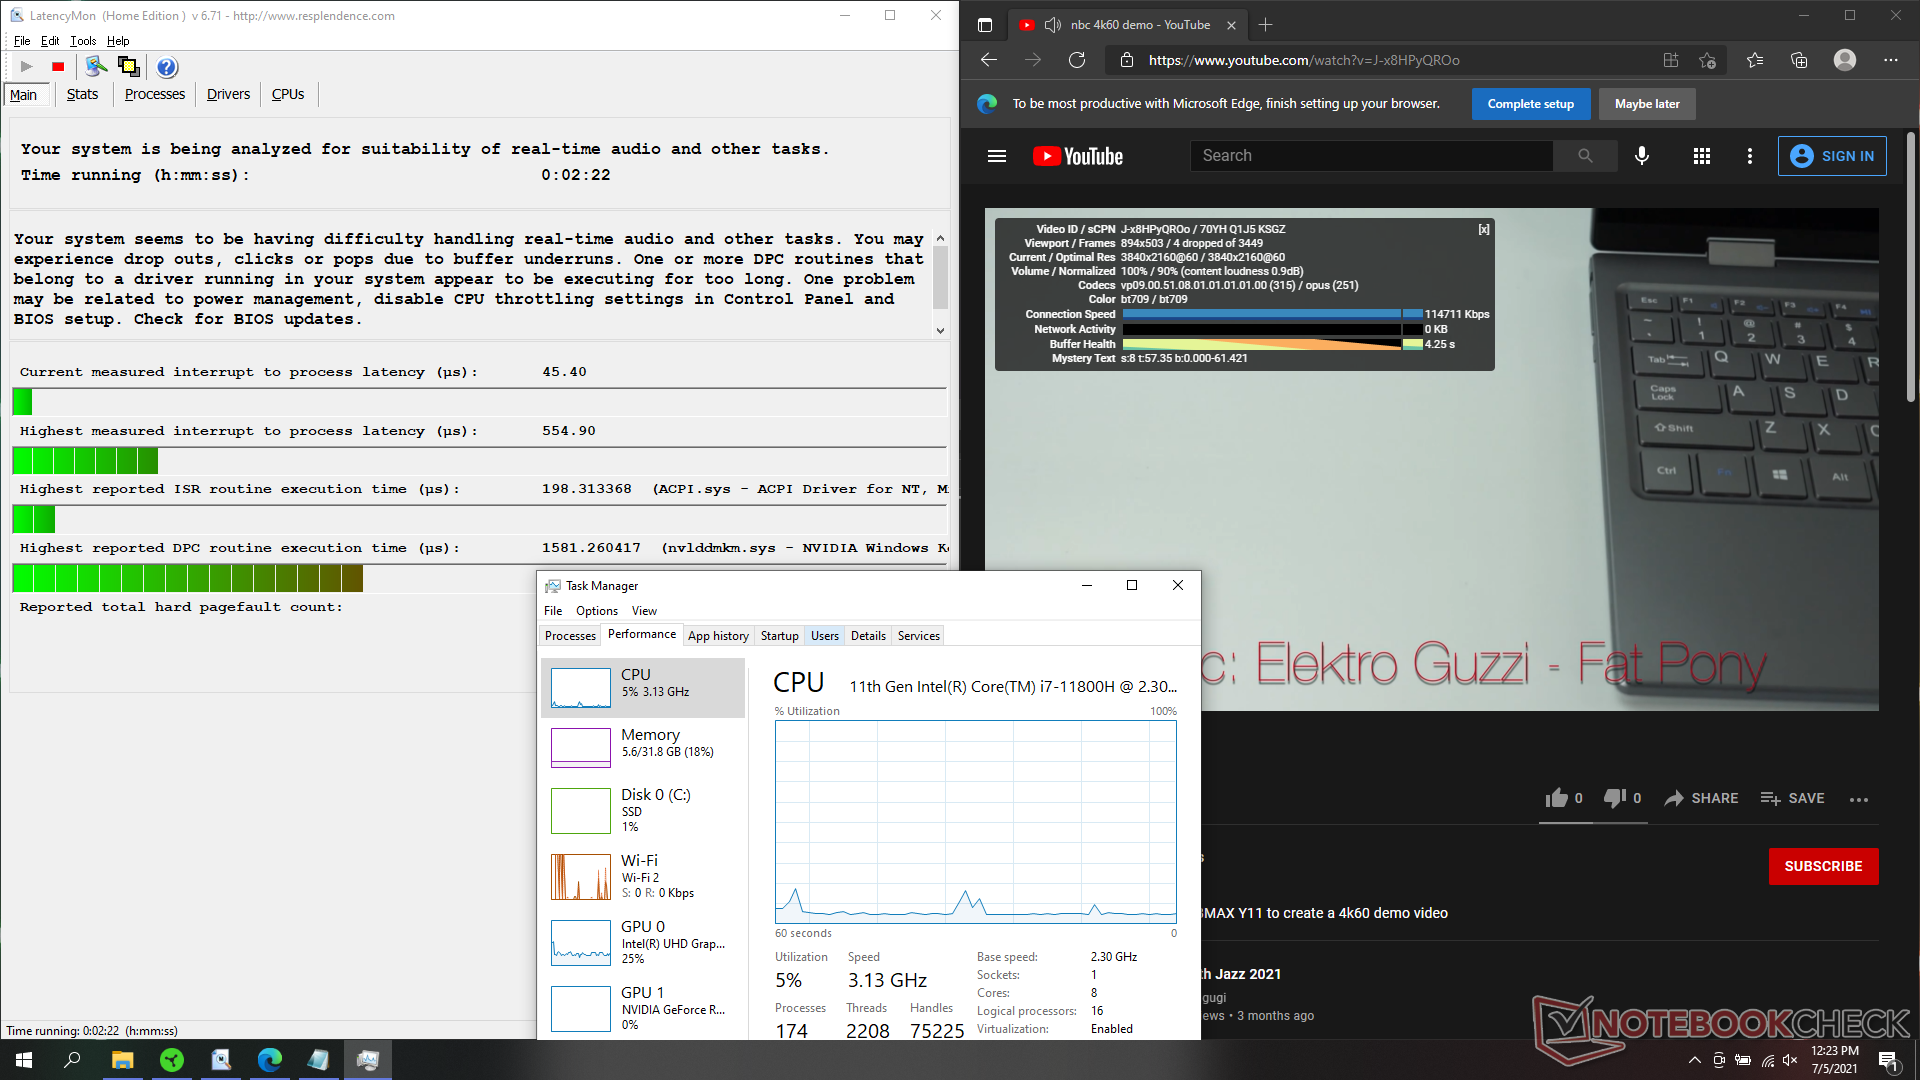
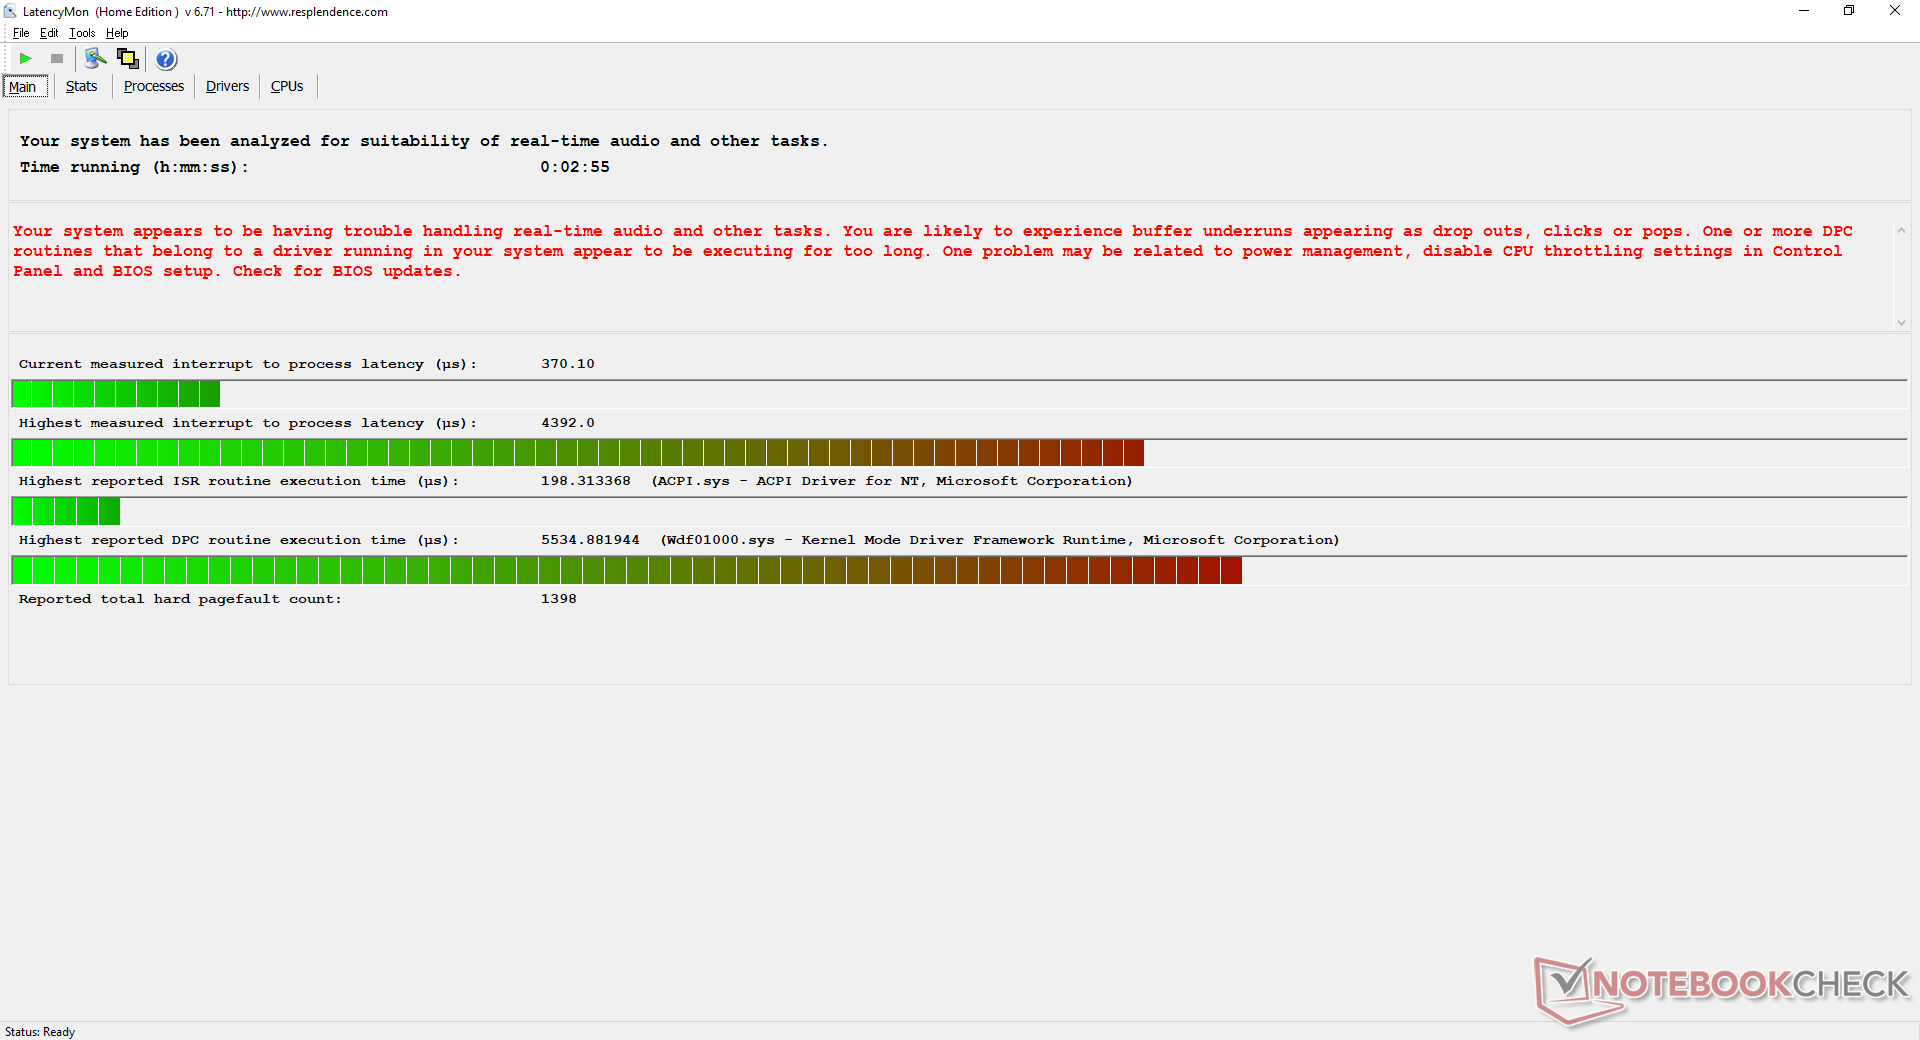
LatencyMon no revela problemas importantes de latencia del CPD cuando se navega por la web o se transmite vídeo a 4K. Sin embargo, una vez que la CPU está muy estresada, la latencia se dispara hasta 4392 μs. Probamos esto dos veces con Prime95 y los resultados son repetibles.
| DPC Latencies / LatencyMon - interrupt to process latency (max), Web, Youtube, Prime95 | |
| Razer Blade 15 Advanced (Mid 2021) | |
| Asus TUF Gaming F15 FX506HM | |
| Razer Blade 15 RTX 2080 Super Max-Q | |
| Aorus 15P YD | |
| Razer Blade 15 Advanced Model Early 2021 | |
| Alienware m15 R5 Ryzen Edition | |
* ... más pequeño es mejor
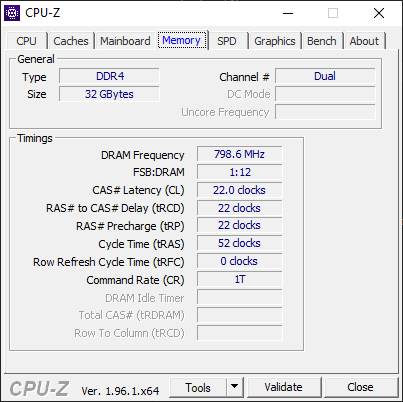
Dispositivos de almacenamiento
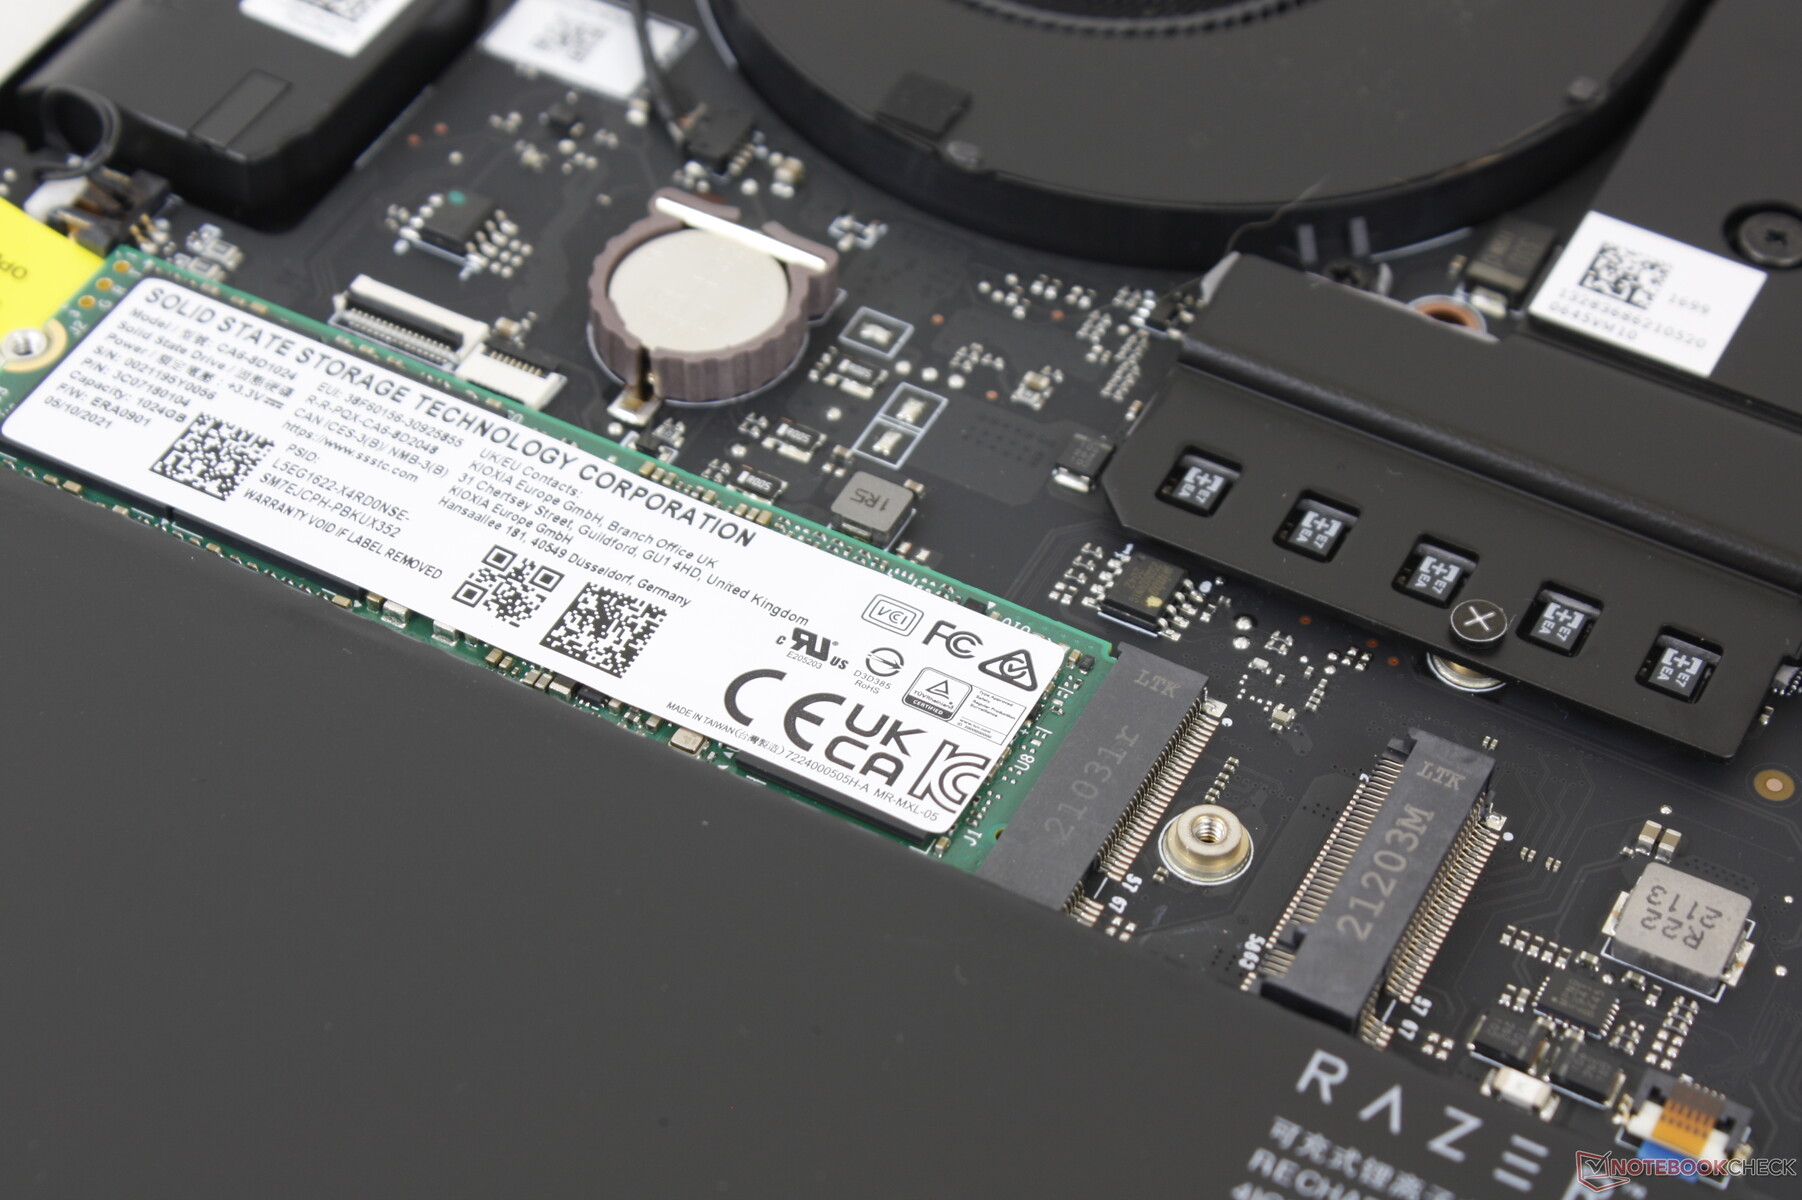
Un importante factor diferenciador que separa al Blade 15 de 11ª generación de todos los modelos anteriores es su soporte para los rápidos SSDs PCIe 4 NVMe. De hecho, las tasas de lectura y escritura secuencial se acercan a 6800+ MB/s y 4800 MB/s, respectivamente, comparado con "sólo" 3200 MB/s y 3000 MB/s en el Blade 15 de 10ª generación con su Samsung PM981a.
Curiosamente, el SSD PCIe 4 aquí viene de SSSTC en lugar de Samsung o Lite-On. Casi todos los demás portátiles Blade vienen con SSDs Samsung y Lite-On, por lo que fue inesperado ver esto en nuestra unidad de prueba. El SSD Samsung PM9A1 PCIe 4 NVMe parece ser ligeramente más rápido que nuestra solución SSSTC
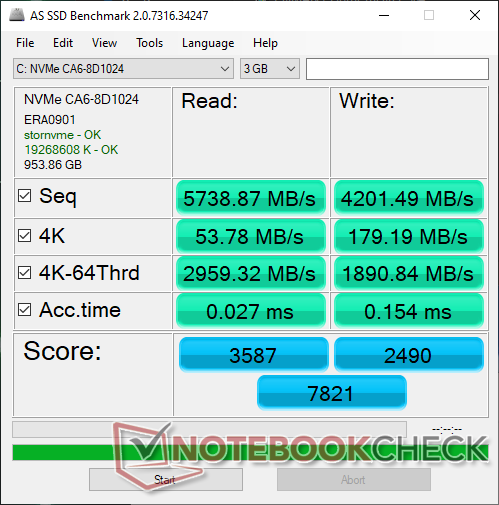
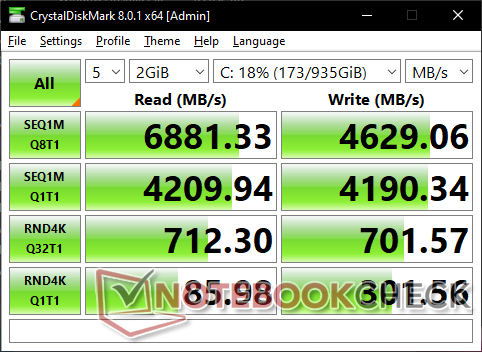
| Razer Blade 15 Advanced (Mid 2021) SSSTC CA6-8D1024 | Razer Blade 15 Advanced Model Early 2021 Samsung PM981a MZVLB1T0HBLR | Asus TUF Gaming F15 FX506HM SK Hynix HFM001TD3JX013N | Alienware m15 R5 Ryzen Edition Toshiba KBG40ZNS512G NVMe | Aorus 15P YD Samsung PM9A1 MZVL21T0HCLR | |
|---|---|---|---|---|---|
| AS SSD | -30% | -27% | -69% | 13% | |
| Seq Read (MB/s) | 5739 | 2112 -63% | 2873 -50% | 2082 -64% | 5376 -6% |
| Seq Write (MB/s) | 4201 | 2024 -52% | 1619 -61% | 825 -80% | 3669 -13% |
| 4K Read (MB/s) | 53.8 | 46.53 -14% | 57.5 7% | 42.41 -21% | 56.5 5% |
| 4K Write (MB/s) | 179.2 | 89.7 -50% | 149.6 -17% | 98.3 -45% | 157.7 -12% |
| 4K-64 Read (MB/s) | 2959 | 1747 -41% | 1252 -58% | 1255 -58% | 2720 -8% |
| 4K-64 Write (MB/s) | 1891 | 1962 4% | 2196 16% | 738 -61% | 3366 78% |
| Access Time Read * (ms) | 0.027 | 0.052 -93% | 0.04 -48% | 0.109 -304% | 0.04 -48% |
| Access Time Write * (ms) | 0.154 | 0.04 74% | 0.082 47% | 0.17 -10% | 0.027 82% |
| Score Read (Points) | 3587 | 2004 -44% | 1597 -55% | 1506 -58% | 3314 -8% |
| Score Write (Points) | 2490 | 2254 -9% | 2508 1% | 918 -63% | 3890 56% |
| Score Total (Points) | 7821 | 5280 -32% | 4869 -38% | 3136 -60% | 8804 13% |
| Copy ISO MB/s (MB/s) | 3027 | 2128 -30% | 1583 -48% | 1391 -54% | |
| Copy Program MB/s (MB/s) | 1177 | 707 -40% | 964 -18% | 645 -45% | |
| Copy Game MB/s (MB/s) | 2170 | 1471 -32% | 943 -57% | 1101 -49% | |
| CrystalDiskMark 5.2 / 6 | -46% | -40% | -54% | 0% | |
| Write 4K (MB/s) | 295.6 | 138 -53% | 168.1 -43% | 116.9 -60% | 230.4 -22% |
| Read 4K (MB/s) | 85.7 | 47.41 -45% | 65.1 -24% | 44.56 -48% | 91.8 7% |
| Write Seq (MB/s) | 4149 | 1922 -54% | 2124 -49% | 1552 -63% | 4301 4% |
| Read Seq (MB/s) | 4203 | 1673 -60% | 2204 -48% | 1682 -60% | 4474 6% |
| Write 4K Q32T1 (MB/s) | 715 | 445.5 -38% | 455.3 -36% | 497.8 -30% | 656 -8% |
| Read 4K Q32T1 (MB/s) | 709 | 534 -25% | 465.6 -34% | 436.8 -38% | 722 2% |
| Write Seq Q32T1 (MB/s) | 4681 | 2976 -36% | 2911 -38% | 1461 -69% | 5198 11% |
| Read Seq Q32T1 (MB/s) | 6905 | 3232 -53% | 3519 -49% | 2364 -66% | 7065 2% |
| Media total (Programa/Opciones) | -38% /
-36% | -34% /
-32% | -62% /
-64% | 7% /
7% |
* ... más pequeño es mejor

Disk Throttling: DiskSpd Read Loop, Queue Depth 8
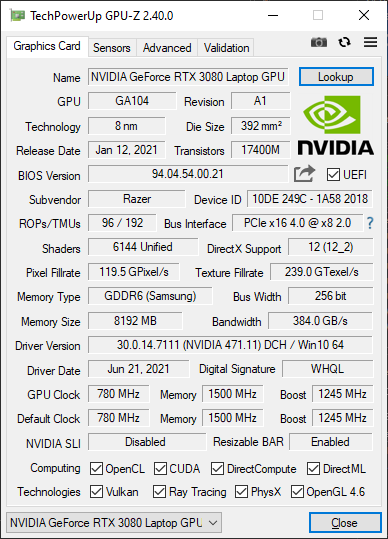
Rendimiento de la GPU
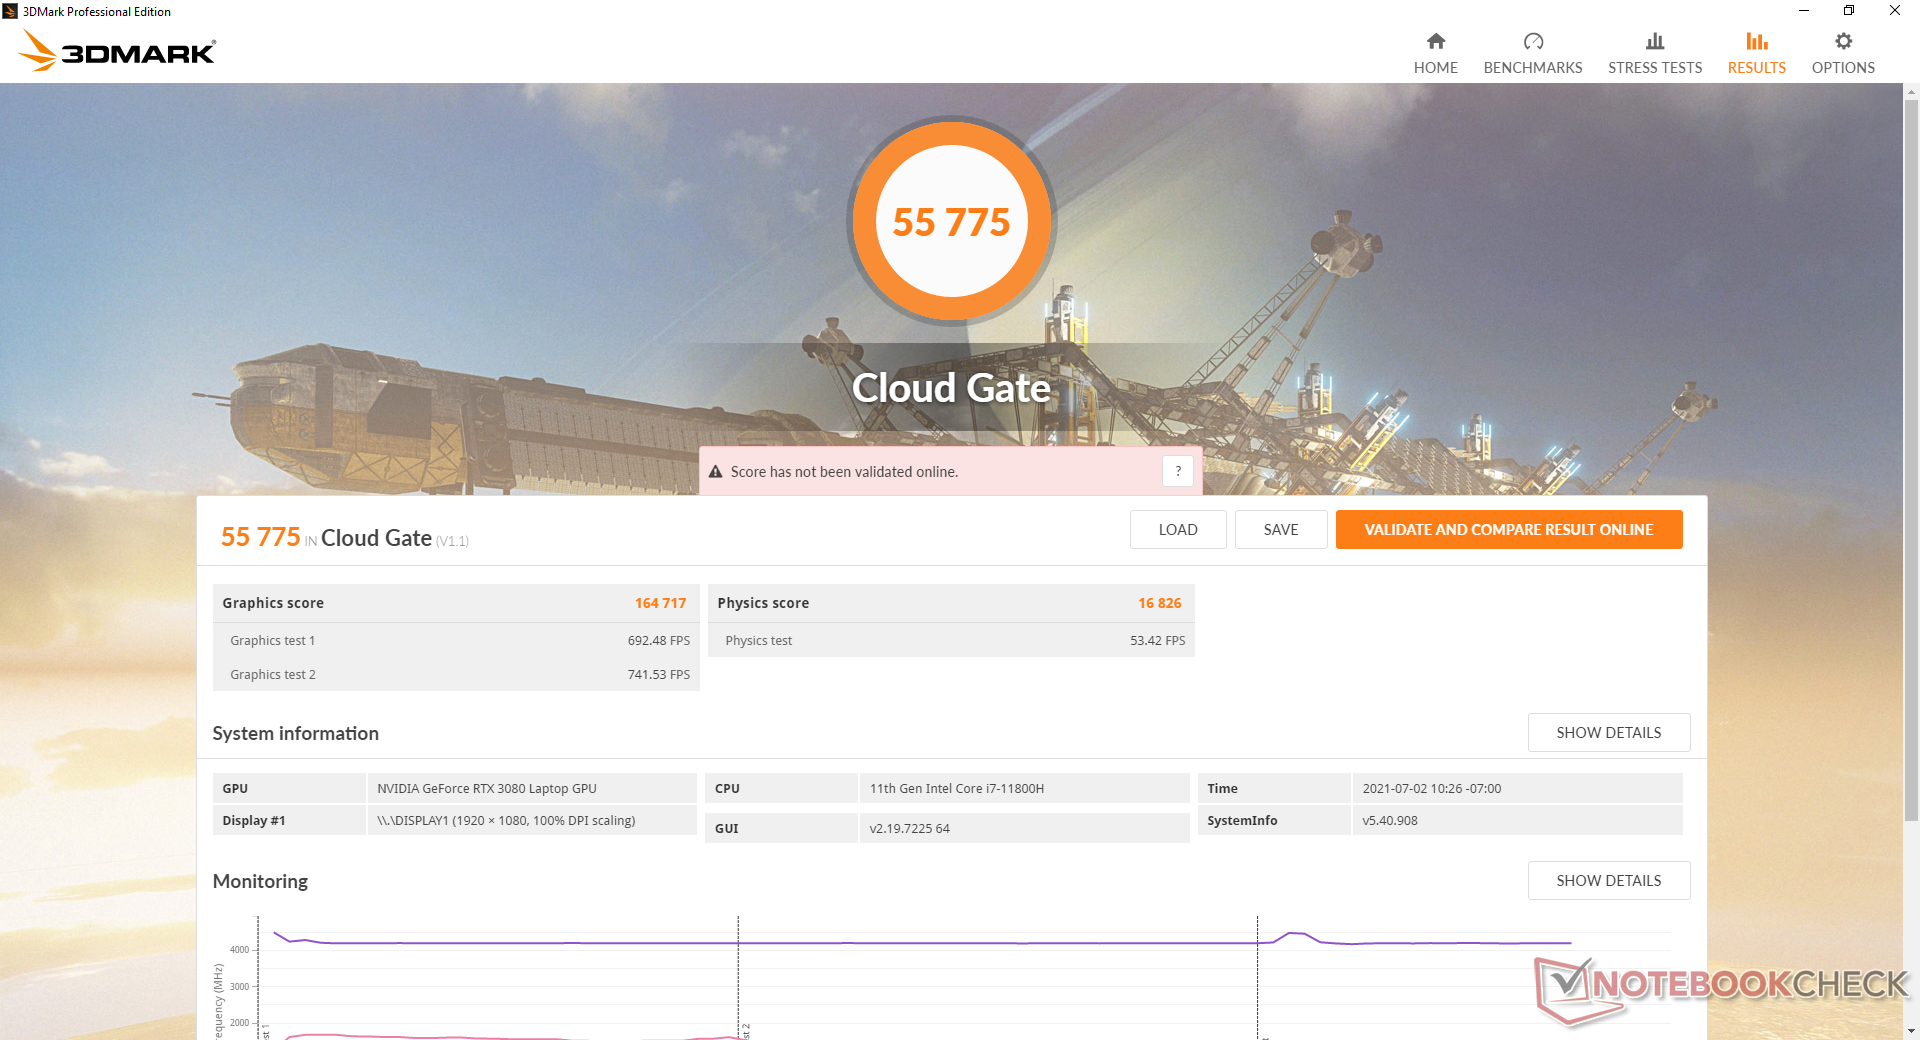
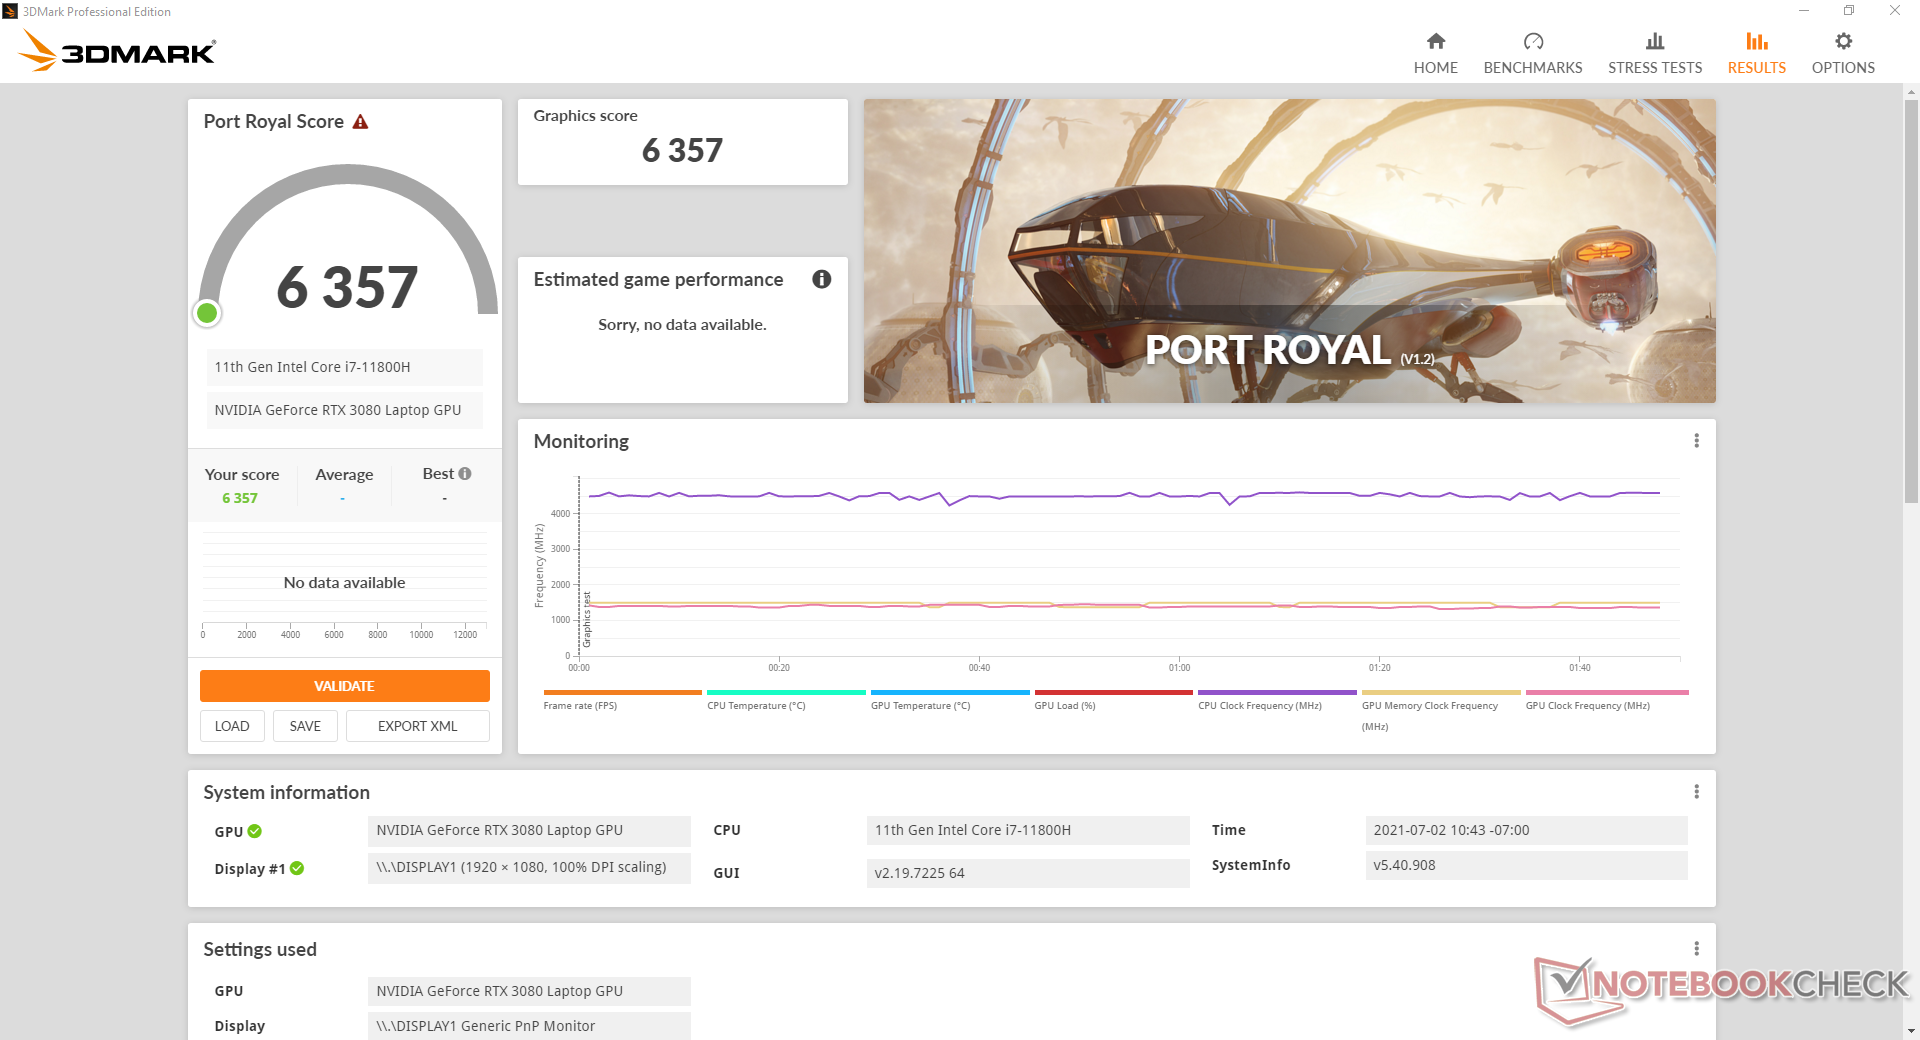
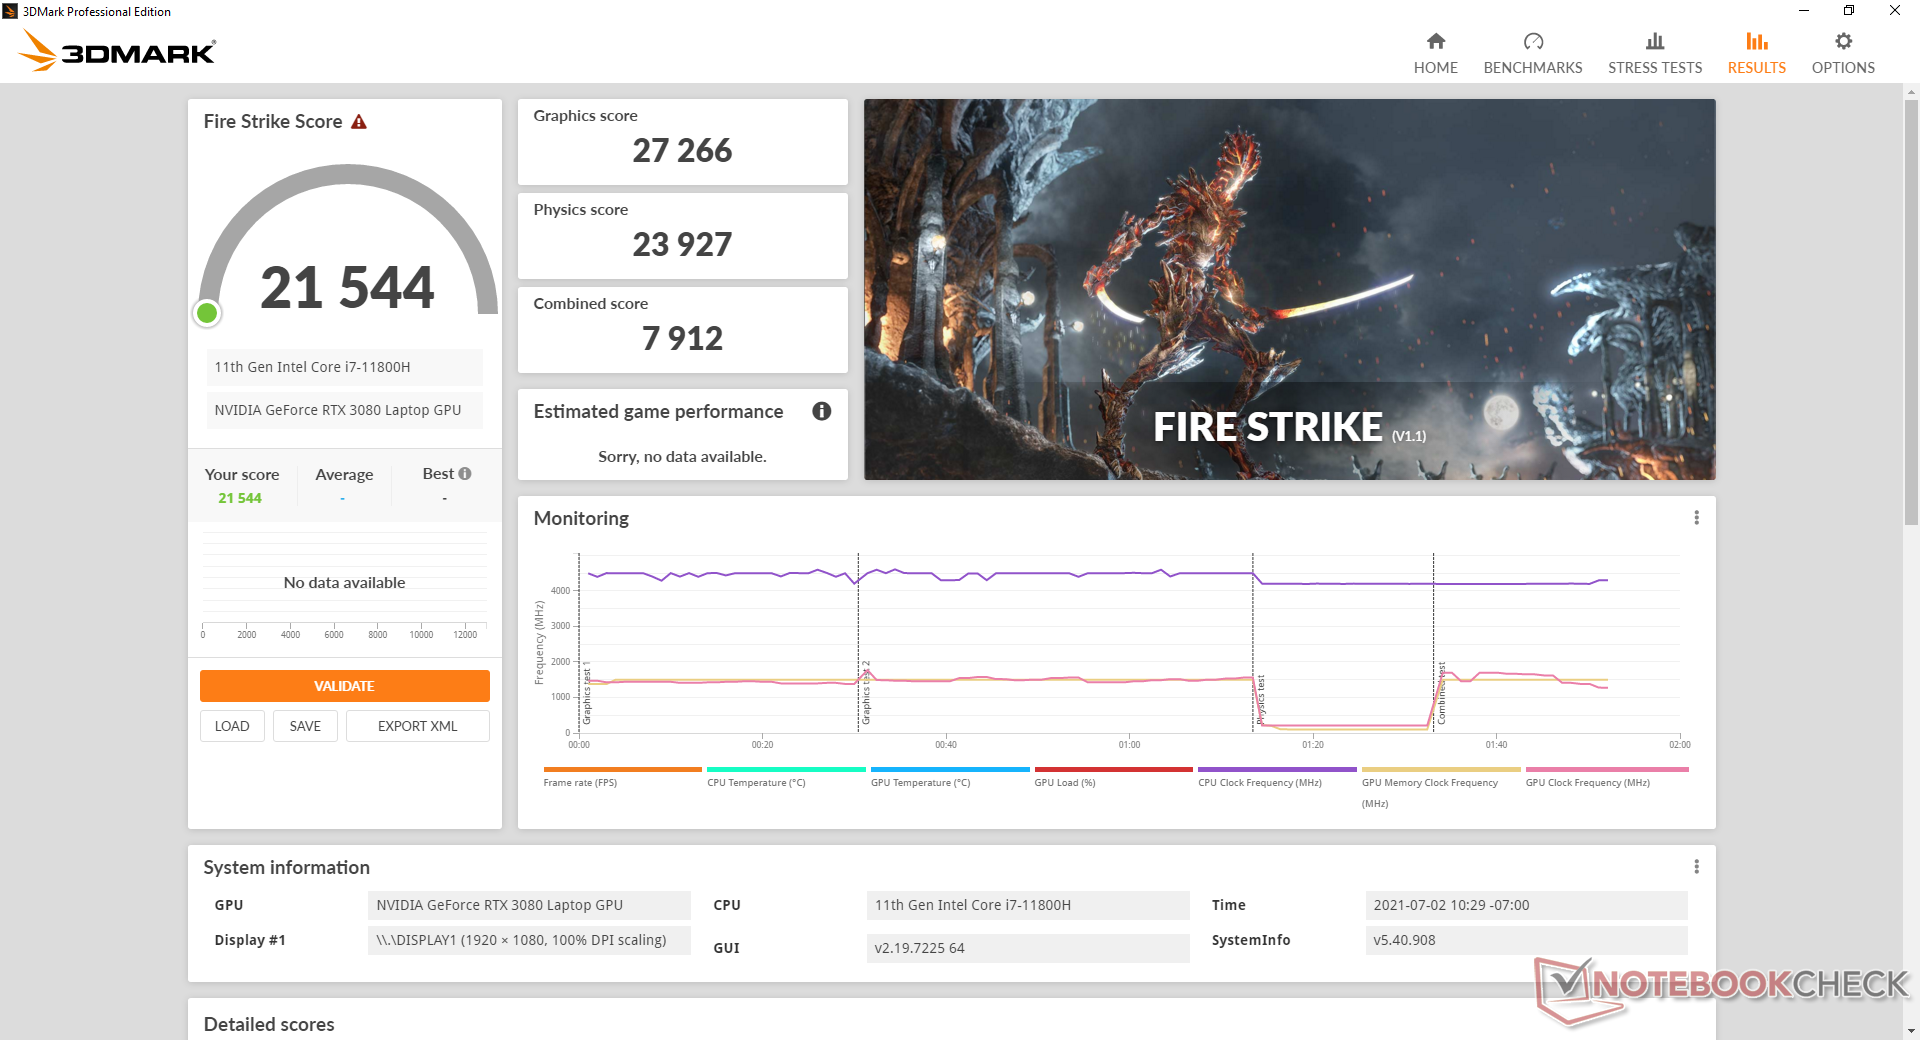
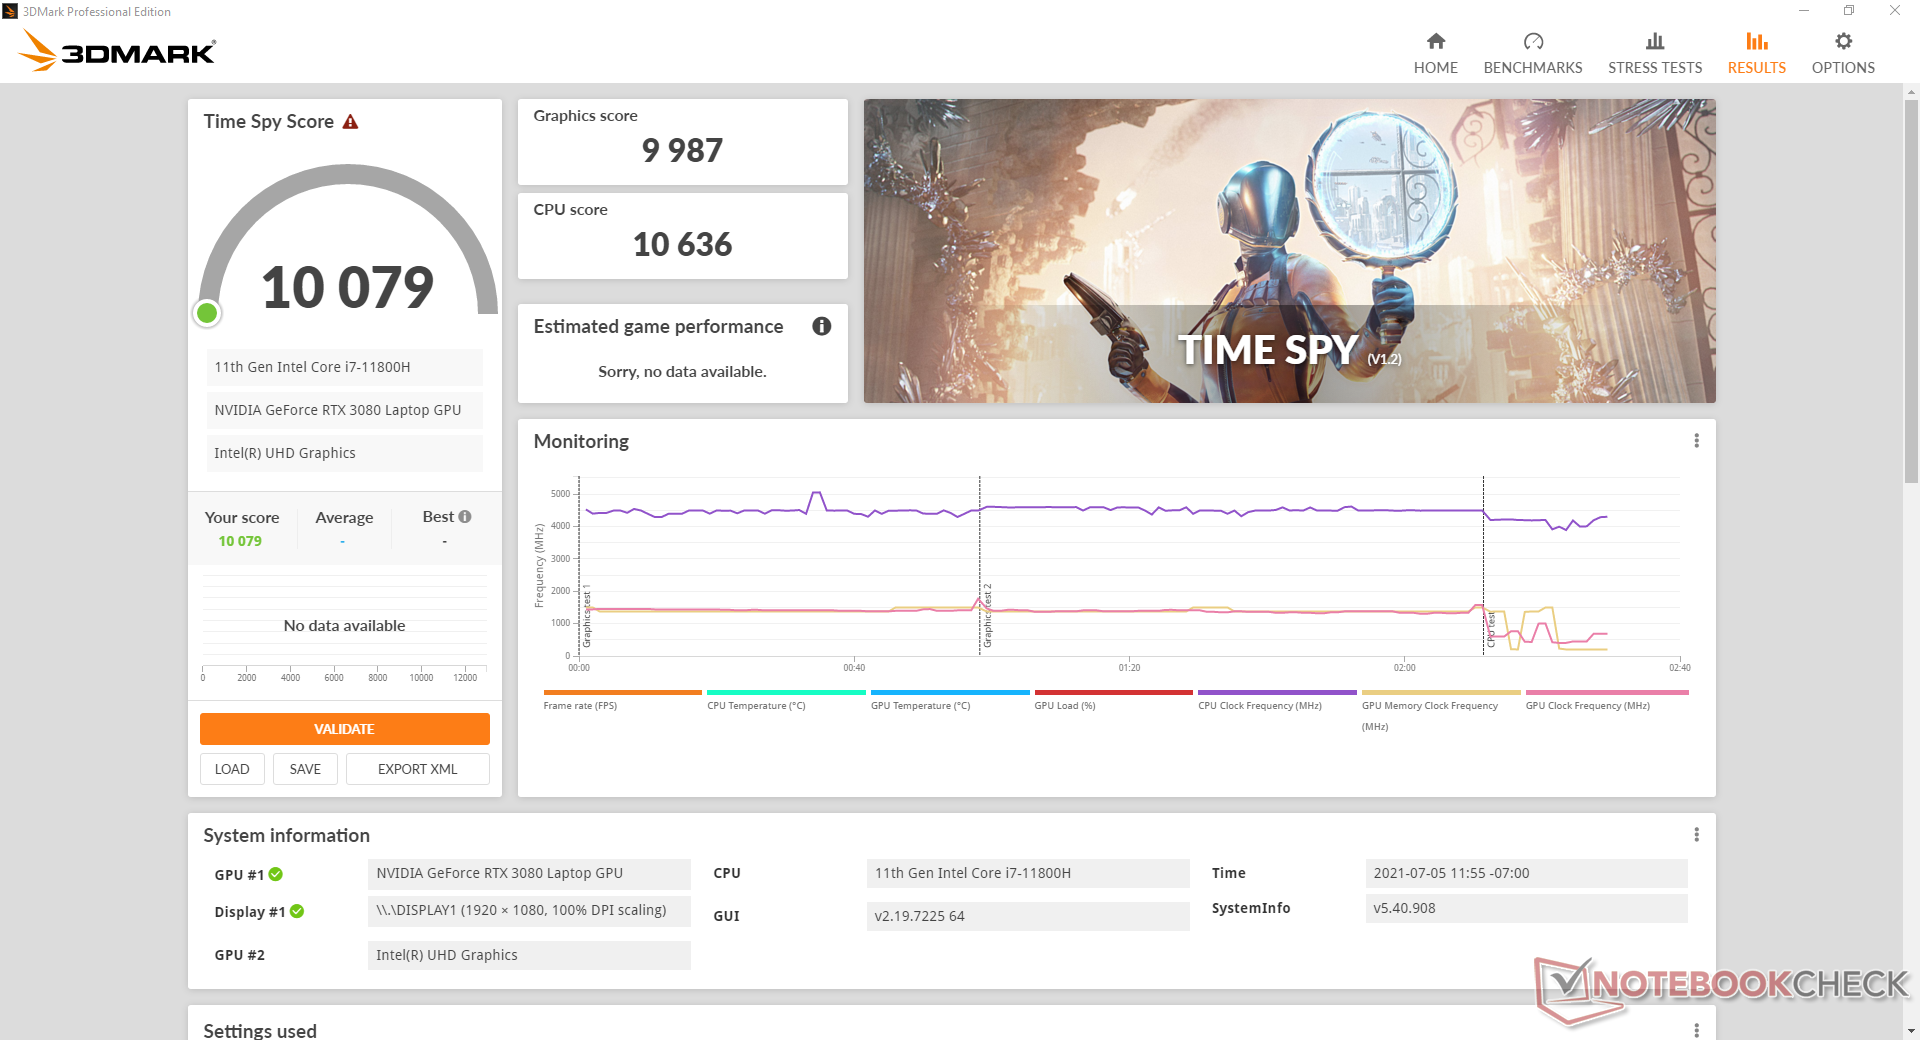
Las puntuaciones en 3DMark son entre un 9 y un 14 por ciento más altas que en el Intel Blade 15 de 10ª generación con exactamente la misma GPU Nvidia (aunque con un TGP inferior). Por tanto, los usuarios que busquen un Blade 15 pueden considerar este último modelo de 11ª generación en lugar del de 10ª generación por la pequeña mejora gráfica. Portátiles más grandes con la misma RTX 3080 como el MSI GE76 11UH pueden correr incluso más rápido que nuestro Razer ya que son capaces de techos TGP más altos.
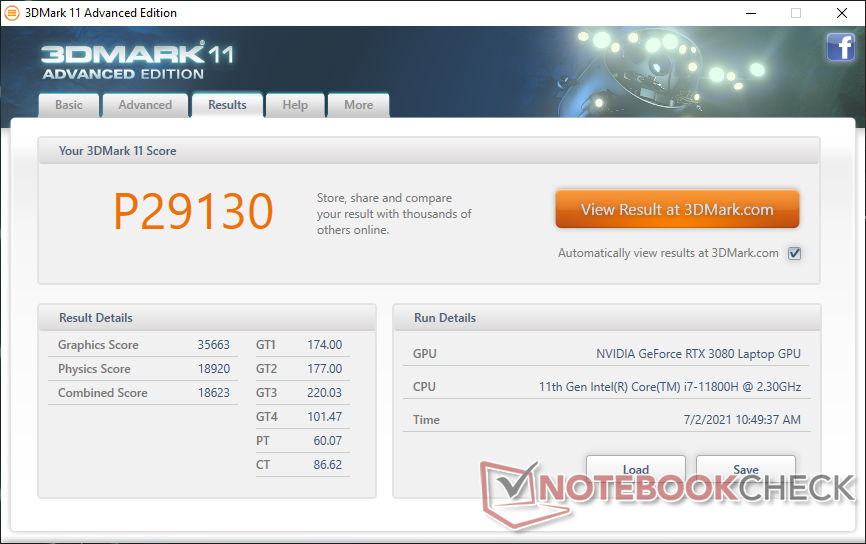
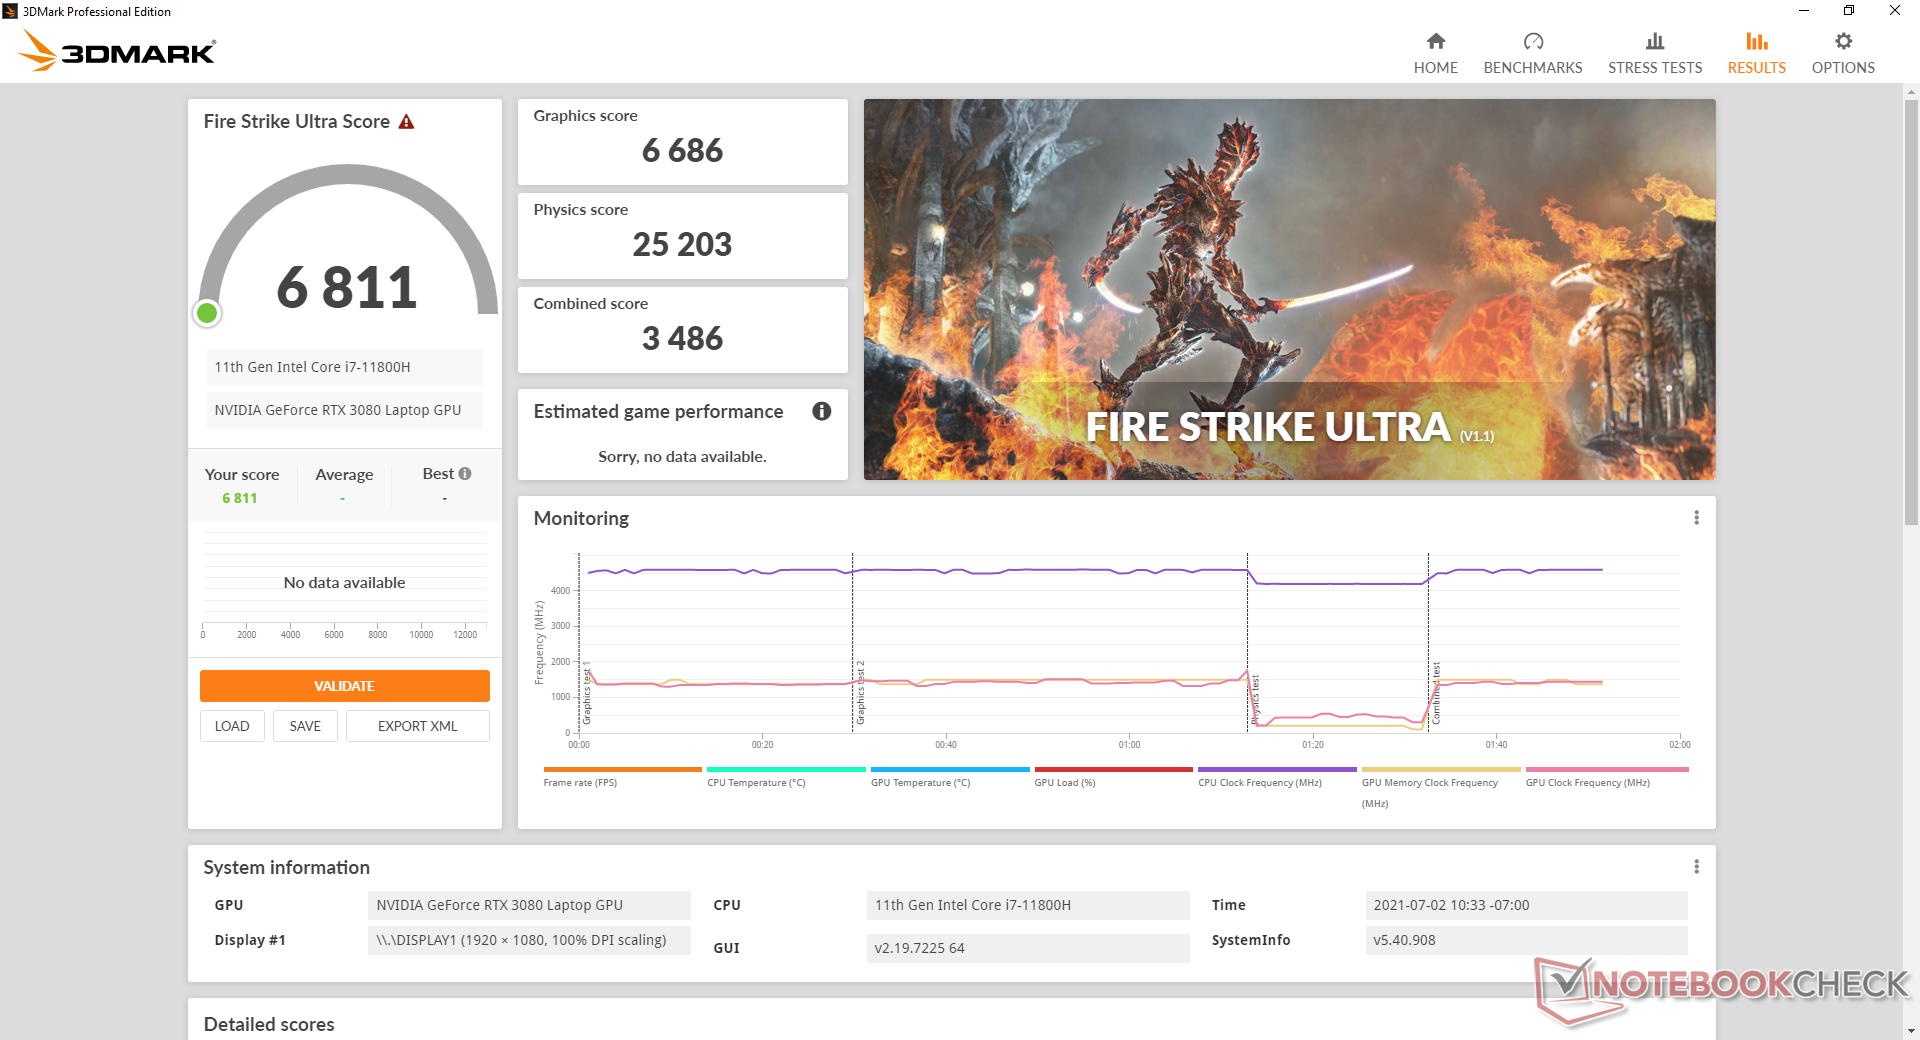
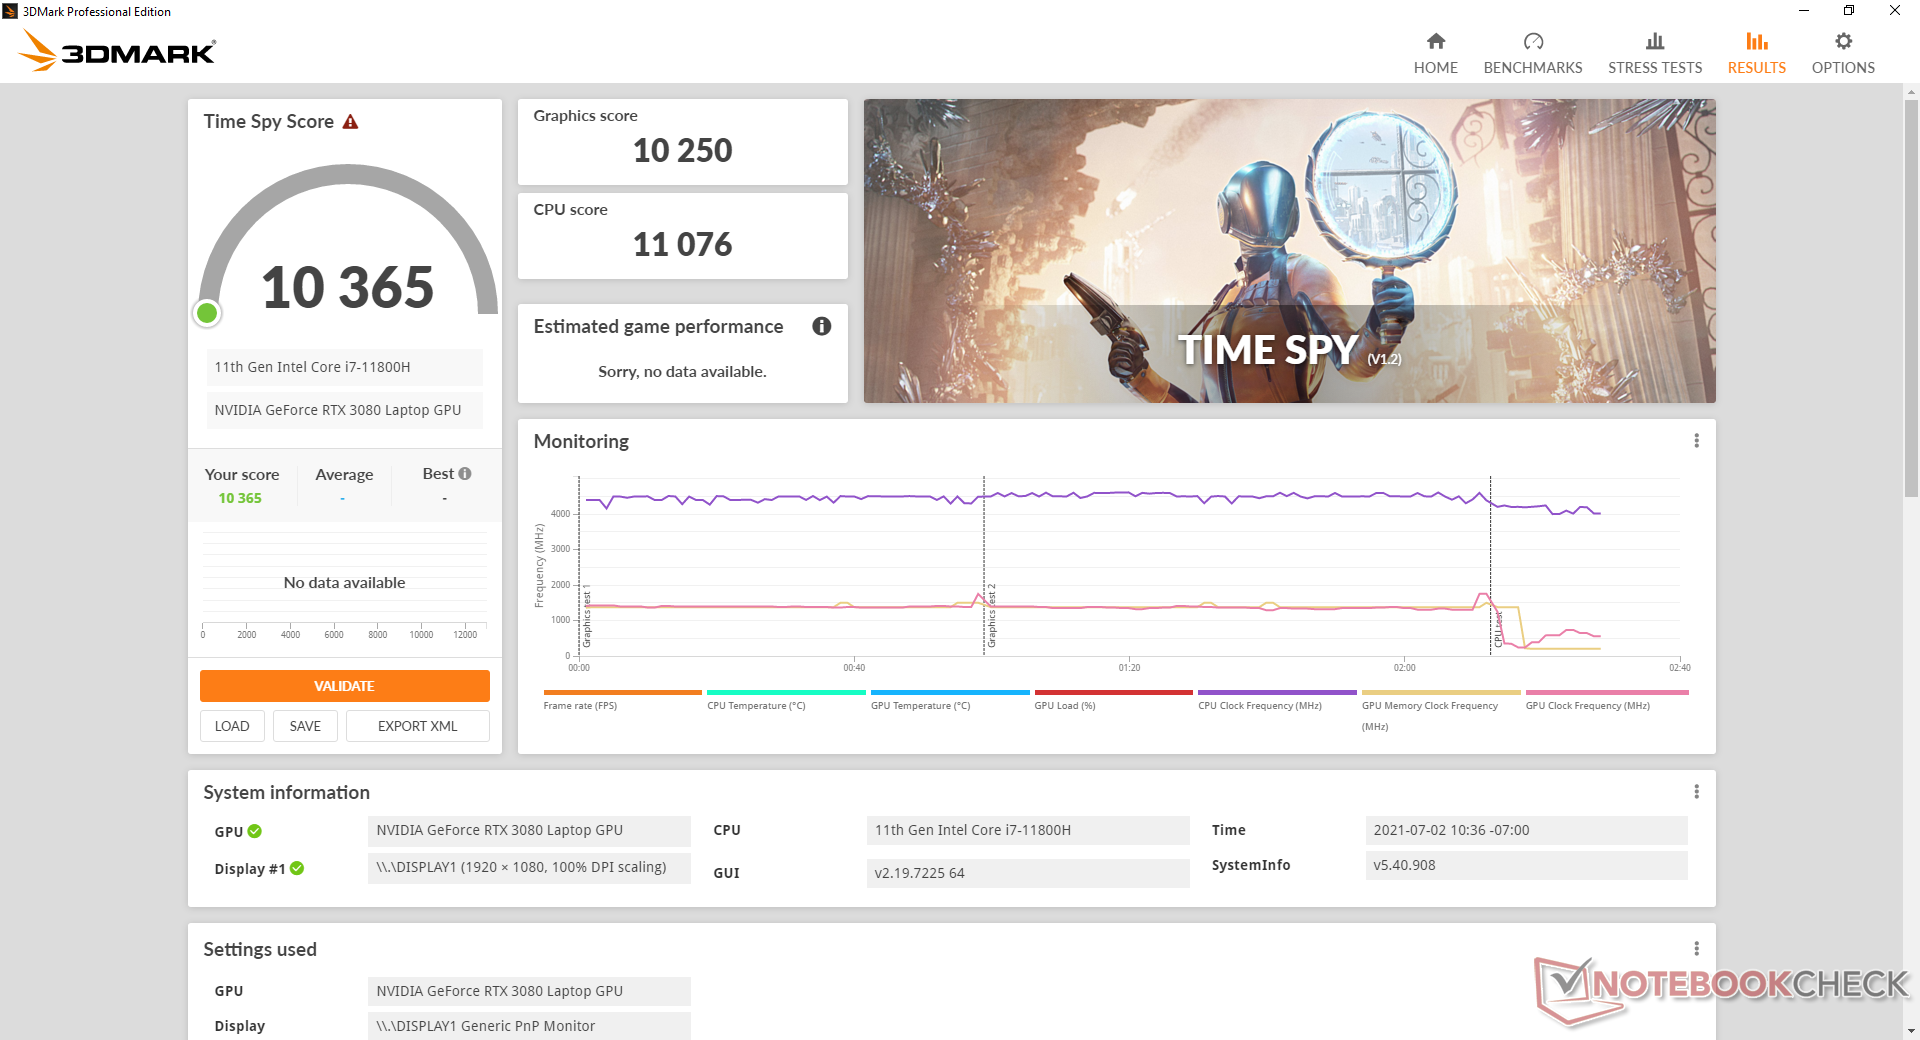
| 3DMark 11 Performance | 29130 puntos | |
| 3DMark Cloud Gate Standard Score | 55775 puntos | |
| 3DMark Fire Strike Score | 21544 puntos | |
| 3DMark Time Spy Score | 10365 puntos | |
ayuda | ||
Rendimiento de los juegos
El rendimiento en los juegos del mundo real es idéntico al del Intel Blade 15 de 10ª generación en el peor de los casos y hasta un 30% más rápido en el mejor de los casos, según nuestros juegos probados. Los usuarios verán los mayores beneficios cuando ejecuten juegos poco exigentes a resoluciones o ajustes más bajos en los que el rendimiento tiende a estar ligado a la CPU, como en DOTA 2 o X-Plane. Los juegos más exigentes, como Assassin's Creed Valhalla, sólo verán aumentos menores.
Consulta nuestra página dedicada a la GeForce RTX 3080 para móviles para obtener más información técnica y pruebas de rendimiento.
Witcher 3 FPS Chart
| bajo | medio | alto | ultra | |
|---|---|---|---|---|
| GTA V (2015) | 186 | 180 | 175 | 110 |
| The Witcher 3 (2015) | 465.4 | 317.3 | 197.3 | 102.8 |
| Dota 2 Reborn (2015) | 174 | 157 | 151 | 142 |
| Final Fantasy XV Benchmark (2018) | 199 | 130 | 97.1 | |
| X-Plane 11.11 (2018) | 138 | 123 | 97.3 | |
| Strange Brigade (2018) | 507 | 253 | 204 | 179 |
| Shadow of the Tomb Raider (2018) | 146 | 127 | 124 | 115 |
| Assassin´s Creed Valhalla (2020) | 134 | 93 | 79 | 68 |
Emissions
Ruido del sistema
El comportamiento del ruido del ventilador es en gran medida el mismo que descubrimos en el Intel Blade 15 de 10ª generación. Los usuarios pueden querer poner los ventiladores en modo automático con Optimus activo o de lo contrario pulsarán con más frecuencia al navegar por la web o hacer streaming de vídeo. Los ventiladores suelen estar en reposo cuando el sistema está en su configuración de rendimiento más baja, pero un ruido de unos 29 a 31 dB(A) será más realista durante el uso real.
Las cargas de juego aumentarán el ruido de los ventiladores hasta el rango de 46 a 52 dB(A), que en realidad es ligeramente más fuerte que lo que registramos en el modelo Intel de 10ª generación. Es ciertamente un portátil ruidoso, pero no es significativamente diferente de otros portátiles de juego de su clase de tamaño.
Nuestra unidad sufre de un ligero ruido electrónico o silbido de bobina. Pudimos captar un ruido agudo audible de 25,3 dB(A) contra un fondo silencioso de 25,1 dB(A) simplemente en ralentí en el escritorio.
| Razer Blade 15 Advanced (Mid 2021) GeForce RTX 3080 Laptop GPU, i7-11800H, SSSTC CA6-8D1024 | Razer Blade 15 Advanced Model Early 2021 GeForce RTX 3080 Laptop GPU, i7-10875H, Samsung PM981a MZVLB1T0HBLR | Razer Blade 15 RTX 2080 Super Max-Q GeForce RTX 2080 Super Max-Q, i7-10875H, Samsung PM981a MZVLB1T0HBLR | Asus TUF Gaming F15 FX506HM GeForce RTX 3060 Laptop GPU, i7-11800H, SK Hynix HFM001TD3JX013N | Alienware m15 R5 Ryzen Edition GeForce RTX 3060 Laptop GPU, R7 5800H, Toshiba KBG40ZNS512G NVMe | Aorus 15P YD GeForce RTX 3080 Laptop GPU, i7-11800H, Samsung PM9A1 MZVL21T0HCLR | |
|---|---|---|---|---|---|---|
| Noise | -8% | -12% | 7% | -5% | -11% | |
| apagado / medio ambiente * (dB) | 25.1 | 24 4% | 30.1 -20% | 24.8 1% | 24 4% | 25 -0% |
| Idle Minimum * (dB) | 25.3 | 26 -3% | 30.1 -19% | 24.6 3% | 24 5% | 26 -3% |
| Idle Average * (dB) | 25.3 | 28 -11% | 30.1 -19% | 24.9 2% | 25 1% | 30 -19% |
| Idle Maximum * (dB) | 25.3 | 40 -58% | 30.1 -19% | 24.9 2% | 35 -38% | 34 -34% |
| Load Average * (dB) | 42 | 45 -7% | 46.8 -11% | 27.1 35% | 44 -5% | 43 -2% |
| Witcher 3 ultra * (dB) | 45.6 | 43 6% | 48.4 -6% | 46.4 -2% | 48 -5% | 50 -10% |
| Load Maximum * (dB) | 51.6 | 45 13% | 46 11% | 49 5% | 50 3% | 57 -10% |
* ... más pequeño es mejor
Ruido
| Ocioso |
| 25.3 / 25.3 / 25.3 dB(A) |
| Carga |
| 42 / 51.6 dB(A) |
 | ||
30 dB silencioso 40 dB(A) audible 50 dB(A) ruidosamente alto |
||
min: | ||
Temperatura
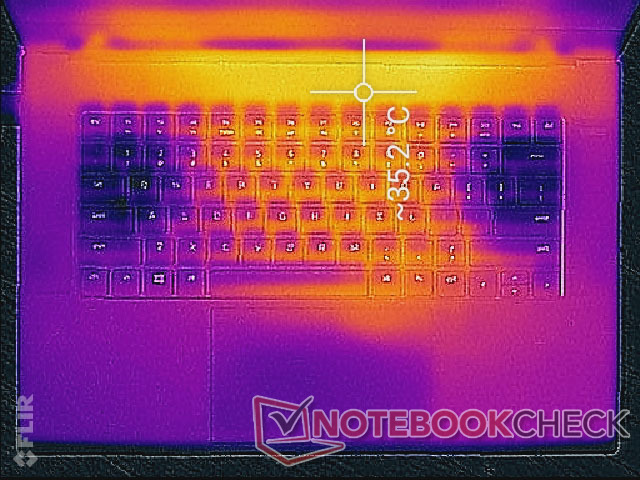
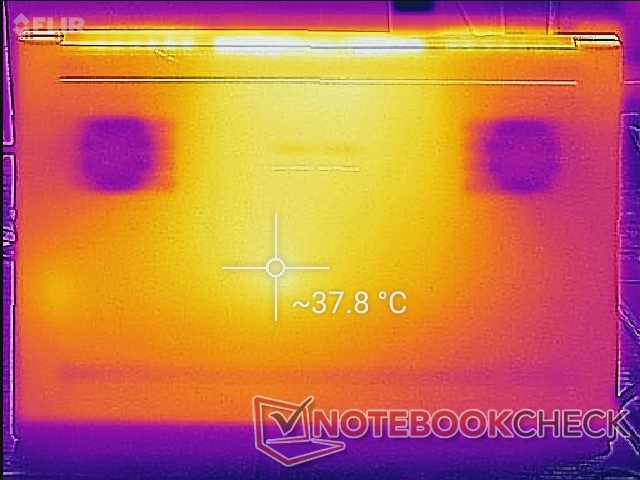
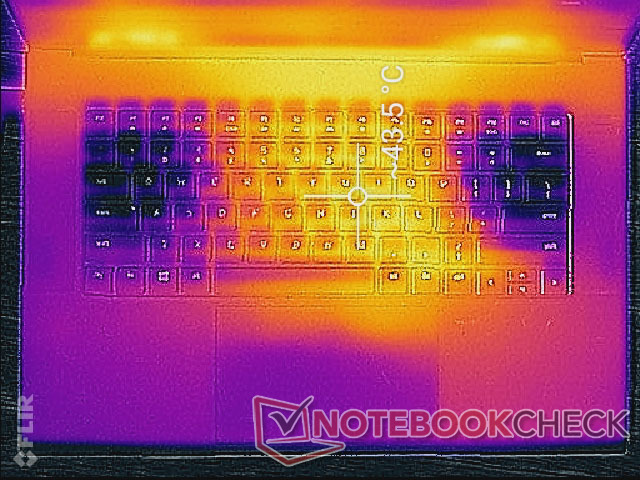
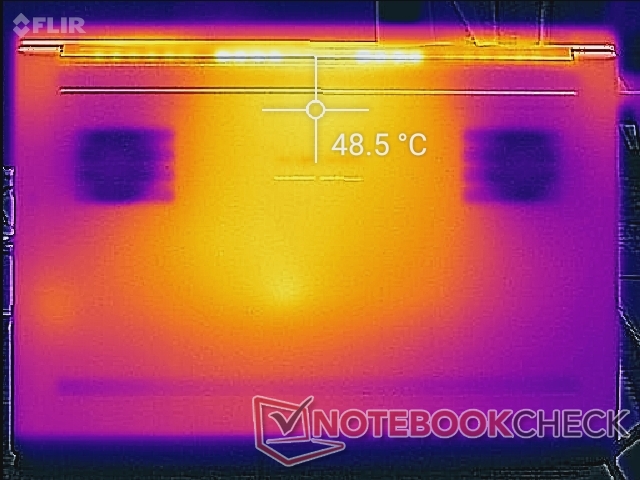
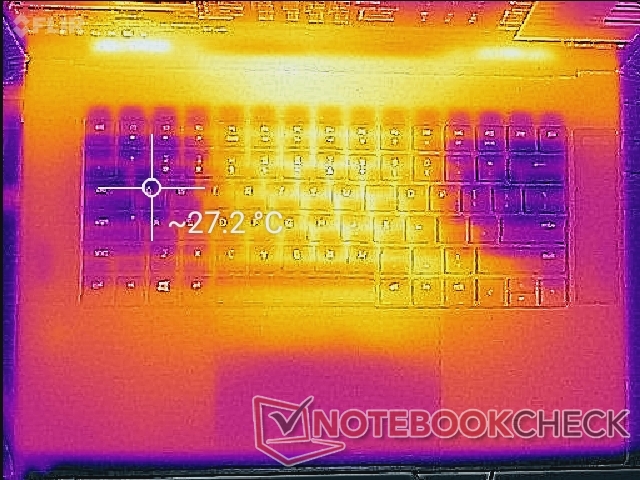
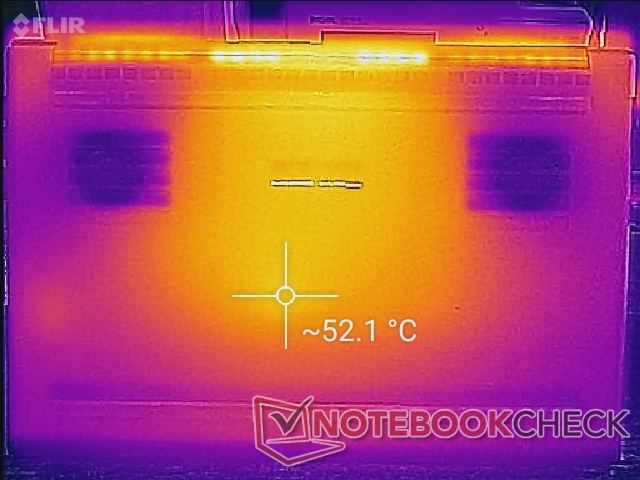
Los puntos calientes de la superficie pueden llegar a los 52 C cuando se juega, lo que no es mucho más frío o cálido que lo que registramos en el modelo Intel Blade 15 de 10ª generación. Los reposamanos pueden calentarse mucho más que en la mayoría de portátiles, con casi 40 C, mientras que las teclas WASD permanecen más frías ya que los ventiladores extraen aire fresco a través de las teclas.
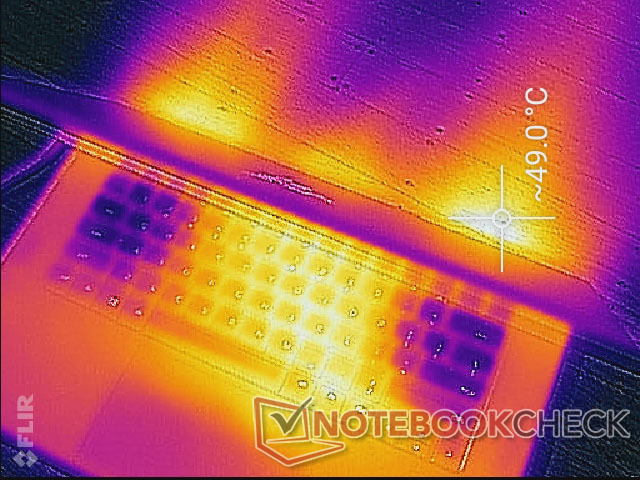
(-) La temperatura máxima en la parte superior es de 51 °C / 124 F, frente a la media de 40.4 °C / 105 F, que oscila entre 21.2 y 68.8 °C para la clase Gaming.
(-) El fondo se calienta hasta un máximo de 52 °C / 126 F, frente a la media de 43.2 °C / 110 F
(+) En reposo, la temperatura media de la parte superior es de 30.7 °C / 87# F, frente a la media del dispositivo de 33.9 °C / 93 F.
(±) Jugando a The Witcher 3, la temperatura media de la parte superior es de 36.2 °C / 97 F, frente a la media del dispositivo de 33.9 °C / 93 F.
(±) El reposamanos y el touchpad pueden calentarse mucho al tacto con un máximo de 38.6 °C / 101.5 F.
(-) La temperatura media de la zona del reposamanos de dispositivos similares fue de 28.8 °C / 83.8 F (-9.8 °C / -17.7 F).
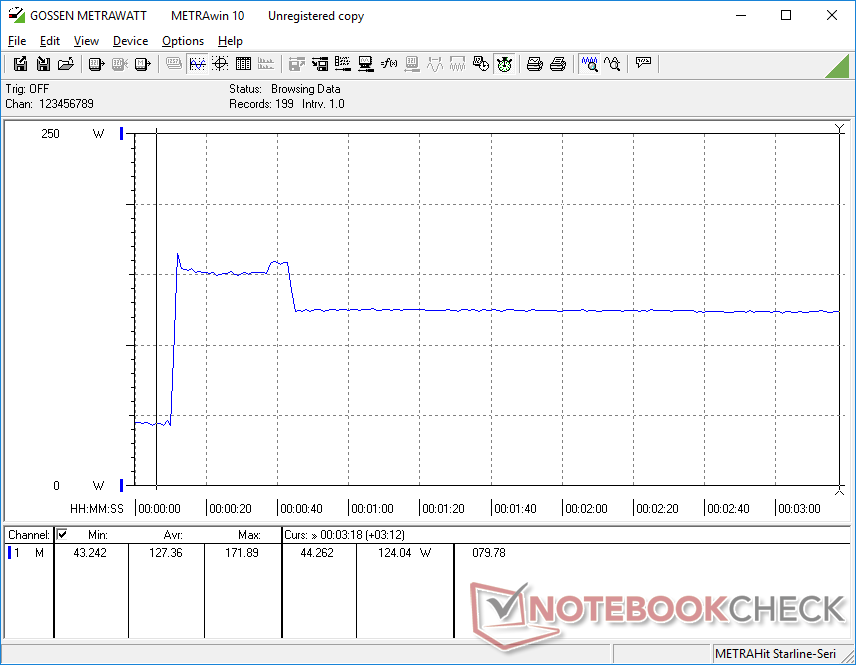
Prueba de esfuerzo
Cuando se estresa con Prime95, la CPU sube a 4,2 GHz sólo durante los primeros segundos hasta que la temperatura del núcleo alcanza los 100 C. A partir de entonces, las velocidades de reloj bajan al rango de 3,3 a 3,4 GHz para mantener temperaturas más bajas. Tras varios minutos más, la velocidad de reloj se estabiliza en el rango de 2,8 a 2,9 GHz para una temperatura plana del núcleo de 83 C
Si se ejecuta Witcher 3 muestra que la CPU y la GPU se estabilizan a 83 C y 80 C, respectivamente, en comparación con los 73 C y 71 C del Blade 15 de 10ª generación. Las temperaturas de los núcleos son notablemente más cálidas como resultado, pero afortunadamente vienen acompañadas de un rendimiento general más rápido como se ejemplifica en los benchmarks anteriores. Los mayores techos de PL2 y TGP son probablemente responsables de estas mayores temperaturas del núcleo. GPU-Z informa de un consumo de energía de la placa de la GPU de unos 97 W cuando se ejecuta el juego, lo que es ligeramente inferior al objetivo de 105 W del TGP.
El uso de la batería limita el rendimiento. Una ejecución de Fire Strike con baterías arrojaría unas puntuaciones de Física y Gráficos de 11073 y 18527 puntos, respectivamente, en comparación con los 23927 y 27266 puntos de la red eléctrica.
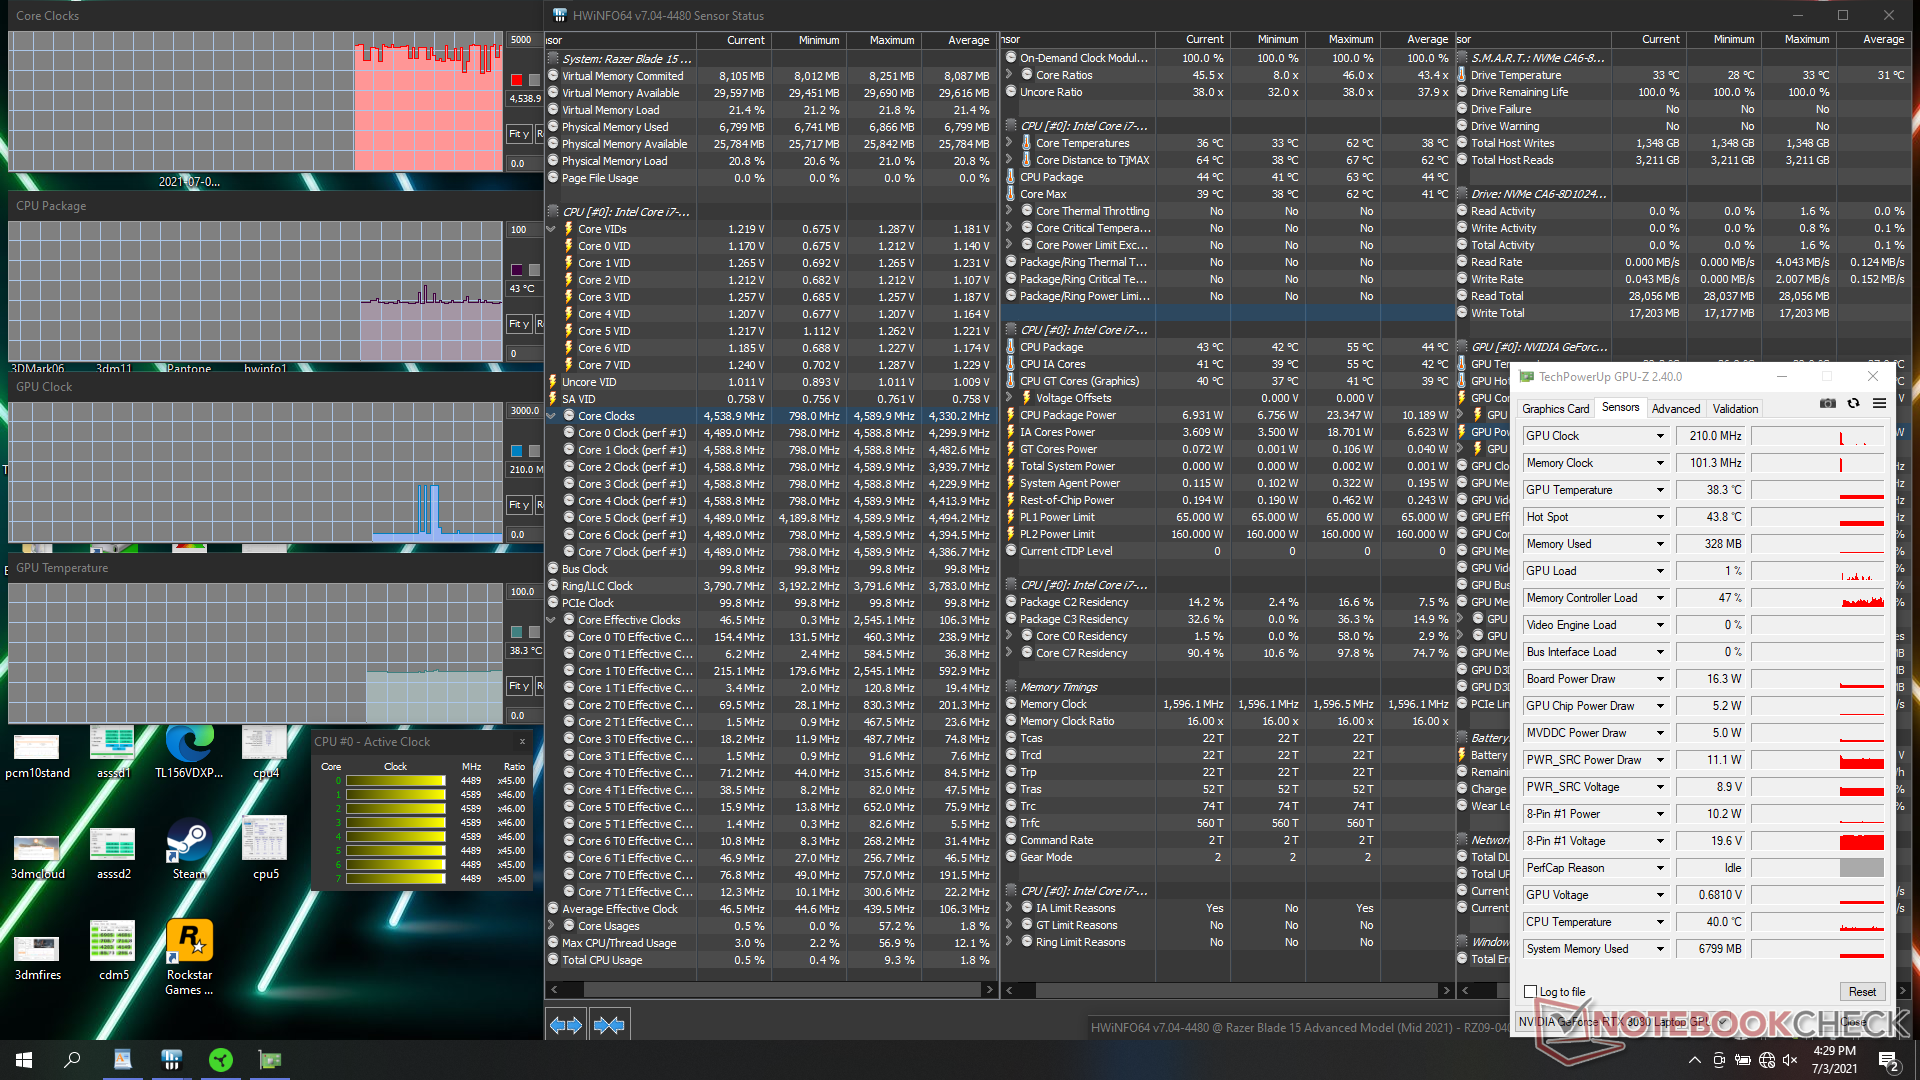
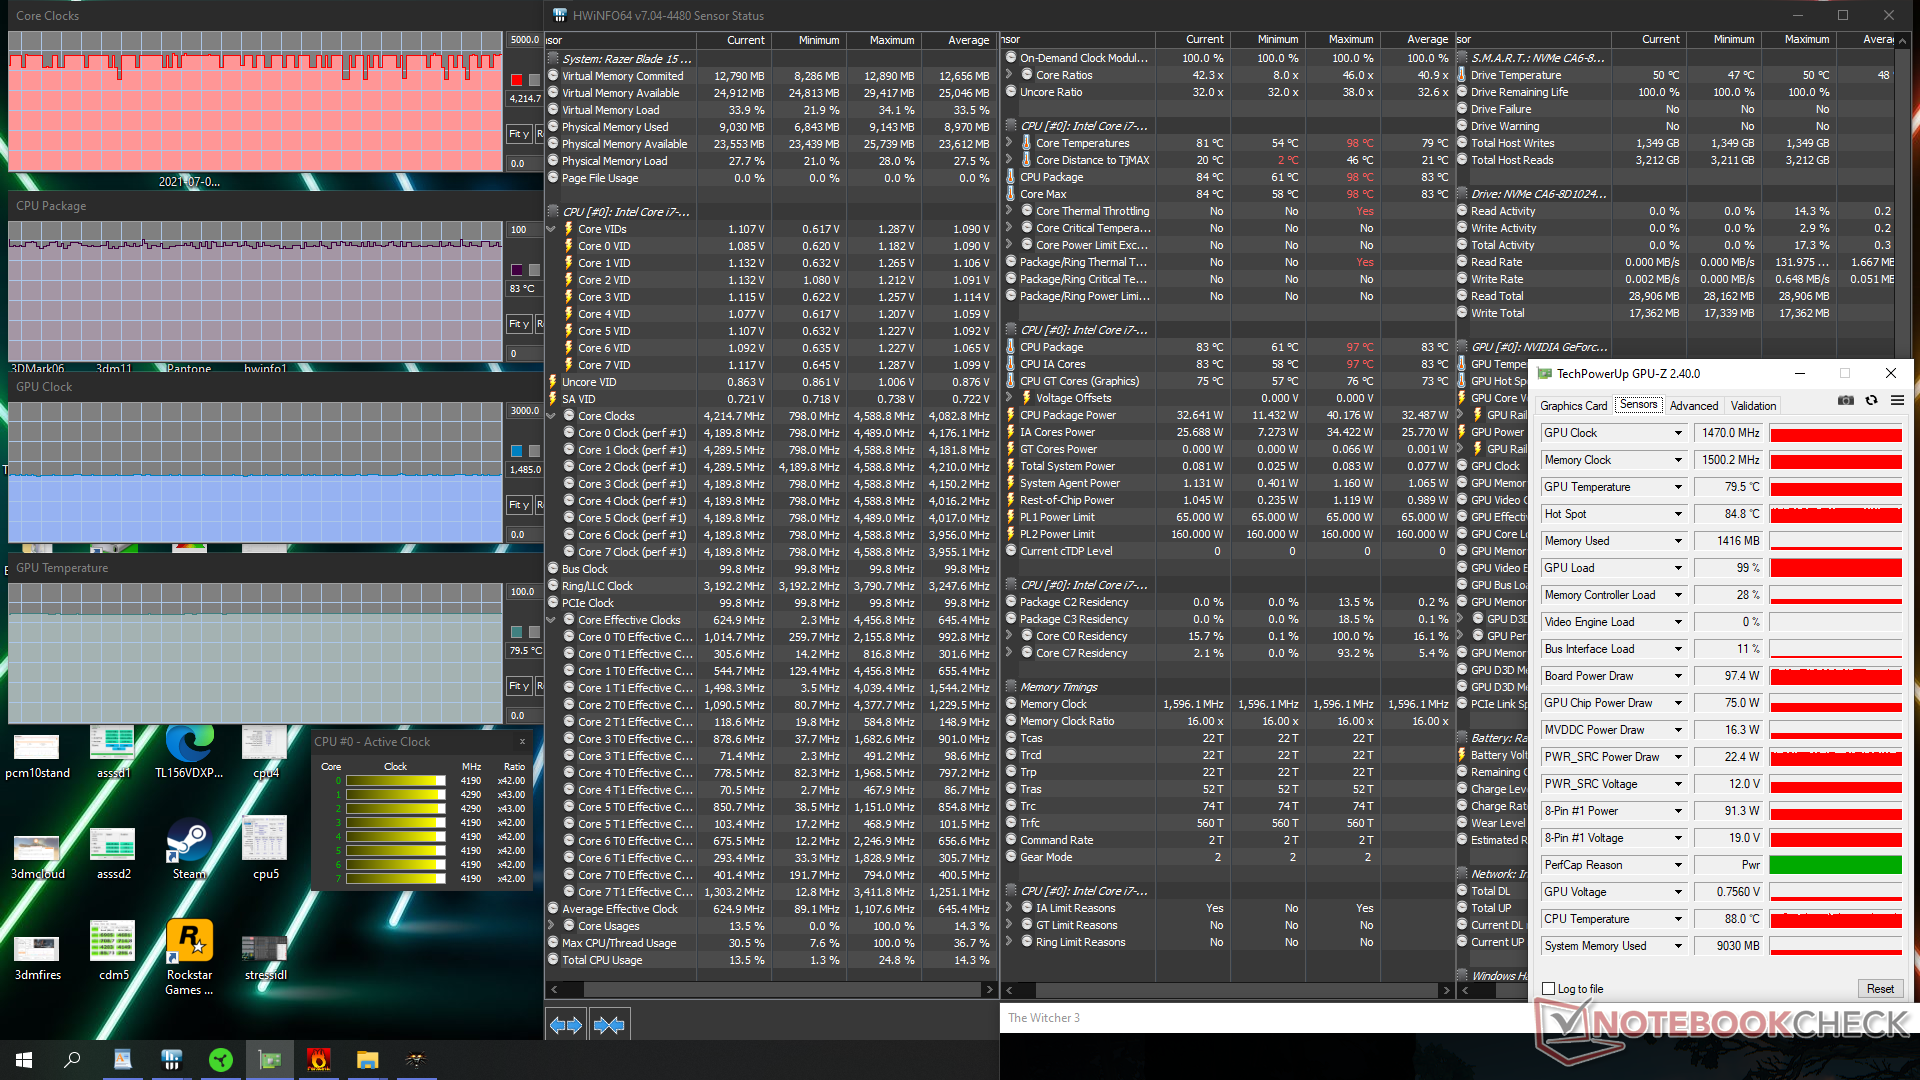
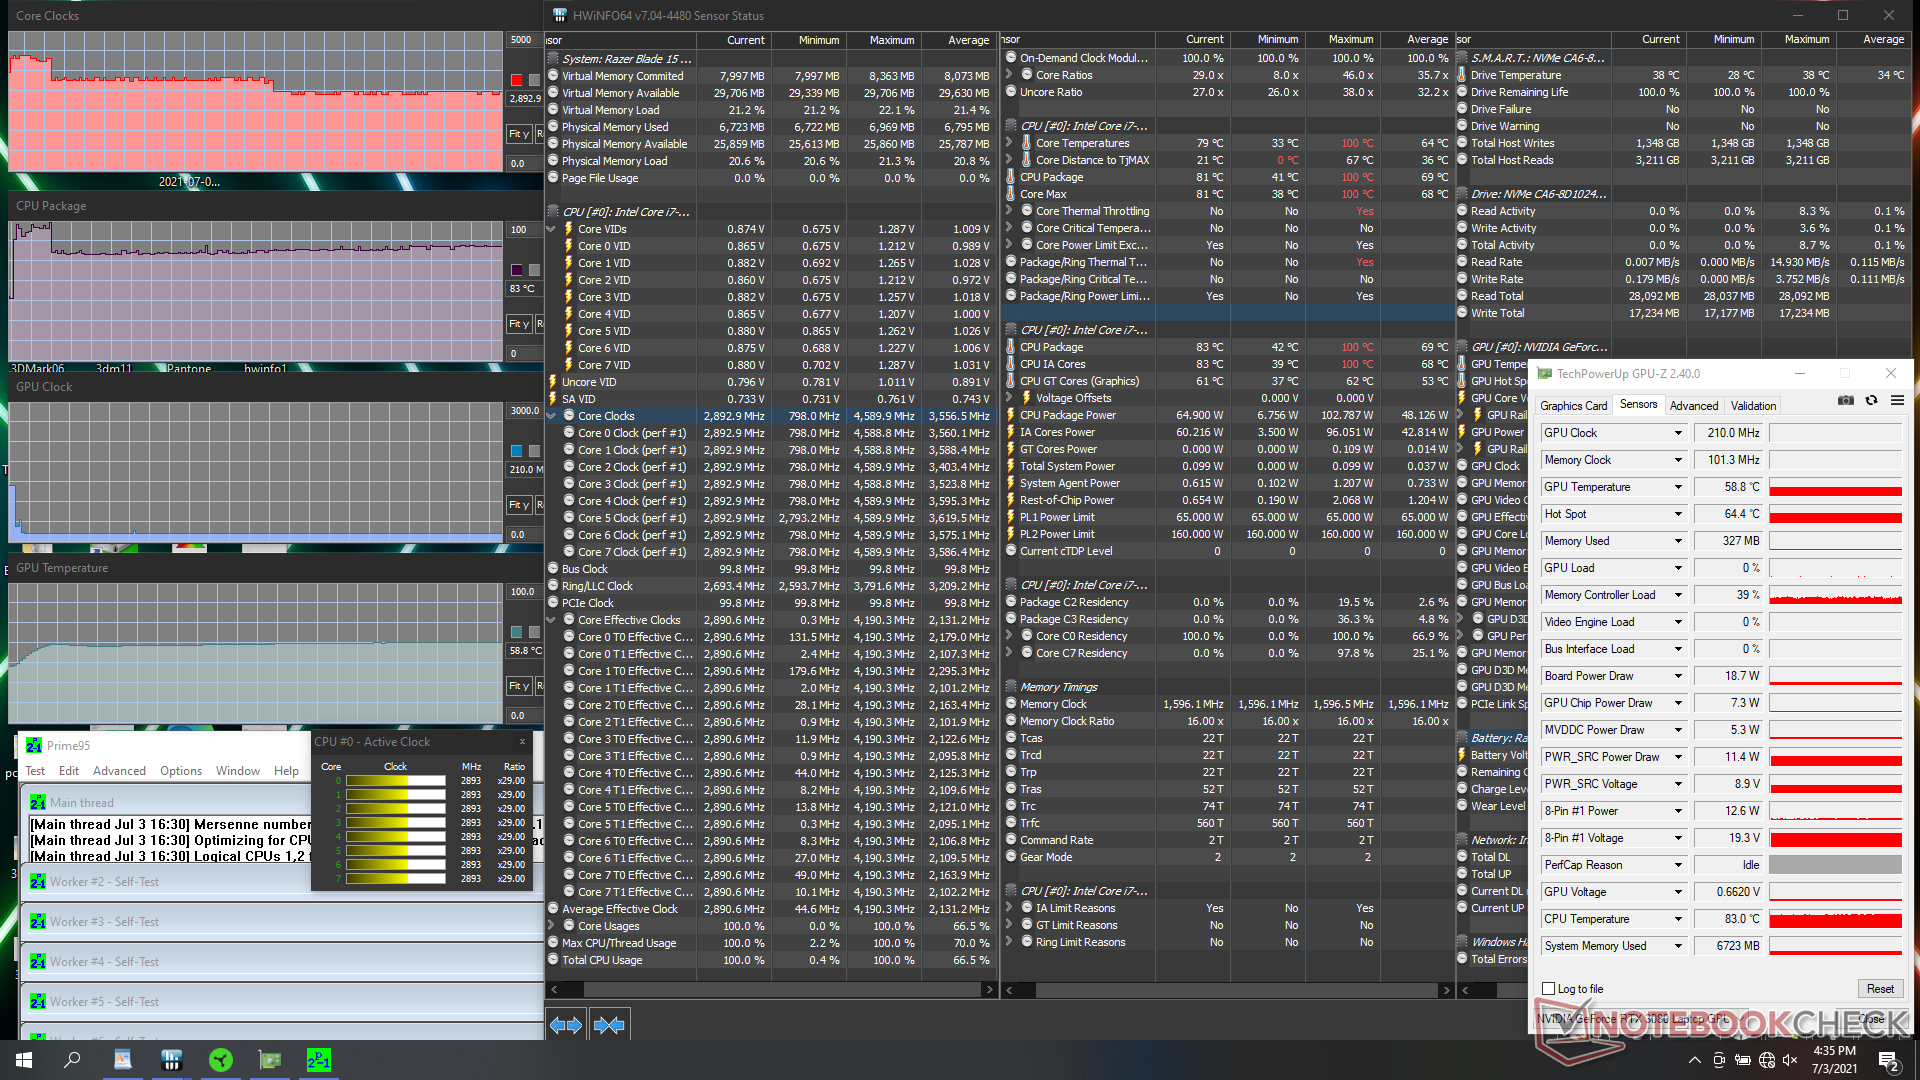
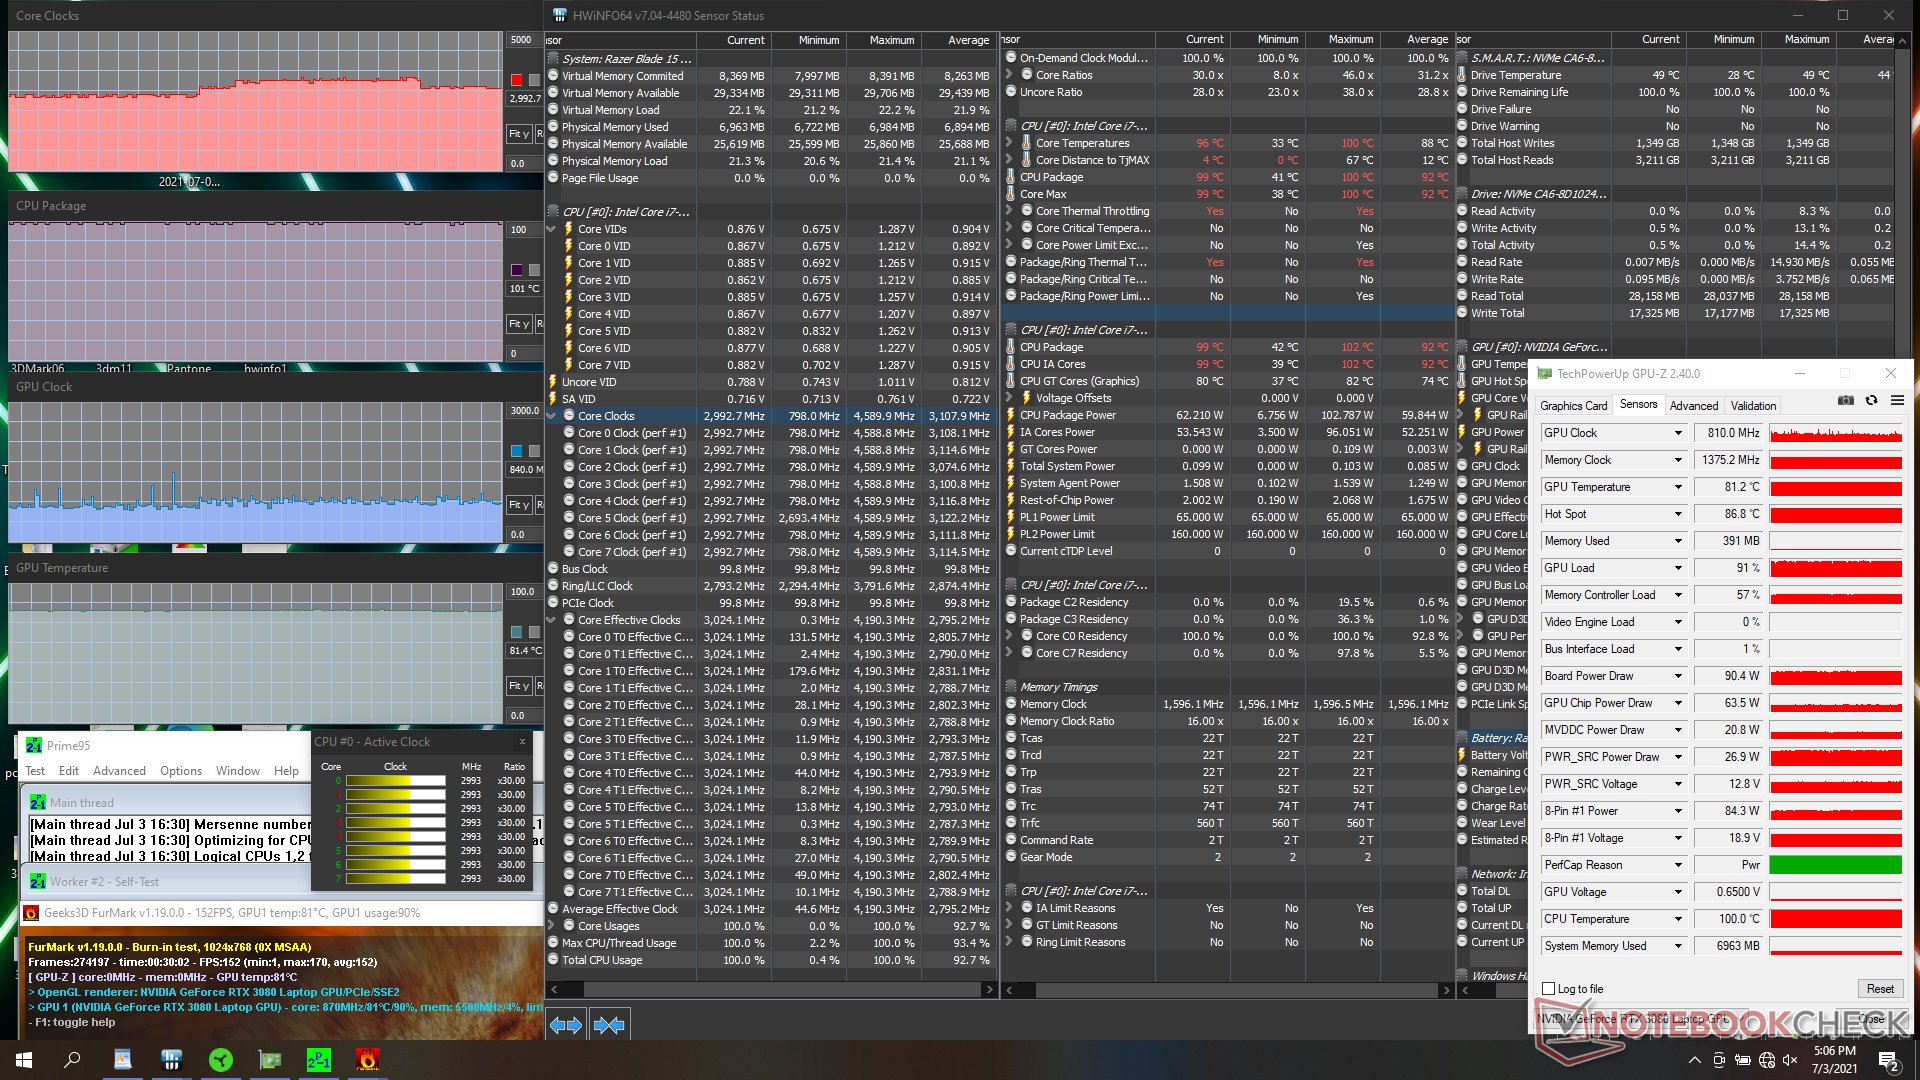
| Relojde la CPU(GHz) | Reloj dela GPU(MHz) | Temperatura media de la CPU (°C) | Temperaturamediade la GPU (°C) | |
| Sistema en reposo | 43 | 38 | ||
| EstrésPrime95 | 2.9 | -- | 83 | 59 |
| Estrés de Prime95+ FurMark | 2,7 - 3,3 | 680 - 1100 | 100 | 81 |
| Witcher 3 Estrés | 3,3 - 4,3 | 1470 | 83 | 80 |
Altavoces
Razer Blade 15 Advanced (Mid 2021) análisis de audio
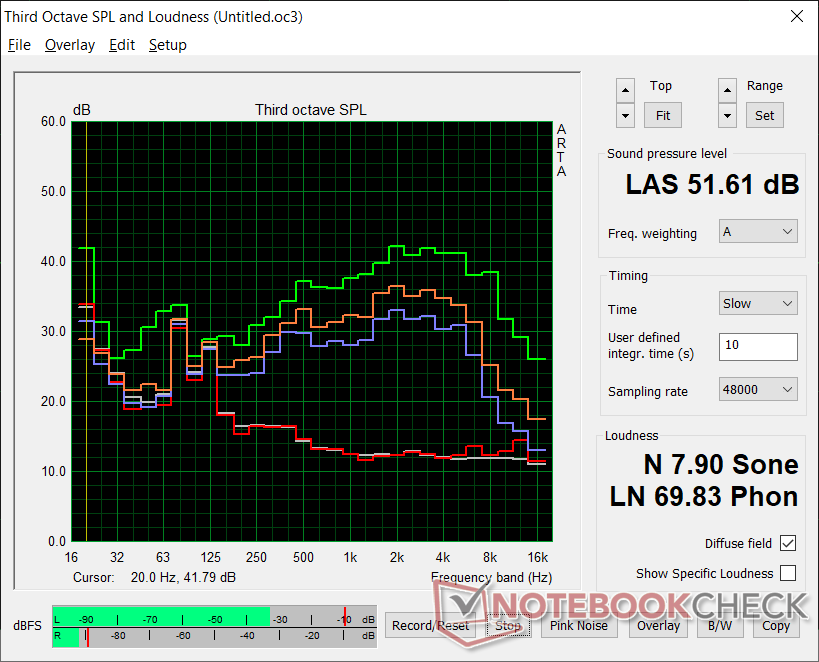
(+) | los altavoces pueden reproducir a un volumen relativamente alto (#84.6 dB)
Graves 100 - 315 Hz
(-) | casi sin bajos - de media 20.1% inferior a la mediana
(±) | la linealidad de los graves es media (12.8% delta a frecuencia anterior)
Medios 400 - 2000 Hz
(+) | medios equilibrados - a sólo 3.6% de la mediana
(+) | los medios son lineales (4.1% delta a la frecuencia anterior)
Altos 2 - 16 kHz
(+) | máximos equilibrados - a sólo 4.9% de la mediana
(±) | la linealidad de los máximos es media (8.3% delta a frecuencia anterior)
Total 100 - 16.000 Hz
(±) | la linealidad del sonido global es media (15.8% de diferencia con la mediana)
En comparación con la misma clase
» 37% de todos los dispositivos probados de esta clase eran mejores, 7% similares, 56% peores
» El mejor tuvo un delta de 6%, la media fue 18%, el peor fue ###max##%
En comparación con todos los dispositivos probados
» 24% de todos los dispositivos probados eran mejores, 5% similares, 70% peores
» El mejor tuvo un delta de 4%, la media fue 23%, el peor fue ###max##%
Apple MacBook 12 (Early 2016) 1.1 GHz análisis de audio
(+) | los altavoces pueden reproducir a un volumen relativamente alto (#83.6 dB)
Graves 100 - 315 Hz
(±) | lubina reducida - en promedio 11.3% inferior a la mediana
(±) | la linealidad de los graves es media (14.2% delta a frecuencia anterior)
Medios 400 - 2000 Hz
(+) | medios equilibrados - a sólo 2.4% de la mediana
(+) | los medios son lineales (5.5% delta a la frecuencia anterior)
Altos 2 - 16 kHz
(+) | máximos equilibrados - a sólo 2% de la mediana
(+) | los máximos son lineales (4.5% delta a la frecuencia anterior)
Total 100 - 16.000 Hz
(+) | el sonido global es lineal (10.2% de diferencia con la mediana)
En comparación con la misma clase
» 7% de todos los dispositivos probados de esta clase eran mejores, 2% similares, 90% peores
» El mejor tuvo un delta de 5%, la media fue 18%, el peor fue ###max##%
En comparación con todos los dispositivos probados
» 5% de todos los dispositivos probados eran mejores, 1% similares, 94% peores
» El mejor tuvo un delta de 4%, la media fue 23%, el peor fue ###max##%
Energy Management
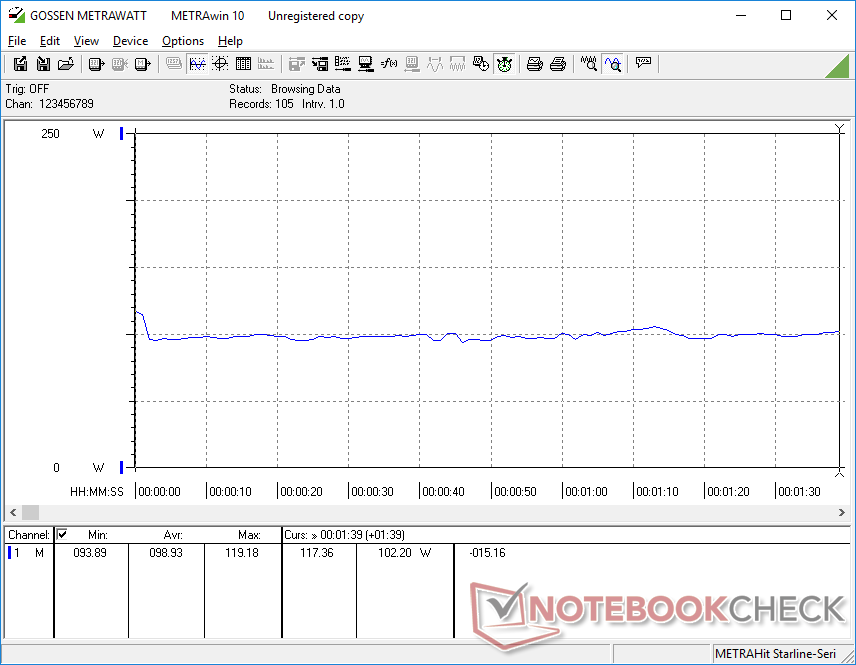
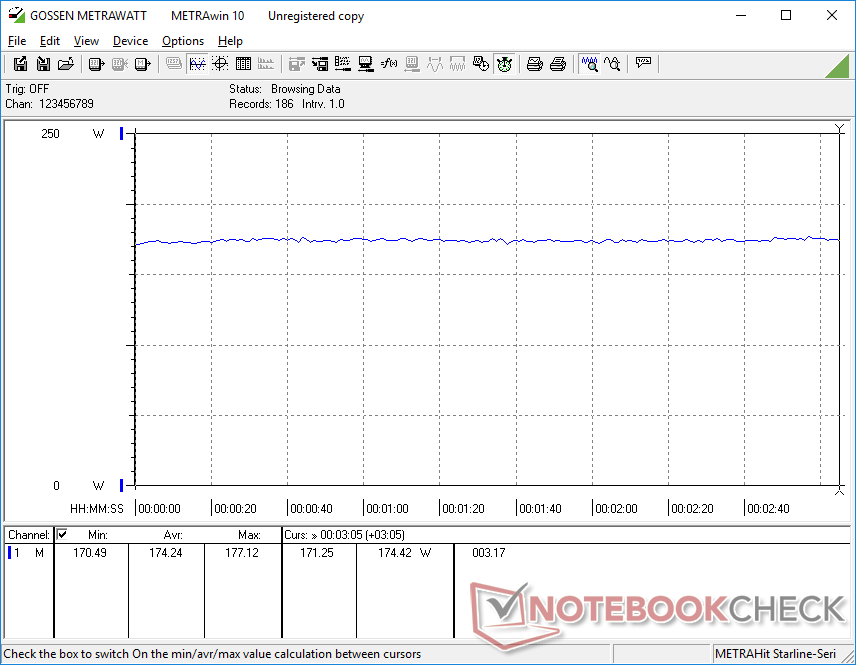
Consumo de energía
El nuevo modelo de 11ª generación de Intel consume más energía en general que el anterior modo de 10ª generación de Intel, lo que puede explicar la menor duración de la batería que registramos en la siguiente sección. Simplemente en reposo en el escritorio con el brillo más bajo en el modo de ahorro de energía y con la GPU integrada activa se consumen casi 20 W. En reposo en el escritorio con la GPU discreta activa y en el modo de alto rendimiento se duplica esta demanda.
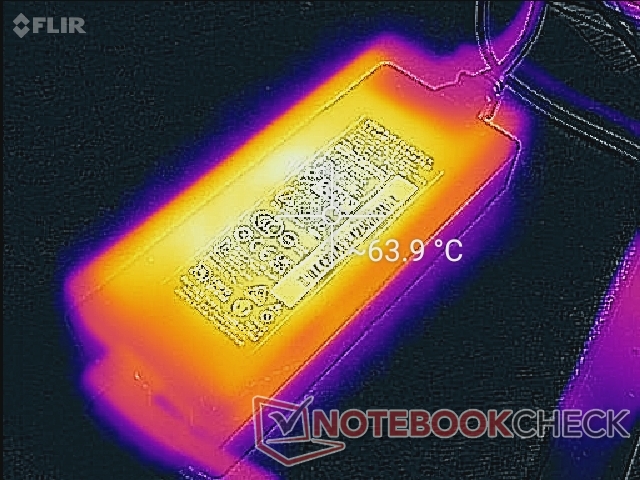
Ejecutar Witcher 3 consume una media de 174 W, lo que es alto pero sigue siendo menor que en el Aorus 15P con la misma CPU y GPU. Pudimos registrar un consumo máximo de 214 W con el adaptador de CA de tamaño medio (~17 x 7 x 2.5 cm) de 230 W.
| Off / Standby | |
| Ocioso | |
| Carga |
|
Clave:
min: | |
| Razer Blade 15 Advanced (Mid 2021) i7-11800H, GeForce RTX 3080 Laptop GPU, SSSTC CA6-8D1024, IPS, 1920x1080, 15.6" | Razer Blade 15 Advanced Model Early 2021 i7-10875H, GeForce RTX 3080 Laptop GPU, Samsung PM981a MZVLB1T0HBLR, IPS, 1920x1080, 15.6" | Razer Blade 15 RTX 2080 Super Max-Q i7-10875H, GeForce RTX 2080 Super Max-Q, Samsung PM981a MZVLB1T0HBLR, IPS, 1920x1080, 15.6" | Asus TUF Gaming F15 FX506HM i7-11800H, GeForce RTX 3060 Laptop GPU, SK Hynix HFM001TD3JX013N, IPS, 1920x1080, 15.6" | Alienware m15 R5 Ryzen Edition R7 5800H, GeForce RTX 3060 Laptop GPU, Toshiba KBG40ZNS512G NVMe, IPS, 1920x1080, 15.6" | Aorus 15P YD i7-11800H, GeForce RTX 3080 Laptop GPU, Samsung PM9A1 MZVL21T0HCLR, IPS, 1920x1080, 15.6" | |
|---|---|---|---|---|---|---|
| Power Consumption | 28% | 26% | 29% | 15% | -9% | |
| Idle Minimum * (Watt) | 19.5 | 13 33% | 10.6 46% | 9.5 51% | 11 44% | 23 -18% |
| Idle Average * (Watt) | 23.3 | 15 36% | 13.1 44% | 12.1 48% | 14 40% | 25 -7% |
| Idle Maximum * (Watt) | 40.1 | 22 45% | 15.8 61% | 22.5 44% | 25 38% | 35 13% |
| Load Average * (Watt) | 98.9 | 98 1% | 131 -32% | 99.5 -1% | 123 -24% | 101 -2% |
| Witcher 3 ultra * (Watt) | 174 | 126 28% | 146 16% | 157 10% | 176 -1% | 190 -9% |
| Load Maximum * (Watt) | 214 | 165 23% | 169 21% | 173.5 19% | 226 -6% | 280 -31% |
* ... más pequeño es mejor
Power Consumption Witcher 3
Duración de la batería
La navegación web en modo equilibrado con la iGPU activa y a 150 nit de brillo es unas cuantas horas más corta que la que registramos en el Blade 15 de 10ª generación. Los usuarios pueden compensar esa diferencia poniendo el sistema en modo de ahorro de energía y la tasa de refresco a 60 Hz en vez de los 360 Hz por defecto.
Los usuarios pueden recargar por USB-C a través de cualquier puerto.
| Razer Blade 15 Advanced (Mid 2021) i7-11800H, GeForce RTX 3080 Laptop GPU, 80 Wh | Razer Blade 15 Advanced Model Early 2021 i7-10875H, GeForce RTX 3080 Laptop GPU, 80 Wh | Razer Blade 15 RTX 2080 Super Max-Q i7-10875H, GeForce RTX 2080 Super Max-Q, 80 Wh | Asus TUF Gaming F15 FX506HM i7-11800H, GeForce RTX 3060 Laptop GPU, 90 Wh | Alienware m15 R5 Ryzen Edition R7 5800H, GeForce RTX 3060 Laptop GPU, 86 Wh | Aorus 15P YD i7-11800H, GeForce RTX 3080 Laptop GPU, 99 Wh | |
|---|---|---|---|---|---|---|
| Duración de Batería | 53% | 3% | 34% | -14% | -10% | |
| WiFi v1.3 (h) | 5.9 | 9 53% | 6.1 3% | 7.9 34% | 5.1 -14% | 5.3 -10% |
| Reader / Idle (h) | 14.4 | 8.7 | 11 | 14.7 | 7.5 | |
| Load (h) | 2 | 1.9 | 2 | 0.9 | 2.1 | |
| Witcher 3 ultra (h) | 1.6 |
Pro
Contra
Veredicto
Dado que el Core i7-10875H del Blade 15 de 10ª generación rendía menos cuando se estresaba, temíamos ver lo mismo con el Core i7-11800H del nuevo modelo Blade 15 de 11ª generación. Afortunadamente, no fue así. La CPU del nuevo Blade 15 se sitúa a unos pocos puntos porcentuales del portátil medio de nuestra base de datos equipado con el mismo i7-11800H. Los usuarios obtienen al menos un 30% más de rendimiento multihilo en bruto que el i7-10875H del antiguo Blade 15. El rendimiento bruto de la GPU también ha aumentado entre un 10 y un 15 por ciento, debido en parte al mayor objetivo de TGP. Algunos juegos verán aumentos similares en la velocidad de fotogramas, dependiendo de la intensidad de la CPU.
El último 2021 Blade 15 es la versión más rápida de sí mismo hasta ahora, especialmente en términos de potencia de la CPU. Sin embargo, su rendimiento general en los juegos es sólo una mejora marginal con respecto al primer modelo 2021 Blade 15, que sólo tiene unos meses de antigüedad.
La mayor velocidad de la CPU y la GPU se produce a costa de una mayor temperatura de los núcleos, un mayor consumo de energía y una menor duración de la batería que en el Intel Blade 15 de 10ª generación. Estos inconvenientes pueden alejar a los usuarios que buscan maximizar la eficiencia energética, pero los cazadores de rendimiento pueden aceptar felizmente estos contratiempos por los procesadores más rápidos, la cámara web de mayor resolución, el soporte de SSD PCIe 4 NVMe y la compatibilidad con Thunderbolt 4.
Precio y disponibilidad
La 11ª generación de Intel Blade 15 todavía no está disponible en los canales de terceros en el momento de escribir este artículo. Para pedirlo directamente a Razer puede ser la mejor manera de conseguir una unidad.
Razer Blade 15 Advanced (Mid 2021)
- 07/07/2021 v7 (old)
Allen Ngo
Price comparison

