Análisis del portátil Dell XPS 17 9710 de 11ª generación de Intel: Pequeños cambios que importan
Ha pasado exactamente un año desde que analizamos el xPS 17 9700 original con Intel de 10ª generación y gráficos GeForce RTX 2060 Max-Q. Ahora, Dell está listo para enviar su segunda generación de la serie XPS 17 9710 actualizada con la 11ª generación de Intel y los gráficos GeForce RTX 3060. Nuestra unidad de prueba de hoy es una configuración de gama media alta con la CPU Core i7-11800H, la GPU RTX 3060 y la pantalla táctil de 2400p por algo menos de 2900 dólares. Otros SKUs incluyen el Core i9-11900H o RTX 3050 con pantalla 1200p por precios de partida más altos y más bajos, respectivamente.
El XPS 17 de 2021 es físicamente idéntico a la versión de 2020, por lo que recomendamos consultar nuestros dos análisis existentes sobre el modelo del año pasado para saber más sobre el chasis y sus características. No obstante, hay un puñado de actualizaciones bajo el capó que hacen que valga la pena considerar el XPS 17 9710 en lugar del 9700.
Las alternativas al XPS 17 incluyen portátiles de 17,3 pulgadas de alto rendimiento como el Gigabyte Aero 17, LG Ultra 17o el Razer Blade Pro 17 hasta cierto punto. Sin embargo, el XPS 17 sigue siendo único con su relación de aspecto 16:10 4K de 17,0 pulgadas.
Más análisis de Dell:
potential competitors in comparison
Valoración | Fecha | Modelo | Peso | Altura | Tamaño | Resolución | Precio |
|---|---|---|---|---|---|---|---|
| 87.9 % v7 (old) | 07/2021 | Dell XPS 17 9710 Core i7 RTX 3060 i7-11800H, GeForce RTX 3060 Laptop GPU | 2.5 kg | 19.5 mm | 17.00" | 3840x2400 | |
| 87.9 % v7 (old) | 07/2020 | Dell XPS 17 9700 Core i7 RTX 2060 Max-Q i7-10875H, GeForce RTX 2060 Max-Q | 2.5 kg | 19.5 mm | 17.00" | 3840x2400 | |
| 87.8 % v7 (old) | 02/2021 | Razer Blade Pro 17 2021 (QHD Touch) i7-10875H, GeForce RTX 3080 Laptop GPU | 3 kg | 19.9 mm | 17.30" | 3840x2160 | |
| 87.6 % v7 (old) | 01/2021 | Gigabyte Aero 17 HDR YC i9-10980HK, GeForce RTX 3080 Laptop GPU | 2.8 kg | 21.4 mm | 17.30" | 3840x2160 | |
| 82.8 % v7 (old) | 09/2020 | LG Ultra 17U70N i5-10210U, GeForce GTX 1650 Mobile | 2 kg | 20.4 mm | 17.00" | 2560x1600 | |
| 84.3 % v7 (old) | 08/2020 | Eluktronics RP-17 R7 4800H, GeForce RTX 2060 Mobile | 2.6 kg | 30 mm | 17.30" | 1920x1080 |
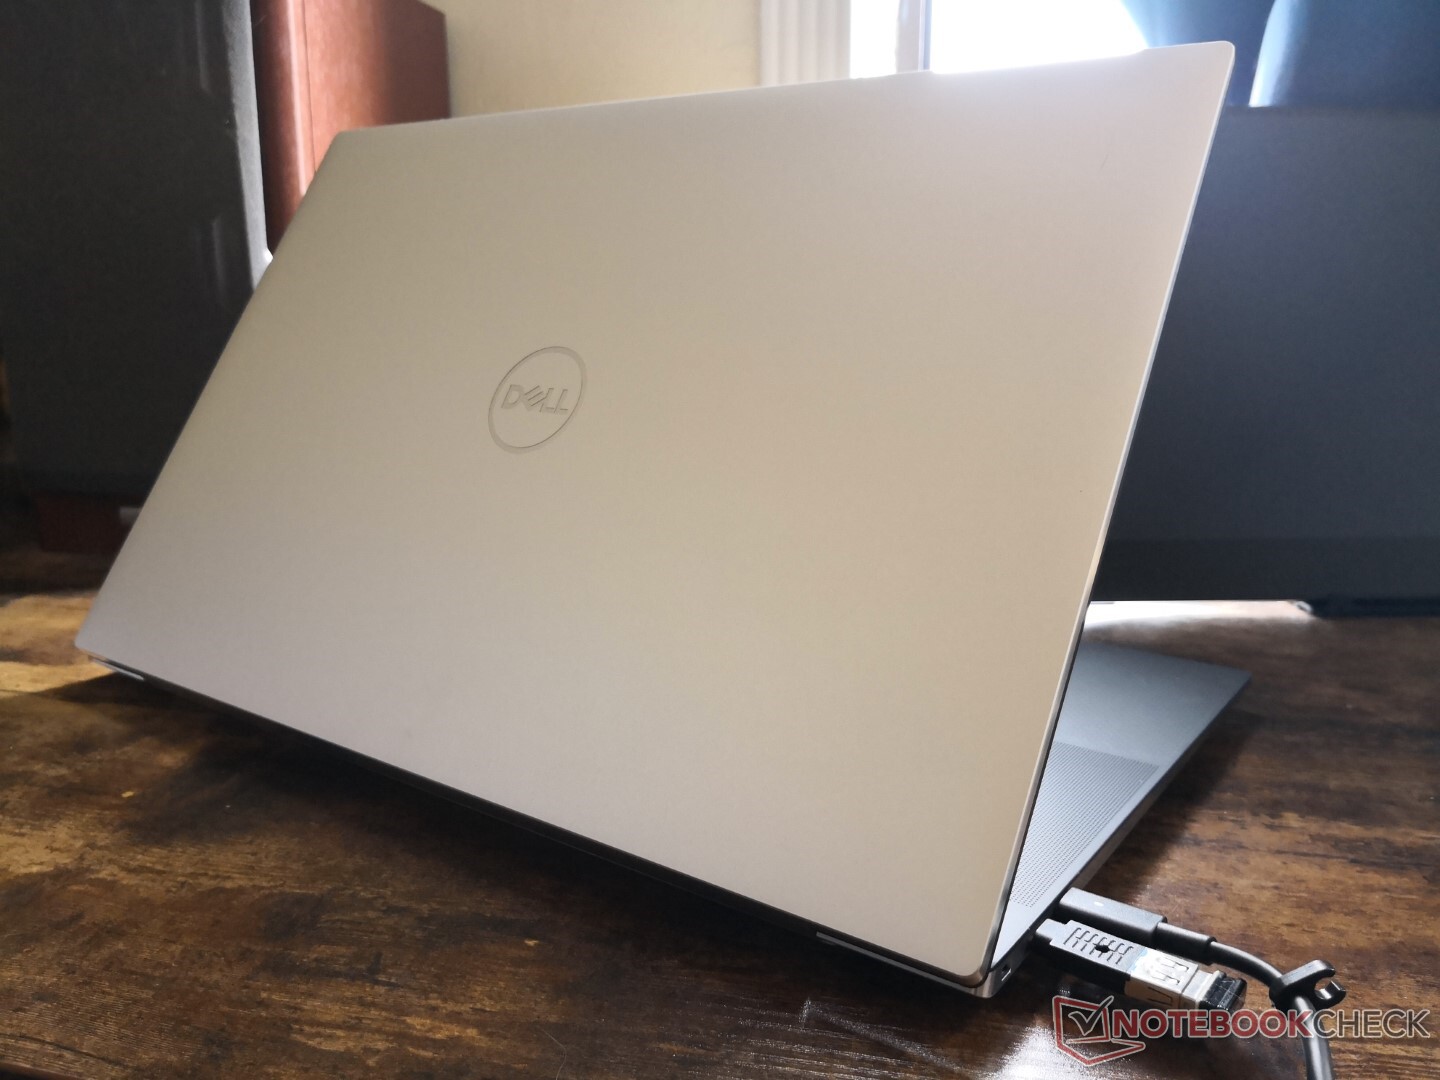
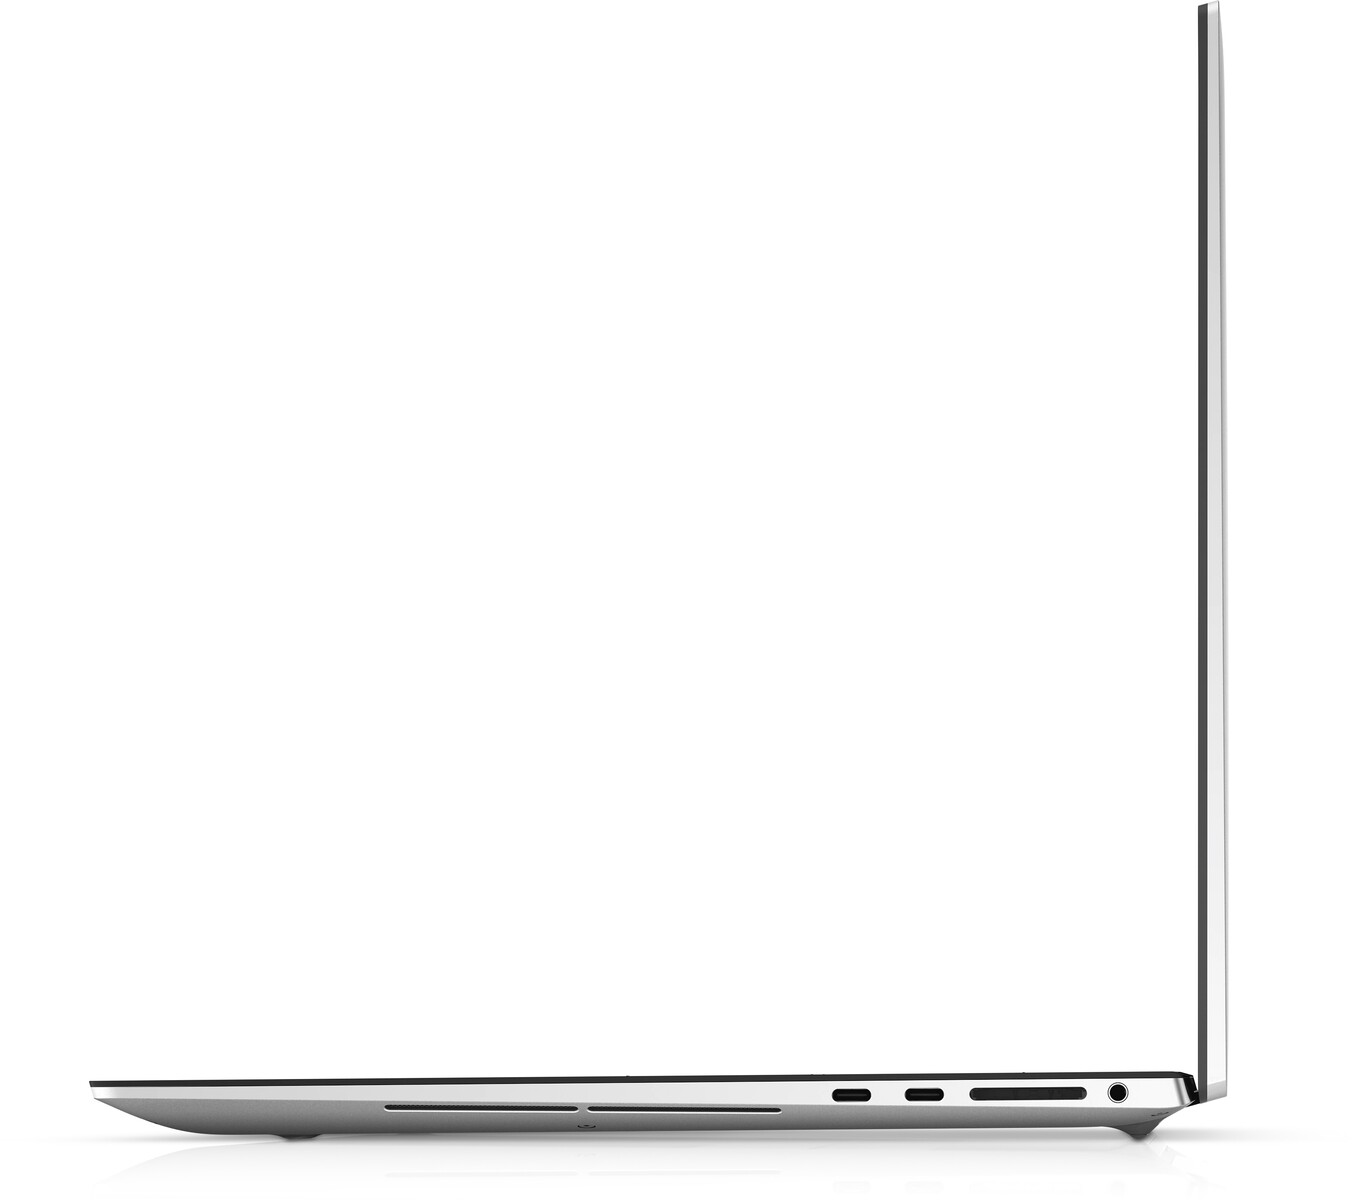
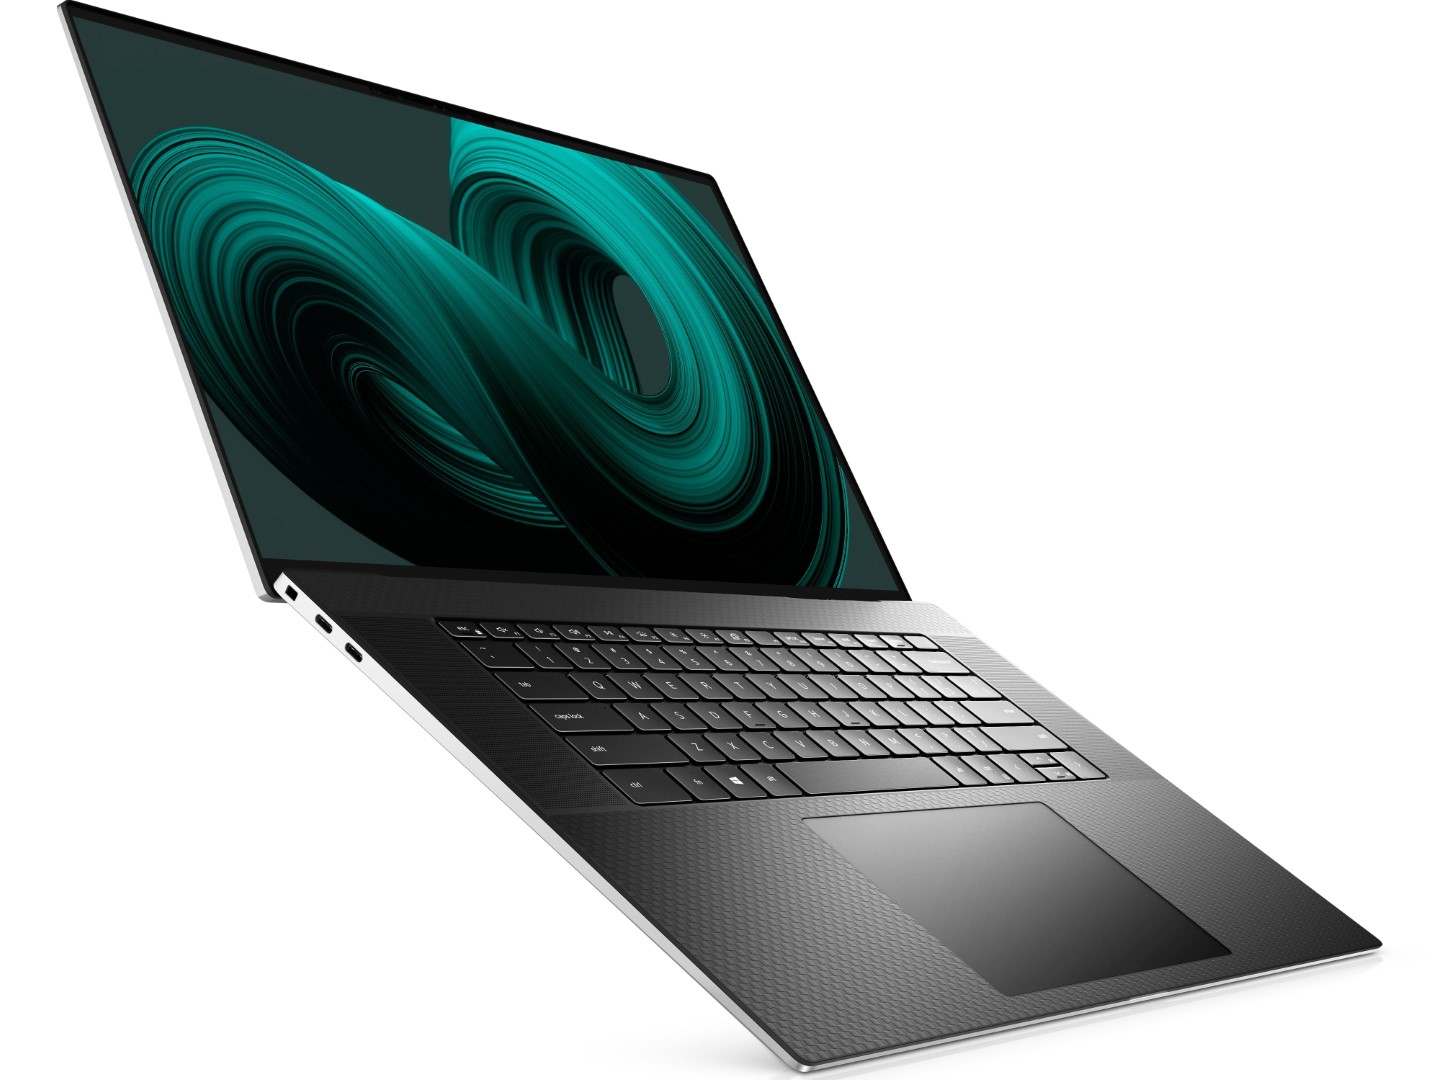
Funda - Relación pantalla-cuerpo increíblemente alta
El chasis sólo tiene un año de antigüedad, por lo que Dell no ha hecho cambios en el diseño exterior del XPS 17 9710. Aun así, habría sido genial ver al menos una opción de color adicional como el XPS 13 de fibra de vidrio o incluso un obturador para la webcam que sigue brillando por su ausencia.
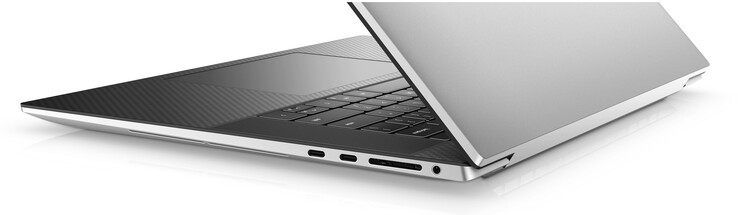
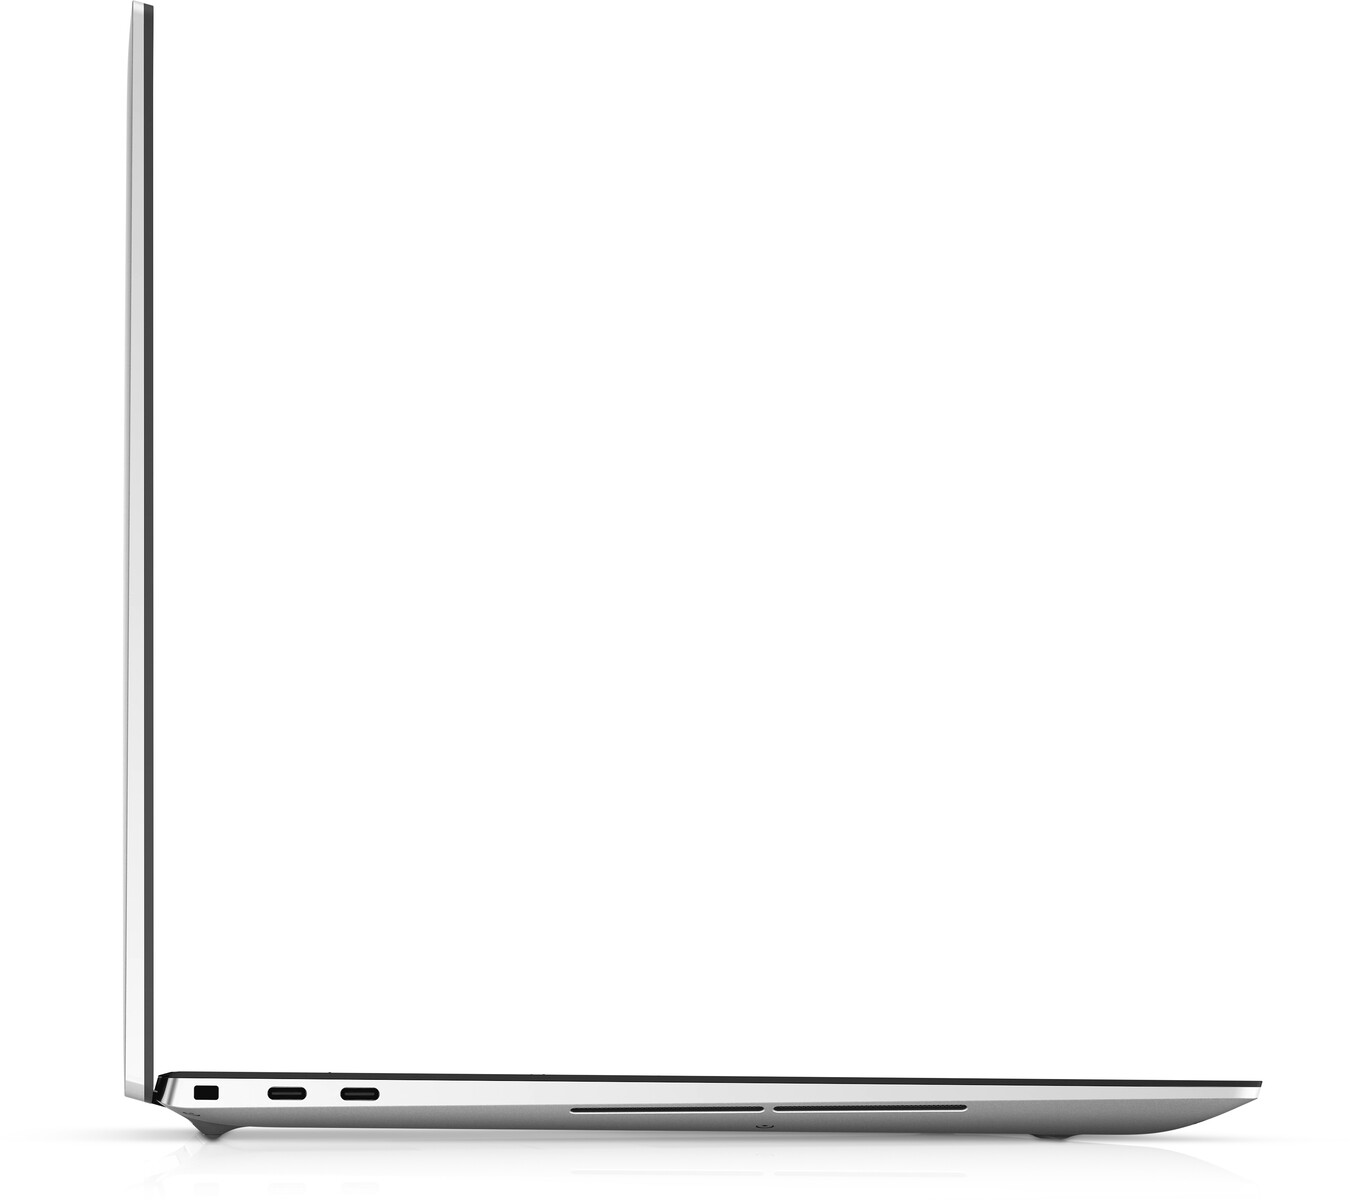
Conectividad - ¿Demasiados puertos Thunderbolt 4?
Como si los cuatro puertos Thunderbolt 3 del XPS 17 9700 no fueran suficientes, todos han sido actualizados a Thunderbolt 4 en este último modelo. La mayoría de los accesorios fuera de las eGPUs probablemente no se beneficien de la actualización ya que Thunderbolt 3 y Thunderbolt 4 comparten el mismo techo de 40 Gbps.
Lector de tarjetas SD - No está muerto
El lector de tarjetas SD ha llegado para quedarse y nos alegramos de que sea compatible con modelos de consumo como el XPS 17. Mover 1 GB de fotos desde nuestra tarjeta de prueba UHS-II sólo lleva entre 5 y 6 segundos.
| SD Card Reader | |
| average JPG Copy Test (av. of 3 runs) | |
| Razer Blade Pro 17 2021 (QHD Touch) (Toshiba Exceria Pro SDXC 64 GB UHS-II) | |
| Dell XPS 17 9700 Core i7 RTX 2060 Max-Q (Toshiba Exceria Pro SDXC 64 GB UHS-II) | |
| Gigabyte Aero 17 HDR YC (Toshiba Exceria Pro SDXC 64 GB UHS-II) | |
| Dell XPS 17 9710 Core i7 RTX 3060 (AV PRO microSD 128 GB V60) | |
| LG Ultra 17U70N (Toshiba Exceria Pro M501 microSDXC 64GB) | |
| Eluktronics RP-17 (Toshiba Exceria Pro SDXC 64 GB UHS-II) | |
| maximum AS SSD Seq Read Test (1GB) | |
| Gigabyte Aero 17 HDR YC (Toshiba Exceria Pro SDXC 64 GB UHS-II) | |
| Dell XPS 17 9700 Core i7 RTX 2060 Max-Q (Toshiba Exceria Pro SDXC 64 GB UHS-II) | |
| Razer Blade Pro 17 2021 (QHD Touch) (Toshiba Exceria Pro SDXC 64 GB UHS-II) | |
| Dell XPS 17 9710 Core i7 RTX 3060 (AV PRO microSD 128 GB V60) | |
| LG Ultra 17U70N (Toshiba Exceria Pro M501 microSDXC 64GB) | |
| Eluktronics RP-17 (Toshiba Exceria Pro SDXC 64 GB UHS-II) | |
Comunicación
El Intel-Killer 1650s viene de serie con conectividad Wi-Fi 6 y Bluetooth 5.2. La principal diferencia con el más común Intel AX200/201 es su compatibilidad con el Software Killer Networking que ofrece características adicionales que los entusiastas podrían apreciar.
Cámara web
La cámara web de 720p sigue siendo la misma. Habría sido genial ver una actualización a 1080p como en el último Razer Blade 15.


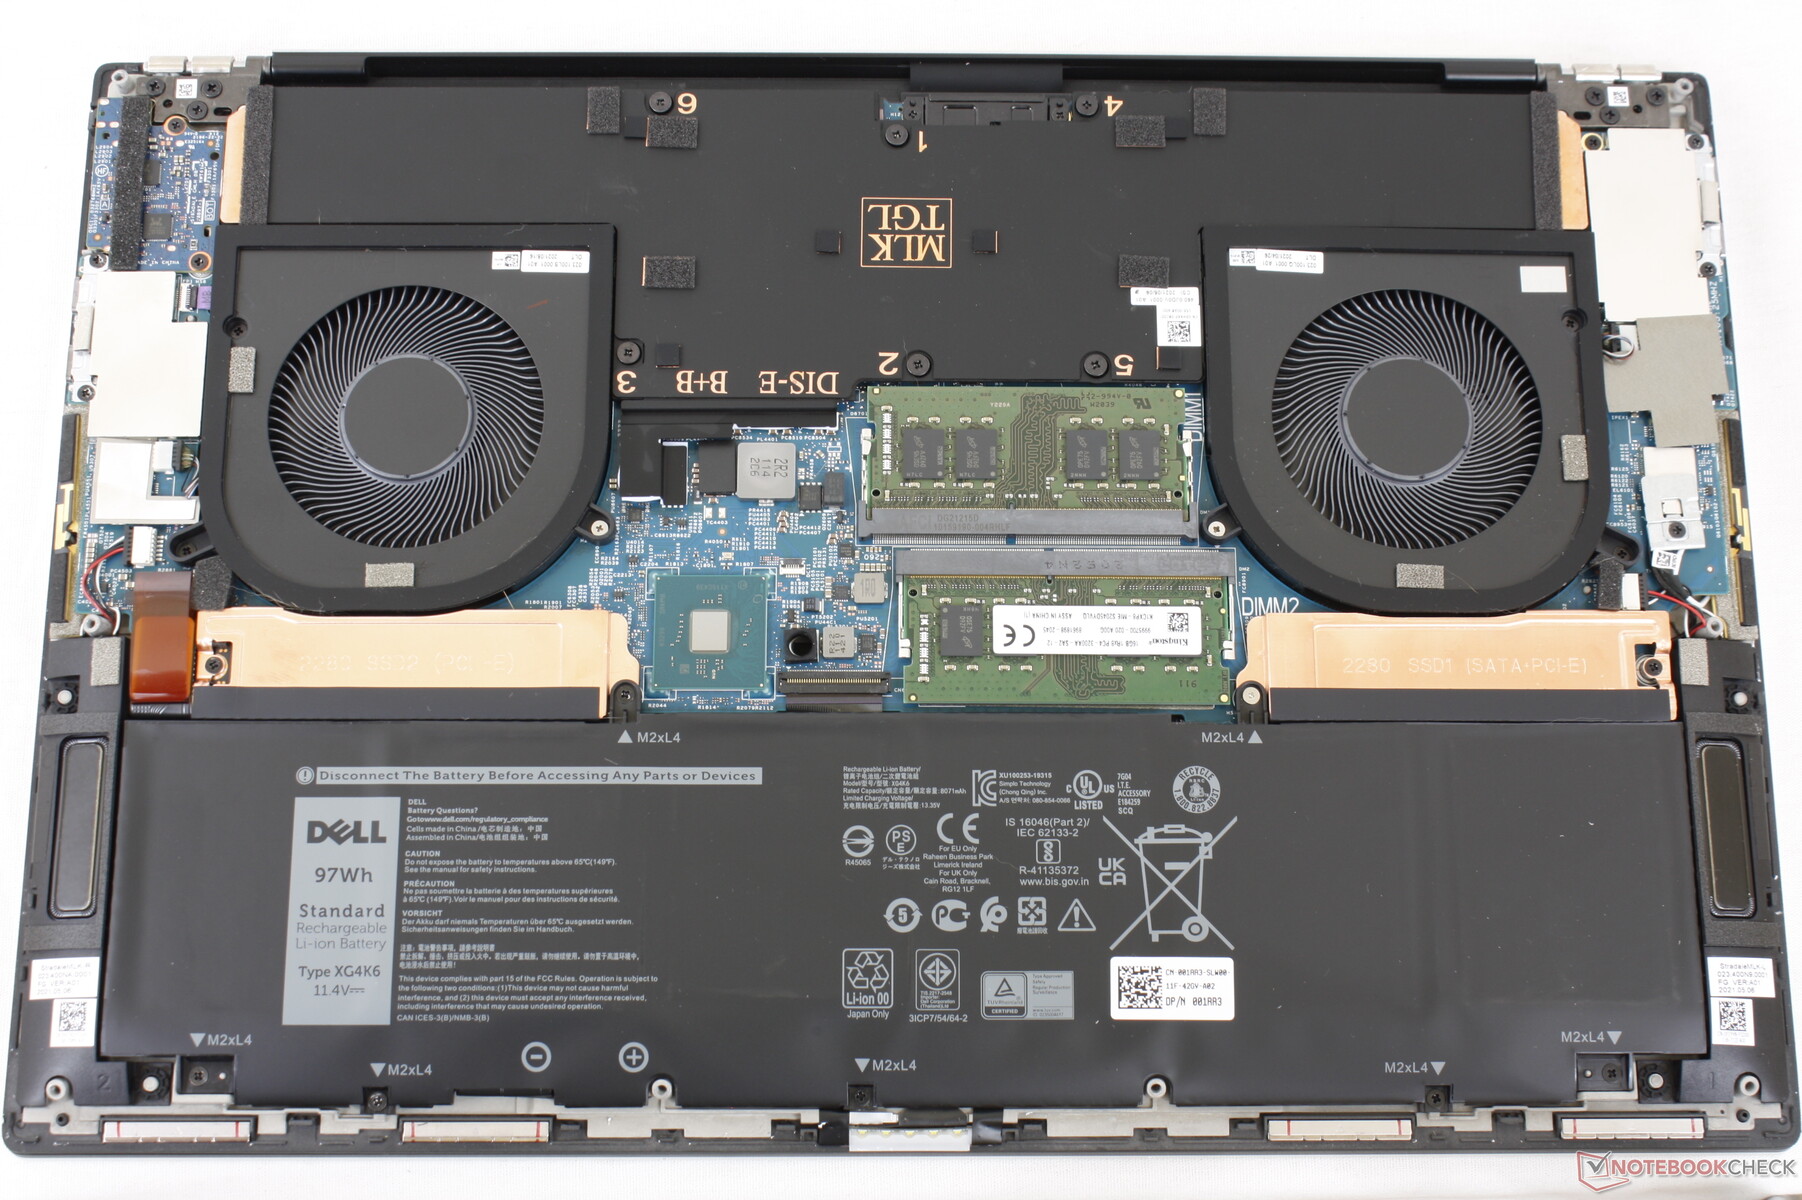
Mantenimiento
El panel inferior es más difícil de quitar que en el XPS 15 ya que sus bordes y esquinas son más ajustados y afilados.
Accesorios y garantía
Dell incluye un práctico adaptador de USB-C a HDMI y USB-A para compensar el hecho de que el chasis no integra ninguno de estos puertos. Se aplica la garantía limitada estándar de un año con muchas opciones de ampliación si se pide directamente a Dell.
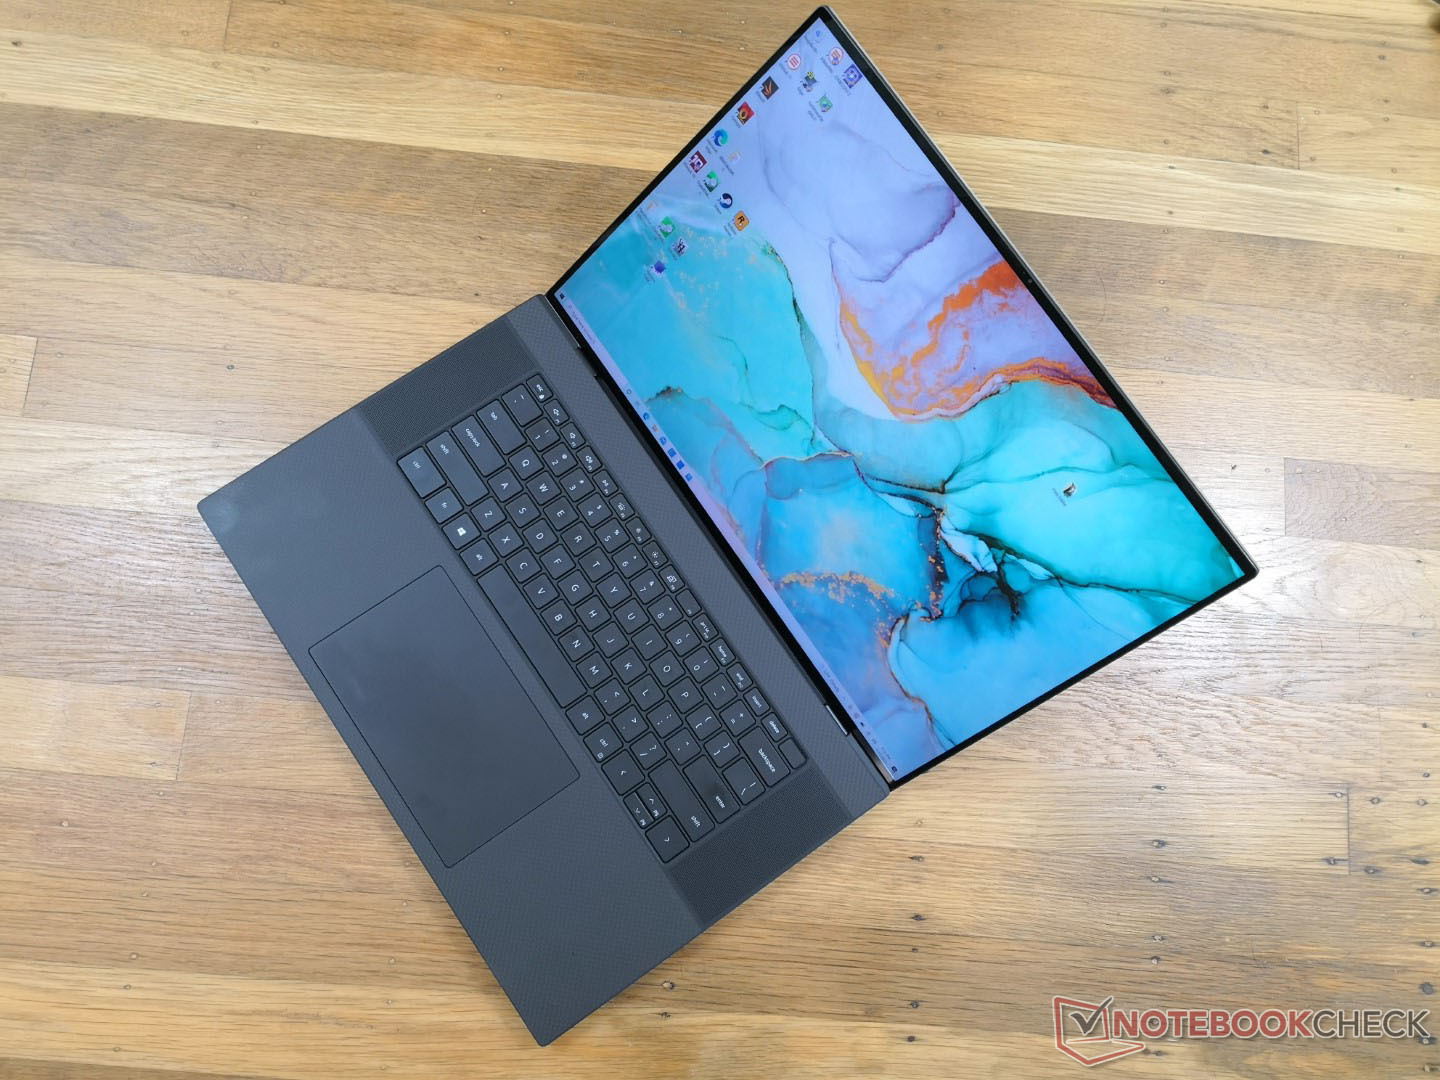
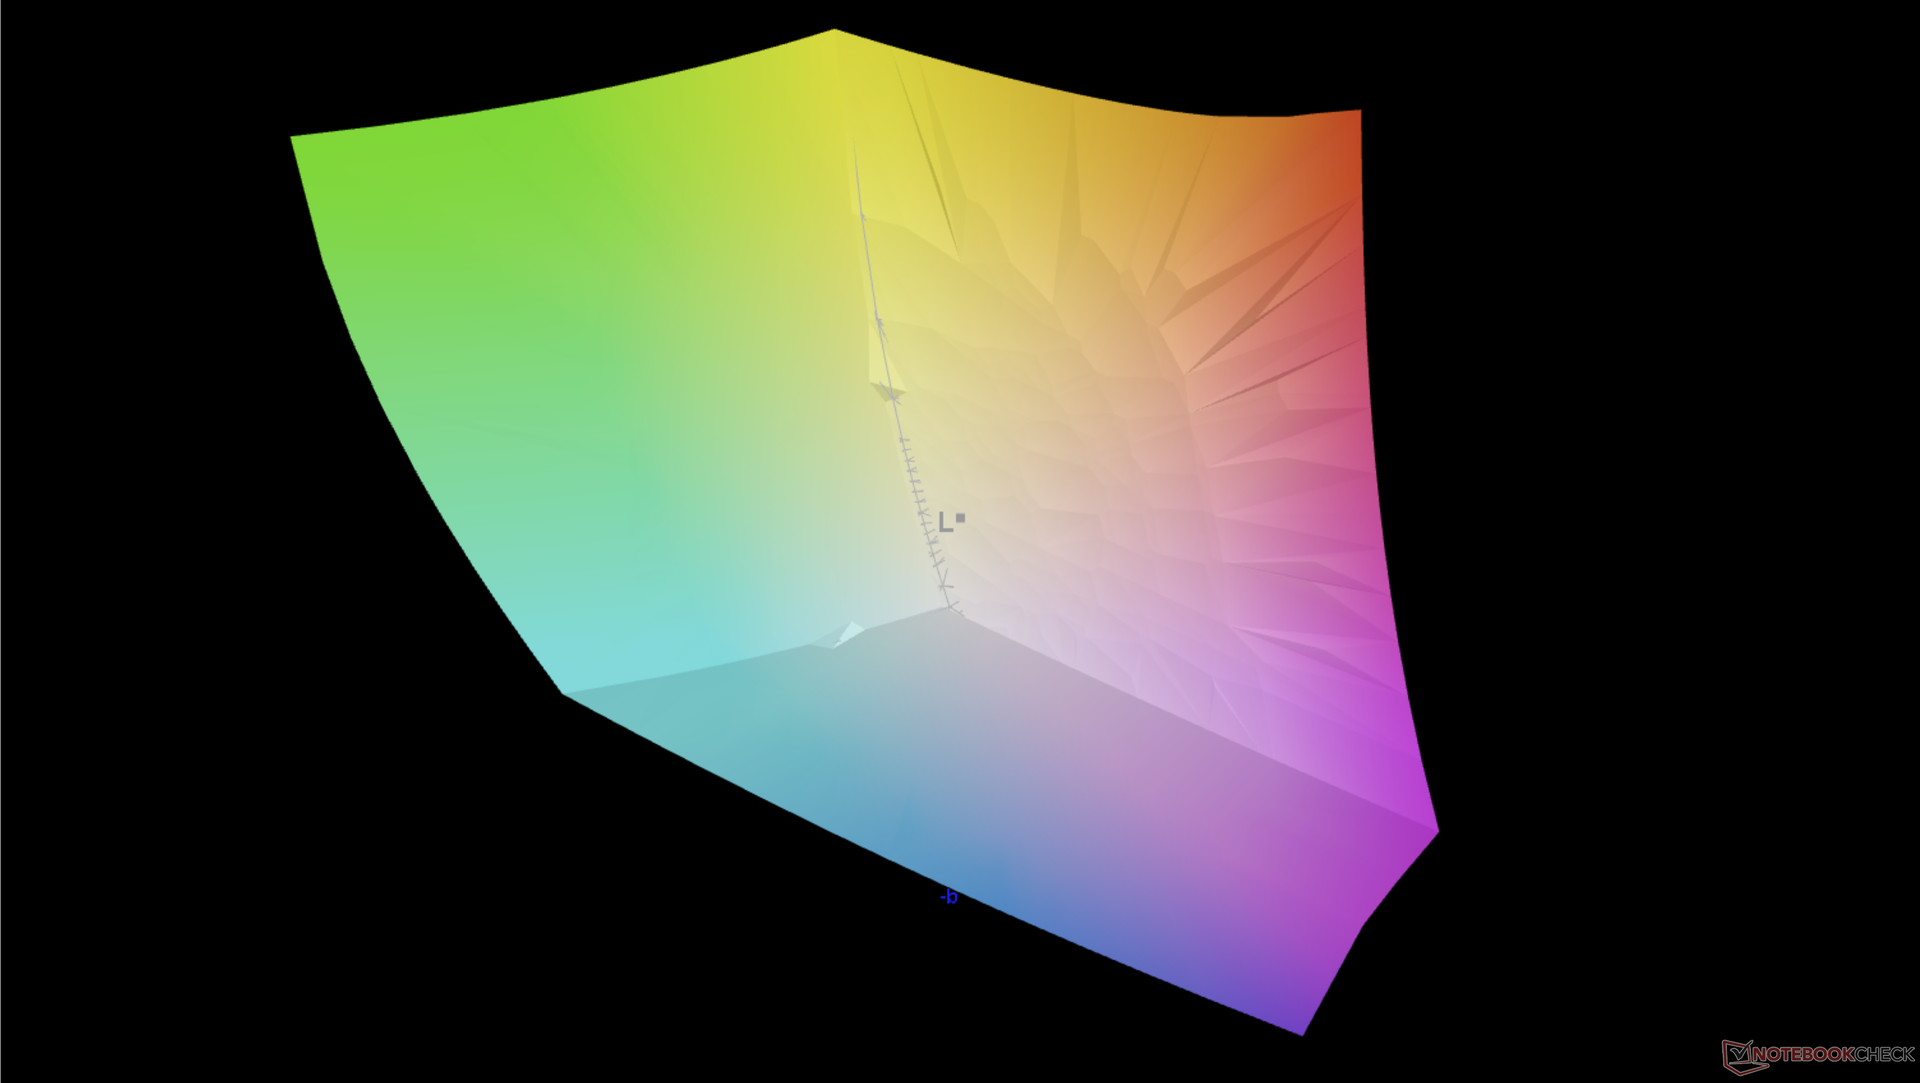
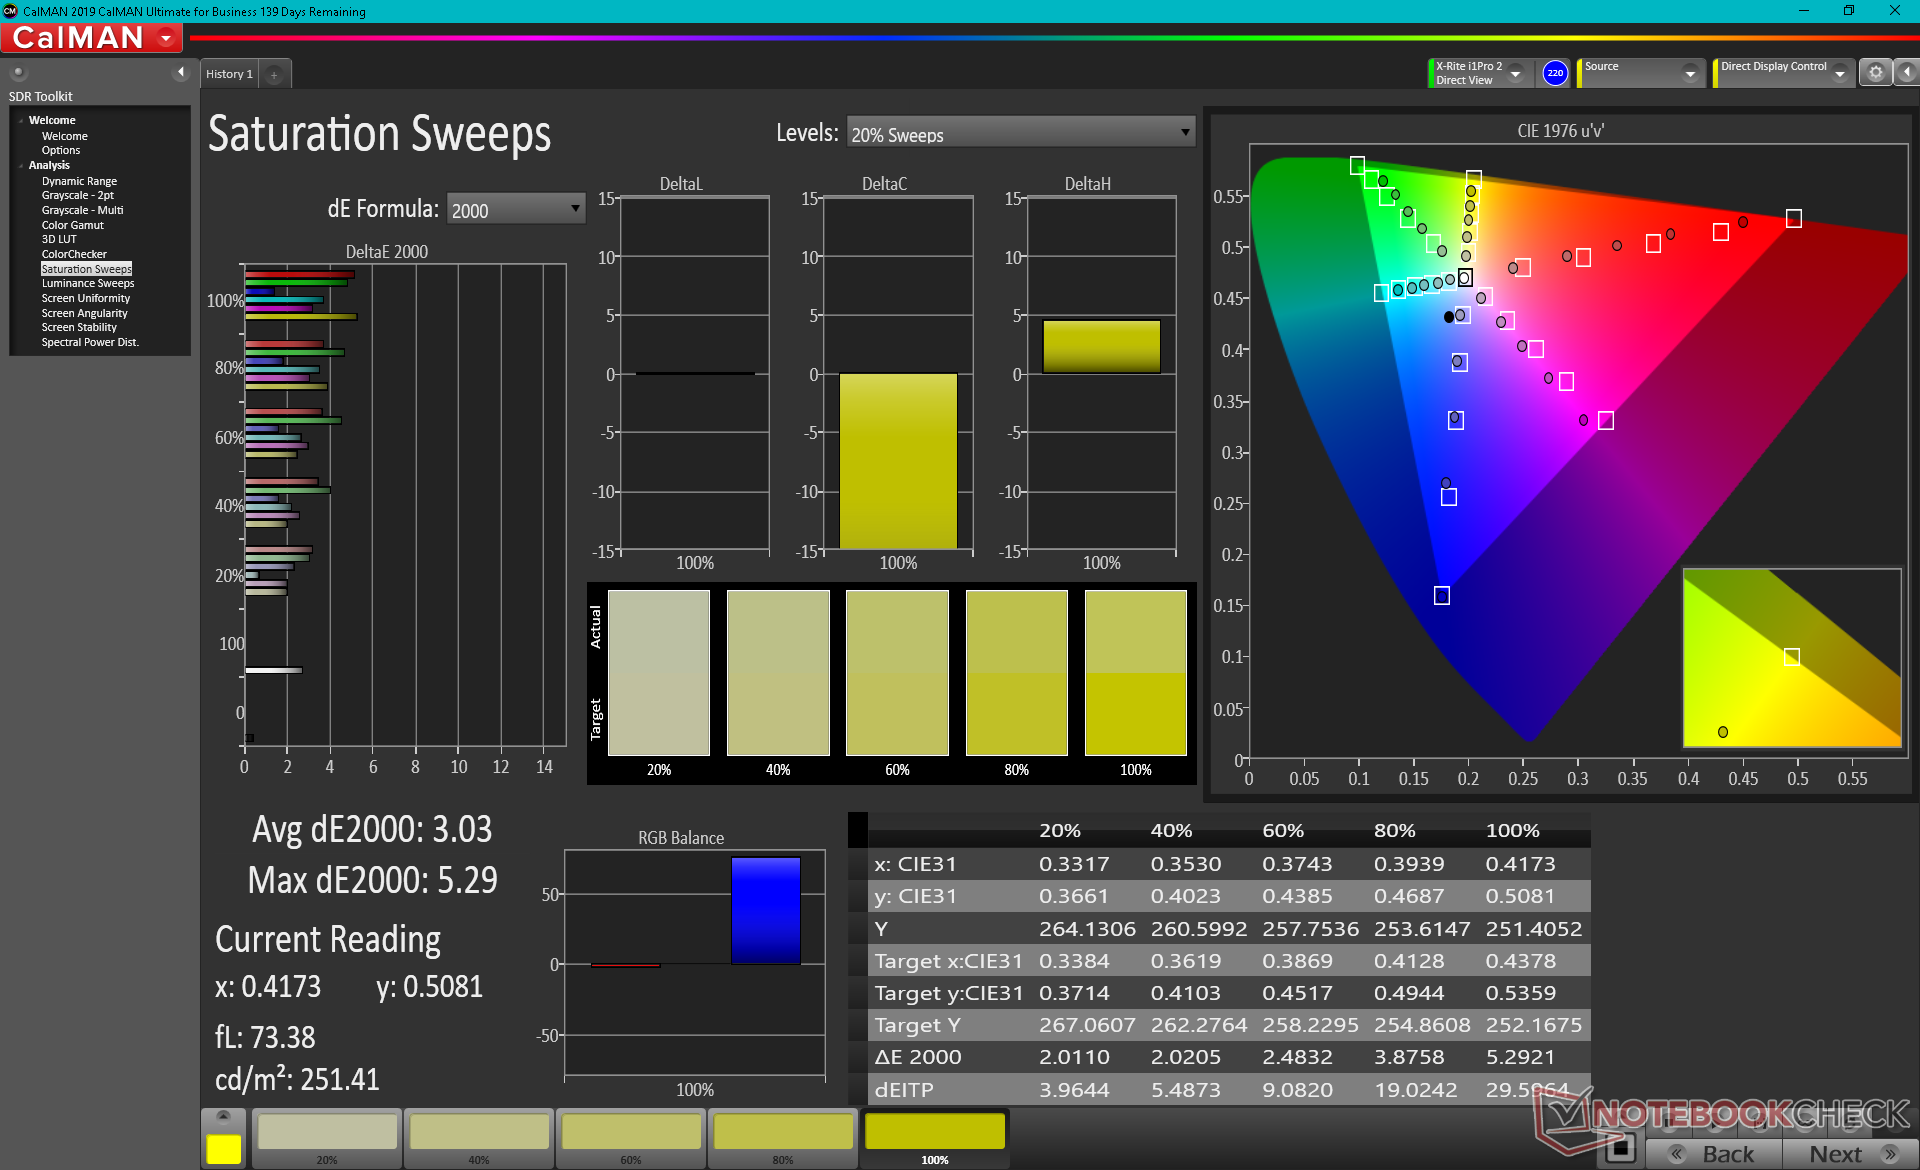
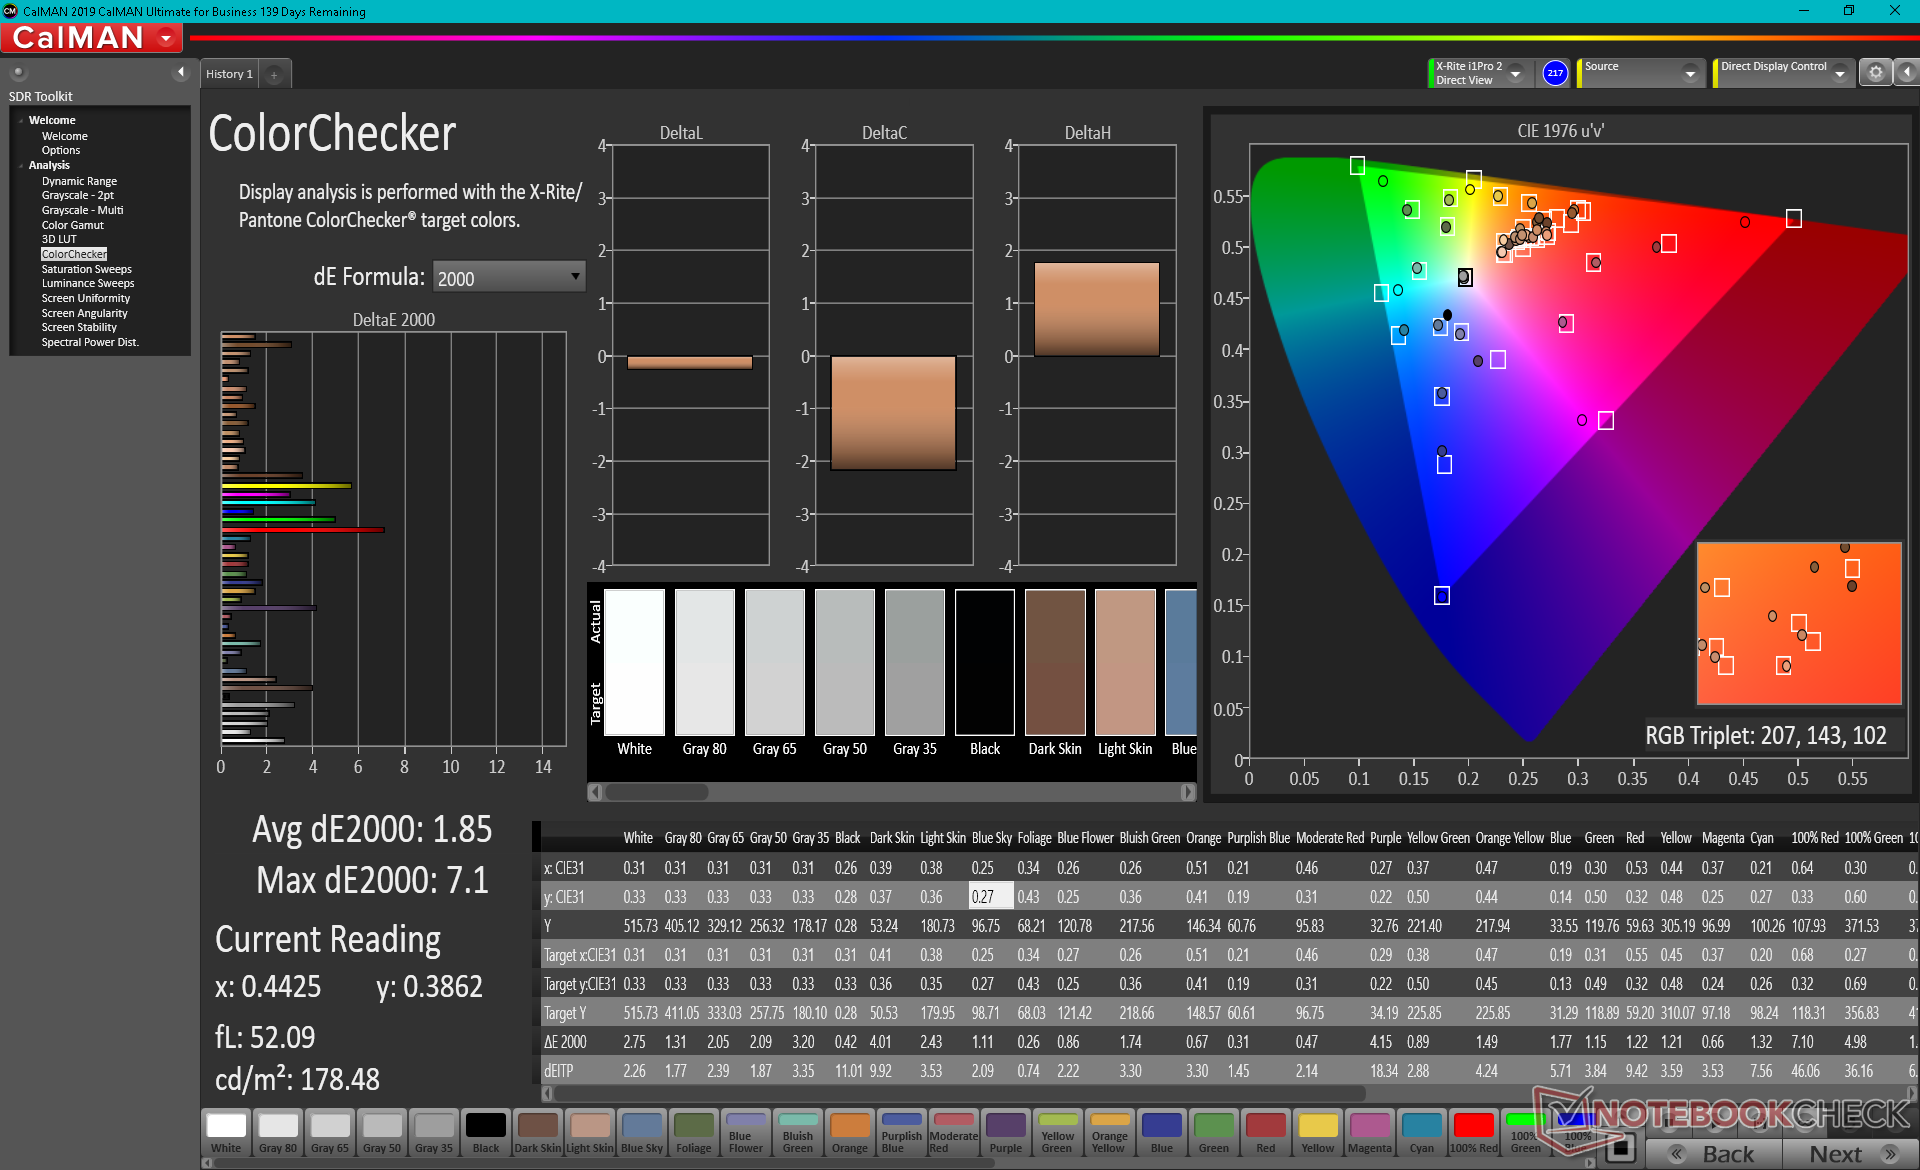
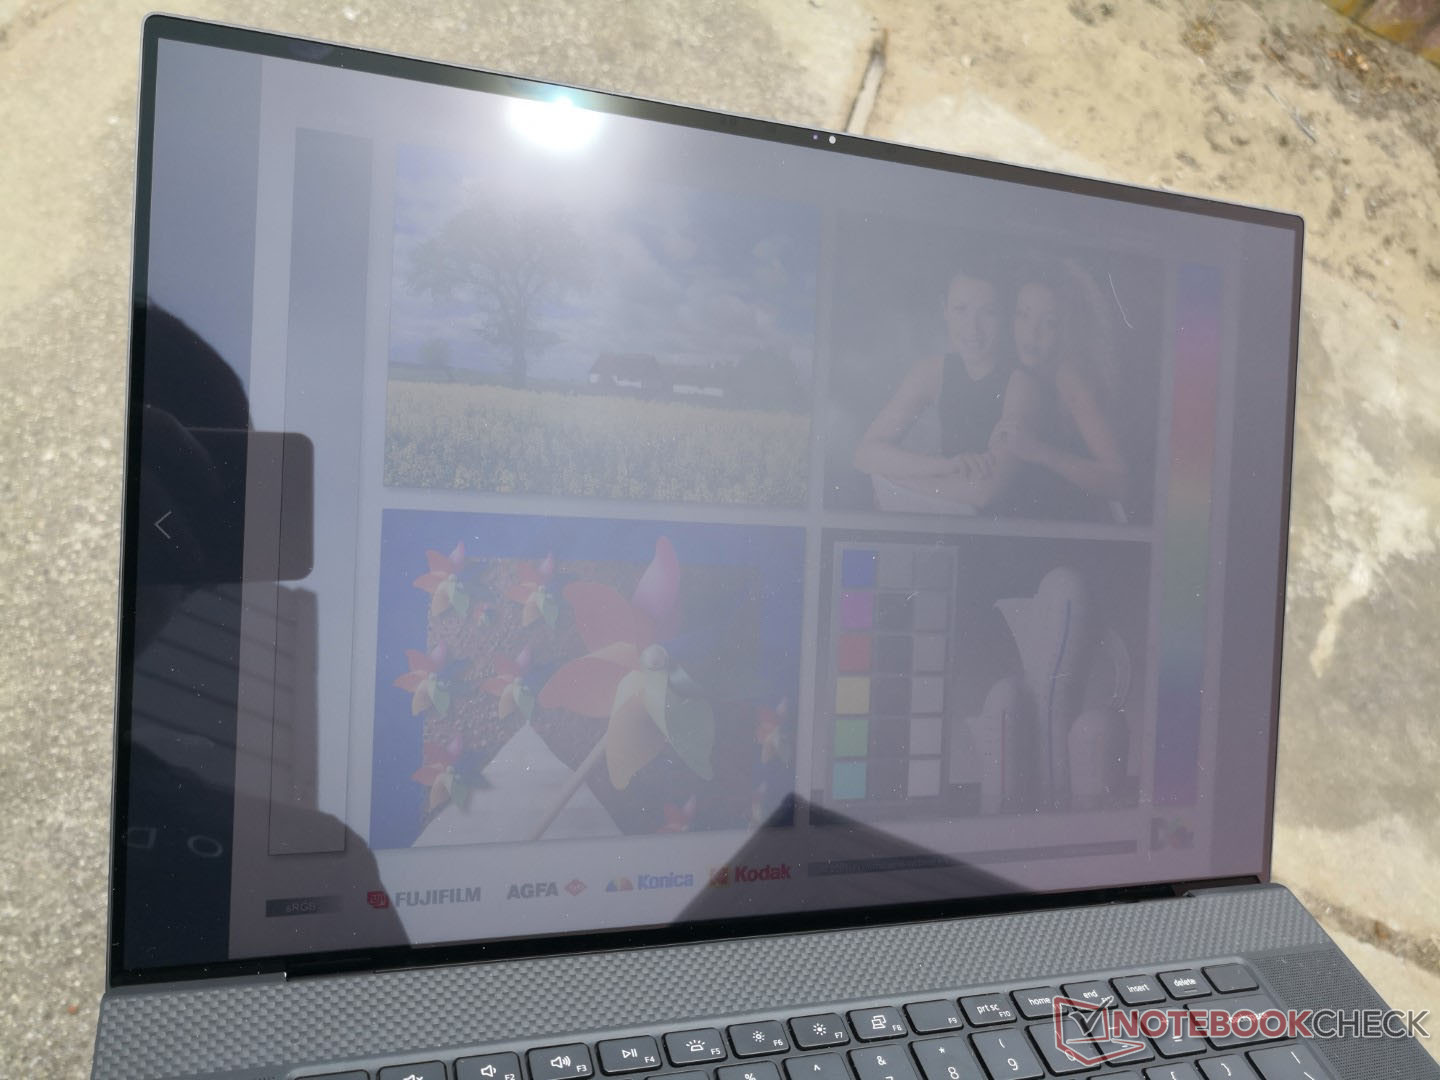
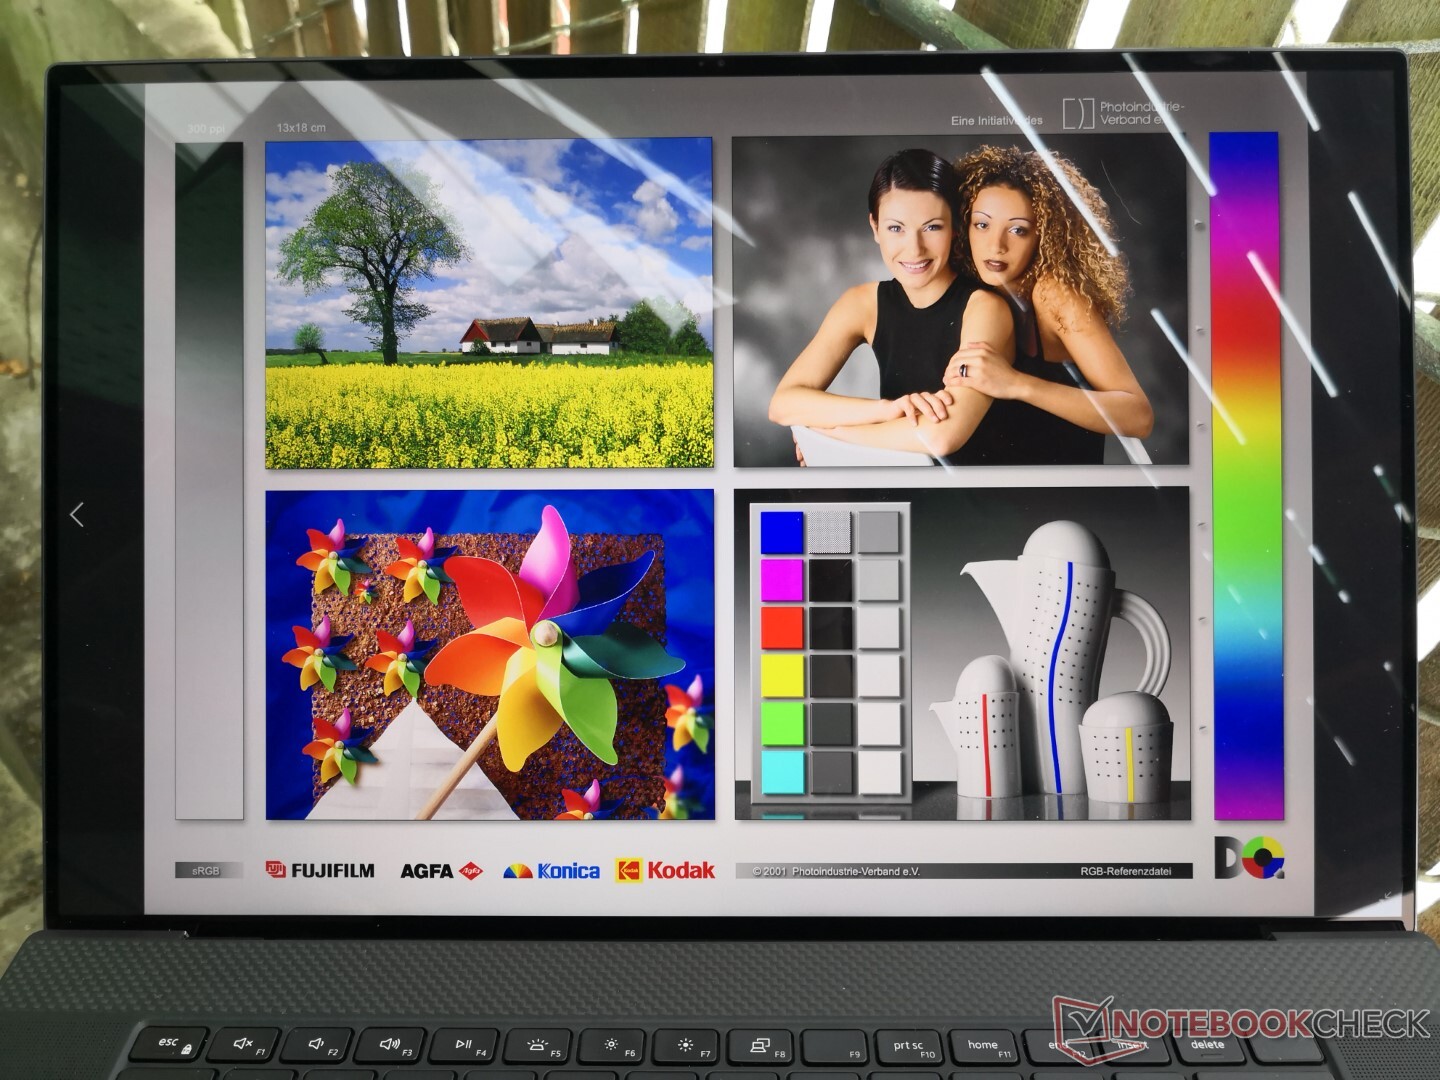
Pantalla - La primera pantalla táctil 16:10 4K de 17,0 pulgadas
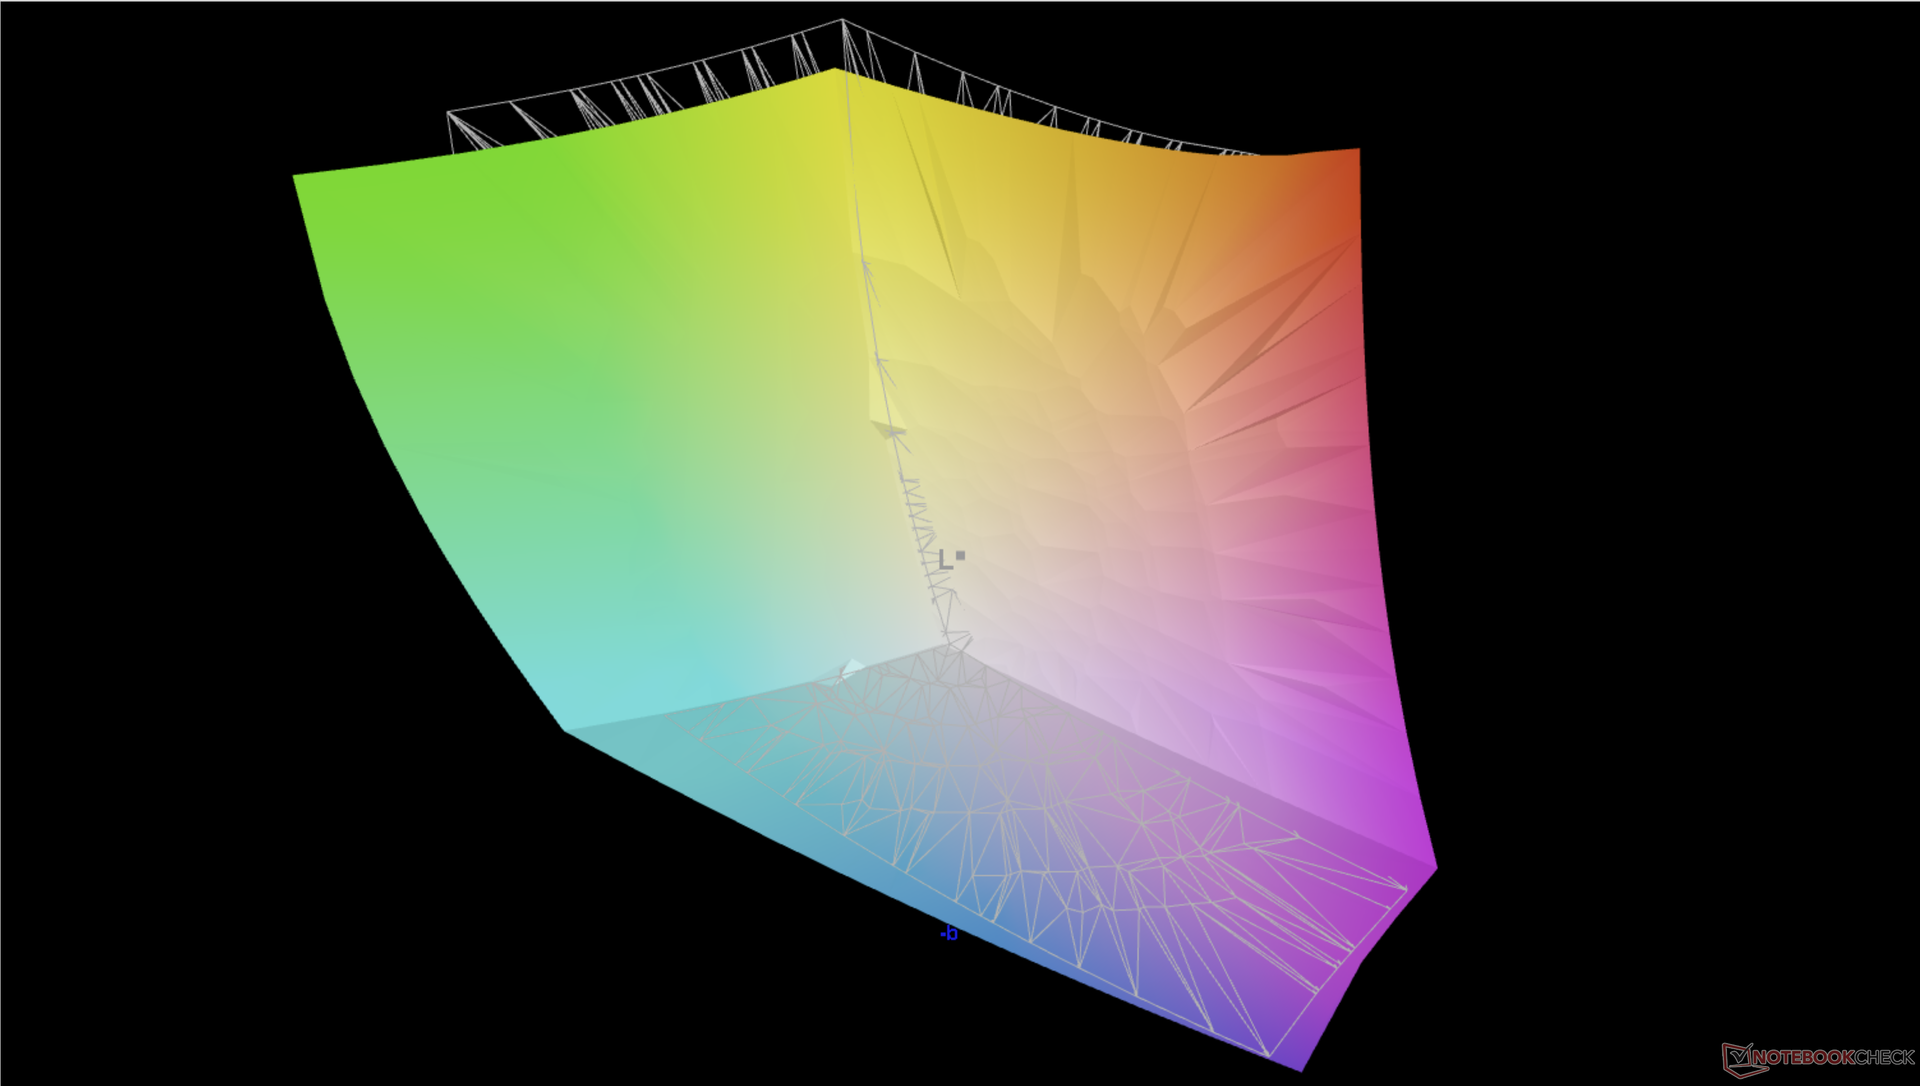
Aunque los procesadores han cambiado, la pantalla no. El XPS 17 de 2021 utiliza la misma pantalla táctil Sharp LQ170R1 3840 x 2400 que se encuentra en la versión de 2020 para la misma experiencia visual. No vemos esto como un problema ya que el XPS 17 sigue teniendo uno de los ratios pantalla-cuerpo más altos y pantallas de mayor calidad en términos de cobertura de color (95 por ciento DCI-P3), contraste (~1500:1) y brillo (~500 nits) para su categoría 16:10.

| |||||||||||||||||||||||||
iluminación: 85 %
Brillo con batería: 536.5 cd/m²
Contraste: 1450:1 (Negro: 0.37 cd/m²)
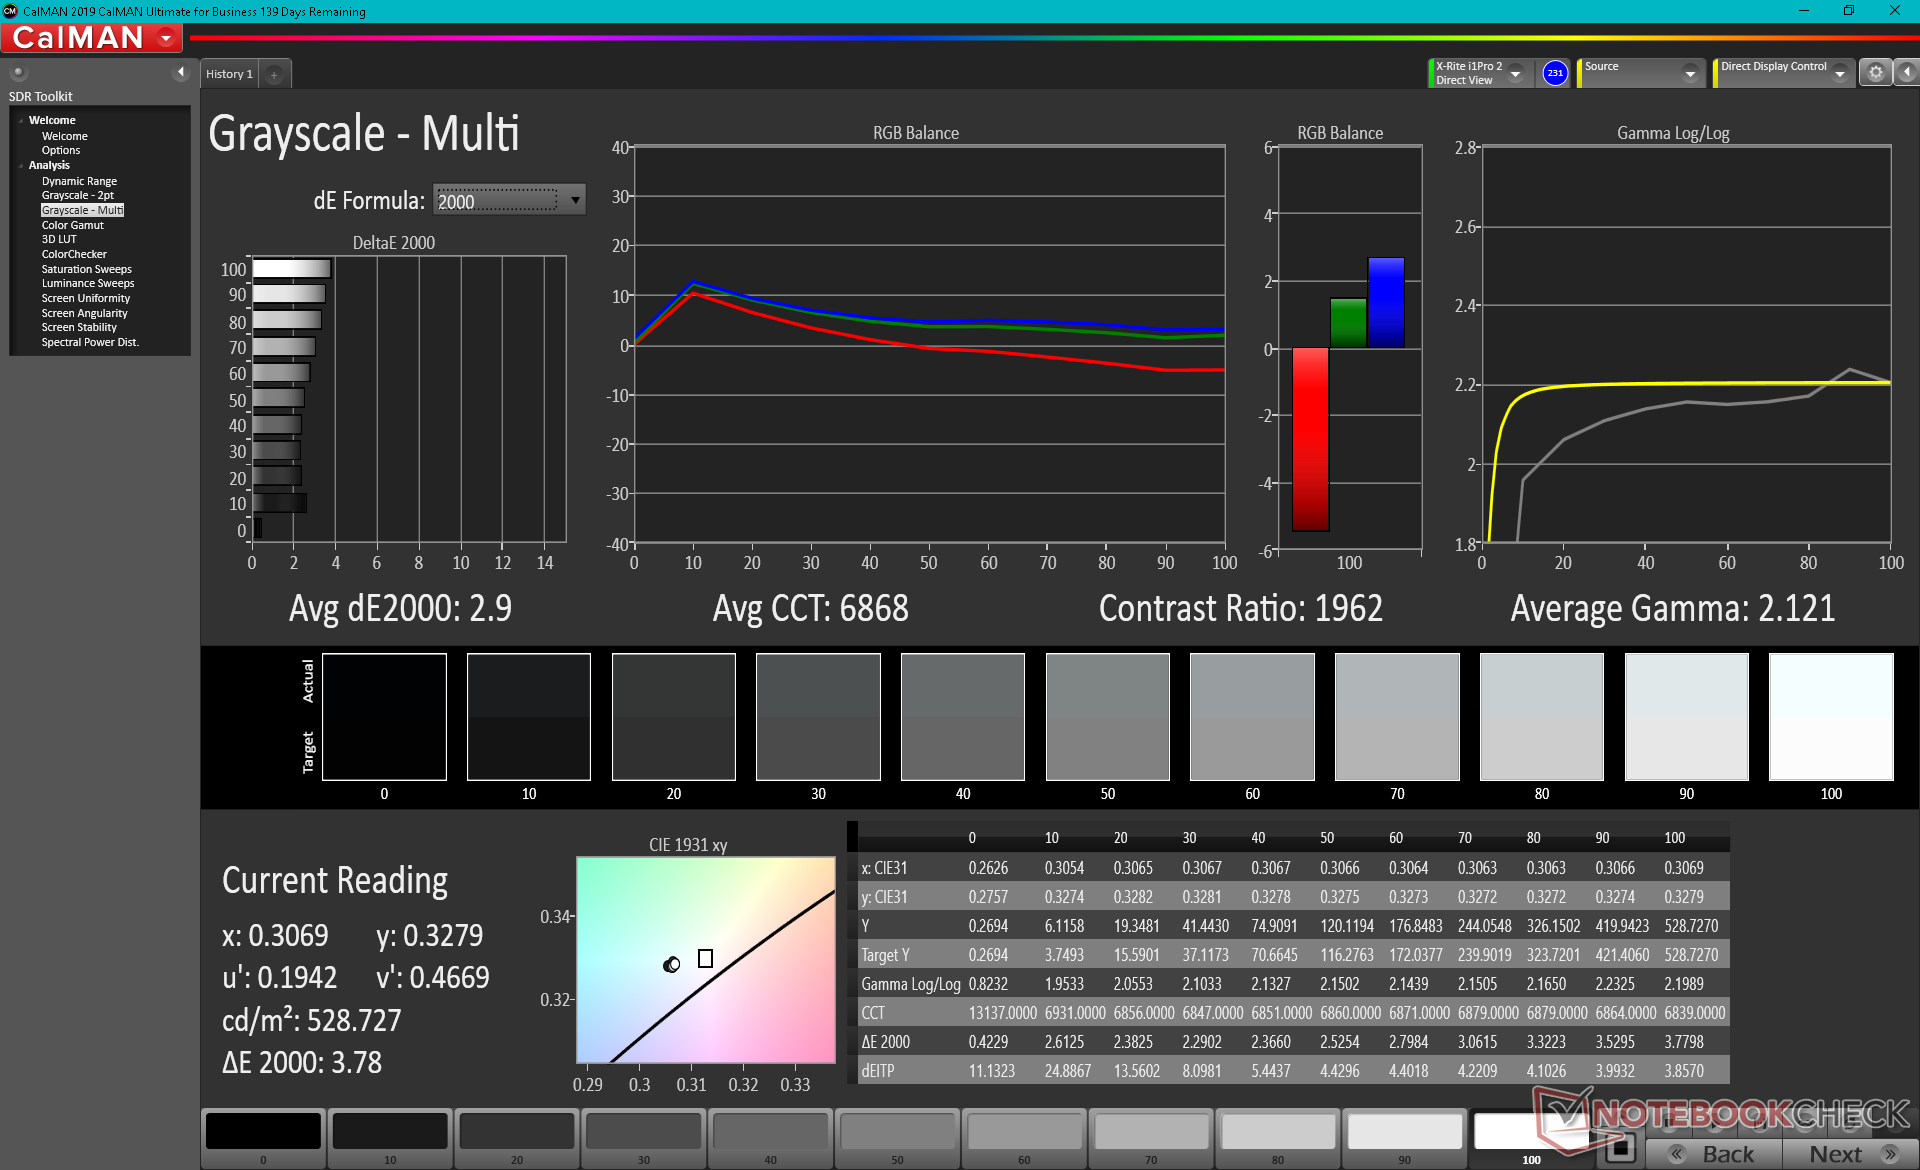
ΔE ColorChecker Calman: 2.46 | ∀{0.5-29.43 Ø4.71}
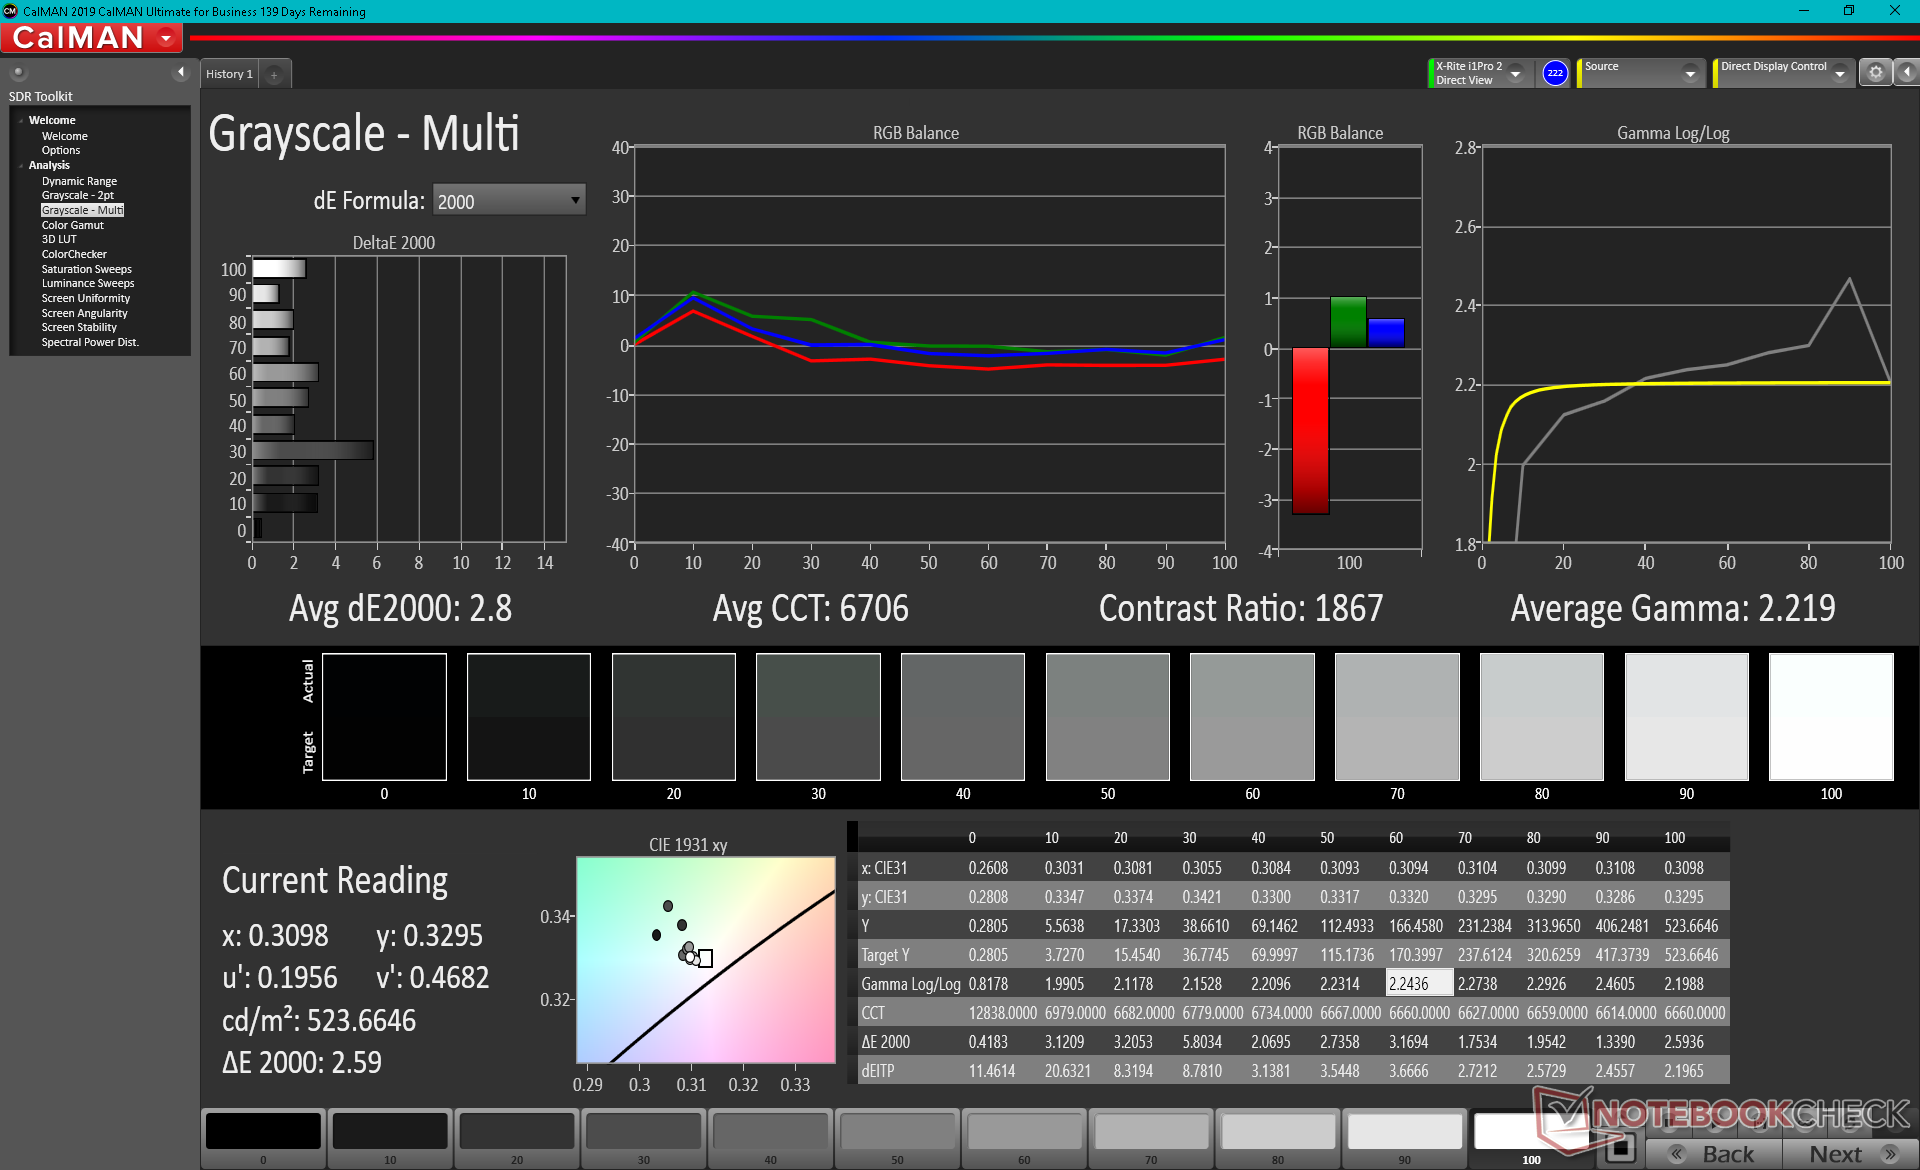
calibrated: 1.85
ΔE Greyscale Calman: 2.9 | ∀{0.09-98 Ø4.96}
100% AdobeRGB 1998 (Argyll 3D)
100% sRGB (Argyll 3D)
94.8% Display P3 (Argyll 3D)
Gamma: 2.12
CCT: 6868 K
| Dell XPS 17 9710 Core i7 RTX 3060 Sharp LQ170R1, IPS, 17", 3840x2400 | Dell XPS 17 9700 Core i7 RTX 2060 Max-Q Sharp LQ170R1, IPS, 17", 3840x2400 | Razer Blade Pro 17 2021 (QHD Touch) AU Optronics B173ZAN03.3, IPS, 17.3", 3840x2160 | Gigabyte Aero 17 HDR YC AUO B173ZAN03.2 (AUO329B), IPS-Level, 17.3", 3840x2160 | LG Ultra 17U70N LG LP170WQ1-SPA1, IPS, 17", 2560x1600 | Eluktronics RP-17 BOE NV173FHM-N44, IPS, 17.3", 1920x1080 | |
|---|---|---|---|---|---|---|
| Display | -2% | -2% | -3% | -24% | -25% | |
| Display P3 Coverage (%) | 94.8 | 90.5 -5% | 88.6 -7% | 87.3 -8% | 64.2 -32% | 64.7 -32% |
| sRGB Coverage (%) | 100 | 100 0% | 100 0% | 100 0% | 94.5 -5% | 92 -8% |
| AdobeRGB 1998 Coverage (%) | 100 | 99.8 0% | 99.9 0% | 99.9 0% | 65.2 -35% | 65.8 -34% |
| Response Times | -7% | 64% | 4% | 10% | 56% | |
| Response Time Grey 50% / Grey 80% * (ms) | 44.8 ? | 51.2 ? -14% | 15.2 ? 66% | 51.6 ? -15% | 41.2 ? 8% | 22.4 ? 50% |
| Response Time Black / White * (ms) | 32 ? | 32 ? -0% | 12 ? 62% | 24.8 ? 22% | 28.4 ? 11% | 12 ? 62% |
| PWM Frequency (Hz) | 943 | |||||
| Screen | -11% | -68% | 19% | 6% | -25% | |
| Brightness middle (cd/m²) | 536.5 | 539.4 1% | 407.2 -24% | 458 -15% | 415.4 -23% | 311.5 -42% |
| Brightness (cd/m²) | 489 | 494 1% | 403 -18% | 446 -9% | 385 -21% | 301 -38% |
| Brightness Distribution (%) | 85 | 84 -1% | 90 6% | 92 8% | 88 4% | 91 7% |
| Black Level * (cd/m²) | 0.37 | 0.32 14% | 0.42 -14% | 0.37 -0% | 0.24 35% | 0.31 16% |
| Contrast (:1) | 1450 | 1686 16% | 970 -33% | 1238 -15% | 1731 19% | 1005 -31% |
| Colorchecker dE 2000 * | 2.46 | 4.12 -67% | 7.25 -195% | 1.52 38% | 2.42 2% | 4.13 -68% |
| Colorchecker dE 2000 max. * | 7.74 | 7.65 1% | 12.51 -62% | 2.51 68% | 5.55 28% | 7.32 5% |
| Colorchecker dE 2000 calibrated * | 1.85 | 3.91 -111% | 3.62 -96% | 0.66 64% | 1.68 9% | 2.93 -58% |
| Greyscale dE 2000 * | 2.9 | 1.5 48% | 8.1 -179% | 1.9 34% | 2.9 -0% | 3.3 -14% |
| Gamma | 2.12 104% | 2.15 102% | 2.24 98% | 2.145 103% | 2.21 100% | 2.17 101% |
| CCT | 6868 95% | 6438 101% | 5925 110% | 6534 99% | 6864 95% | 7157 91% |
| Color Space (Percent of AdobeRGB 1998) (%) | 90.4 | 88.1 | 100 | 60.2 | 59.5 | |
| Color Space (Percent of sRGB) (%) | 100 | 100 | 100 | 94.2 | 91.6 | |
| Media total (Programa/Opciones) | -7% /
-8% | -2% /
-35% | 7% /
12% | -3% /
0% | 2% /
-13% |
* ... más pequeño es mejor
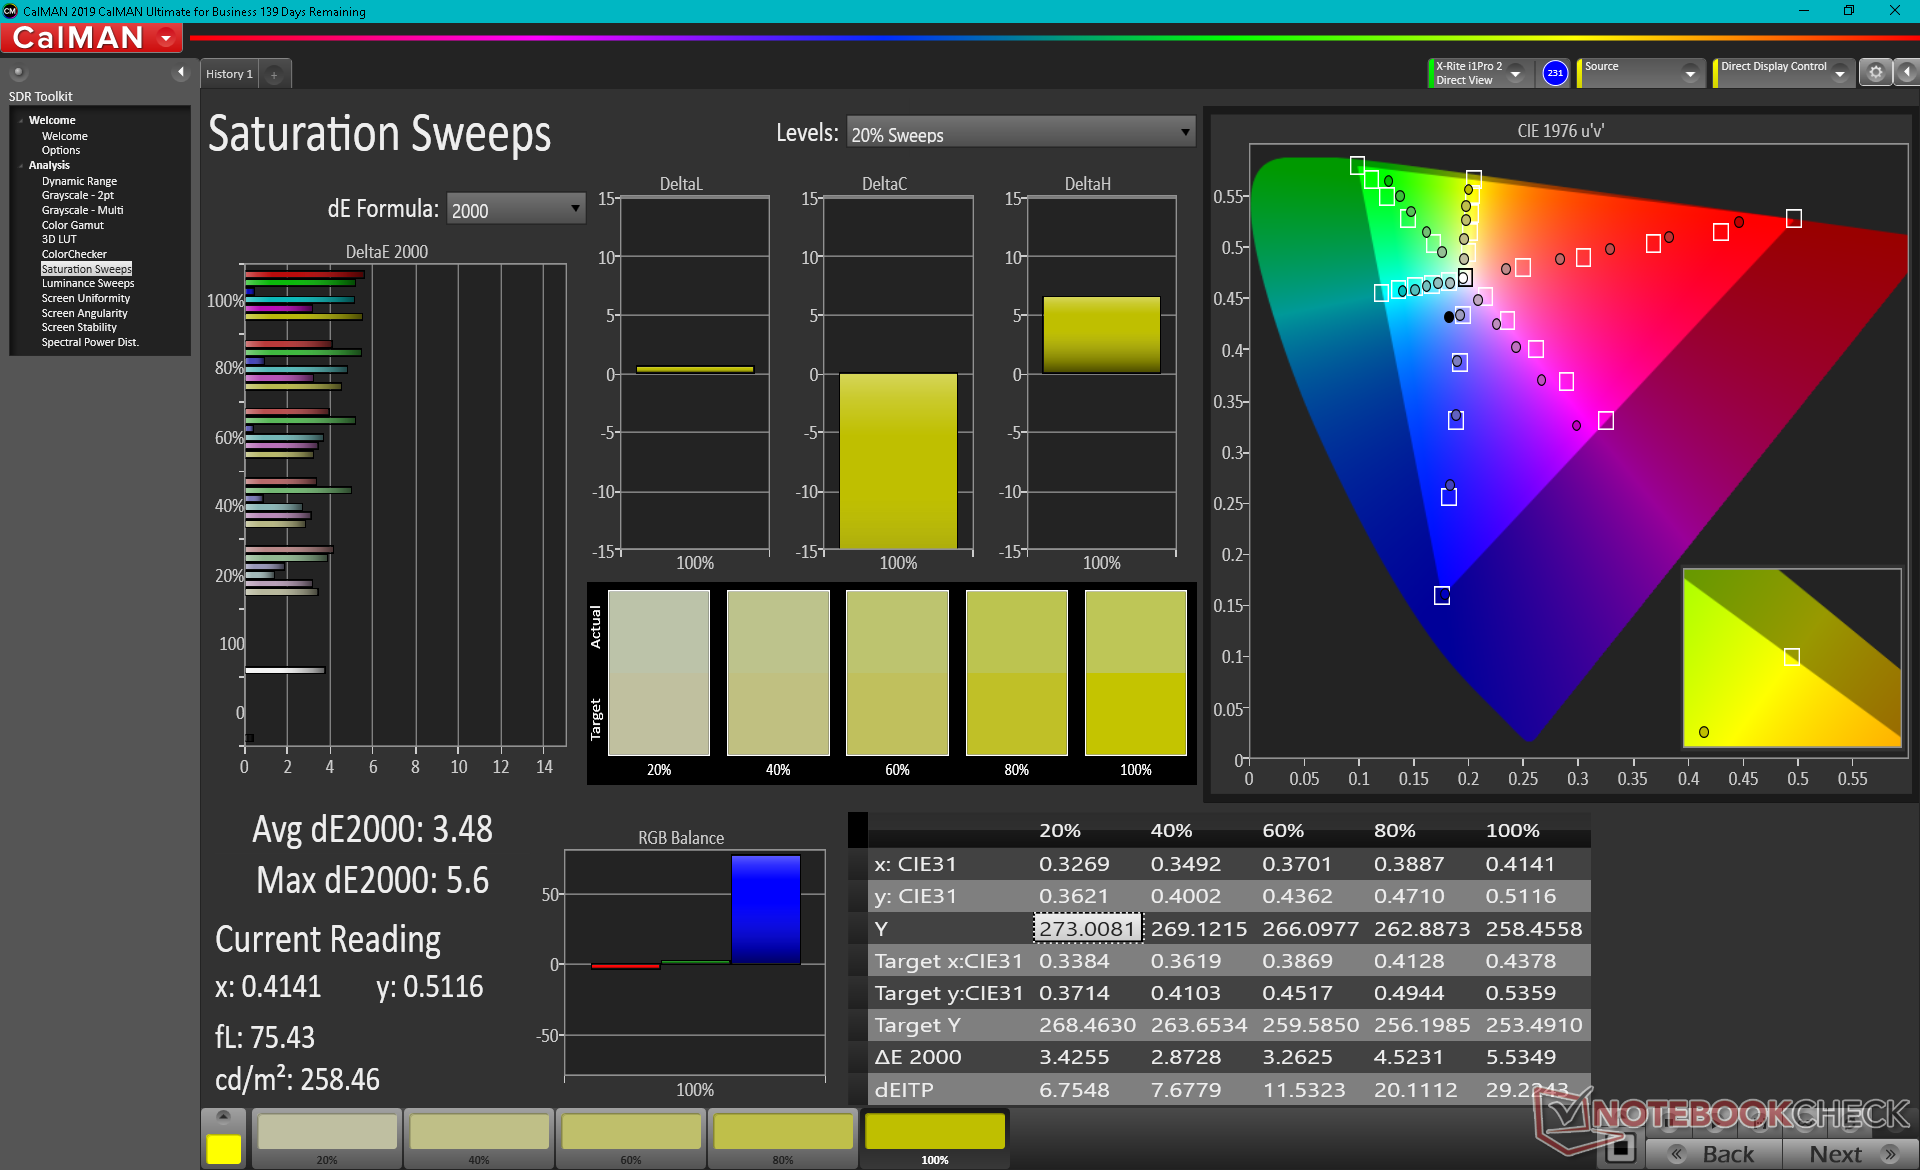
La pantalla está bien calibrada desde el principio, con unos valores DeltaE medios de escala de grises y color de sólo 2,9 y 2,46, respectivamente. Calibrando el panel aún más nosotros mismos reduciríamos el DeltaE de color medio a 1,85, pero los colores primarios y secundarios sólidos seguirían siendo más imprecisos que otros colores.

Tiempos de respuesta del display
| ↔ Tiempo de respuesta de Negro a Blanco | ||
|---|---|---|
| 32 ms ... subida ↗ y bajada ↘ combinada | ↗ 15.6 ms subida | 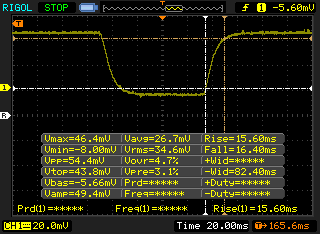 |
| ↘ 16.4 ms bajada | ||
| La pantalla mostró tiempos de respuesta lentos en nuestros tests y podría ser demasiado lenta para los jugones. En comparación, todos los dispositivos de prueba van de ##min### (mínimo) a 240 (máximo) ms. » 86 % de todos los dispositivos son mejores. Eso quiere decir que el tiempo de respuesta es peor que la media (19.8 ms) de todos los dispositivos testados. | ||
| ↔ Tiempo de respuesta 50% Gris a 80% Gris | ||
| 44.8 ms ... subida ↗ y bajada ↘ combinada | ↗ 20.8 ms subida | 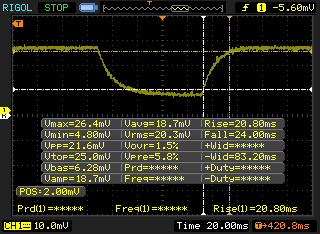 |
| ↘ 24 ms bajada | ||
| La pantalla mostró tiempos de respuesta lentos en nuestros tests y podría ser demasiado lenta para los jugones. En comparación, todos los dispositivos de prueba van de ##min### (mínimo) a 636 (máximo) ms. » 76 % de todos los dispositivos son mejores. Eso quiere decir que el tiempo de respuesta es peor que la media (31 ms) de todos los dispositivos testados. | ||
Parpadeo de Pantalla / PWM (Pulse-Width Modulation)
| Parpadeo de Pantalla / PWM no detectado | 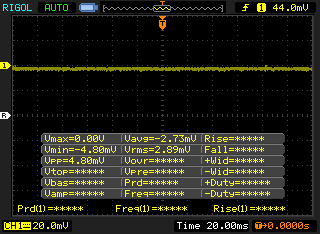 | ||
Comparación: 52 % de todos los dispositivos testados no usaron PWM para atenuar el display. Si se usó, medimos una media de 7754 (mínimo: 5 - máxmo: 343500) Hz. | |||


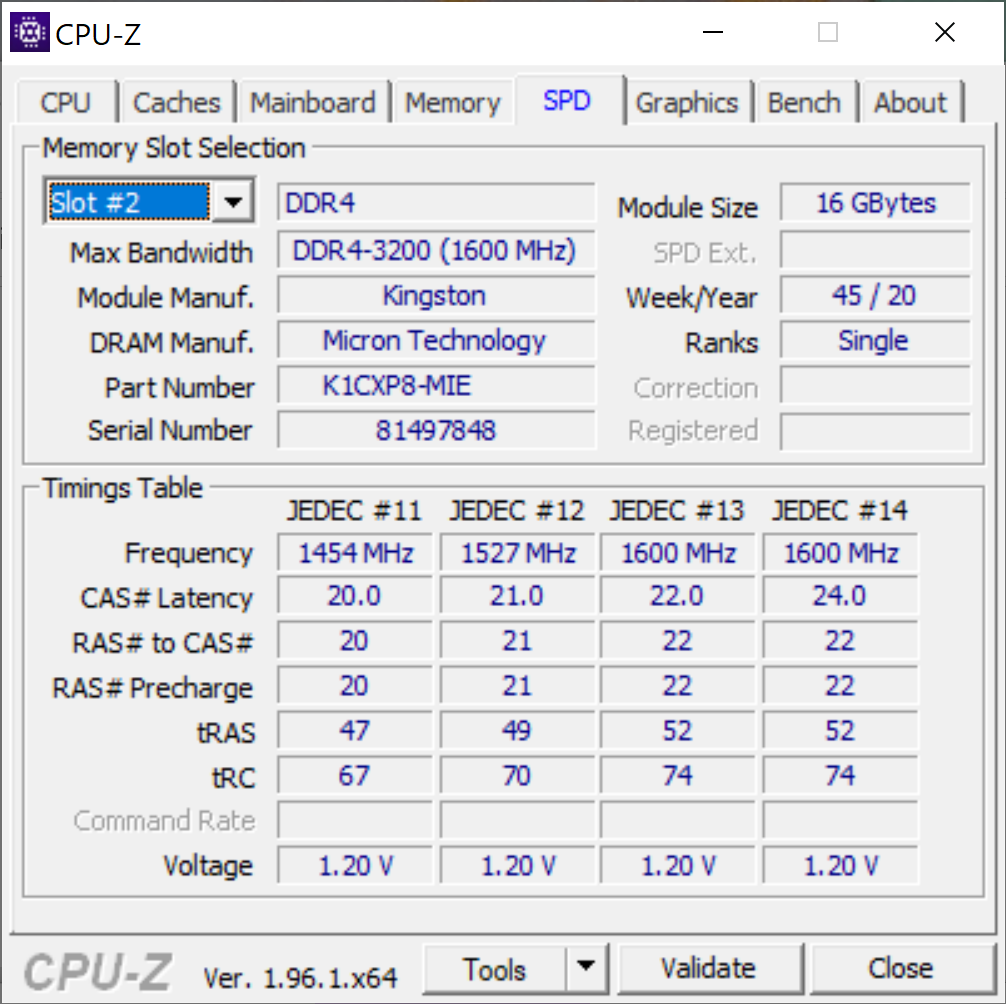
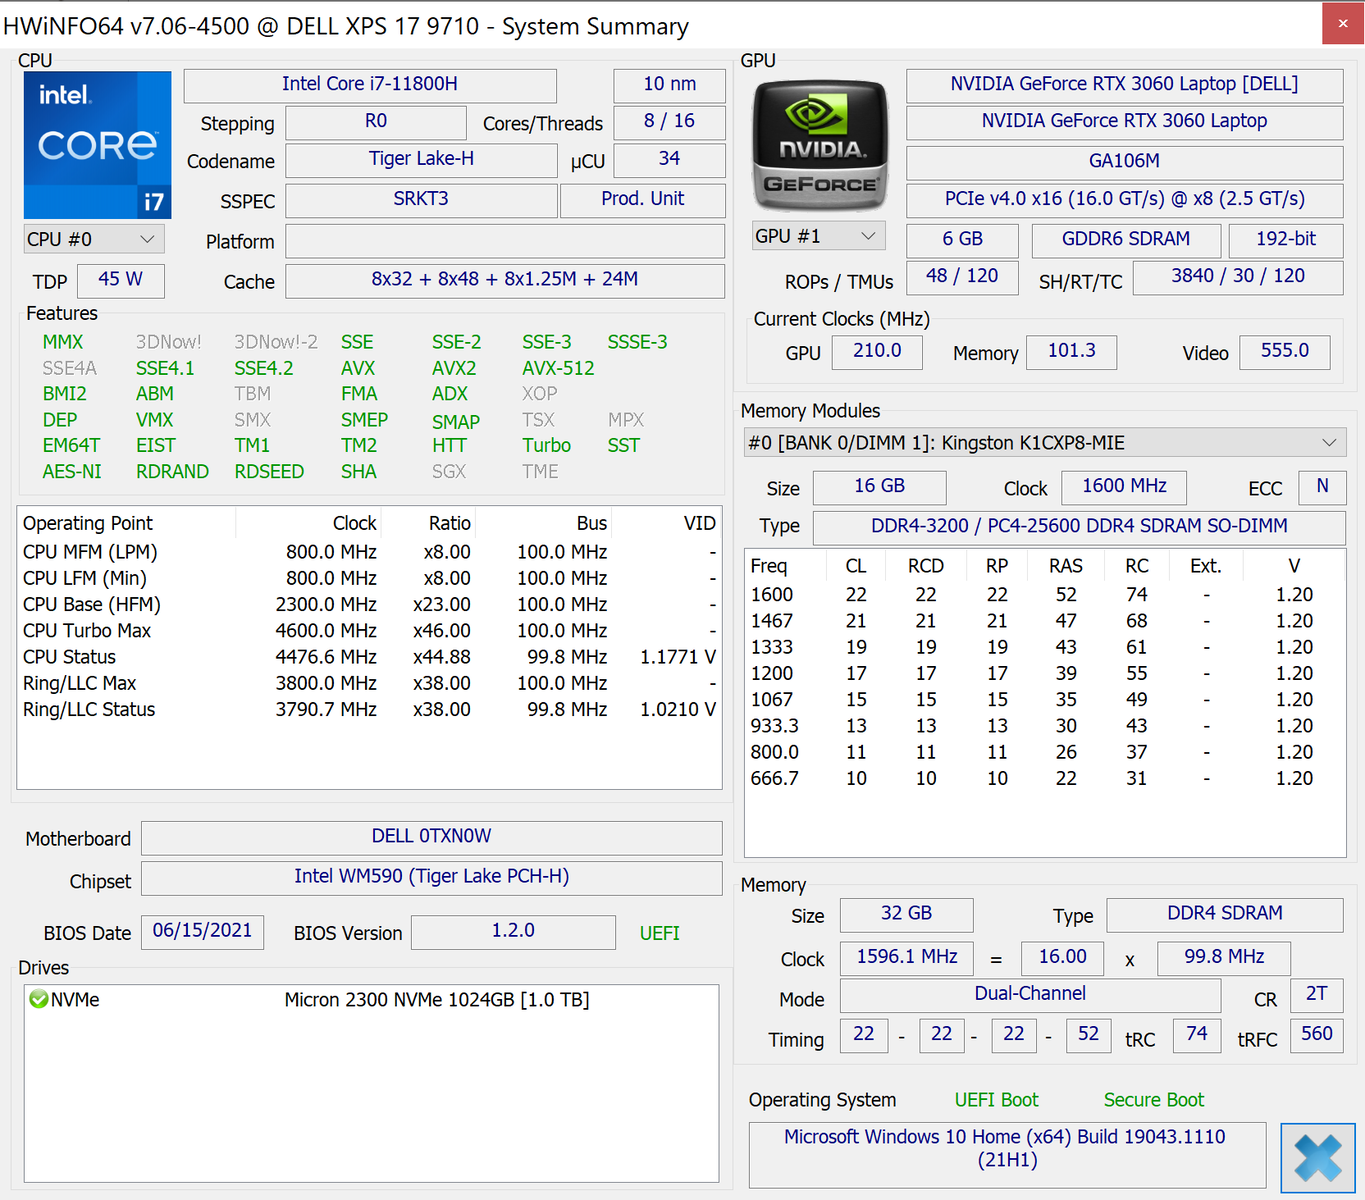
Rendimiento - CPU de 45 W TDP con GPU de 70 W TGP
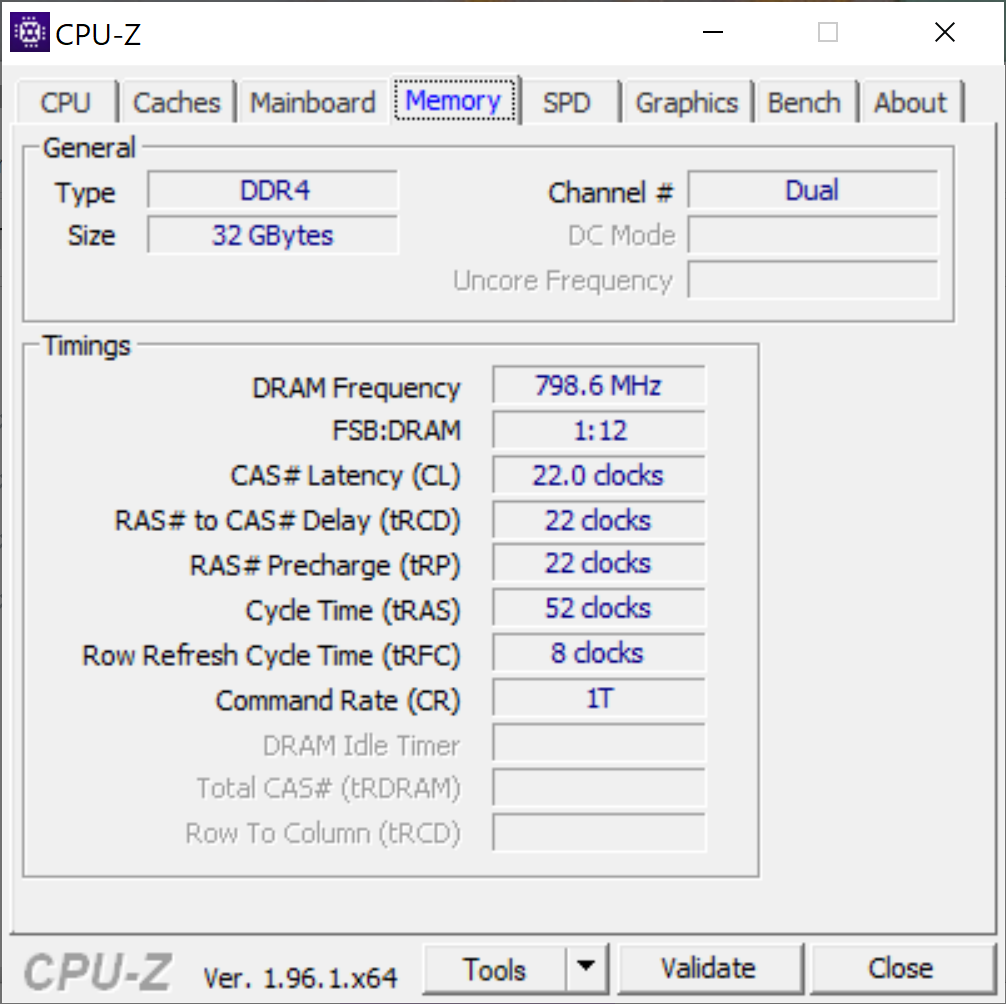
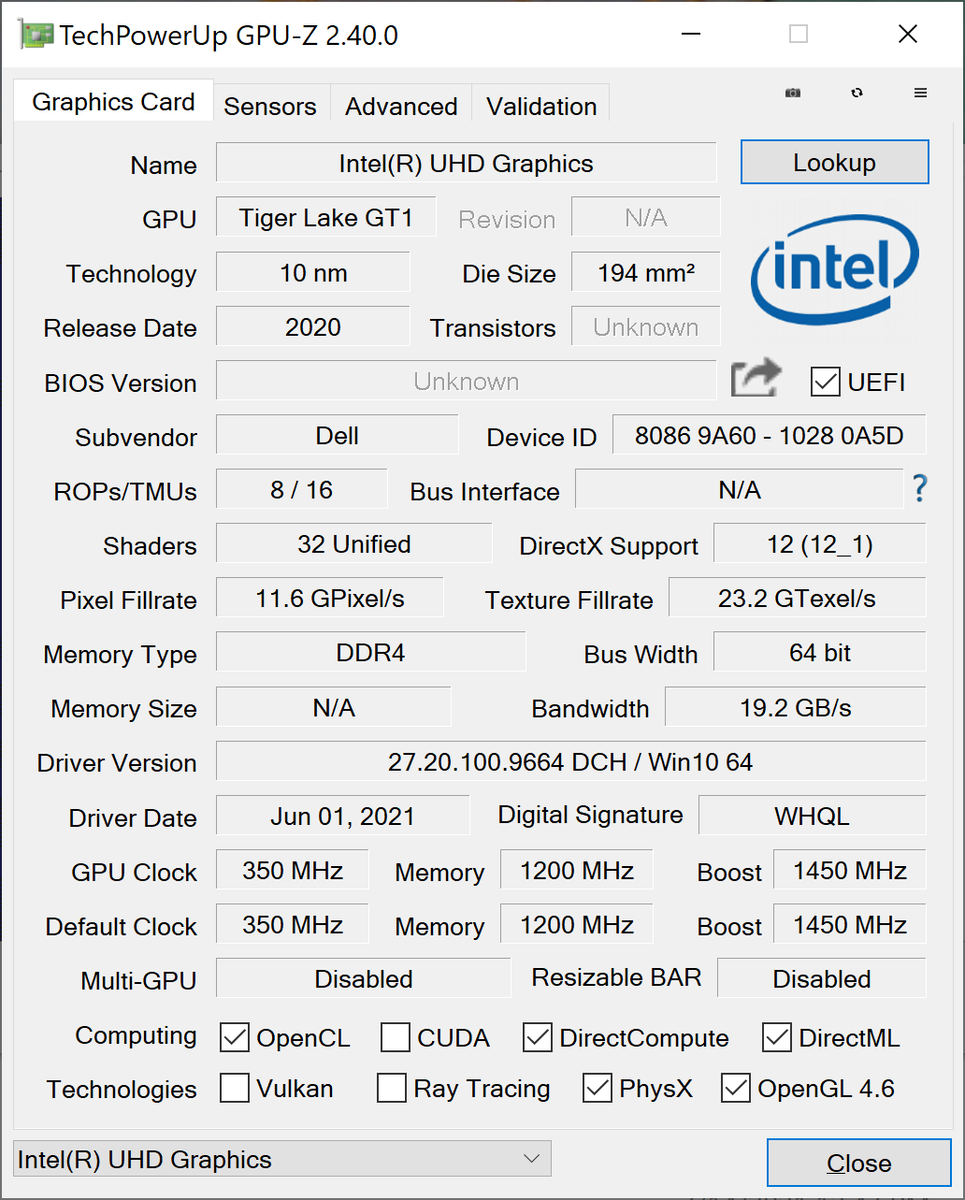
Las opciones de núcleo incluyen la CPU Core i5-11400H, i7-11800H o i9-11900H de 11ª generación con UHD Graphics, GeForce RTX 3050 o RTX 3060. La velocidad de la RAM (3200 MHz) sigue siendo la misma que en el XPS 17 9700. La barra redimensionable, Optimus, y Dynamic Book 2.0 vienen de serie si se configura con gráficos dedicados pero sin soporte para G-Sync interno (Advanced Optimus) o WhisperMode 2.0.
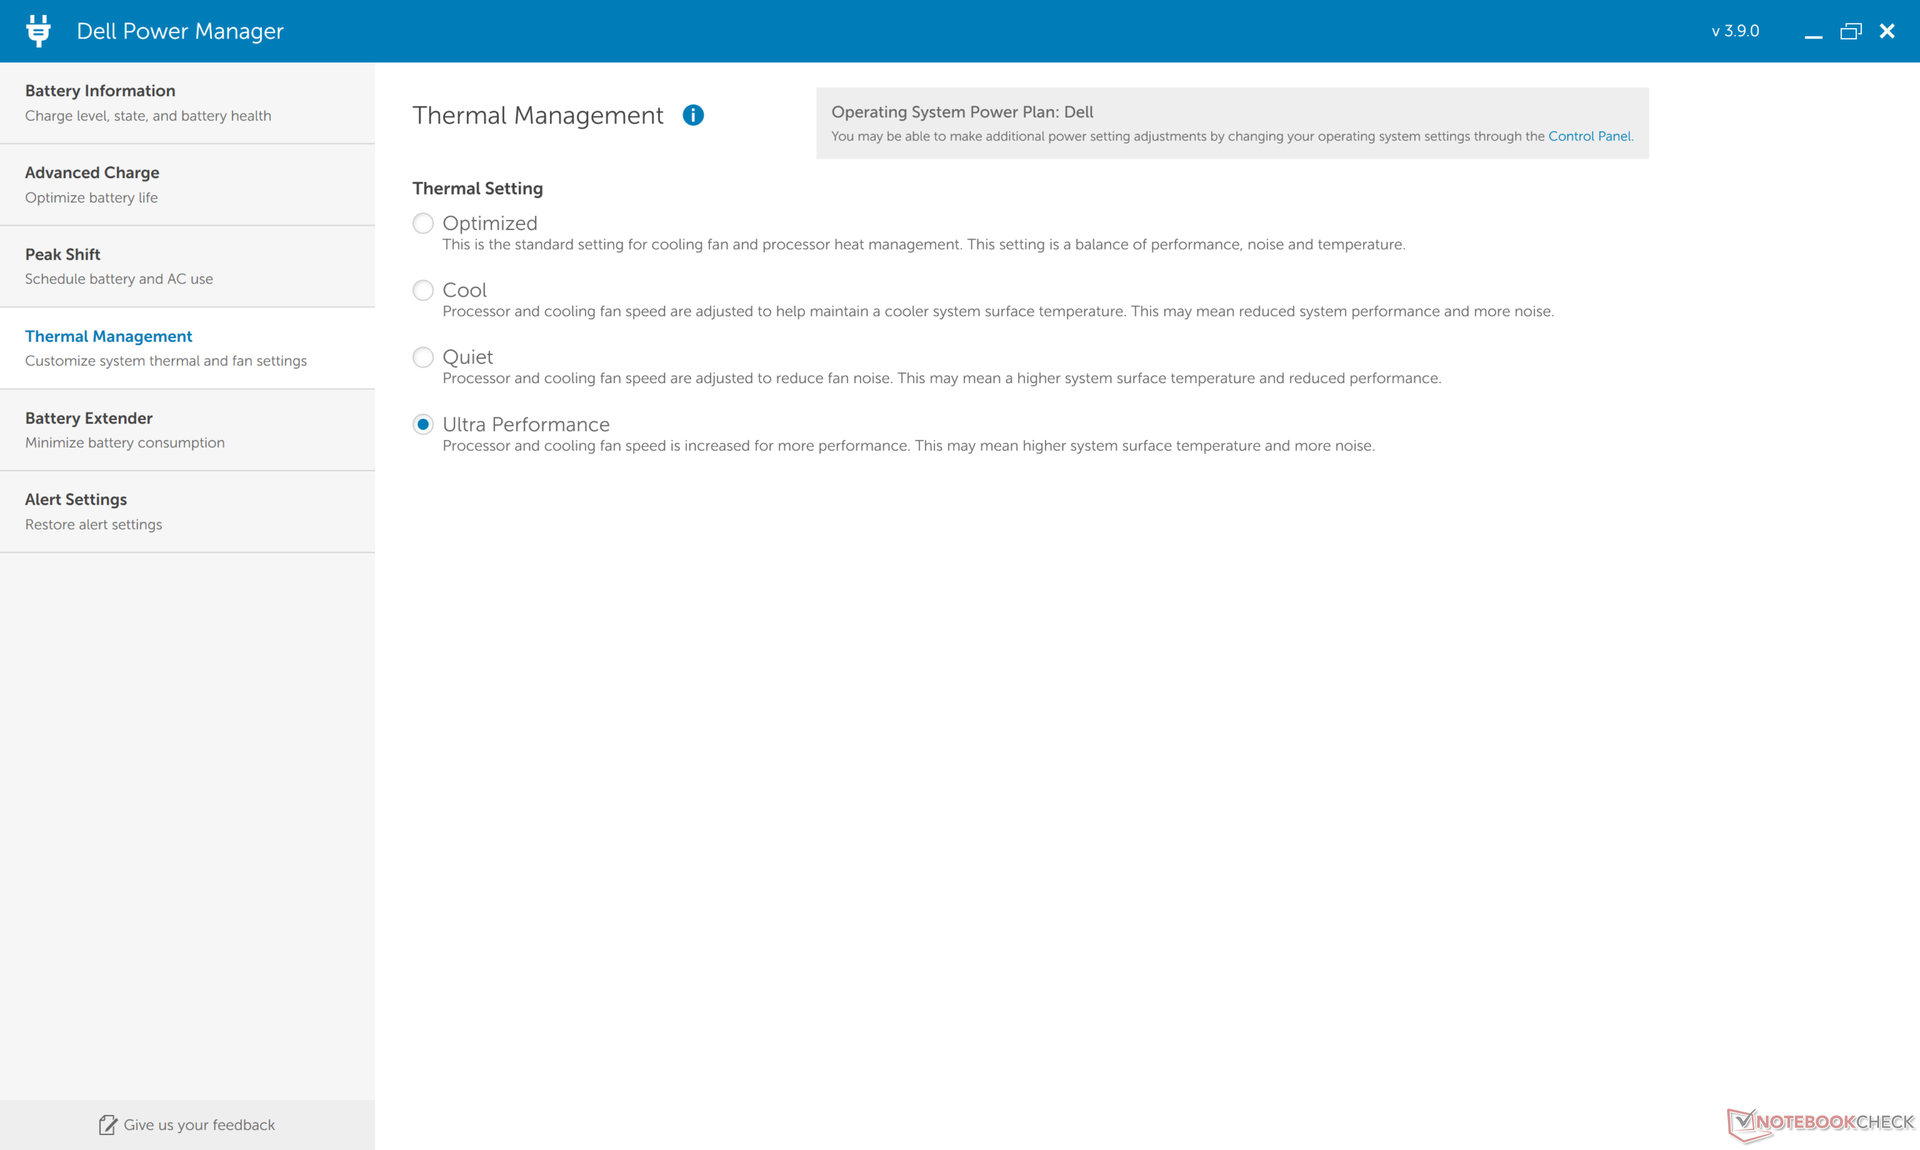
Nuestra unidad de pruebas se configuró en modo Ultra Performance a través de Dell Power Manager para obtener las puntuaciones más altas posibles.
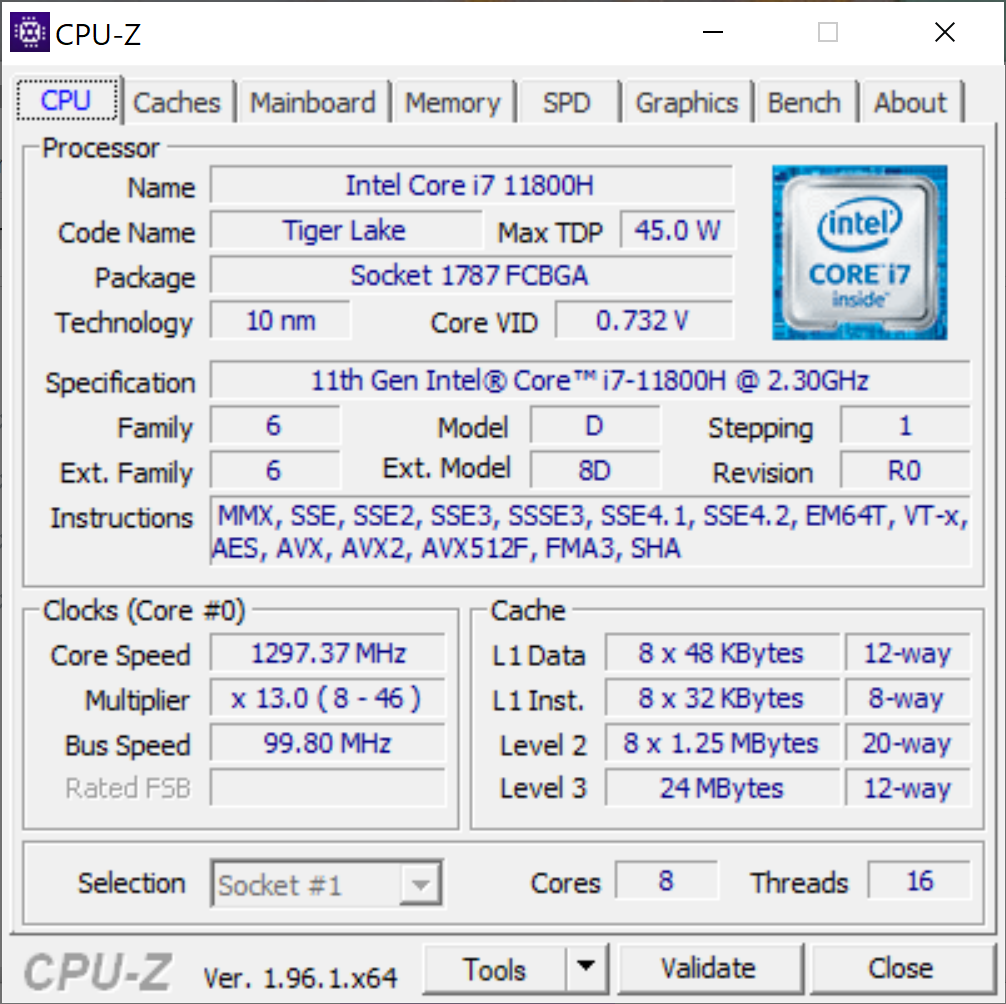
Procesador
El rendimiento de un solo hilo y de varios hilos aumenta un 20% y un 30%, respectivamente, con respecto al Core i7-10875H del modelo del año pasado. La sostenibilidad del rendimiento sigue siendo excelente, como demuestran los resultados de nuestro bucle CineBench R15 xT que aparecen a continuación
La actualización al más costoso Core i9-11900H Más costoso, probablemente sólo traerá beneficios marginales de rendimiento de sólo unos pocos puntos porcentuales. Las temperaturas del núcleo en nuestro i7-11800H ya rondan los 90 C bajo carga, por lo que una pieza Core i9 de mayor velocidad no tendrá casi ningún margen de maniobra adicional.
Cinebench R15 Multi Loop
Cinebench R23: Multi Core | Single Core
Cinebench R15: CPU Multi 64Bit | CPU Single 64Bit
Blender: v2.79 BMW27 CPU
7-Zip 18.03: 7z b 4 -mmt1 | 7z b 4
Geekbench 5.5: Single-Core | Multi-Core
HWBOT x265 Benchmark v2.2: 4k Preset
LibreOffice : 20 Documents To PDF
R Benchmark 2.5: Overall mean
| Cinebench R23 / Multi Core | |
| Schenker XMG Ultra 17 Rocket Lake | |
| Schenker XMG Neo 17 (Early 2021, RTX 3070, 5800H) | |
| Dell XPS 17 9710 Core i7 RTX 3060 | |
| Medio Intel Core i7-11800H (6508 - 14088, n=48) | |
| Asus TUF Gaming F17 FX706HM | |
| Gigabyte Aero 17 HDR YC | |
| Razer Blade Pro 17 2021 (QHD Touch) | |
| Cinebench R23 / Single Core | |
| Schenker XMG Ultra 17 Rocket Lake | |
| Asus TUF Gaming F17 FX706HM | |
| Dell XPS 17 9710 Core i7 RTX 3060 | |
| Medio Intel Core i7-11800H (1386 - 1522, n=45) | |
| Schenker XMG Neo 17 (Early 2021, RTX 3070, 5800H) | |
| Gigabyte Aero 17 HDR YC | |
| Razer Blade Pro 17 2021 (QHD Touch) | |
Cinebench R23: Multi Core | Single Core
Cinebench R15: CPU Multi 64Bit | CPU Single 64Bit
Blender: v2.79 BMW27 CPU
7-Zip 18.03: 7z b 4 -mmt1 | 7z b 4
Geekbench 5.5: Single-Core | Multi-Core
HWBOT x265 Benchmark v2.2: 4k Preset
LibreOffice : 20 Documents To PDF
R Benchmark 2.5: Overall mean
* ... más pequeño es mejor
Rendimiento del sistema
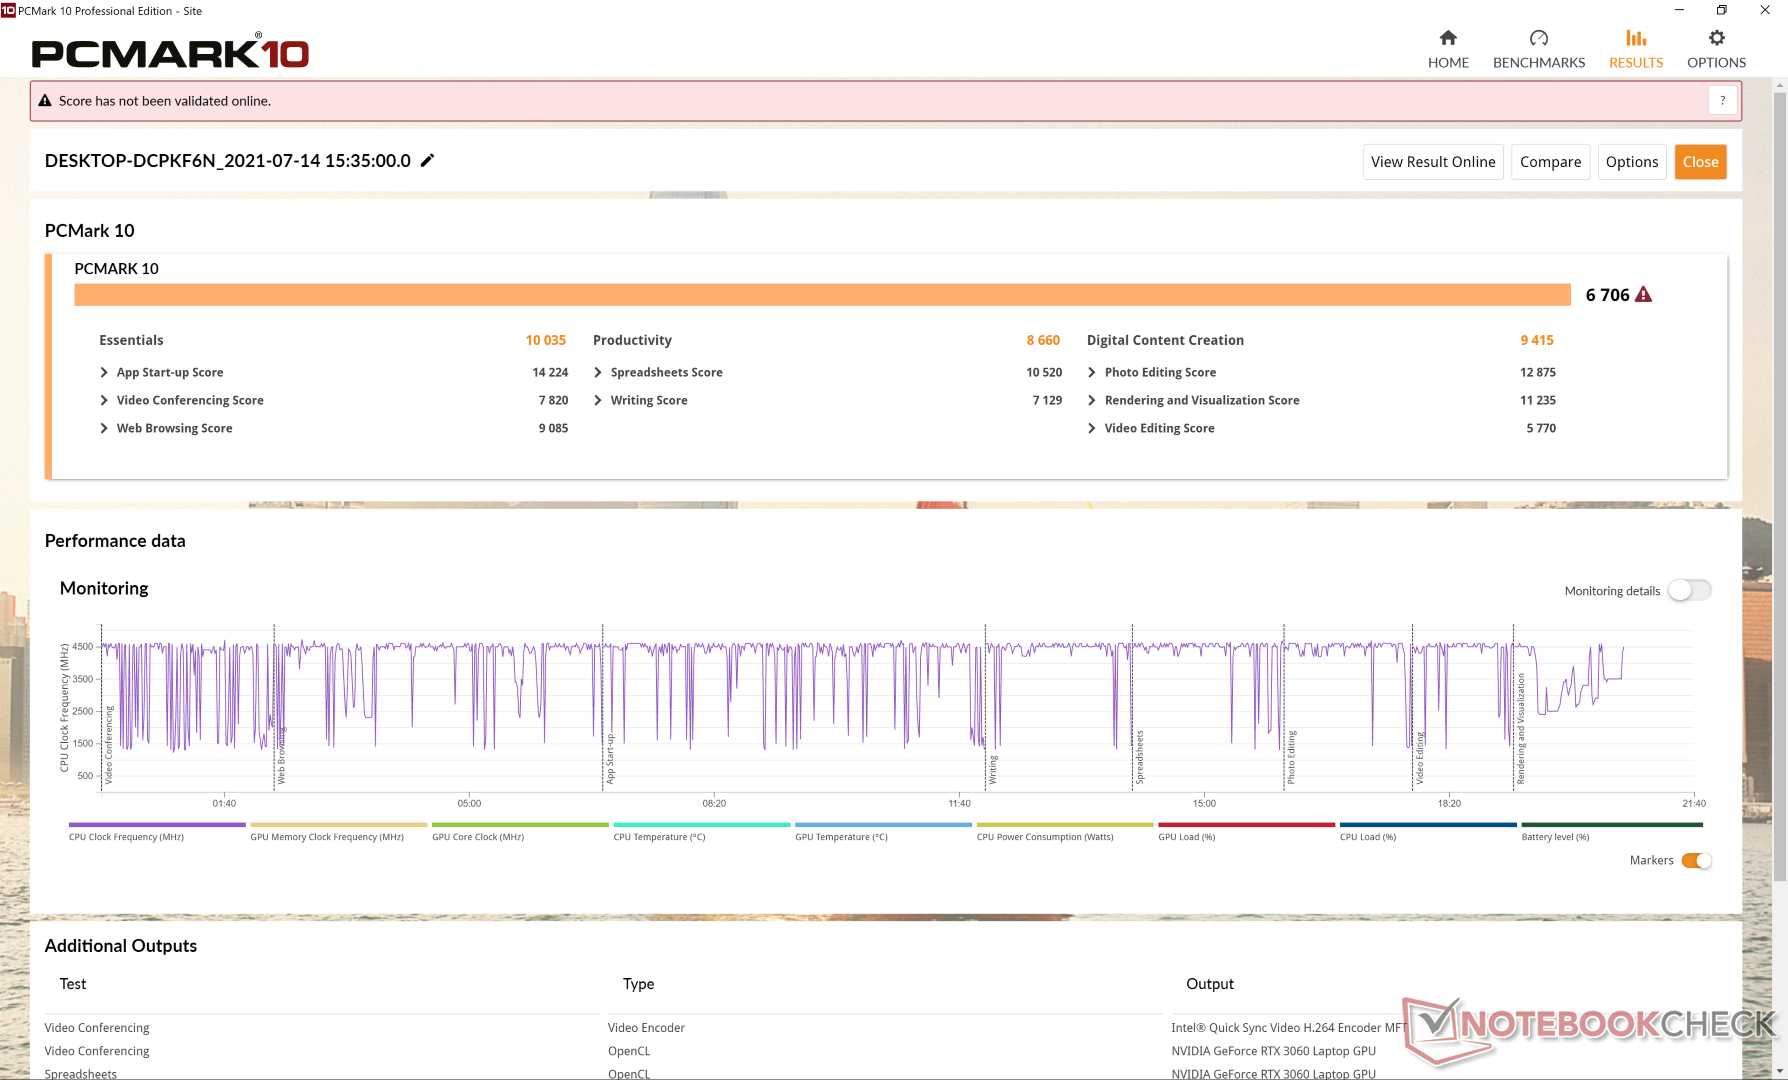
Las puntuaciones de PCMark son sistemáticamente superiores a las del XPS 17 9700 del año pasado y a las de la mayoría de portátiles con CPUs Comet Lake-H más antiguas. El mayor impulso se da en la creación de contenido digital, donde el rendimiento gráfico es lo más importante.
| PCMark 10 / Score | |
| Dell XPS 17 9710 Core i7 RTX 3060 | |
| Medio Intel Core i7-11800H, NVIDIA GeForce RTX 3060 Laptop GPU (6156 - 6865, n=4) | |
| Razer Blade Pro 17 2021 (QHD Touch) | |
| Gigabyte Aero 17 HDR YC | |
| Dell XPS 17 9700 Core i7 RTX 2060 Max-Q | |
| Eluktronics RP-17 | |
| LG Ultra 17U70N | |
| PCMark 10 / Essentials | |
| Dell XPS 17 9710 Core i7 RTX 3060 | |
| Razer Blade Pro 17 2021 (QHD Touch) | |
| Medio Intel Core i7-11800H, NVIDIA GeForce RTX 3060 Laptop GPU (9063 - 10522, n=4) | |
| Dell XPS 17 9700 Core i7 RTX 2060 Max-Q | |
| Gigabyte Aero 17 HDR YC | |
| Eluktronics RP-17 | |
| LG Ultra 17U70N | |
| PCMark 10 / Productivity | |
| Gigabyte Aero 17 HDR YC | |
| Dell XPS 17 9710 Core i7 RTX 3060 | |
| Medio Intel Core i7-11800H, NVIDIA GeForce RTX 3060 Laptop GPU (8200 - 8874, n=4) | |
| Razer Blade Pro 17 2021 (QHD Touch) | |
| Dell XPS 17 9700 Core i7 RTX 2060 Max-Q | |
| LG Ultra 17U70N | |
| Eluktronics RP-17 | |
| PCMark 10 / Digital Content Creation | |
| Dell XPS 17 9710 Core i7 RTX 3060 | |
| Gigabyte Aero 17 HDR YC | |
| Razer Blade Pro 17 2021 (QHD Touch) | |
| Medio Intel Core i7-11800H, NVIDIA GeForce RTX 3060 Laptop GPU (8520 - 9423, n=4) | |
| Dell XPS 17 9700 Core i7 RTX 2060 Max-Q | |
| Eluktronics RP-17 | |
| LG Ultra 17U70N | |
| PCMark 10 Score | 6706 puntos | |
ayuda | ||
Latencia del CPD
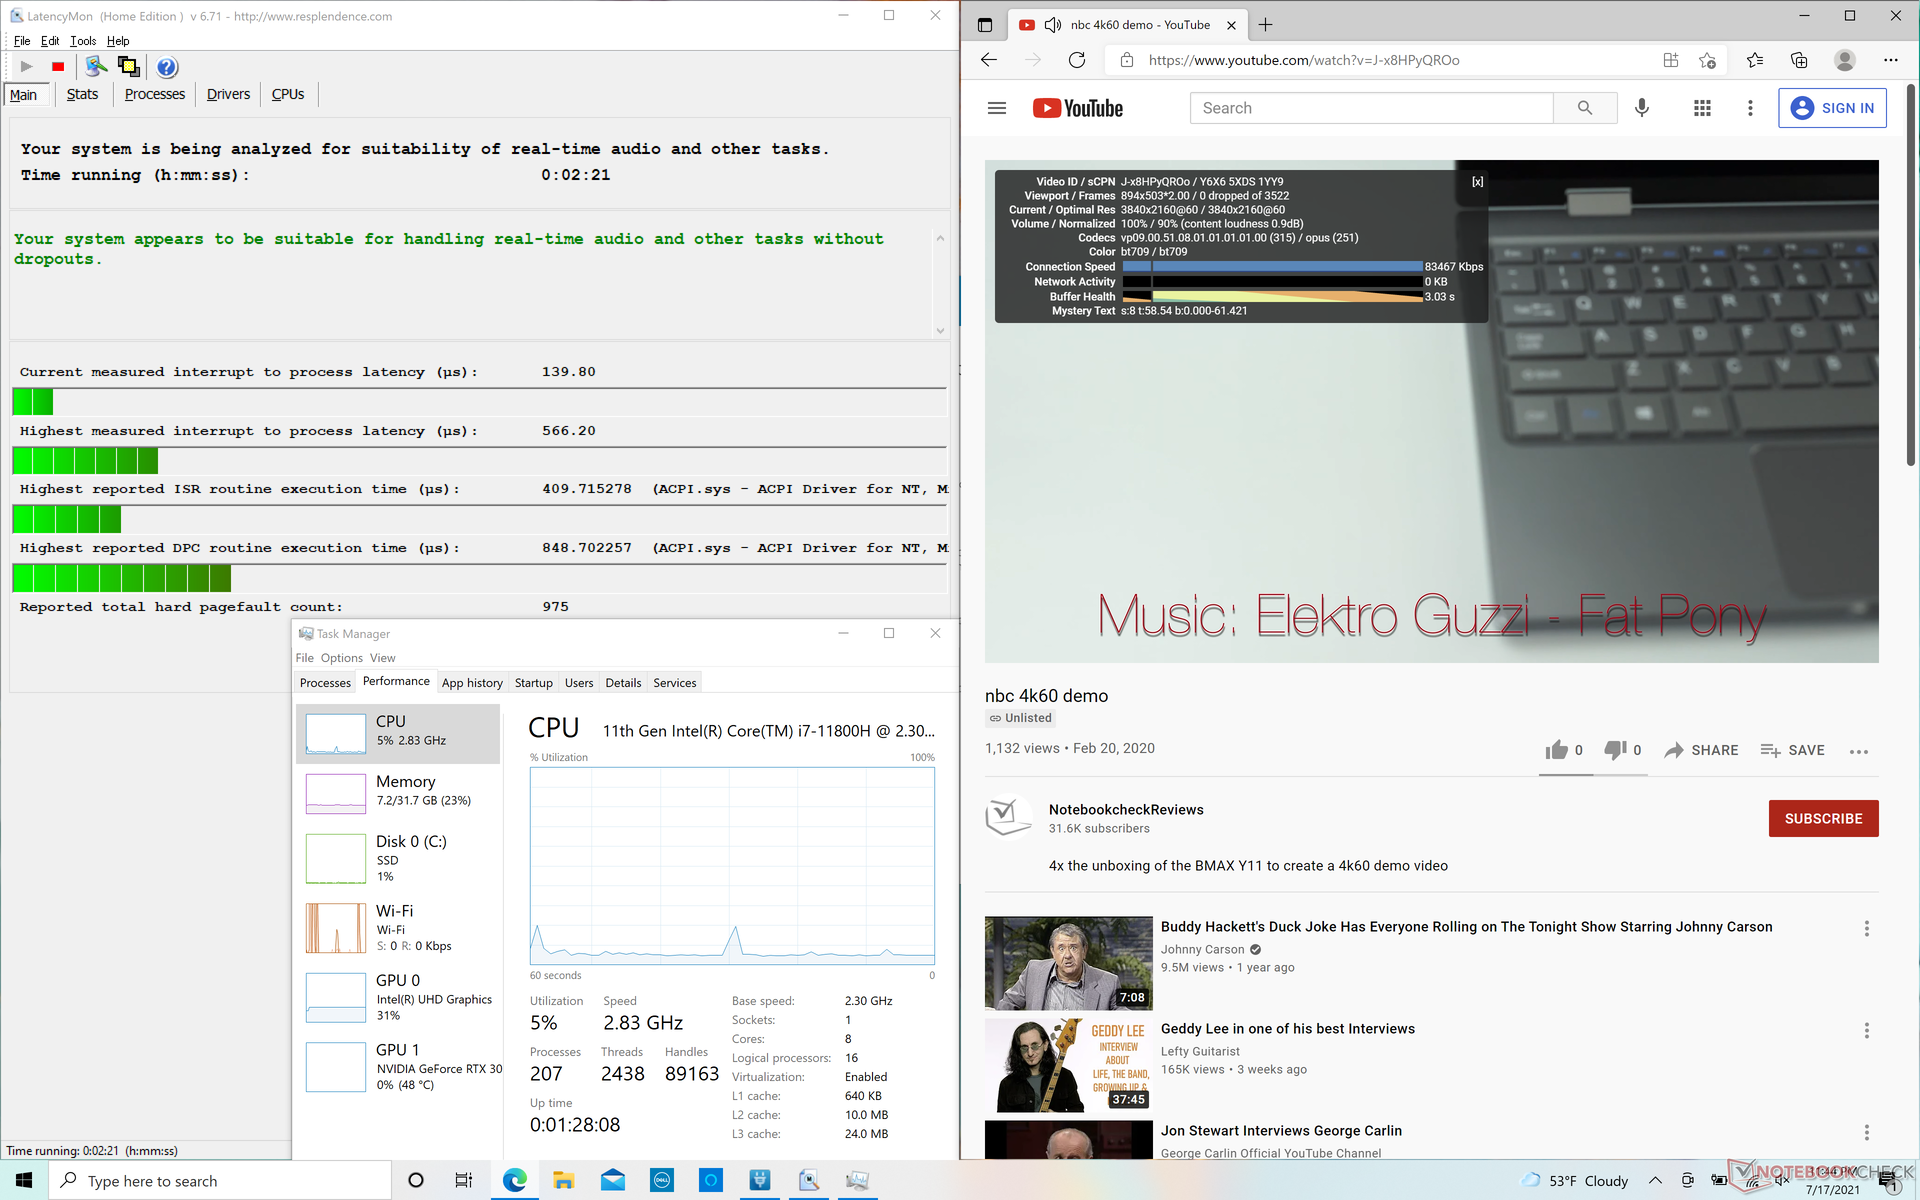
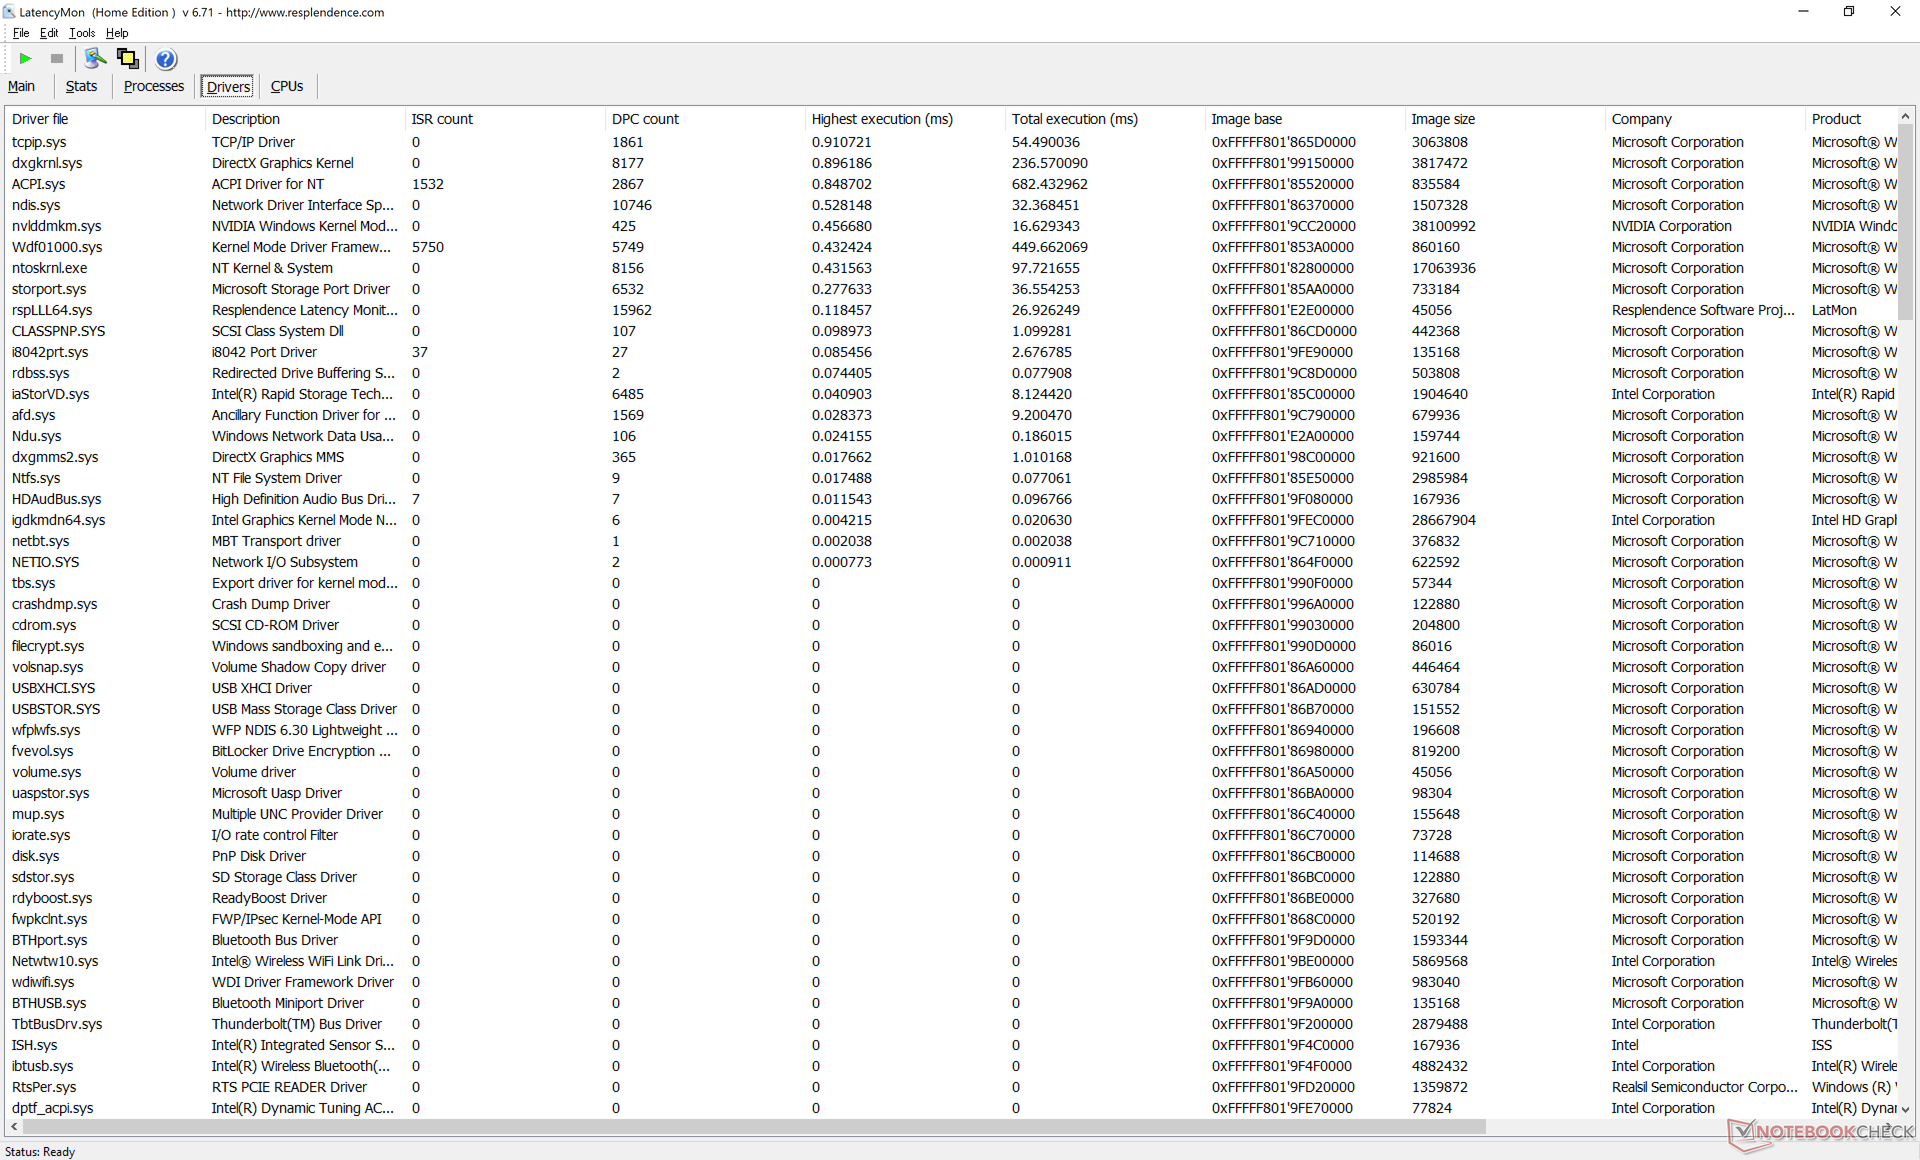
LatencyMon no muestra problemas de latencia del CPD al navegar por múltiples pestañas en nuestra página web. La reproducción de vídeo 4K a 60 FPS también es fluida y sin pérdida de fotogramas.
| DPC Latencies / LatencyMon - interrupt to process latency (max), Web, Youtube, Prime95 | |
| Gigabyte Aero 17 HDR YC | |
| Razer Blade Pro 17 2021 (QHD Touch) | |
| Eluktronics RP-17 | |
| LG Ultra 17U70N | |
| Dell XPS 17 9700 Core i7 RTX 2060 Max-Q | |
| Dell XPS 17 9710 Core i7 RTX 3060 | |
* ... más pequeño es mejor
Dispositivos de almacenamiento
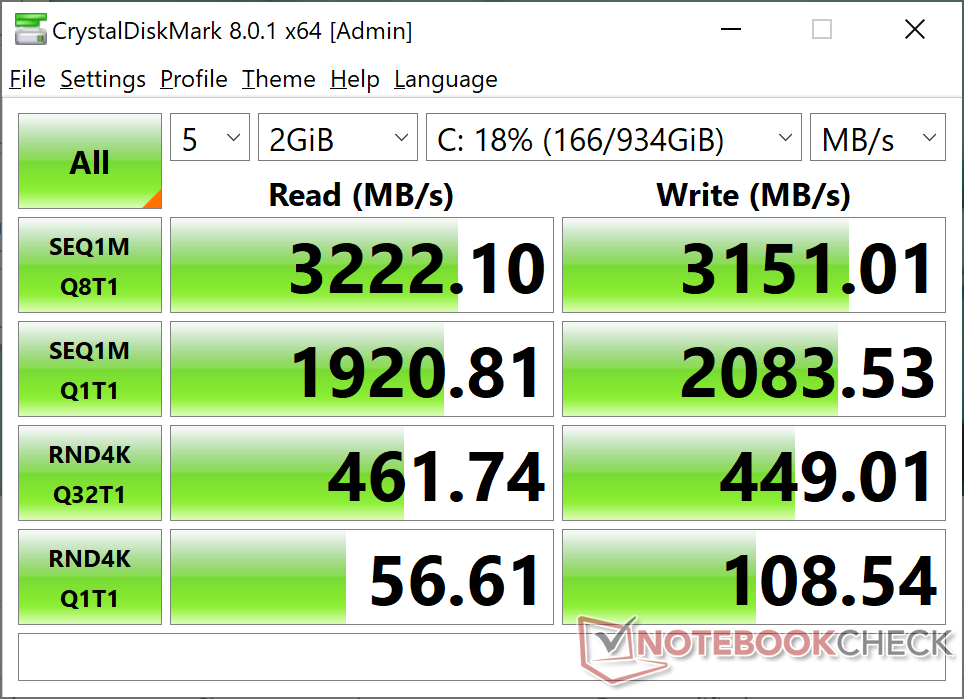
Dell ha actualizado las dos ranuras PCIe 3.0 M.2 2280 del XPS 17 9700 a PCIe 4 x4 para el 9710. Sin embargo, nuestra unidad de prueba viene con un 1 TB Micron 2300 PCIe 3.0 NVMe de 1 TB que no puede utilizar completamente el mayor ancho de banda PCIe 4. El rendimiento sigue siendo mucho más rápido que el Micron 2200S que venía en nuestra antigua unidad XPS 17 9700.

| Dell XPS 17 9710 Core i7 RTX 3060 Micron 2300 1TB MTFDHBA1T0TDV | Dell XPS 17 9700 Core i7 RTX 2060 Max-Q Micron 2200S 1TB MTFDHBA1T0TCK | Razer Blade Pro 17 2021 (QHD Touch) Samsung PM981a MZVLB1T0HBLR | Gigabyte Aero 17 HDR YC ESR01TBTLCG-EAC-4 | Eluktronics RP-17 Phison PS5013 PRO-X-1TB-G2R NVMe SSD | |
|---|---|---|---|---|---|
| AS SSD | -53% | 4% | 11% | -4% | |
| Seq Read (MB/s) | 2688 | 1141 -58% | 2068 -23% | 2674 -1% | 1689 -37% |
| Seq Write (MB/s) | 1566 | 994 -37% | 2047 31% | 2458 57% | 1695 8% |
| 4K Read (MB/s) | 55.2 | 31.98 -42% | 47.85 -13% | 52.1 -6% | 50 -9% |
| 4K Write (MB/s) | 125.8 | 61 -52% | 87.4 -31% | 113.4 -10% | 182.9 45% |
| 4K-64 Read (MB/s) | 1295 | 790 -39% | 1932 49% | 1881 45% | 1043 -19% |
| 4K-64 Write (MB/s) | 2076 | 845 -59% | 2017 -3% | 2849 37% | 1841 -11% |
| Access Time Read * (ms) | 0.034 | 0.063 -85% | 0.055 -62% | 0.102 -200% | 0.04 -18% |
| Access Time Write * (ms) | 0.246 | 0.679 -176% | 0.128 48% | 0.033 87% | 0.102 59% |
| Score Read (Points) | 1619 | 966 -40% | 2187 35% | 2201 36% | 1262 -22% |
| Score Write (Points) | 2358 | 1005 -57% | 2309 -2% | 3208 36% | 2194 -7% |
| Score Total (Points) | 4757 | 2448 -49% | 5612 18% | 6524 37% | 4112 -14% |
| Copy ISO MB/s (MB/s) | 1563 | 1732 11% | 2400 54% | 2124 36% | |
| Copy Program MB/s (MB/s) | 976 | 717 -27% | 684 -30% | 579 -41% | |
| Copy Game MB/s (MB/s) | 1786 | 1343 -25% | 1629 -9% | 1304 -27% | |
| CrystalDiskMark 5.2 / 6 | -29% | -2% | 10% | 4% | |
| Write 4K (MB/s) | 109.2 | 64.1 -41% | 123.5 13% | 141.2 29% | 226.1 107% |
| Read 4K (MB/s) | 56.6 | 39.93 -29% | 45.96 -19% | 46.48 -18% | 54.7 -3% |
| Write Seq (MB/s) | 2073 | 1191 -43% | 1861 -10% | 2433 17% | 1868 -10% |
| Read Seq (MB/s) | 1916 | 1418 -26% | 1584 -17% | 1742 -9% | 1648 -14% |
| Write 4K Q32T1 (MB/s) | 487 | 450.3 -8% | 466.4 -4% | 565 16% | 429.9 -12% |
| Read 4K Q32T1 (MB/s) | 463.2 | 365 -21% | 566 22% | 655 41% | 521 12% |
| Write Seq Q32T1 (MB/s) | 3155 | 1563 -50% | 2981 -6% | 3028 -4% | 2248 -29% |
| Read Seq Q32T1 (MB/s) | 3209 | 2683 -16% | 3260 2% | 3424 7% | 2484 -23% |
| Media total (Programa/Opciones) | -41% /
-44% | 1% /
2% | 11% /
10% | 0% /
-1% |
* ... más pequeño es mejor

Disk Throttling: DiskSpd Read Loop, Queue Depth 8
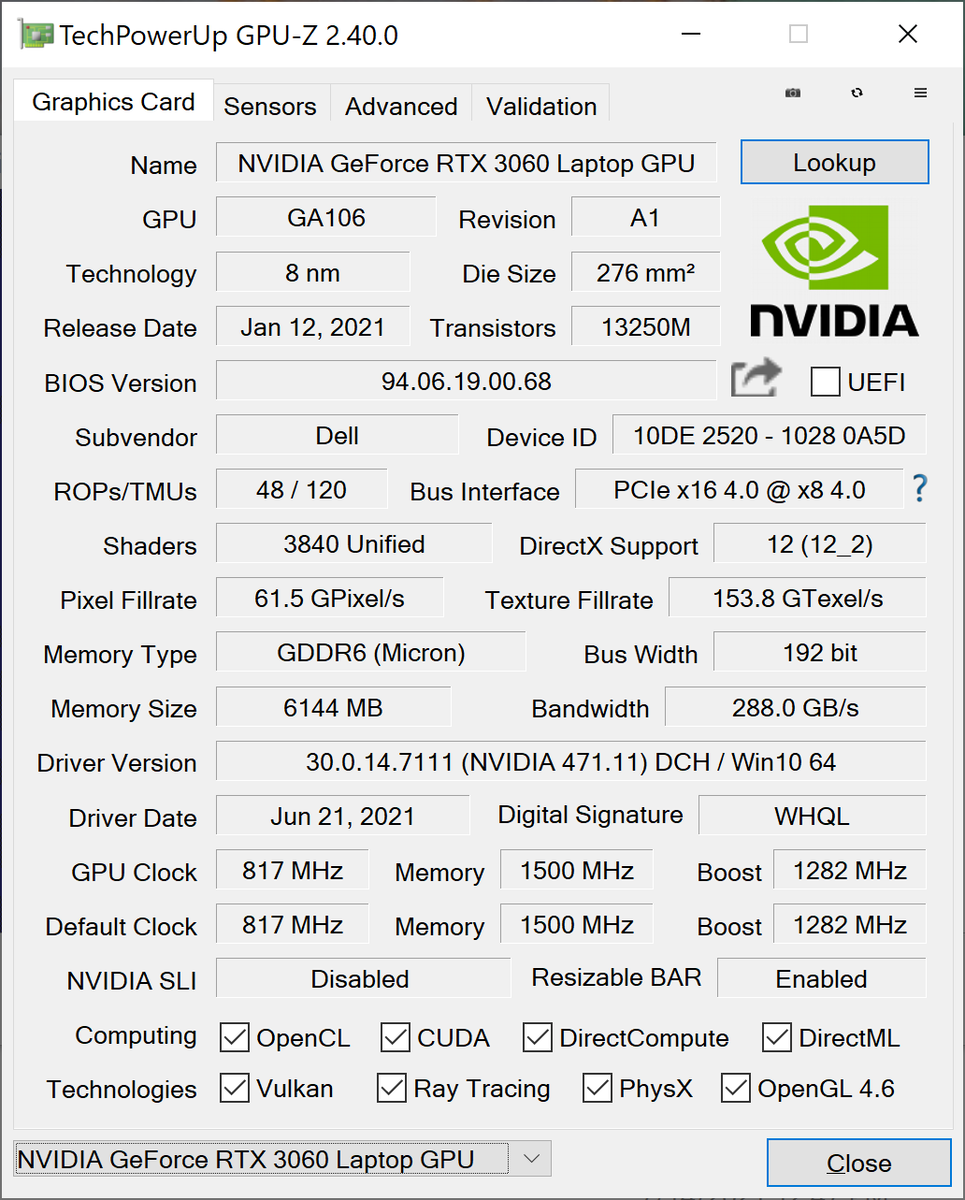
Rendimiento de la GPU - Max-Q at Heart
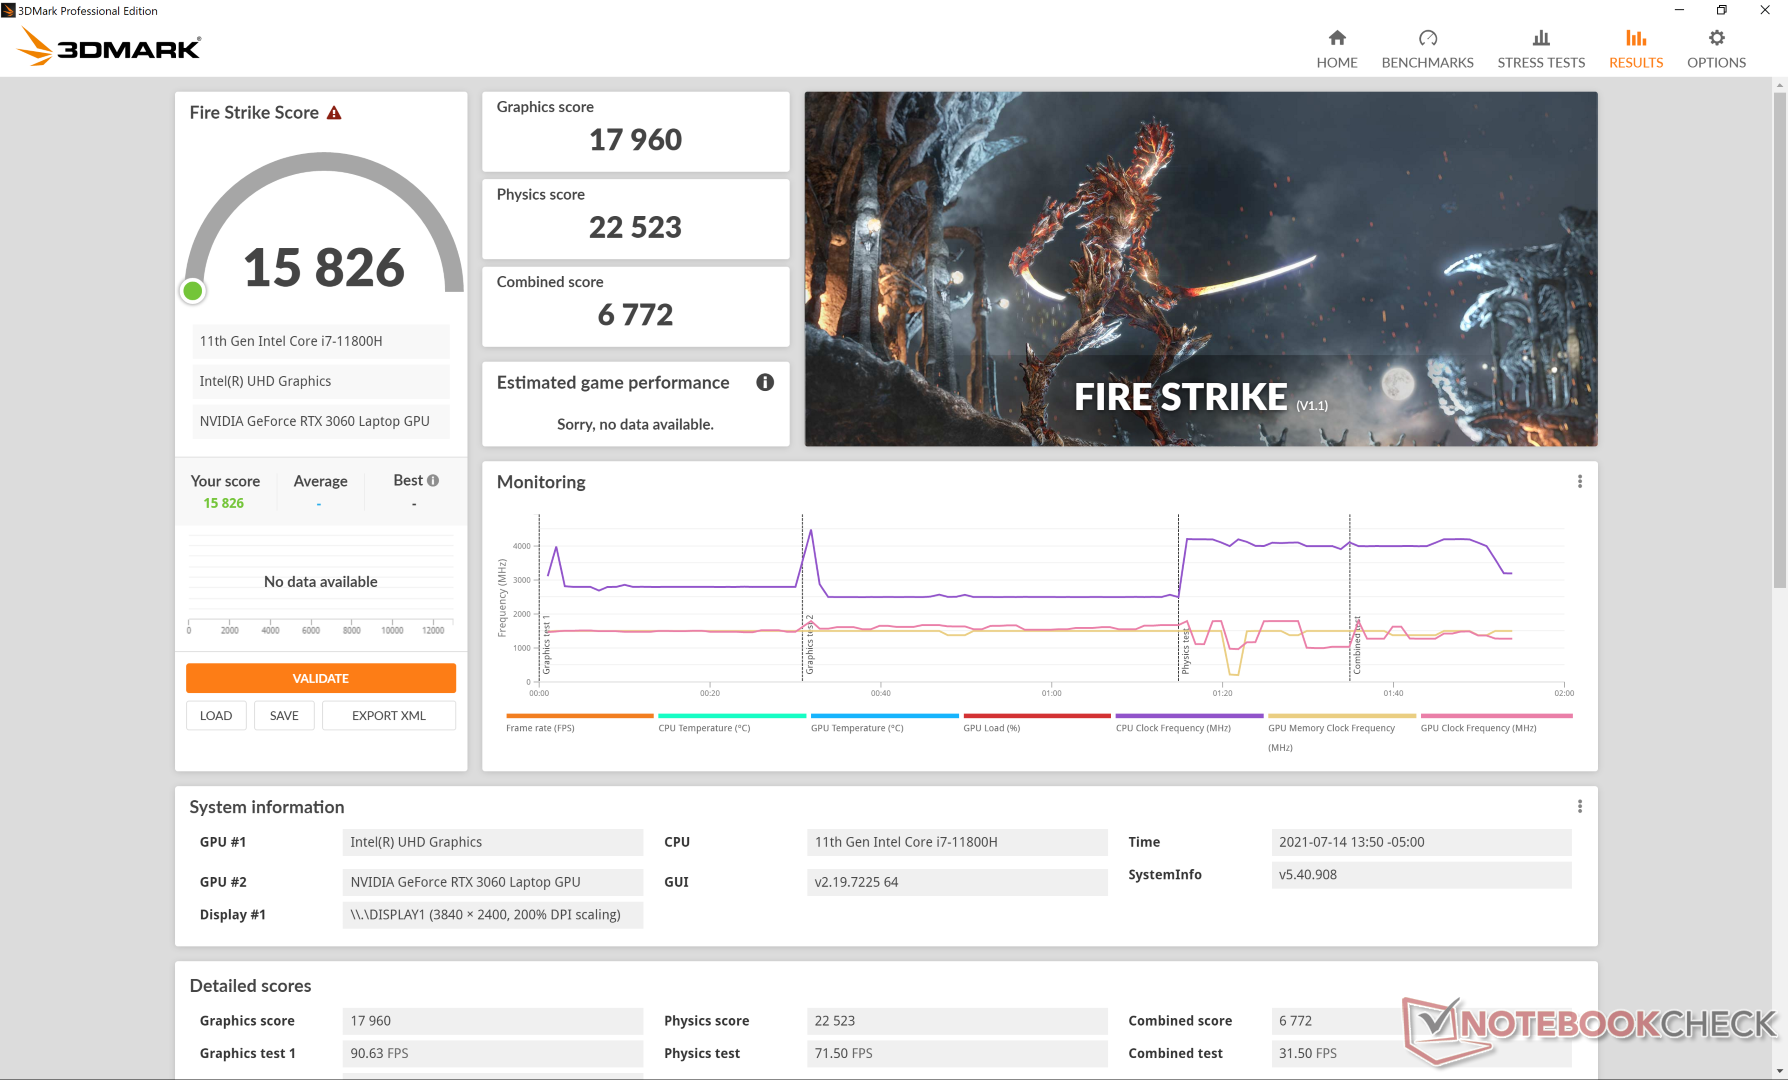
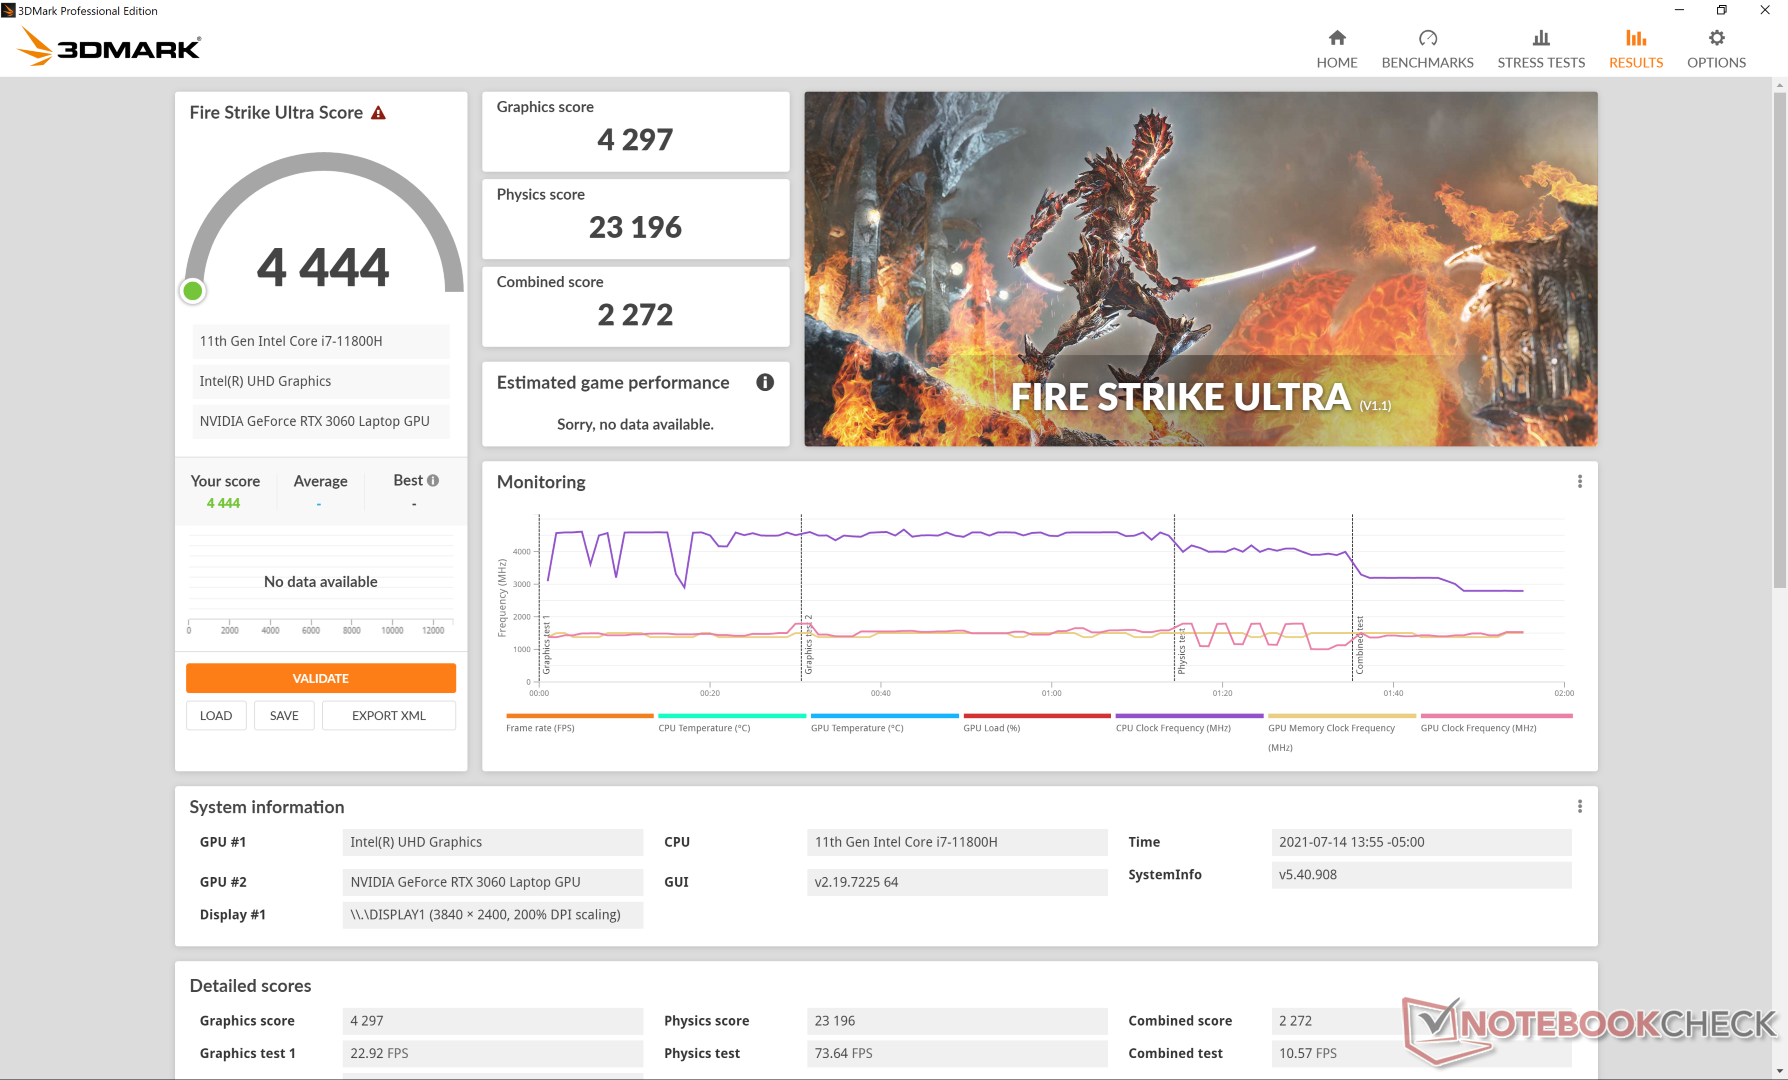
El rendimiento gráfico en bruto es aproximadamente un 30 por ciento más rápido que la RTX 2060 Max-Q en el XPS 17 9700 del año pasado para ser una actualización respetable de un año a otro. Quizá lo más sorprendente es que el rendimiento es solo un 10 % más lento que una GeForce RTX 3060 a pesar de la envolvente TGP de 70 W mucho más baja de nuestra GPU Dell
El rendimiento en juegos es excelente con resultados muy cercanos a los portátiles equipados con GeForce RTX 2070 gráficos. Sin embargo, recomendamos jugar en un monitor externo cuando sea posible debido a la lentitud de los tiempos de respuesta blanco-negro y gris-gris en la pantalla interna del XPS 17 para un ghosting muy notable. Los juegos no son el objetivo principal de los portátiles XPS, después de todo.
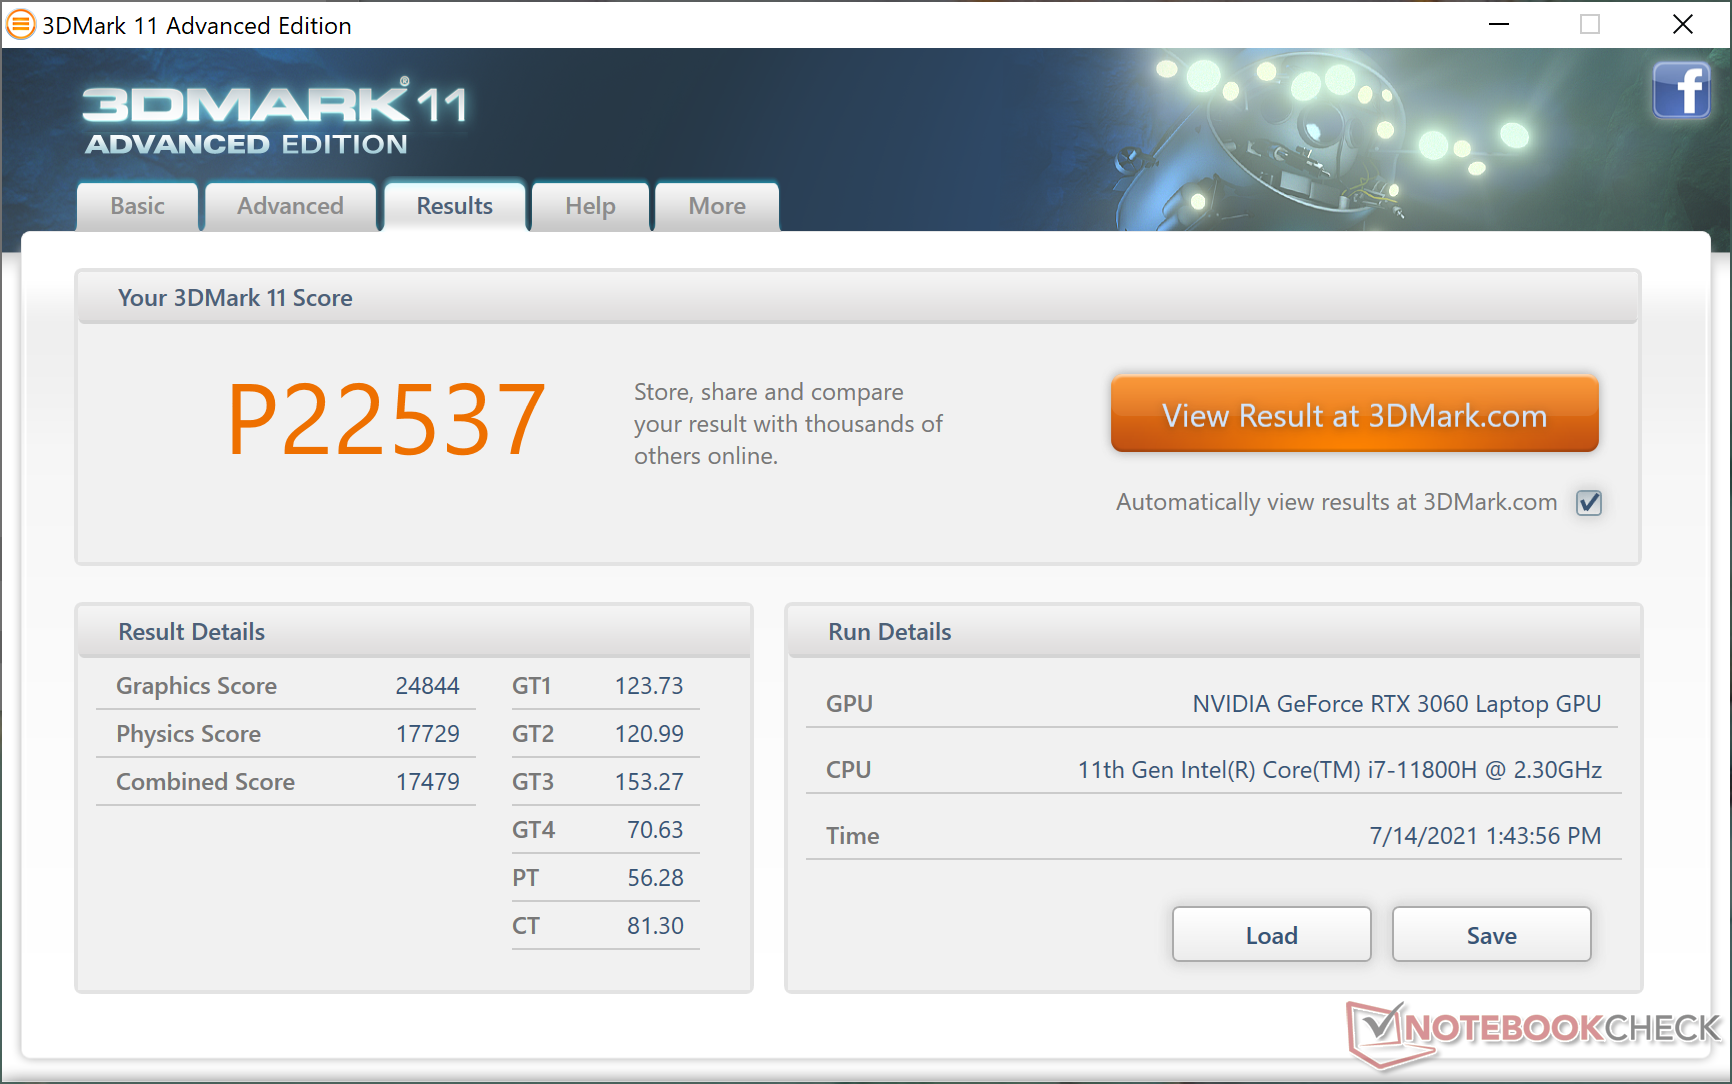
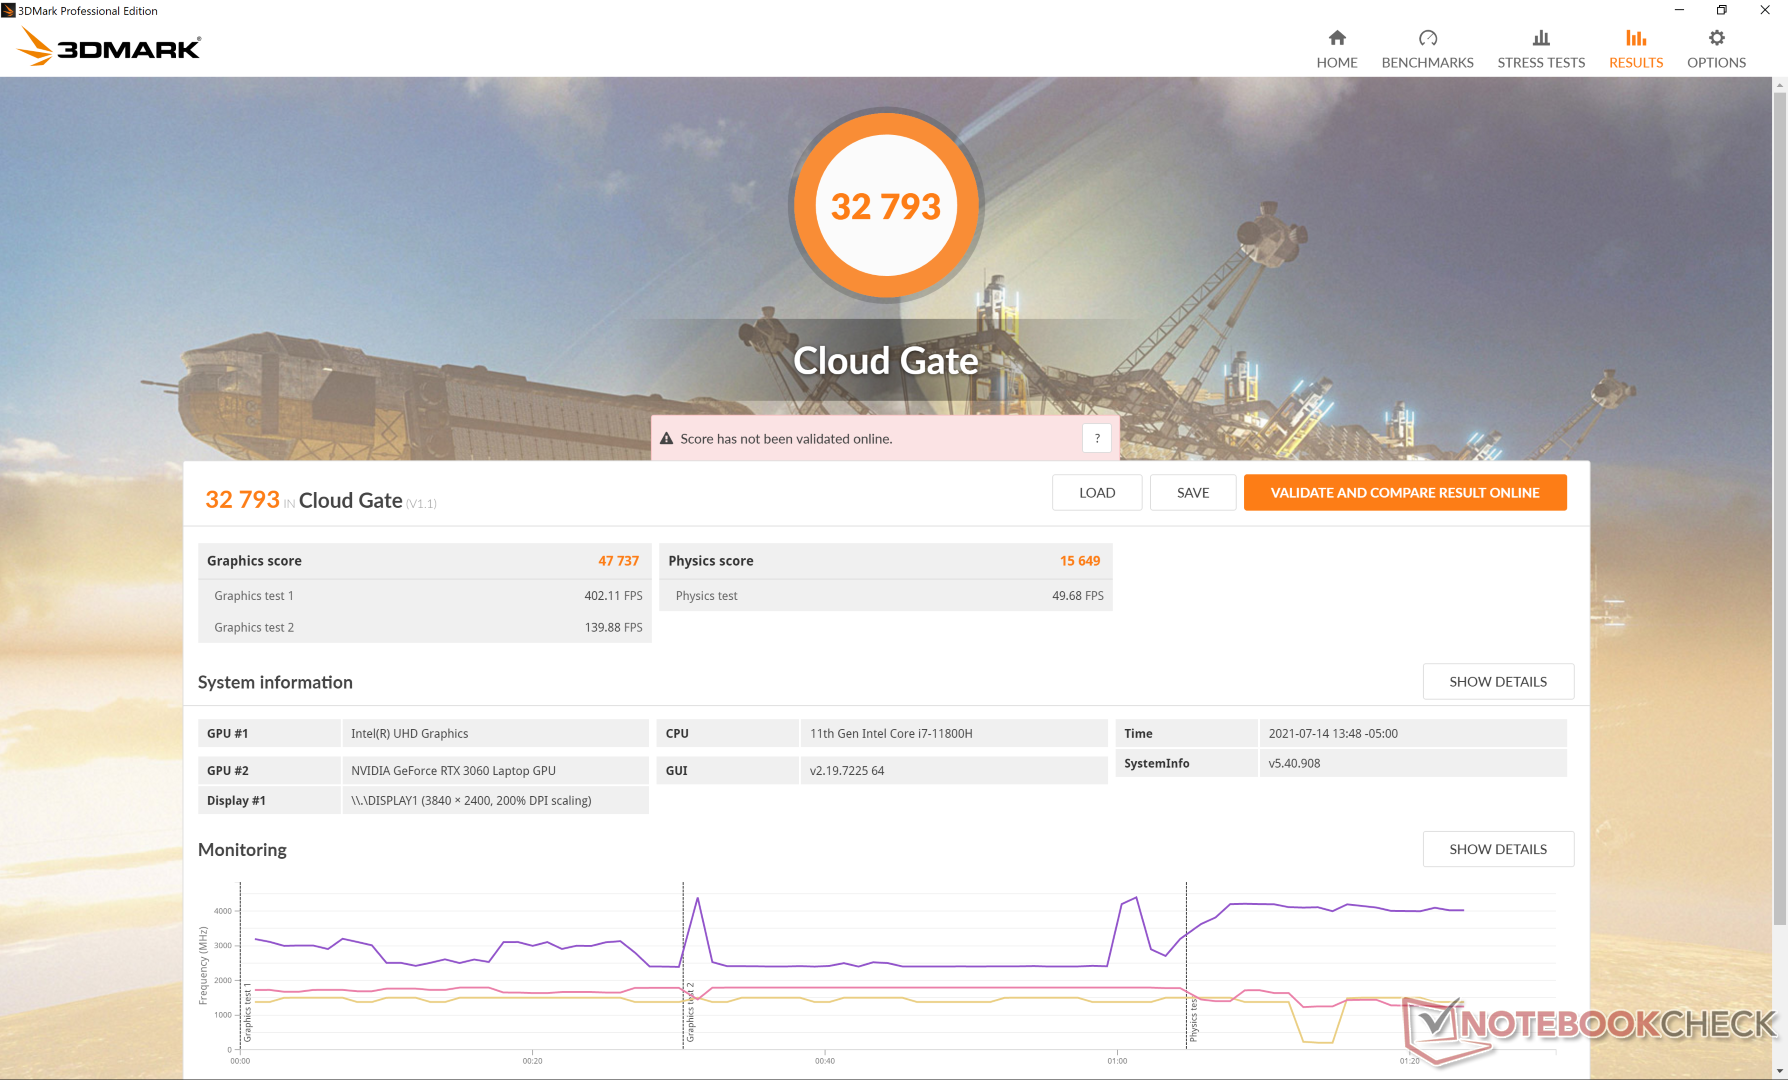
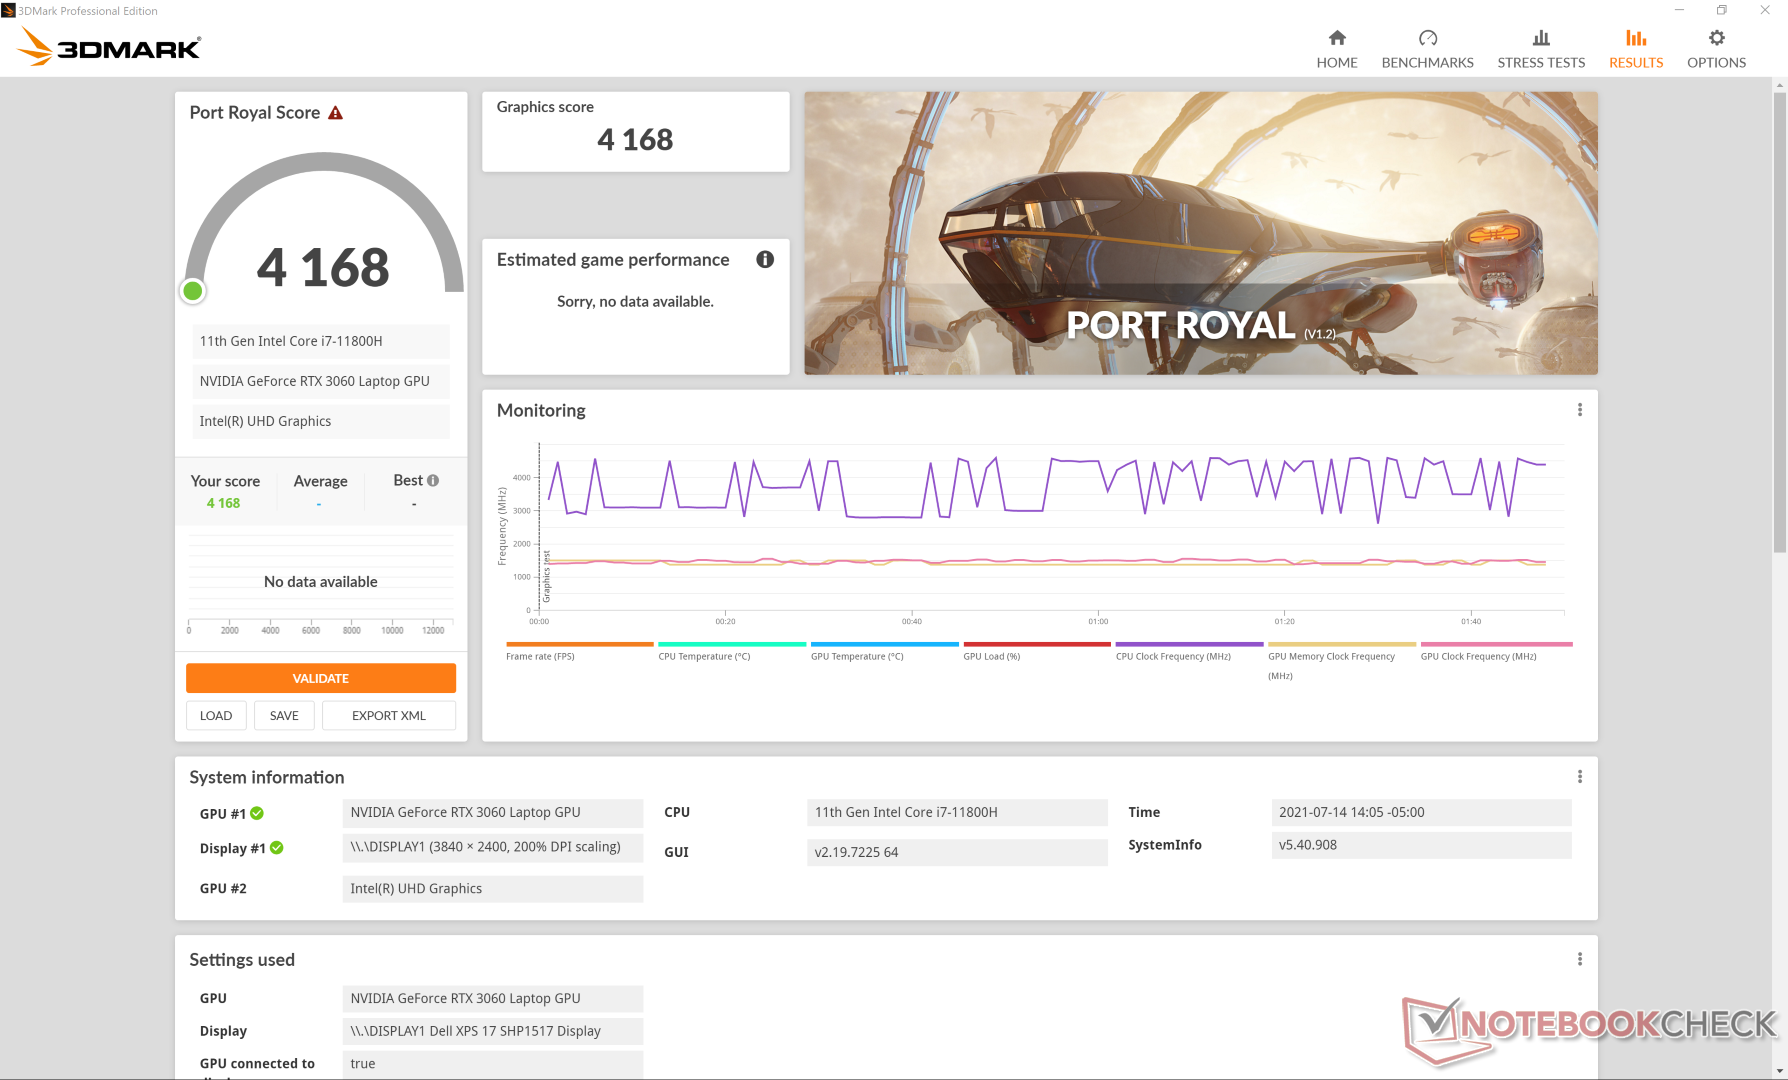
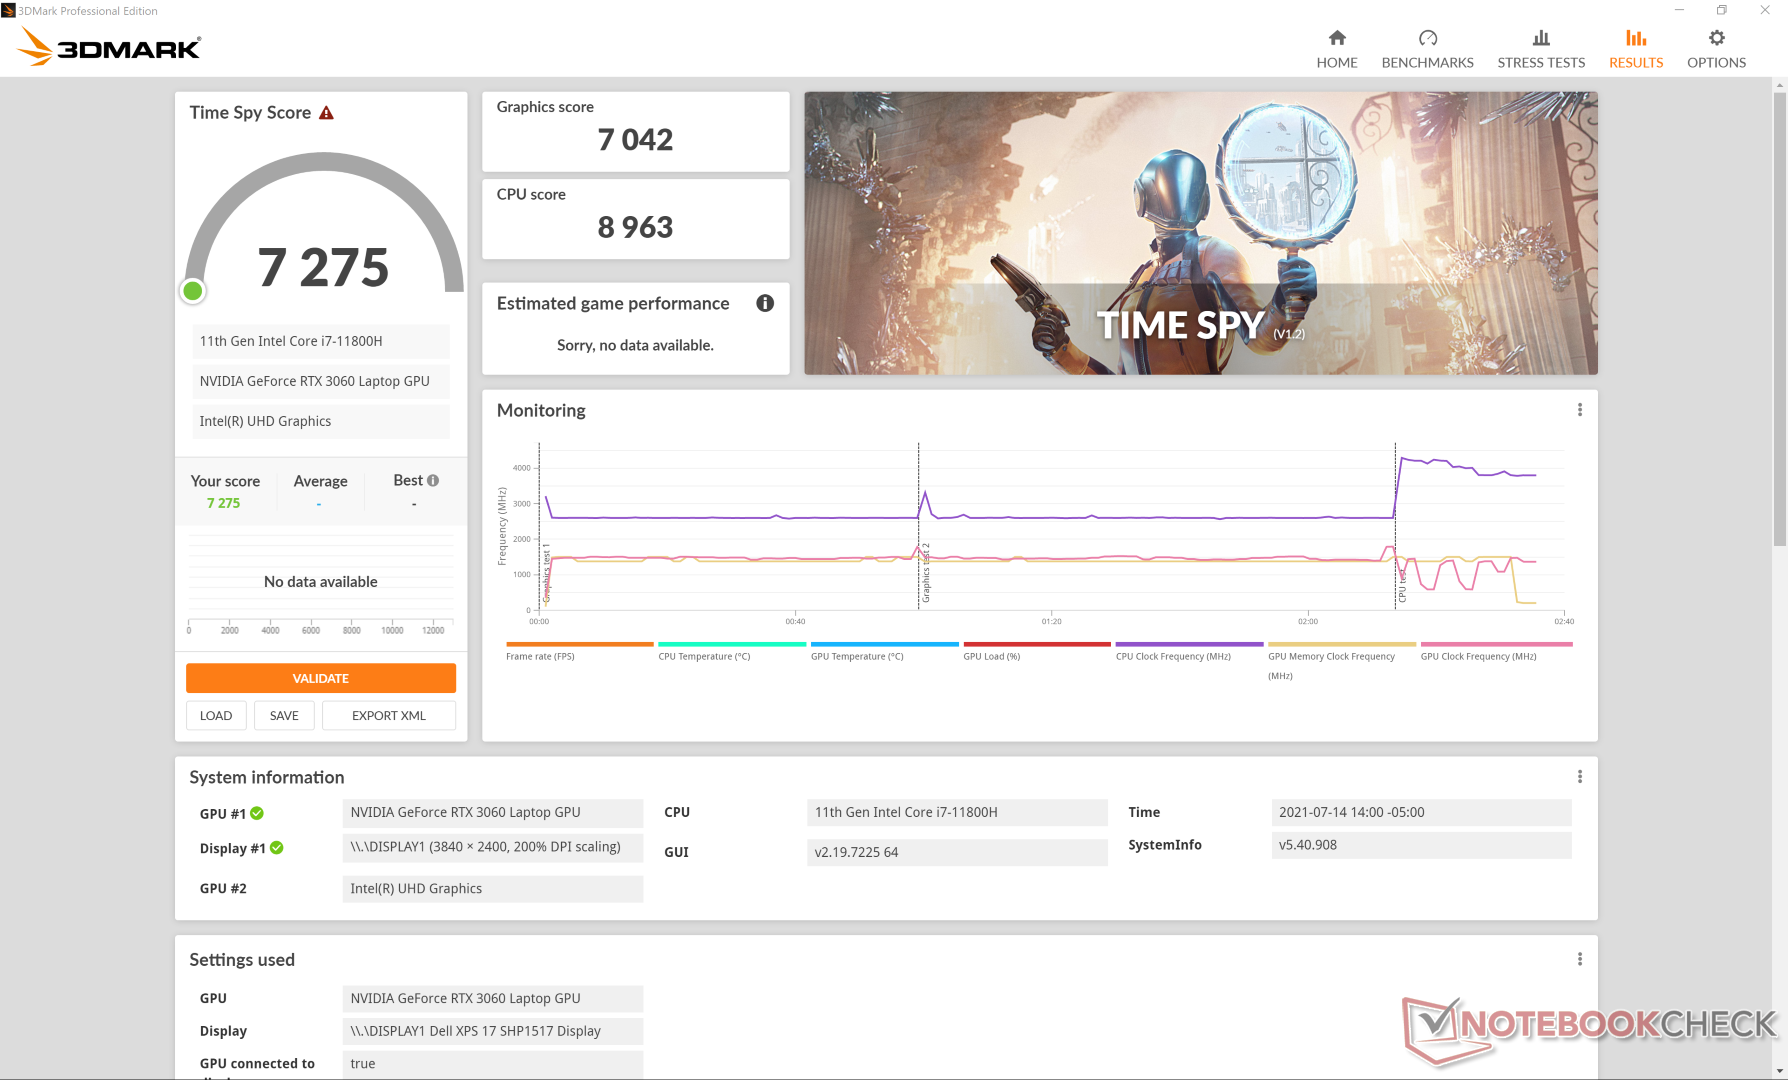
| 3DMark 11 Performance | 22537 puntos | |
| 3DMark Cloud Gate Standard Score | 32793 puntos | |
| 3DMark Fire Strike Score | 15826 puntos | |
| 3DMark Time Spy Score | 7275 puntos | |
ayuda | ||
Witcher 3 FPS Chart
| bajo | medio | alto | ultra | QHD | 4K | |
|---|---|---|---|---|---|---|
| GTA V (2015) | 181 | 178 | 155 | 81.6 | 63.6 | |
| The Witcher 3 (2015) | 341.6 | 218.1 | 142.2 | 72.3 | ||
| Dota 2 Reborn (2015) | 168 | 148 | 133 | 126 | ||
| Final Fantasy XV Benchmark (2018) | 140 | 98.2 | 73.5 | 54.9 | 31.4 | |
| X-Plane 11.11 (2018) | 125 | 105 | 84.6 | 60.2 | ||
| Strange Brigade (2018) | 348 | 176 | 140 | 123 | 91.1 |
Emissions
Ruido del sistema: silencioso como un ultrabook, ruidoso como un jugador
El comportamiento del ventilador no ha cambiado realmente, ya que tanto el techo de potencia como la solución de refrigeración siguen siendo los mismos. Al ejecutar 3DMark 06 y Witcher 3 enmodo optimizado, el ruido del ventilador se estabiliza en 29,2 dB(A) y 46,2 dB(A), respectivamente. Cuando se ejecuta Witcher 3 en modo Ultra Performance, el ruido del ventilador alcanza los 49 dB(A), que es lo que registramos en el modelo del año pasado. Este rango es más similar al de los portátiles de juego que al de otros Ultrabooks, ya que el XPS 17 lleva una GPU de nivel de juego.
Se recomienda ejecutar el sistema en modo optimizado o inferior y con la iGPU activa cuando no se necesite el rendimiento extra. De lo contrario, los ventiladores pulsarán con más frecuencia, especialmente al lanzar aplicaciones.
| Dell XPS 17 9710 Core i7 RTX 3060 GeForce RTX 3060 Laptop GPU, i7-11800H, Micron 2300 1TB MTFDHBA1T0TDV | Dell XPS 17 9700 Core i7 RTX 2060 Max-Q GeForce RTX 2060 Max-Q, i7-10875H, Micron 2200S 1TB MTFDHBA1T0TCK | Razer Blade Pro 17 2021 (QHD Touch) GeForce RTX 3080 Laptop GPU, i7-10875H, Samsung PM981a MZVLB1T0HBLR | Gigabyte Aero 17 HDR YC GeForce RTX 3080 Laptop GPU, i9-10980HK, ESR01TBTLCG-EAC-4 | LG Ultra 17U70N GeForce GTX 1650 Mobile, i5-10210U, Samsung SSD PM981a MZVLB512HBJQ | Eluktronics RP-17 GeForce RTX 2060 Mobile, R7 4800H, Phison PS5013 PRO-X-1TB-G2R NVMe SSD | |
|---|---|---|---|---|---|---|
| Noise | -5% | -7% | -10% | -3% | -3% | |
| apagado / medio ambiente * (dB) | 25.5 | 28 -10% | 26.1 -2% | 26 -2% | 27 -6% | 26.2 -3% |
| Idle Minimum * (dB) | 25.2 | 28 -11% | 26.1 -4% | 30 -19% | 27.3 -8% | 26.2 -4% |
| Idle Average * (dB) | 25.2 | 28 -11% | 26.5 -5% | 32 -27% | 27.3 -8% | 26.2 -4% |
| Idle Maximum * (dB) | 25.2 | 28 -11% | 30.7 -22% | 36 -43% | 31.7 -26% | 30 -19% |
| Load Average * (dB) | 45.9 | 43.2 6% | 43.5 5% | 45 2% | 43.6 5% | 38.5 16% |
| Witcher 3 ultra * (dB) | 49 | 49 -0% | 54 -10% | 42 14% | 45.3 8% | 47.2 4% |
| Load Maximum * (dB) | 50.4 | 50.5 -0% | 55 -9% | 49 3% | 44.7 11% | 54.6 -8% |
* ... más pequeño es mejor
Ruido
| Ocioso |
| 25.2 / 25.2 / 25.2 dB(A) |
| Carga |
| 45.9 / 50.4 dB(A) |
 | ||
30 dB silencioso 40 dB(A) audible 50 dB(A) ruidosamente alto |
||
min: | ||
Temperatura
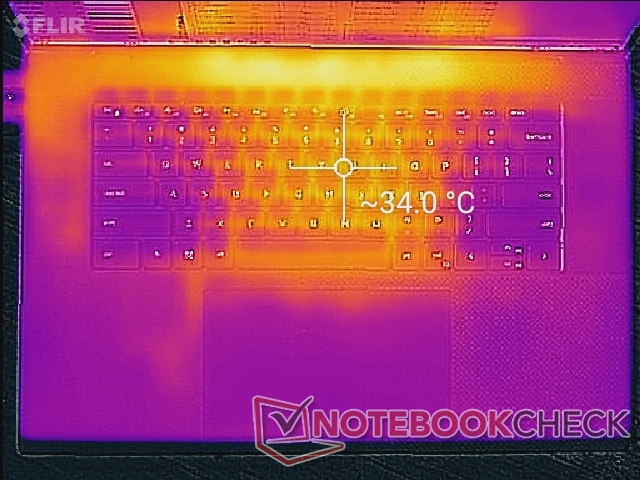
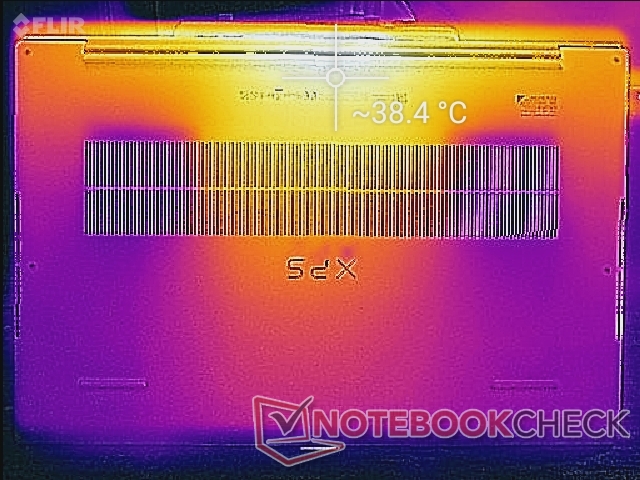
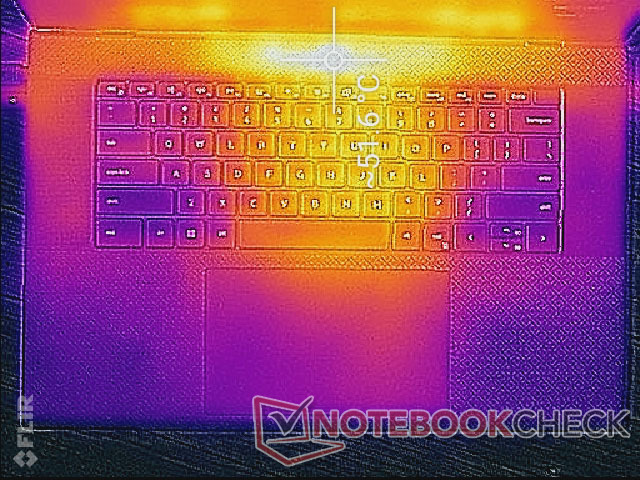
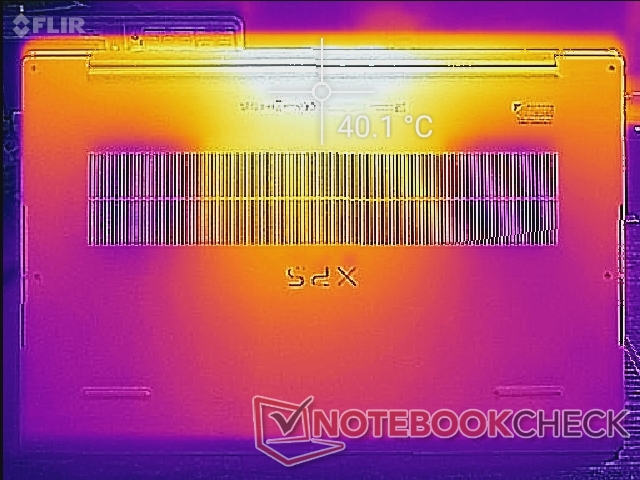
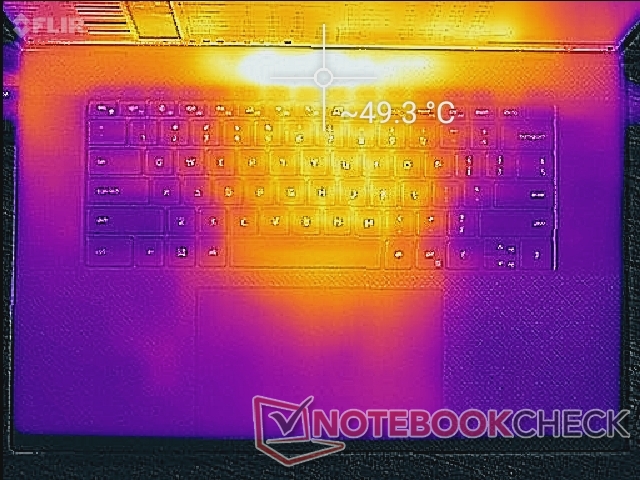
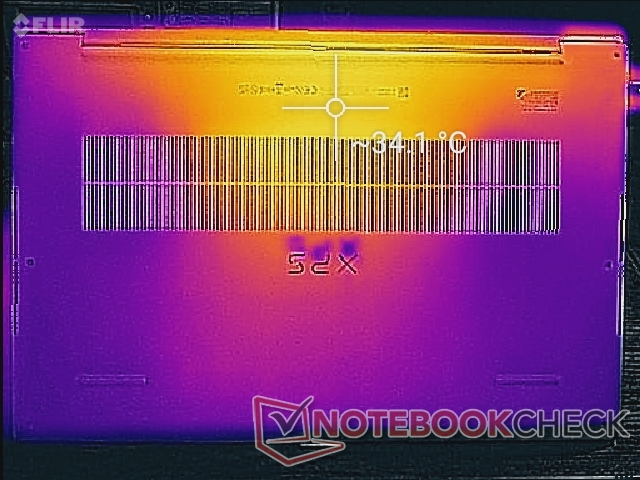
Los puntos calientes cuando se ejecutan cargas altas durante períodos prolongados pueden alcanzar hasta 51 C y 41 C en las superficies superior e inferior del portátil, respectivamente. Estos mismos puntos se calientan entre 34 C y 37 C inclusocuando está en reposo en el escritorio. Sin embargo, los puntos calientes se concentran hacia el centro trasero del chasis mientras que los reposamanos permanecen mucho más fríos. Esto es similar a lo que observamos en el Razer Blade Pro 17 pero en mayor medida en el Dell.
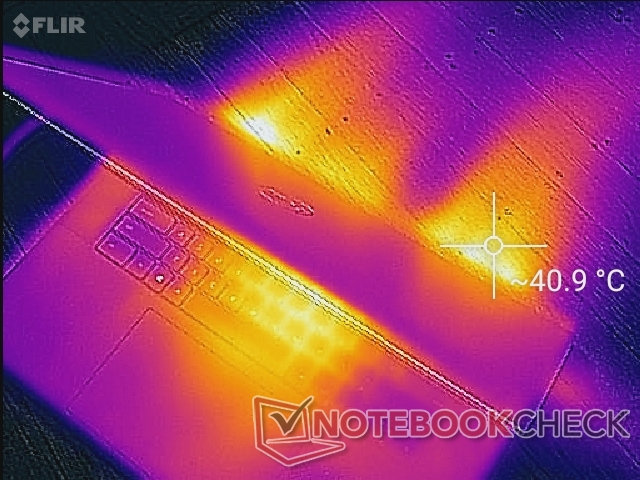
(-) La temperatura máxima en la parte superior es de 50.2 °C / 122 F, frente a la media de 36.8 °C / 98 F, que oscila entre 21 y 71 °C para la clase Multimedia.
(+) El fondo se calienta hasta un máximo de 38.4 °C / 101 F, frente a la media de 39.1 °C / 102 F
(+) En reposo, la temperatura media de la parte superior es de 29.4 °C / 85# F, frente a la media del dispositivo de 31.3 °C / 88 F.
(±) Jugando a The Witcher 3, la temperatura media de la parte superior es de 33.9 °C / 93 F, frente a la media del dispositivo de 31.3 °C / 88 F.
(+) El reposamanos y el panel táctil están a una temperatura inferior a la de la piel, con un máximo de 29.8 °C / 85.6 F y, por tanto, son fríos al tacto.
(±) La temperatura media de la zona del reposamanos de dispositivos similares fue de 28.7 °C / 83.7 F (-1.1 °C / -1.9 F).
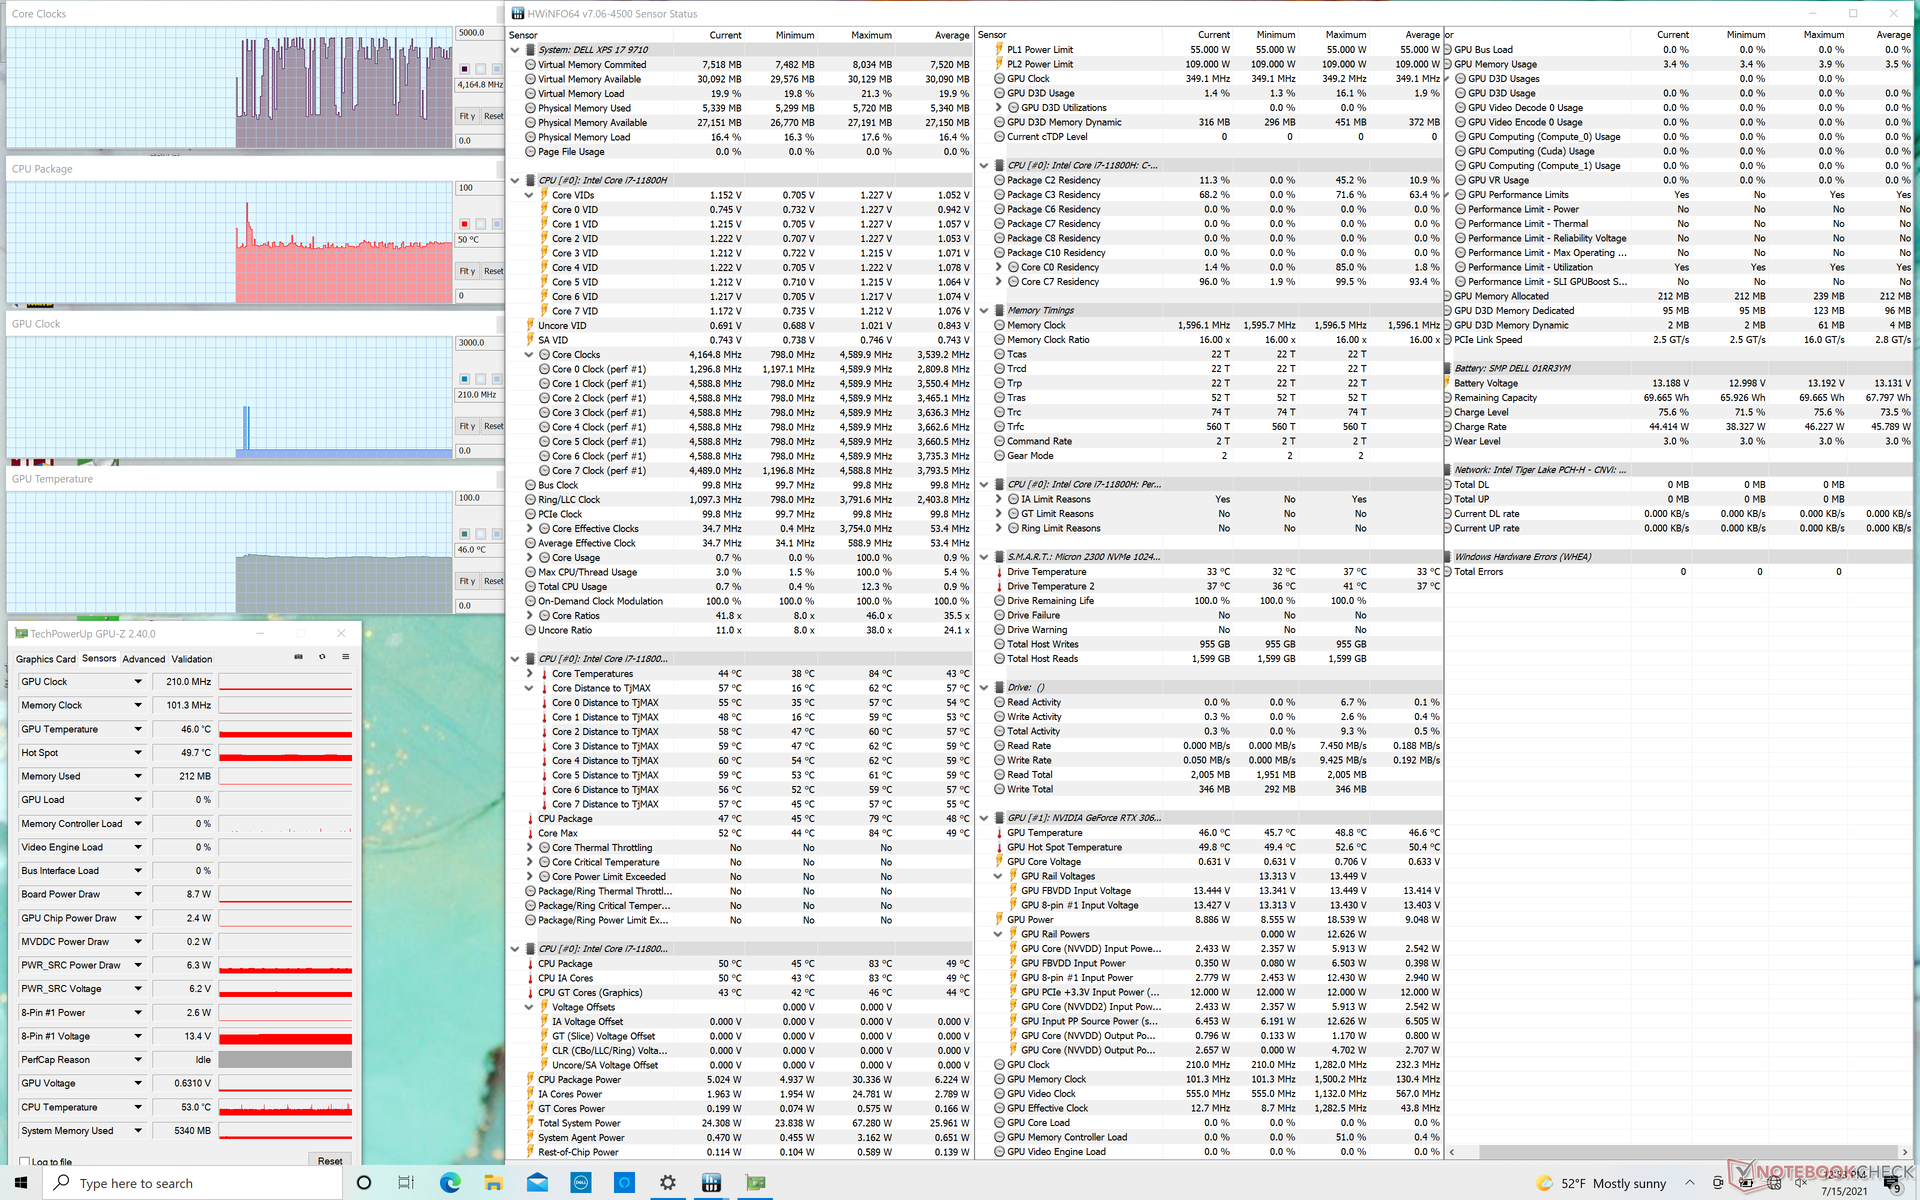
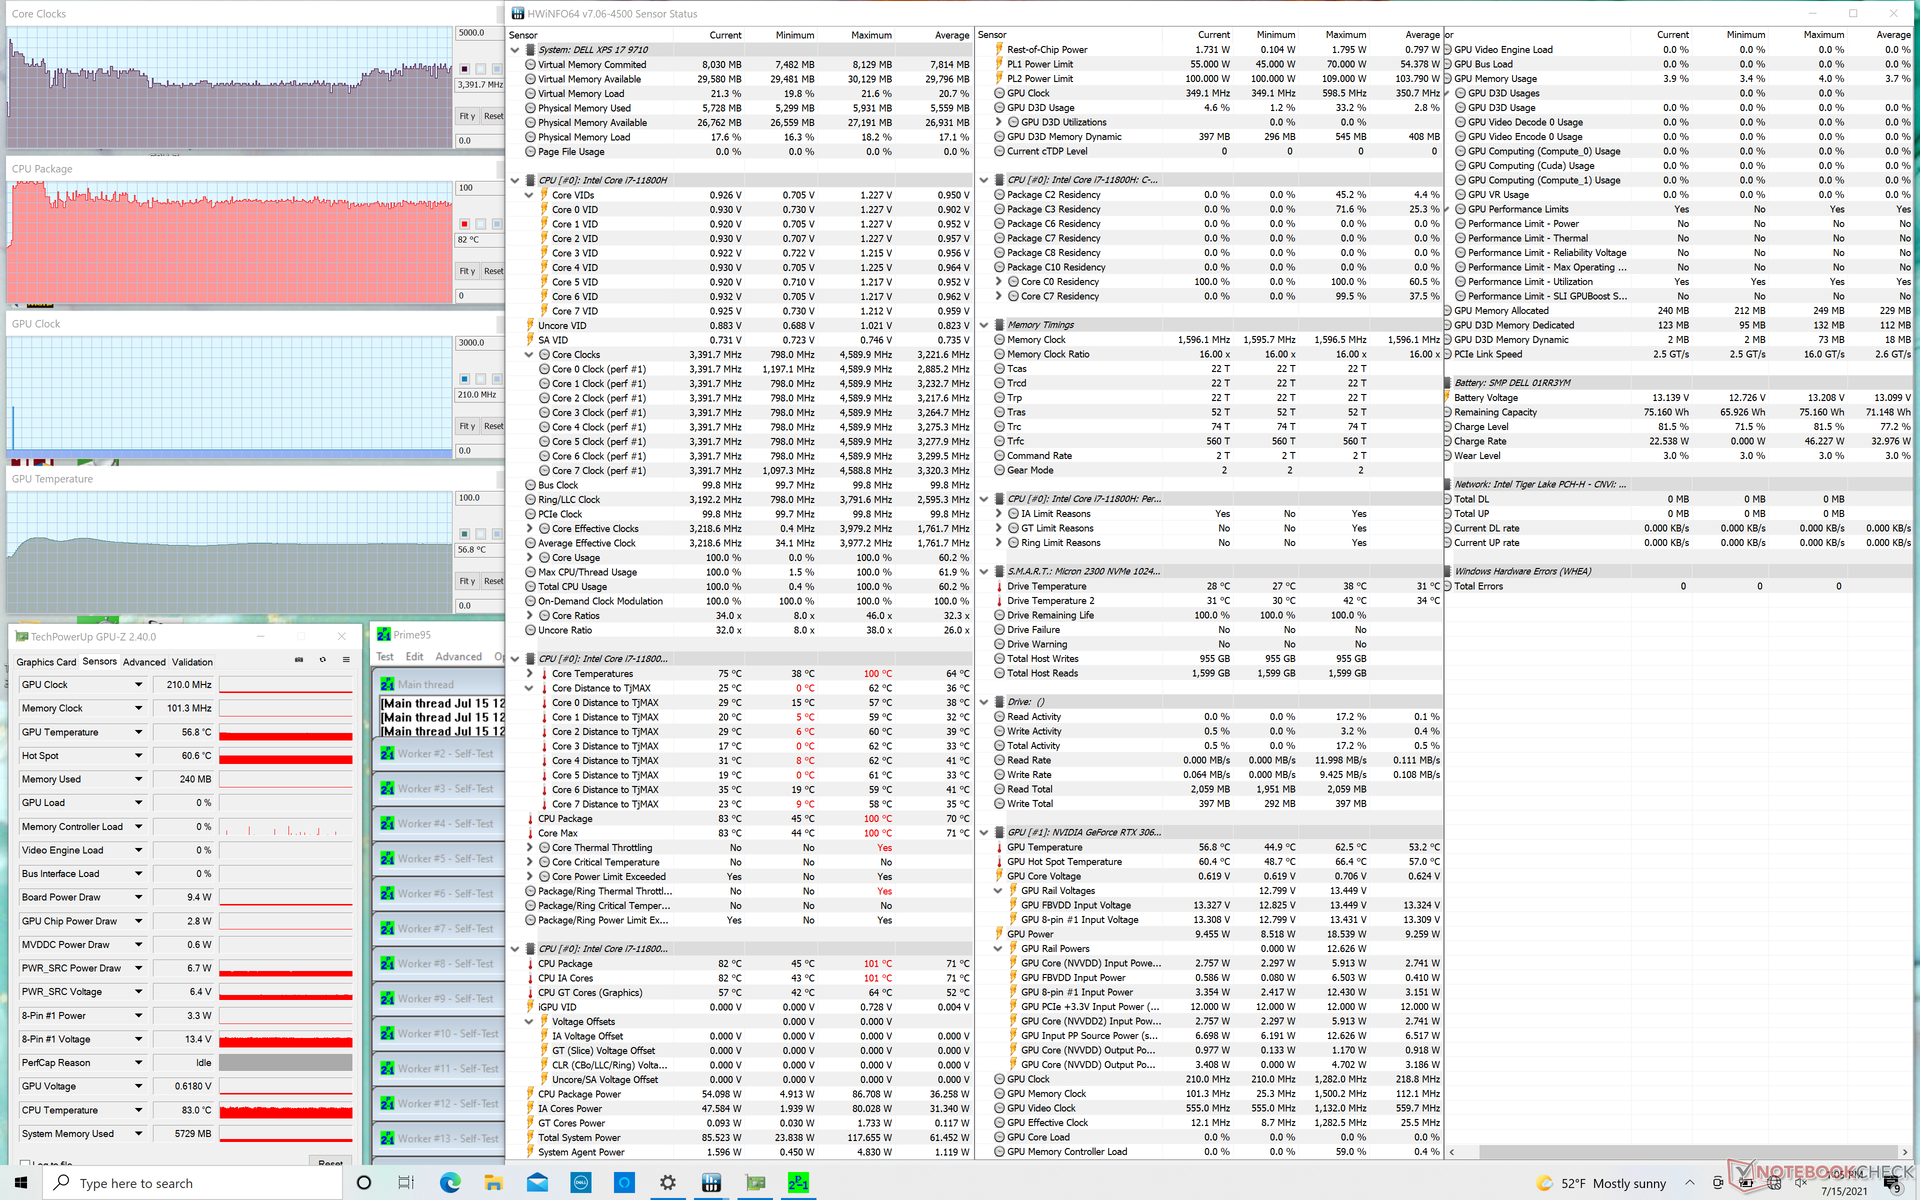
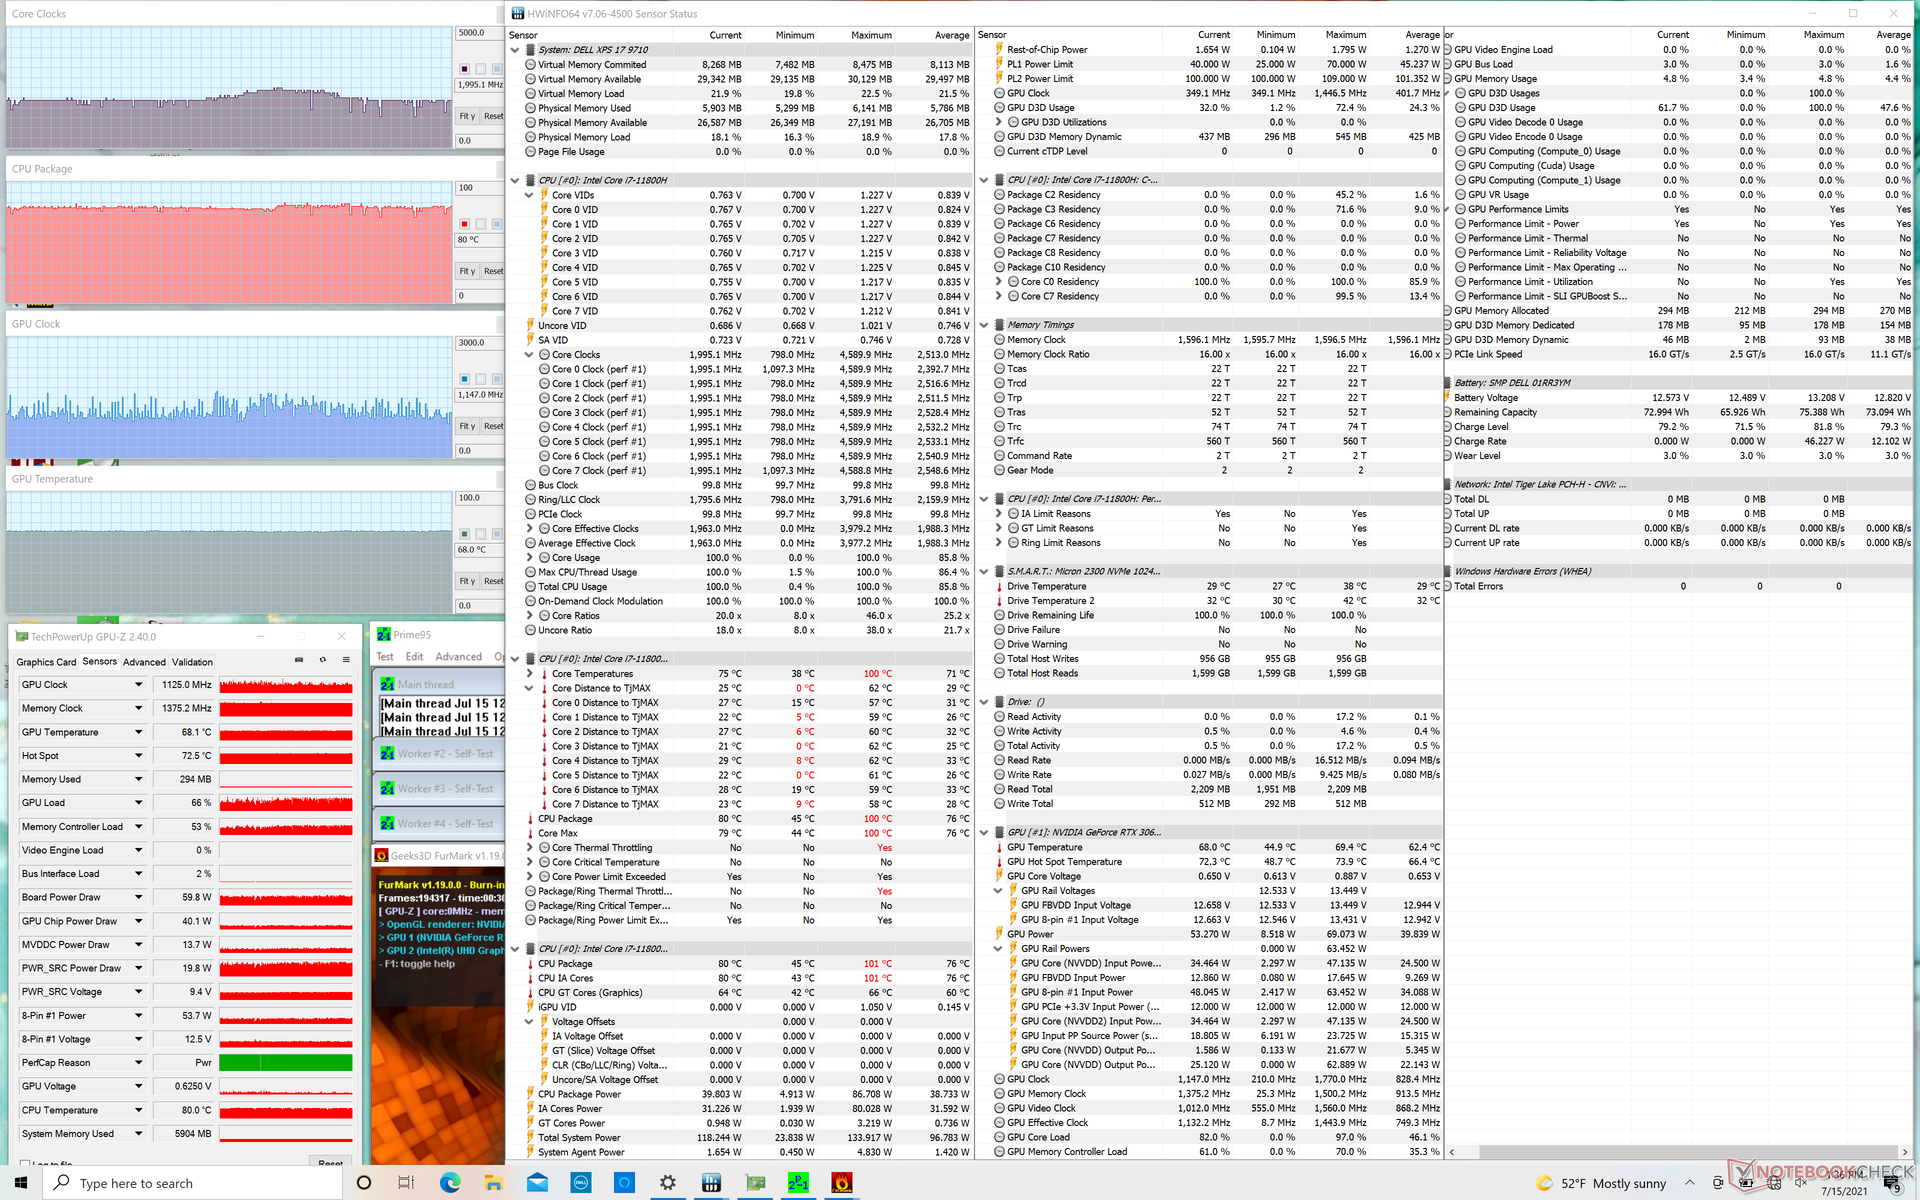
Prueba de esfuerzo
Cuando se estresa con Prime95, la CPU se eleva a 3,6-4 GHz y a una temperatura del núcleo de 100 C. Sin embargo, después de unos 90 segundos, la velocidad de reloj oscila entre 2,5 GHz y 3,4 GHz para mantener una temperatura del núcleo más fría de 82 C. Si se ejecuta esta misma prueba en el XPS 17 9700 se obtienen velocidades de reloj del núcleo y temperaturas de 2,9 a 3,1 GHz y 99 C, respectivamente, lo que sugiere que el XPS 19 9710 puede reducir el Turbo Boost de la CPU aún más para obtener temperaturas más bajas cuando sea necesario
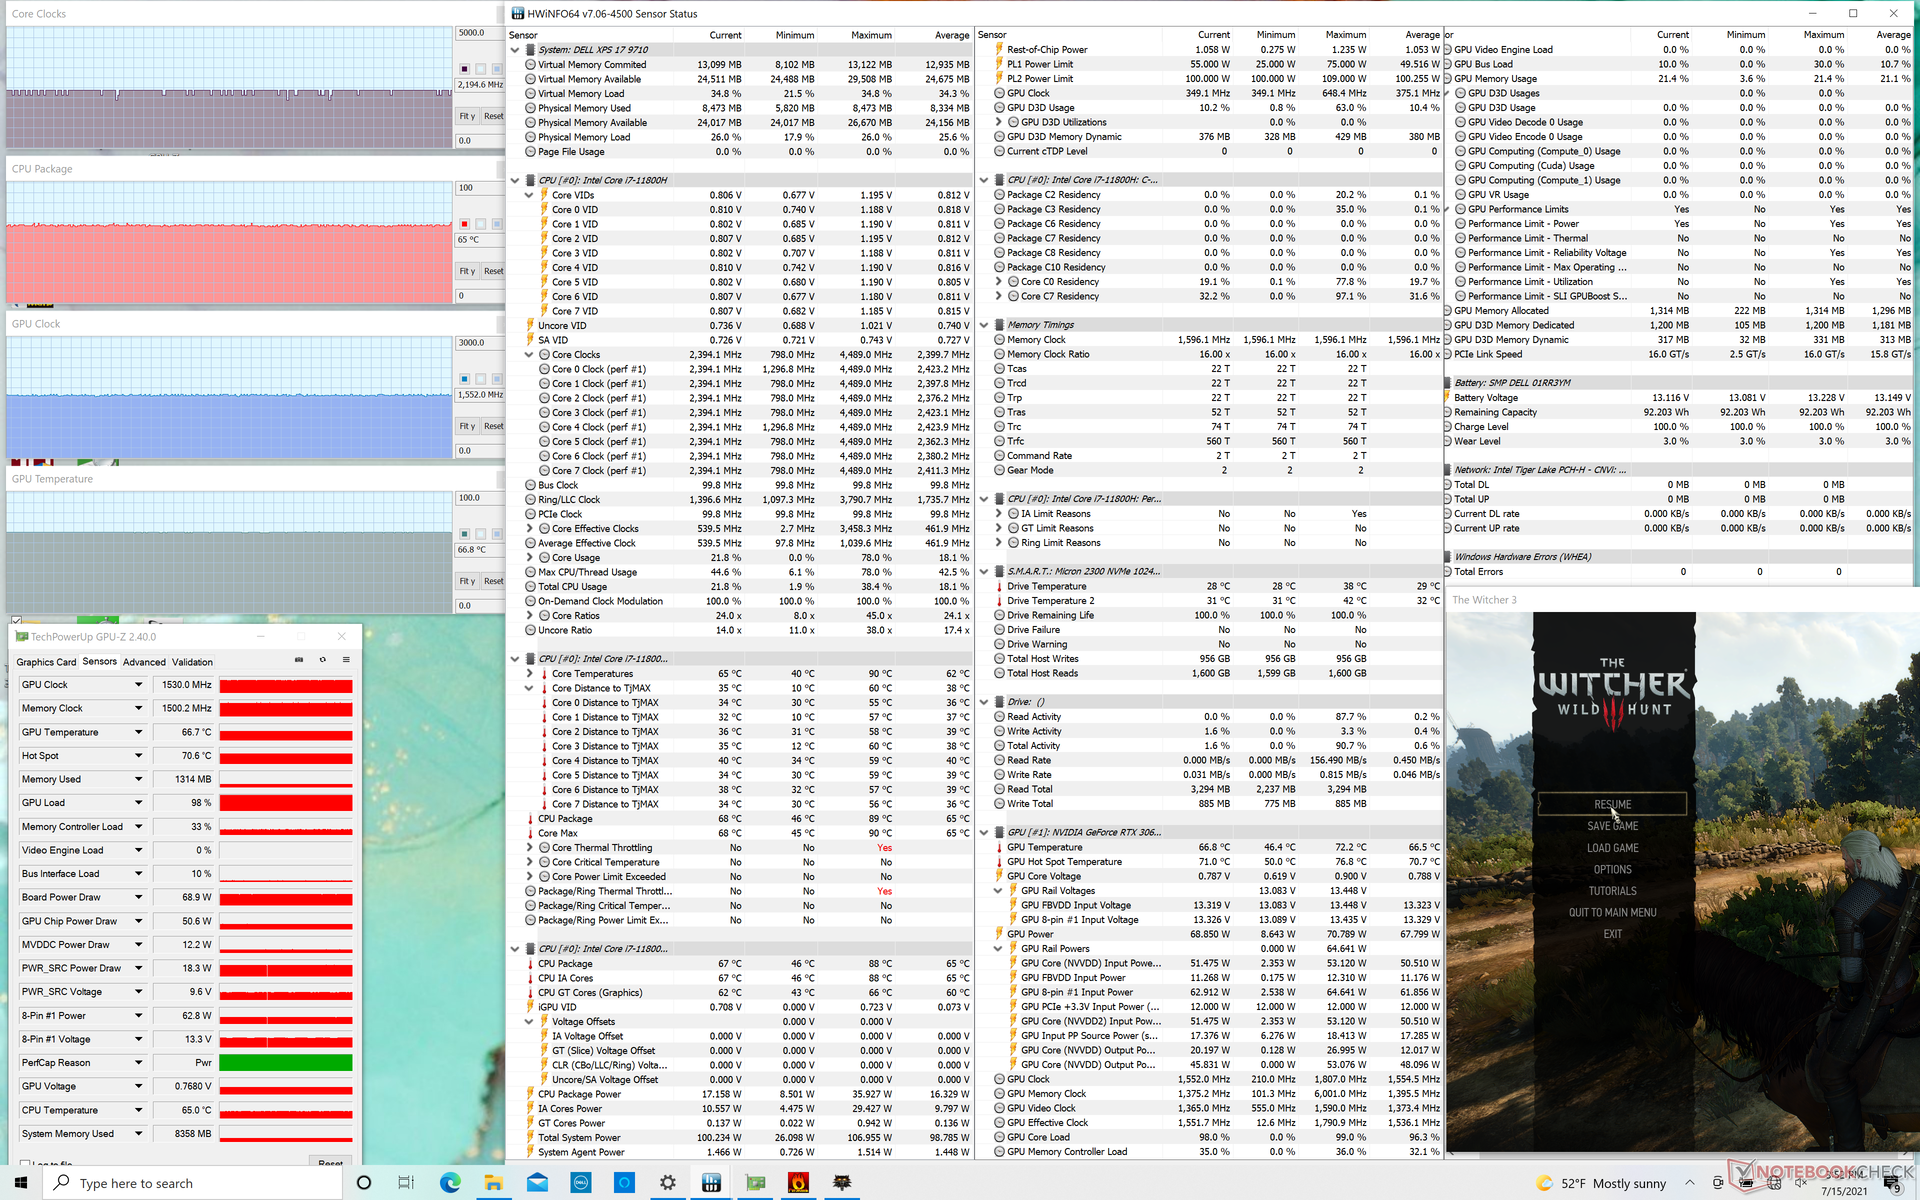
Ejecutando Witcher 3 se muestran tanto los relojes de la GPU como las temperaturas del núcleo más altas que en la RTX 2060 Max-Q. Por otro lado, las frecuencias de reloj de la CPU son más bajas para una menor temperatura de la CPU. La distribución de energía parece estar más ajustada en el XPS 17 9710 que en el 9700 como resultado. Las temperaturas de los núcleos son muy parecidas a las que observamos en el Eluktronics RP-17, que es un portátil de 17,3 pulgadas más grueso pero con la GPU RTX 2060 más antigua.
Funcionar con baterías limitará el rendimiento. Una prueba de Fire Strike en batería devolvería unas puntuaciones de Física y Gráficos de 14102 y 13572 puntos, respectivamente, comparado con 22523 y 17960 puntos cuando está conectado a la red eléctrica.
| Relojde la CPU(GHz) | Reloj dela GPU(MHz) | Temperatura media de la CPU (°C) | Temperaturamediade la GPU (°C) |
| Sistema en reposo | 50 | ||
| EstrésPrime95 | 2,5 - 3,4 | -- | 82 |
| Estrés de Prime95+ FurMark | 1,7 - 2,5 | ~1147 | 80 |
| Witcher 3 Stress | 2.2 | 1530 | 65 |
Altavoces
Los altavoces cuádruples (2 subwoofer de 2,5 W + 2 tweeters de 1,5 W) se mantienen sin cambios respecto al XPS 17 9700 del año pasado. La calidad de audio es más equilibrada que en la mayoría de portátiles, como demuestra la curva de ruido rosa relativamente plana. Sin embargo, el volumen máximo podría haber sido un poco más alto


Dell XPS 17 9710 Core i7 RTX 3060 análisis de audio
(±) | la sonoridad del altavoz es media pero buena (78.3 dB)
Graves 100 - 315 Hz
(±) | lubina reducida - en promedio 5.2% inferior a la mediana
(±) | la linealidad de los graves es media (10.7% delta a frecuencia anterior)
Medios 400 - 2000 Hz
(+) | medios equilibrados - a sólo 2.6% de la mediana
(+) | los medios son lineales (4.5% delta a la frecuencia anterior)
Altos 2 - 16 kHz
(+) | máximos equilibrados - a sólo 2.2% de la mediana
(+) | los máximos son lineales (5% delta a la frecuencia anterior)
Total 100 - 16.000 Hz
(+) | el sonido global es lineal (8.7% de diferencia con la mediana)
En comparación con la misma clase
» 11% de todos los dispositivos probados de esta clase eran mejores, 2% similares, 87% peores
» El mejor tuvo un delta de 5%, la media fue 17%, el peor fue ###max##%
En comparación con todos los dispositivos probados
» 3% de todos los dispositivos probados eran mejores, 1% similares, 97% peores
» El mejor tuvo un delta de 4%, la media fue 23%, el peor fue ###max##%
Apple MacBook 12 (Early 2016) 1.1 GHz análisis de audio
(+) | los altavoces pueden reproducir a un volumen relativamente alto (#83.6 dB)
Graves 100 - 315 Hz
(±) | lubina reducida - en promedio 11.3% inferior a la mediana
(±) | la linealidad de los graves es media (14.2% delta a frecuencia anterior)
Medios 400 - 2000 Hz
(+) | medios equilibrados - a sólo 2.4% de la mediana
(+) | los medios son lineales (5.5% delta a la frecuencia anterior)
Altos 2 - 16 kHz
(+) | máximos equilibrados - a sólo 2% de la mediana
(+) | los máximos son lineales (4.5% delta a la frecuencia anterior)
Total 100 - 16.000 Hz
(+) | el sonido global es lineal (10.2% de diferencia con la mediana)
En comparación con la misma clase
» 7% de todos los dispositivos probados de esta clase eran mejores, 2% similares, 90% peores
» El mejor tuvo un delta de 5%, la media fue 18%, el peor fue ###max##%
En comparación con todos los dispositivos probados
» 5% de todos los dispositivos probados eran mejores, 1% similares, 94% peores
» El mejor tuvo un delta de 4%, la media fue 23%, el peor fue ###max##%
Energy Management
Consumo de energía
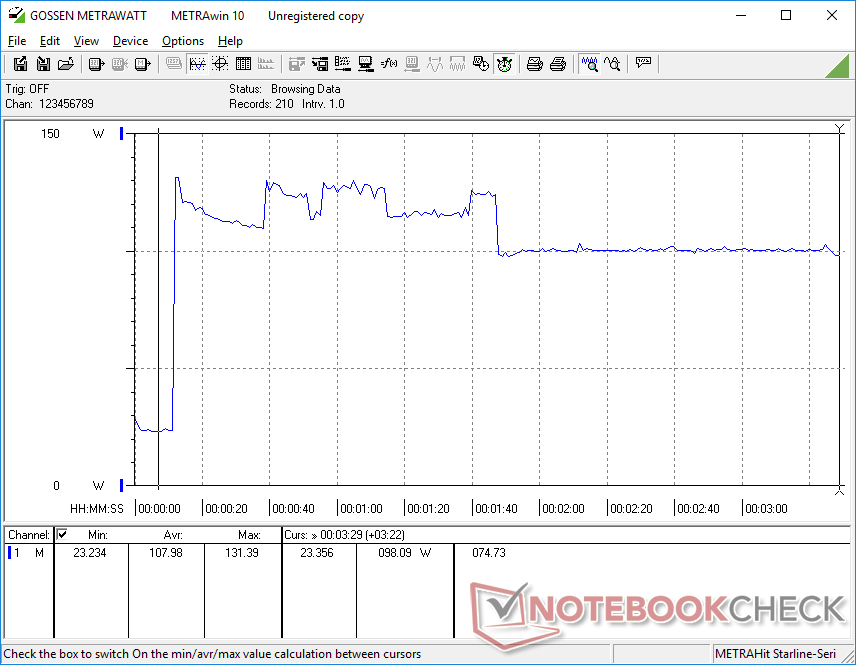
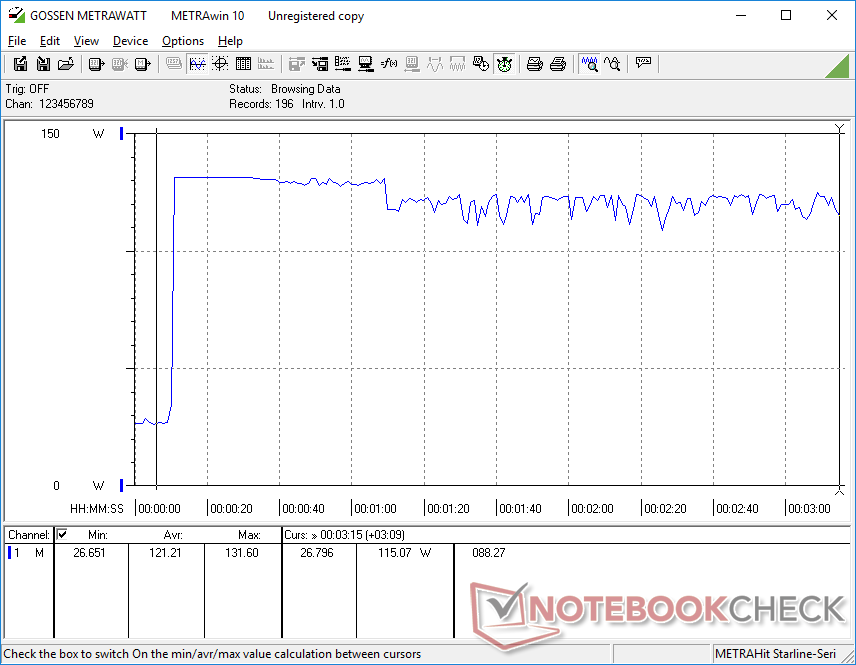
Como se ha señalado dos veces antes deregistramos lecturas de consumo de energía más bajas de lo esperado en nuestro XPS 17 9700 SKU, lo que provocó el agotamiento de la batería incluso cuando estaba conectado a una toma de corriente. Afortunadamente, Dell ha solucionado el problema en el XPS 17 9710. La batería ya no se agotará cuando se ejecuten cargas exigentes y en su lugar permanecerá con la carga que tenga en ese momento. Por ejemplo, si se ejecuta Witcher 3 al 80 por ciento o al 100 por ciento de la carga de la batería mientras está conectada a la red eléctrica no agotará ni cargará la batería en nuestras pruebas
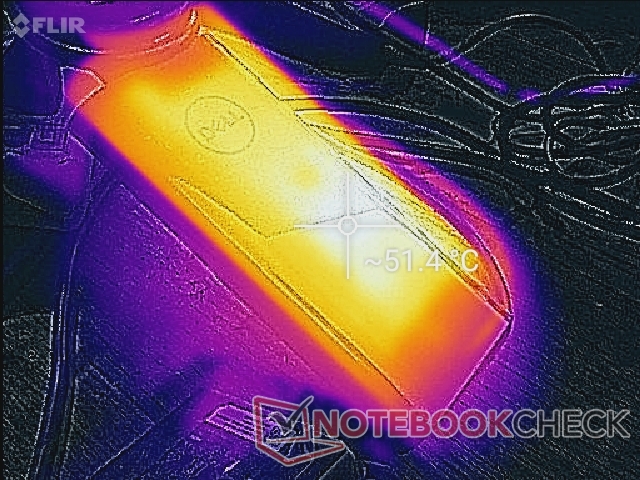
Podemos registrar un nuevo consumo máximo de 131.6 W desde el mismo adaptador de CA de 130 W cuando tanto la CPU como la GPU están al 100% de utilización. Dell usa su propio método de alimentación USB-C para superar el límite estándar de 100 W. Quizá un objetivo aún mayor de 150 W o más habría permitido al portátil cargar y jugar simultáneamente.
El sistema Dell se enviará con un adaptador de CA USB-C de 90 W en vez de 130 W si se configura sin gráficos GeForce.
| Off / Standby | |
| Ocioso | |
| Carga |
|
Clave:
min: | |
| Dell XPS 17 9710 Core i7 RTX 3060 i7-11800H, GeForce RTX 3060 Laptop GPU, Micron 2300 1TB MTFDHBA1T0TDV, IPS, 3840x2400, 17" | Dell XPS 17 9700 Core i7 RTX 2060 Max-Q i7-10875H, GeForce RTX 2060 Max-Q, Micron 2200S 1TB MTFDHBA1T0TCK, IPS, 3840x2400, 17" | Gigabyte Aero 17 HDR YC i9-10980HK, GeForce RTX 3080 Laptop GPU, ESR01TBTLCG-EAC-4, IPS-Level, 3840x2160, 17.3" | LG Ultra 17U70N i5-10210U, GeForce GTX 1650 Mobile, Samsung SSD PM981a MZVLB512HBJQ, IPS, 2560x1600, 17" | Eluktronics RP-17 R7 4800H, GeForce RTX 2060 Mobile, Phison PS5013 PRO-X-1TB-G2R NVMe SSD, IPS, 1920x1080, 17.3" | |
|---|---|---|---|---|---|
| Power Consumption | 2% | -58% | 21% | -64% | |
| Idle Minimum * (Watt) | 7.5 | 5.8 23% | 17 -127% | 3.7 51% | 20.2 -169% |
| Idle Average * (Watt) | 15.7 | 20.6 -31% | 21 -34% | 8.8 44% | 24.5 -56% |
| Idle Maximum * (Watt) | 23.1 | 21 9% | 33 -43% | 30.6 -32% | 28.7 -24% |
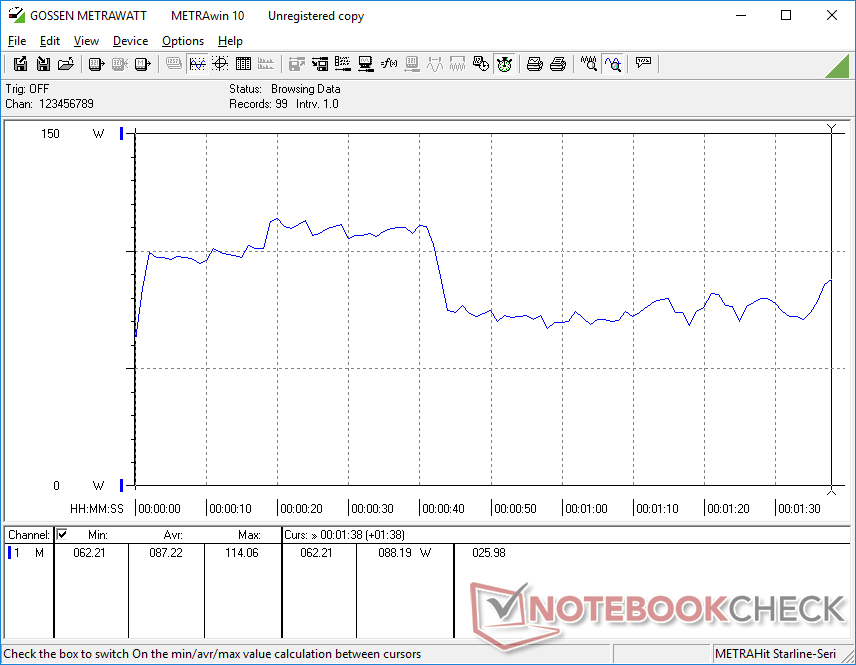
| Load Average * (Watt) | 87.2 | 104.7 -20% | 113 -30% | 67.4 23% | 110.4 -27% |
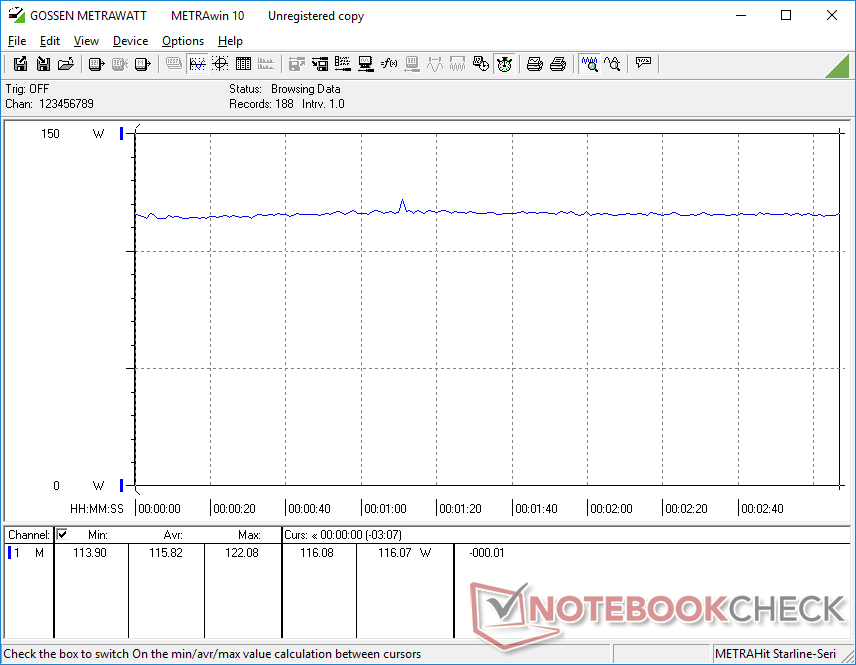
| Witcher 3 ultra * (Watt) | 116 | 99.2 14% | 157 -35% | 84.5 27% | 166.3 -43% |
| Load Maximum * (Watt) | 131.6 | 107.6 18% | 237 -80% | 114 13% | 217.4 -65% |
* ... más pequeño es mejor
Power Consumption Witcher 3 / Stresstest
Duración de la batería
Las duraciones son generalmente las mismas que en el XPS 9700, si no un poco más cortas. Hemos sido capaces de exprimir 7,5 horas de uso real de WLAN comparado con las 9,5 horas del modelo del año pasado
La carga desde el vacío hasta la capacidad total lleva algo más de 2 horas completas comparado con 1,5 horas en la mayoría de otros Ultrabooks ya que el XPS 17 lleva un paquete de baterías de 97 Wh más grande que la media.
| Dell XPS 17 9710 Core i7 RTX 3060 i7-11800H, GeForce RTX 3060 Laptop GPU, 97 Wh | Dell XPS 17 9700 Core i7 RTX 2060 Max-Q i7-10875H, GeForce RTX 2060 Max-Q, 97 Wh | Razer Blade Pro 17 2021 (QHD Touch) i7-10875H, GeForce RTX 3080 Laptop GPU, 70.5 Wh | Gigabyte Aero 17 HDR YC i9-10980HK, GeForce RTX 3080 Laptop GPU, 99 Wh | LG Ultra 17U70N i5-10210U, GeForce GTX 1650 Mobile, 72 Wh | Eluktronics RP-17 R7 4800H, GeForce RTX 2060 Mobile, 62 Wh | |
|---|---|---|---|---|---|---|
| Duración de Batería | 13% | -37% | -35% | 23% | -50% | |
| Reader / Idle (h) | 17.7 | 23.8 34% | 9.9 -44% | 10.3 -42% | 24.8 40% | |
| WiFi v1.3 (h) | 7.6 | 9.7 28% | 5.9 -22% | 5.9 -22% | 13.7 80% | 4.4 -42% |
| Load (h) | 2.6 | 2 -23% | 1.4 -46% | 1.5 -42% | 1.3 -50% | 1.1 -58% |
Pro
Contra
Veredicto - A la segunda va la vencida
Si estabas interesado en el XPS 17 pero dudabas en comprar un modelo de primera generación, esta actualización de segunda generación parece el mejor momento para lanzarse. No sólo soluciona algunos de los errores que encontramos en el modelo del año pasado, sino que también consigue aumentar el rendimiento de la CPU y la GPU en un 30% aproximadamente sin necesidad de recurrir a ventiladores más ruidosos o a una nueva refrigeración. El XPS 17 9710 es el modelo más optimizado que debería haber sido el XPS 17 9700 original.
Las cosas buenas llegan a los que esperan. El XPS 17 de 2021 es la versión más rápida y optimizada del XPS 17 de 2020, con el mismo precio de lanzamiento.
El precio también se ha mantenido más o menos igual. El XPS 17 9700 del año pasado con Core i7-10875H y RTX 2060 Max-Q se lanzó por algo menos de 3000 dólares, mientras que nuestra configuración con el Core i7-11800H y RTX 3060 sale por unos 2900 dólares. Los nuevos propietarios estarían obteniendo un rendimiento más rápido sin necesidad de pagar más que los early adopters.
Otras actualizaciones menores como los puertos Thunderbolt 4 y las ranuras SSD PCIe 4 son buenas adiciones, pero la mayoría de usuarios fuera de los entusiastas no apreciarán del todo estos cambios. Nos encantaría ver actualizaciones más llamativas como un obturador de cámara web, una cámara web de mayor calidad o posibles opciones de color para hacer el sistema aún más atractivo de lo que ya es.
Todavía no hay muchos competidores directos del XPS 17, incluso después de un año completo en el mercado, debido a la relación de aspecto única de 17,0 pulgadas 16:10 del sistema. El más ligeroLG Ultra 17 o Gram 17 pero estos son significativamente más lentos y de menor calidad de construcción. Los usuarios a los que no les importe el factor de forma 16:9 más común de 17,3 pulgadas pueden encontrar opciones de Razer o MSI con opciones GeForce RTX más rápidas que el Dell.
Precio y disponibilidad
El XPS 17 9710 todavía no está disponible en los principales minoristas en el momento de escribir este artículo, excepto en la propia tienda online de Dell https://www.dell.com/en-us/member/shop/laptops/17-new/spd/xps-17-9710-laptop/xn9710cto220s. Nuestra configuración exacta puede encontrarse por 2900 dólares, mientras que las versiones inferiores con el Core i5 básico, gráficos integrados, 8 GB de RAM, 512 GB de SSD y pantalla FHD+ empiezan en 1500 dólares.
Dell XPS 17 9710 Core i7 RTX 3060
- 07/19/2021 v7 (old)
Allen Ngo
Price comparison

