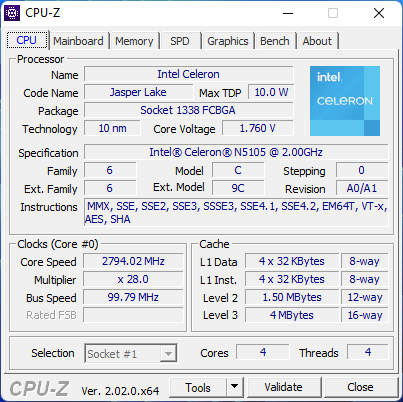
Debut del Celeron N5105 Jasper Lake: Análisis del mini PC Beelink U59
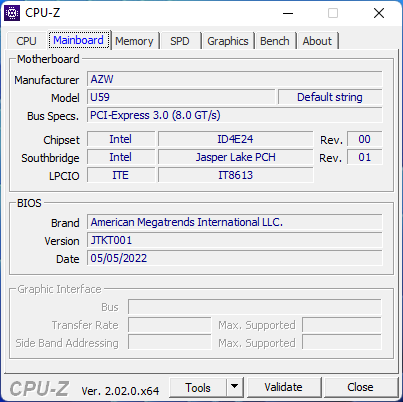
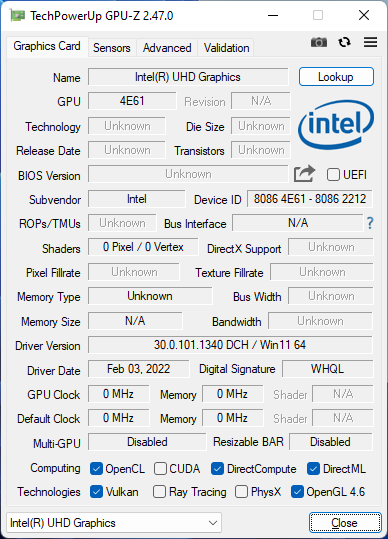
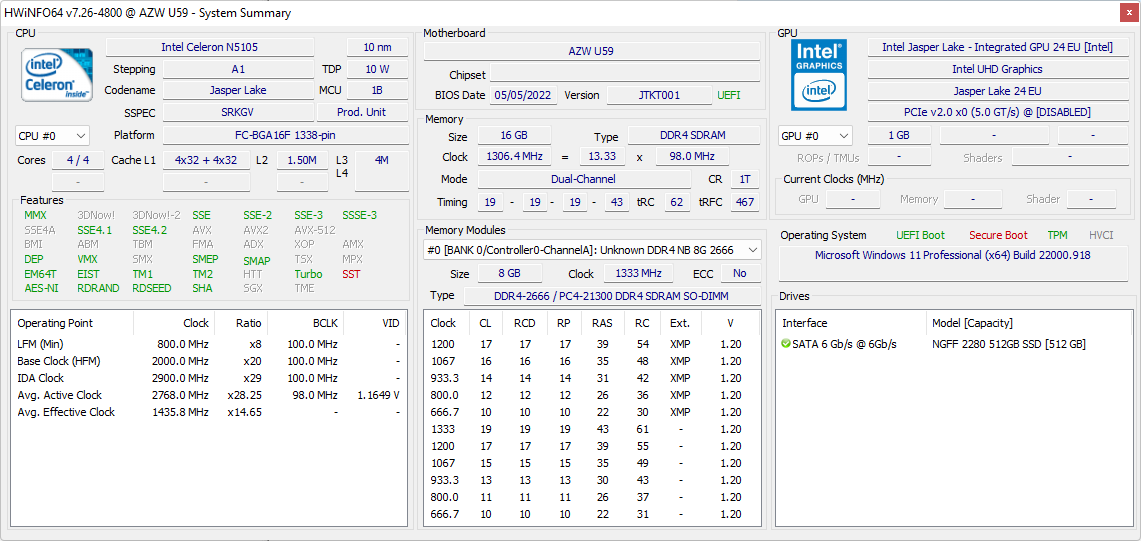
Beelink ha actualizado uno de sus mini PC más económicos con una CPU Intel Celeron N5105 más rápida que sustituye al Celeron N5095 del anterior Modelo U59. Aunque el chasis sigue siendo casi el mismo que antes, hay algunas diferencias importantes que señalaremos en el análisis a continuación
El Beelink U59 compite con otros mini PC económicos como la Serie Nano de Zotac, La serie GMK NucBoxo el Chuwi GBox
Más opiniones de Beelink:
Posibles contendientes en la comparación
Valoración | Fecha | Modelo | Peso | Altura | Tamaño | Resolución | Precio |
|---|---|---|---|---|---|---|---|
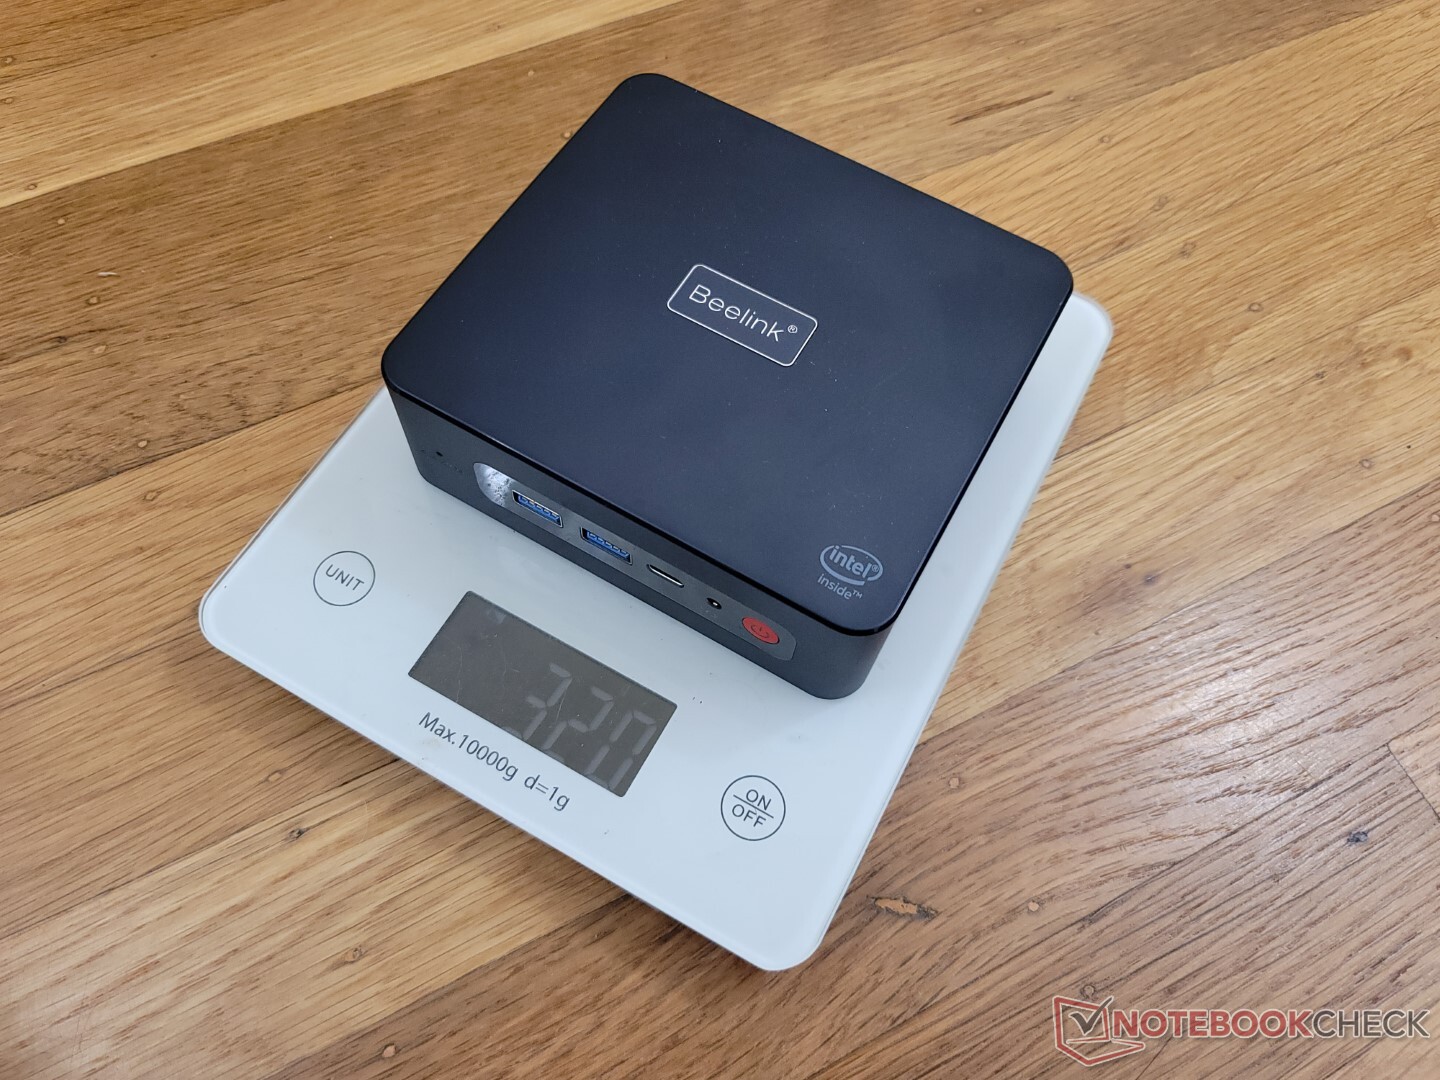
v (old) | 09/2022 | Beelink U59 N5105 Celeron N5105, UHD Graphics (Jasper Lake 24 EU) | 320 g | 42 mm | x | ||
v (old) | 06/2022 | Beelink U59 Mini-S Celeron N5095, UHD Graphics (Jasper Lake 16 EU) | 279 g | 41 mm | x | ||
v (old) | 04/2022 | Beelink SER4 R7 4800U, Vega 8 | 494 g | 40 mm | x | ||
v (old) | 11/2021 | Beelink SER3 R7 3750H, Vega 10 | 492 g | 40 mm | x | ||
v (old) | 04/2021 | Intel NUC11TNKi5 i5-1135G7, Iris Xe G7 80EUs | 504 g | 37 mm | x | ||
v (old) | 07/2022 | Zotac ZBOX PI336 pico Celeron N6211, UHD Graphics (Elkhart Lake 16 EU) | 293 g | 20.7 mm | x |
Caso
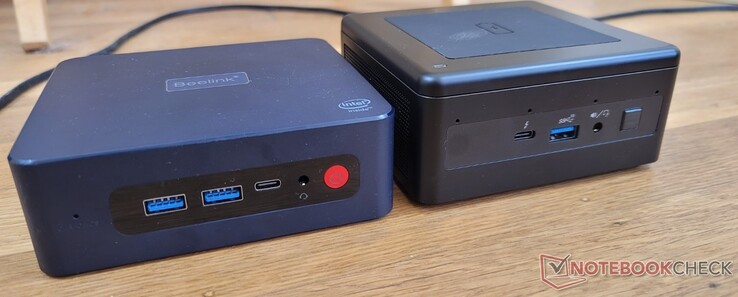
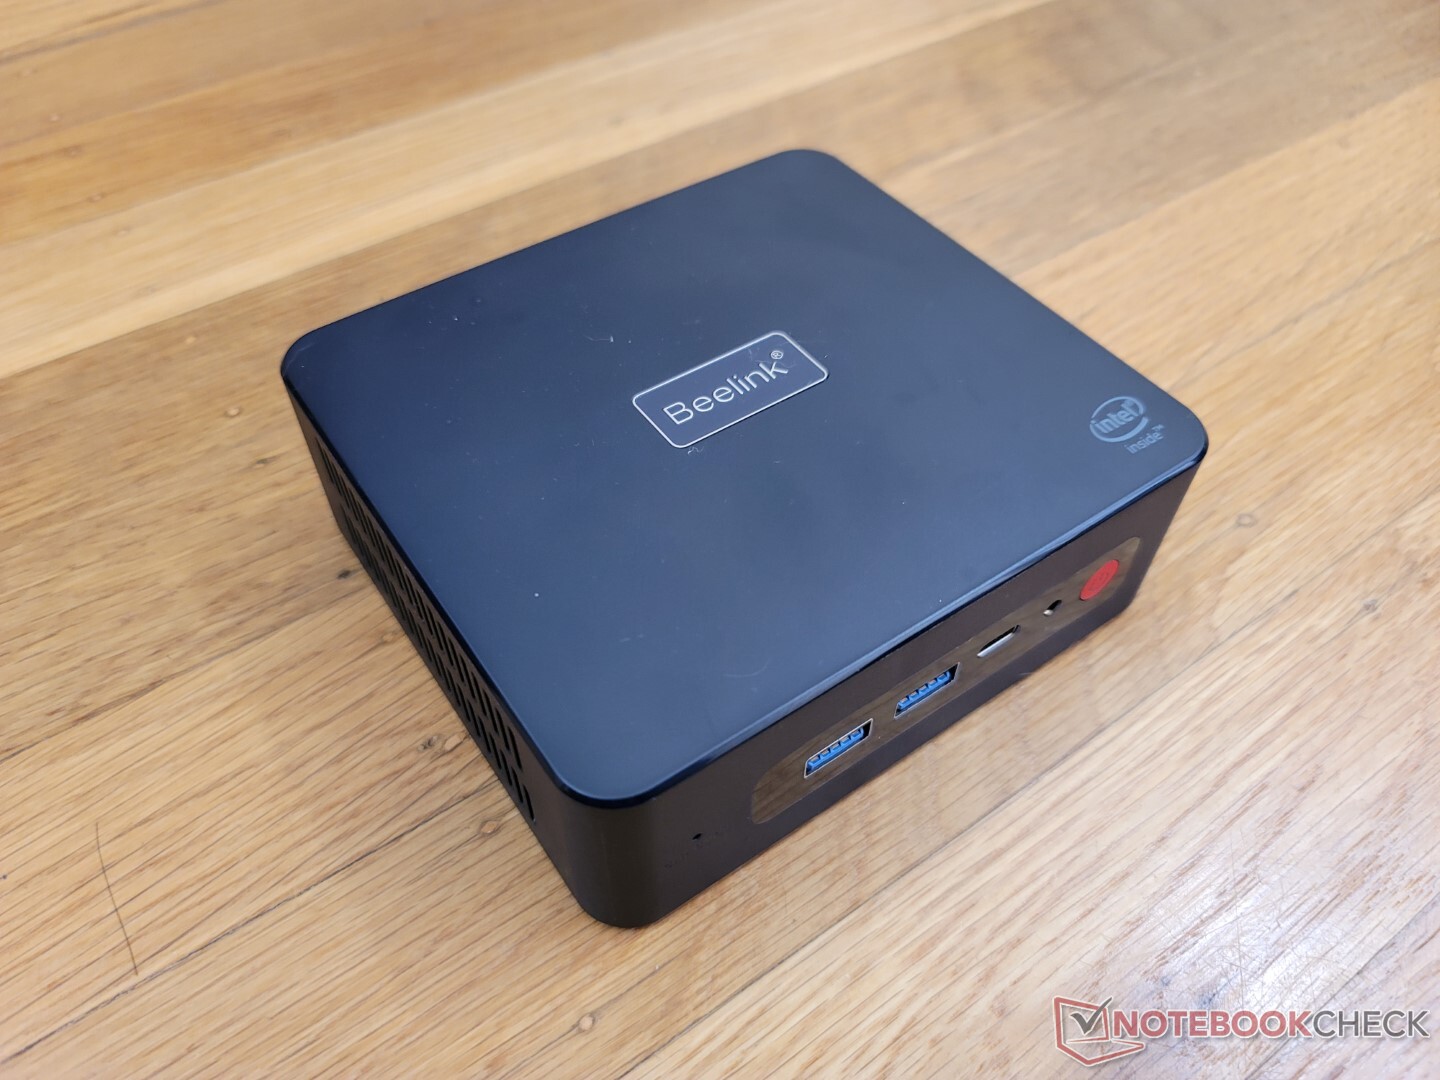
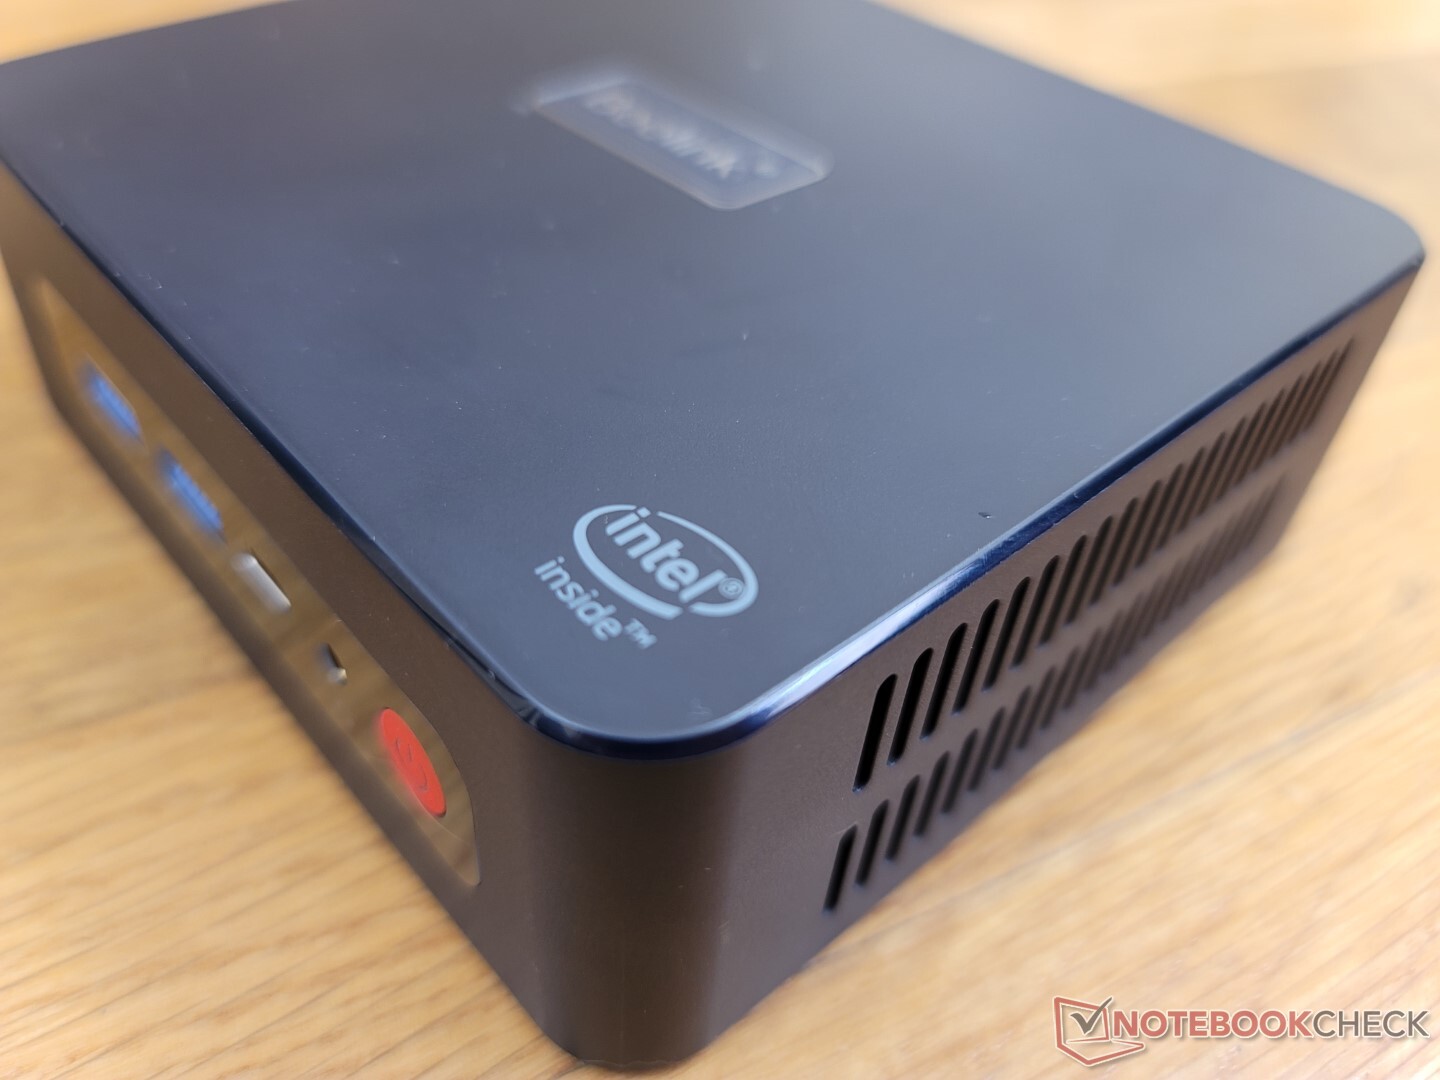
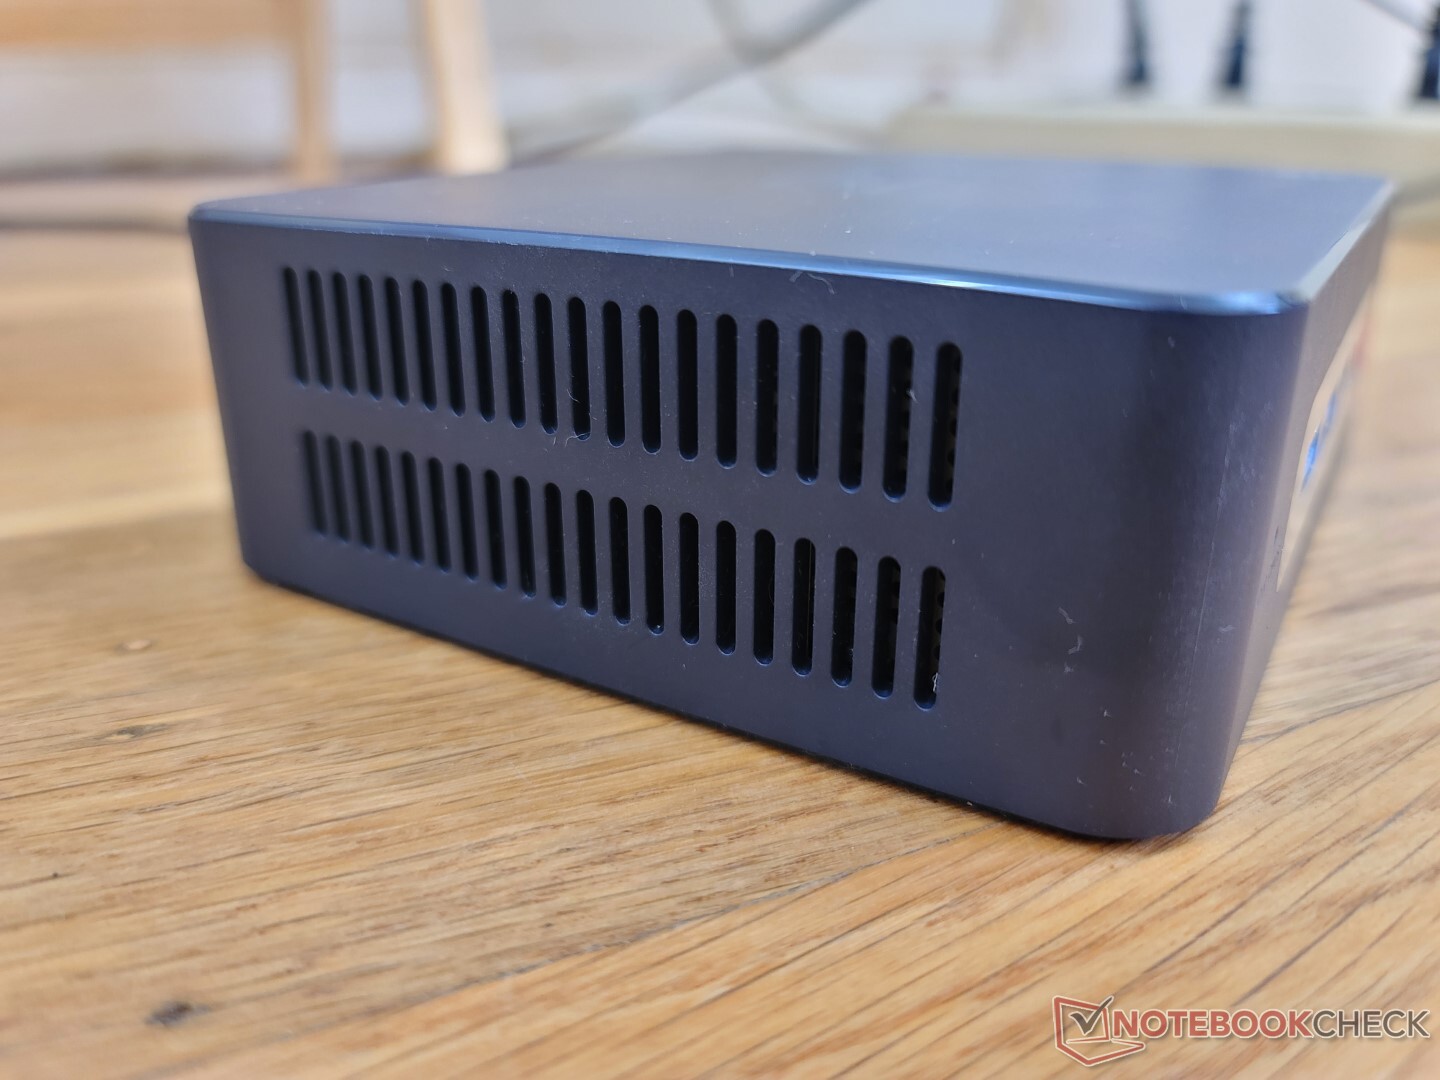
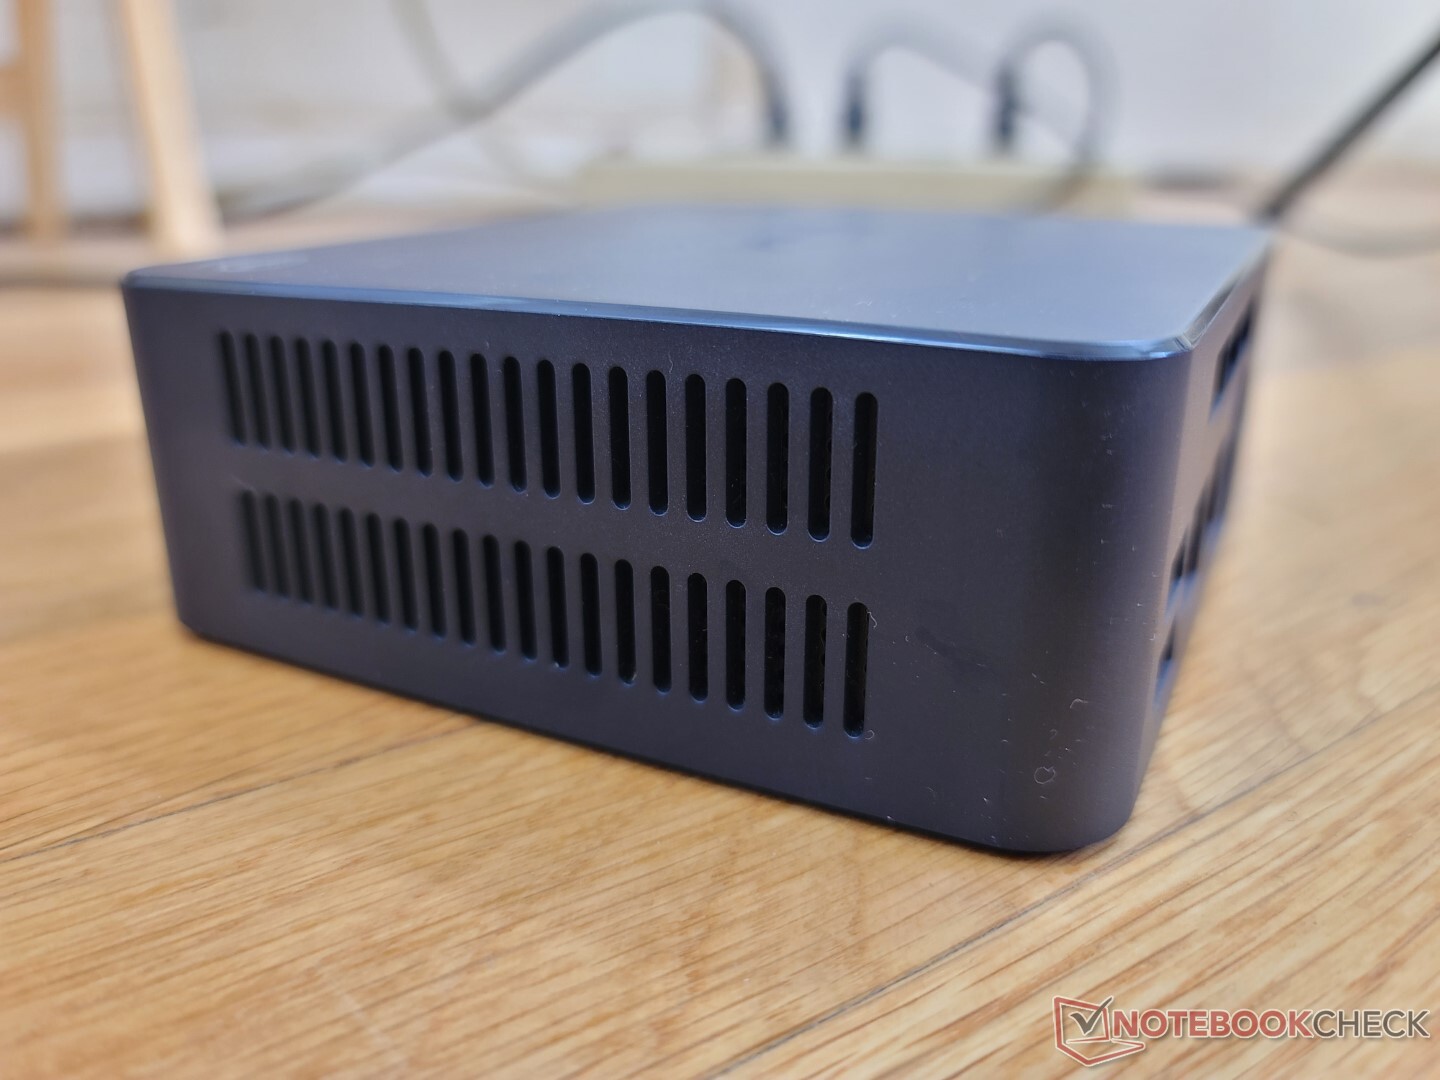
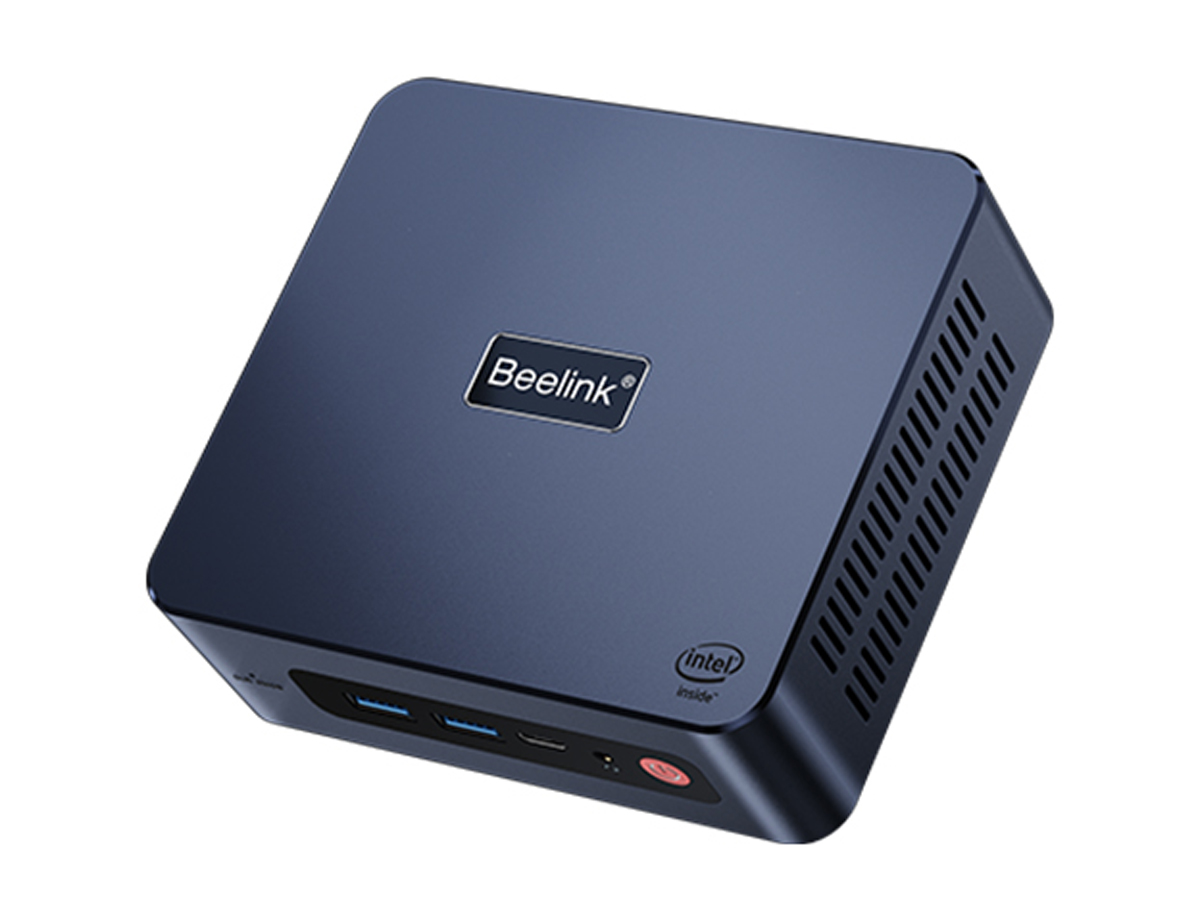
Molestamente, Beelink ofrece tres diferentes U59 cada uno con opciones de puertos, diseños y características internas ligeramente diferentes. Por lo demás, las dimensiones y el peso son prácticamente iguales entre ellos. En el caso de nuestro modelo de análisis, el chasis tiene rejillas de ventilación más grandes y una parte superior y un logotipo totalmente mate, en comparación con las rejillas más pequeñas y la parte superior brillante de los modelos anteriores.
Conectividad
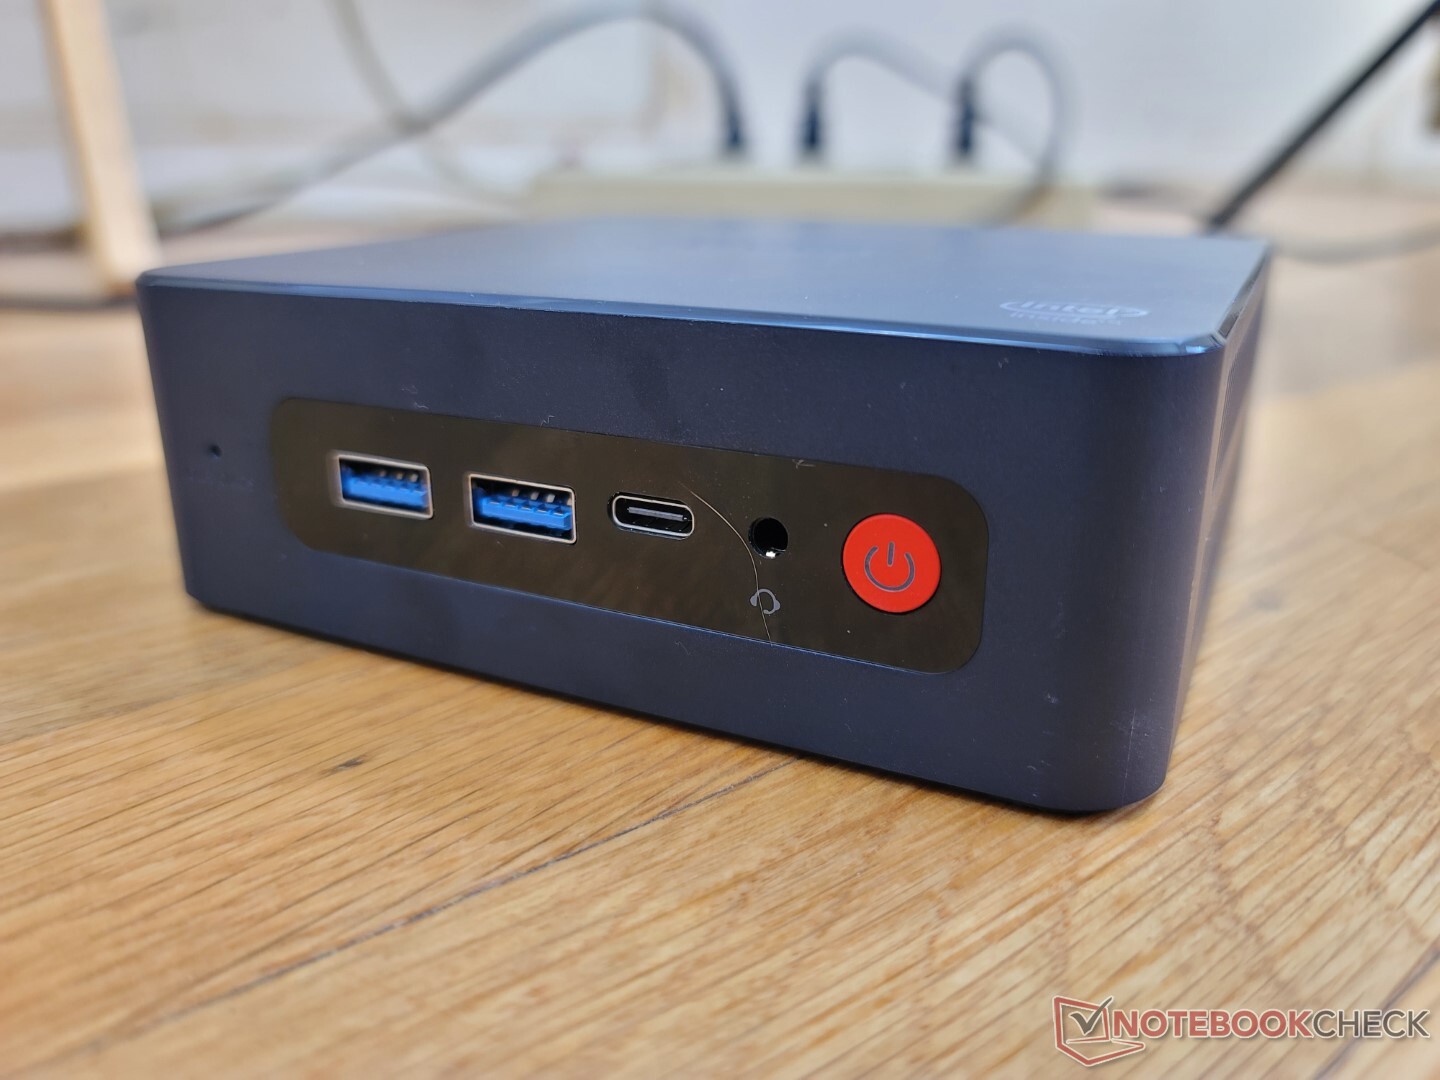
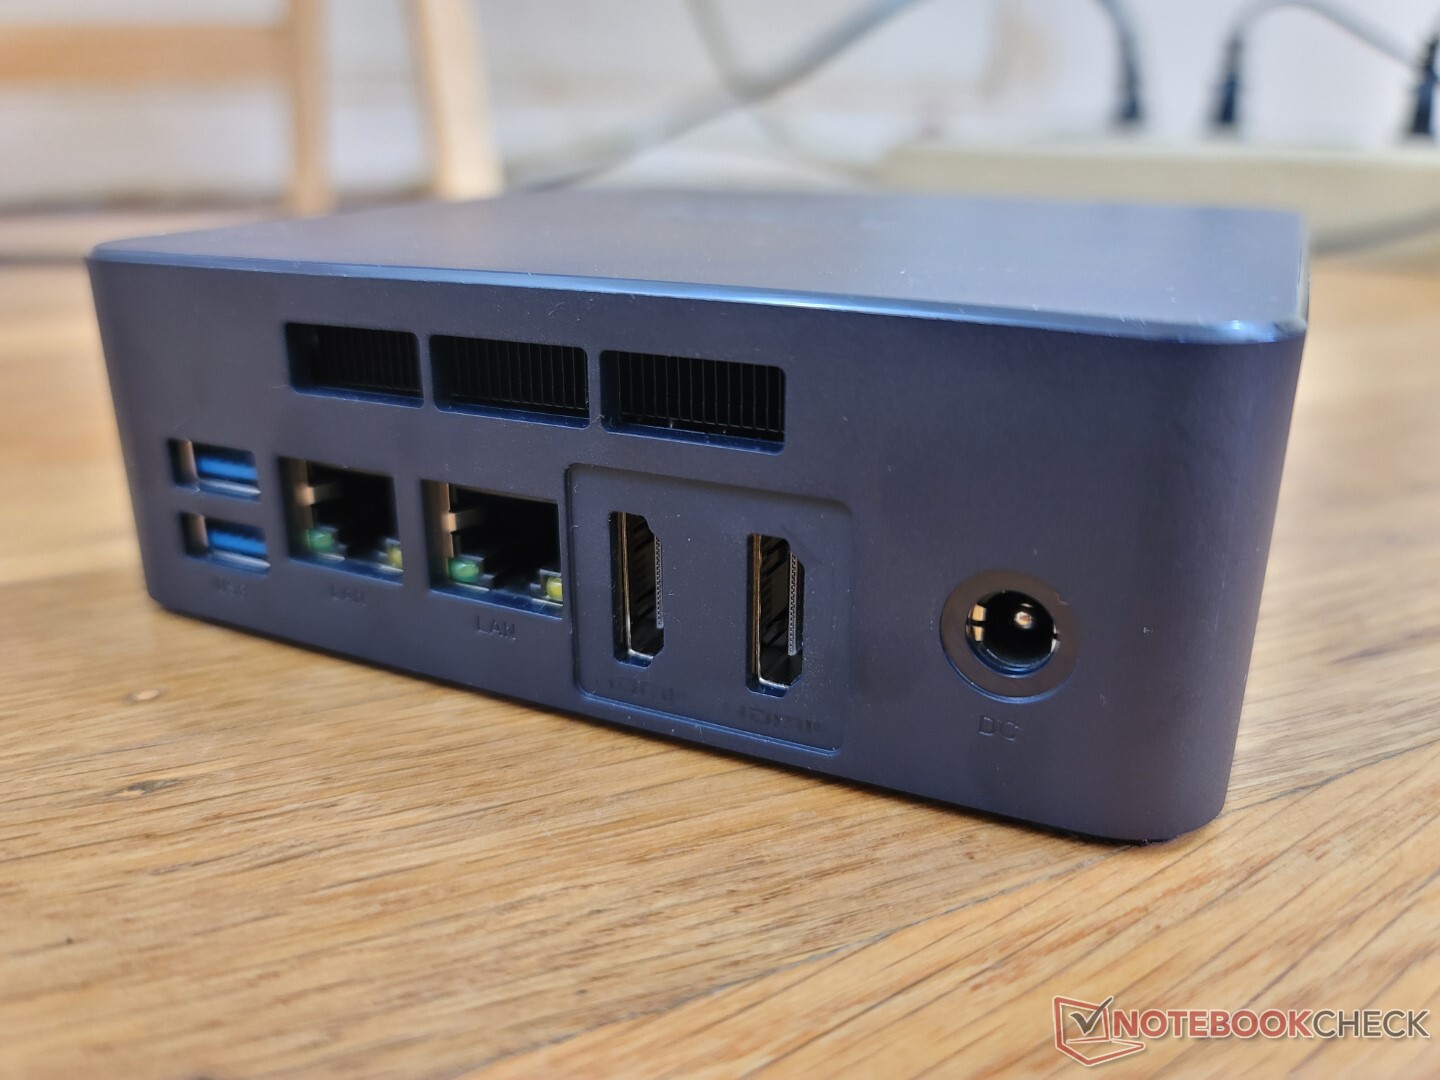
Las opciones de puerto son en su mayoría idénticas a las del U59 original, incluyendo el puerto USB-C y la falta de bloqueo Kensington. Para este nuevo modelo, sin embargo, el fabricante ha integrado un segundo puerto RJ-45 para un total de dos. Hay que tener en cuenta que el puerto USB-C soporta DisplayPort pero no Power Delivery, por lo que el sistema depende de su propio adaptador de corriente para alimentarse.
Comunicación
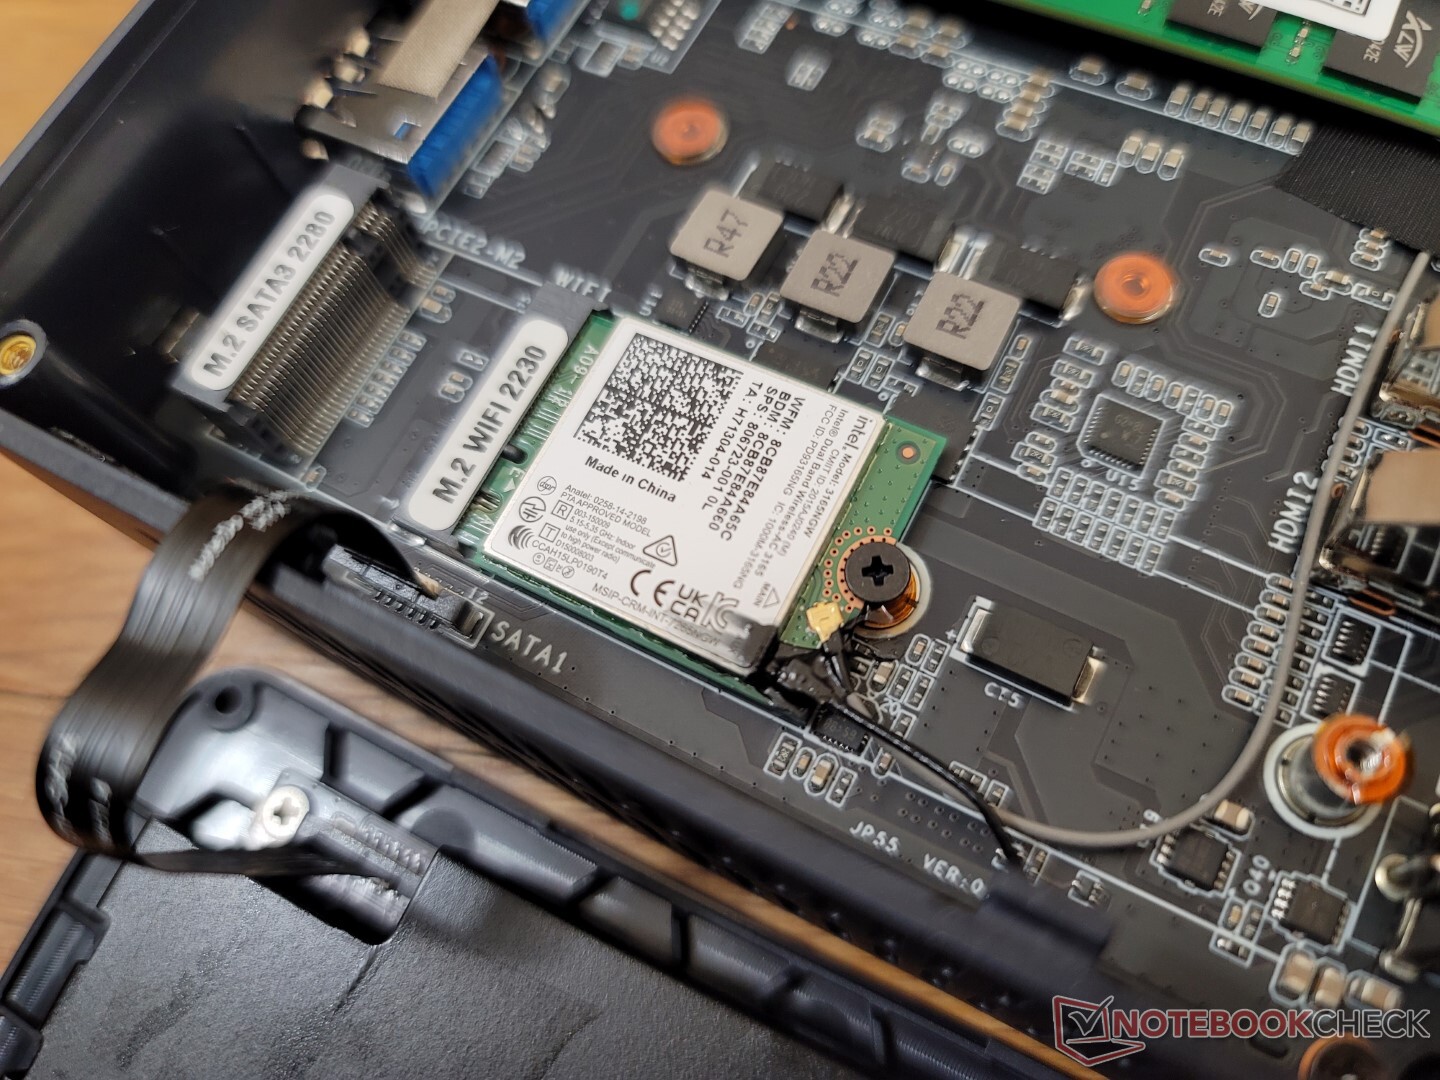
El módulo WLAN Intel 3165 es extraíble, a diferencia de la versión U59 Mini-S. Aunque es lento, no experimentamos problemas de conectividad al transmitir contenido 4K.
| Networking | |
| iperf3 transmit AX12 | |
| Intel NUC11TNKi5 | |
| Beelink SER4 | |
| Beelink SER3 | |
| iperf3 receive AX12 | |
| Intel NUC11TNKi5 | |
| Beelink SER4 | |
| Beelink SER3 | |
| iperf3 receive AXE11000 | |
| Beelink U59 N5105 | |
| Beelink U59 Mini-S | |
| iperf3 transmit AXE11000 | |
| Beelink U59 N5105 | |
| Beelink U59 Mini-S | |
Mantenimiento
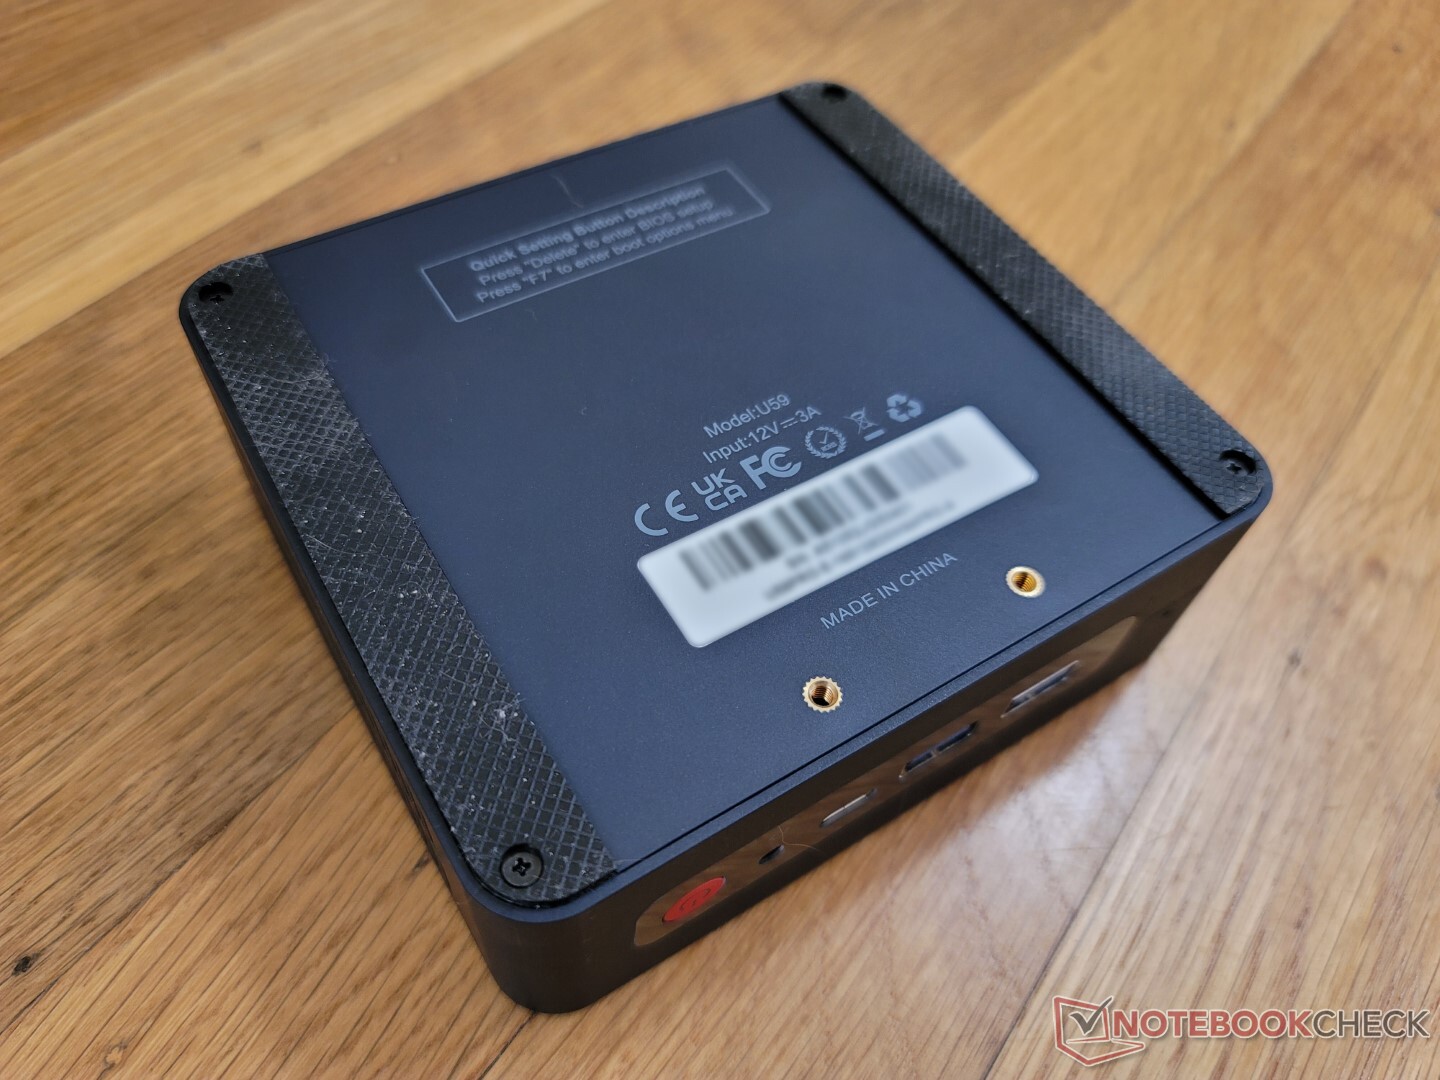
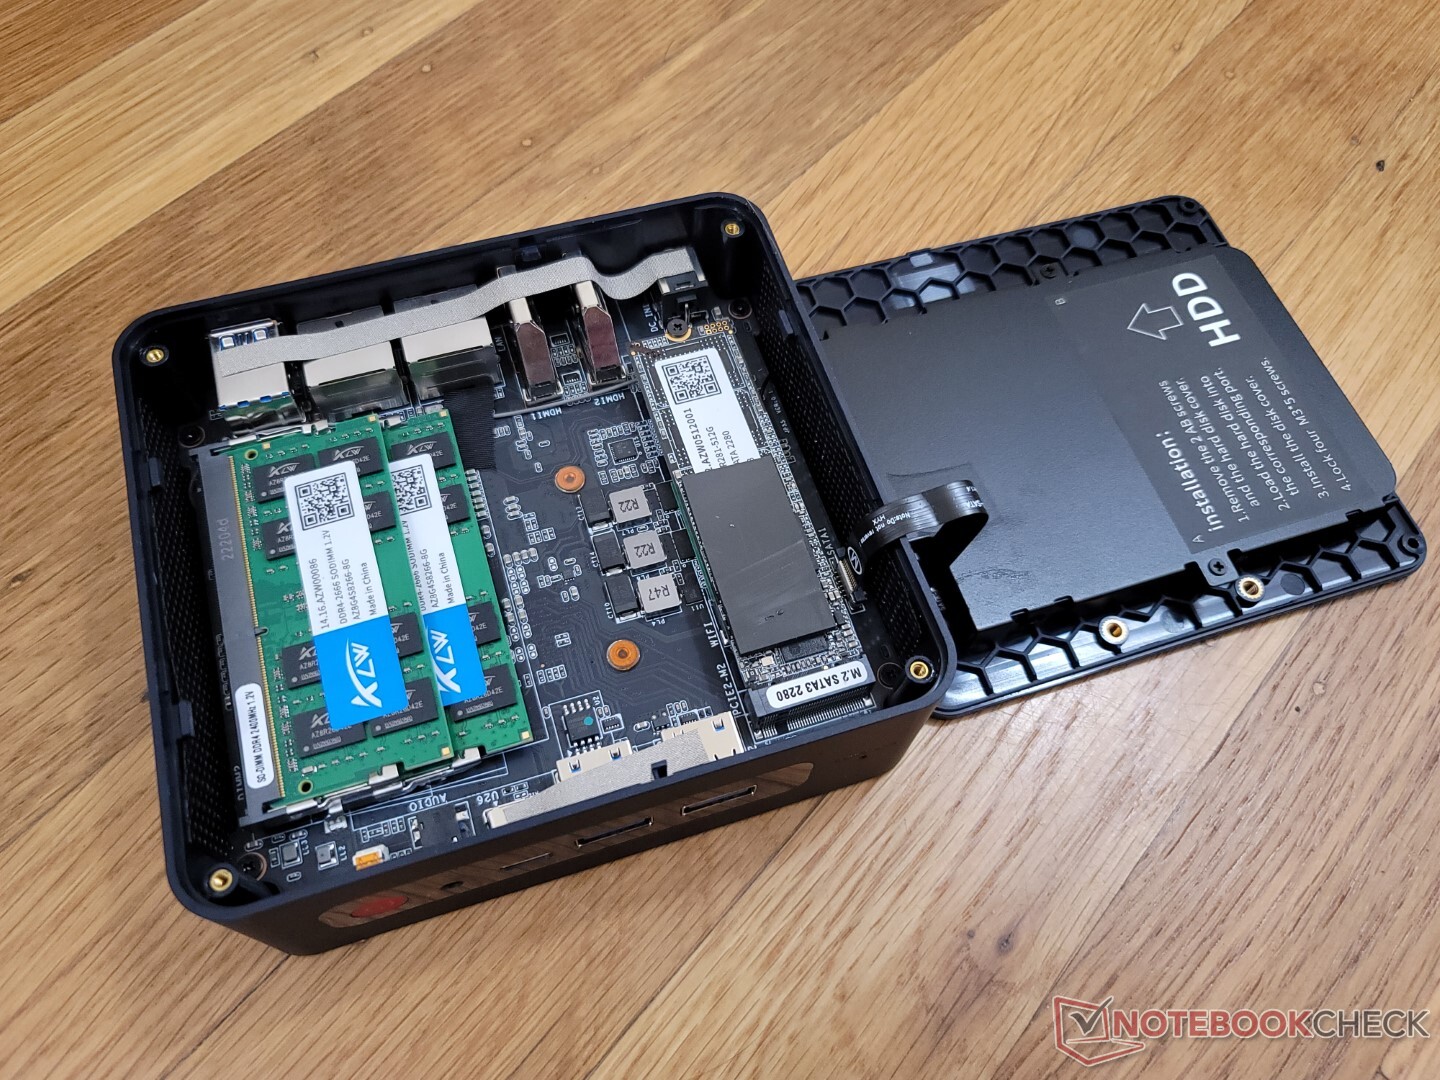
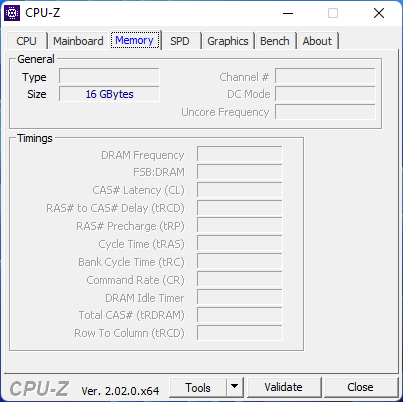
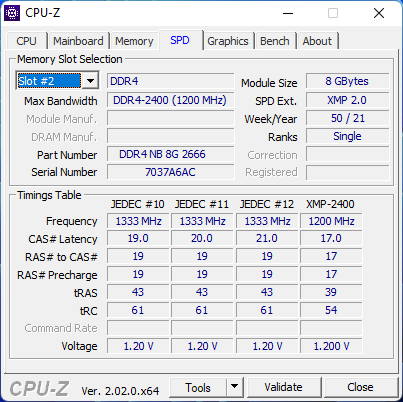
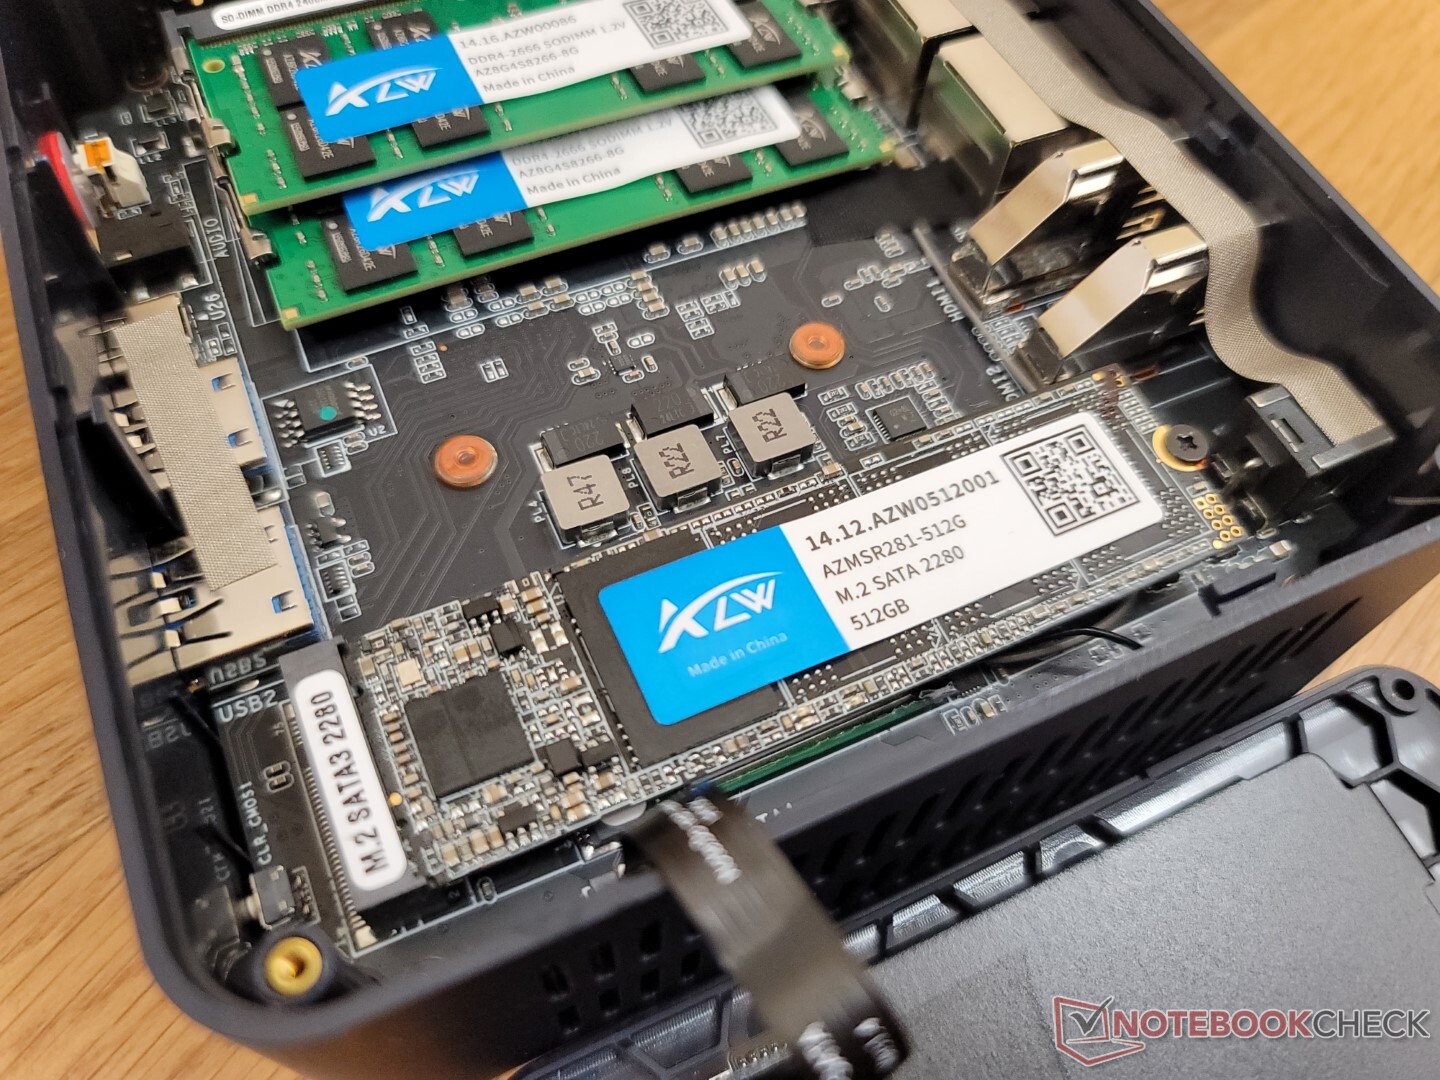
El panel inferior se puede retirar con un simple destornillador Philips para descubrir 2 ranuras de almacenamiento (M.2 SATA 2280 + SATA III de 2,5 pulgadas), 2 ranuras SODIMM y el módulo WLAN M.2 extraíble. En comparación, el U59 Mini-S está limitado a la memoria de un solo canal con su única ranura SODIMM.
Accesorios y garantía
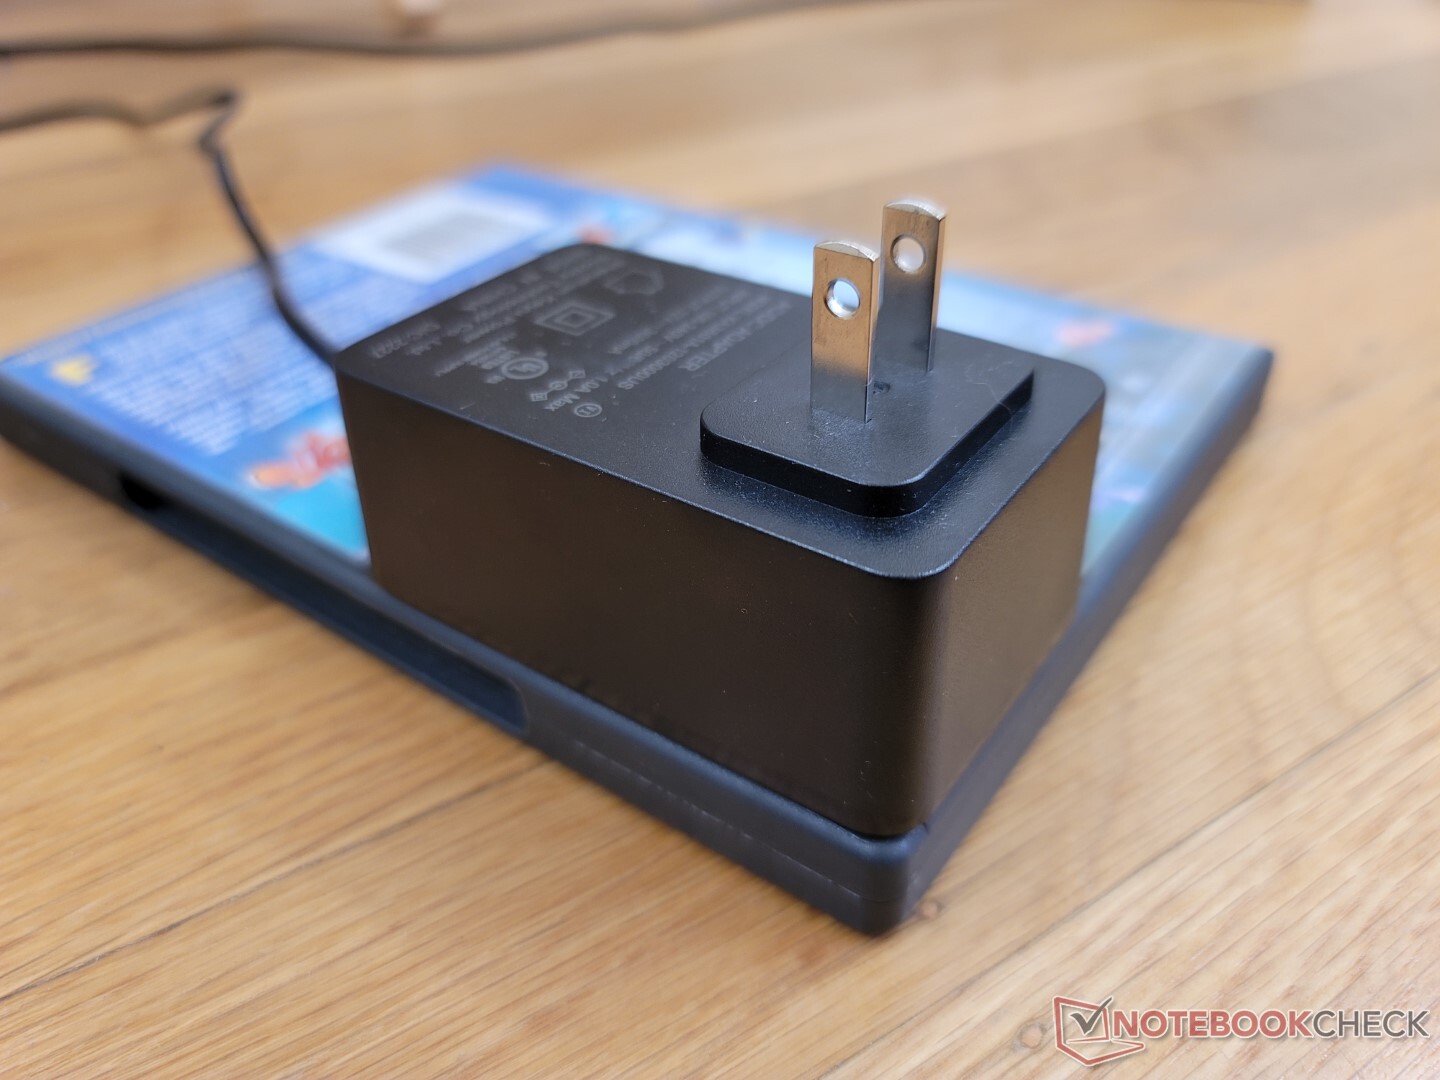
En la caja se incluyen dos cables HDMI, un adaptador de CA, documentación y un soporte adaptador para el montaje VESA.
Se aplica la garantía limitada estándar de un año si se adquiere en Estados Unidos.
Rendimiento
Condiciones de la prueba
Hemos puesto nuestra unidad de prueba en el modo de rendimiento a través de Windows antes de ejecutar las pruebas de rendimiento que se indican a continuación. No hay programas específicos del fabricante ni características de la BIOS relacionadas con el rendimiento del mini PC.
Procesador
El rendimiento bruto de la CPU es sólo un pelo más rápido que el N5095 tanto en operaciones de un solo hilo como de varios. La diferencia de rendimiento es tan pequeña que los dos podrían ser el mismo procesador.
Cinebench R15 Multi Loop
Cinebench R23: Multi Core | Single Core
Cinebench R15: CPU Multi 64Bit | CPU Single 64Bit
Blender: v2.79 BMW27 CPU
7-Zip 18.03: 7z b 4 | 7z b 4 -mmt1
Geekbench 5.5: Multi-Core | Single-Core
HWBOT x265 Benchmark v2.2: 4k Preset
LibreOffice : 20 Documents To PDF
R Benchmark 2.5: Overall mean
| Cinebench R20 / CPU (Multi Core) | |
| Beelink SER4 | |
| Intel NUC11TNKi5 | |
| Beelink SER3 | |
| Lenovo IdeaPad 3 15ITL05 81X80074GE | |
| Beelink U59 N5105 | |
| Medio Intel Celeron N5105 (n=1) | |
| Teclast TBOLT F15 Pro | |
| Beelink U59 Mini-S | |
| Beelink SEi8 | |
| HP 17-by2437ng | |
| Zotac ZBOX PI336 pico | |
| Cinebench R20 / CPU (Single Core) | |
| Lenovo IdeaPad 3 15ITL05 81X80074GE | |
| Intel NUC11TNKi5 | |
| Beelink SER4 | |
| Teclast TBOLT F15 Pro | |
| HP 17-by2437ng | |
| Beelink SER3 | |
| Beelink SEi8 | |
| Beelink U59 N5105 | |
| Medio Intel Celeron N5105 (n=1) | |
| Beelink U59 Mini-S | |
| Zotac ZBOX PI336 pico | |
| Cinebench R23 / Multi Core | |
| Beelink SER4 | |
| Intel NUC11TNKi5 | |
| Beelink SER3 | |
| Lenovo IdeaPad 3 15ITL05 81X80074GE | |
| Beelink U59 N5105 | |
| Medio Intel Celeron N5105 (n=1) | |
| Beelink U59 Mini-S | |
| Teclast TBOLT F15 Pro | |
| Beelink SEi8 | |
| Zotac ZBOX PI336 pico | |
| Cinebench R23 / Single Core | |
| Intel NUC11TNKi5 | |
| Lenovo IdeaPad 3 15ITL05 81X80074GE | |
| Beelink SER4 | |
| Teclast TBOLT F15 Pro | |
| Beelink SER3 | |
| Beelink SEi8 | |
| Beelink U59 N5105 | |
| Medio Intel Celeron N5105 (n=1) | |
| Beelink U59 Mini-S | |
| Zotac ZBOX PI336 pico | |
| Cinebench R15 / CPU Multi 64Bit | |
| Beelink SER4 | |
| Intel NUC11TNKi5 | |
| Beelink SER3 | |
| Lenovo IdeaPad 3 15ITL05 81X80074GE | |
| Beelink U59 N5105 | |
| Medio Intel Celeron N5105 (n=1) | |
| Beelink U59 Mini-S | |
| Teclast TBOLT F15 Pro | |
| Beelink SEi8 | |
| HP 17-by2437ng | |
| Zotac ZBOX PI336 pico | |
| Cinebench R15 / CPU Single 64Bit | |
| Intel NUC11TNKi5 | |
| Beelink SER4 | |
| HP 17-by2437ng | |
| Teclast TBOLT F15 Pro | |
| Beelink SER3 | |
| Lenovo IdeaPad 3 15ITL05 81X80074GE | |
| Beelink SEi8 | |
| Beelink U59 N5105 | |
| Medio Intel Celeron N5105 (n=1) | |
| Beelink U59 Mini-S | |
| Zotac ZBOX PI336 pico | |
| Blender / v2.79 BMW27 CPU | |
| Zotac ZBOX PI336 pico | |
| Beelink U59 Mini-S | |
| Beelink U59 N5105 | |
| Medio Intel Celeron N5105 (n=1) | |
| Teclast TBOLT F15 Pro | |
| HP 17-by2437ng | |
| Beelink SEi8 | |
| Lenovo IdeaPad 3 15ITL05 81X80074GE | |
| Beelink SER3 | |
| Intel NUC11TNKi5 | |
| Beelink SER4 | |
| 7-Zip 18.03 / 7z b 4 | |
| Beelink SER4 | |
| Intel NUC11TNKi5 | |
| Beelink SER3 | |
| Lenovo IdeaPad 3 15ITL05 81X80074GE | |
| Beelink U59 N5105 | |
| Medio Intel Celeron N5105 (n=1) | |
| Beelink U59 Mini-S | |
| HP 17-by2437ng | |
| Teclast TBOLT F15 Pro | |
| Beelink SEi8 | |
| Zotac ZBOX PI336 pico | |
| 7-Zip 18.03 / 7z b 4 -mmt1 | |
| Intel NUC11TNKi5 | |
| Lenovo IdeaPad 3 15ITL05 81X80074GE | |
| Beelink SER4 | |
| HP 17-by2437ng | |
| Teclast TBOLT F15 Pro | |
| Beelink SER3 | |
| Beelink SEi8 | |
| Beelink U59 Mini-S | |
| Beelink U59 N5105 | |
| Medio Intel Celeron N5105 (n=1) | |
| Zotac ZBOX PI336 pico | |
| Geekbench 5.5 / Multi-Core | |
| Beelink SER4 | |
| Intel NUC11TNKi5 | |
| Lenovo IdeaPad 3 15ITL05 81X80074GE | |
| Teclast TBOLT F15 Pro | |
| Beelink U59 N5105 | |
| Medio Intel Celeron N5105 (n=1) | |
| HP 17-by2437ng | |
| Beelink U59 Mini-S | |
| Beelink SEi8 | |
| Zotac ZBOX PI336 pico | |
| Geekbench 5.5 / Single-Core | |
| Intel NUC11TNKi5 | |
| Lenovo IdeaPad 3 15ITL05 81X80074GE | |
| Beelink SER4 | |
| Teclast TBOLT F15 Pro | |
| HP 17-by2437ng | |
| Beelink SEi8 | |
| Beelink U59 N5105 | |
| Medio Intel Celeron N5105 (n=1) | |
| Beelink U59 Mini-S | |
| Zotac ZBOX PI336 pico | |
| HWBOT x265 Benchmark v2.2 / 4k Preset | |
| Beelink SER4 | |
| Intel NUC11TNKi5 | |
| Beelink SER3 | |
| Lenovo IdeaPad 3 15ITL05 81X80074GE | |
| Beelink SEi8 | |
| HP 17-by2437ng | |
| Teclast TBOLT F15 Pro | |
| Beelink U59 N5105 | |
| Medio Intel Celeron N5105 (n=1) | |
| Beelink U59 Mini-S | |
| Zotac ZBOX PI336 pico | |
| LibreOffice / 20 Documents To PDF | |
| Zotac ZBOX PI336 pico | |
| Beelink U59 Mini-S | |
| Beelink U59 N5105 | |
| Medio Intel Celeron N5105 (n=1) | |
| Beelink SER3 | |
| Teclast TBOLT F15 Pro | |
| Beelink SEi8 | |
| HP 17-by2437ng | |
| Beelink SER4 | |
| Intel NUC11TNKi5 | |
| Lenovo IdeaPad 3 15ITL05 81X80074GE | |
| R Benchmark 2.5 / Overall mean | |
| Zotac ZBOX PI336 pico | |
| Beelink U59 Mini-S | |
| Beelink U59 N5105 | |
| Medio Intel Celeron N5105 (n=1) | |
| Beelink SEi8 | |
| Teclast TBOLT F15 Pro | |
| HP 17-by2437ng | |
| Beelink SER3 | |
| Lenovo IdeaPad 3 15ITL05 81X80074GE | |
| Intel NUC11TNKi5 | |
| Beelink SER4 | |
* ... más pequeño es mejor
AIDA64: FP32 Ray-Trace | FPU Julia | CPU SHA3 | CPU Queen | FPU SinJulia | FPU Mandel | CPU AES | CPU ZLib | FP64 Ray-Trace | CPU PhotoWorxx
| Performance rating | |
| Beelink SER4 | |
| Intel NUC11TNKi5 | |
| Beelink SER3 | |
| Beelink U59 N5105 | |
| Beelink U59 Mini-S | |
| Zotac ZBOX PI336 pico | |
| AIDA64 / FP32 Ray-Trace | |
| Beelink SER4 | |
| Intel NUC11TNKi5 | |
| Beelink SER3 | |
| Beelink U59 Mini-S | |
| Beelink U59 N5105 | |
| Zotac ZBOX PI336 pico | |
| AIDA64 / FPU Julia | |
| Beelink SER4 | |
| Intel NUC11TNKi5 | |
| Beelink SER3 | |
| Beelink U59 N5105 | |
| Beelink U59 Mini-S | |
| Zotac ZBOX PI336 pico | |
| AIDA64 / CPU SHA3 | |
| Intel NUC11TNKi5 | |
| Beelink SER4 | |
| Beelink SER3 | |
| Beelink U59 N5105 | |
| Beelink U59 Mini-S | |
| Zotac ZBOX PI336 pico | |
| AIDA64 / CPU Queen | |
| Beelink SER4 | |
| Intel NUC11TNKi5 | |
| Beelink SER3 | |
| Beelink U59 N5105 | |
| Beelink U59 Mini-S | |
| Zotac ZBOX PI336 pico | |
| AIDA64 / FPU SinJulia | |
| Beelink SER4 | |
| Beelink SER3 | |
| Intel NUC11TNKi5 | |
| Beelink U59 Mini-S | |
| Beelink U59 N5105 | |
| Zotac ZBOX PI336 pico | |
| AIDA64 / FPU Mandel | |
| Beelink SER4 | |
| Intel NUC11TNKi5 | |
| Beelink SER3 | |
| Beelink U59 N5105 | |
| Beelink U59 Mini-S | |
| Zotac ZBOX PI336 pico | |
| AIDA64 / CPU AES | |
| Intel NUC11TNKi5 | |
| Beelink SER4 | |
| Beelink SER3 | |
| Beelink U59 N5105 | |
| Beelink U59 Mini-S | |
| Zotac ZBOX PI336 pico | |
| AIDA64 / CPU ZLib | |
| Beelink SER4 | |
| Intel NUC11TNKi5 | |
| Beelink SER3 | |
| Beelink U59 N5105 | |
| Beelink U59 Mini-S | |
| Zotac ZBOX PI336 pico | |
| AIDA64 / FP64 Ray-Trace | |
| Beelink SER4 | |
| Intel NUC11TNKi5 | |
| Beelink SER3 | |
| Beelink U59 N5105 | |
| Beelink U59 Mini-S | |
| Zotac ZBOX PI336 pico | |
| AIDA64 / CPU PhotoWorxx | |
| Beelink SER4 | |
| Intel NUC11TNKi5 | |
| Beelink U59 N5105 | |
| Beelink SER3 | |
| Beelink U59 Mini-S | |
| Zotac ZBOX PI336 pico | |
Rendimiento del sistema
CrossMark: Overall | Productivity | Creativity | Responsiveness
| PCMark 10 / Score | |
| Beelink SER4 | |
| Intel NUC11TNKi5 | |
| Beelink SER3 | |
| Beelink U59 N5105 | |
| Medio Intel Celeron N5105, Intel UHD Graphics (Jasper Lake 24 EU) (n=1) | |
| Beelink U59 Mini-S | |
| PCMark 10 / Essentials | |
| Beelink SER4 | |
| Intel NUC11TNKi5 | |
| Beelink SER3 | |
| Beelink U59 N5105 | |
| Medio Intel Celeron N5105, Intel UHD Graphics (Jasper Lake 24 EU) (n=1) | |
| Beelink U59 Mini-S | |
| PCMark 10 / Productivity | |
| Beelink SER4 | |
| Intel NUC11TNKi5 | |
| Beelink SER3 | |
| Beelink U59 N5105 | |
| Medio Intel Celeron N5105, Intel UHD Graphics (Jasper Lake 24 EU) (n=1) | |
| Beelink U59 Mini-S | |
| PCMark 10 / Digital Content Creation | |
| Beelink SER4 | |
| Intel NUC11TNKi5 | |
| Beelink SER3 | |
| Beelink U59 N5105 | |
| Medio Intel Celeron N5105, Intel UHD Graphics (Jasper Lake 24 EU) (n=1) | |
| Beelink U59 Mini-S | |
| CrossMark / Overall | |
| Beelink U59 N5105 | |
| Medio Intel Celeron N5105, Intel UHD Graphics (Jasper Lake 24 EU) (n=1) | |
| Beelink U59 Mini-S | |
| CrossMark / Productivity | |
| Beelink U59 N5105 | |
| Medio Intel Celeron N5105, Intel UHD Graphics (Jasper Lake 24 EU) (n=1) | |
| Beelink U59 Mini-S | |
| CrossMark / Creativity | |
| Beelink U59 N5105 | |
| Medio Intel Celeron N5105, Intel UHD Graphics (Jasper Lake 24 EU) (n=1) | |
| Beelink U59 Mini-S | |
| CrossMark / Responsiveness | |
| Beelink U59 N5105 | |
| Medio Intel Celeron N5105, Intel UHD Graphics (Jasper Lake 24 EU) (n=1) | |
| Beelink U59 Mini-S | |
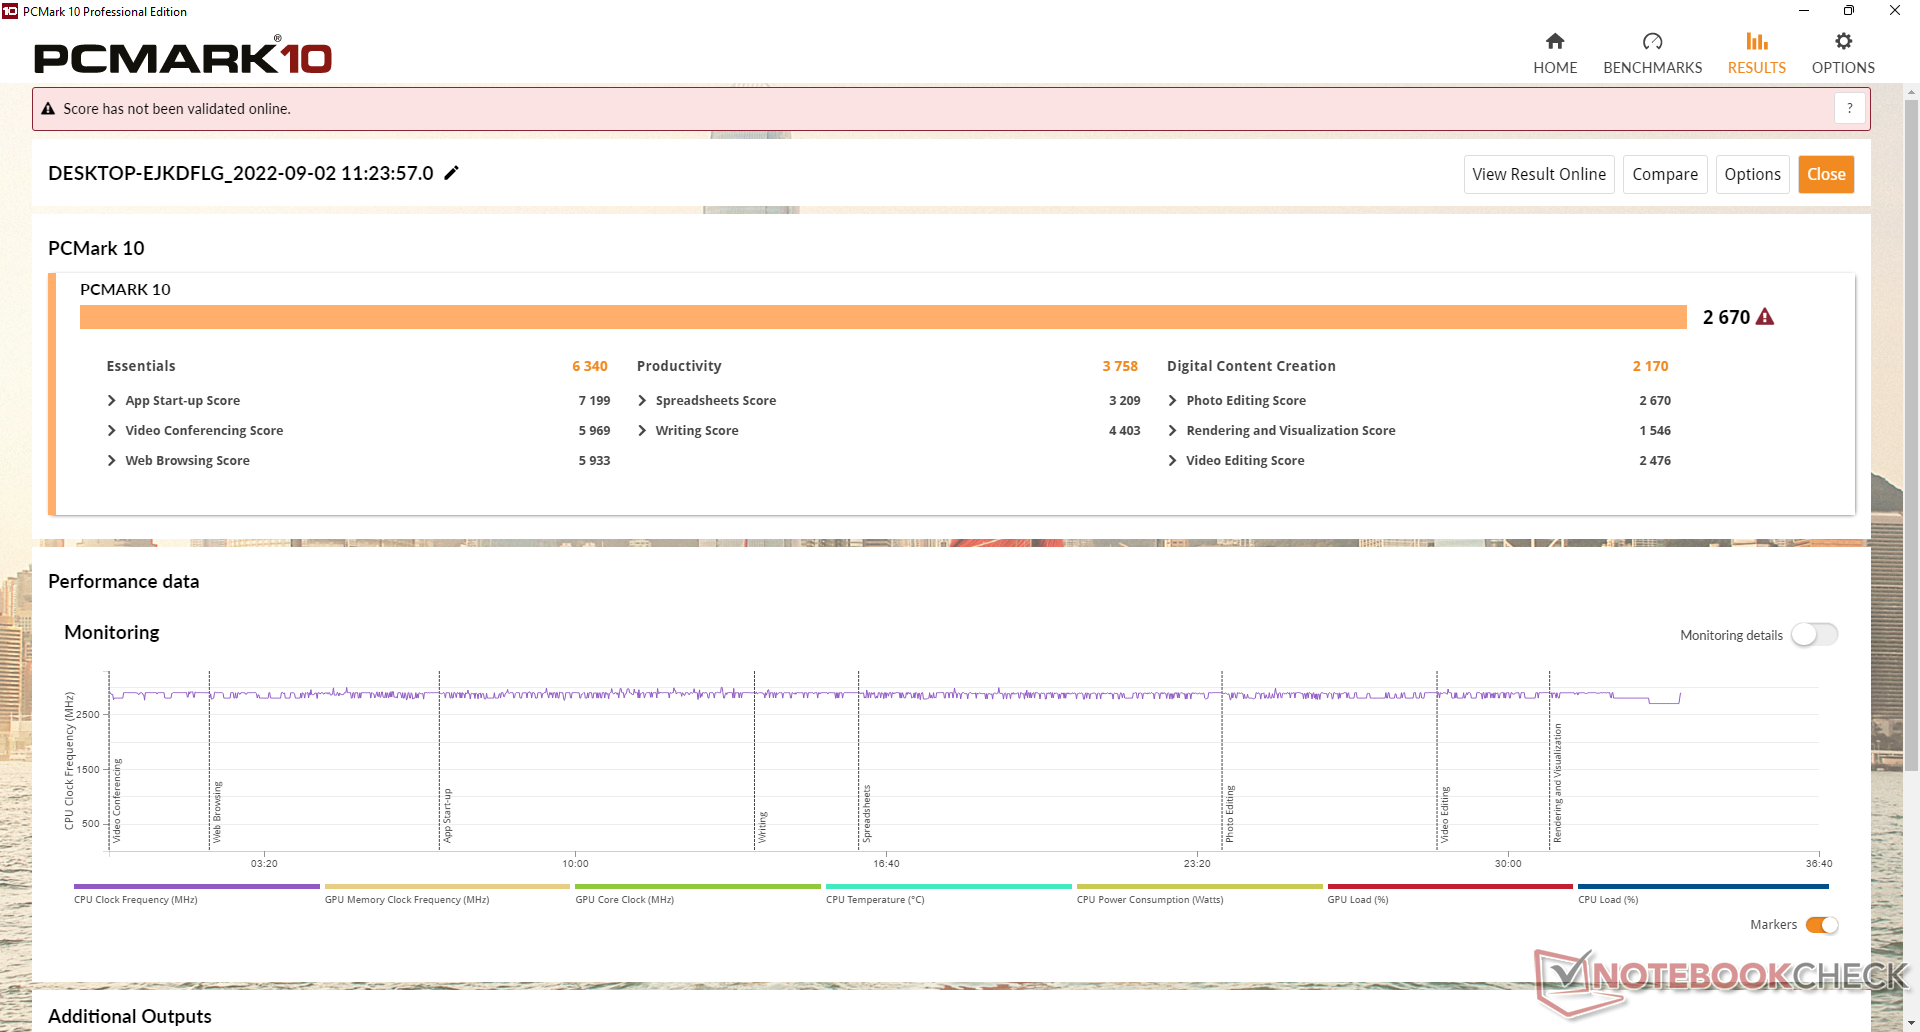
| PCMark 10 Score | 2670 puntos | |
ayuda | ||
| AIDA64 / Memory Copy | |
| Beelink SER4 | |
| Beelink U59 N5105 | |
| Intel NUC11TNKi5 | |
| Beelink U59 Mini-S | |
| Beelink SER3 | |
| Zotac ZBOX PI336 pico | |
| AIDA64 / Memory Read | |
| Beelink SER4 | |
| Intel NUC11TNKi5 | |
| Beelink SER3 | |
| Beelink U59 N5105 | |
| Beelink U59 Mini-S | |
| Zotac ZBOX PI336 pico | |
| AIDA64 / Memory Write | |
| Beelink SER4 | |
| Beelink U59 N5105 | |
| Intel NUC11TNKi5 | |
| Beelink U59 Mini-S | |
| Beelink SER3 | |
| Zotac ZBOX PI336 pico | |
| AIDA64 / Memory Latency | |
| Beelink SER3 | |
| Beelink SER4 | |
| Intel NUC11TNKi5 | |
| Zotac ZBOX PI336 pico | |
| Beelink U59 N5105 | |
| Beelink U59 Mini-S | |
* ... más pequeño es mejor
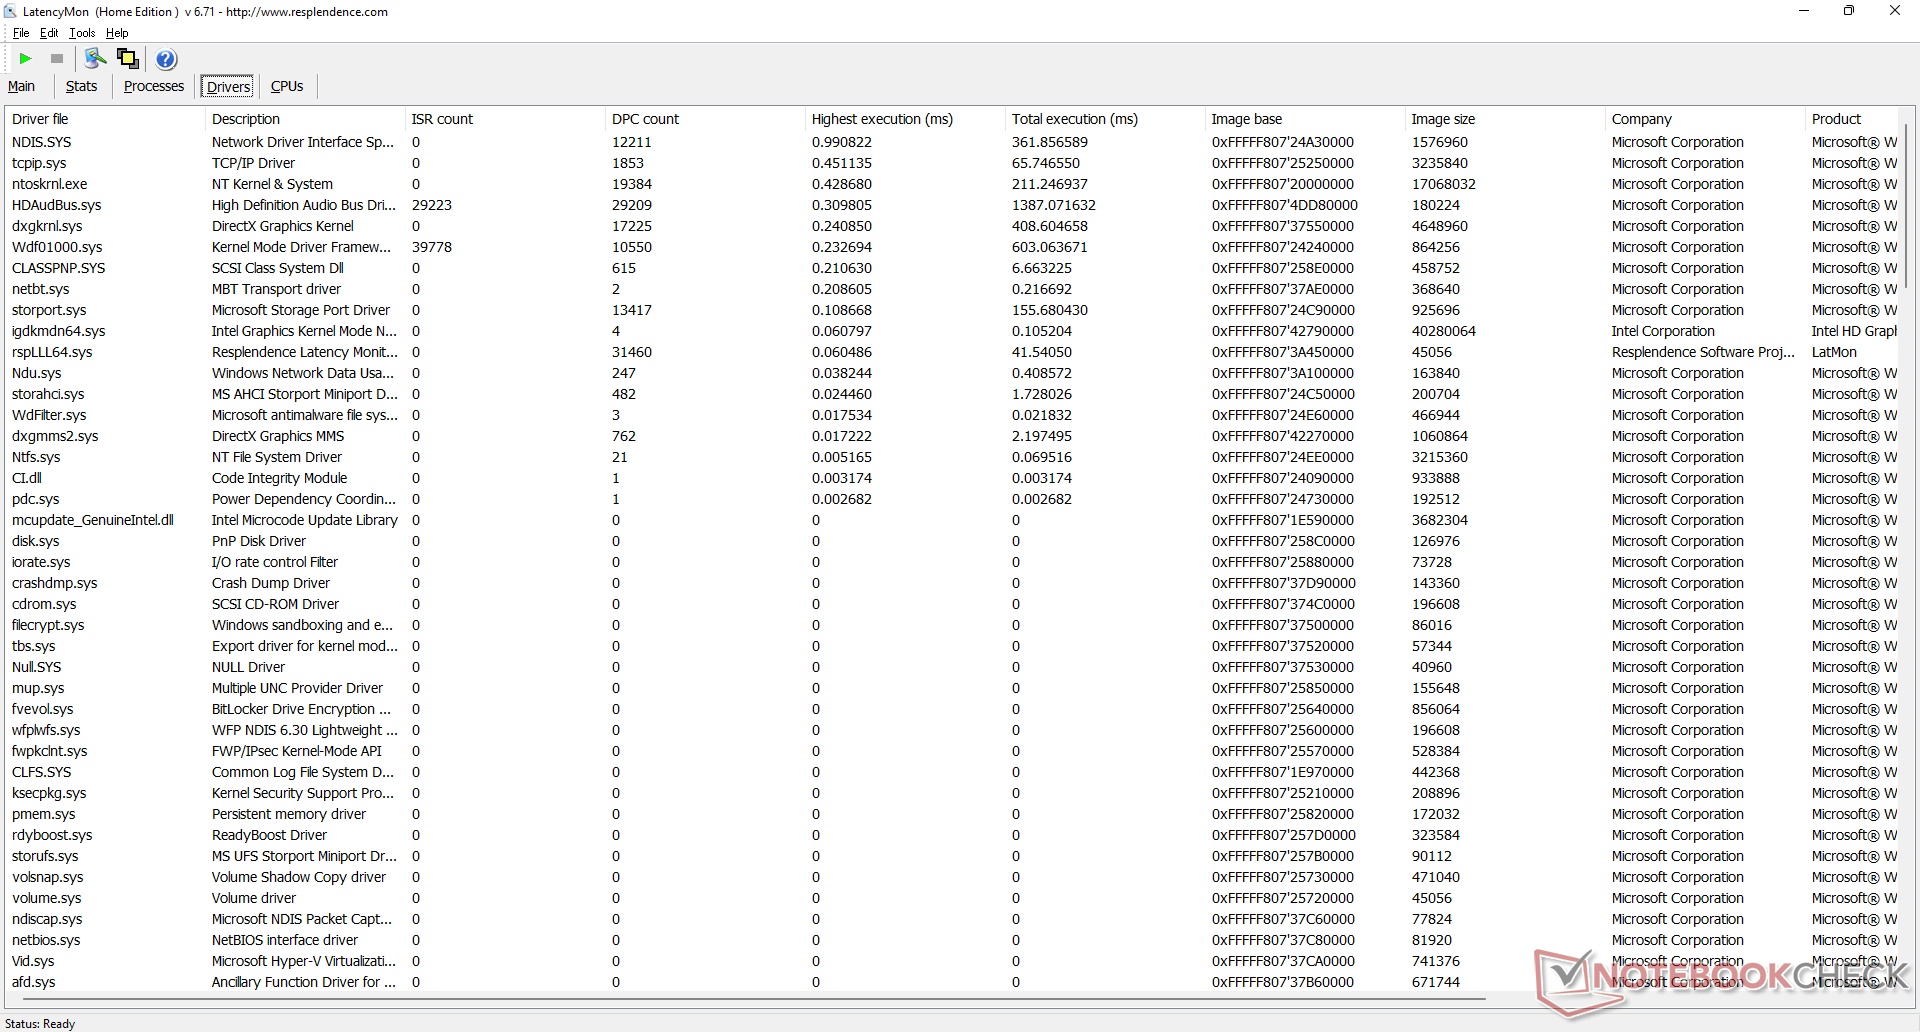
Latencia del CPD
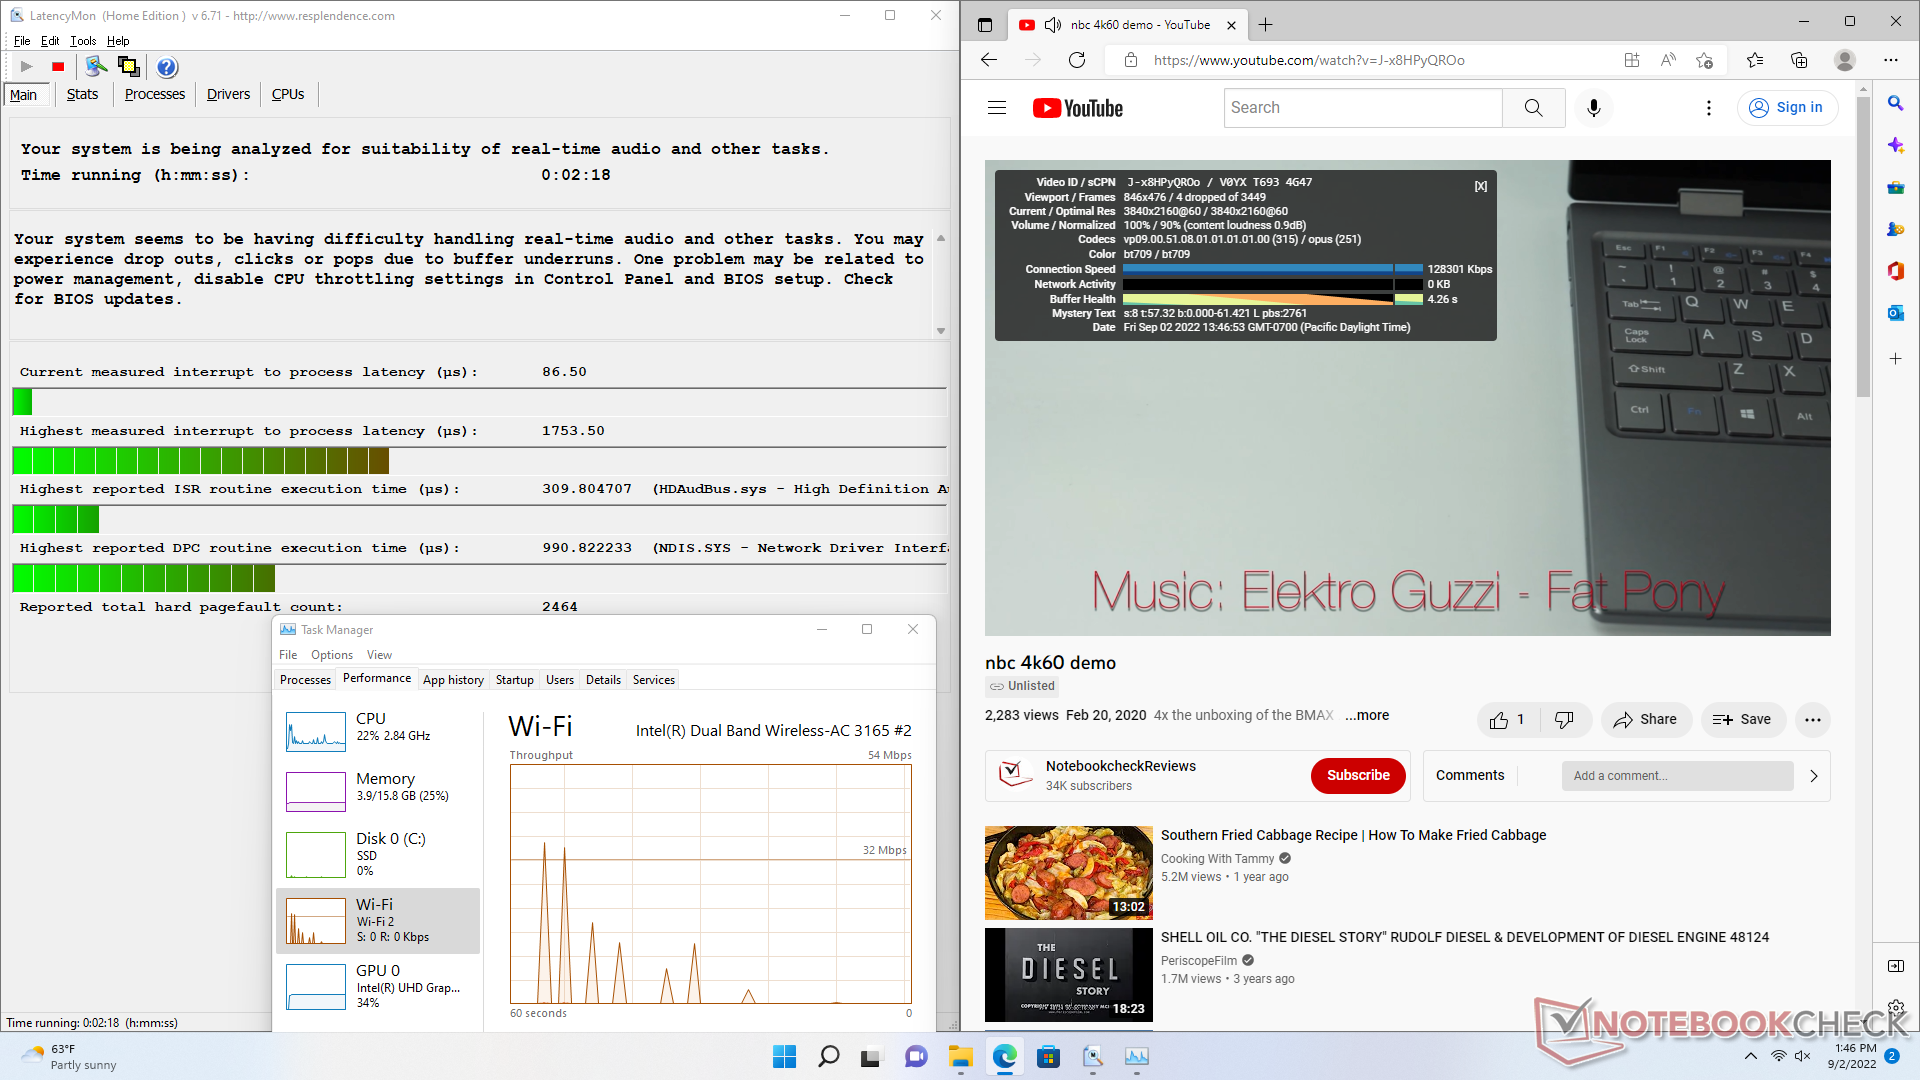
LatencyMon revela problemas de CPD al abrir varias pestañas del navegador de nuestra página web. la reproducción de vídeo 4K a 60 FPS es casi perfecta, con solo 4 fotogramas perdidos durante nuestro vídeo de prueba de un minuto.
| DPC Latencies / LatencyMon - interrupt to process latency (max), Web, Youtube, Prime95 | |
| Beelink U59 N5105 | |
| Beelink U59 Mini-S | |
| Zotac ZBOX PI336 pico | |
| Beelink SER3 | |
| Intel NUC11TNKi5 | |
| Beelink SER4 | |
* ... más pequeño es mejor
Dispositivos de almacenamiento
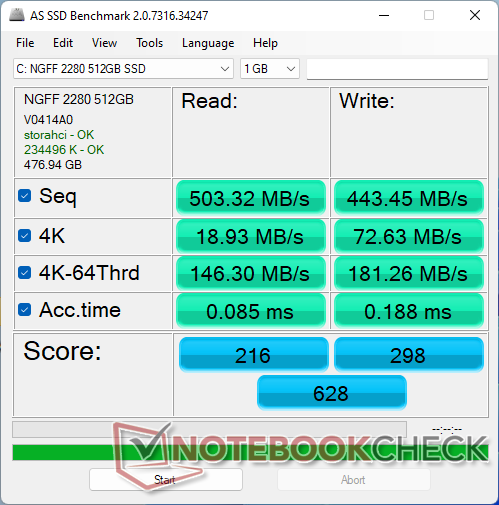
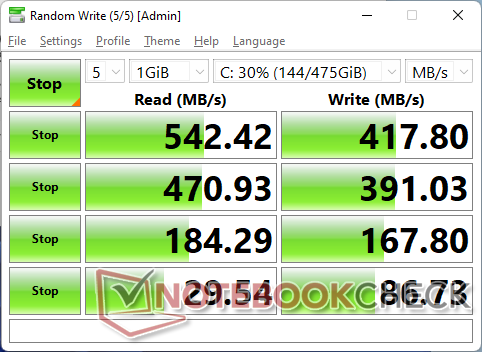
El modelo viene con una unidad M.2 SATA III en lugar de NVMe probablemente para ahorrar costes. Teniendo en cuenta la CPU, sin embargo, una unidad SATA III es aceptable. ElSilicon Motion AZW de nuestra unidad de pruebas arrojaría unas tasas de lectura y escritura secuenciales estupendas por encima de los 400 MB/s cada una
Se incluye una pequeña almohadilla térmica para el SSD, lo cual es sorprendente de ver en un mini PC económico como el U59. La almohadilla se sitúa entre el SSD y la carcasa metálica SATA III de 2,5 pulgadas que está unida al panel inferior superior.

| Drive Performance rating - Percent | |
| Beelink SER3 | |
| Beelink SER4 | |
| Intel NUC11TNKi5 | |
| Beelink U59 N5105 | |
| Beelink U59 Mini-S | |
| Zotac ZBOX PI336 pico | |
* ... más pequeño es mejor
Disk Throttling: DiskSpd Read Loop, Queue Depth 8
Rendimiento de la GPU
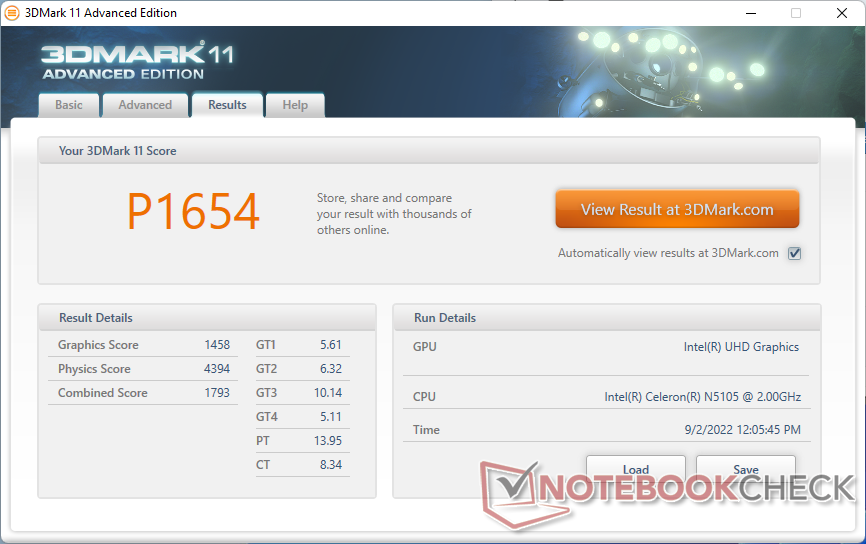
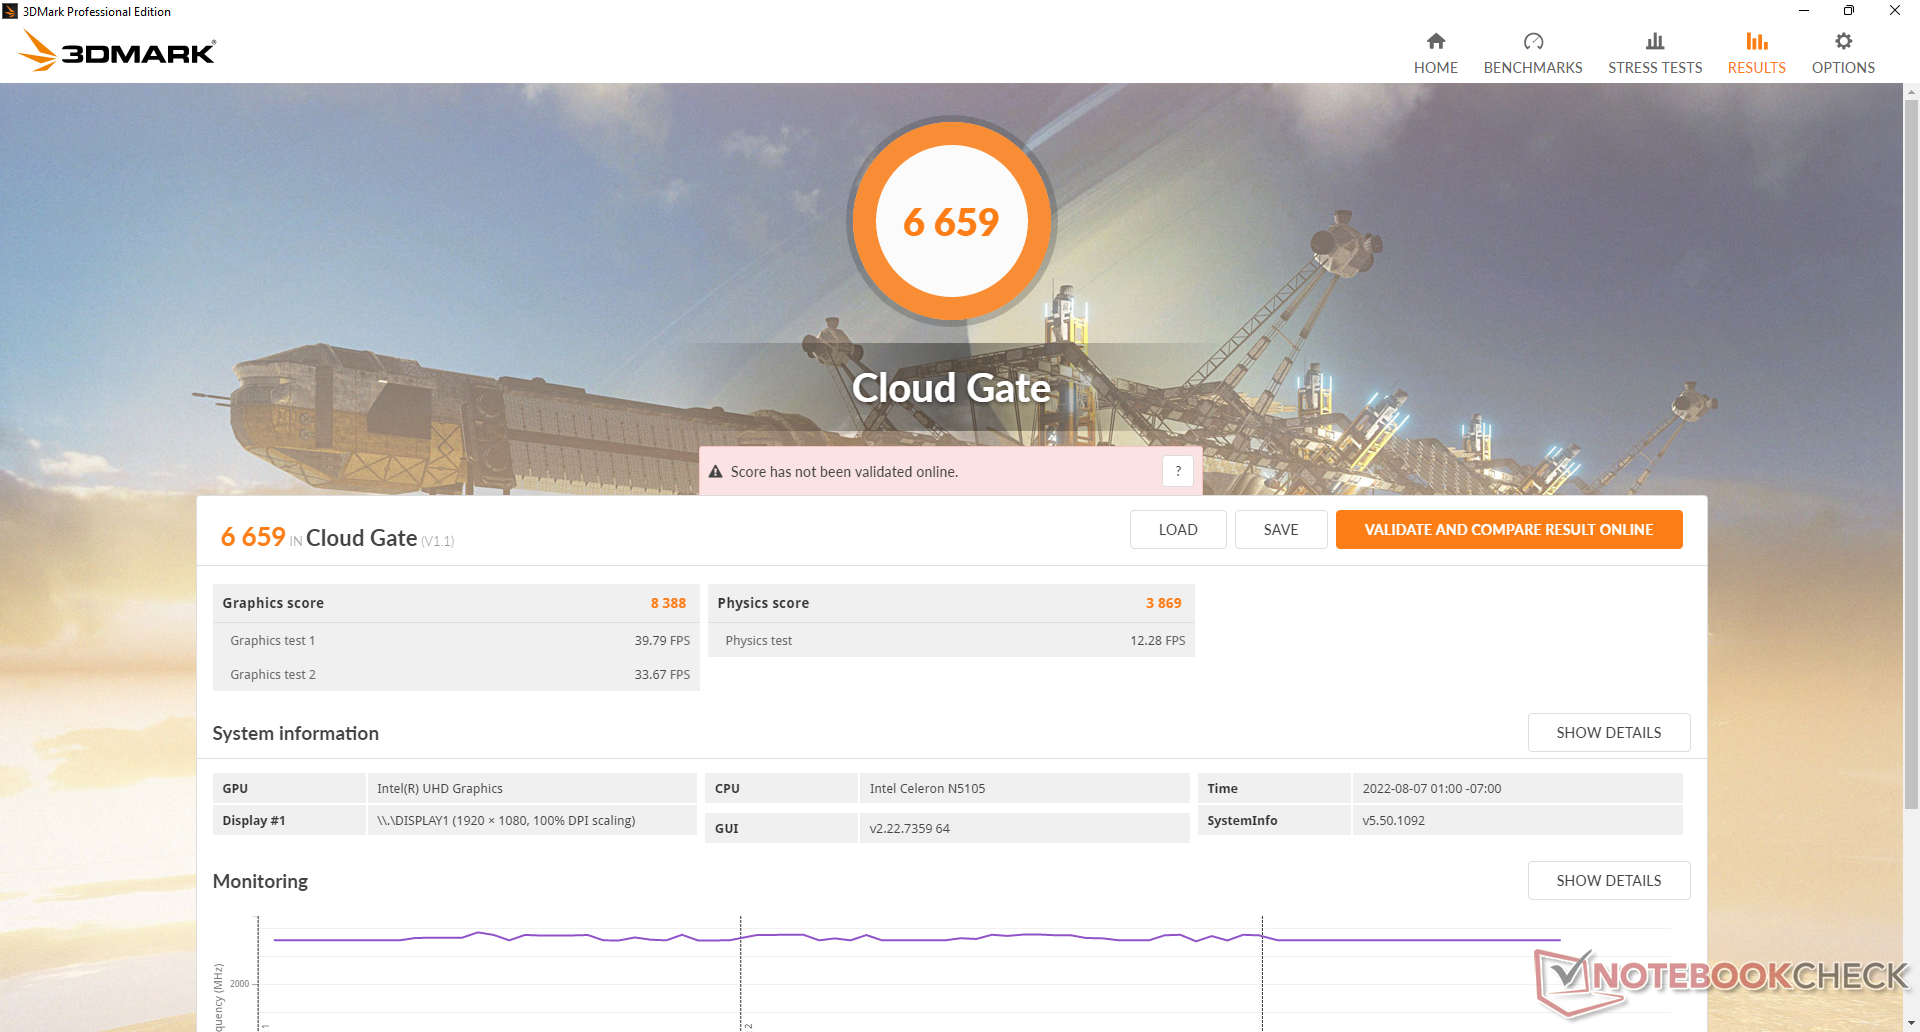
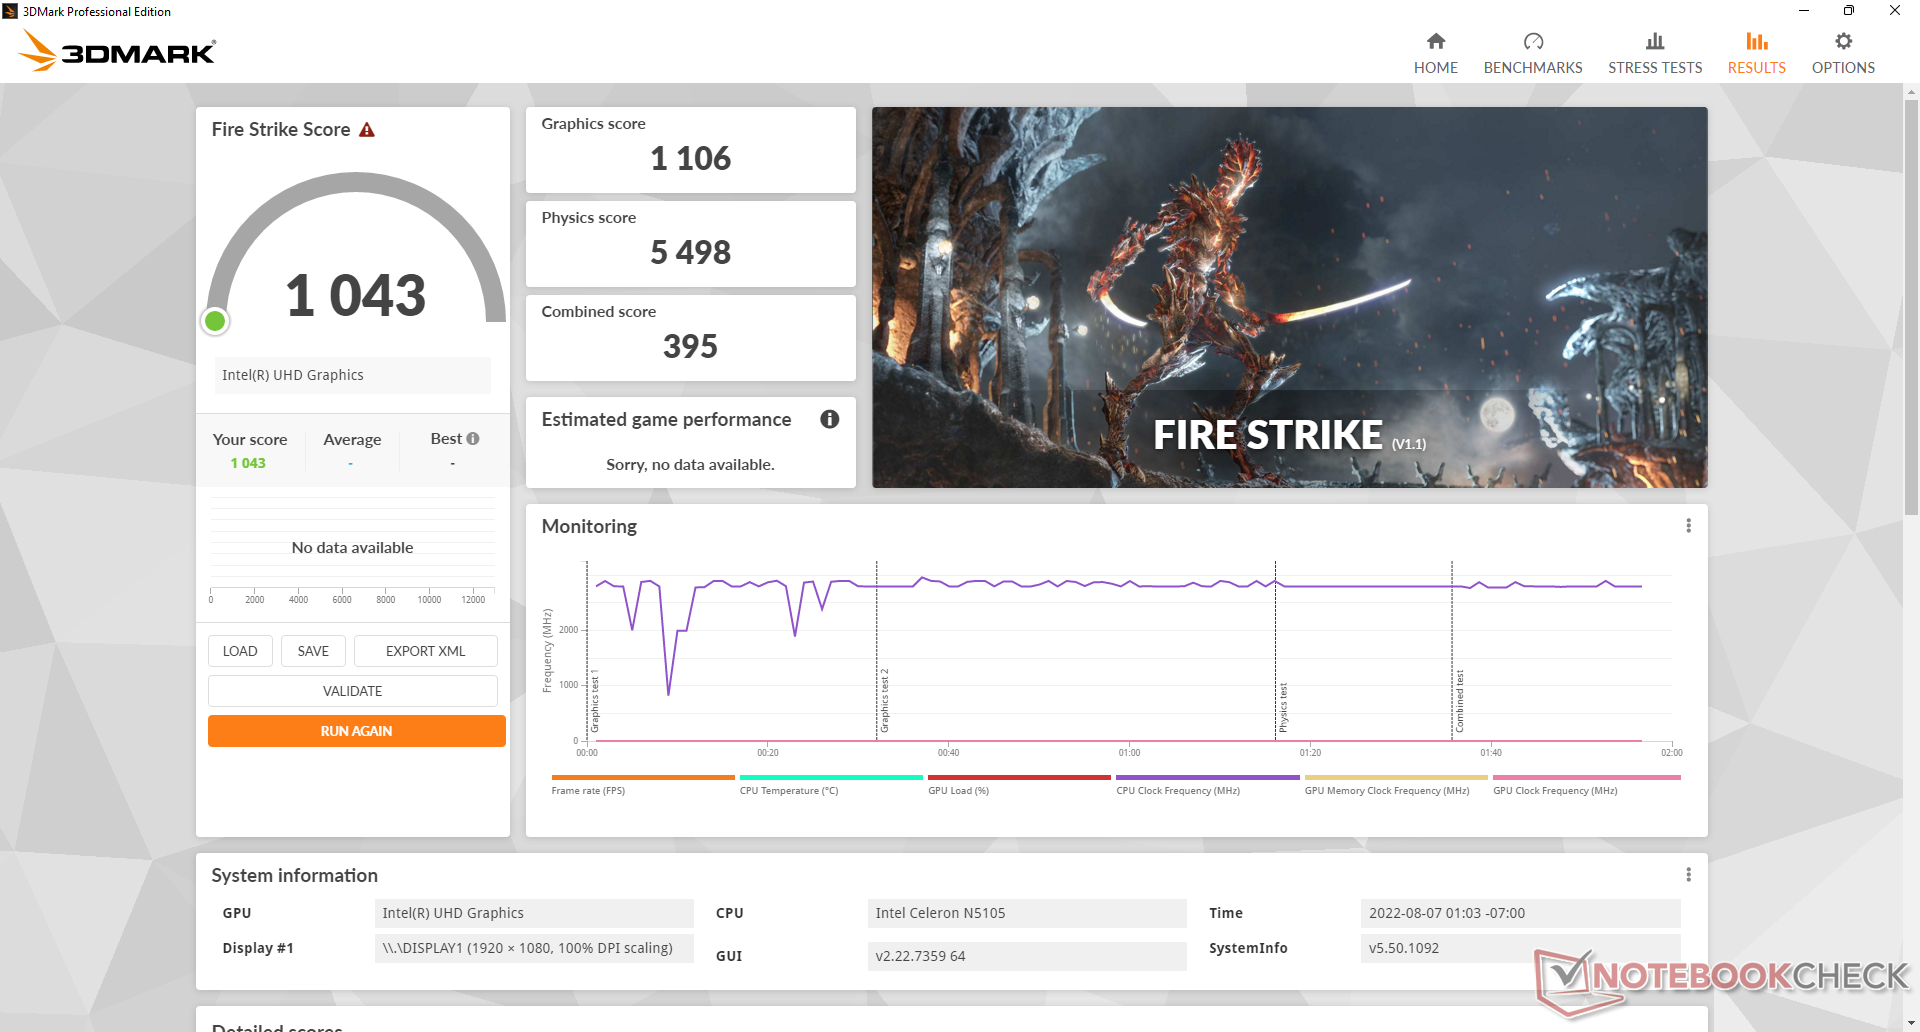
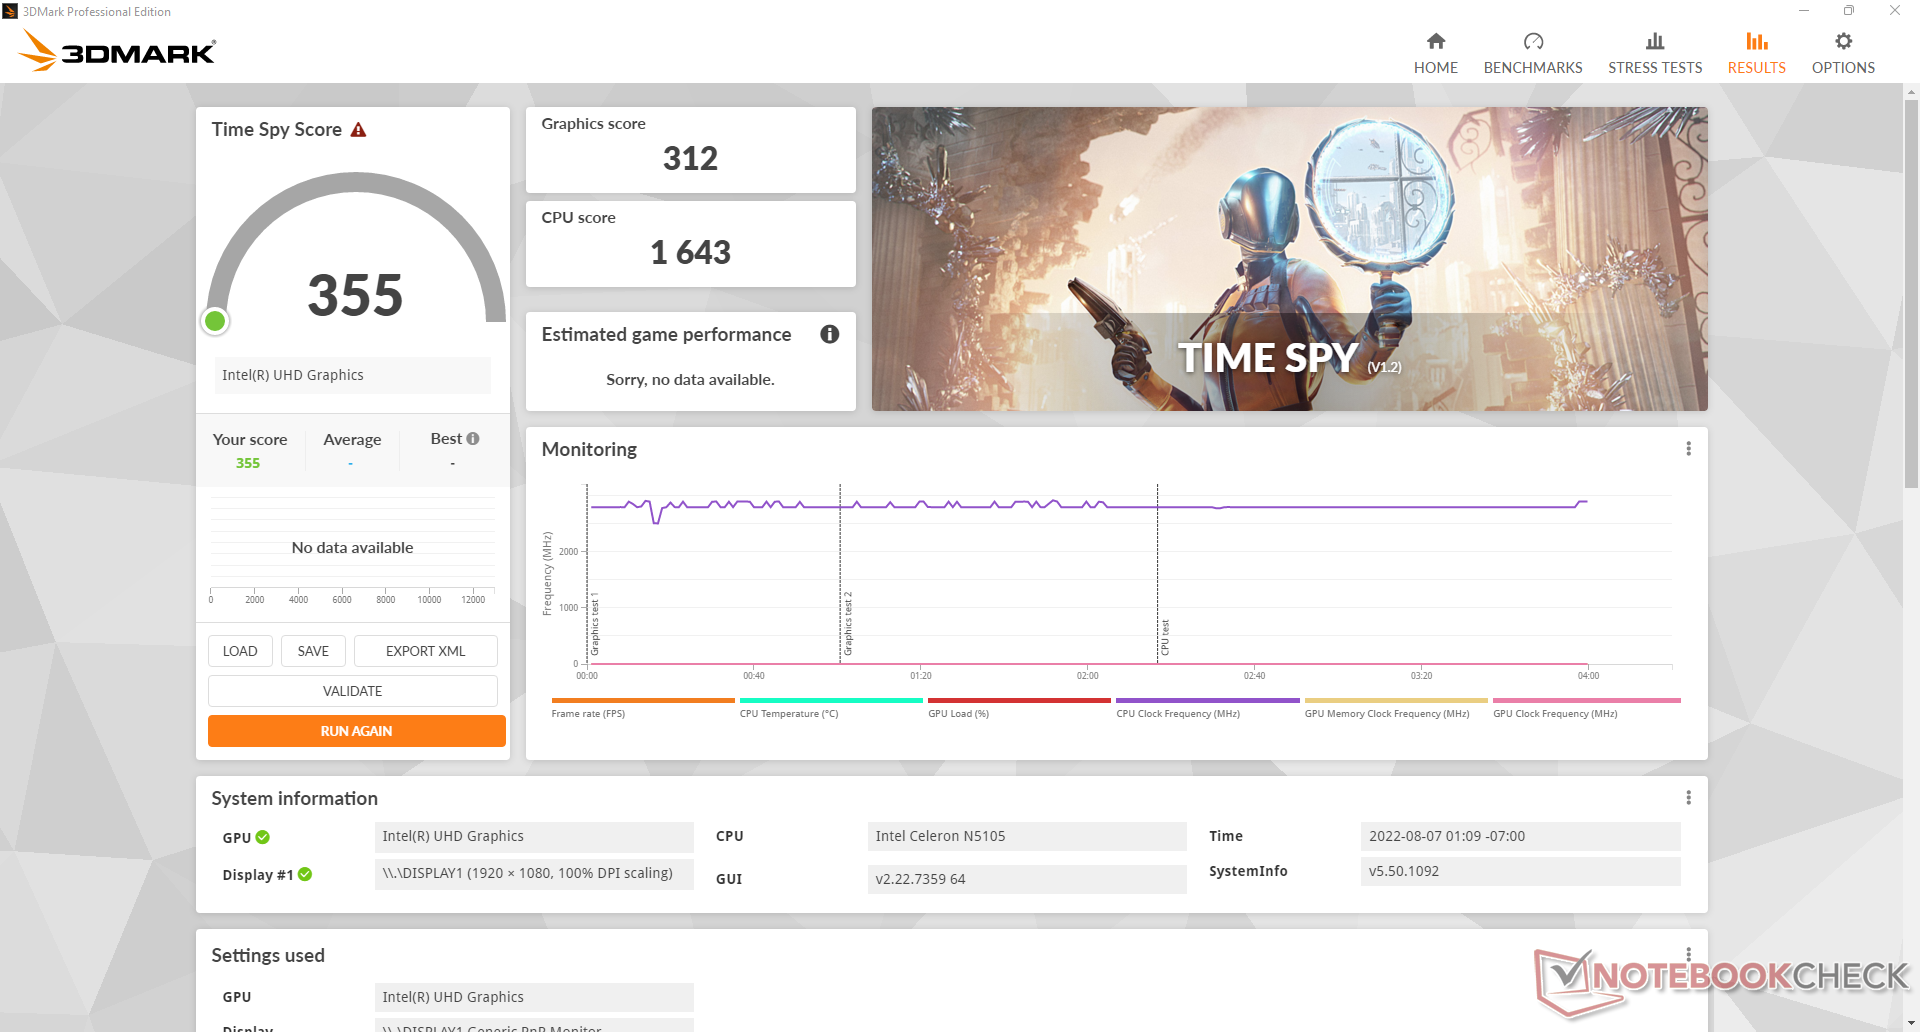
La GPU integrada recibe una actualización del Jasper Lake 16 UEs del Celeron N5095 del año pasado a los Jasper Lake 24 EUs en el U59 N5105 de este año. los resultados de 3DMark son un 80 por ciento más rápidos en la nueva GPU en comparación con el U59 del año pasado, lo que representa un aumento significativo con respecto al año anterior. Sin embargo, es importante tener en cuenta que nuestro U59 N5095 se envió con 8 GB de RAM de un solo canal en comparación con los 16 GB de RAM de doble canal de nuestro U59 N5105. La memoria RAM de doble canal representa por sí sola entre el 30 y el 50 por ciento de la diferencia de rendimiento. No obstante, sigue siendo una de las soluciones de GPU integrada más lentas que existen, por lo que no es apta para la mayoría de los juegos, ya sean nuevos o antiguos.
| 3DMark | |
| 1920x1080 Fire Strike Graphics | |
| Beelink SER4 | |
| Intel NUC11TNKi5 | |
| Lenovo IdeaPad 3 15ITL05 81X80074GE | |
| Beelink SER3 | |
| Beelink SEi8 | |
| Teclast TBOLT F15 Pro | |
| Beelink U59 N5105 | |
| Medio Intel UHD Graphics (Jasper Lake 24 EU) (n=1) | |
| HP 17-by2437ng | |
| Beelink U59 Mini-S | |
| Zotac ZBOX PI336 pico | |
| 2560x1440 Time Spy Graphics | |
| Beelink SER4 | |
| Intel NUC11TNKi5 | |
| Lenovo IdeaPad 3 15ITL05 81X80074GE | |
| Beelink SER3 | |
| Beelink SEi8 | |
| Teclast TBOLT F15 Pro | |
| HP 17-by2437ng | |
| Beelink U59 N5105 | |
| Medio Intel UHD Graphics (Jasper Lake 24 EU) (n=1) | |
| Beelink U59 Mini-S | |
| 2560x1440 Time Spy Score | |
| Beelink SER4 | |
| Intel NUC11TNKi5 | |
| Lenovo IdeaPad 3 15ITL05 81X80074GE | |
| Beelink SER3 | |
| Beelink SEi8 | |
| Teclast TBOLT F15 Pro | |
| HP 17-by2437ng | |
| Beelink U59 N5105 | |
| Medio Intel UHD Graphics (Jasper Lake 24 EU) (n=1) | |
| Beelink U59 Mini-S | |
| 3DMark 11 - 1280x720 Performance GPU | |
| Beelink SER4 | |
| Intel NUC11TNKi5 | |
| Lenovo IdeaPad 3 15ITL05 81X80074GE | |
| Beelink SER3 | |
| Beelink SEi8 | |
| Teclast TBOLT F15 Pro | |
| HP 17-by2437ng | |
| Beelink U59 N5105 | |
| Medio Intel UHD Graphics (Jasper Lake 24 EU) (n=1) | |
| Beelink U59 Mini-S | |
| Zotac ZBOX PI336 pico | |
| 3DMark 11 Performance | 1654 puntos | |
| 3DMark Cloud Gate Standard Score | 6659 puntos | |
| 3DMark Fire Strike Score | 1043 puntos | |
| 3DMark Time Spy Score | 355 puntos | |
ayuda | ||
| The Witcher 3 | |
| 1024x768 Low Graphics & Postprocessing | |
| Beelink SER4 | |
| Intel NUC11TNKi5 | |
| Lenovo IdeaPad 3 15ITL05 81X80074GE | |
| Beelink SER3 | |
| Teclast TBOLT F15 Pro | |
| Beelink U59 N5105 | |
| Medio Intel UHD Graphics (Jasper Lake 24 EU) (n=1) | |
| 1366x768 Medium Graphics & Postprocessing | |
| Beelink SER4 | |
| Lenovo IdeaPad 3 15ITL05 81X80074GE | |
| Beelink SER3 | |
| Teclast TBOLT F15 Pro | |
| Beelink U59 N5105 | |
| Medio Intel UHD Graphics (Jasper Lake 24 EU) (n=1) | |
| 1920x1080 High Graphics & Postprocessing (Nvidia HairWorks Off) | |
| Beelink SER4 | |
| Lenovo IdeaPad 3 15ITL05 81X80074GE | |
| Beelink SER3 | |
| Teclast TBOLT F15 Pro | |
| Beelink U59 N5105 | |
| Medio Intel UHD Graphics (Jasper Lake 24 EU) (n=1) | |
| 1920x1080 Ultra Graphics & Postprocessing (HBAO+) | |
| Beelink SER4 | |
| Lenovo IdeaPad 3 15ITL05 81X80074GE | |
| Beelink SER3 | |
| Beelink U59 N5105 | |
| Medio Intel UHD Graphics (Jasper Lake 24 EU) (n=1) | |
| X-Plane 11.11 | |
| 1280x720 low (fps_test=1) | |
| Beelink SER4 | |
| Lenovo IdeaPad 3 15ITL05 81X80074GE | |
| Intel NUC11TNKi5 | |
| Teclast TBOLT F15 Pro | |
| Beelink SER3 | |
| Beelink SEi8 | |
| Beelink U59 N5105 | |
| Medio Intel UHD Graphics (Jasper Lake 24 EU) (n=1) | |
| Beelink U59 Mini-S | |
| Zotac ZBOX PI336 pico | |
| 1920x1080 med (fps_test=2) | |
| Beelink SER4 | |
| Intel NUC11TNKi5 | |
| Lenovo IdeaPad 3 15ITL05 81X80074GE | |
| Beelink SER3 | |
| Beelink SEi8 | |
| Teclast TBOLT F15 Pro | |
| Beelink U59 N5105 | |
| Medio Intel UHD Graphics (Jasper Lake 24 EU) (n=1) | |
| Beelink U59 Mini-S | |
| Zotac ZBOX PI336 pico | |
| 1920x1080 high (fps_test=3) | |
| Beelink SER4 | |
| Intel NUC11TNKi5 | |
| Lenovo IdeaPad 3 15ITL05 81X80074GE | |
| Beelink SER3 | |
| Teclast TBOLT F15 Pro | |
| Beelink SEi8 | |
| Beelink U59 N5105 | |
| Medio Intel UHD Graphics (Jasper Lake 24 EU) (n=1) | |
| Beelink U59 Mini-S | |
| Zotac ZBOX PI336 pico | |
| Final Fantasy XV Benchmark - 1280x720 Lite Quality | |
| Beelink SER4 | |
| Intel NUC11TNKi5 | |
| Lenovo IdeaPad 3 15ITL05 81X80074GE | |
| Beelink SER3 | |
| Beelink SEi8 | |
| Teclast TBOLT F15 Pro | |
| Beelink U59 N5105 | |
| Medio Intel UHD Graphics (Jasper Lake 24 EU) (n=1) | |
| Beelink U59 Mini-S | |
| Zotac ZBOX PI336 pico | |
| Dota 2 Reborn | |
| 1280x720 min (0/3) fastest | |
| Beelink SER4 | |
| Beelink SEi8 | |
| Lenovo IdeaPad 3 15ITL05 81X80074GE | |
| Teclast TBOLT F15 Pro | |
| Intel NUC11TNKi5 | |
| Beelink U59 N5105 | |
| Medio Intel UHD Graphics (Jasper Lake 24 EU) (n=1) | |
| Beelink SER3 | |
| Beelink U59 Mini-S | |
| Zotac ZBOX PI336 pico | |
| 1366x768 med (1/3) | |
| Beelink SER4 | |
| Intel NUC11TNKi5 | |
| Beelink SER3 | |
| Lenovo IdeaPad 3 15ITL05 81X80074GE | |
| Beelink SEi8 | |
| Teclast TBOLT F15 Pro | |
| Beelink U59 N5105 | |
| Medio Intel UHD Graphics (Jasper Lake 24 EU) (n=1) | |
| Beelink U59 Mini-S | |
| Zotac ZBOX PI336 pico | |
| 1920x1080 high (2/3) | |
| Beelink SER4 | |
| Intel NUC11TNKi5 | |
| Beelink SER3 | |
| Lenovo IdeaPad 3 15ITL05 81X80074GE | |
| Beelink SEi8 | |
| Teclast TBOLT F15 Pro | |
| Beelink U59 N5105 | |
| Medio Intel UHD Graphics (Jasper Lake 24 EU) (n=1) | |
| Beelink U59 Mini-S | |
| Zotac ZBOX PI336 pico | |
| 1920x1080 ultra (3/3) best looking | |
| Beelink SER4 | |
| Intel NUC11TNKi5 | |
| Beelink SER3 | |
| Lenovo IdeaPad 3 15ITL05 81X80074GE | |
| Beelink SEi8 | |
| Teclast TBOLT F15 Pro | |
| Beelink U59 N5105 | |
| Medio Intel UHD Graphics (Jasper Lake 24 EU) (n=1) | |
| Beelink U59 Mini-S | |
| Zotac ZBOX PI336 pico | |
| bajo | medio | alto | ultra | |
|---|---|---|---|---|
| The Witcher 3 (2015) | 21.6 | 14.4 | 7.8 | 3.9 |
| Dota 2 Reborn (2015) | 73.8 | 24.1 | 16.8 | 15.5 |
| Final Fantasy XV Benchmark (2018) | 13.7 | |||
| X-Plane 11.11 (2018) | 20.8 | 13.3 | 12.3 |
Emisiones
Ruido del sistema
El ruido del ventilador es silencioso sin importar la carga incluso cuando se pone en modo Rendimiento. Sólo hemos podido registrar un máximo de algo menos de 27 dB(A) contra un fondo silencioso de 21,5 dB(A) en comparación con los 34 dB(A) del U59 del año pasado. Se trata de uno de los mini PC más silenciosos sin optar por modelos sin ventilador como el Zotac ZBOX PI336.
Nuestra unidad de prueba mostraba un ruido electrónico menor o un silbido de la bobina que ayuda a explicar nuestro ruido en ralentí de 22,1 dB(A).
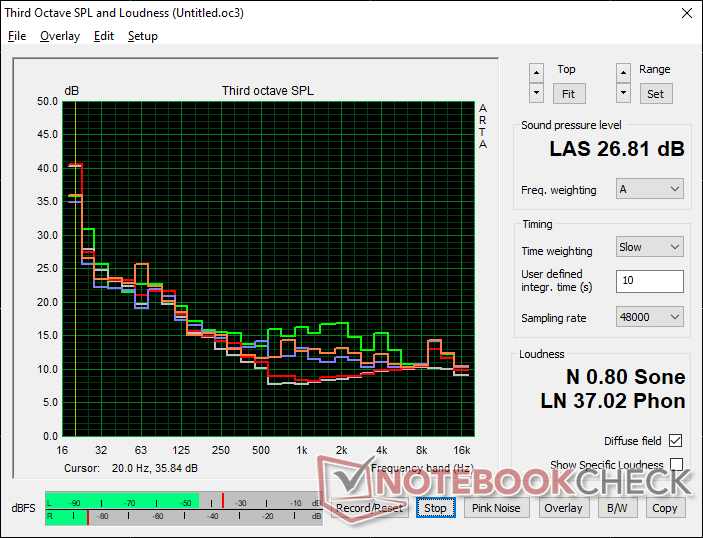
Ruido
| Ocioso |
| 22.1 / 22.1 / 22.1 dB(A) |
| Carga |
| 23.9 / 26.8 dB(A) |
 | ||
30 dB silencioso 40 dB(A) audible 50 dB(A) ruidosamente alto |
||
min: | ||
| Beelink U59 N5105 UHD Graphics (Jasper Lake 24 EU), Celeron N5105, Silicon Motion AZW 512G NV428 | Beelink U59 Mini-S UHD Graphics (Jasper Lake 16 EU), Celeron N5095, Silicon Motion AZW 256G M.228 220426 C SATA 3 | Beelink SER4 Vega 8, R7 4800U, Intel SSD 660p SSDPEKNW512G8 | Beelink SER3 Vega 10, R7 3750H, GSemi AZW GSDFN512TS3F1OGCX | Intel NUC11TNKi5 Iris Xe G7 80EUs, i5-1135G7, Transcend M.2 SSD 430S TS512GMTS430S | Zotac ZBOX PI336 pico UHD Graphics (Elkhart Lake 16 EU), Celeron N6211, SanDisk DF4128 | |
|---|---|---|---|---|---|---|
| Noise | -12% | -48% | -31% | -55% | ||
| apagado / medio ambiente * (dB) | 21.5 | 23.3 -8% | 23.4 -9% | 23.4 -9% | 24.8 -15% | |
| Idle Minimum * (dB) | 22.1 | 24.2 -10% | 33.2 -50% | 23.4 -6% | 35.6 -61% | |
| Idle Average * (dB) | 22.1 | 24.2 -10% | 33.2 -50% | 23.4 -6% | 35.6 -61% | |
| Idle Maximum * (dB) | 22.1 | 24.2 -10% | 33.2 -50% | 29.4 -33% | 35.6 -61% | |
| Load Average * (dB) | 23.9 | 25.1 -5% | 38.6 -62% | 35.2 -47% | 36.2 -51% | |
| Witcher 3 ultra * (dB) | 24.4 | 39.2 -61% | 37.2 -52% | 38 -56% | ||
| Load Maximum * (dB) | 26.8 | 33.9 -26% | 40.8 -52% | 43.3 -62% | 47.6 -78% |
* ... más pequeño es mejor
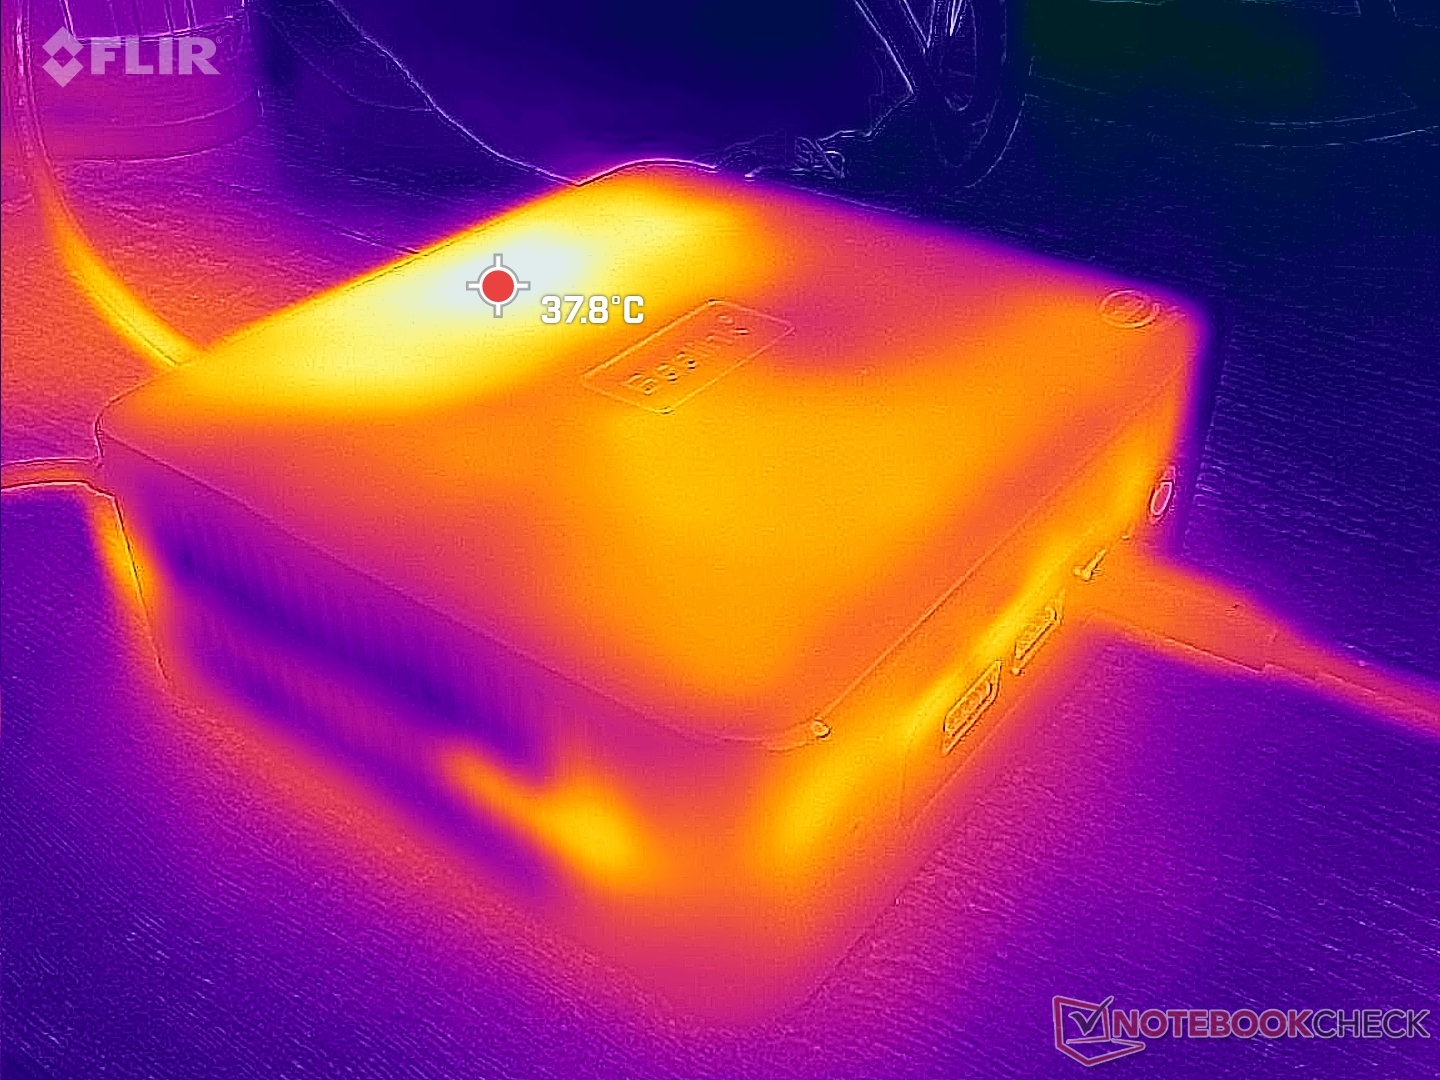
Temperatura
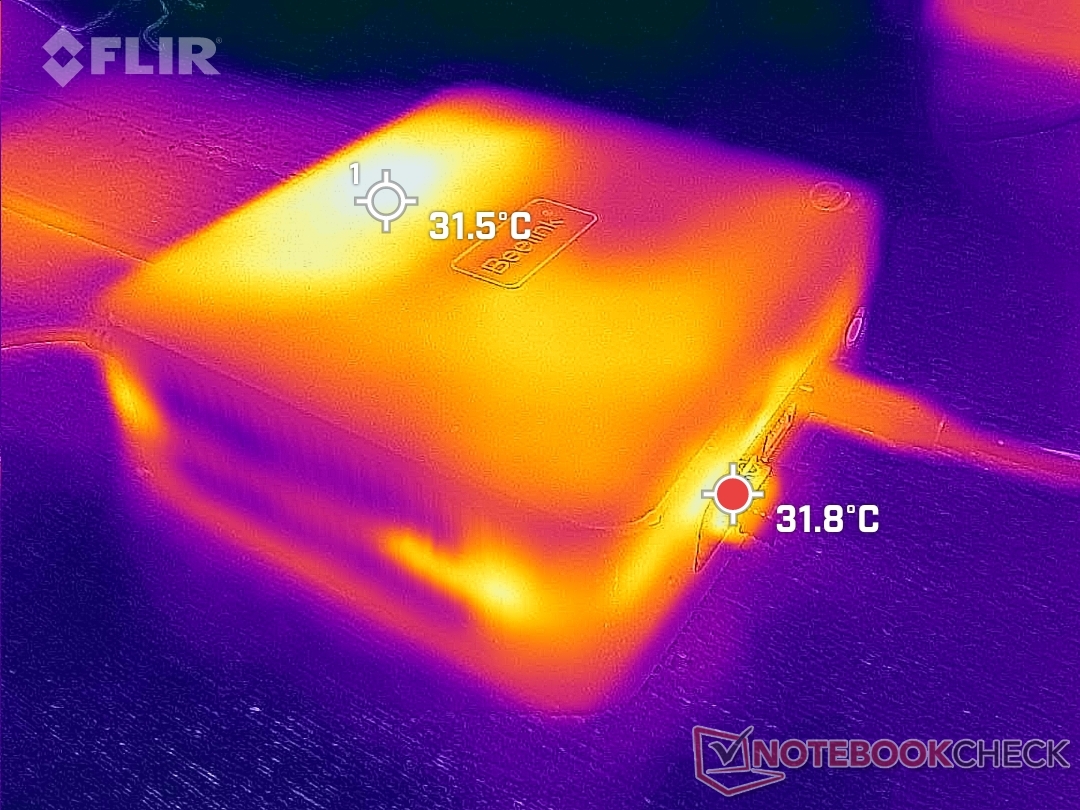
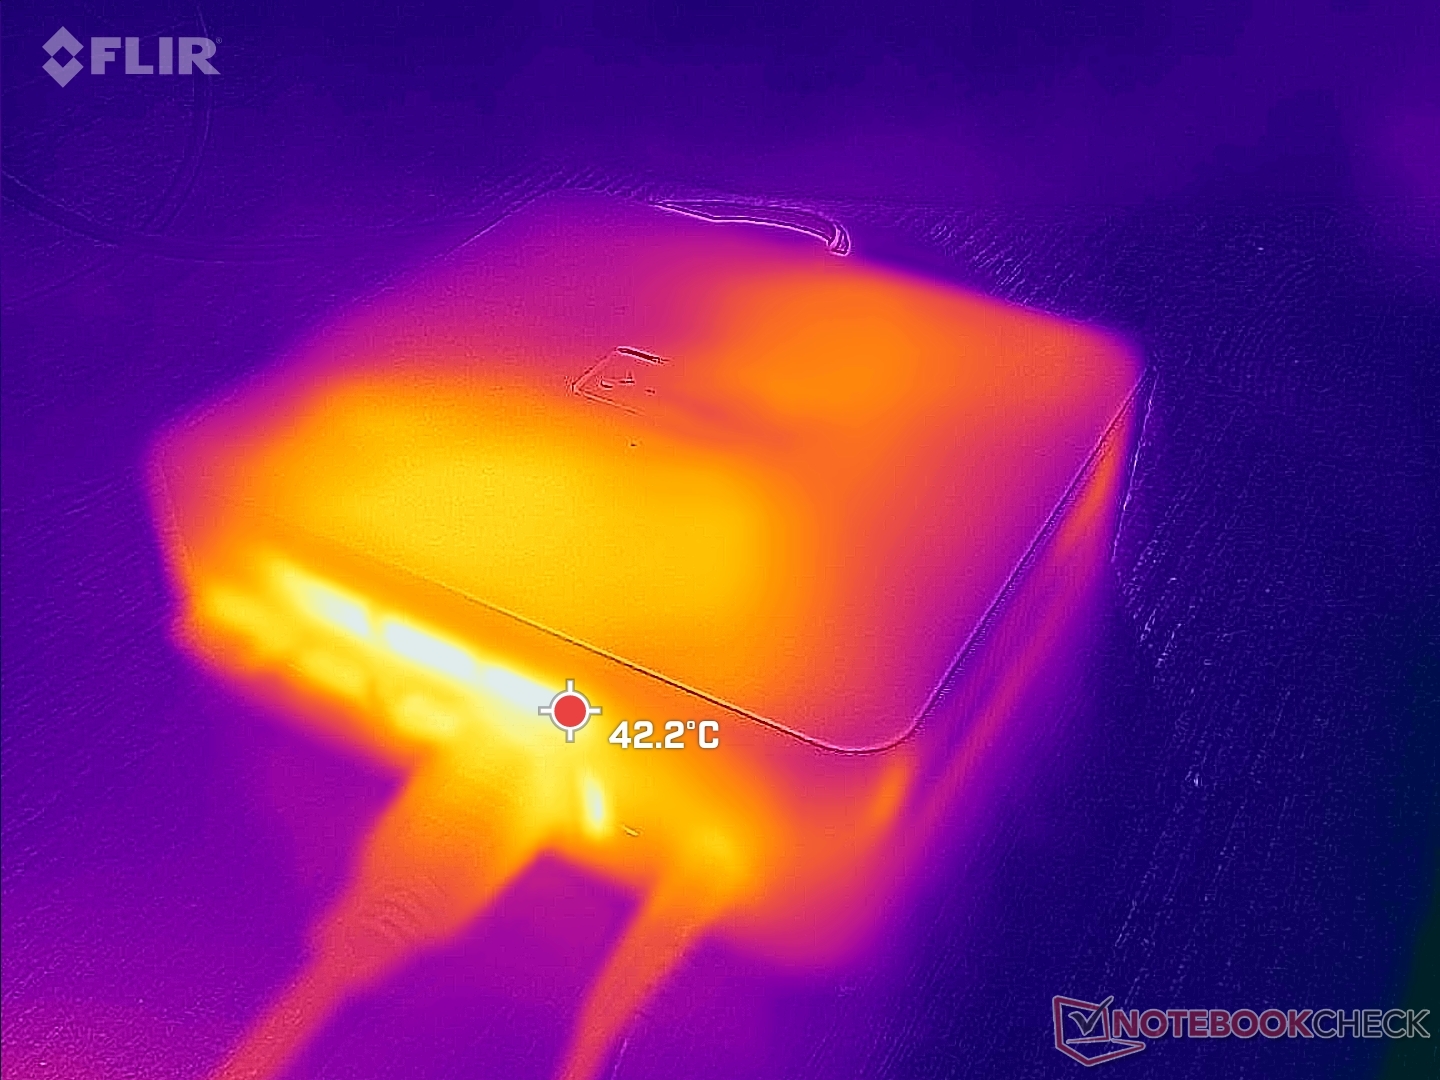
Las temperaturas de la superficie son cálidas incluso cuando está en reposo en el escritorio ya que el ventilador es muy letárgico. La parte superior de la unidad puede alcanzar 32 C cuando no se ejecuta ninguna aplicación o hasta 38 C cuando se ejecutan aplicaciones estresantes durante largos períodos. Los puntos calientes están en la parte trasera del chasis, cerca de las rejillas de ventilación traseras.
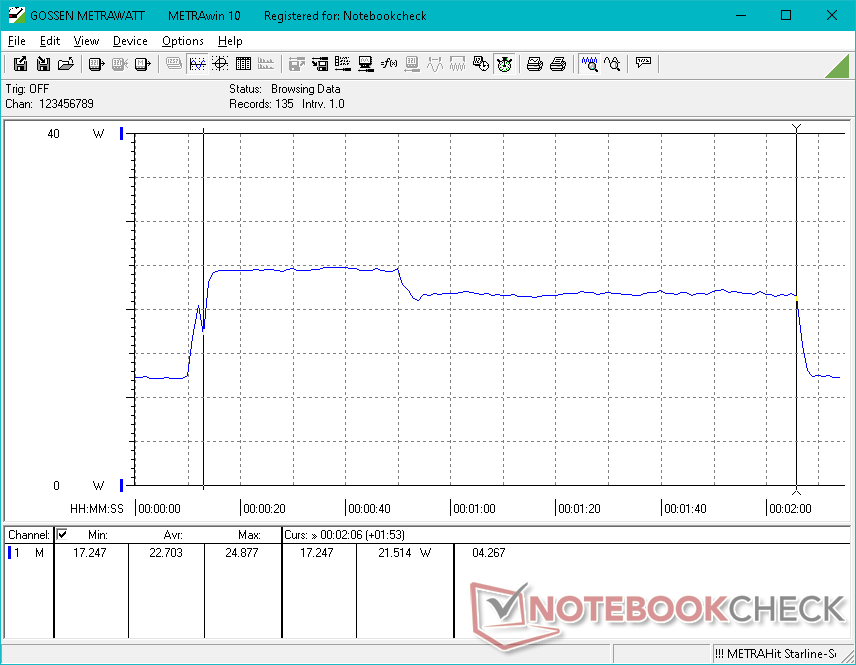
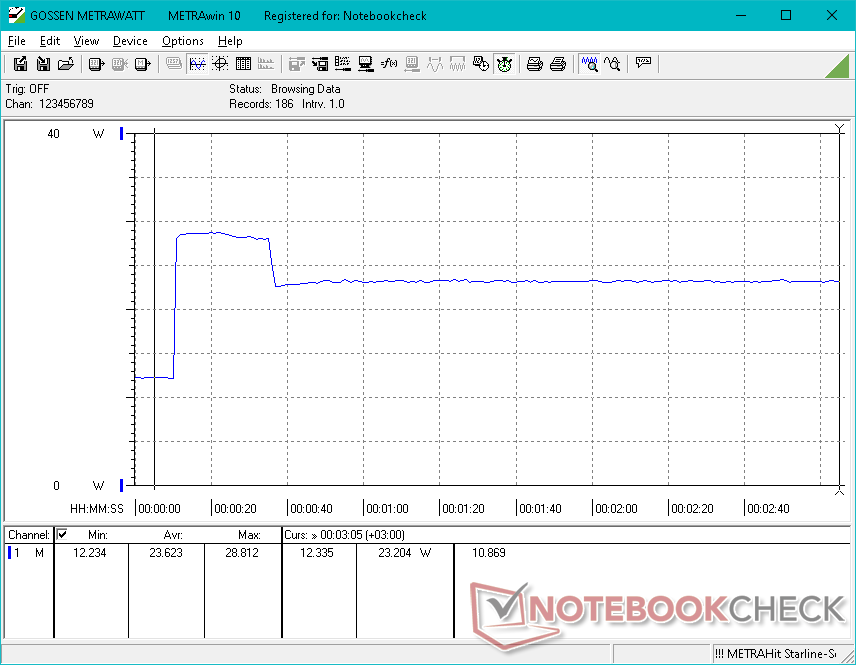
Prueba de esfuerzo
Las velocidades de reloj de la CPU, la temperatura y el consumo de energía de la placa se disparan a 2,8 GHz, 86 C y 20 W, respectivamente, cuando se inicia el estrés de Prime95. Sin embargo, después de unos 20 segundos, la velocidad de reloj y el consumo de energía de la placa bajaban a 2,4 GHz y 15 W, respectivamente, para mantener una temperatura del núcleo más fría de 76 C, como se muestra en la captura de pantalla siguiente. Esto es en realidad más lento y más frío en 200 MHz y 9 C, respectivamente, que lo que registramos en el U59 del año pasado con el antiguo N5095.
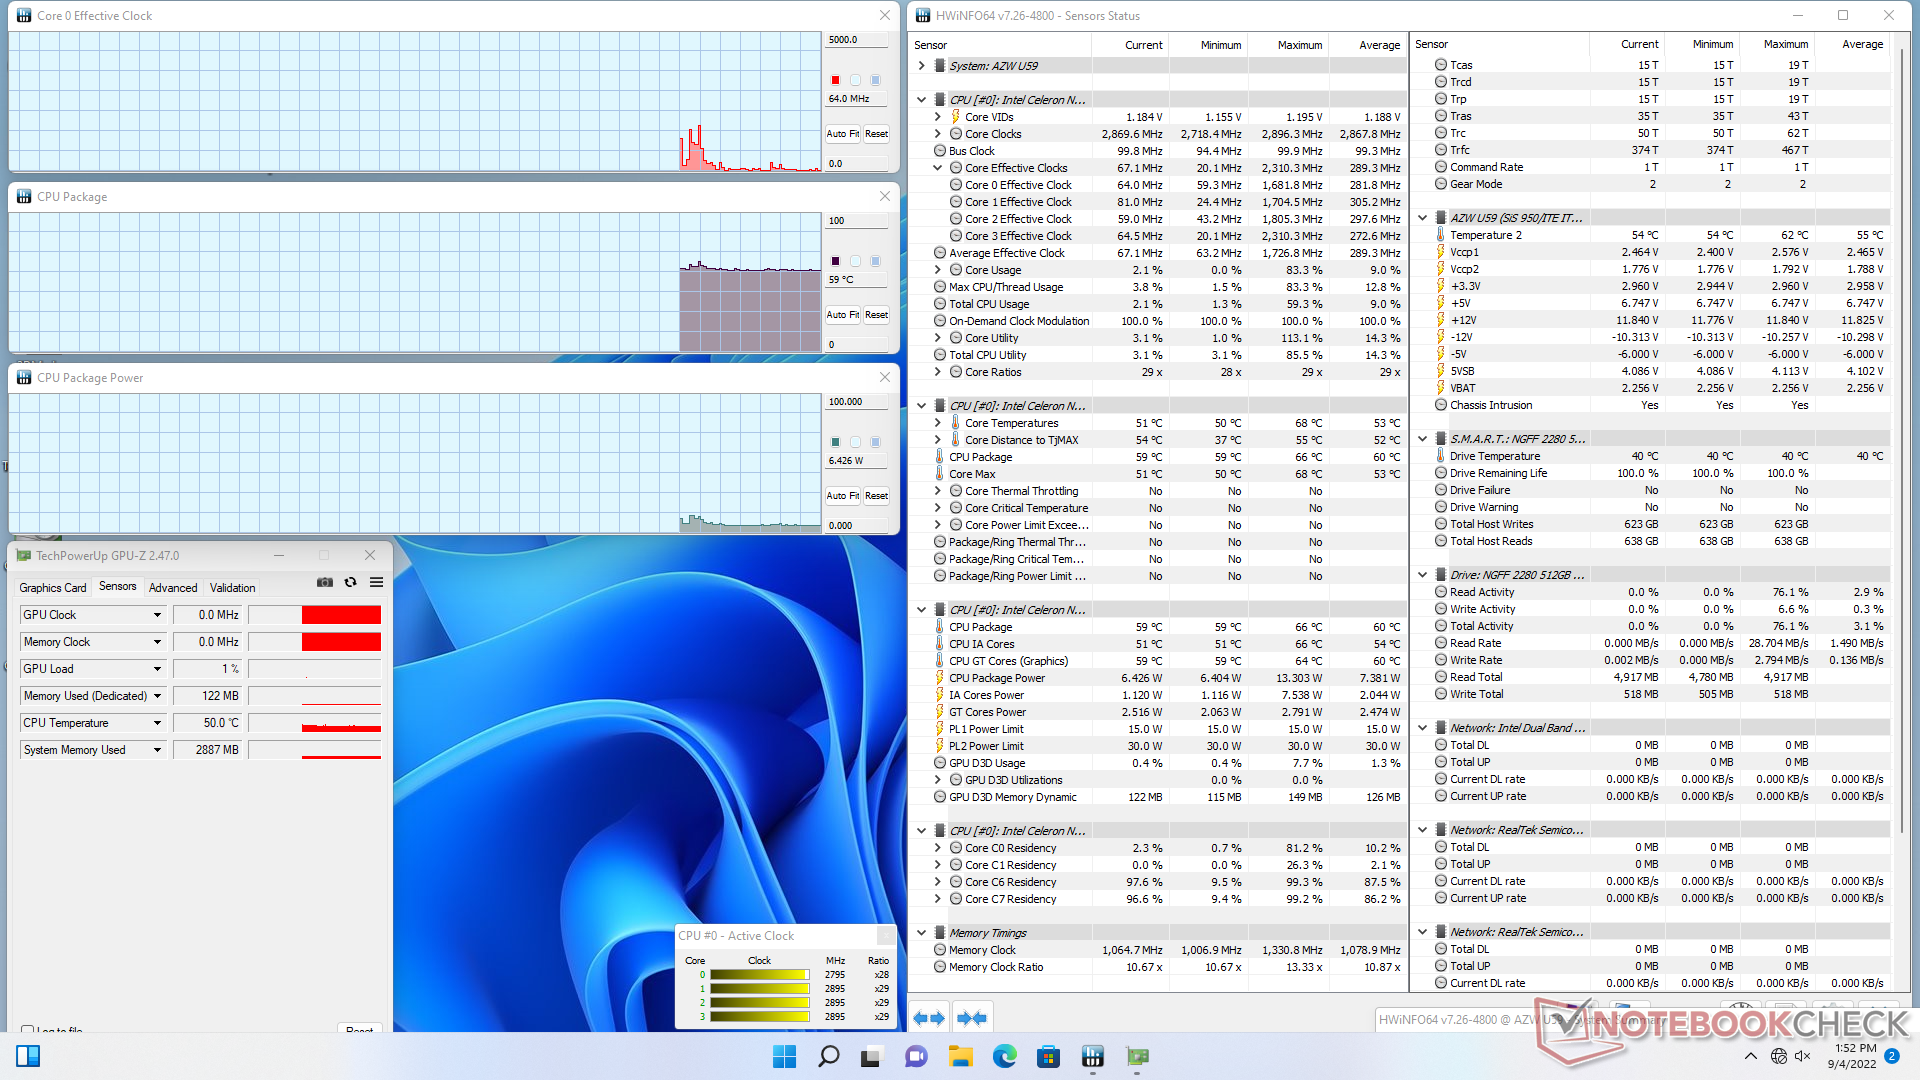
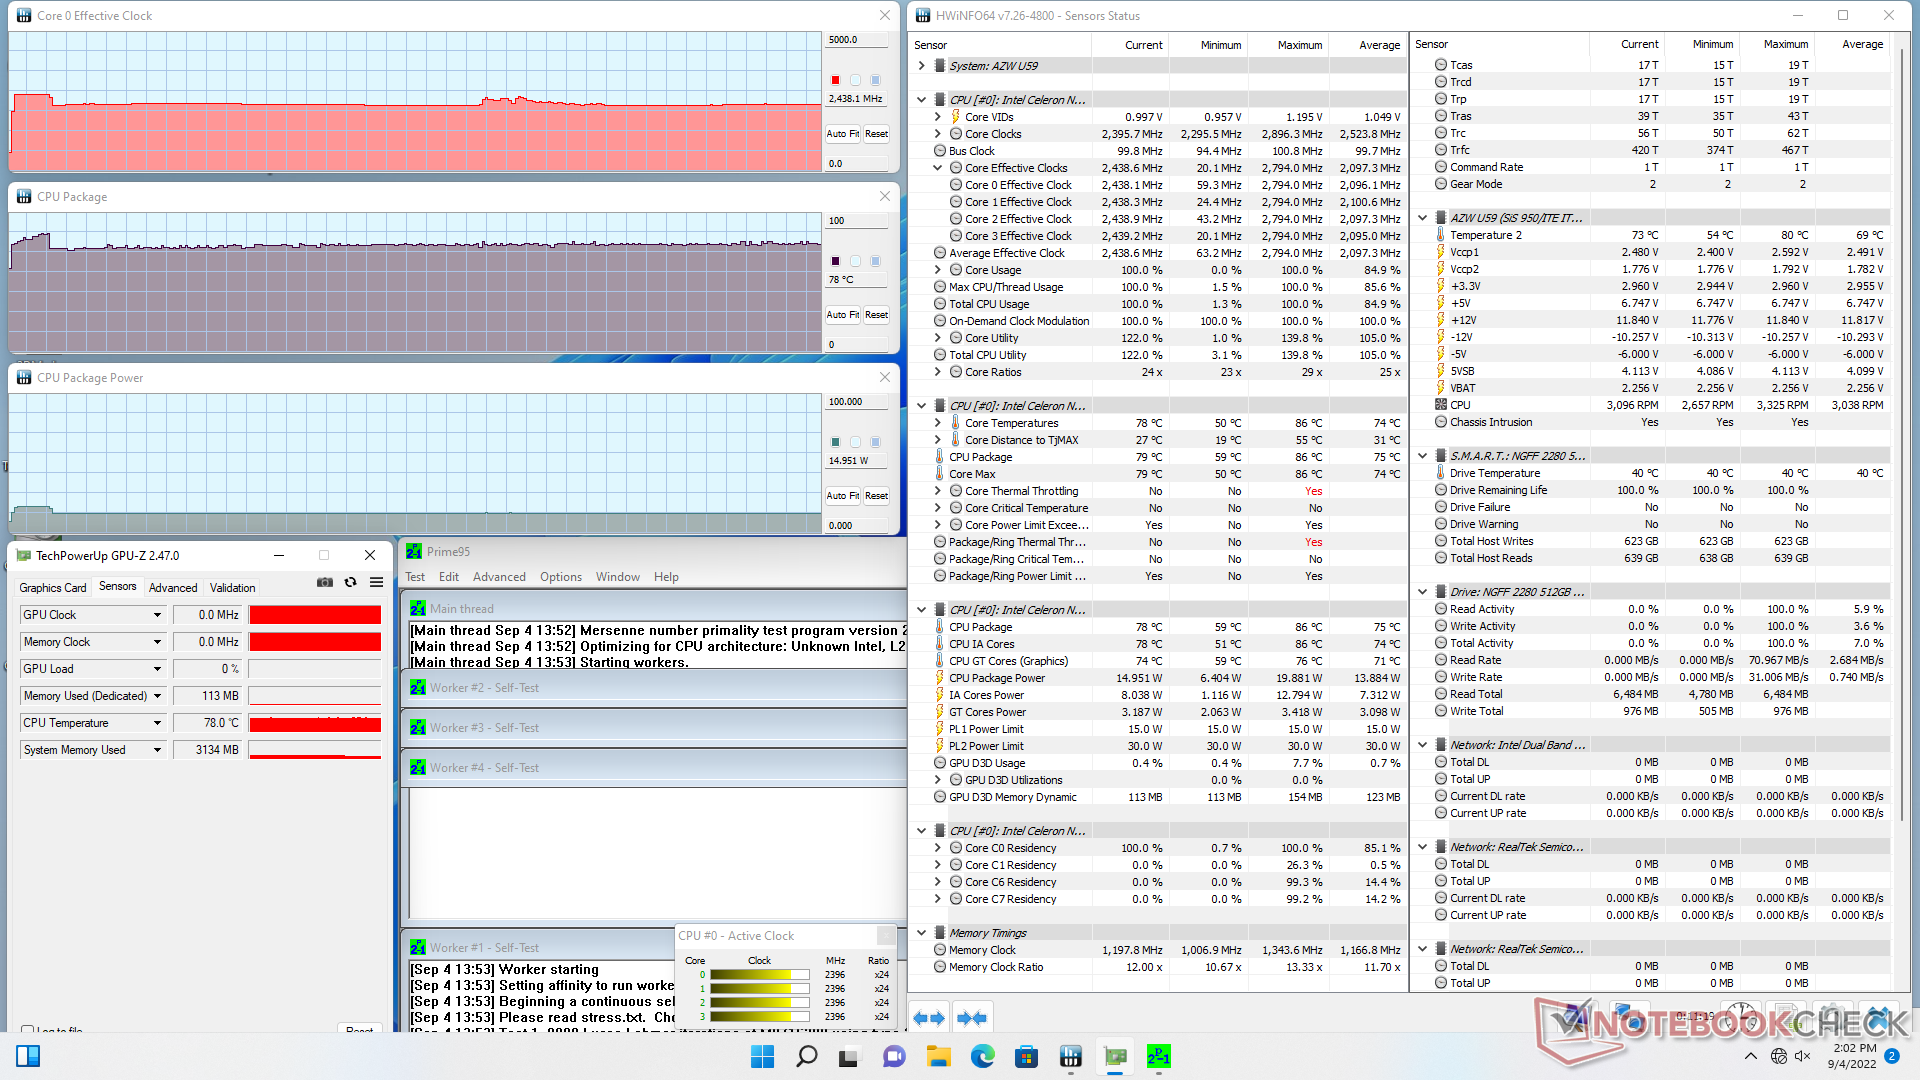
| Reloj dela CPU (GHz) | Reloj de la GPU (MHz) | Temperatura media de la CPU (°C) | |
| Sistema en reposo | -- | -- | 59 |
| Prime95 Stress | 2.4 | -- | 78 |
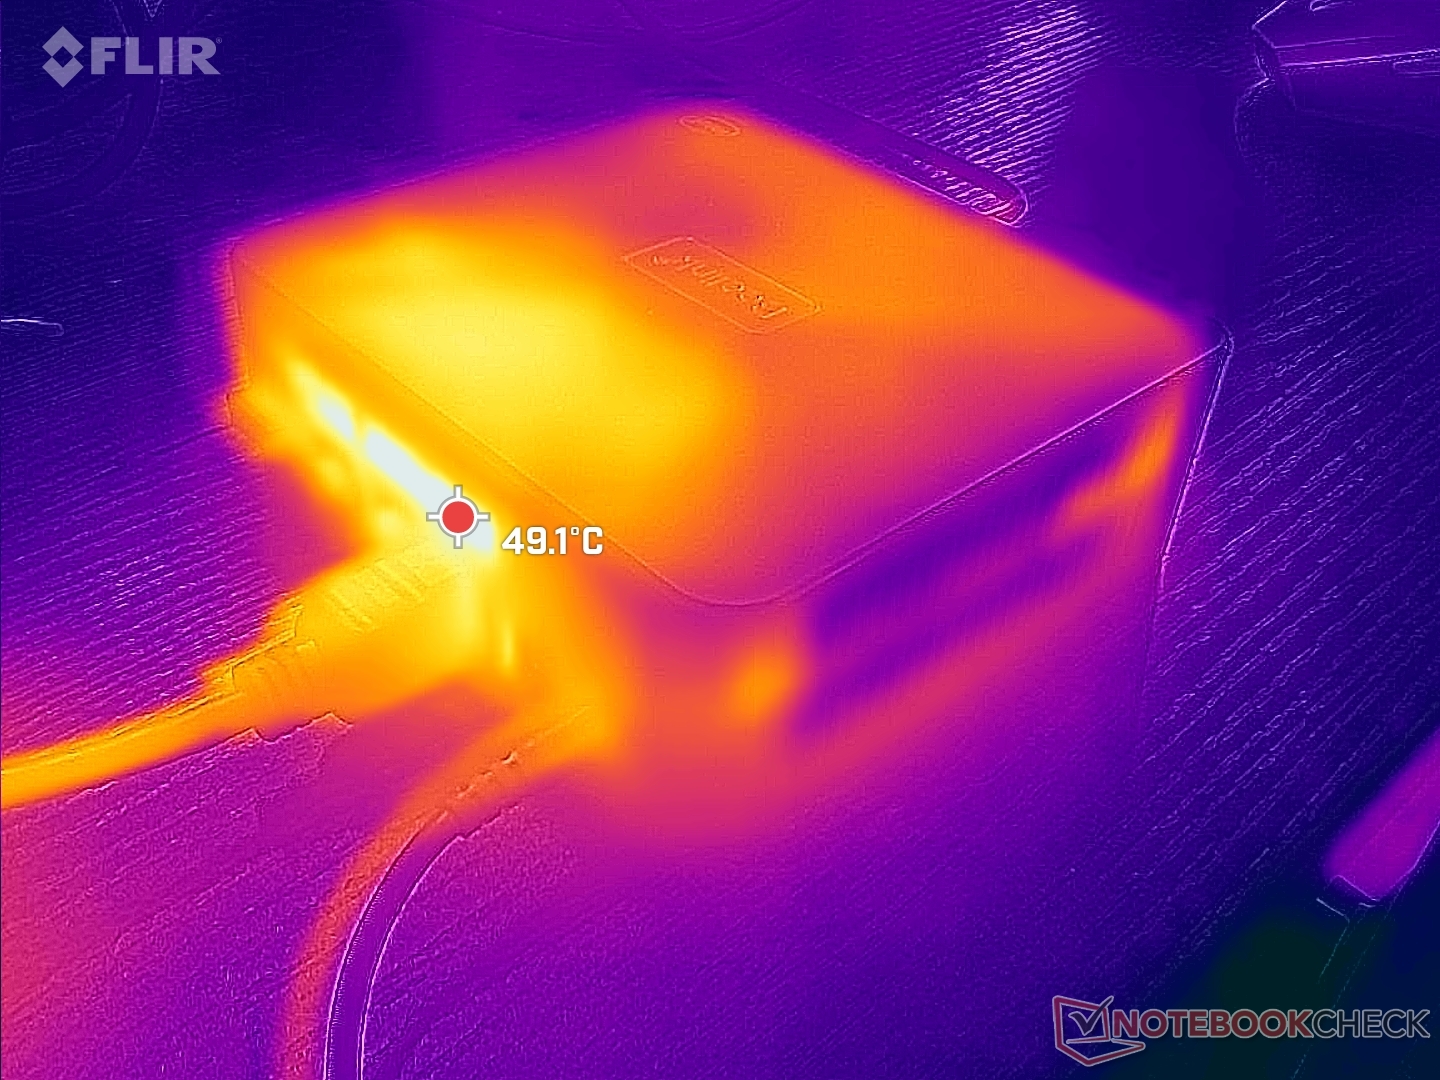
Gestión de la energía
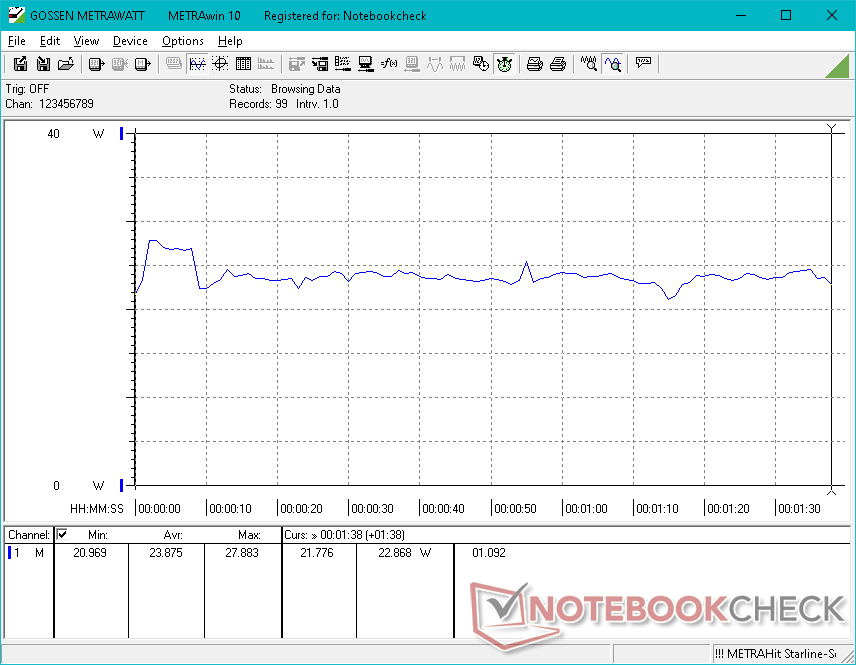
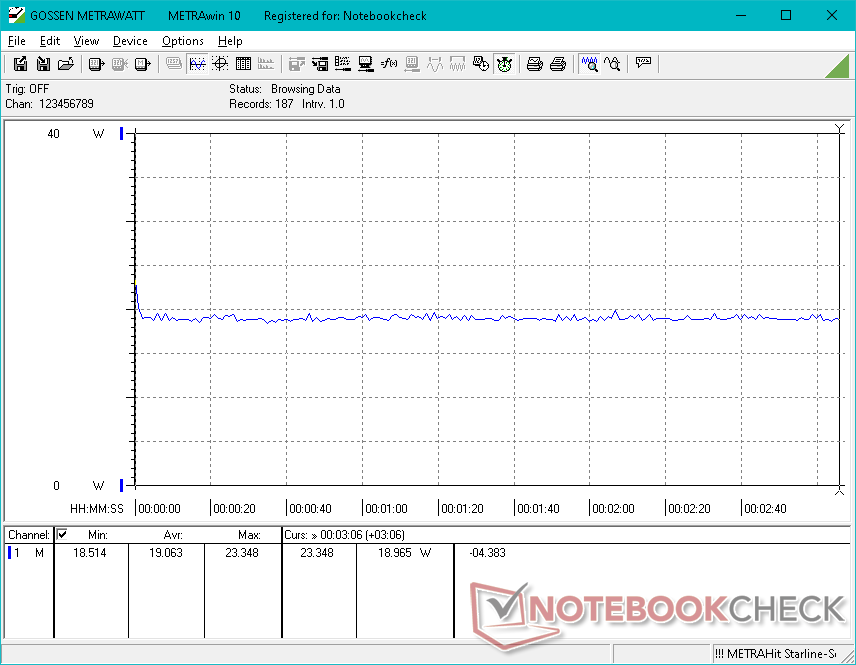
Consumo de energía
El sistema es ligeramente más exigente que en el U59 del año pasado con el antiguo Celeron N5095. Sin embargo, las ganancias de la GPU antes mencionadas merecen el par de vatios extra. El consumo general sigue siendo mucho menor que el de los mini PCs con CPUs Core U o Ryzen U, como el Intel NUC11 o el Beelink SER4
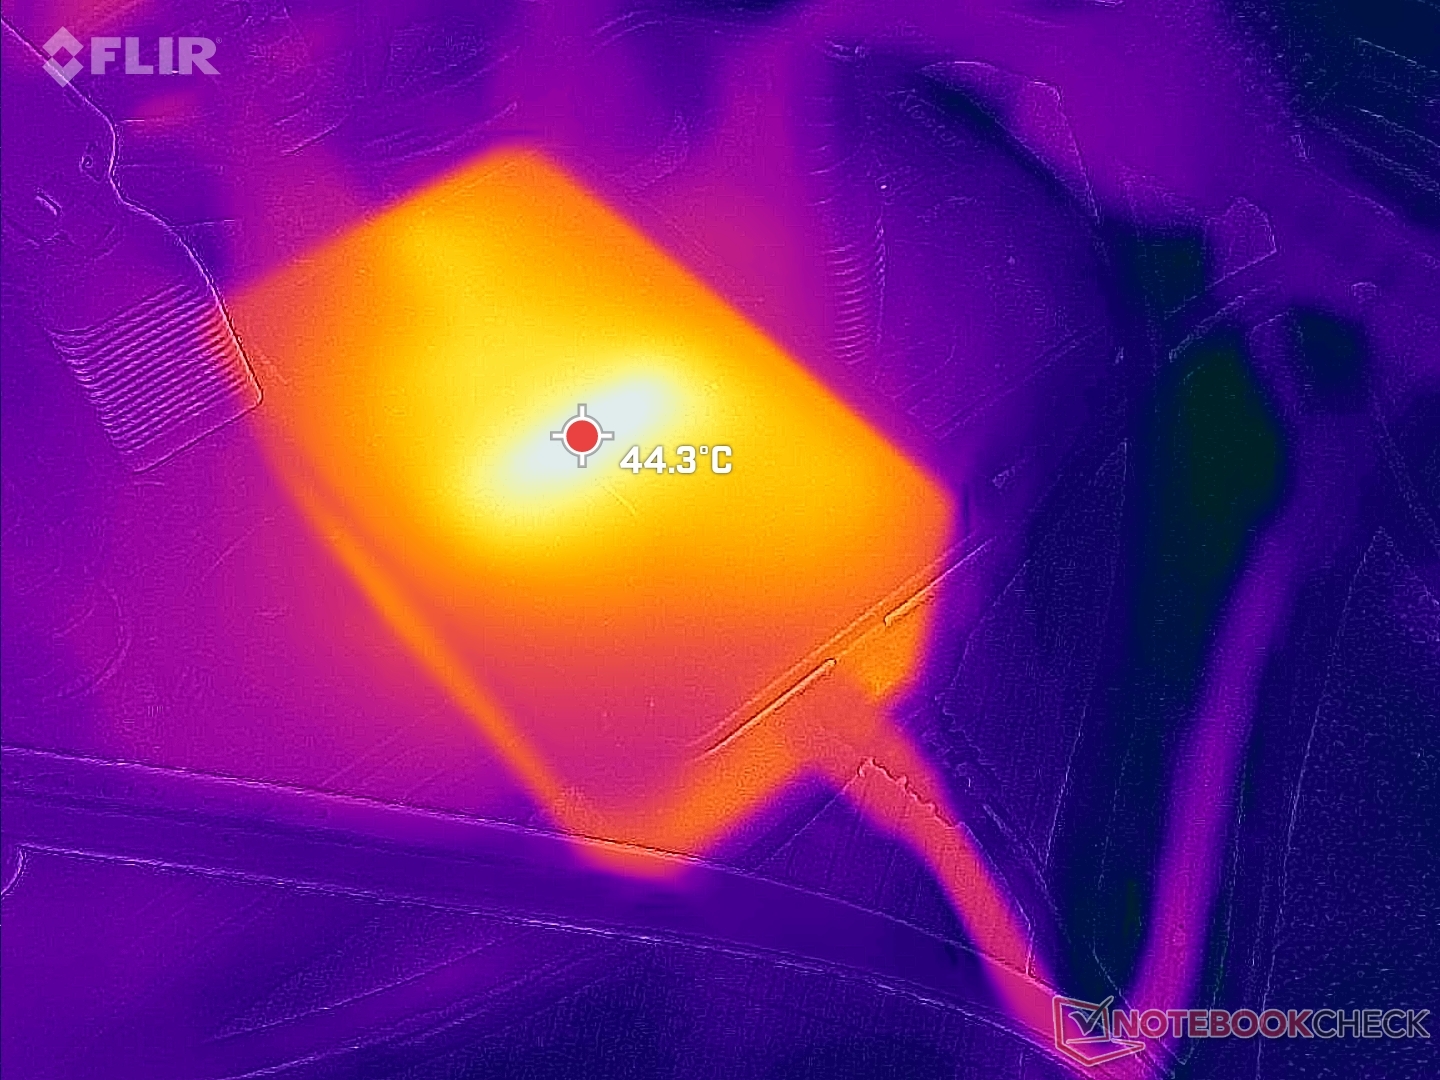
Hemos podido registrar un consumo máximo temporal de 29 W del pequeño (~7,8 x 4,6 x 3,2 cm) adaptador de CA de 36 W al ejecutar el estrés de Prime95.
| Off / Standby | |
| Ocioso | |
| Carga |
|
Clave:
min: | |
| Beelink U59 N5105 Celeron N5105, UHD Graphics (Jasper Lake 24 EU), Silicon Motion AZW 512G NV428, , x, | Beelink U59 Mini-S Celeron N5095, UHD Graphics (Jasper Lake 16 EU), Silicon Motion AZW 256G M.228 220426 C SATA 3, , x, | Beelink SER4 R7 4800U, Vega 8, Intel SSD 660p SSDPEKNW512G8, , x, | Beelink SER3 R7 3750H, Vega 10, GSemi AZW GSDFN512TS3F1OGCX, , x, | Intel NUC11TNKi5 i5-1135G7, Iris Xe G7 80EUs, Transcend M.2 SSD 430S TS512GMTS430S, , x, | Zotac ZBOX PI336 pico Celeron N6211, UHD Graphics (Elkhart Lake 16 EU), SanDisk DF4128, , x, | |
|---|---|---|---|---|---|---|
| Power Consumption | 15% | -4% | -27% | -82% | 42% | |
| Idle Minimum * (Watt) | 6.7 | 7 -4% | 4.1 39% | 7 -4% | 11.5 -72% | 5.4 19% |
| Idle Average * (Watt) | 8.1 | 7 14% | 4.1 49% | 9.1 -12% | 12.4 -53% | 5.5 32% |
| Idle Maximum * (Watt) | 11.6 | 7.6 34% | 4.6 60% | 9.7 16% | 12.9 -11% | 6.2 47% |
| Load Average * (Watt) | 23.9 | 18.3 23% | 35.6 -49% | 29.5 -23% | 40.7 -70% | 11.3 53% |
| Witcher 3 ultra * (Watt) | 19.1 | 35.6 -86% | 32.5 -70% | 43.9 -130% | ||
| Load Maximum * (Watt) | 28.8 | 27.1 6% | 39.9 -39% | 48.7 -69% | 73.5 -155% | 11.8 59% |
* ... más pequeño es mejor
Power Consumption Witcher 3 / Stresstest
Power Consumption external Monitor
Pro
Contra
Veredicto - Misma CPU, GPU más rápida
Si lo que busca es velocidad de procesamiento, no hay casi ninguna razón para elegir el Celeron N5105 en lugar del N5095. Puede que el N5105 funcione ligeramente más frío, pero no ofrece ninguna ganancia apreciable en el rendimiento de un solo hilo o de varios hilos. Sus ventajas residen en la GPU integrada, que es más rápida que la del N5095 por un margen mucho mayor.
Por desgracia, la GPU del N5105 sigue siendo lenta, por lo que la experiencia de la interfaz de usuario de Windows sigue siendo lenta cuando se ejecutan más de una o dos aplicaciones simultáneamente. En este caso, las capacidades de streaming del U59 N5105 son esencialmente las mismas que en el U59 N5095. Se recomienda buscar SKUs con RAM de doble canal siempre que sea posible para maximizar el rendimiento de la GPU integrada.
En cuanto al mini PC en sí, el U59 tiene una buena cantidad de características teniendo en cuenta su bajo precio. Las configuraciones vienen preinstaladas con Windows 11 y un SSD muy espacioso de 512 GB con 16 GB de RAM por solo unos 200 dólares, mientras que un NUC de Intel podría costar fácilmente más del doble sin RAM ni almacenamiento. Si todo lo que buscas es hacer un streaming básico a 1080p o navegar, entonces este U59 hará el trabajo suficientemente. Sin embargo, para una multitarea más pesada y una mayor sobrecarga, querrás invertir en un mini PC con CPUs Core o Ryzen más rápidas, como las series SEI o SER de Bellink.
Precio y disponibilidad
El Beelink U59, tal y como está configurado en nuestra reseña, se puede adquirir actualmente por 200 dólares si se compra en directamente al fabricante. Como alternativa, Amazon tiene la configuración en stock por 240 dólares y 200 dólares para las versiones de 16 y 8 GB, respectivamente.
Price comparison

