Reseña del Intel NUC11TNKi5 Pro Mini Tiger Canyon: El NUC más pequeño Tiger Lake

La familia NUC 11 se compone de tres amplios modelos: el NUC 11 Pro Mini (NUC11TNK), el NUC 11 Performance (NUC11PAQ), y el NUC 11 Enthusiast (NUC11PHK), con tecnología RTX GeForce. Cada modelo es visualmente distinto, siendo el Pro Mini el más pequeño de todos.
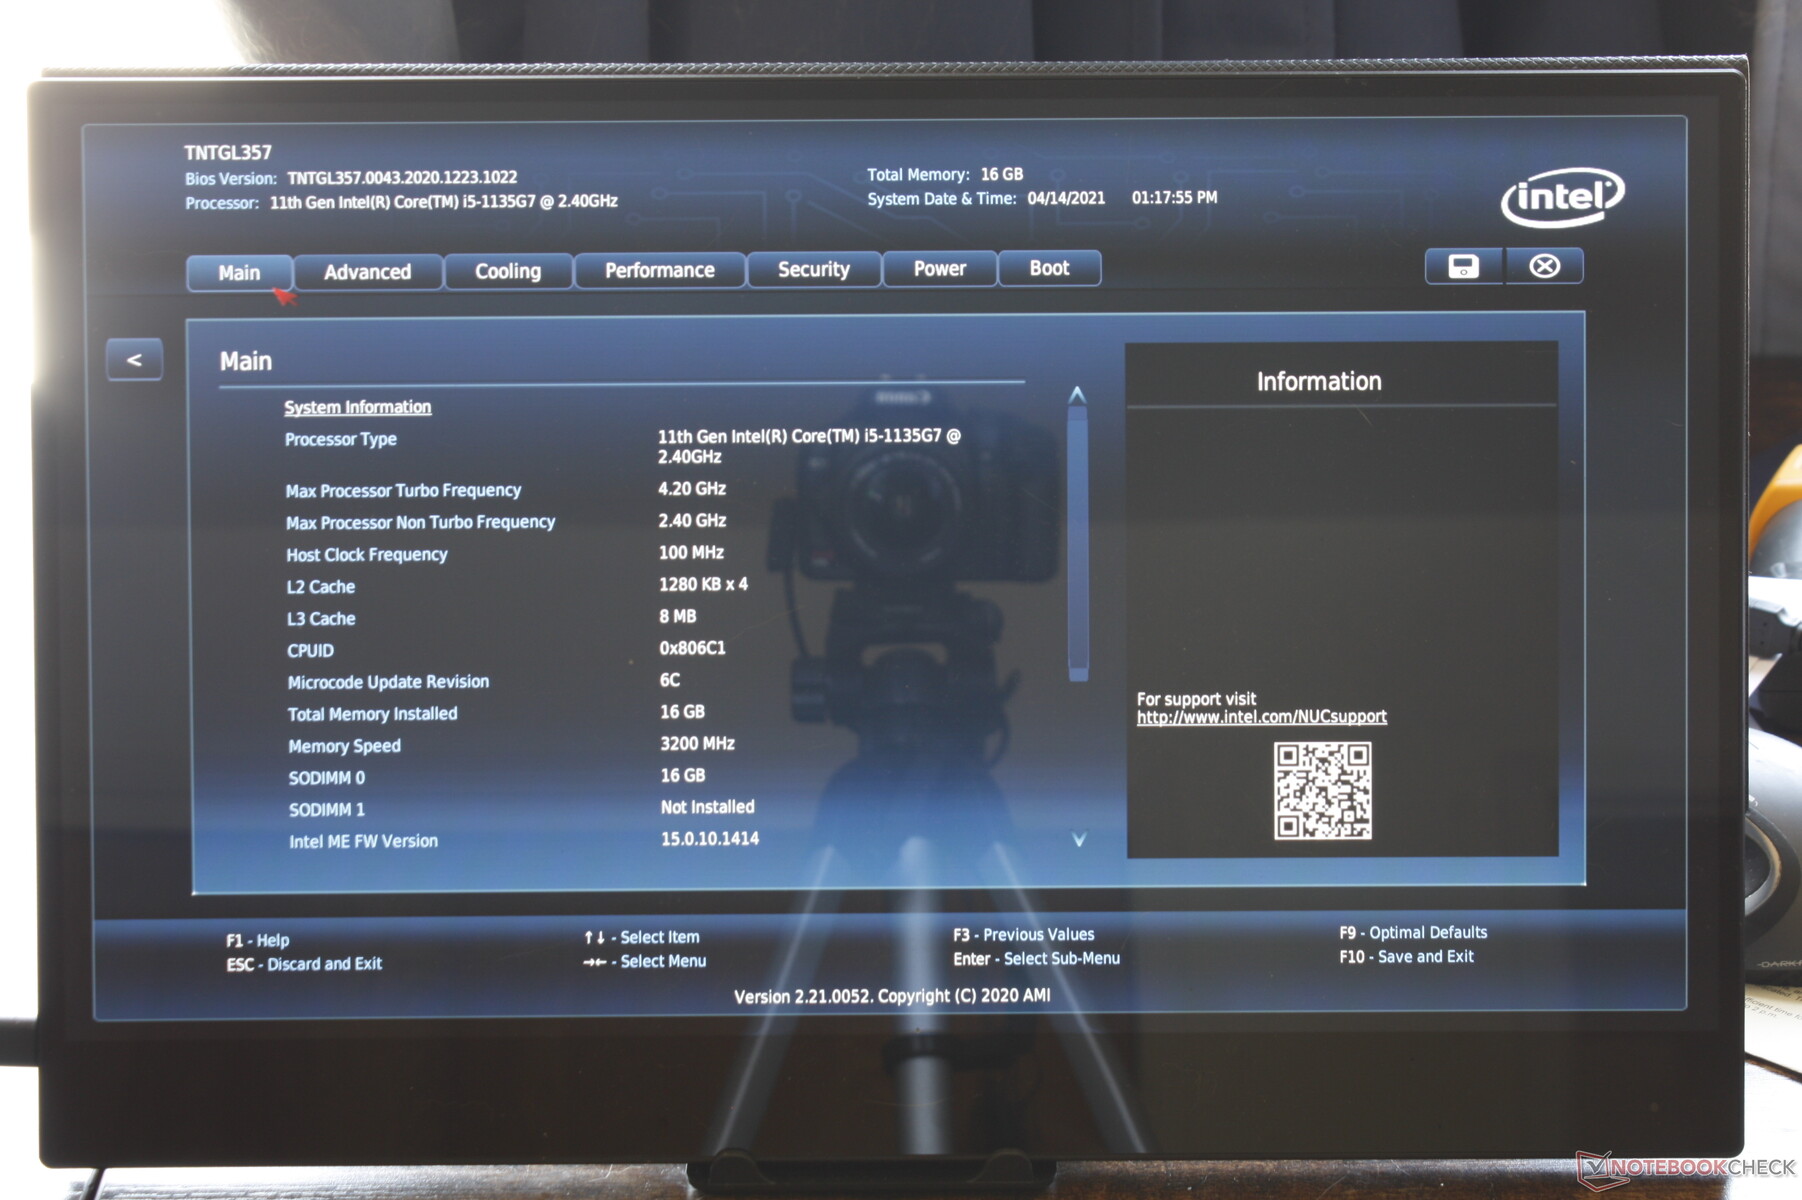
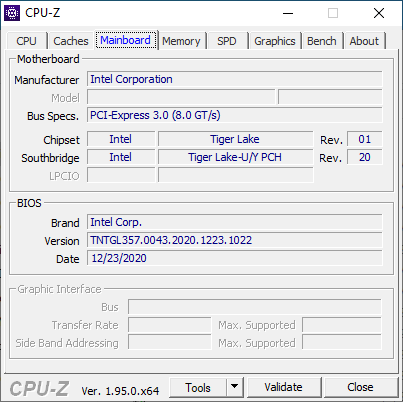
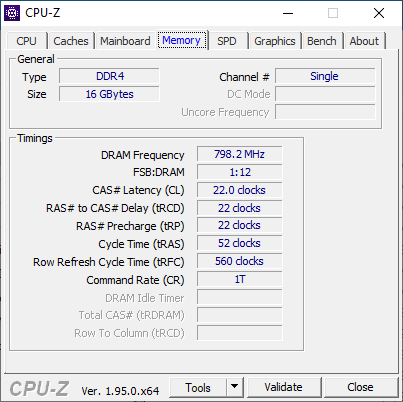
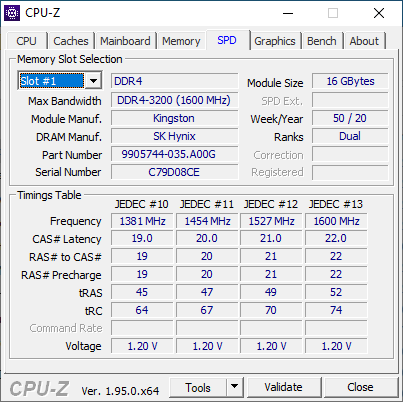
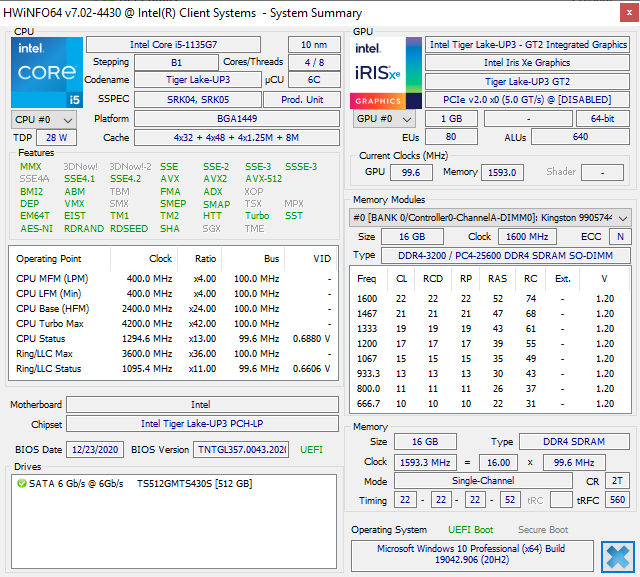
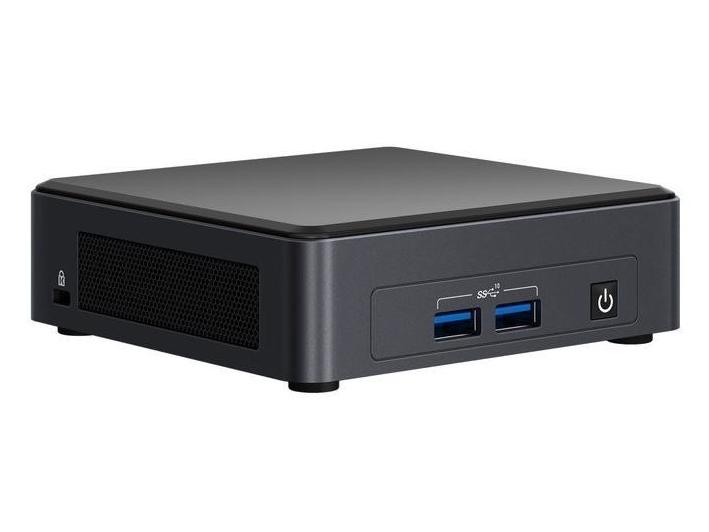
La unidad que probamos aquí es el NUC 11 Pro Mini, y en las próximas semanas analizaremos el modelo Enthusiast. Aunque hay opciones de Core i3, Core i7, RAM de doble canal y SSD NVMe, Intel ha configurado el nuestro con la CPU Core i5-1135G7, 16 GB de RAM de un solo canal y una SSD M.2 SATA III de 512 GB.
Los competidores de la serie NUC de Intel han ido creciendo a lo largo de los años. Las alternativas incluyen el Zotac ZBox, Beelink SEi10, GMK NucBox 2y el Lenovo ThinkCentre Nano.
Más opiniones sobre el Intel NUC:
potential competitors in comparison
Valoración | Fecha | Modelo | Peso | Altura | Tamaño | Resolución | Precio |
|---|---|---|---|---|---|---|---|
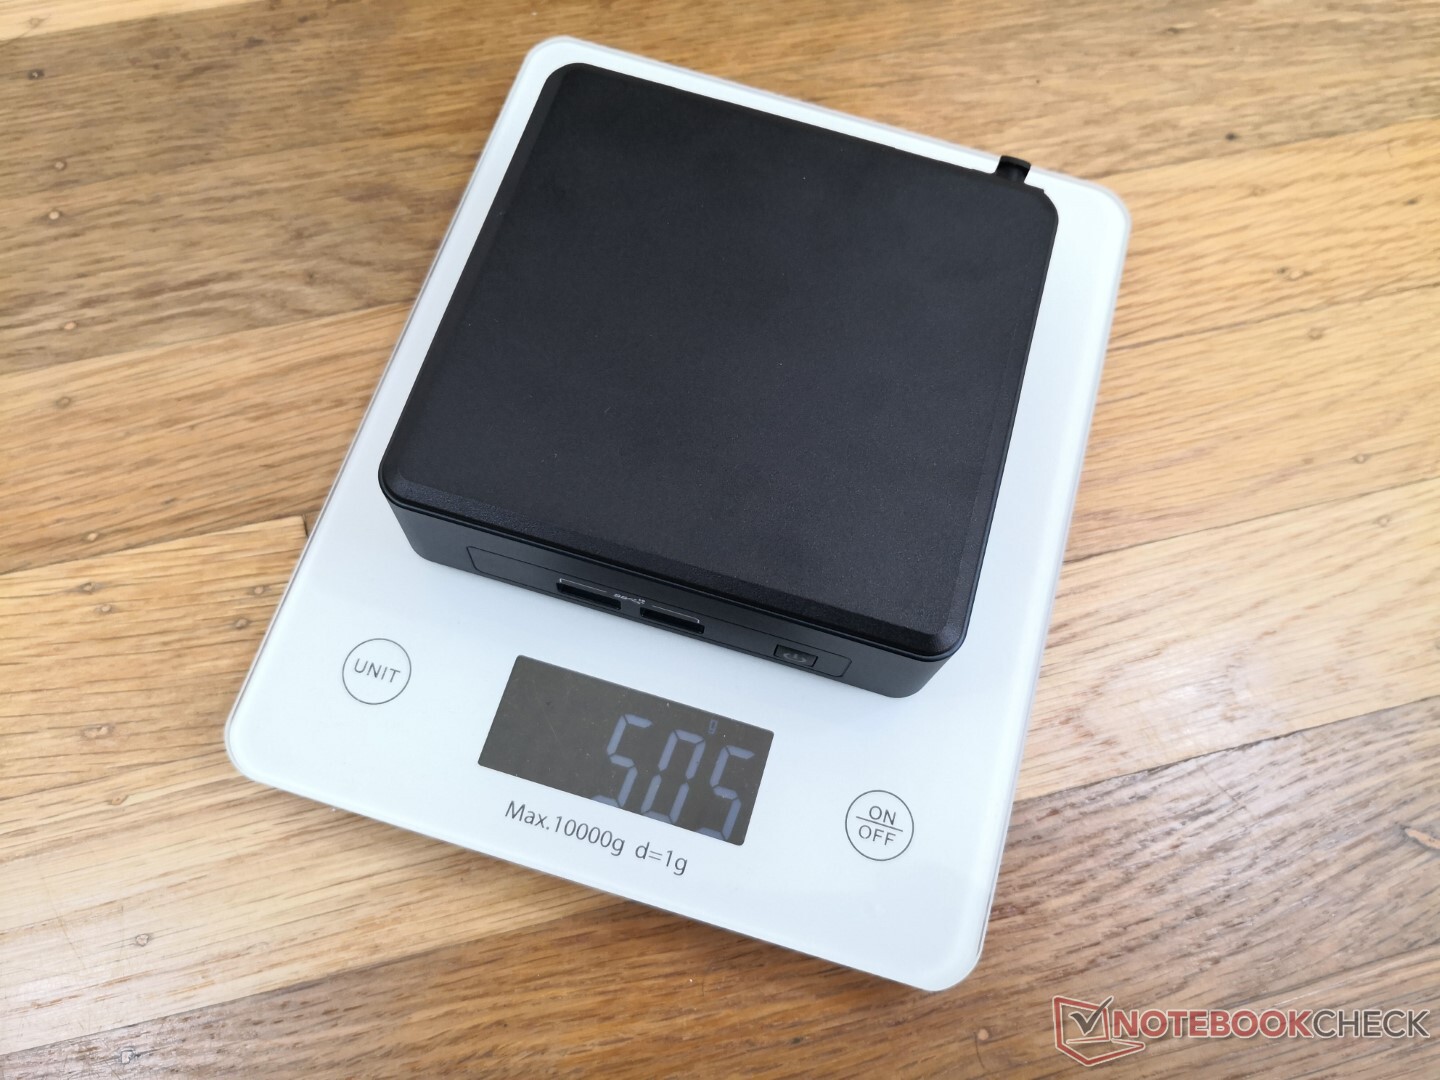
v (old) | 04/2021 | Intel NUC11TNKi5 i5-1135G7, Iris Xe G7 80EUs | 504 g | 37 mm | x | ||
v (old) | 03/2021 | GMK NucBox 2 i5-8259U, Iris Plus Graphics 655 | 430 g | 50 mm | x | ||
v (old) | 02/2021 | Intel NUC11PAQi7 i7-1165G7, Iris Xe G7 96EUs | 647 g | 56 mm | x | ||
v (old) | 02/2020 | Intel NUC10i5FNK i5-10210U, UHD Graphics 620 | 493 g | 36 mm | 0.00" | 0x0 | |
v (old) | Beelink SEi10 i3-1005G1, UHD Graphics G1 (Ice Lake 32 EU) | 350 g | 41 mm | x | |||
v (old) | 10/2020 | Zotac ZBOX MI642 Nano i5-10210U, UHD Graphics 620 | 472 g | 51 mm | x |
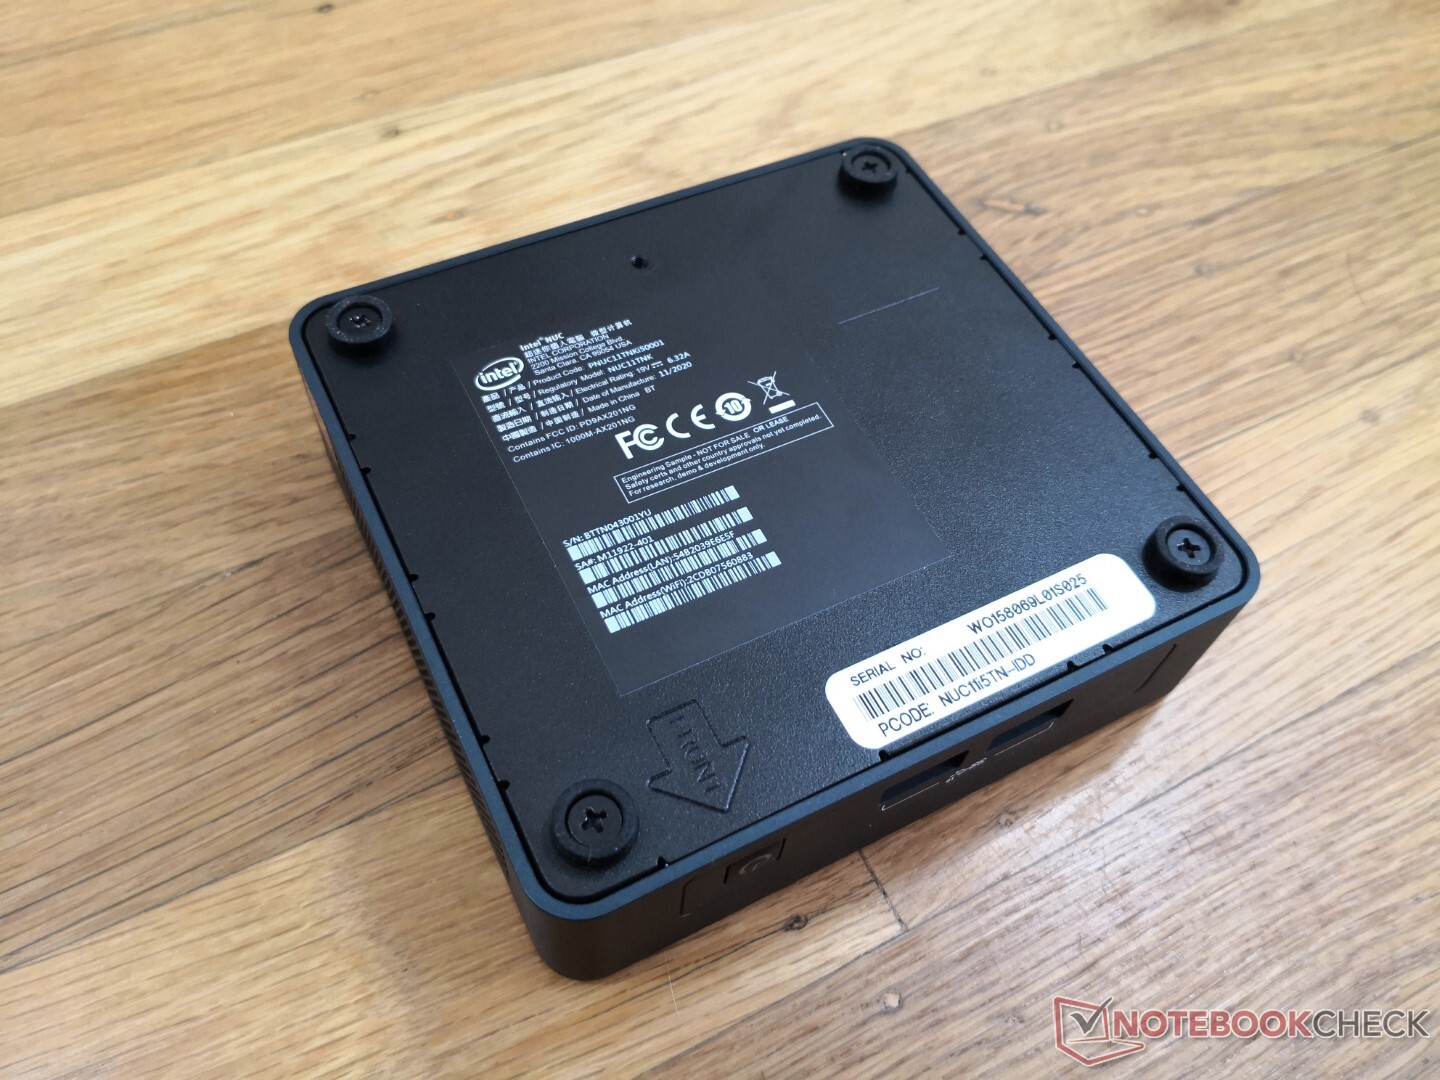
Caso
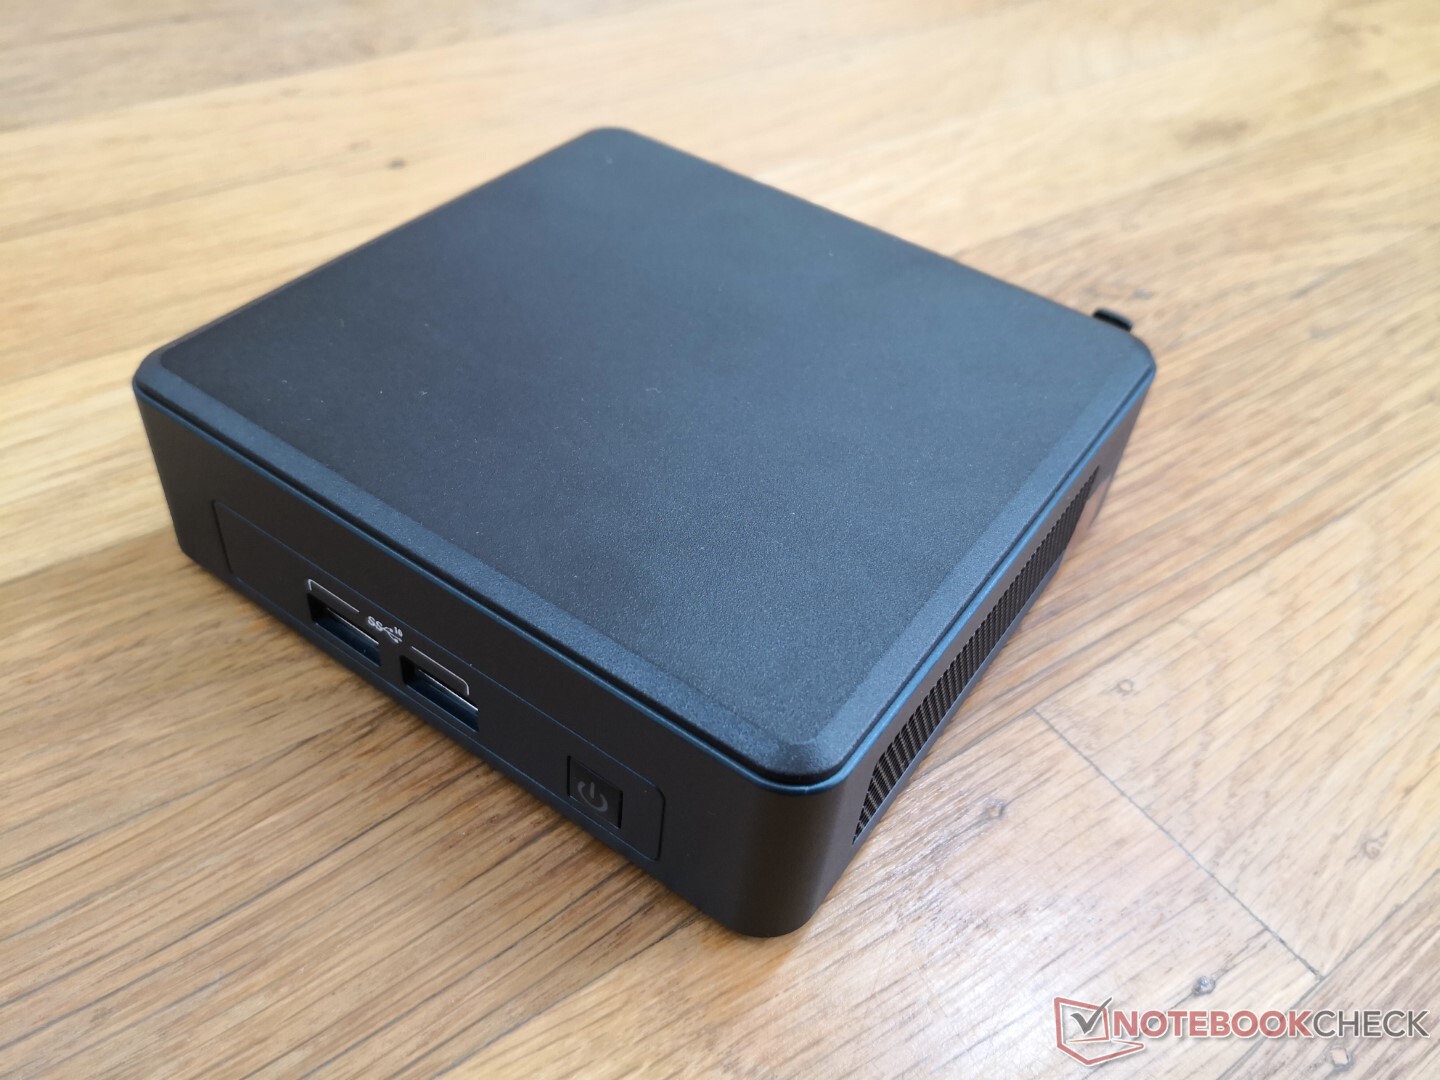
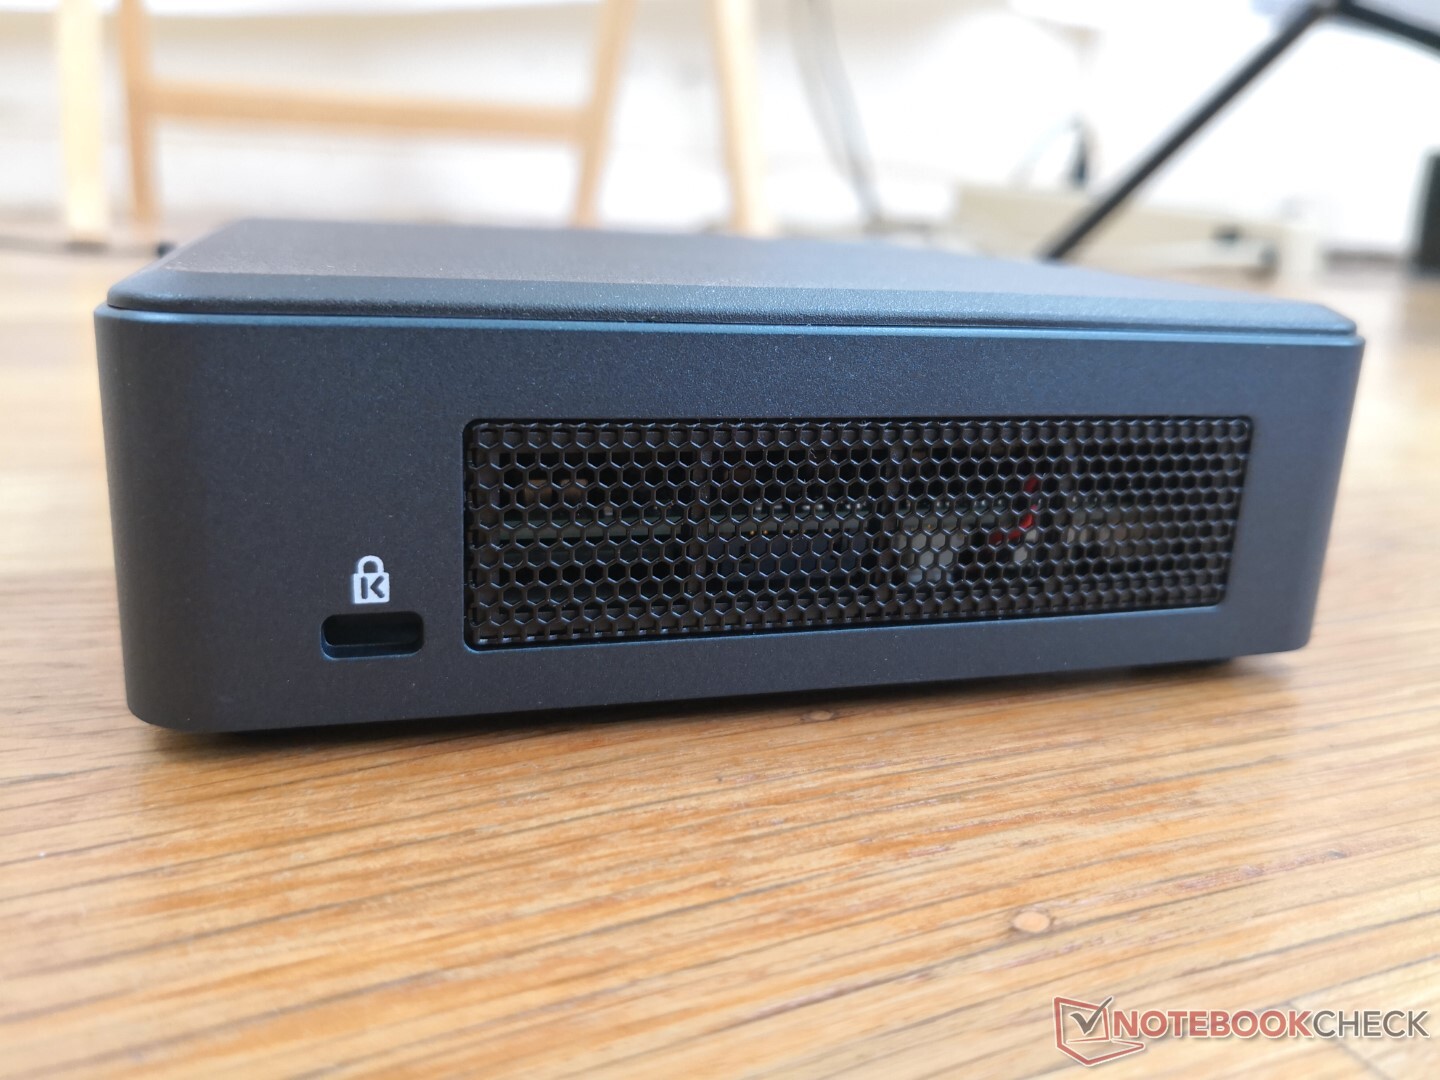
La longitud y la anchura son idénticas a las del NUC 11 Performance, mientras que la altura es 19 mm menor. La placa de plástico superior es ahora mate y ligeramente rugosa, a diferencia de las placas lisas y brillantes de los antiguos NUC, probablemente para reducir la antiestética acumulación de huellas dactilares y arañazos.
Al igual que en otros NUC de Intel, hay una jaula metálica interior para mejorar la rigidez y la calidad a costa de aumentar el peso. Esto sigue siendo una característica distintiva de la NUC en comparación con la mayoría de los otros mini PC.
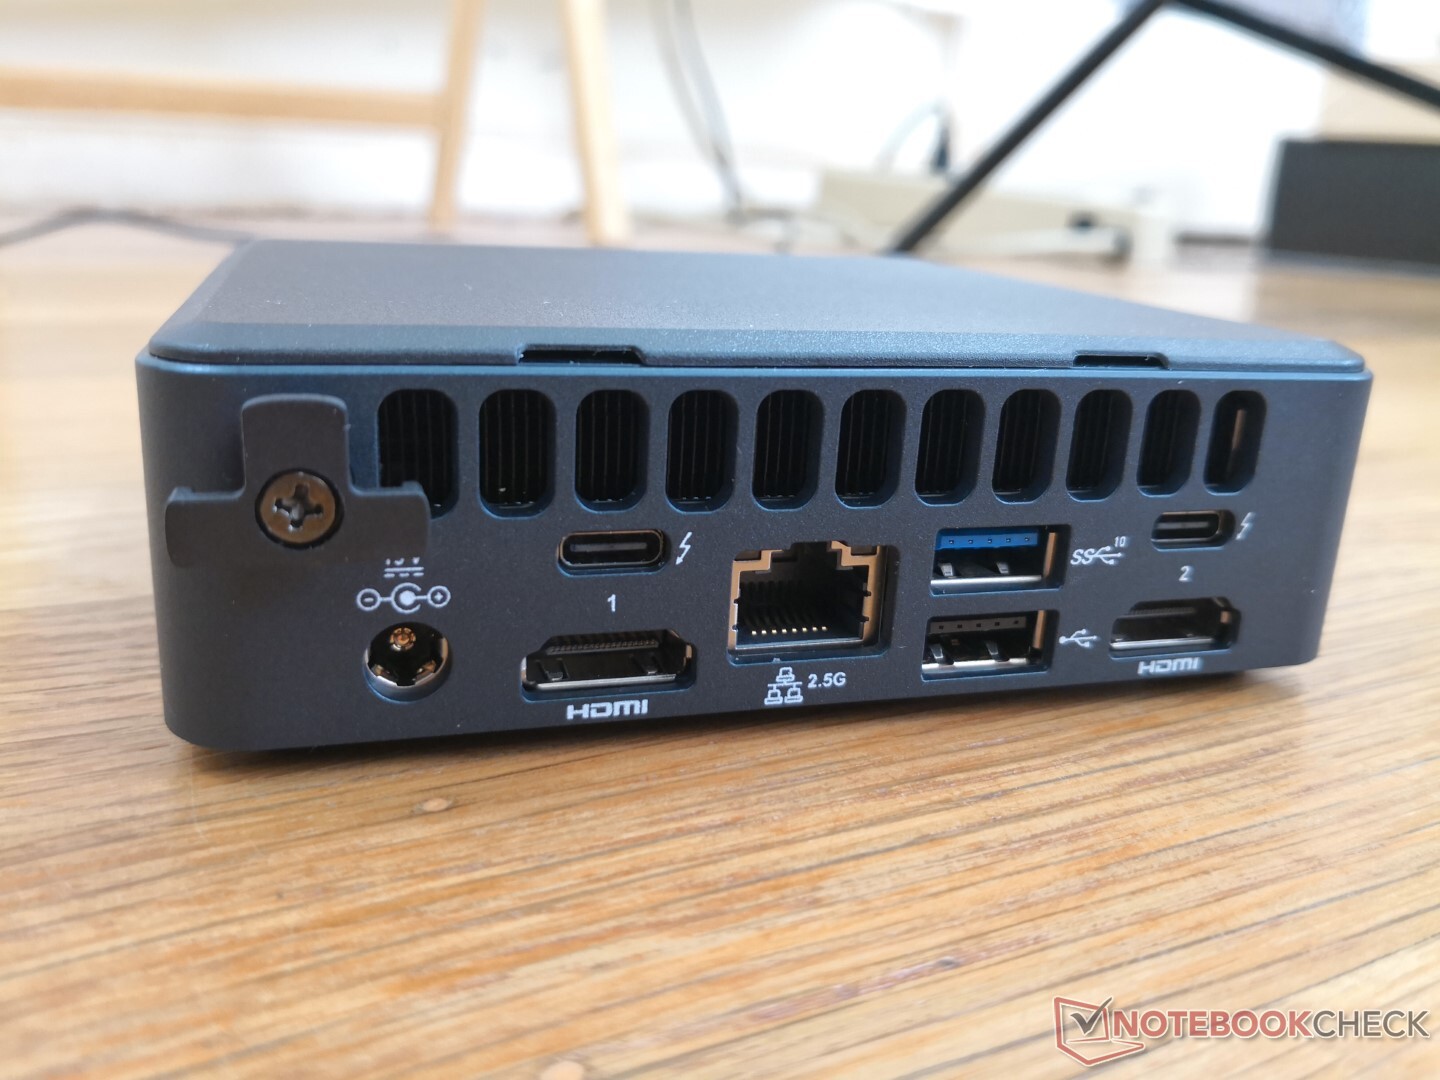
Conectividad
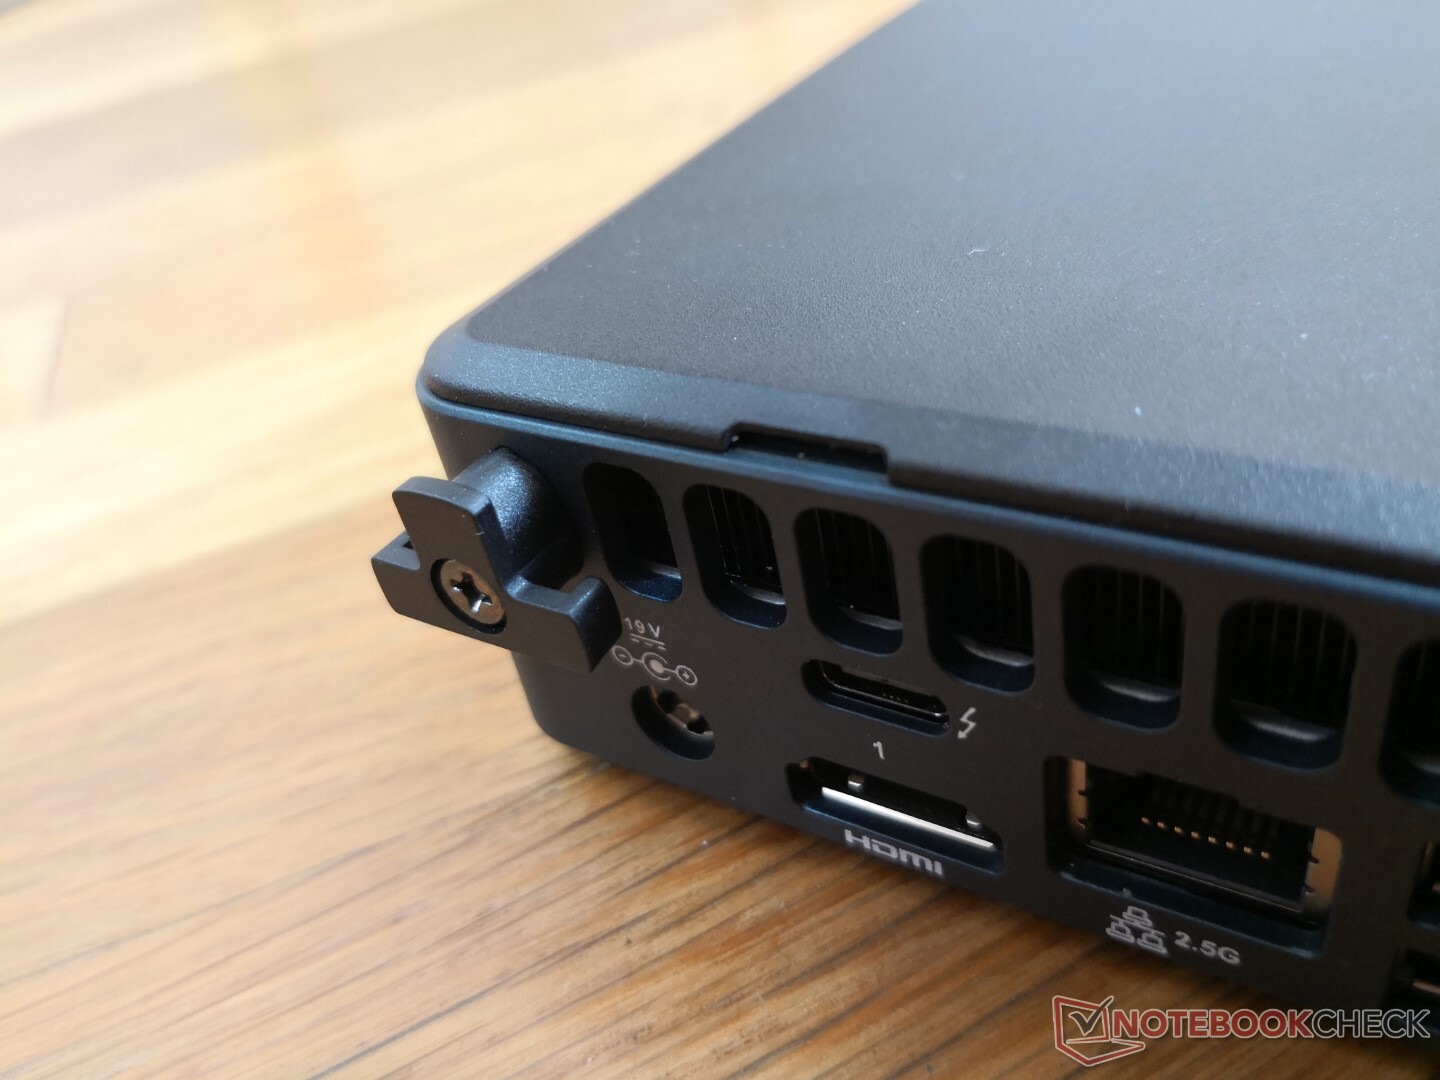
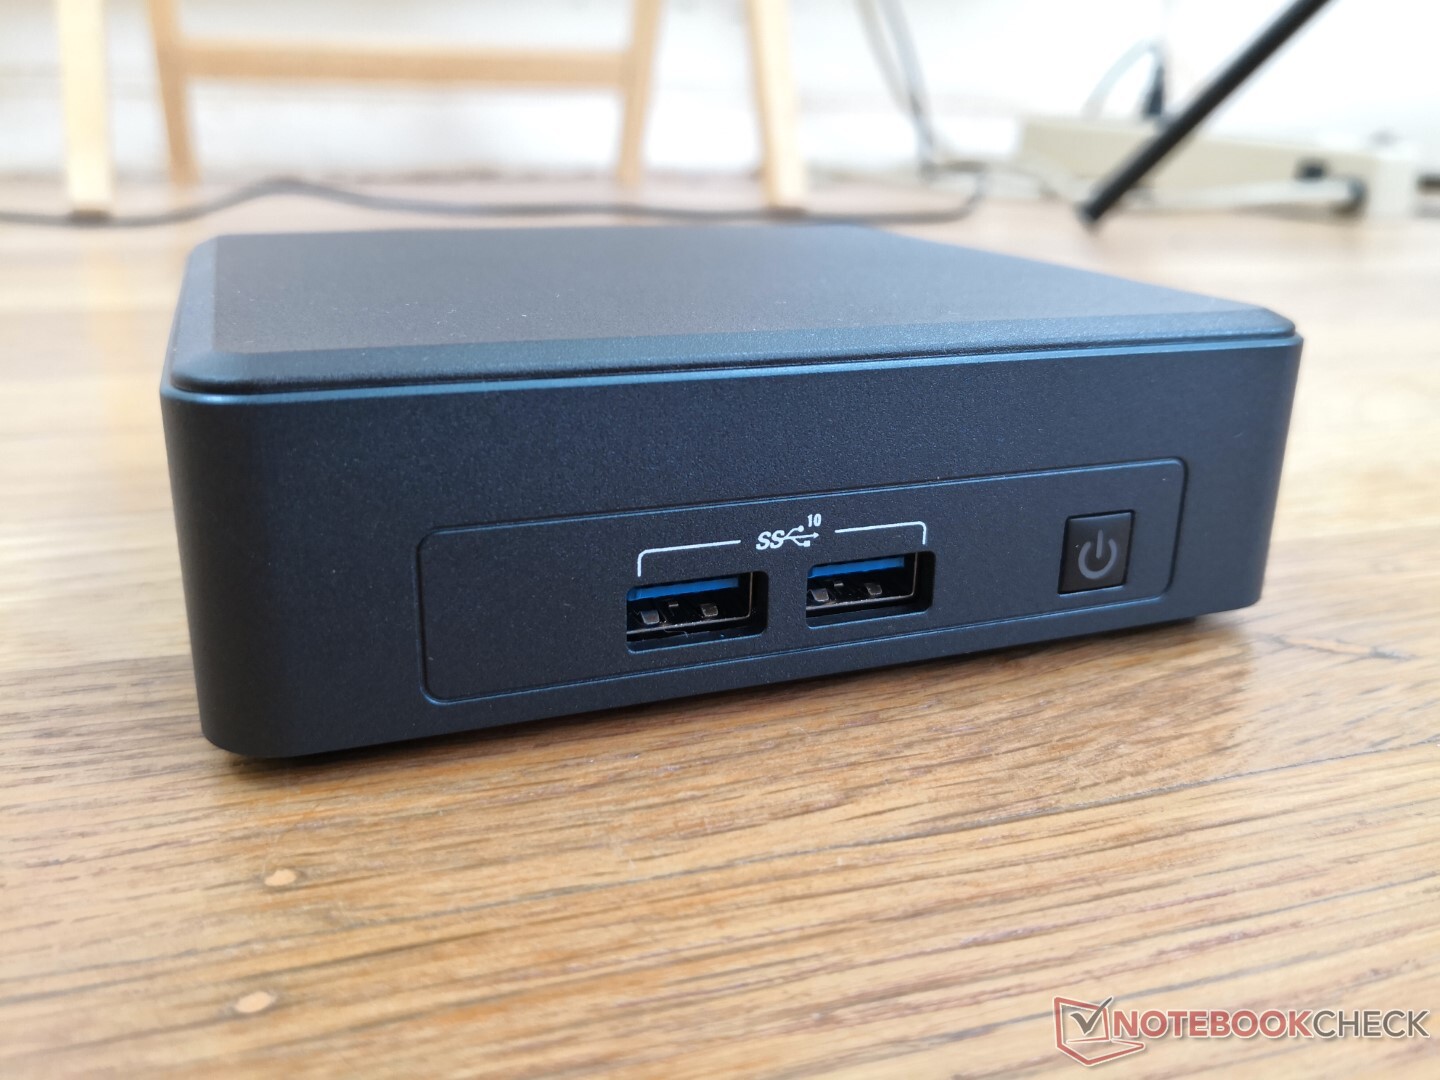
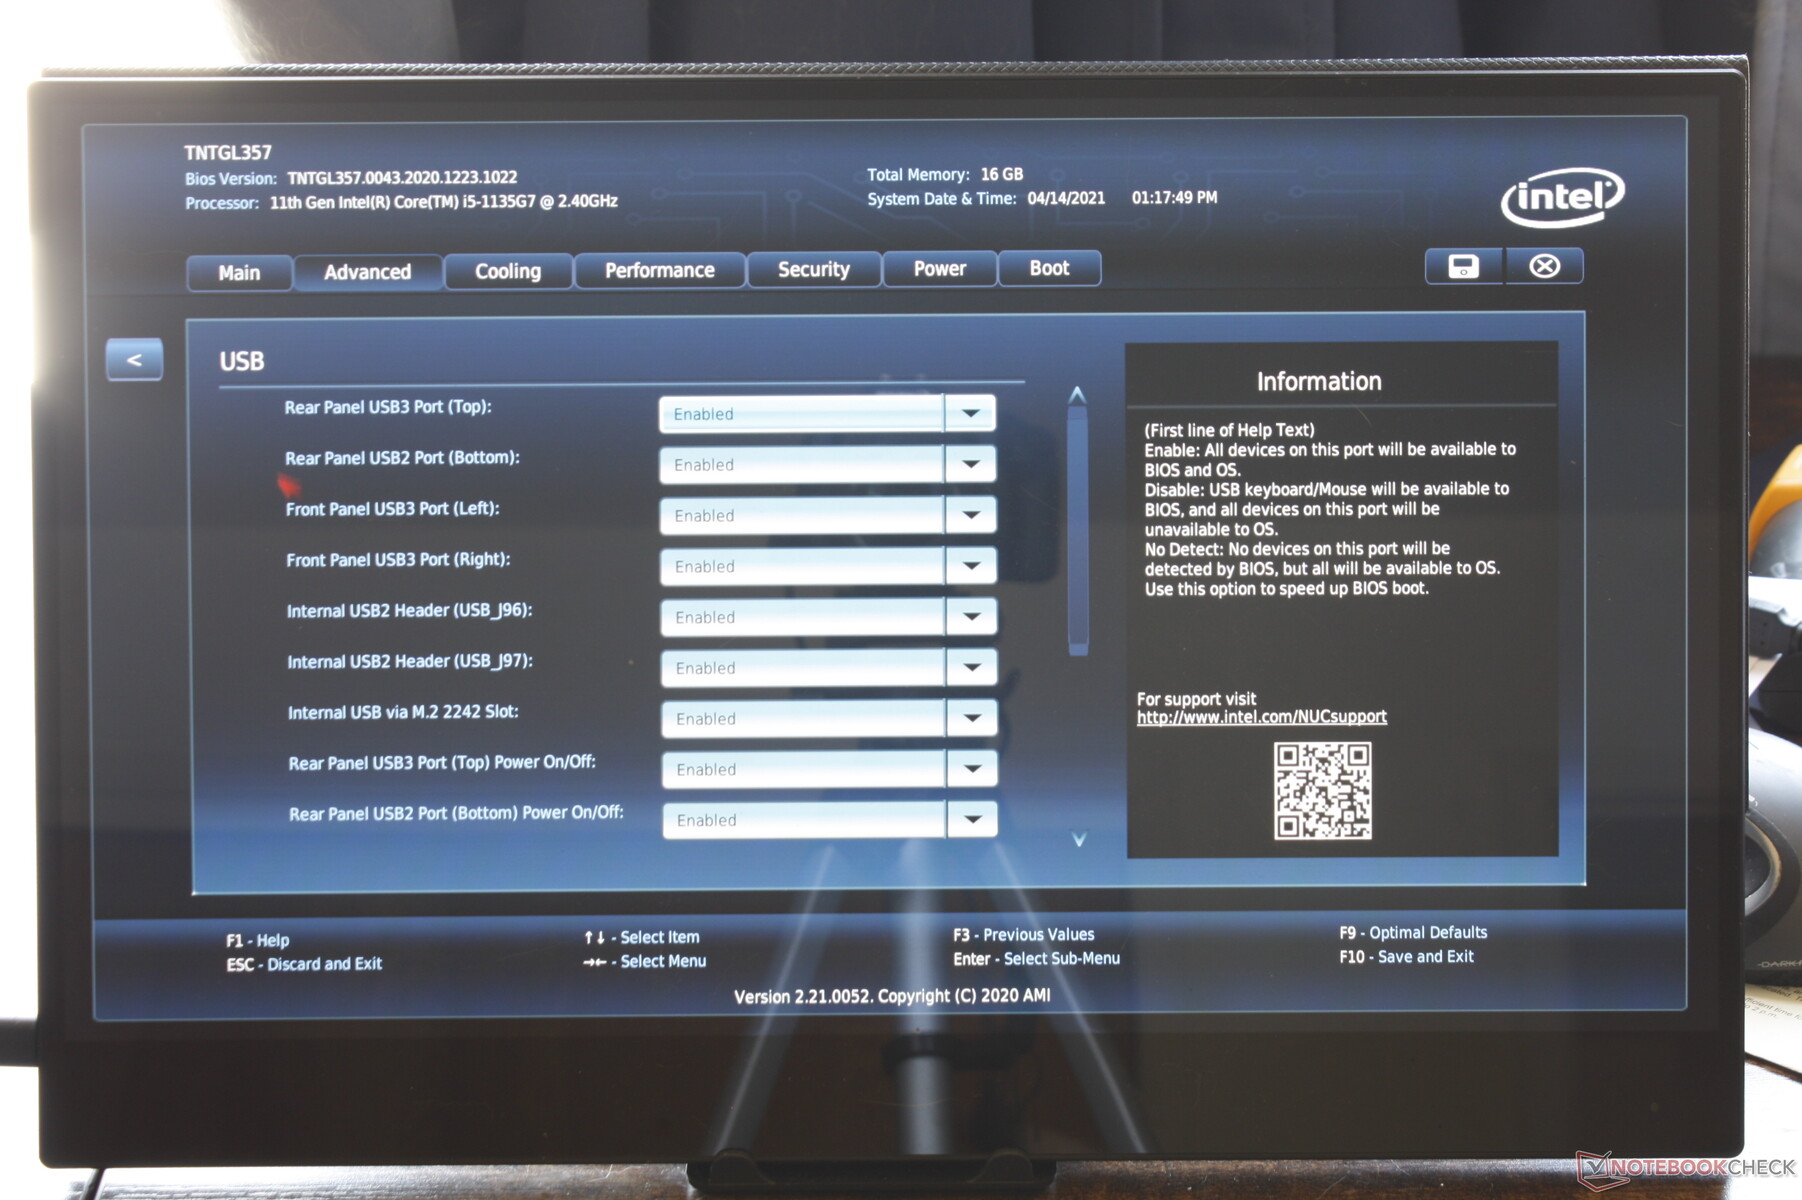
Casi todos los puertos están apretados a lo largo de la parte trasera, incluyendo un puerto Thunderbolt 3 y un puerto Thunderbolt 4. Por desgracia, el NUC no se puede alimentar con adaptadores de CA USB-C, por lo que los propietarios deben utilizar el puerto de barril de CA incluido.
Comunicación
| Networking | |
| iperf3 transmit AX12 | |
| Intel NUC11TNKi5 | |
| Beelink SEi10 | |
| Intel NUC11PAQi7 | |
| GMK NucBox 2 | |
| iperf3 receive AX12 | |
| Intel NUC11TNKi5 | |
| Beelink SEi10 | |
| Intel NUC11PAQi7 | |
| GMK NucBox 2 | |
Mantenimiento
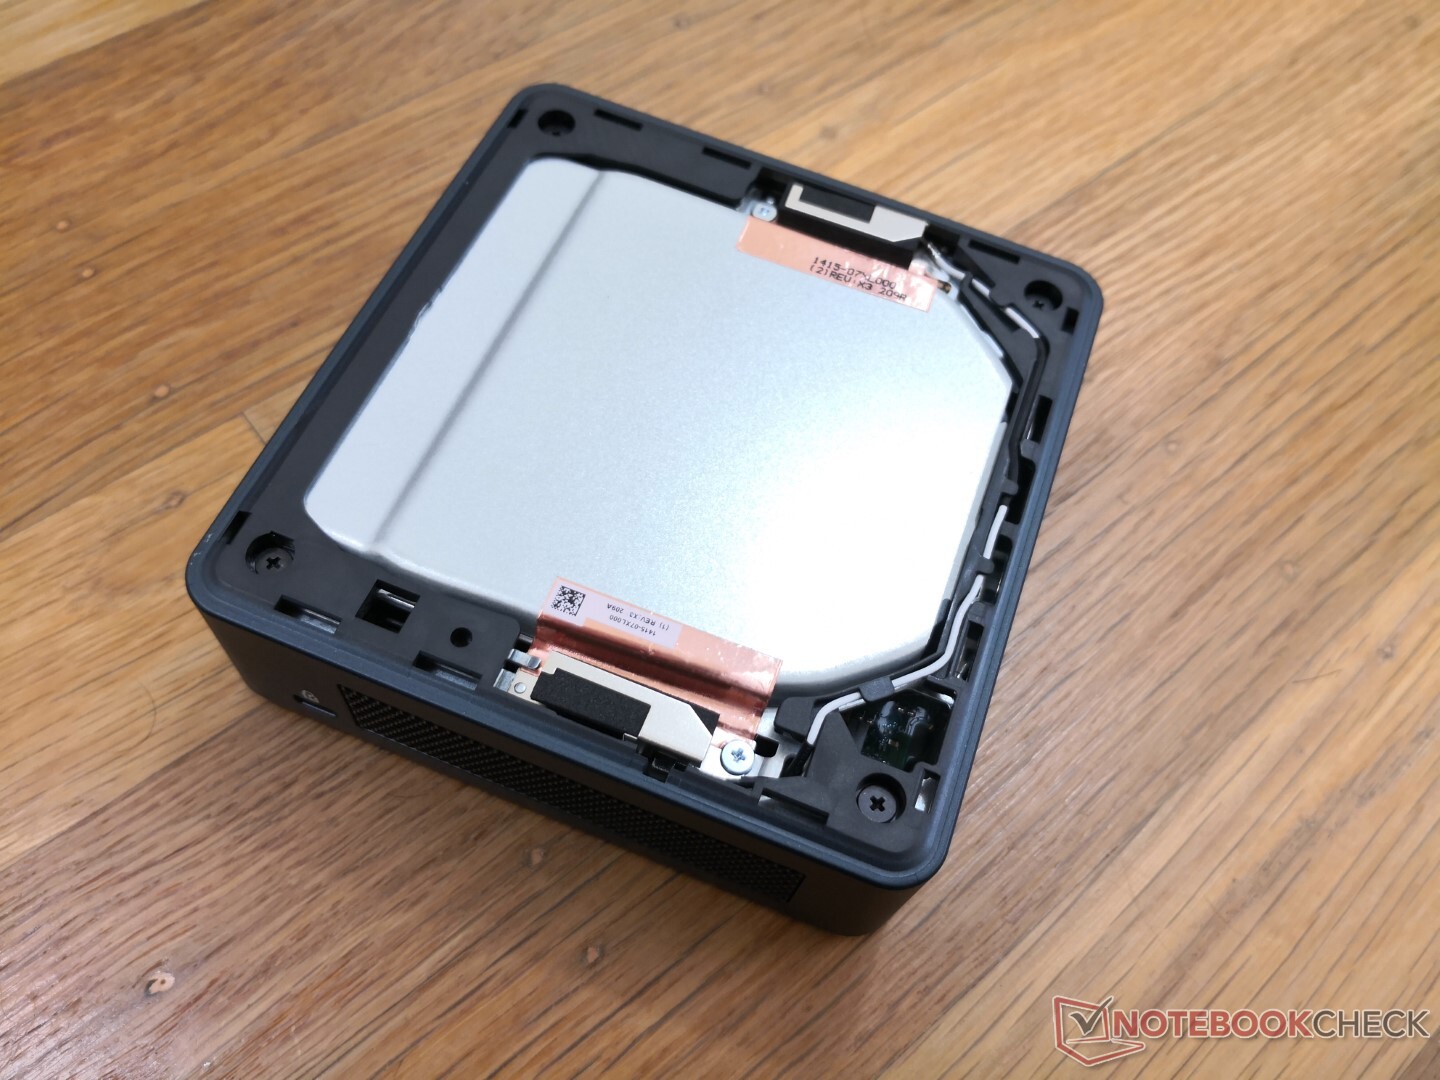
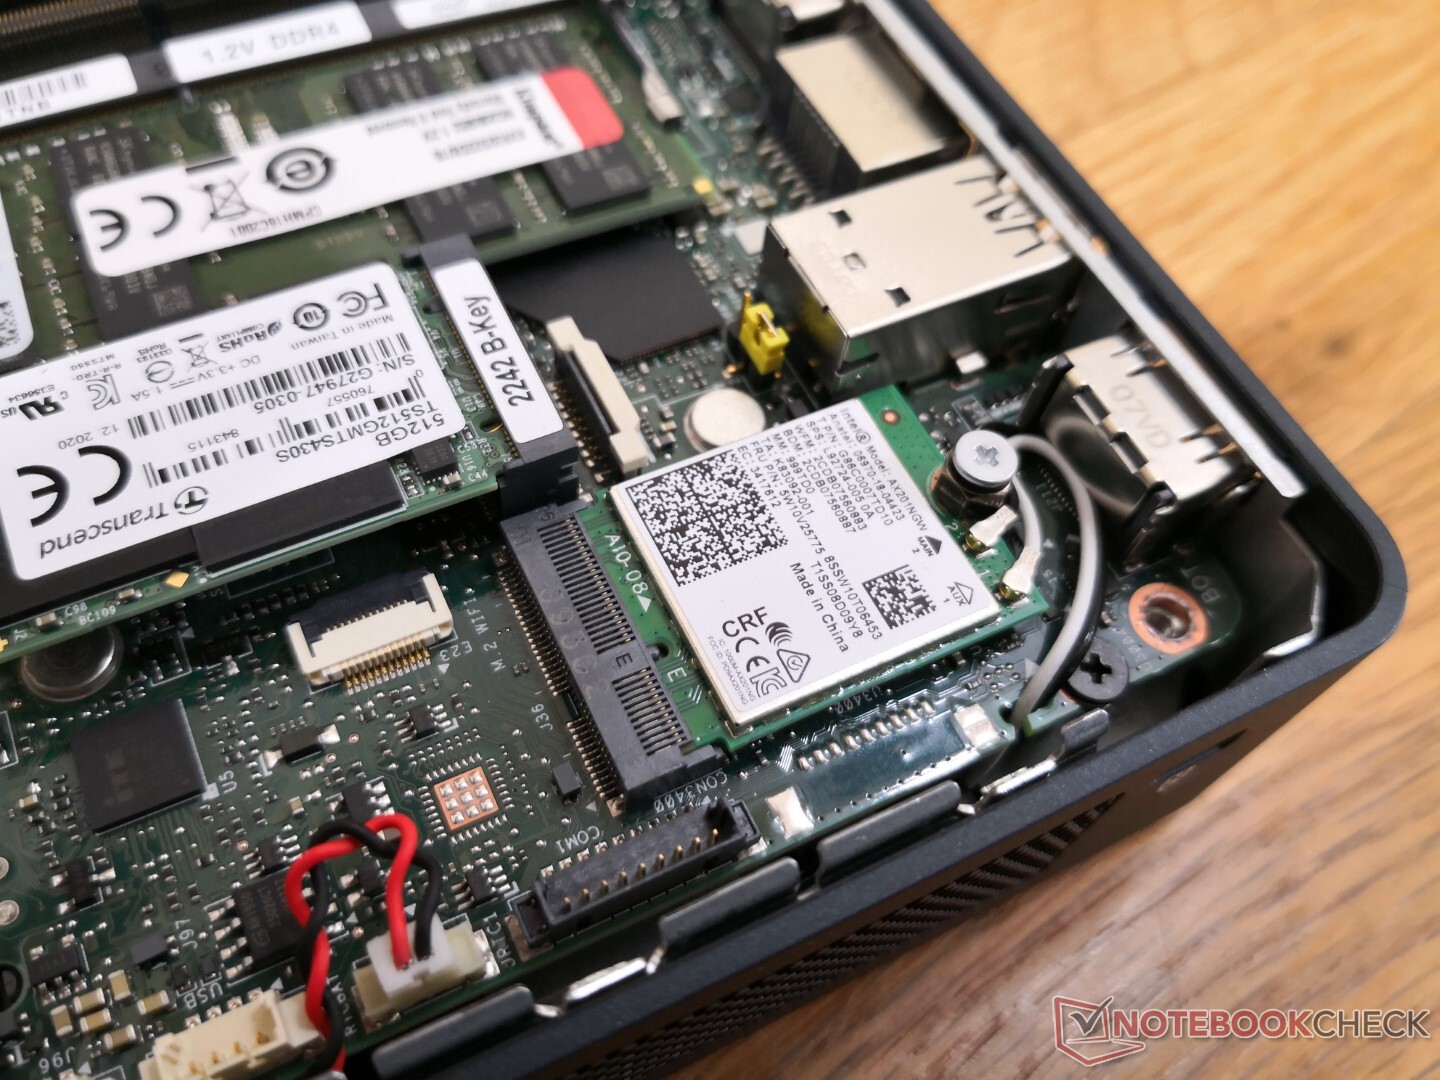
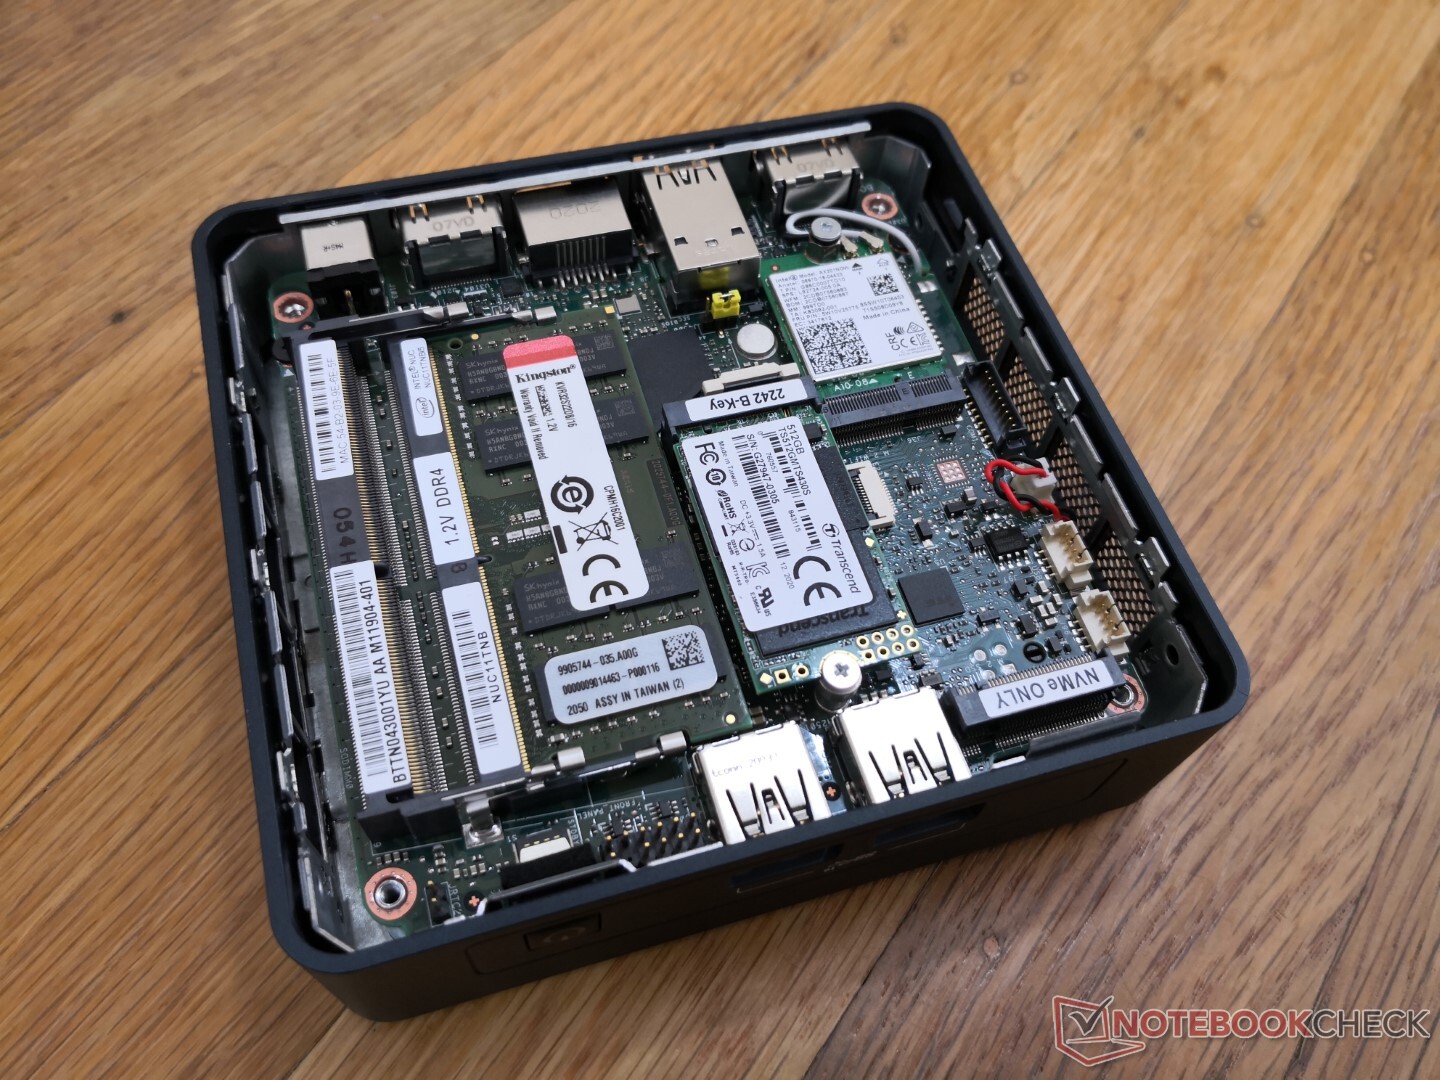
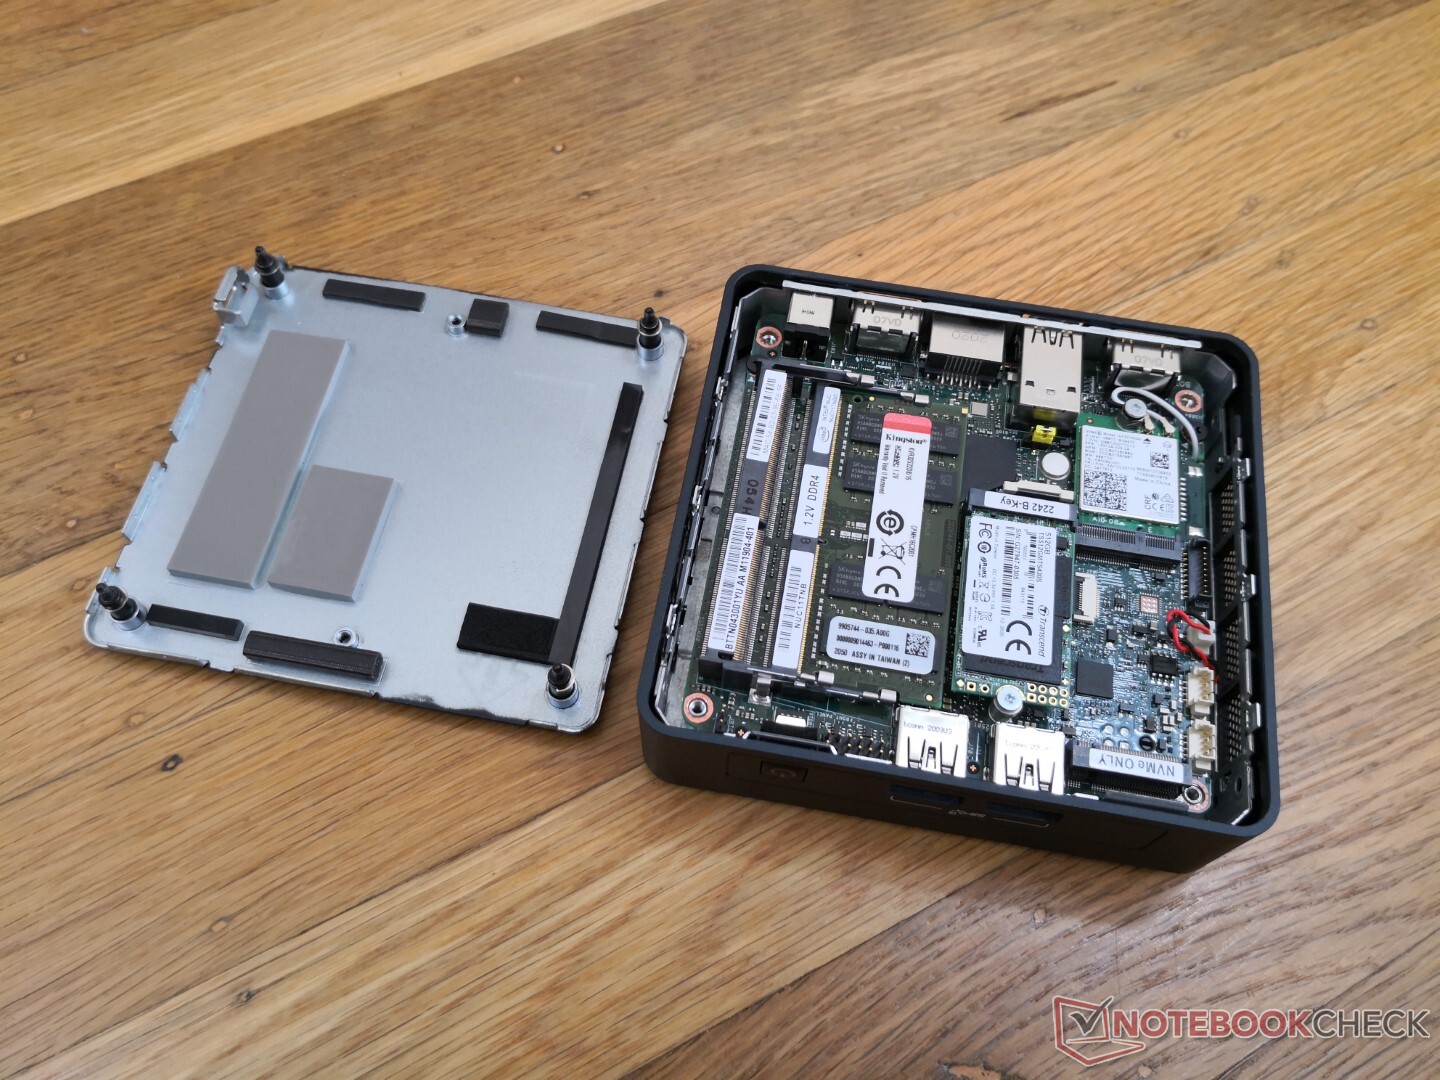
El panel inferior se retira fácilmente para exponer los componentes actualizables: 2x SODIMM, 2x almacenamiento M.2 (M.2 2242 SATA III, M.2 2280 PCIe 4), y el módulo WLAN extraíble. El SSD M.2 2280 más largo se situaría encima del módulo WLAN.
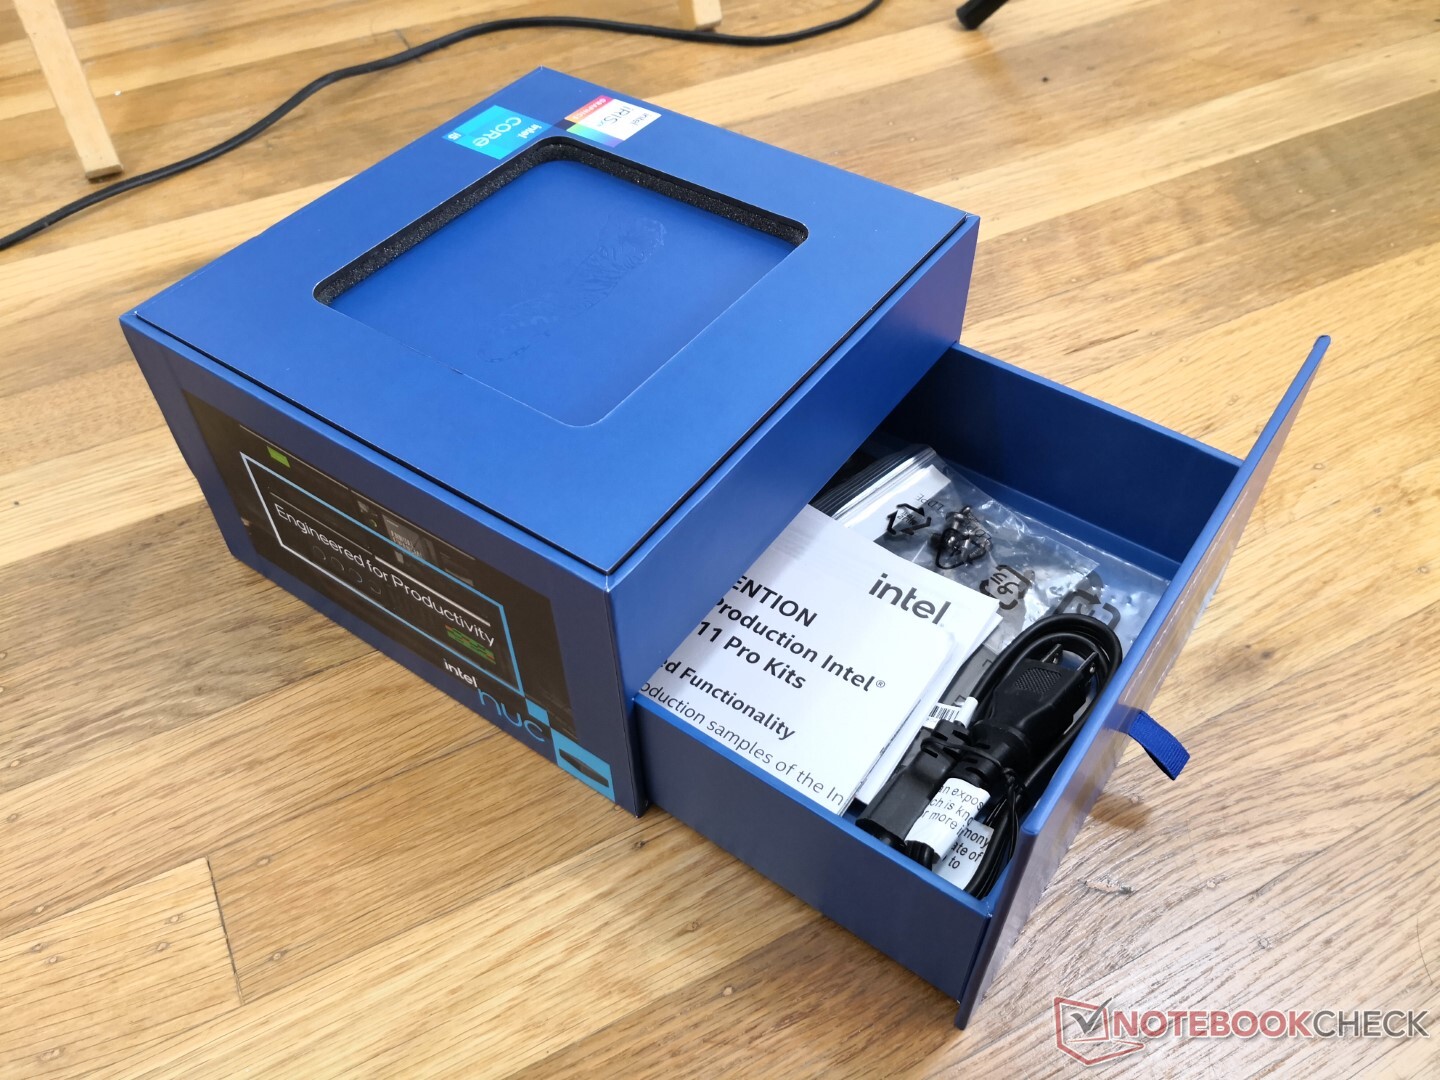
Accesorios y garantía
La caja incluye un soporte de montaje VESA extraíble y tornillos adicionales. La garantía limitada de tres años del fabricante viene de serie, dos años más que la mayoría de los otros mini PC.
Rendimiento
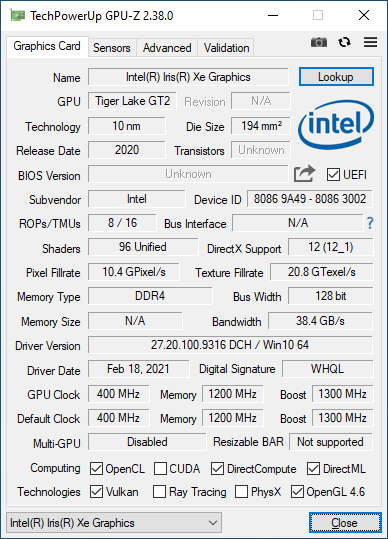
Haciendo honor a su nombre, cada mini PC de la serie NUC11 está equipado con un procesador de la 11ª generación Tiger Lake que va desde el Core i3 de la serie U hasta el Core i7. Intel vPro está disponible en el Core i5-1145G7 y i7-1185G7 mientras que las opciones no vPro son los habituales i5-1135G7 e i7-1165G7. Todos vienen con gráficos Iris Xe, excepto el de gama baja Core i3-1115G4.
No hay opciones de gráficos discretos. Los usuarios podrían considerar el NUC 11 Enthusiast si el rendimiento gráfico es una prioridad.
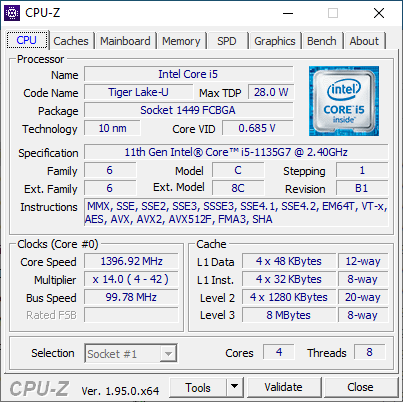
Procesador
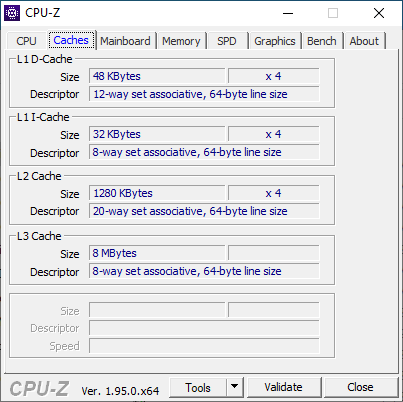
El rendimiento de la CPU está a unos pocos puntos porcentuales de la media Core i5-1135G7 De nuestra base de datos. La actualización al Core i7-1165G7, más caro, puede aumentar el rendimiento multihilo hasta en un 25 o 35 por ciento, según nuestras observaciones con elNUC11PAQi7. Cabe destacar que el Core i5-1135G7 es capaz de superar al Core i7-8809G en el antiguo Hades Canyon NUC8.
La sostenibilidad del rendimiento es mejor que en la Surface Pro 7 Plus que viene con la misma CPU. La ejecución de CineBench R15 xT en bucle revela que nuestro NUC11 mantiene puntuaciones mucho más altas a lo largo del tiempo en comparación con la tableta de Microsoft.
Cinebench R15: CPU Multi 64Bit | CPU Single 64Bit
Blender: v2.79 BMW27 CPU
7-Zip 18.03: 7z b 4 -mmt1 | 7z b 4
Geekbench 5.5: Single-Core | Multi-Core
HWBOT x265 Benchmark v2.2: 4k Preset
LibreOffice : 20 Documents To PDF
R Benchmark 2.5: Overall mean
| Cinebench R20 / CPU (Multi Core) | |
| Lenovo Yoga Slim 7-14ARE | |
| Asus VivoBook Flip 14 TM420IA | |
| Lenovo IdeaPad S540-13ARE-82DL000YGE | |
| Intel NUC11PAQi7 | |
| Intel Hades Canyon NUC8i7HVK | |
| Intel NUC11TNKi5 | |
| Lenovo Yoga 9 14 ITL 4K | |
| Medio Intel Core i5-1135G7 (979 - 2382, n=62) | |
| Intel NUC10i5FNK | |
| Microsoft Surface Pro 7 Plus | |
| GMK NucBox 2 | |
| HP Envy 13-ba0001ng | |
| Zotac ZBOX MI642 Nano | |
| Beelink SEi10 | |
| Cinebench R20 / CPU (Single Core) | |
| Intel NUC11PAQi7 | |
| Lenovo Yoga 9 14 ITL 4K | |
| Medio Intel Core i5-1135G7 (375 - 527, n=62) | |
| Intel NUC11TNKi5 | |
| Microsoft Surface Pro 7 Plus | |
| Lenovo Yoga Slim 7-14ARE | |
| Asus VivoBook Flip 14 TM420IA | |
| Lenovo IdeaPad S540-13ARE-82DL000YGE | |
| HP Envy 13-ba0001ng | |
| Intel NUC10i5FNK | |
| Zotac ZBOX MI642 Nano | |
| Intel Hades Canyon NUC8i7HVK | |
| Beelink SEi10 | |
| GMK NucBox 2 | |
| Cinebench R15 / CPU Multi 64Bit | |
| Lenovo Yoga Slim 7-14ARE | |
| Lenovo IdeaPad S540-13ARE-82DL000YGE | |
| Asus VivoBook Flip 14 TM420IA | |
| Intel NUC11PAQi7 | |
| Lenovo Yoga 9 14 ITL 4K | |
| Intel Hades Canyon NUC8i7HVK | |
| Intel NUC11TNKi5 | |
| Medio Intel Core i5-1135G7 (431 - 941, n=65) | |
| Intel NUC10i5FNK | |
| Microsoft Surface Pro 7 Plus | |
| GMK NucBox 2 | |
| HP Envy 13-ba0001ng | |
| Zotac ZBOX MI642 Nano | |
| Beelink SEi10 | |
| Cinebench R15 / CPU Single 64Bit | |
| Intel NUC11PAQi7 | |
| Lenovo Yoga 9 14 ITL 4K | |
| Intel NUC11TNKi5 | |
| Medio Intel Core i5-1135G7 (141.4 - 205, n=61) | |
| Microsoft Surface Pro 7 Plus | |
| Lenovo Yoga Slim 7-14ARE | |
| Asus VivoBook Flip 14 TM420IA | |
| Intel Hades Canyon NUC8i7HVK | |
| HP Envy 13-ba0001ng | |
| Lenovo IdeaPad S540-13ARE-82DL000YGE | |
| Intel NUC10i5FNK | |
| Zotac ZBOX MI642 Nano | |
| Beelink SEi10 | |
| GMK NucBox 2 | |
| HWBOT x265 Benchmark v2.2 / 4k Preset | |
| Lenovo Yoga Slim 7-14ARE | |
| Asus VivoBook Flip 14 TM420IA | |
| Lenovo IdeaPad S540-13ARE-82DL000YGE | |
| Intel NUC11PAQi7 | |
| Intel Hades Canyon NUC8i7HVK | |
| Intel NUC11TNKi5 | |
| Intel NUC10i5FNK | |
| Microsoft Surface Pro 7 Plus | |
| Medio Intel Core i5-1135G7 (3.57 - 7.6, n=57) | |
| Lenovo Yoga 9 14 ITL 4K | |
| GMK NucBox 2 | |
| HP Envy 13-ba0001ng | |
| Zotac ZBOX MI642 Nano | |
| Beelink SEi10 | |
| LibreOffice / 20 Documents To PDF | |
| Lenovo IdeaPad S540-13ARE-82DL000YGE | |
| Zotac ZBOX MI642 Nano | |
| GMK NucBox 2 | |
| Lenovo Yoga Slim 7-14ARE | |
| Microsoft Surface Pro 7 Plus | |
| Asus VivoBook Flip 14 TM420IA | |
| HP Envy 13-ba0001ng | |
| Beelink SEi10 | |
| Medio Intel Core i5-1135G7 (44.2 - 62.9, n=60) | |
| Lenovo Yoga 9 14 ITL 4K | |
| Intel NUC11TNKi5 | |
| Intel NUC11PAQi7 | |
| R Benchmark 2.5 / Overall mean | |
| GMK NucBox 2 | |
| Beelink SEi10 | |
| Intel NUC10i5FNK | |
| Zotac ZBOX MI642 Nano | |
| Microsoft Surface Pro 7 Plus | |
| HP Envy 13-ba0001ng | |
| Medio Intel Core i5-1135G7 (0.619 - 0.727, n=59) | |
| Lenovo IdeaPad S540-13ARE-82DL000YGE | |
| Intel NUC11TNKi5 | |
| Lenovo Yoga Slim 7-14ARE | |
| Asus VivoBook Flip 14 TM420IA | |
| Lenovo Yoga 9 14 ITL 4K | |
| Intel NUC11PAQi7 | |
Cinebench R15: CPU Multi 64Bit | CPU Single 64Bit
Blender: v2.79 BMW27 CPU
7-Zip 18.03: 7z b 4 -mmt1 | 7z b 4
Geekbench 5.5: Single-Core | Multi-Core
HWBOT x265 Benchmark v2.2: 4k Preset
LibreOffice : 20 Documents To PDF
R Benchmark 2.5: Overall mean
* ... más pequeño es mejor
Rendimiento del sistema
| PCMark 8 | |
| Home Score Accelerated v2 | |
| Medio Intel Core i5-1135G7, Intel Iris Xe Graphics G7 80EUs (3472 - 5032, n=11) | |
| Intel NUC11PAQi7 | |
| Intel NUC10i5FNK | |
| Zotac ZBOX MI642 Nano | |
| Beelink SEi10 | |
| Work Score Accelerated v2 | |
| Zotac ZBOX MI642 Nano | |
| Intel NUC10i5FNK | |
| Intel NUC11PAQi7 | |
| Medio Intel Core i5-1135G7, Intel Iris Xe Graphics G7 80EUs (2473 - 3214, n=11) | |
| Beelink SEi10 | |
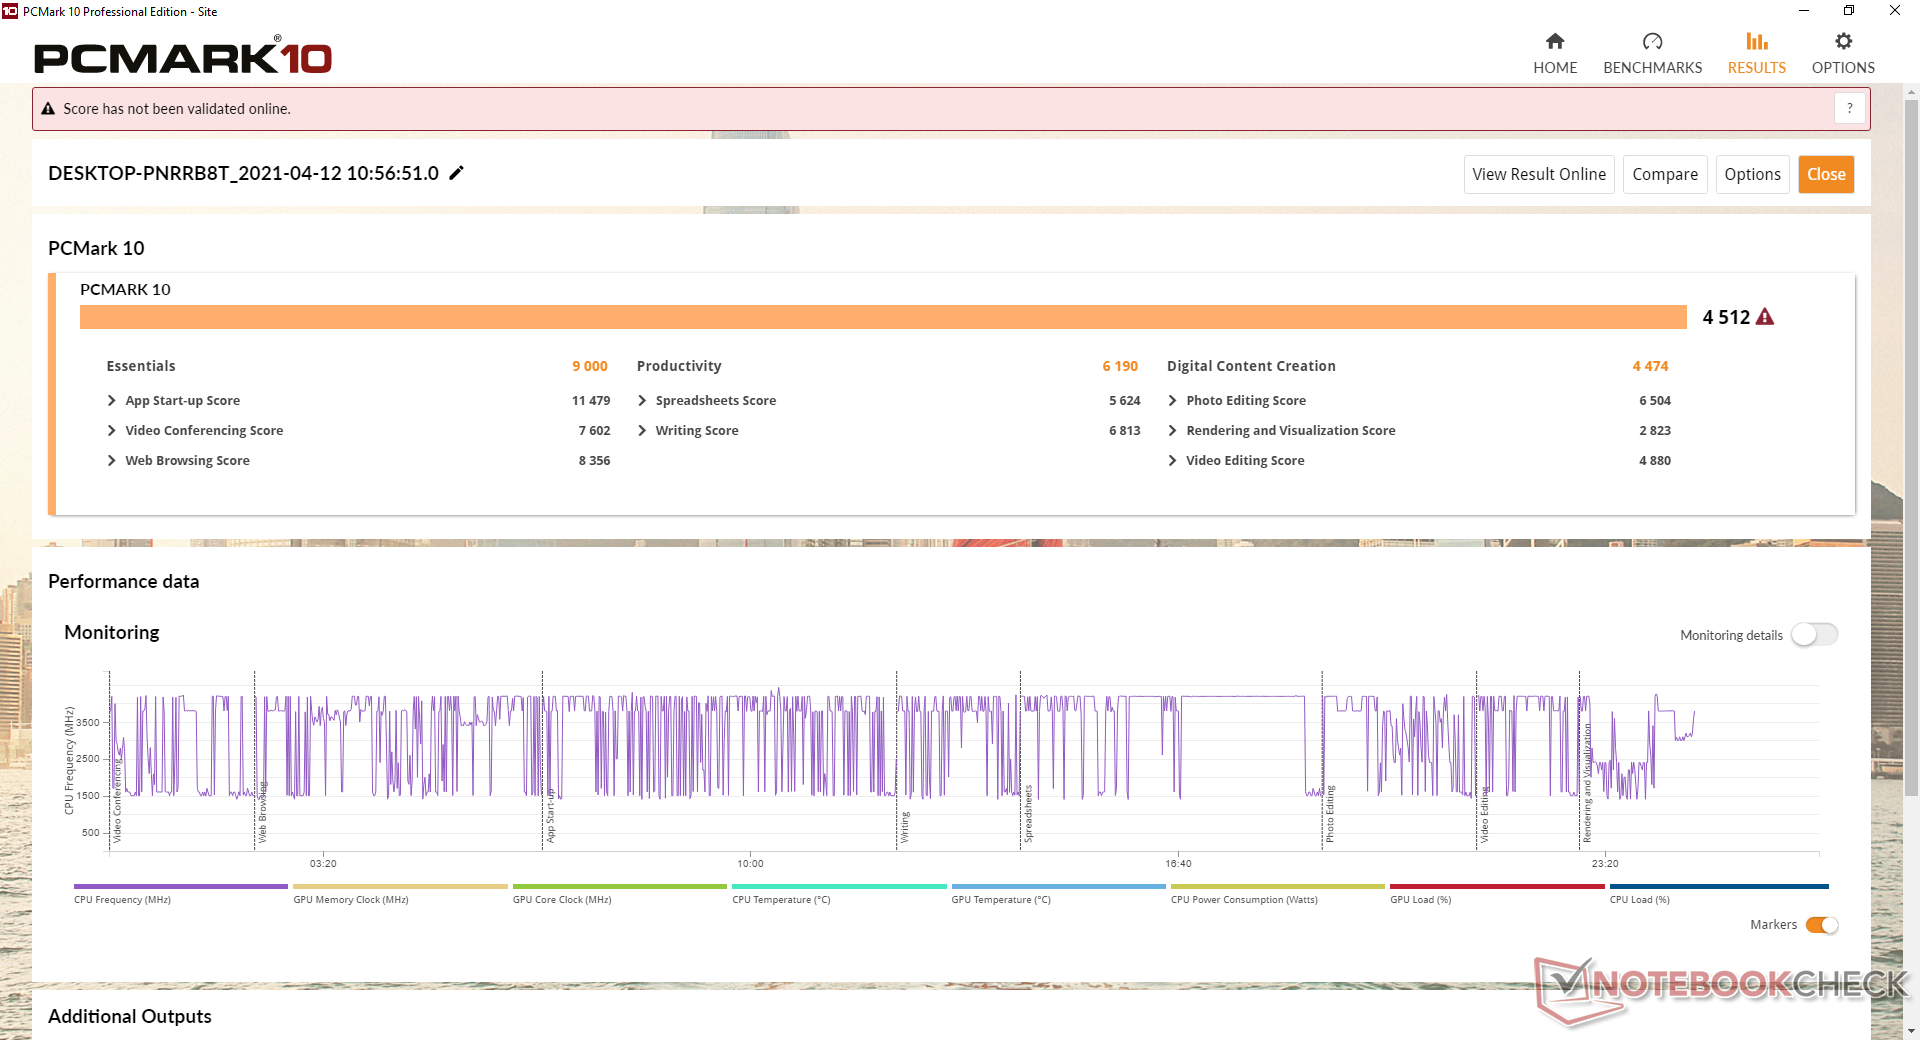
| PCMark 10 Score | 4512 puntos | |
ayuda | ||
Latencia del CPD
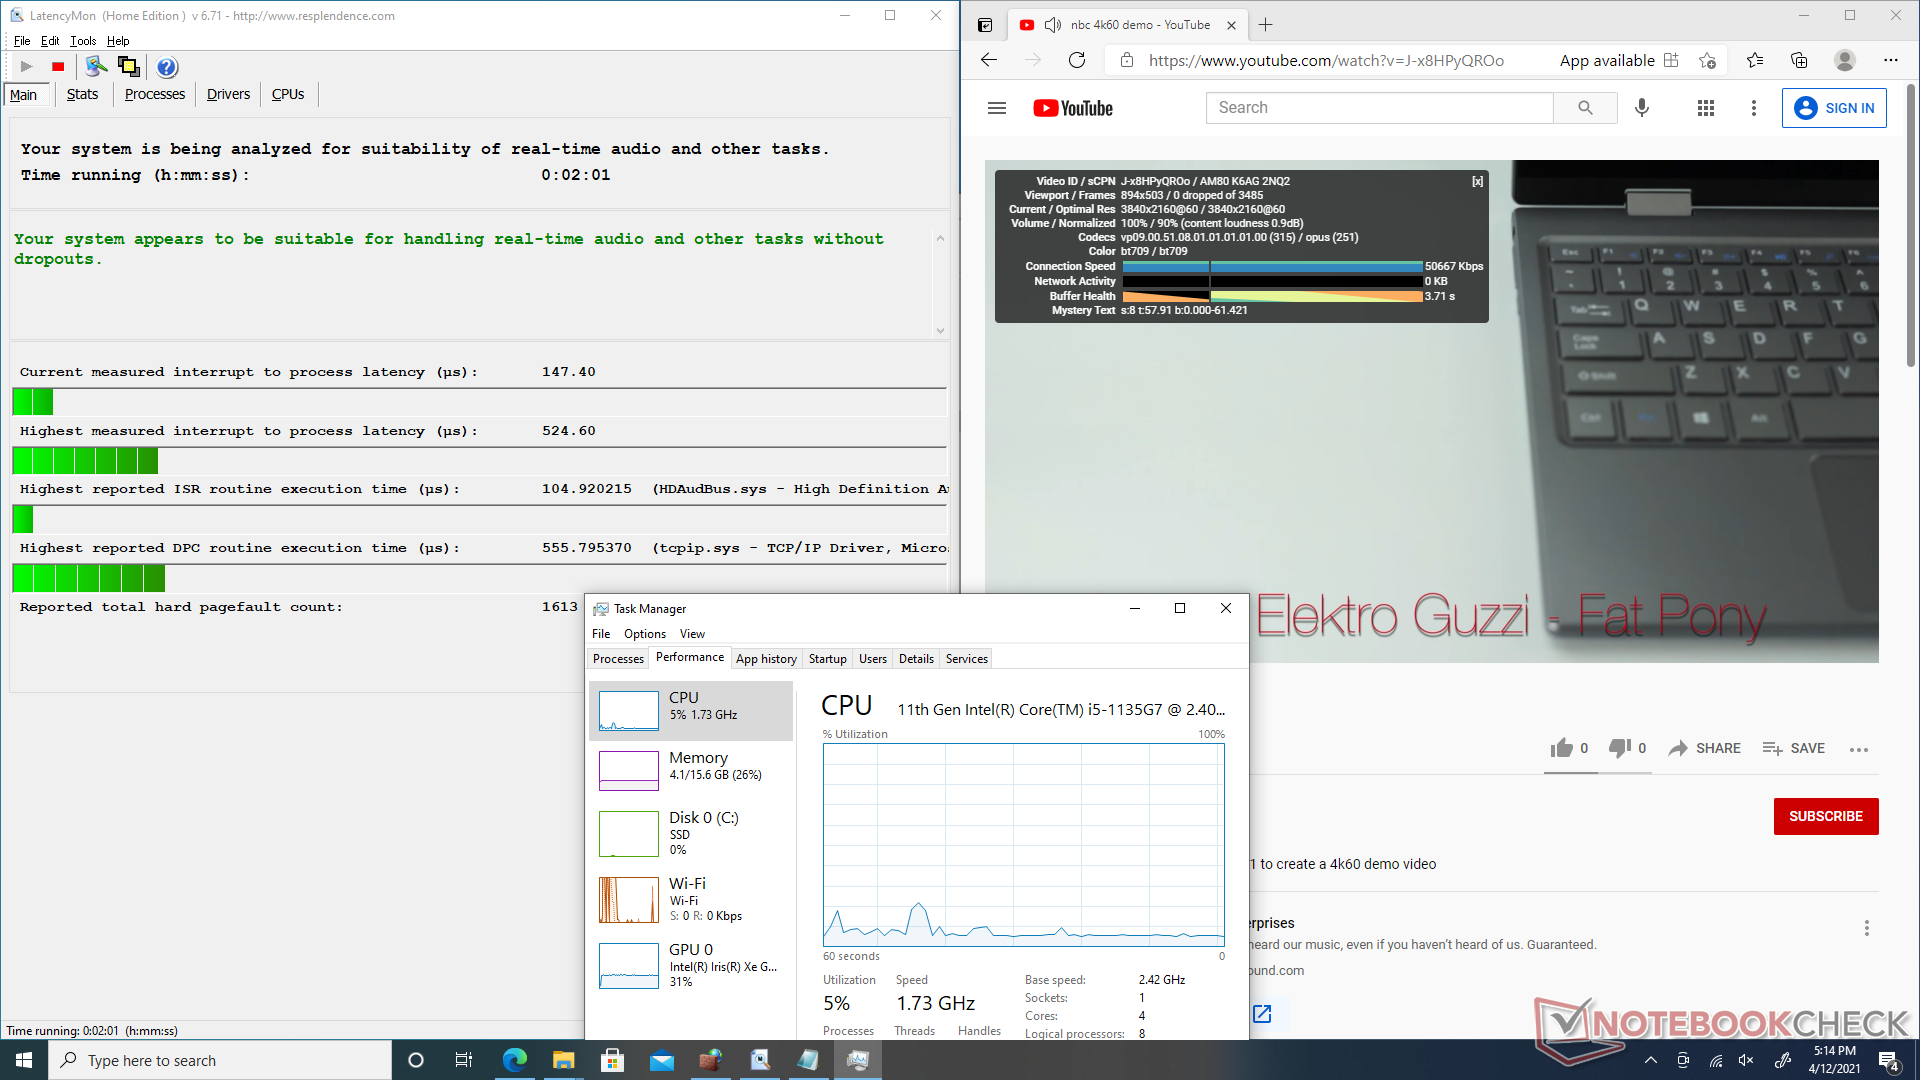
LatencyMon no muestra problemas de latencia del CPD al abrir varias pestañas en nuestra página web. La reproducción de vídeo 4K a 60 FPS también es fluida y sin caídas de frames durante nuestras pruebas.
| DPC Latencies / LatencyMon - interrupt to process latency (max), Web, Youtube, Prime95 | |
| Beelink SEi10 | |
| GMK NucBox 2 | |
| Intel NUC11PAQi7 | |
| Intel NUC11TNKi5 | |
* ... más pequeño es mejor
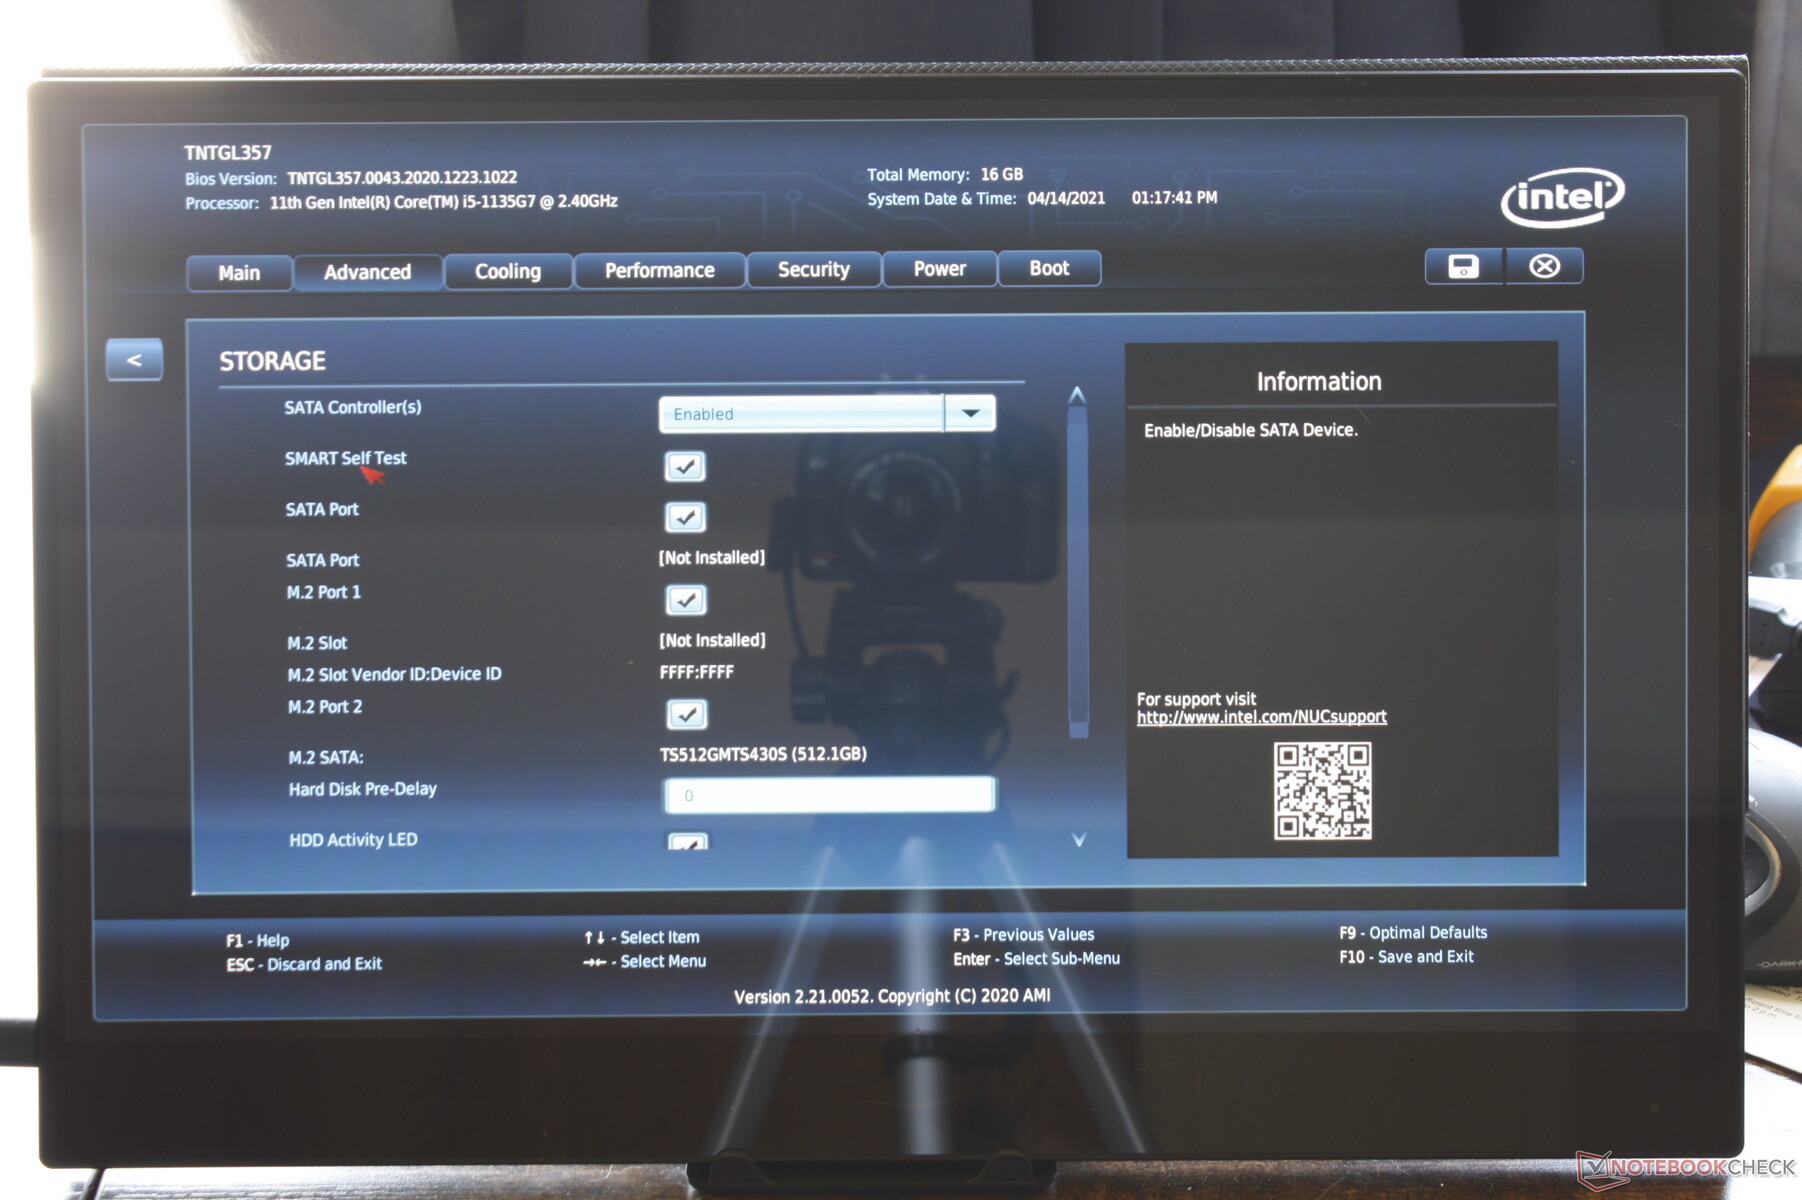
Dispositivos de almacenamiento
El NUC 11 Pro Mini tiene una configuración de almacenamiento única con sus dos ranuras M.2 asimétricas. Una de las ranuras sólo admite 2242 unidades SSD SATA III, mientras que la segunda ranura admite hasta 2280 unidades PCIe 4.0. El SSD Transcend SATA III de nuestra unidad no le hace ascos a las unidades NVMe, pero los propietarios pueden actualizarlo fácilmente si lo desean.
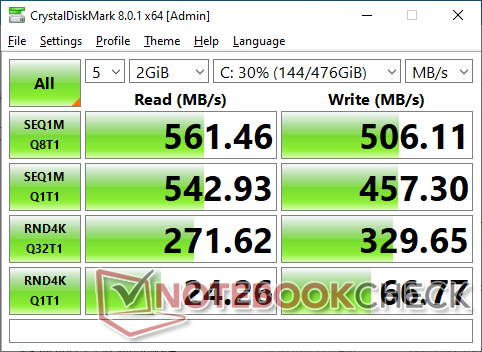
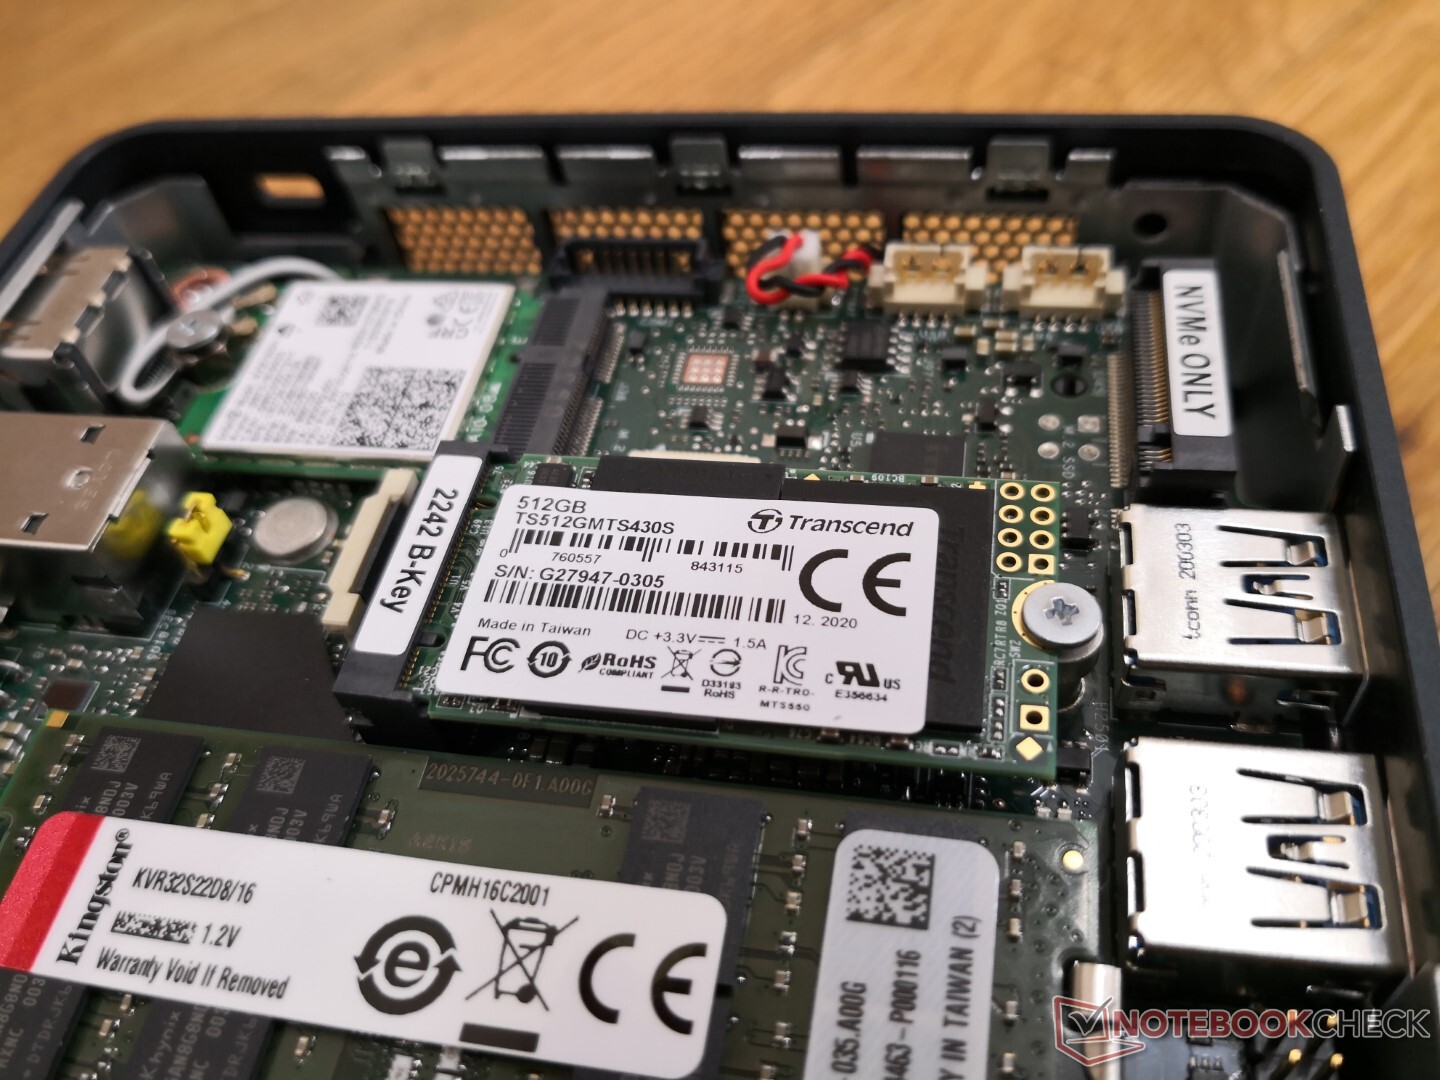
| Intel NUC11TNKi5 Transcend M.2 SSD 430S TS512GMTS430S | GMK NucBox 2 Netac S930E8/256GPN | Intel NUC11PAQi7 Samsung SSD 980 Pro 500GB MZ-V8P500BW | Beelink SEi10 Silicon Motion AZW 256G M.2280 NVMe 4X 200725 D | Zotac ZBOX MI642 Nano Western Digital WD Blue 3D WDBNCE5000PNC | |
|---|---|---|---|---|---|
| AS SSD | 91% | 434% | 17% | 18% | |
| Seq Read (MB/s) | 527 | 2069 293% | 3257 518% | 1111 111% | 507 -4% |
| Seq Write (MB/s) | 469 | 1203 157% | 3937 739% | 323.5 -31% | 413.8 -12% |
| 4K Read (MB/s) | 20.41 | 41.66 104% | 51.3 151% | 33.1 62% | 36.75 80% |
| 4K Write (MB/s) | 42.52 | 136.9 222% | 75.7 78% | 66.2 56% | 88.5 108% |
| 4K-64 Read (MB/s) | 231.4 | 366.3 58% | 2283 887% | 357.3 54% | 369.4 60% |
| 4K-64 Write (MB/s) | 285.3 | 340.5 19% | 2206 673% | 154.8 -46% | 193.7 -32% |
| Access Time Read * (ms) | 0.124 | 0.064 48% | 0.056 55% | 0.066 47% | 0.103 17% |
| Access Time Write * (ms) | 0.269 | 0.347 -29% | 0.154 43% | 0.616 -129% | 0.095 65% |
| Score Read (Points) | 304 | 615 102% | 2660 775% | 501 65% | 457 50% |
| Score Write (Points) | 375 | 598 59% | 2676 614% | 253 -33% | 324 -14% |
| Score Total (Points) | 839 | 1497 78% | 6725 702% | 983 17% | 1023 22% |
| Copy ISO MB/s (MB/s) | 490.9 | 1186 142% | 2030 314% | 1160 136% | 482.5 -2% |
| Copy Program MB/s (MB/s) | 415.9 | 428.6 3% | 883 112% | 121.1 -71% | 191.9 -54% |
| Copy Game MB/s (MB/s) | 352.3 | 435.7 24% | 1817 416% | 364.4 3% | 248.9 -29% |
| CrystalDiskMark 5.2 / 6 | 149% | 533% | 146% | 23% | |
| Write 4K (MB/s) | 65.9 | 178.4 171% | 244.6 271% | 203 208% | 105.9 61% |
| Read 4K (MB/s) | 24.27 | 61 151% | 80.4 231% | 63.2 160% | 39.15 61% |
| Write Seq (MB/s) | 456.4 | 1040 128% | 4094 797% | 1114 144% | |
| Read Seq (MB/s) | 542 | 1919 254% | 4099 656% | 1765 226% | |
| Write 4K Q32T1 (MB/s) | 331.3 | 417.7 26% | 715 116% | 423.9 28% | 320.5 -3% |
| Read 4K Q32T1 (MB/s) | 295 | 325.6 10% | 783 165% | 389.2 32% | 342.1 16% |
| Write Seq Q32T1 (MB/s) | 506 | 1144 126% | 5065 901% | 1104 118% | 514 2% |
| Read Seq Q32T1 (MB/s) | 562 | 2379 323% | 6884 1125% | 1990 254% | 554 -1% |
| Write 4K Q8T8 (MB/s) | 330.8 | ||||
| Read 4K Q8T8 (MB/s) | 391.8 | ||||
| Media total (Programa/Opciones) | 120% /
112% | 484% /
470% | 82% /
64% | 21% /
20% |
* ... más pequeño es mejor

Disk Throttling: DiskSpd Read Loop, Queue Depth 8
Rendimiento de la GPU
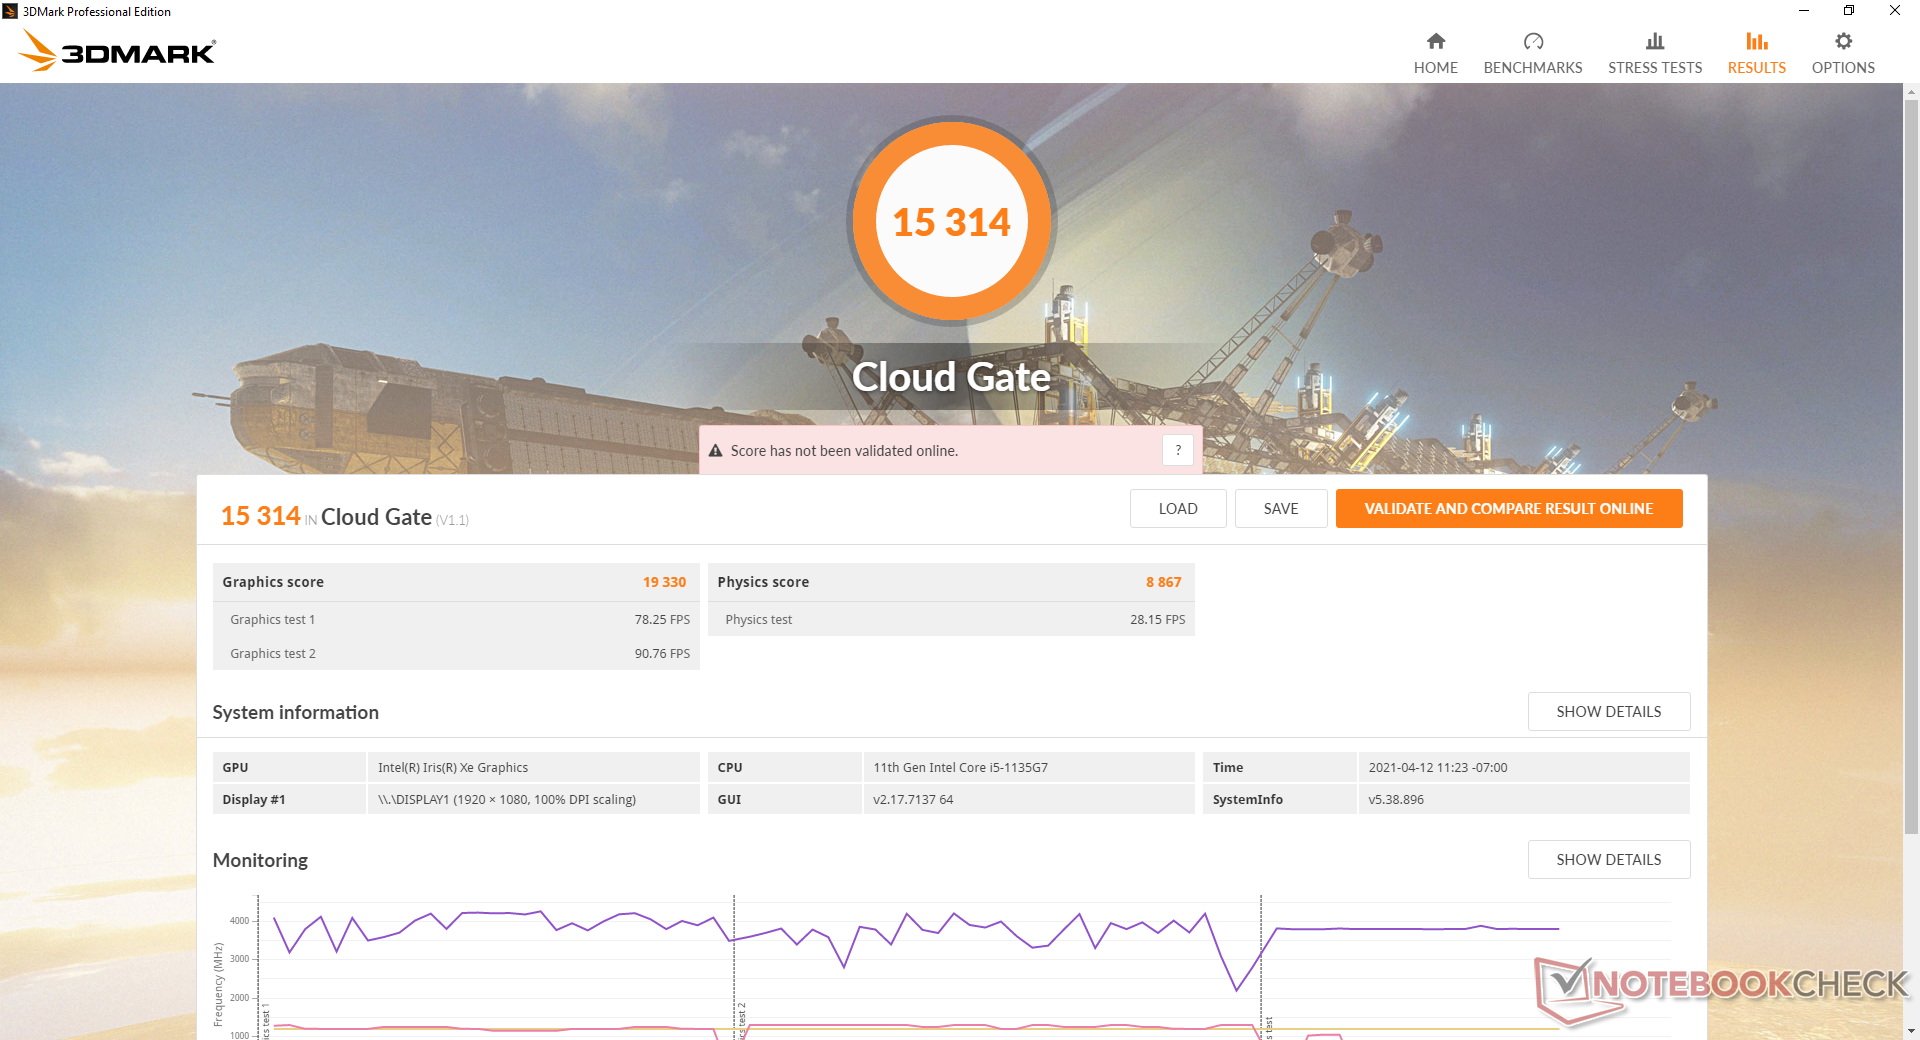
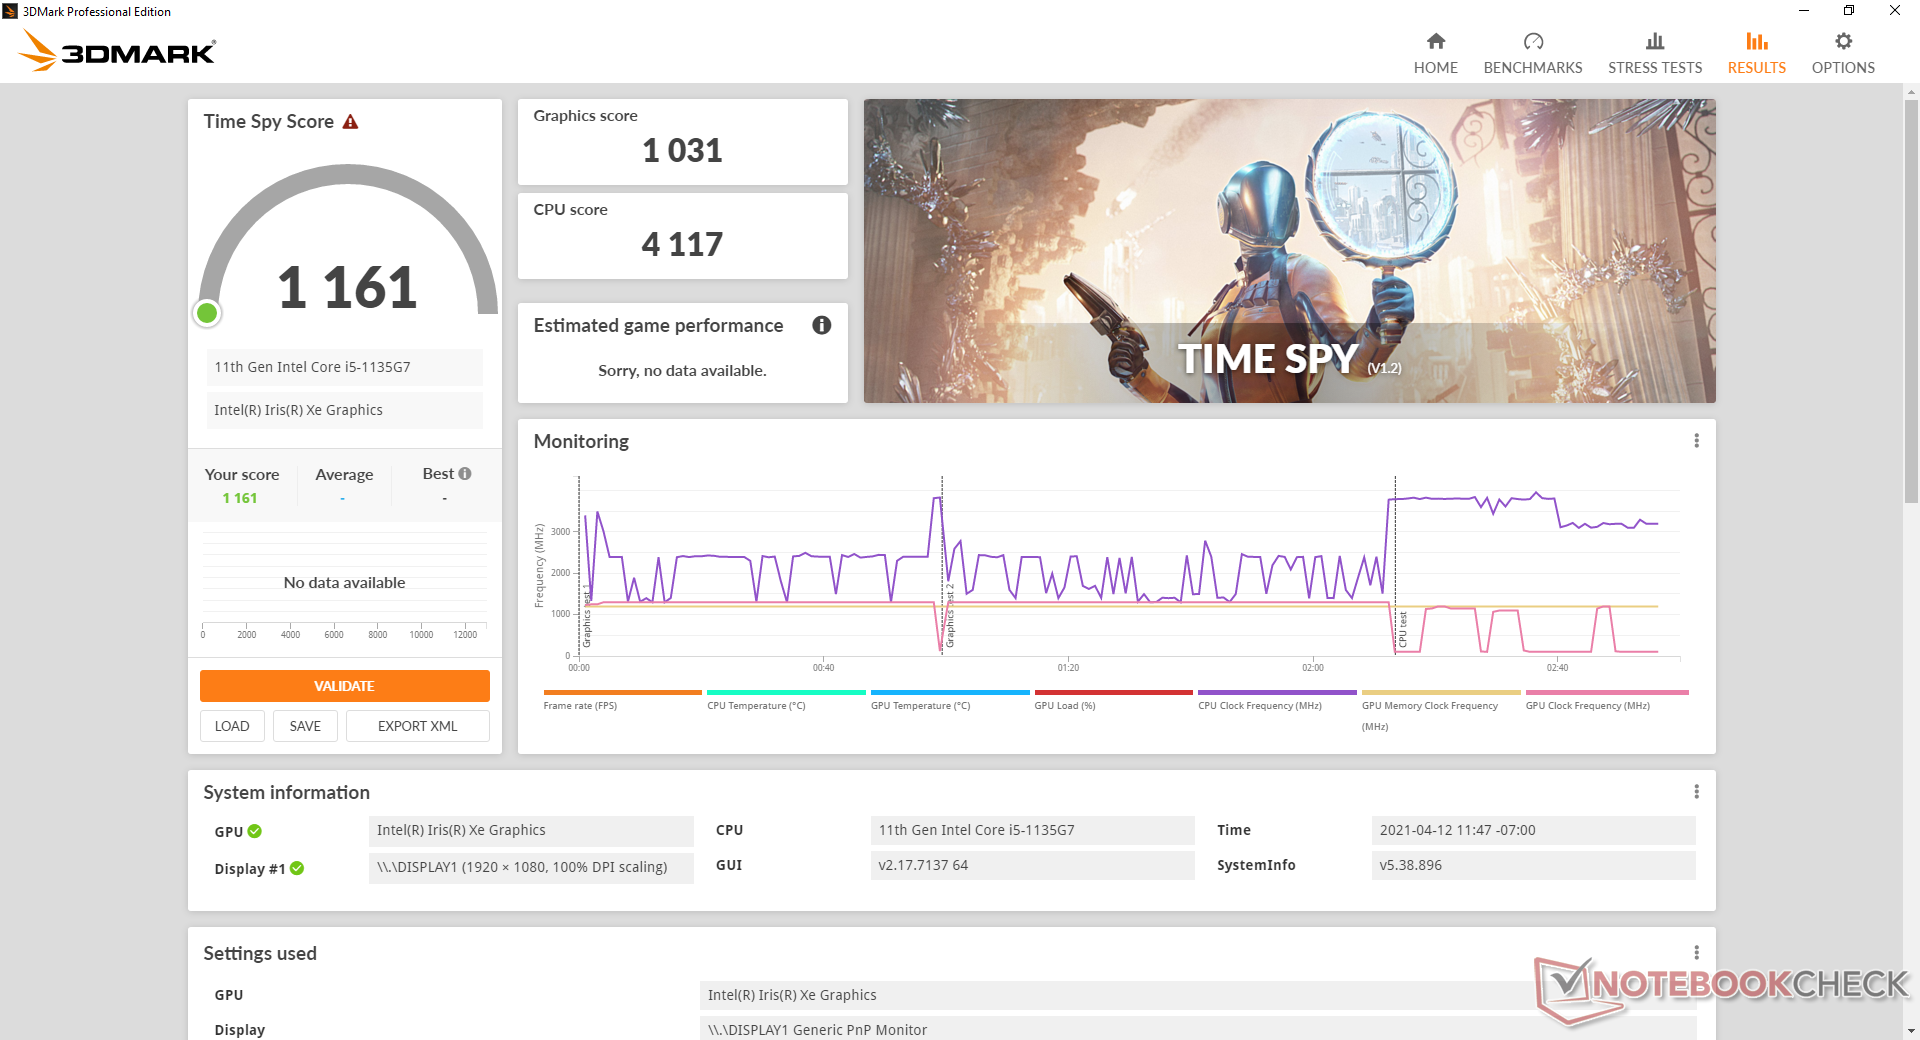
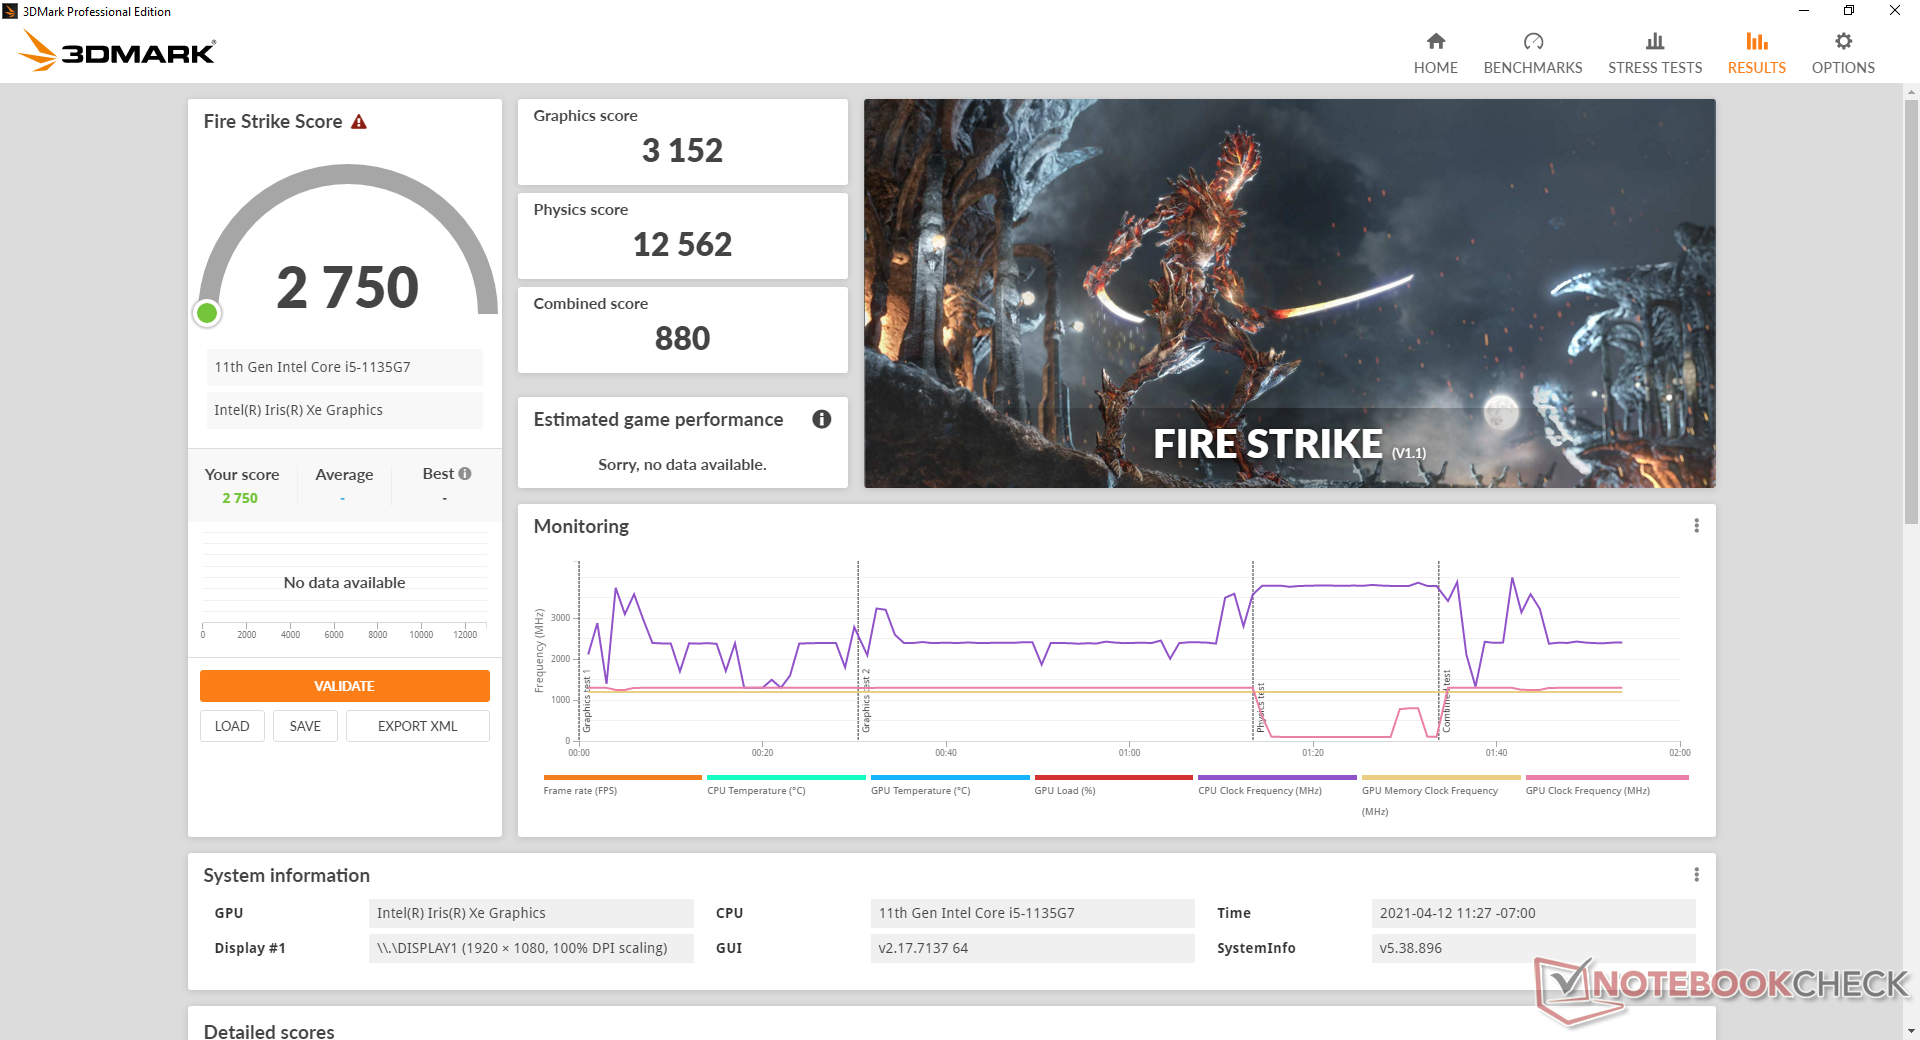
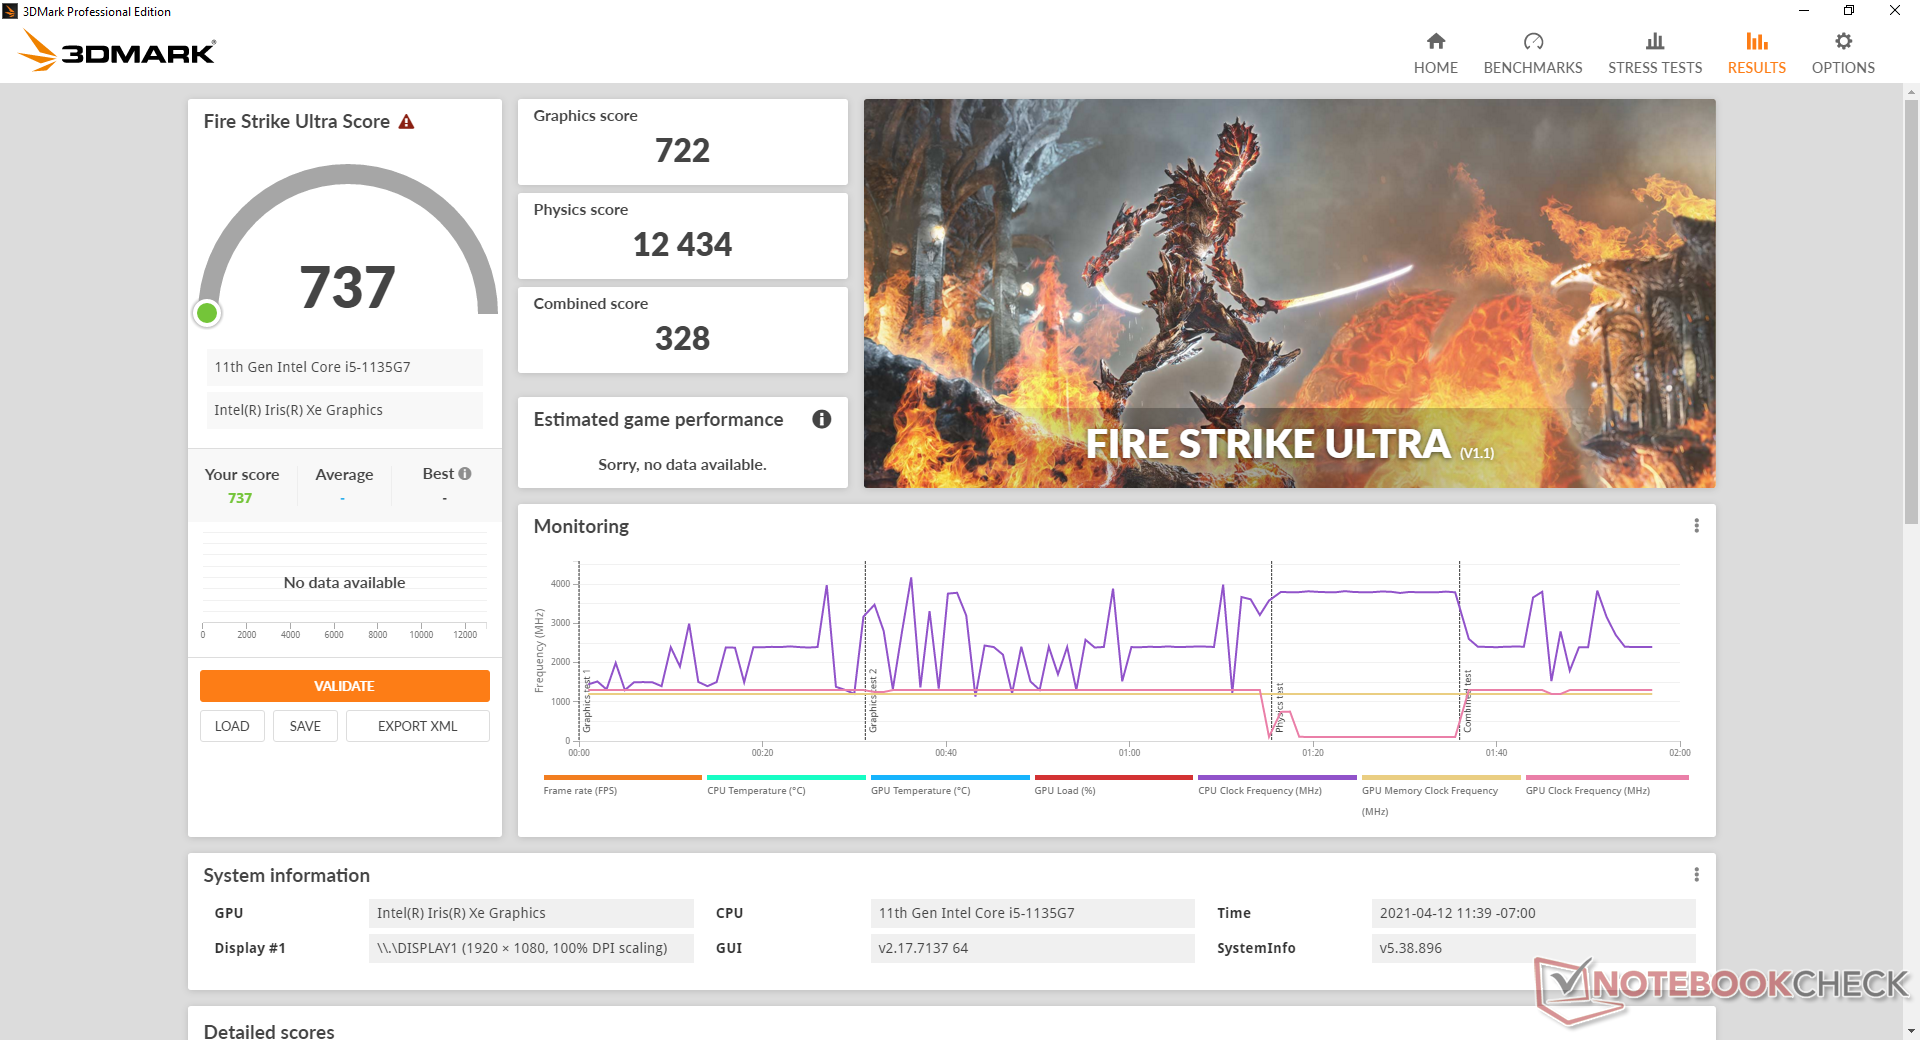
Las puntuaciones de 3DMark son un 10 por ciento más lentas que la mediaIris Xe Graphics G7 80EUs en nuestra base de datos, probablemente debido a la configuración de RAM de un solo canal de nuestra unidad de preproducción. La actualización a la opción Core i7-1165G7 con la más rápida Iris Xe 96EUs aumentará el rendimiento de la GPU en al menos un 30 por ciento.
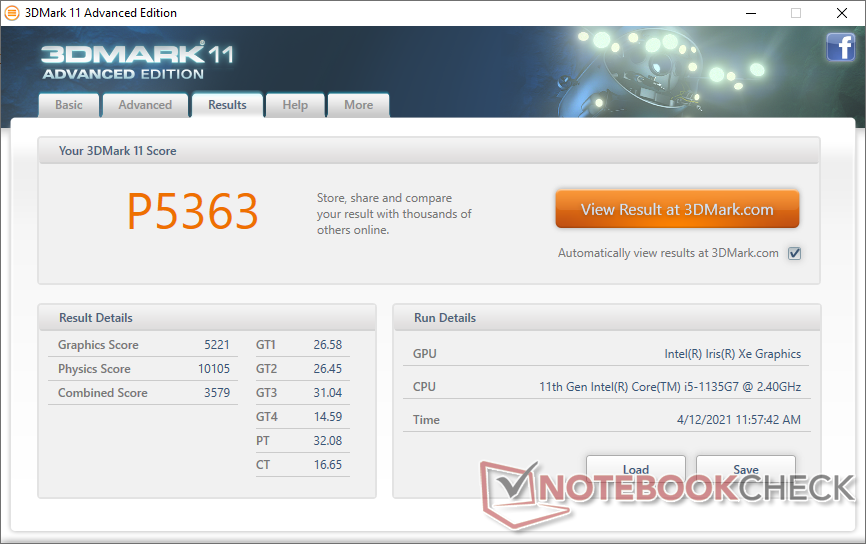
| 3DMark 11 Performance | 5363 puntos | |
| 3DMark Cloud Gate Standard Score | 15314 puntos | |
| 3DMark Fire Strike Score | 2750 puntos | |
| 3DMark Time Spy Score | 1161 puntos | |
ayuda | ||
| bajo | medio | alto | ultra | |
|---|---|---|---|---|
| The Witcher 3 (2015) | 59.8 | |||
| Dota 2 Reborn (2015) | 73.8 | 56 | 34.2 | 31.4 |
| Final Fantasy XV Benchmark (2018) | 26.8 | 13.7 | 10.5 | |
| X-Plane 11.11 (2018) | 37.1 | 27.3 | 29.1 |
Emissions
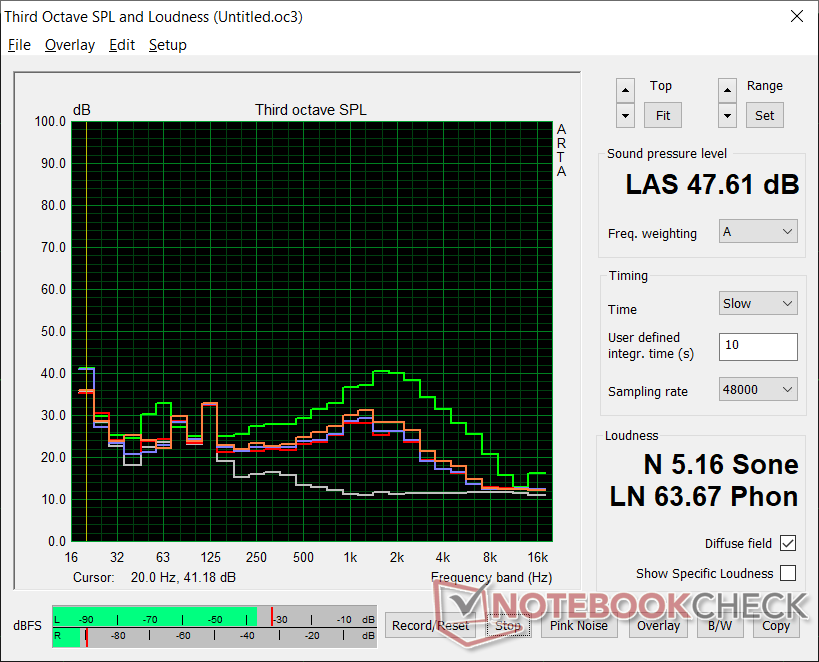
Ruido del sistema
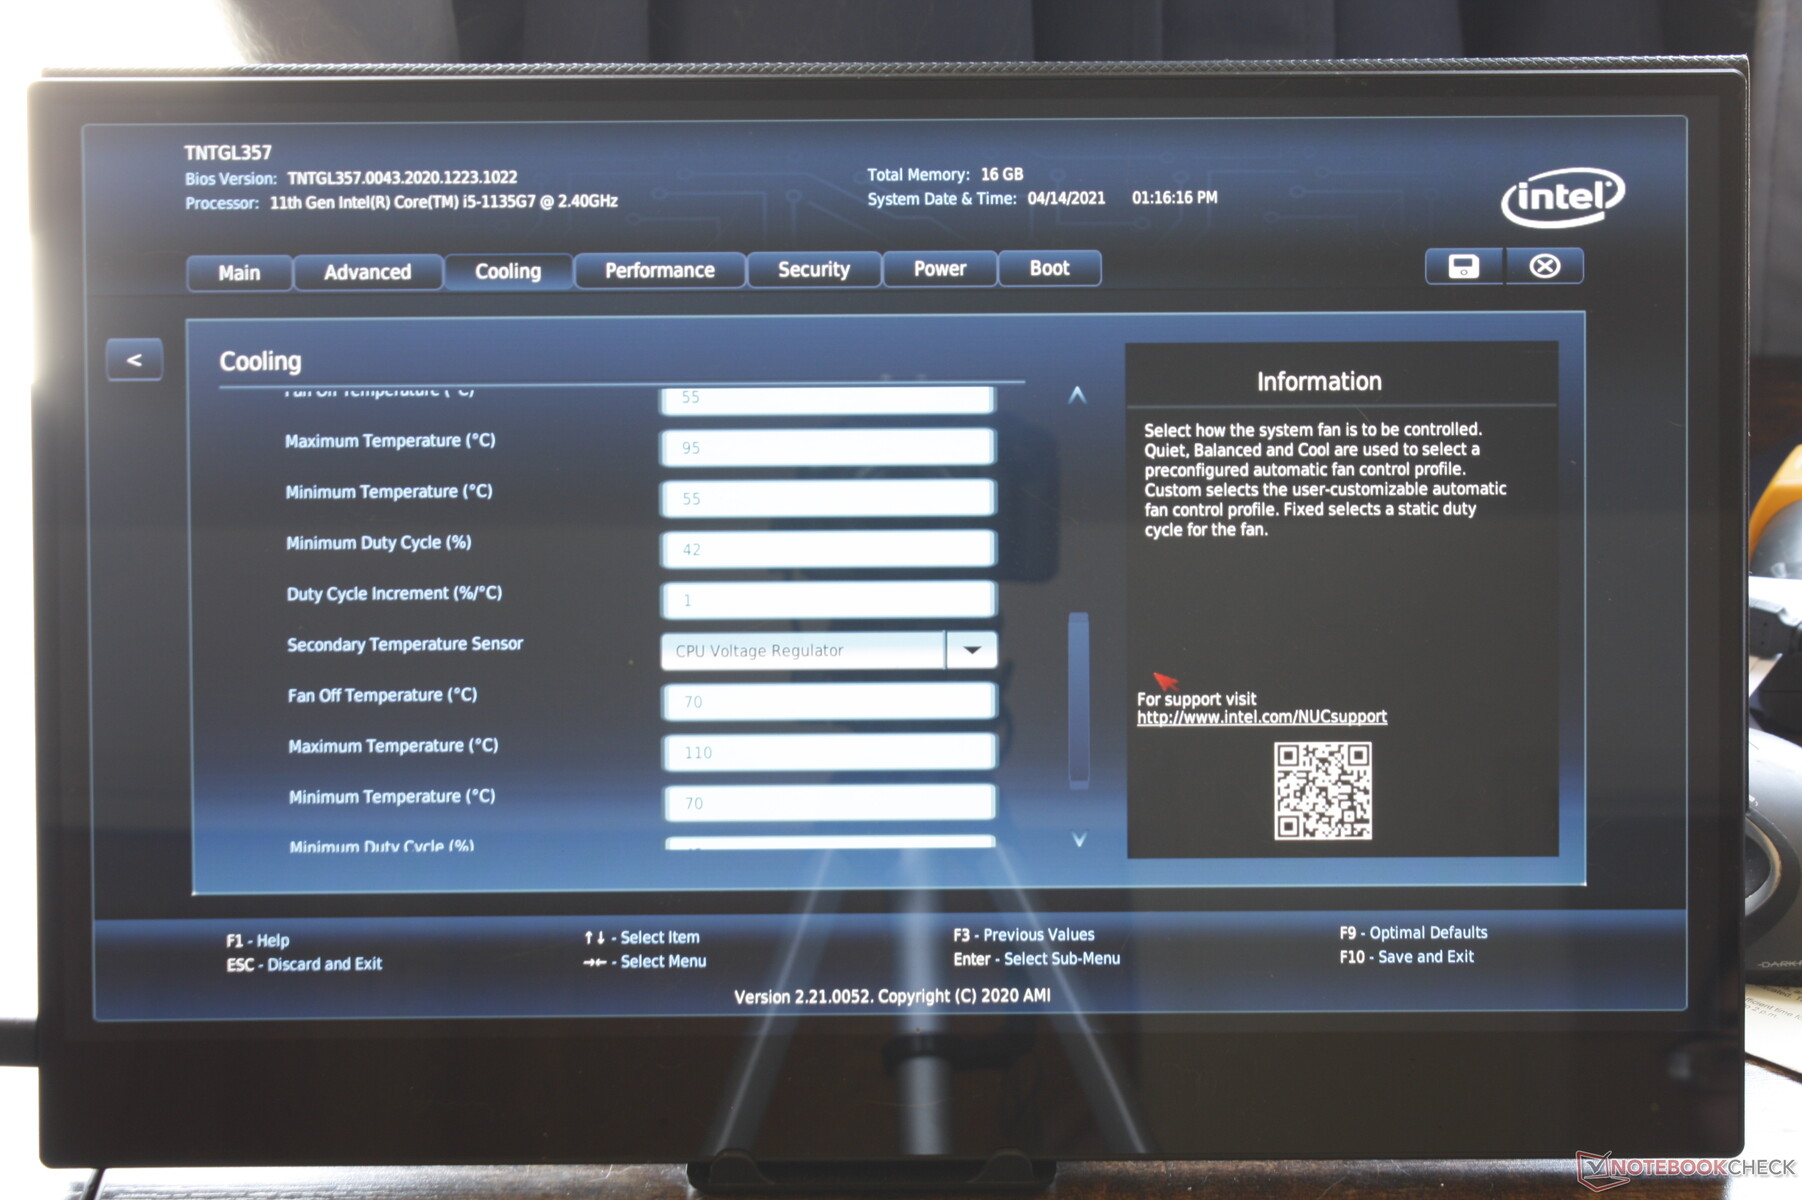
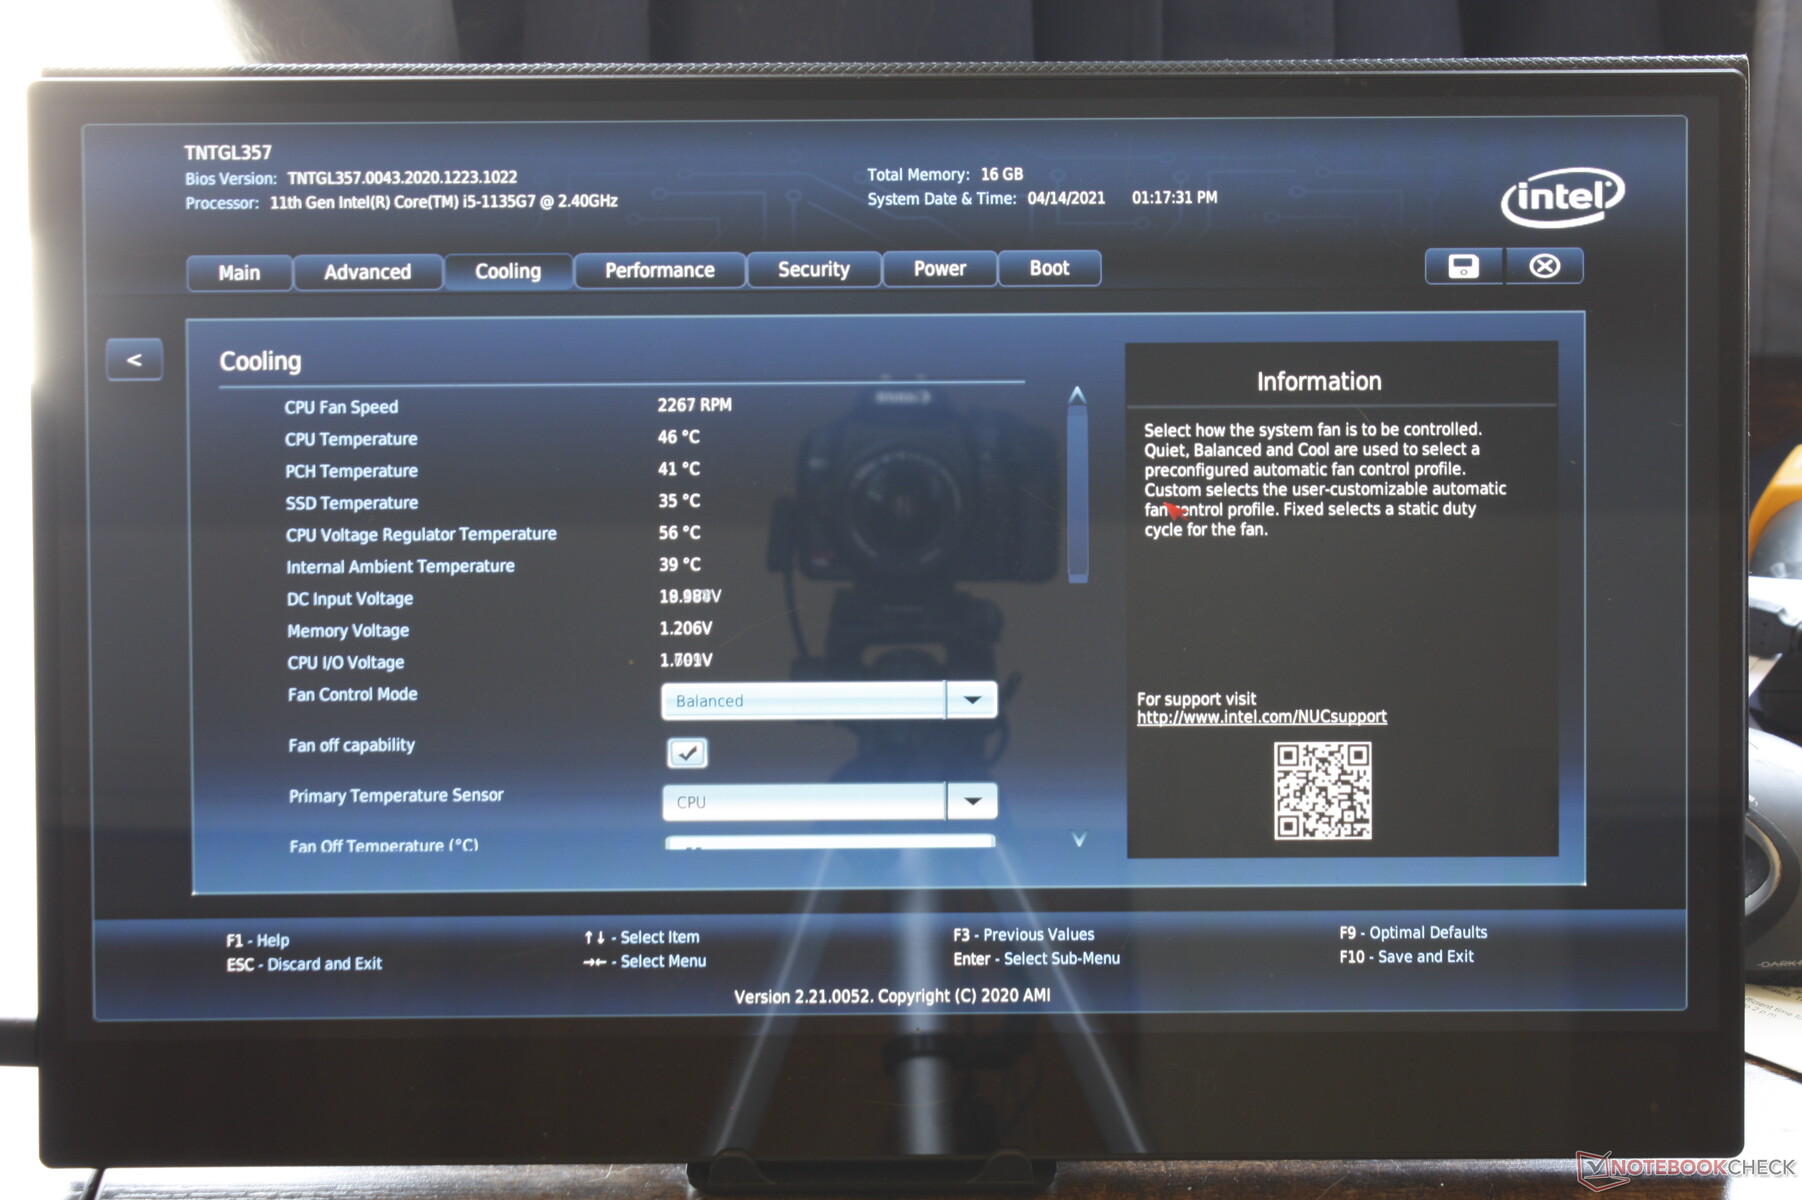
El ventilador interno rara vez funciona en vacío, incluso cuando el sistema está en reposo en el escritorio. Hemos podido registrar un ruido constante del ventilador de 35,6 dB(A) contra un fondo silencioso de 24,8 dB(A) cuando se navega por la web para ser más ruidoso que la mayoría de otros mini PC en condiciones similares. Los cambios de RPM son graduales, por lo que no hay problemas de pulsaciones, pero los usuarios deben esperar un ruido de ventilador superior a la media cuando se ejecuta la mayoría de las cargas. La BIOS permite establecer umbrales de temperatura más específicos para el control del ruido del ventilador.
| Intel NUC11TNKi5 | GMK NucBox 2 | Intel NUC11PAQi7 | Beelink SEi10 | Zotac ZBOX MI642 Nano | Intel NUC8i7BE | |
|---|---|---|---|---|---|---|
| Noise | 18% | 12% | 0% | 1% | 5% | |
| apagado / medio ambiente * (dB) | 24.8 | 25.6 -3% | 25.6 -3% | 27.5 -11% | 27.8 -12% | 28.7 -16% |
| Idle Minimum * (dB) | 35.6 | 25.7 28% | 25.6 28% | 30.9 13% | 27.8 22% | 28.7 19% |
| Idle Average * (dB) | 35.6 | 25.7 28% | 25.6 28% | 33.5 6% | 33.9 5% | 29.3 18% |
| Idle Maximum * (dB) | 35.6 | 25.7 28% | 25.6 28% | 33.5 6% | 33.9 5% | 31.8 11% |
| Load Average * (dB) | 36.2 | 35.3 2% | 33.6 7% | 38.5 -6% | 43.7 -21% | 39 -8% |
| Witcher 3 ultra * (dB) | 38 | 33.6 12% | 39 -3% | |||
| Load Maximum * (dB) | 47.6 | 35.1 26% | 54.5 -14% | 51.6 -8% | 43.7 8% | 41.4 13% |
* ... más pequeño es mejor
Ruido
| Ocioso |
| 35.6 / 35.6 / 35.6 dB(A) |
| Carga |
| 36.2 / 47.6 dB(A) |
 | ||
30 dB silencioso 40 dB(A) audible 50 dB(A) ruidosamente alto |
||
min: | ||
Temperatura
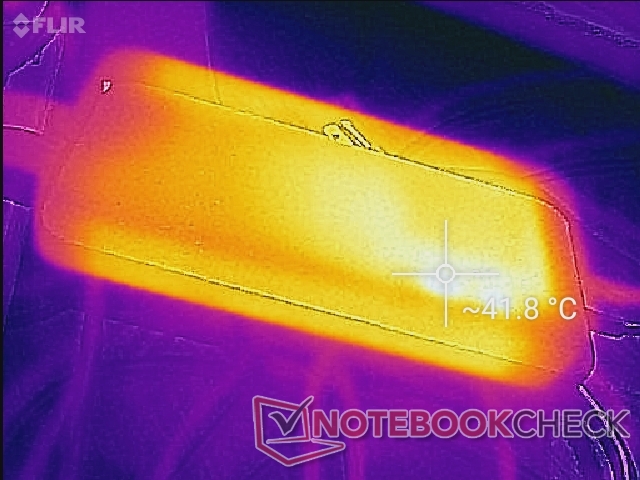
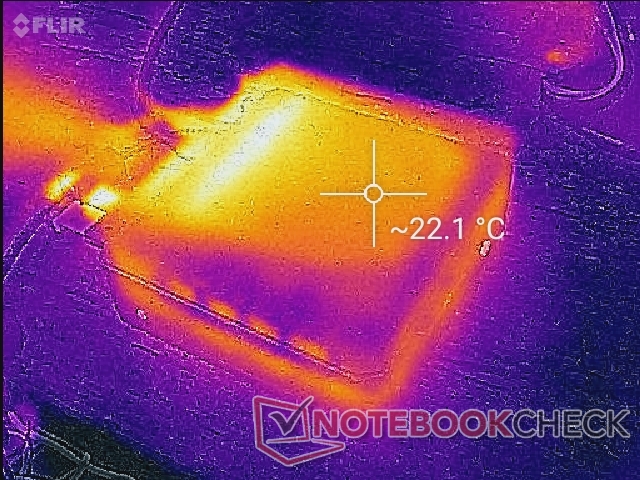
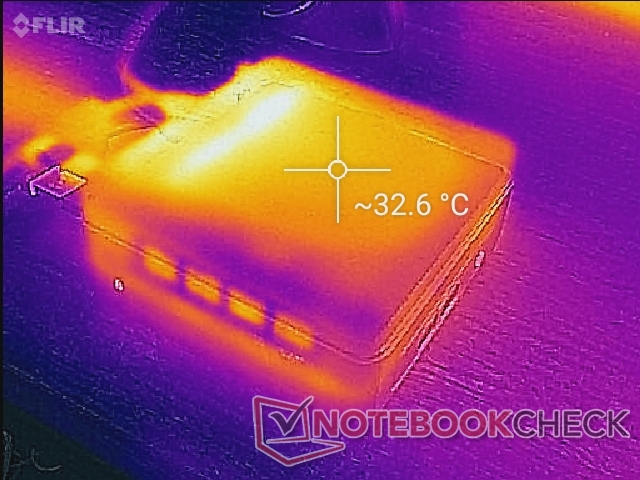
La temperatura de la superficie oscila entre 22 C y 27 C en reposo y 43 C cuando se ejecutan cargas de procesamiento extremas. El aire fresco se extrae de los lados, lo que significa que la ventilación estará parcialmente bloqueada si el NUC se coloca en posición vertical.
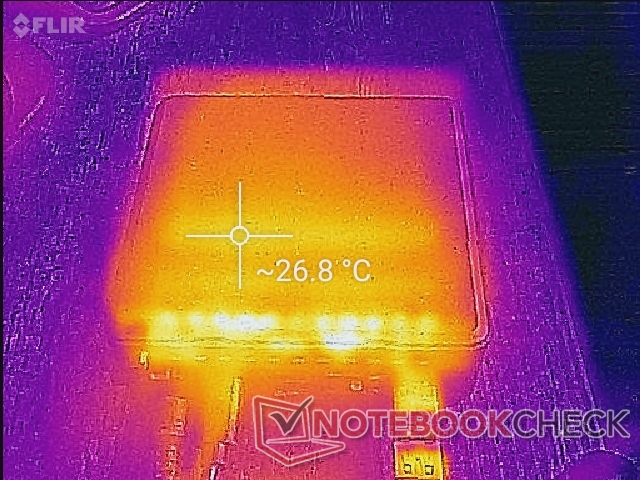
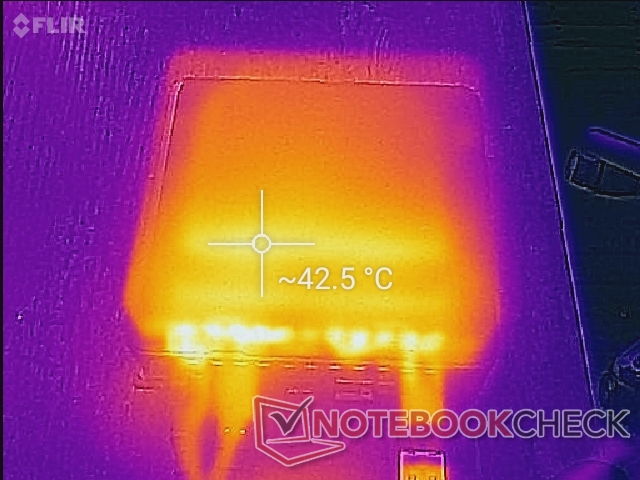
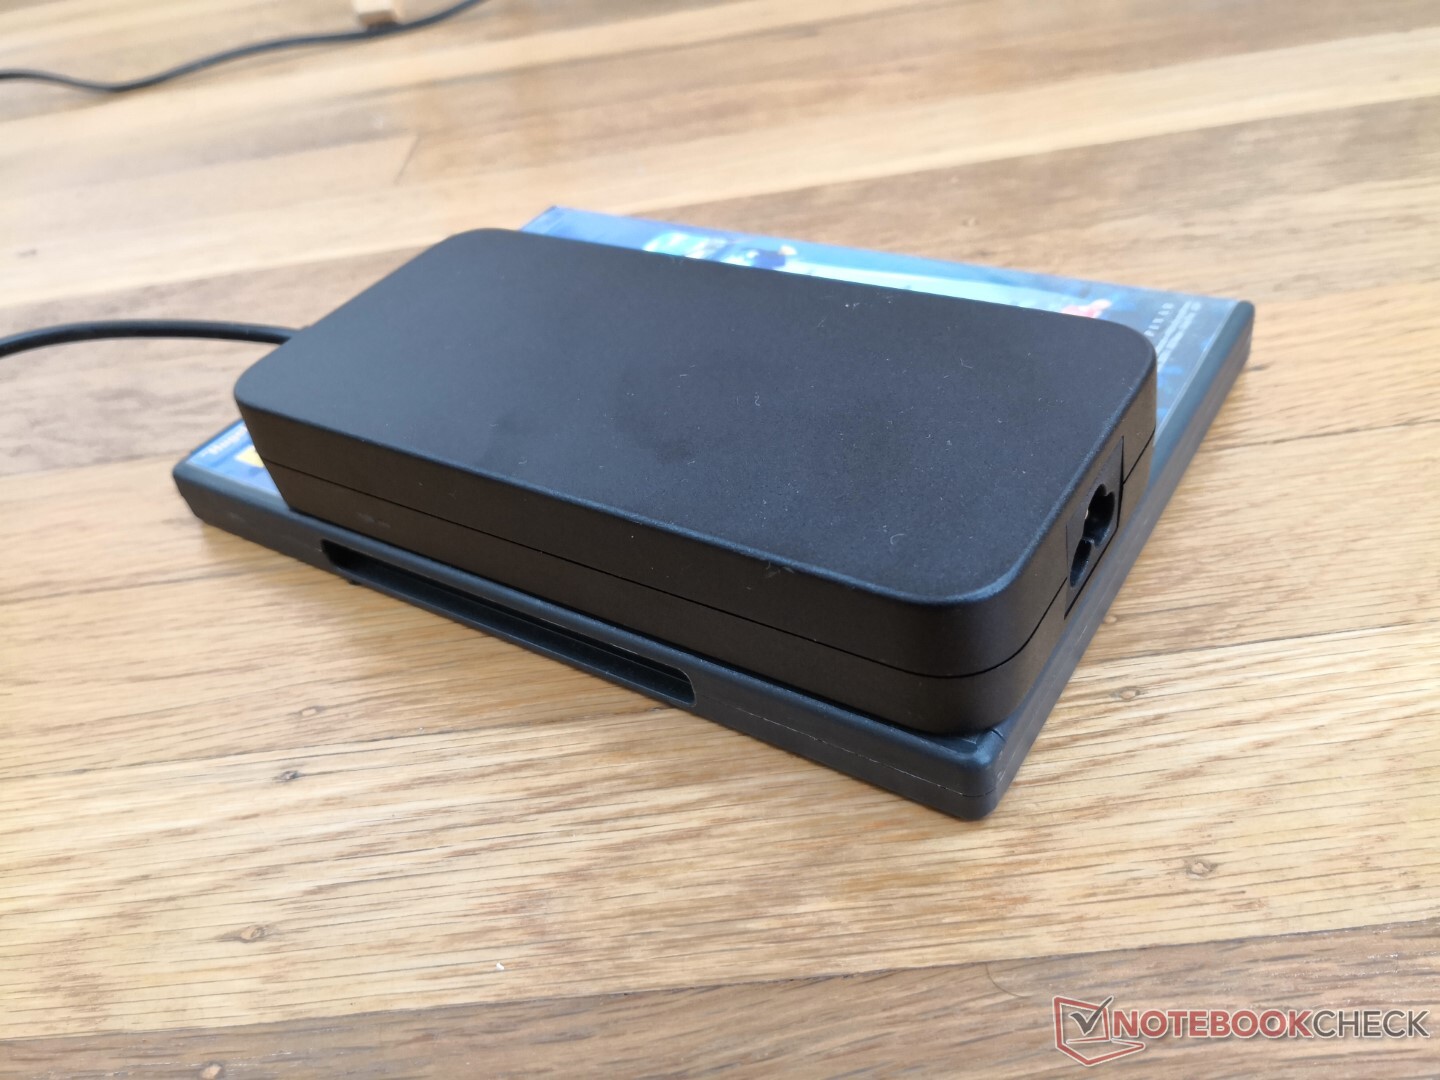
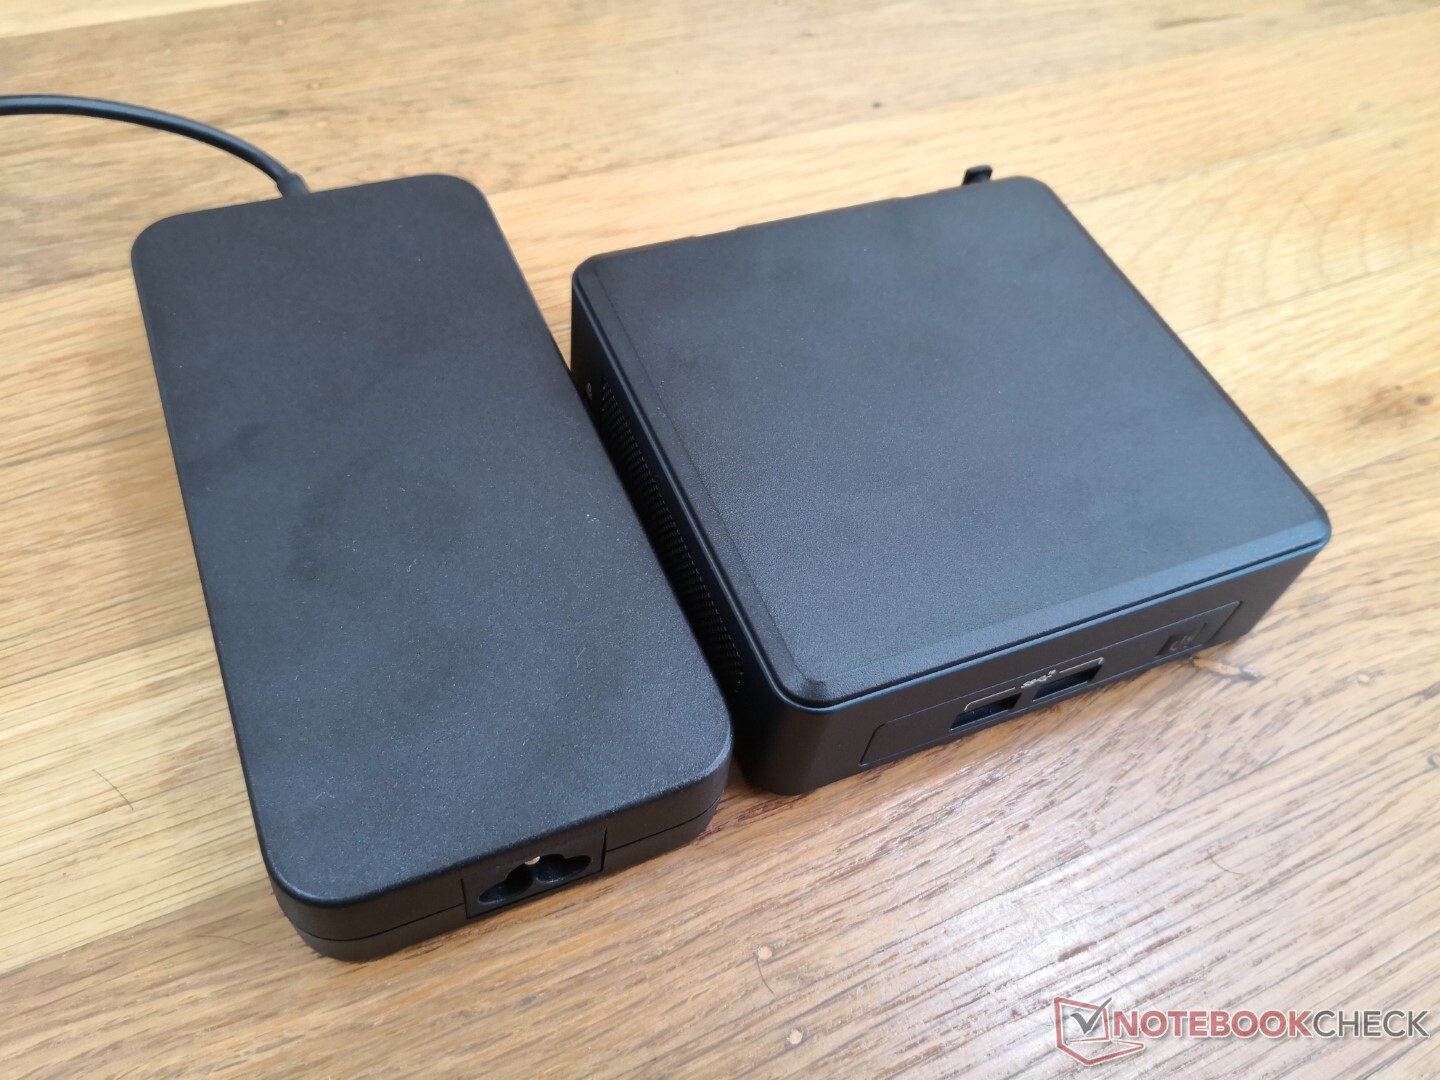
El adaptador de CA puede estar tan caliente como el propio mini PC a 42 C cuando está bajo carga.
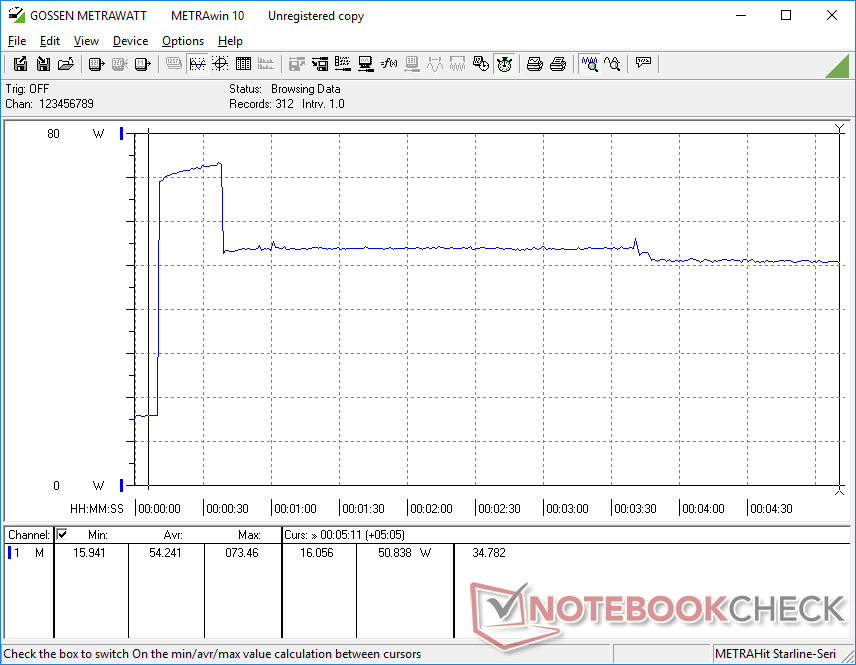
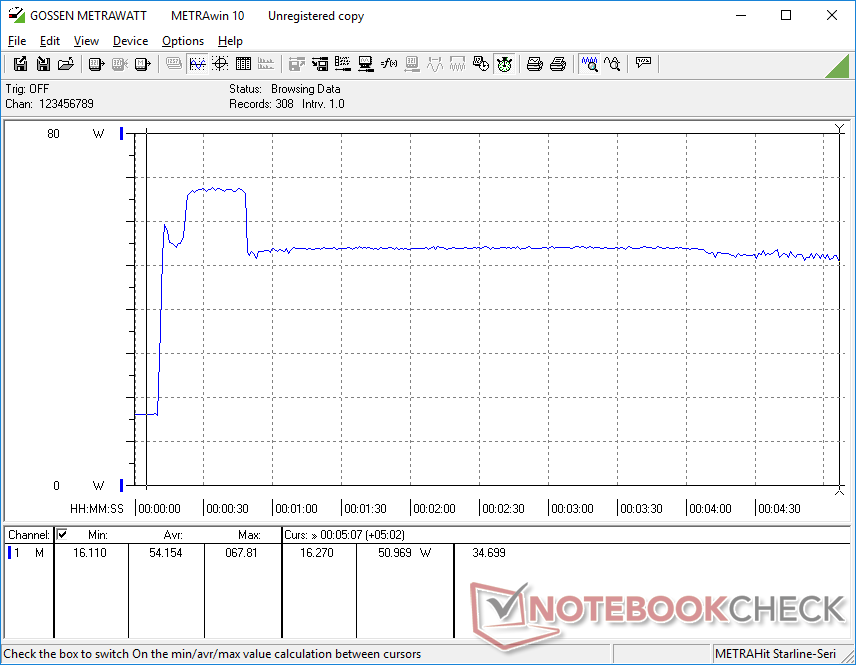
Prueba de esfuerzo
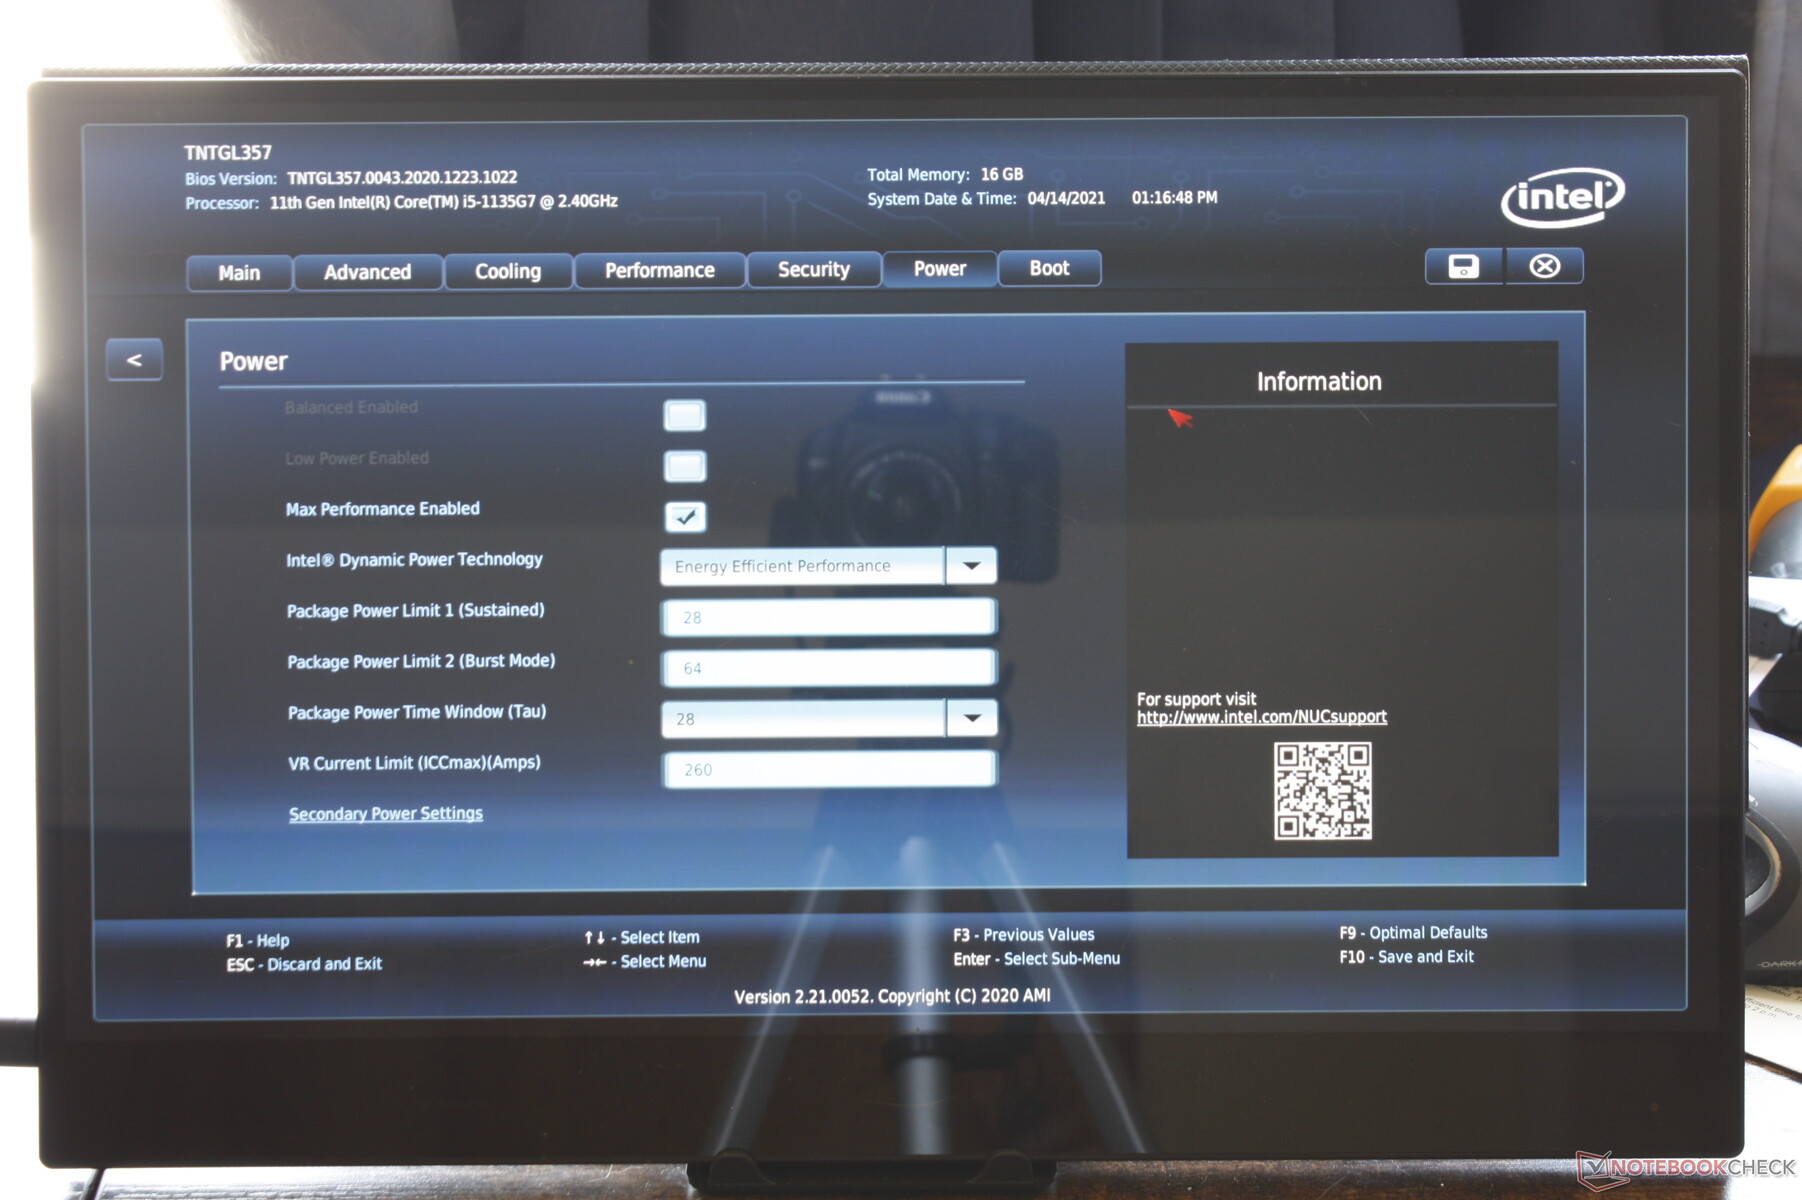
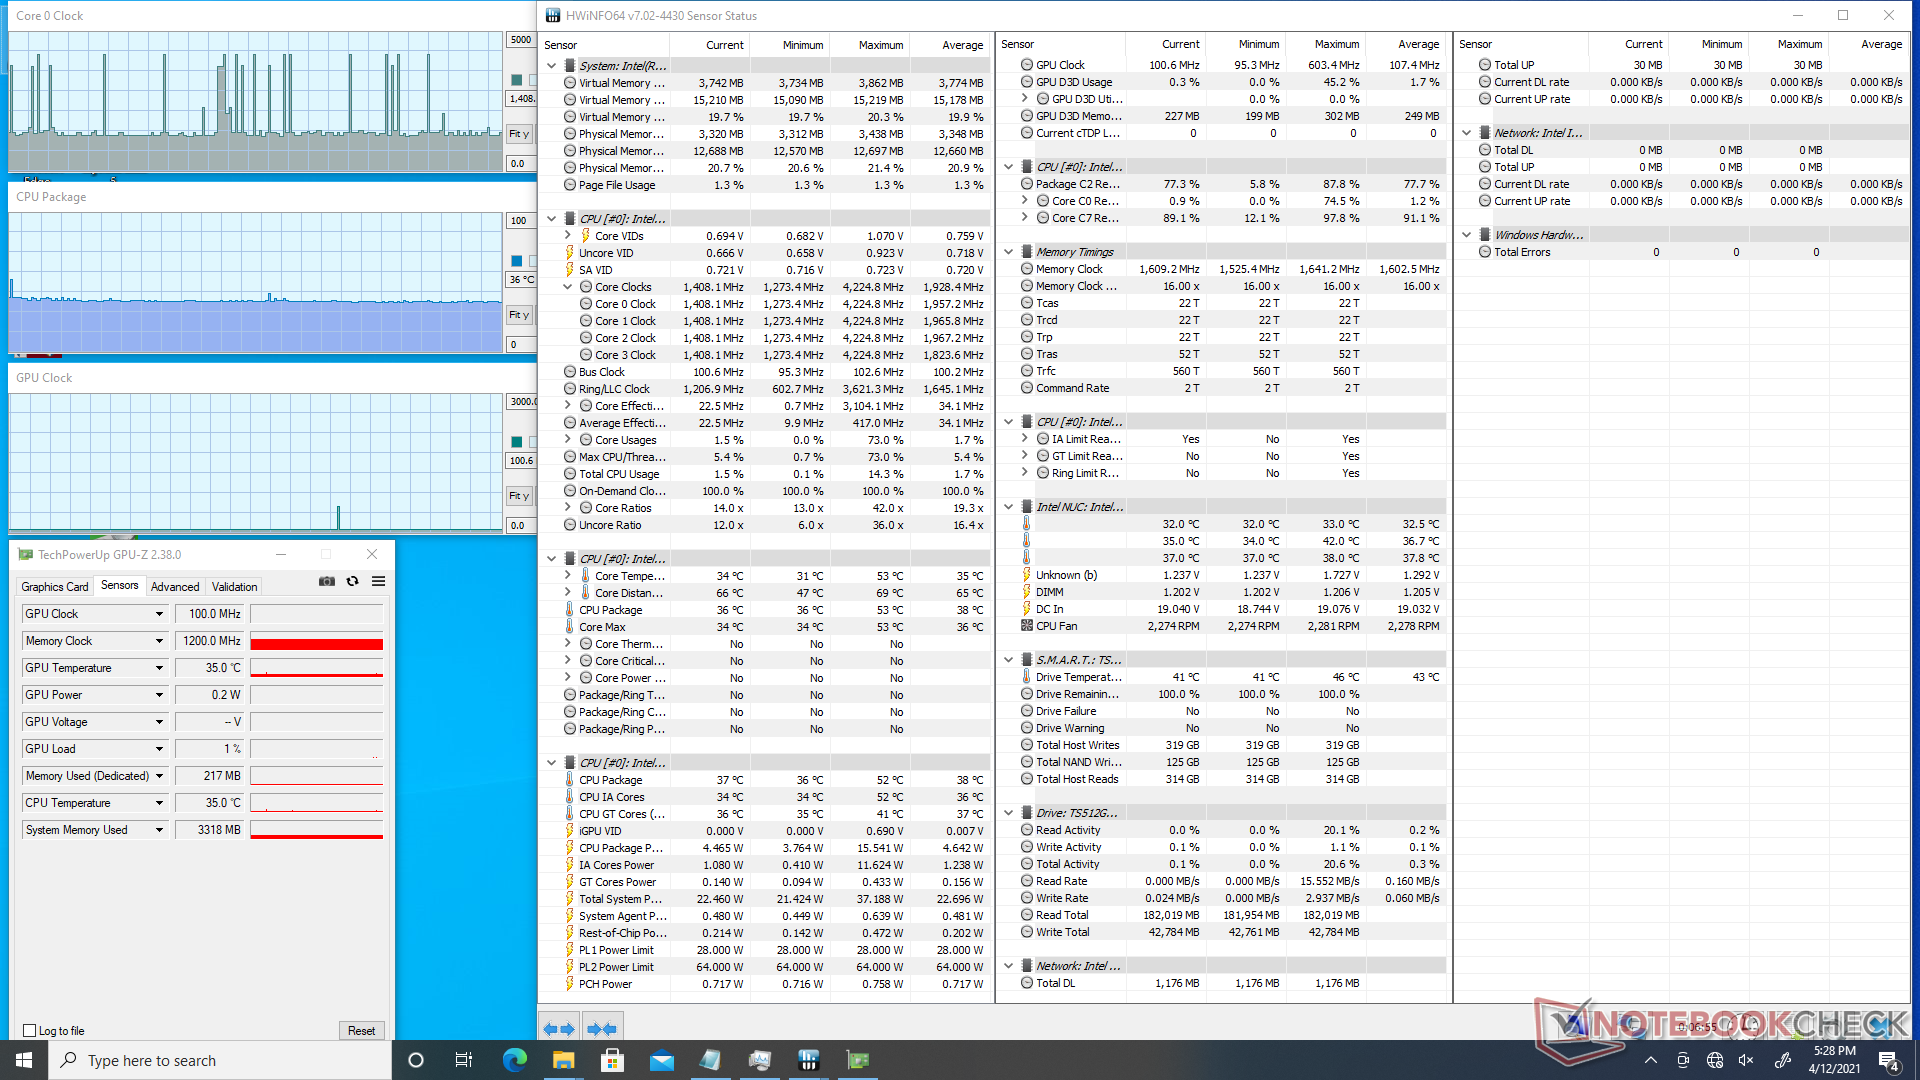
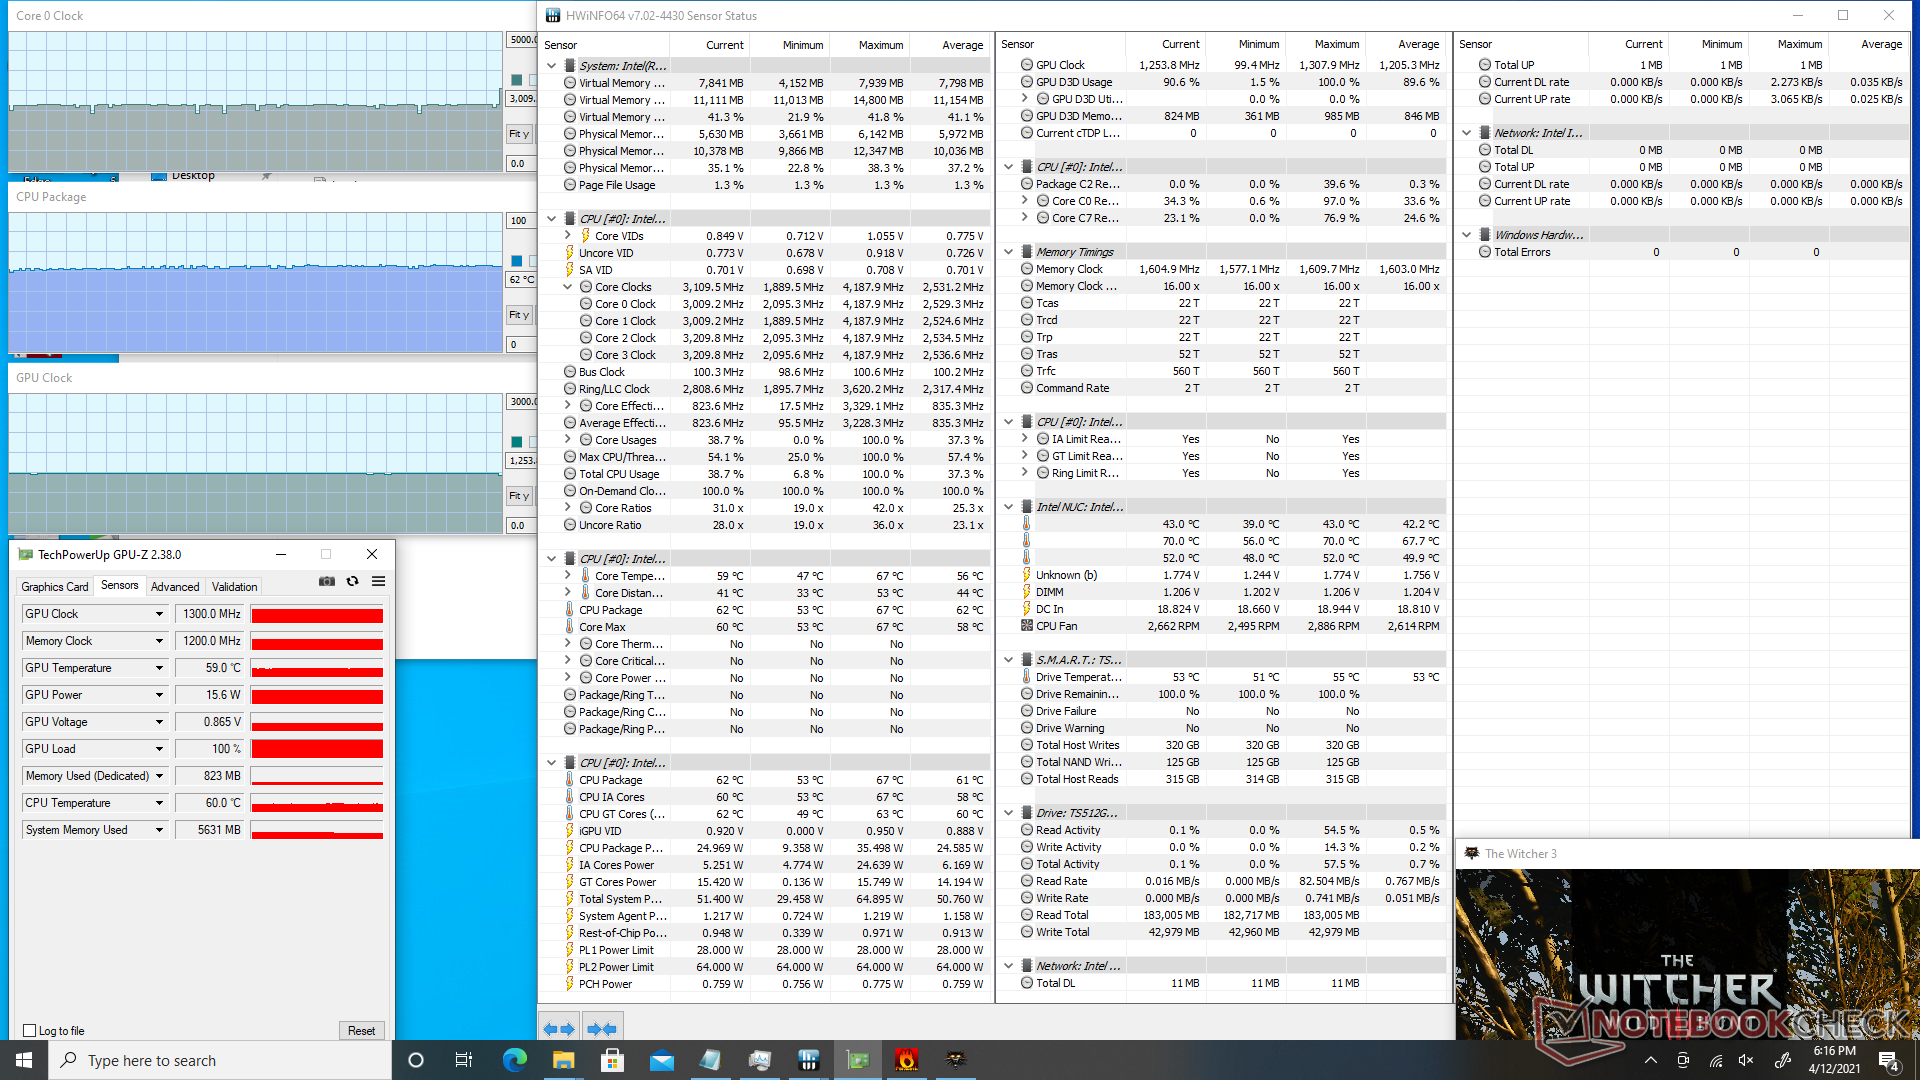
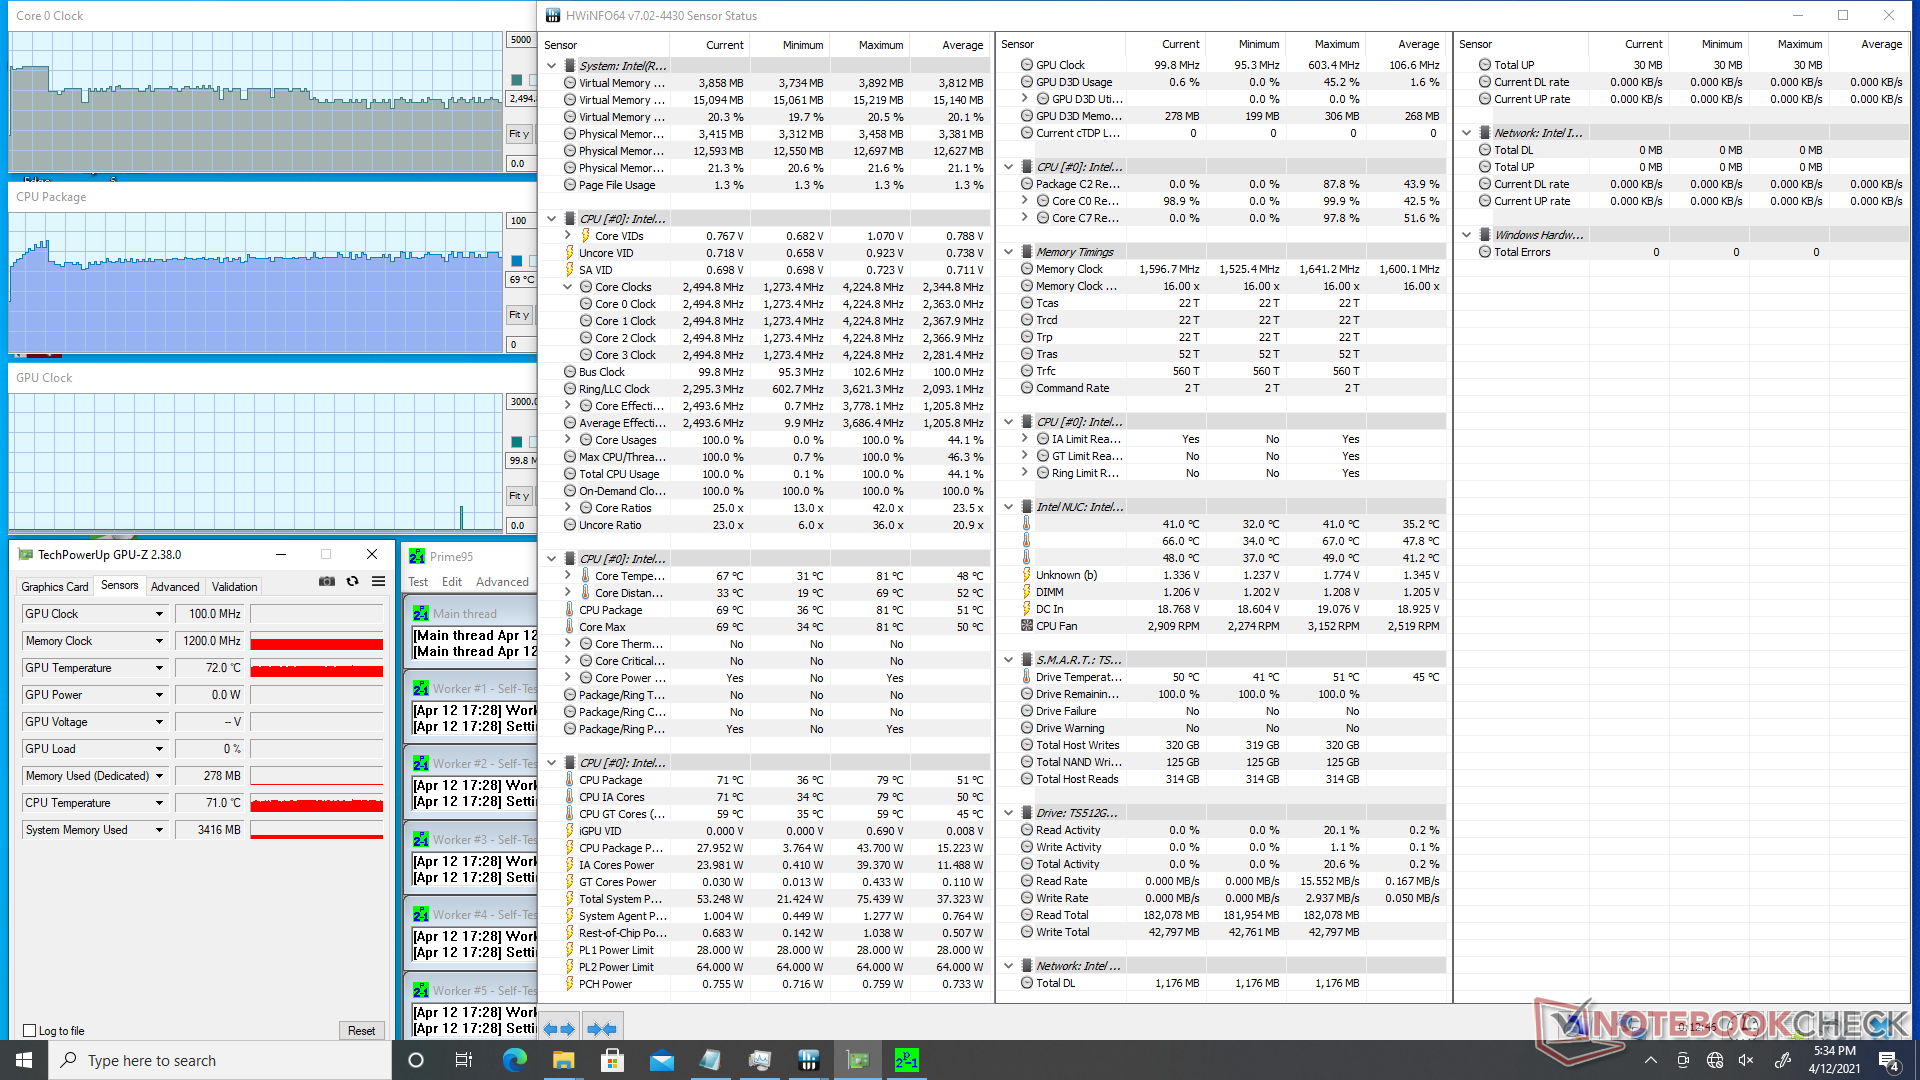
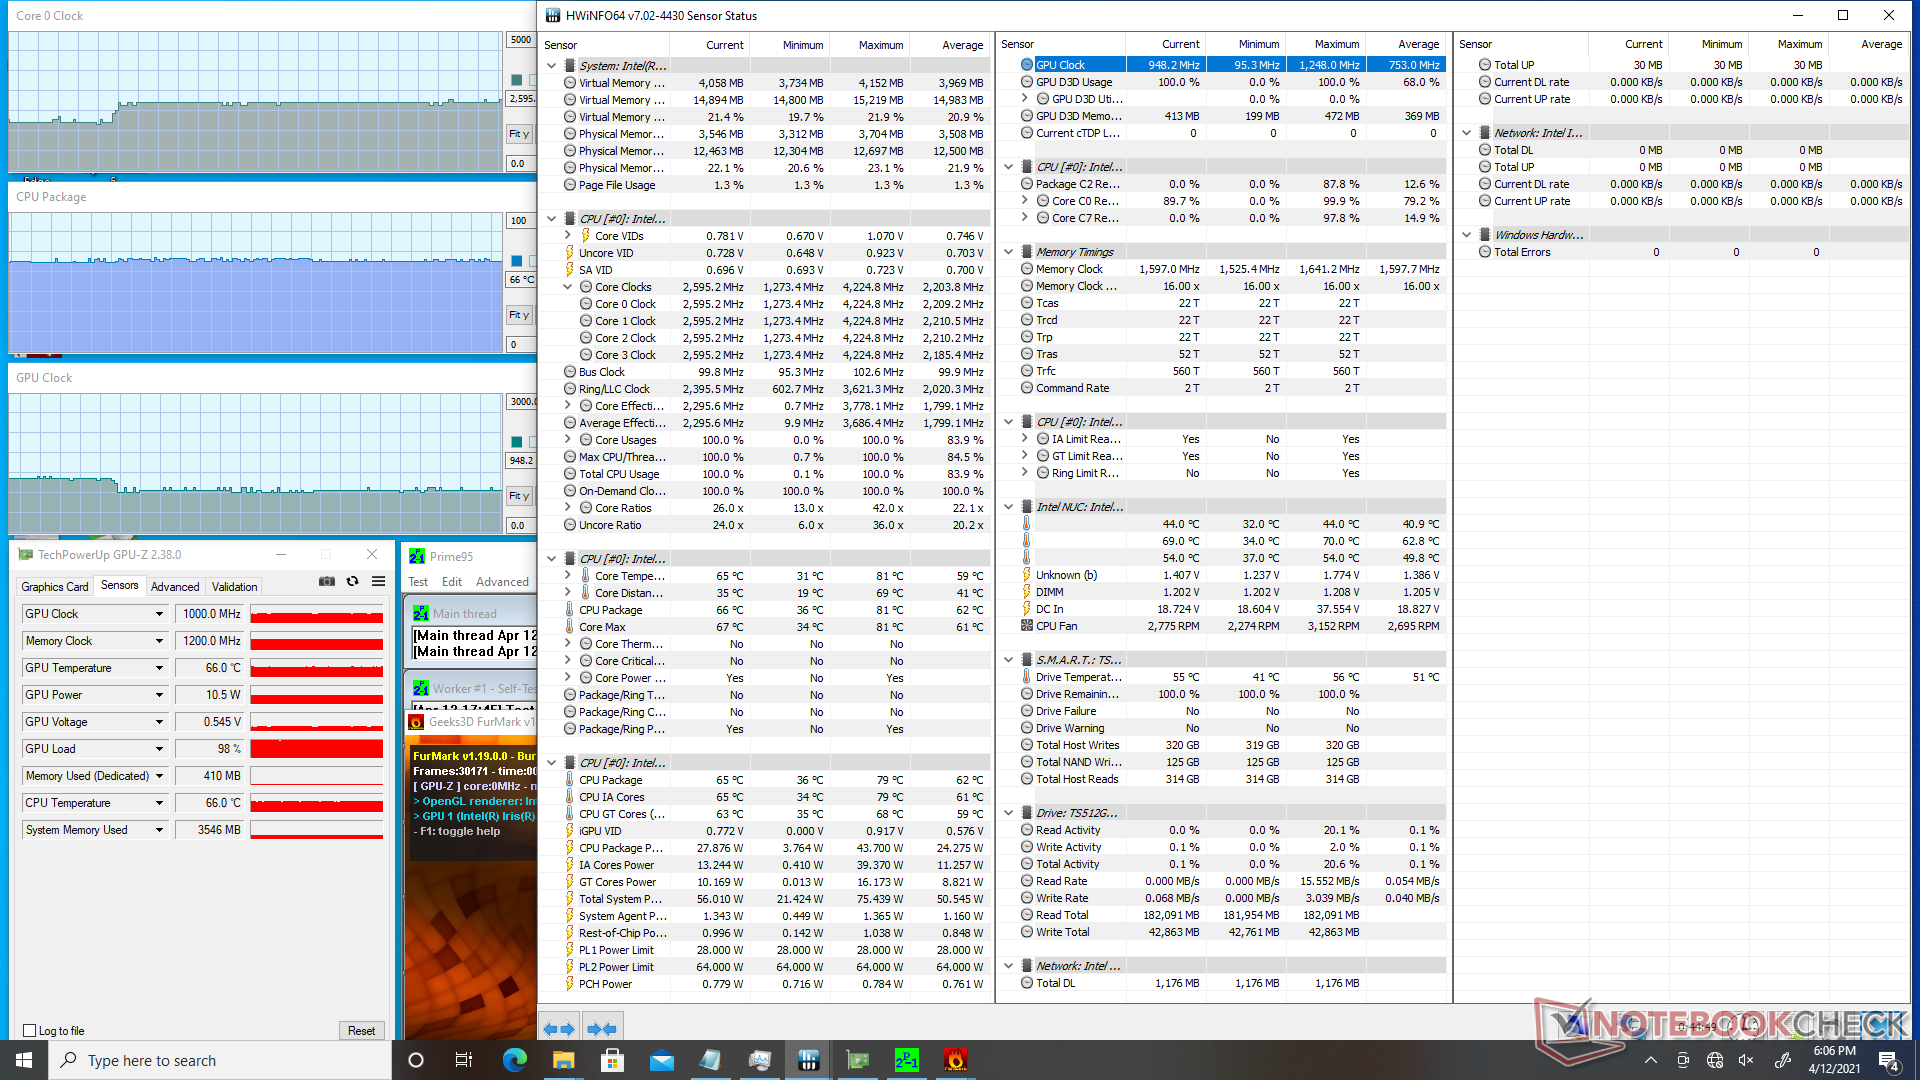
Cuando se ejecuta Prime95, la CPU se dispara a 3,7 GHz durante unos 30 segundos hasta alcanzar una temperatura del núcleo de 81 C. A partir de entonces, la velocidad de reloj desciende constantemente y se estabiliza en el rango de 2,5 a 2,7 GHz para mantener una temperatura del núcleo más fresca de 70 C. La sostenibilidad máxima del Turbo Boost no es, por tanto, indefinida, pero al menos es más duradera que la de muchos portátiles con la misma CPU Core i5-1135G7. El Lenovo Yoga 7i 14por ejemplo, alcanzaría los 3.8 GHz durante unos pocos segundos antes de estancarse bajo las mismas condiciones Prime95
Los usuarios pueden esperar que las temperaturas del núcleo ronden entre los 60 C y los 70 C cuando se ejecutan cargas exigentes.
| Relojde la CPU(GHz) | Reloj dela GPU(MHz) | Temperaturamediade la CPU (°C) | |
| Sistema en reposo | |||
| EstrésPrime95 | 2,4 - 2,7 | -- | 70 |
| Prime95+ FurMark Stress | 1,8 - 2,6 | 950 - 1200 | 66 |
| Witcher 3 Stress | 2.4 | 1300 | 62 |
Energy Management
Consumo de energía
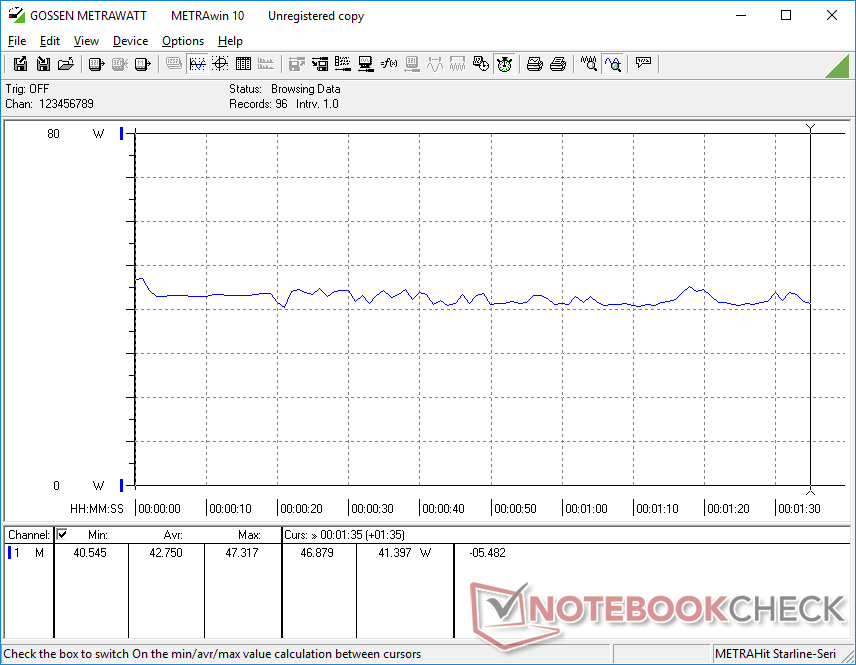
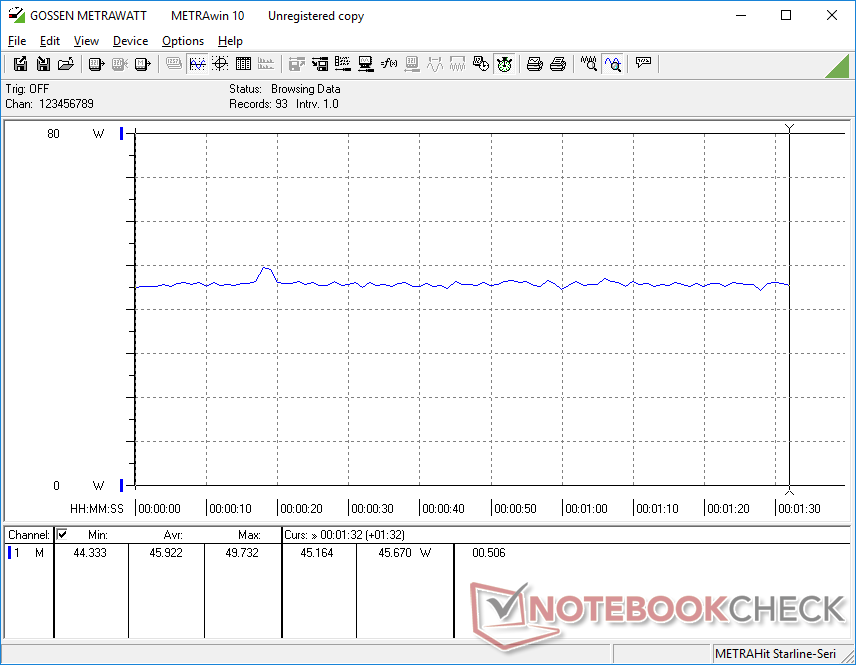
El NUC11TNKi5 consume siempre más energía que el NUC11PAQi7, aunque este último es el NUC más rápido y grande. Las cargas de juego consumen entre 40 W y 44 W frente a los 31 W y 39 W del NUC11PAQi7. El consumo puede llegar a los 74 W cuando se somete a cargas de procesamiento extremas, pero este consumo es sólo temporal debido al limitado Turbo Boost del sistema.
| Off / Standby | |
| Ocioso | |
| Carga |
|
Clave:
min: | |
| Intel NUC11TNKi5 | GMK NucBox 2 | Intel NUC11PAQi7 | Intel NUC10i5FNK | Beelink SEi10 | Zotac ZBOX MI642 Nano | |
|---|---|---|---|---|---|---|
| Power Consumption | 30% | 31% | -4% | 42% | 23% | |
| Idle Minimum * (Watt) | 11.5 | 6.1 47% | 5.6 51% | 6.3 45% | 8.9 23% | |
| Idle Average * (Watt) | 12.4 | 6.8 45% | 5.6 55% | 15.7 -27% | 6.6 47% | 9 27% |
| Idle Maximum * (Watt) | 12.9 | 7.3 43% | 6 53% | 6.7 48% | 9.9 23% | |
| Load Average * (Watt) | 40.7 | 46.3 -14% | 31.4 23% | 25.9 36% | 33 19% | |
| Witcher 3 ultra * (Watt) | 43.9 | 39 11% | ||||
| Load Maximum * (Watt) | 73.5 | 50.7 31% | 80.5 -10% | 58.6 20% | 46.7 36% | 58 21% |
* ... más pequeño es mejor
Pro
Contra
Veredicto
El precio siempre ha sido una batalla difícil para la serie NUC. El NUC11TNKi5 con 4 GB de RAM, sin sistema operativo y sin almacenamiento se vende por 670 dólares en comparación con los 500 dólares del GMK NucBox 2 con 8 GB de RAM, sistema operativo Windows 10 y una unidad SSD NVMe de 256 GB. El aún más barato Beelink SEi10 cuesta 400 dólares con 8 GB de RAM, 256 GB de SSD NVMe e incluso soporte para Thunderbolt 3. Para que el NUC 11 Pro realmente merezca la pena, los usuarios tendrán que aprovechar el rendimiento relativamente alto del procesador y valorar tanto la garantía de tres años del fabricante como la sólida calidad de construcción. Por lo demás, los mencionados GMK o Beelink funcionarán igual de bien para entornos HTPC de bajo consumo o para el streaming 4K.
No es precisamente barato, pero los usuarios obtienen un mini PC delgado de primera clase con la última CPU de 11ª generación y todas sus ventajas de rendimiento.
Para el inevitable "NUC 12 Pro", nos encantaría ver USB-C Power Delivery y un adaptador de CA más pequeño. El USB-C PD permitiría que los adaptadores de CA USB-C de terceros redujeran la dependencia de los adaptadores de barril propietarios de Intel. El adaptador sobredimensionado de 120 W de Intel aquí es tan grande como el adaptador del portátil para juegos MSI GP66, lo cual es absurdo para un mini PC con motor Core U.
Precio y disponibilidad
El Intel NUC 11 Pro estará ampliamente disponible en las semanas siguientes a este análisis. Al menos un minorista en línea ya está enviando la configuración Core i7 del modelo
Price comparison

