Reseña del mini PC Intel NUC11PAQi7 Panther Canyon: Tiger Lake hecho a conciencia
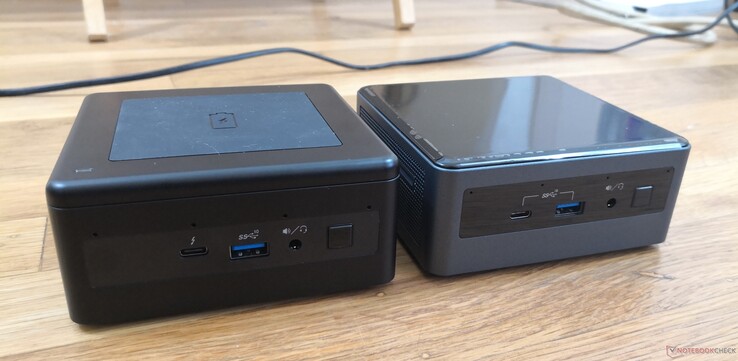
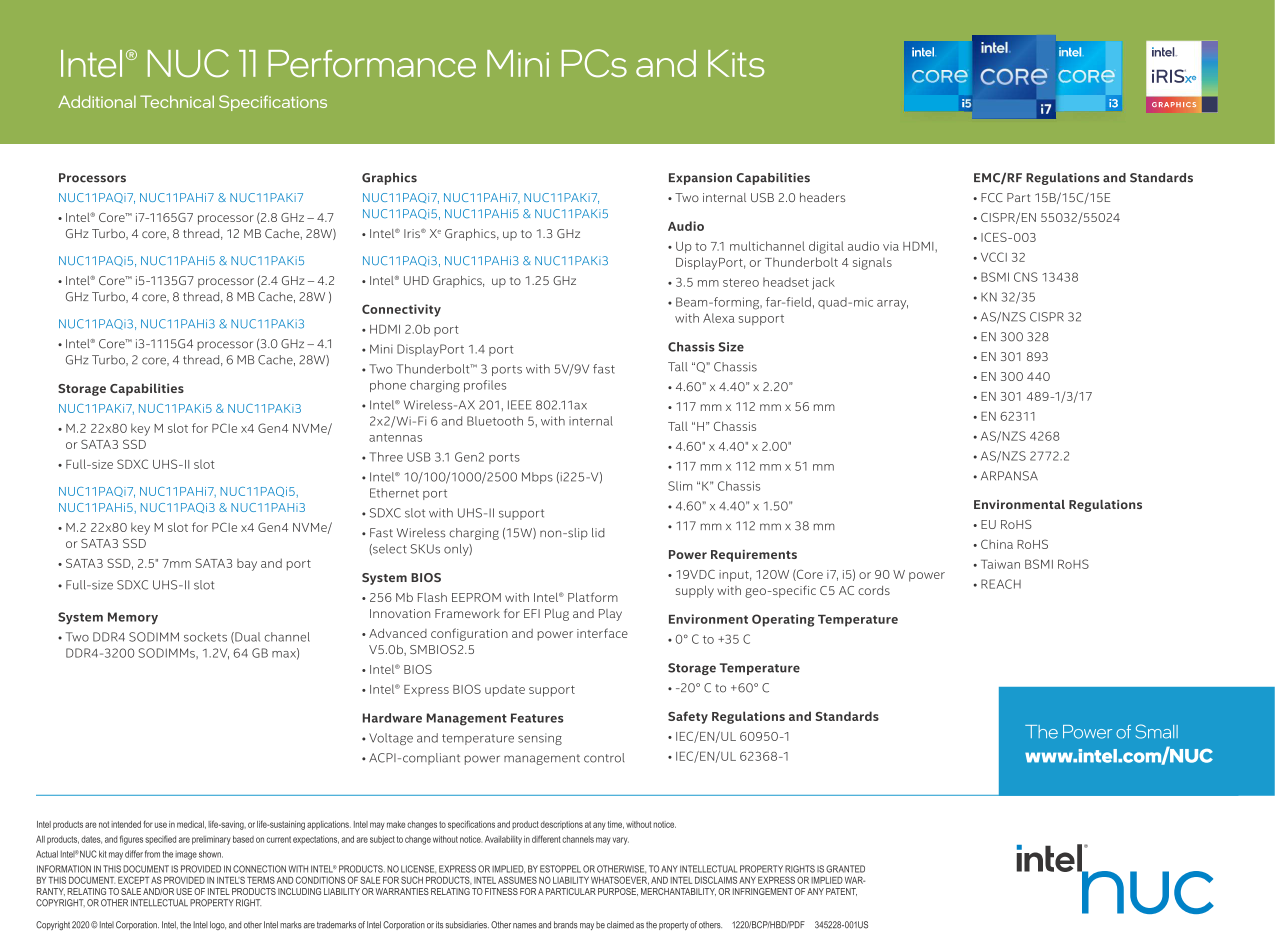
La serie NUC 11 sucede a la NUC 10 del año pasado introduciendo nuevos diseños de chasis y actualizando las opciones de procesador a Tiger Lake-U. Hay tres modelos disponibles en diferentes tamaños: el NUC11PAQ grande, el NUC11PAH mediano y el NUC11PAK pequeño. Las diferencias físicas y las características se detallan en el informe oficial de Intel sobre el producto que figura a continuación.
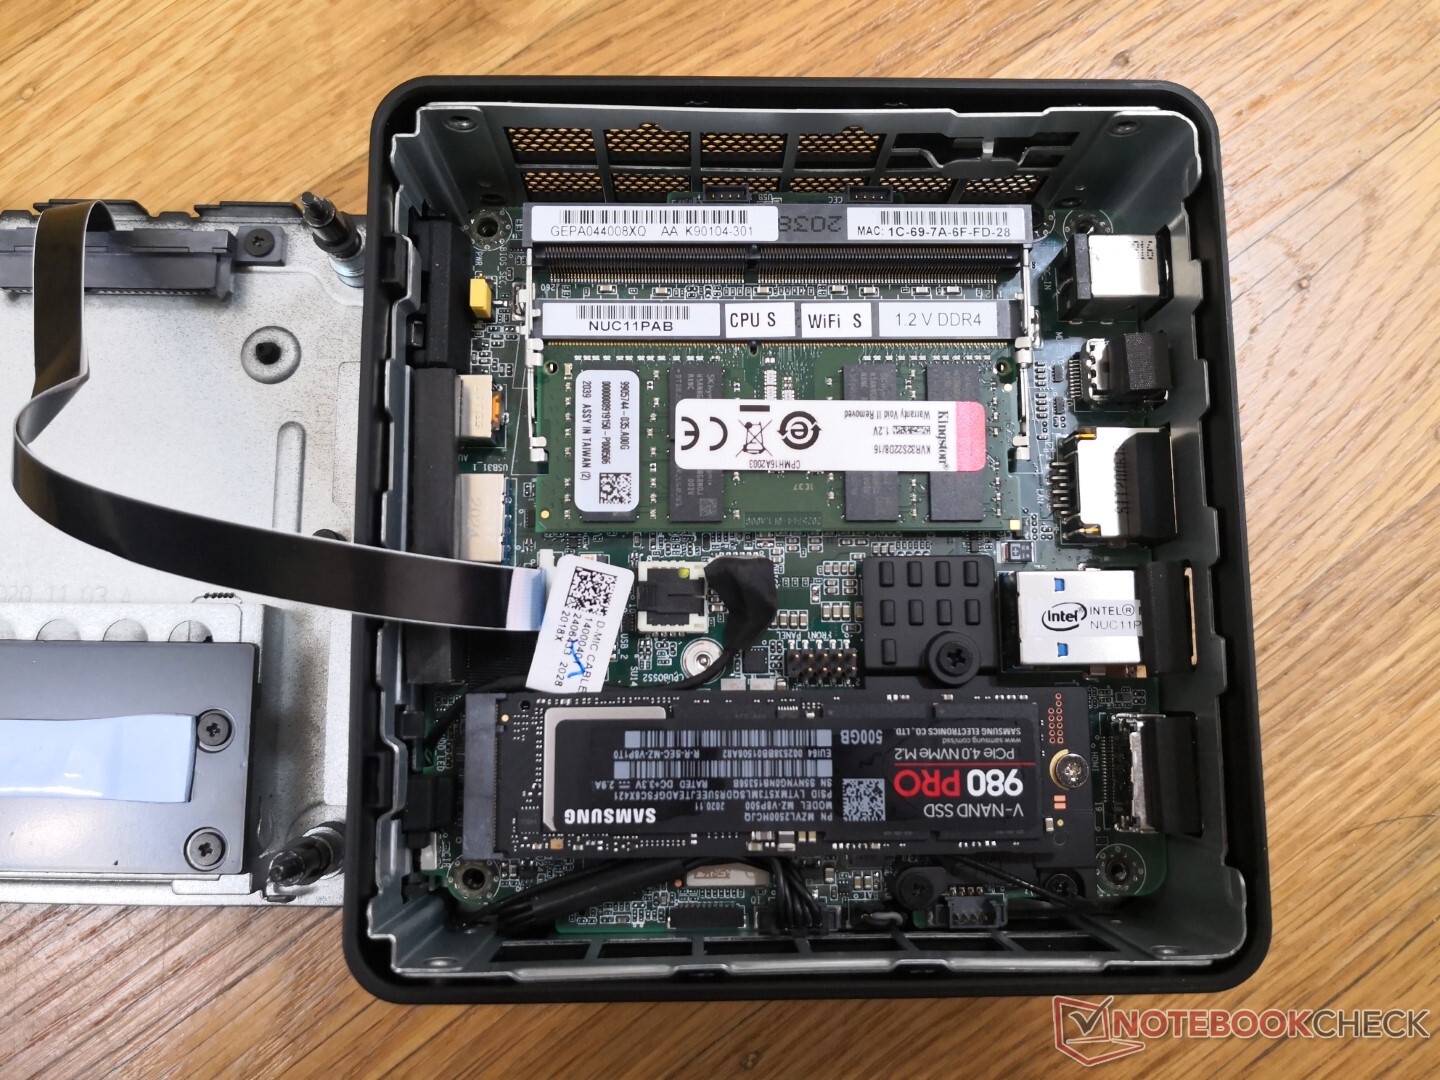
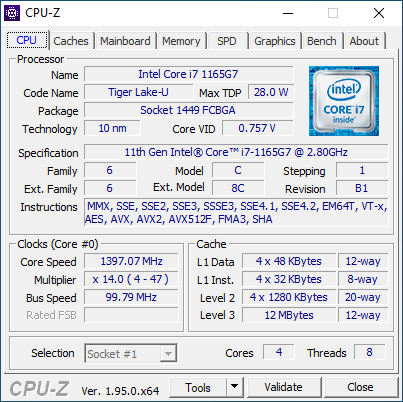
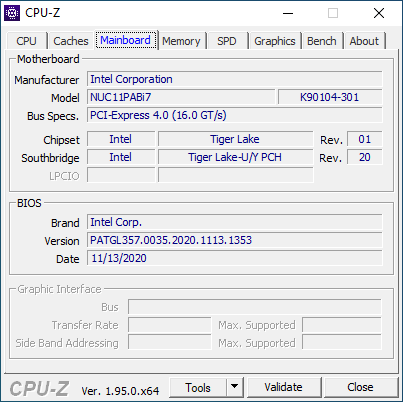
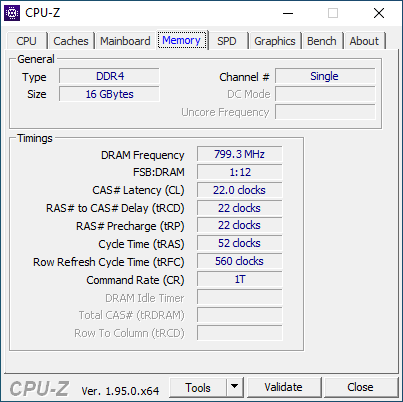
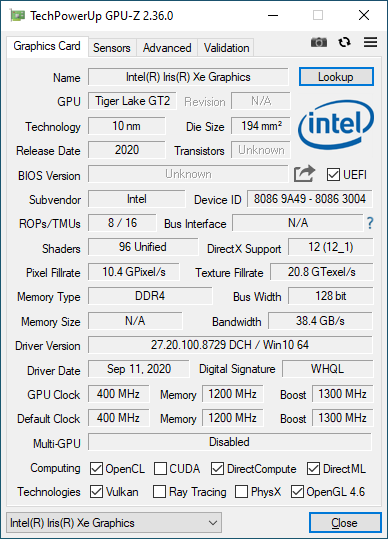
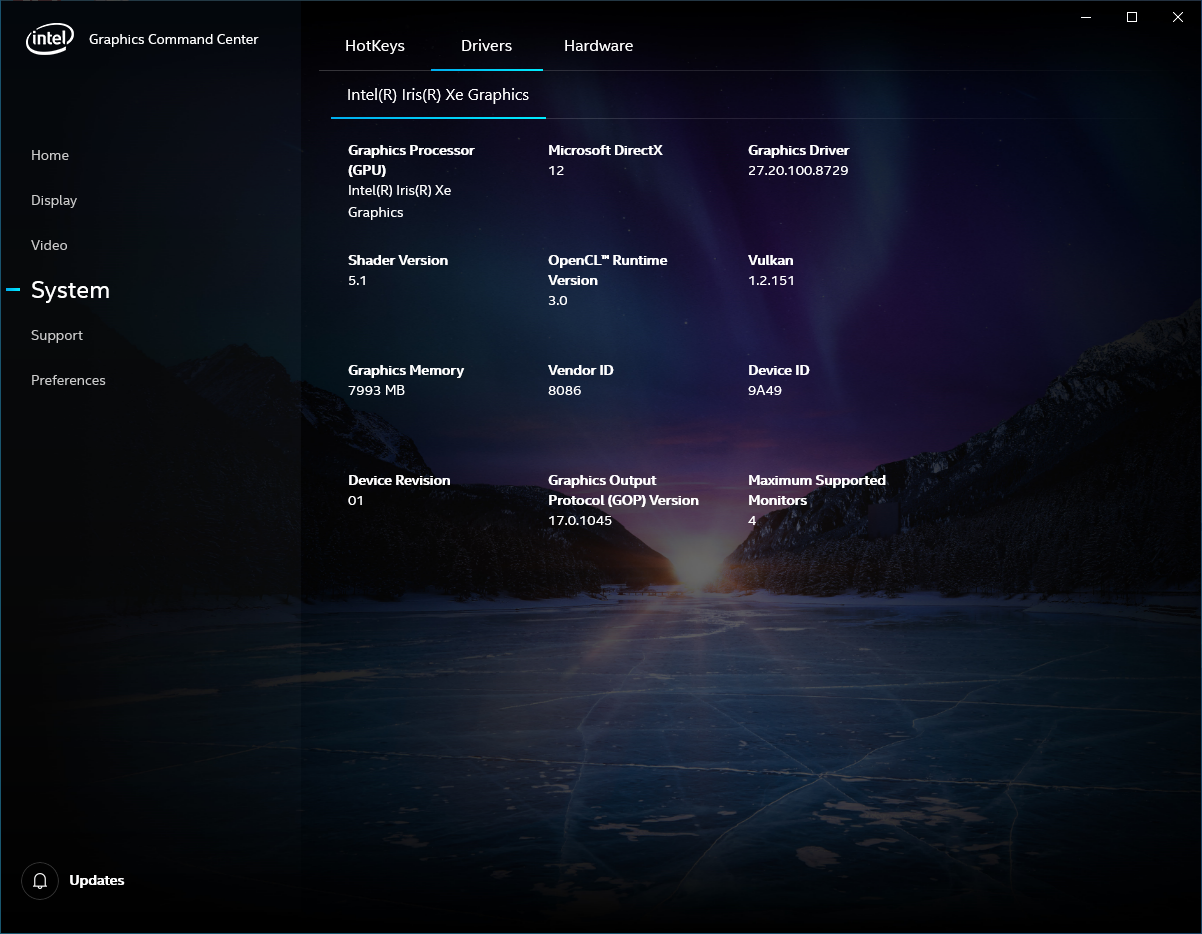
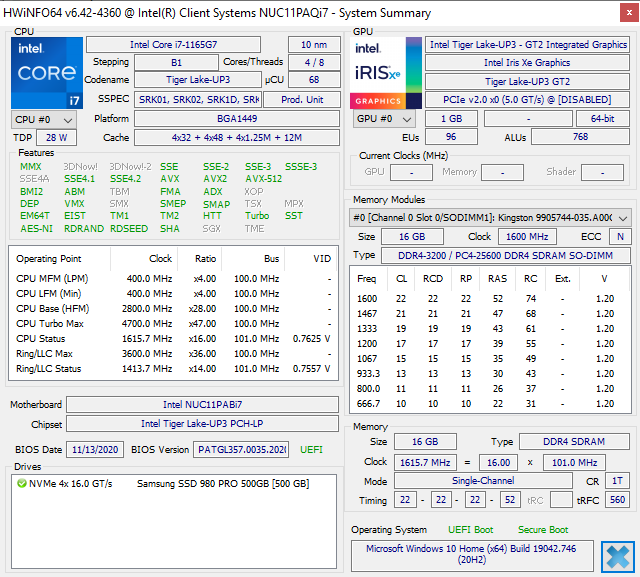
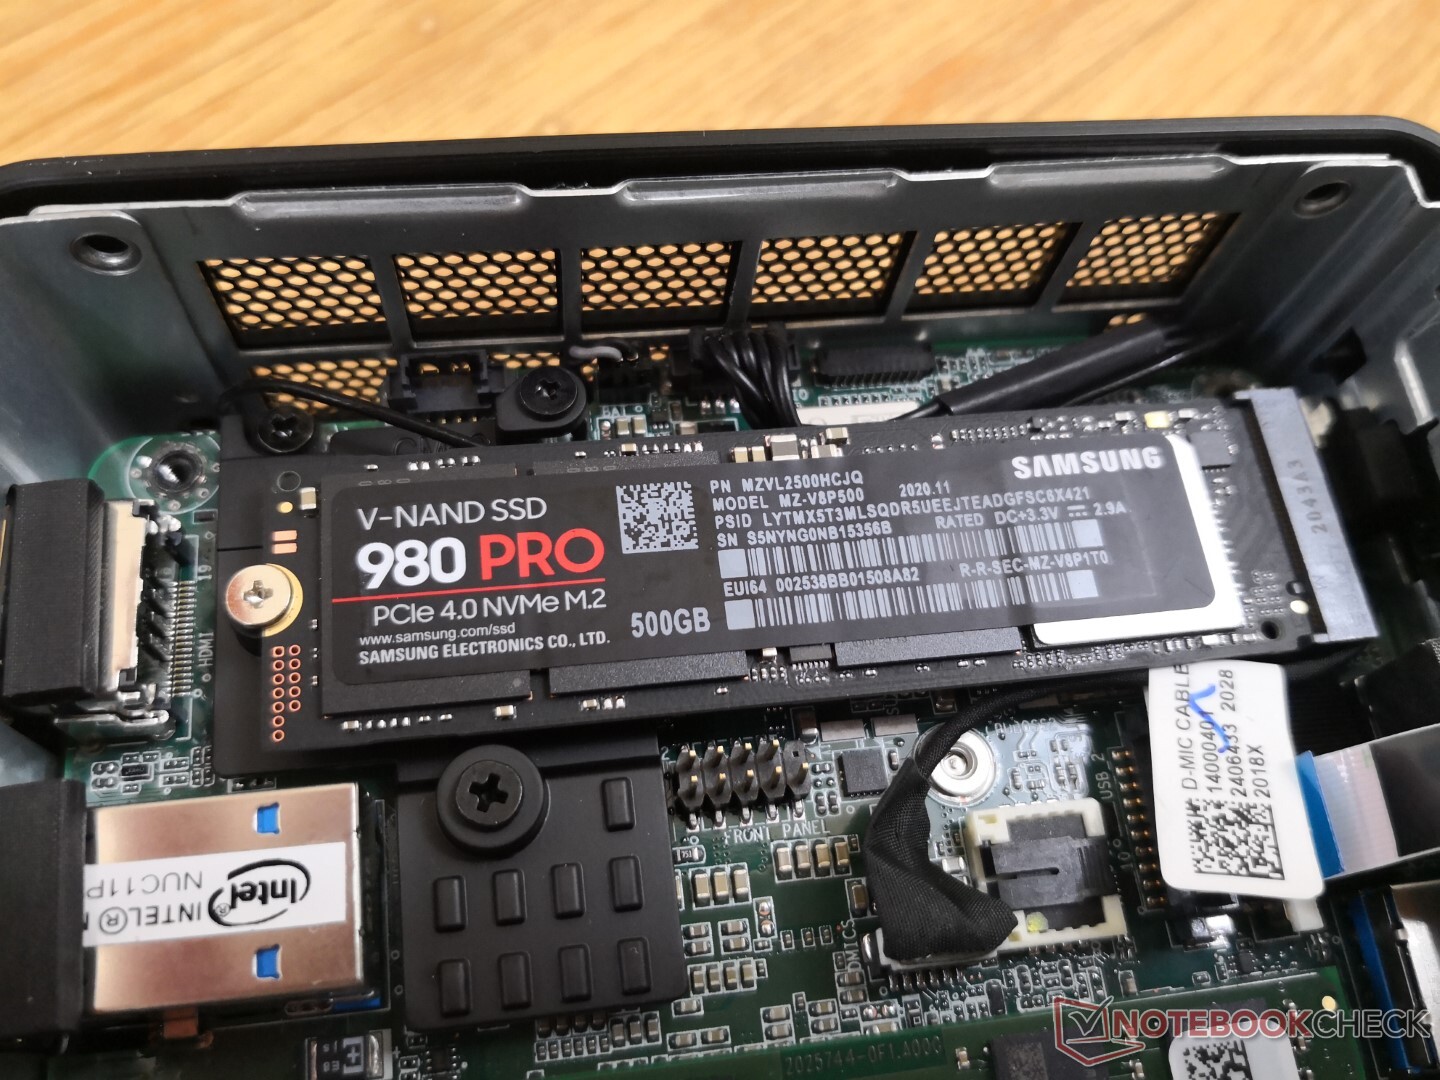
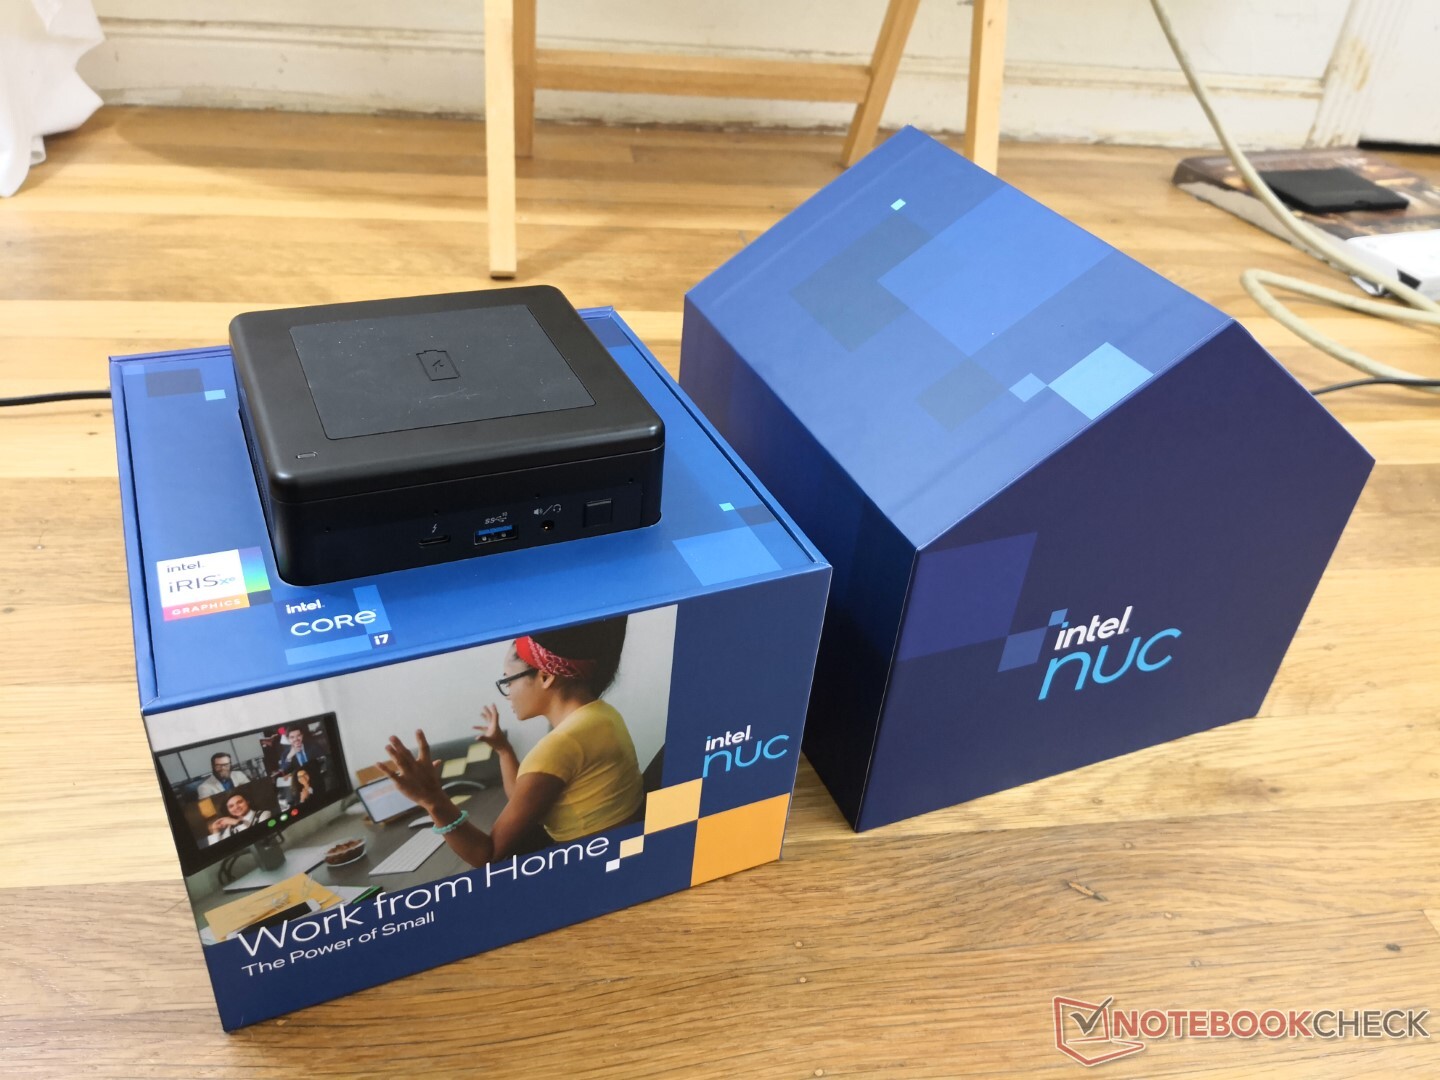
Nuestra unidad de análisis aquí es el NUC11PAQ equipado con la CPU Core i7-1165G7, 16 GB de RAM de un solo canal y 500 GB de SSD PCIe 4.0 Samsung 980 Pro NVMe. También hay disponibles SKUs inferiores Core i5-1135G7 y Core i3-1115G4, todos con gráficos Iris Xe integrados.
Más opiniones sobre el Intel NUC:
potential competitors in comparison
Valoración | Fecha | Modelo | Peso | Altura | Tamaño | Resolución | Precio |
|---|---|---|---|---|---|---|---|
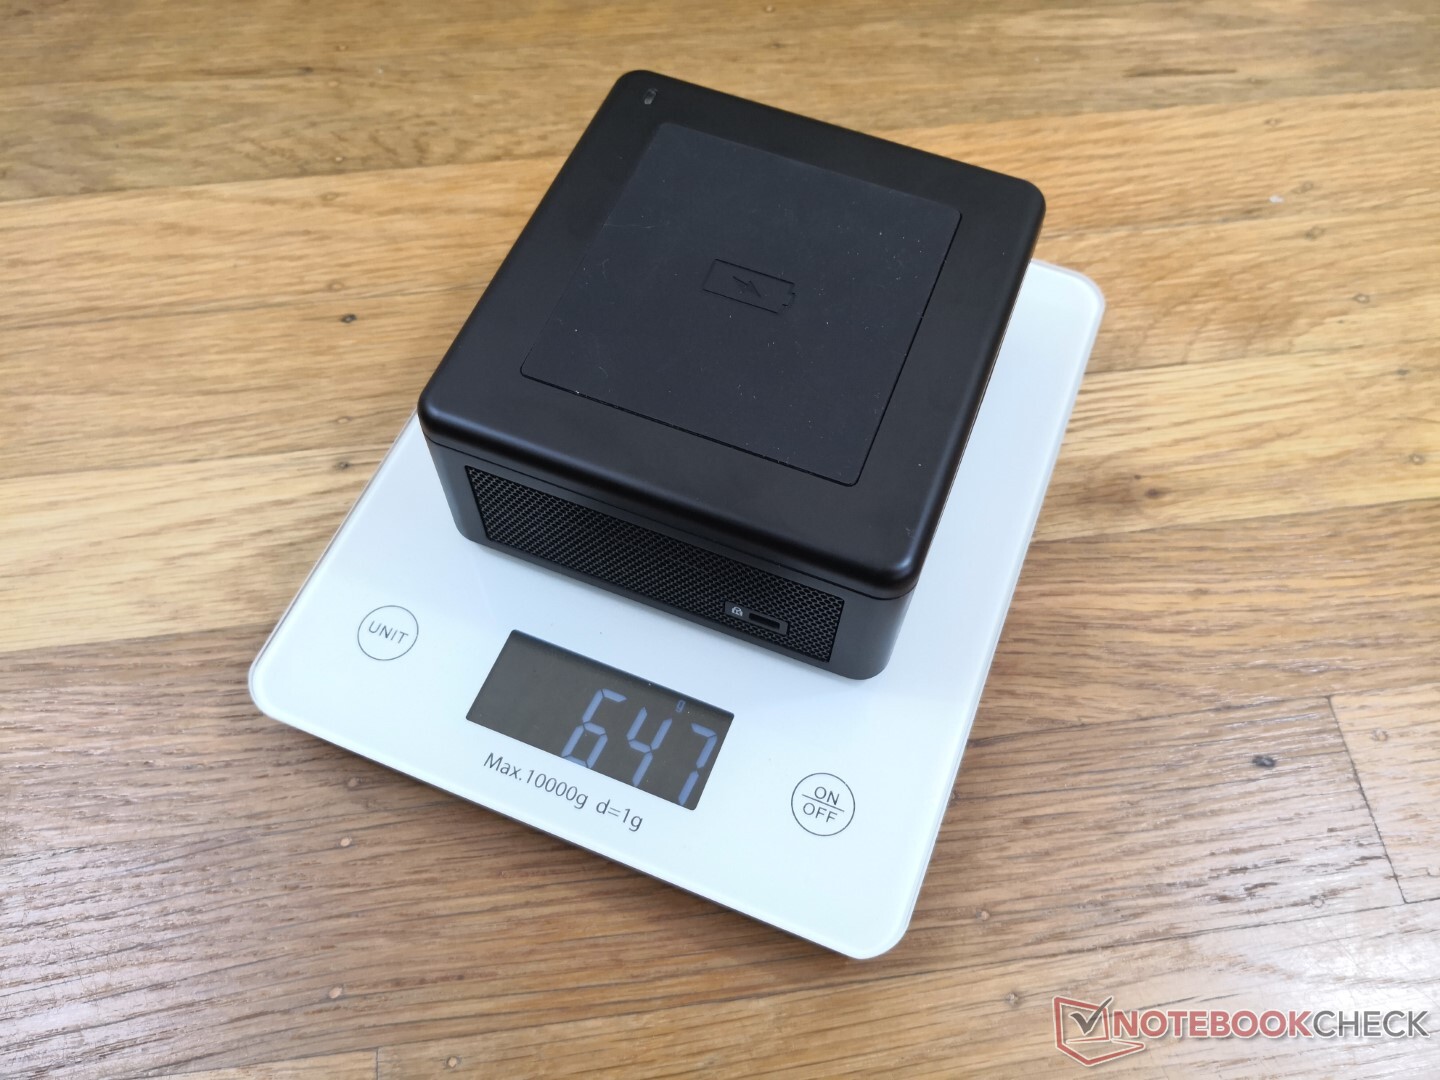
v (old) | 02/2021 | Intel NUC11PAQi7 i7-1165G7, Iris Xe G7 96EUs | 647 g | 56 mm | x | ||
v (old) | 02/2020 | Intel NUC10i7FNH i7-10710U, UHD Graphics 620 | 697 g | 51 mm | 0.00" | 0x0 | |
v (old) | 11/2018 | Intel NUC8i7BE i7-8559U, Iris Plus Graphics 655 | 683 g | 51 mm | x | ||
v (old) | 03/2018 | Intel Hades Canyon NUC8i7HVK i7-8809G, Vega M GH | 1.3 kg | 39 mm | x | ||
v (old) | Beelink SEi10 i3-1005G1, UHD Graphics G1 (Ice Lake 32 EU) | 350 g | 41 mm | x | |||
v (old) | 07/2020 | Zotac ZBox MI643 i5-10210U, UHD Graphics 620 | 550 g | 28.5 mm | x |
Caso
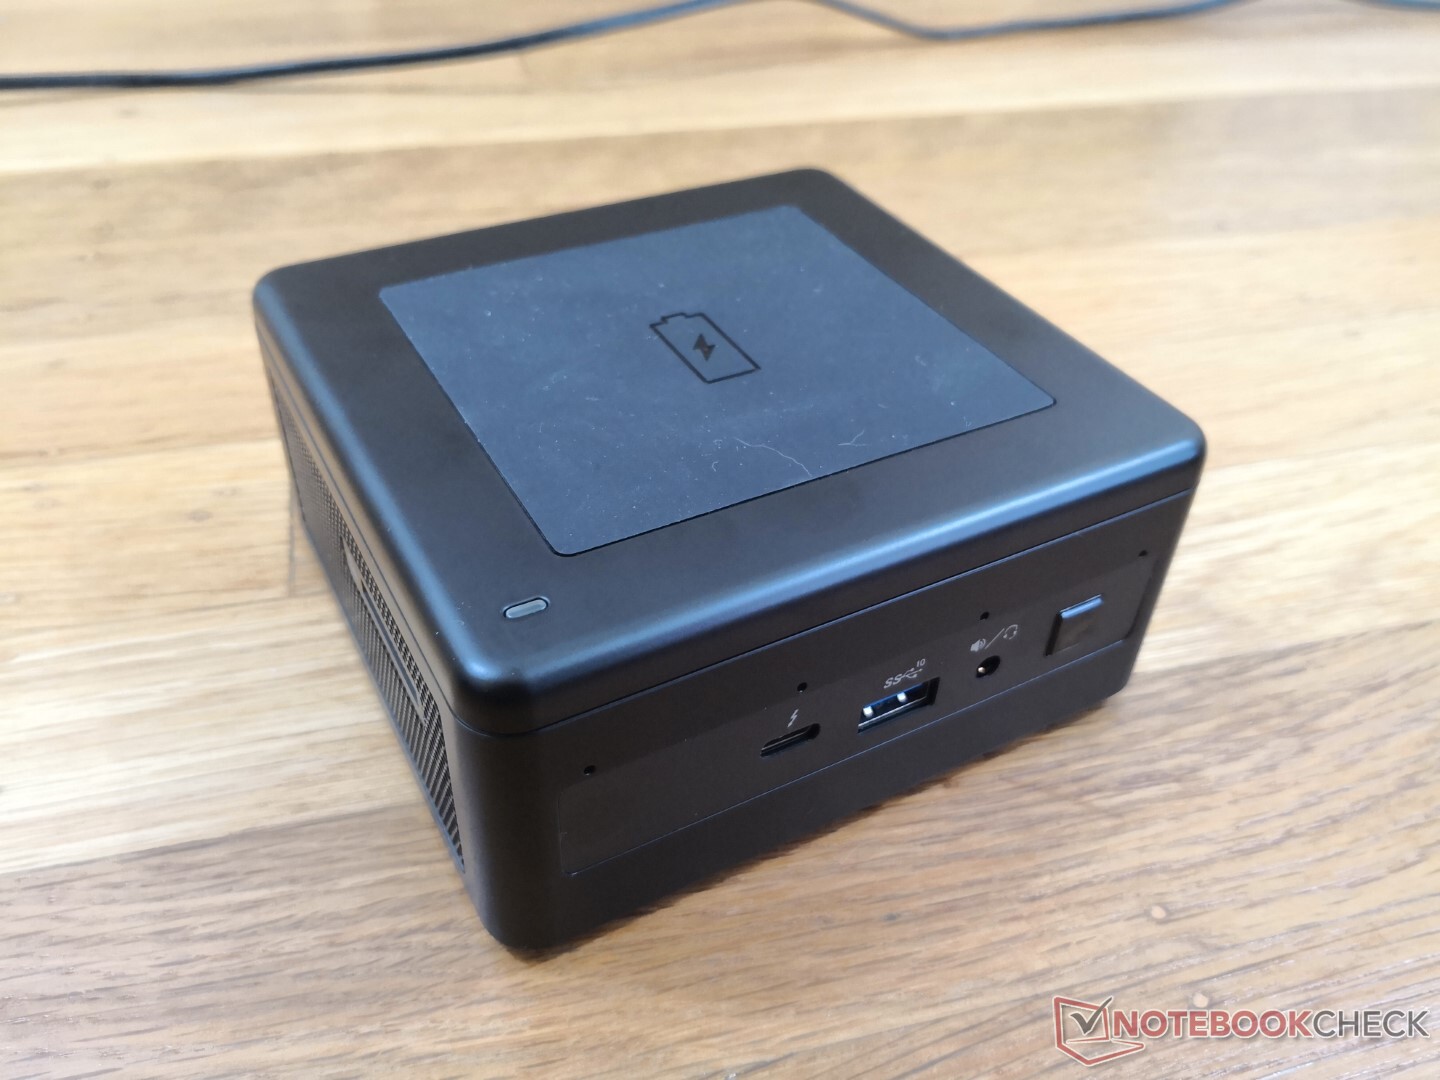
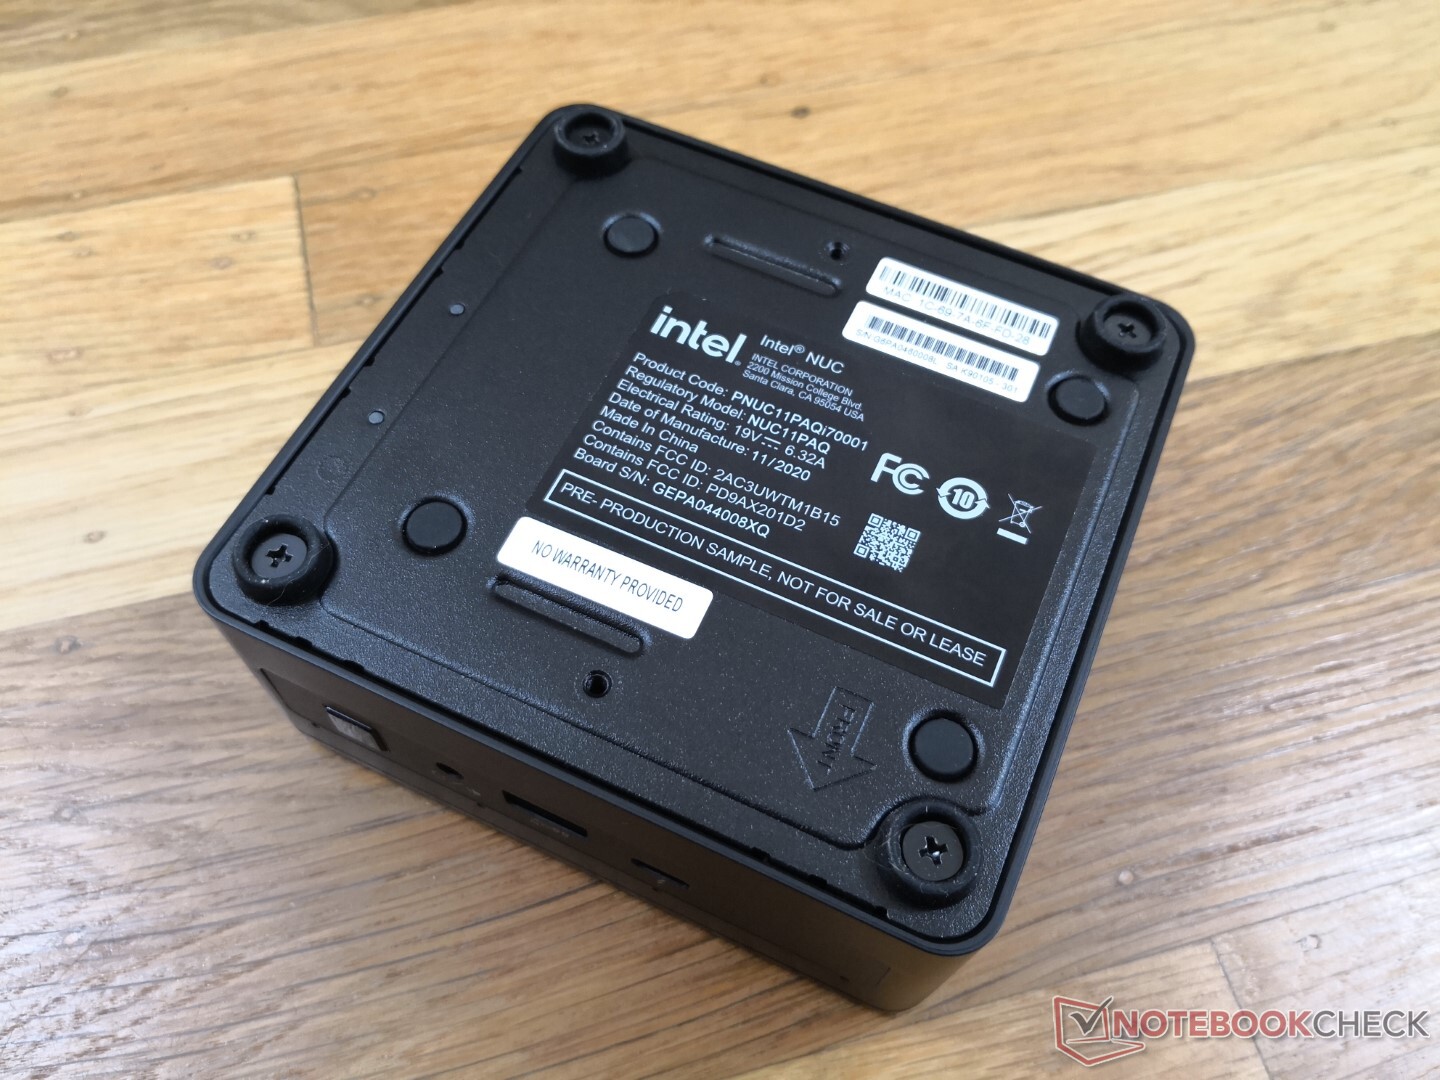
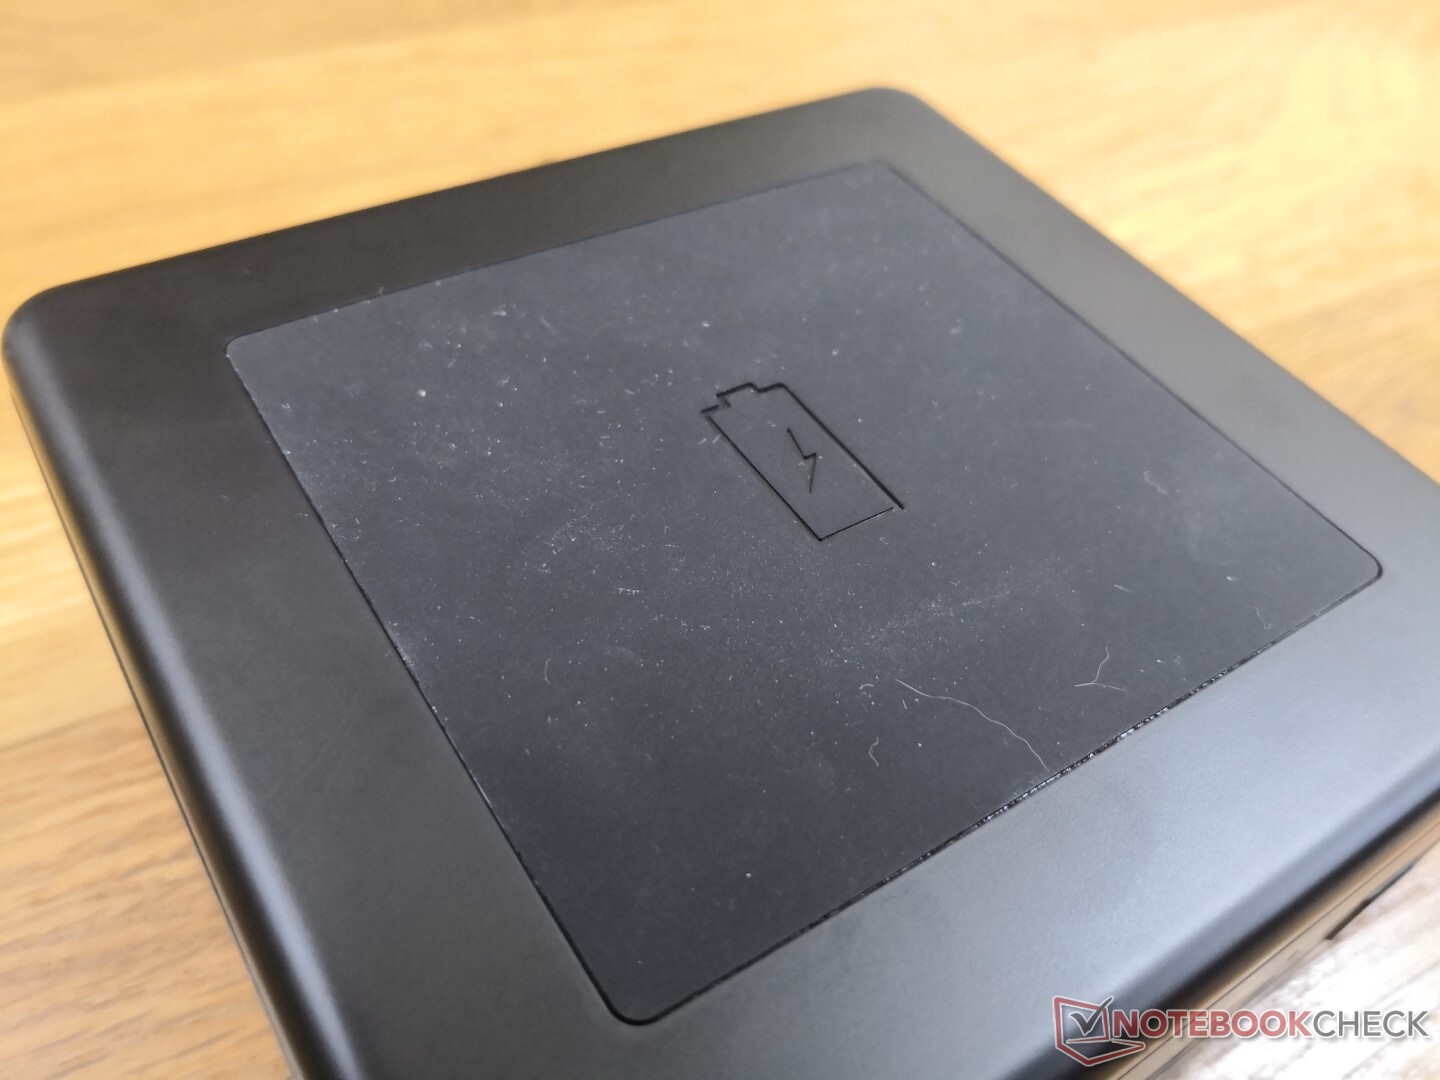
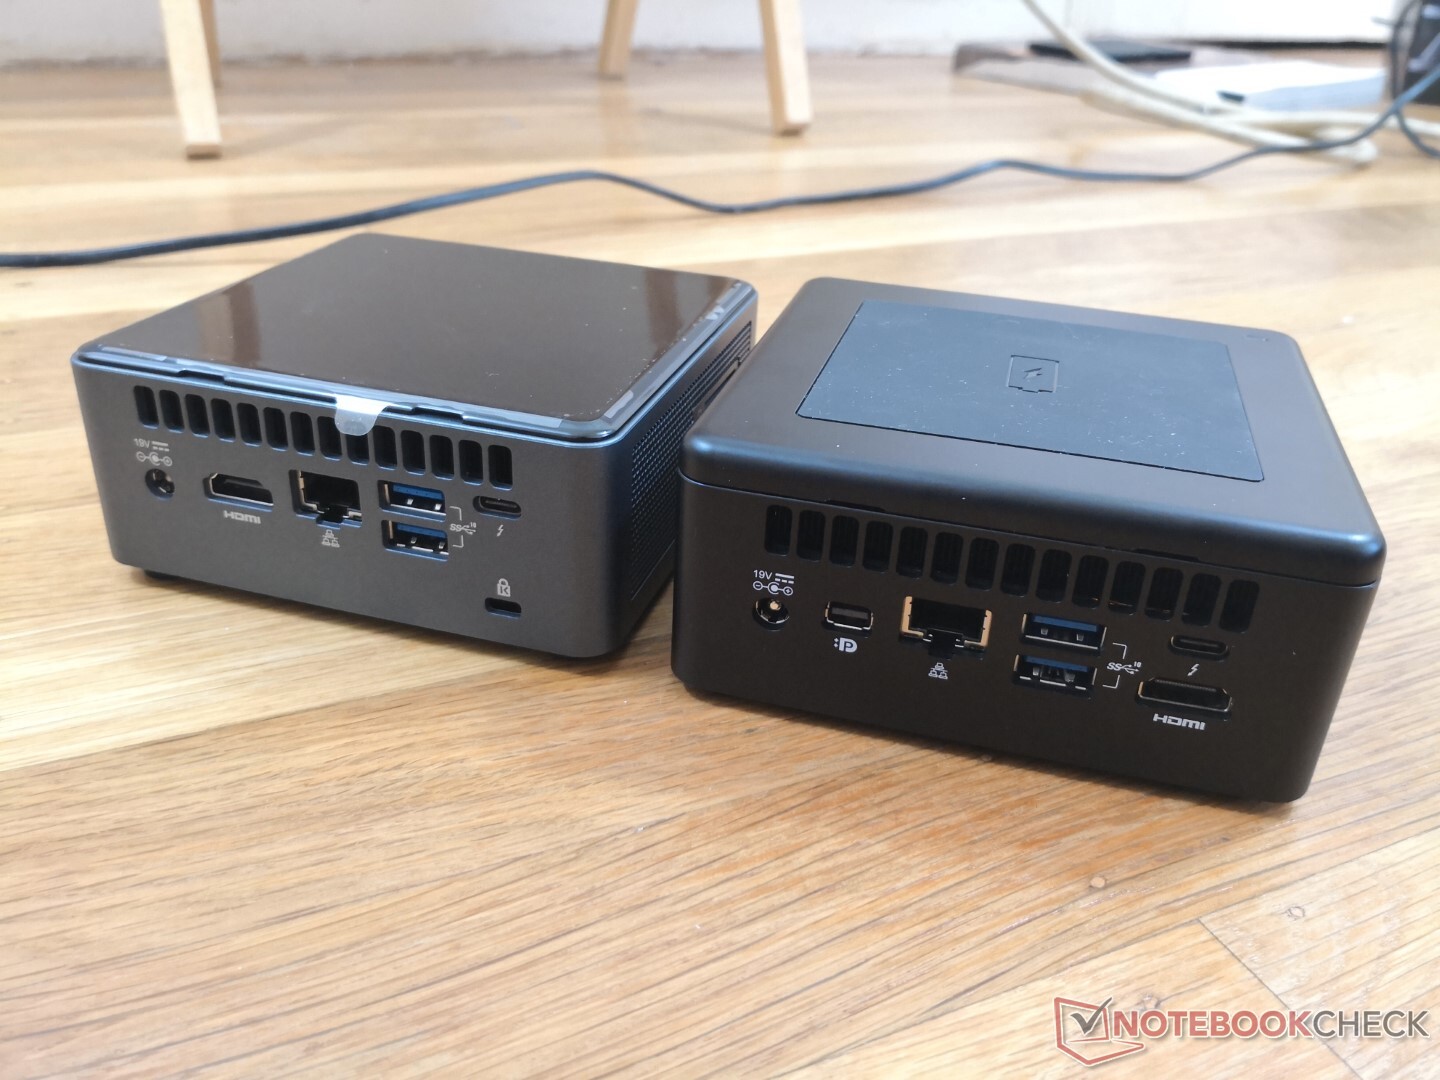
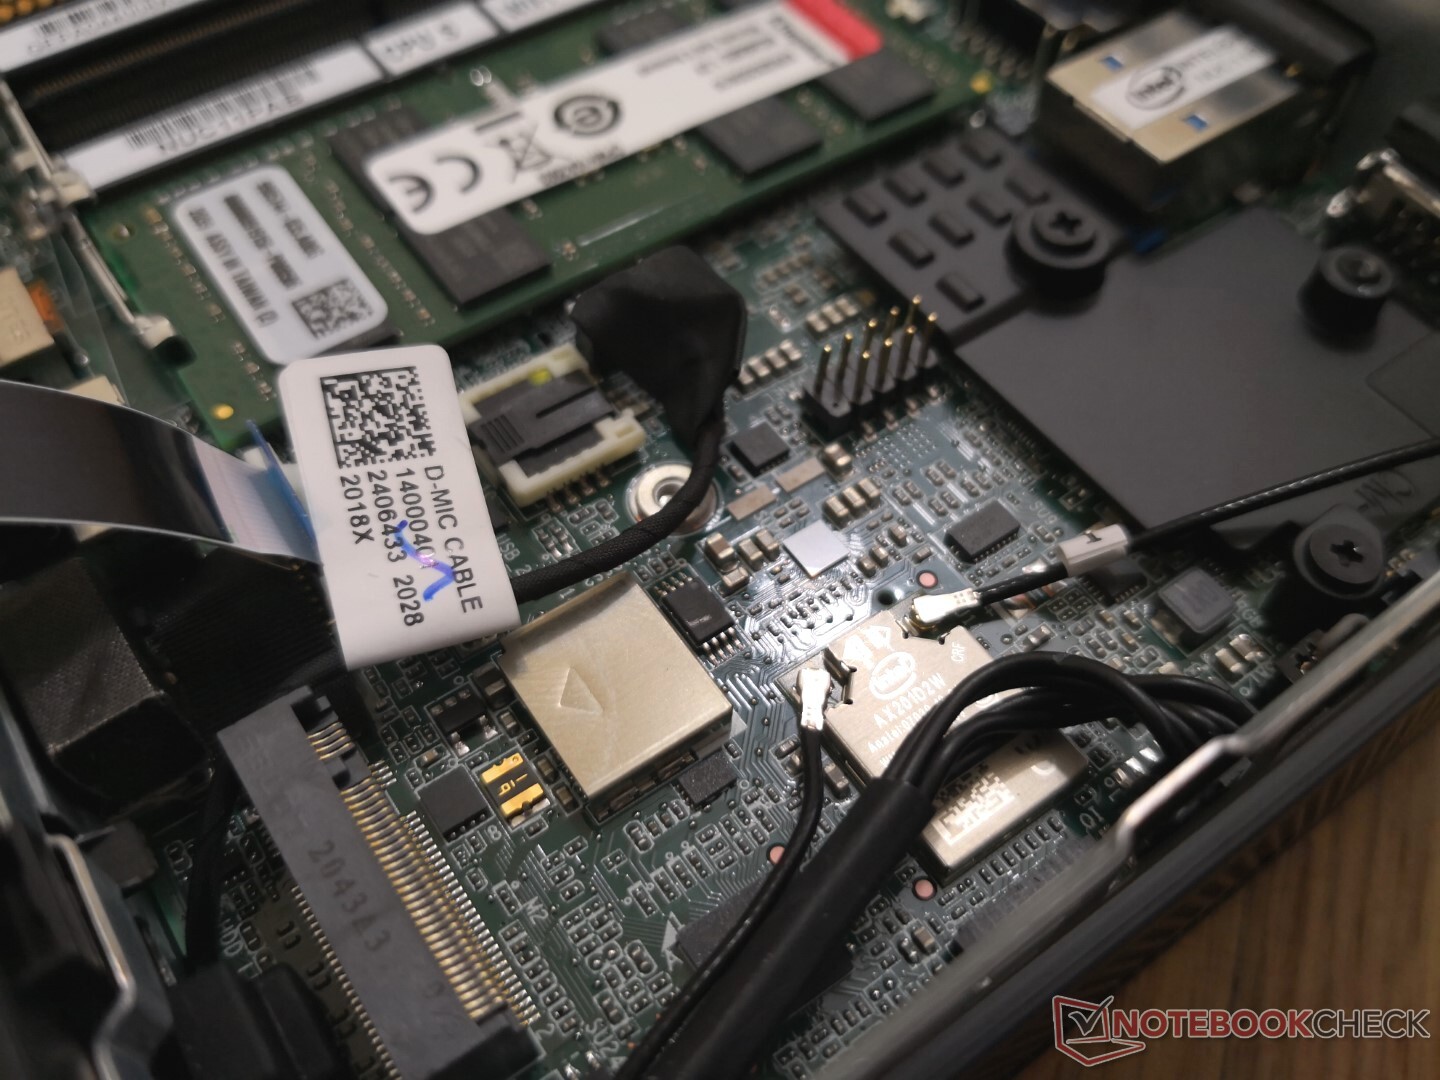
El NUC 11PAQ adopta la forma y los materiales habituales de los diseños anteriores de NUC, pero con una nueva "alfombrilla" de carga Qi de goma en la parte superior. Parece más elegante que el plástico liso y brillante del NUC 10 del año pasado, pero la superficie de goma atraerá el polvo y la piel como si nada. La nueva característica también será inútil para los propietarios que pretendan ocultar sus unidades NUC bajo las mesas o montarlas verticalmente detrás de los monitores
Conectividad
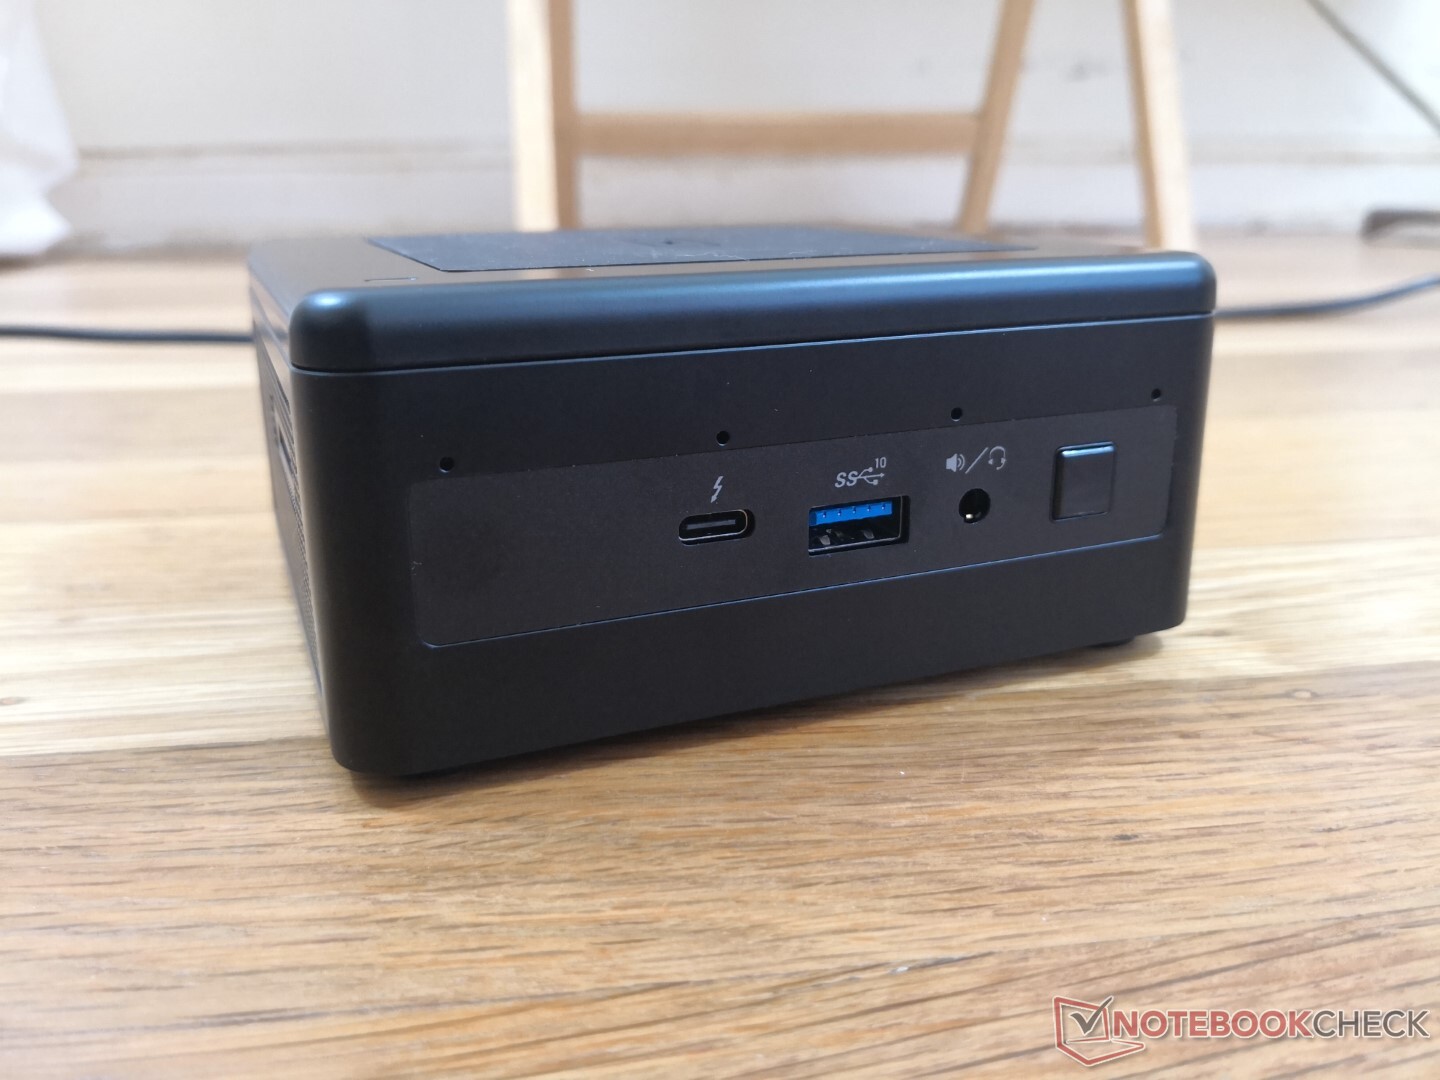
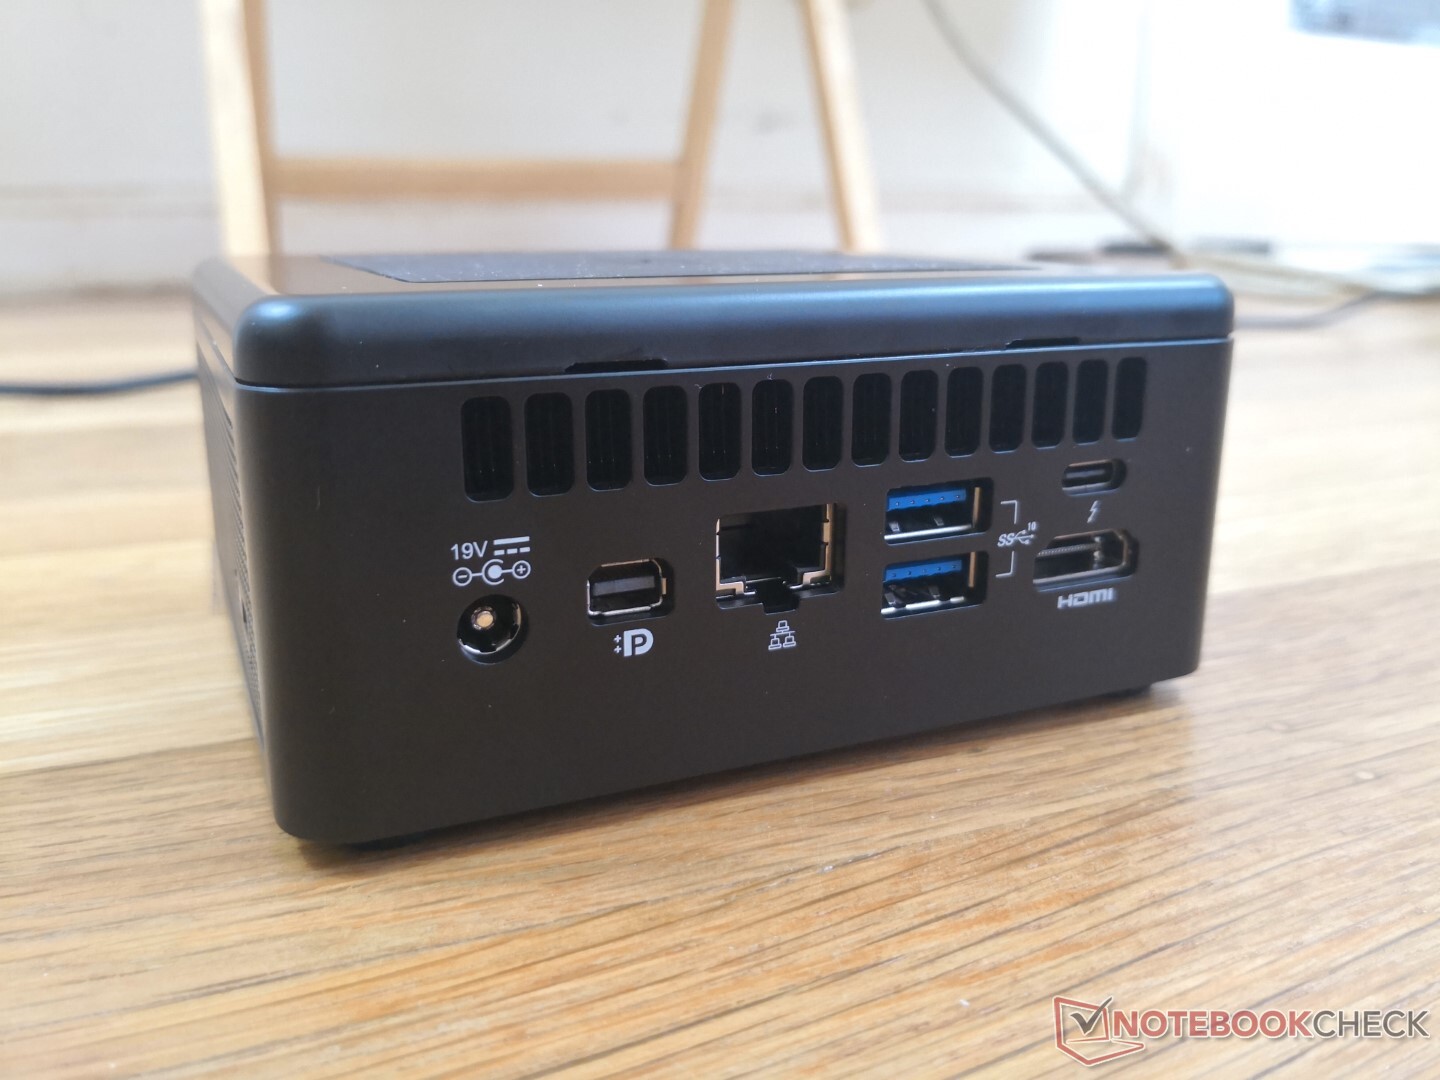
El NUC 11 incluye todos los puertos que se encuentran en el NUC 10, aunque ligeramente reordenados. Una nueva adición es el mini DisplayPort 1.4 como cuarta opción de salida de vídeo a los puertos HDMI y 2x Thunderbolt 3 existentes.
Por desgracia, el adaptador de CA propietario sigue siendo necesario para alimentar la NUC, ya que ninguno de los puertos USB-C admite la alimentación.
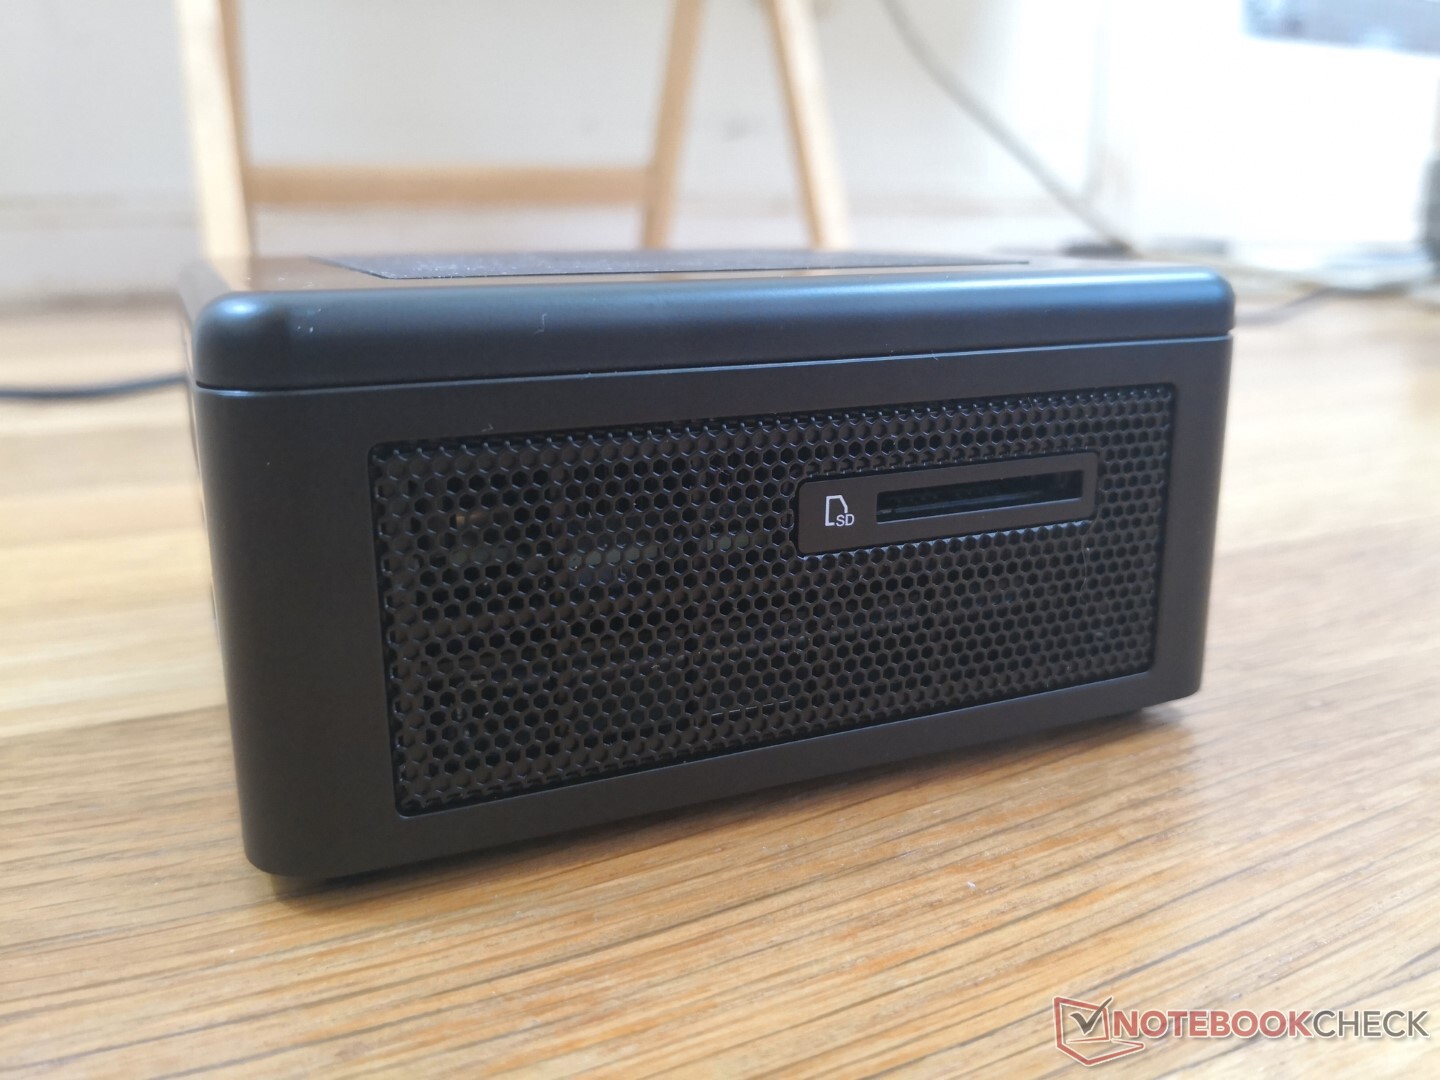
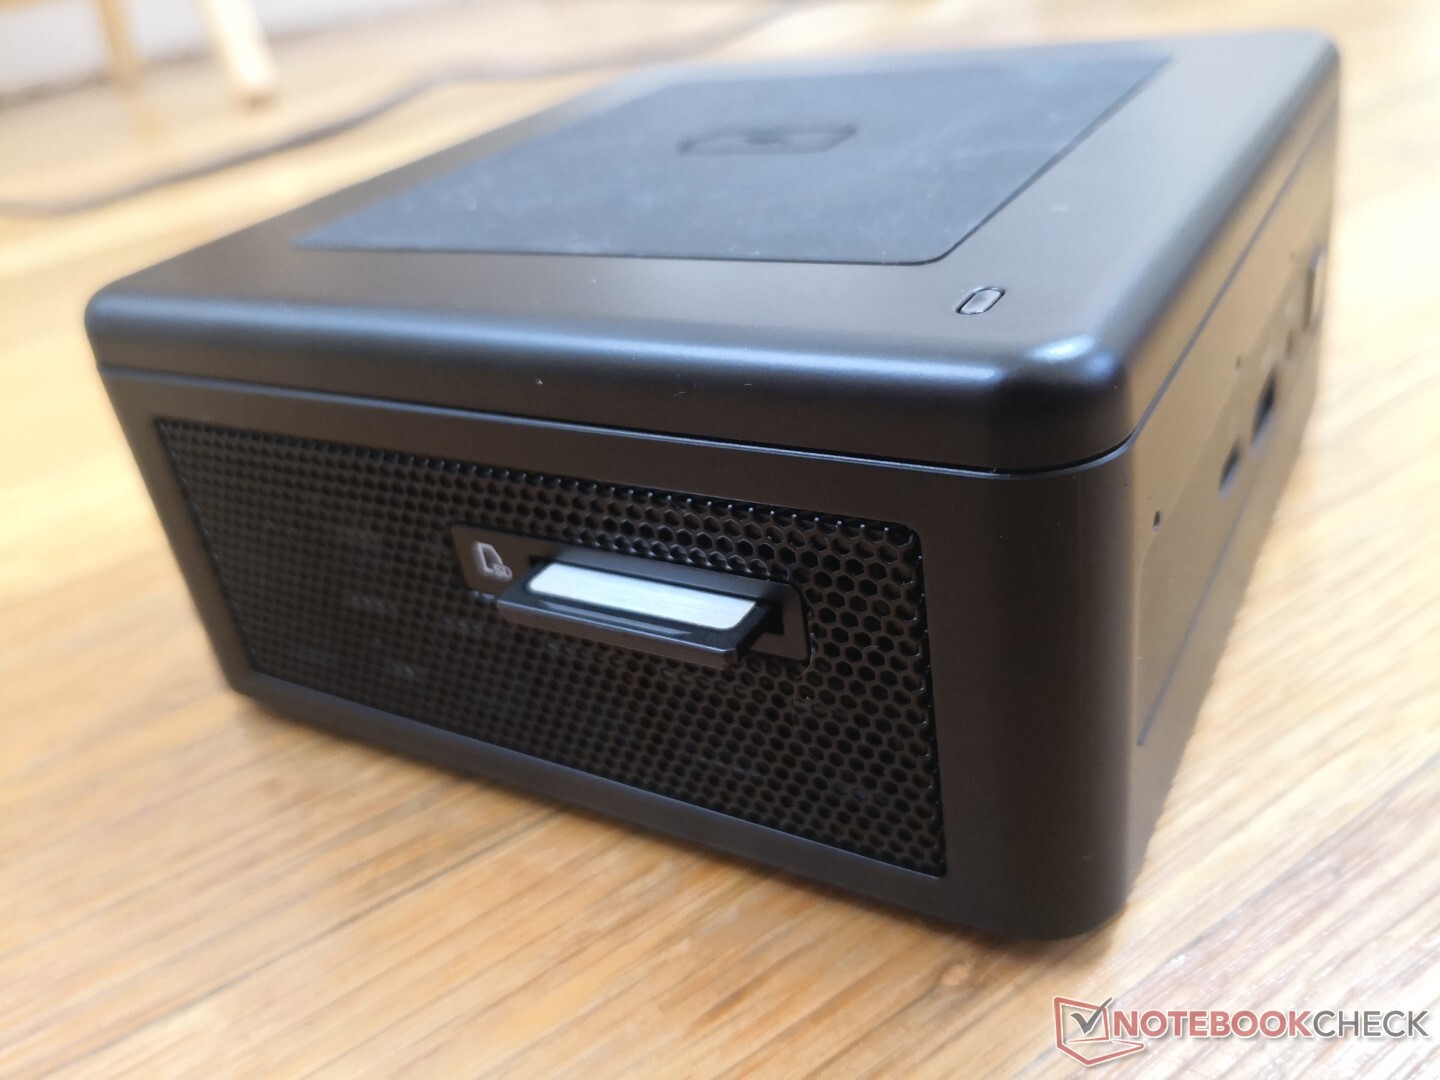
Lector de tarjetas SD
Las velocidades de transferencia del lector de tarjetas integrado son más de dos veces más rápidas que en el antiguo NUC Hades Canyon. Mover 1 GB de archivos desde nuestra tarjeta de prueba UHS-II lleva entre 5 y 6 segundos, frente a los 12 segundos del Hades Canyon.
| SD Card Reader | |
| average JPG Copy Test (av. of 3 runs) | |
| Intel NUC11PAQi7 (Toshiba Exceria Pro SDXC 64 GB UHS-II) | |
| Intel Hades Canyon NUC8i7HVK (Toshiba Exceria Pro SDXC 64 GB UHS-II) | |
| Intel NUC8i7BE (Toshiba Exceria Pro M501 UHS-II) | |
| Zotac ZBox MI643 (Toshiba Exceria Pro M501 UHS-II) | |
| Beelink SEi10 (Toshiba Exceria Pro M501 UHS-II) | |
| maximum AS SSD Seq Read Test (1GB) | |
| Intel NUC11PAQi7 (Toshiba Exceria Pro SDXC 64 GB UHS-II) | |
| Intel Hades Canyon NUC8i7HVK (Toshiba Exceria Pro SDXC 64 GB UHS-II) | |
| Intel NUC8i7BE (Toshiba Exceria Pro M501 UHS-II) | |
| Zotac ZBox MI643 (Toshiba Exceria Pro M501 UHS-II) | |
| Beelink SEi10 (Toshiba Exceria Pro M501 UHS-II) | |
Comunicación
Wi-Fi 6 y Bluetooth 5.1 vienen de serie a través del Intel AX201. Aunque no experimentamos ningún problema de conectividad, las tasas de transferencia en bruto son más lentas de lo esperado en comparación con los portátiles con el mismo módulo AX201, aproximadamente la mitad. Sospechamos que esto puede deberse a una antena más débil en el NUC.
| Networking | |
| iperf3 transmit AX12 | |
| Beelink SEi10 | |
| Intel NUC8i7BE | |
| Intel NUC11PAQi7 | |
| Intel Hades Canyon NUC8i7HVK | |
| Zotac ZBox MI643 | |
| iperf3 receive AX12 | |
| Beelink SEi10 | |
| Intel NUC11PAQi7 | |
| Intel NUC8i7BE | |
| Intel Hades Canyon NUC8i7HVK | |
| Zotac ZBox MI643 | |
Mantenimiento
El panel inferior proporciona acceso directo a la ranura M.2 2280, la ranura SATA III de 2,5 pulgadas y las dos ranuras SODIMM. Se requiere un desmontaje adicional para acceder al ventilador y a la almohadilla de carga. Intel ha hecho la cinta SATA III de 2,5 pulgadas más larga esta vez para facilitar el mantenimiento.
Accesorios y garantía
La caja incluye cuatro tornillos de montaje y los manuales habituales. No se incluye un soporte de montaje.
La garantía limitada de tres años viene de serie con todas las nuevas compras.
Rendimiento
Procesador
El rendimiento de la CPU es excelente, con una puntuación en CineBench R15 xT muy superior a la media del Core i7-1165G7 de nuestra base de datos en al menos un 15 por ciento. Esta diferencia se amplía cuando se comparan los resultados de CineBench R20 xT porque el Intel NUC es mejor para mantener velocidades de reloj más altas durante más tiempo que la mayoría de los portátiles con la misma CPU. Los procesadores AMD Zen 2 menos caros, como el Ryzen 5 4500U o el Ryzen 7 4700U, son capaces de rivalizar con nuestro Intel, aunque con un rendimiento de un solo hilo más lento.
Si se opta por los SKU Core i3-1115G4 o Core i5-1135G7 NUC de menor tamaño, se producirá un déficit de rendimiento multihilo del 30% y el 65%, respectivamente.
Cinebench R15: CPU Multi 64Bit | CPU Single 64Bit
Blender: v2.79 BMW27 CPU
7-Zip 18.03: 7z b 4 -mmt1 | 7z b 4
Geekbench 5.5: Single-Core | Multi-Core
HWBOT x265 Benchmark v2.2: 4k Preset
LibreOffice : 20 Documents To PDF
R Benchmark 2.5: Overall mean
Cinebench R15: CPU Multi 64Bit | CPU Single 64Bit
Blender: v2.79 BMW27 CPU
7-Zip 18.03: 7z b 4 -mmt1 | 7z b 4
Geekbench 5.5: Single-Core | Multi-Core
HWBOT x265 Benchmark v2.2: 4k Preset
LibreOffice : 20 Documents To PDF
R Benchmark 2.5: Overall mean
* ... más pequeño es mejor
Rendimiento del sistema
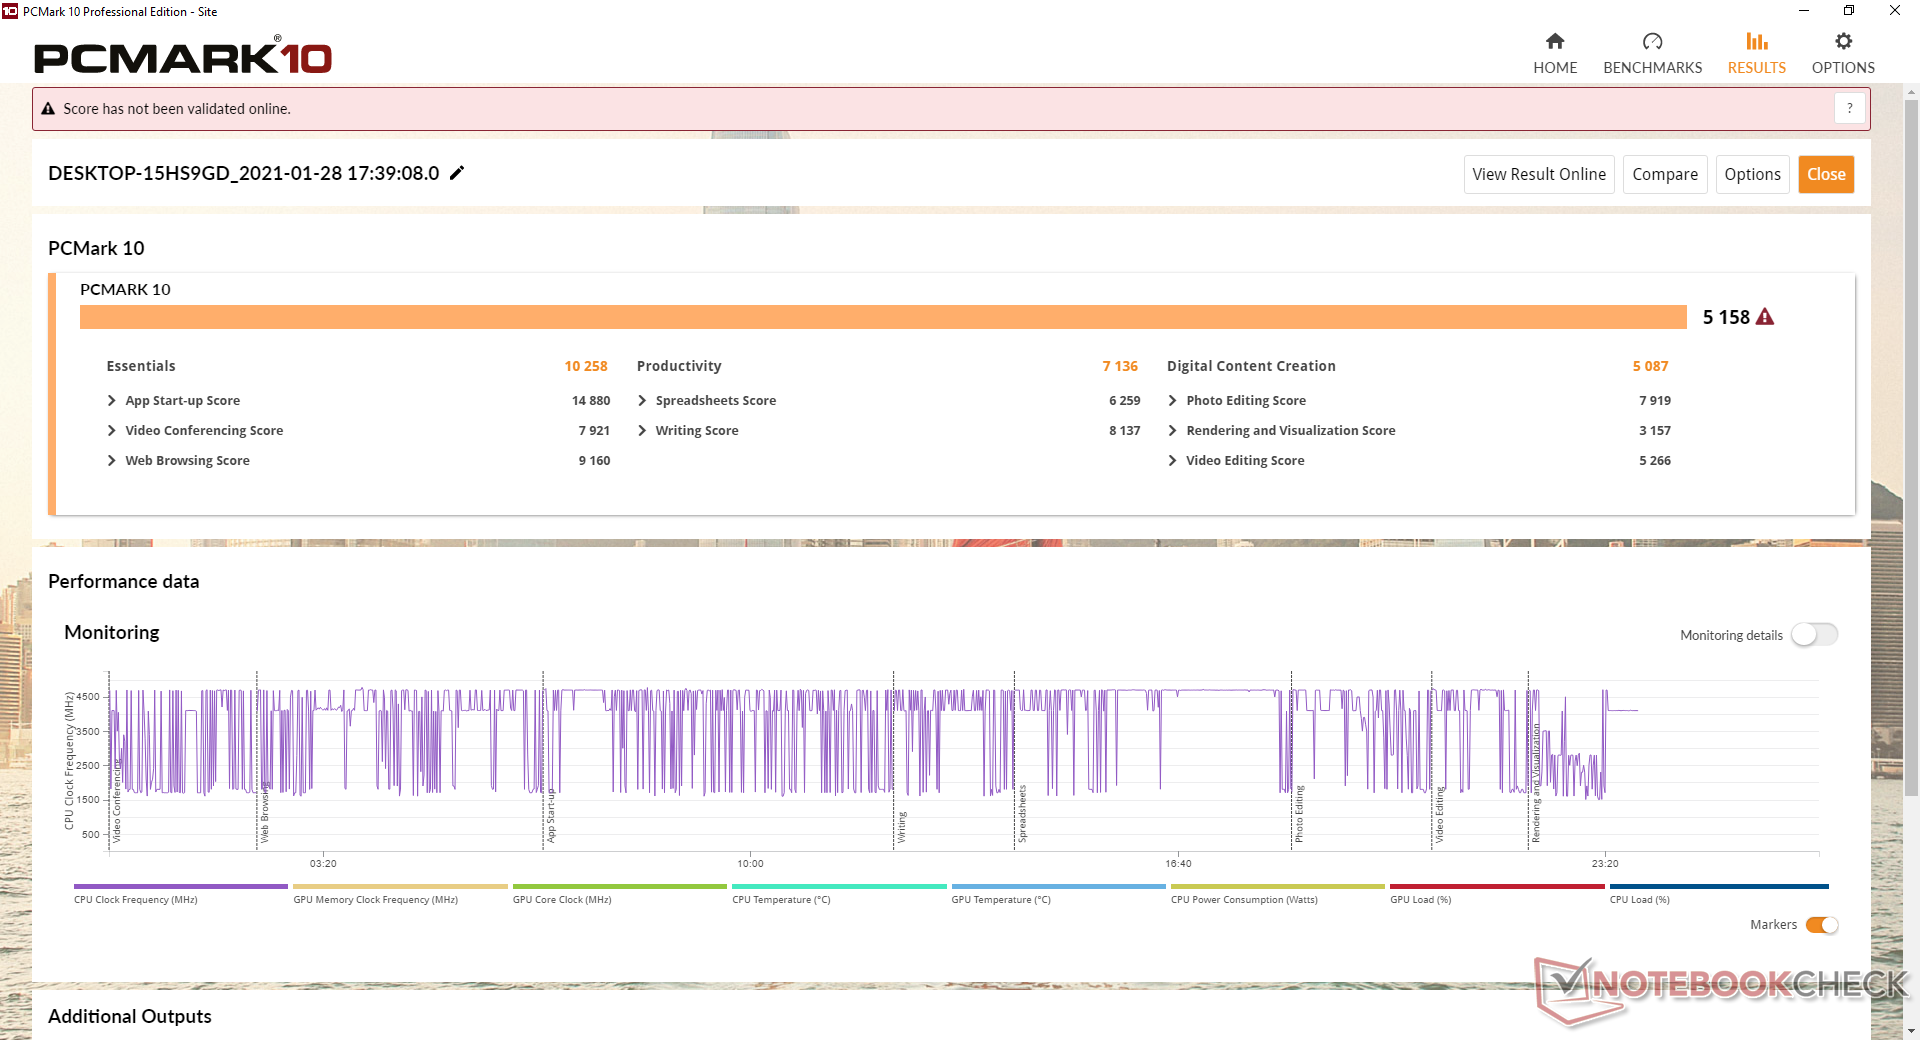
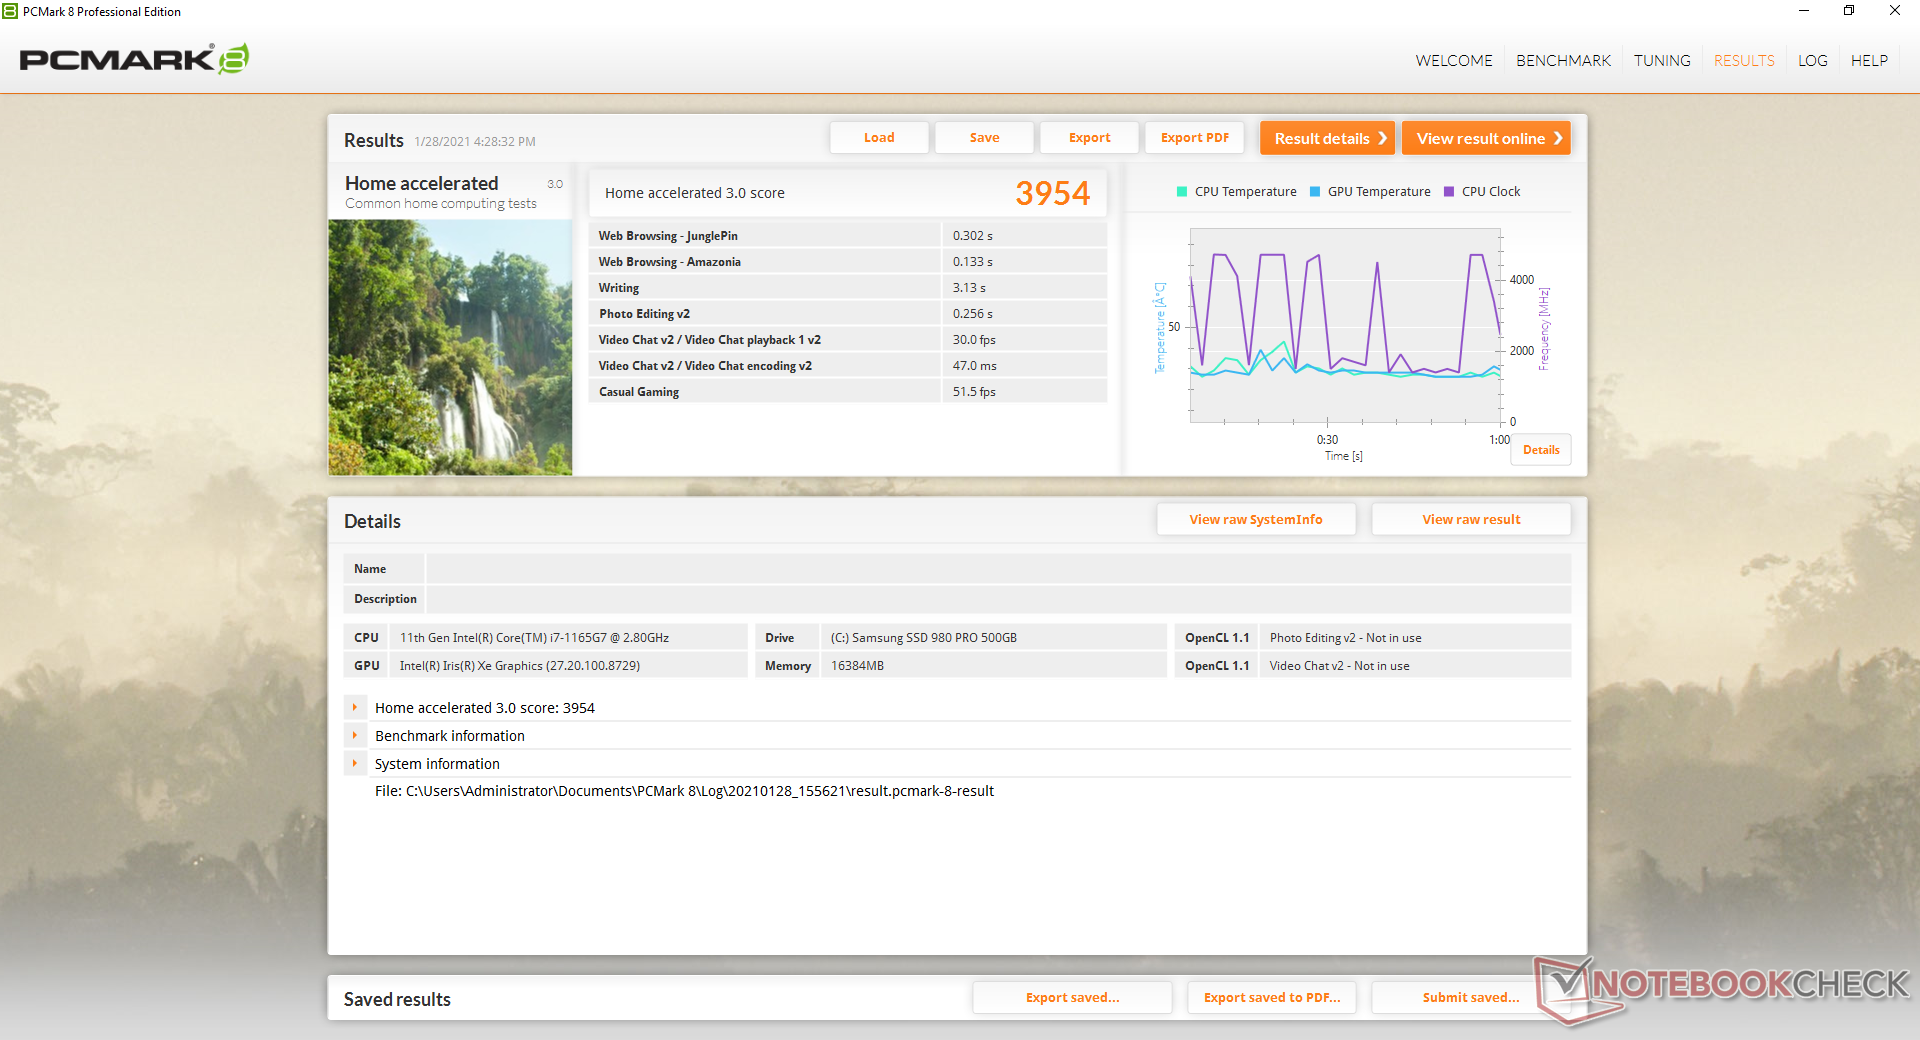
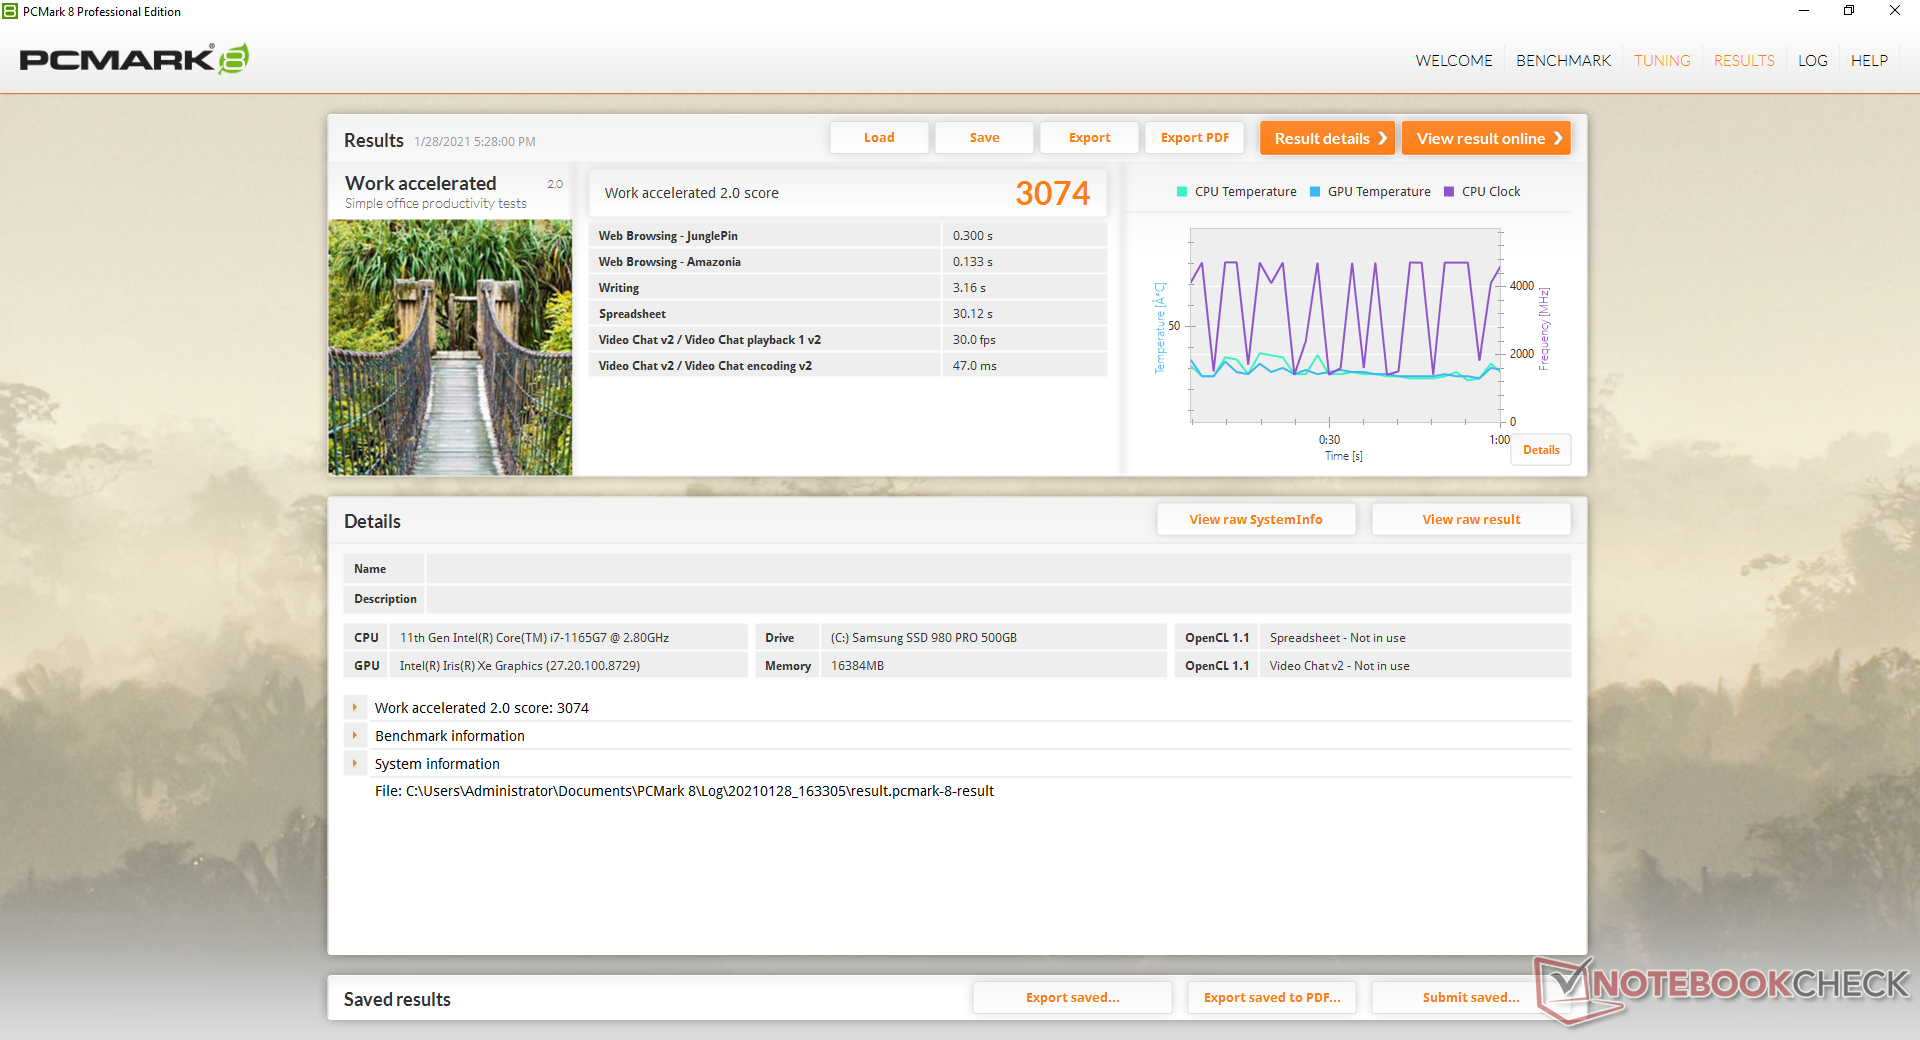
| PCMark 8 Home Score Accelerated v2 | 3954 puntos | |
| PCMark 8 Work Score Accelerated v2 | 3074 puntos | |
| PCMark 10 Score | 5158 puntos | |
ayuda | ||
Latencia del CPD
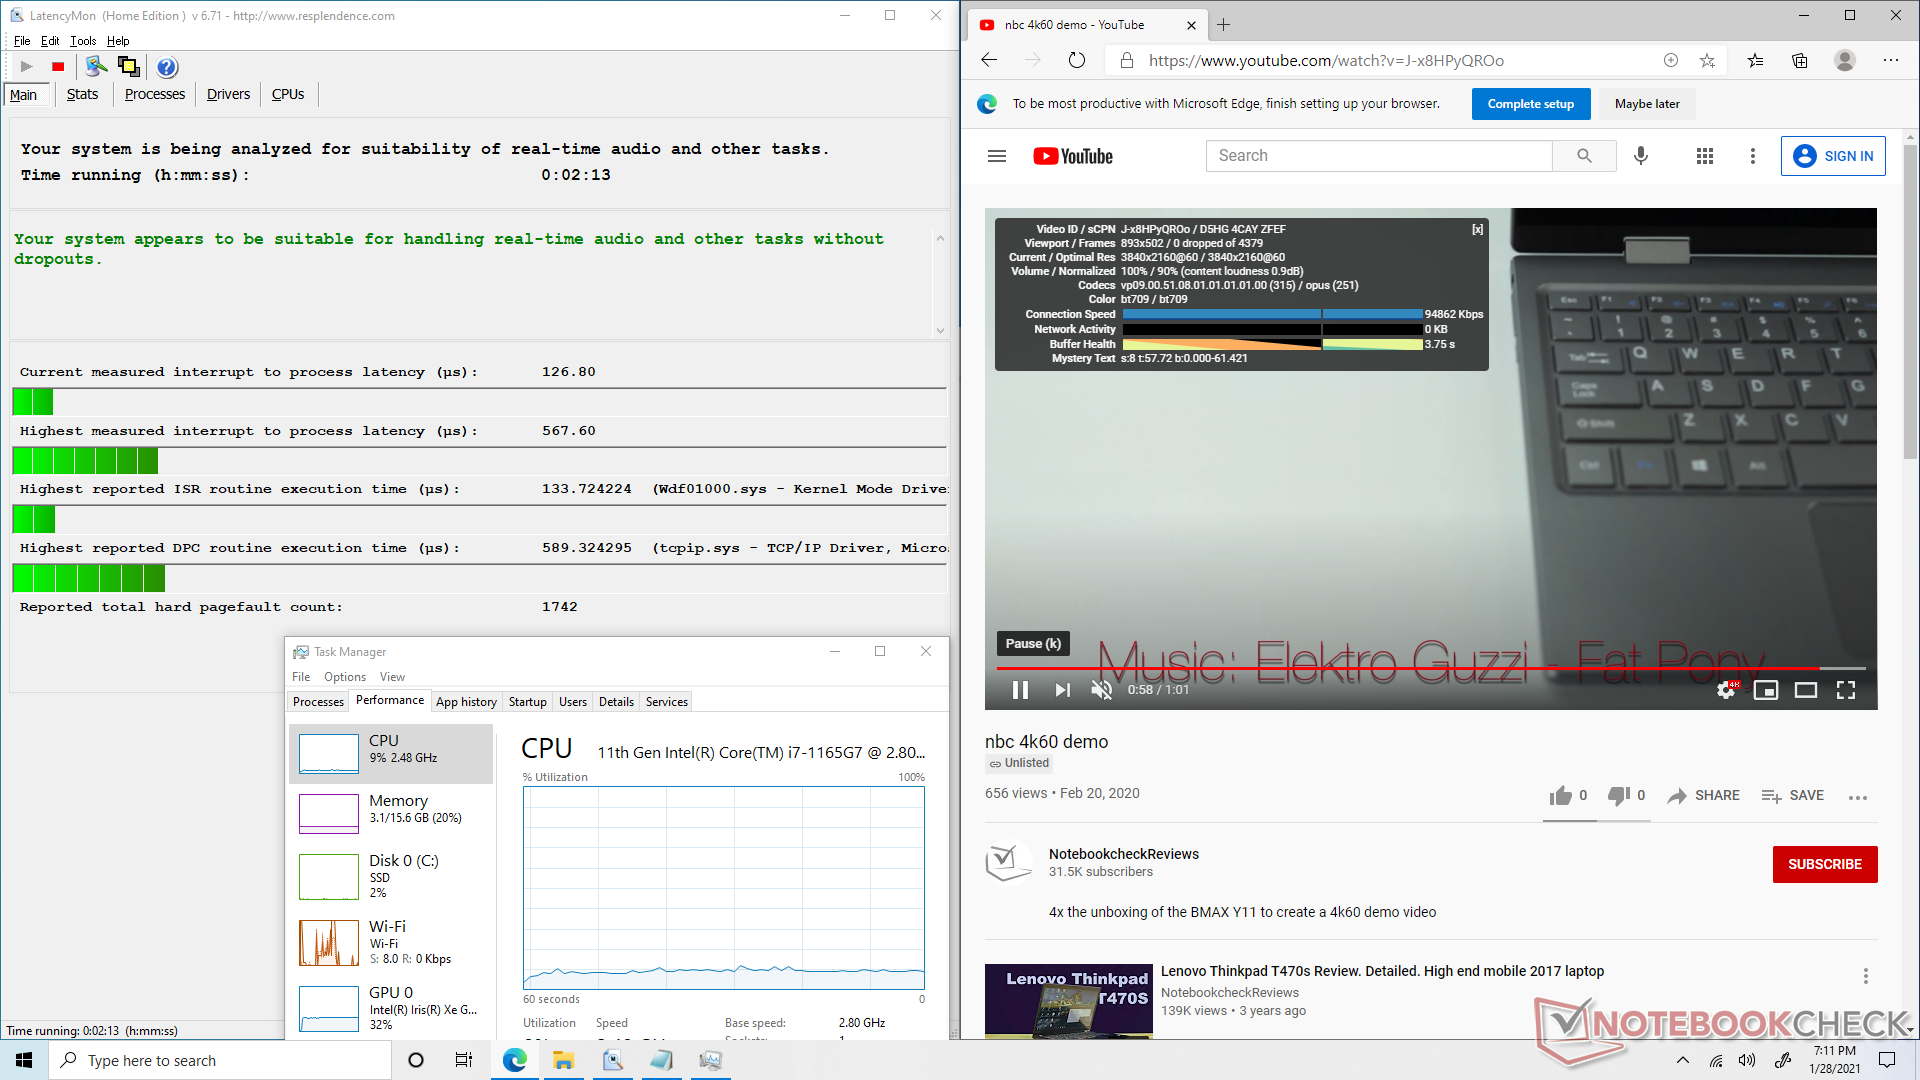
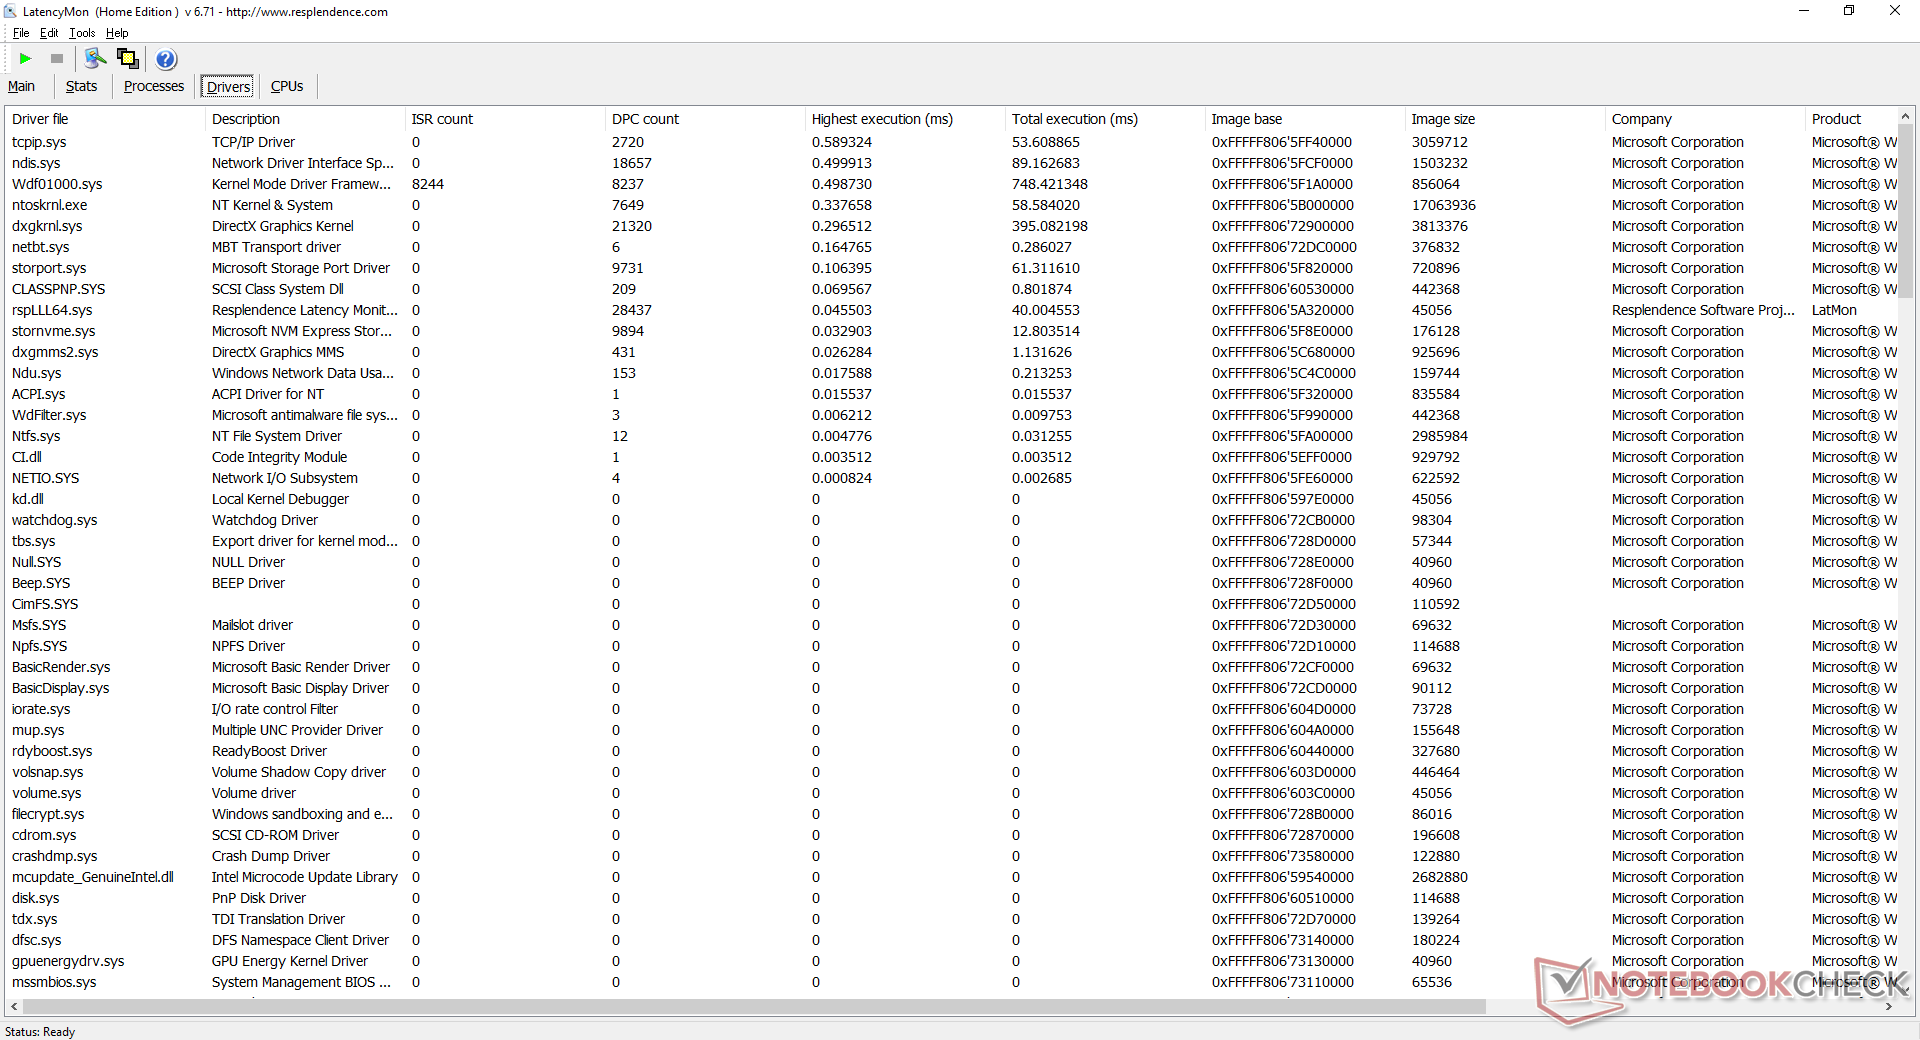
LatencyMon no muestra problemas de latencia DPC. La reproducción de vídeo 4K a 60 FPS también es fluida y sin pérdida de frames. La GPU Iris Xe se mantiene estable con un 32% de utilización frente al 50% de la antigua Iris Plus G7.
| DPC Latencies / LatencyMon - interrupt to process latency (max), Web, Youtube, Prime95 | |
| Beelink SEi10 | |
| Zotac ZBox MI643 | |
| Intel NUC11PAQi7 | |
* ... más pequeño es mejor
Dispositivos de almacenamiento
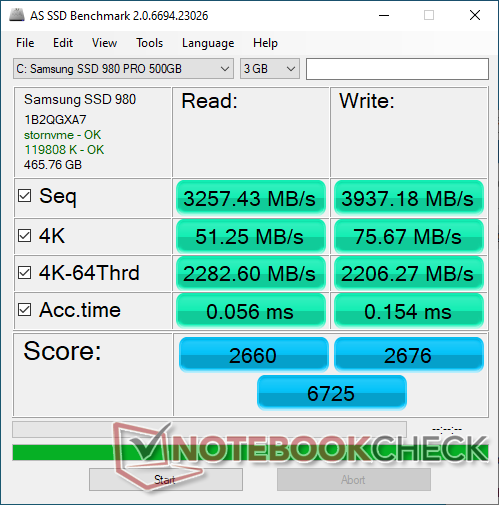
Nuestra unidad viene con un SSD Samsung 980 Pro de 500 GB para unas tasas teóricas de lectura y escritura de hasta 6900 MB/s y 5000 MB/s, respectivamente. Hemos podido confirmar estas cifras anunciadas al ejecutar DiskSpd en un bucle, como muestra el gráfico siguiente. Hay que tener en cuenta que se incluye un acolchado térmico y un fino disipador de calor.
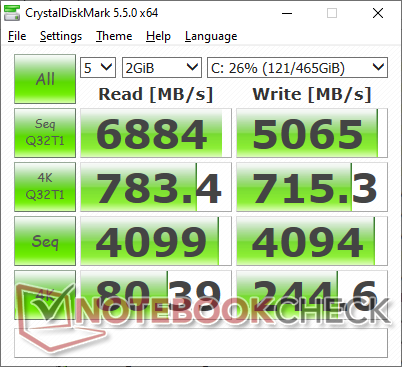

| Intel NUC11PAQi7 Samsung SSD 980 Pro 500GB MZ-V8P500BW | Intel NUC10i7FNH Kingston RBUSNS8154P3256GJ1 | Intel Hades Canyon NUC8i7HVK Intel Optane 120 GB SSDPEK1W120GA | Beelink SEi10 Silicon Motion AZW 256G M.2280 NVMe 4X 200725 D | Zotac ZBox MI643 Lexar NM610 1TB | |
|---|---|---|---|---|---|
| AS SSD | -58% | -20% | -83% | -40% | |
| Seq Read (MB/s) | 3257 | 1306 -60% | 1379 -58% | 1111 -66% | 1511 -54% |
| Seq Write (MB/s) | 3937 | 611 -84% | 553 -86% | 323.5 -92% | 1558 -60% |
| 4K Read (MB/s) | 51.3 | 21.53 -58% | 127.9 149% | 33.1 -35% | 43.77 -15% |
| 4K Write (MB/s) | 75.7 | 53.5 -29% | 103.5 37% | 66.2 -13% | 119.5 58% |
| 4K-64 Read (MB/s) | 2283 | 652 -71% | 1258 -45% | 357.3 -84% | 839 -63% |
| 4K-64 Write (MB/s) | 2206 | 648 -71% | 556 -75% | 154.8 -93% | 909 -59% |
| Access Time Read * (ms) | 0.056 | 0.114 -104% | 0.025 55% | 0.066 -18% | 0.032 43% |
| Access Time Write * (ms) | 0.154 | 0.07 55% | 0.033 79% | 0.616 -300% | 0.242 -57% |
| Score Read (Points) | 2660 | 804 -70% | 1524 -43% | 501 -81% | 1034 -61% |
| Score Write (Points) | 2676 | 762 -72% | 714 -73% | 253 -91% | 1185 -56% |
| Score Total (Points) | 6725 | 1944 -71% | 3023 -55% | 983 -85% | 2760 -59% |
| Copy ISO MB/s (MB/s) | 2030 | 976 -52% | 1125 -45% | 1160 -43% | 1373 -32% |
| Copy Program MB/s (MB/s) | 883 | 346 -61% | 342.4 -61% | 121.1 -86% | 280.4 -68% |
| Copy Game MB/s (MB/s) | 1817 | 735 -60% | 768 -58% | 364.4 -80% | 531 -71% |
| CrystalDiskMark 5.2 / 6 | 6% | -45% | -51% | -48% | |
| Write 4K (MB/s) | 244.6 | 442.4 81% | 133.7 -45% | 203 -17% | 214.1 -12% |
| Read 4K (MB/s) | 80.4 | 371.1 362% | 178.6 122% | 63.2 -21% | 62.1 -23% |
| Write Seq (MB/s) | 4094 | 900 -78% | 608 -85% | 1114 -73% | 1664 -59% |
| Read Seq (MB/s) | 4099 | 1582 -61% | 1428 -65% | 1765 -57% | 1797 -56% |
| Write 4K Q32T1 (MB/s) | 715 | 373.8 -48% | 323.6 -55% | 423.9 -41% | 421.8 -41% |
| Read 4K Q32T1 (MB/s) | 783 | 374.9 -52% | 282.3 -64% | 389.2 -50% | 512 -35% |
| Write Seq Q32T1 (MB/s) | 5065 | 893 -82% | 627 -88% | 1104 -78% | 564 -89% |
| Read Seq Q32T1 (MB/s) | 6884 | 1582 -77% | 1521 -78% | 1990 -71% | 2073 -70% |
| Write 4K Q8T8 (MB/s) | 399.1 | ||||
| Read 4K Q8T8 (MB/s) | 688 | ||||
| Media total (Programa/Opciones) | -26% /
-35% | -33% /
-29% | -67% /
-72% | -44% /
-43% |
* ... más pequeño es mejor

Disk Throttling: DiskSpd Read Loop, Queue Depth 8
Rendimiento de la GPU
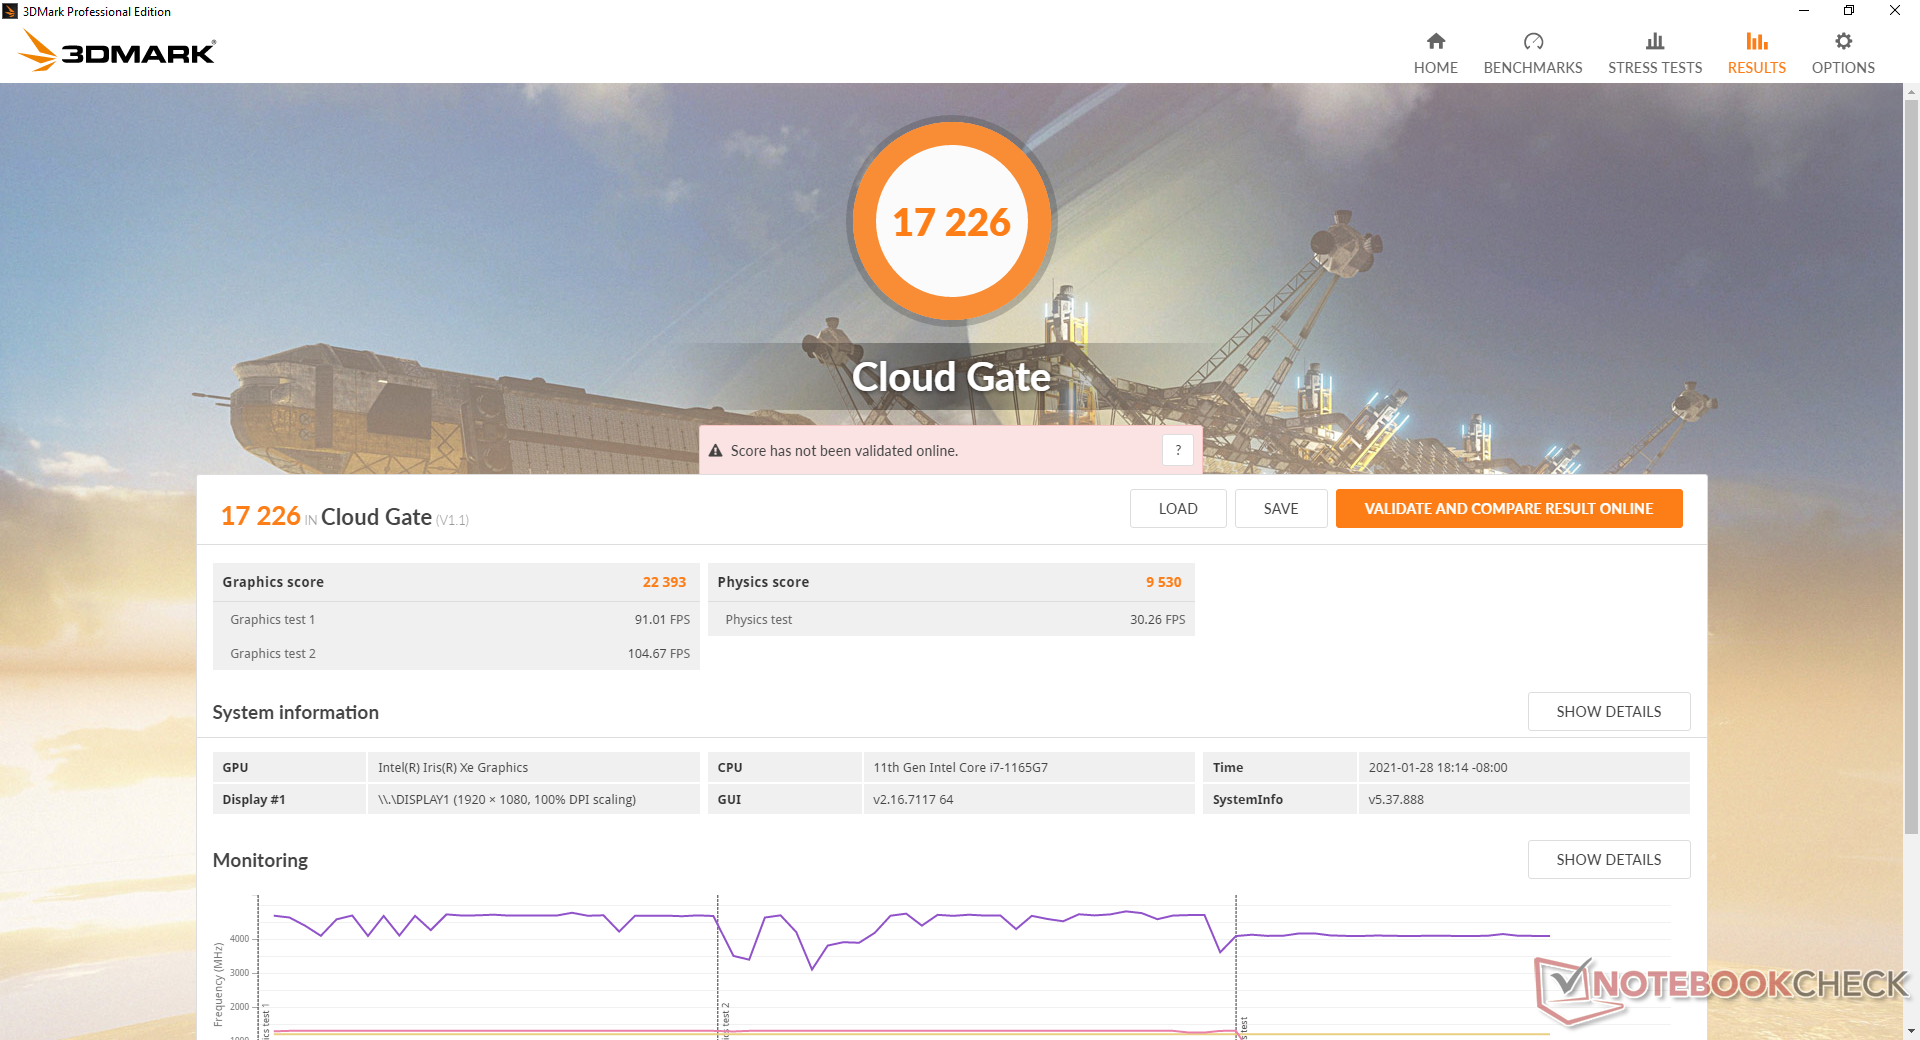
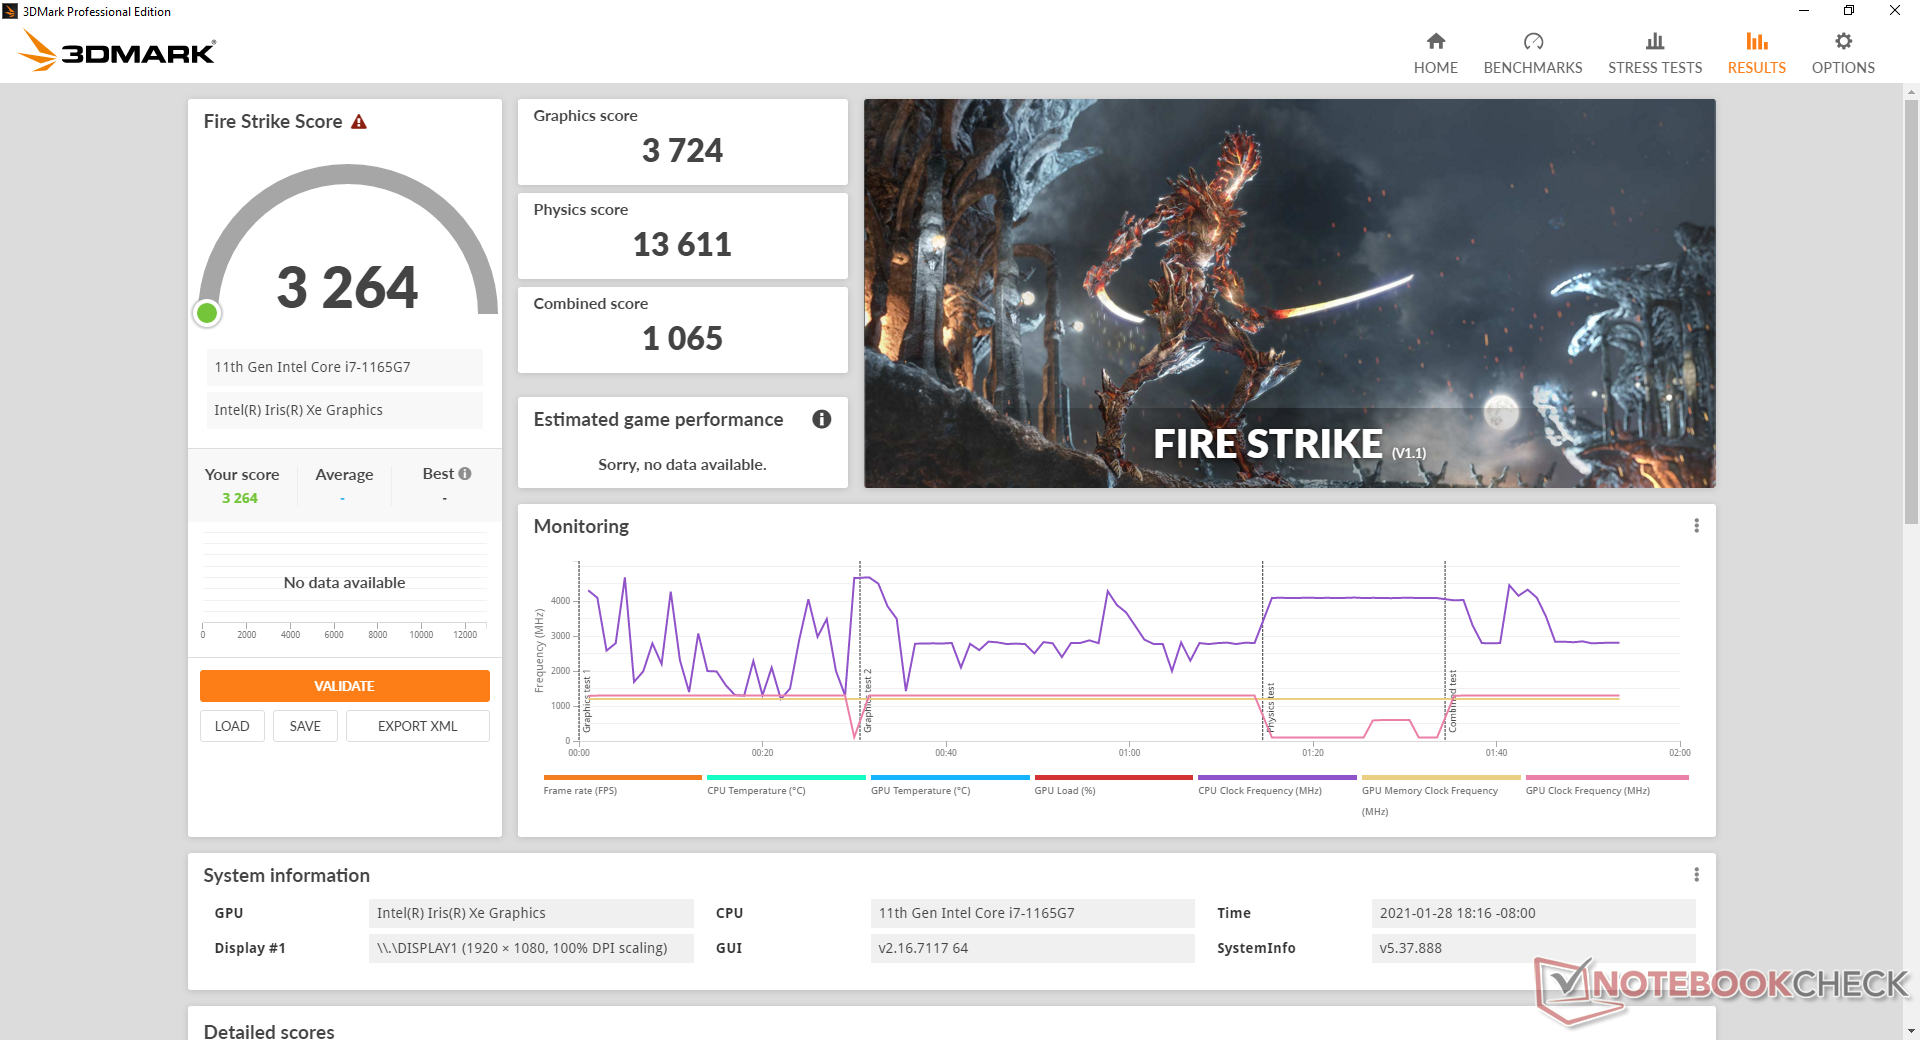
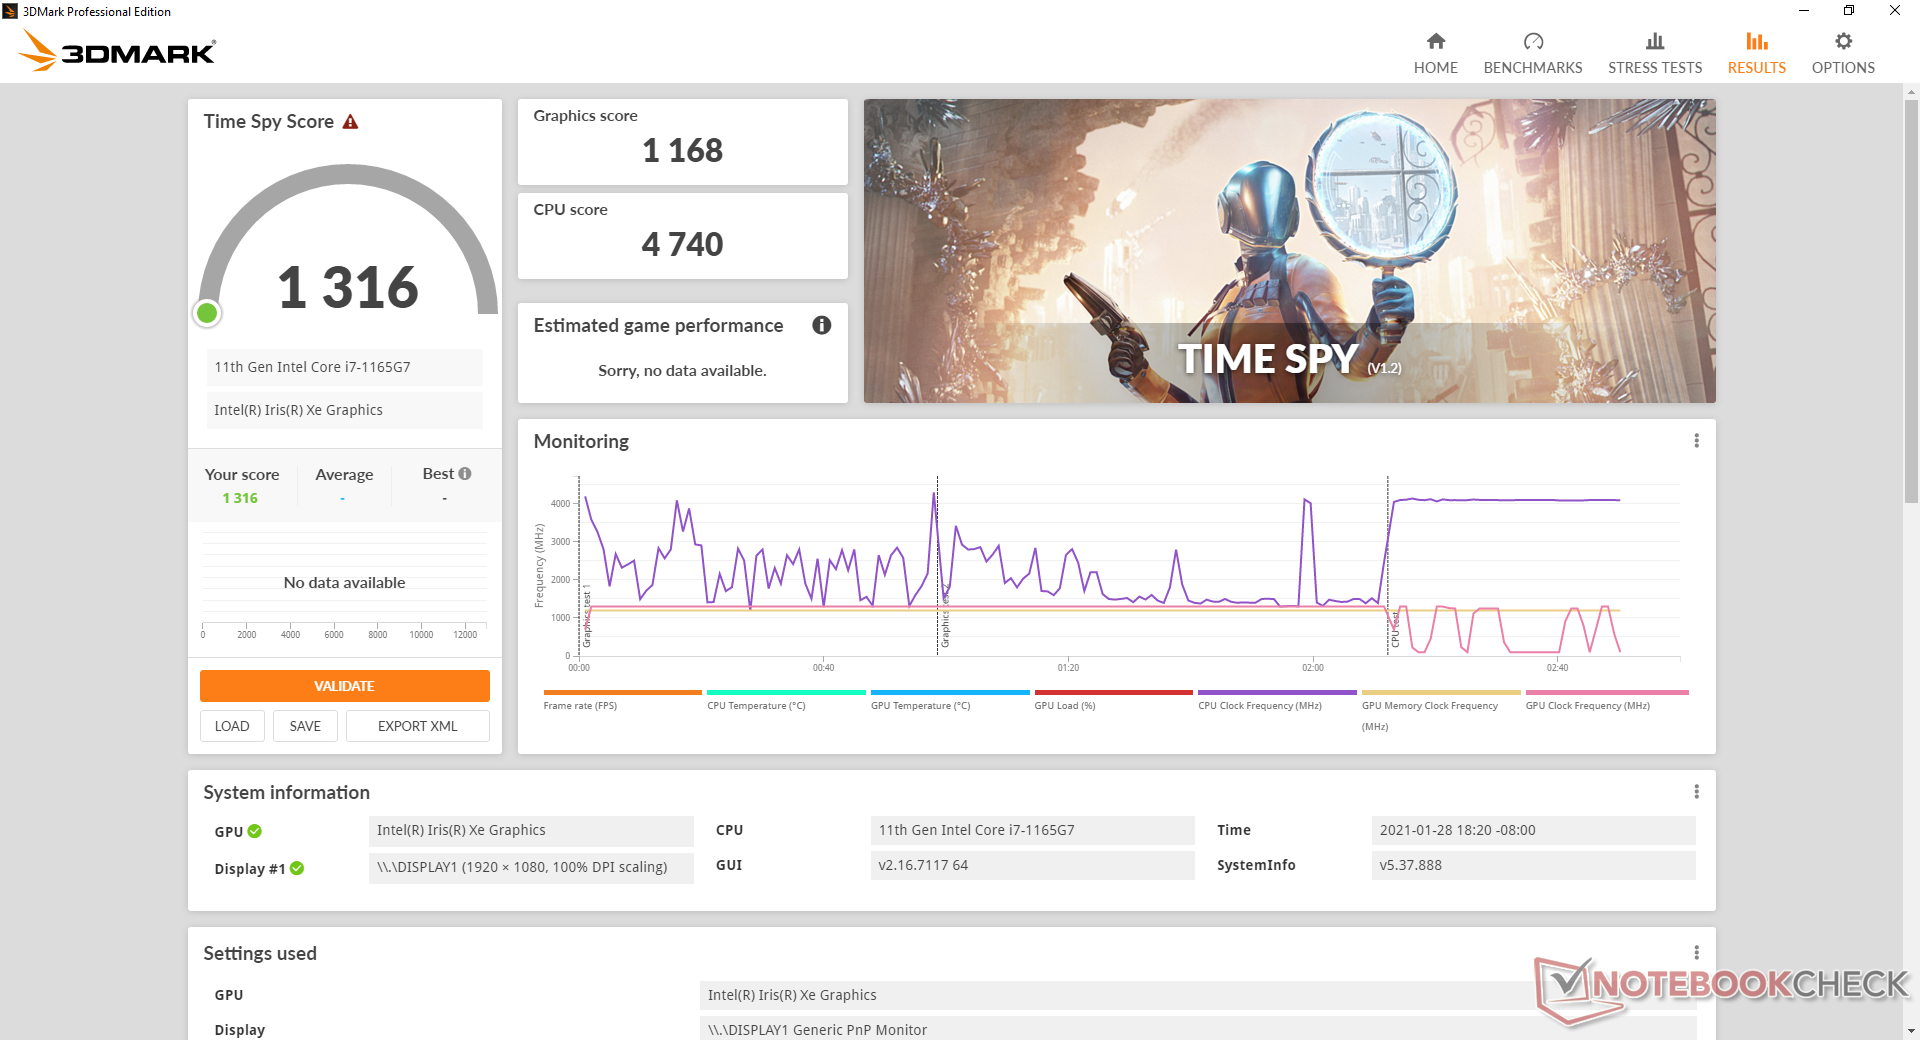
Las puntuaciones de 3DMark son aproximadamente un 15 por ciento más lentas que la media de los Iris Xe 96 EU de nuestra base de datos, a pesar de que el rendimiento de la CPU es superior a la media. La discrepancia se atribuye probablemente a la RAM de un solo canal de nuestra unidad de análisis. Si hubiera sido de doble canal, los resultados serían probablemente superiores en un 30 por ciento o más, como lo que observamos en el Lenovo IdeaPad Slim 9i.
Se pueden encontrar más pruebas e información técnica sobre el Iris Xe 96 EUs aquí. Optar por el menor Core i5 Iris Xe 80 EUs no tiene por qué significar un menor rendimiento gráfico dependiendo de la configuración de la RAM. Sin embargo, es de esperar que la opción Core i3 UHD Graphics 620 (o Iris Xe 48 EUs) sea significativamente más lenta.
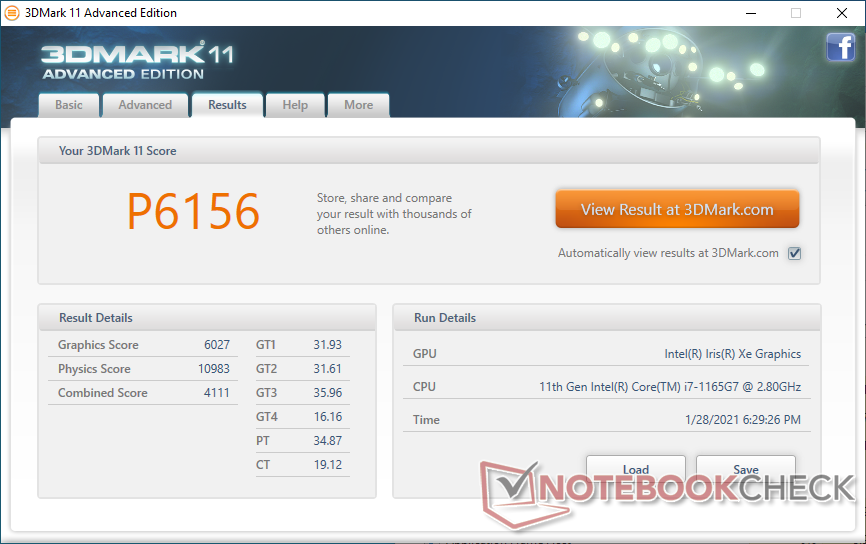
| 3DMark 11 Performance | 6156 puntos | |
| 3DMark Cloud Gate Standard Score | 17226 puntos | |
| 3DMark Fire Strike Score | 3264 puntos | |
| 3DMark Time Spy Score | 1316 puntos | |
ayuda | ||
| bajo | medio | alto | ultra | |
|---|---|---|---|---|
| GTA V (2015) | 67.6 | 52.5 | 12.6 | 5.72 |
| The Witcher 3 (2015) | 70.3 | 43.7 | 20.7 | 10.3 |
| Dota 2 Reborn (2015) | 78.8 | 61.8 | 37.7 | 35 |
| Final Fantasy XV Benchmark (2018) | 30.3 | 15.6 | 12.7 | |
| X-Plane 11.11 (2018) | 42.3 | 32.7 | 28.8 | |
| Strange Brigade (2018) | 66.2 | 23.8 | 20.1 | 16.9 |
Emissions
Ruido del sistema
El ventilador interno pulsa entre el ralentí y los 33,6 dB(A) incluso cuando simplemente se navega por la web o se está en reposo en el escritorio. Aunque no es lo suficientemente ruidoso como para ser molesto o demasiado notorio, hubiera sido preferible un enfoque más constante. El ruido del ventilador en funcionamiento Witcher 3 es estable a 33,6 dB(A) para ser más silencioso de lo esperado inicialmente. Ejecutar otros juegos en configuraciones más bajas para velocidades de fotogramas más altas hará que el ruido del ventilador salte ligeramente.
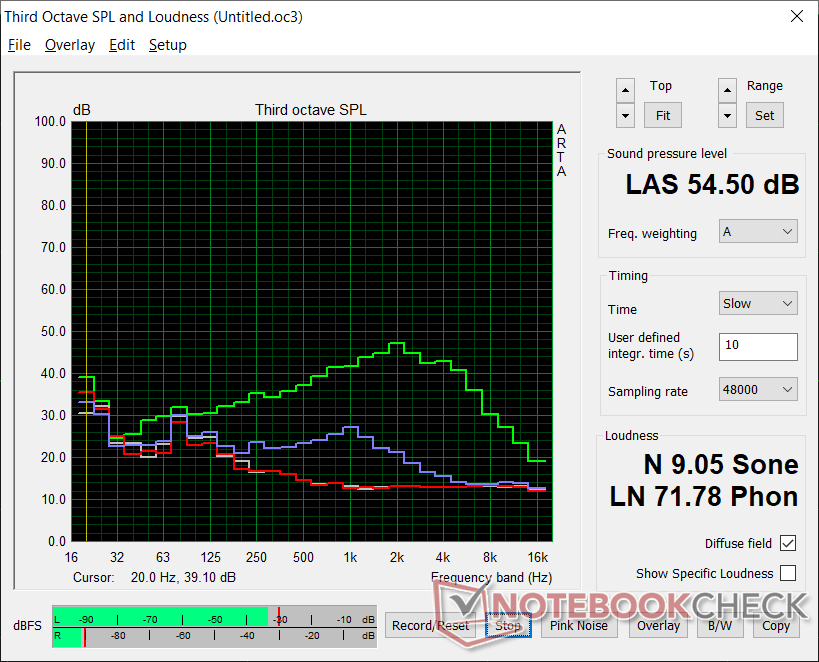
Las cargas extremas como Prime95 elevarán el ruido del ventilador hasta los 49,2 dB(A) e incluso los 54,5 dB(A), siendo mucho más ruidoso que la mayoría de los otros mini PC en condiciones similares. Puede que la CPU sea rápida, pero el ventilador tendrá que trabajar para mantener esos impresionantes niveles de rendimiento.
Podemos notar un pequeño zumbido de la bobina o ruido electrónico en nuestra unidad de prueba.
| Intel NUC11PAQi7 Iris Xe G7 96EUs, i7-1165G7, Samsung SSD 980 Pro 500GB MZ-V8P500BW | Intel NUC8i7BE Iris Plus Graphics 655, i7-8559U | Intel Hades Canyon NUC8i7HVK Vega M GH, i7-8809G, Intel Optane 120 GB SSDPEK1W120GA | Beelink SEi10 UHD Graphics G1 (Ice Lake 32 EU), i3-1005G1, Silicon Motion AZW 256G M.2280 NVMe 4X 200725 D | Zotac ZBox MI643 UHD Graphics 620, i5-10210U, Lexar NM610 1TB | GMK NucBox K1 UHD Graphics 600, Celeron J4125, HIKVision C100 NGFF SSD 128GB | |
|---|---|---|---|---|---|---|
| Noise | -10% | -11% | -17% | 2% | -10% | |
| apagado / medio ambiente * (dB) | 25.6 | 28.7 -12% | 28.7 -12% | 27.5 -7% | 26.1 -2% | 27.8 -9% |
| Idle Minimum * (dB) | 25.6 | 28.7 -12% | 29 -13% | 30.9 -21% | 27.5 -7% | 27.8 -9% |
| Idle Average * (dB) | 25.6 | 29.3 -14% | 29 -13% | 33.5 -31% | 27.5 -7% | 27.8 -9% |
| Idle Maximum * (dB) | 25.6 | 31.8 -24% | 29 -13% | 33.5 -31% | 27.5 -7% | 27.8 -9% |
| Load Average * (dB) | 33.6 | 39 -16% | 36 -7% | 38.5 -15% | 28.9 14% | 46.8 -39% |
| Witcher 3 ultra * (dB) | 33.6 | 39 -16% | 42 -25% | |||
| Load Maximum * (dB) | 54.5 | 41.4 24% | 49.4 9% | 51.6 5% | 42 23% | 46.8 14% |
* ... más pequeño es mejor
Ruido
| Ocioso |
| 25.6 / 25.6 / 25.6 dB(A) |
| Carga |
| 33.6 / 54.5 dB(A) |
 | ||
30 dB silencioso 40 dB(A) audible 50 dB(A) ruidosamente alto |
||
min: | ||
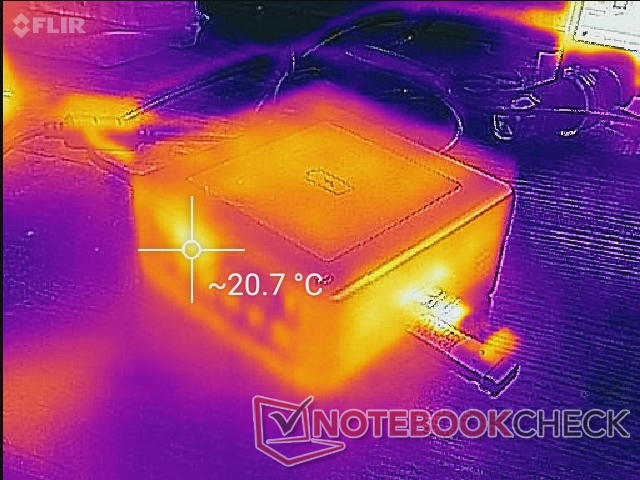
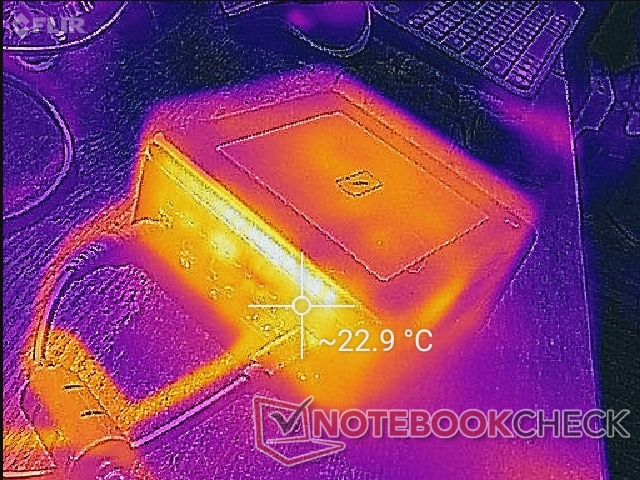
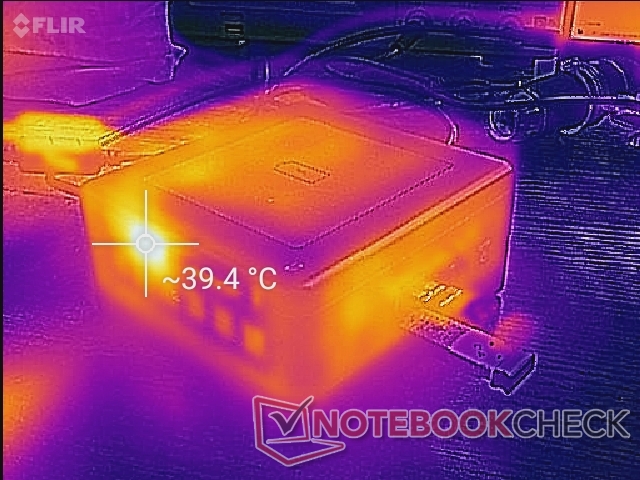
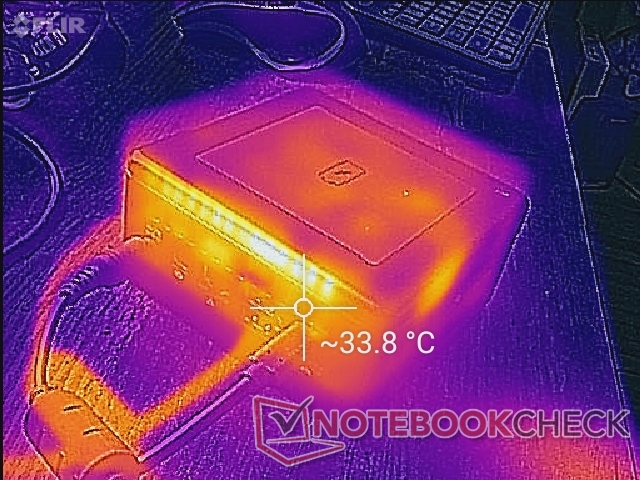
Temperatura
Las temperaturas de la superficie no son un problema incluso cuando está bajo carga. La unidad funcionará bien si se coloca de lado, pero no se recomienda porque las rejillas de ventilación estarán bloqueadas.
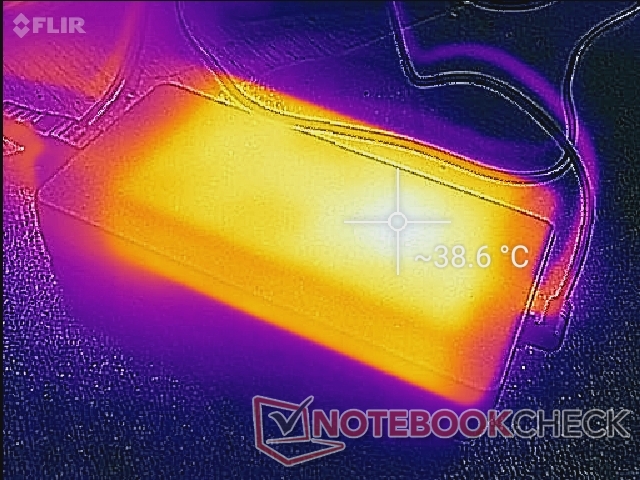
El adaptador de CA puede estar notablemente más caliente que el propio mini PC, a unos 40 C cuando se juega.
Prueba de esfuerzo
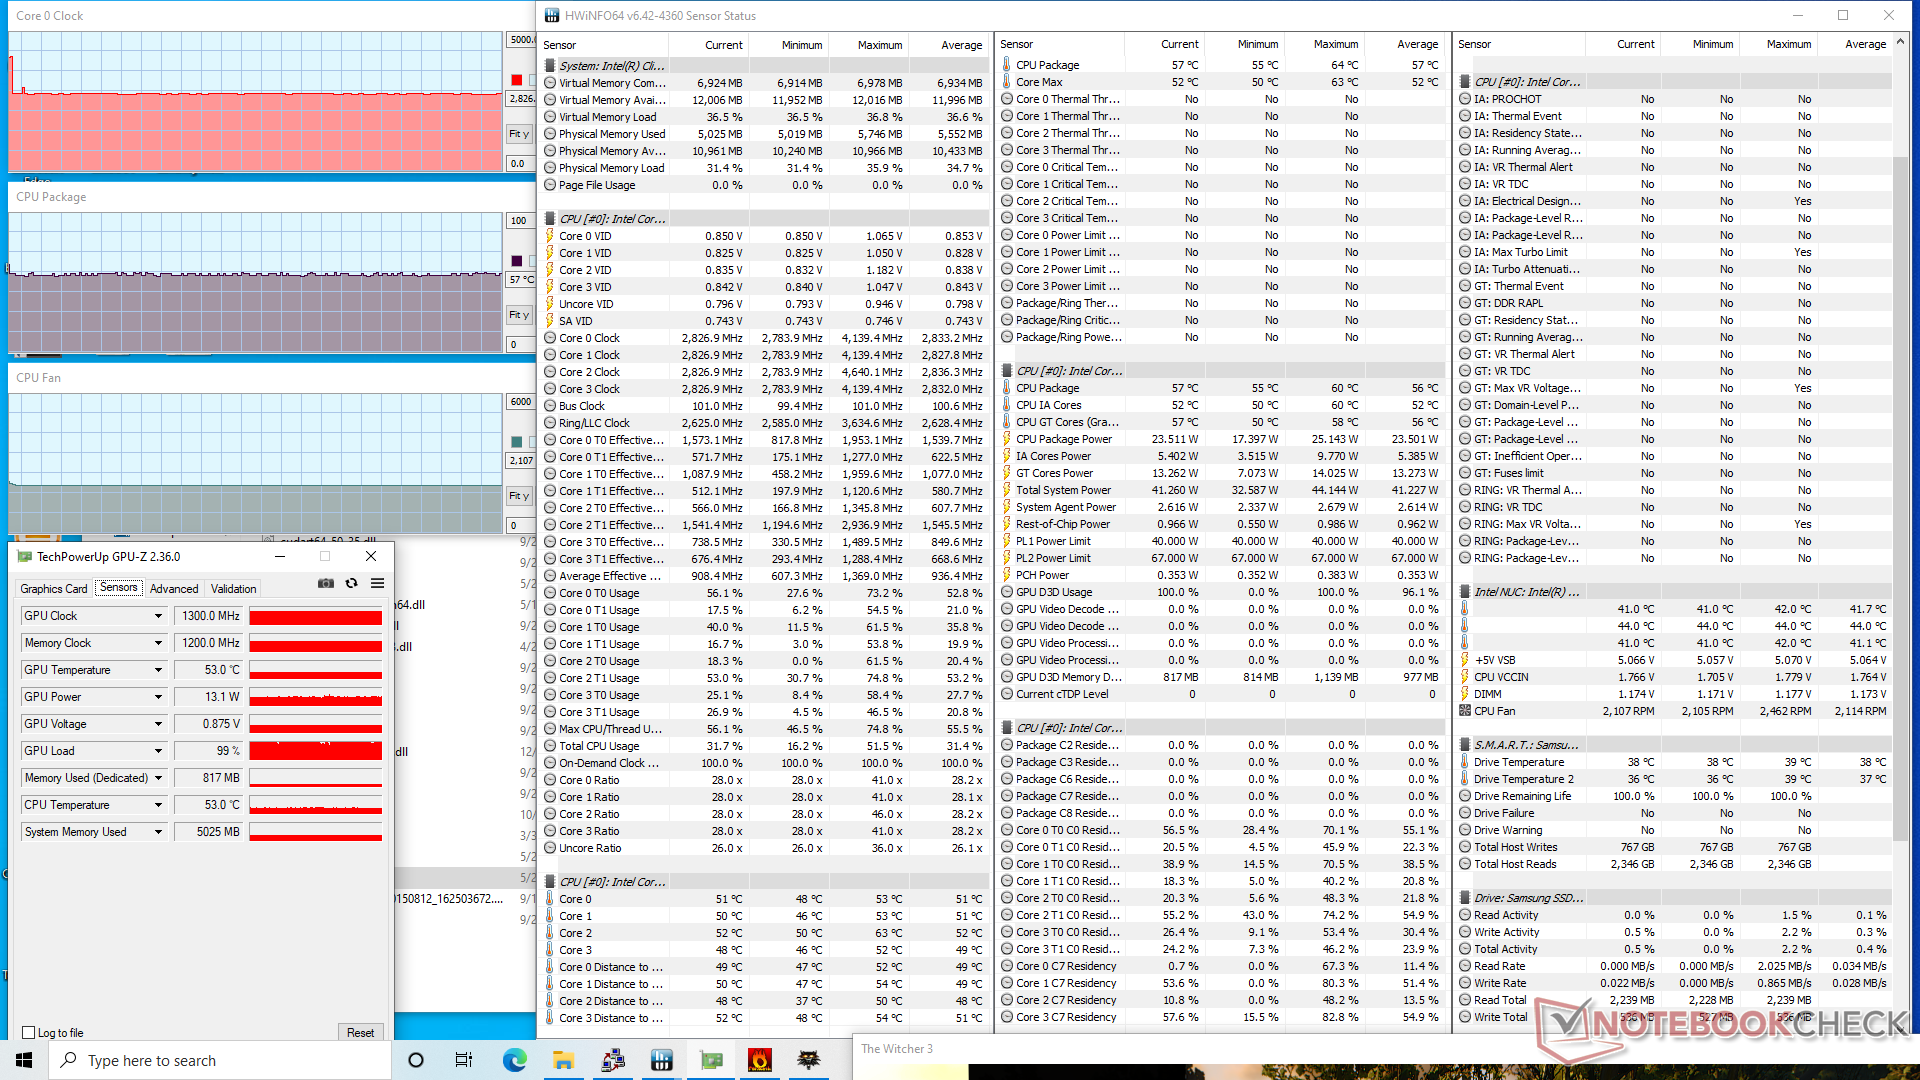
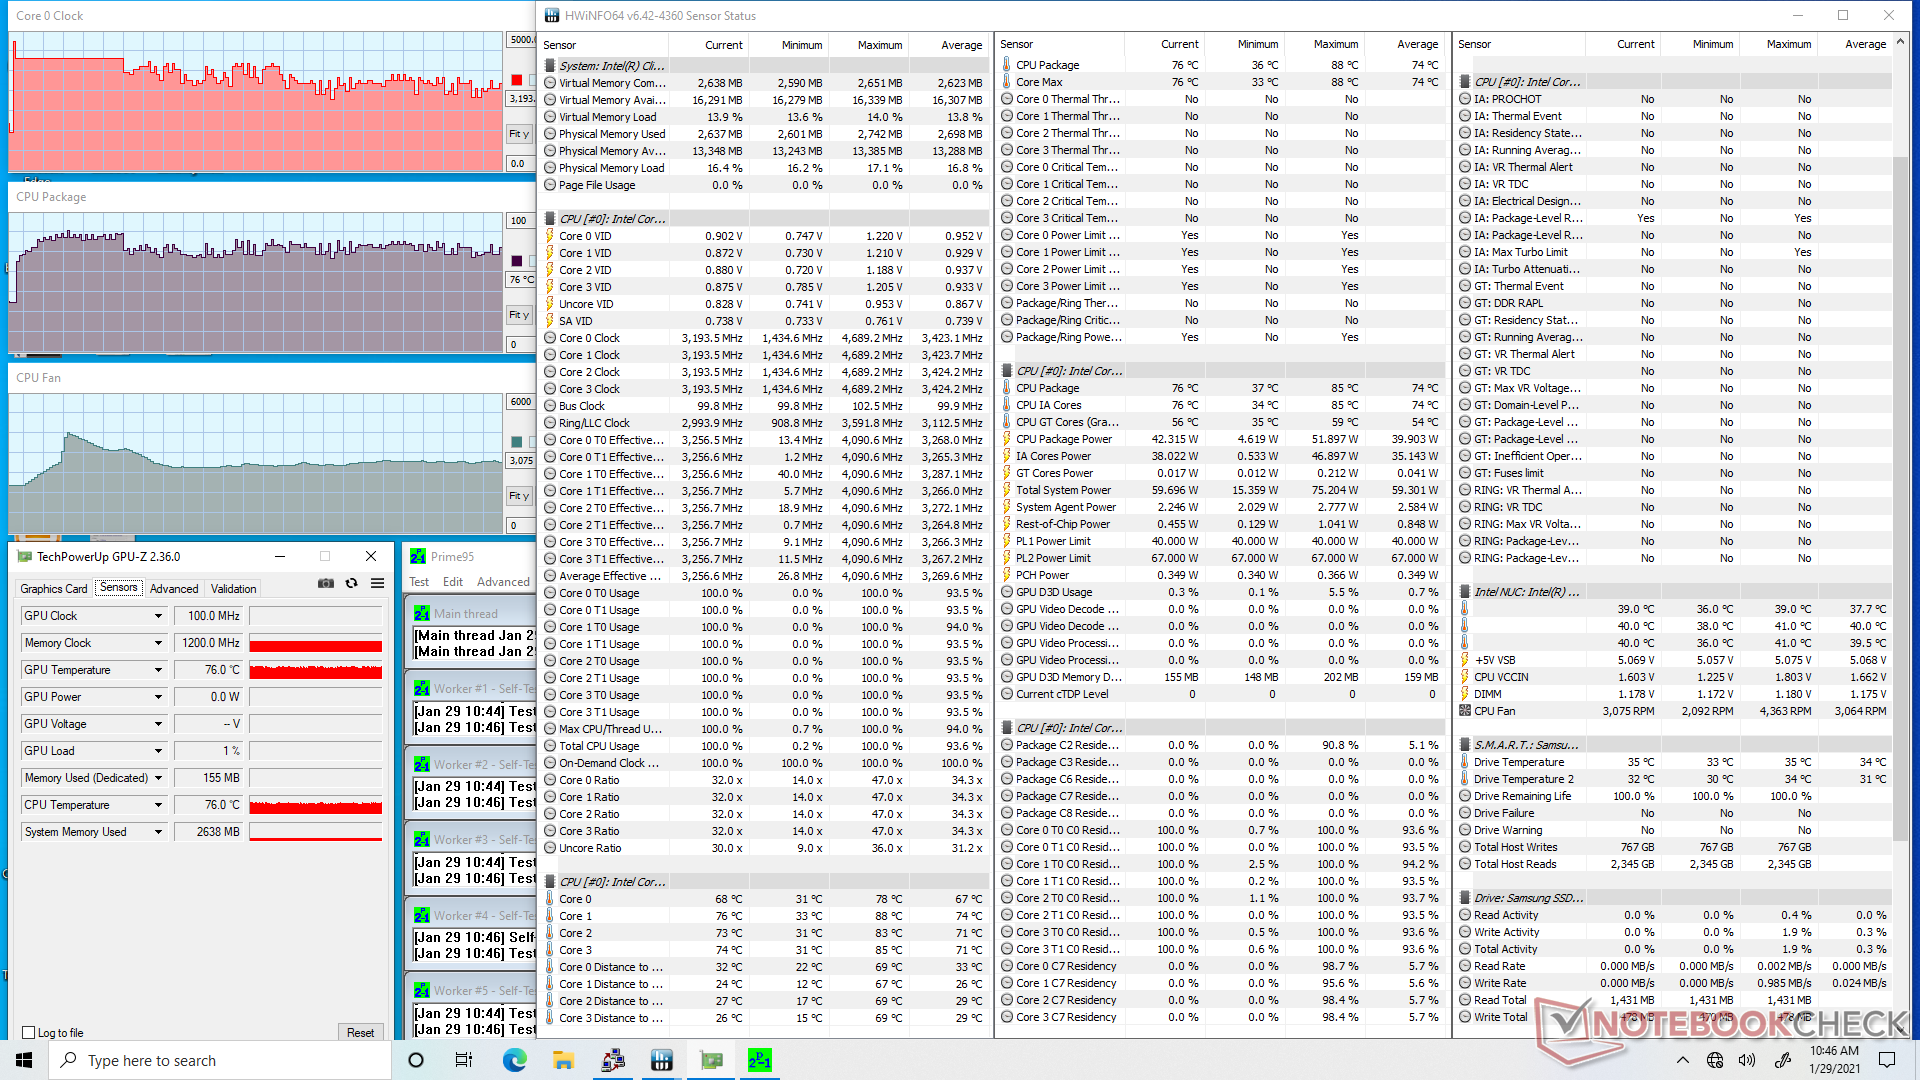
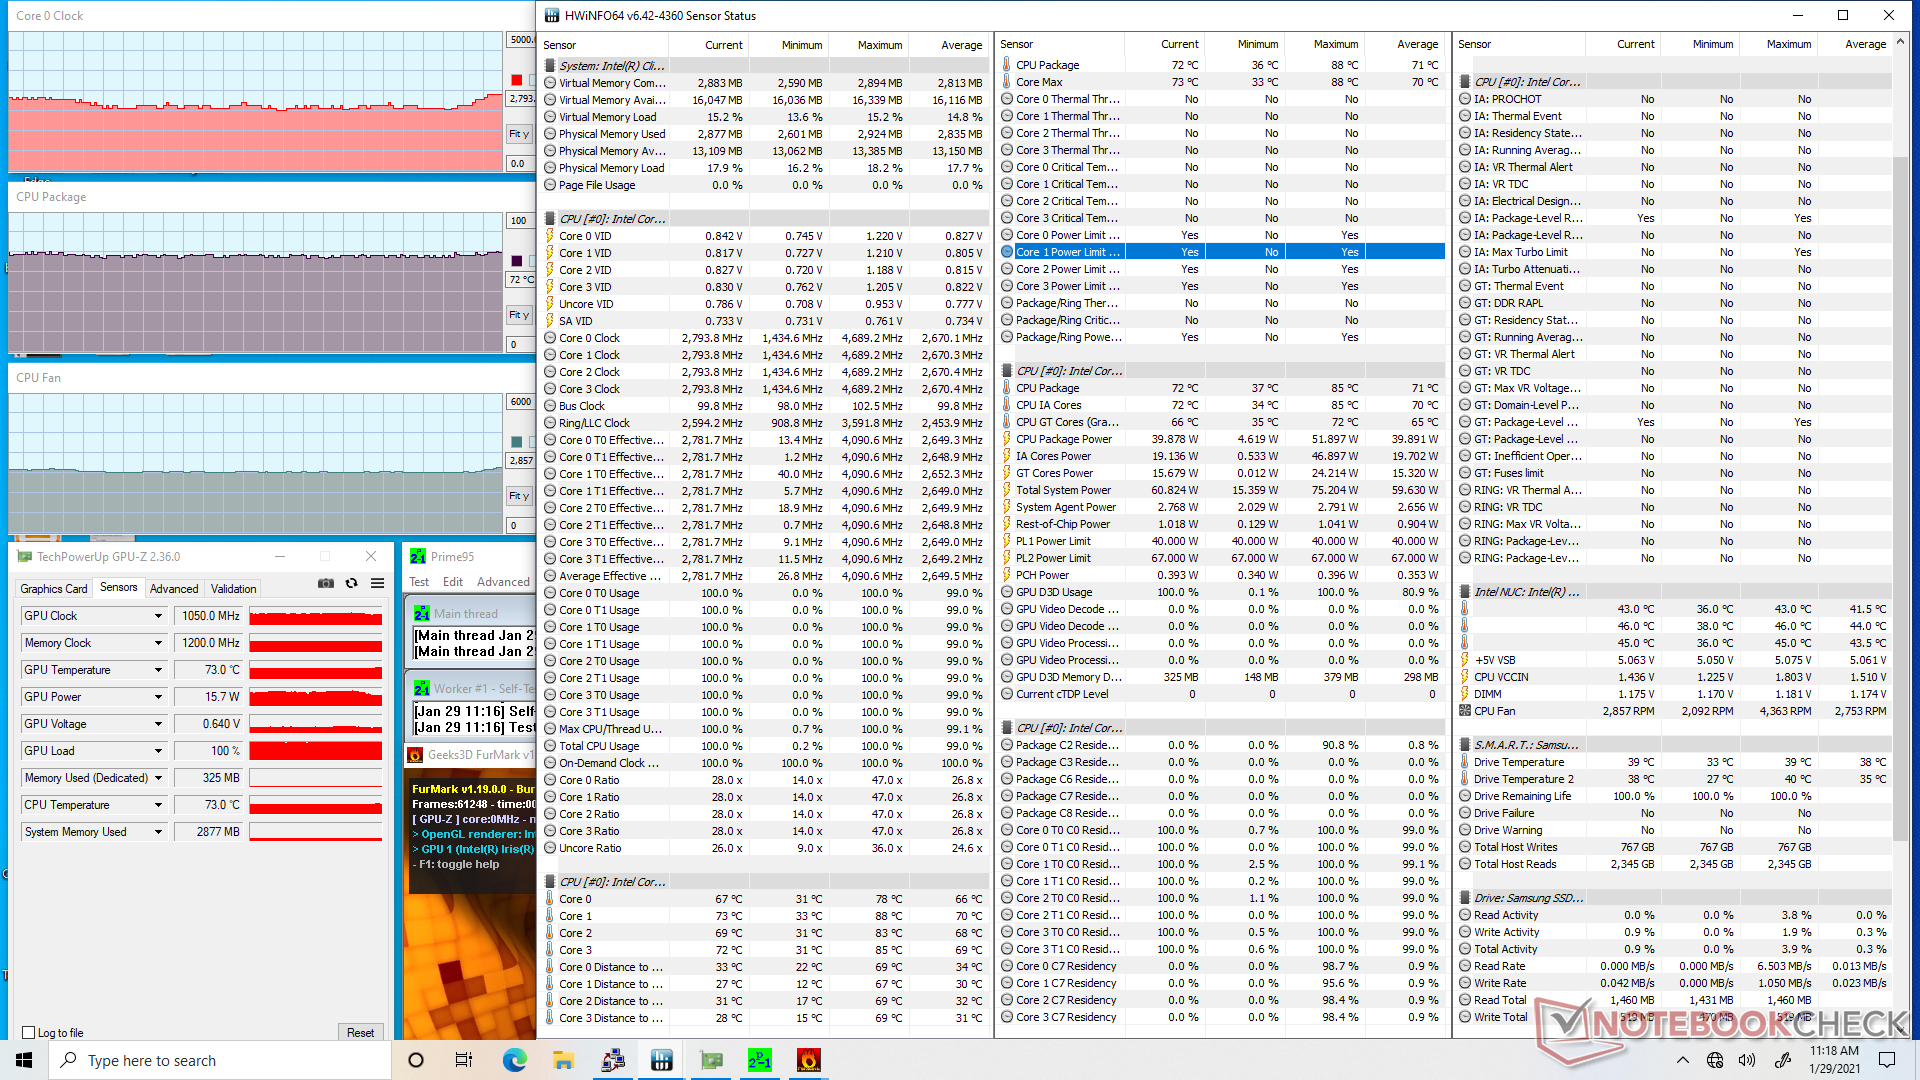
Estresamos el NUC para identificar cualquier problema potencial de estrangulamiento. Cuando se ejecuta Prime95, las velocidades de reloj aumentan a 4,1 GHz durante los primeros minutos y a una temperatura estable del núcleo de 86 C. Sin embargo, con el tiempo, tanto las velocidades de reloj como la temperatura caen automáticamente y fluctúan entre 2,7 y 3,4 GHz y 71 C y 79 C, respectivamente. Una opción para funcionar a 4,1 GHz y 86 C de forma indefinida para obtener el máximo rendimiento sostenido habría sido genial para los usuarios avanzados. Cuando se ejecuta Witcher 3 para representar las cargas de juego del mundo real, las frecuencias de reloj y la temperatura son mucho más bajas, con sólo 57 C.
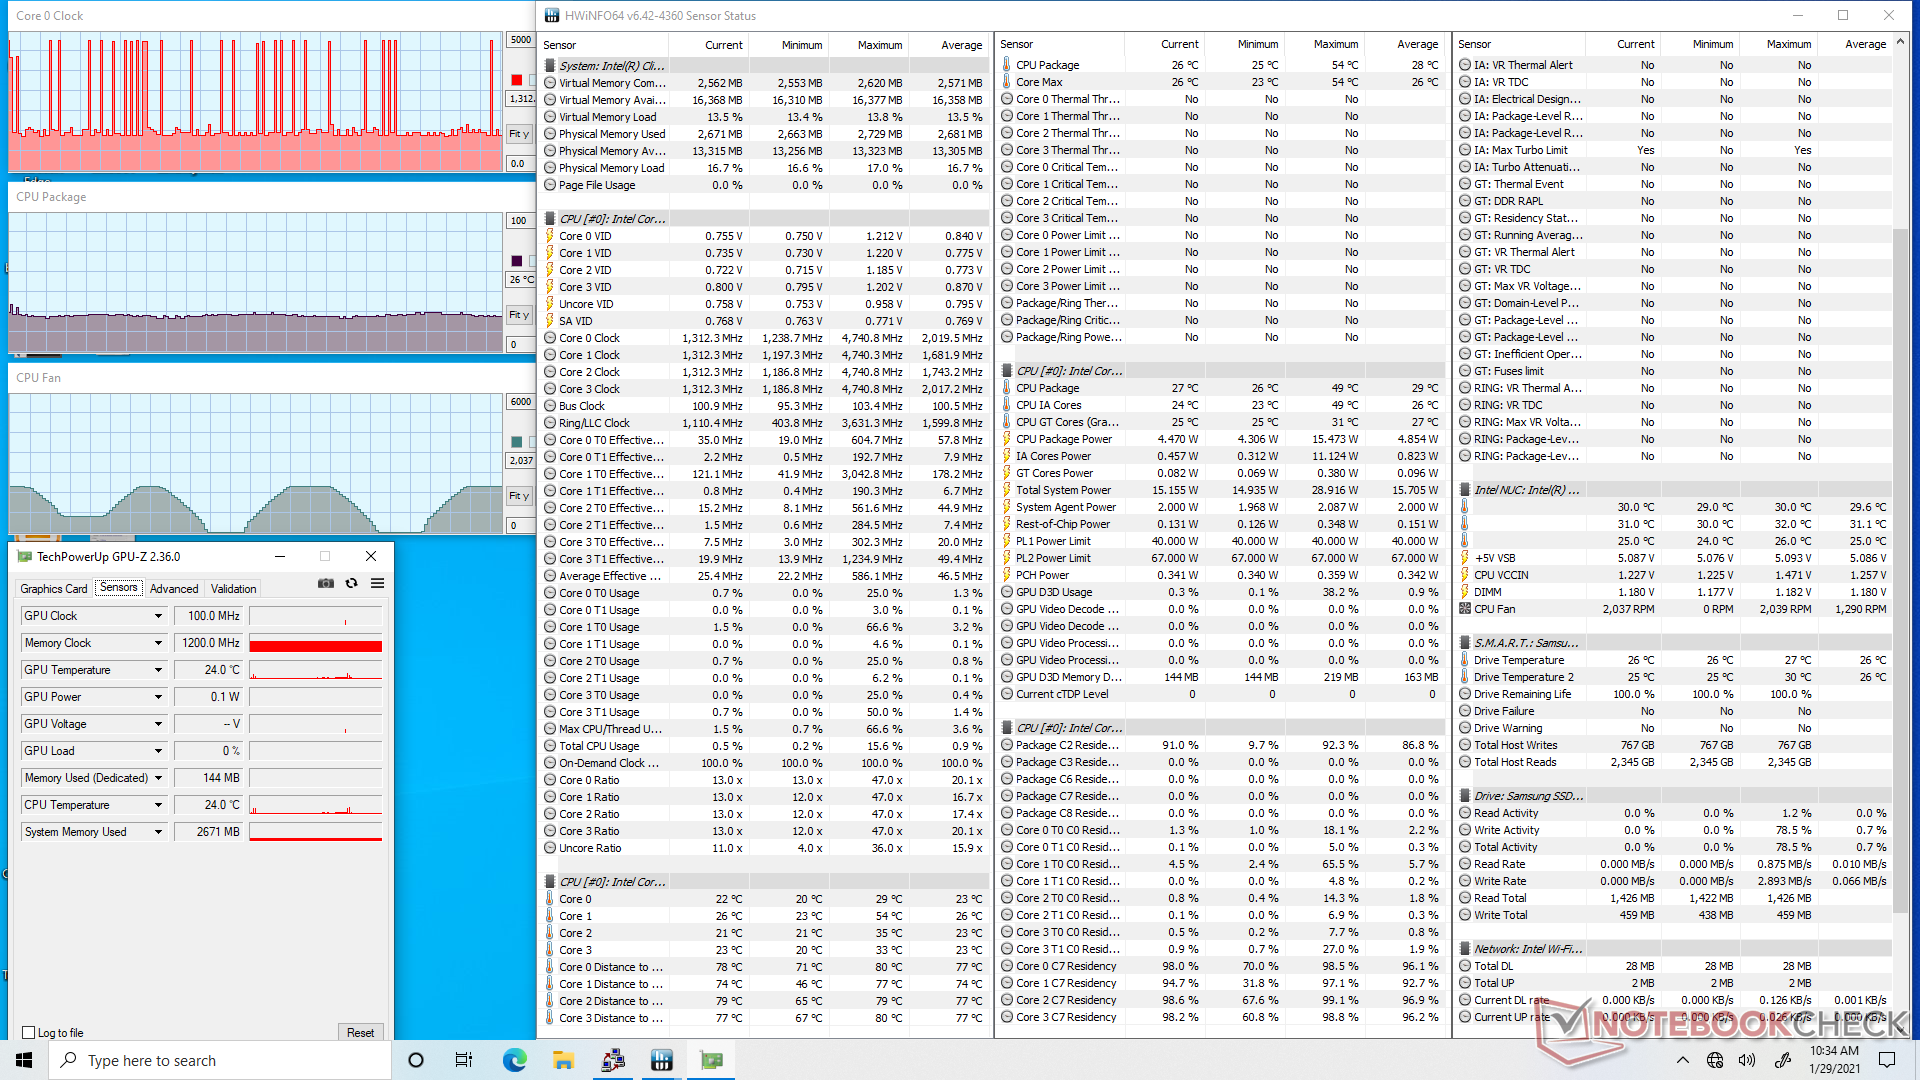
Ten en cuenta que las RPM del ventilador fluctúan entre 0 y 2000 incluso cuando el sistema está en reposo como se muestra en la captura de pantalla de abajo.
| Relojde la CPU(GHz) | Reloj dela GPU(MHz) | Temperaturamediade la CPU (°C) |
| Sistema en reposo | ---- | |
| EstrésPrime95 | 2,7 - 3,4 | -- |
| Estrés Prime95+ FurMark | 2,1 - 2,8 | ~1050 |
| Witcher 3 Stress | 2.8 | 1300 |
Energy Management
Consumo de energía
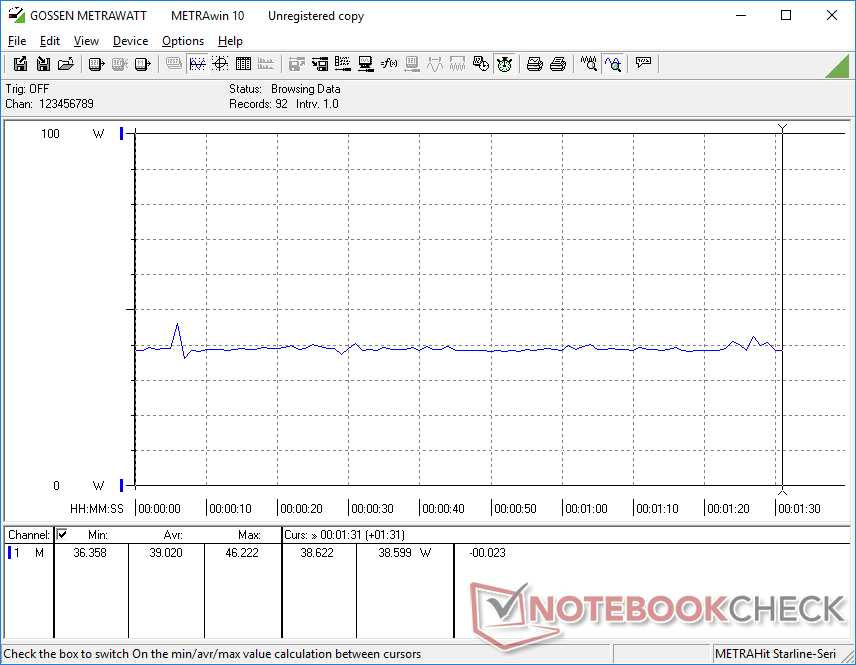
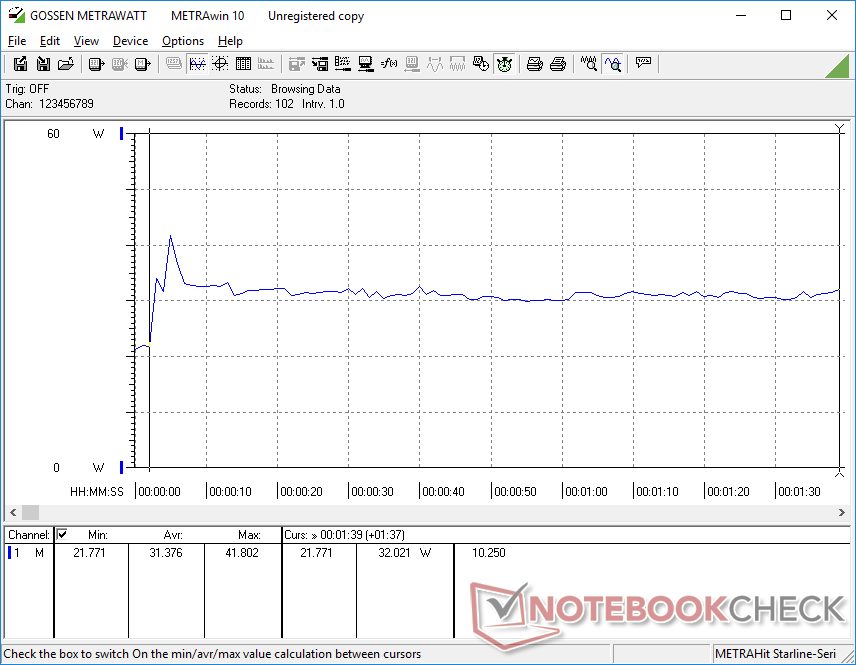
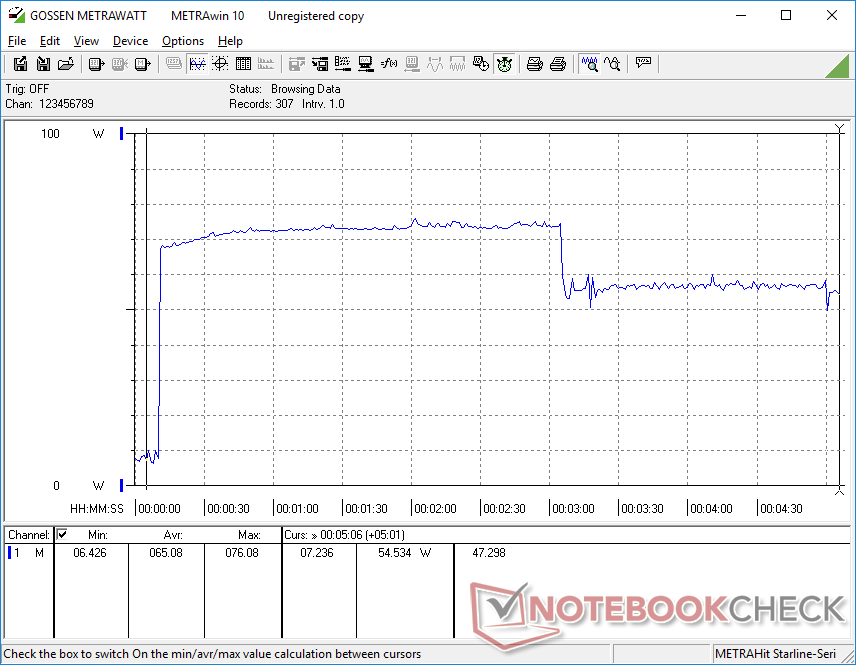
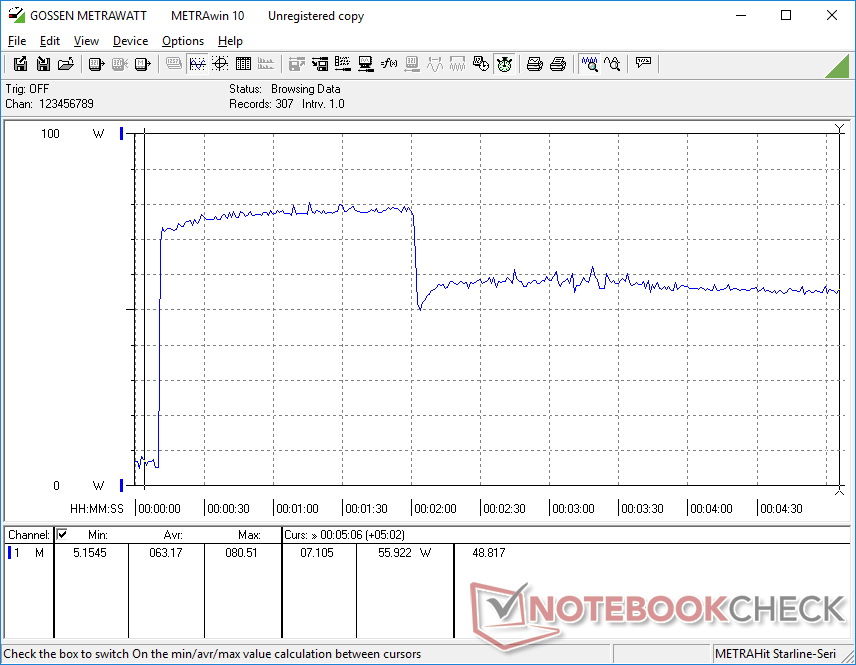
Los modelos NUC siempre han sido muy eficientes desde el punto de vista energético y el NUC 11 continúa la tendencia. El sistema sólo consume entre 31 W y 39 W cuando juega, en comparación con los 63 W y 50 W del NUC Skull Can yon y del competidor Beelink GT-R35, respectivamente, todo ello mientras ofrece un rendimiento de la CPU y la GPU significativamente más rápido que ambos. Hades Canyon sigue siendo más de dos veces más potente en cuanto a rendimiento gráfico, pero también consume 3 veces más energía en el proceso.
Hemos podido medir un consumo máximo de 80,5 W cuando se ejecutan cargas extremas, como muestran los gráficos siguientes. Este consumo es sólo temporal y coincide con nuestras observaciones de velocidad de reloj al ejecutar Prime95 en la sección de pruebas de estrés anterior.
Cabe destacar que el adaptador de CA externo de 120 W es relativamente grande (~15 x 7,5 x 2,5 cm) y pesa más de dos tercios que la unidad NUC (448 g frente a 647 g).
| Off / Standby | |
| Ocioso | |
| Carga |
|
Clave:
min: | |
| Intel NUC11PAQi7 i7-1165G7, Iris Xe G7 96EUs, Samsung SSD 980 Pro 500GB MZ-V8P500BW, , x, | Intel NUC8i7BE i7-8559U, Iris Plus Graphics 655, , , x, | Intel Hades Canyon NUC8i7HVK i7-8809G, Vega M GH, Intel Optane 120 GB SSDPEK1W120GA, , x, | Zotac ZBox MI643 i5-10210U, UHD Graphics 620, Lexar NM610 1TB, , x, | Beelink GTR35 II-G-16512D00W64PRO-1T R5 3550H, Vega 8, Silicon Motion AZW 512G NV428, , x, | |
|---|---|---|---|---|---|
| Power Consumption | -3% | -173% | -29% | -44% | |
| Idle Minimum * (Watt) | 5.6 | 2.7 52% | 15.5 -177% | 7.5 -34% | 8.8 -57% |
| Idle Average * (Watt) | 5.6 | 3.1 45% | 16.2 -189% | 9.2 -64% | 9.1 -63% |
| Idle Maximum * (Watt) | 6 | 6.3 -5% | 16.5 -175% | 9.6 -60% | 9.6 -60% |
| Load Average * (Watt) | 31.4 | 59.7 -90% | 83.4 -166% | 34.4 -10% | 55.3 -76% |
| Witcher 3 ultra * (Watt) | 39 | 47.2 -21% | 121.7 -212% | 50.3 -29% | |
| Load Maximum * (Watt) | 80.5 | 78 3% | 173.5 -116% | 60.6 25% | 65.6 19% |
* ... más pequeño es mejor
Pro
Contra
Veredicto
En términos de rendimiento, nuestro Tiger Lake Core i7 está más o menos a la par con el Comet Lake NUC 10 en cargas multihilo, mientras que es alrededor de un 20 por ciento más rápido en cargas de un solo hilo. Su mayor ventaja, sin embargo, reside en el rendimiento gráfico, donde la Iris Xe puede ser más de 3 veces más rápida que la UHD Graphics 620 sin necesidad de consumir mucha más energía. Si la potencia y la eficiencia de la GPU son lo más importante, el NUC 11 será la mejor inversión. De lo contrario, los usuarios que pretendan ejecutar sobre todo cargas de HTPC como el streaming 4K o la navegación de vídeo estarían bien con un NUC 10 más antiguo, mientras que el NUC Hades Canyon seguirá siendo la mejor opción para los juegos en bruto.
El NUC pone a Tiger Lake en una mejor luz que lo que la mayoría de los portátiles han logrado hacer con la misma serie de procesadores. Te costará más que la mayoría de los otros mini PC de la serie Core U, pero la calidad y la garantía de 3 años lo convierten en una inversión más segura.
Es muy recomendable configurar el NUC 11 con memoria de doble canal para aumentar el rendimiento gráfico. Nuestro kit de un solo canal proporcionado por Intel arrojó puntuaciones 3DMark más lentas de lo esperado y velocidades de fotogramas que no hacen justicia a Iris Xe.
En futuros NUCs, nos gustaría ver un lector de huellas dactilares integrado y soporte para adaptadores de CA USB-C. El mini PC Beelink GT-R de la competencia incluye un lector de huellas dactilares, mientras que una fuente de alimentación externa USB-C sería una solución más universal en el futuro.
Precio y disponibilidad
No se espera que la serie NUC 11 salga a la venta hasta marzo de 2021, por lo que todavía no está ampliamente disponible en el momento de escribir este artículo
Price comparison

