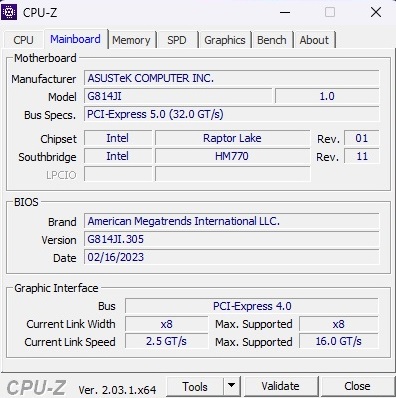
Análisis del portátil Asus ROG Strix G18 G814JI: Luz y sombra con la máquina de juegos de 18 pulgadas

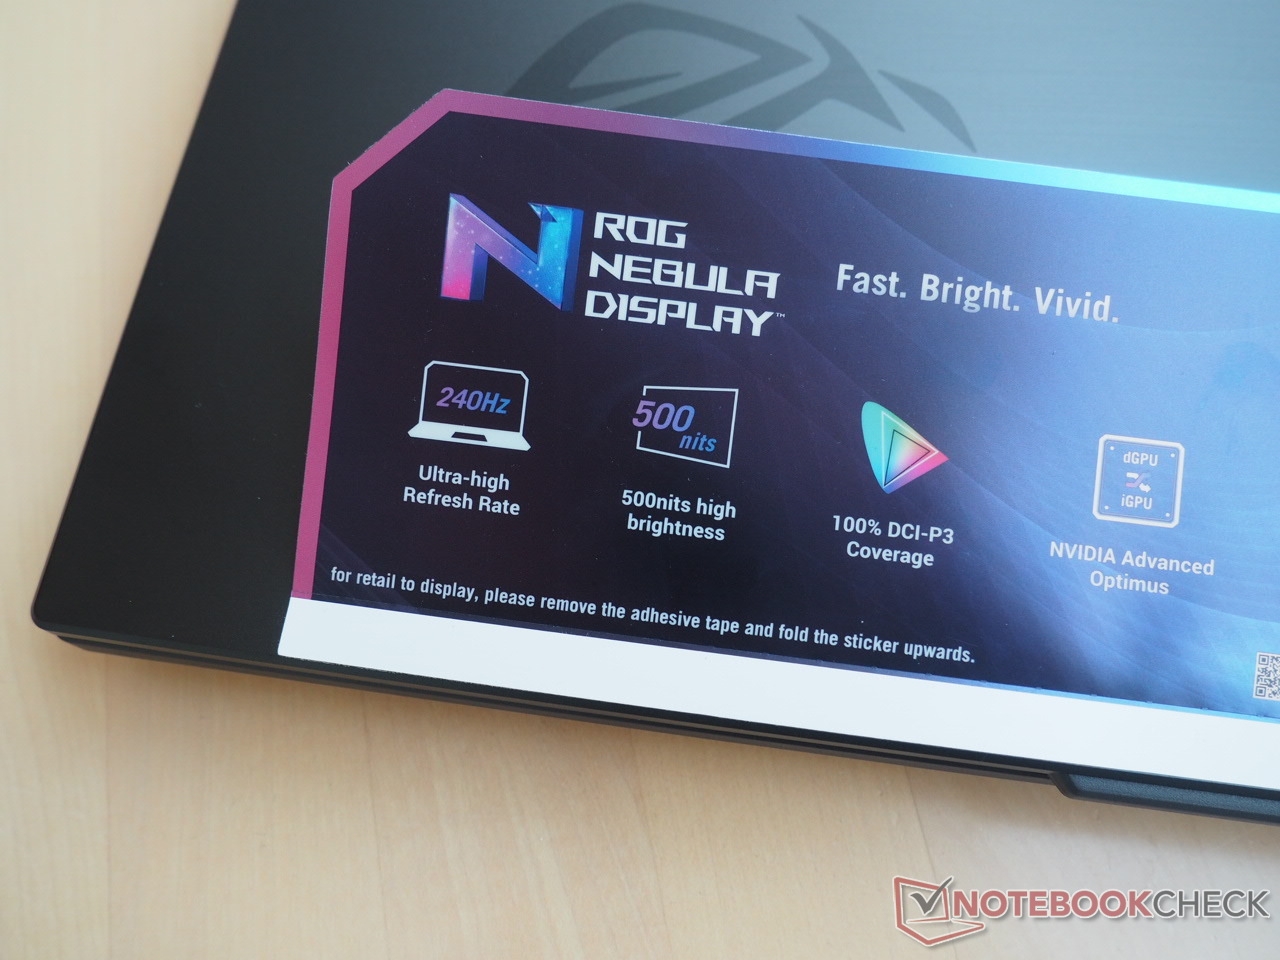
ROG Strix, ROG Strix Scar....A menudo puede resultar difícil seguir la pista a la gama de productos de Asus. Tras haber analizado recientemente elStrix Scar 18 G834JYcon un Core i9-13980HXy GeForce RTX 4090, el fabricante nos ha presentado ahora la Strix G18 G814JI, considerablemente más barata pero también menos potente, con unCore i7-13650HXy GeForce RTX 4070. Las características adicionales incluyen 2 x 16 GB DDR5-4800 de RAM de doble canal y un SSD NVMe de 1 TB. En cuanto a la pantalla WQXGA de 2560 x 1600 píxeles, Asus ha arrojado características y palabras de moda como 240 Hz, 500 nits, 100 % DCI-P3, tiempo de respuesta de 3 ms, G-Sync y certificación Pantone que, por cierto, no solo está dirigida a los jugadores, sino también a los creadores. El dispositivo (no disponible en el momento de realizar este análisis) se puede conseguir por 2300 dólares. Una opción más barata es el G814JV basado en RTX 4060. Por detrás está el G814JU, que tiene que conformarse con unaGeForce RTX 4050. Sin embargo, independientemente del modelo que estés considerando, los portátiles para juegos actuales son muy caros y por eso deberías pensártelo bien antes de decidir cuál comprar.
Los competidores del Strix G18 son principalmente otros portátiles para juegos de 18 pulgadas como el Razer Blade 18cuya versión de análisis estaba equipada con una RTX 4070. Aparte de eso, la diferencia de rendimiento respecto a tarjetas gráficas más antiguas es particularmente interesante. Por esta razón, la tabla incluye el Gigabyte A7 X1 (RTX 3070 @140 vatios), elLenovo Legion 5 Pro 16ARH7H (RTX 3070 Ti a 150 vatios), elAlienware x17 R1 (RTX 3080 @165 vatios) y laMSI Raider GE77 HX 12UHS (RTX 3080 Ti @175 vatios), todos ellos -al igual que el Strix G18 (175 vatios)- especificados con un TGP alto.
Posibles contendientes en la comparación
Valoración | Fecha | Modelo | Peso | Altura | Tamaño | Resolución | Precio |
|---|---|---|---|---|---|---|---|
| 87.4 % v7 (old) | 03/2023 | Asus ROG Strix G18 G814JI i7-13650HX, GeForce RTX 4070 Laptop GPU | 3 kg | 31 mm | 18.00" | 2560x1600 | |
| 91.4 % v7 (old) | 02/2023 | Razer Blade 18 RTX 4070 i9-13950HX, GeForce RTX 4070 Laptop GPU | 3 kg | 21.9 mm | 18.00" | 2560x1600 | |
| 83.2 % v7 (old) | 10/2021 | Gigabyte A7 X1 R9 5900HX, GeForce RTX 3070 Laptop GPU | 2.5 kg | 34 mm | 17.30" | 1920x1080 | |
| 87.7 % v7 (old) | 10/2022 | Lenovo Legion 5 Pro 16ARH7H RTX 3070 Ti R7 6800H, GeForce RTX 3070 Ti Laptop GPU | 2.6 kg | 26.6 mm | 16.00" | 2560x1600 | |
| 89 % v7 (old) | 09/2021 | Alienware x17 RTX 3080 P48E i7-11800H, GeForce RTX 3080 Laptop GPU | 3.2 kg | 21.4 mm | 17.30" | 3840x2160 | |
| 86.8 % v7 (old) | 07/2022 | MSI Raider GE77 HX 12UHS i9-12900HX, GeForce RTX 3080 Ti Laptop GPU | 3.1 kg | 25.9 mm | 17.30" | 3840x2160 |
Caso
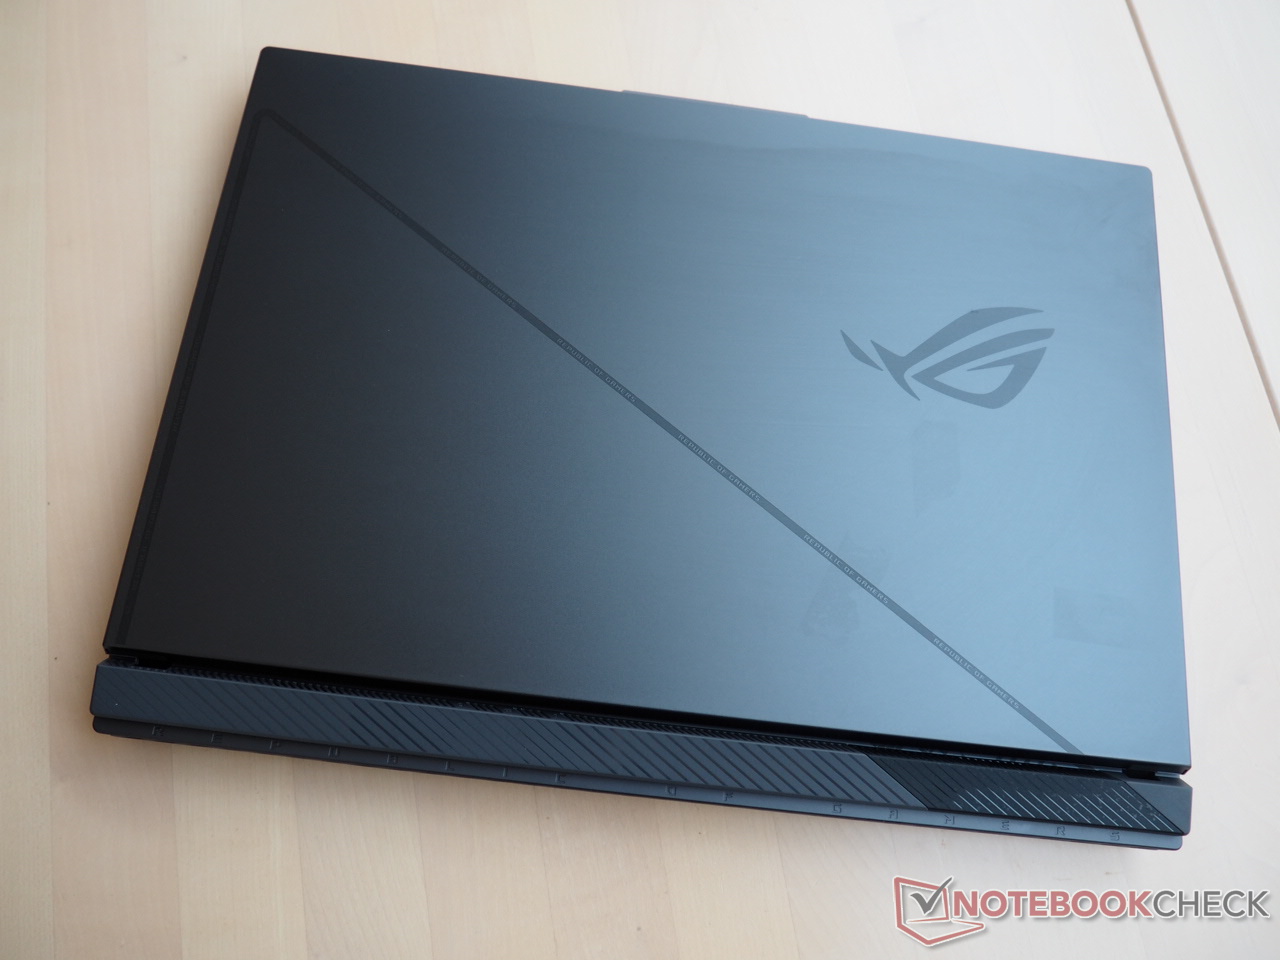
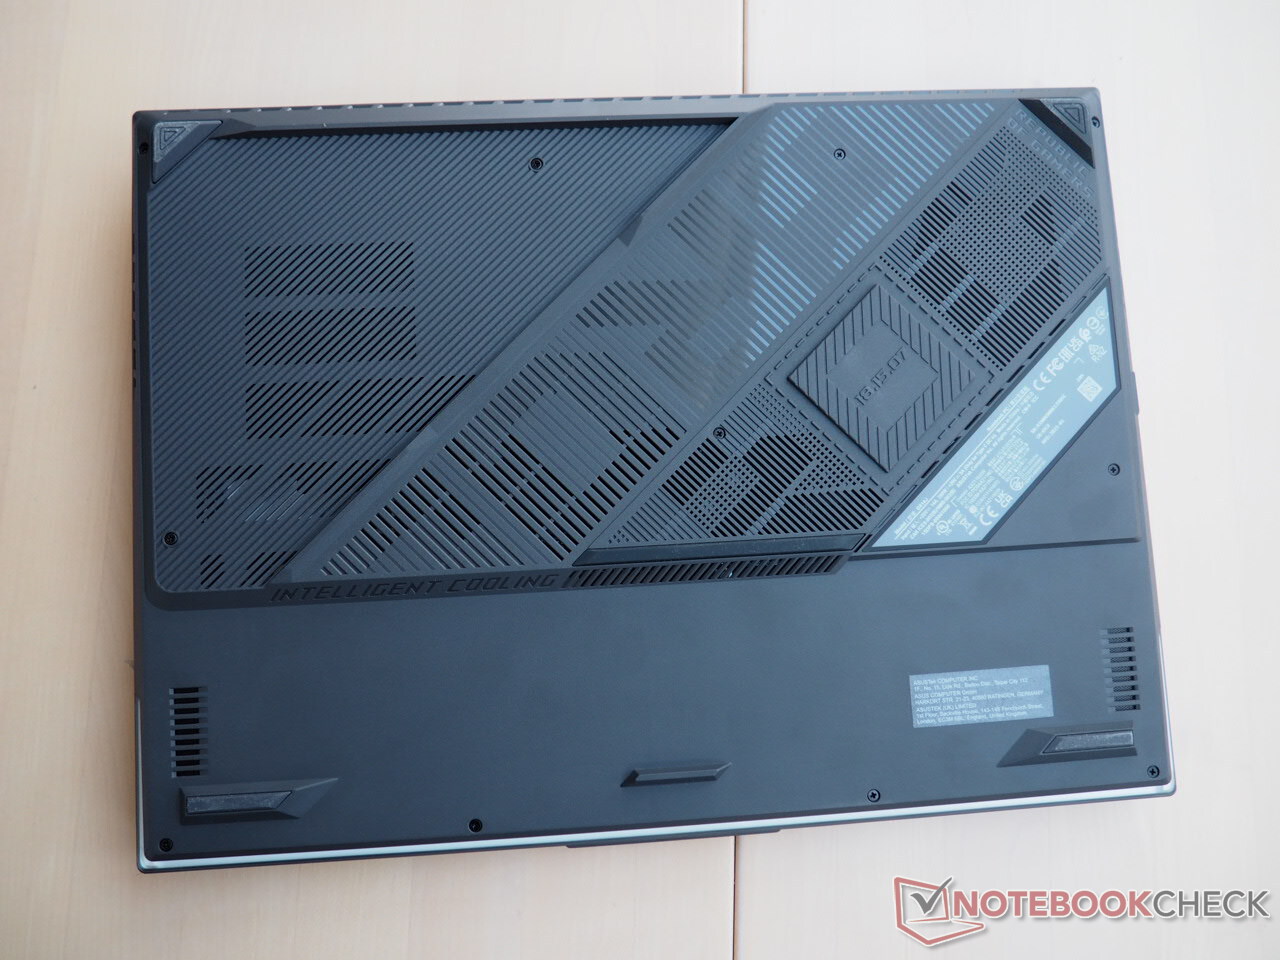
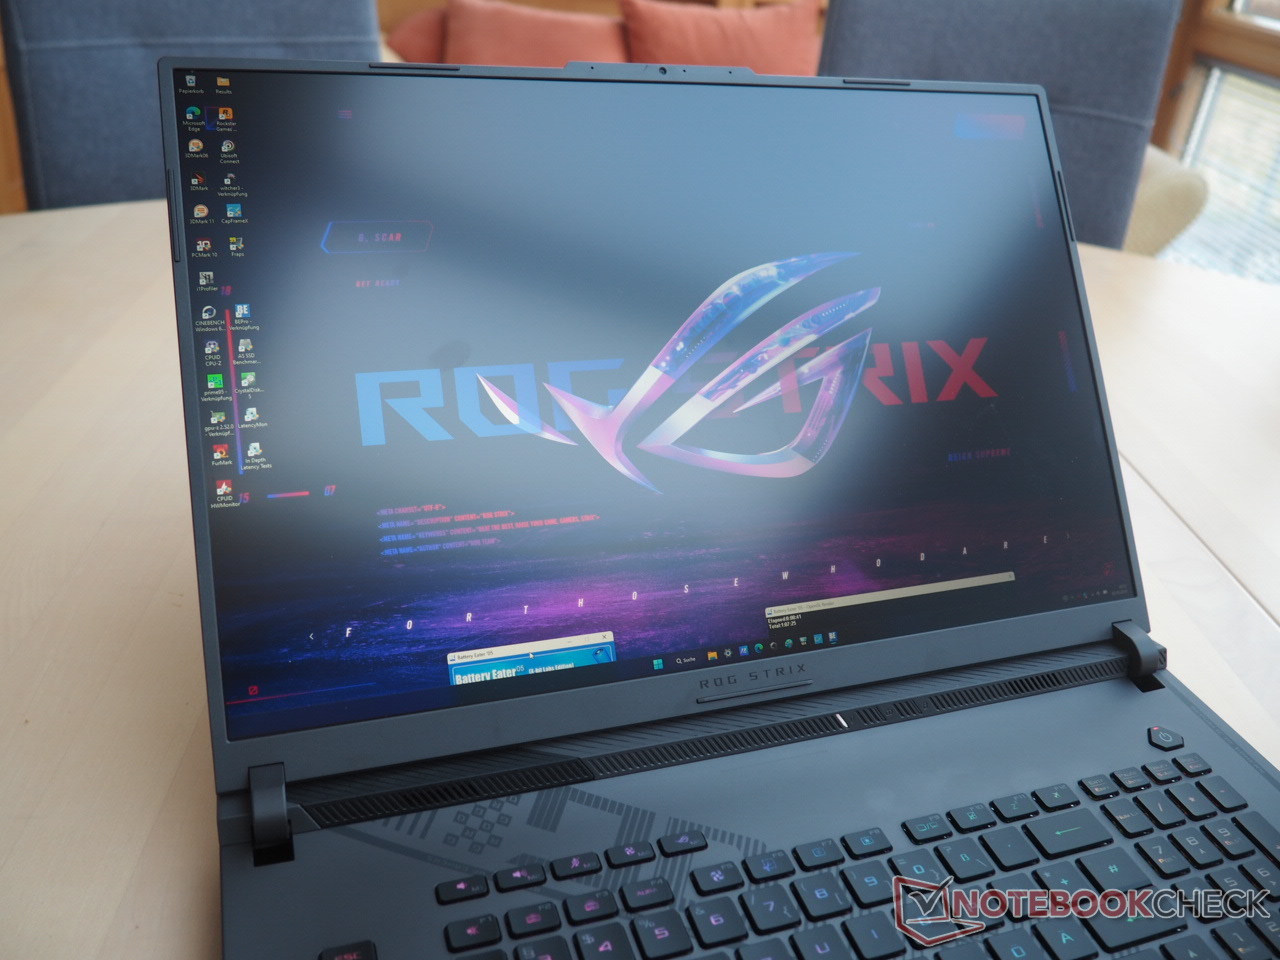
El diseño de la carcasa toma prestado del Strix Scar 18, mientras que el Strix G18 "normal" tiene que prescindir de la superficie parcialmente transparente. La robusta tapa es de metal y tiene un aspecto muy discreto, y, con la excepción del logotipo de ROG y las rayas estrechas, se pueden encontrar muchos elementos de diseño en la unidad base de plástico. Desde un punto de vista visual, incluso en la base de la carcasa, que normalmente nunca ve la luz del día, el fabricante se ha vuelto un poco loco. Sin embargo, habría sido mejor si se hubieran invertido más recursos en la calidad de construcción. En algunas partes, como la zona de las teclas de dirección, la unidad base se flexiona de forma tangible, al menos cuando se aplica mucha presión. Además, la carcasa tiende rápidamente a traquetear, lo que afecta negativamente a la sensación premium del dispositivo, especialmente teniendo en cuenta su precio.
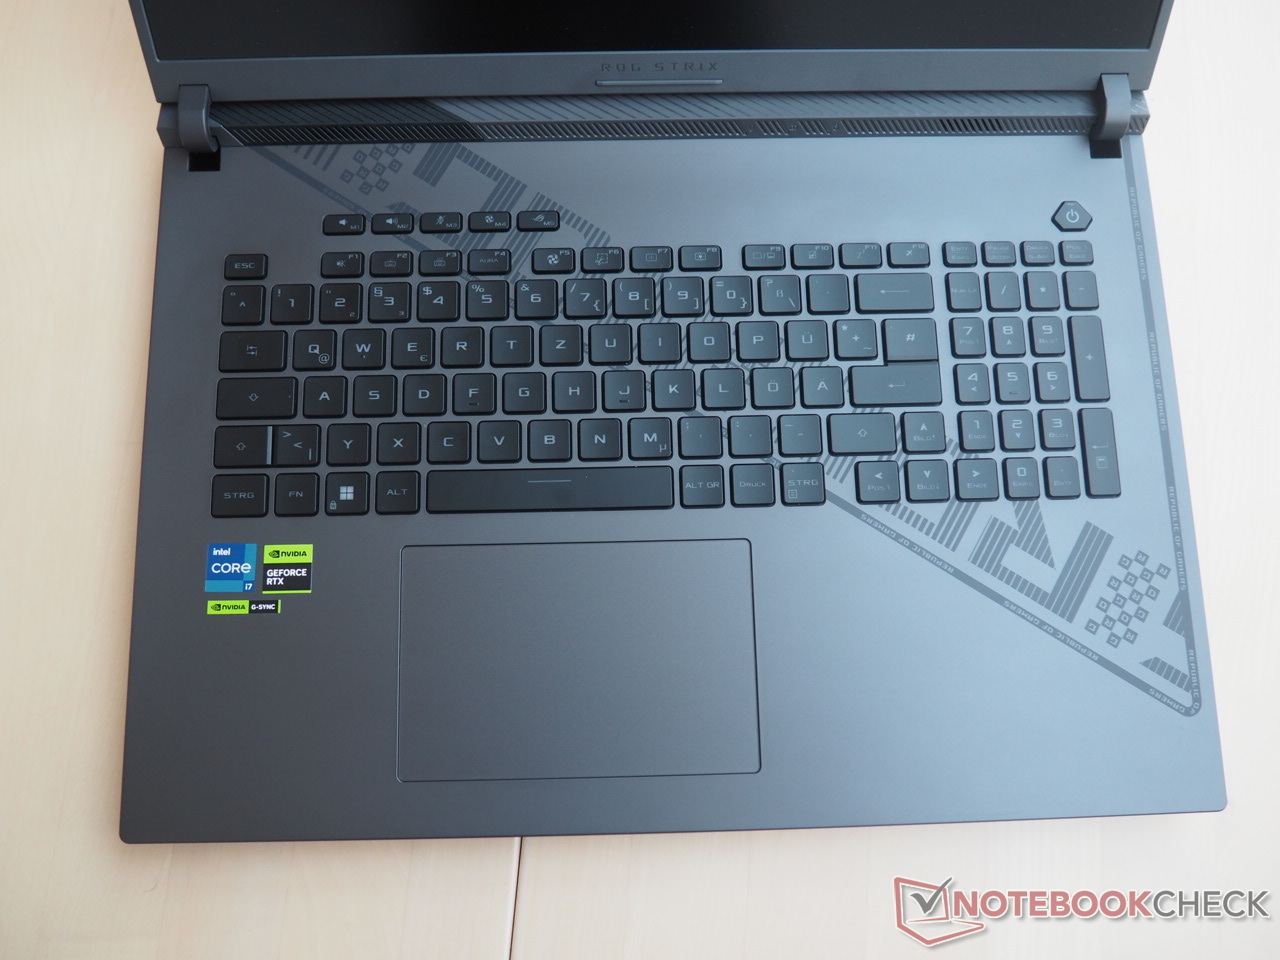
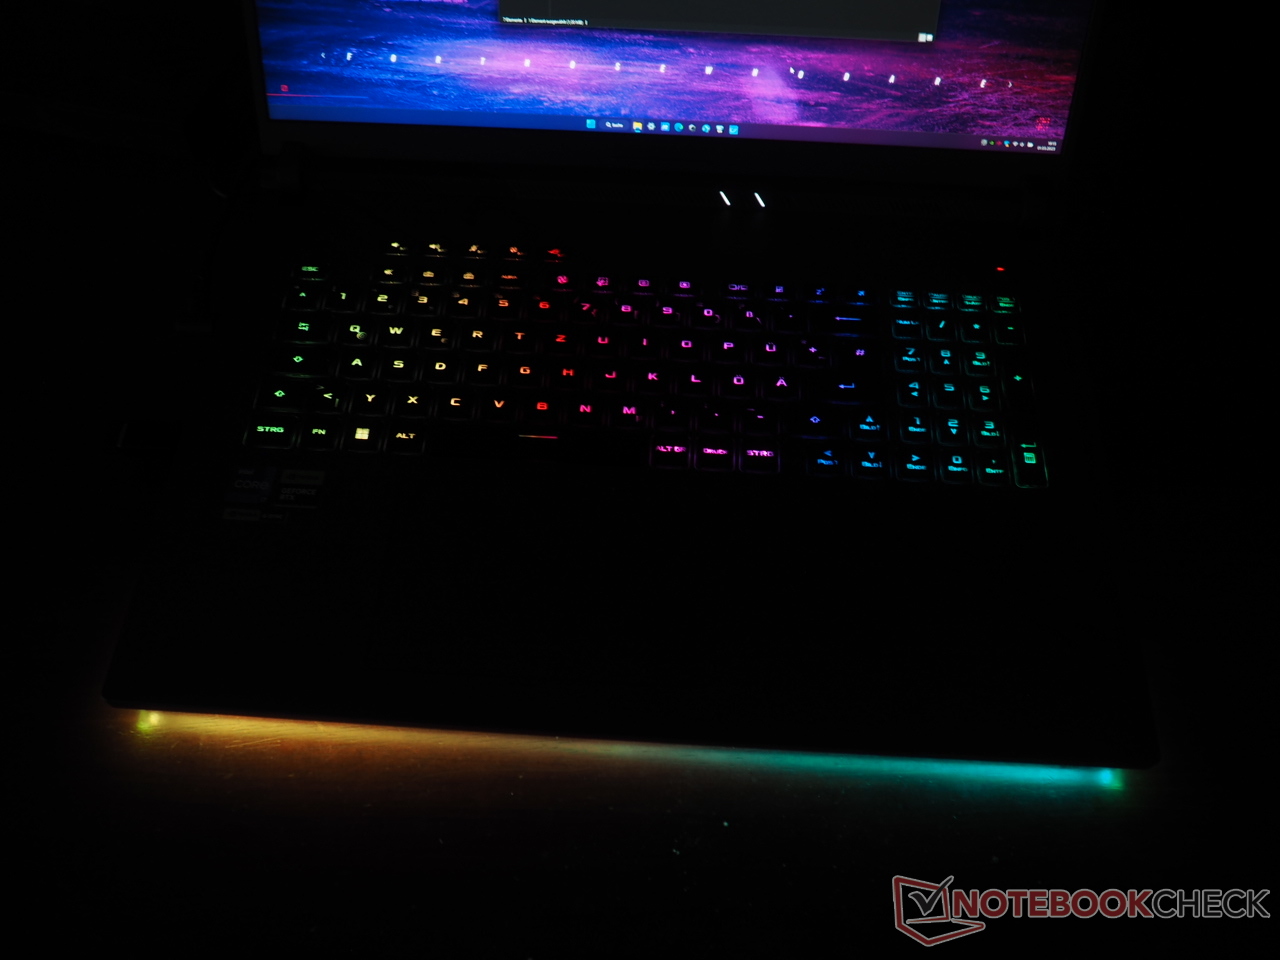
Por lo demás, no se puede criticar el chasis. El acabado es discreto y las bisagras también hacen un buen trabajo, aunque el ángulo máximo de apertura podría ser algo mayor. Para atraer al público gamer, Asus no sólo se ha limitado a un teclado RGB, sino que también ha dotado al frontal de la carcasa de una elegante barra de luces LED (ver galería de fotos).
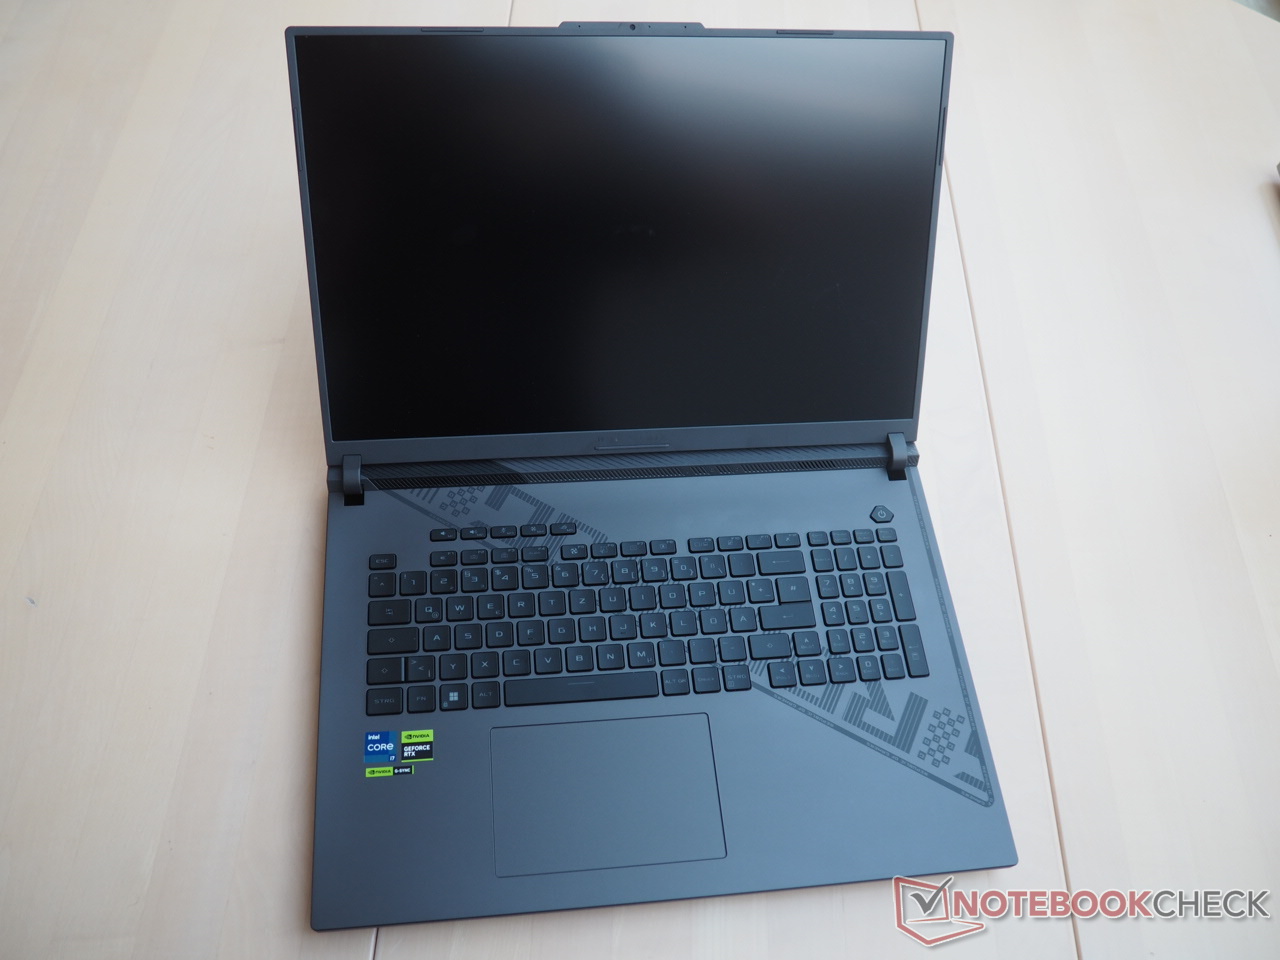
Por supuesto, al tratarse de un portátil de 18 pulgadas, el Strix G18 parece bastante voluminoso, pero el marco de la pantalla es agradablemente delgado gracias al diseño de bisel fino y al formato 16:10. No obstante, en comparación con el Razer Blade 18, la máquina de Asus es más profunda y, además, aproximadamente 1 cm más gruesa. Sin embargo, en lo que respecta al peso, la competencia no es mucho mejor: 3 kg no son fáciles de cargar.
Características
Puertos
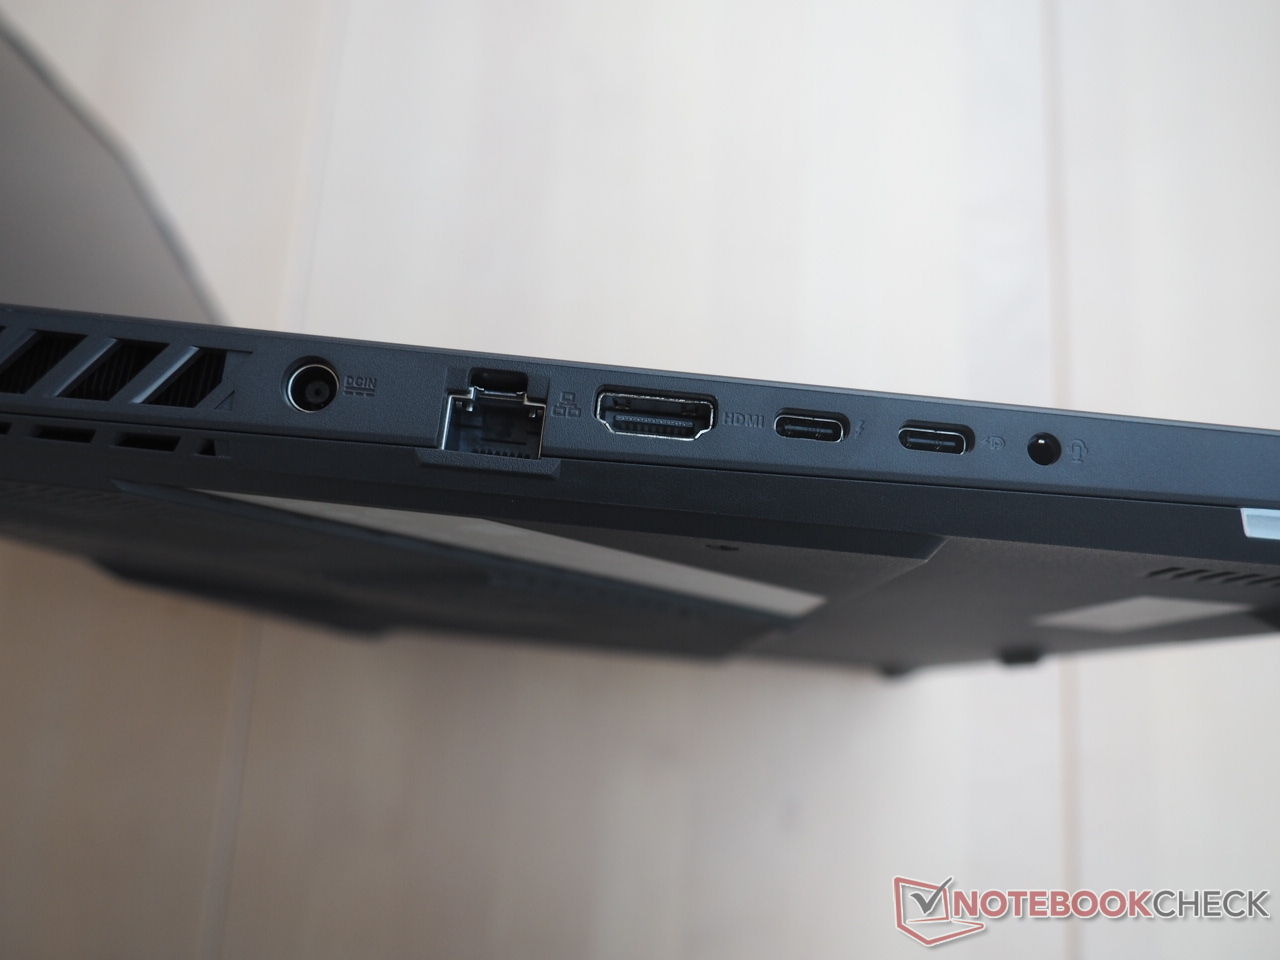
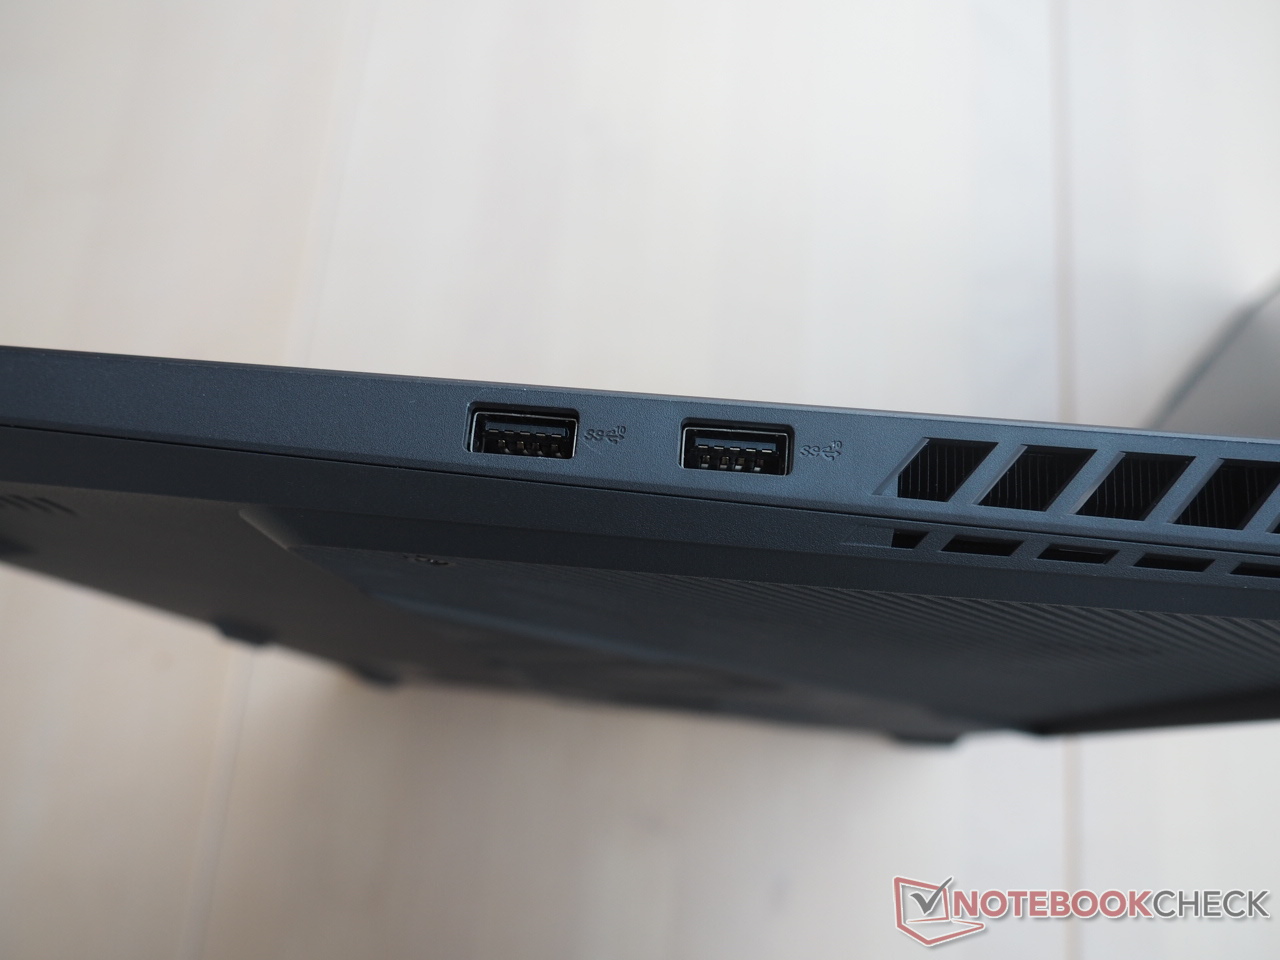
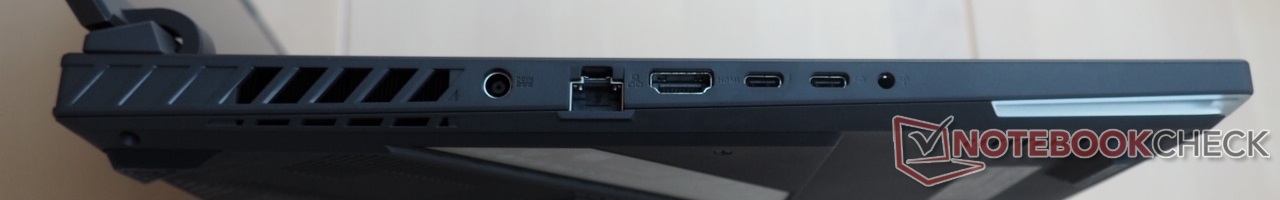
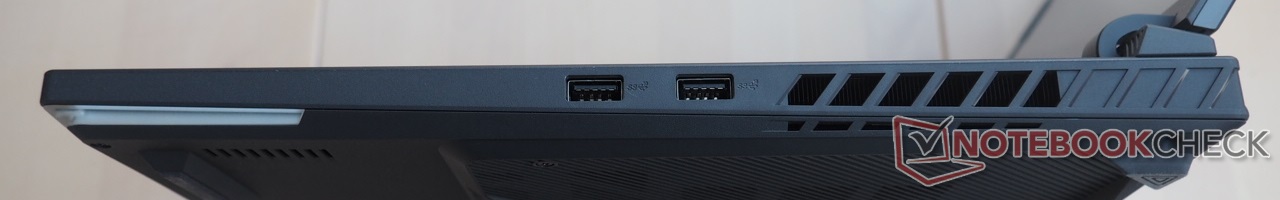
Si se prescinde del lector de tarjetas ausente, la selección de puertos es impresionante. Empezando por el lado izquierdo, encontramos la toma de corriente, un puerto RJ45, una salida HDMI 2.1, una toma de audio combinada y dos puertos USB-C (1x USB 3.2 Gen2, 1x USB 4) que incluyen Power Delivery y soporte DisplayPort. En el lado derecho, tenemos dos puertos tipo-A clásicos que están diseñados según el estándar 3.2-Gen2. Como los puertos están situados en la zona media de las superficies laterales, esto puede llevar a restringir el movimiento cuando se conecta a un ratón externo.
Comunicación
El rendimiento WiFi demuestra estar por encima de la media. Nuestra prueba WiFi estandarizada se llevó a cabo a un metro de nuestro router de referencia y el G18 alcanzó unos 1600 Mbit/s tanto al enviar como al recibir datos. Esto representa un buen resultado y gana al Razer Blade 18 - a pesar de un módulo-Modul WiFi idéntico (Intel AX211) - por más de 100 Mbit.
Cámara web
La calidad de la webcam sólo es suficiente para situarse en la mitad de la tabla. Aunque la nitidez de la imagen es algo mejor que la de algunos competidores, no llega a impresionar (lo mismo cabe decir del espacio de color).


Accesorios
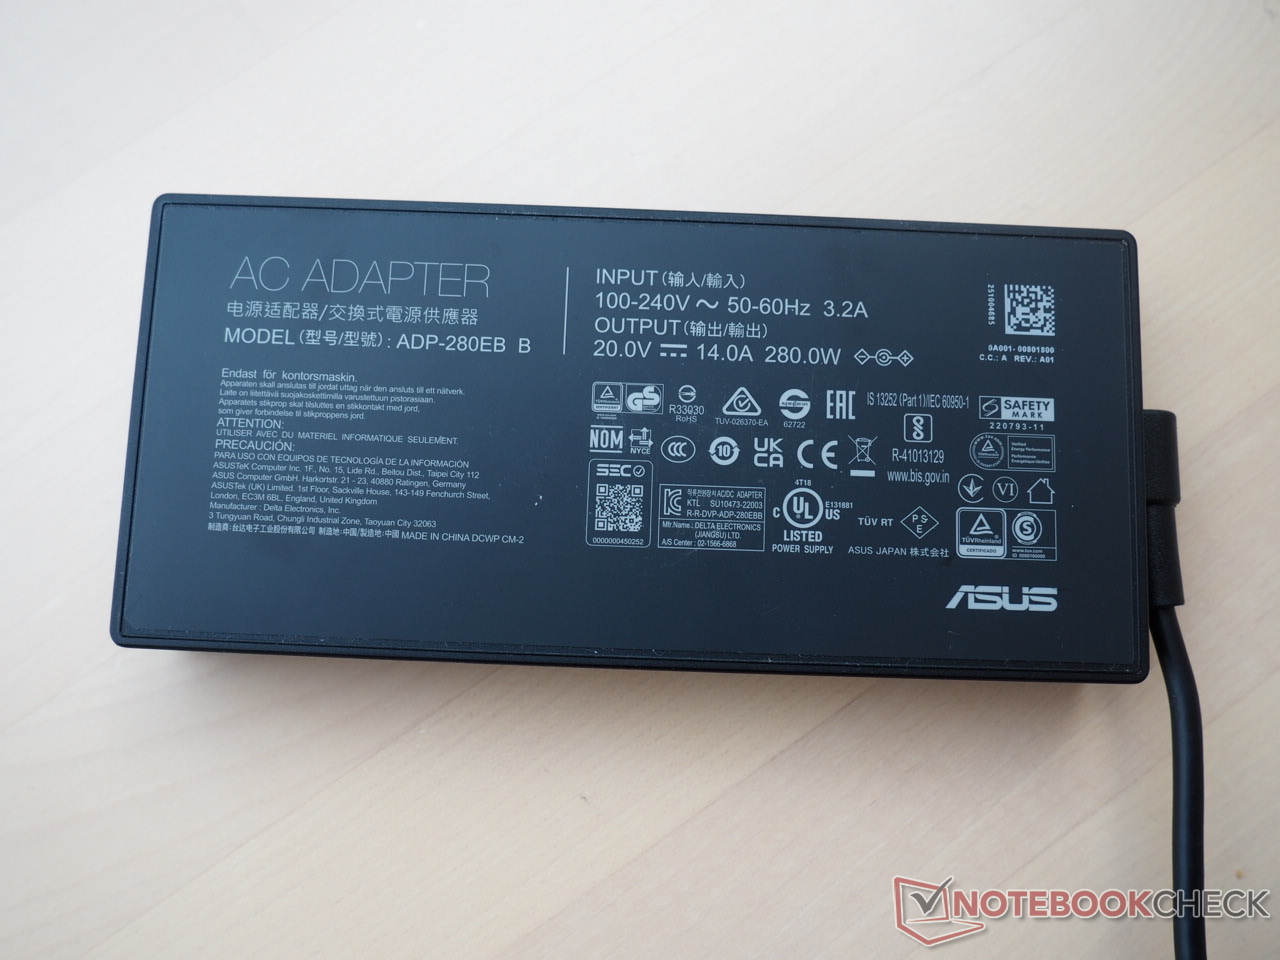
Además de algunos folletos informativos, el aparato viene con una fuente de alimentación de 650 gramos y 280 vatios, que mide 18 x 8 x 2,5 cm.
Mantenimiento
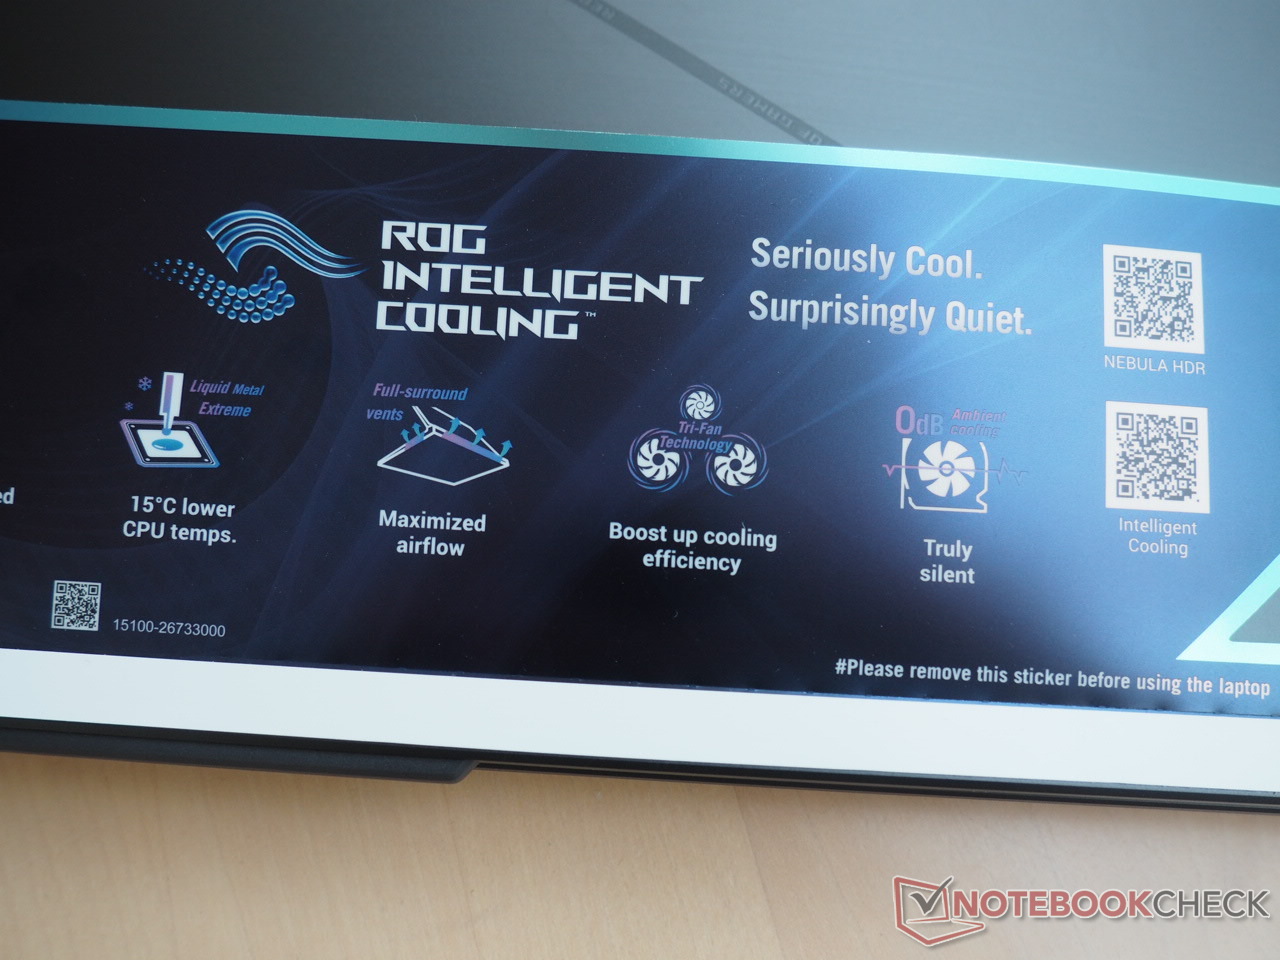
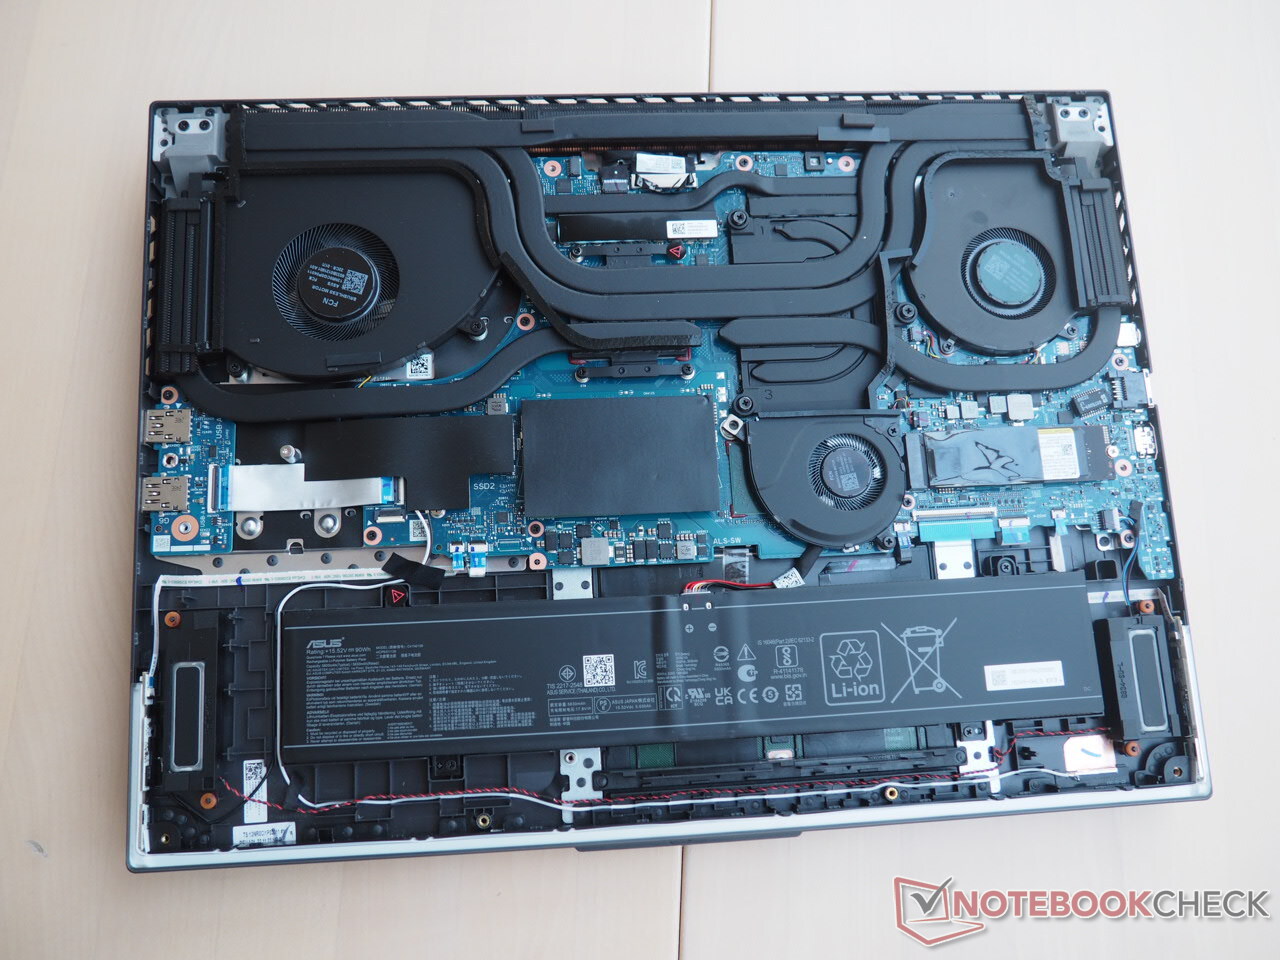
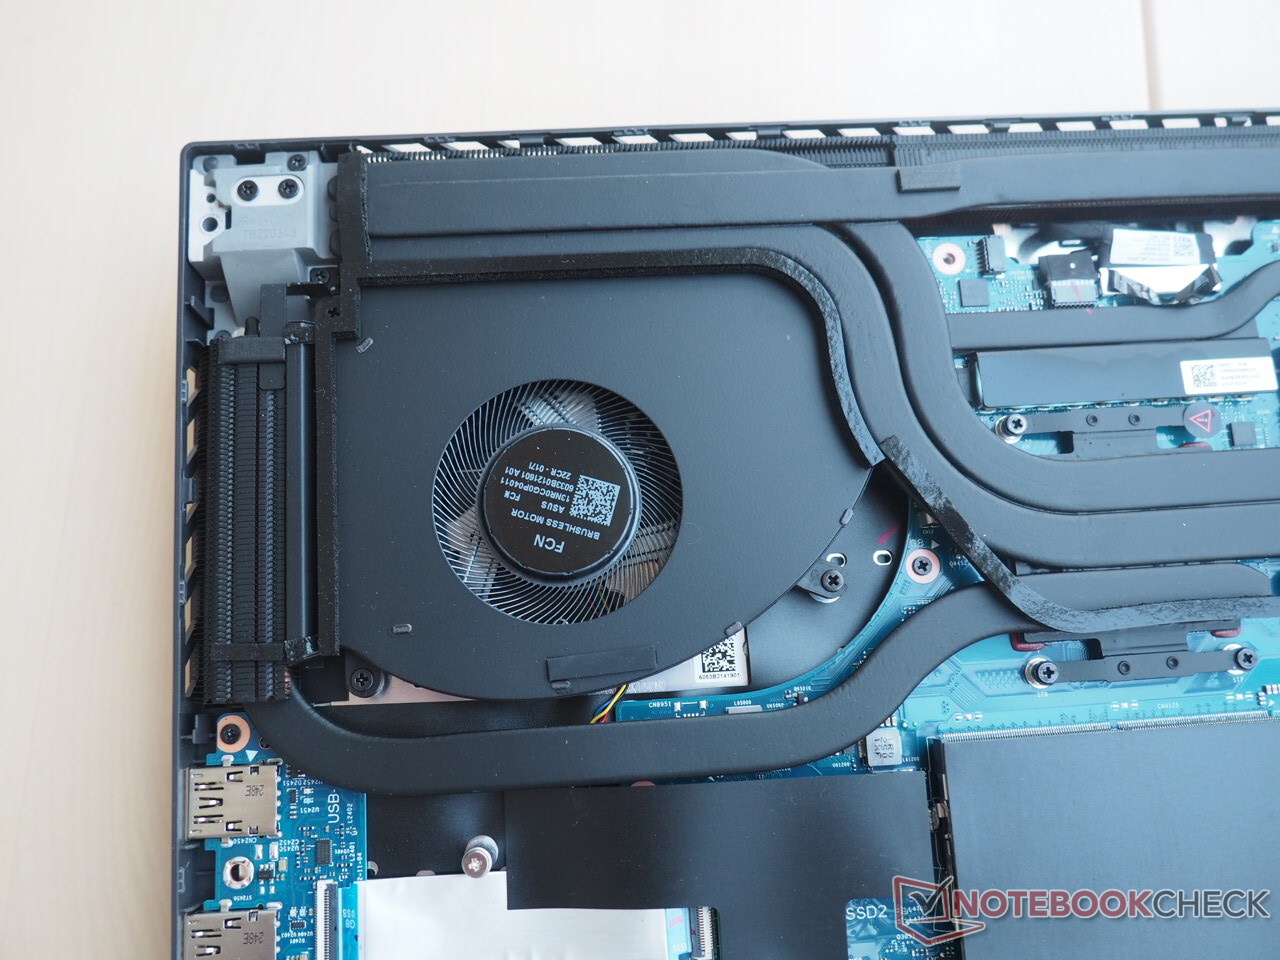
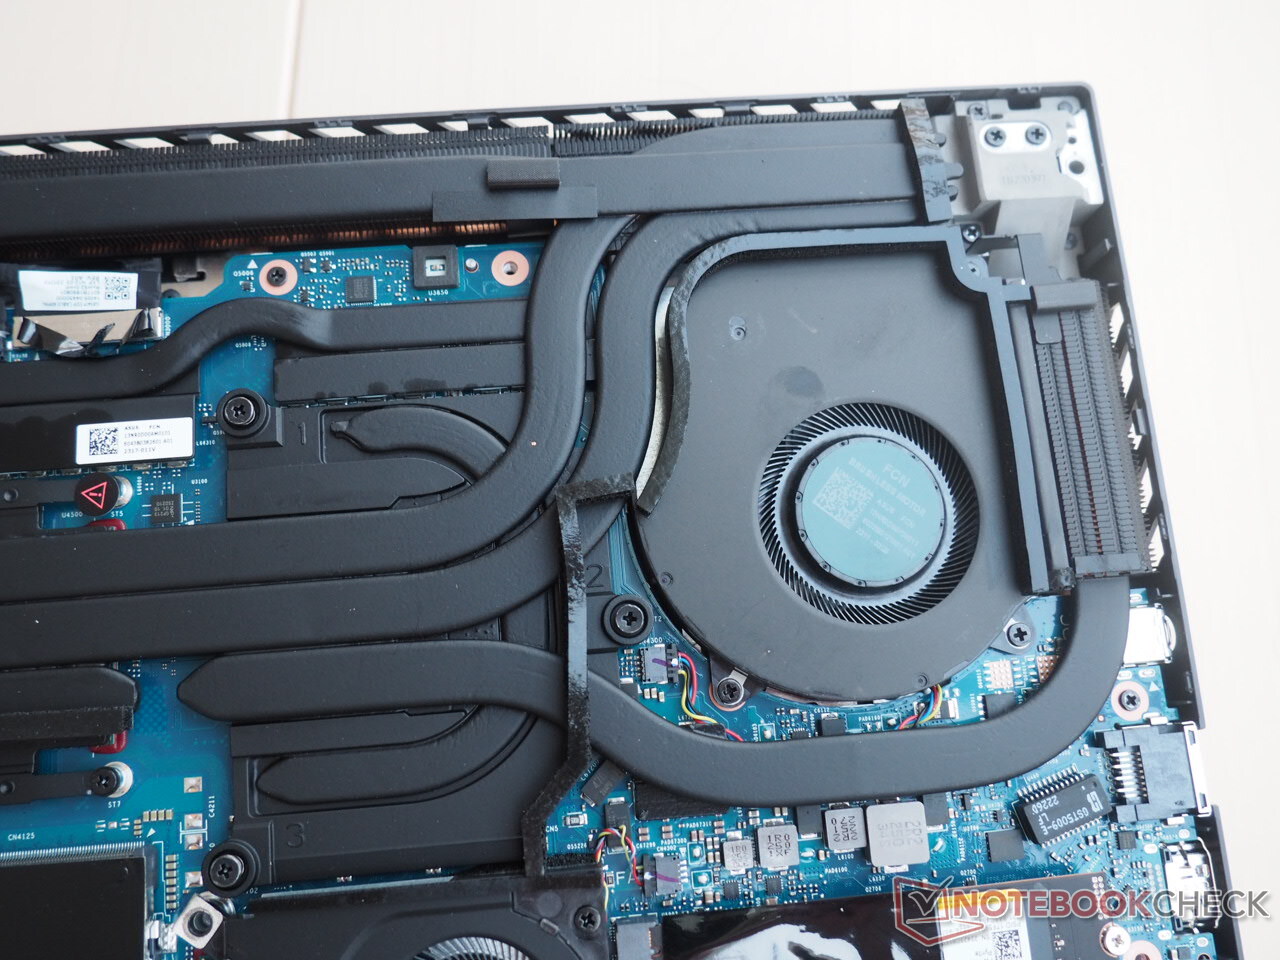
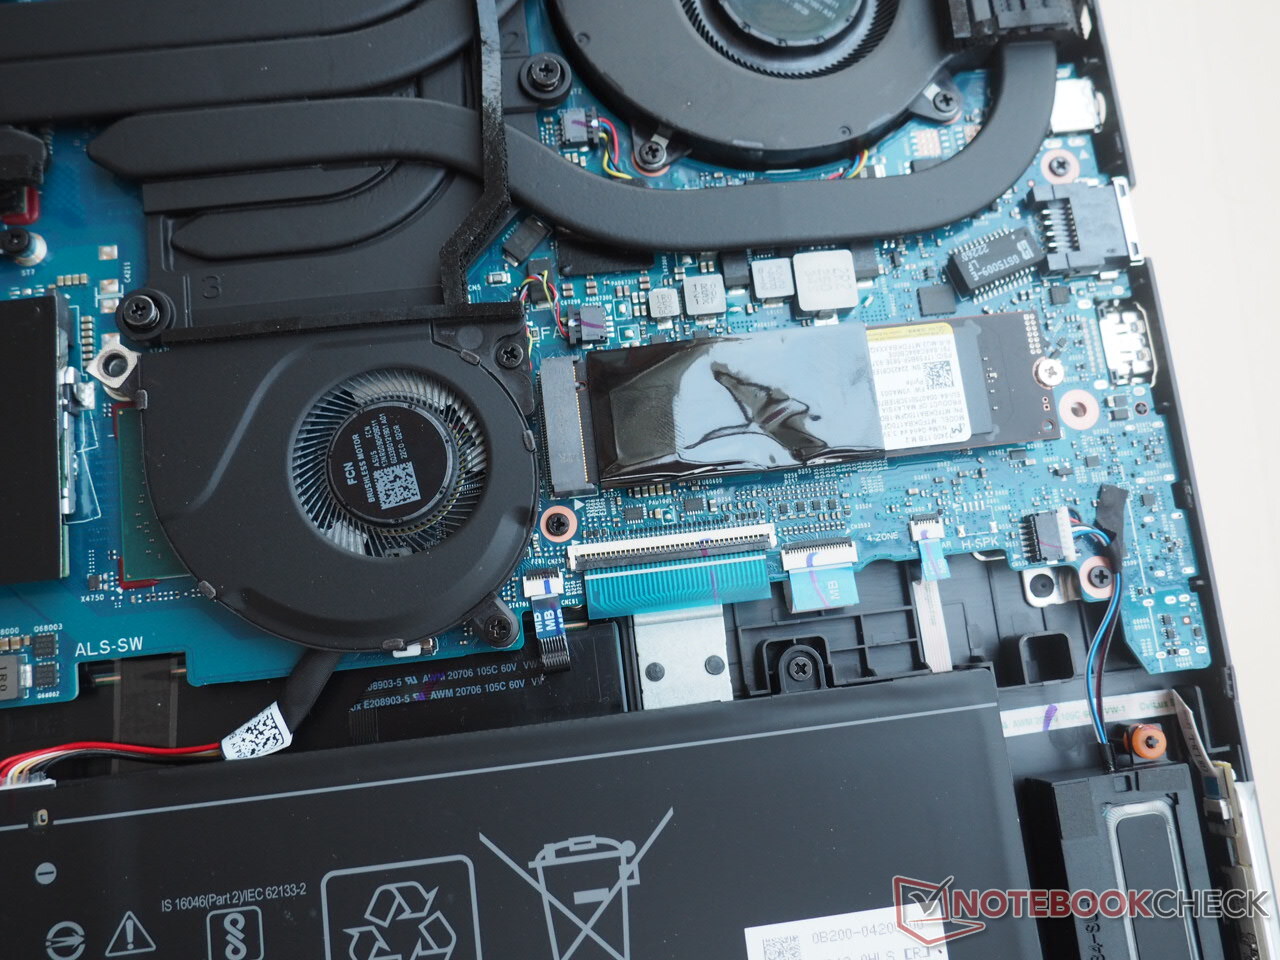
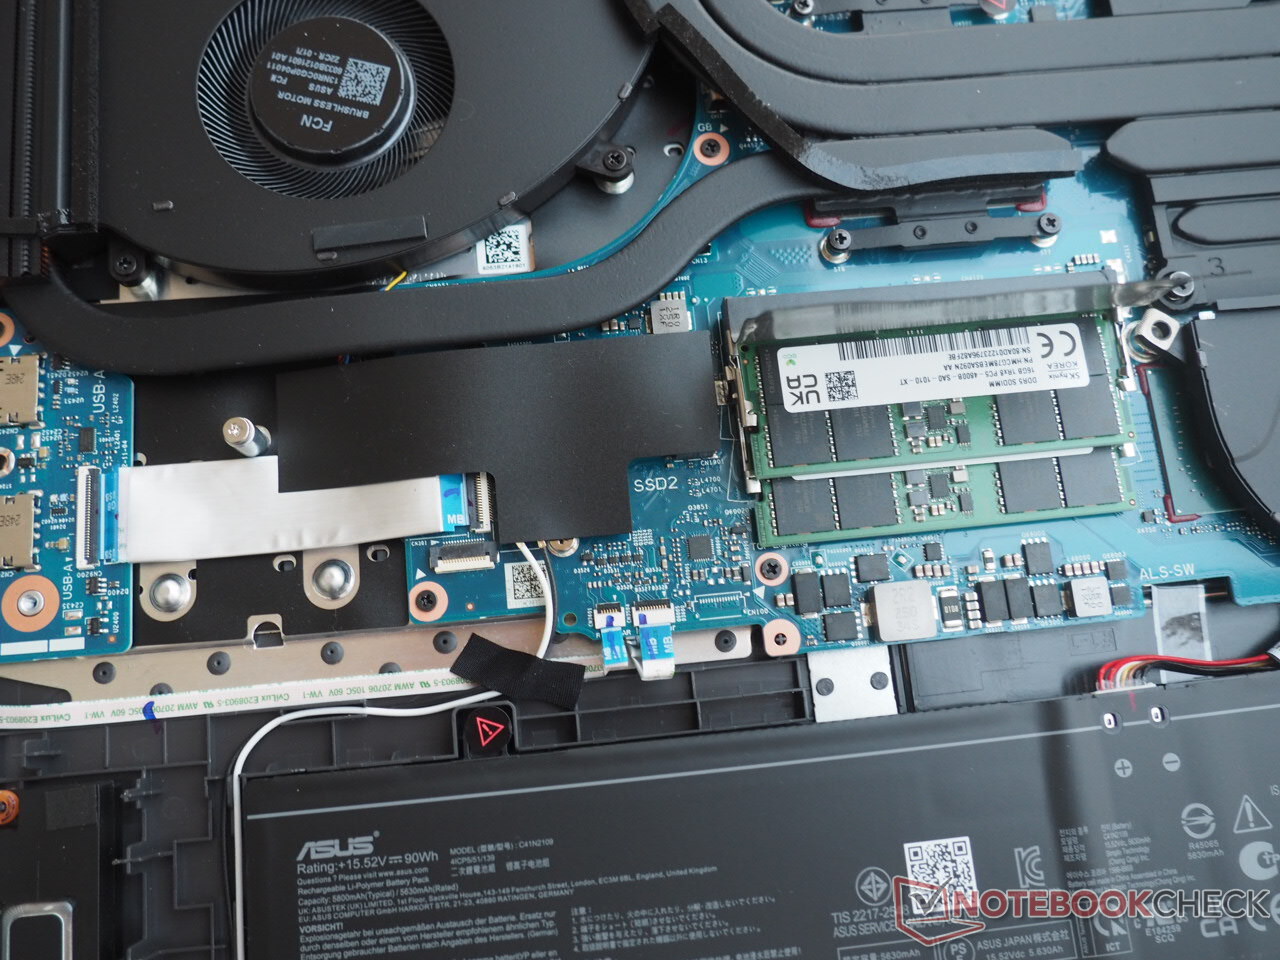
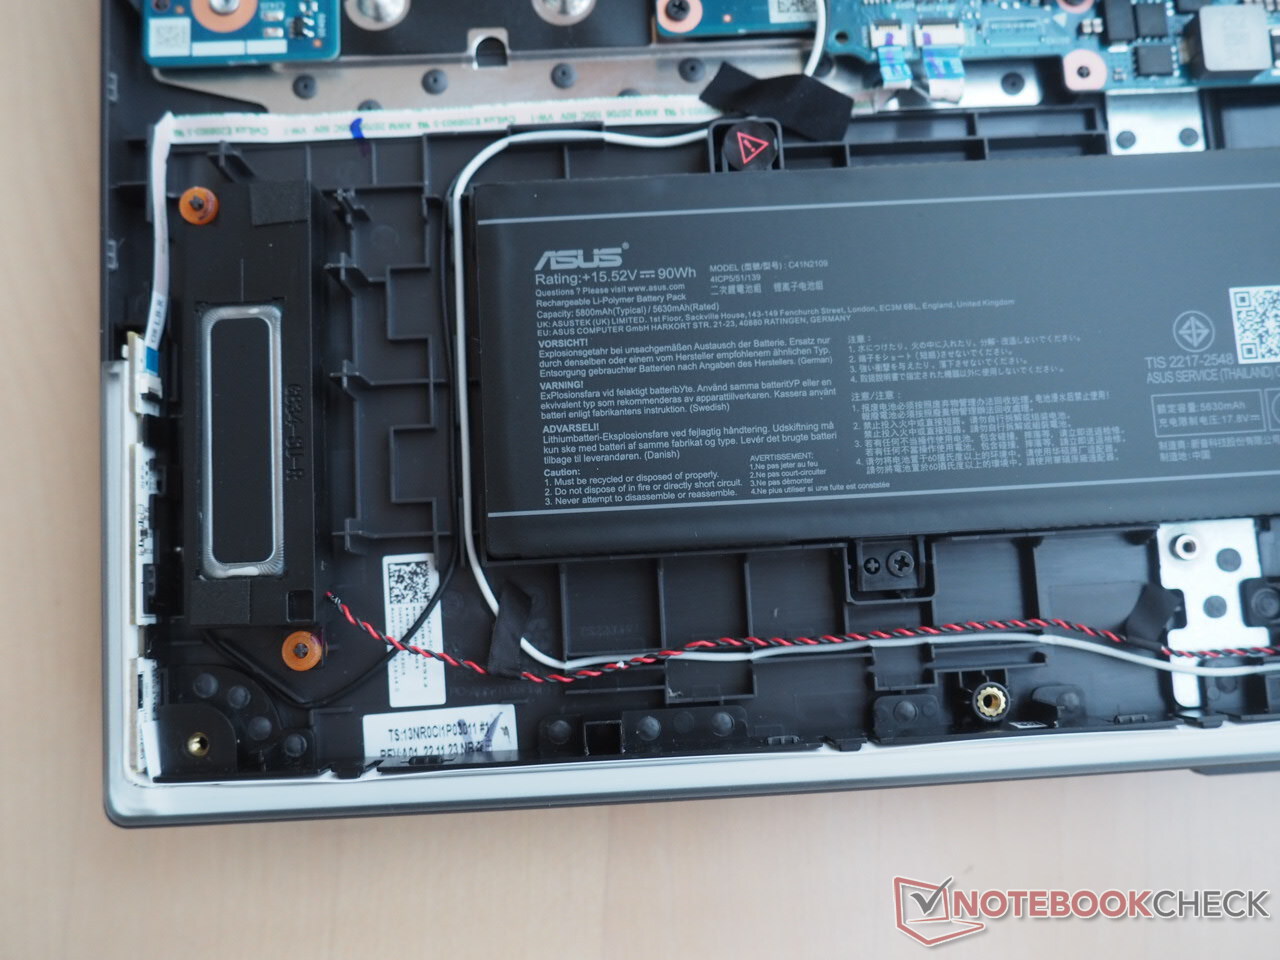
Como es habitual, hay que retirar varios tornillos de estrella y hacer palanca en la placa base para acceder a las entrañas del aparato. Esto último es algo más fácil que en muchos competidores, ya que la extracción de uno de los tornillos de las esquinas levanta ligeramente la carcasa, creando así un buen ángulo de apertura. Un vistazo bajo el capó revela un extenso sistema de refrigeración con múltiples y complejos tubos de calor, dos ventiladores grandes y uno pequeño (Asus también usa metal líquido). Además, hay dos ranuras SO-DIMM para RAM (ocupadas) y dos ranuras M.2 para SSDs (1x libre). El área de reposamanos está flanqueada por una larga batería.
Dispositivos de entrada
Teclado
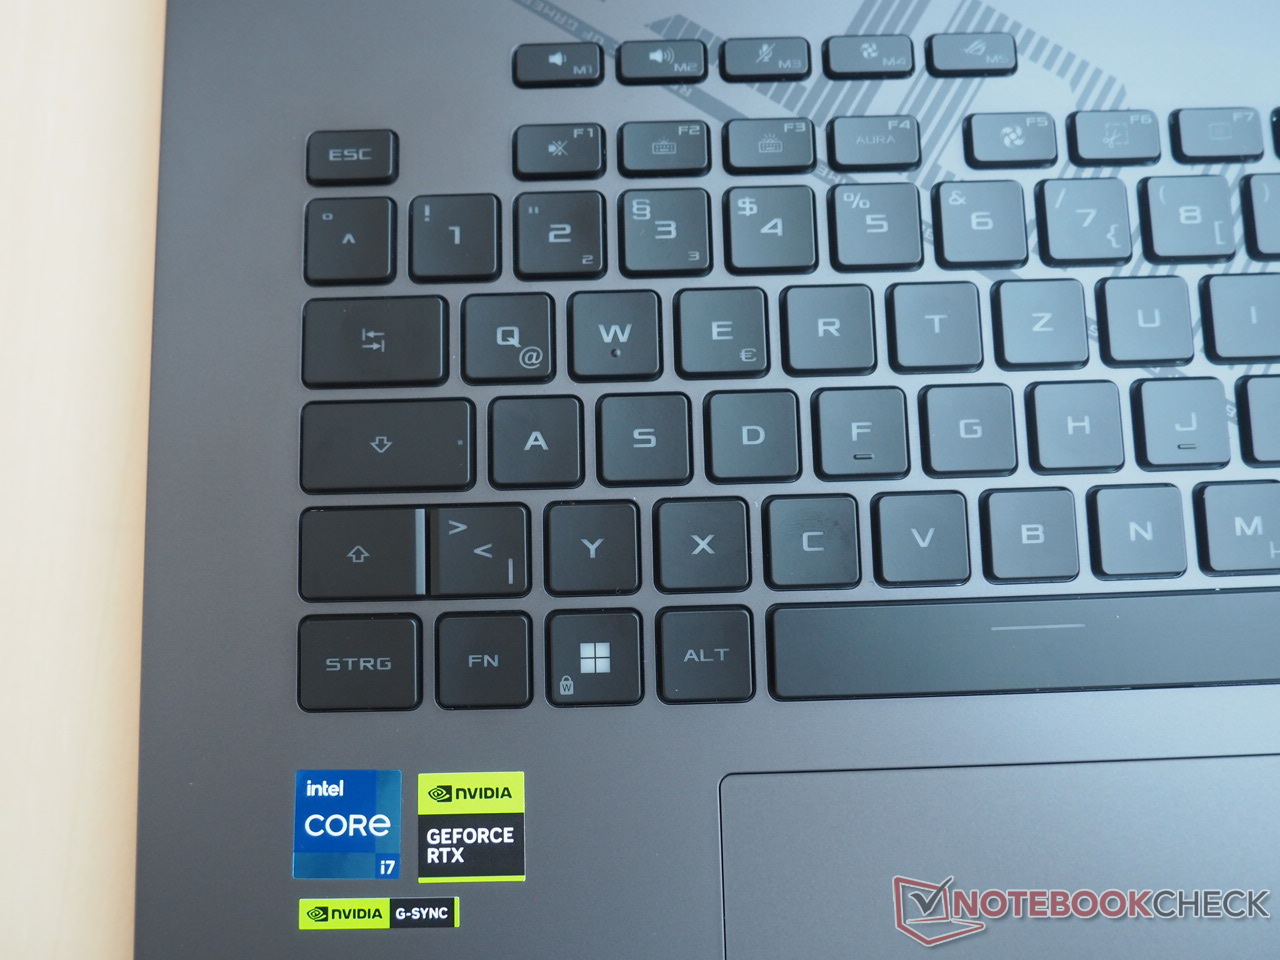
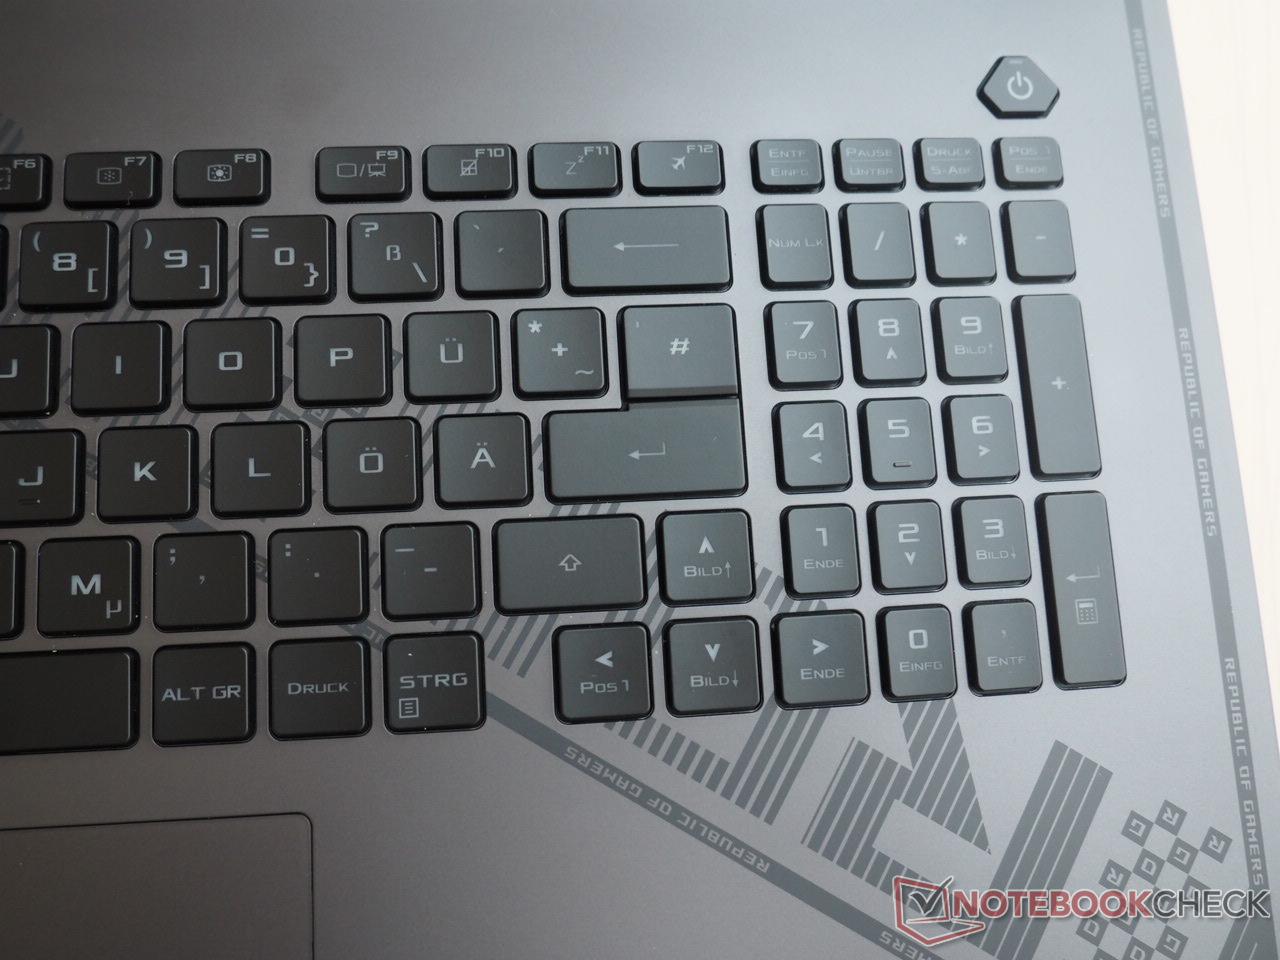
Tenemos sentimientos encontrados respecto al teclado. Mientras que, por ejemplo, las teclas de dirección (a diferencia de muchos otros portátiles) tienen un buen tamaño, las teclas del teclado numérico y la fila F podrían ser más grandes teniendo en cuenta el formato de 18 pulgadas. Es poco probable que la disposición guste a todo el mundo. Por ejemplo, los usuarios alemanes tienen que conformarse con una tecla Intro de un solo espacio. Algunas combinaciones de teclas, como Supr/Insertar, también son bastante desfavorables.
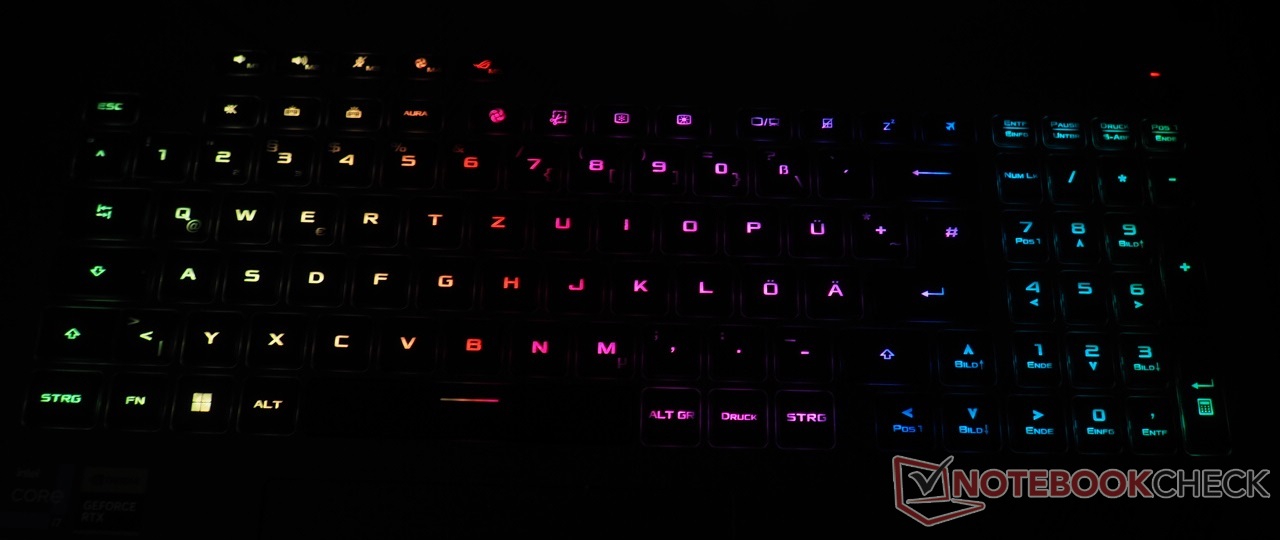
Esto sigue con la experiencia de tecleo. Aunque es aceptable en su mayor parte - debido a la decente estabilidad de la unidad base - podría ser un poco más definida (respuesta algo blanda), especialmente en comparación con el tipo de teclados mecánicos que se encuentran en algunos portátiles para juegos. Los puntos positivos son las prácticas teclas especiales y la buena iluminación RGB de una sola tecla, que disfruta de varios modos y personalización multinivel.
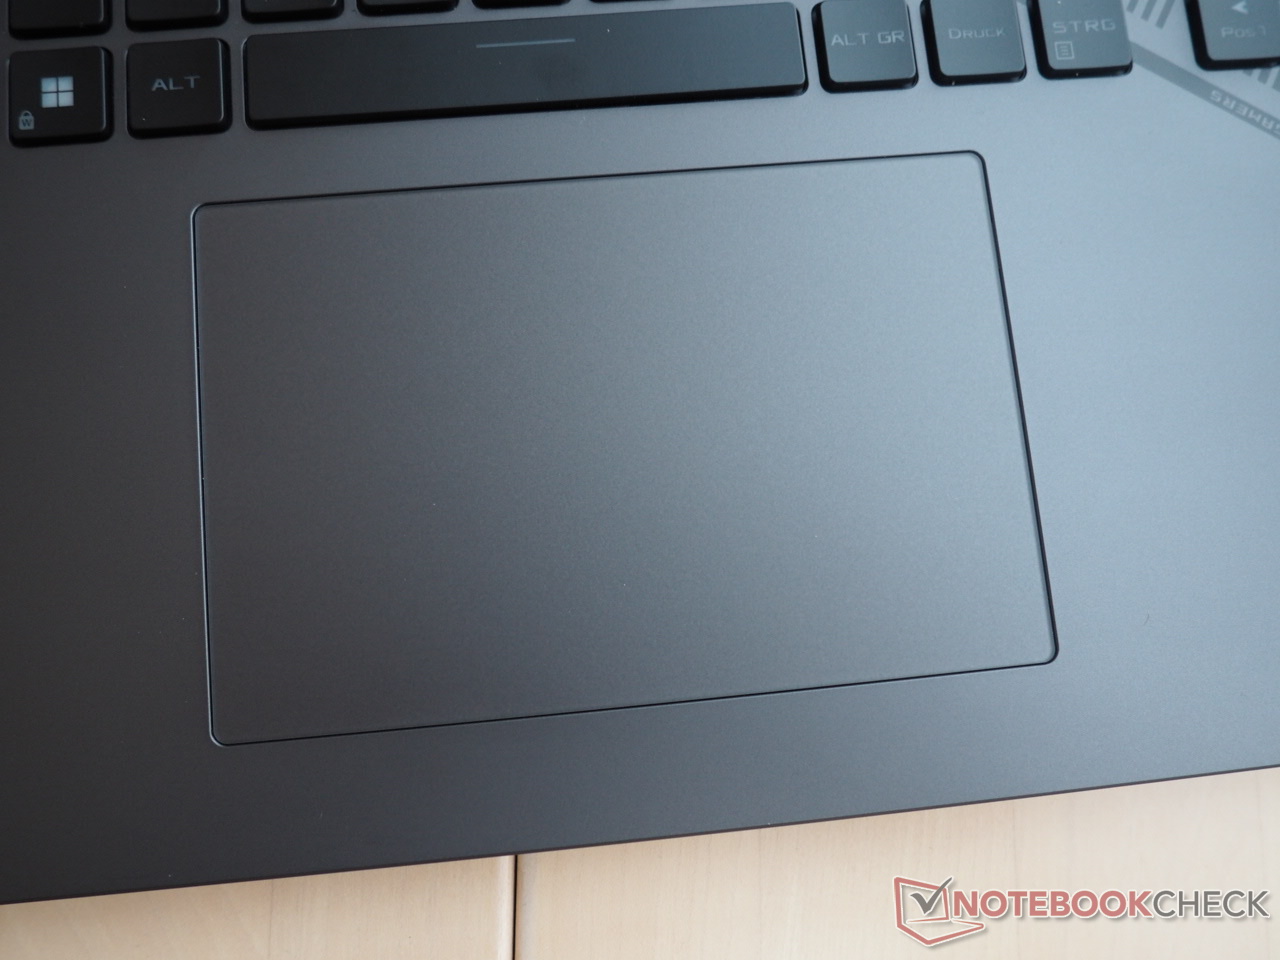
Panel táctil
Hasta cierto punto, el touchpad también sufre de una estabilidad subóptima de la carcasa. Al igual que el chasis, a veces cruje bastante, lo que no debería ser el caso a este precio. Aparte de eso, el ratón de sustitución causó una impresión de primera. Con su superficie lisa y su generoso tamaño (13 x 8,5 cm), las entradas como el desplazamiento a través de una larga serie de imágenes son fáciles de manejar, sobre todo porque la precisión está en su punto.
Mostrar
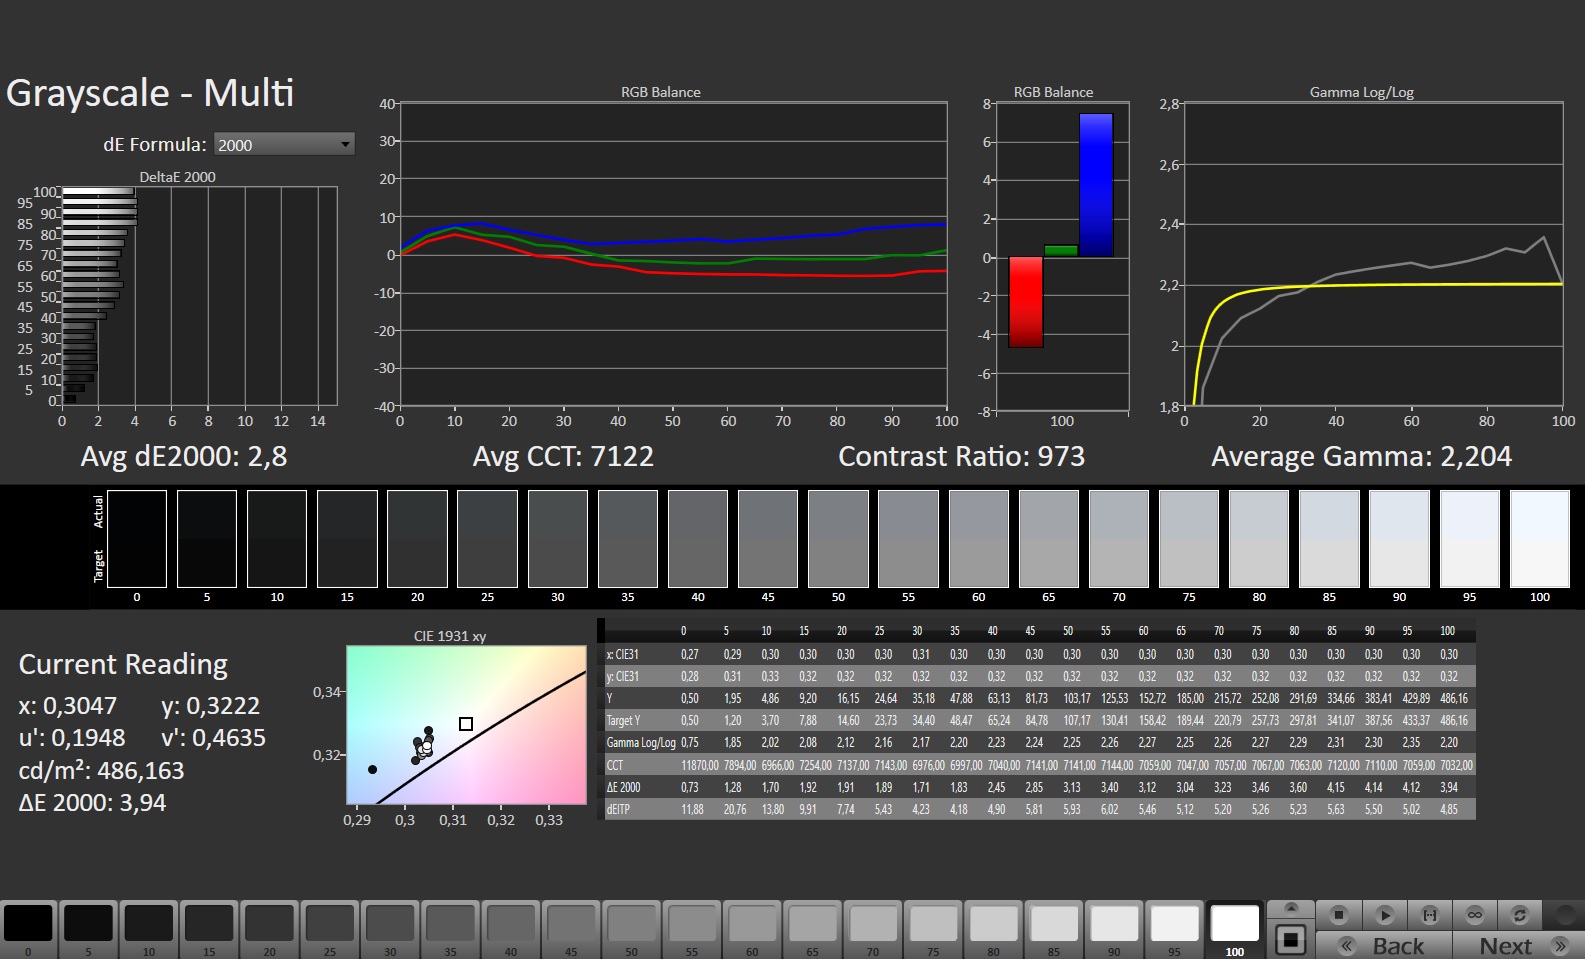
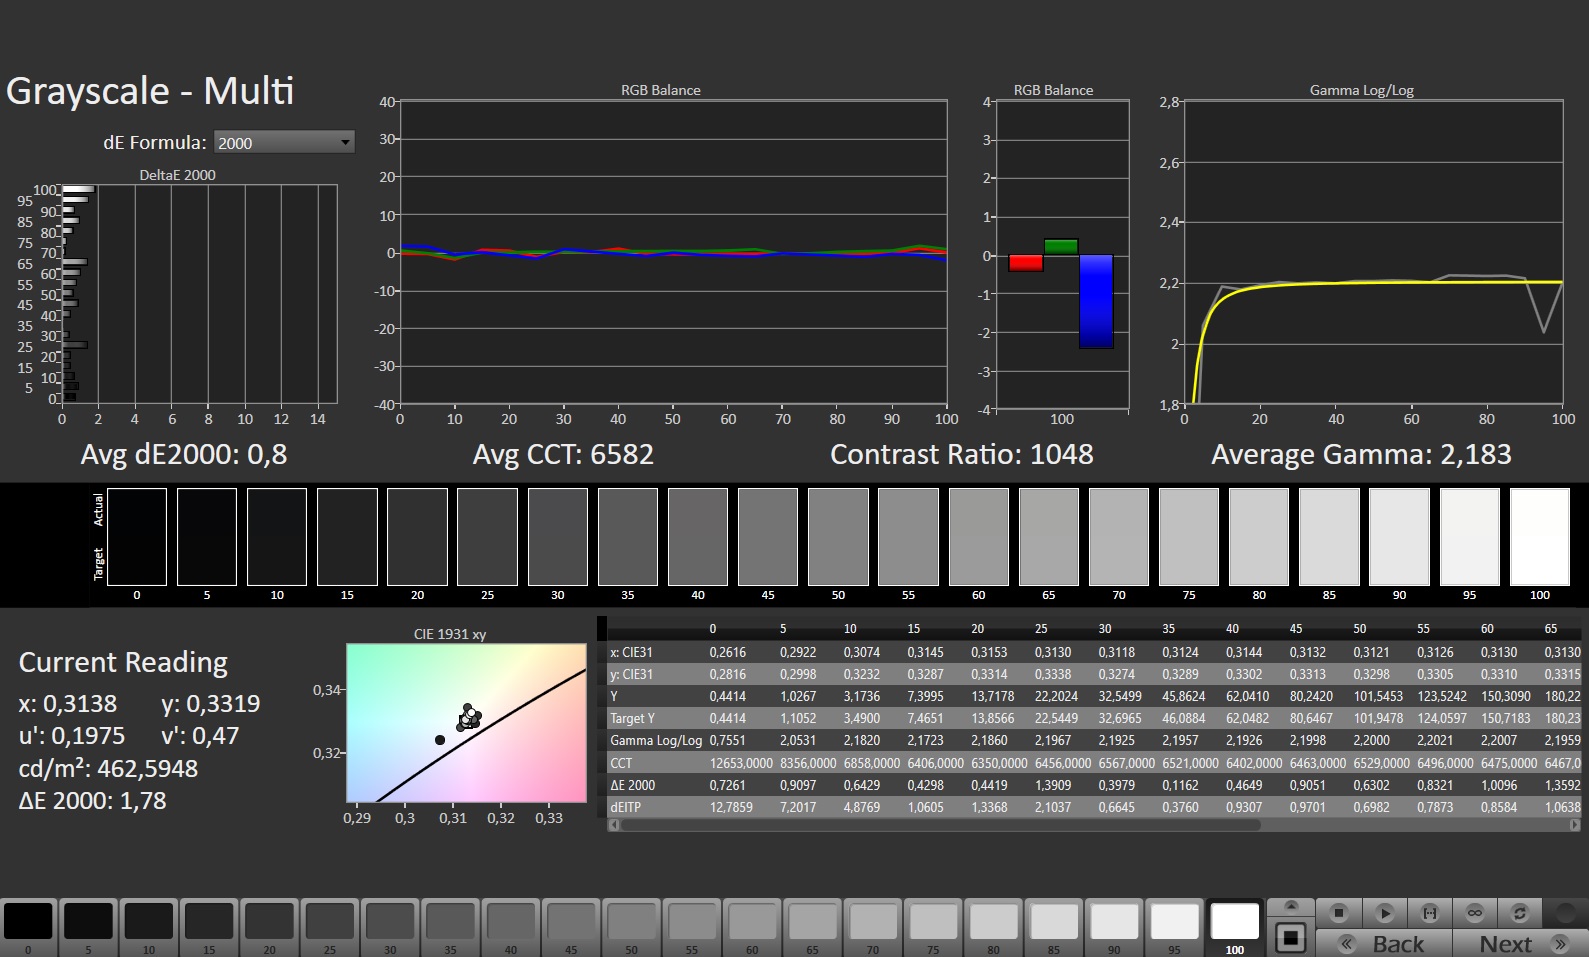
Uno de los mayores puntos fuertes del G18 es la buena pantalla. Aunque el panel no llega a los 500 nits anunciados por Asus - algo probablemente relacionado con el precalibrado - una media de 420 cd/m² sigue siendo buena para un panel IPs y permite el uso ocasional en exteriores.
| |||||||||||||||||||||||||
iluminación: 83 %
Brillo con batería: 471 cd/m²
Contraste: 1002:1 (Negro: 0.47 cd/m²)
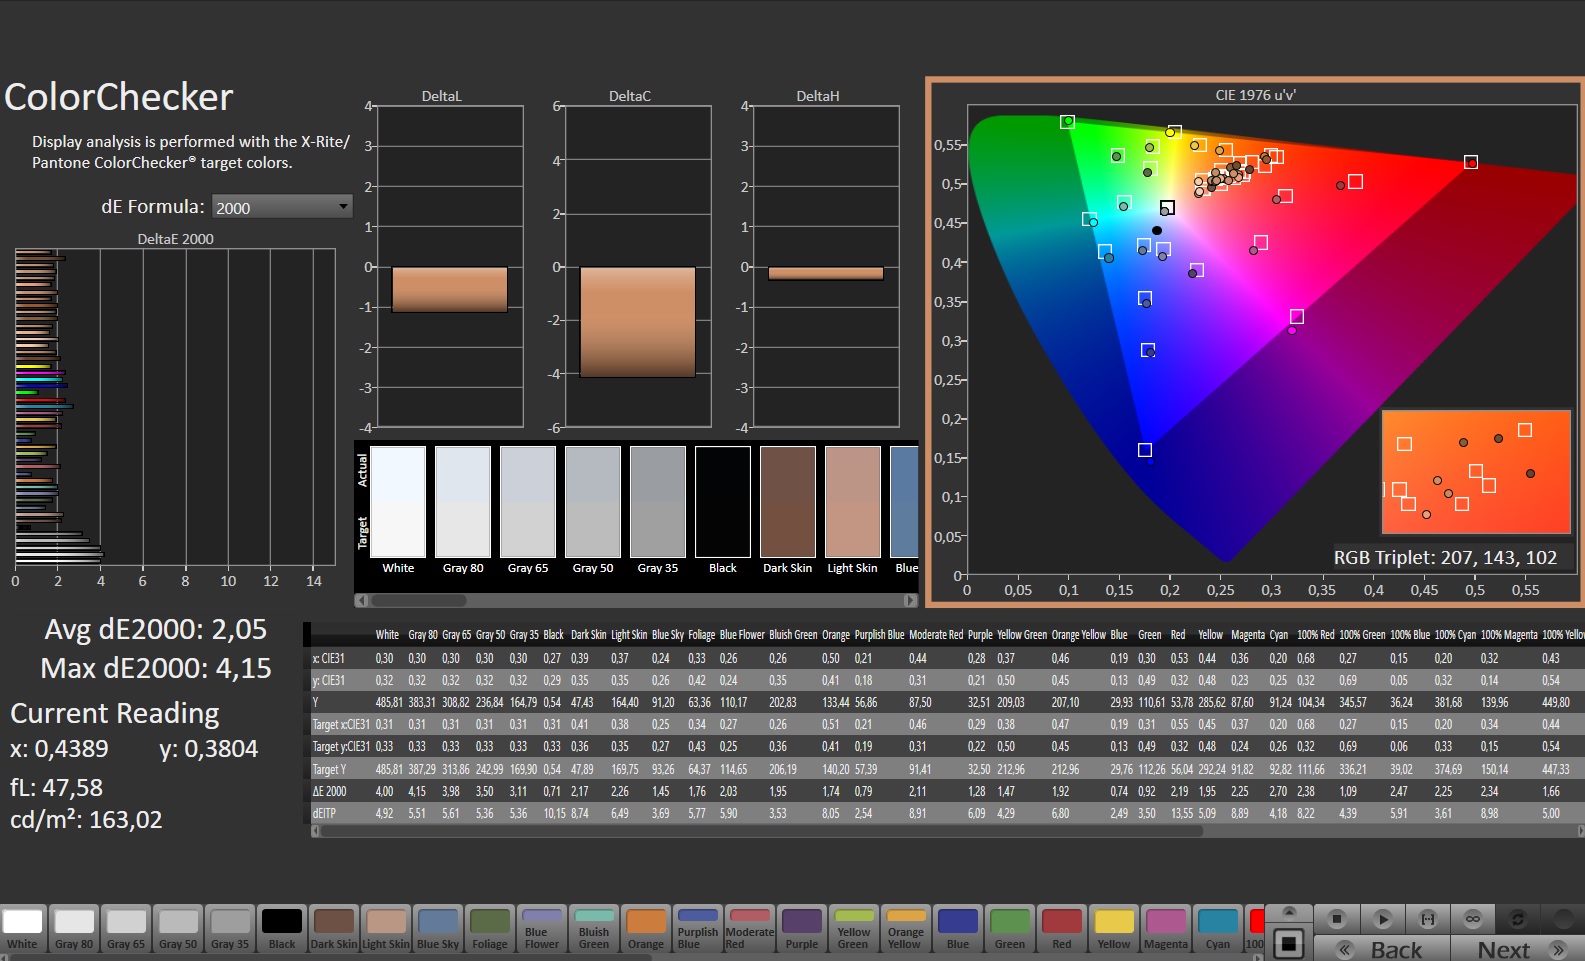
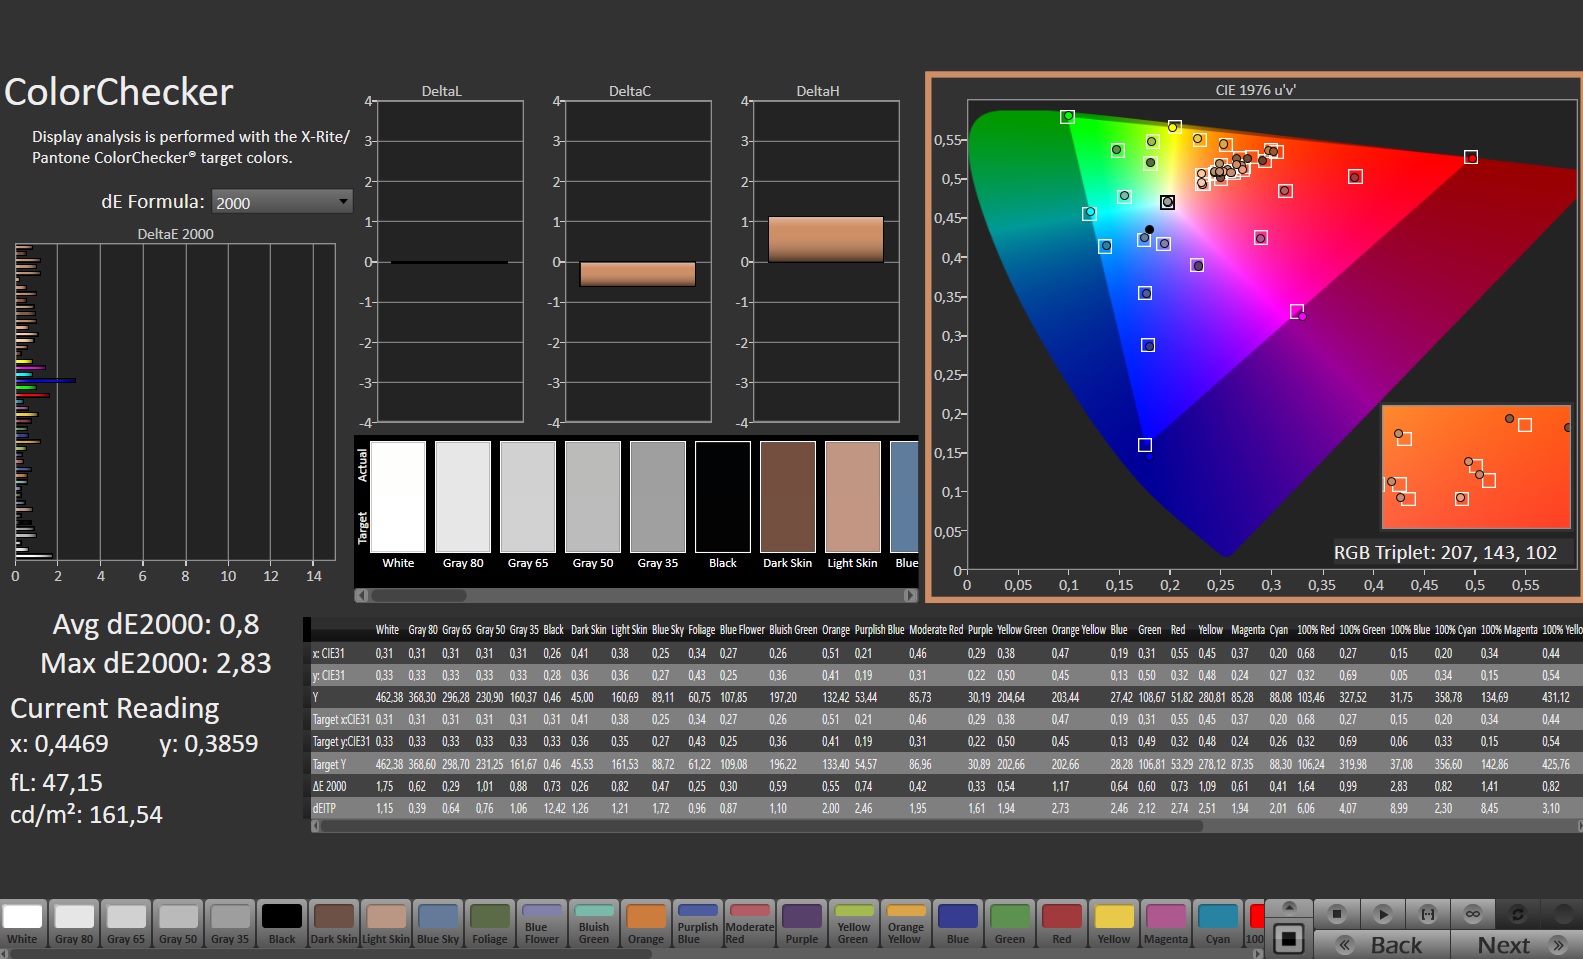
ΔE ColorChecker Calman: 2.05 | ∀{0.5-29.43 Ø4.73}
calibrated: 0.8
ΔE Greyscale Calman: 2.8 | ∀{0.09-98 Ø4.97}
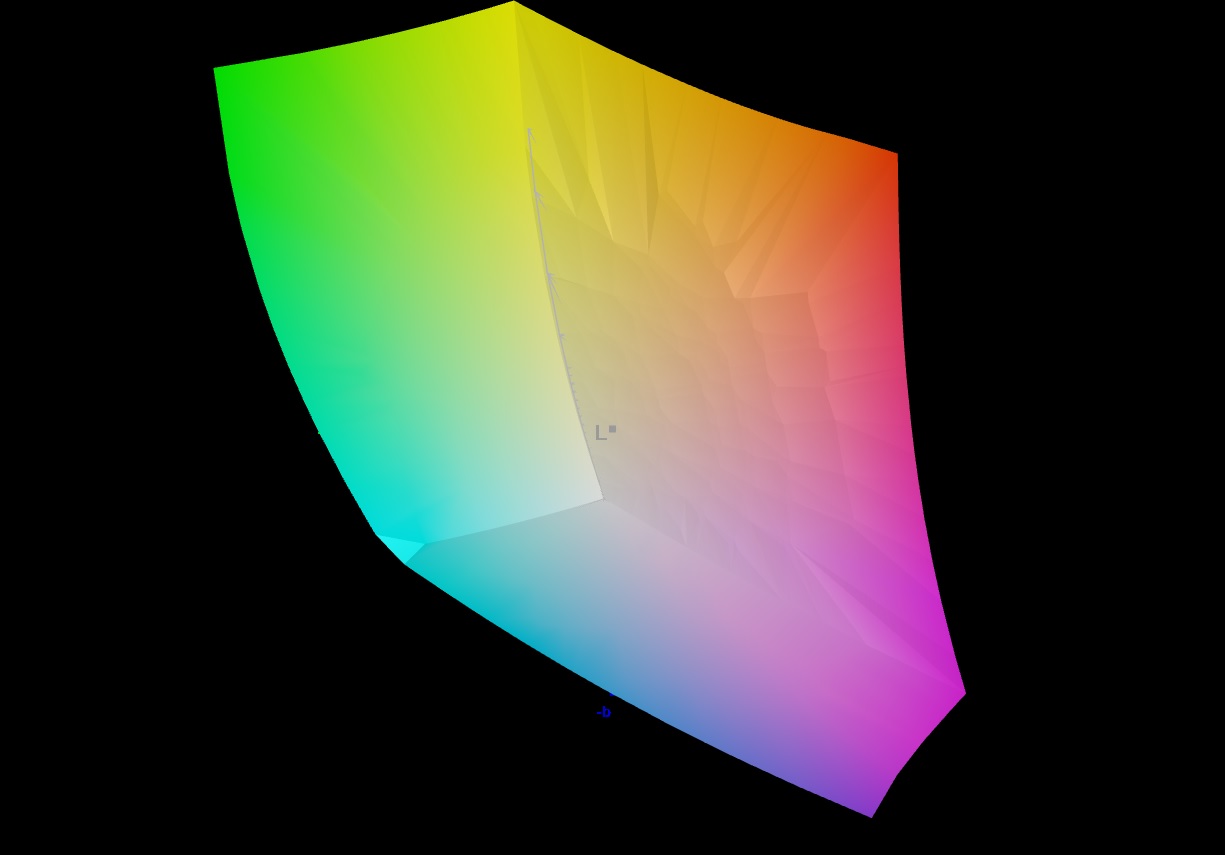
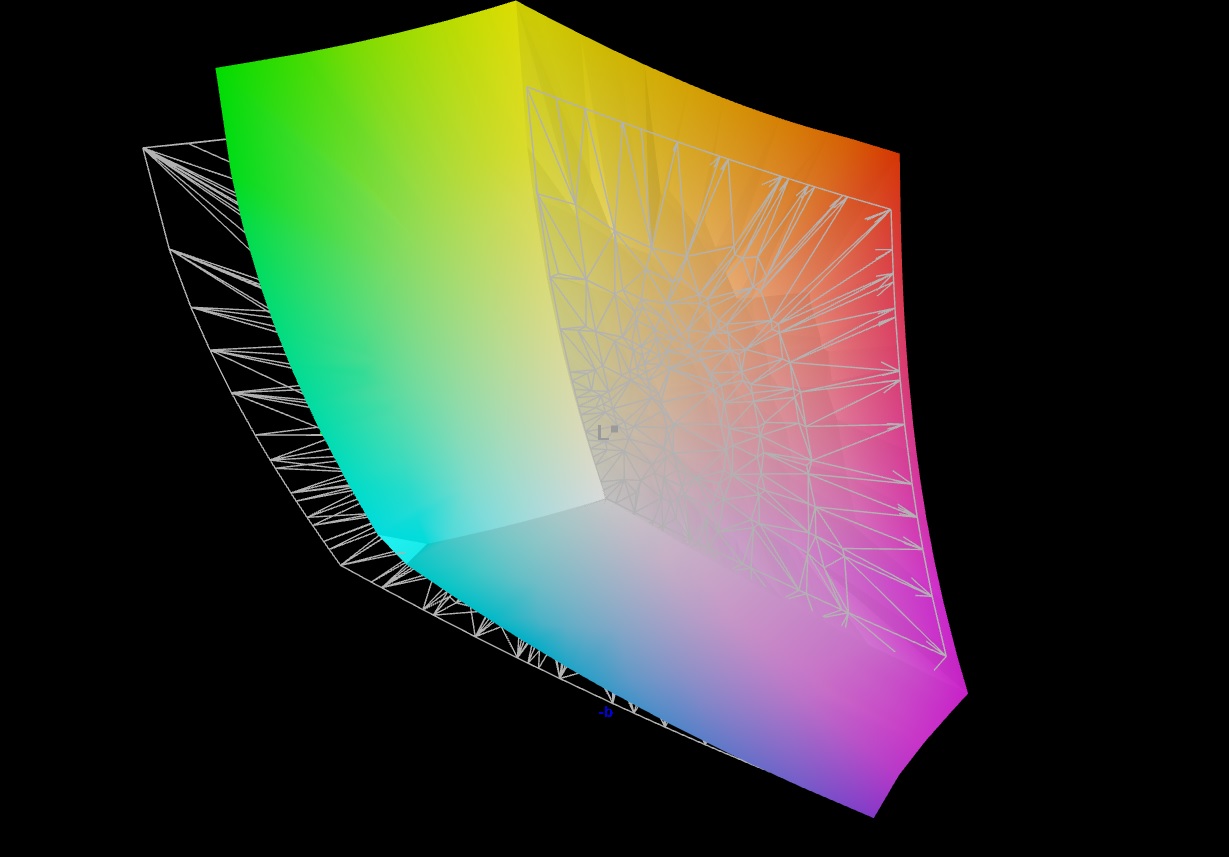
85.6% AdobeRGB 1998 (Argyll 3D)
99.9% sRGB (Argyll 3D)
98.1% Display P3 (Argyll 3D)
Gamma: 2.204
CCT: 7122 K
| Asus ROG Strix G18 G814JI NE180QDM-NZ2 (BOE0B35), IPS, 2560x1600, 18" | Razer Blade 18 RTX 4070 AU Optronics B180QAN01.0, IPS, 2560x1600, 18" | Gigabyte A7 X1 AU Optronics AUO8E8D, IPS, 1920x1080, 17.3" | Lenovo Legion 5 Pro 16ARH7H RTX 3070 Ti BOE CQ NE160QDM-NY1, IPS, 2560x1600, 16" | Alienware x17 RTX 3080 P48E AU Optronics B173ZAN, IPS, 3840x2160, 17.3" | MSI Raider GE77 HX 12UHS AU Optronics B173ZAN06.1, IPS, 3840x2160, 17.3" | |
|---|---|---|---|---|---|---|
| Display | -0% | -24% | -18% | 2% | -1% | |
| Display P3 Coverage (%) | 98.1 | 96.9 -1% | 61.5 -37% | 67.3 -31% | 88.3 -10% | 96.6 -2% |
| sRGB Coverage (%) | 99.9 | 99.8 0% | 90.9 -9% | 96.1 -4% | 100 0% | 99.8 0% |
| AdobeRGB 1998 Coverage (%) | 85.6 | 85.3 0% | 63.2 -26% | 69.5 -19% | 100 17% | 85.8 0% |
| Response Times | 18% | -103% | -91% | -87% | 17% | |
| Response Time Grey 50% / Grey 80% * (ms) | 5.6 ? | 4.2 ? 25% | 16 ? -186% | 14.4 ? -157% | 14.4 ? -157% | 5.8 ? -4% |
| Response Time Black / White * (ms) | 9 ? | 8 ? 11% | 10.8 ? -20% | 11.2 ? -24% | 10.4 ? -16% | 5.6 ? 38% |
| PWM Frequency (Hz) | ||||||
| Screen | -33% | -50% | 1% | -19% | -47% | |
| Brightness middle (cd/m²) | 471 | 549.6 17% | 325 -31% | 522.8 11% | 438.7 -7% | 381 -19% |
| Brightness (cd/m²) | 422 | 524 24% | 318 -25% | 503 19% | 435 3% | 371 -12% |
| Brightness Distribution (%) | 83 | 89 7% | 95 14% | 84 1% | 91 10% | 84 1% |
| Black Level * (cd/m²) | 0.47 | 0.53 -13% | 0.29 38% | 0.41 13% | 0.48 -2% | 0.52 -11% |
| Contrast (:1) | 1002 | 1037 3% | 1121 12% | 1275 27% | 914 -9% | 733 -27% |
| Colorchecker dE 2000 * | 2.05 | 3.32 -62% | 4.33 -111% | 2.47 -20% | 4.34 -112% | |
| Colorchecker dE 2000 max. * | 4.15 | 6.63 -60% | 8.6 -107% | 6.56 -58% | 7.3 -76% | |
| Colorchecker dE 2000 calibrated * | 0.8 | 2.7 -238% | 1.95 -144% | 0.61 24% | 0.72 10% | 2.53 -216% |
| Greyscale dE 2000 * | 2.8 | 2 29% | 5.5 -96% | 3 -7% | 2.4 14% | |
| Gamma | 2.204 100% | 2.29 96% | 2.142 103% | 2.27 97% | 2.09 105% | |
| CCT | 7122 91% | 6319 103% | 7893 82% | 6719 97% | 6413 101% | |
| Media total (Programa/Opciones) | -5% /
-18% | -59% /
-52% | -36% /
-16% | -35% /
-24% | -10% /
-23% |
* ... más pequeño es mejor
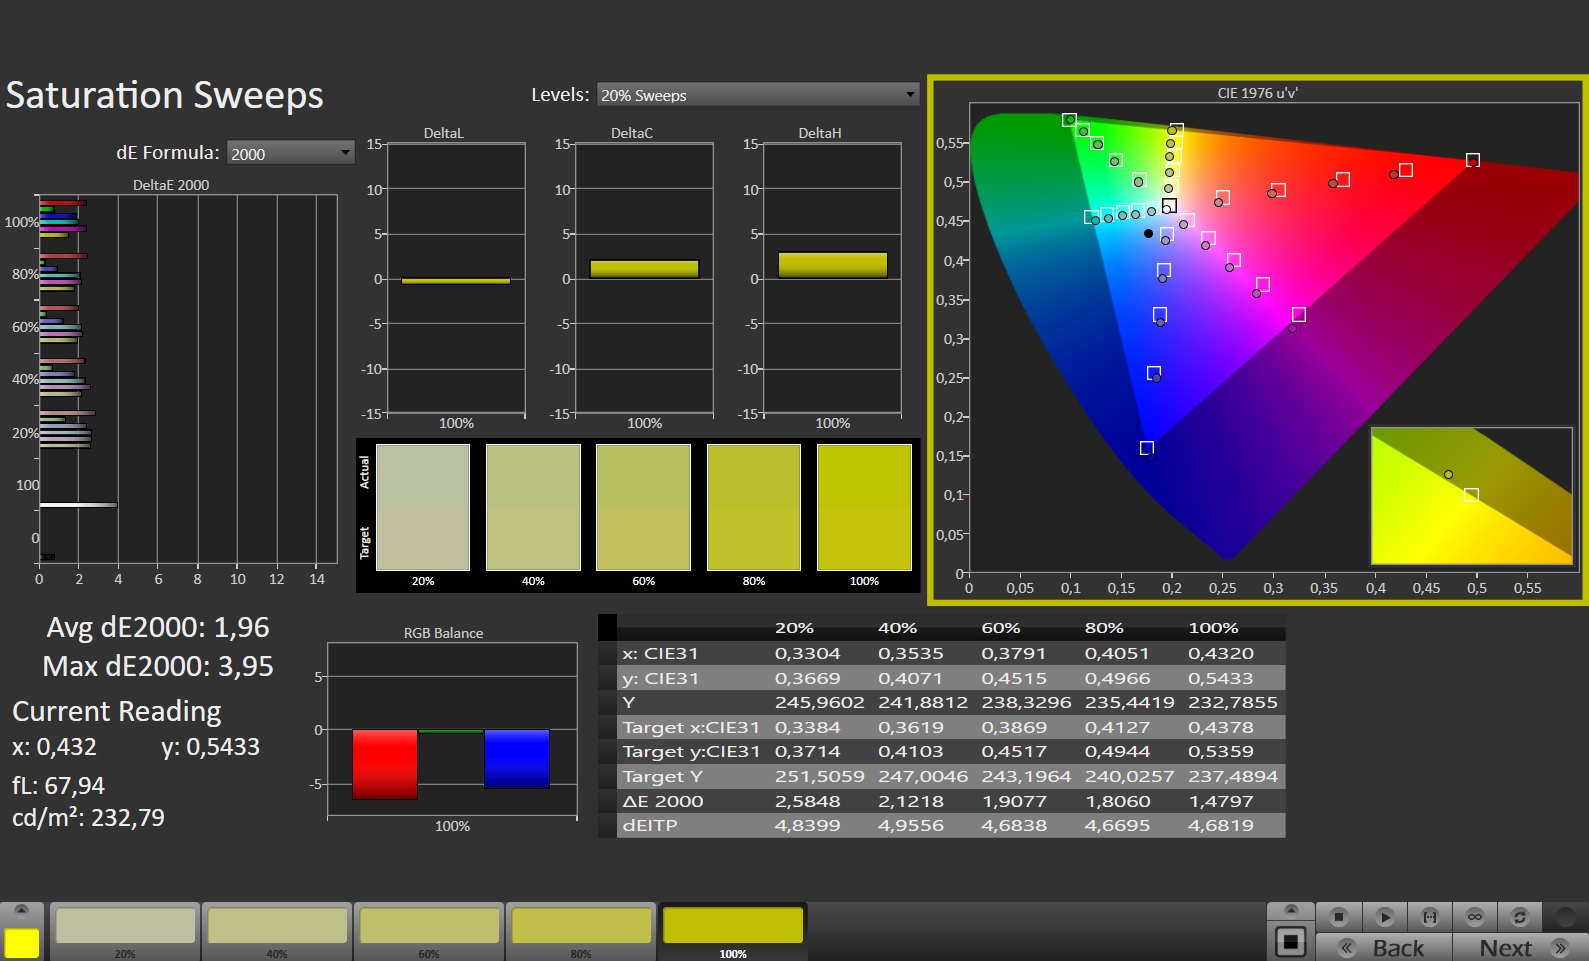
Los usuarios profesionales estarán contentos con el espacio de color del portátil: Según nuestras mediciones, el G18 logra un 100 % de sRGB, 98 % de P3 y 86 % de AdobeRGB - en conjunto, unos resultados impresionantes. Tampoco hay casi nada que criticar en el área de la reproducción del color. Desde el primer momento, los valores se encuentran en un rango ideal (DeltaE inferior a 3), lo que garantiza unos colores muy naturales.
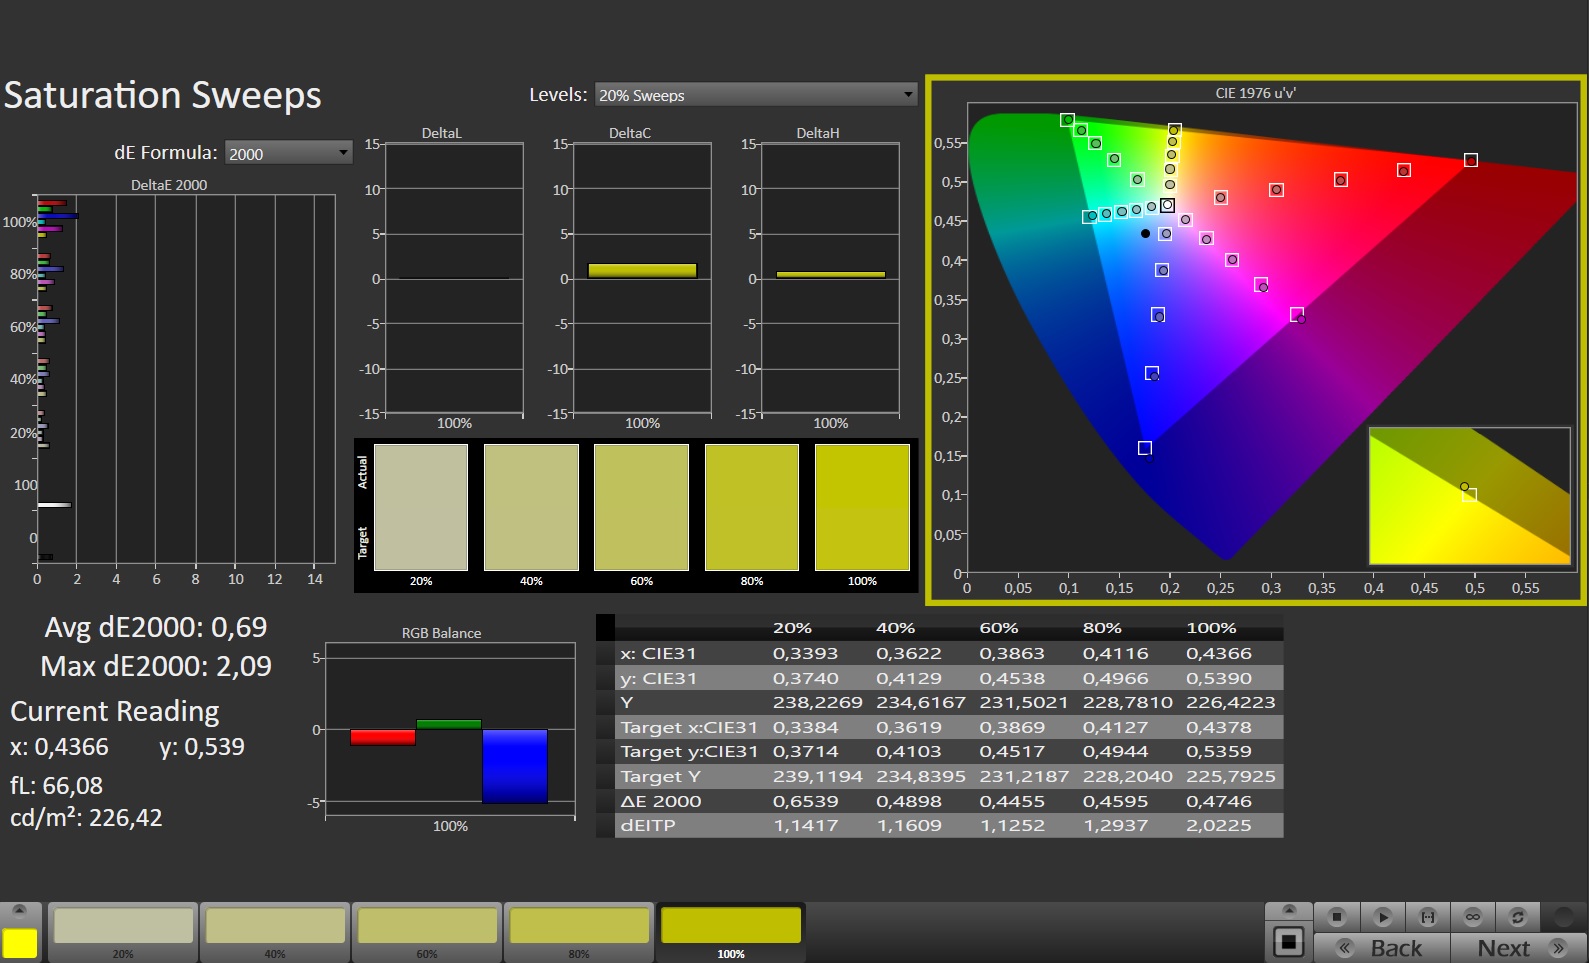
Sin embargo, no sólo los creadores, sino también los jugadores sacan provecho de su dinero: gracias al corto tiempo de respuesta (menos de 10 ms), el G18 es incluso adecuado para juegos de ritmo más rápido. No detectamos ningún parpadeo de la pantalla (por ejemplo, PWM).

Por otro lado, el dispositivo de pruebas tuvo problemas de sangrado de pantalla, especialmente en las esquinas del panel. Sin embargo, no es algo que se note en todas las situaciones. El contraste (alrededor de 1.000:1) y el nivel de negro (0.47 cd/m²) tampoco son perfectos, y el Blade 18 tiene una puntuación similar en este aspecto. Por contra, los ángulos de visión son bastante buenos y típicos de un panel IPS.
Tiempos de respuesta del display
| ↔ Tiempo de respuesta de Negro a Blanco | ||
|---|---|---|
| 9 ms ... subida ↗ y bajada ↘ combinada | ↗ 4 ms subida | 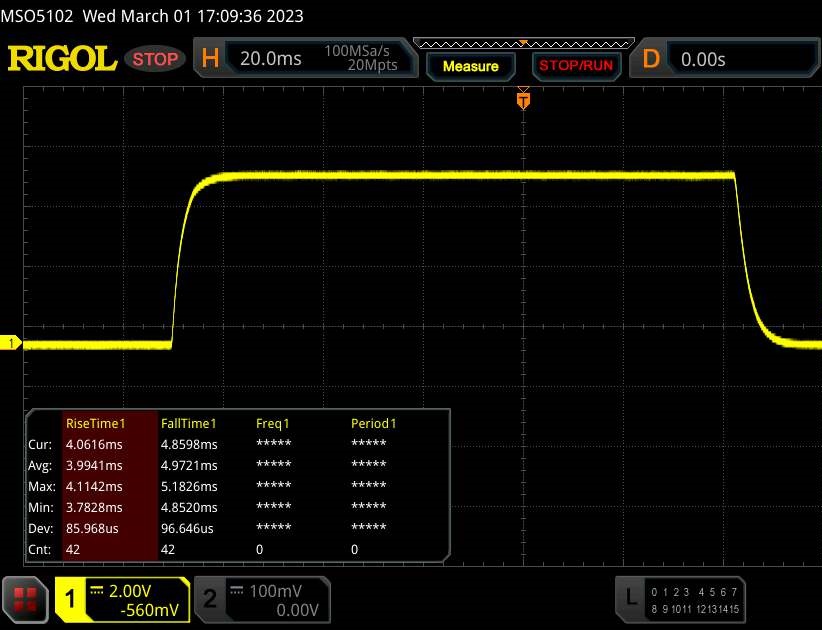 |
| ↘ 5 ms bajada | ||
| La pantalla mostró tiempos de respuesta rápidos en nuestros tests y debería ser adecuada para juegos. En comparación, todos los dispositivos de prueba van de ##min### (mínimo) a 240 (máximo) ms. » 25 % de todos los dispositivos son mejores. Esto quiere decir que el tiempo de respuesta medido es mejor que la media (19.9 ms) de todos los dispositivos testados. | ||
| ↔ Tiempo de respuesta 50% Gris a 80% Gris | ||
| 5.6 ms ... subida ↗ y bajada ↘ combinada | ↗ 2.7 ms subida | 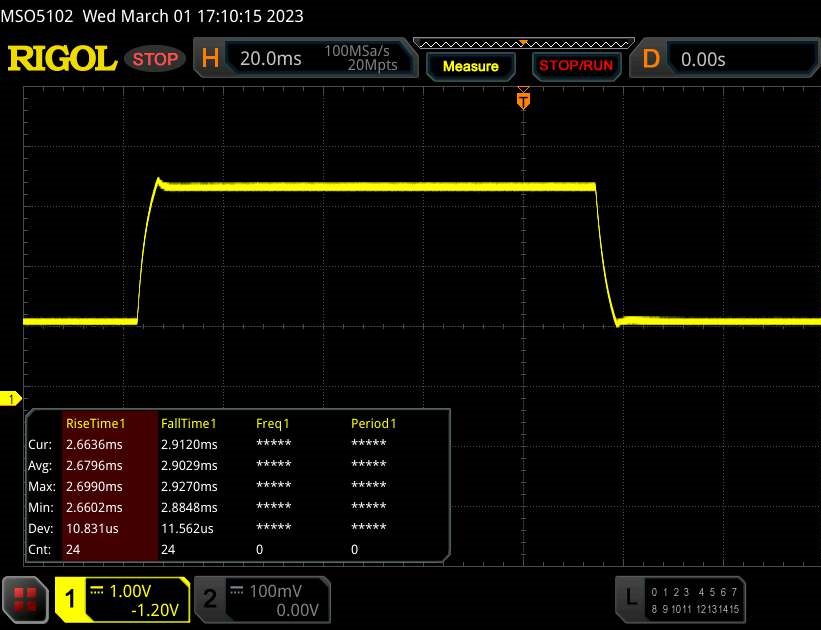 |
| ↘ 2.9 ms bajada | ||
| La pantalla mostró tiempos de respuesta muy rápidos en nuestros tests y debería ser adecuada para juegos frenéticos. En comparación, todos los dispositivos de prueba van de ##min### (mínimo) a 636 (máximo) ms. » 18 % de todos los dispositivos son mejores. Esto quiere decir que el tiempo de respuesta medido es mejor que la media (31.1 ms) de todos los dispositivos testados. | ||
Parpadeo de Pantalla / PWM (Pulse-Width Modulation)
| Parpadeo de Pantalla / PWM no detectado | 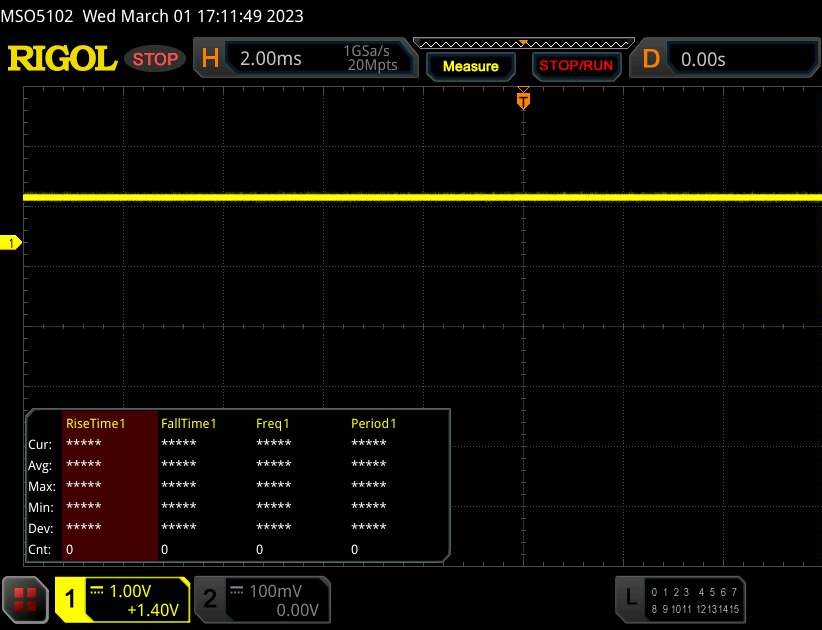 | ||
Comparación: 52 % de todos los dispositivos testados no usaron PWM para atenuar el display. Si se usó, medimos una media de 7798 (mínimo: 5 - máxmo: 343500) Hz. | |||
Rendimiento
Según las especificaciones, el Strix G18 puede considerarse un portátil de gama media o baja, con 32 GB de RAM probablemente suficientes para el año que viene. En caso de que la capacidad de almacenamiento del SSD se quede corta, el dispositivo puede ampliarse fácilmente con una segunda unidad M.2.
Condiciones de la prueba
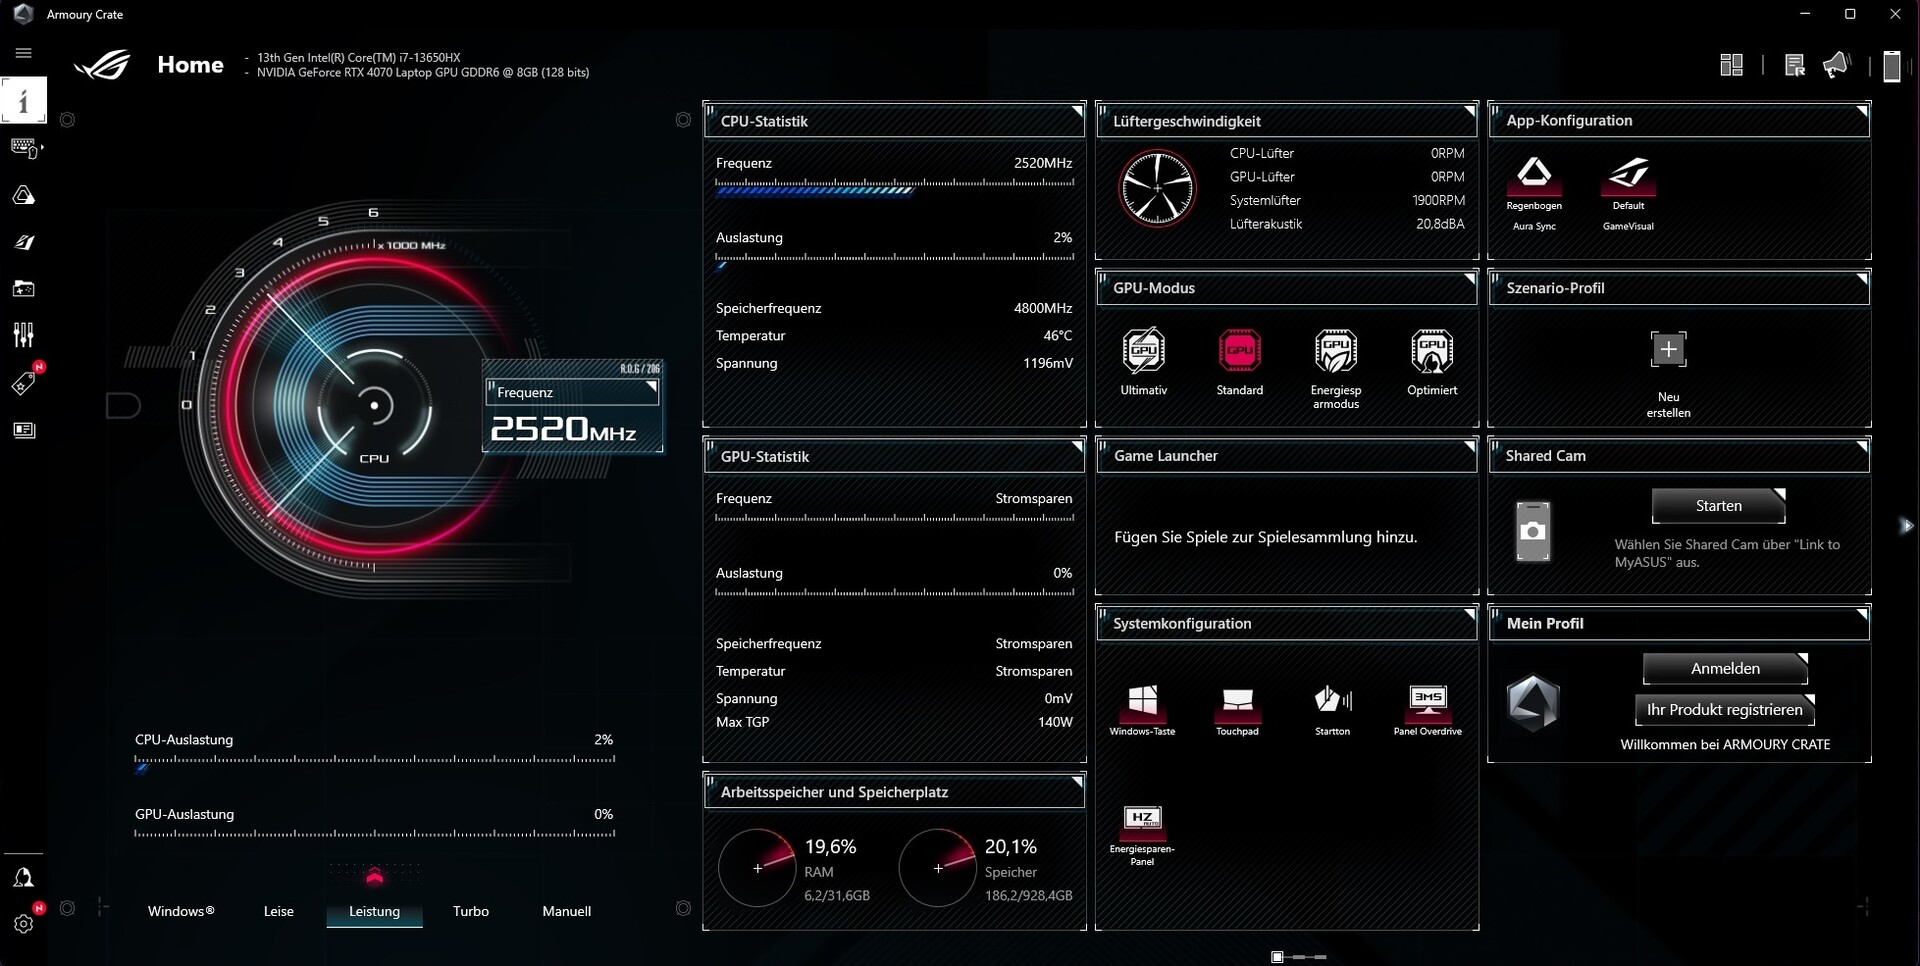
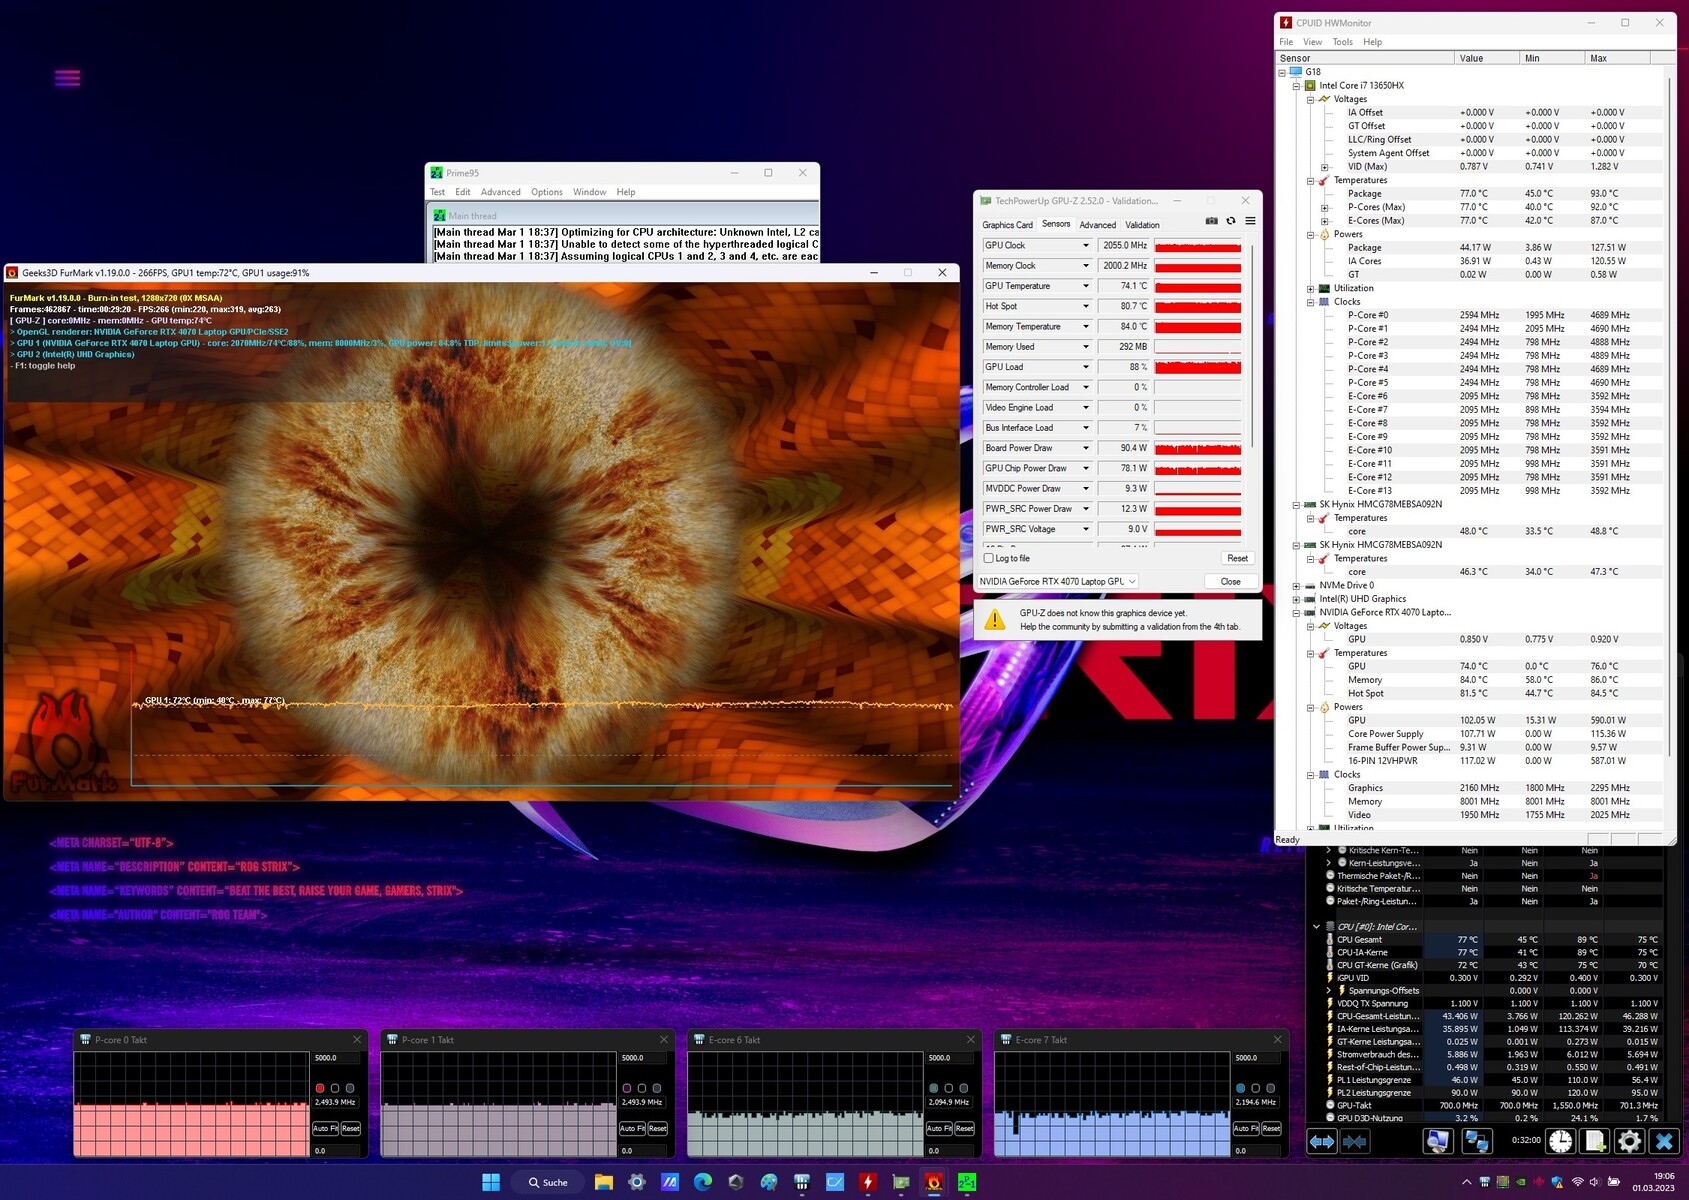
Muchos parámetros pueden configurarse en el potente, pero también algo desordenado y confuso Armoury Crate. Nuestras mediciones se realizaron utilizando los modos "Estándar" (conmutación activa de gráficos) y "Rendimiento" de la GPU. Extraño: Usando los modos "Silencioso" o "Turbo", el comportamiento del ventilador cambia, pero el rendimiento en la prueba The Witcher 3 permaneció inalterado. Esto sugeriría que hay problemas o un error aquí.
| ModoSilencioso | Modo Rendimiento | Modo Turbo | |
| CPU PL1 (HWiNFO) | 80 W | 110 W | 170 W |
| CPU PL2 (HWiNFO) | 100 W | 120 W | 175 W |
| Ruido (Witcher 3 ) | 38 - 40 dB(A) | 42 - 44 dB(A) | 51 dB(A) |
| Rendimiento (Witcher 3 ) | ~120 FPS | ~120 FPS | ~120 FPS |
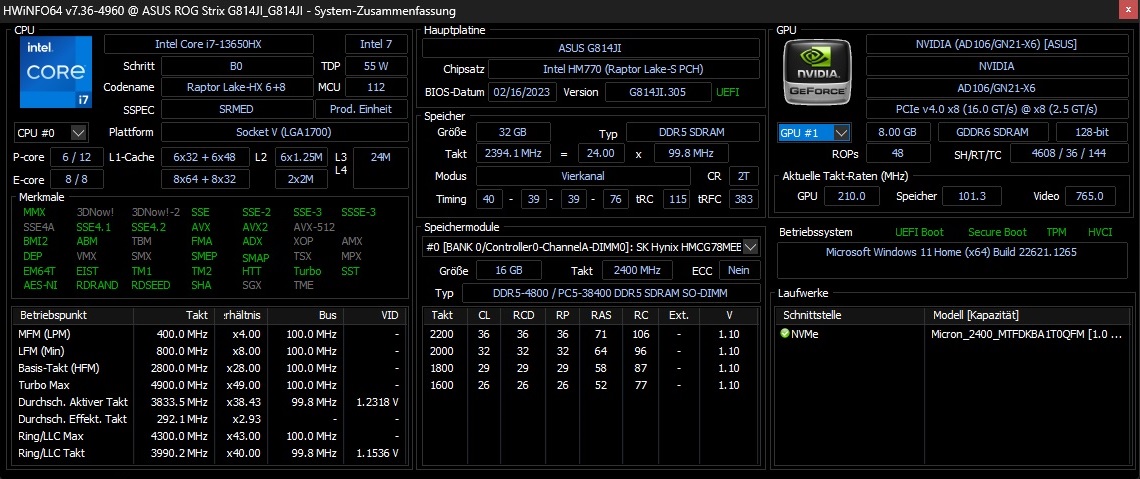
Procesador
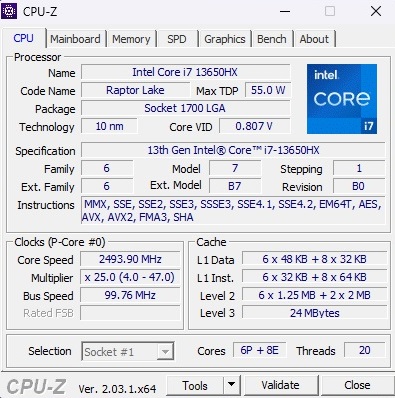
El Core i7-13650HX procede de la flamante serie Raptor Lake de Intel y tiene un TDP base de 55 vatios. Los 14 núcleos disponibles se dividen en 6 núcleos de rendimiento con hyper-threading y 8 núcleos de eficiencia sin HT, haciendo posible un total de 20 hilos. Dependiendo del tipo de núcleo, la velocidad de reloj puede variar enormemente, con variantes de rendimiento que llegan hasta los 4,9 GHz.
Aunque el rendimiento del i7-13650HX es alrededor de un 10 % menos potente que el Core i7-12900HX y aproximadamente un 20 % inferior que el Core i9-13950HXen el curso de la prueba de referencia, estos admiten hasta 24 hilos. Las CPUs a menudo significativamente más antiguas que se encuentran en los portátiles de la competencia - (Ryzen 7 6800H, Ryzen 9 5900HX & Core i7-11800H) - suelen quedarse atrás.
Cinebench R15 Multi Continuous Test
* ... más pequeño es mejor
AIDA64: FP32 Ray-Trace | FPU Julia | CPU SHA3 | CPU Queen | FPU SinJulia | FPU Mandel | CPU AES | CPU ZLib | FP64 Ray-Trace | CPU PhotoWorxx
| Performance rating | |
| Razer Blade 18 RTX 4070 | |
| Media de la clase Gaming | |
| MSI Raider GE77 HX 12UHS | |
| Asus ROG Strix G18 G814JI | |
| Lenovo Legion 5 Pro 16ARH7H RTX 3070 Ti | |
| Medio Intel Core i7-13650HX | |
| Gigabyte A7 X1 | |
| Alienware x17 RTX 3080 P48E -9! | |
| AIDA64 / FP32 Ray-Trace | |
| Media de la clase Gaming (10227 - 85542, n=110, últimos 2 años) | |
| Razer Blade 18 RTX 4070 | |
| Asus ROG Strix G18 G814JI | |
| MSI Raider GE77 HX 12UHS | |
| Medio Intel Core i7-13650HX (13404 - 20012, n=5) | |
| Lenovo Legion 5 Pro 16ARH7H RTX 3070 Ti | |
| Gigabyte A7 X1 | |
| AIDA64 / FPU Julia | |
| Media de la clase Gaming (51376 - 238426, n=110, últimos 2 años) | |
| Razer Blade 18 RTX 4070 | |
| MSI Raider GE77 HX 12UHS | |
| Lenovo Legion 5 Pro 16ARH7H RTX 3070 Ti | |
| Asus ROG Strix G18 G814JI | |
| Gigabyte A7 X1 | |
| Medio Intel Core i7-13650HX (68241 - 97317, n=5) | |
| AIDA64 / CPU SHA3 | |
| Razer Blade 18 RTX 4070 | |
| Media de la clase Gaming (2180 - 9817, n=110, últimos 2 años) | |
| MSI Raider GE77 HX 12UHS | |
| Asus ROG Strix G18 G814JI | |
| Medio Intel Core i7-13650HX (3127 - 4487, n=5) | |
| Lenovo Legion 5 Pro 16ARH7H RTX 3070 Ti | |
| Gigabyte A7 X1 | |
| AIDA64 / CPU Queen | |
| Razer Blade 18 RTX 4070 | |
| Media de la clase Gaming (49785 - 173351, n=101, últimos 2 años) | |
| Asus ROG Strix G18 G814JI | |
| Medio Intel Core i7-13650HX (108627 - 110589, n=5) | |
| Lenovo Legion 5 Pro 16ARH7H RTX 3070 Ti | |
| MSI Raider GE77 HX 12UHS | |
| Gigabyte A7 X1 | |
| AIDA64 / FPU SinJulia | |
| Razer Blade 18 RTX 4070 | |
| Media de la clase Gaming (4424 - 33636, n=110, últimos 2 años) | |
| MSI Raider GE77 HX 12UHS | |
| Lenovo Legion 5 Pro 16ARH7H RTX 3070 Ti | |
| Gigabyte A7 X1 | |
| Asus ROG Strix G18 G814JI | |
| Medio Intel Core i7-13650HX (9134 - 10887, n=5) | |
| AIDA64 / FPU Mandel | |
| Media de la clase Gaming (25115 - 128721, n=110, últimos 2 años) | |
| Razer Blade 18 RTX 4070 | |
| Lenovo Legion 5 Pro 16ARH7H RTX 3070 Ti | |
| MSI Raider GE77 HX 12UHS | |
| Gigabyte A7 X1 | |
| Asus ROG Strix G18 G814JI | |
| Medio Intel Core i7-13650HX (33391 - 48323, n=5) | |
| AIDA64 / CPU AES | |
| MSI Raider GE77 HX 12UHS | |
| Lenovo Legion 5 Pro 16ARH7H RTX 3070 Ti | |
| Gigabyte A7 X1 | |
| Razer Blade 18 RTX 4070 | |
| Media de la clase Gaming (39258 - 247074, n=110, últimos 2 años) | |
| Asus ROG Strix G18 G814JI | |
| Medio Intel Core i7-13650HX (64436 - 85343, n=5) | |
| AIDA64 / CPU ZLib | |
| Razer Blade 18 RTX 4070 | |
| Media de la clase Gaming (574 - 2531, n=110, últimos 2 años) | |
| MSI Raider GE77 HX 12UHS | |
| Asus ROG Strix G18 G814JI | |
| Medio Intel Core i7-13650HX (1136 - 1285, n=5) | |
| Lenovo Legion 5 Pro 16ARH7H RTX 3070 Ti | |
| Gigabyte A7 X1 | |
| Alienware x17 RTX 3080 P48E | |
| AIDA64 / FP64 Ray-Trace | |
| Media de la clase Gaming (5509 - 45446, n=110, últimos 2 años) | |
| Razer Blade 18 RTX 4070 | |
| Asus ROG Strix G18 G814JI | |
| MSI Raider GE77 HX 12UHS | |
| Medio Intel Core i7-13650HX (7270 - 10900, n=5) | |
| Lenovo Legion 5 Pro 16ARH7H RTX 3070 Ti | |
| Gigabyte A7 X1 | |
| AIDA64 / CPU PhotoWorxx | |
| Razer Blade 18 RTX 4070 | |
| MSI Raider GE77 HX 12UHS | |
| Media de la clase Gaming (12271 - 89891, n=110, últimos 2 años) | |
| Asus ROG Strix G18 G814JI | |
| Medio Intel Core i7-13650HX (36170 - 43289, n=5) | |
| Lenovo Legion 5 Pro 16ARH7H RTX 3070 Ti | |
| Gigabyte A7 X1 | |
Rendimiento del sistema
Asus debería trabajar en el rendimiento del sistema. Similar al recientemente analizado TUF Gaming A16al abrir programas, el cambio de gráfica resulta en molestos congelamientos que a veces duran unos segundos. Como el rendimiento SSD tampoco puede seguirle el ritmo a la competencia, el PCMark 10 sólo pudo asegurar el último puesto. El Razer Blade 18 le saca casi un 20% de ventaja.
CrossMark: Overall | Productivity | Creativity | Responsiveness
| PCMark 10 / Score | |
| Media de la clase Gaming (5828 - 11574, n=96, últimos 2 años) | |
| Razer Blade 18 RTX 4070 | |
| Lenovo Legion 5 Pro 16ARH7H RTX 3070 Ti | |
| Alienware x17 RTX 3080 P48E | |
| MSI Raider GE77 HX 12UHS | |
| Gigabyte A7 X1 | |
| Asus ROG Strix G18 G814JI | |
| Medio Intel Core i7-13650HX, NVIDIA GeForce RTX 4070 Laptop GPU (n=1) | |
| PCMark 10 / Essentials | |
| Razer Blade 18 RTX 4070 | |
| Media de la clase Gaming (8810 - 12600, n=100, últimos 2 años) | |
| Lenovo Legion 5 Pro 16ARH7H RTX 3070 Ti | |
| Alienware x17 RTX 3080 P48E | |
| Gigabyte A7 X1 | |
| Asus ROG Strix G18 G814JI | |
| Medio Intel Core i7-13650HX, NVIDIA GeForce RTX 4070 Laptop GPU (n=1) | |
| MSI Raider GE77 HX 12UHS | |
| PCMark 10 / Productivity | |
| Media de la clase Gaming (6845 - 18766, n=98, últimos 2 años) | |
| Alienware x17 RTX 3080 P48E | |
| MSI Raider GE77 HX 12UHS | |
| Razer Blade 18 RTX 4070 | |
| Lenovo Legion 5 Pro 16ARH7H RTX 3070 Ti | |
| Gigabyte A7 X1 | |
| Asus ROG Strix G18 G814JI | |
| Medio Intel Core i7-13650HX, NVIDIA GeForce RTX 4070 Laptop GPU (n=1) | |
| PCMark 10 / Digital Content Creation | |
| Media de la clase Gaming (7602 - 19657, n=98, últimos 2 años) | |
| Lenovo Legion 5 Pro 16ARH7H RTX 3070 Ti | |
| Alienware x17 RTX 3080 P48E | |
| Razer Blade 18 RTX 4070 | |
| MSI Raider GE77 HX 12UHS | |
| Gigabyte A7 X1 | |
| Asus ROG Strix G18 G814JI | |
| Medio Intel Core i7-13650HX, NVIDIA GeForce RTX 4070 Laptop GPU (n=1) | |
| CrossMark / Overall | |
| MSI Raider GE77 HX 12UHS | |
| Razer Blade 18 RTX 4070 | |
| Media de la clase Gaming (1366 - 2409, n=98, últimos 2 años) | |
| Lenovo Legion 5 Pro 16ARH7H RTX 3070 Ti | |
| CrossMark / Productivity | |
| MSI Raider GE77 HX 12UHS | |
| Razer Blade 18 RTX 4070 | |
| Media de la clase Gaming (1386 - 2254, n=98, últimos 2 años) | |
| Lenovo Legion 5 Pro 16ARH7H RTX 3070 Ti | |
| CrossMark / Creativity | |
| Razer Blade 18 RTX 4070 | |
| MSI Raider GE77 HX 12UHS | |
| Media de la clase Gaming (1343 - 2729, n=98, últimos 2 años) | |
| Lenovo Legion 5 Pro 16ARH7H RTX 3070 Ti | |
| CrossMark / Responsiveness | |
| MSI Raider GE77 HX 12UHS | |
| Razer Blade 18 RTX 4070 | |
| Media de la clase Gaming (1226 - 2334, n=98, últimos 2 años) | |
| Lenovo Legion 5 Pro 16ARH7H RTX 3070 Ti | |
| PCMark 10 Score | 6404 puntos | |
ayuda | ||
| AIDA64 / Memory Copy | |
| Razer Blade 18 RTX 4070 | |
| Media de la clase Gaming (21750 - 129946, n=110, últimos 2 años) | |
| MSI Raider GE77 HX 12UHS | |
| Asus ROG Strix G18 G814JI | |
| Medio Intel Core i7-13650HX (59266 - 66372, n=5) | |
| Lenovo Legion 5 Pro 16ARH7H RTX 3070 Ti | |
| Gigabyte A7 X1 | |
| AIDA64 / Memory Read | |
| Razer Blade 18 RTX 4070 | |
| Media de la clase Gaming (22956 - 118858, n=110, últimos 2 años) | |
| MSI Raider GE77 HX 12UHS | |
| Medio Intel Core i7-13650HX (67305 - 71022, n=5) | |
| Asus ROG Strix G18 G814JI | |
| Lenovo Legion 5 Pro 16ARH7H RTX 3070 Ti | |
| Gigabyte A7 X1 | |
| AIDA64 / Memory Write | |
| Media de la clase Gaming (22297 - 135096, n=110, últimos 2 años) | |
| Razer Blade 18 RTX 4070 | |
| MSI Raider GE77 HX 12UHS | |
| Medio Intel Core i7-13650HX (58028 - 68225, n=5) | |
| Asus ROG Strix G18 G814JI | |
| Lenovo Legion 5 Pro 16ARH7H RTX 3070 Ti | |
| Gigabyte A7 X1 | |
| AIDA64 / Memory Latency | |
| Media de la clase Gaming (75.3 - 259, n=110, últimos 2 años) | |
| Medio Intel Core i7-13650HX (83.7 - 90.8, n=5) | |
| Lenovo Legion 5 Pro 16ARH7H RTX 3070 Ti | |
| Razer Blade 18 RTX 4070 | |
| MSI Raider GE77 HX 12UHS | |
| Asus ROG Strix G18 G814JI | |
| Gigabyte A7 X1 | |
| Alienware x17 RTX 3080 P48E | |
* ... más pequeño es mejor
Latencias del CPD
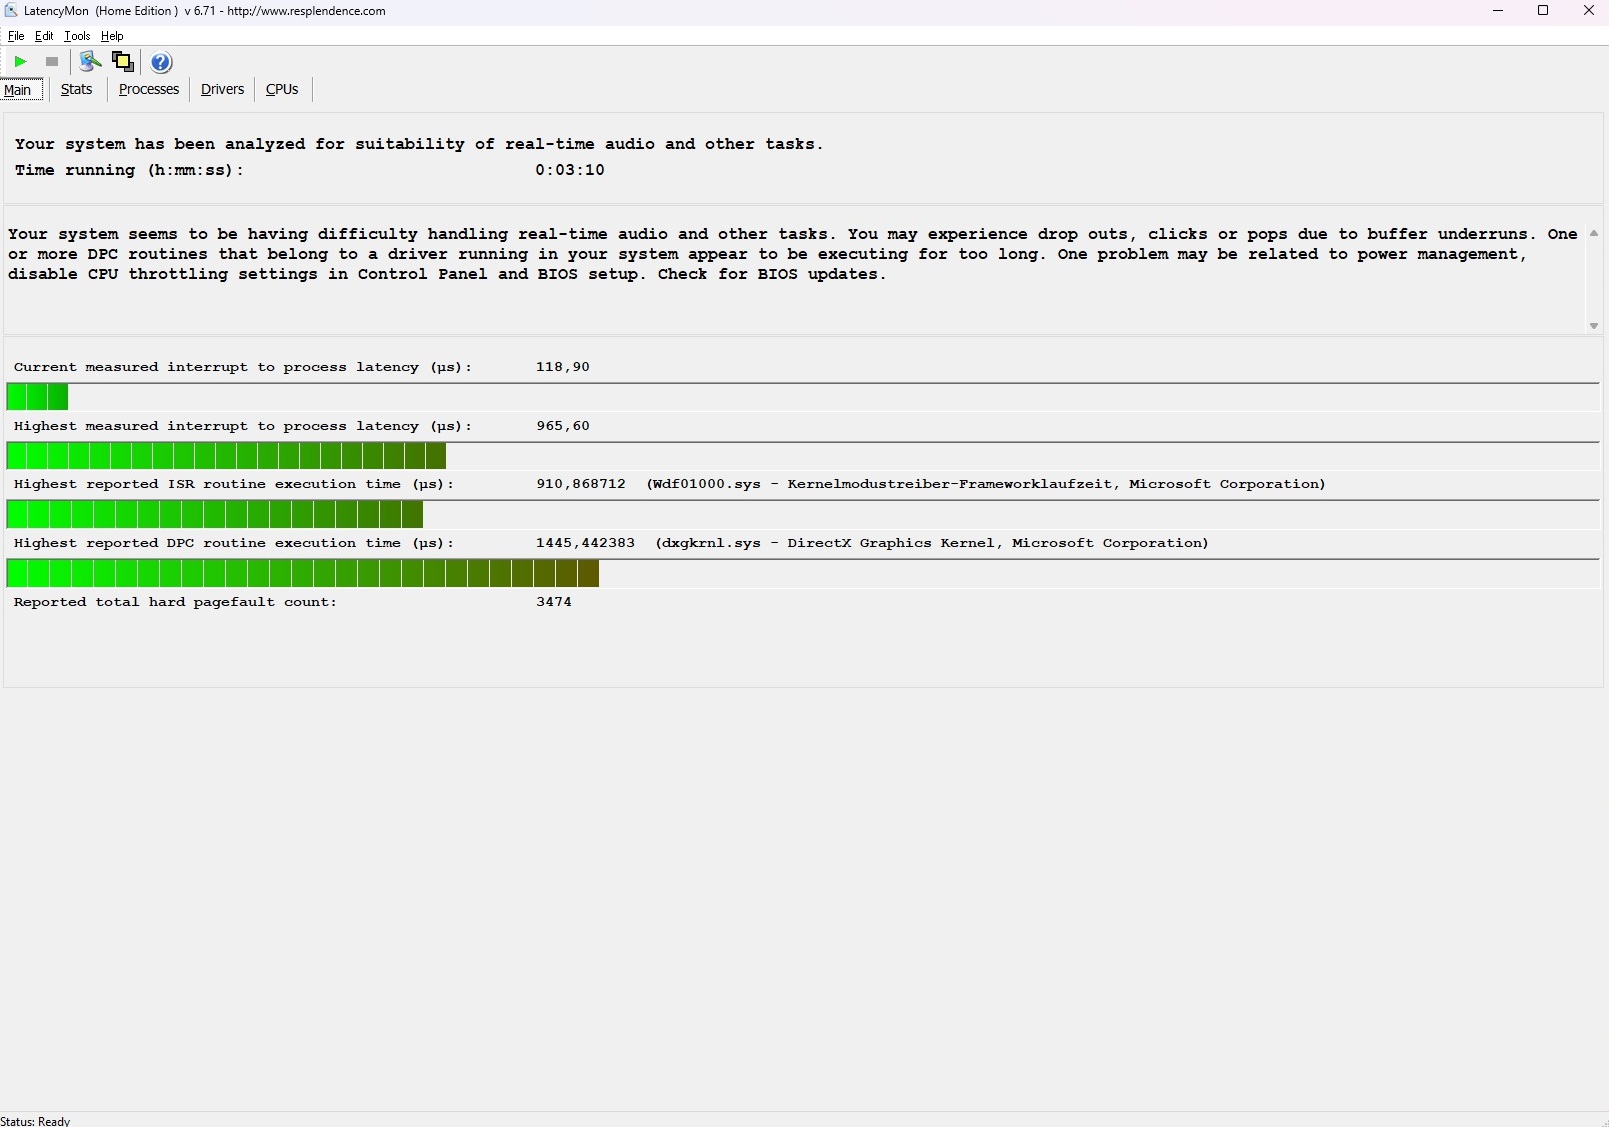
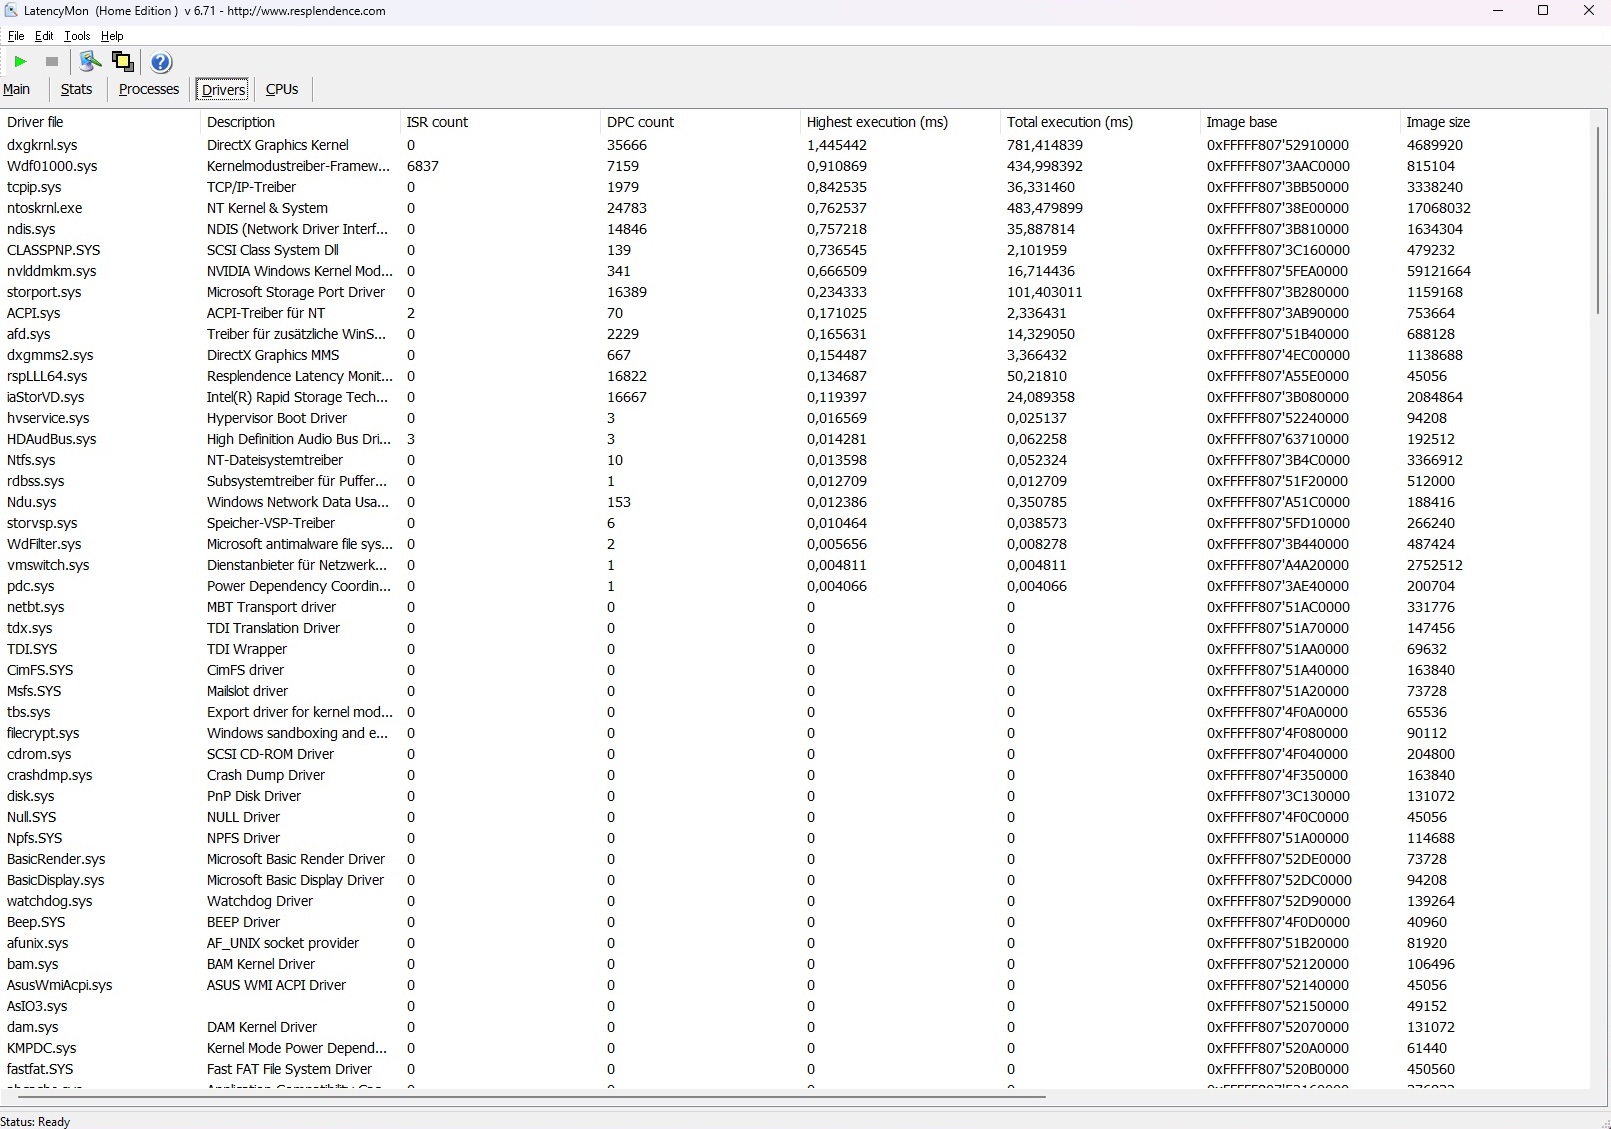
En cuanto a las latencias, el G18 ocupa cómodamente un lugar intermedio en la tabla. A pesar del sólido resultado, la herramienta LatencyMon indica posibles problemas durante el procesado en tiempo real de, por ejemplo, contenido de audio. Esto es algo que afecta a muchos portátiles pero sólo es relevante para grupos de usuarios específicos.
| DPC Latencies / LatencyMon - interrupt to process latency (max), Web, Youtube, Prime95 | |
| Alienware x17 RTX 3080 P48E | |
| MSI Raider GE77 HX 12UHS | |
| Razer Blade 18 RTX 4070 | |
| Asus ROG Strix G18 G814JI | |
| Gigabyte A7 X1 | |
| Lenovo Legion 5 Pro 16ARH7H RTX 3070 Ti | |
* ... más pequeño es mejor
Almacenamiento masivo
La configuración de pruebas se basa en un SSD Micron de 1 TB. Aunque el rendimiento ofrecido (unos 3800 MB/s de lectura y 2300 MB/s de escritura en la prueba AS SSD) no es bajo en absoluto, los SSDs de la competencia tienen ventaja. Sólo el Gigabyte A7 X1 es capaz de desmarcarse del G18 en esta disciplina.

* ... más pequeño es mejor
Continuous Performance Read: DiskSpd Read Loop, Queue Depth 8
Tarjeta gráfica
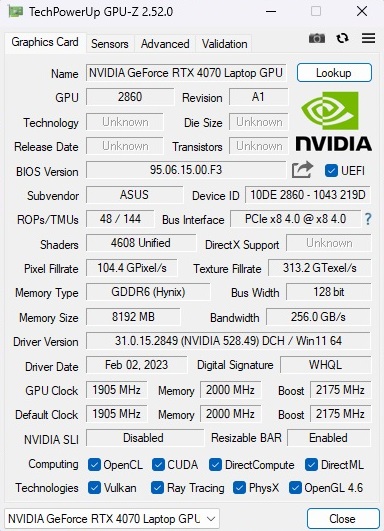
Después de que la GeForce RTX 4070 Ti tuviera que soportar muchas críticas en el segmento de sobremesa (demasiado cara y con unas especificaciones cuestionables para el rendimiento que ofrece), la GeForce RTX 4070 para portátiles era muy esperada.
Para ir al grano: Una vez más, Nvidia no ha tomado la mejor de las decisiones. El nombre RTX 4070 suena a gama alta propiamente dicha, pero como los sistemas de ese tipo son caros, las especificaciones tienden a ser sólo suficientes para un dispositivo típico de gama media. Asimismo, en el año 2023, 8 GB de VRAM son tan escasos como una interfaz de memoria de 128 bits. Además, 4608 unidades de sombreado son más parecidas a una RTX 4060 (3072) que a laRTX 4080 (7424), lo que supone una diferencia considerable con respecto a modelos más potentes. En cuanto a las puntuaciones de GPU en 3DMark, la RTX 4070 es apenas más rápida que una RTX 3070 y a veces incluso más lenta que una RTX 3070 Ti. Con todo, está a un nivel comparable a la RTX 3080 (también se aplica a la Blade 18).
| 3DMark 06 Standard Score | 54916 puntos | |
| 3DMark 11 Performance | 34117 puntos | |
| 3DMark Cloud Gate Standard Score | 65577 puntos | |
| 3DMark Fire Strike Score | 25633 puntos | |
| 3DMark Time Spy Score | 12364 puntos | |
ayuda | ||
* ... más pequeño es mejor
Rendimiento en juegos
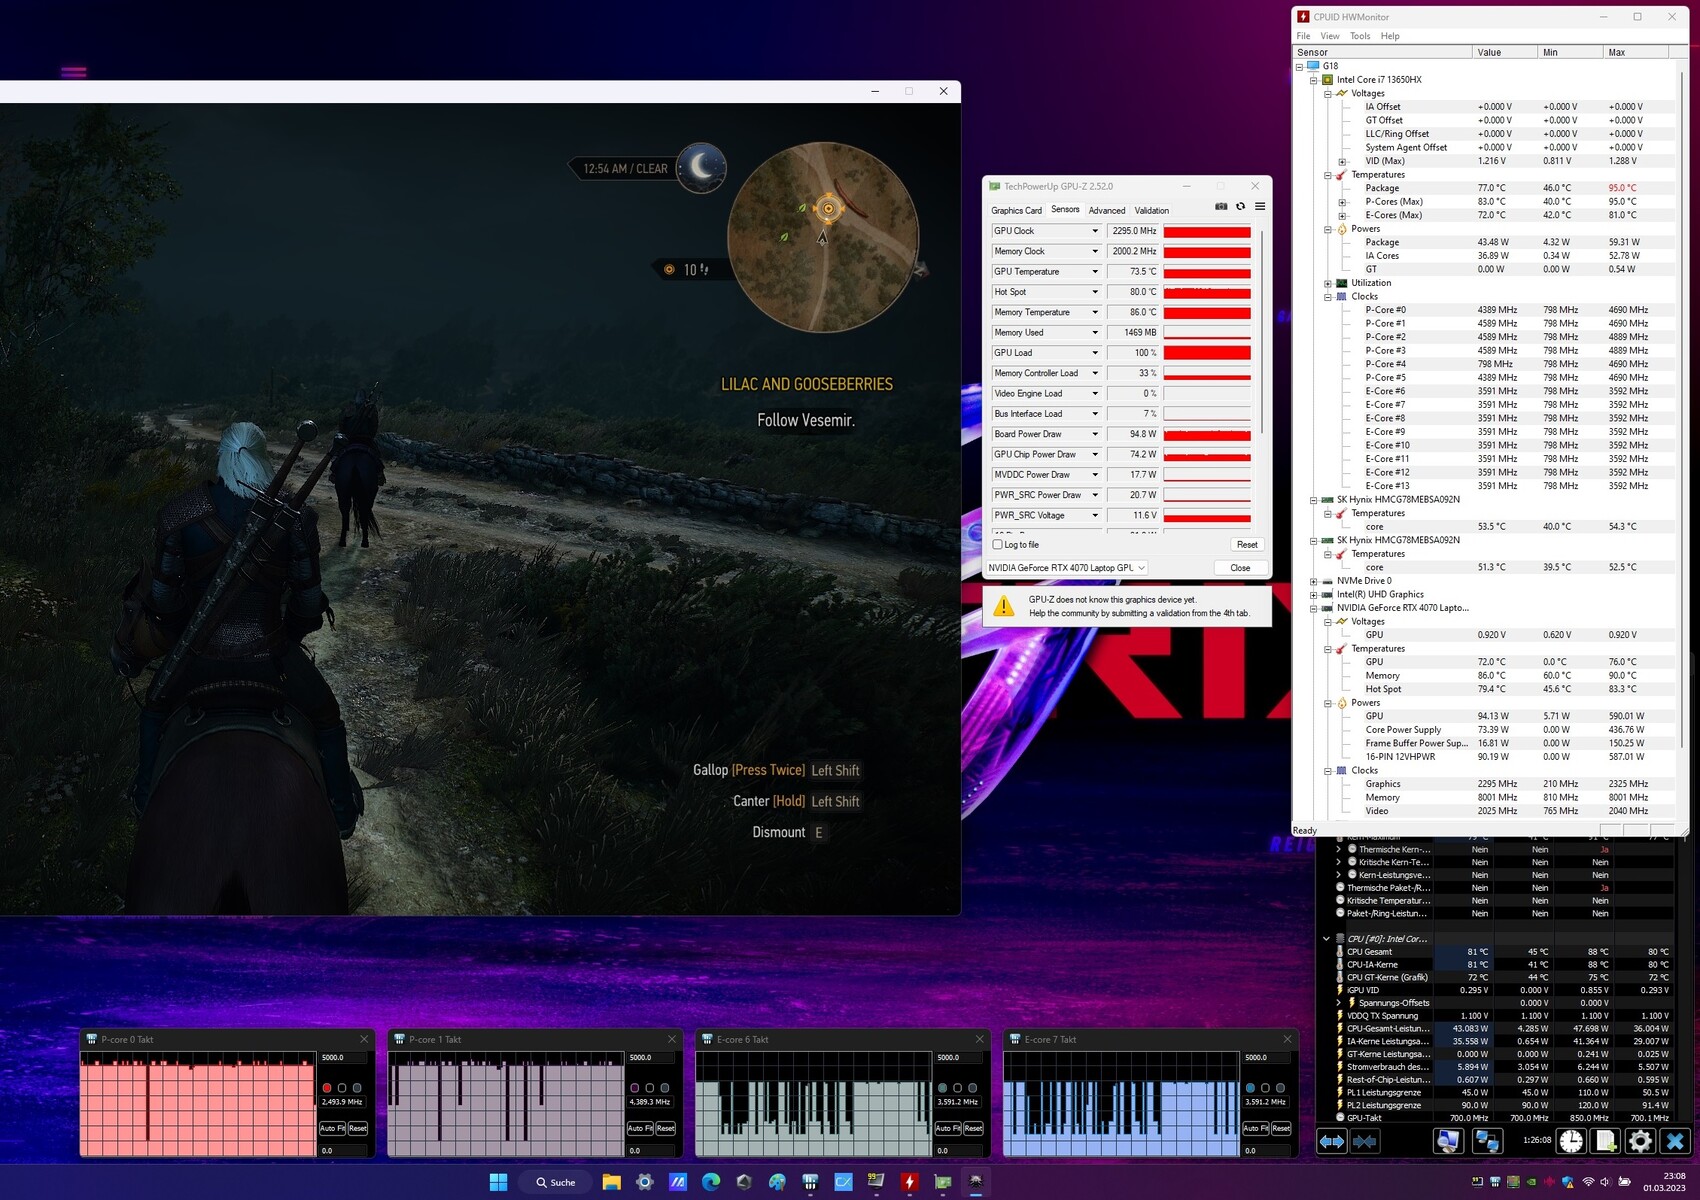
La situación parece mejor en los juegos cotidianos. Nuestra clasificación de rendimiento (FHD/Ultra con muchos juegos estándar) muestra una diferencia de casi el 30 % respecto a la RTX 3070 y una ventaja de casi el 10 % sobre la RTX 3070 Ti. En juegos, la RTX 4070 se sitúa a medio camino entre una RTX 3080 y una RTX 3080 Ti. Puedes ver cómo rinde el dispositivo a resoluciones más altas (QHD/UHD) y con el trazado de rayos activado en la segunda tabla, donde se enumeran tres ejemplos de títulos más recientes. Para una comparación más detallada, echa un vistazo a nuestra lista de juegos.
| The Witcher 3 - 1920x1080 Ultra Graphics & Postprocessing (HBAO+) | |
| Media de la clase Gaming (95 - 240, n=8, últimos 2 años) | |
| MSI Raider GE77 HX 12UHS | |
| Asus ROG Strix G18 G814JI | |
| Lenovo Legion 5 Pro 16ARH7H RTX 3070 Ti | |
| Razer Blade 18 RTX 4070 | |
| Alienware x17 RTX 3080 P48E | |
| Gigabyte A7 X1 | |
| Final Fantasy XV Benchmark - 1920x1080 High Quality | |
| Media de la clase Gaming (41 - 215, n=104, últimos 2 años) | |
| MSI Raider GE77 HX 12UHS | |
| Lenovo Legion 5 Pro 16ARH7H RTX 3070 Ti | |
| Asus ROG Strix G18 G814JI | |
| Razer Blade 18 RTX 4070 | |
| Alienware x17 RTX 3080 P48E | |
| Strange Brigade - 1920x1080 ultra AA:ultra AF:16 | |
| Media de la clase Gaming (76.3 - 456, n=94, últimos 2 años) | |
| Lenovo Legion 5 Pro 16ARH7H RTX 3070 Ti | |
| MSI Raider GE77 HX 12UHS | |
| Asus ROG Strix G18 G814JI | |
| Razer Blade 18 RTX 4070 | |
| Alienware x17 RTX 3080 P48E | |
| Gigabyte A7 X1 | |
| Dota 2 Reborn - 1920x1080 ultra (3/3) best looking | |
| Razer Blade 18 RTX 4070 | |
| MSI Raider GE77 HX 12UHS | |
| Asus ROG Strix G18 G814JI | |
| Media de la clase Gaming (84.8 - 248, n=113, últimos 2 años) | |
| Alienware x17 RTX 3080 P48E | |
| Lenovo Legion 5 Pro 16ARH7H RTX 3070 Ti | |
| Gigabyte A7 X1 | |
| Resident Evil Village | |
| 1920x1080 Ray Tracing Preset | |
| MSI GE76 Raider | |
| Asus ROG Strix G18 G814JI | |
| Lenovo Legion 7 16ACHg6 | |
| Medion Erazer Beast X20 | |
| 2560x1440 Max Preset | |
| MSI GE76 Raider | |
| Asus ROG Strix G18 G814JI | |
| Lenovo Legion 7 16ACHg6 | |
| Medion Erazer Beast X20 | |
| 3840x2160 Max Preset | |
| MSI GE76 Raider | |
| Asus ROG Strix G18 G814JI | |
| Guardians of the Galaxy | |
| 1920x1080 Ultra Preset + Ultra Ray-Tracing | |
| MSI GE76 Raider | |
| XMG Neo 15 @165 W TGP | |
| Asus ROG Strix G18 G814JI | |
| XMG Neo 17 @140 W TGP | |
| 2560x1440 Ultra Preset | |
| MSI GE76 Raider | |
| XMG Neo 15 @165 W TGP | |
| Asus ROG Strix G18 G814JI | |
| XMG Neo 17 @140 W TGP | |
| 3840x2160 Ultra Preset | |
| MSI GE76 Raider | |
| XMG Neo 15 @165 W TGP | |
| Asus ROG Strix G18 G814JI | |
| XMG Neo 17 @140 W TGP | |
| Ghostwire Tokyo | |
| 1920x1080 Highest Settings + Maximum Ray Tracing | |
| Asus ROG Strix G18 G814JI | |
| Medion Erazer Beast X30 | |
| XMG Neo 15 @165 W TGP | |
| XMG Neo 17 @140 W TGP | |
| 2560x1440 Highest Settings | |
| Asus ROG Strix G18 G814JI | |
| Medion Erazer Beast X30 | |
| XMG Neo 15 @165 W TGP | |
| XMG Neo 17 @140 W TGP | |
| 3840x2160 Highest Settings | |
| Asus ROG Strix G18 G814JI | |
| XMG Neo 15 @165 W TGP | |
| XMG Neo 17 @140 W TGP | |
Básicamente, la GeForce RTX 4070 es una tarjeta gráfica muy buena para portátiles QHD. Ajustada a 2560 x 1440 píxeles (la G18 también gestiona los 2560 x 1600 píxeles nativos de forma excelente), la GPU Ada Lovelace suele alcanzar más de 60fps, incluso con los ajustes al máximo. Sólo juegos poco optimizados como A Plague Tale Requiemcaen por debajo de este nivel. En cambio, a 4K, la RTX 4070 (sin DLSS) sólo ofrece una aptitud limitada. En títulos más exigentes, más de 60 fps son la excepción más que la regla.
Para ver si el rendimiento gráfico podía mantenerse estable incluso durante periodos más largos, probamos The Witcher 3 durante 60 minutos. El resultado: Como se vio en el bucle Cinebench para la CPU, el rendimiento fue relativamente estable.
Witcher 3 FPS Diagram
| bajo | medio | alto | ultra | QHD | 4K | |
|---|---|---|---|---|---|---|
| GTA V (2015) | 182.5 | 178.3 | 117.2 | |||
| The Witcher 3 (2015) | 379 | 237 | 119 | |||
| Dota 2 Reborn (2015) | 173.2 | 164.4 | 154.7 | |||
| Final Fantasy XV Benchmark (2018) | 162.3 | 115.5 | ||||
| X-Plane 11.11 (2018) | 145.8 | 112.6 | ||||
| Far Cry 5 (2018) | 163 | 154 | 144 | |||
| Strange Brigade (2018) | 309 | 245 | 209 | |||
| Outriders (2021) | 165.3 | 145.2 | 129.4 | 90 | 46.3 | |
| Resident Evil Village (2021) | 220 | 212 | 189.7 | 128.6 | 62.7 | |
| Days Gone (2021) | 173.2 | 154.7 | 119.2 | 83.8 | 45 | |
| Deathloop (2021) | 139.9 | 129.8 | 106.3 | 65.4 | 37.4 | |
| Back 4 Blood (2021) | 252 | 221 | 209 | 129.4 | 73.7 | |
| Guardians of the Galaxy (2021) | 148 | 147 | 144 | 108 | 60 | |
| Riders Republic (2021) | 160 | 135 | 121 | 87 | 49 | |
| Farming Simulator 22 (2021) | 203 | 148.2 | 138.9 | 137 | 94.1 | |
| Halo Infinite (2021) | 172.7 | 149.1 | 140.6 | 102.5 | 57.5 | |
| Elden Ring (2022) | 59.6 | 59.5 | 59.5 | 59.5 | 45 | |
| Elex 2 (2022) | 118.7 | 118.2 | 112.9 | 78.9 | 40 | |
| Ghostwire Tokyo (2022) | 172.7 | 171.7 | 165.9 | 108.7 | 52.3 | |
| Vampire Bloodhunt (2022) | 212 | 199.9 | 195.7 | 148.6 | 78.5 | |
| The Quarry (2022) | 146 | 122.1 | 98 | 68.2 | 28.7 | |
| A Plague Tale Requiem (2022) | 74.6 | 65.6 | 57.5 | 40.9 | 23 | |
| Need for Speed Unbound (2022) | 131.1 | 110.1 | 97.2 | 67.7 | 36.2 | |
| High On Life (2023) | 178 | 131.6 | 108.5 | 64.5 | 25.7 | |
| Hogwarts Legacy (2023) | 142.7 | 121.2 | 101.2 | 71 | 27.7 | |
| Returnal (2023) | 115 | 104 | 88 | 66 | 39 | |
| Company of Heroes 3 (2023) | 186 | 155 | 150 | 107 | 63 |
Emisiones
Emisiones sonoras
La emisión de ruido depende mucho del modo seleccionado en Armoury Crate. En Witcher 3, nuestro dispositivo de medición registró entre 8 y 40 dB(A) en modo "Quiet" y entre 42 y 44 dB(A) en modo "Performance" - niveles aceptables para un portátil de juego. Las cosas se ponen ruidosas en modo "Turbo", con los ventiladores emitiendo 51 dB(A) mientras se juega. En reposo, los ventiladores están completamente apagados o funcionan a un nivel bastante decente de casi 30 dB(A).
Molesto: El Strix G18 tiene que lidiar con el zumbido de la bobina en casi todos los rangos de carga. Muchos otros portátiles también muestran este problema pero no a este nivel de intensidad o frecuencia.
Ruido
| Ocioso |
| 26 / 28 / 29 dB(A) |
| Carga |
| 41 / 46 dB(A) |
 | ||
30 dB silencioso 40 dB(A) audible 50 dB(A) ruidosamente alto |
||
min: | ||
| Asus ROG Strix G18 G814JI i7-13650HX, GeForce RTX 4070 Laptop GPU | Razer Blade 18 RTX 4070 i9-13950HX, GeForce RTX 4070 Laptop GPU | Gigabyte A7 X1 R9 5900HX, GeForce RTX 3070 Laptop GPU | Lenovo Legion 5 Pro 16ARH7H RTX 3070 Ti R7 6800H, GeForce RTX 3070 Ti Laptop GPU | Alienware x17 RTX 3080 P48E i7-11800H, GeForce RTX 3080 Laptop GPU | MSI Raider GE77 HX 12UHS i9-12900HX, GeForce RTX 3080 Ti Laptop GPU | |
|---|---|---|---|---|---|---|
| Noise | 3% | -17% | -6% | 1% | -22% | |
| apagado / medio ambiente * (dB) | 25 | 23.5 6% | 24 4% | 23.5 6% | 24.9 -0% | 26 -4% |
| Idle Minimum * (dB) | 26 | 23.8 8% | 25 4% | 23.7 9% | 24.9 4% | 26 -0% |
| Idle Average * (dB) | 28 | 23.8 15% | 29 -4% | 31.1 -11% | 24.9 11% | 34 -21% |
| Idle Maximum * (dB) | 29 | 26.8 8% | 35 -21% | 32.2 -11% | 29.6 -2% | 46 -59% |
| Load Average * (dB) | 41 | 37.3 9% | 58 -41% | 38.4 6% | 31.1 24% | 50 -22% |
| Witcher 3 ultra * (dB) | 44 | 48 -9% | 57 -30% | 54.8 -25% | 49.7 -13% | 55 -25% |
| Load Maximum * (dB) | 46 | 53.5 -16% | 59 -28% | 54.8 -19% | 54.8 -19% | 57 -24% |
* ... más pequeño es mejor
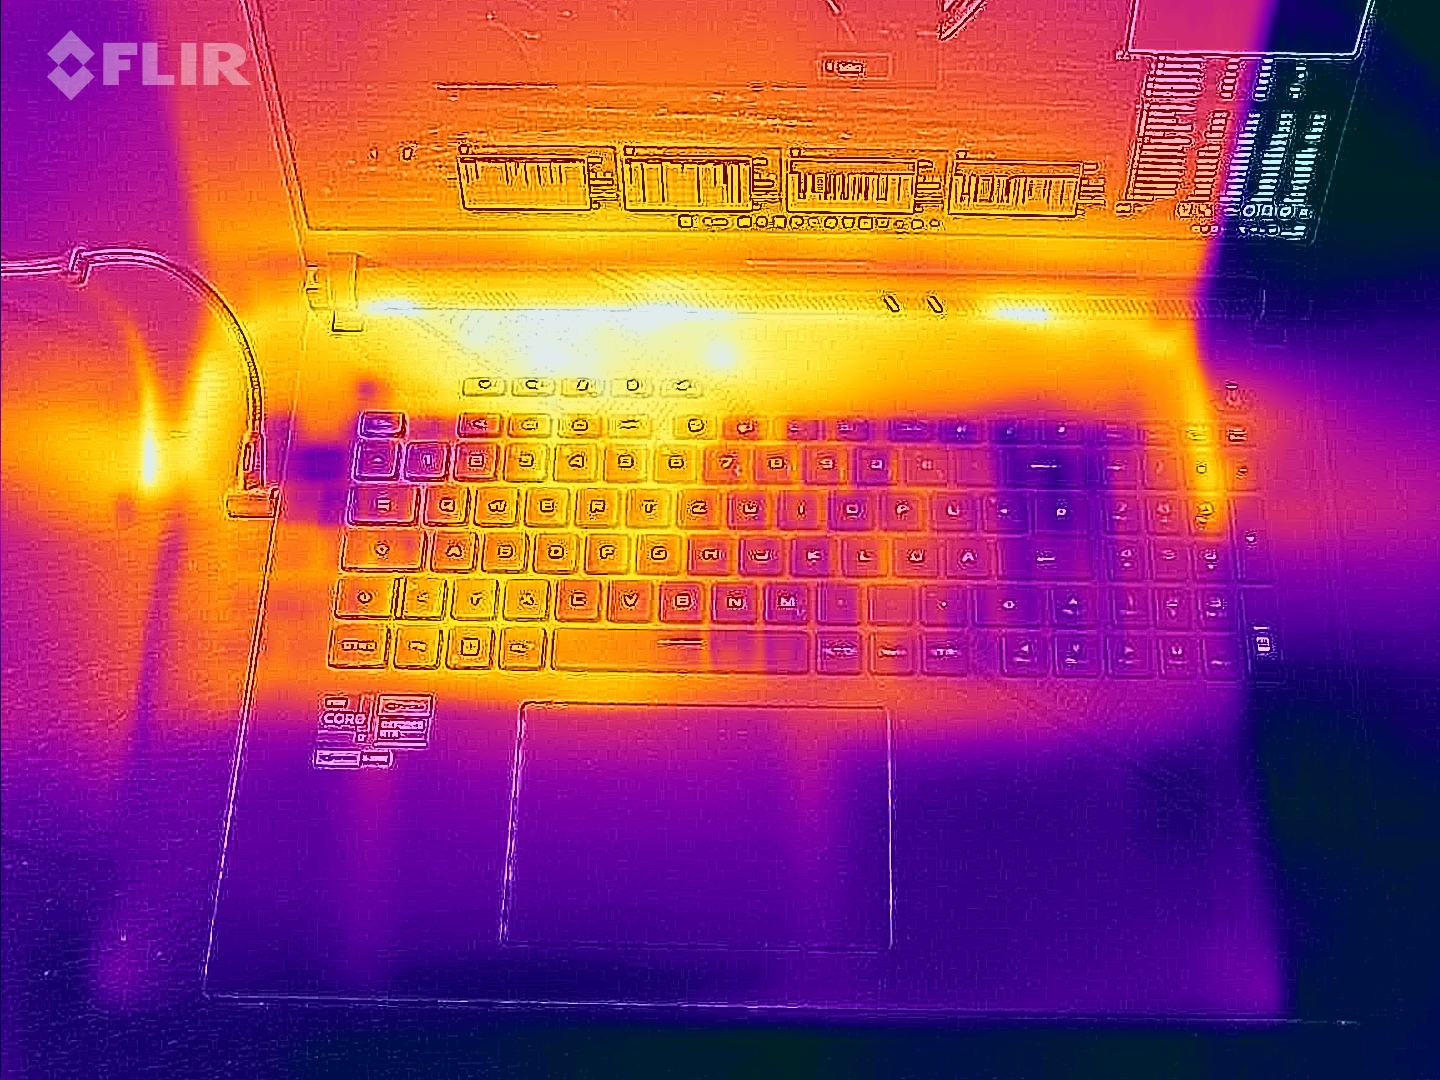
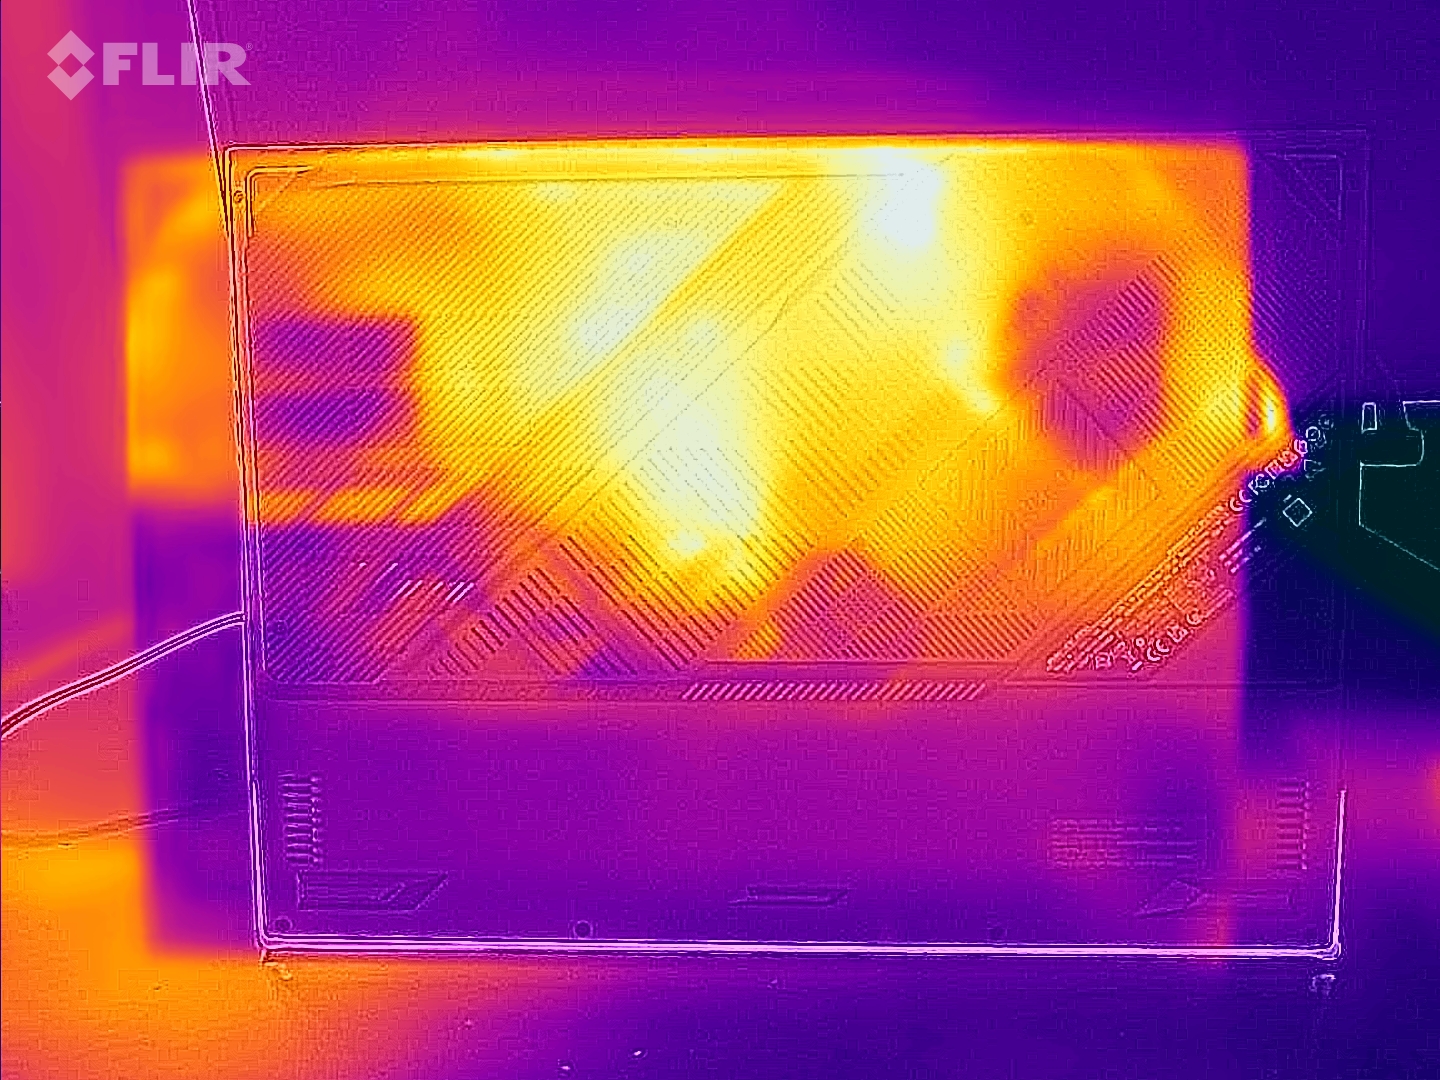
Temperatura
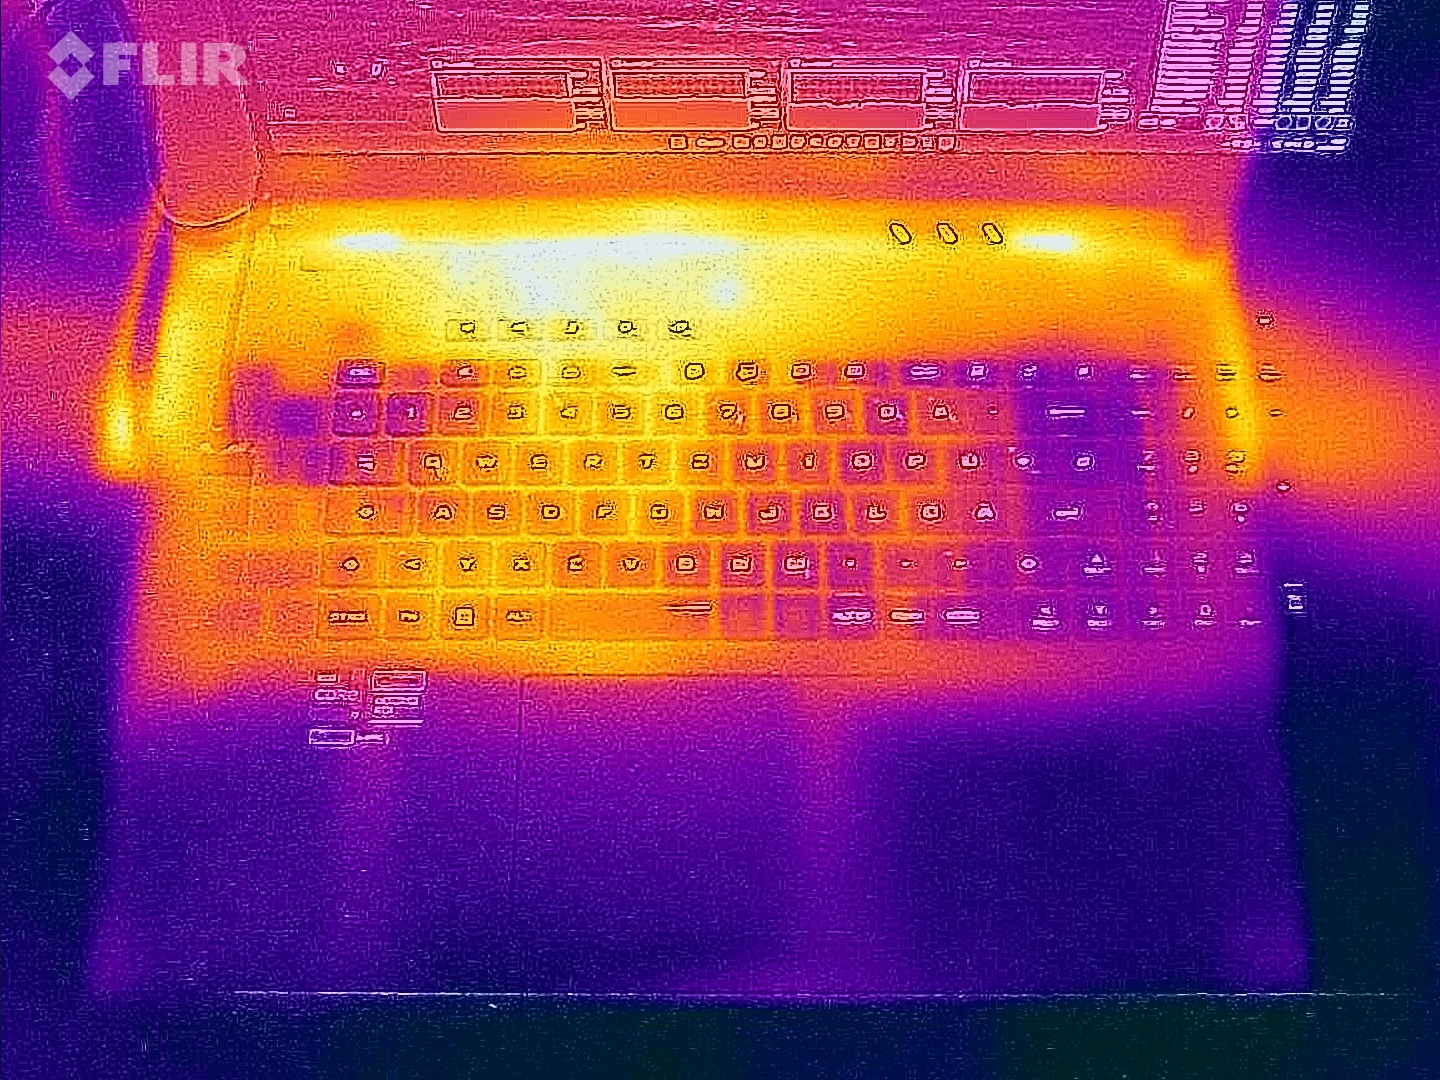
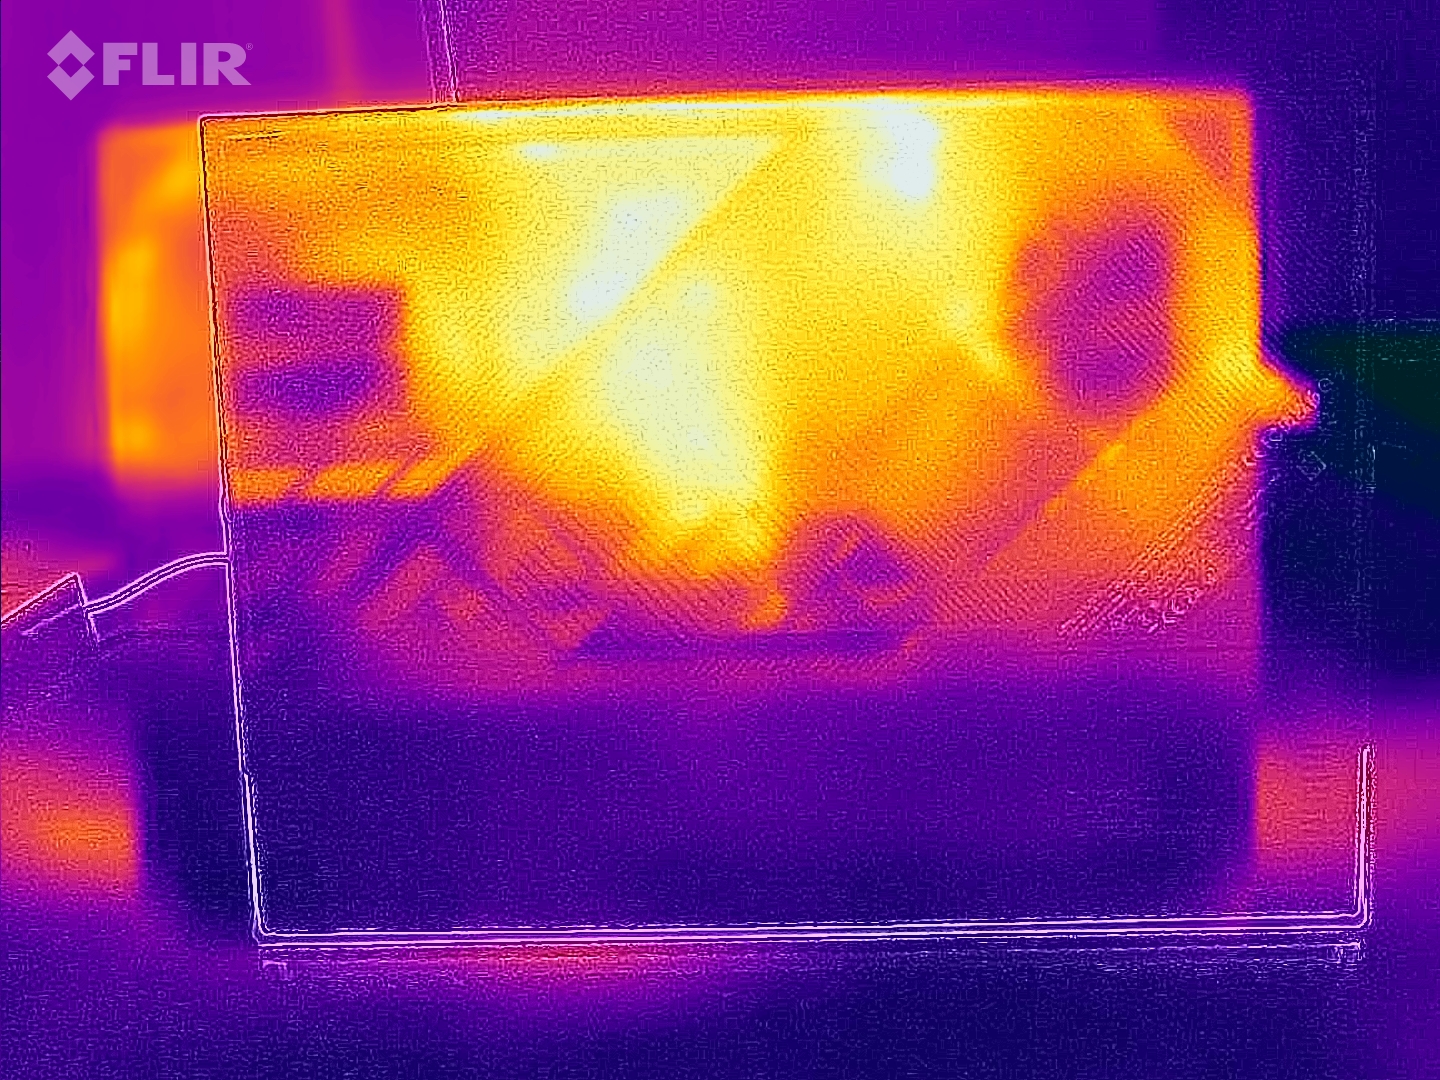
En cuanto a la temperatura, no hay valores atípicos. Aunque el G18 es ligeramente más frío que el Blade 18 en reposo, se calienta algo más bajo carga. Temperaturas máximas de 45 °C en la parte superior de la unidad y hasta 47 °C en la base, son aceptables.
(±) La temperatura máxima en la parte superior es de 45 °C / 113 F, frente a la media de 40.4 °C / 105 F, que oscila entre 21.2 y 68.8 °C para la clase Gaming.
(-) El fondo se calienta hasta un máximo de 47 °C / 117 F, frente a la media de 43.2 °C / 110 F
(+) En reposo, la temperatura media de la parte superior es de 27 °C / 81# F, frente a la media del dispositivo de 33.9 °C / 93 F.
(±) Jugando a The Witcher 3, la temperatura media de la parte superior es de 36.8 °C / 98 F, frente a la media del dispositivo de 33.9 °C / 93 F.
(+) Los reposamanos y el panel táctil alcanzan como máximo la temperatura de la piel (32 °C / 89.6 F) y, por tanto, no están calientes.
(-) La temperatura media de la zona del reposamanos de dispositivos similares fue de 28.8 °C / 83.8 F (-3.2 °C / -5.8 F).
| Asus ROG Strix G18 G814JI i7-13650HX, GeForce RTX 4070 Laptop GPU | Razer Blade 18 RTX 4070 i9-13950HX, GeForce RTX 4070 Laptop GPU | Gigabyte A7 X1 R9 5900HX, GeForce RTX 3070 Laptop GPU | Lenovo Legion 5 Pro 16ARH7H RTX 3070 Ti R7 6800H, GeForce RTX 3070 Ti Laptop GPU | Alienware x17 RTX 3080 P48E i7-11800H, GeForce RTX 3080 Laptop GPU | MSI Raider GE77 HX 12UHS i9-12900HX, GeForce RTX 3080 Ti Laptop GPU | |
|---|---|---|---|---|---|---|
| Heat | 4% | 1% | -5% | -17% | -29% | |
| Maximum Upper Side * (°C) | 45 | 39.2 13% | 44 2% | 43.8 3% | 58.4 -30% | 53 -18% |
| Maximum Bottom * (°C) | 47 | 35.6 24% | 49 -4% | 53 -13% | 49 -4% | 58 -23% |
| Idle Upper Side * (°C) | 28 | 31.8 -14% | 27 4% | 30 -7% | 33.6 -20% | 38 -36% |
| Idle Bottom * (°C) | 31 | 33.2 -7% | 30 3% | 31.8 -3% | 34.6 -12% | 43 -39% |
* ... más pequeño es mejor
Prueba de esfuerzo
Ninguno de los componentes se ve sobrecargado cuando se selecciona el modo "Rendimiento". En la prueba de estrés, usando las herramientas Furmark y Prime95 así como The Witcher 3, el Core i7-13650HX alcanzó una media de 77 °C - un valor moderado. La RTX 4070 alcanzó unos 74 °C.
Altavoces
La calidad del sonido es bastante impresionante. El sistema 2.0 no mostró ninguna debilidad evidente independientemente del rango de frecuencias, aunque el Razer Blade 18 sonó ligeramente mejor en nuestro análisis de audio. A cambio, el G18 ofrece un volumen máximo ligeramente superior de hasta 88 dB(A). De este modo, las habitaciones más grandes pueden llenarse de sonido sin necesidad de altavoces externos.
Asus ROG Strix G18 G814JI análisis de audio
(+) | los altavoces pueden reproducir a un volumen relativamente alto (#88 dB)
Graves 100 - 315 Hz
(±) | lubina reducida - en promedio 10.2% inferior a la mediana
(+) | el bajo es lineal (5.6% delta a la frecuencia anterior)
Medios 400 - 2000 Hz
(+) | medios equilibrados - a sólo 3.8% de la mediana
(+) | los medios son lineales (4% delta a la frecuencia anterior)
Altos 2 - 16 kHz
(+) | máximos equilibrados - a sólo 2.8% de la mediana
(±) | la linealidad de los máximos es media (7% delta a frecuencia anterior)
Total 100 - 16.000 Hz
(+) | el sonido global es lineal (11.5% de diferencia con la mediana)
En comparación con la misma clase
» 10% de todos los dispositivos probados de esta clase eran mejores, 3% similares, 87% peores
» El mejor tuvo un delta de 6%, la media fue 18%, el peor fue ###max##%
En comparación con todos los dispositivos probados
» 8% de todos los dispositivos probados eran mejores, 2% similares, 90% peores
» El mejor tuvo un delta de 4%, la media fue 24%, el peor fue ###max##%
Razer Blade 18 RTX 4070 análisis de audio
(+) | los altavoces pueden reproducir a un volumen relativamente alto (#85.7 dB)
Graves 100 - 315 Hz
(±) | lubina reducida - en promedio 7.5% inferior a la mediana
(±) | la linealidad de los graves es media (9.2% delta a frecuencia anterior)
Medios 400 - 2000 Hz
(+) | medios equilibrados - a sólo 3.5% de la mediana
(+) | los medios son lineales (4.1% delta a la frecuencia anterior)
Altos 2 - 16 kHz
(+) | máximos equilibrados - a sólo 4.8% de la mediana
(+) | los máximos son lineales (3.8% delta a la frecuencia anterior)
Total 100 - 16.000 Hz
(+) | el sonido global es lineal (9.2% de diferencia con la mediana)
En comparación con la misma clase
» 3% de todos los dispositivos probados de esta clase eran mejores, 1% similares, 95% peores
» El mejor tuvo un delta de 6%, la media fue 18%, el peor fue ###max##%
En comparación con todos los dispositivos probados
» 3% de todos los dispositivos probados eran mejores, 1% similares, 96% peores
» El mejor tuvo un delta de 4%, la media fue 24%, el peor fue ###max##%
Gestión de la energía
Consumo de energía
En funcionamiento en reposo con el interruptor gráfico activo, el portátil de 18 pulgadas consume muy poca energía. Niveles de 8 a 26 vatios son completamente aceptables para un portátil de juegos. Bajo carga, esta cifra de consumo sube de 102 (puntuación media en 3DMark 06) a 267 vatios (valor máximo de la prueba de estrés). La fuente de alimentación de 280 vatios suministrada también tiene un buen tamaño. Al jugar, puedes contar con unos 180 vatios, algo menos que el Blade 18, a pesar de un rendimiento 3D comparable (con un Core i9-13950HX, el Razer tiene una CPU más potente y hambrienta).
| Off / Standby | |
| Ocioso | |
| Carga |
|
Clave:
min: | |
| Asus ROG Strix G18 G814JI i7-13650HX, GeForce RTX 4070 Laptop GPU | Razer Blade 18 RTX 4070 i9-13950HX, GeForce RTX 4070 Laptop GPU | Gigabyte A7 X1 R9 5900HX, GeForce RTX 3070 Laptop GPU | Lenovo Legion 5 Pro 16ARH7H RTX 3070 Ti R7 6800H, GeForce RTX 3070 Ti Laptop GPU | Alienware x17 RTX 3080 P48E i7-11800H, GeForce RTX 3080 Laptop GPU | MSI Raider GE77 HX 12UHS i9-12900HX, GeForce RTX 3080 Ti Laptop GPU | Media de la clase Gaming | |
|---|---|---|---|---|---|---|---|
| Power Consumption | -77% | -6% | -17% | -35% | -35% | -18% | |
| Idle Minimum * (Watt) | 8 | 24.5 -206% | 12 -50% | 9.7 -21% | 10.2 -27% | 13 -63% | 13.3 ? -66% |
| Idle Average * (Watt) | 15 | 34.1 -127% | 14 7% | 14.8 1% | 21.2 -41% | 19 -27% | 19 ? -27% |
| Idle Maximum * (Watt) | 26 | 47.7 -83% | 19 27% | 45.8 -76% | 48.4 -86% | 29 -12% | 24.5 ? 6% |
| Load Average * (Watt) | 102 | 140 -37% | 118 -16% | 87.2 15% | 118.7 -16% | 143 -40% | 108.1 ? -6% |
| Witcher 3 ultra * (Watt) | 178.6 | 202 -13% | 205 -15% | 209 -17% | 249 -39% | 247 -38% | |
| Load Maximum * (Watt) | 267 | 261 2% | 229 14% | 275.3 -3% | 262 2% | 352 -32% | 254 ? 5% |
* ... más pequeño es mejor
Power consumption Witcher 3 / stress test
Power consumption with an external monitor
Duración de la batería
Mientras no pidas al G18 que ejecute aplicaciones 3D, la duración de la batería es sorprendentemente buena para un portátil de juegos. Con casi 12 horas de uso en reposo con el brillo al mínimo y unas 8 horas de navegación por Internet con un brillo de pantalla reducido de 150 cd/m², el G18 deja atrás a la competencia a pesar de que en su mayoría ofrecen baterías de entre 80 y 100 Wh (el G18 posee 90 Wh).
| Asus ROG Strix G18 G814JI i7-13650HX, GeForce RTX 4070 Laptop GPU, 90 Wh | Razer Blade 18 RTX 4070 i9-13950HX, GeForce RTX 4070 Laptop GPU, 91.7 Wh | Gigabyte A7 X1 R9 5900HX, GeForce RTX 3070 Laptop GPU, 48.96 Wh | Lenovo Legion 5 Pro 16ARH7H RTX 3070 Ti R7 6800H, GeForce RTX 3070 Ti Laptop GPU, 80 Wh | Alienware x17 RTX 3080 P48E i7-11800H, GeForce RTX 3080 Laptop GPU, 87 Wh | MSI Raider GE77 HX 12UHS i9-12900HX, GeForce RTX 3080 Ti Laptop GPU, 99.99 Wh | Media de la clase Gaming | |
|---|---|---|---|---|---|---|---|
| Duración de Batería | -28% | -21% | -46% | -33% | 6% | -5% | |
| Reader / Idle (h) | 11.7 | 7 -40% | 7 -40% | 9.8 -16% | 8.71 ? -26% | ||
| WiFi v1.3 (h) | 8.1 | 4 -51% | 4.7 -42% | 4.4 -46% | 5.9 -27% | 5.4 -33% | 7.01 ? -13% |
| Load (h) | 1.2 | 1.3 8% | 1.2 0% | 0.8 -33% | 2 67% | 1.47 ? 23% | |
| H.264 (h) | 6.5 | 8.26 ? |
Pro
Contra
Veredicto
Con el ROG Strix G18 G814JI, Asus ha hecho un debut casi consistentemente bueno en el todavía bastante nuevo segmento de portátiles de 18 pulgadas.
La carcasa de la unidad base muestra algunos signos de debilidad en el área de la estabilidad y es algo que tiene un efecto en la calidad percibida de los dispositivos de entrada (el chasis tiende a traquetear un poco). No obstante, gracias a las generosas características de puerto (incl. Thunderbolt 4), un diseño llamativo, y amplia iluminación (teclado, tira LED en el frontal), los jugones obtienen una plataforma de juego adecuada.
Aunque Asus se ha decidido por una pantalla Mini LED u OLED (esta última tecnología también tiene sus desventajas), nos gusta la calidad de imagen. El brillo y los tiempos de respuesta, así como el espacio y la precisión del color, no tienen por qué esconderse de la competencia. Además, el G18 también merece elogios por la duración relativamente larga de su batería.
El veredicto sobre el rendimiento (3D) está algo dividido. Mientras que el Core i7-13650HX debuta con éxito, la tarjeta gráfica plantea algunas dudas.
No se entiende del todo en qué estaba pensando Nvidia con la versión móvil de laRTX 4070las especificaciones (8 GB de VRAM, interfaz de 128 bits, ...) ni están al día ni hacen justicia al precio de compra. No sólo su ventaja sobre la generación anterior es a menudo pequeña, sino que los costes para el usuario final han aumentado drásticamente (comparar, por ejemplo,Los portátiles RTX 3070 Ti).
En consecuencia, los jugadores que busquen un portátil deberían fijarse en la generación anterior o incluso darse el capricho de comprar un dispositivo con una GPURTX 4080.
Si tiene que ser absolutamente una máquina de 18 pulgadas, una mejor alternativa sería un dispositivo al que se hace referencia muchas veces en el análisis, elRazer Blade 18.
Precio y disponibilidad
El Asus ROG Strix G18 G814JI-N6051W con un Core i7-13650HX, GeForce RTX 4070 y pantalla WQXGA, actualmente aún no está disponible en varias tiendas online.
Asus ROG Strix G18 G814JI
- 03/07/2023 v7 (old)
Florian Glaser
Transparencia
La selección de los dispositivos que se van a reseñar corre a cargo de nuestro equipo editorial. La muestra de prueba fue proporcionada al autor en calidad de préstamo por el fabricante o el minorista a los efectos de esta reseña. El prestamista no tuvo ninguna influencia en esta reseña, ni el fabricante recibió una copia de la misma antes de su publicación. No había ninguna obligación de publicar esta reseña. Como empresa de medios independiente, Notebookcheck no está sujeta a la autoridad de fabricantes, minoristas o editores.
Así es como prueba Notebookcheck
Cada año, Notebookcheck revisa de forma independiente cientos de portátiles y smartphones utilizando procedimientos estandarizados para asegurar que todos los resultados son comparables. Hemos desarrollado continuamente nuestros métodos de prueba durante unos 20 años y hemos establecido los estándares de la industria en el proceso. En nuestros laboratorios de pruebas, técnicos y editores experimentados utilizan equipos de medición de alta calidad. Estas pruebas implican un proceso de validación en varias fases. Nuestro complejo sistema de clasificación se basa en cientos de mediciones y puntos de referencia bien fundamentados, lo que mantiene la objetividad.Price comparison

