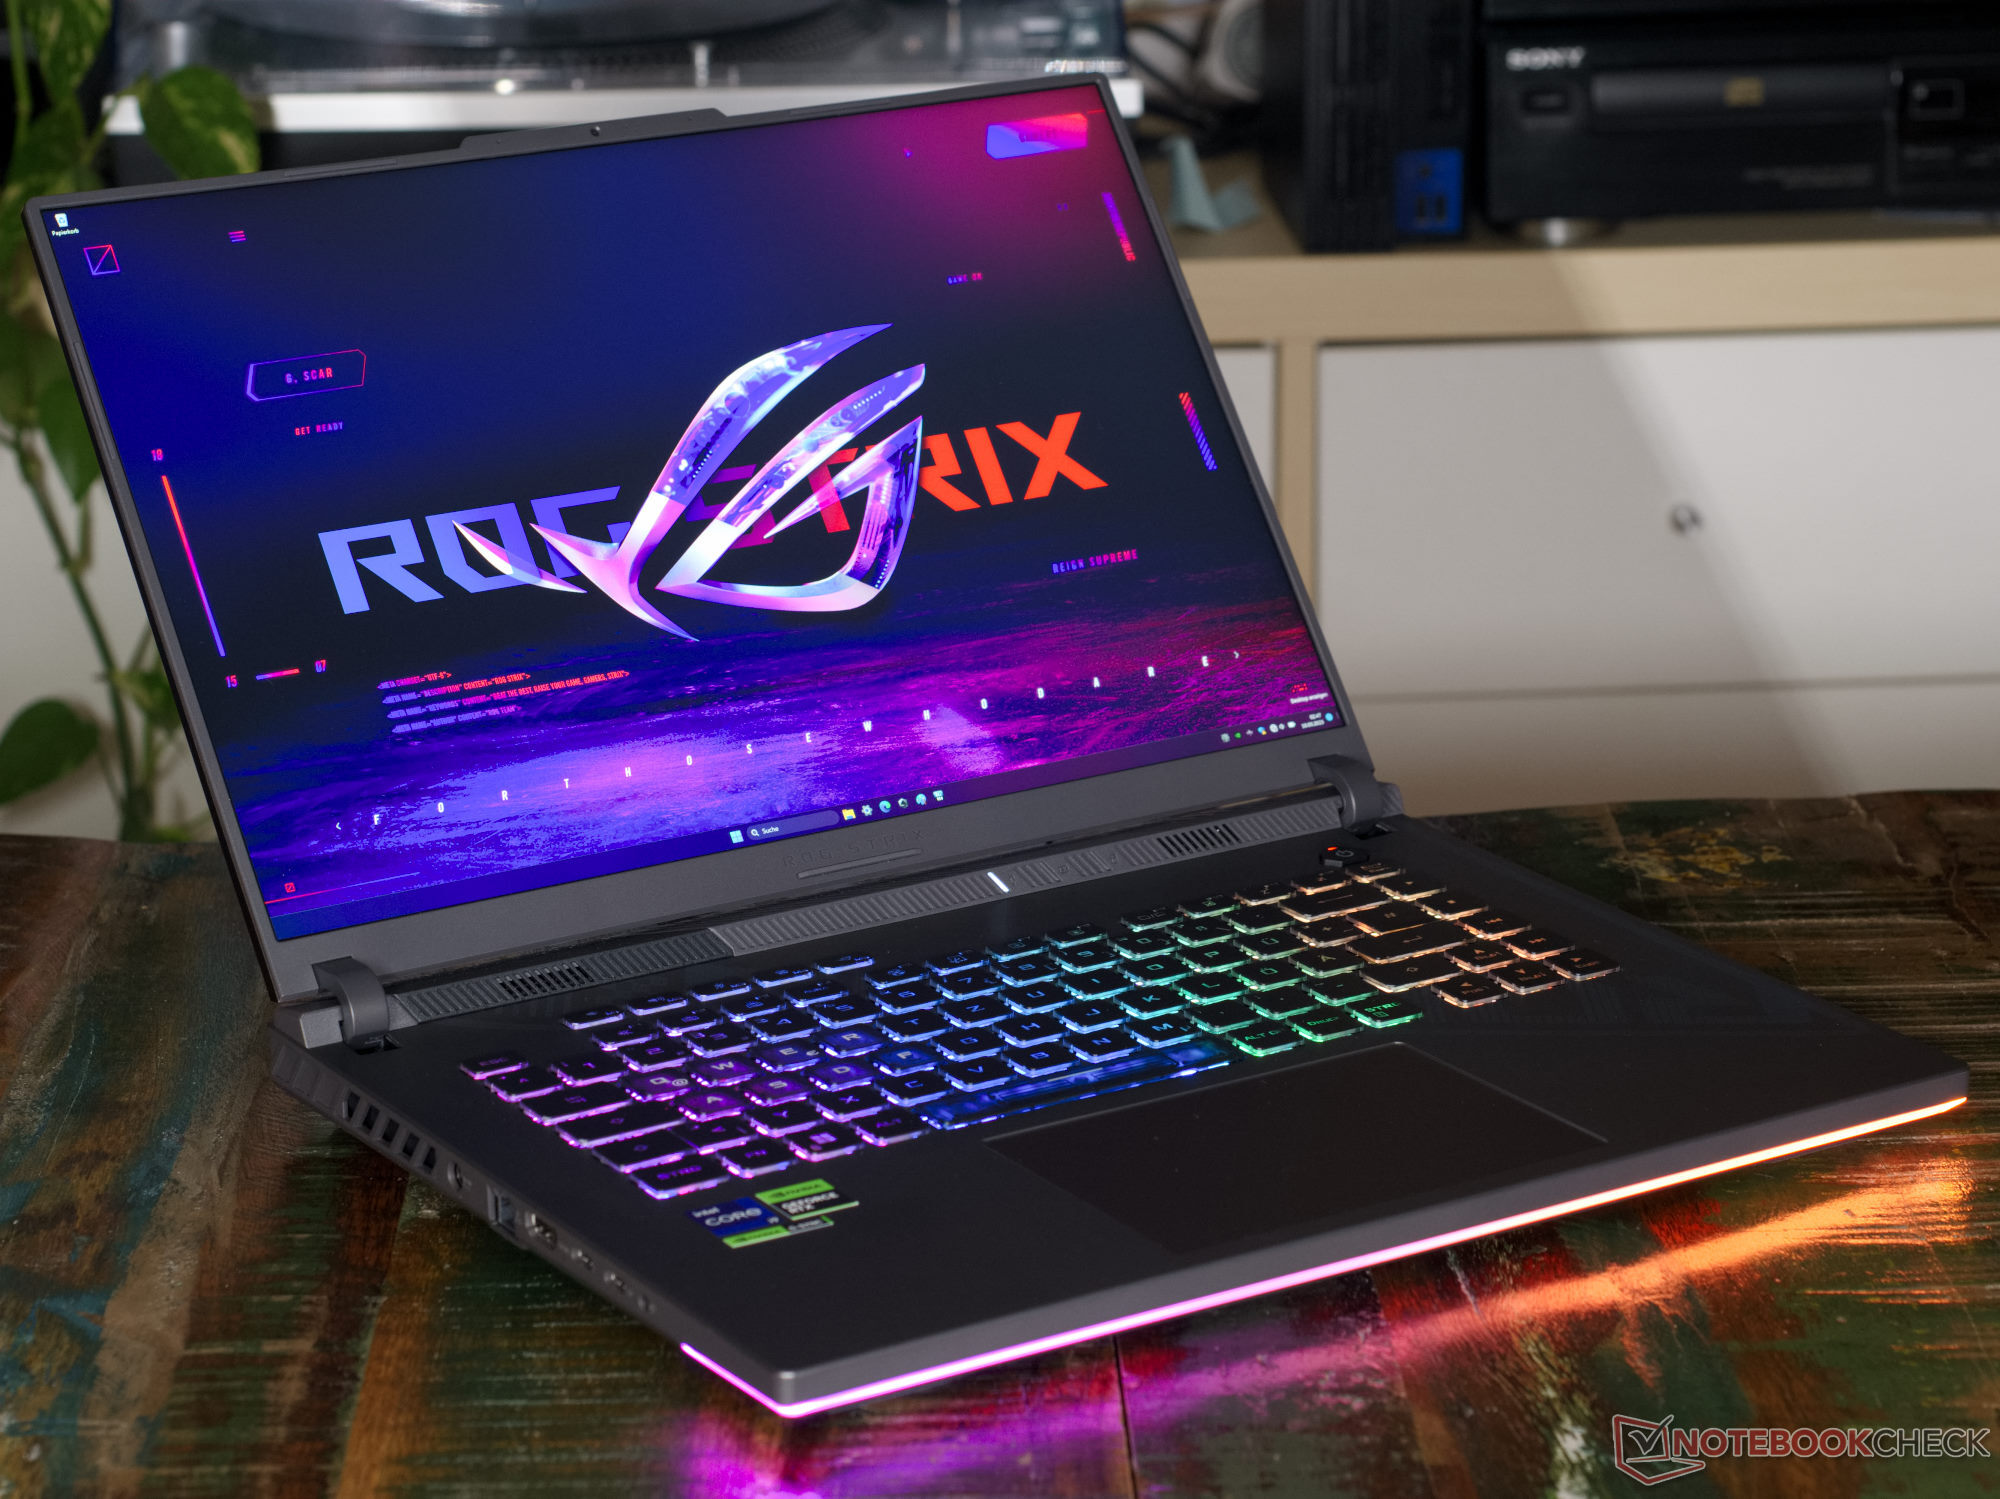
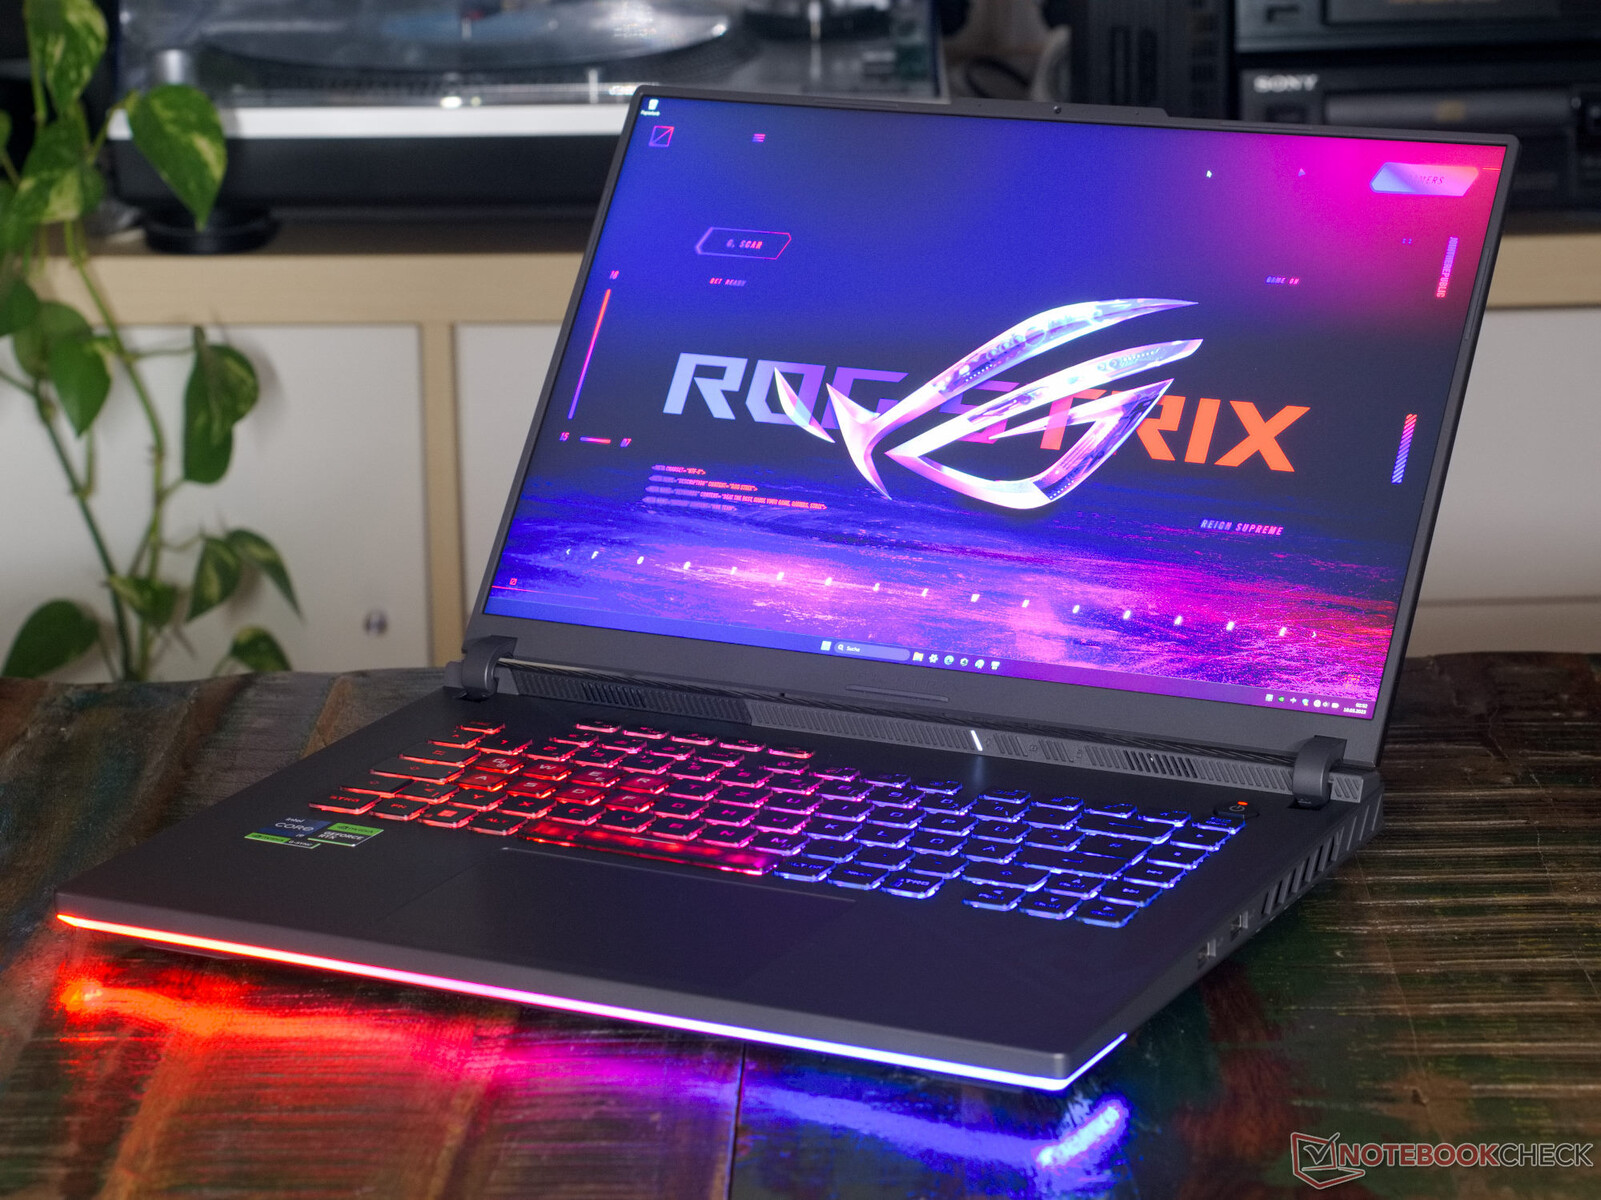
Análisis del portátil Asus ROG Strix G16 G614JZ: Despeja el escenario para la RTX 4080

ROG, Republic of Gamers, es la marca de juegos de gama alta de Asus. Entre ellas hay tres líneas de productos: Flow, Zephyrus y Strix, de las cuales sólo los portátiles Strix son portátiles gaming clásicos. Asus subdivide además la línea Strix en las categorías ROG Strix y ROG Strix Scar. En principio, todos los portátiles ROG Strix están disponibles con un hardware similar al de los modelos ROG Strix Scar, pero tienen un diseño algo más sencillo. Por otra parte, esto también es una cuestión de perspectiva, ya que todos los portátiles para juegos del fabricante taiwanés son bastante llamativos. Mientras tanto, los dispositivos de las series ROG Strix G y Scar se han acercado un poco más. Mientras que los modelos Scar de 2022 se refrigeraban con una cámara de vapor, los sistemas de refrigeración de ambas series son ahora casi idénticos.
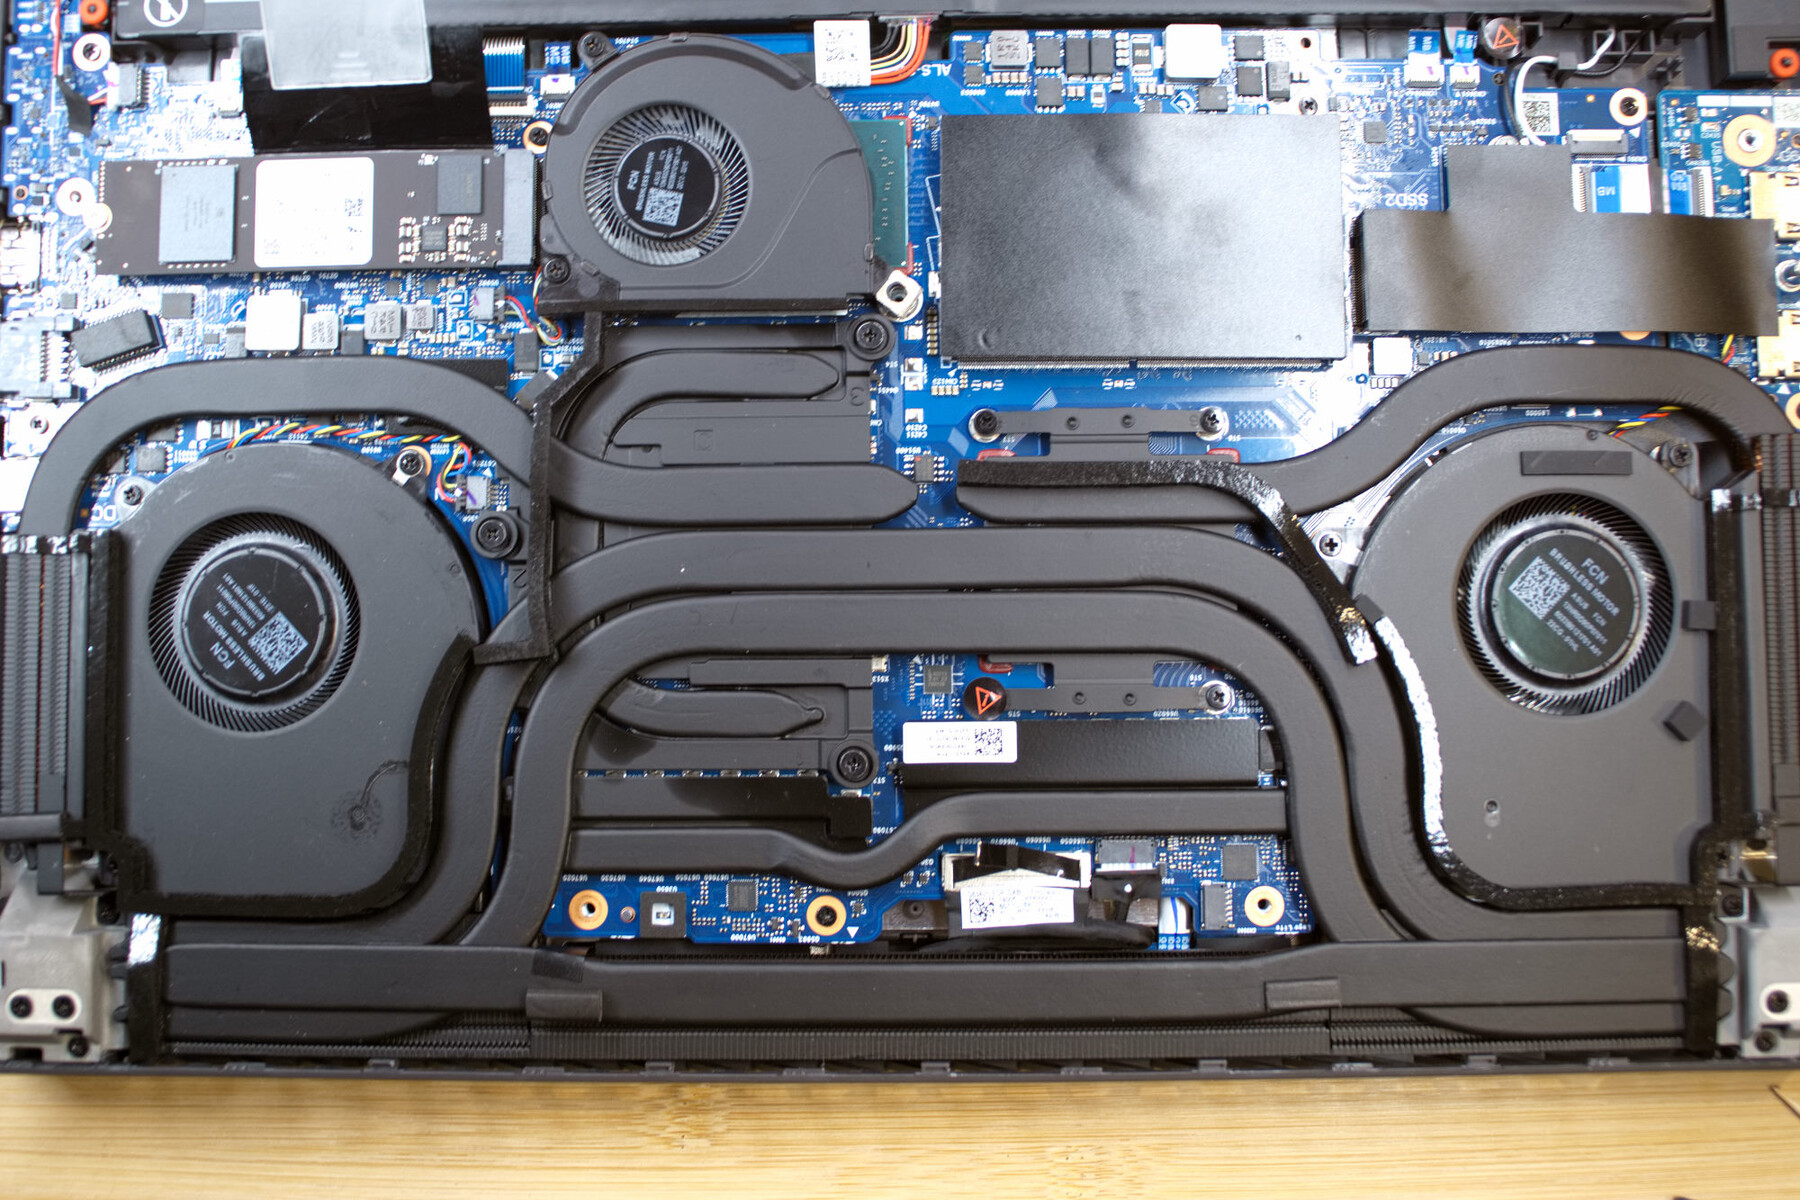
Nuestro dispositivo de pruebas con suIntel Core i7-13980HX y Nvidia GeForce RTX 4080 es uno de los dispositivos mejor equipados. Para mantener el potente hardware a temperaturas de funcionamiento tolerables, Asus ha instalado un enorme sistema de refrigeración con tres ventiladores. El metal líquido también garantiza una buena disipación del calor y un aumento prolongado de la potencia.
los portátiles gaming de 16 pulgadas están actualmente de moda, por lo que nuestra base de datos cuenta con un gran número de gama actual con especificaciones similares. Ya hemos analizado algunos portátiles de la última generación de la serie ROG Strix. Entre ellos, el Asus ROG Strix G18 y el Asus ROG Strix Scar 18ambos portátiles tienen chips gráficos diferentes, a saber, RTX 4070 y RTX 4090, pero tienen sistemas de refrigeración similares, placas base casi idénticas y, por tanto, valores límite de potencia similares. Esto da lugar a interesantes posibilidades de comparación entre las distintas unidades gráficas de Nvidia.
El Lenovo Legion Pro 7 y el Razer Blade 16son portátiles de 16 pulgadas de la misma clase de rendimiento que el ROG Strix G16, aunque es probable que ambos portátiles sean más caros.
Comparaison avec les concurrents potentiels
Valoración | Fecha | Modelo | Peso | Altura | Tamaño | Resolución | Precio |
|---|---|---|---|---|---|---|---|
| 88.4 % v7 (old) | 03/2023 | Asus ROG Strix G16 G614JZ i9-13980HX, GeForce RTX 4080 Laptop GPU | 2.4 kg | 30.4 mm | 16.00" | 2560x1600 | |
| 88 % v7 (old) | 04/2023 | Asus Zephyrus Duo 16 GX650PY-NM006W R9 7945HX, GeForce RTX 4090 Laptop GPU | 2.7 kg | 29.7 mm | 16.00" | 2560x1600 | |
| 89.4 % v7 (old) | 02/2023 | Lenovo Legion Pro 7 16IRX8H i9-13900HX, GeForce RTX 4080 Laptop GPU | 2.7 kg | 26 mm | 16.00" | 2560x1600 | |
| 86.2 % v7 (old) | 03/2023 | Gigabyte AERO 16 OLED BSF i9-13900H, GeForce RTX 4070 Laptop GPU | 2.1 kg | 18 mm | 16.00" | 3840x2400 | |
| 86.2 % v7 (old) | 02/2023 | Asus TUF Gaming A16 FA617 R7 7735HS, Radeon RX 7600S | 2.2 kg | 27 mm | 16.00" | 1920x1200 | |
| 91.2 % v7 (old) | 02/2023 | Razer Blade 16 Early 2023 i9-13950HX, GeForce RTX 4080 Laptop GPU | 2.4 kg | 21.99 mm | 16.00" | 2560x1600 | |
| 88.4 % v7 (old) | 04/2023 | Asus ROG Strix G17 G713PI R9 7945HX, GeForce RTX 4070 Laptop GPU | 2.8 kg | 30.7 mm | 17.30" | 2560x1440 | |
| 87.4 % v7 (old) | 03/2023 | Asus ROG Strix G18 G814JI i7-13650HX, GeForce RTX 4070 Laptop GPU | 3 kg | 31 mm | 18.00" | 2560x1600 | |
| 86.6 % v7 (old) | 02/2023 | Asus ROG Strix Scar 18 2023 G834JY-N6005W i9-13980HX, GeForce RTX 4090 Laptop GPU | 3.1 kg | 30.8 mm | 18.00" | 2560x1600 | |
| 86.9 % v7 (old) | 11/2022 | Asus ROG Strix Scar 17 SE G733CX-LL014W i9-12950HX, GeForce RTX 3080 Ti Laptop GPU | 2.9 kg | 28.3 mm | 17.30" | 2560x1440 | |
| 85 % v7 (old) | 02/2021 | Asus ROG Strix G15 G513QR R9 5900HX, GeForce RTX 3070 Laptop GPU | 2.3 kg | 27.2 mm | 15.60" | 1920x1080 |
Caso - Diseño superior, pero la aplicación podría mejorarse
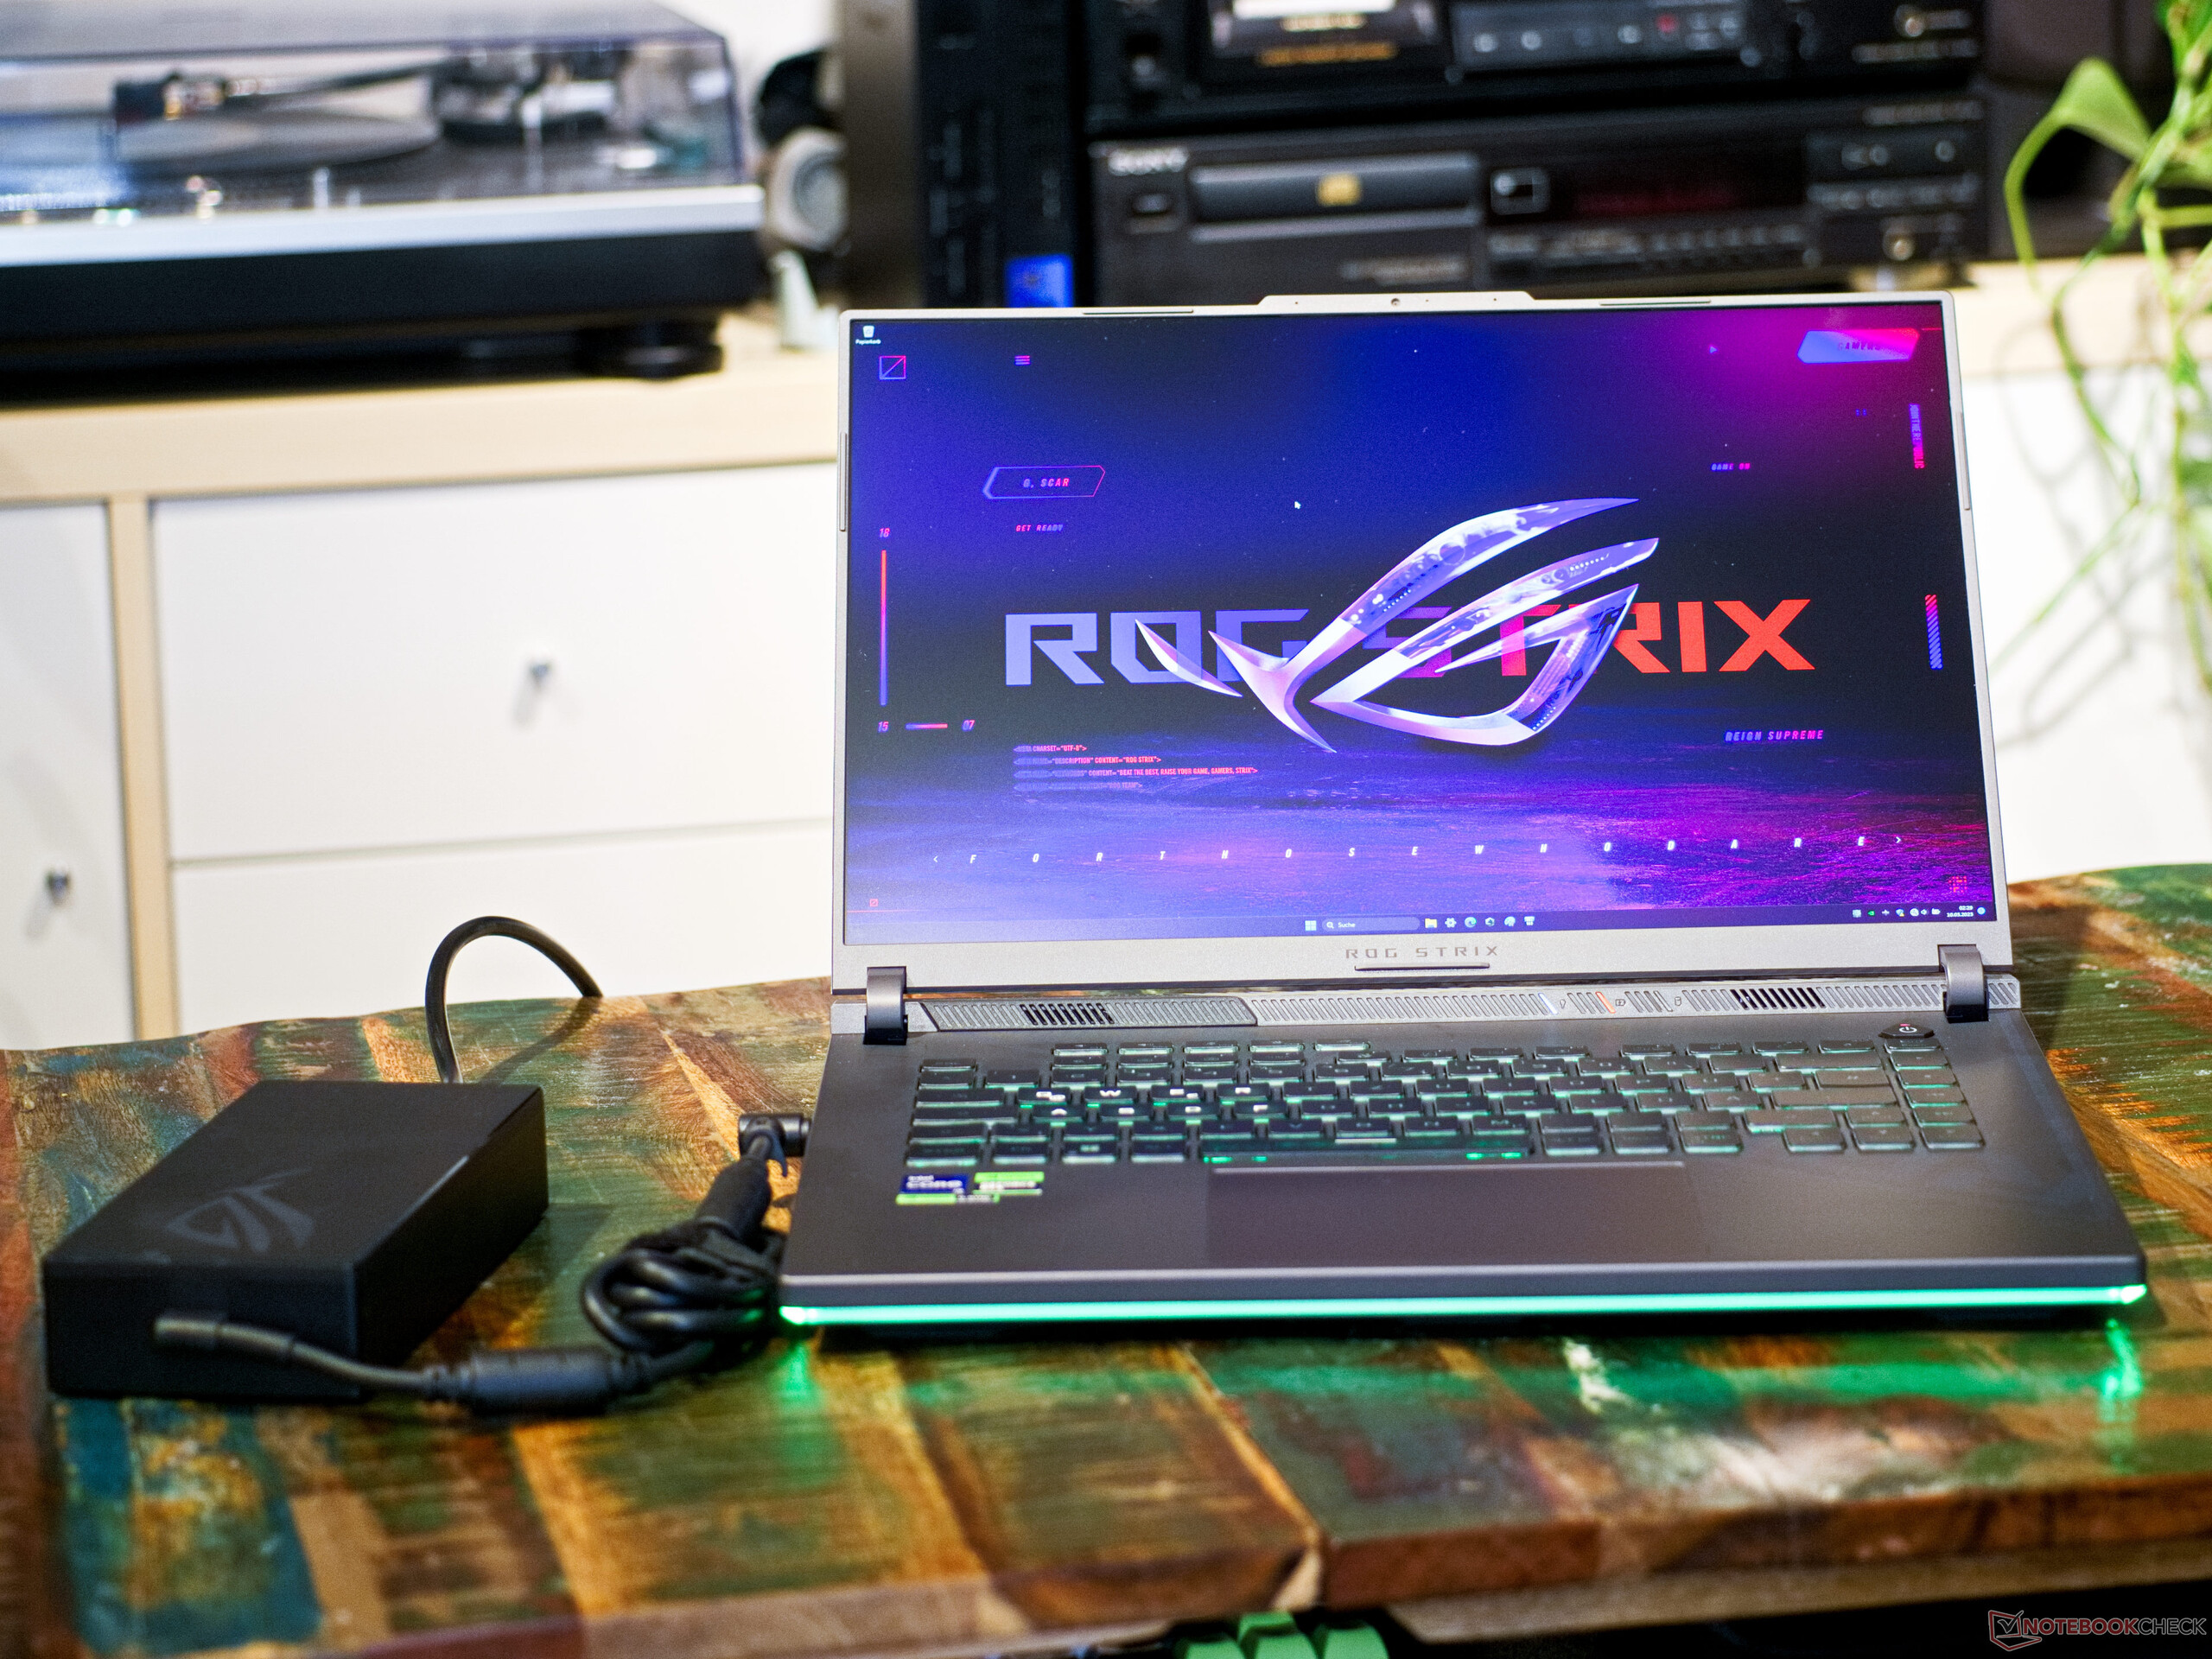
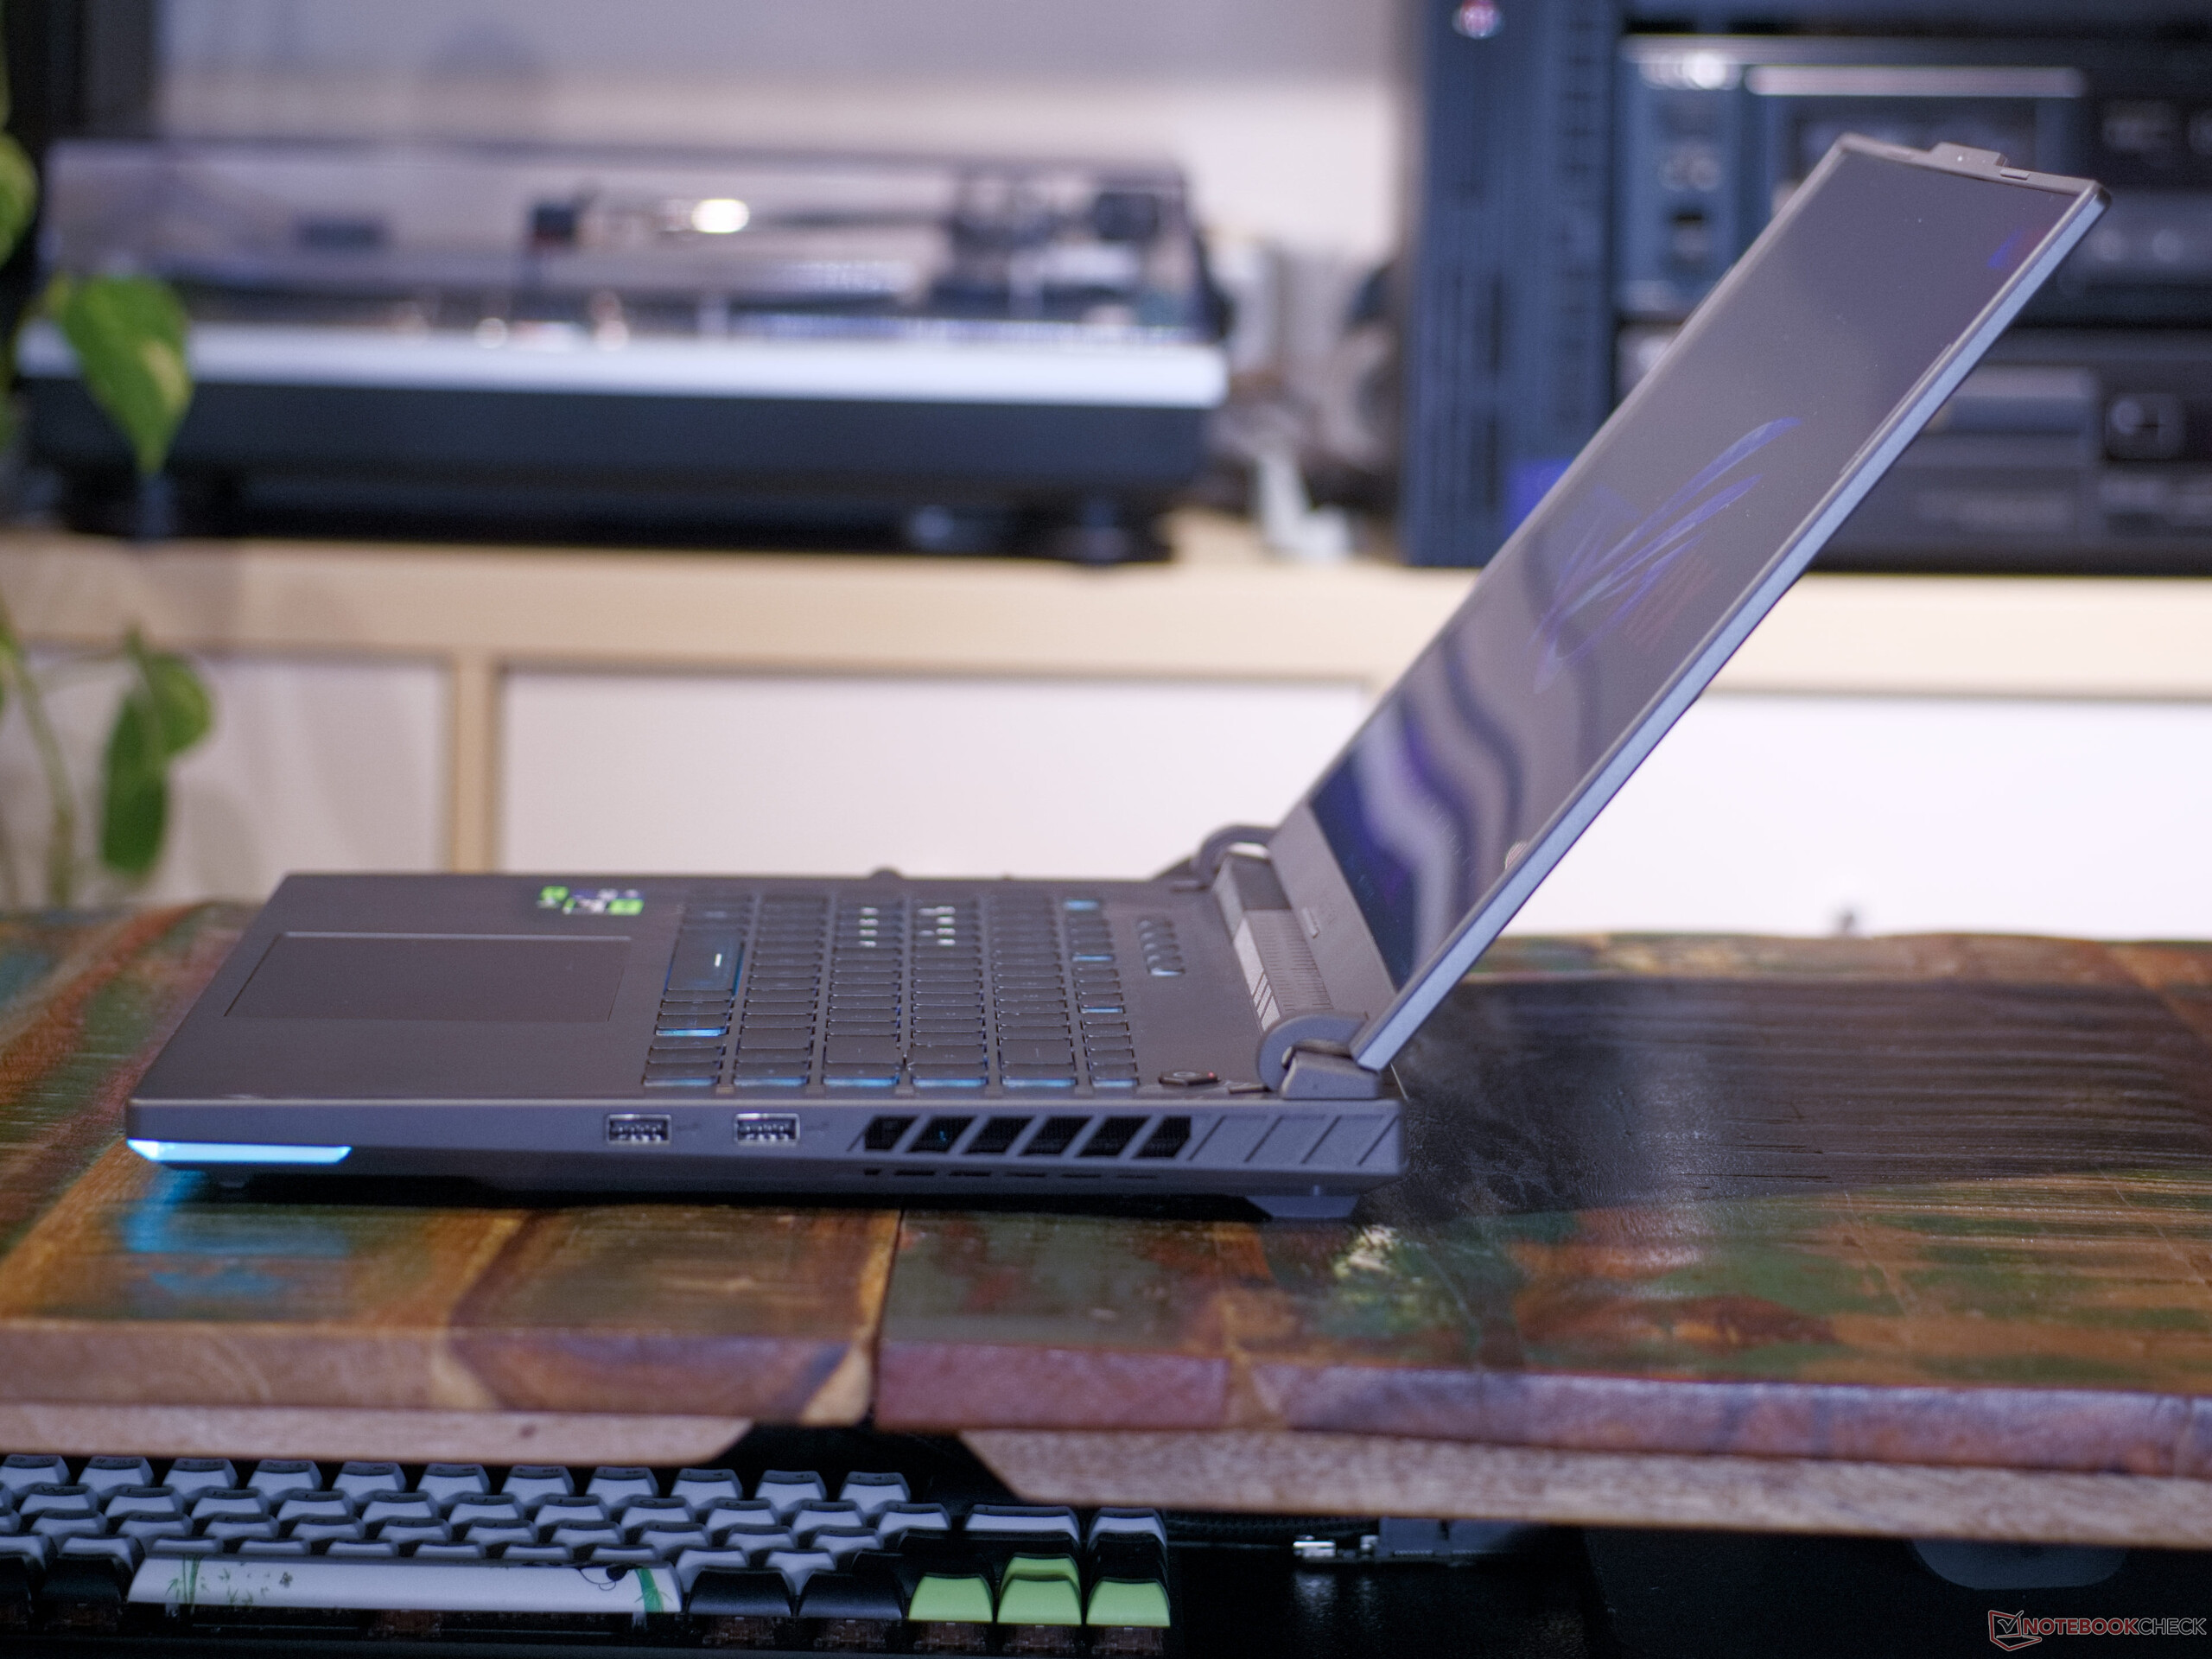
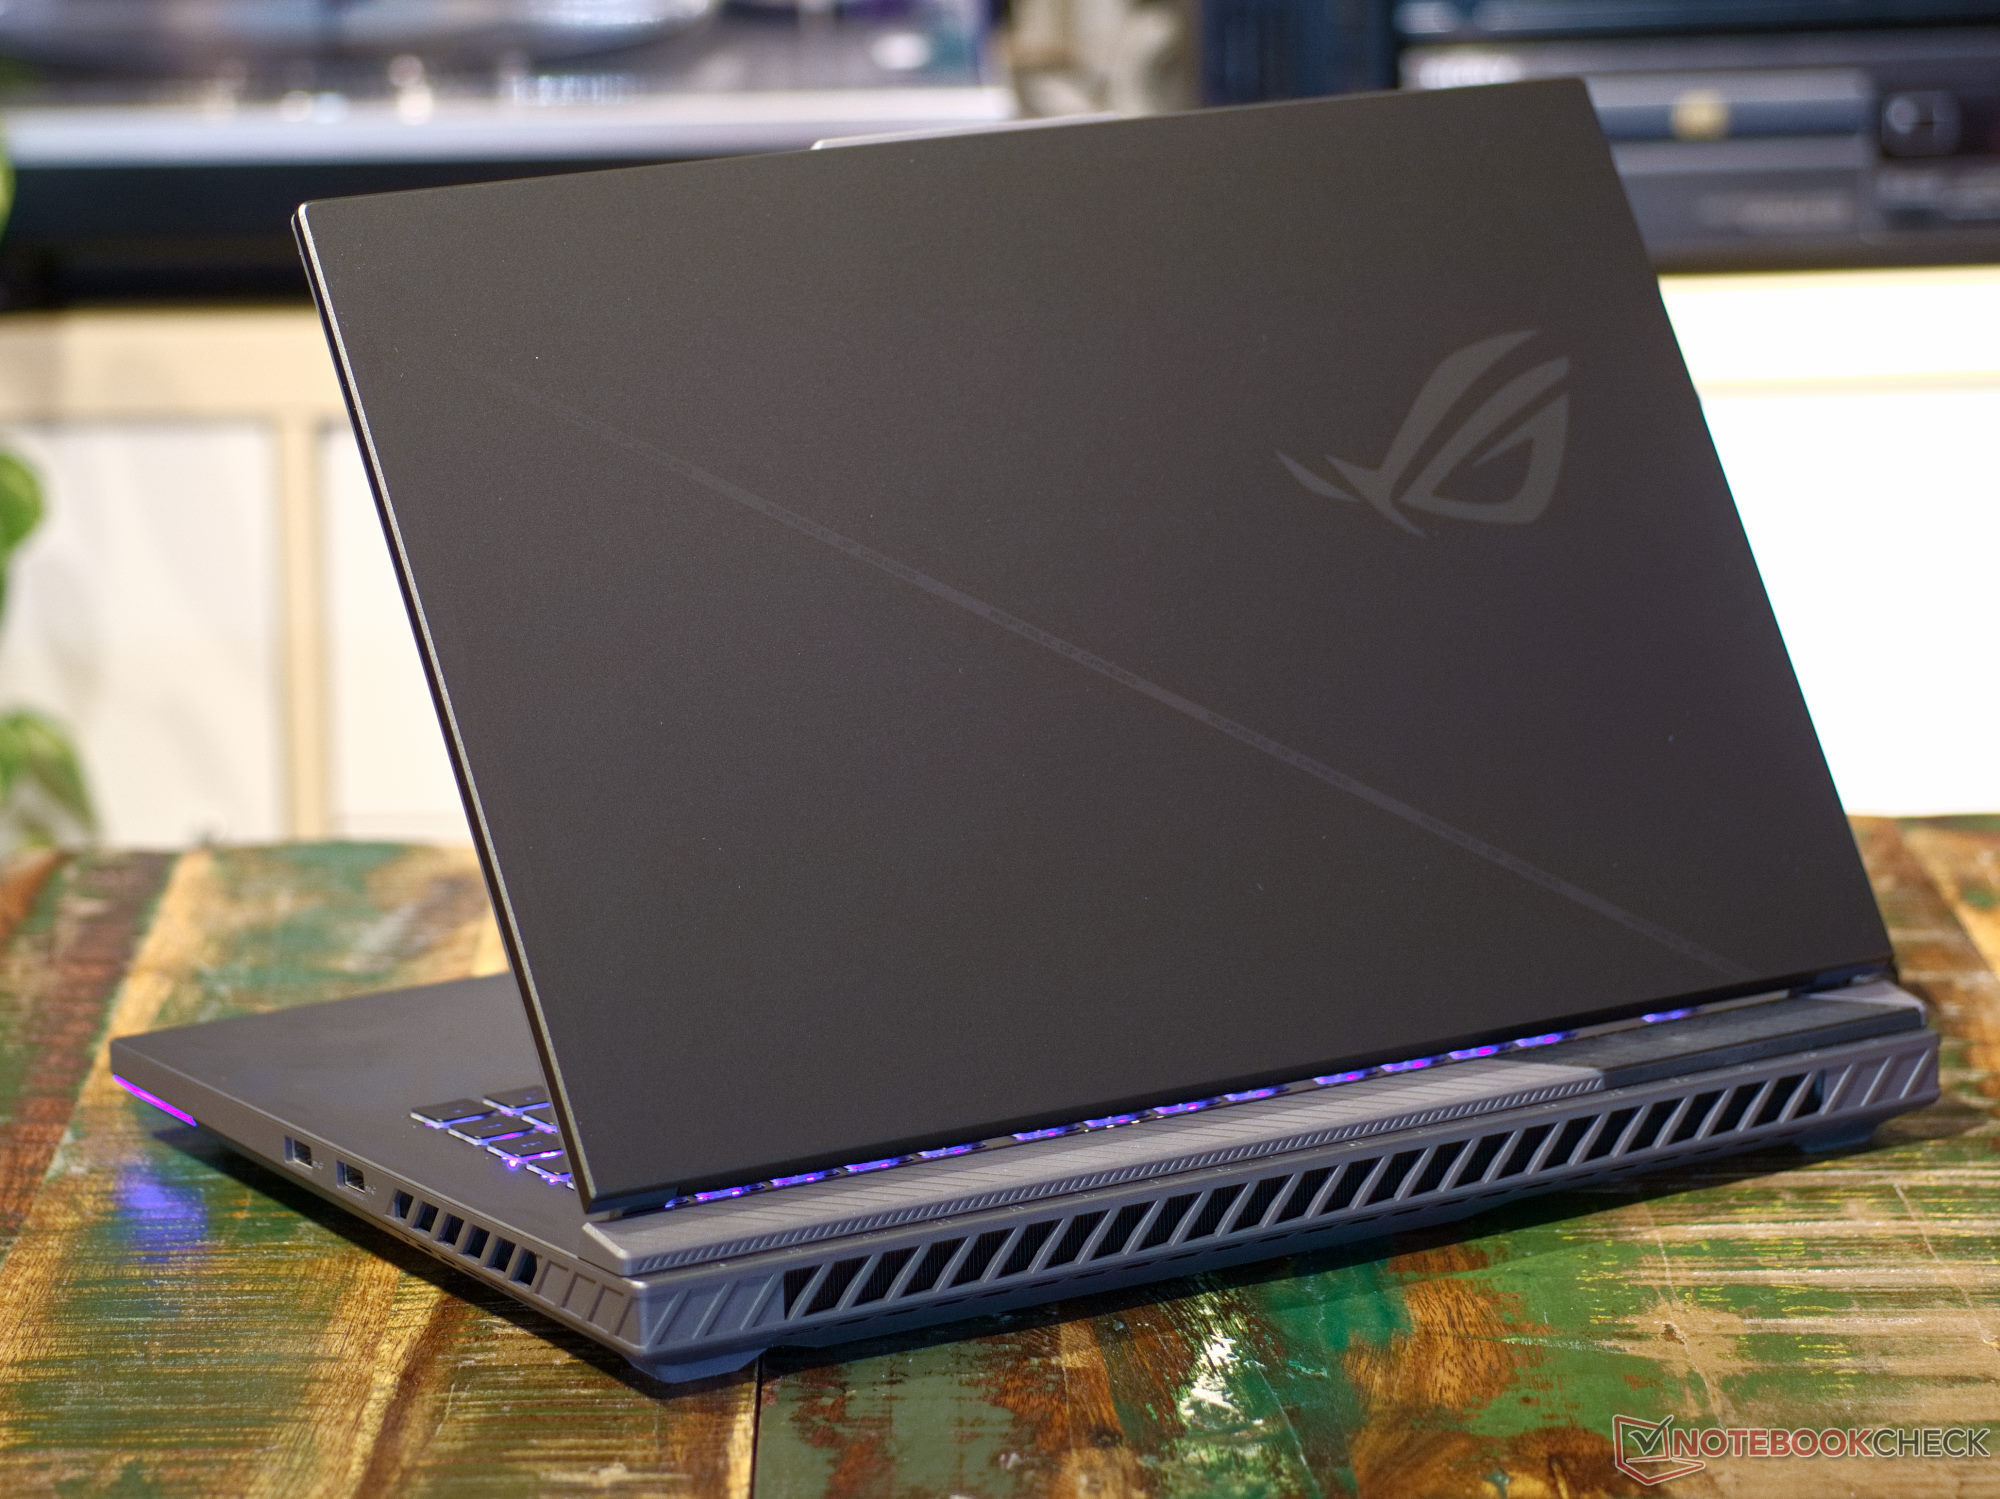
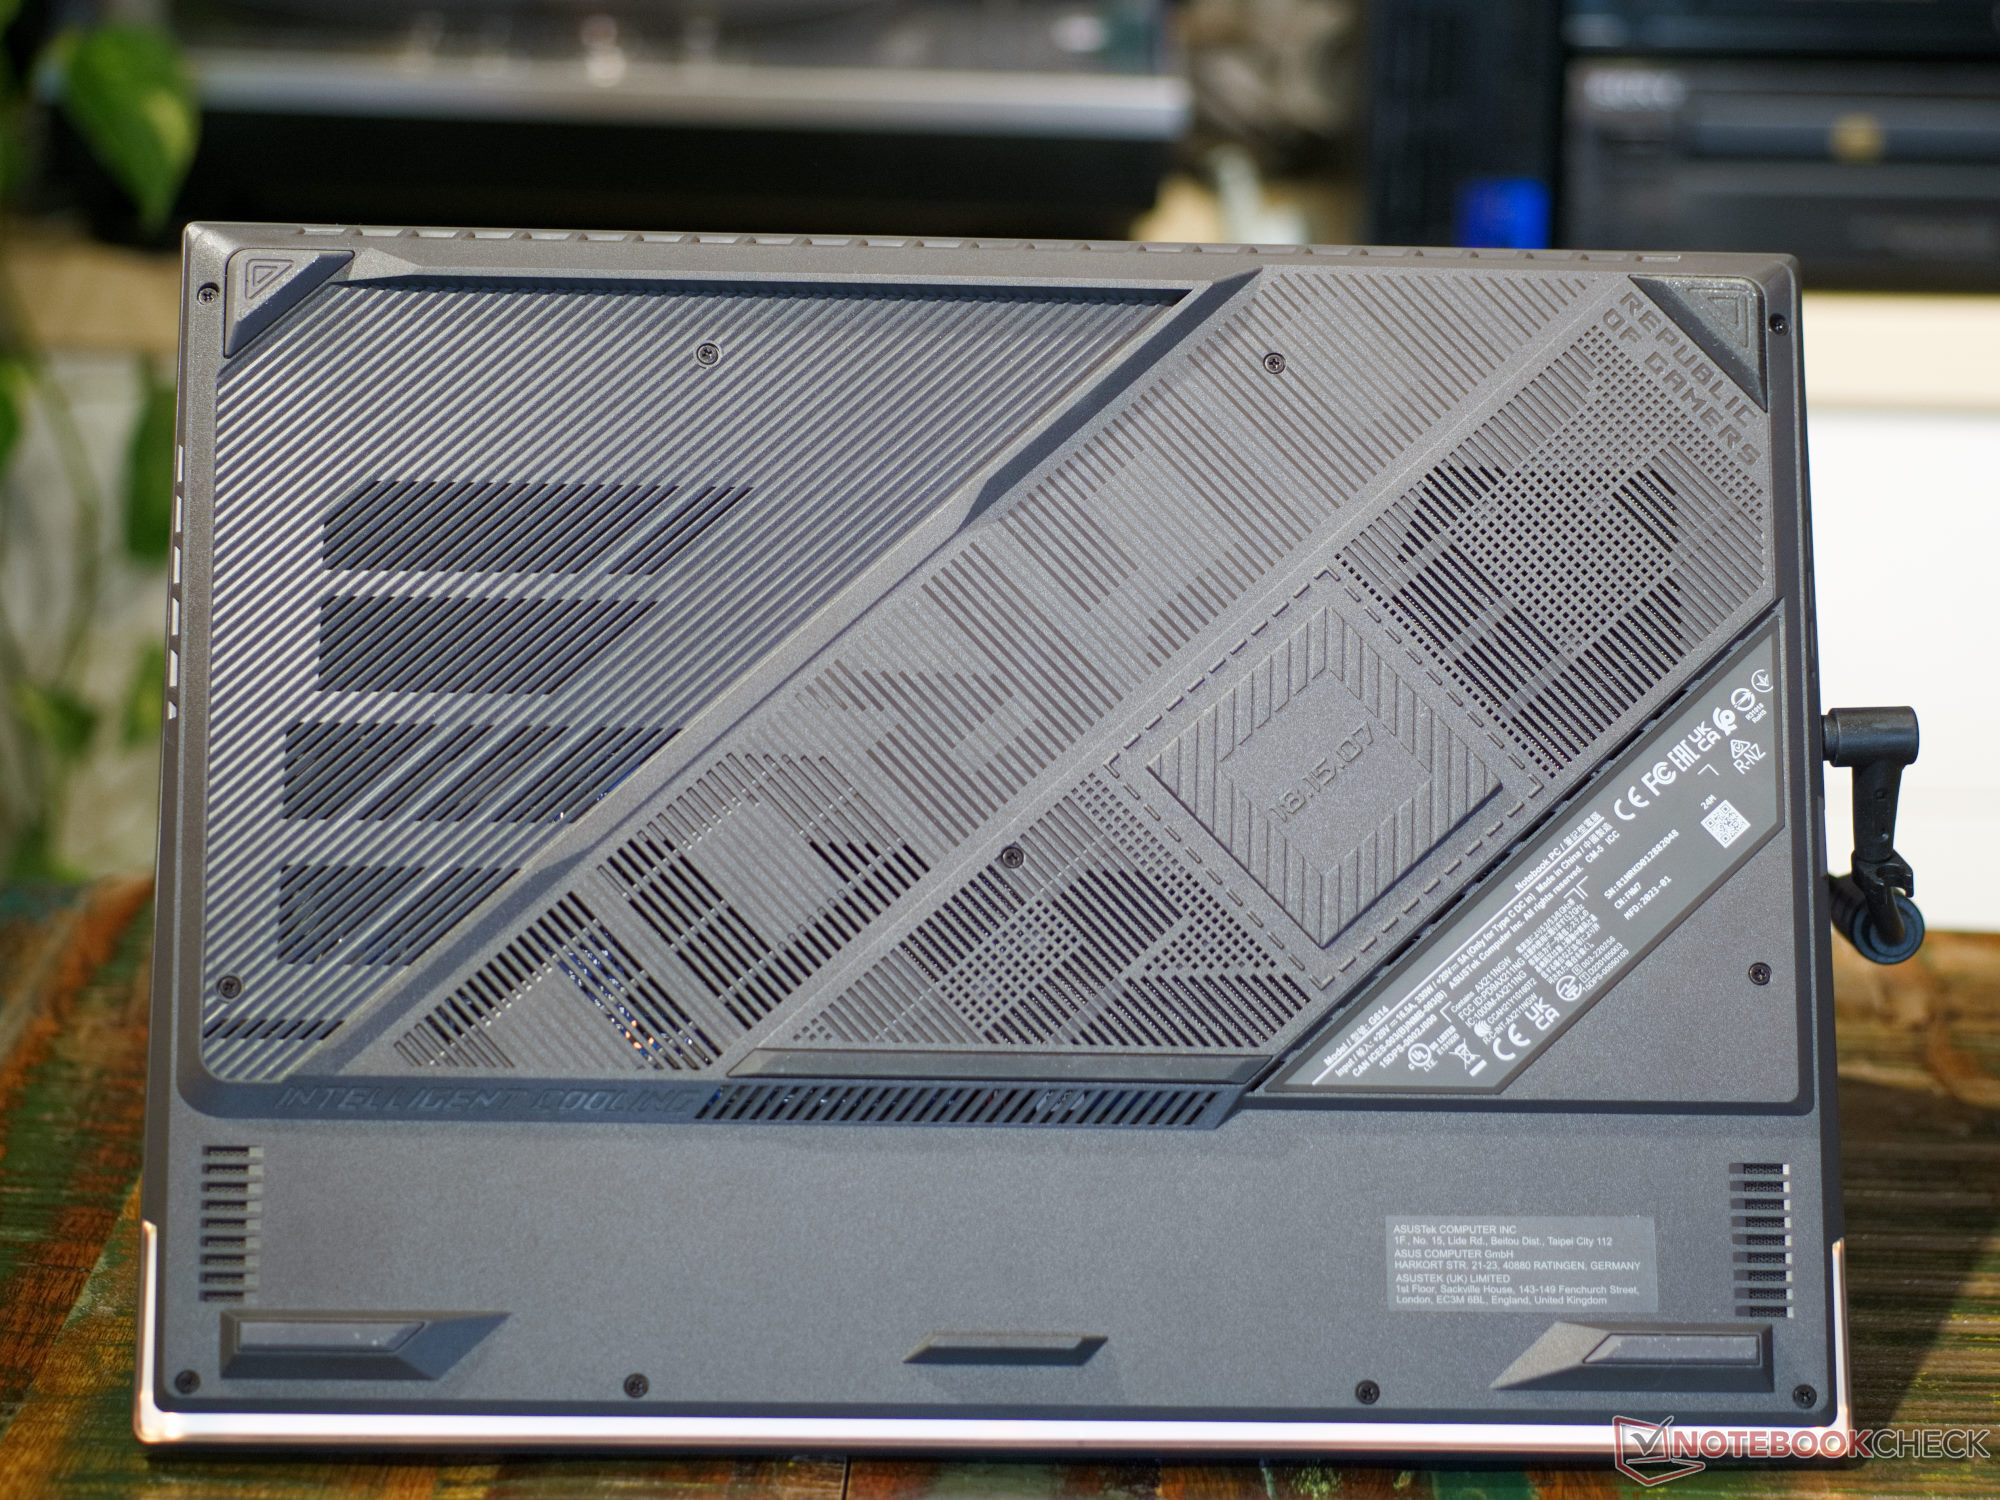
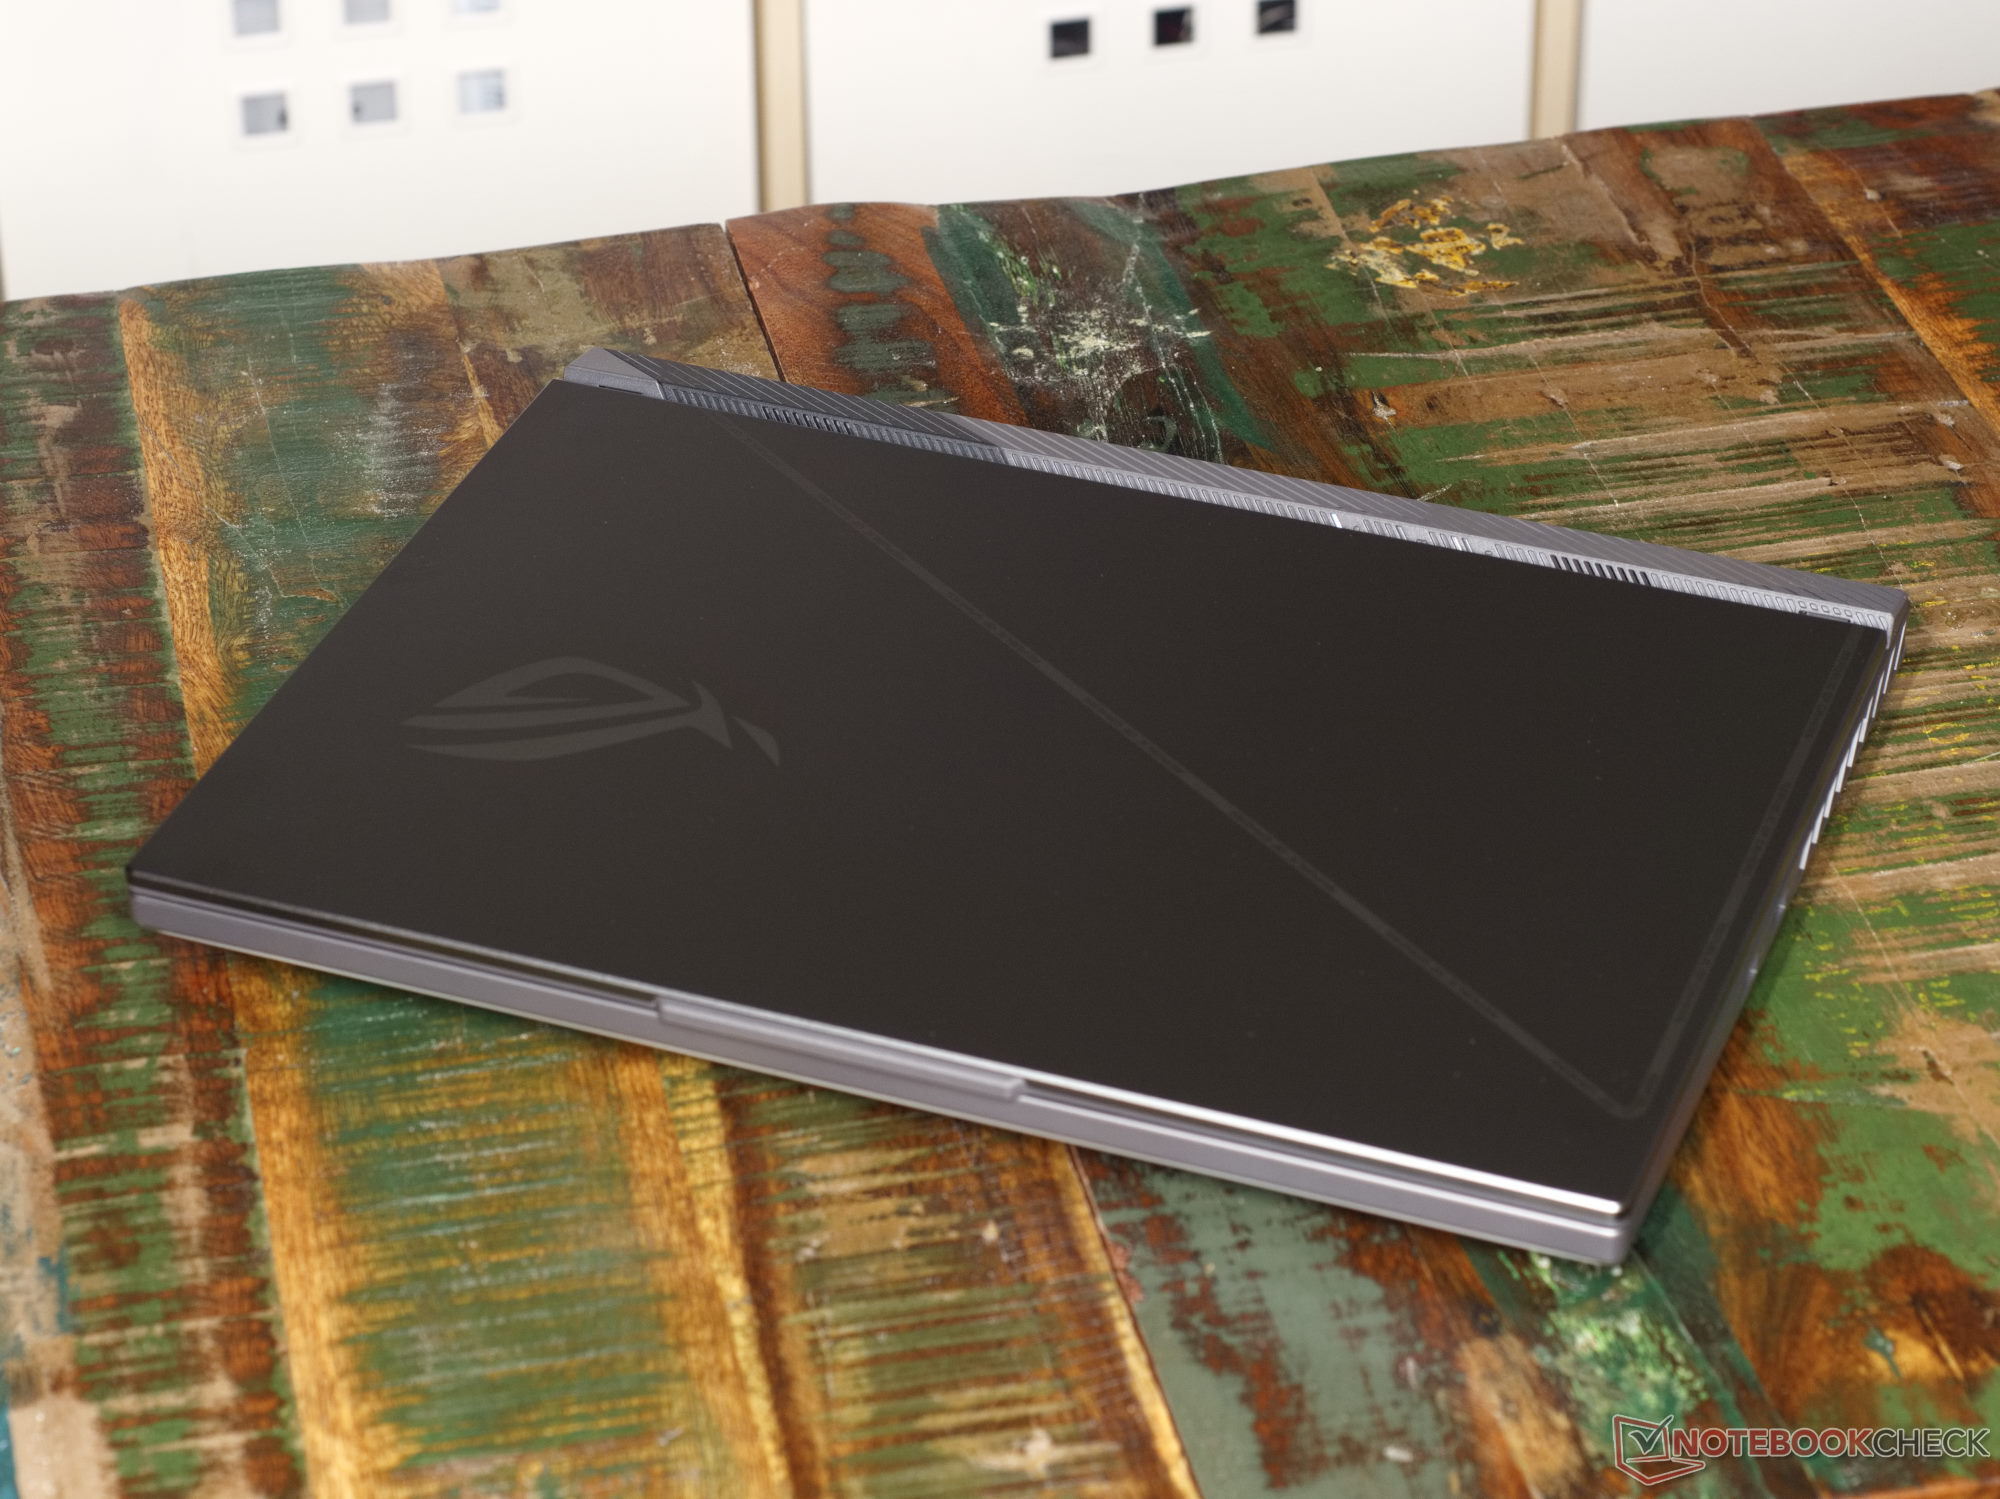
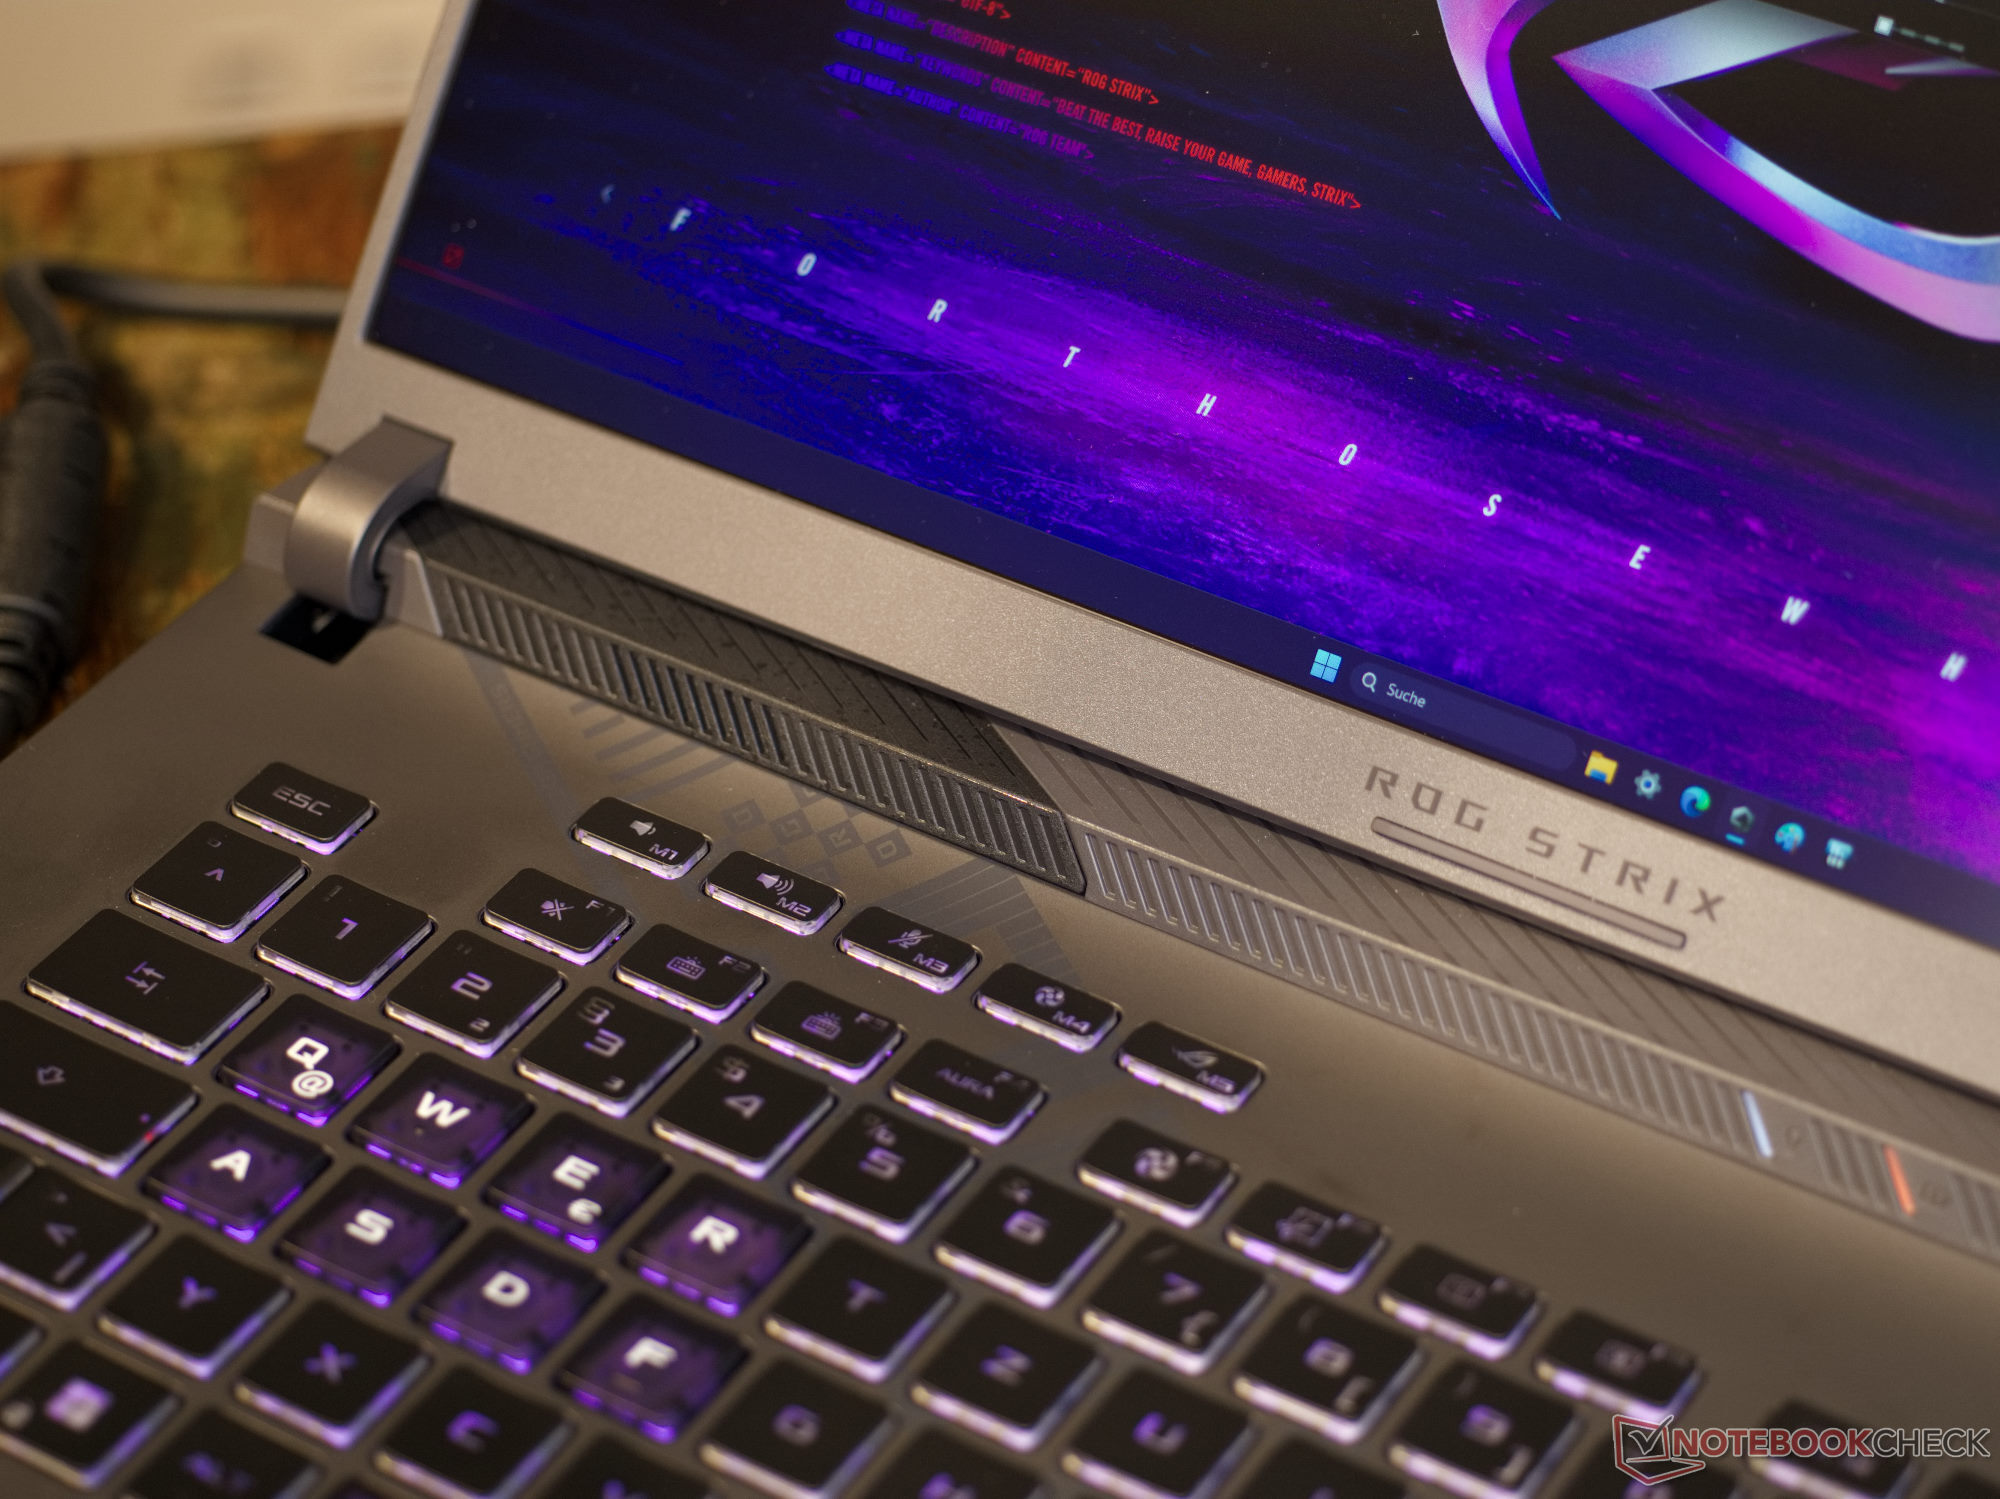
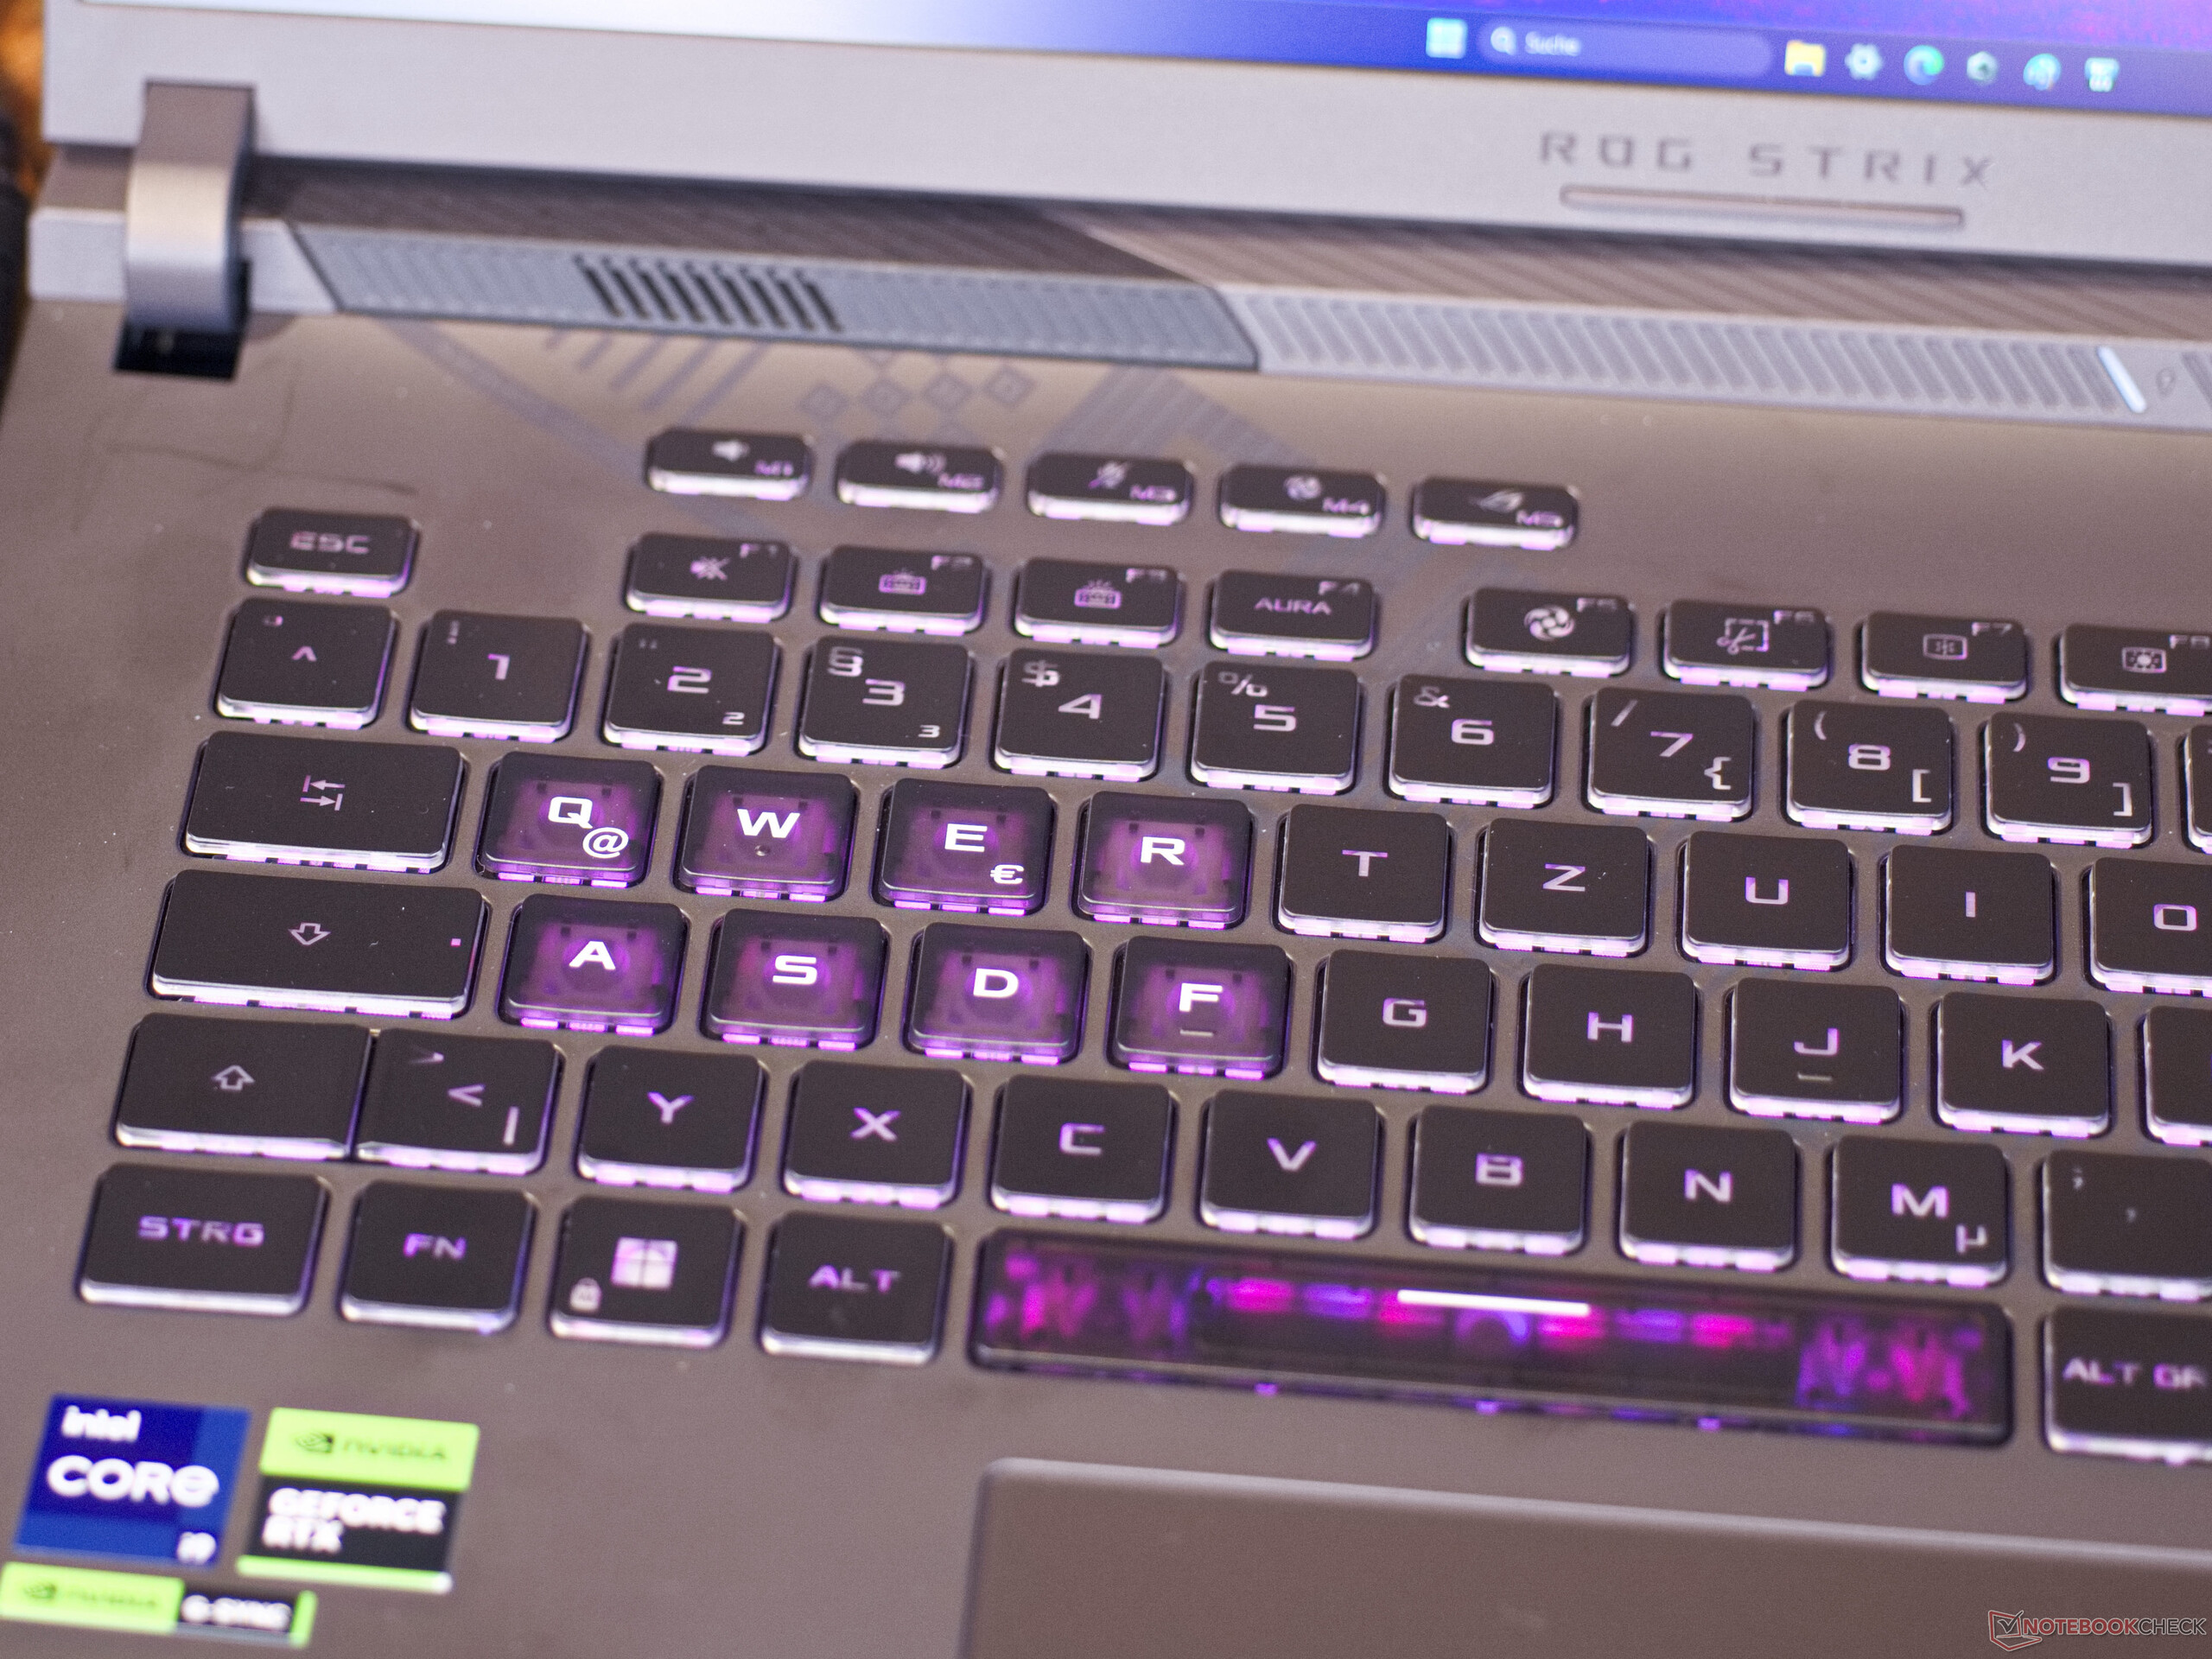
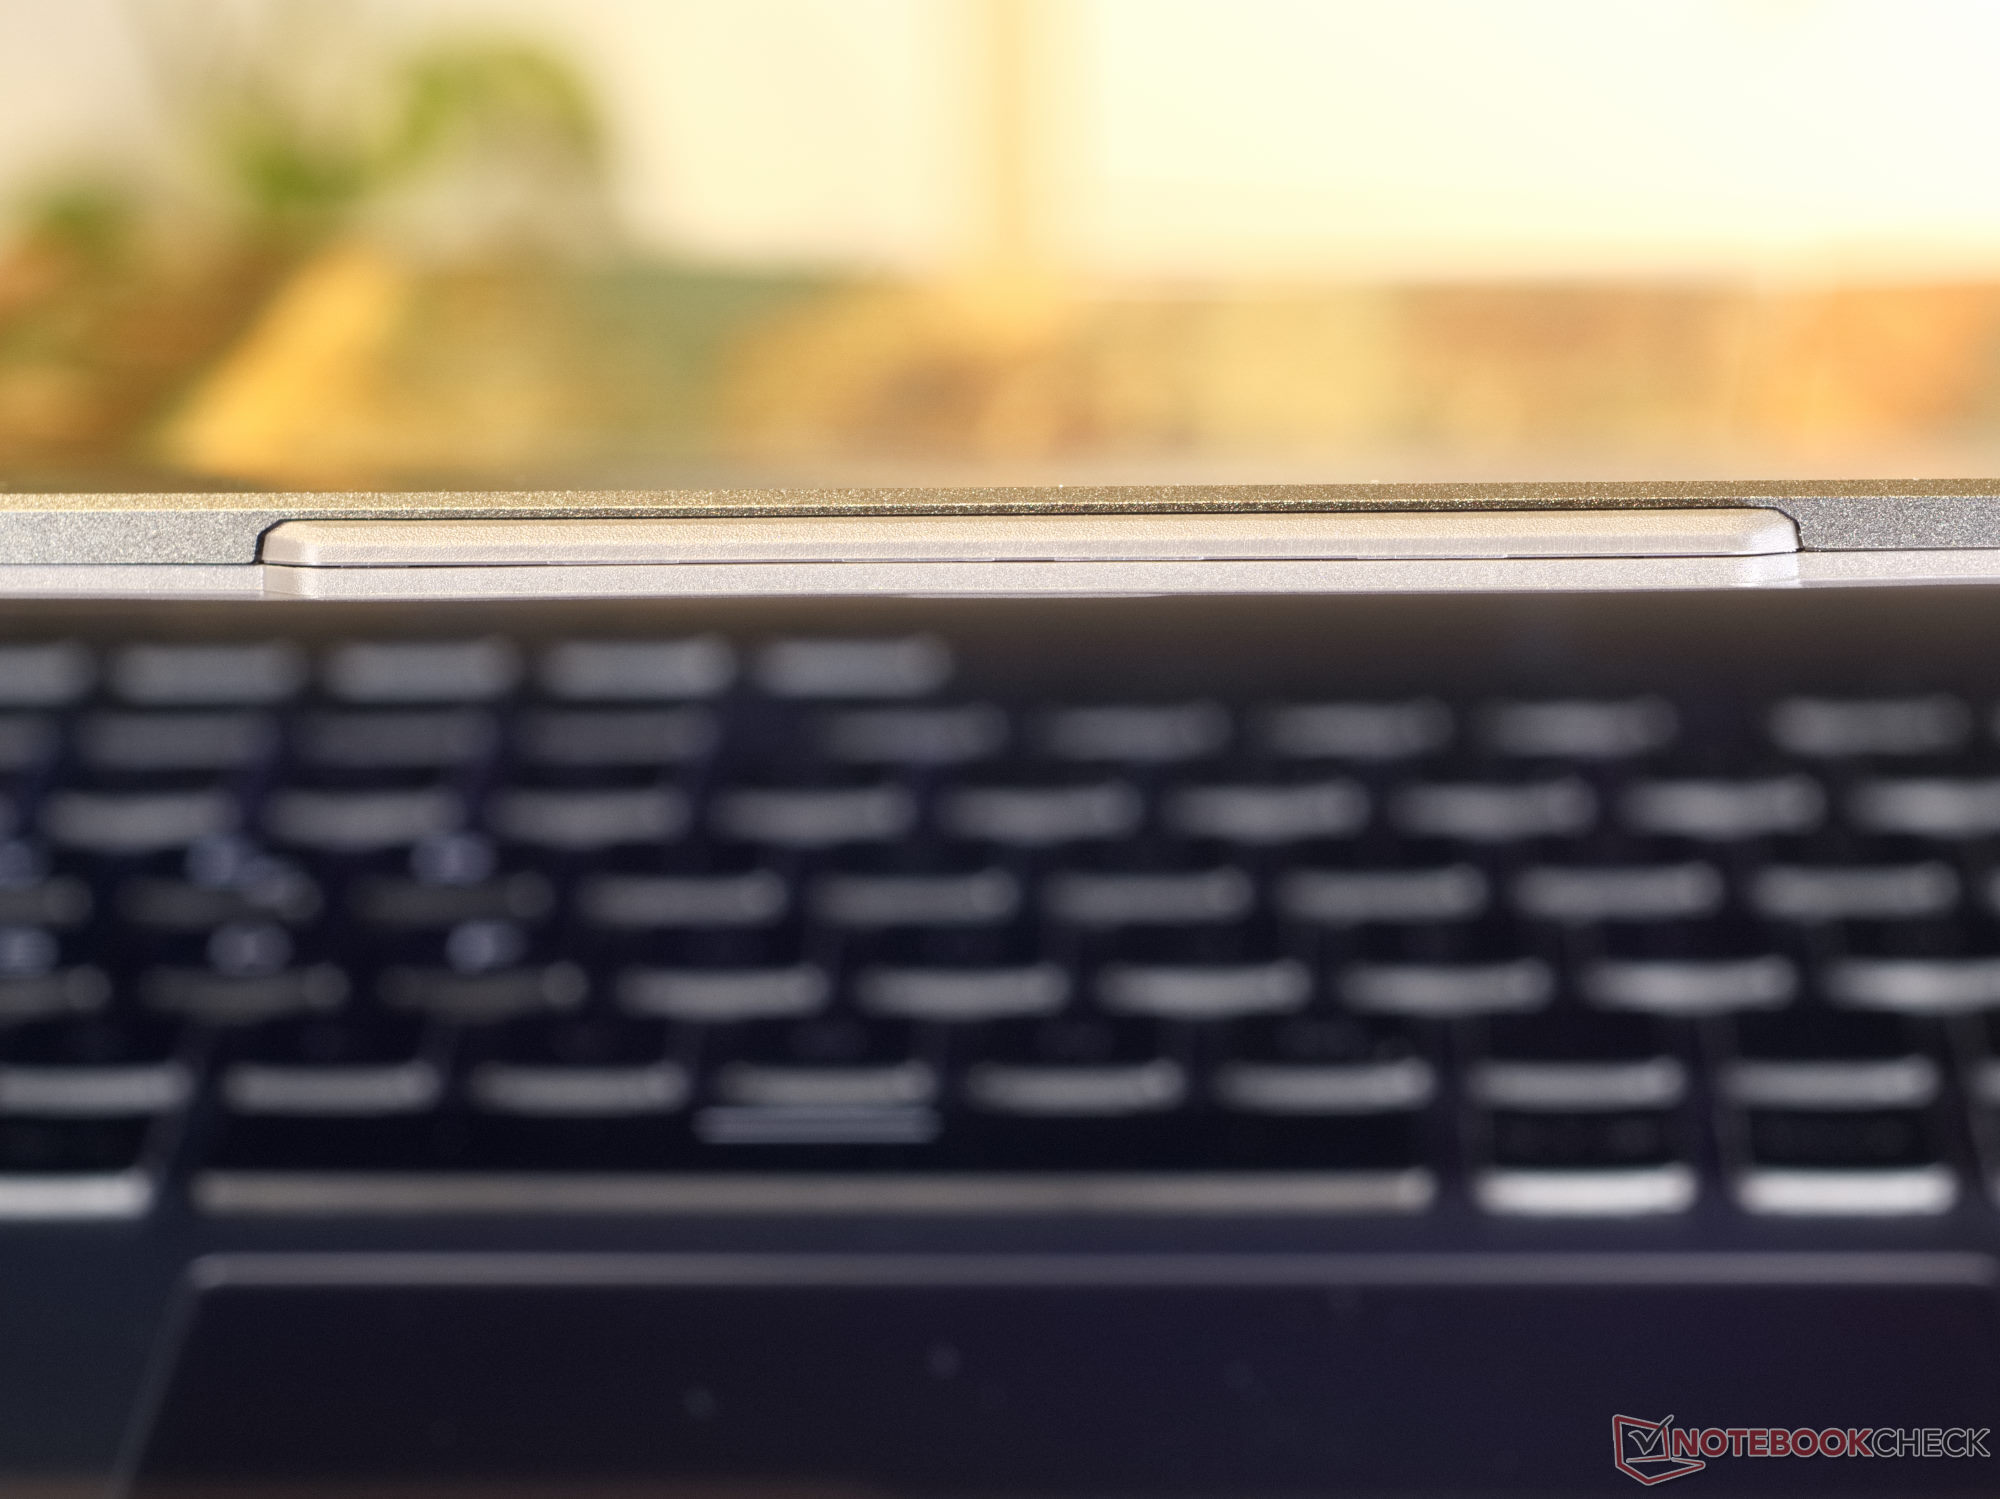
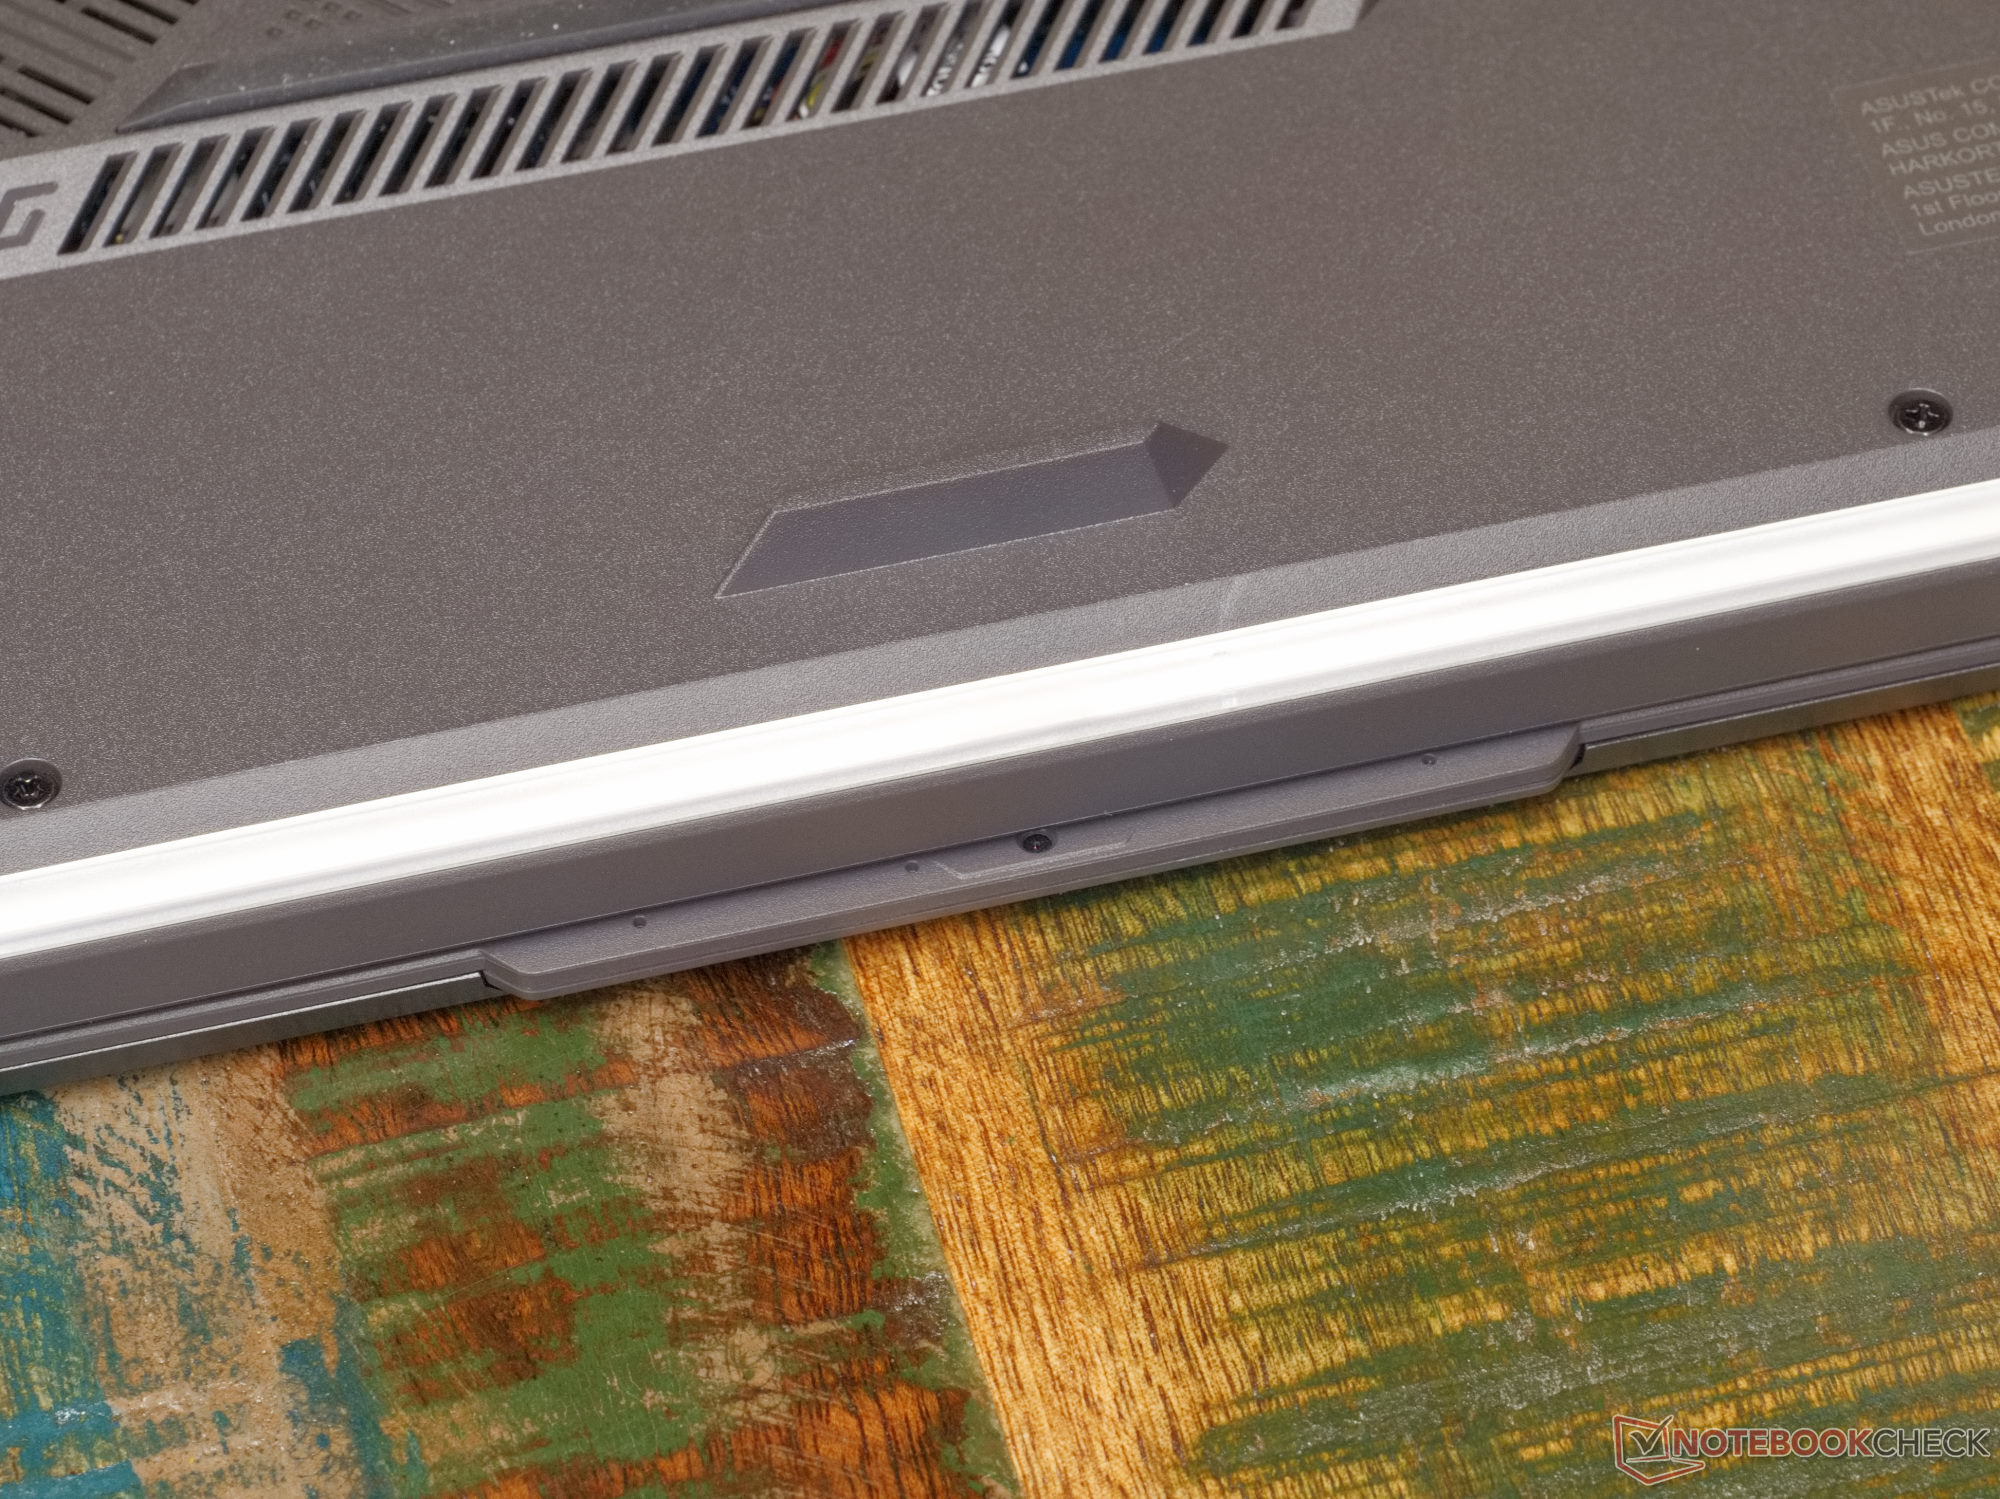
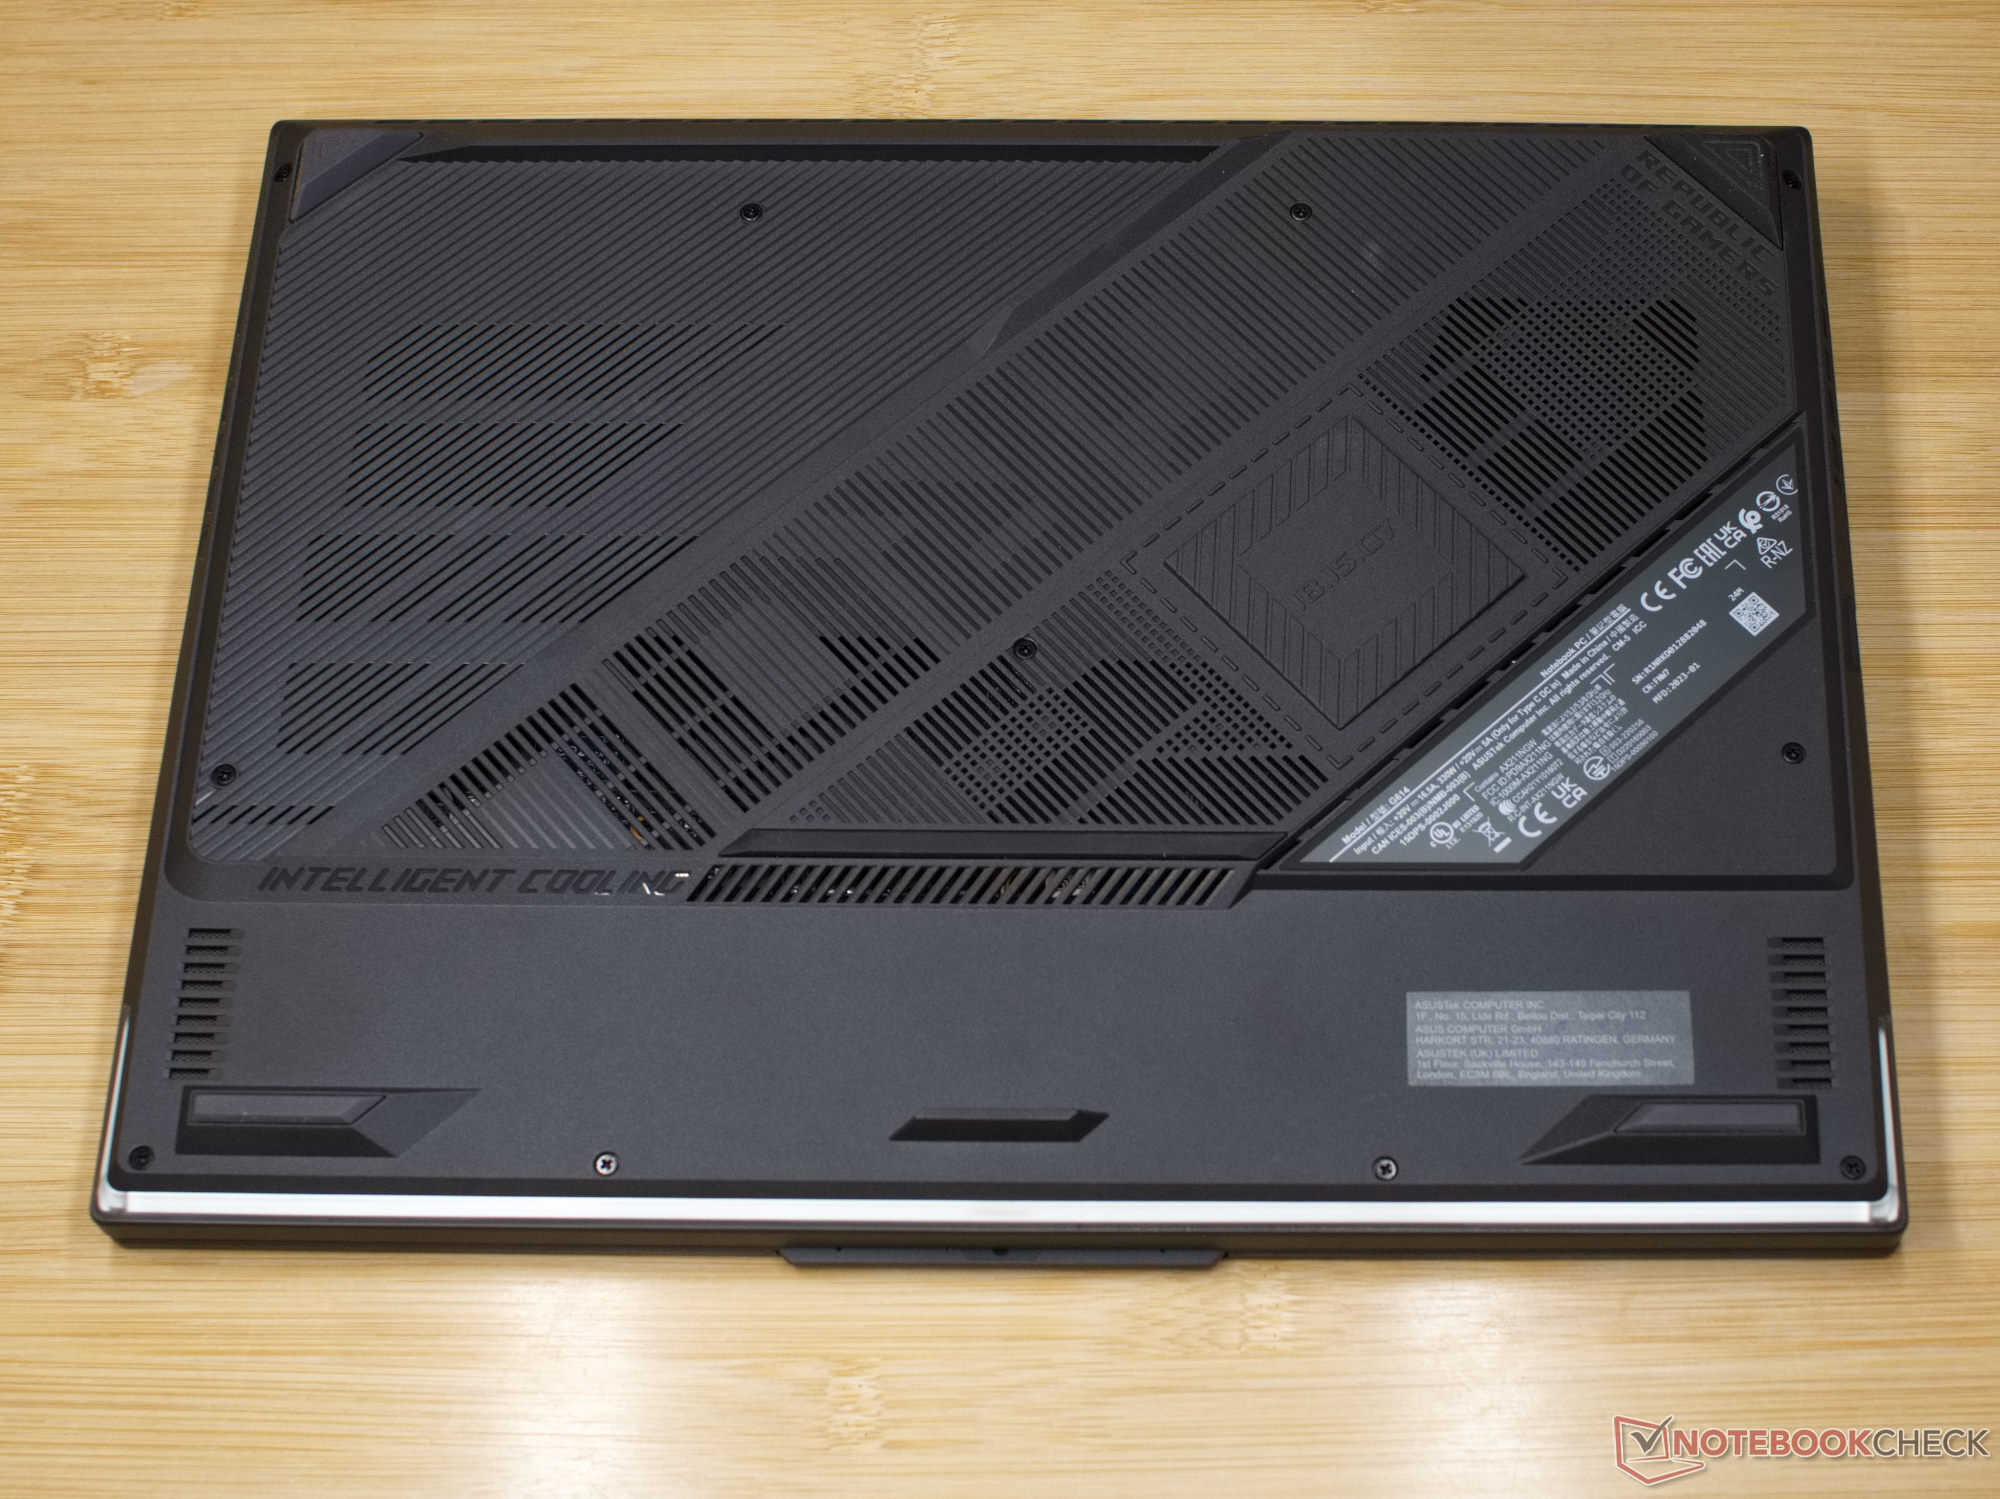
Los diseñadores del Asus ROG Strix G16 no han dejado piedra sin remover. Ningún componente del portátil carece de elementos de diseño o letras. Cada componente también tiene forma 3D de una manera u otra. Por ejemplo, la parte superior de la base es ligeramente cóncava hacia el borde. El frontal y parte de los laterales están provistos de tiras de luz RGB. El teclado también está iluminado con RGB y destaca abiertamente las zonas más importantes para el juego con teclas translúcidas. Varios tonos de gris definen la elegante carcasa. Asus incluso ha dotado a la parte inferior, poco interesante en la mayoría de portátiles, de varios elementos de diseño, algunos de los cuales también están pensados para ayudar a la refrigeración. En comparación con modelos anteriores, algunos puertos han tenido que desplazarse de la parte trasera del portátil para dejar sitio a la refrigeración, ya que ahora el disipador de calor recorre toda la parte trasera del portátil. Esto da al disipador de calor una superficie total de más de 174 mm², lo que confiere al portátil para juegos un aspecto muy agresivo. La pantalla de formato 16:10 puede abrirse hasta 130° con una sola mano. Las bisagras son bastante rígidas, pero sujetan de forma estable la pantalla de 16 pulgadas (aprox. 41 cm) en todas las posiciones imaginables.
En lugar de un diseño desenfrenado, habríamos deseado una mejor calidad y mano de obra de la carcasa. Exceptuando la tapa de la pantalla, todas las piezas son de plástico. Muchos elementos parecen excesivos y tienen huecos antiestéticos, como la barra sobre las bisagras. El módulo de la webcam es el más afectado, que, además de grandes huecos, sobresale mucho cuando está cerrado. Esto hace que la webcam parezca como si se hubiera añadido después de fabricar la carcasa. Desde la distancia, el portátil para juegos parece de alta calidad, pero muestra debilidades al examinarlo más de cerca. Al menos, el portátil de 16 pulgadas es más estable que su homólogo de 18 pulgadas; encontramos que la estabilidad de la unidad base delROG Strix G18merece muchas críticas.
Todos los portátiles para juegos de 16 pulgadas actuales son muy similares en cuanto a tamaño y peso. Casi todos los modelos pesan entre dos y tres kilos sin la fuente de alimentación. En el caso de nuestro dispositivo de prueba, la fuente de alimentación añade casi un kilogramo a la balanza, por lo que hay que cargar con un portátil que pesa alrededor de 3,3 kilogramos. Sólo elGigabyte AERO 16es bastante más delgado que el resto de portátiles de 16 pulgadas de nuestra base de datos.
Equipamiento - Thunderbolt 4 y Wi-Fi 6E rápido
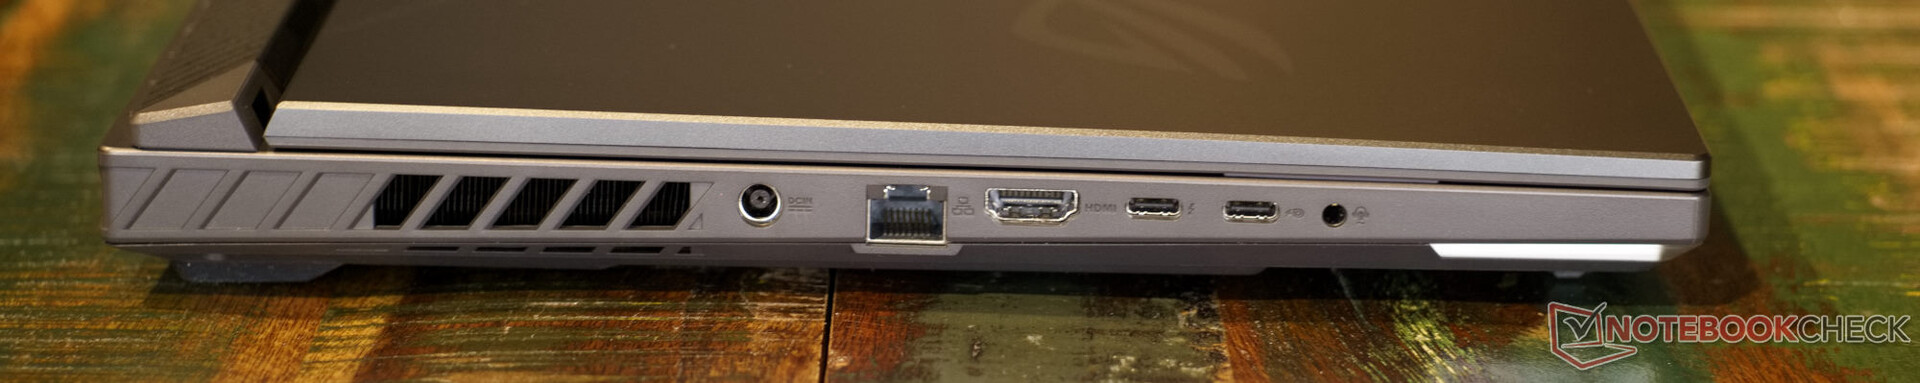
La mayoría de los puertos del ROG Strix G16 se concentran en el lado izquierdo del portátil. A la derecha, sólo hay dos puertos USB. Las dos tomas USB Type-C de la izquierda comparten sus tareas: la trasera soporta Thunderbolt 4 y la frontal Power Delivery, mientras que ambas soportan DisplayPort. El suministro de energía por USB-C es bastante limitado. El portátil requiere 20 voltios de potencia y consume un máximo de 100 vatios. Por tanto, no se puede acceder a todo el rendimiento del portátil por USB-C Power Delivery.

Comunicación
El módulo Intel Wi-Fi 6E AX211 asegura conexiones rápidas entre la red local y el portátil de juego Asus y es, por tanto, de última generación. Las velocidades de carga y descarga están ligeramente por encima de la media, pero hemos visto resultados aún mejores con el módulo WLAN-ax de Intel.
Cámara web
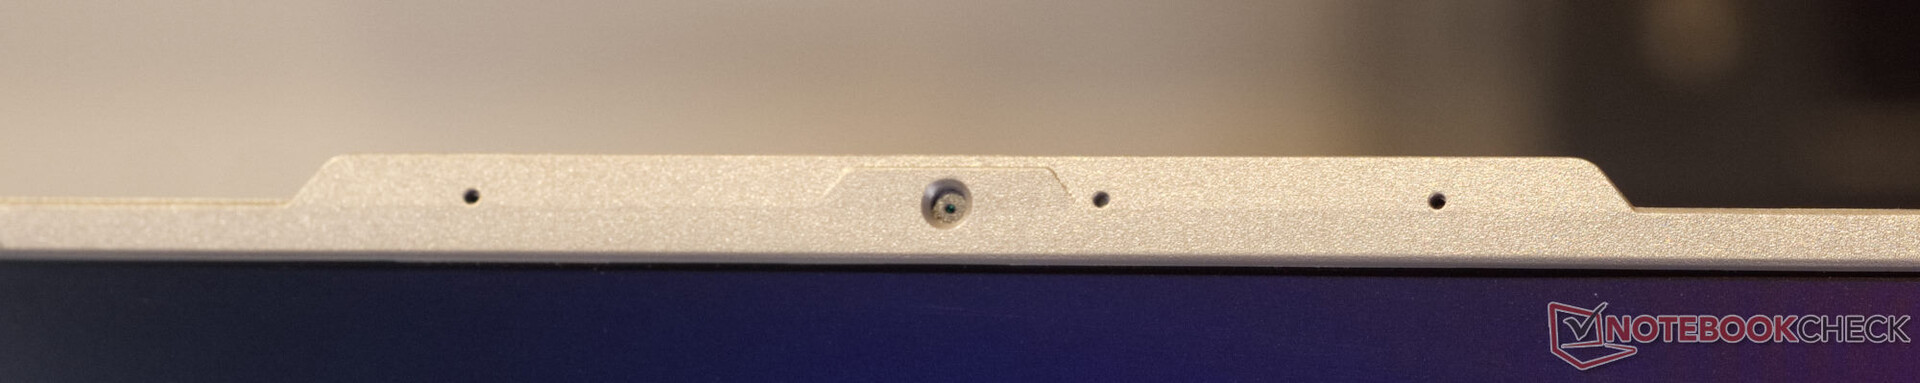
Con la calidad de imagen de una cámara estenopeica, la webcam 720p de este portátil no rinde bien. Sólo con buena iluminación las imágenes son algo utilizables. De lo contrario, la supresión de ruido se traga todos los detalles. Los detalles también son muy borrosos hacia los bordes. Al menos los tres micrófonos junto a la webcam ofrecen un sonido bastante bueno.


Seguridad
No hay escáner de huellas dactilares ni otras características de seguridad. Solo dispone de las medidas de seguridad del Intel Core i9, como TPM 2.0.
Accesorios
El portátil para juegos no viene con mucho más que una fuente de alimentación de 330 vatios y algo de documentación. Asus prescinde en gran medida del plástico para el embalaje, y sólo envuelve el portátil en una película protectora.
Mantenimiento
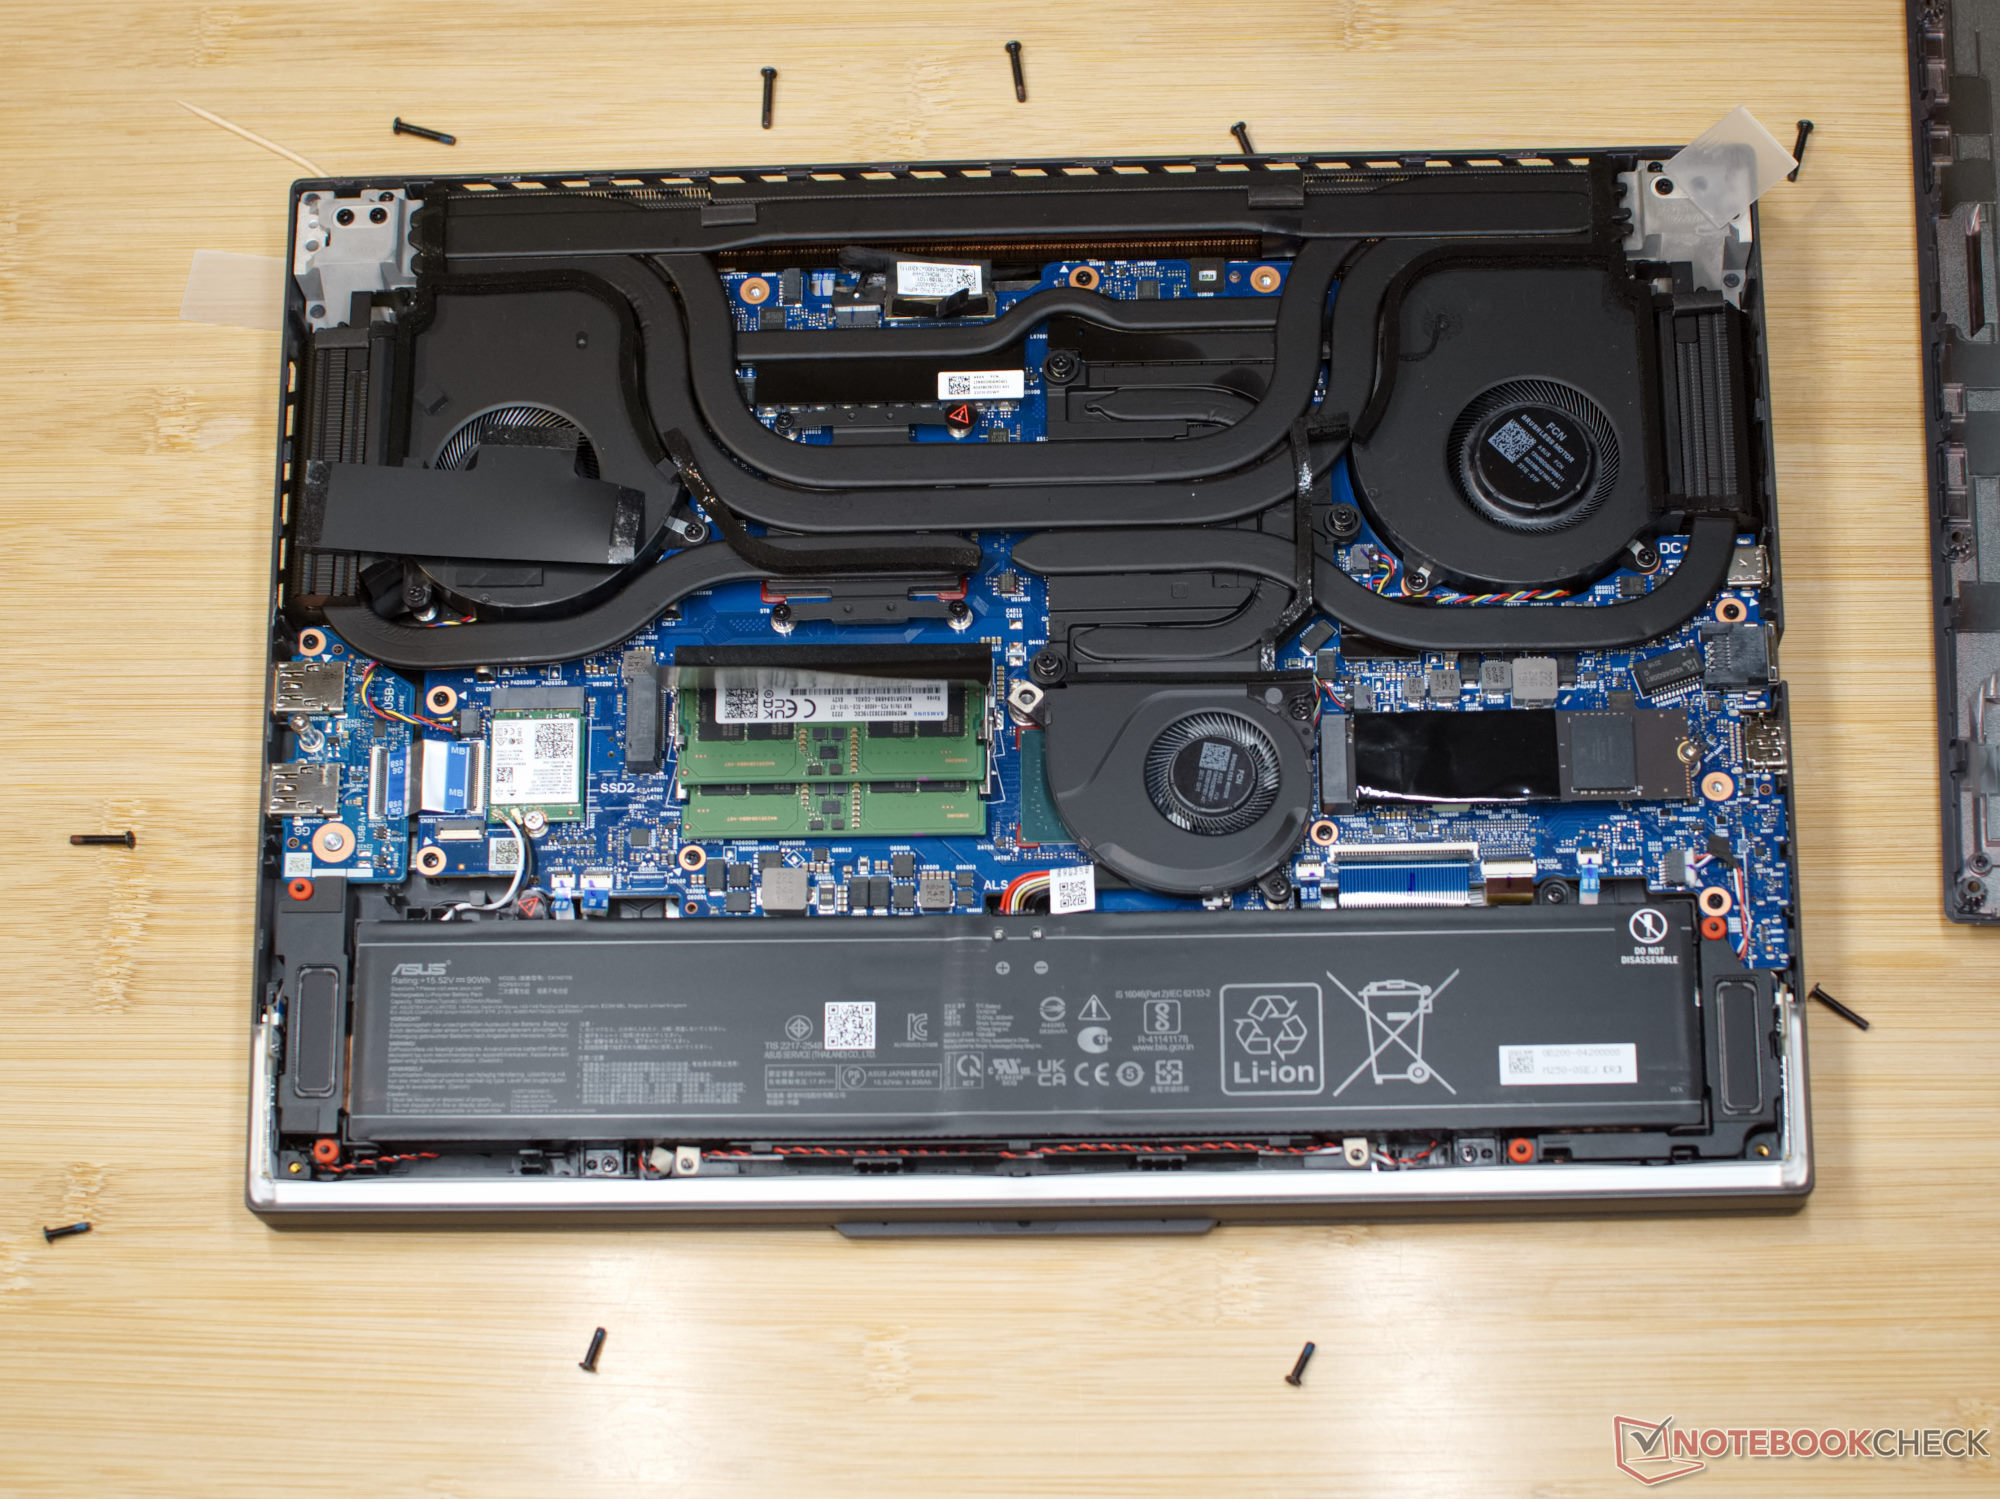
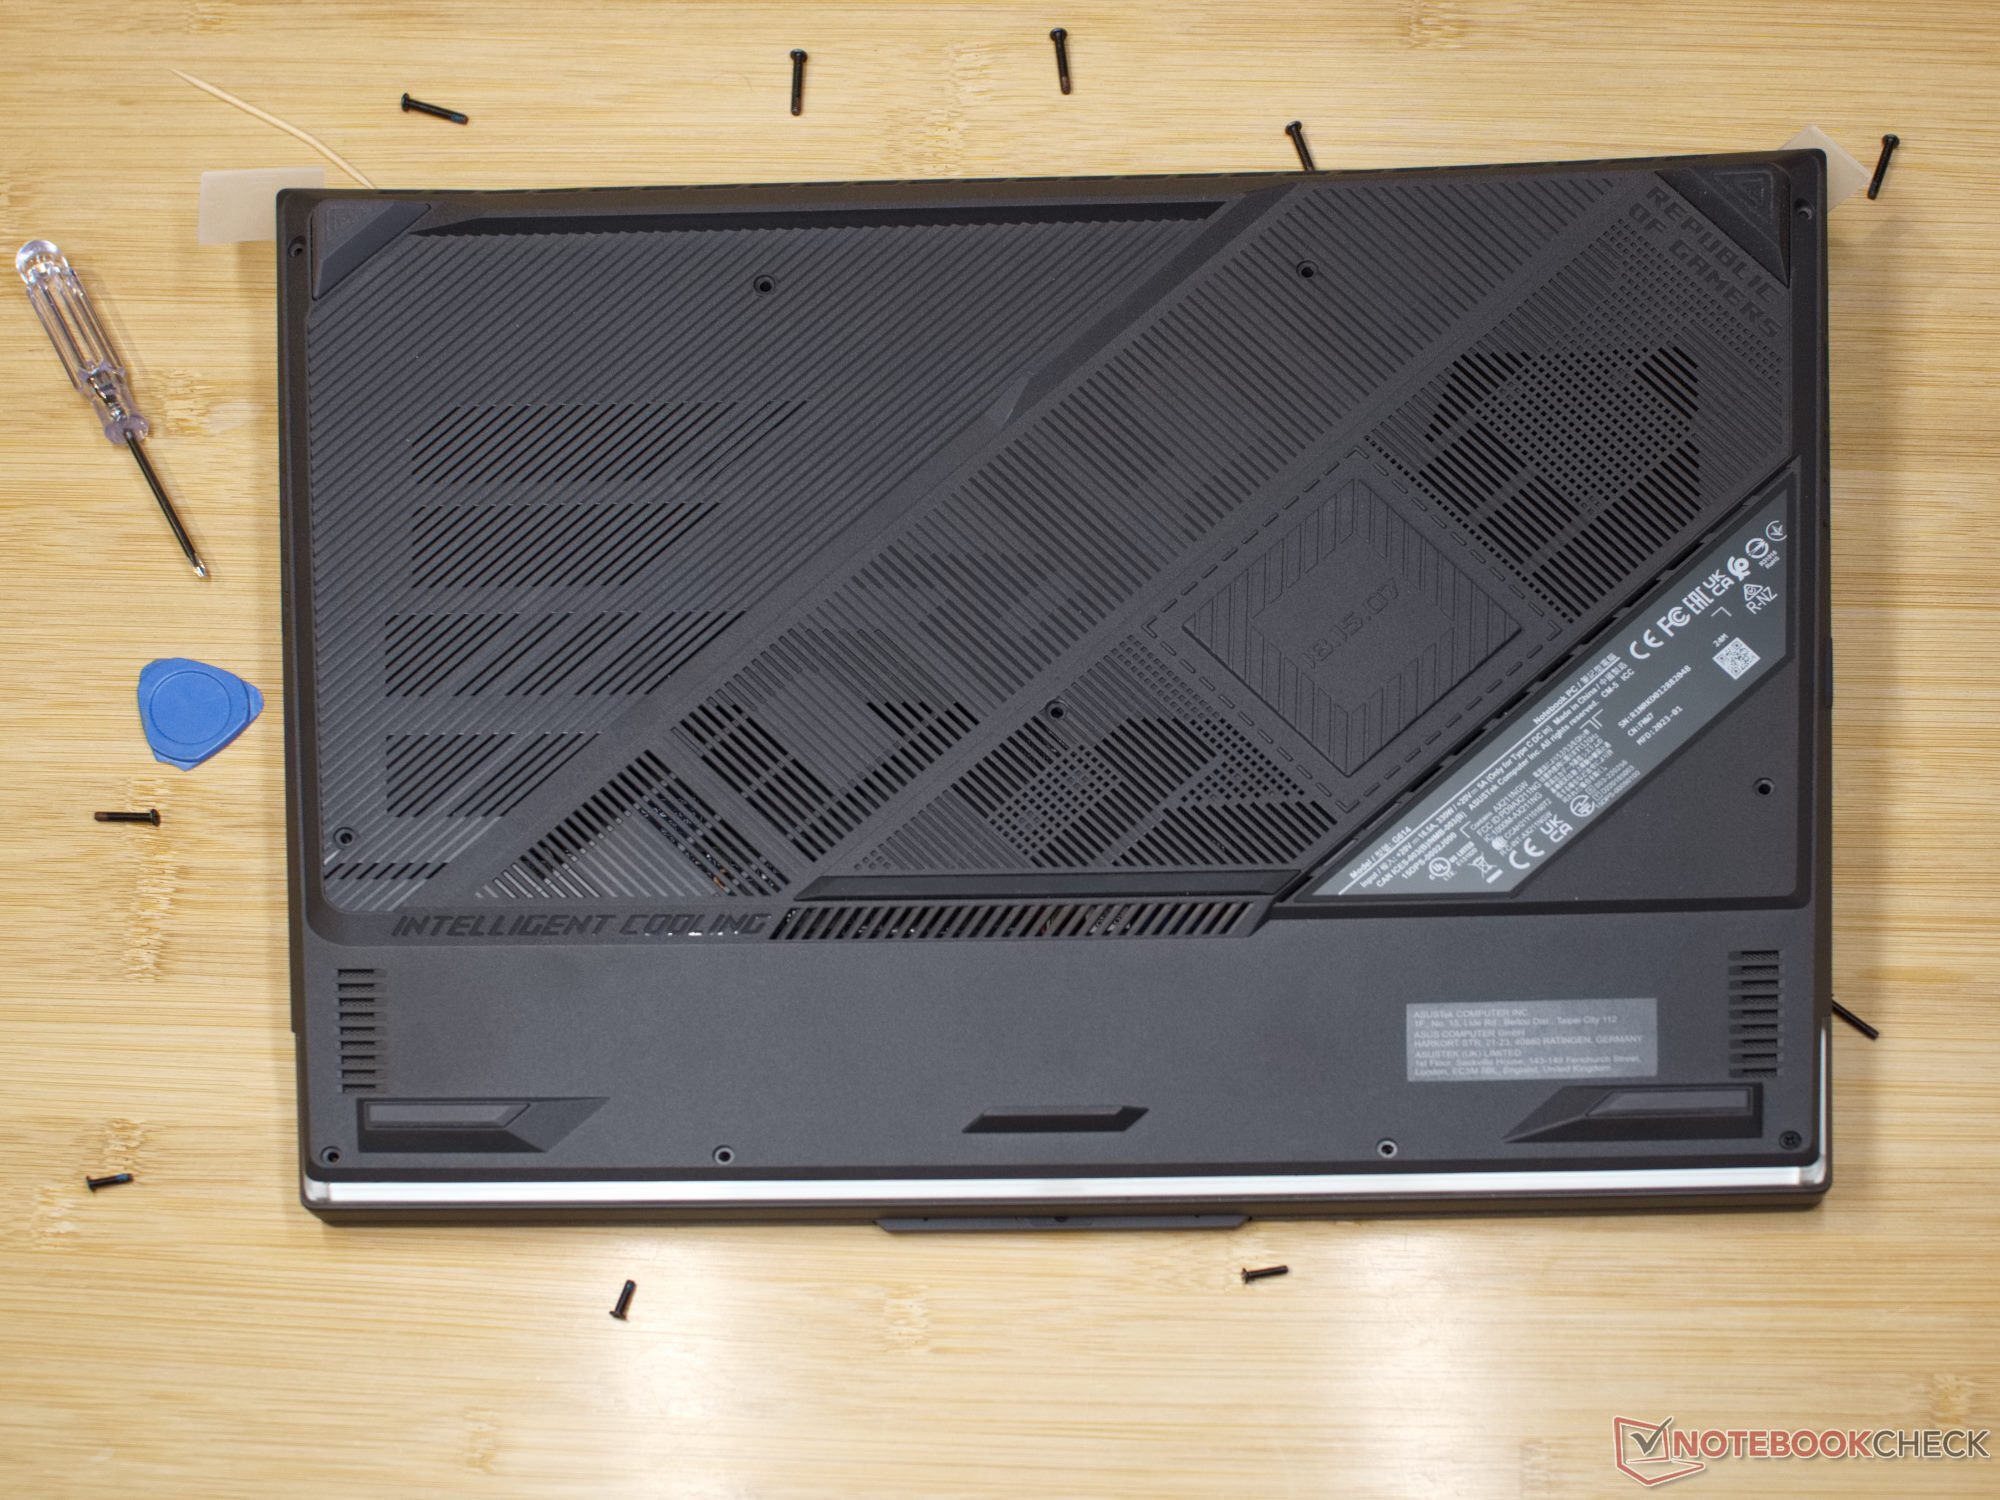
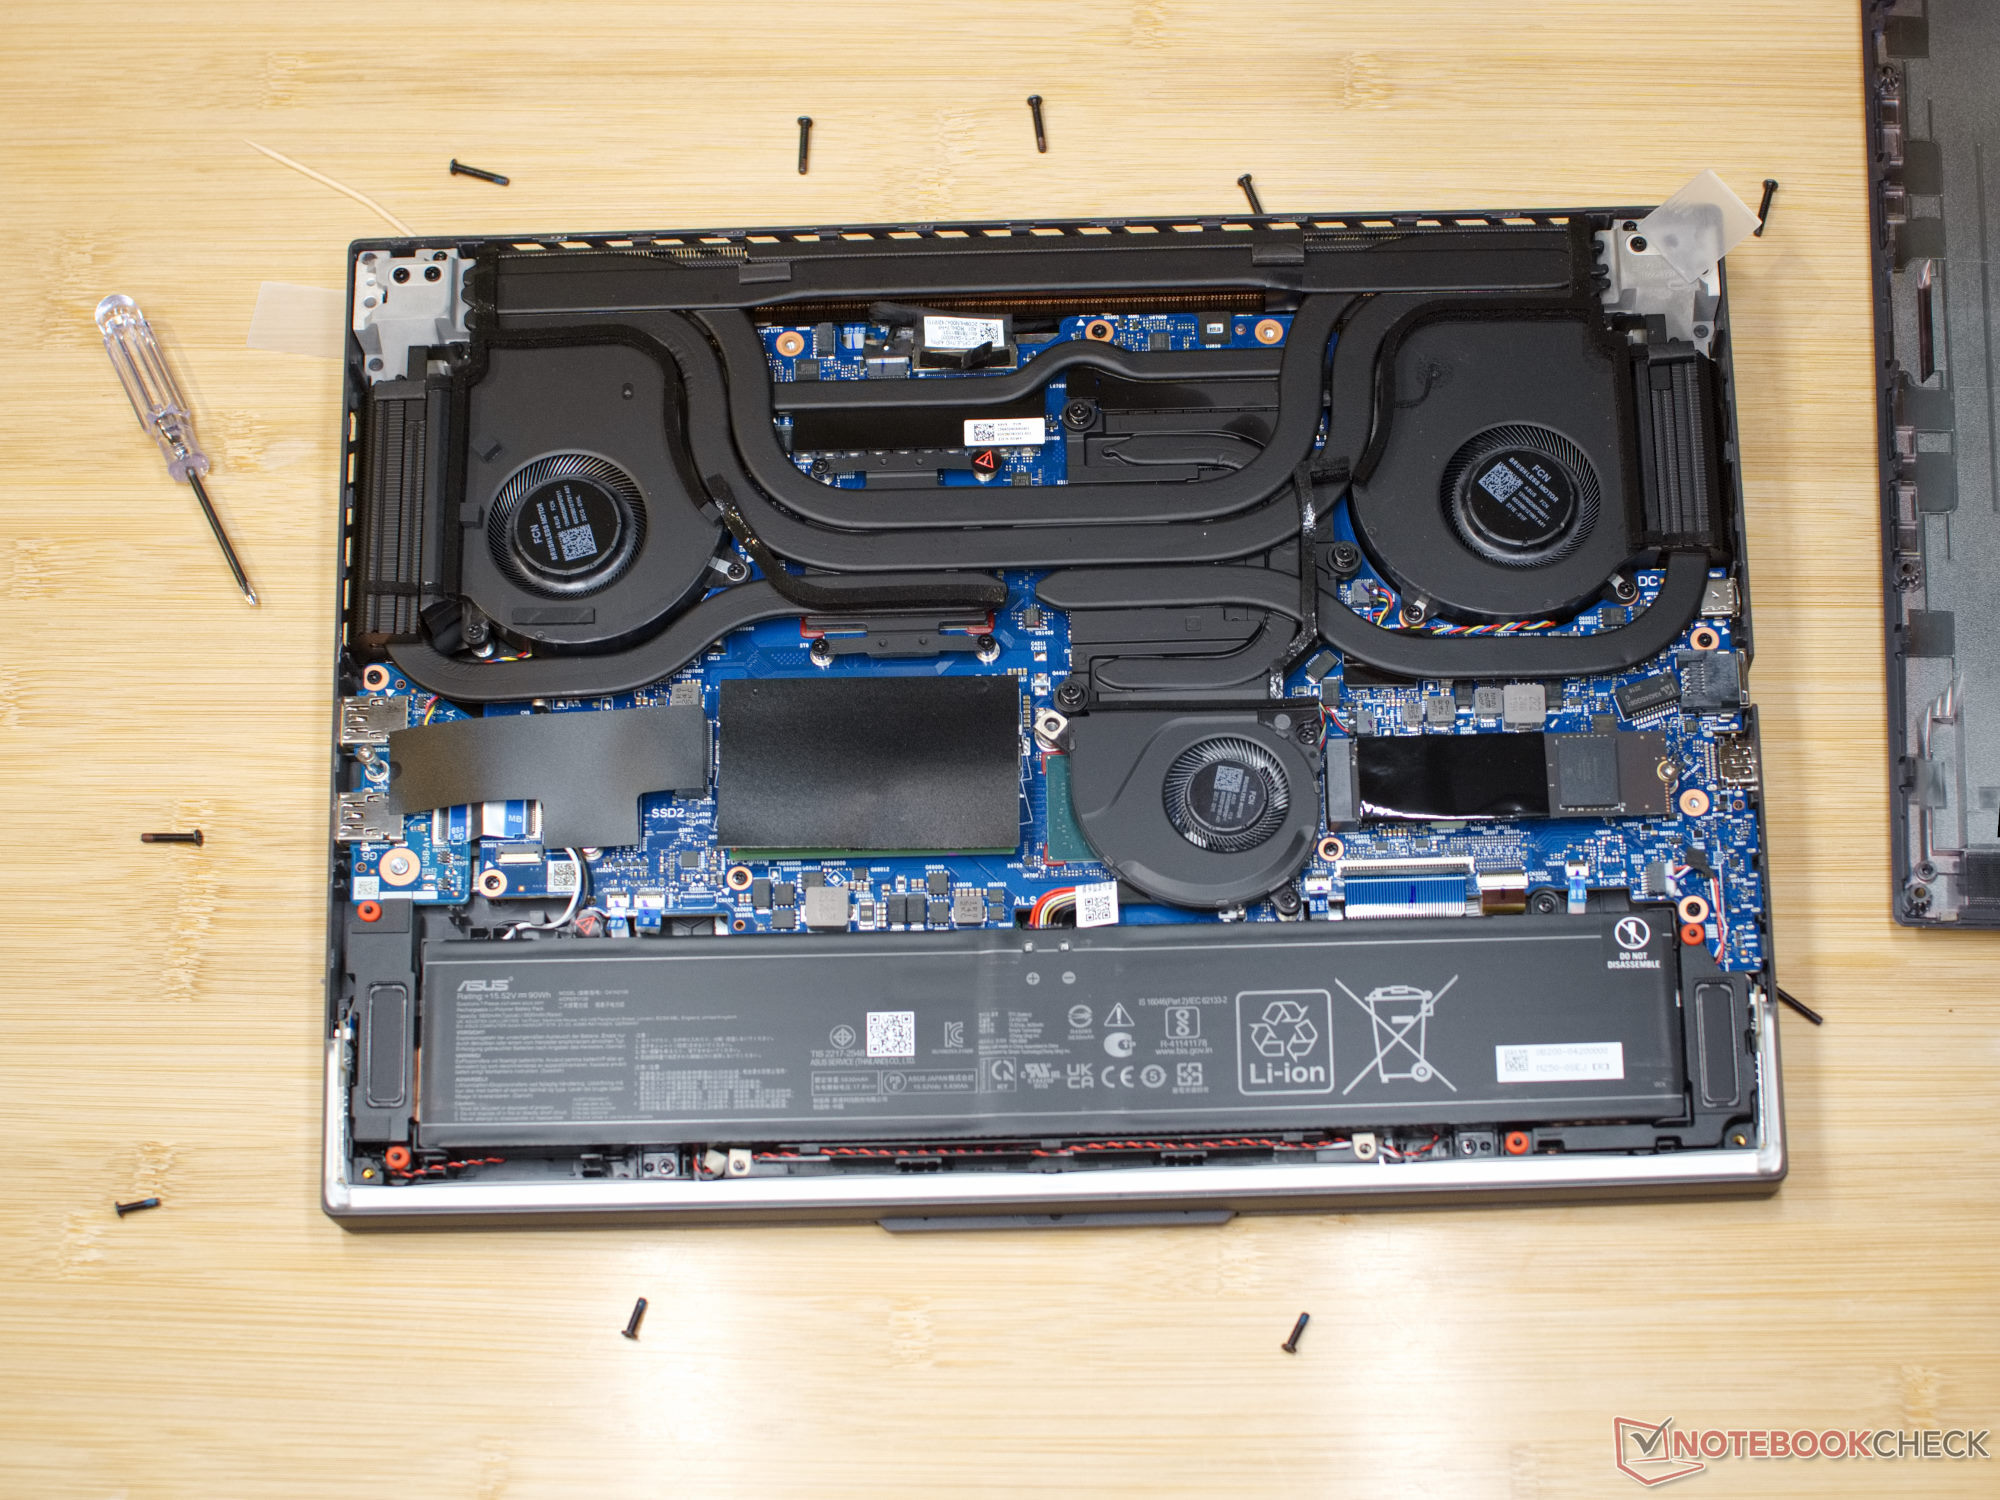
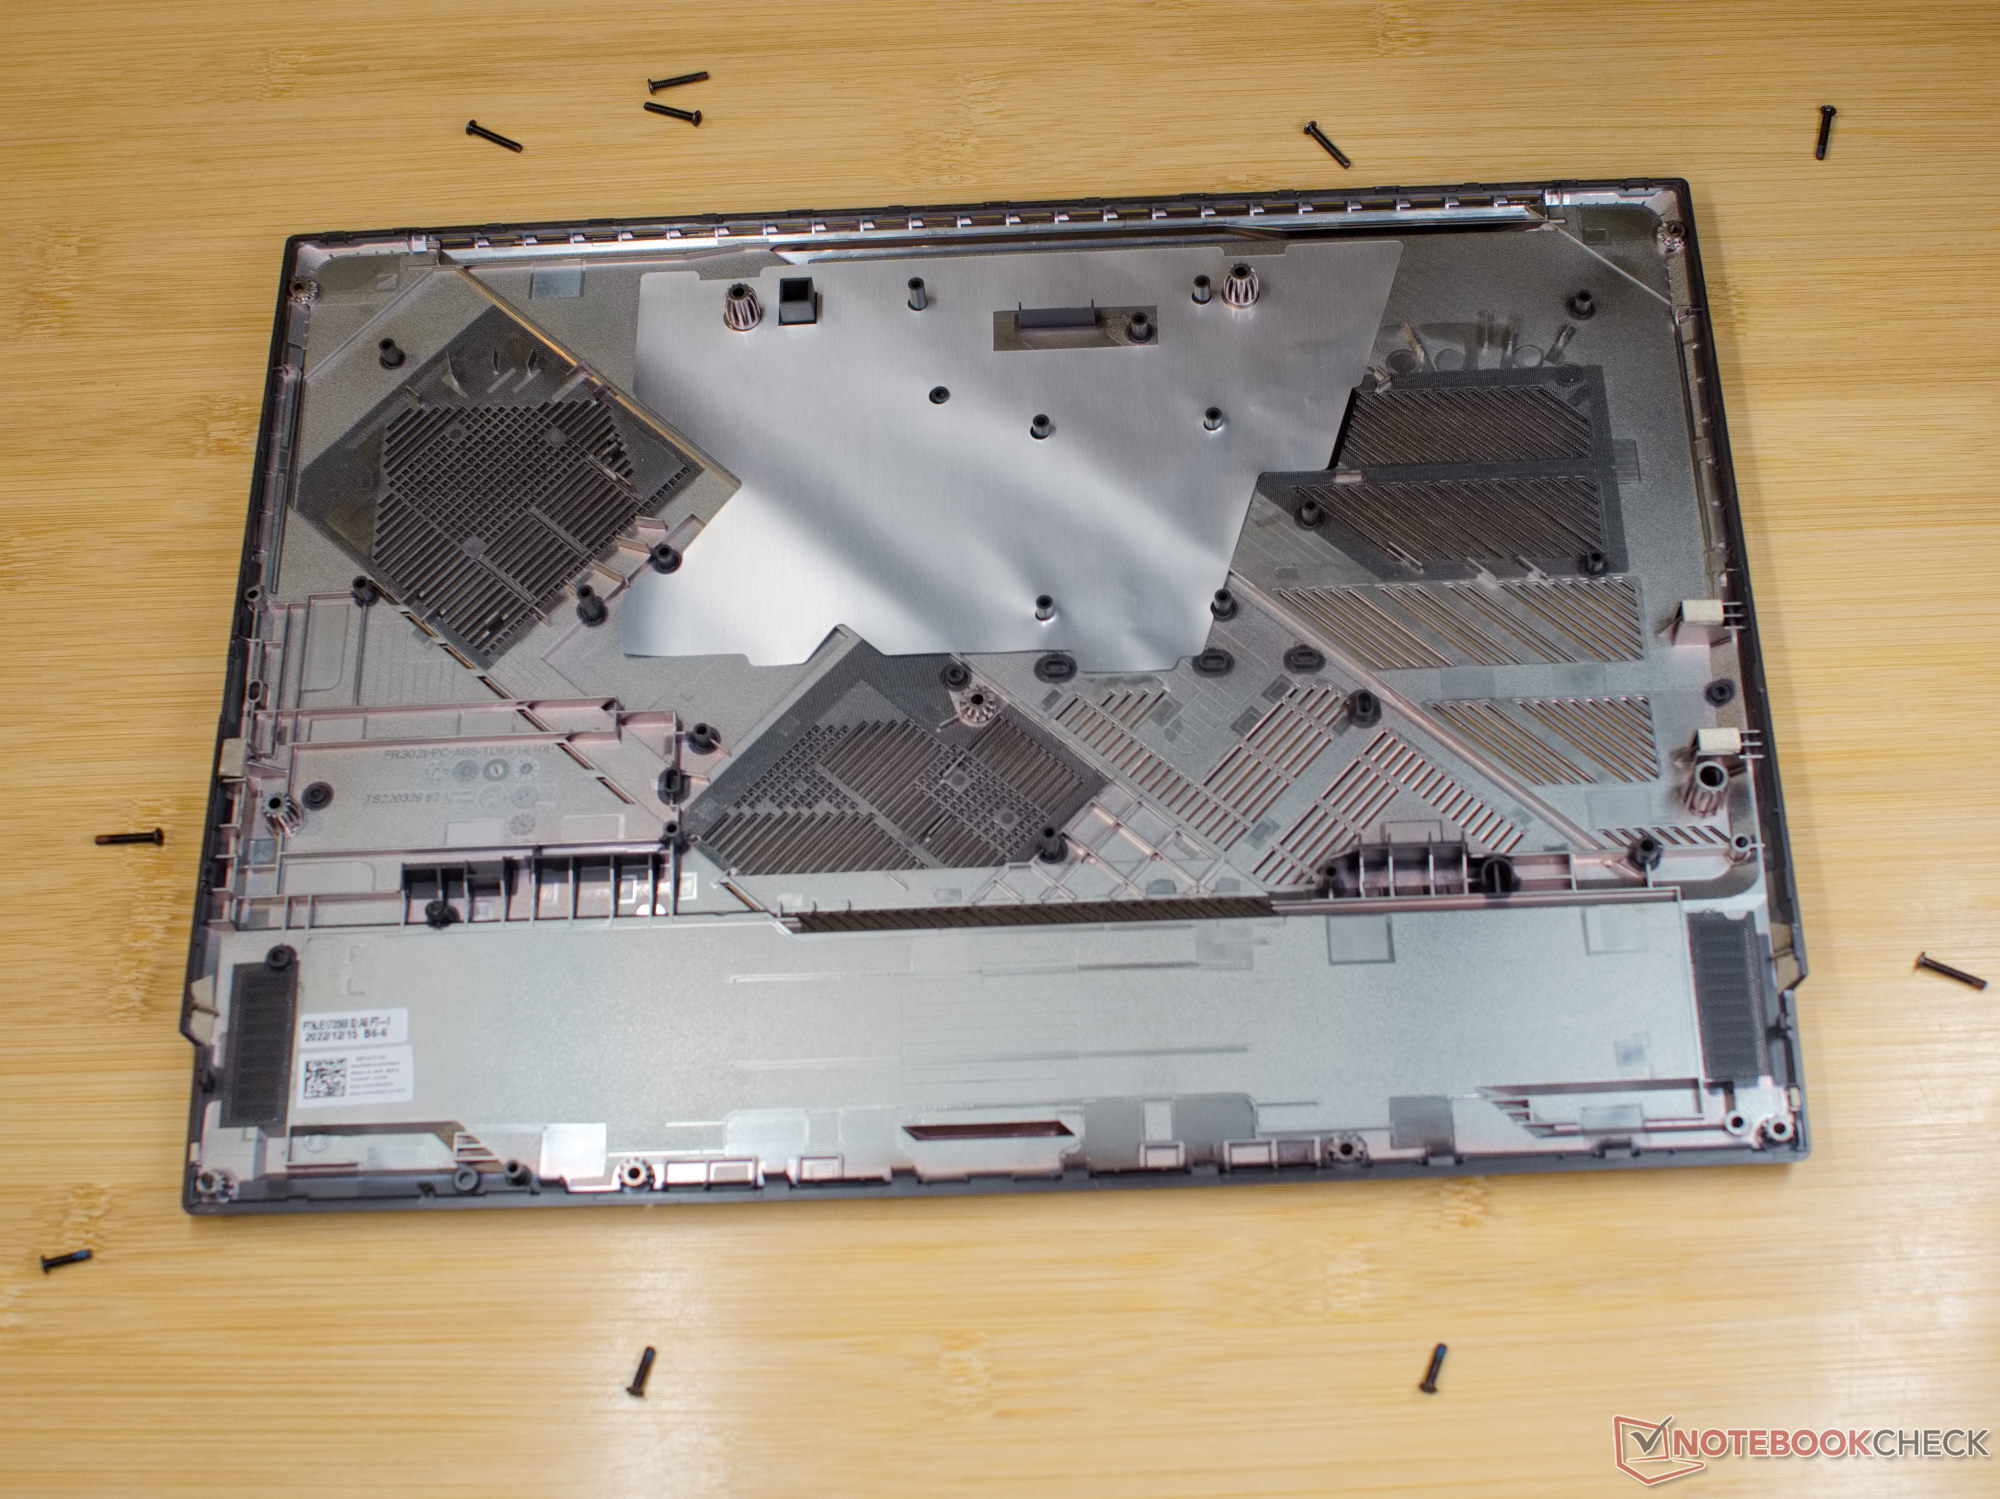
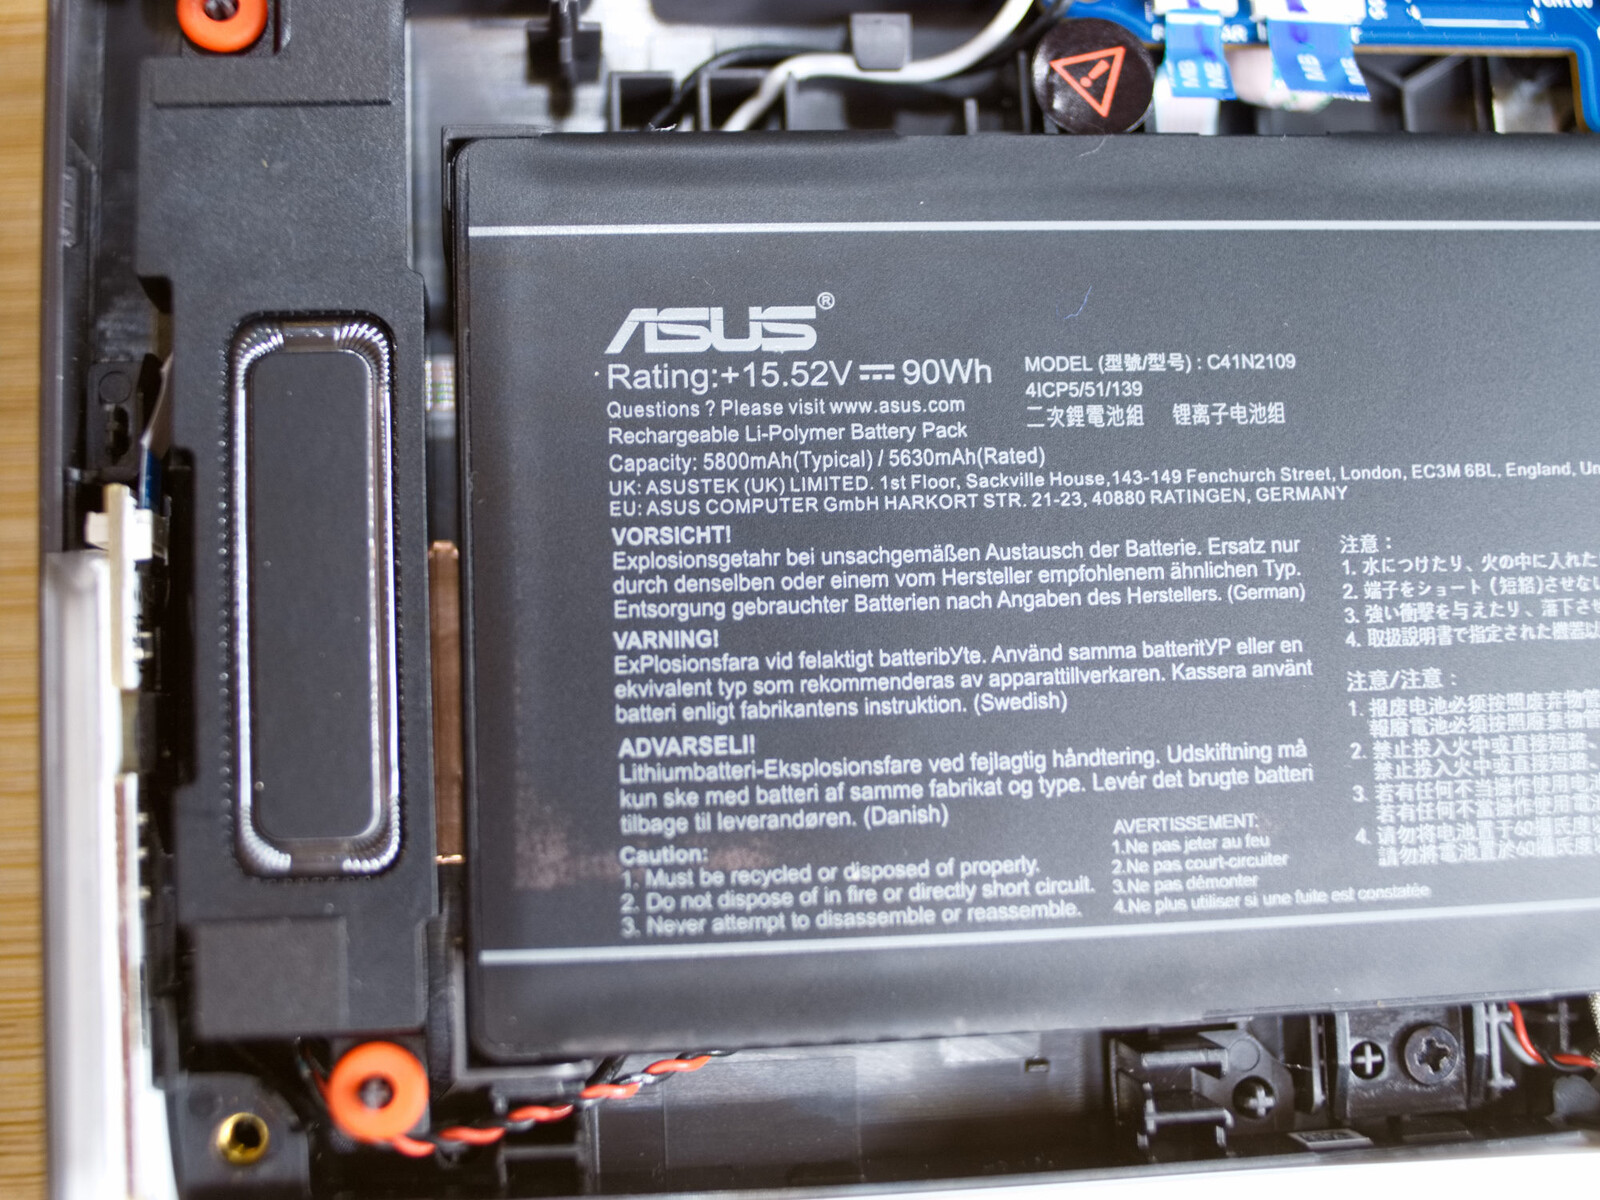
Once tornillos PH1 sujetan la placa base del portátil para juegos. Recomendamos trabajar desde la parte trasera del portátil hacia la delantera y aflojar el tornillo de la parte delantera derecha en último lugar. Esto se debe a que tiene un anillo de bloqueo que asegura que parte de la tapa se levante y así proporciona un fácil acceso para una herramienta de apertura de plástico. Varios clips mantienen la tapa en su sitio. La herramienta se utiliza para abrir el fondo por completo. Encontrará información más detallada sobre cómo abrir el portátil y qué componentes pueden sustituirse en el manual de mantenimiento de Asus https://dlcdnets.asus.com/pub/ASUS/GamingNB/G834JY/E20679_G614J_G634J_G814J_G834J_SM_WEB.pdf?model=ROG%20Strix%20G16%20(2023)%20G614.
Dentro del portátil nos encontramos con un dispositivo bastante fácil de mantener. Encontramos dos ranuras RAM (ambas ocupadas), dos ranuras M.2 (una ocupada) y el módulo WLAN reemplazable. La batería de 90Wh también es fácil de reemplazar, ya que no está pegada.
Garantía
Asus ofrece una garantía de dos años para el ROG Strix G16 en Europa. Esto puede diferir en otras regiones, por lo que los compradores interesados deberían volver a comprobarlo antes de la compra.
Dispositivos de entrada - Buen teclado, pero no mecánico
Teclado
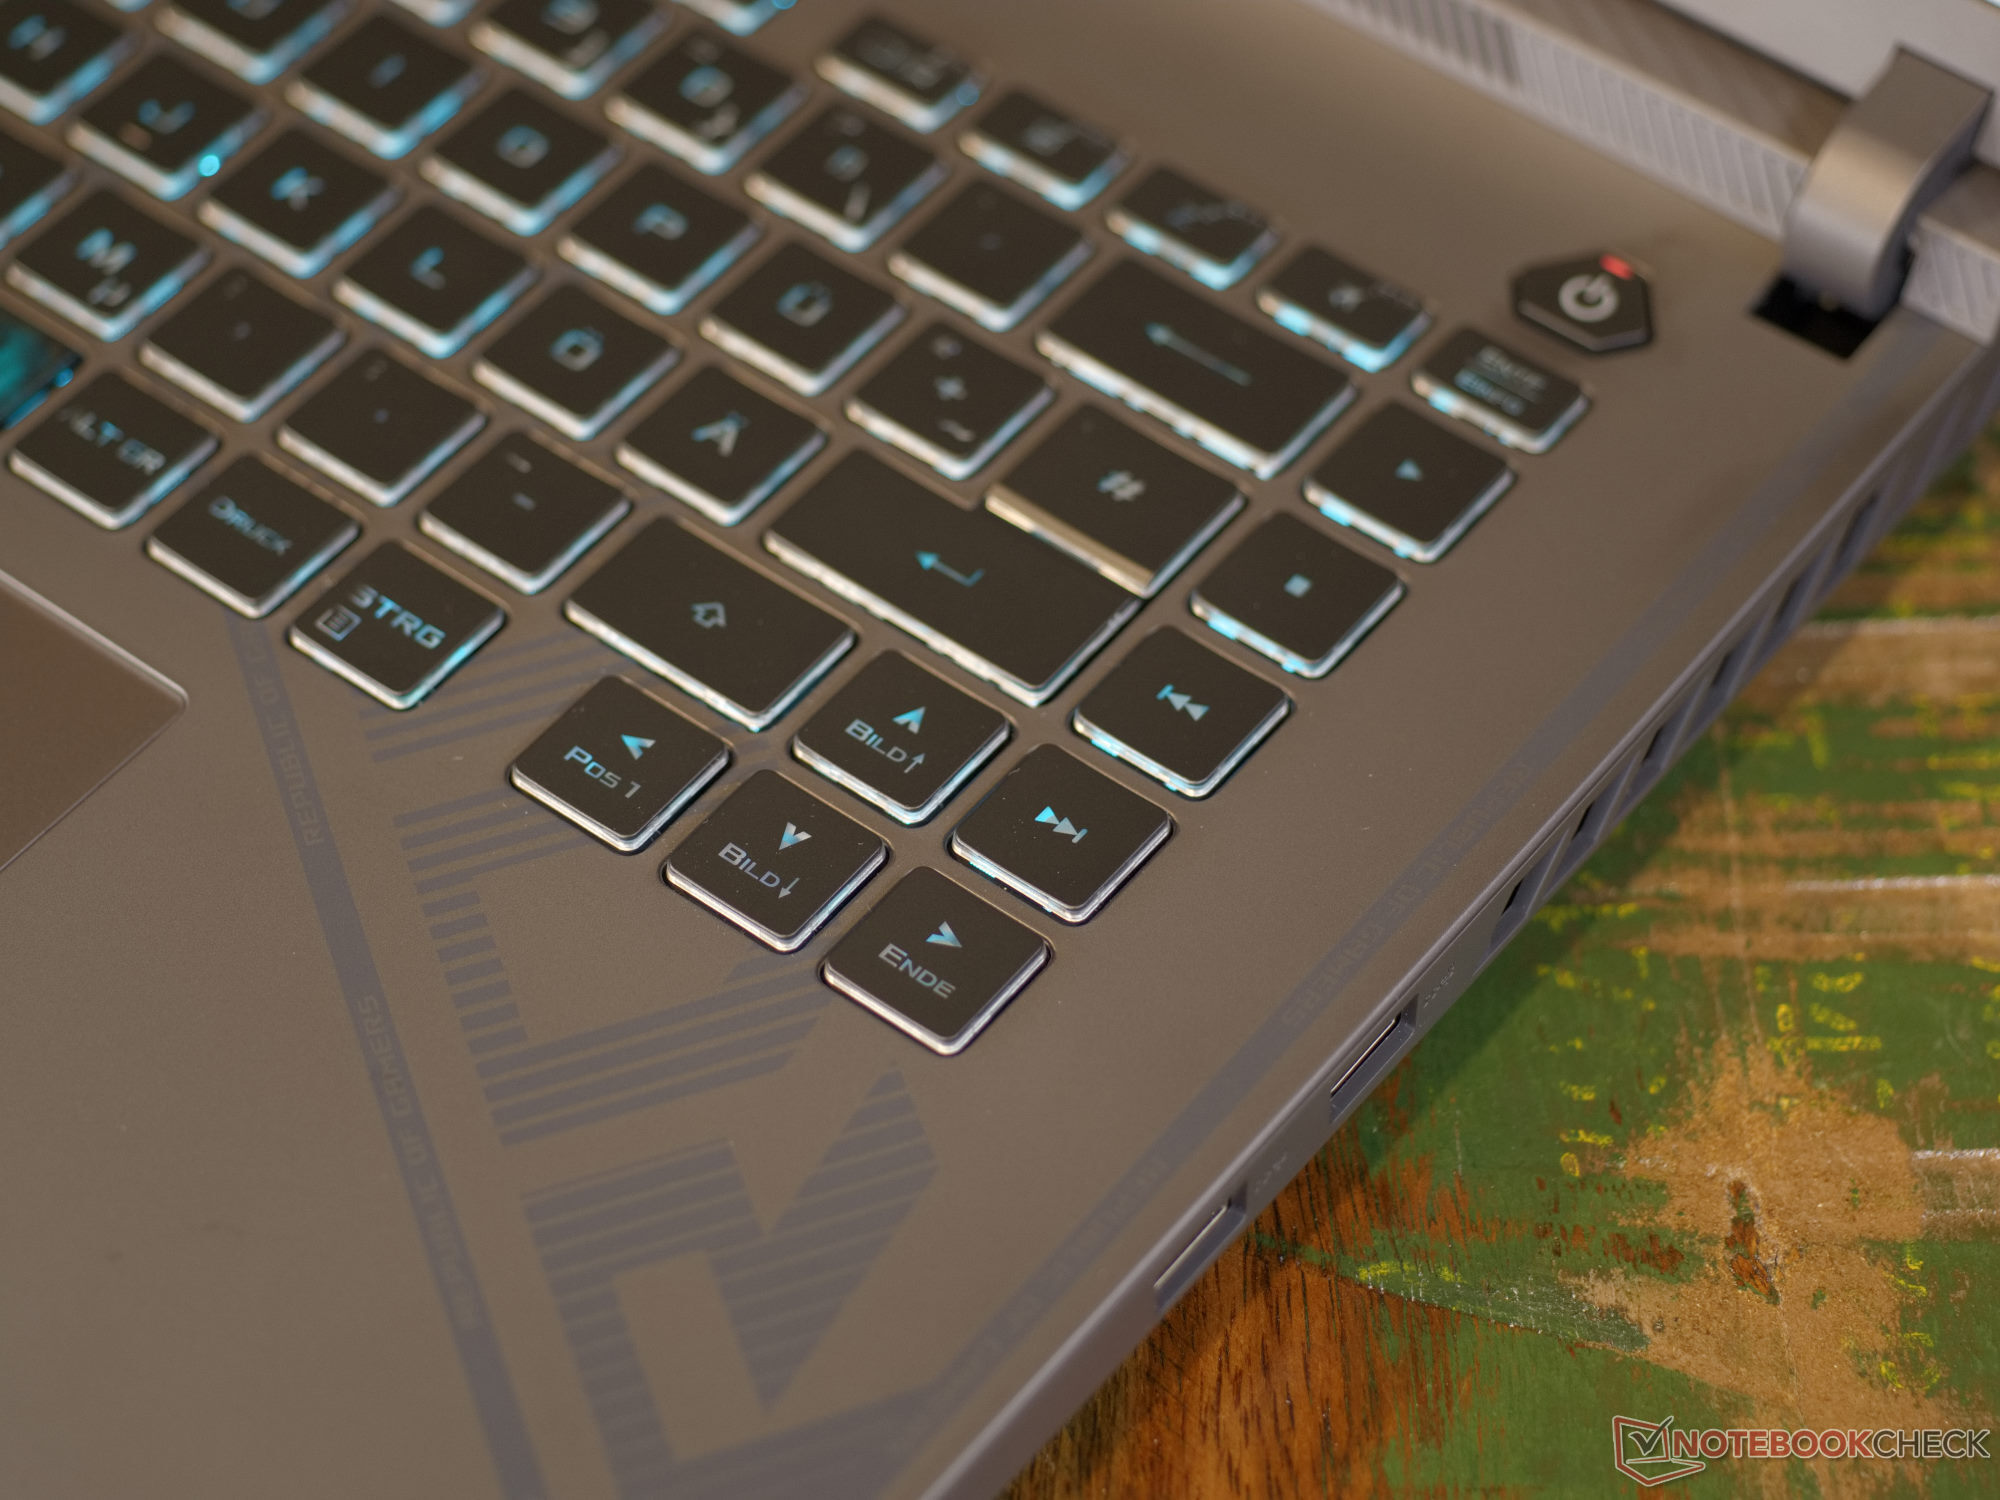
El ROG Strix G16 está equipado con un teclado chiclet, que sin embargo proporciona una agradable sensación de tecleo gracias a su recorrido de tecla de 1.9 mm y una retroalimentación háptica decente. El diseño del teclado es el típico de los portátiles para juegos, con iluminación RBG instalada. Además, las teclas más importantes para jugar están resaltadas. Todos los botones se han diseñado como teclas de tamaño normal, lo que significa que las teclas de flecha del lado derecho están bastante apretadas. En el calor del momento, podrías fácilmente pulsar la tecla equivocada aquí. El propio portátil habría tenido espacio suficiente para desplazar las teclas de dirección un poco hacia abajo. Al escribir textos, sin embargo, tienes que acostumbrarte a la tecla shift acortada
Encima de las teclas de función hay cinco teclas más a las que se pueden asignar diversas macros. Sin embargo, las teclas de macro están muy lejos del reposamanos. Dependiendo del tamaño de tu mano, son difíciles de alcanzar sin cambiar la posición de la mano.
Panel táctil
Con 13 × 8,5 cm, el clickpad del portátil para juegos es agradablemente grande y está colocado de tal forma que no debería interferir con el funcionamiento del teclado. Gracias a su superficie de vidrio, debería conservar su sedosa textura mate durante mucho tiempo. Tiene un tacto agradable y buenas propiedades de deslizamiento. El propio clickpad responde con rapidez y precisión a todas las entradas, hasta las esquinas.

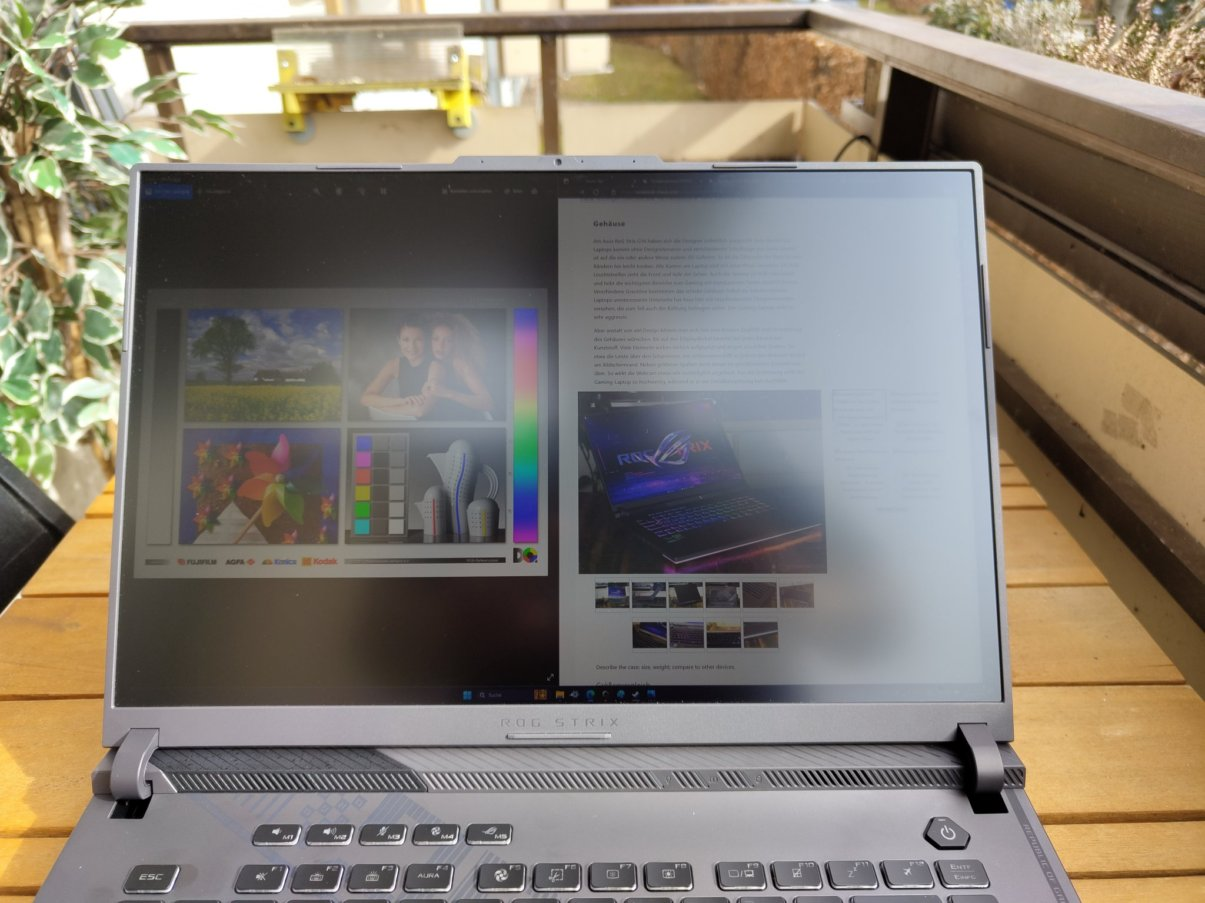
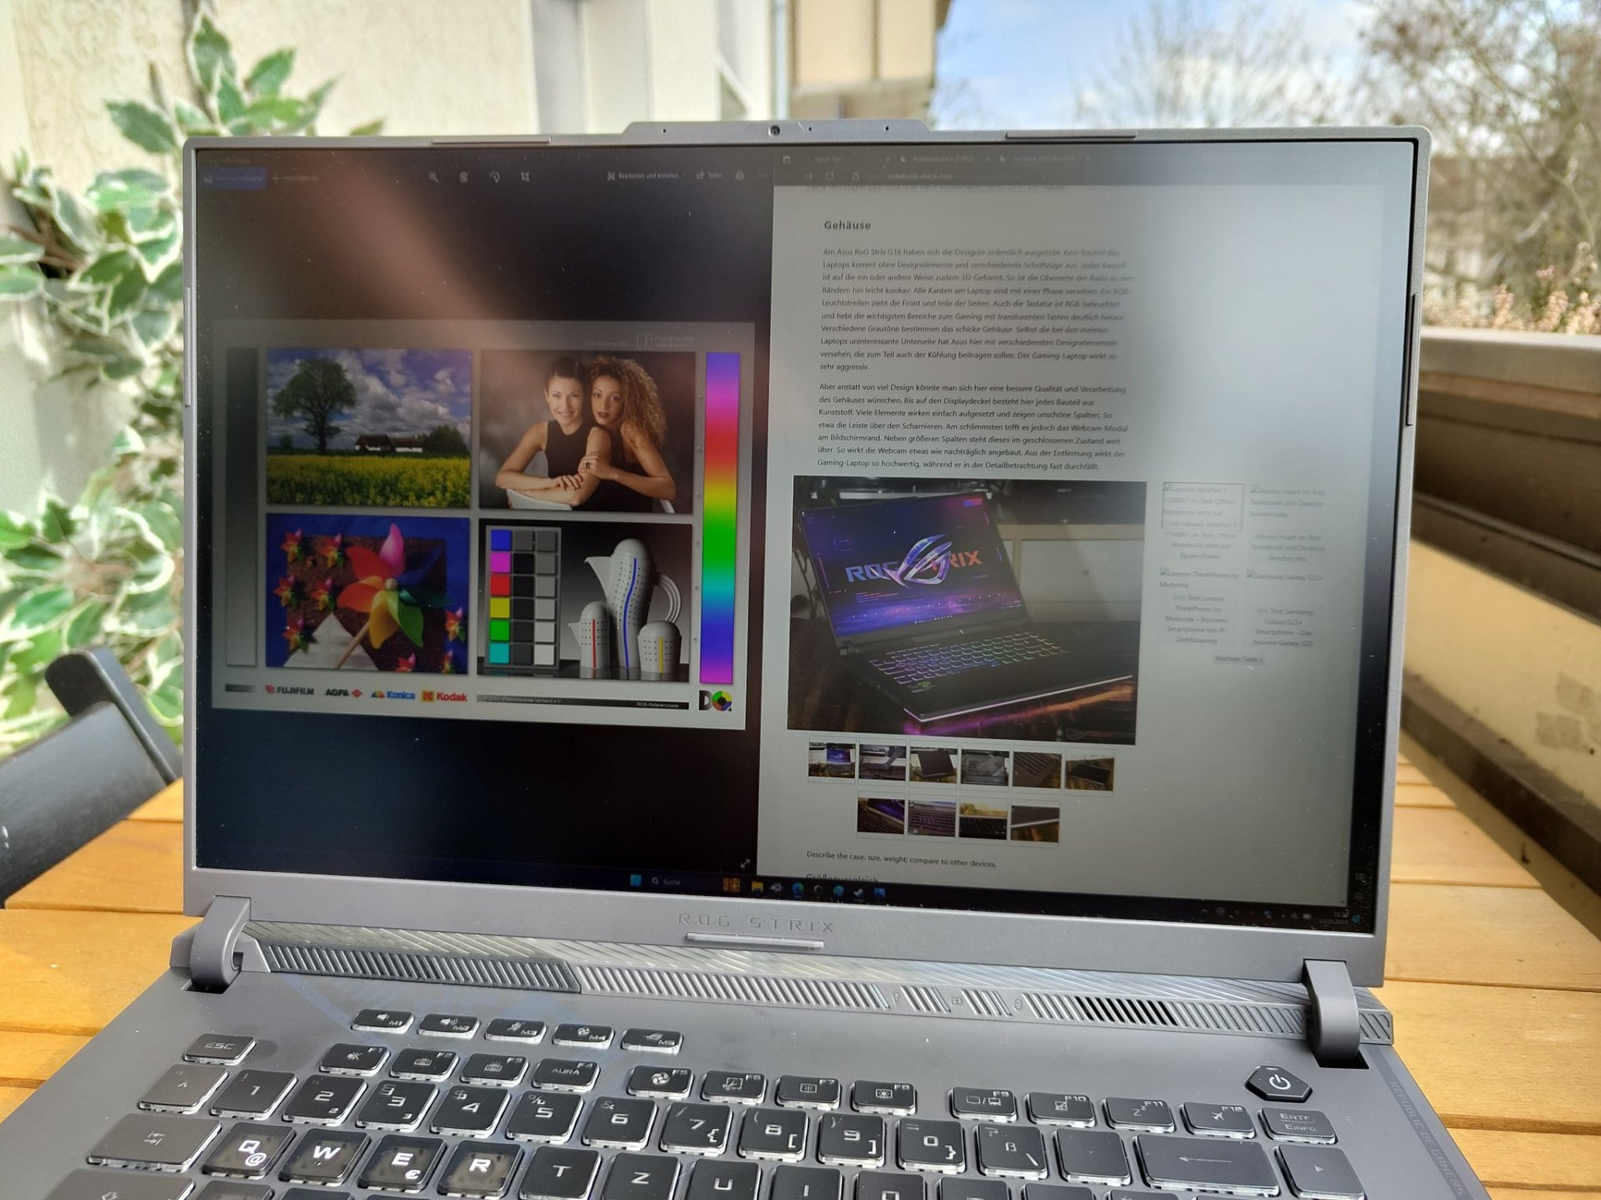
Pantalla - QHD+ con capacidad de respuesta en formato 16:10
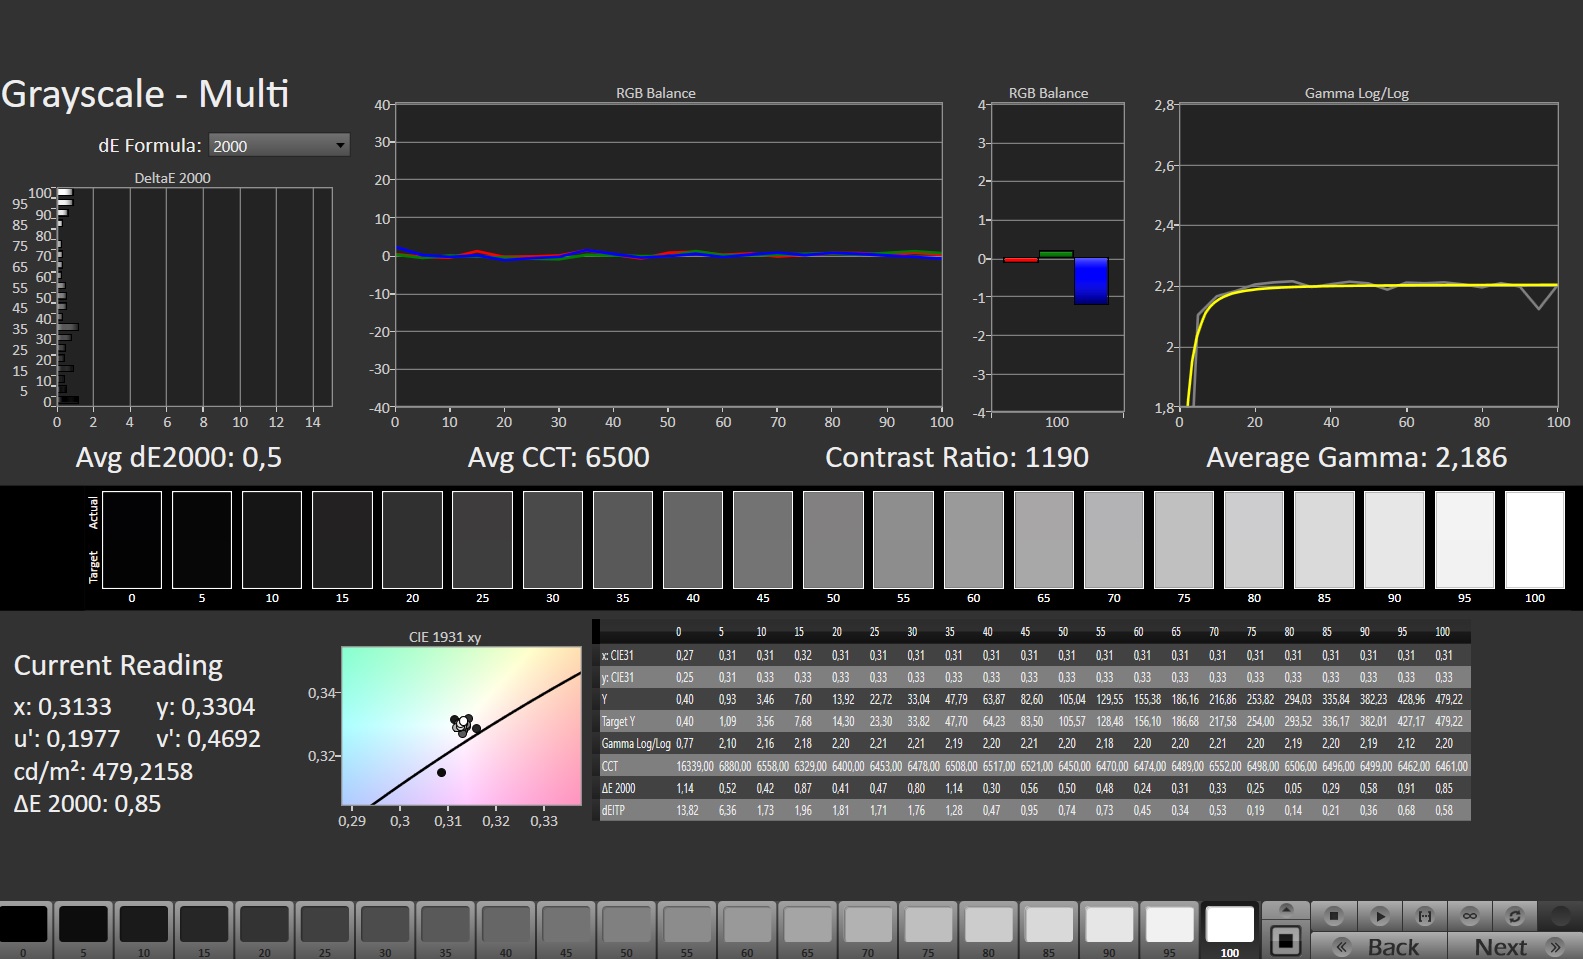
El display IPS ofrece resolución QHD+ en formato 16:10 y una frecuencia de refresco de 240 Hz. Sin embargo, el panel no logra el tiempo de respuesta anunciado de 3 ms; en algunos casos, el valor incluso se duplica. El brillo tampoco llega a los 500 cd/m² que promete Asus en la hoja de datos. En general, seguimos teniendo un display sólido con una superficie mate y una alta cobertura del espacio de color DisplayP3. No se detectaron errores visibles de iluminación.
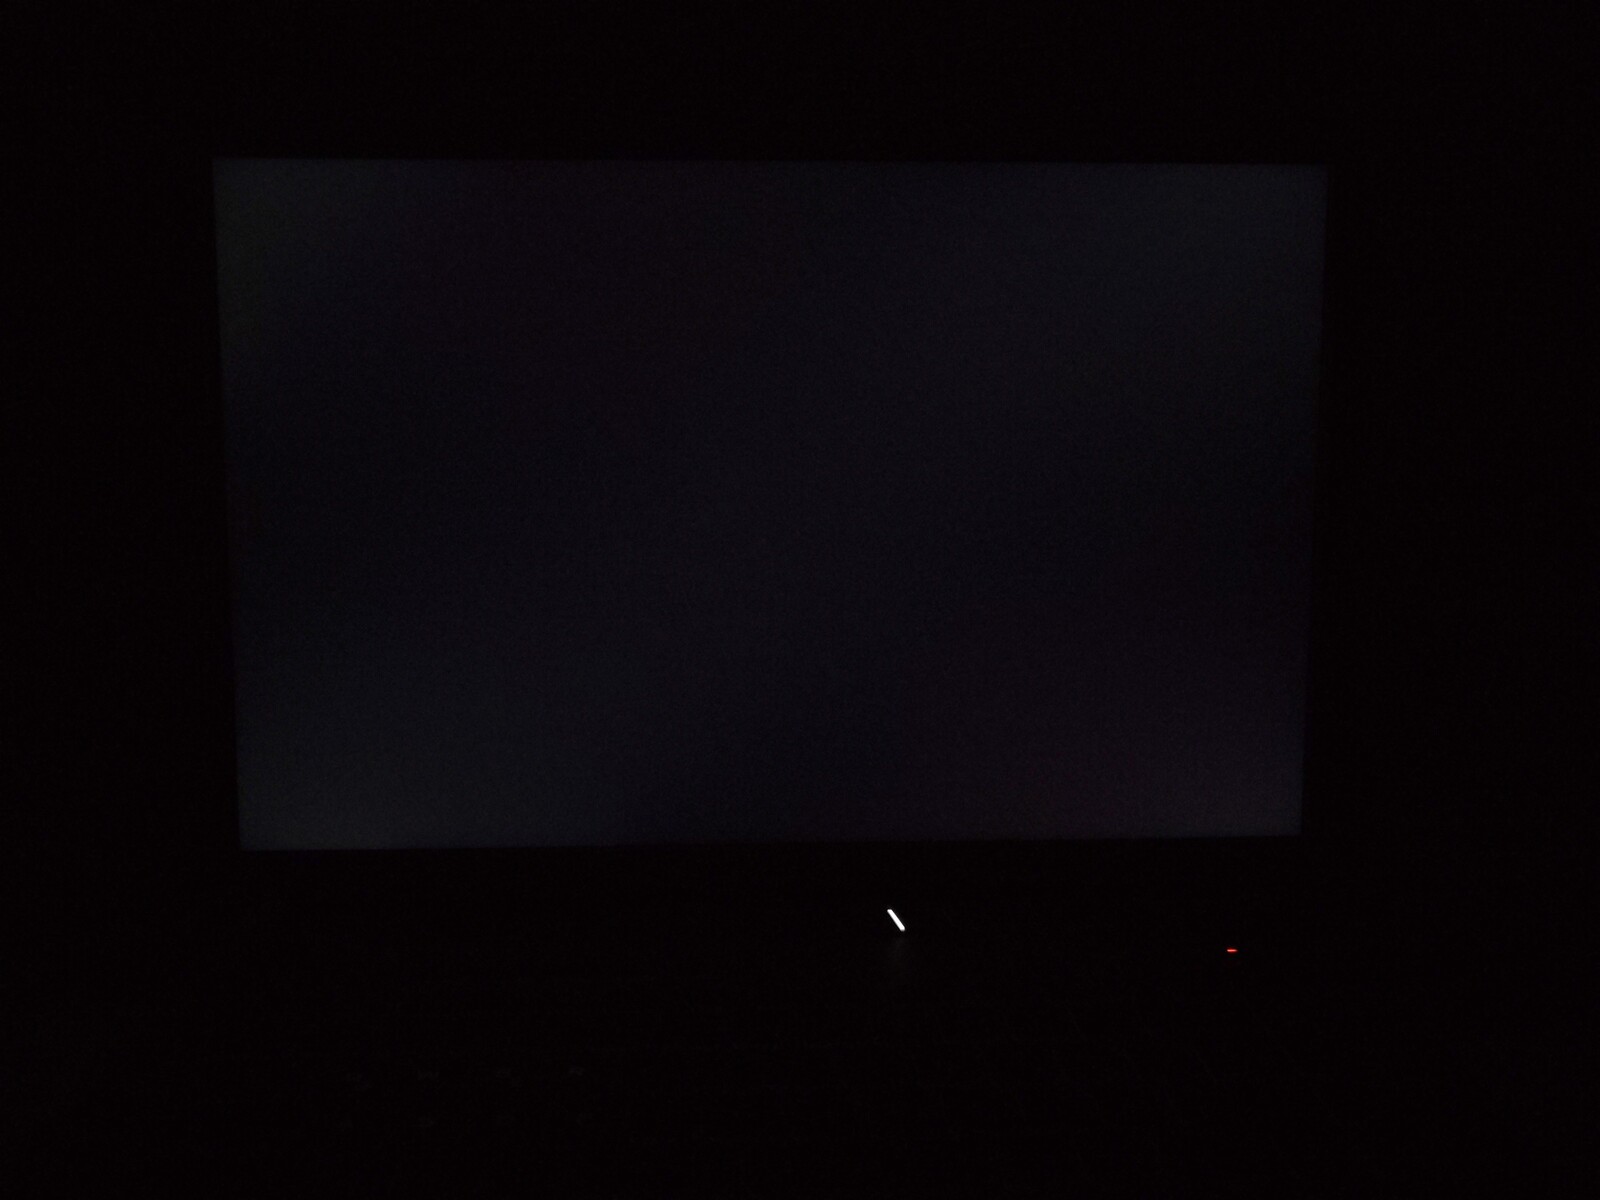
Pero hay algo que puede resultar molesto al jugar. Los LEDs de estado del Asus ROG Strix G16 están situados directamente debajo de la pantalla, de los cuales el LED del dispositivo de almacenamiento parpadea con bastante frecuencia durante el juego y distrae, especialmente durante juegos llenos de acción. Para una experiencia de juego inmersiva, lo único que puede ayudar es una tira de cinta negra.
| |||||||||||||||||||||||||
iluminación: 93 %
Brillo con batería: 470 cd/m²
Contraste: 1119:1 (Negro: 0.42 cd/m²)
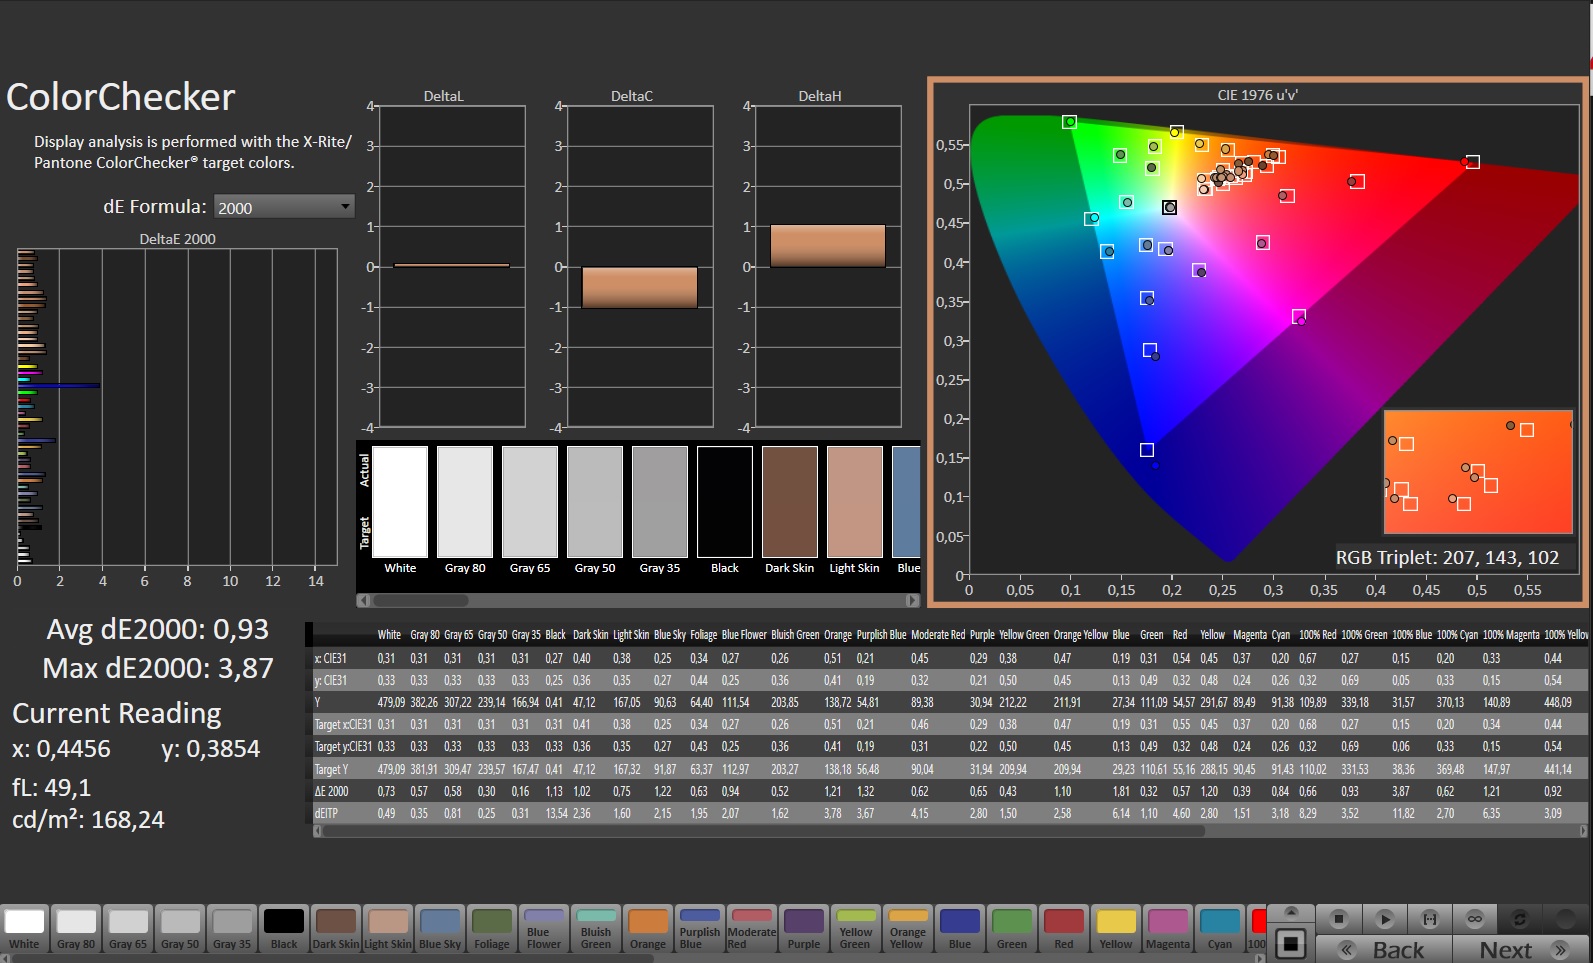
ΔE ColorChecker Calman: 1.86 | ∀{0.5-29.43 Ø4.72}
calibrated: 0.93
ΔE Greyscale Calman: 2.7 | ∀{0.09-98 Ø4.97}
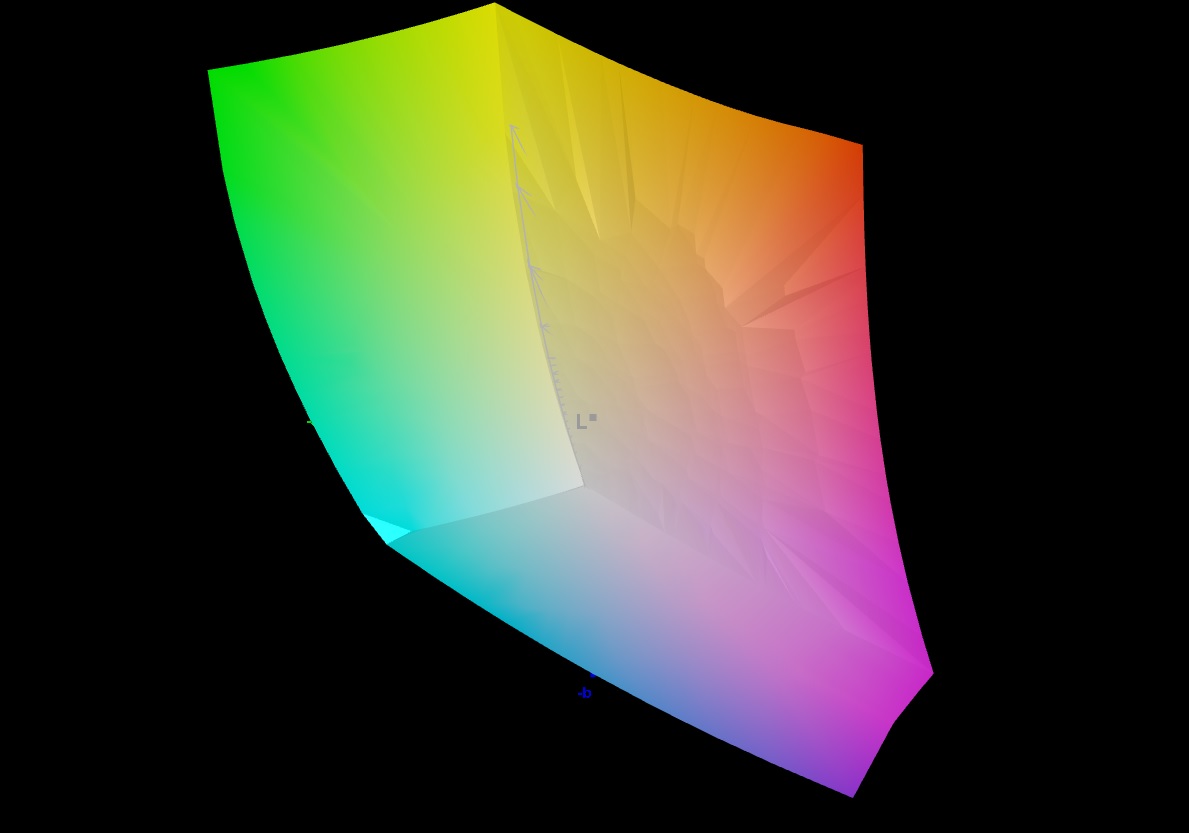
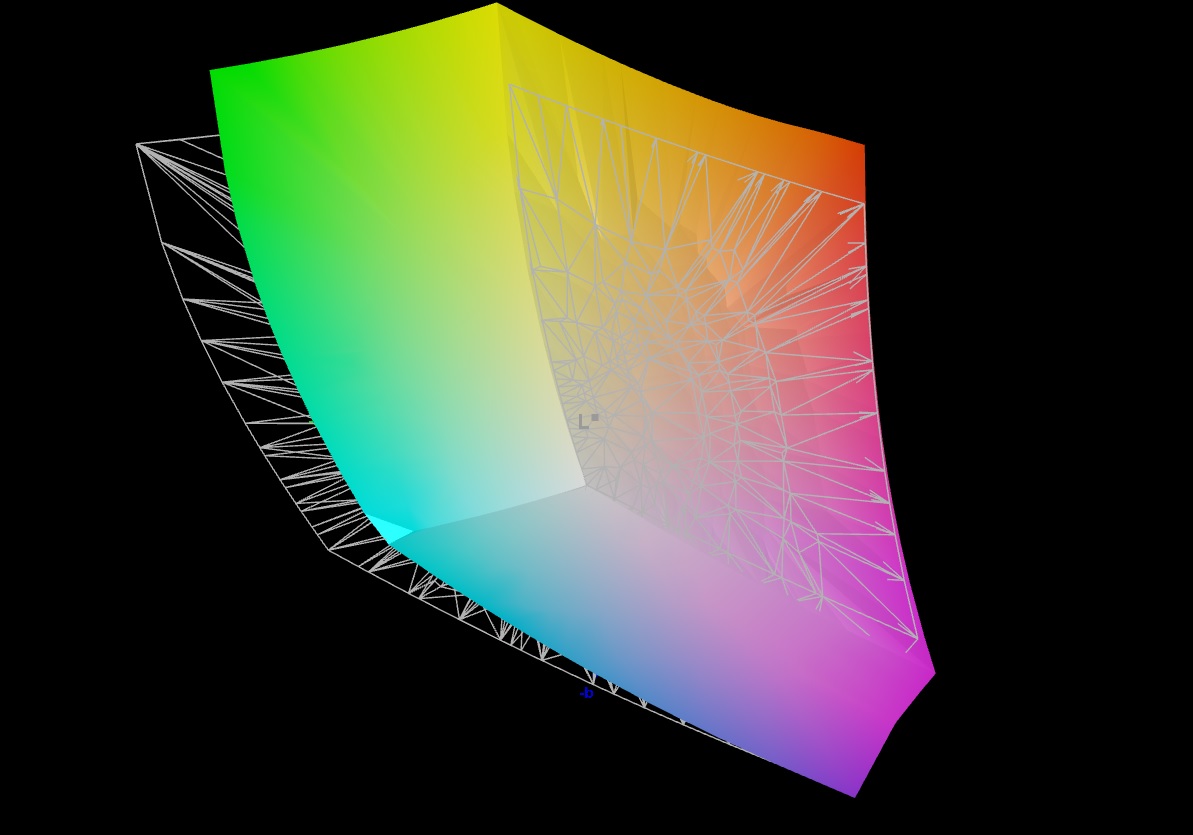
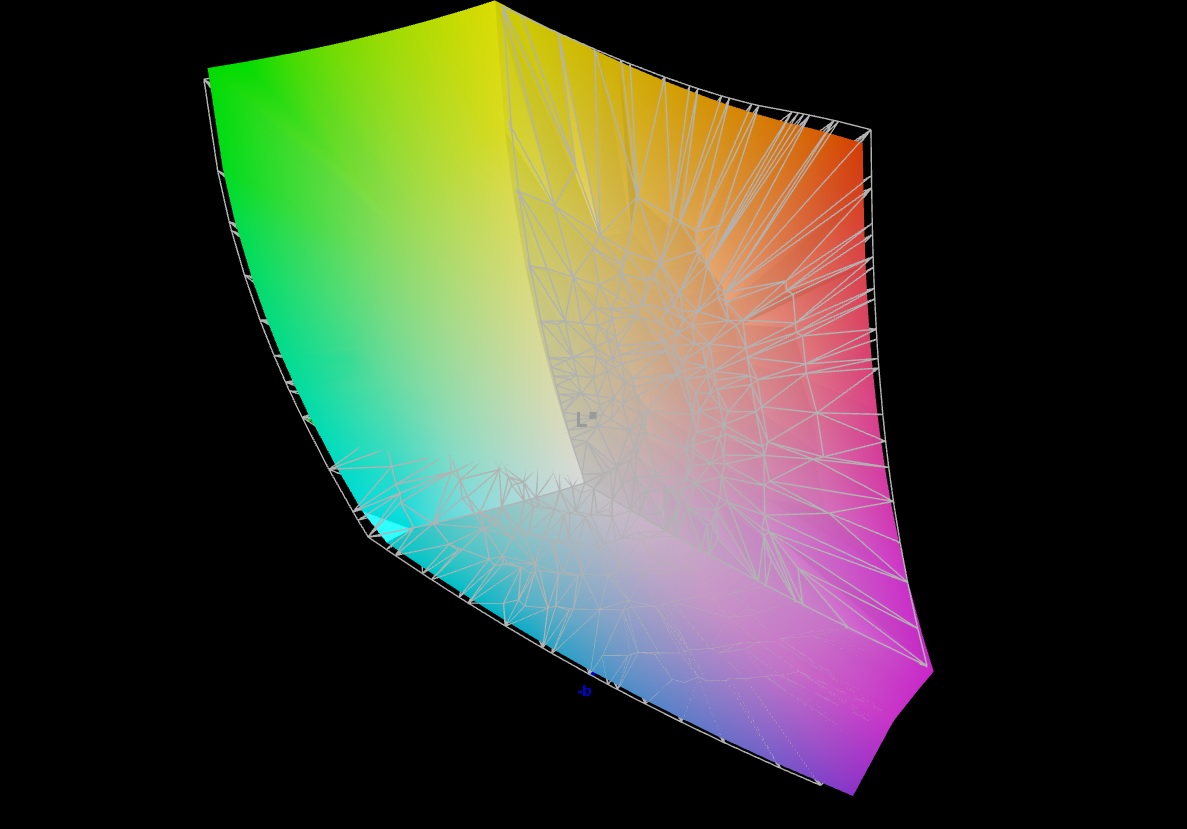
84.9% AdobeRGB 1998 (Argyll 3D)
99.9% sRGB (Argyll 3D)
97% Display P3 (Argyll 3D)
Gamma: 2.246
CCT: 6711 K
| Asus ROG Strix G16 G614JZ TL160ADMP03-0, IPS, 2560x1600, 16" | Asus Zephyrus Duo 16 GX650PY-NM006W NE160QDM-NM4, MiniLED, 2560x1600, 16" | Lenovo Legion Pro 7 16IRX8H MNG007DA2-3 (CSO1628), IPS, 2560x1600, 16" | Gigabyte AERO 16 OLED BSF Samsung SDC4191 (ATNA60YV09-0, OLED, 3840x2400, 16" | Asus TUF Gaming A16 FA617 NE160WUM-NX2 (BOE0B33), IPS-Level, 1920x1200, 16" | Razer Blade 16 Early 2023 CSOT T3 MNG007DA4-1, IPS, 2560x1600, 16" | |
|---|---|---|---|---|---|---|
| Display | 3% | -15% | 6% | -15% | 3% | |
| Display P3 Coverage (%) | 97 | 99.4 2% | 69.1 -29% | 99.9 3% | 69.4 -28% | 98.5 2% |
| sRGB Coverage (%) | 99.9 | 100 0% | 99.7 0% | 100 0% | 97.8 -2% | 100 0% |
| AdobeRGB 1998 Coverage (%) | 84.9 | 90.8 7% | 71.2 -16% | 96.4 14% | 70.9 -16% | 89.7 6% |
| Response Times | -193% | -65% | 66% | -143% | -56% | |
| Response Time Grey 50% / Grey 80% * (ms) | 5.1 ? | 15.2 ? -198% | 12.3 ? -141% | 2 ? 61% | 17 ? -233% | 6.6 ? -29% |
| Response Time Black / White * (ms) | 6.6 ? | 19 ? -188% | 5.9 ? 11% | 1.98 ? 70% | 10.1 ? -53% | 12 ? -82% |
| PWM Frequency (Hz) | 12000 ? | 60 | ||||
| Screen | 108% | 22% | 117% | 5% | -13% | |
| Brightness middle (cd/m²) | 470 | 712 51% | 511 9% | 389.97 -17% | 308 -34% | 456.8 -3% |
| Brightness (cd/m²) | 459 | 703 53% | 469 2% | 395 -14% | 293 -36% | 437 -5% |
| Brightness Distribution (%) | 93 | 95 2% | 86 -8% | 97 4% | 90 -3% | 83 -11% |
| Black Level * (cd/m²) | 0.42 | 0.07 83% | 0.4 5% | 0.03 93% | 0.23 45% | 0.35 17% |
| Contrast (:1) | 1119 | 10171 809% | 1278 14% | 12999 1062% | 1339 20% | 1305 17% |
| Colorchecker dE 2000 * | 1.86 | 1.7 9% | 0.95 49% | 2 -8% | 1.47 21% | 3.7 -99% |
| Colorchecker dE 2000 max. * | 3.87 | 4 -3% | 2.07 47% | 4.1 -6% | 2.98 23% | 6.42 -66% |
| Colorchecker dE 2000 calibrated * | 0.93 | 1.2 -29% | 0.91 2% | 1.68 -81% | 1.02 -10% | 0.66 29% |
| Greyscale dE 2000 * | 2.7 | 2.8 -4% | 0.6 78% | 2.23 17% | 2.2 19% | 2.6 4% |
| Gamma | 2.246 98% | 2.21 100% | 2.176 101% | 2.41 91% | 2.228 99% | 2.3 96% |
| CCT | 6711 97% | 6978 93% | 6545 99% | 6323 103% | 6228 104% | 6108 106% |
| Media total (Programa/Opciones) | -27% /
42% | -19% /
2% | 63% /
86% | -51% /
-21% | -22% /
-16% |
* ... más pequeño es mejor
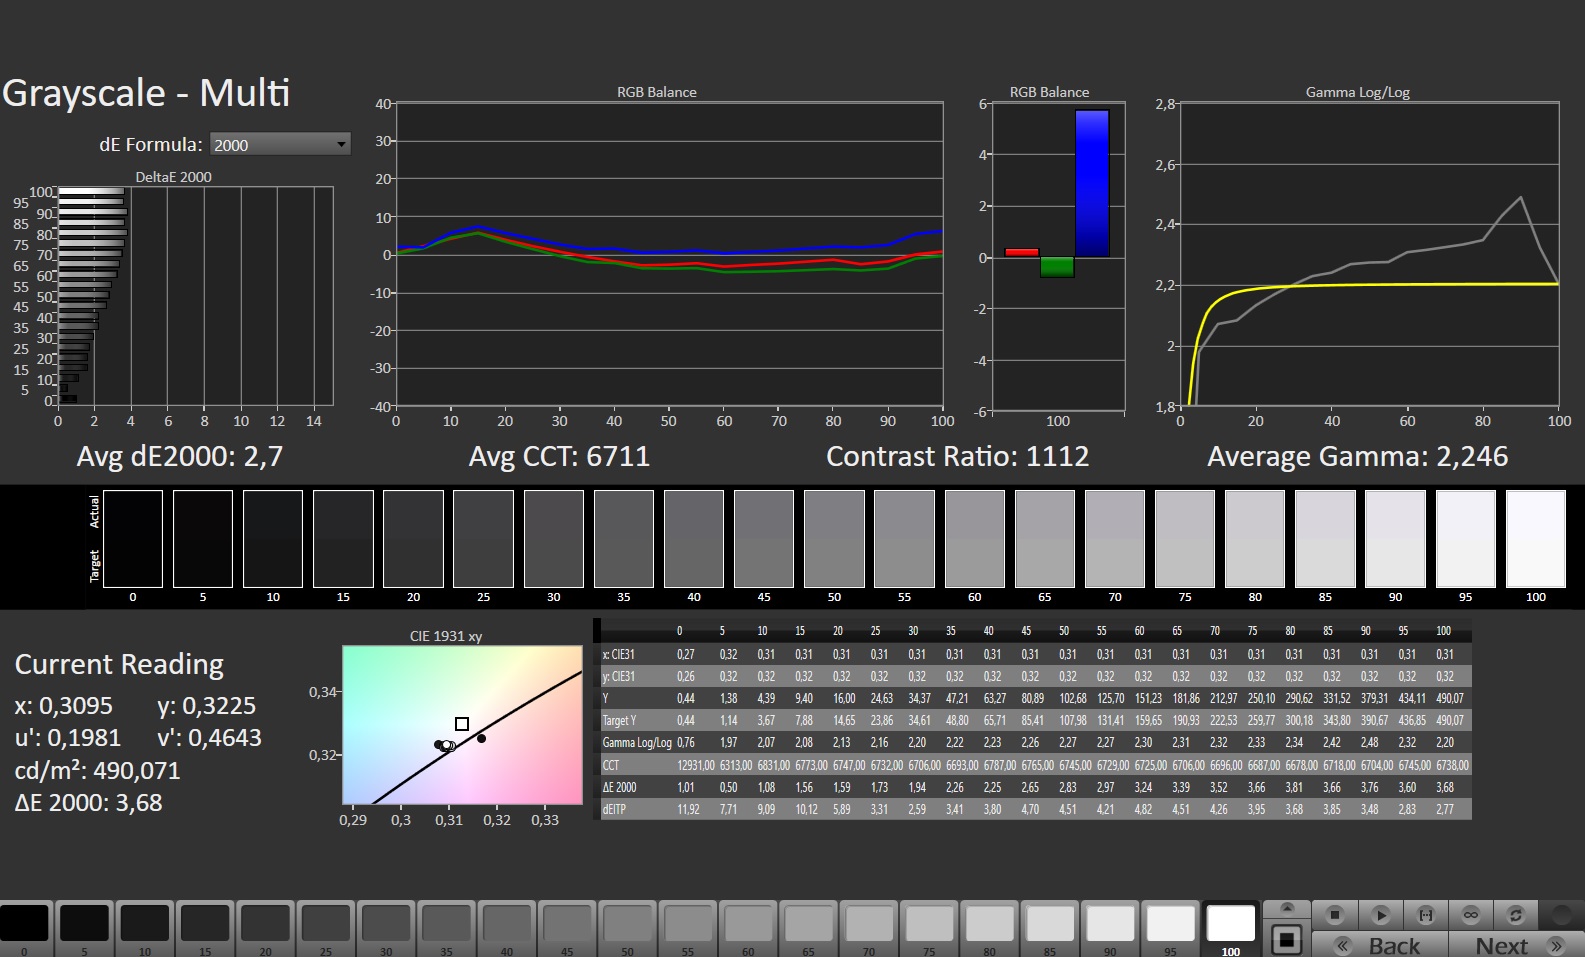
El Asus ROG Strix G16 viene con un display bien calibrado de fábrica. Ninguna de las desviaciones de color medias supera un ΔΕ2000 de 2. Con nuestro perfil ICC de la caja de información, las desviaciones de color caen muy por debajo de un ΔΕ2000 de 1, pero los valores máximos permanecen casi inalterados justo por encima de un ΔΕ2000 de 3.
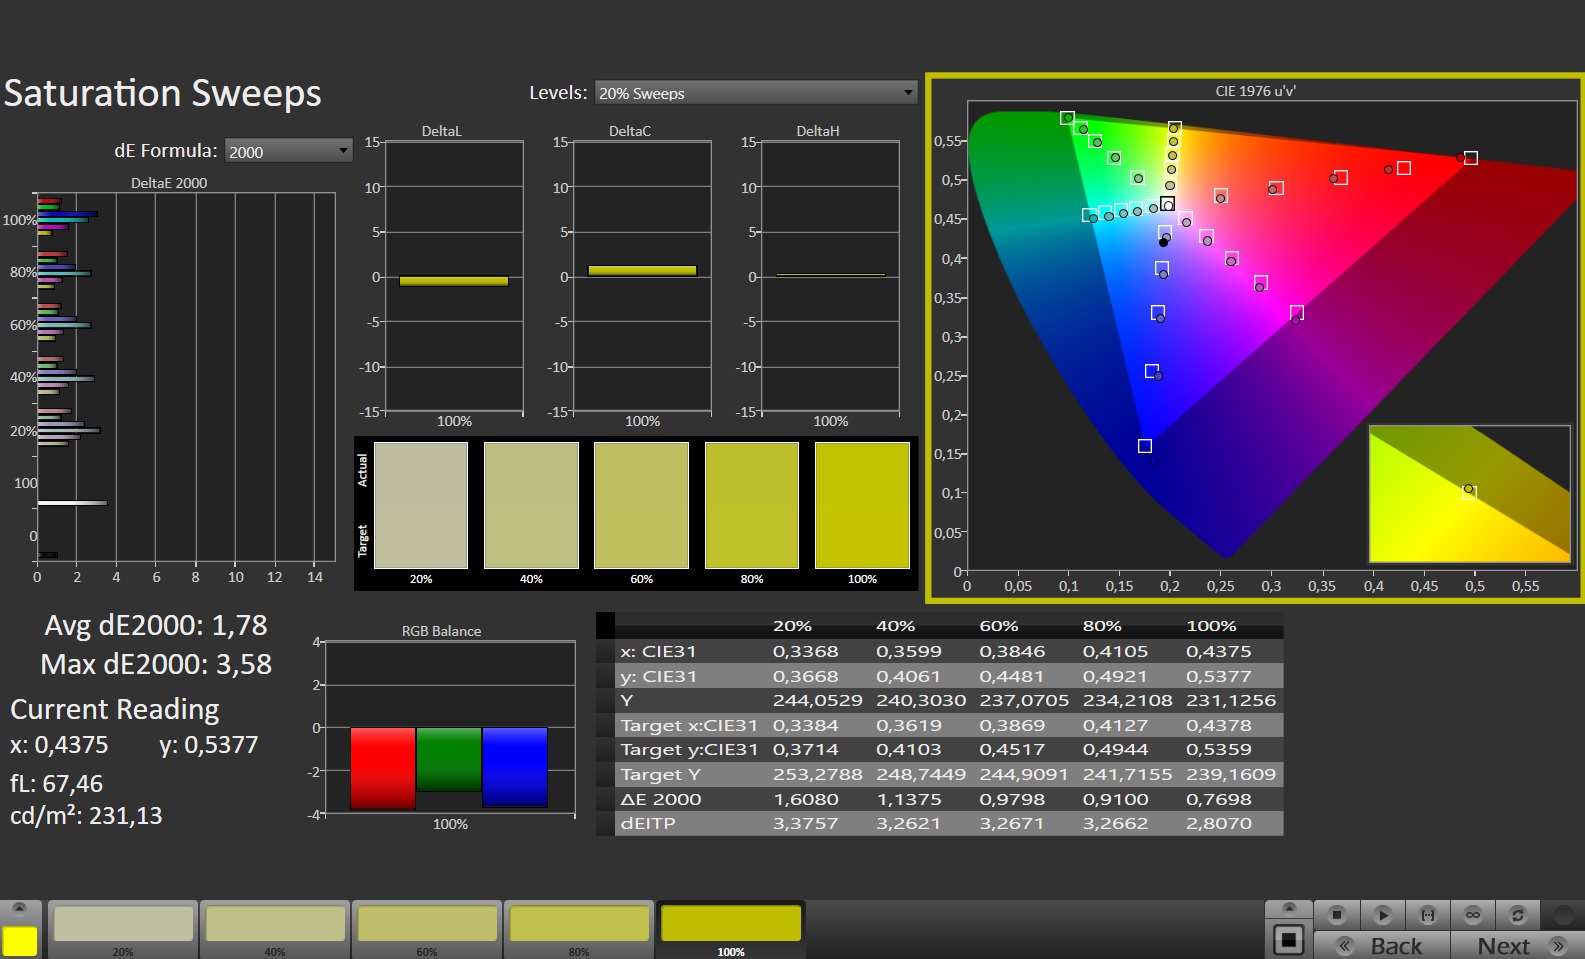


Para cineastas y amantes del cine, la cobertura del 97% del espacio de color DisplayP3 también debería ser agradable. La cobertura cercana al 100% del espacio de color sRGB suele ser suficiente para los juegos. Sólo unos pocos juegos ofrecen la posibilidad de elegir un espacio de color mayor. Sólo en AdobeRGB la pantalla flaquea un poco, ya que el espacio de color, importante para los fotógrafos, sólo tiene una cobertura en torno al 85%.
Tiempos de respuesta del display
| ↔ Tiempo de respuesta de Negro a Blanco | ||
|---|---|---|
| 6.6 ms ... subida ↗ y bajada ↘ combinada | ↗ 2.2 ms subida | 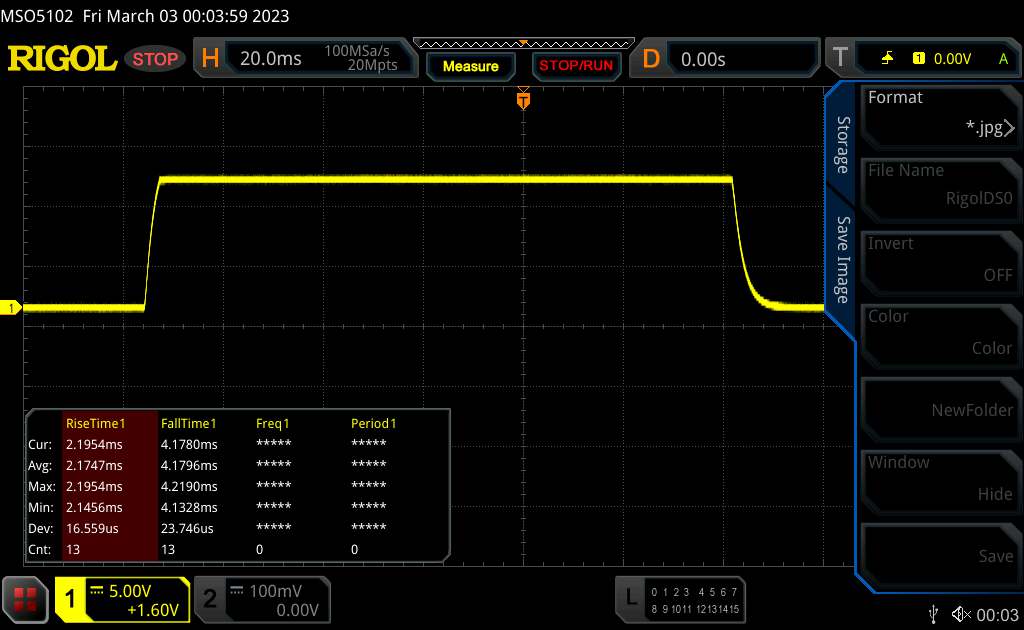 |
| ↘ 4.2 ms bajada | ||
| La pantalla mostró tiempos de respuesta muy rápidos en nuestros tests y debería ser adecuada para juegos frenéticos. En comparación, todos los dispositivos de prueba van de ##min### (mínimo) a 240 (máximo) ms. » 21 % de todos los dispositivos son mejores. Esto quiere decir que el tiempo de respuesta medido es mejor que la media (19.8 ms) de todos los dispositivos testados. | ||
| ↔ Tiempo de respuesta 50% Gris a 80% Gris | ||
| 5.1 ms ... subida ↗ y bajada ↘ combinada | ↗ 2.3 ms subida | 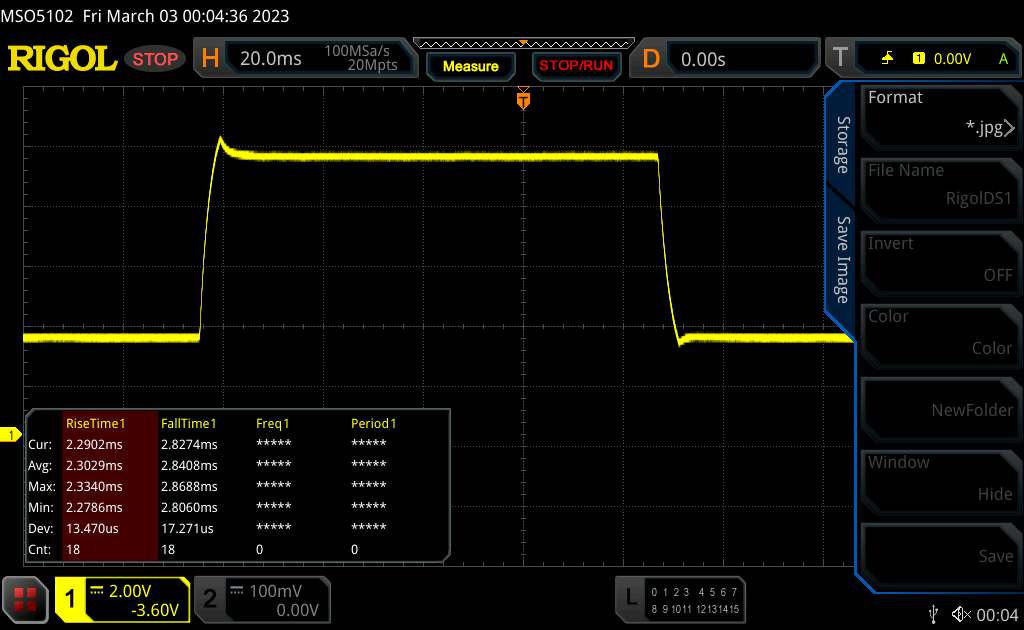 |
| ↘ 2.8 ms bajada | ||
| La pantalla mostró tiempos de respuesta muy rápidos en nuestros tests y debería ser adecuada para juegos frenéticos. En comparación, todos los dispositivos de prueba van de ##min### (mínimo) a 636 (máximo) ms. » 17 % de todos los dispositivos son mejores. Esto quiere decir que el tiempo de respuesta medido es mejor que la media (31 ms) de todos los dispositivos testados. | ||
Parpadeo de Pantalla / PWM (Pulse-Width Modulation)
| Parpadeo de Pantalla / PWM no detectado |  | ||
Comparación: 52 % de todos los dispositivos testados no usaron PWM para atenuar el display. Si se usó, medimos una media de 7781 (mínimo: 5 - máxmo: 343500) Hz. | |||
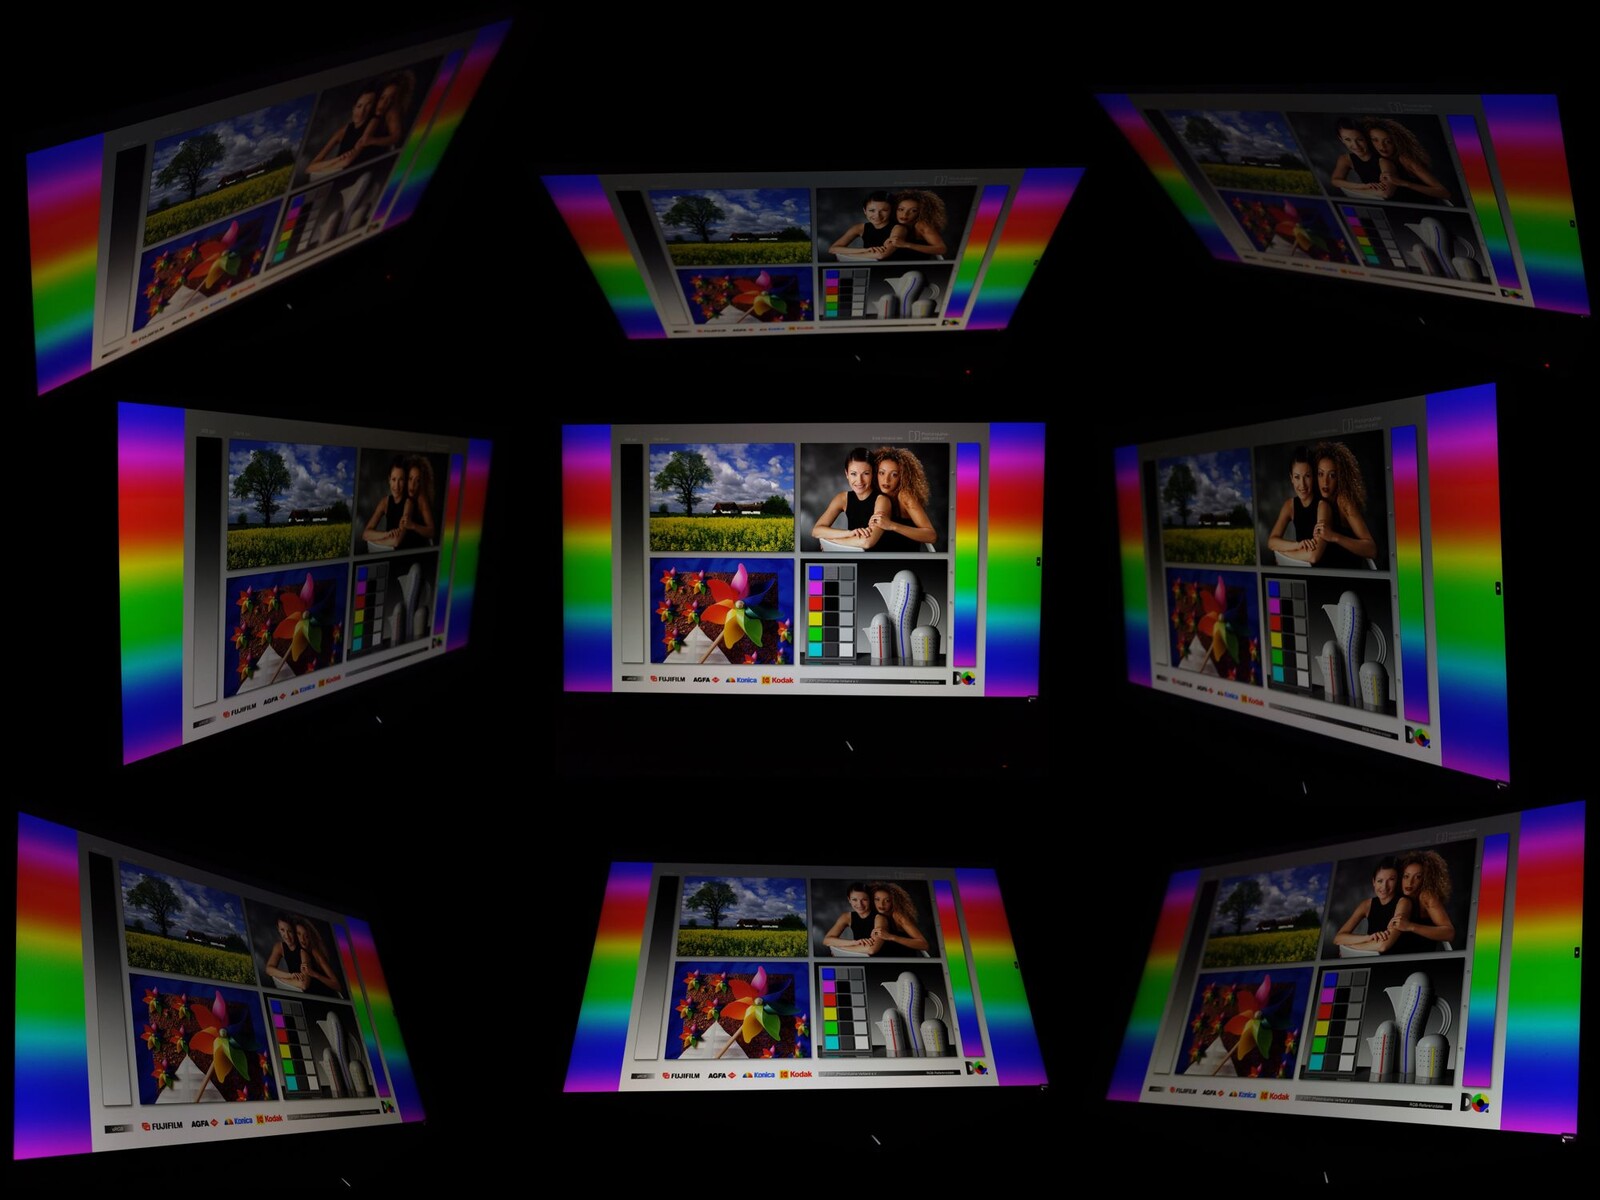
470 cd/m² con un ratio de contraste de 1119:1 no es suficiente para el uso sin restricciones de la pantalla mate en exteriores. Un cielo azul puede reflejarse en la pantalla y dificultar la lectura si no se mira desde el ángulo adecuado. Afortunadamente, la pantalla del Asus ROG Strix G16 tiene un ángulo de visión muy estable. Visto desde todos los lados, apenas hay desviaciones perceptibles de brillo y color.
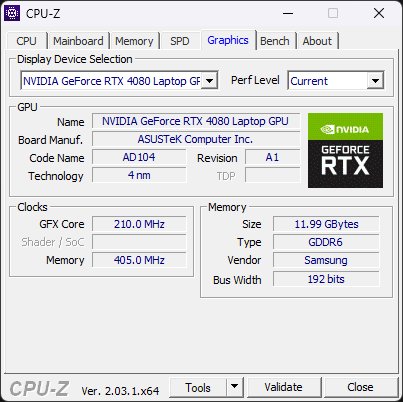
Rendimiento - Hasta 175 vatios para la GeForce RTX 4080
El Asus ROG Strix G16 está disponible en varias configuraciones. La configuración superior consta de un Intel Core i9-13980HX con 32 GB de RAM DDR5 y una tarjeta Nvidia GeForce RTX 4080. Nuestra unidad de pruebas es idéntica, aparte de los 16 GB de RAM. Gracias a los altos valores de TDP y TGP, apenas hay límites en el juego. Con los ajustes de máxima calidad, muchos títulos actuales se renderizan en el ROG Strix en la resolución QHD+ nativa del display a bastante más de 60 FPS.
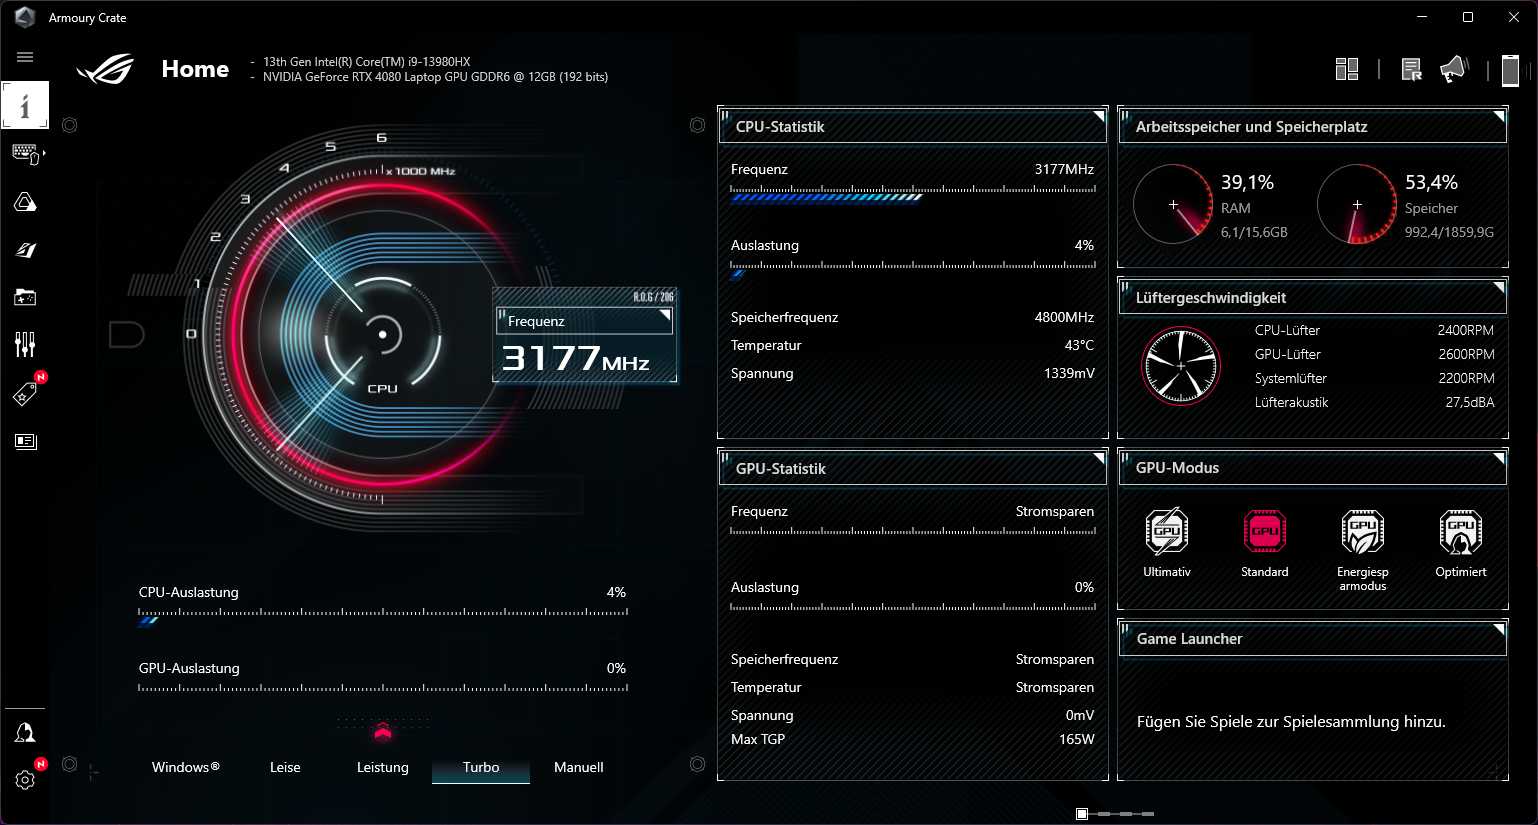
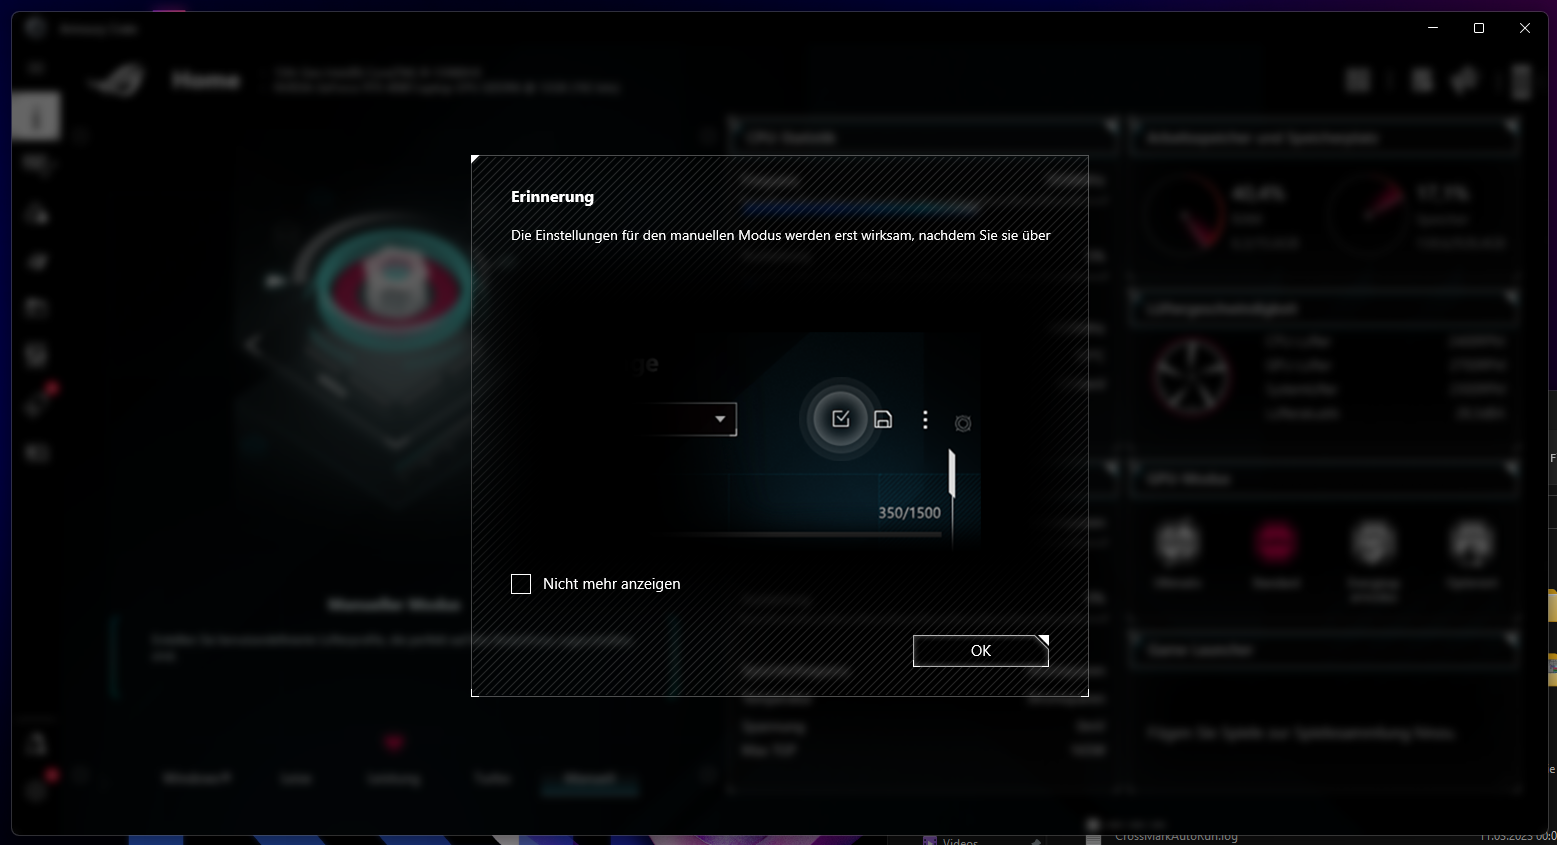
Control del rendimiento y condiciones de ensayo
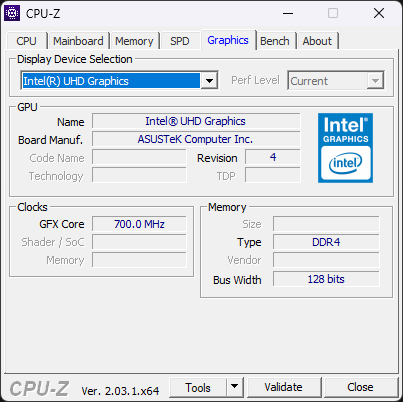
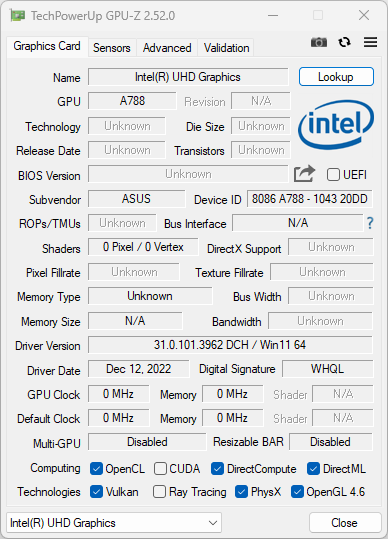
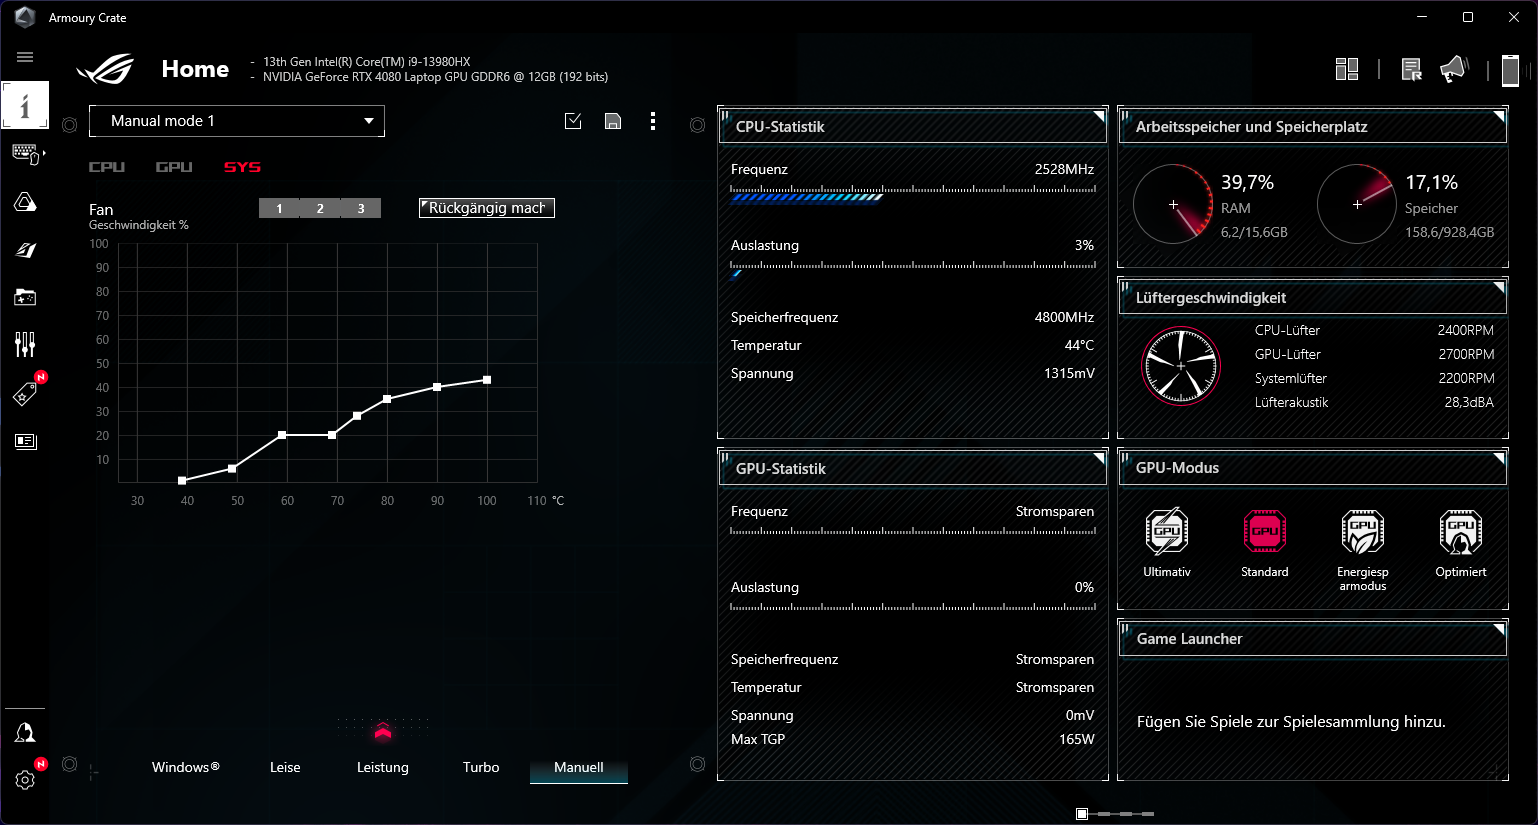
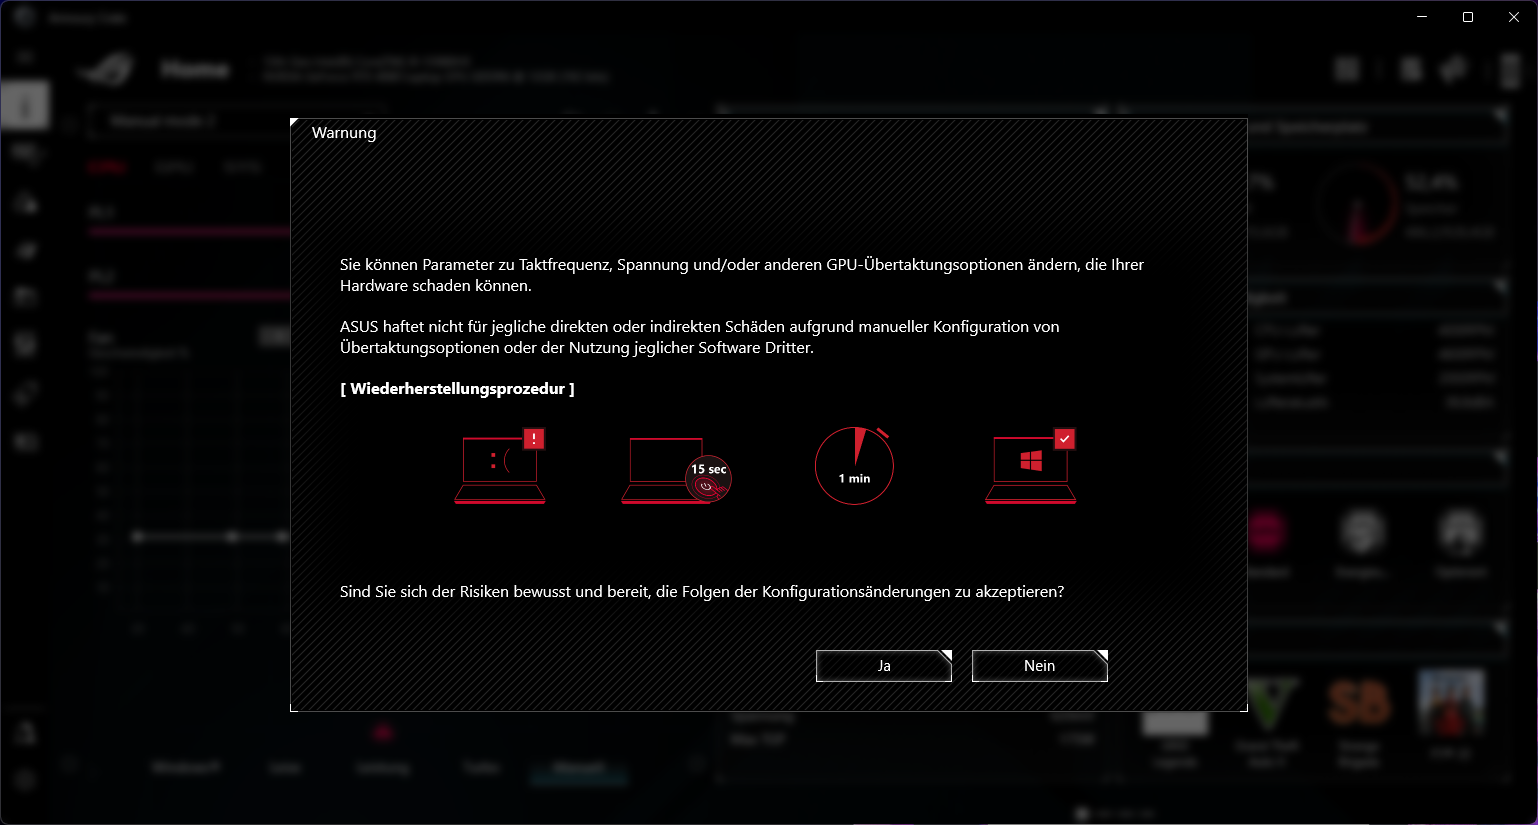
El rendimiento del ROG Strix G16 se puede controlar a través de la completa app Armory Crate. Además del rendimiento, aquí también se configuran la iluminación RGB, la pantalla y otras funciones. Hay disponibles tres perfiles de rendimiento predefinidos, a saber, Silencioso, Rendimiento y Turbo, junto con ajustes para la GPU RTX 4080. Dependiendo del modo de GPU, existe un modo mixto, o la posibilidad de elegir entre la iGPU del i9 o la tarjeta gráfica Nvidia como GPU. El cambio se realiza a través de MUX, por lo que la pantalla siempre está directamente conectada a la unidad gráfica activa. Si lo desean, los usuarios pueden exprimir todo el potencial de juego del portátil en modo manual y ajustar una amplia variedad de configuraciones. Se pueden establecer curvas de ventilador, TGP, Dynamic Boost, PL1 y PL2, así como límites de temperatura. Los overclockers sacarán partido a su dinero, aunque Asus intente frenar el sistema con límites estrictos. Al menos el rendimiento del portátil puede adaptarse a los requisitos de algunos juegos. Ni la GPU ni la CPU plantean problemas de cuello de botella de rendimiento.
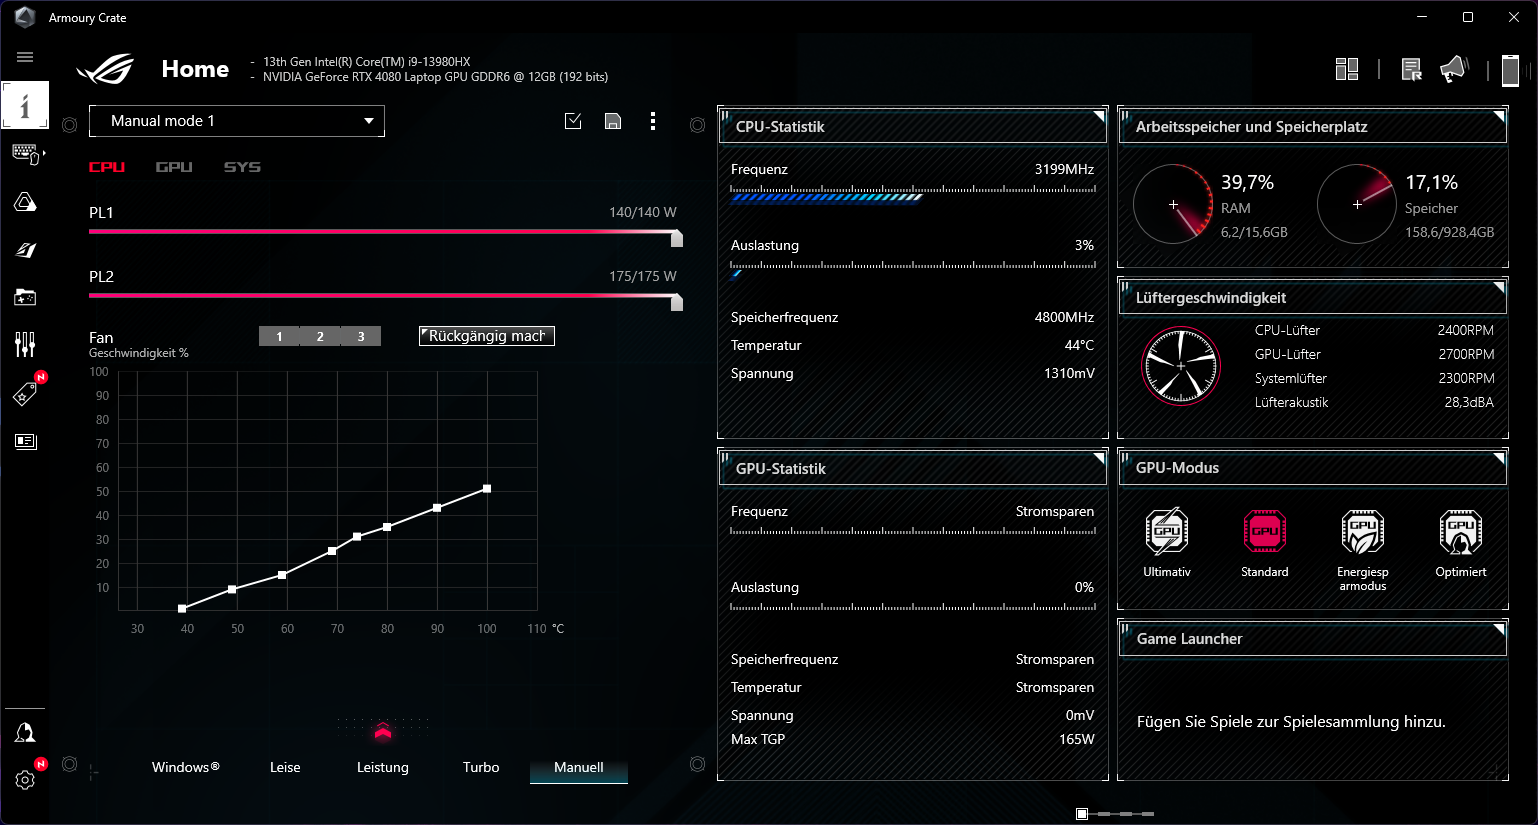
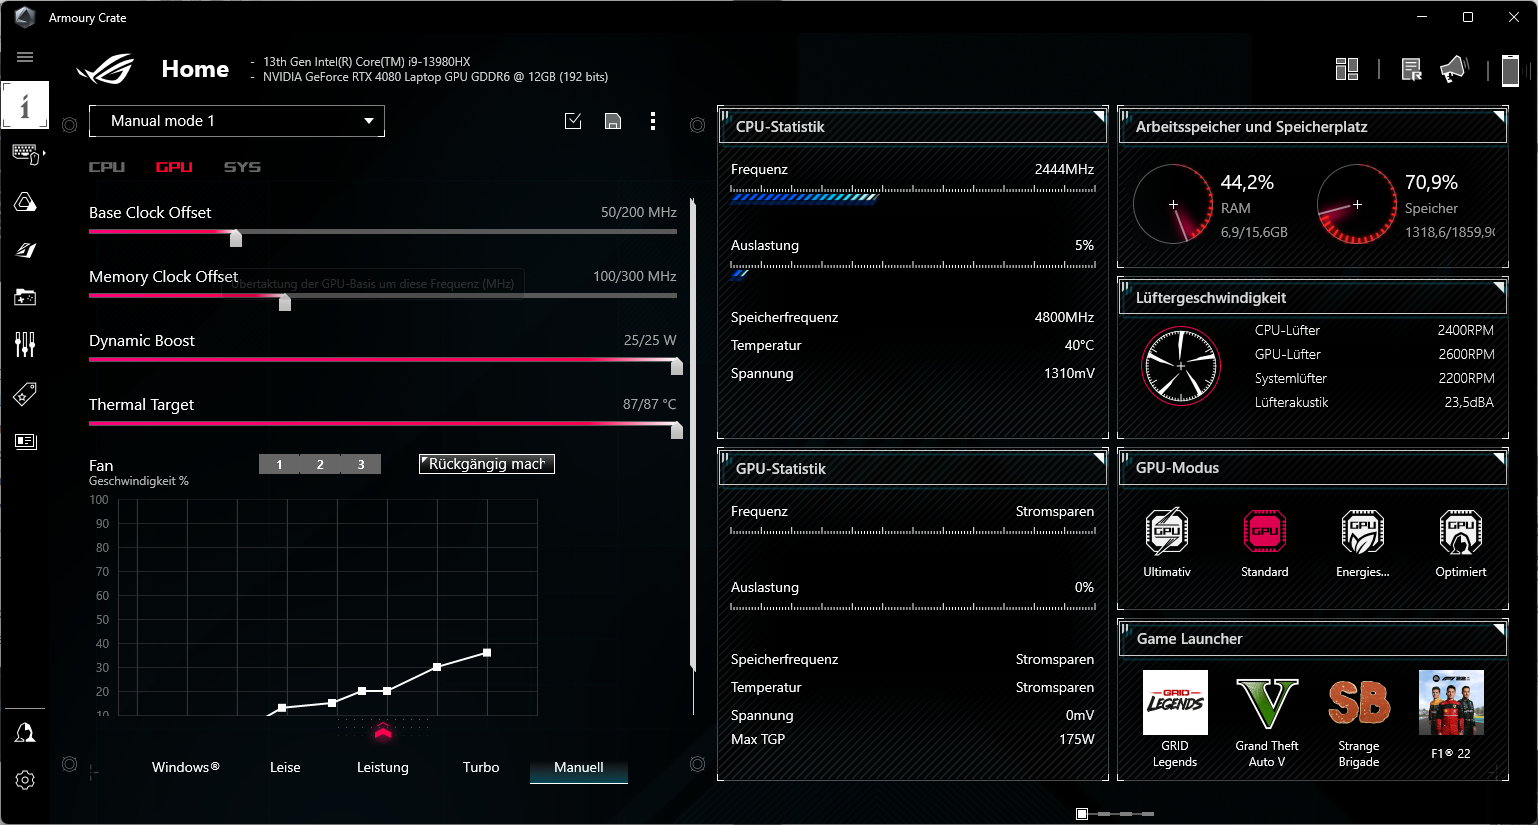
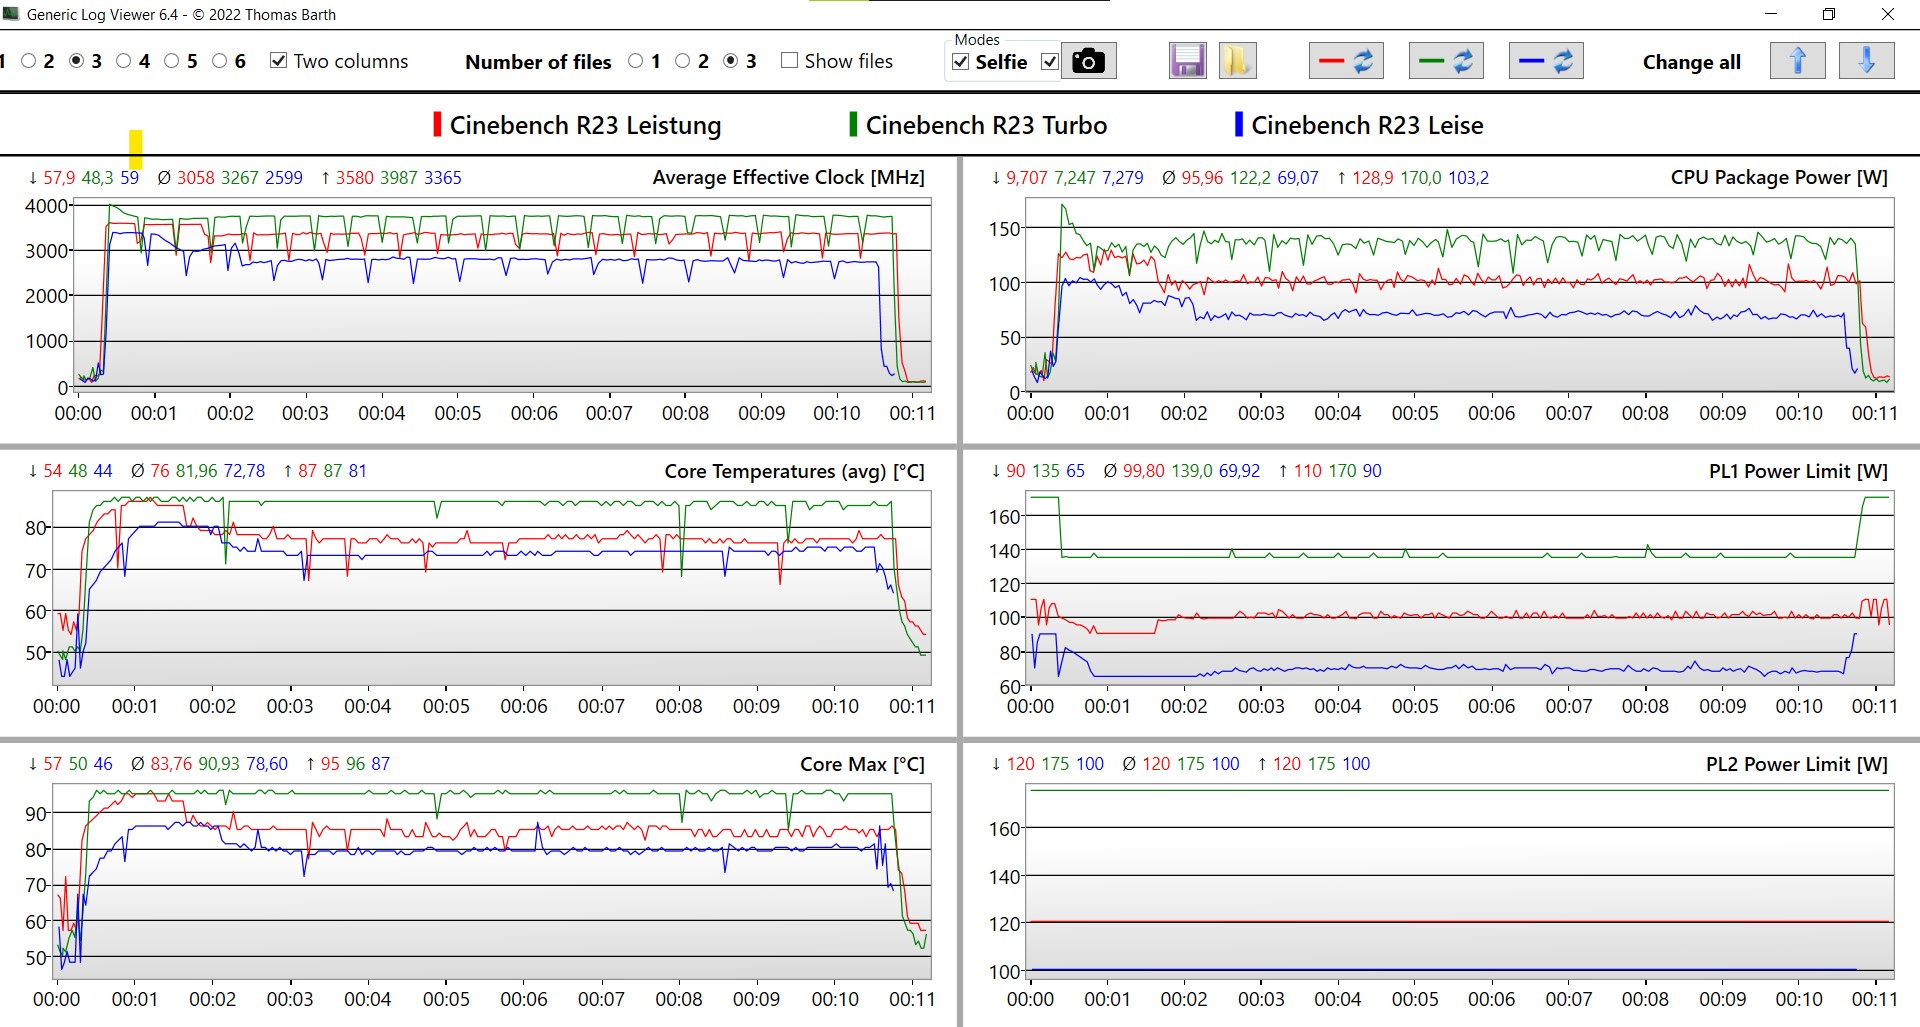
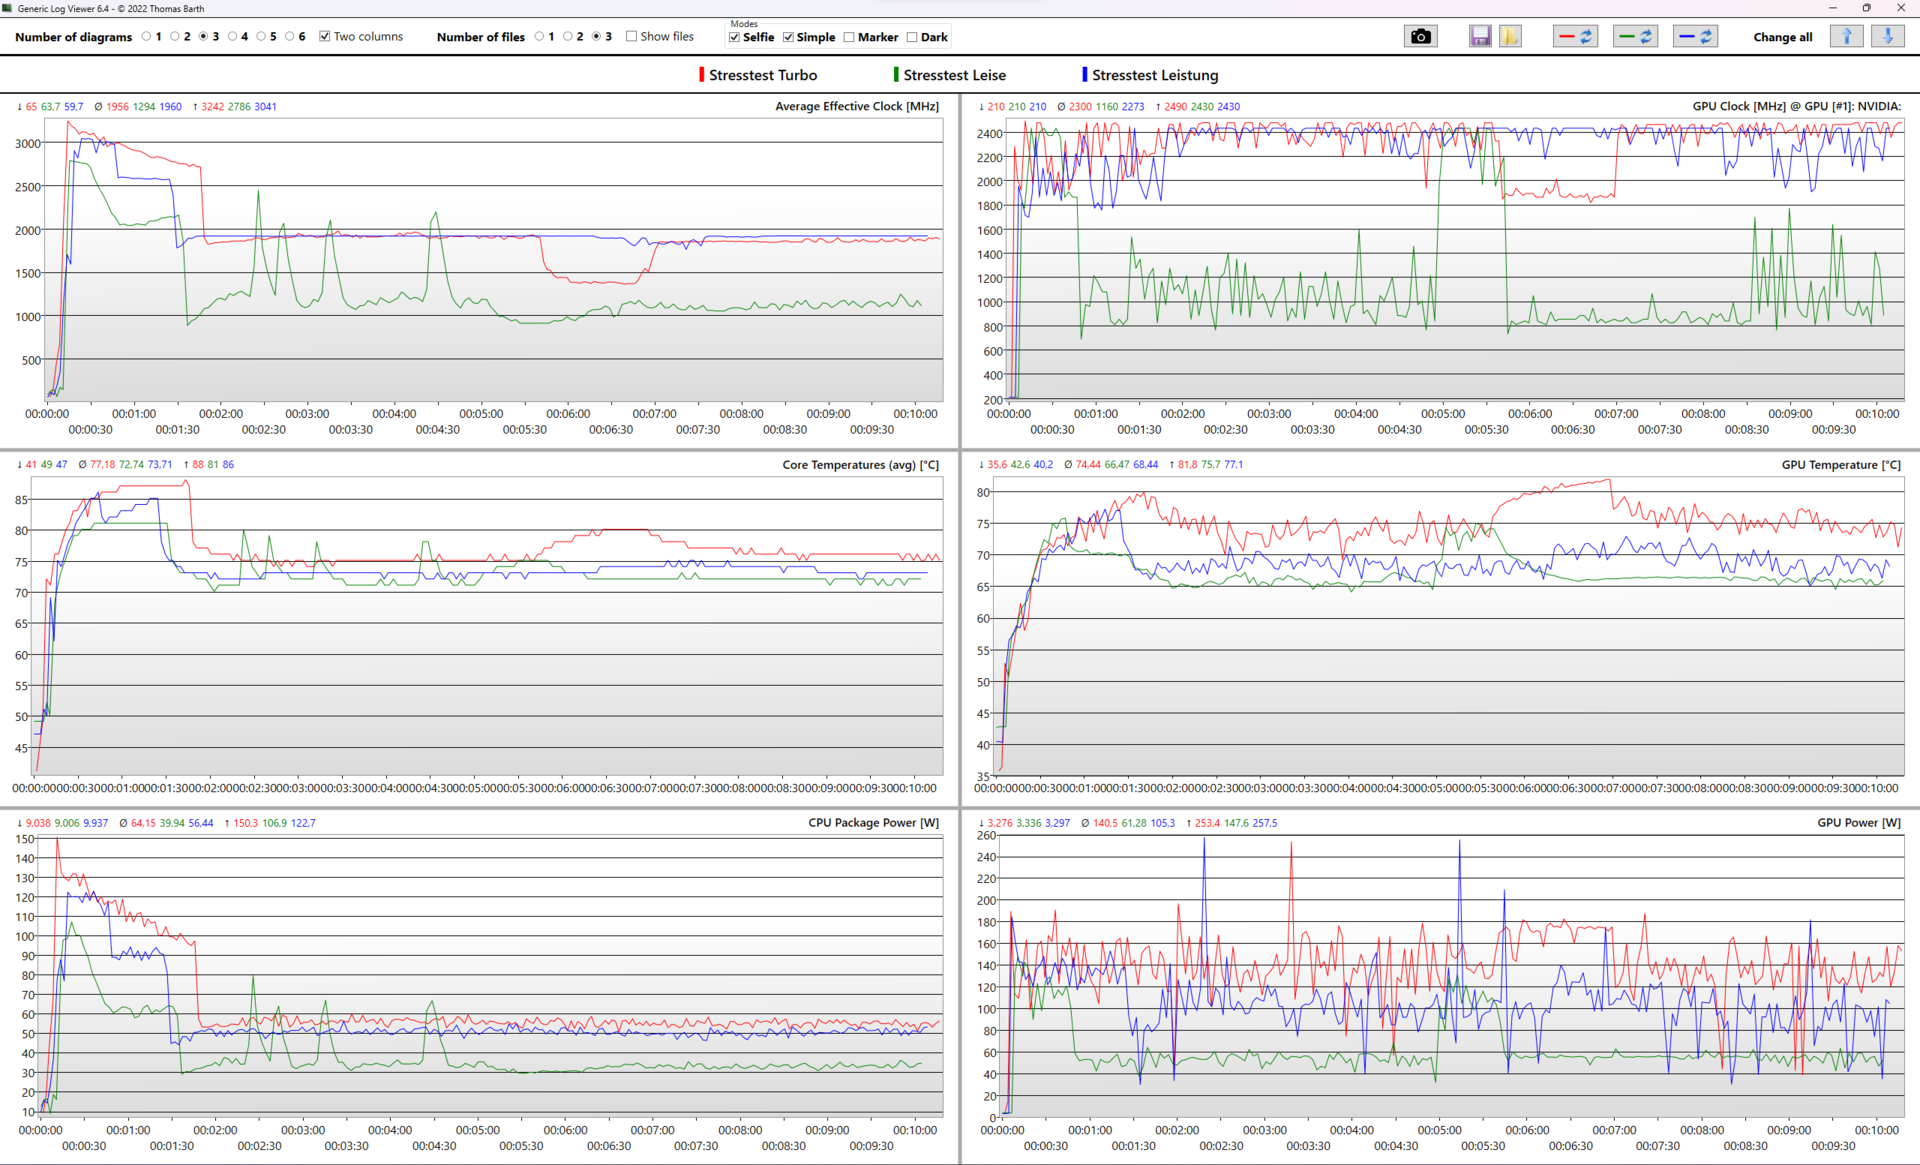
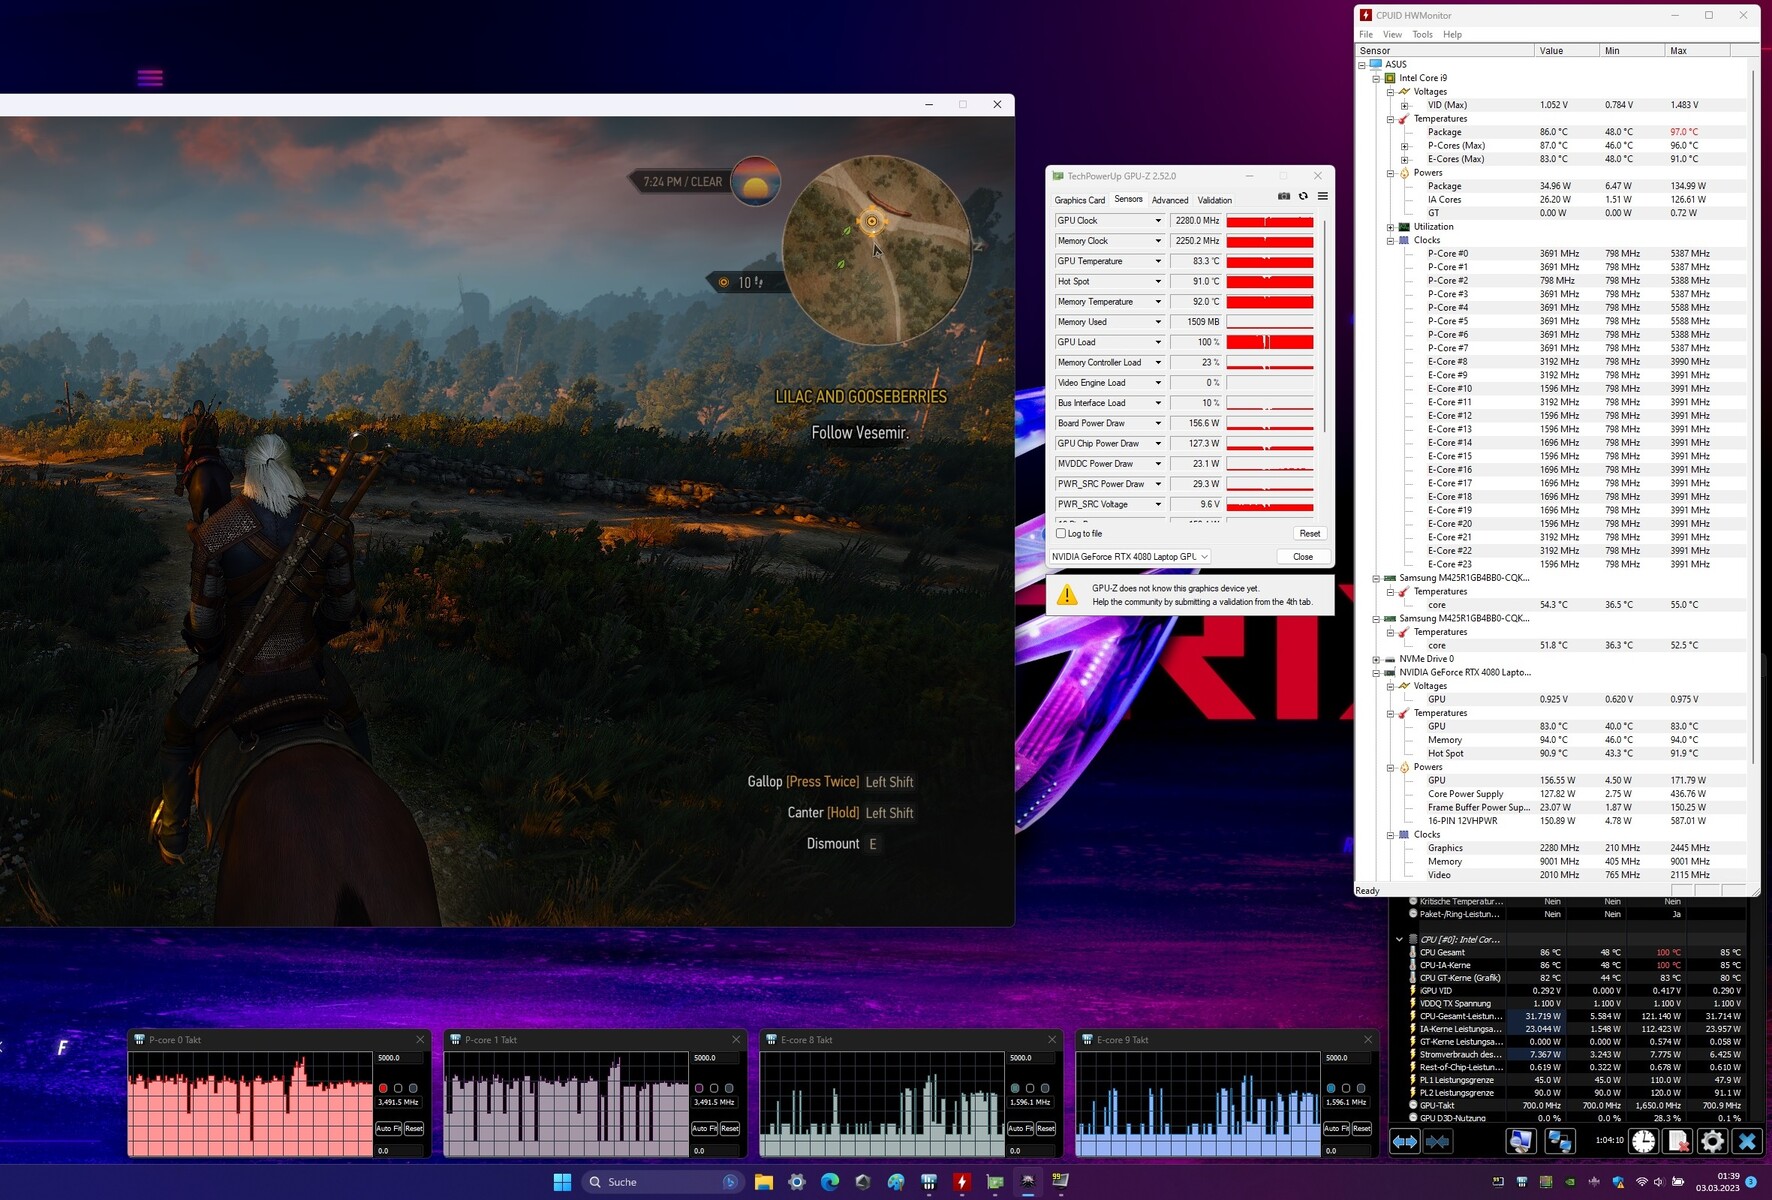
Los distintos ajustes de Armory Crate pueden cambiar bastante los valores de TGP y TDP. Por ejemplo, el procesador es capaz de extraer 130 vatios durante largos periodos en modo Turbo, y unos 70 vatios en modo Silencioso. En las pruebas de estrés con Prime95 y Furmark, el Intel Core i9 y la Nvidia GeForce RTX 4080 trabajan con una potencia combinada de unos 210 vatios en modo Turbo y 95 vatios en modo Silencioso. En los siguientes registros se pueden obtener valores más precisos. Un examen más detallado revela que, si bien los valores de rendimiento del hardware en vatios están ocasionalmente muy alejados en función del modo de funcionamiento, las frecuencias de reloj efectivas del procesador y el chip gráfico no están muy alejadas.
Por otro lado, notamos diferencias significativas en las emisiones de ruido del portátil. En modo silencioso, los tres ventiladores funcionan a unos 40 dB(A). El modo Turbo ronda los 51 dB(A). Dado que la escala de dB es logarítmica, esto duplica la sonoridad percibida del ROG Strix G16. Nuestras mediciones y pruebas se llevaron a cabo principalmente en el modo GPU estándar y en el modo Rendimiento.
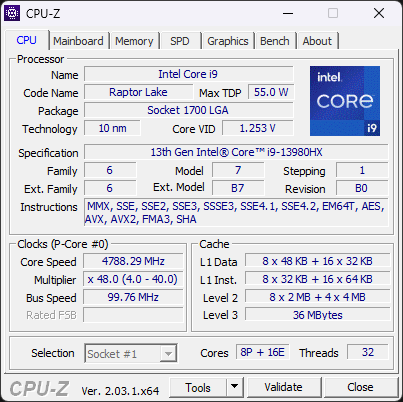
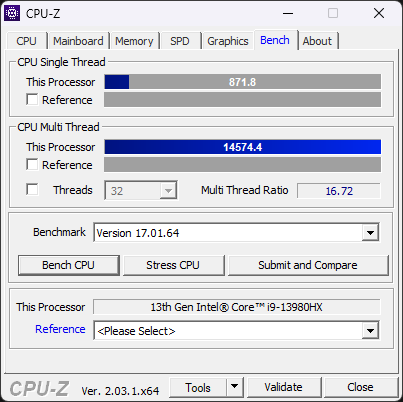
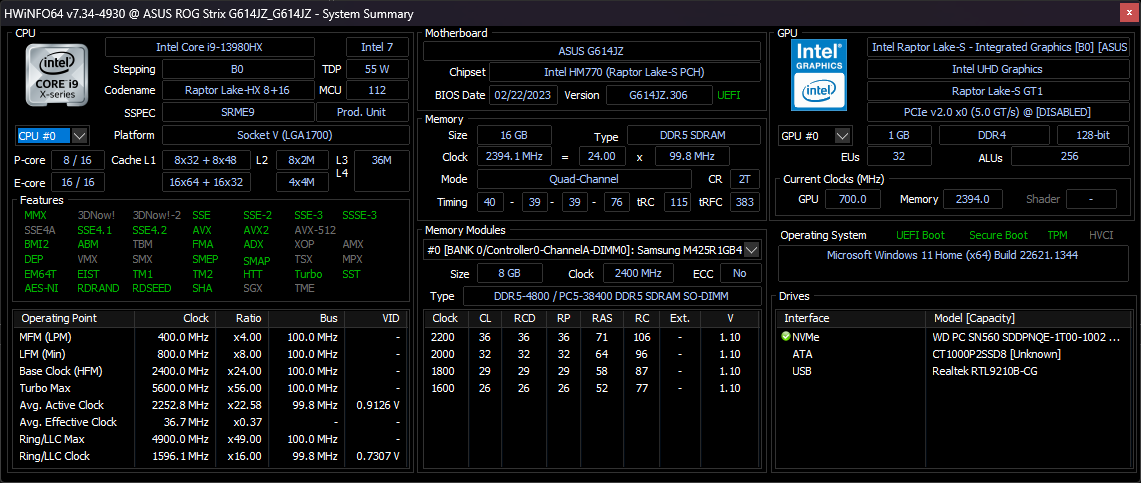
Procesador
Raptor Lake es el nombre de la 13ª generación de procesadores de Intel, que dio a luz al Intel Core i9-13980HX. La CPU de gama alta está diseñada para portátiles más grandes con una refrigeración potente. Gracias a ocho núcleos P y 16 núcleos E, el i9 tiene 32 hilos. Según HWinfo, la CPU del portátil para juegos de Asus funciona muy por encima de los valores TDP recomendados por Intel. En modo Turbo, es posible alcanzar hasta 130 vatios de potencia continua.
En modo Rendimiento, los ventiladores se ponen en marcha repetida y notablemente bastante tarde en el bucle Cinebench R15. Esto explica la brusca caída de rendimiento tras las tres primeras ejecuciones. Poco después, sin embargo, la refrigeración se estabiliza y el procesador es capaz de seguir trabajando a un alto nivel. La caída brusca del rendimiento sólo se produce en esta prueba en particular. Después de cada ejecución, Cinebench se reinicia, dando al procesador de uno a tres segundos para recuperarse entre ejecuciones. Sin embargo, esto también puede provocar una reacción retardada del control de rendimiento al escenario de carga. En el bucle con Cinebench R23, no pudimos provocar una caída brusca del rendimiento. Aquí los tiempos entre las ejecuciones individuales son algo más cortos. Tras dos fuertes ejecuciones con más de 30.000 puntos, el ROG Strix G16 permaneció en torno a los 29.000 puntos en el bucle CB R23 durante 10 minutos. El rendimiento multinúcleo cae un 30% hasta los 20.000 puntos en modo Batería.
En general, el Intel Core i9 del ROG Strix G16 es bastante potente. Los resultados del benchmark aquí son consistentemente de alto nivel. Sin embargo, el i9 no es rival para el Ryzen 9 del Asus Zephyrus Duo 16.
Cinebench R15 Multi Sustained Load
Cinebench R23: Multi Core | Single Core
Cinebench R20: CPU (Multi Core) | CPU (Single Core)
Cinebench R15: CPU Multi 64Bit | CPU Single 64Bit
Blender: v2.79 BMW27 CPU
7-Zip 18.03: 7z b 4 | 7z b 4 -mmt1
Geekbench 5.5: Multi-Core | Single-Core
HWBOT x265 Benchmark v2.2: 4k Preset
LibreOffice : 20 Documents To PDF
R Benchmark 2.5: Overall mean
| CPU Performance rating | |
| Asus Zephyrus Duo 16 GX650PY-NM006W | |
| Lenovo Legion Pro 7 16IRX8H | |
| Medio Intel Core i9-13980HX | |
| Asus ROG Strix G16 G614JZ | |
| Razer Blade 16 Early 2023 | |
| Media de la clase Gaming | |
| Gigabyte AERO 16 OLED BSF | |
| Asus TUF Gaming A16 FA617 | |
| Cinebench R23 / Multi Core | |
| Asus Zephyrus Duo 16 GX650PY-NM006W | |
| Medio Intel Core i9-13980HX (28301 - 33052, n=11) | |
| Lenovo Legion Pro 7 16IRX8H | |
| Asus ROG Strix G16 G614JZ | |
| Razer Blade 16 Early 2023 | |
| Media de la clase Gaming (10488 - 40970, n=110, últimos 2 años) | |
| Gigabyte AERO 16 OLED BSF | |
| Asus TUF Gaming A16 FA617 | |
| Cinebench R23 / Single Core | |
| Asus ROG Strix G16 G614JZ | |
| Medio Intel Core i9-13980HX (1825 - 2169, n=9) | |
| Lenovo Legion Pro 7 16IRX8H | |
| Razer Blade 16 Early 2023 | |
| Media de la clase Gaming (1166 - 2356, n=110, últimos 2 años) | |
| Asus Zephyrus Duo 16 GX650PY-NM006W | |
| Gigabyte AERO 16 OLED BSF | |
| Asus TUF Gaming A16 FA617 | |
| Cinebench R20 / CPU (Multi Core) | |
| Asus Zephyrus Duo 16 GX650PY-NM006W | |
| Medio Intel Core i9-13980HX (10353 - 12437, n=10) | |
| Asus ROG Strix G16 G614JZ | |
| Lenovo Legion Pro 7 16IRX8H | |
| Media de la clase Gaming (4029 - 16108, n=109, últimos 2 años) | |
| Razer Blade 16 Early 2023 | |
| Gigabyte AERO 16 OLED BSF | |
| Asus TUF Gaming A16 FA617 | |
| Cinebench R20 / CPU (Single Core) | |
| Asus ROG Strix G16 G614JZ | |
| Medio Intel Core i9-13980HX (717 - 825, n=10) | |
| Lenovo Legion Pro 7 16IRX8H | |
| Media de la clase Gaming (442 - 895, n=109, últimos 2 años) | |
| Asus Zephyrus Duo 16 GX650PY-NM006W | |
| Razer Blade 16 Early 2023 | |
| Gigabyte AERO 16 OLED BSF | |
| Asus TUF Gaming A16 FA617 | |
| Cinebench R15 / CPU Multi 64Bit | |
| Asus Zephyrus Duo 16 GX650PY-NM006W | |
| Lenovo Legion Pro 7 16IRX8H | |
| Asus ROG Strix G16 G614JZ | |
| Asus ROG Strix G16 G614JZ | |
| Medio Intel Core i9-13980HX (4358 - 5172, n=11) | |
| Razer Blade 16 Early 2023 | |
| Media de la clase Gaming (1578 - 6271, n=109, últimos 2 años) | |
| Gigabyte AERO 16 OLED BSF | |
| Asus TUF Gaming A16 FA617 | |
| Cinebench R15 / CPU Single 64Bit | |
| Asus Zephyrus Duo 16 GX650PY-NM006W | |
| Asus ROG Strix G16 G614JZ | |
| Asus ROG Strix G16 G614JZ | |
| Medio Intel Core i9-13980HX (289 - 312, n=11) | |
| Lenovo Legion Pro 7 16IRX8H | |
| Media de la clase Gaming (188.8 - 343, n=109, últimos 2 años) | |
| Razer Blade 16 Early 2023 | |
| Asus TUF Gaming A16 FA617 | |
| Gigabyte AERO 16 OLED BSF | |
| Blender / v2.79 BMW27 CPU | |
| Asus TUF Gaming A16 FA617 | |
| Gigabyte AERO 16 OLED BSF | |
| Media de la clase Gaming (80 - 330, n=107, últimos 2 años) | |
| Razer Blade 16 Early 2023 | |
| Medio Intel Core i9-13980HX (97 - 136, n=10) | |
| Asus ROG Strix G16 G614JZ | |
| Lenovo Legion Pro 7 16IRX8H | |
| Asus Zephyrus Duo 16 GX650PY-NM006W | |
| 7-Zip 18.03 / 7z b 4 | |
| Asus Zephyrus Duo 16 GX650PY-NM006W | |
| Lenovo Legion Pro 7 16IRX8H | |
| Medio Intel Core i9-13980HX (104616 - 129804, n=10) | |
| Asus ROG Strix G16 G614JZ | |
| Razer Blade 16 Early 2023 | |
| Media de la clase Gaming (33491 - 148086, n=108, últimos 2 años) | |
| Gigabyte AERO 16 OLED BSF | |
| Asus TUF Gaming A16 FA617 | |
| 7-Zip 18.03 / 7z b 4 -mmt1 | |
| Asus Zephyrus Duo 16 GX650PY-NM006W | |
| Lenovo Legion Pro 7 16IRX8H | |
| Medio Intel Core i9-13980HX (6230 - 7163, n=10) | |
| Asus ROG Strix G16 G614JZ | |
| Razer Blade 16 Early 2023 | |
| Media de la clase Gaming (4199 - 7436, n=108, últimos 2 años) | |
| Asus TUF Gaming A16 FA617 | |
| Gigabyte AERO 16 OLED BSF | |
| Geekbench 5.5 / Multi-Core | |
| Lenovo Legion Pro 7 16IRX8H | |
| Medio Intel Core i9-13980HX (18475 - 22200, n=10) | |
| Asus Zephyrus Duo 16 GX650PY-NM006W | |
| Asus ROG Strix G16 G614JZ | |
| Razer Blade 16 Early 2023 | |
| Media de la clase Gaming (6460 - 27010, n=108, últimos 2 años) | |
| Gigabyte AERO 16 OLED BSF | |
| Asus TUF Gaming A16 FA617 | |
| Geekbench 5.5 / Single-Core | |
| Asus Zephyrus Duo 16 GX650PY-NM006W | |
| Medio Intel Core i9-13980HX (1796 - 2139, n=10) | |
| Media de la clase Gaming (986 - 2474, n=108, últimos 2 años) | |
| Asus ROG Strix G16 G614JZ | |
| Lenovo Legion Pro 7 16IRX8H | |
| Razer Blade 16 Early 2023 | |
| Gigabyte AERO 16 OLED BSF | |
| Asus TUF Gaming A16 FA617 | |
| HWBOT x265 Benchmark v2.2 / 4k Preset | |
| Asus Zephyrus Duo 16 GX650PY-NM006W | |
| Lenovo Legion Pro 7 16IRX8H | |
| Medio Intel Core i9-13980HX (27 - 33.4, n=9) | |
| Asus ROG Strix G16 G614JZ | |
| Razer Blade 16 Early 2023 | |
| Media de la clase Gaming (11.5 - 44.3, n=108, últimos 2 años) | |
| Gigabyte AERO 16 OLED BSF | |
| Asus TUF Gaming A16 FA617 | |
| LibreOffice / 20 Documents To PDF | |
| Asus Zephyrus Duo 16 GX650PY-NM006W | |
| Asus TUF Gaming A16 FA617 | |
| Gigabyte AERO 16 OLED BSF | |
| Media de la clase Gaming (19 - 88.8, n=108, últimos 2 años) | |
| Asus ROG Strix G16 G614JZ | |
| Razer Blade 16 Early 2023 | |
| Lenovo Legion Pro 7 16IRX8H | |
| Medio Intel Core i9-13980HX (35 - 51.4, n=10) | |
| R Benchmark 2.5 / Overall mean | |
| Asus TUF Gaming A16 FA617 | |
| Gigabyte AERO 16 OLED BSF | |
| Media de la clase Gaming (0.3439 - 0.759, n=109, últimos 2 años) | |
| Razer Blade 16 Early 2023 | |
| Asus Zephyrus Duo 16 GX650PY-NM006W | |
| Lenovo Legion Pro 7 16IRX8H | |
| Medio Intel Core i9-13980HX (0.3793 - 0.4462, n=10) | |
| Asus ROG Strix G16 G614JZ | |
* ... más pequeño es mejor
AIDA64: FP32 Ray-Trace | FPU Julia | CPU SHA3 | CPU Queen | FPU SinJulia | FPU Mandel | CPU AES | CPU ZLib | FP64 Ray-Trace | CPU PhotoWorxx
| Performance rating | |
| Lenovo Legion Pro 7 16IRX8H | |
| Medio Intel Core i9-13980HX | |
| Asus ROG Strix G16 G614JZ | |
| Media de la clase Gaming | |
| Razer Blade 16 Early 2023 | |
| Gigabyte AERO 16 OLED BSF | |
| Asus TUF Gaming A16 FA617 | |
| AIDA64 / FP32 Ray-Trace | |
| Media de la clase Gaming (10227 - 85542, n=107, últimos 2 años) | |
| Asus ROG Strix G16 G614JZ | |
| Lenovo Legion Pro 7 16IRX8H | |
| Medio Intel Core i9-13980HX (21332 - 29553, n=9) | |
| Razer Blade 16 Early 2023 | |
| Razer Blade 16 Early 2023 | |
| Razer Blade 16 Early 2023 | |
| Gigabyte AERO 16 OLED BSF | |
| Asus TUF Gaming A16 FA617 | |
| AIDA64 / FPU Julia | |
| Media de la clase Gaming (51376 - 238426, n=107, últimos 2 años) | |
| Lenovo Legion Pro 7 16IRX8H | |
| Medio Intel Core i9-13980HX (108001 - 148168, n=9) | |
| Asus ROG Strix G16 G614JZ | |
| Razer Blade 16 Early 2023 | |
| Razer Blade 16 Early 2023 | |
| Razer Blade 16 Early 2023 | |
| Asus TUF Gaming A16 FA617 | |
| Gigabyte AERO 16 OLED BSF | |
| AIDA64 / CPU SHA3 | |
| Lenovo Legion Pro 7 16IRX8H | |
| Asus ROG Strix G16 G614JZ | |
| Medio Intel Core i9-13980HX (5264 - 7142, n=9) | |
| Razer Blade 16 Early 2023 | |
| Razer Blade 16 Early 2023 | |
| Razer Blade 16 Early 2023 | |
| Media de la clase Gaming (2180 - 9817, n=107, últimos 2 años) | |
| Gigabyte AERO 16 OLED BSF | |
| Asus TUF Gaming A16 FA617 | |
| AIDA64 / CPU Queen | |
| Asus ROG Strix G16 G614JZ | |
| Medio Intel Core i9-13980HX (126758 - 143409, n=9) | |
| Razer Blade 16 Early 2023 | |
| Razer Blade 16 Early 2023 | |
| Lenovo Legion Pro 7 16IRX8H | |
| Media de la clase Gaming (49785 - 173351, n=98, últimos 2 años) | |
| Asus TUF Gaming A16 FA617 | |
| Gigabyte AERO 16 OLED BSF | |
| AIDA64 / FPU SinJulia | |
| Asus ROG Strix G16 G614JZ | |
| Medio Intel Core i9-13980HX (13785 - 17117, n=9) | |
| Razer Blade 16 Early 2023 | |
| Razer Blade 16 Early 2023 | |
| Razer Blade 16 Early 2023 | |
| Lenovo Legion Pro 7 16IRX8H | |
| Media de la clase Gaming (4424 - 33636, n=107, últimos 2 años) | |
| Asus TUF Gaming A16 FA617 | |
| Gigabyte AERO 16 OLED BSF | |
| AIDA64 / FPU Mandel | |
| Media de la clase Gaming (25115 - 128721, n=107, últimos 2 años) | |
| Lenovo Legion Pro 7 16IRX8H | |
| Medio Intel Core i9-13980HX (53398 - 73758, n=9) | |
| Asus ROG Strix G16 G614JZ | |
| Razer Blade 16 Early 2023 | |
| Razer Blade 16 Early 2023 | |
| Razer Blade 16 Early 2023 | |
| Asus TUF Gaming A16 FA617 | |
| Gigabyte AERO 16 OLED BSF | |
| AIDA64 / CPU AES | |
| Razer Blade 16 Early 2023 | |
| Razer Blade 16 Early 2023 | |
| Razer Blade 16 Early 2023 | |
| Gigabyte AERO 16 OLED BSF | |
| Asus ROG Strix G16 G614JZ | |
| Lenovo Legion Pro 7 16IRX8H | |
| Medio Intel Core i9-13980HX (105169 - 136520, n=9) | |
| Media de la clase Gaming (39258 - 247074, n=107, últimos 2 años) | |
| Asus TUF Gaming A16 FA617 | |
| AIDA64 / CPU ZLib | |
| Lenovo Legion Pro 7 16IRX8H | |
| Asus ROG Strix G16 G614JZ | |
| Medio Intel Core i9-13980HX (1513 - 2039, n=9) | |
| Razer Blade 16 Early 2023 | |
| Razer Blade 16 Early 2023 | |
| Razer Blade 16 Early 2023 | |
| Media de la clase Gaming (574 - 2531, n=107, últimos 2 años) | |
| Gigabyte AERO 16 OLED BSF | |
| Asus TUF Gaming A16 FA617 | |
| AIDA64 / FP64 Ray-Trace | |
| Media de la clase Gaming (5509 - 45446, n=107, últimos 2 años) | |
| Lenovo Legion Pro 7 16IRX8H | |
| Asus ROG Strix G16 G614JZ | |
| Medio Intel Core i9-13980HX (11431 - 16325, n=9) | |
| Razer Blade 16 Early 2023 | |
| Razer Blade 16 Early 2023 | |
| Razer Blade 16 Early 2023 | |
| Gigabyte AERO 16 OLED BSF | |
| Asus TUF Gaming A16 FA617 | |
| AIDA64 / CPU PhotoWorxx | |
| Razer Blade 16 Early 2023 | |
| Razer Blade 16 Early 2023 | |
| Razer Blade 16 Early 2023 | |
| Lenovo Legion Pro 7 16IRX8H | |
| Medio Intel Core i9-13980HX (37069 - 52949, n=9) | |
| Gigabyte AERO 16 OLED BSF | |
| Media de la clase Gaming (12271 - 89891, n=107, últimos 2 años) | |
| Asus ROG Strix G16 G614JZ | |
| Asus TUF Gaming A16 FA617 | |
Rendimiento del sistema
En el test PCMark 10, el Asus ROG Strix G16 queda por detrás de muchos competidores con hardware similar. La caída de rendimiento se da en la subsección Productividad, que tiene en cuenta el rendimiento de la RAM y el disco duro. Ambos son subóptimos en el ROG Strix G16 en comparación con otros portátiles de juego actuales. No obstante, no se puede hablar de valores bajos aquí, ya que el Asus ROG Strix sigue estando muy por encima de la media de portátiles para juegos.
Que el portátil es muy potente queda claro cuando miras los resultados de Crossmark así como PCMark 10 Essentials y Content Creation: el Asus ROG Strix G16 está equipado para todas las eventualidades. Aparte de su principal competencia en juegos, el portátil también es muy versátil en el uso diario. El potente hardware de computación asegura tiempos de carga cortos y un sistema muy sensible.
CrossMark: Overall | Productivity | Creativity | Responsiveness
| PCMark 10 / Score | |
| Asus Zephyrus Duo 16 GX650PY-NM006W | |
| Asus ROG Strix Scar 18 2023 G834JY-N6005W | |
| Media de la clase Gaming (5828 - 11574, n=95, últimos 2 años) | |
| Gigabyte AERO 16 OLED BSF | |
| Razer Blade 16 Early 2023 | |
| Lenovo Legion Pro 7 16IRX8H | |
| Asus TUF Gaming A16 FA617 | |
| Asus ROG Strix G16 G614JZ | |
| Medio Intel Core i9-13980HX, NVIDIA GeForce RTX 4080 Laptop GPU (n=1) | |
| Asus ROG Strix G18 G814JI | |
| PCMark 10 / Essentials | |
| Asus Zephyrus Duo 16 GX650PY-NM006W | |
| Asus ROG Strix G16 G614JZ | |
| Medio Intel Core i9-13980HX, NVIDIA GeForce RTX 4080 Laptop GPU (n=1) | |
| Lenovo Legion Pro 7 16IRX8H | |
| Gigabyte AERO 16 OLED BSF | |
| Razer Blade 16 Early 2023 | |
| Media de la clase Gaming (8810 - 12600, n=99, últimos 2 años) | |
| Asus TUF Gaming A16 FA617 | |
| Asus ROG Strix G18 G814JI | |
| PCMark 10 / Productivity | |
| Asus Zephyrus Duo 16 GX650PY-NM006W | |
| Lenovo Legion Pro 7 16IRX8H | |
| Media de la clase Gaming (6845 - 18766, n=97, últimos 2 años) | |
| Asus TUF Gaming A16 FA617 | |
| Gigabyte AERO 16 OLED BSF | |
| Asus ROG Strix G18 G814JI | |
| Razer Blade 16 Early 2023 | |
| Asus ROG Strix G16 G614JZ | |
| Medio Intel Core i9-13980HX, NVIDIA GeForce RTX 4080 Laptop GPU (n=1) | |
| PCMark 10 / Digital Content Creation | |
| Razer Blade 16 Early 2023 | |
| Asus Zephyrus Duo 16 GX650PY-NM006W | |
| Media de la clase Gaming (7602 - 19657, n=97, últimos 2 años) | |
| Gigabyte AERO 16 OLED BSF | |
| Asus ROG Strix G16 G614JZ | |
| Medio Intel Core i9-13980HX, NVIDIA GeForce RTX 4080 Laptop GPU (n=1) | |
| Asus TUF Gaming A16 FA617 | |
| Lenovo Legion Pro 7 16IRX8H | |
| Asus ROG Strix G18 G814JI | |
| CrossMark / Overall | |
| Asus ROG Strix G16 G614JZ | |
| Medio Intel Core i9-13980HX, NVIDIA GeForce RTX 4080 Laptop GPU (n=1) | |
| Asus ROG Strix Scar 18 2023 G834JY-N6005W | |
| Asus Zephyrus Duo 16 GX650PY-NM006W | |
| Media de la clase Gaming (1366 - 2409, n=96, últimos 2 años) | |
| Gigabyte AERO 16 OLED BSF | |
| Razer Blade 16 Early 2023 | |
| CrossMark / Productivity | |
| Asus ROG Strix G16 G614JZ | |
| Medio Intel Core i9-13980HX, NVIDIA GeForce RTX 4080 Laptop GPU (n=1) | |
| Asus Zephyrus Duo 16 GX650PY-NM006W | |
| Asus ROG Strix Scar 18 2023 G834JY-N6005W | |
| Media de la clase Gaming (1386 - 2254, n=96, últimos 2 años) | |
| Gigabyte AERO 16 OLED BSF | |
| Razer Blade 16 Early 2023 | |
| CrossMark / Creativity | |
| Asus ROG Strix Scar 18 2023 G834JY-N6005W | |
| Asus ROG Strix G16 G614JZ | |
| Medio Intel Core i9-13980HX, NVIDIA GeForce RTX 4080 Laptop GPU (n=1) | |
| Asus Zephyrus Duo 16 GX650PY-NM006W | |
| Media de la clase Gaming (1343 - 2729, n=96, últimos 2 años) | |
| Gigabyte AERO 16 OLED BSF | |
| Razer Blade 16 Early 2023 | |
| CrossMark / Responsiveness | |
| Asus ROG Strix G16 G614JZ | |
| Medio Intel Core i9-13980HX, NVIDIA GeForce RTX 4080 Laptop GPU (n=1) | |
| Gigabyte AERO 16 OLED BSF | |
| Media de la clase Gaming (1226 - 2334, n=96, últimos 2 años) | |
| Asus Zephyrus Duo 16 GX650PY-NM006W | |
| Asus ROG Strix Scar 18 2023 G834JY-N6005W | |
| Razer Blade 16 Early 2023 | |
| PCMark 10 Score | 7223 puntos | |
ayuda | ||
| AIDA64 / Memory Copy | |
| Razer Blade 16 Early 2023 | |
| Razer Blade 16 Early 2023 | |
| Razer Blade 16 Early 2023 | |
| Lenovo Legion Pro 7 16IRX8H | |
| Media de la clase Gaming (21750 - 129946, n=107, últimos 2 años) | |
| Medio Intel Core i9-13980HX (62189 - 80776, n=9) | |
| Asus ROG Strix Scar 18 2023 G834JY-N6005W | |
| Gigabyte AERO 16 OLED BSF | |
| Asus ROG Strix G18 G814JI | |
| Asus ROG Strix G16 G614JZ | |
| Asus TUF Gaming A16 FA617 | |
| AIDA64 / Memory Read | |
| Razer Blade 16 Early 2023 | |
| Razer Blade 16 Early 2023 | |
| Razer Blade 16 Early 2023 | |
| Lenovo Legion Pro 7 16IRX8H | |
| Medio Intel Core i9-13980HX (62624 - 89096, n=9) | |
| Asus ROG Strix Scar 18 2023 G834JY-N6005W | |
| Media de la clase Gaming (22956 - 118858, n=107, últimos 2 años) | |
| Asus ROG Strix G16 G614JZ | |
| Asus ROG Strix G18 G814JI | |
| Gigabyte AERO 16 OLED BSF | |
| Asus TUF Gaming A16 FA617 | |
| AIDA64 / Memory Write | |
| Razer Blade 16 Early 2023 | |
| Razer Blade 16 Early 2023 | |
| Razer Blade 16 Early 2023 | |
| Media de la clase Gaming (22297 - 135096, n=107, últimos 2 años) | |
| Lenovo Legion Pro 7 16IRX8H | |
| Medio Intel Core i9-13980HX (59912 - 79917, n=9) | |
| Gigabyte AERO 16 OLED BSF | |
| Asus ROG Strix Scar 18 2023 G834JY-N6005W | |
| Asus ROG Strix G18 G814JI | |
| Asus ROG Strix G16 G614JZ | |
| Asus TUF Gaming A16 FA617 | |
| AIDA64 / Memory Latency | |
| Media de la clase Gaming (75.3 - 259, n=107, últimos 2 años) | |
| Razer Blade 16 Early 2023 | |
| Razer Blade 16 Early 2023 | |
| Razer Blade 16 Early 2023 | |
| Gigabyte AERO 16 OLED BSF | |
| Asus ROG Strix Scar 18 2023 G834JY-N6005W | |
| Asus ROG Strix G16 G614JZ | |
| Medio Intel Core i9-13980HX (79.4 - 93.2, n=9) | |
| Asus TUF Gaming A16 FA617 | |
| Asus ROG Strix G18 G814JI | |
| Lenovo Legion Pro 7 16IRX8H | |
* ... más pequeño es mejor
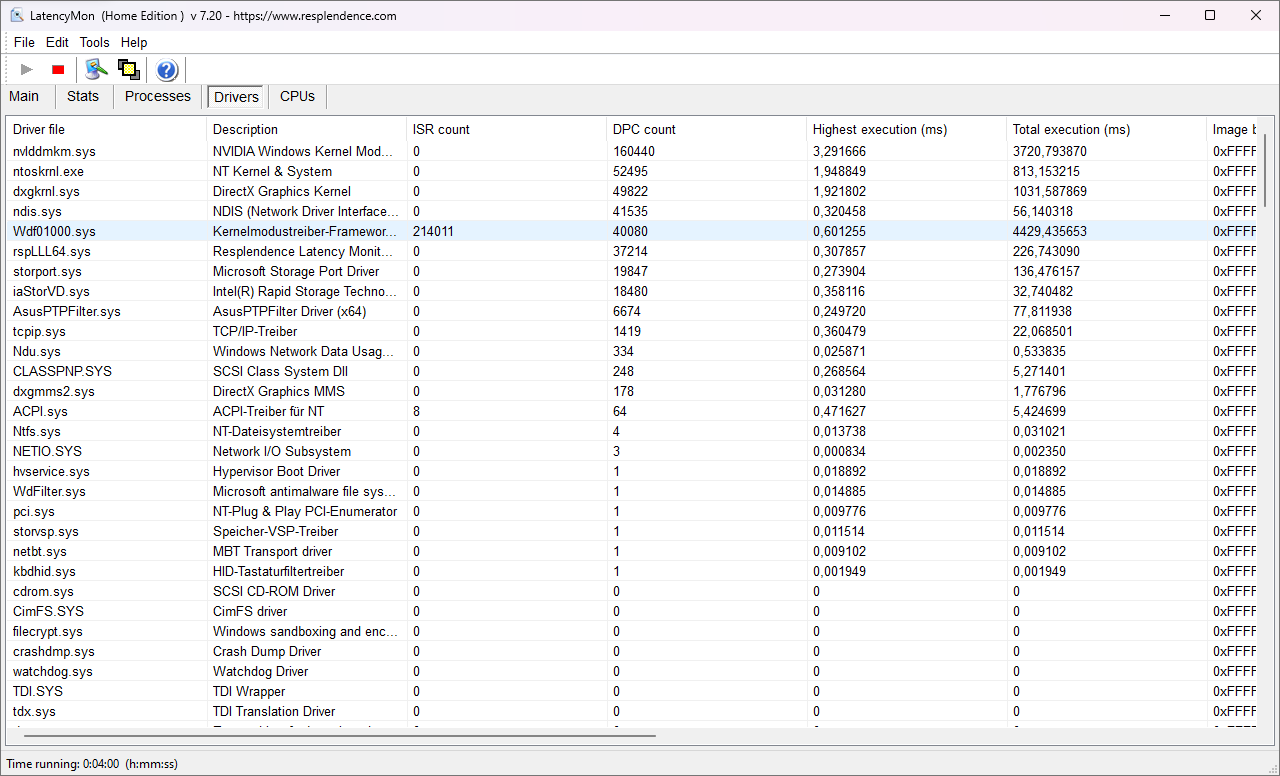
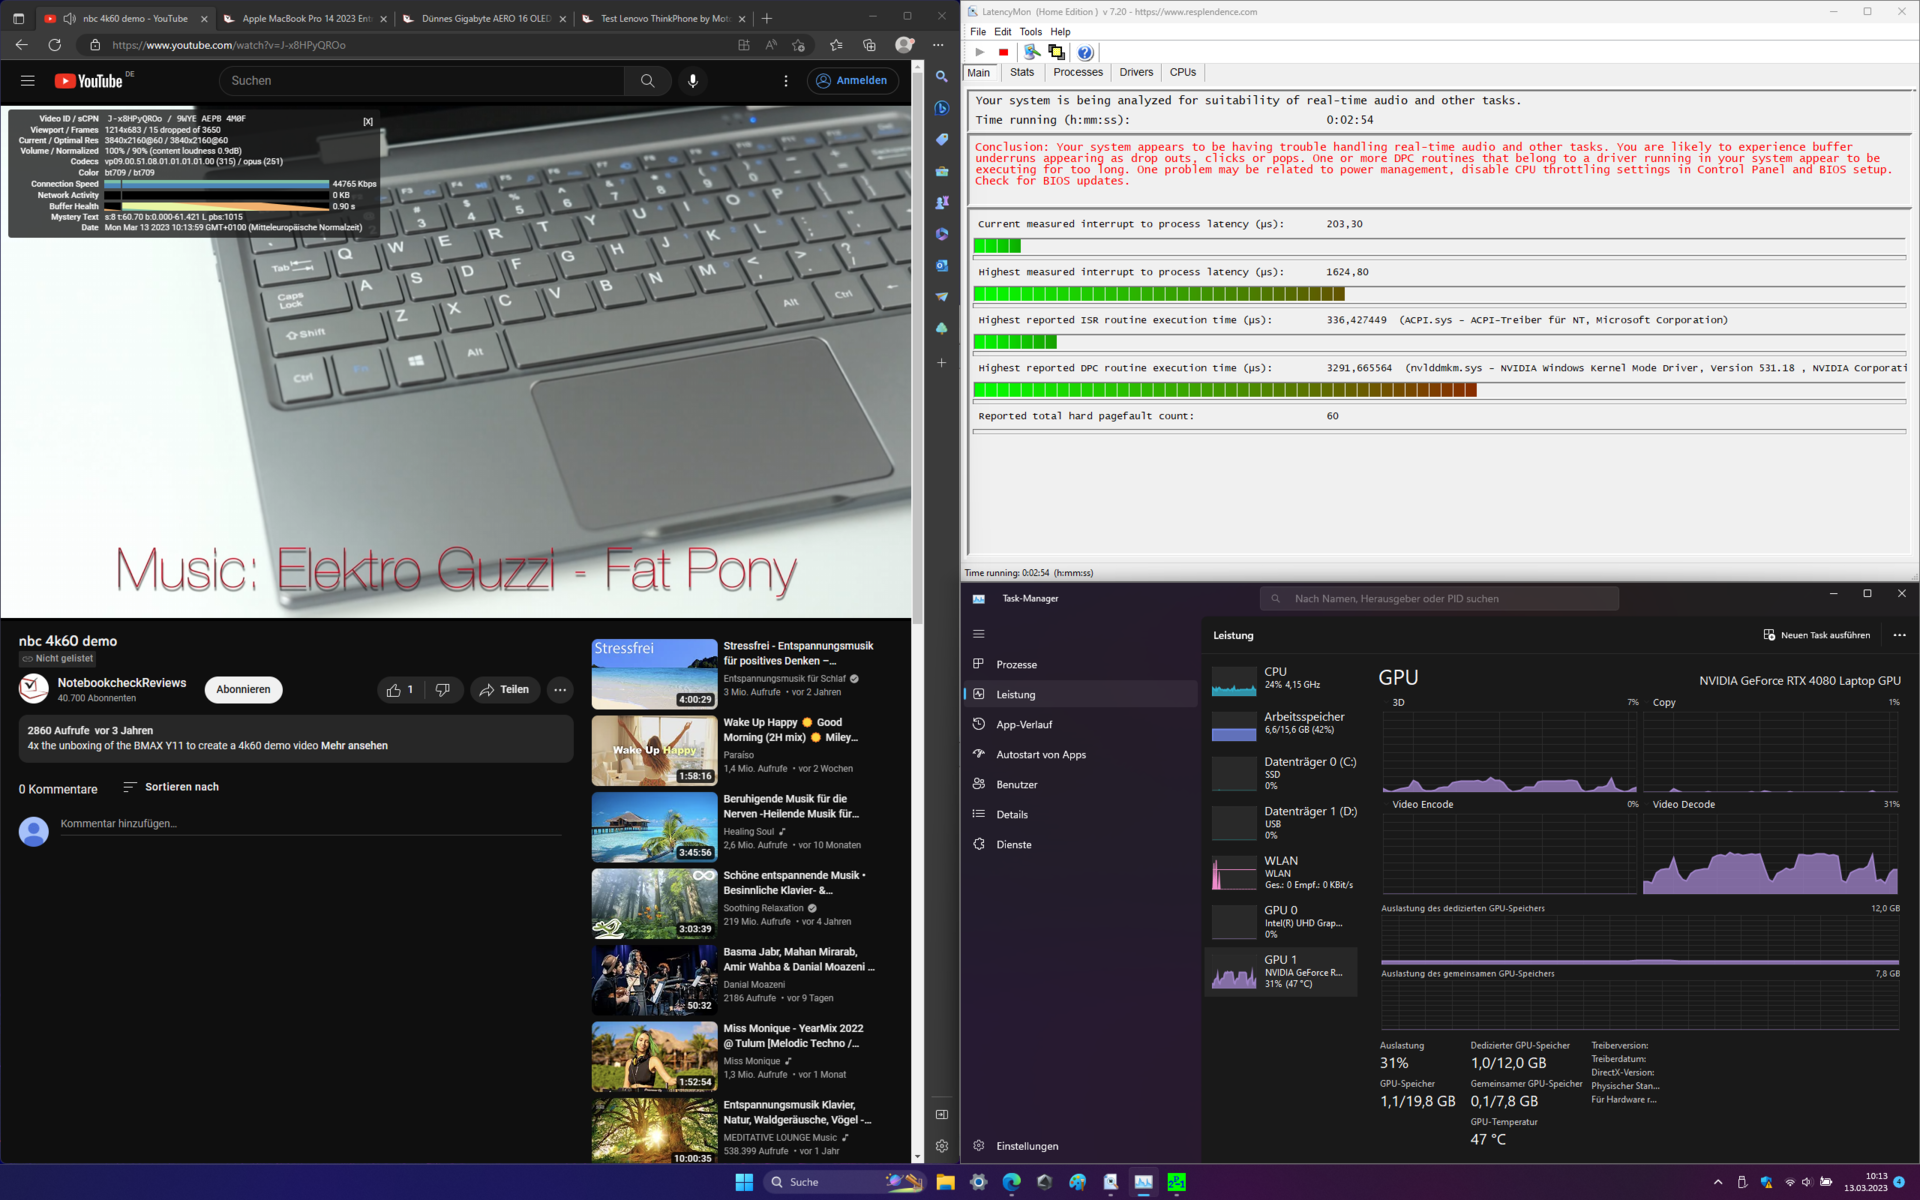
Latencia del CPD
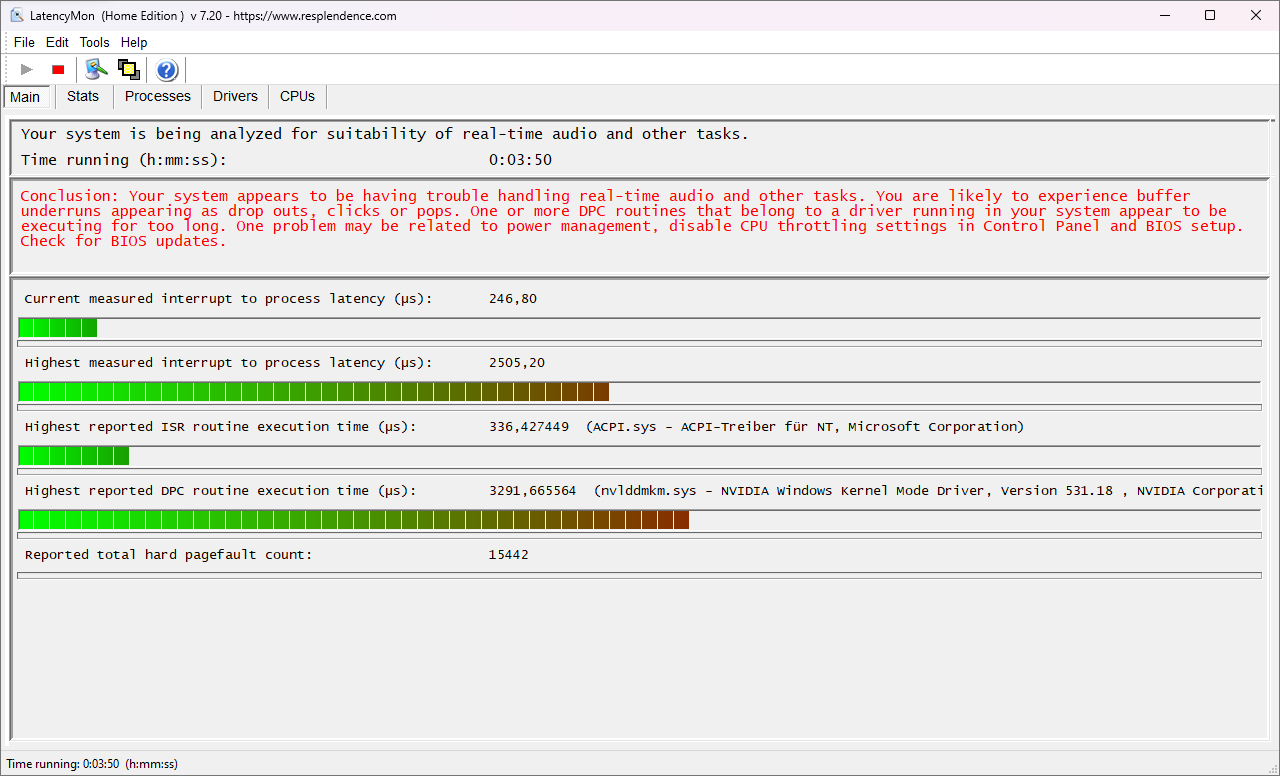
En la configuración actual del driver en el momento del análisis, las latencias DPC del ROG Strix G16 eran relativamente altas. Las aplicaciones en tiempo real como el procesado de audio podrían tener problemas aquí.
| DPC Latencies / LatencyMon - interrupt to process latency (max), Web, Youtube, Prime95 | |
| Asus Zephyrus Duo 16 GX650PY-NM006W | |
| Asus ROG Strix G16 G614JZ | |
| Razer Blade 16 Early 2023 | |
| Gigabyte AERO 16 OLED BSF | |
| Lenovo Legion Pro 7 16IRX8H | |
| Asus TUF Gaming A16 FA617 | |
* ... más pequeño es mejor
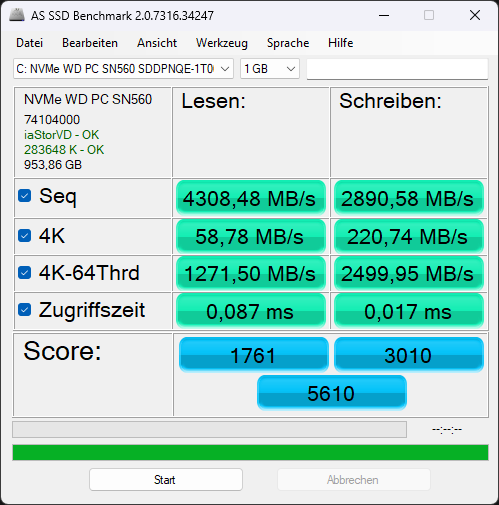
Dispositivos de almacenamiento
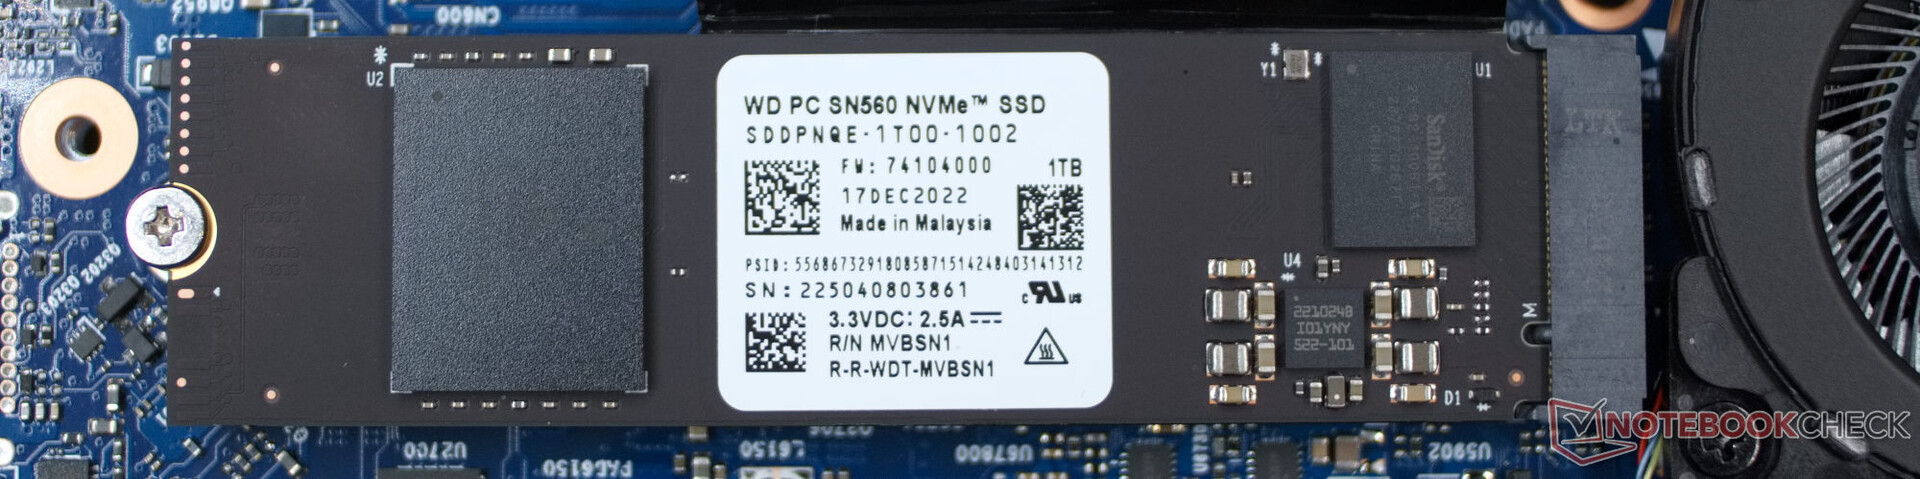
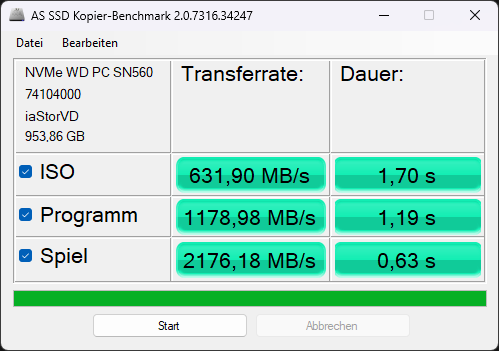
El Western Digital PC SN560 NVMe SSD no es realmente lento, pero no se acerca a los rapidísimos discos duros de otros portátiles de juego en el campo de comparación. Así que el SSD tiene que conformarse con un lugar en el medio campo. Para el rendimiento del Asus ROG Strix G16, esto sólo significa pérdidas de rendimiento menores y posiblemente tiempos de carga ligeramente más largos en algunos juegos.

* ... más pequeño es mejor
Sustained Read Performance: DiskSpd Read Loop, Queue Depth 8
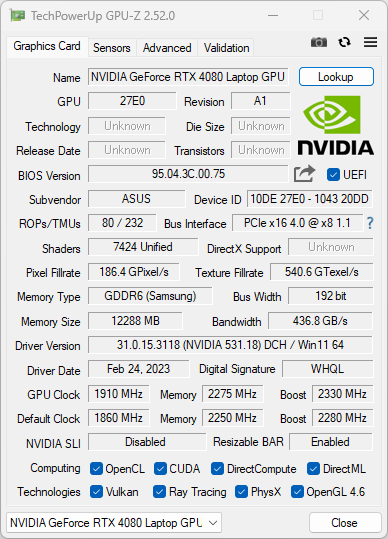
Tarjeta gráfica
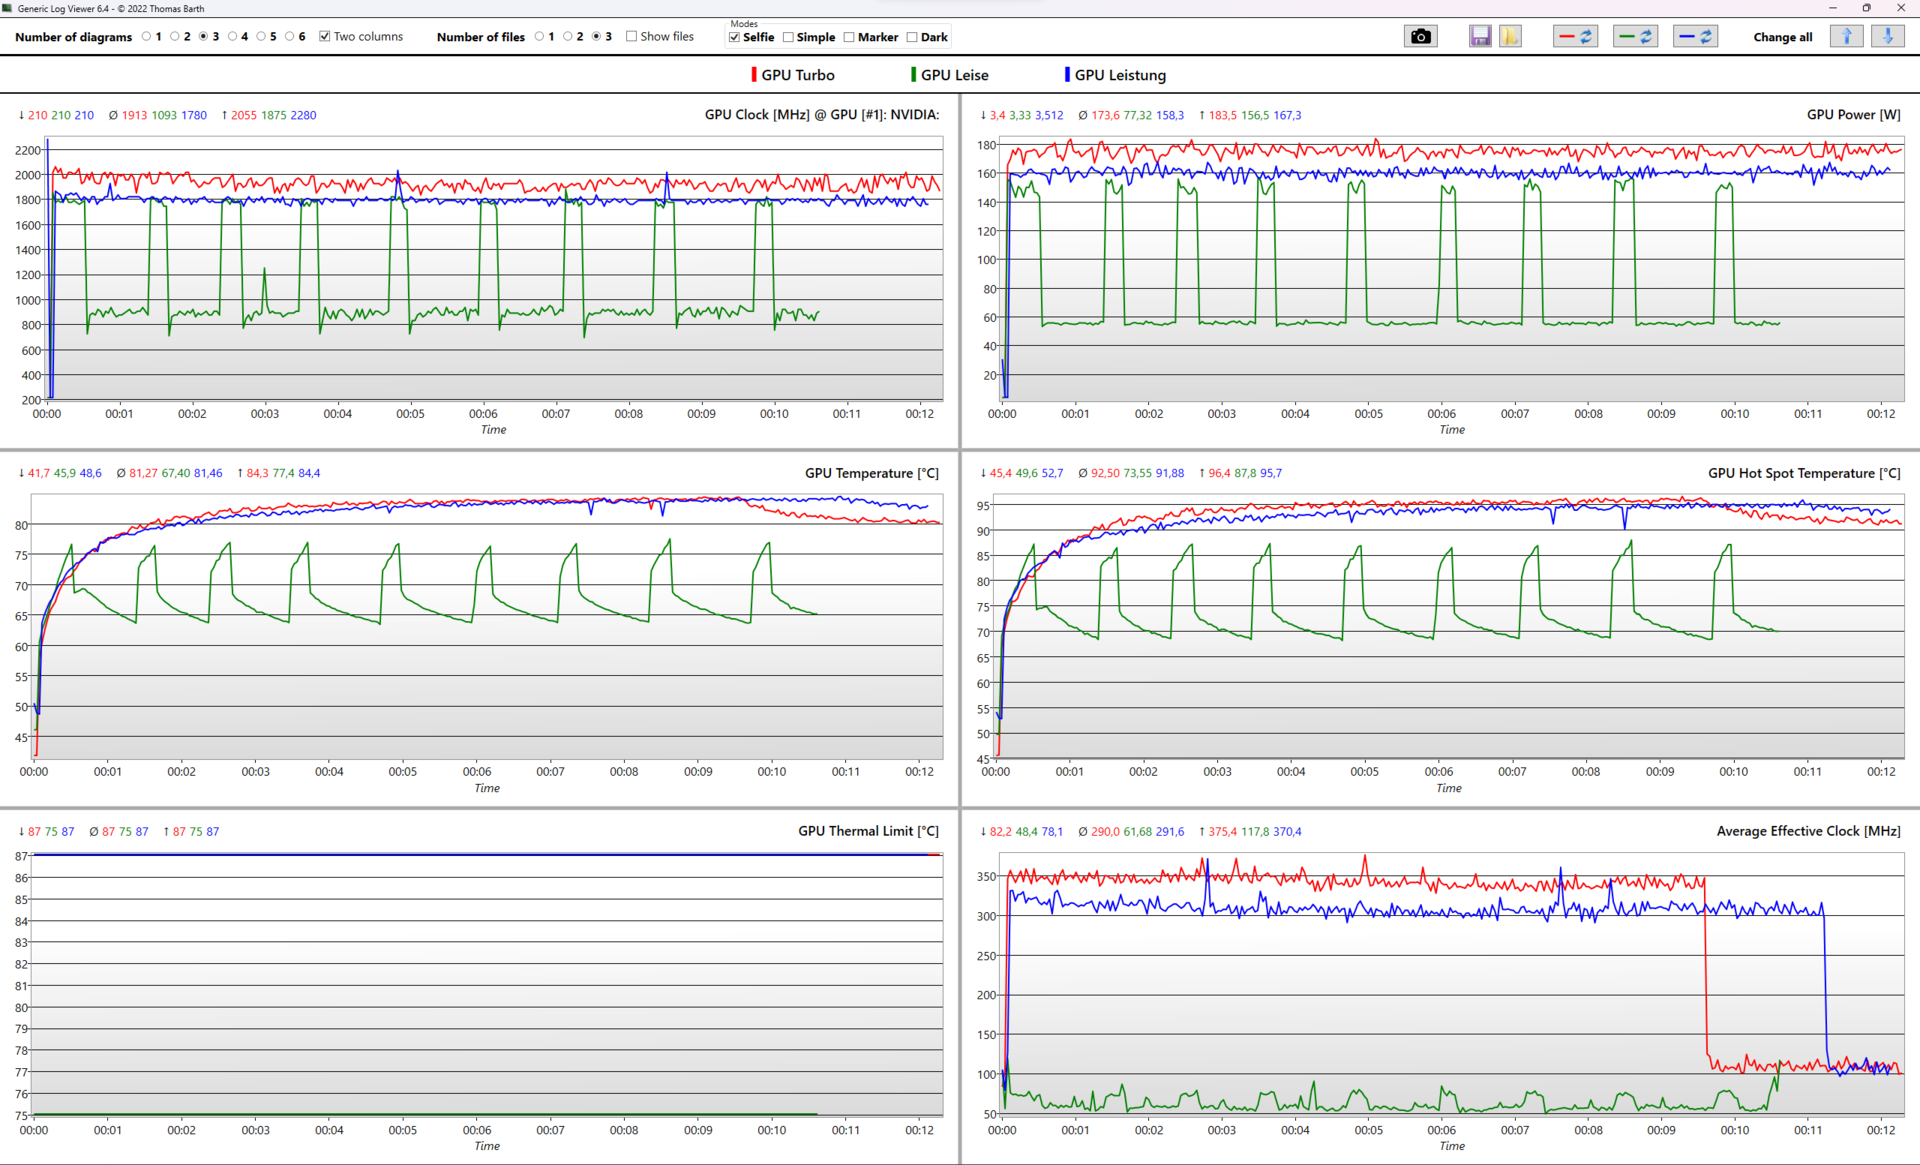
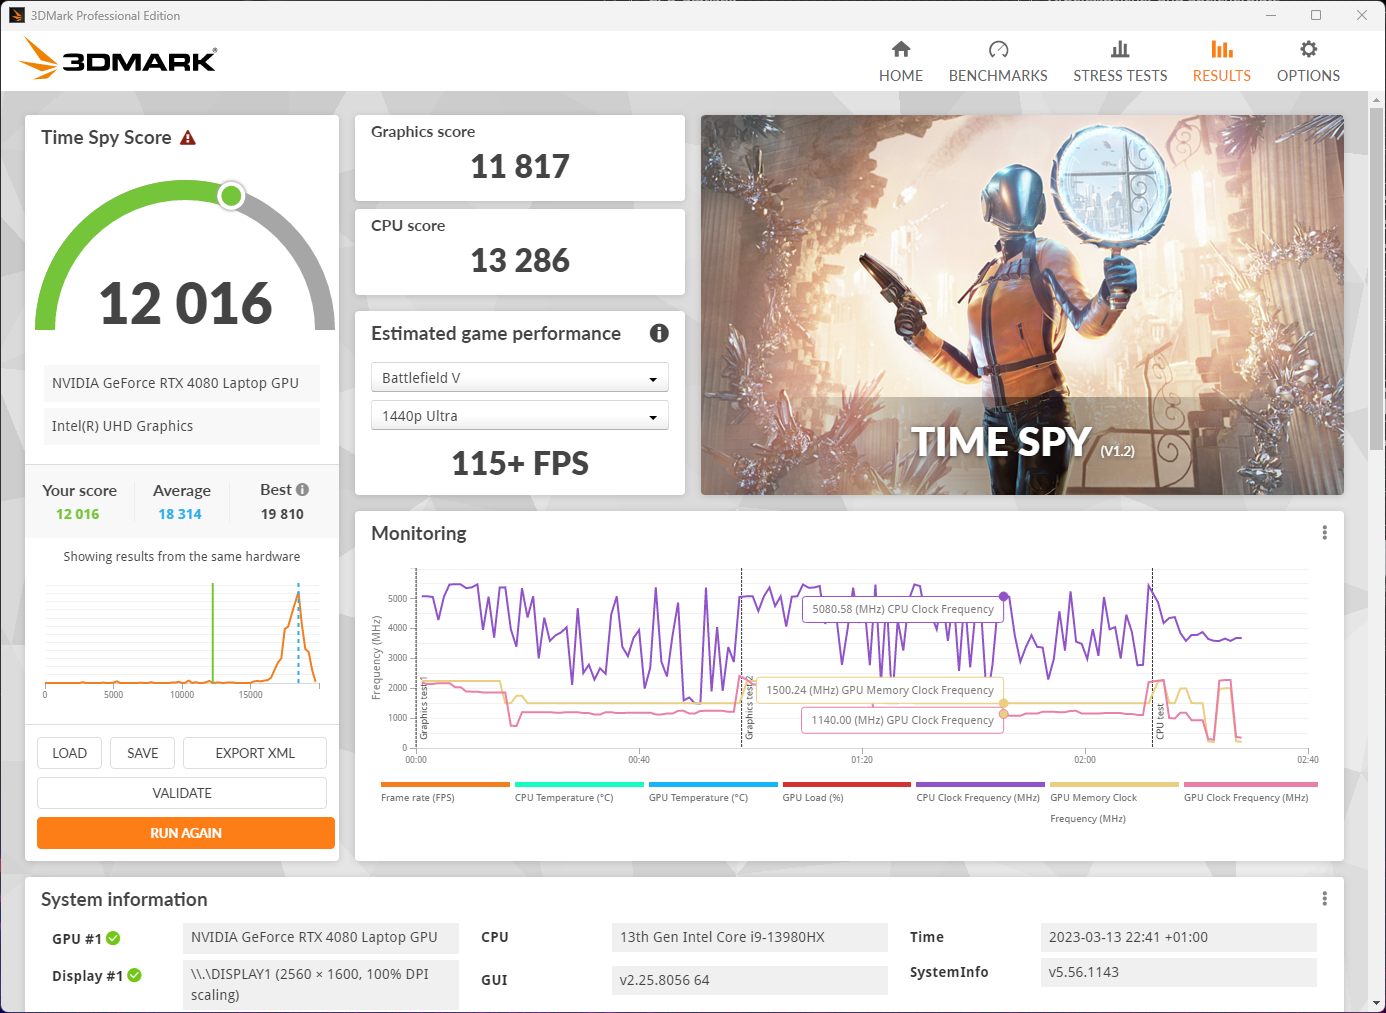
La RTX 4080 ocupa el segundo lugar en la última generación de tarjetas gráficas de Nvidia. El potente chip AD104 se apoya en 12 GB de memoria GDDR6X y ofrece un máximo de 7.680 shaders y 232 núcleos tensoriales. Asus también apuesta por altas tasas de rendimiento para el chip gráfico. En modo Turbo, la RTX 4080 es capaz de trabajar continuamente con unos 170 vatios. Esto pone el rendimiento gráfico del Strix G16 a una distancia sorprendente del Asus ROG Strix Scar 18. Sin embargo, este portátil tiene la RTX 4090 con una refrigeración similar. La RTX 4080 está por tanto en el punto dulce en términos de equilibrio entre opciones de refrigeración y rendimiento gráfico.
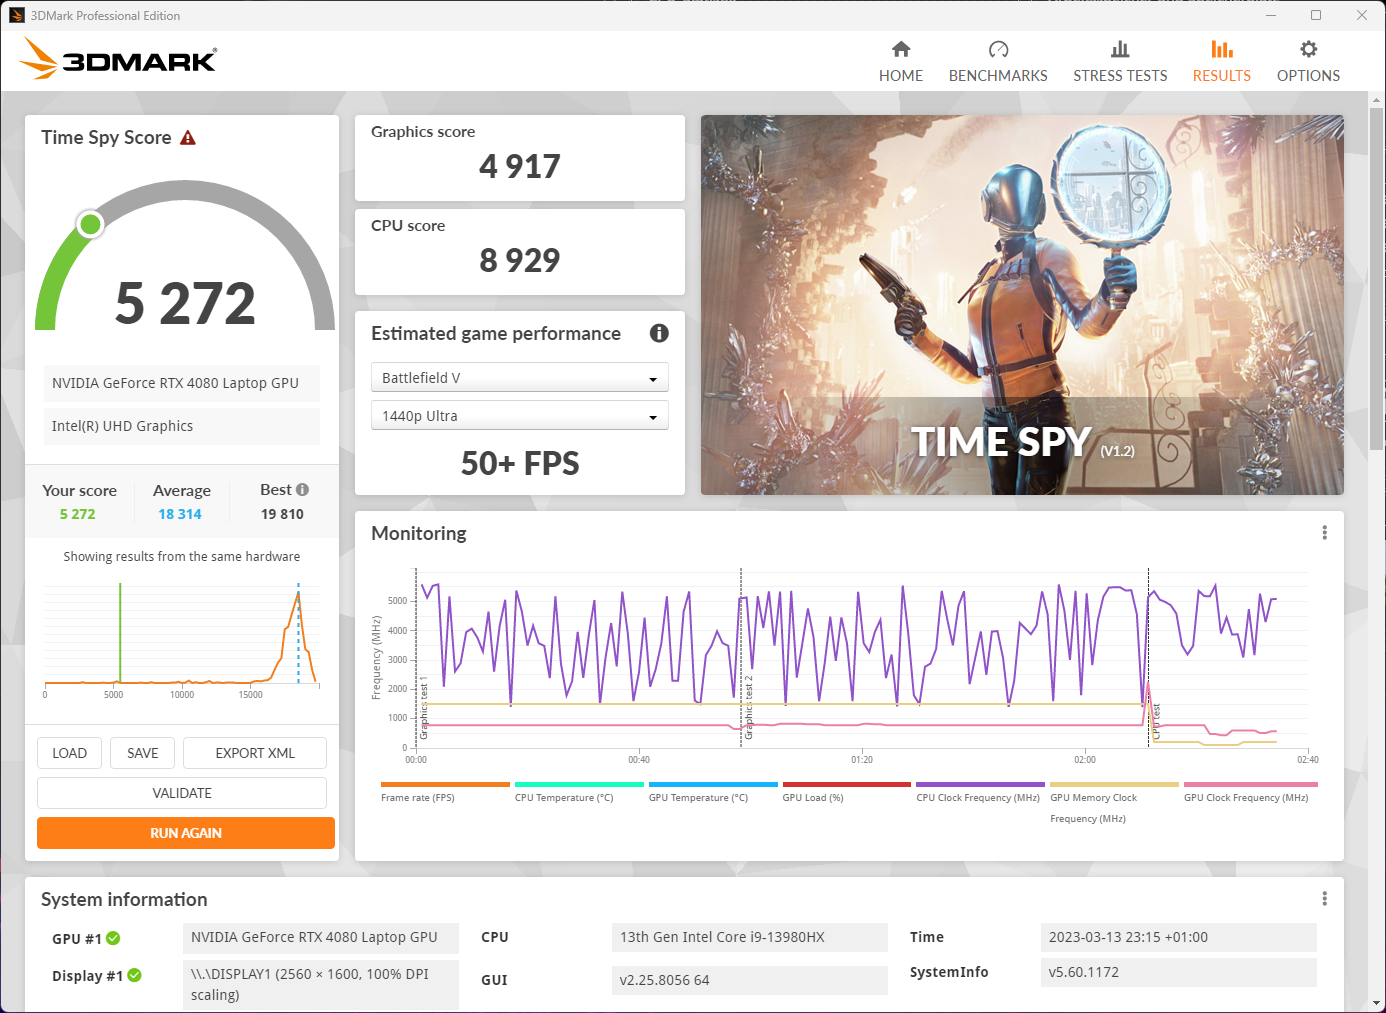
El alto rendimiento gráfico del ROG Strix G16 en modo silencioso también es interesante. Aquí podemos volver a hacer una comparación directa con otro dispositivo ROG de Asus: El ROG Strix G18 con su RTX 4070 logra 12.111 puntos en el benchmark Time Spy con el modo Rendimiento activado. La RTX 4080 del G16 logra 11.817 puntos en modo Silencio. Así que el portátil gaming puede funcionar en silencio sin sacrificar un buen rendimiento gráfico.


| 3DMark 11 Performance | 44528 puntos | |
| 3DMark Ice Storm Standard Score | 288532 puntos | |
| 3DMark Cloud Gate Standard Score | 72794 puntos | |
| 3DMark Fire Strike Score | 34456 puntos | |
| 3DMark Time Spy Score | 18495 puntos | |
ayuda | ||
* ... más pequeño es mejor
Rendimiento en juegos
Gracias a los amplios valores de rendimiento gráfico de la RTX 4080, es posible obtener altas frecuencias de cuadro (FPS) en muchos títulos actuales, incluso con los ajustes de máxima calidad y en resolución QHD. El chip gráfico también puede manejar bien el trazado de rayos. En la resolución nativa de 2560 × 1600, empero, los 240 Hz del display sólo pueden aprovecharse al máximo en juegos poco exigentes o con ajustes de calidad reducidos.
Tras los buenos resultados en modo silencioso, no perdimos la oportunidad de probar el rendimiento gaming del ROG Strix G16 también en este modo. El resultado: El modo silencioso es adecuado para jugar. Por lo tanto, aquellos que no buscan los más altos FPS no deben ser tímidos en el uso del modo. En el benchmark F1 22, hubo ocasionalmente sólo una diferencia de 30 FPS entre el modo Silencioso y el Rendimiento. La unidad gráfica también maneja muy bien el trazado de rayos a 72 FPS. Ninguno de los juegos probados se ralentizó a pesar de la baja refrigeración.
| The Witcher 3 - 1920x1080 Ultra Graphics & Postprocessing (HBAO+) | |
| Asus Zephyrus Duo 16 GX650PY-NM006W | |
| Lenovo Legion Pro 7 16IRX8H | |
| Razer Blade 16 Early 2023 | |
| Asus ROG Strix G16 G614JZ | |
| Media de la clase Gaming (95 - 240, n=8, últimos 2 años) | |
| Asus ROG Strix G18 G814JI | |
| Gigabyte AERO 16 OLED BSF | |
| Asus TUF Gaming A16 FA617 | |
| Hogwarts Legacy | |
| 1920x1080 Ultra Preset + Full Ray Tracing AA:High T | |
| Medio NVIDIA GeForce RTX 4080 Laptop GPU (53 - 66, n=2) | |
| Asus ROG Strix G16 G614JZ | |
| Asus ROG Strix G18 G814JI | |
| 2560x1440 Ultra Preset AA:High T | |
| Asus ROG Strix G16 G614JZ | |
| Medio NVIDIA GeForce RTX 4080 Laptop GPU (76 - 102, n=3) | |
| Media de la clase Gaming (52 - 96.8, n=2, últimos 2 años) | |
| Asus ROG Strix G18 G814JI | |
| 1920x1080 Ultra Preset AA:High T | |
| Asus ROG Strix G16 G614JZ | |
| Medio NVIDIA GeForce RTX 4080 Laptop GPU (108 - 131, n=3) | |
| Asus ROG Strix G18 G814JI | |
| Media de la clase Gaming (76 - 108.3, n=2, últimos 2 años) | |
| 1920x1080 High Preset AA:High T | |
| Asus ROG Strix G16 G614JZ | |
| Medio NVIDIA GeForce RTX 4080 Laptop GPU (134 - 161.6, n=3) | |
| Asus ROG Strix G18 G814JI | |
| Media de la clase Gaming (n=1últimos 2 años) | |
| GRID Legends | |
| 2560x1440 Ultra Preset | |
| Asus ROG Strix G16 G614JZ | |
| Medio NVIDIA GeForce RTX 4080 Laptop GPU (n=1) | |
| 1920x1080 Ultra Preset | |
| Asus ROG Strix G16 G614JZ | |
| Medio NVIDIA GeForce RTX 4080 Laptop GPU (n=1) | |
| 1920x1080 High Preset | |
| Asus ROG Strix G16 G614JZ | |
| Medio NVIDIA GeForce RTX 4080 Laptop GPU (n=1) | |
La prueba a largo plazo con Witcher 3 muestra que la G16 puede mantener su rendimiento durante largos periodos de tiempo. Las ligeras fluctuaciones en los FPS se deben al ciclo día-noche. Entre otras cosas, esto cambia el rango de visión en el juego.
Witcher 3 FPS Chart
| bajo | medio | alto | ultra | QHD | 4K | |
|---|---|---|---|---|---|---|
| GTA V (2015) | 186.9 | 186.4 | 183 | 146.1 | 131.4 | |
| The Witcher 3 (2015) | 175 | |||||
| Dota 2 Reborn (2015) | 233 | 205 | 193.9 | 180.7 | 182.6 | |
| Final Fantasy XV Benchmark (2018) | 224 | 201 | 168.1 | 128.3 | 74.2 | |
| X-Plane 11.11 (2018) | 192.2 | 181 | 138.8 | |||
| Strange Brigade (2018) | 497 | 399 | 369 | 338 | 241 | |
| GRID Legends (2022) | 241 | 220 | 199 | 187 | 158 | |
| Cyberpunk 2077 1.6 (2022) | 123.48 | 121.41 | 81.98 | |||
| F1 22 (2022) | 312 | 294 | 263 | 117 | ||
| FIFA 23 (2022) | 165 | 158 | 160 | 155 | ||
| Call of Duty Modern Warfare 2 2022 (2022) | 154 | 145 | 108 | |||
| Hogwarts Legacy (2023) | 207 | 178.5 | 161.6 | 131 | 102 |
Emisiones - El ROG Strix también puede ser silencioso
Ruido
Los tres ventiladores del ROG Strix G16 crean mucho viento, pero también una cantidad considerable de ruido, dependiendo de la configuración de potencia. A 52 dB(A), los ventiladores ahogan gran parte del ruido ambiental y también otros tipos de ruido del portátil que de otro modo serían audibles. Si se desea, el portátil de juegos también puede ser silencioso, pero esto no significa necesariamente que haya que depender de auriculares, ya que el portátil se mantiene en un rango tolerable con un máximo de 40 dB(A) en modo Silencioso y sigue teniendo potencia suficiente para jugar. Sin embargo, entonces se hace claramente audible un quejido de bobina. Cuando la CPU y la GPU están funcionando en modo Turbo, puedes oír pitar a los VRMs u otros componentes del portátil. Cuando se juega con los altavoces encendidos, el pitido de la bobina ya no es tan perceptible.
Ruido
| Ocioso |
| 26 / 28 / 30 dB(A) |
| Carga |
| 48 / 52 dB(A) |
 | ||
30 dB silencioso 40 dB(A) audible 50 dB(A) ruidosamente alto |
||
min: | ||
| Asus ROG Strix G16 G614JZ i9-13980HX, GeForce RTX 4080 Laptop GPU | Asus Zephyrus Duo 16 GX650PY-NM006W R9 7945HX, GeForce RTX 4090 Laptop GPU | Lenovo Legion Pro 7 16IRX8H i9-13900HX, GeForce RTX 4080 Laptop GPU | Gigabyte AERO 16 OLED BSF i9-13900H, GeForce RTX 4070 Laptop GPU | Asus TUF Gaming A16 FA617 R7 7735HS, Radeon RX 7600S | Razer Blade 16 Early 2023 i9-13950HX, GeForce RTX 4080 Laptop GPU | |
|---|---|---|---|---|---|---|
| Noise | -4% | -4% | 0% | 6% | 11% | |
| apagado / medio ambiente * (dB) | 25 | 23.9 4% | 24 4% | 23 8% | 24 4% | 23 8% |
| Idle Minimum * (dB) | 26 | 23.9 8% | 26 -0% | 23 12% | 24 8% | 23 12% |
| Idle Average * (dB) | 28 | 32.9 -18% | 28 -0% | 23 18% | 25 11% | 23 18% |
| Idle Maximum * (dB) | 30 | 36.5 -22% | 34 -13% | 33.64 -12% | 28 7% | 23.6 21% |
| Load Average * (dB) | 48 | 42.9 11% | 47 2% | 51.49 -7% | 42 12% | 39 19% |
| Witcher 3 ultra * (dB) | 49 | 51.2 -4% | 55 -12% | 55.27 -13% | 50 -2% | 51.6 -5% |
| Load Maximum * (dB) | 52 | 56 -8% | 56 -8% | 55.24 -6% | 50 4% | 51.3 1% |
* ... más pequeño es mejor
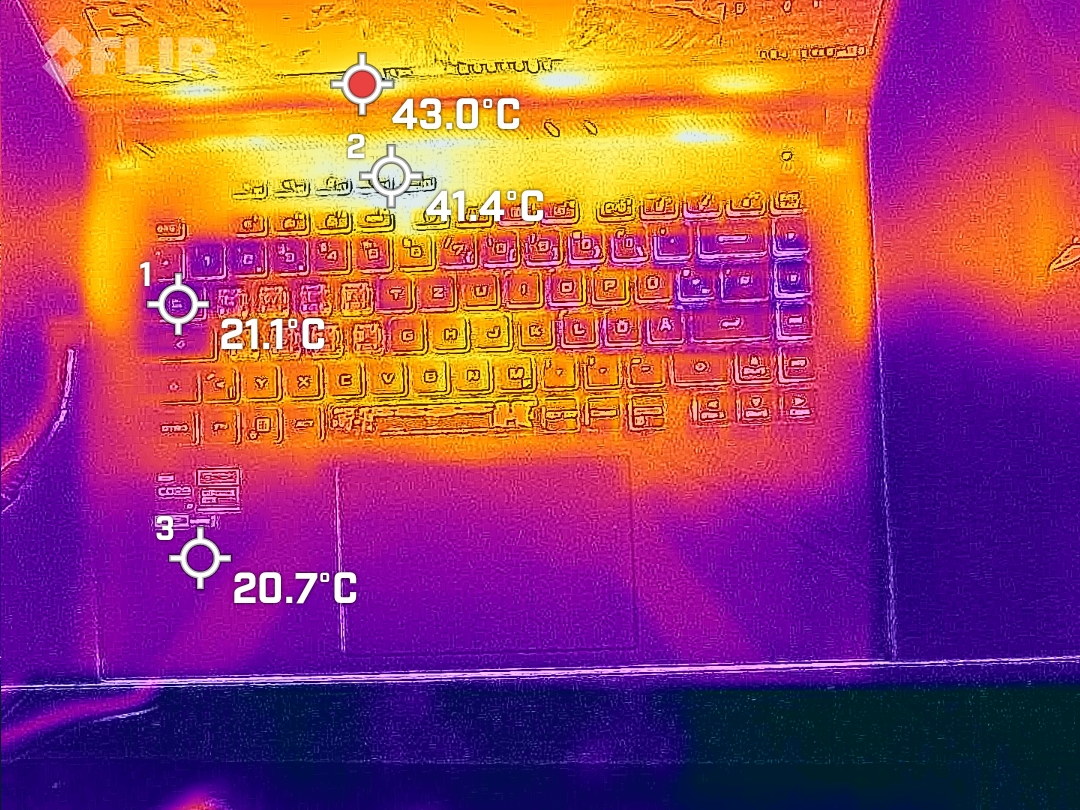
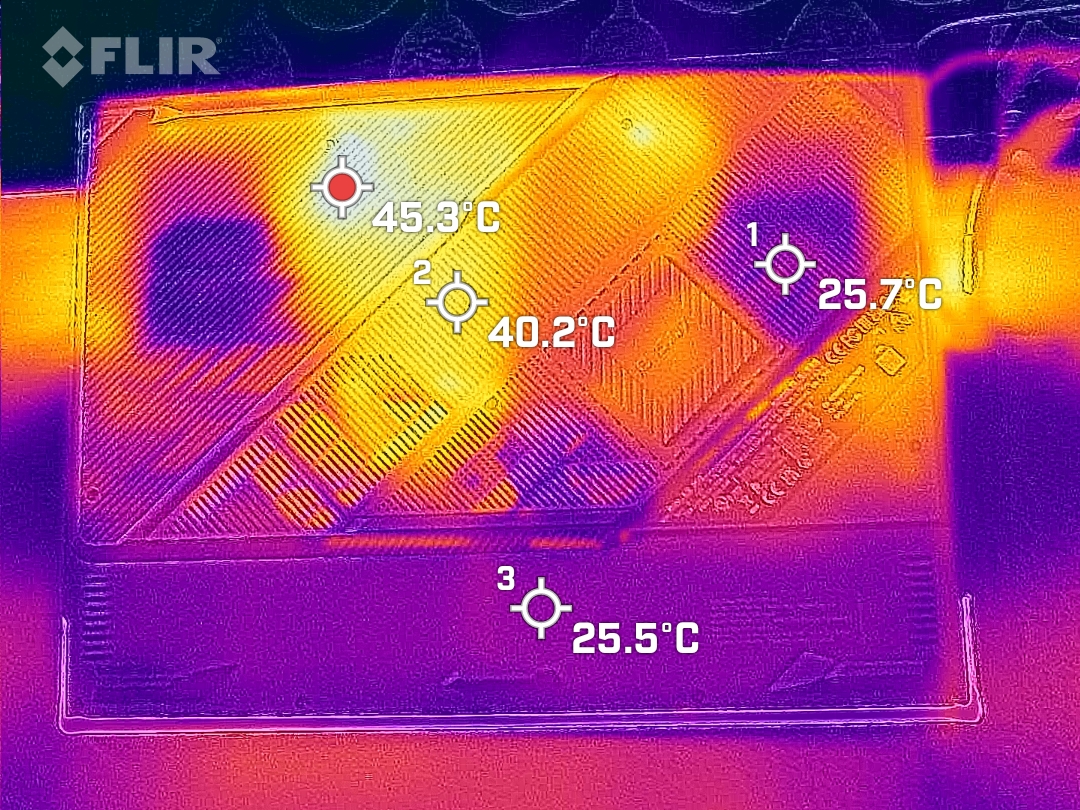
Temperatura
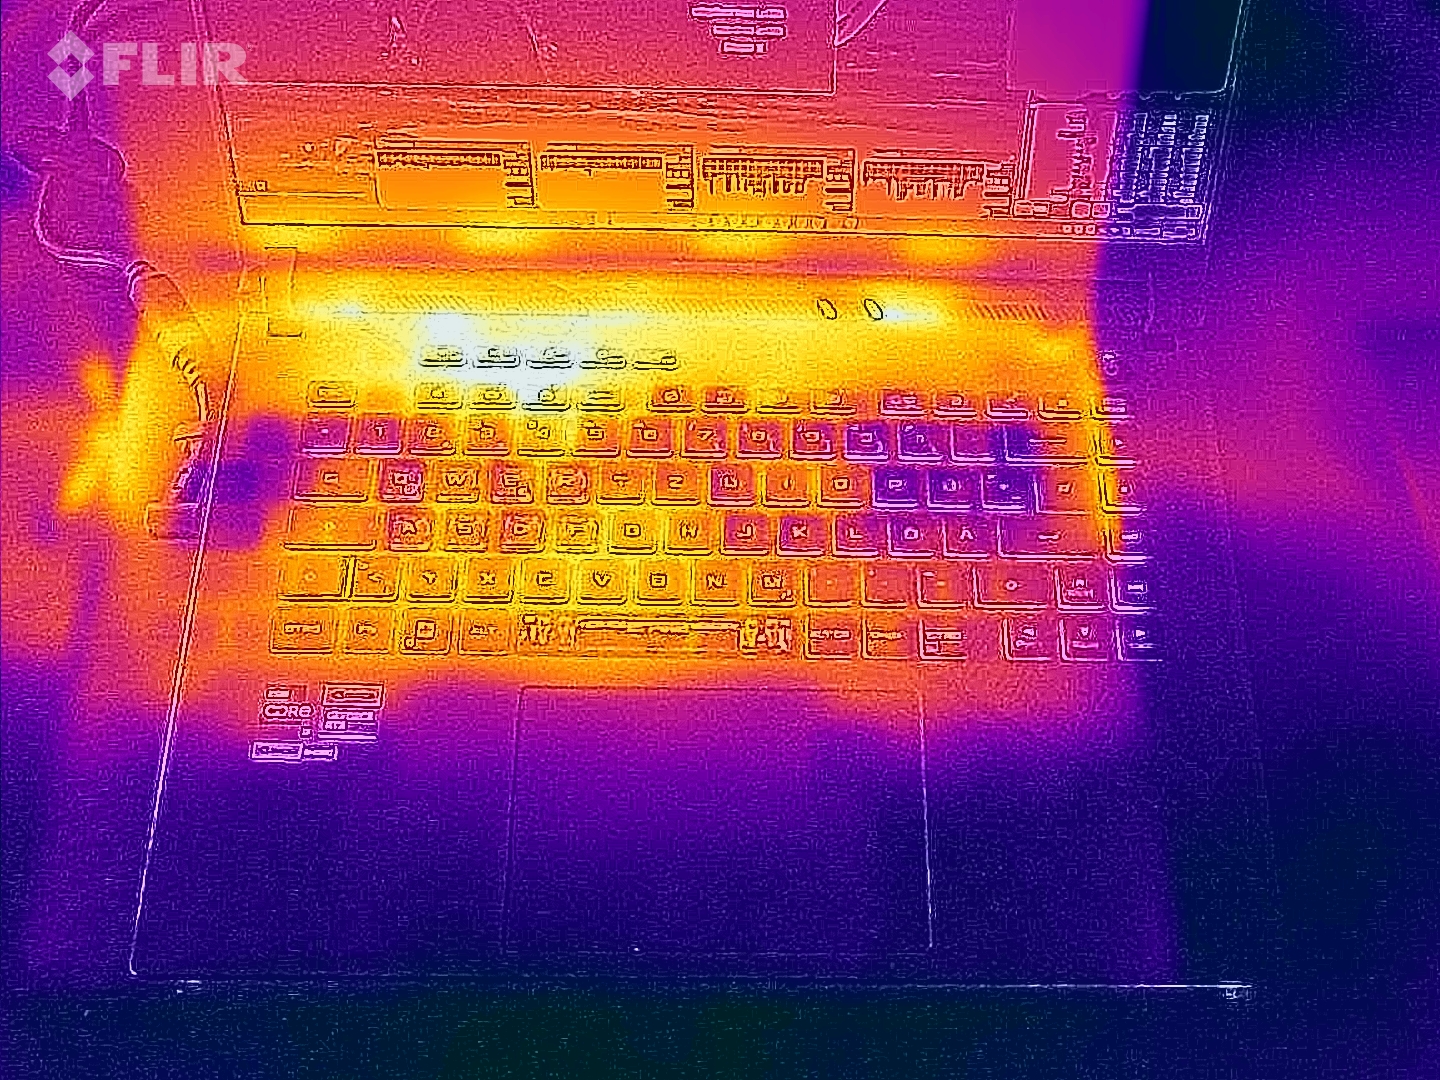
El potente hardware calienta bastante la carcasa del ROG Strix G16. Durante el juego, las temperaturas en la parte superior del portátil suben hasta 54°C. Afortunadamente, los ventiladores del portátil para juegos están situados directamente debajo de las teclas WASD. Aquí la temperatura baja notablemente, por lo que no te quemas los dedos mientras juegas. Los reposamanos siempre se mantienen frescos. Debes colocar el portátil sobre una superficie sólida cuando juegues.
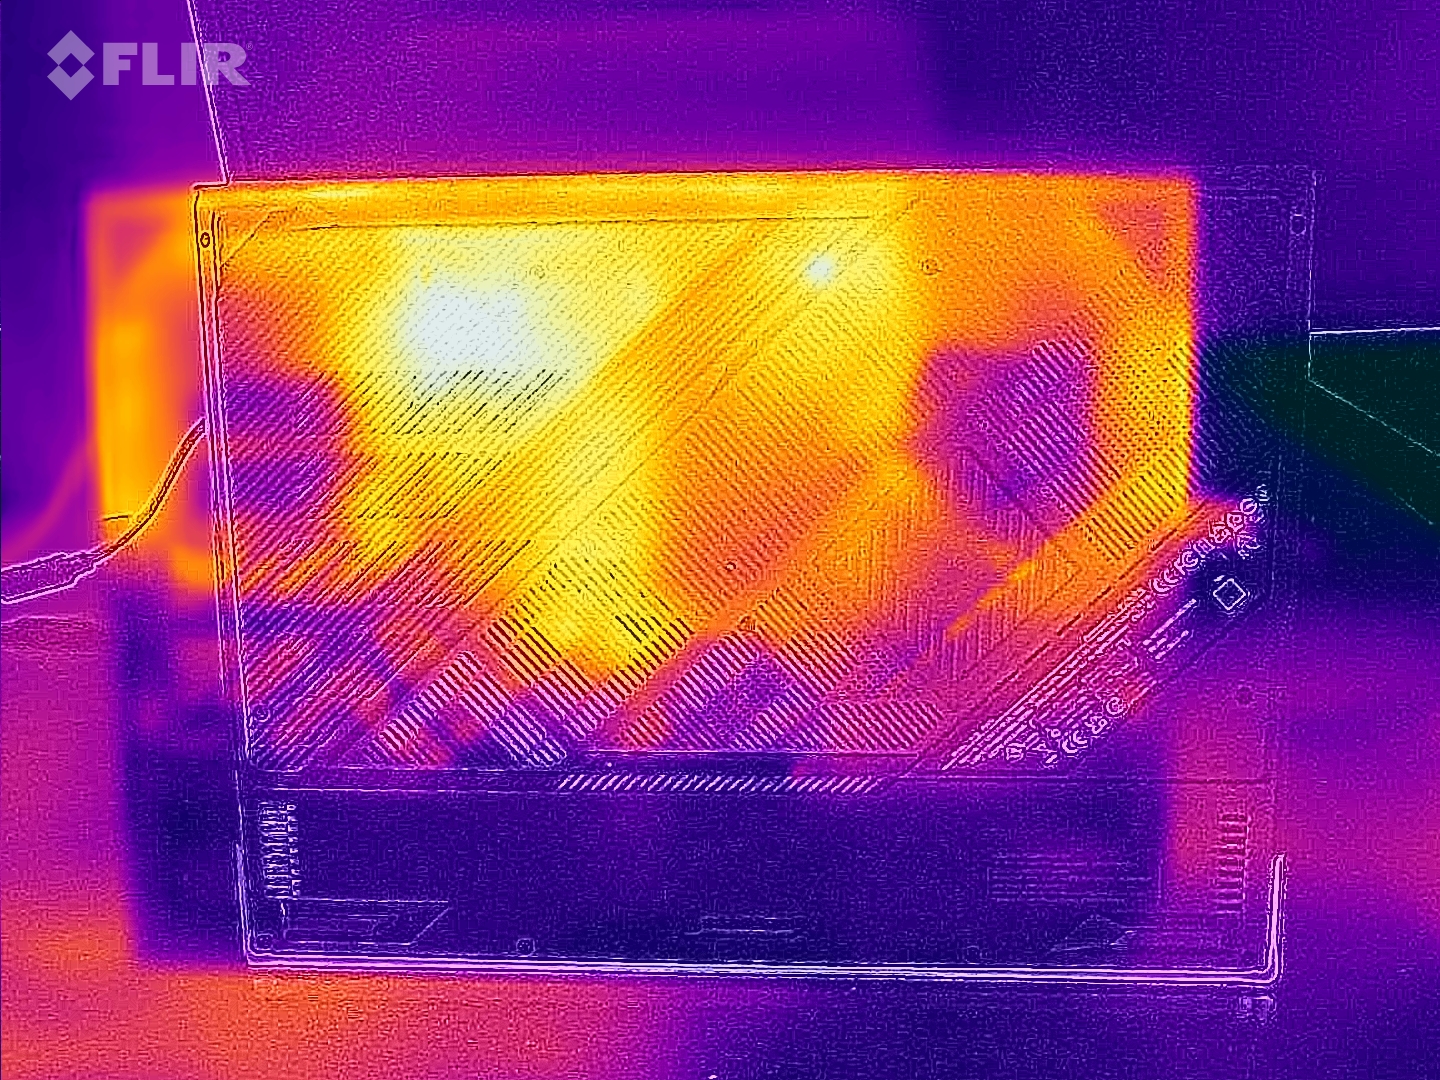
La situación es diferente cuando la carga es menor. Ya sea en reposo, editando fotos y videos, o incluso dibujando CAD, el ROG Strix G16 realmente no se calienta. Con casi 30°C en la parte inferior, el calor de funcionamiento es mucho más tolerable que en el escenario de carga.
(-) La temperatura máxima en la parte superior es de 54 °C / 129 F, frente a la media de 40.4 °C / 105 F, que oscila entre 21.2 y 68.8 °C para la clase Gaming.
(-) El fondo se calienta hasta un máximo de 55 °C / 131 F, frente a la media de 43.2 °C / 110 F
(+) En reposo, la temperatura media de la parte superior es de 27.6 °C / 82# F, frente a la media del dispositivo de 33.9 °C / 93 F.
(-) Jugando a The Witcher 3, la temperatura media de la parte superior es de 40.1 °C / 104 F, frente a la media del dispositivo de 33.9 °C / 93 F.
(±) El reposamanos y el touchpad pueden calentarse mucho al tacto con un máximo de 38 °C / 100.4 F.
(-) La temperatura media de la zona del reposamanos de dispositivos similares fue de 28.8 °C / 83.8 F (-9.2 °C / -16.6 F).
| Asus ROG Strix G16 G614JZ Intel Core i9-13980HX, NVIDIA GeForce RTX 4080 Laptop GPU | Asus Zephyrus Duo 16 GX650PY-NM006W AMD Ryzen 9 7945HX, NVIDIA GeForce RTX 4090 Laptop GPU | Lenovo Legion Pro 7 16IRX8H Intel Core i9-13900HX, NVIDIA GeForce RTX 4080 Laptop GPU | Gigabyte AERO 16 OLED BSF Intel Core i9-13900H, NVIDIA GeForce RTX 4070 Laptop GPU | Asus TUF Gaming A16 FA617 AMD Ryzen 7 7735HS, AMD Radeon RX 7600S | Razer Blade 16 Early 2023 Intel Core i9-13950HX, NVIDIA GeForce RTX 4080 Laptop GPU | |
|---|---|---|---|---|---|---|
| Heat | 10% | -4% | 23% | -11% | 13% | |
| Maximum Upper Side * (°C) | 54 | 44.2 18% | 48 11% | 41 24% | 54 -0% | 40 26% |
| Maximum Bottom * (°C) | 55 | 46.8 15% | 49 11% | 47 15% | 47 15% | 37.6 32% |
| Idle Upper Side * (°C) | 29 | 29.2 -1% | 40 -38% | 23 21% | 40 -38% | 32.4 -12% |
| Idle Bottom * (°C) | 33 | 30.2 8% | 33 -0% | 23 30% | 40 -21% | 31.4 5% |
* ... más pequeño es mejor
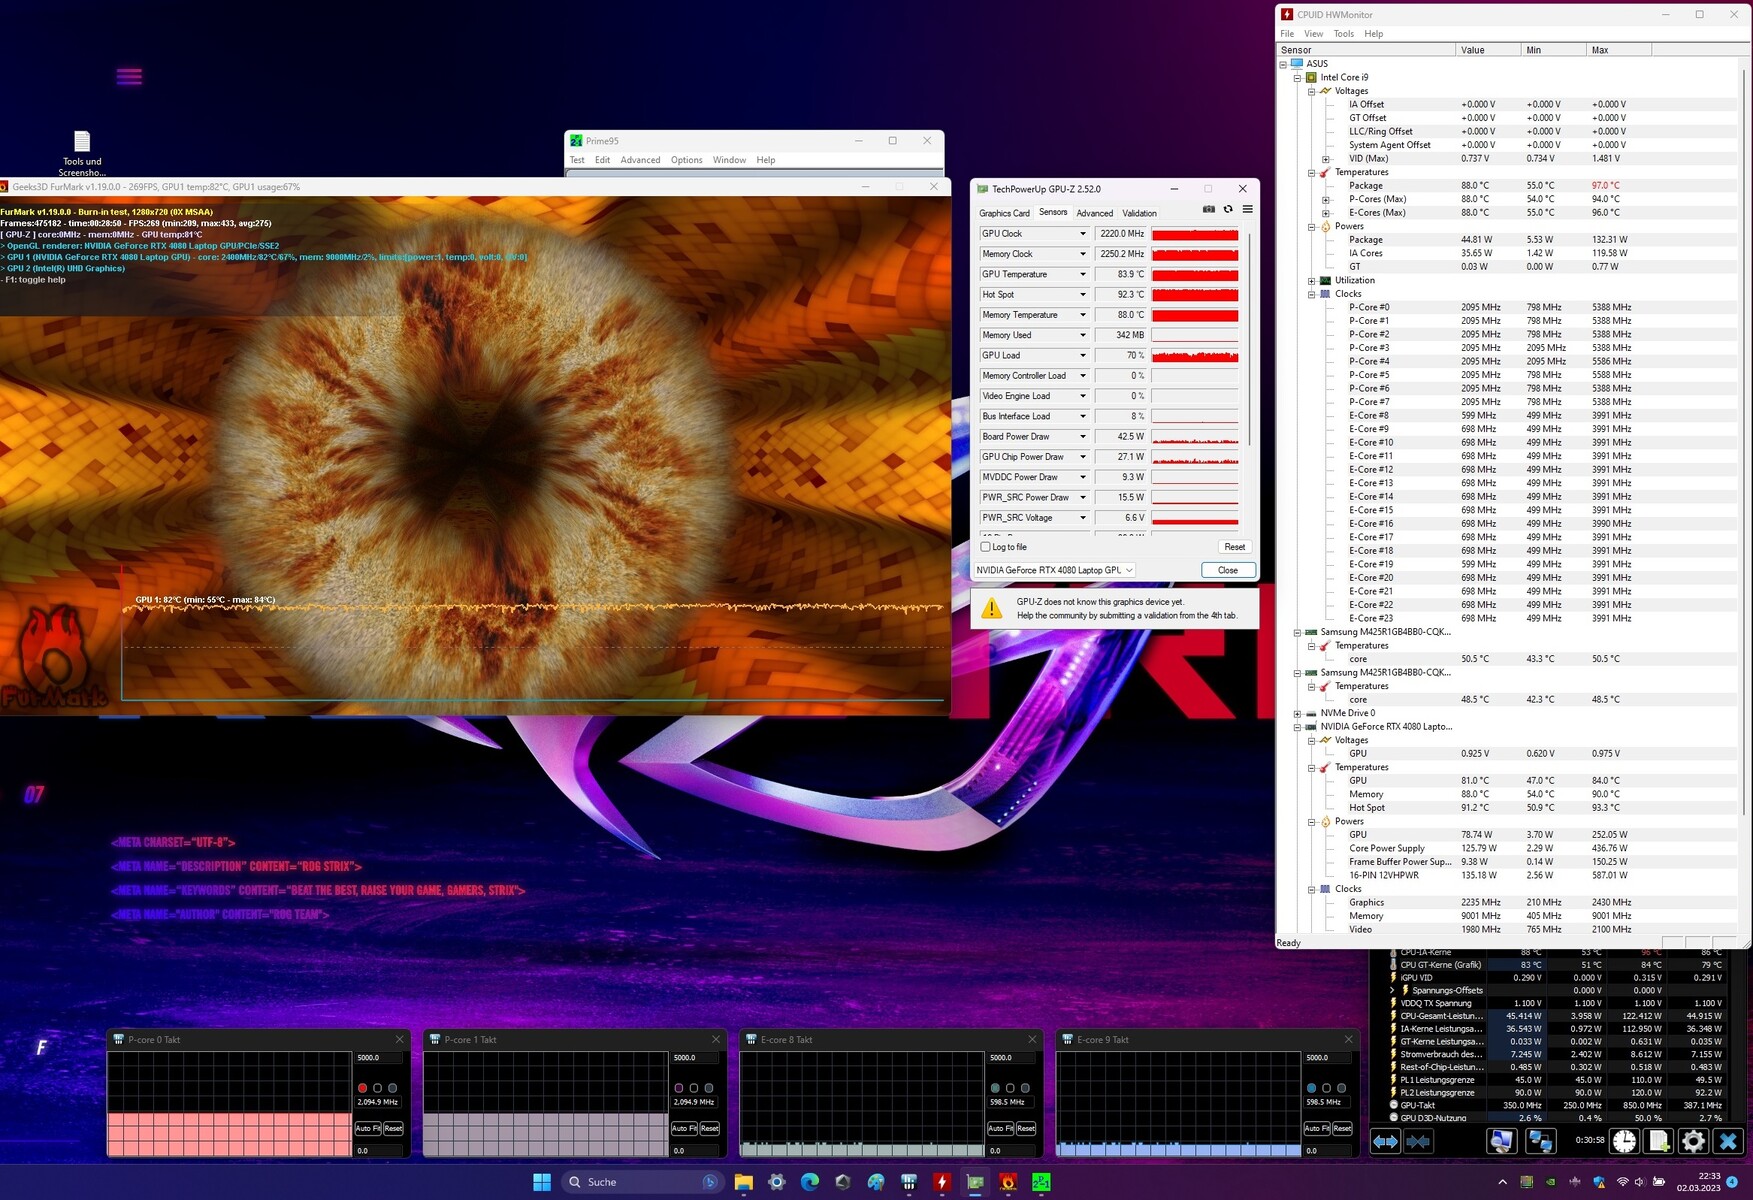
Pruebas de resistencia
El metal líquido y los tres ventiladores combinados con los enormes disipadores de calor deberían garantizar temperaturas estables. En las pruebas de estrés, el equilibrio se alcanza tras unos ocho o diez minutos. A partir de entonces, las temperaturas de la CPU y la GPU se mueven entre 83 y 88 °C. El i9 trabaja constantemente a unos 55 vatios, la RTX 4080 a unos 140 vatios. Llaman la atención los hotspots de la GeForce RTX 4080, que están claramente por encima de la media con casi 93 °C. Unos hotspots tan altos no deberían darse en presencia de una buena refrigeración por metal líquido.
Altavoces
El ROG Strix G16 incorpora cuatro módulos de altavoces. Dos drivers de rango completo orientados hacia abajo en la parte frontal de la base se complementan con dos tweeters entre las bisagras. Esto permite un buen paisaje sonoro, aunque los graves sean un poco débiles. Los medios y los agudos están muy bien equilibrados. Con un volumen máximo de 83 dB(A), los altavoces también ahogan a los ventiladores del portátil para juegos. Aquí se puede prescindir de los auriculares, aunque la toma de auriculares de 3,5 mm y Bluetooth 5.2 ofrecen la posibilidad de conectar altavoces y auriculares externos.
Asus ROG Strix G16 G614JZ análisis de audio
(+) | los altavoces pueden reproducir a un volumen relativamente alto (#87 dB)
Graves 100 - 315 Hz
(-) | casi sin bajos - de media 16.6% inferior a la mediana
(±) | la linealidad de los graves es media (8.7% delta a frecuencia anterior)
Medios 400 - 2000 Hz
(+) | medios equilibrados - a sólo 1.9% de la mediana
(+) | los medios son lineales (4.1% delta a la frecuencia anterior)
Altos 2 - 16 kHz
(+) | máximos equilibrados - a sólo 3.8% de la mediana
(+) | los máximos son lineales (6.2% delta a la frecuencia anterior)
Total 100 - 16.000 Hz
(+) | el sonido global es lineal (12.2% de diferencia con la mediana)
En comparación con la misma clase
» 13% de todos los dispositivos probados de esta clase eran mejores, 4% similares, 83% peores
» El mejor tuvo un delta de 6%, la media fue 18%, el peor fue ###max##%
En comparación con todos los dispositivos probados
» 10% de todos los dispositivos probados eran mejores, 2% similares, 88% peores
» El mejor tuvo un delta de 4%, la media fue 24%, el peor fue ###max##%
Lenovo Legion Pro 7 16IRX8H análisis de audio
(+) | los altavoces pueden reproducir a un volumen relativamente alto (#82 dB)
Graves 100 - 315 Hz
(±) | lubina reducida - en promedio 8.9% inferior a la mediana
(+) | el bajo es lineal (6.4% delta a la frecuencia anterior)
Medios 400 - 2000 Hz
(+) | medios equilibrados - a sólo 2.8% de la mediana
(+) | los medios son lineales (4.2% delta a la frecuencia anterior)
Altos 2 - 16 kHz
(+) | máximos equilibrados - a sólo 2.5% de la mediana
(+) | los máximos son lineales (6% delta a la frecuencia anterior)
Total 100 - 16.000 Hz
(+) | el sonido global es lineal (9.4% de diferencia con la mediana)
En comparación con la misma clase
» 3% de todos los dispositivos probados de esta clase eran mejores, 2% similares, 95% peores
» El mejor tuvo un delta de 6%, la media fue 18%, el peor fue ###max##%
En comparación con todos los dispositivos probados
» 3% de todos los dispositivos probados eran mejores, 1% similares, 96% peores
» El mejor tuvo un delta de 4%, la media fue 24%, el peor fue ###max##%
Gestión de la energía: la batería de 90 Wh y Optimus garantizan una larga duración
Consumo de energía
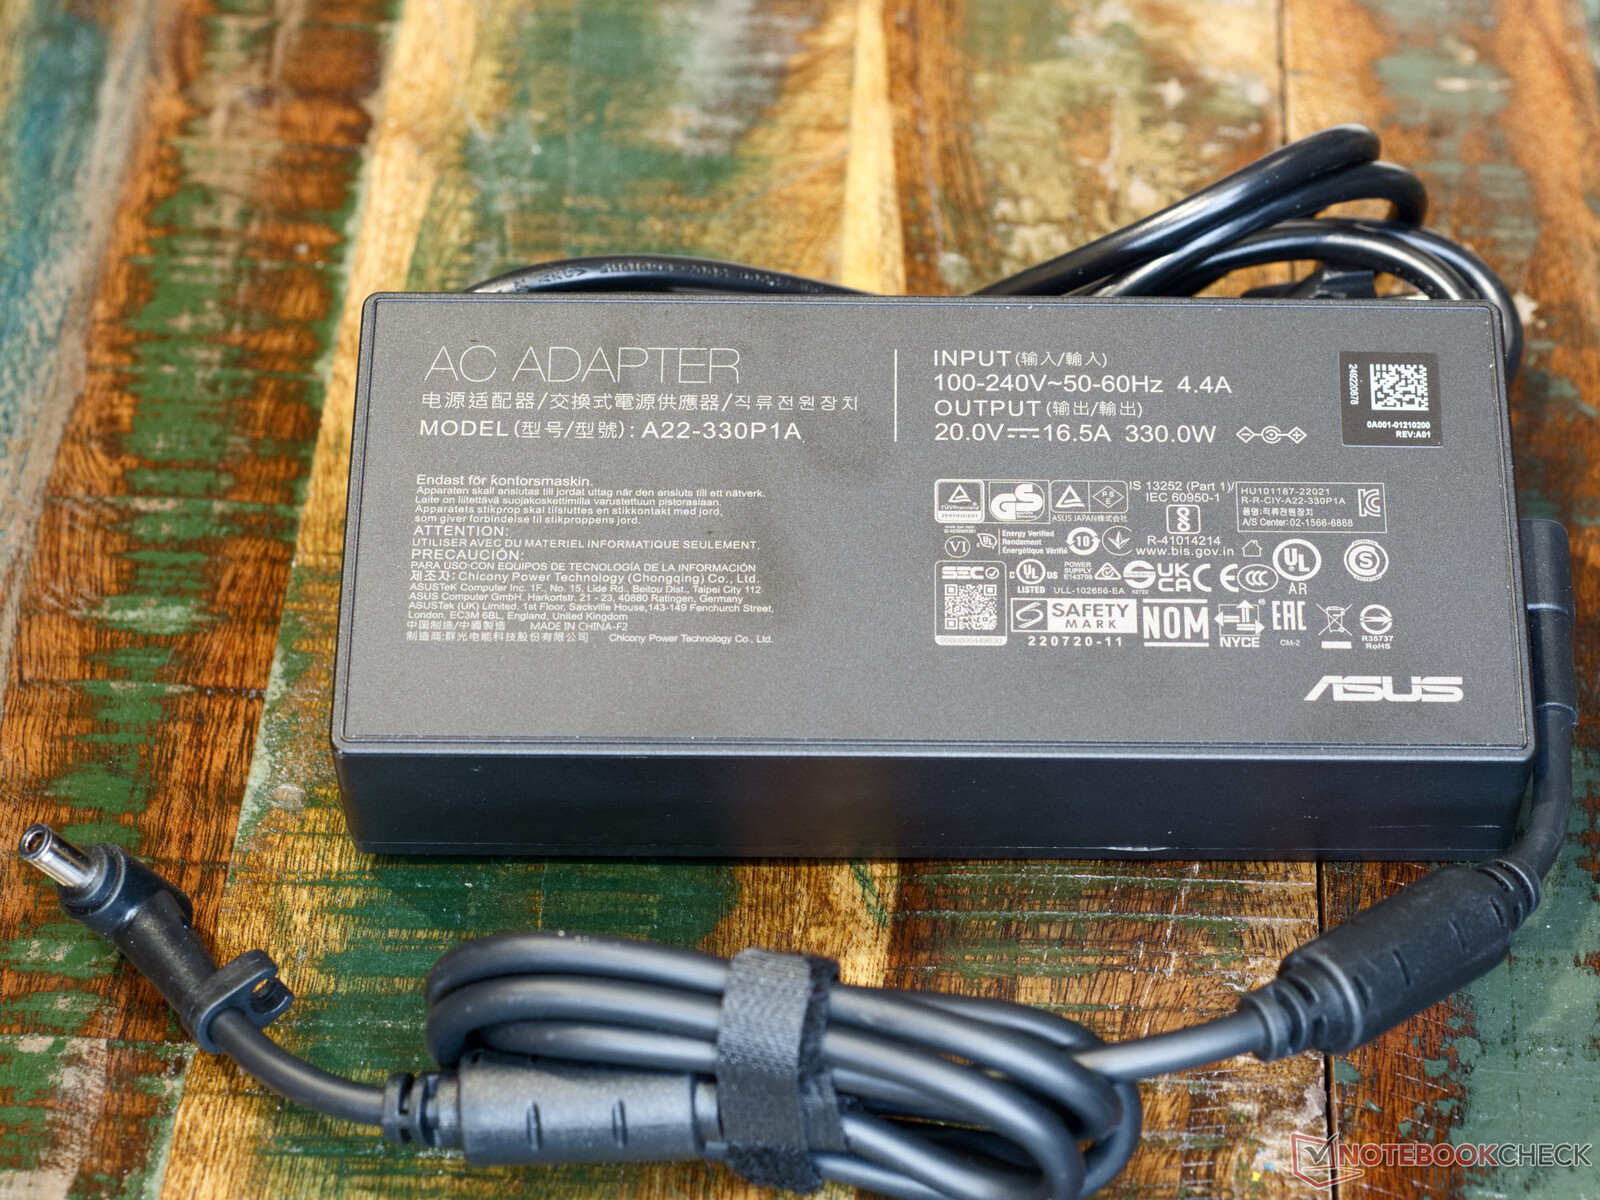
Con un consumo de energía de 10 a 20 vatios en reposo, el portátil para juegos está dentro del rango tolerable. Sin embargo, estos valores relativamente bajos sólo se alcanzan con conmutación gráfica activa. Bajo carga, el consumo sube hasta los 342 vatios, que es un pico corto durante boost. La fuente de alimentación de 330 vatios incluida debería poder con esto. Durante periodos más largos, el consumo se mantiene bastante estable en 260 vatios, incluso bajo carga.
| Off / Standby | |
| Ocioso | |
| Carga |
|
Clave:
min: | |
| Asus ROG Strix G16 G614JZ i9-13980HX, GeForce RTX 4080 Laptop GPU | Asus Zephyrus Duo 16 GX650PY-NM006W R9 7945HX, GeForce RTX 4090 Laptop GPU | Lenovo Legion Pro 7 16IRX8H i9-13900HX, GeForce RTX 4080 Laptop GPU | Gigabyte AERO 16 OLED BSF i9-13900H, GeForce RTX 4070 Laptop GPU | Asus TUF Gaming A16 FA617 R7 7735HS, Radeon RX 7600S | Razer Blade 16 Early 2023 i9-13950HX, GeForce RTX 4080 Laptop GPU | Medio NVIDIA GeForce RTX 4080 Laptop GPU | Media de la clase Gaming | |
|---|---|---|---|---|---|---|---|---|
| Power Consumption | -32% | -25% | 20% | 34% | -25% | -22% | 0% | |
| Idle Minimum * (Watt) | 10 | 19.2 -92% | 18 -80% | 11.8 -18% | 8 20% | 15.2 -52% | 16.9 ? -69% | 13.2 ? -32% |
| Idle Average * (Watt) | 16 | 29.7 -86% | 24 -50% | 16.1 -1% | 11 31% | 22.8 -43% | 22 ? -38% | 18.9 ? -18% |
| Idle Maximum * (Watt) | 27 | 30.8 -14% | 32 -19% | 17 37% | 16 41% | 49.8 -84% | 34.1 ? -26% | 24.3 ? 10% |
| Load Average * (Watt) | 129 | 126 2% | 130 -1% | 100.6 22% | 97 25% | 121.2 6% | 117.9 ? 9% | 108.3 ? 16% |
| Witcher 3 ultra * (Watt) | 247 | 258 -4% | 260 -5% | 158 36% | 161.5 35% | 242 2% | ||
| Load Maximum * (Watt) | 342 | 330 4% | 320 6% | 192 44% | 168 51% | 273.7 20% | 297 ? 13% | 254 ? 26% |
* ... más pequeño es mejor
Power Consumption Witcher 3 / Stress Test
Power Consumption with an external monitor
Duración de la batería
Con una capacidad de 90 vatios hora, la batería del Asus ROG Strix G16 debería ser capaz de ofrecer una buena duración lejos del enchufe. Sin embargo, el portátil sólo logra más de nueve horas en el test de navegación web WiFi con la gráfica activa. En cuanto la GeForce RTX 4080 está activa, la duración cae significativamente. Bajo carga alta, la batería sólo dura una hora en algunos casos. Con todo, la duración de la batería sigue siendo excepcionalmente buena para un portátil de juegos de 2023.
| Asus ROG Strix G16 G614JZ i9-13980HX, GeForce RTX 4080 Laptop GPU, 90 Wh | Asus Zephyrus Duo 16 GX650PY-NM006W R9 7945HX, GeForce RTX 4090 Laptop GPU, 90 Wh | Lenovo Legion Pro 7 16IRX8H i9-13900HX, GeForce RTX 4080 Laptop GPU, 99.9 Wh | Gigabyte AERO 16 OLED BSF i9-13900H, GeForce RTX 4070 Laptop GPU, 88 Wh | Asus TUF Gaming A16 FA617 R7 7735HS, Radeon RX 7600S, 90 Wh | Razer Blade 16 Early 2023 i9-13950HX, GeForce RTX 4080 Laptop GPU, 95.2 Wh | Media de la clase Gaming | |
|---|---|---|---|---|---|---|---|
| Duración de Batería | -34% | 22% | 34% | 31% | -5% | 4% | |
| WiFi v1.3 (h) | 9.7 | 4 -59% | 5.1 -47% | 7.5 -23% | 12.1 25% | 6.1 -37% | 7.04 ? -27% |
| Load (h) | 1.1 | 1 -9% | 2.1 91% | 2.1 91% | 1.5 36% | 1.4 27% | 1.47 ? 34% |
| H.264 (h) | 3.8 | 7.4 | 8.26 ? | ||||
| Reader / Idle (h) | 6.4 | 20.2 | 8.9 | 8.71 ? |
Pro
Contra
Veredicto - El 4080 es una buena elección
Con la portátil Nvidia GeForce RTX 4080, la Asus ROG Stix G16 da en el clavo entre rendimiento y refrigeración. El G16 tampoco tiene que rehuir la comparación directa con su supuestamente más fuerte miembro de la familia, el ROG Strix Scar 18 con su RTX 4090, ya que la mayoría de los benchmarks de los dos portátiles están muy cerca el uno del otro. Además, el G16 debería ser significativamente más barato. Dependiendo del proveedor, la diferencia de precio podría ser de casi 2.000 dólares.
En la serie de modelos 2023, Asus ha nivelado significativamente las diferencias entre las dos líneas de gama alta. Debido a la omisión de la cámara de vapor en los Strix Scar, las diferencias entre el Scar 18 y el G16 son casi totalmente cosméticas. Los que insistan absolutamente en un portátil con chasis translúcido tendrán que rascarse mucho más el bolsillo. También analizamos recientemente un Strix G18 con una RTX 4070. Al igual que en el G16, aquí se usa una buena pantalla y un hardware resistente con buena disipación del calor. Dicho esto, el 16 pulgadas podría ser la mejor opción debido a su construcción algo más estable.
Potente rendimiento en un paquete llamativo. El Asus ROG Strix G16 es divertido de usar gracias a sus potentes capacidades.
Curiosamente, el ROG Strix G16 ofrece la posibilidad real de jugar sin contaminación acústica. El Modo Silencioso preconfigurado consigue unos FPS más que jugables y un bajo ruido del ventilador. Desafortunadamente, esto también trae el quejido de la bobina del G16 a primer plano. El ruido penetrante es especialmente audible durante los boosts y probablemente es generado por los convertidores de voltaje.
El ROG Strix G16 está más o menos a la par con el Lenovo Legion Pro 7 y el Razer Blade 16 en términos de rendimiento, pero es probable que sea más barato. Sin embargo, los dos competidores tienen ventajas en la calidad de la carcasa y la conectividad. Estos dos puntos son también las mayores debilidades del ROG Strix G16.
Precio y disponibilidad
Teniendo en cuenta su reciente lanzamiento, la disponibilidad global de la Asus ROG Strix G16 con una Nvidia GeForce RTX 4080 es actualmente limitada o no está disponible en absoluto. En EE.UU., solo las configuraciones con la RTX 4070 (a través de Amazon por US$1999.99) o la RTX 4050 (a través del sitio web Asus ROG por 1799,99 dólares).
Se espera que los modelos con RTX 4080 ronden los 3.000 dólares en cuanto estén disponibles.
Los precios son a fecha de 17.03.2023 y están sujetos a cambios.
Asus ROG Strix G16 G614JZ
- 03/16/2023 v7 (old)
Marc Herter
Transparencia
La selección de los dispositivos que se van a reseñar corre a cargo de nuestro equipo editorial. La muestra de prueba fue proporcionada al autor en calidad de préstamo por el fabricante o el minorista a los efectos de esta reseña. El prestamista no tuvo ninguna influencia en esta reseña, ni el fabricante recibió una copia de la misma antes de su publicación. No había ninguna obligación de publicar esta reseña. Como empresa de medios independiente, Notebookcheck no está sujeta a la autoridad de fabricantes, minoristas o editores.
Así es como prueba Notebookcheck
Cada año, Notebookcheck revisa de forma independiente cientos de portátiles y smartphones utilizando procedimientos estandarizados para asegurar que todos los resultados son comparables. Hemos desarrollado continuamente nuestros métodos de prueba durante unos 20 años y hemos establecido los estándares de la industria en el proceso. En nuestros laboratorios de pruebas, técnicos y editores experimentados utilizan equipos de medición de alta calidad. Estas pruebas implican un proceso de validación en varias fases. Nuestro complejo sistema de clasificación se basa en cientos de mediciones y puntos de referencia bien fundamentados, lo que mantiene la objetividad.Price comparison

