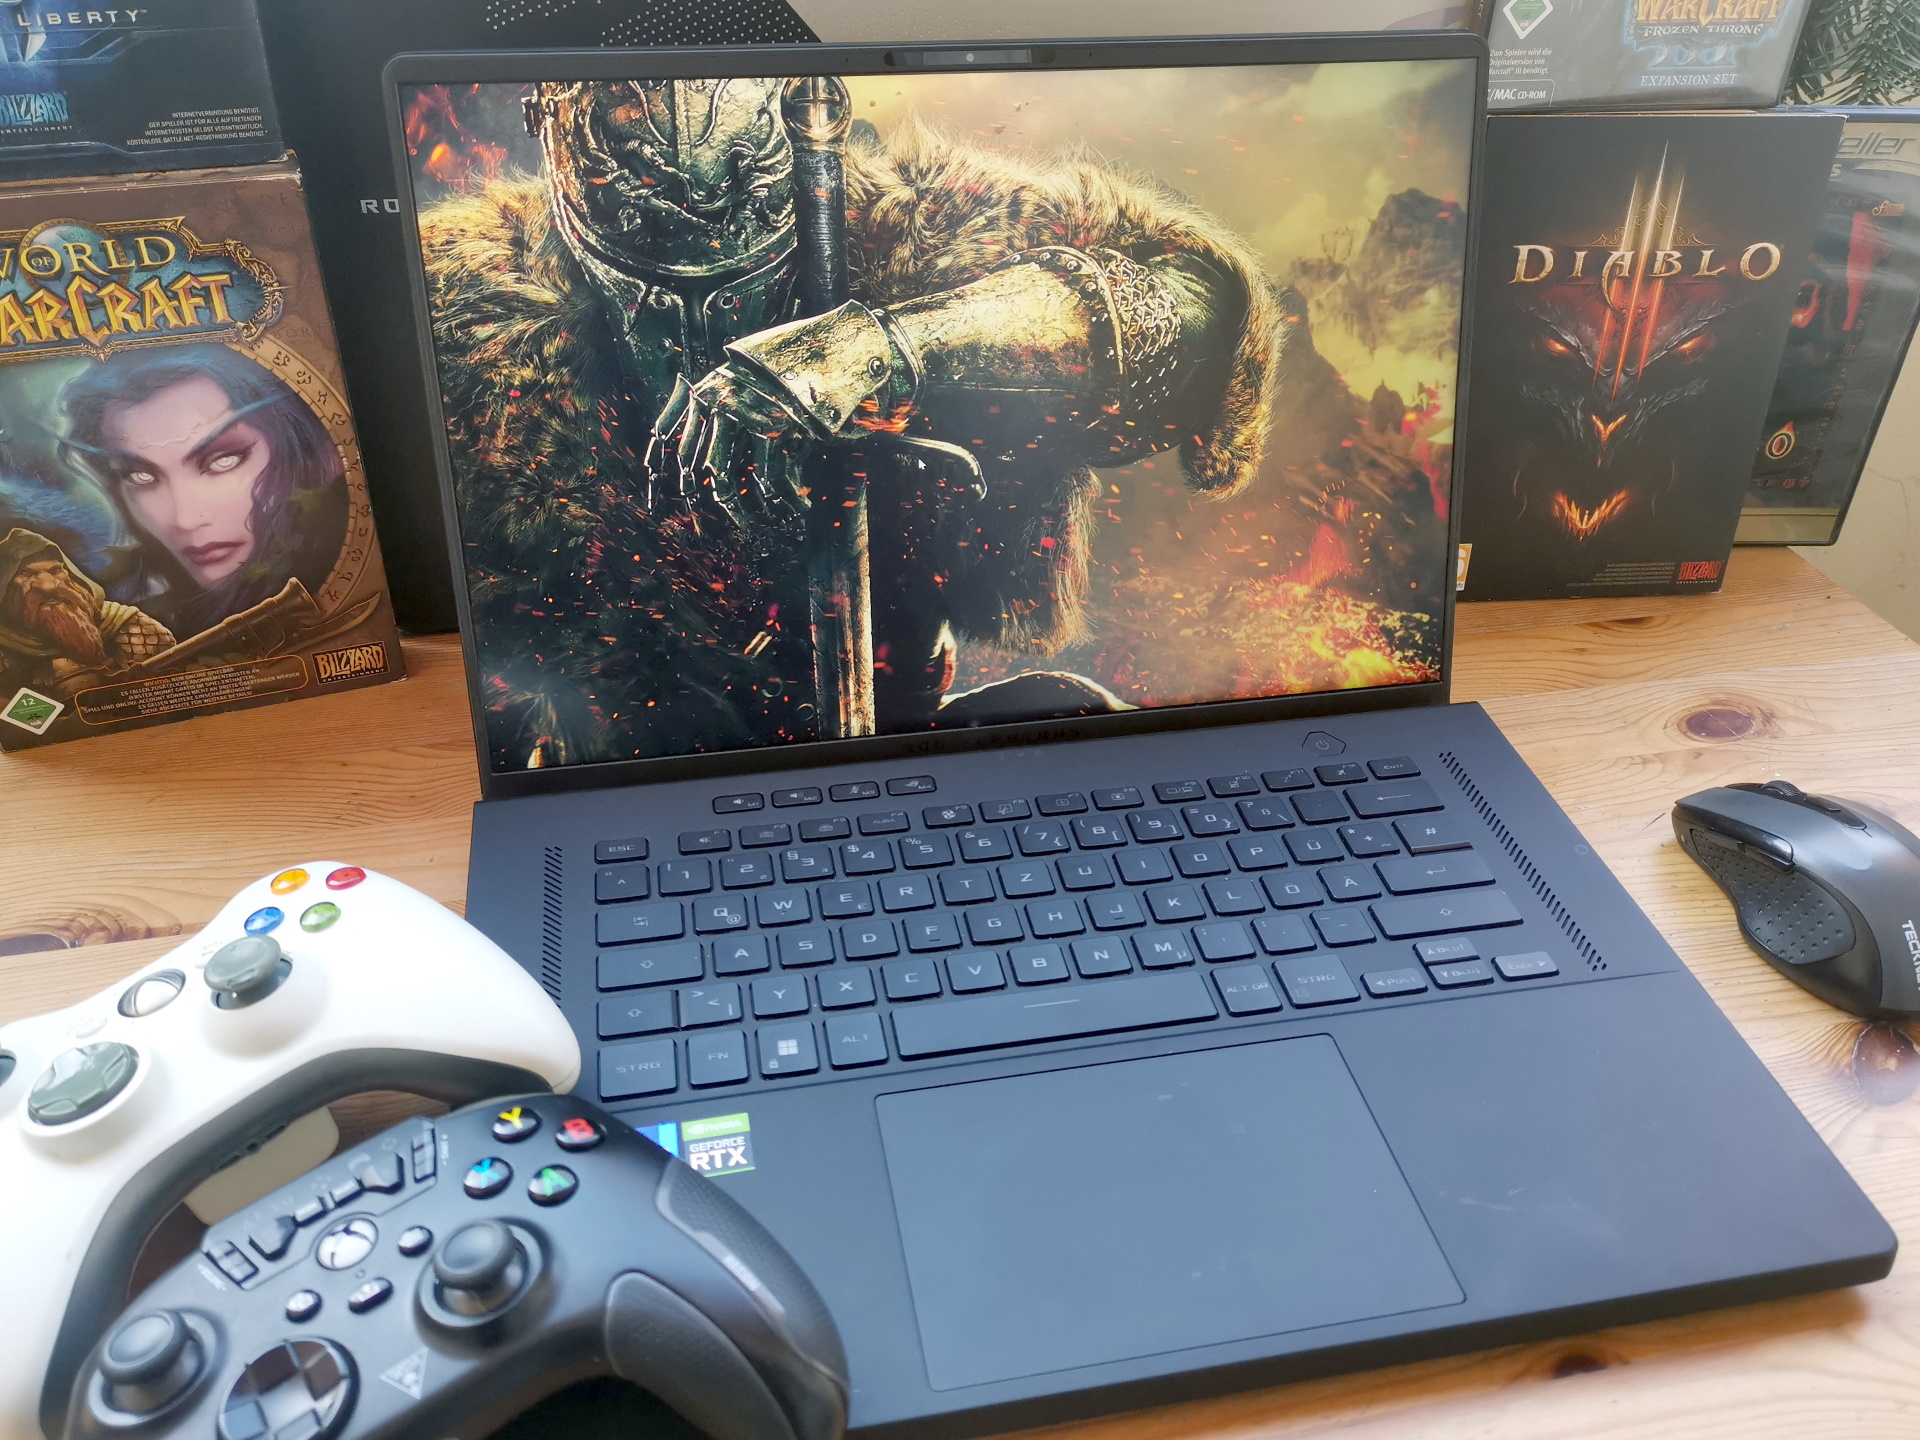
Análisis del portátil Asus ROG Zephyrus M16: Un paquete de juegos completo

El M16 (2022) GU603zw hereda de su predecesor del mismo nombre, actualizando el paquete con una potente CPU i9 Alder Lake y una RTX 3070 Ti. Todo eso viene en un factor de forma de 16 pulgadas bastante delgado y compacto con una pantalla 16:10 (2,560 x 1,500 píxeles) que apenas se pierde nuestra lista de los mejores portátiles móviles para juegos, ya que pesa solo 75 gramos (~2,6 oz) de más (>2 kg = 4,4 lb). Habría sido el primer dispositivo de 16 pulgadas de la lista.
Como los portátiles de juego de 16 pulgadas con pantalla 16:10 siguen siendo la minoría, también incluimos dispositivos "convencionales" 16:9 con hardware similar en nuestra comparación. Además delpredecesorse trata en particular delSchenker Vision 16 Proy elLenovo Legion 5 Propero también el Schenker XMG Focus 16y el Corsair Voyager a1600.
Posibles contendientes en la comparación
Valoración | Fecha | Modelo | Peso | Altura | Tamaño | Resolución | Precio |
|---|---|---|---|---|---|---|---|
| 87.8 % v7 (old) | 02/2023 | Asus ROG Zephyrus M16 GU603Z i9-12900H, GeForce RTX 3070 Ti Laptop GPU | 2.1 kg | 19.9 mm | 16.00" | 2560x1600 | |
| 85.6 % v7 (old) | 07/2021 | Asus ROG Zephyrus M16 GU603H i9-11900H, GeForce RTX 3070 Laptop GPU | 2 kg | 20 mm | 16.00" | 2560x1600 | |
| 87.8 % v7 (old) | 11/2022 | Schenker Vision 16 Pro RTX 3070 Ti i7-12700H, GeForce RTX 3070 Ti Laptop GPU | 1.7 kg | 17.1 mm | 16.00" | 2560x1600 | |
| 87.7 % v7 (old) | 10/2022 | Lenovo Legion 5 Pro 16ARH7H RTX 3070 Ti R7 6800H, GeForce RTX 3070 Ti Laptop GPU | 2.6 kg | 26.6 mm | 16.00" | 2560x1600 | |
| 87 % v7 (old) | 01/2023 | Schenker XMG Focus 16 (i7-12700H, RTX 3060) i7-12700H, GeForce RTX 3060 Laptop GPU | 2.2 kg | 24.3 mm | 16.00" | 2560x1600 | |
| 86.6 % v7 (old) | 12/2022 | Corsair Voyager a1600 R9 6900HS, Radeon RX 6800M | 2.4 kg | 19.9 mm | 16.00" | 2560x1600 |
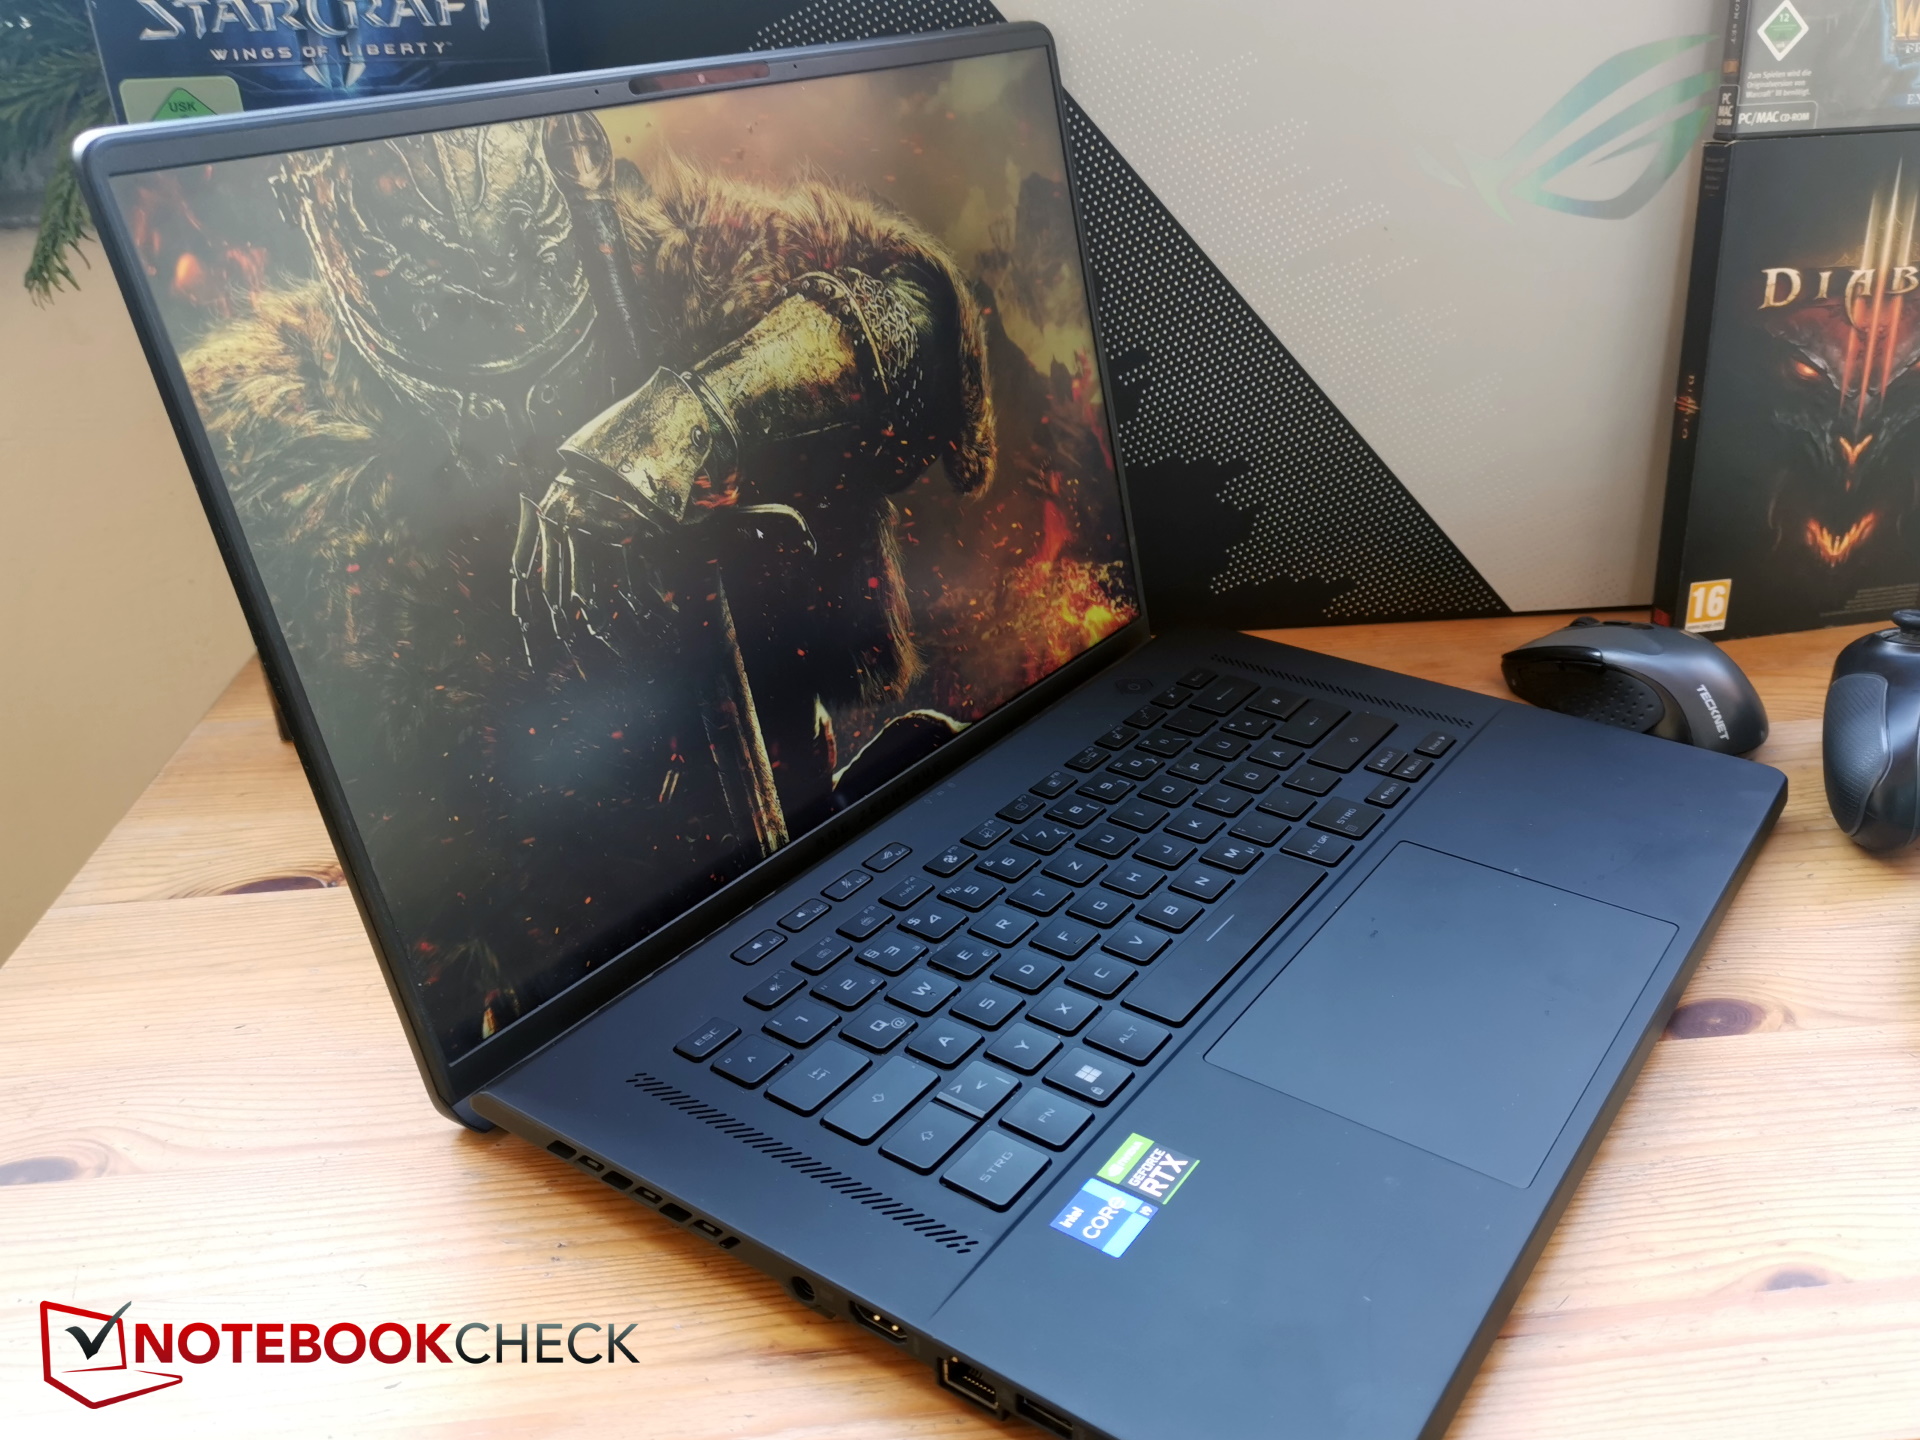
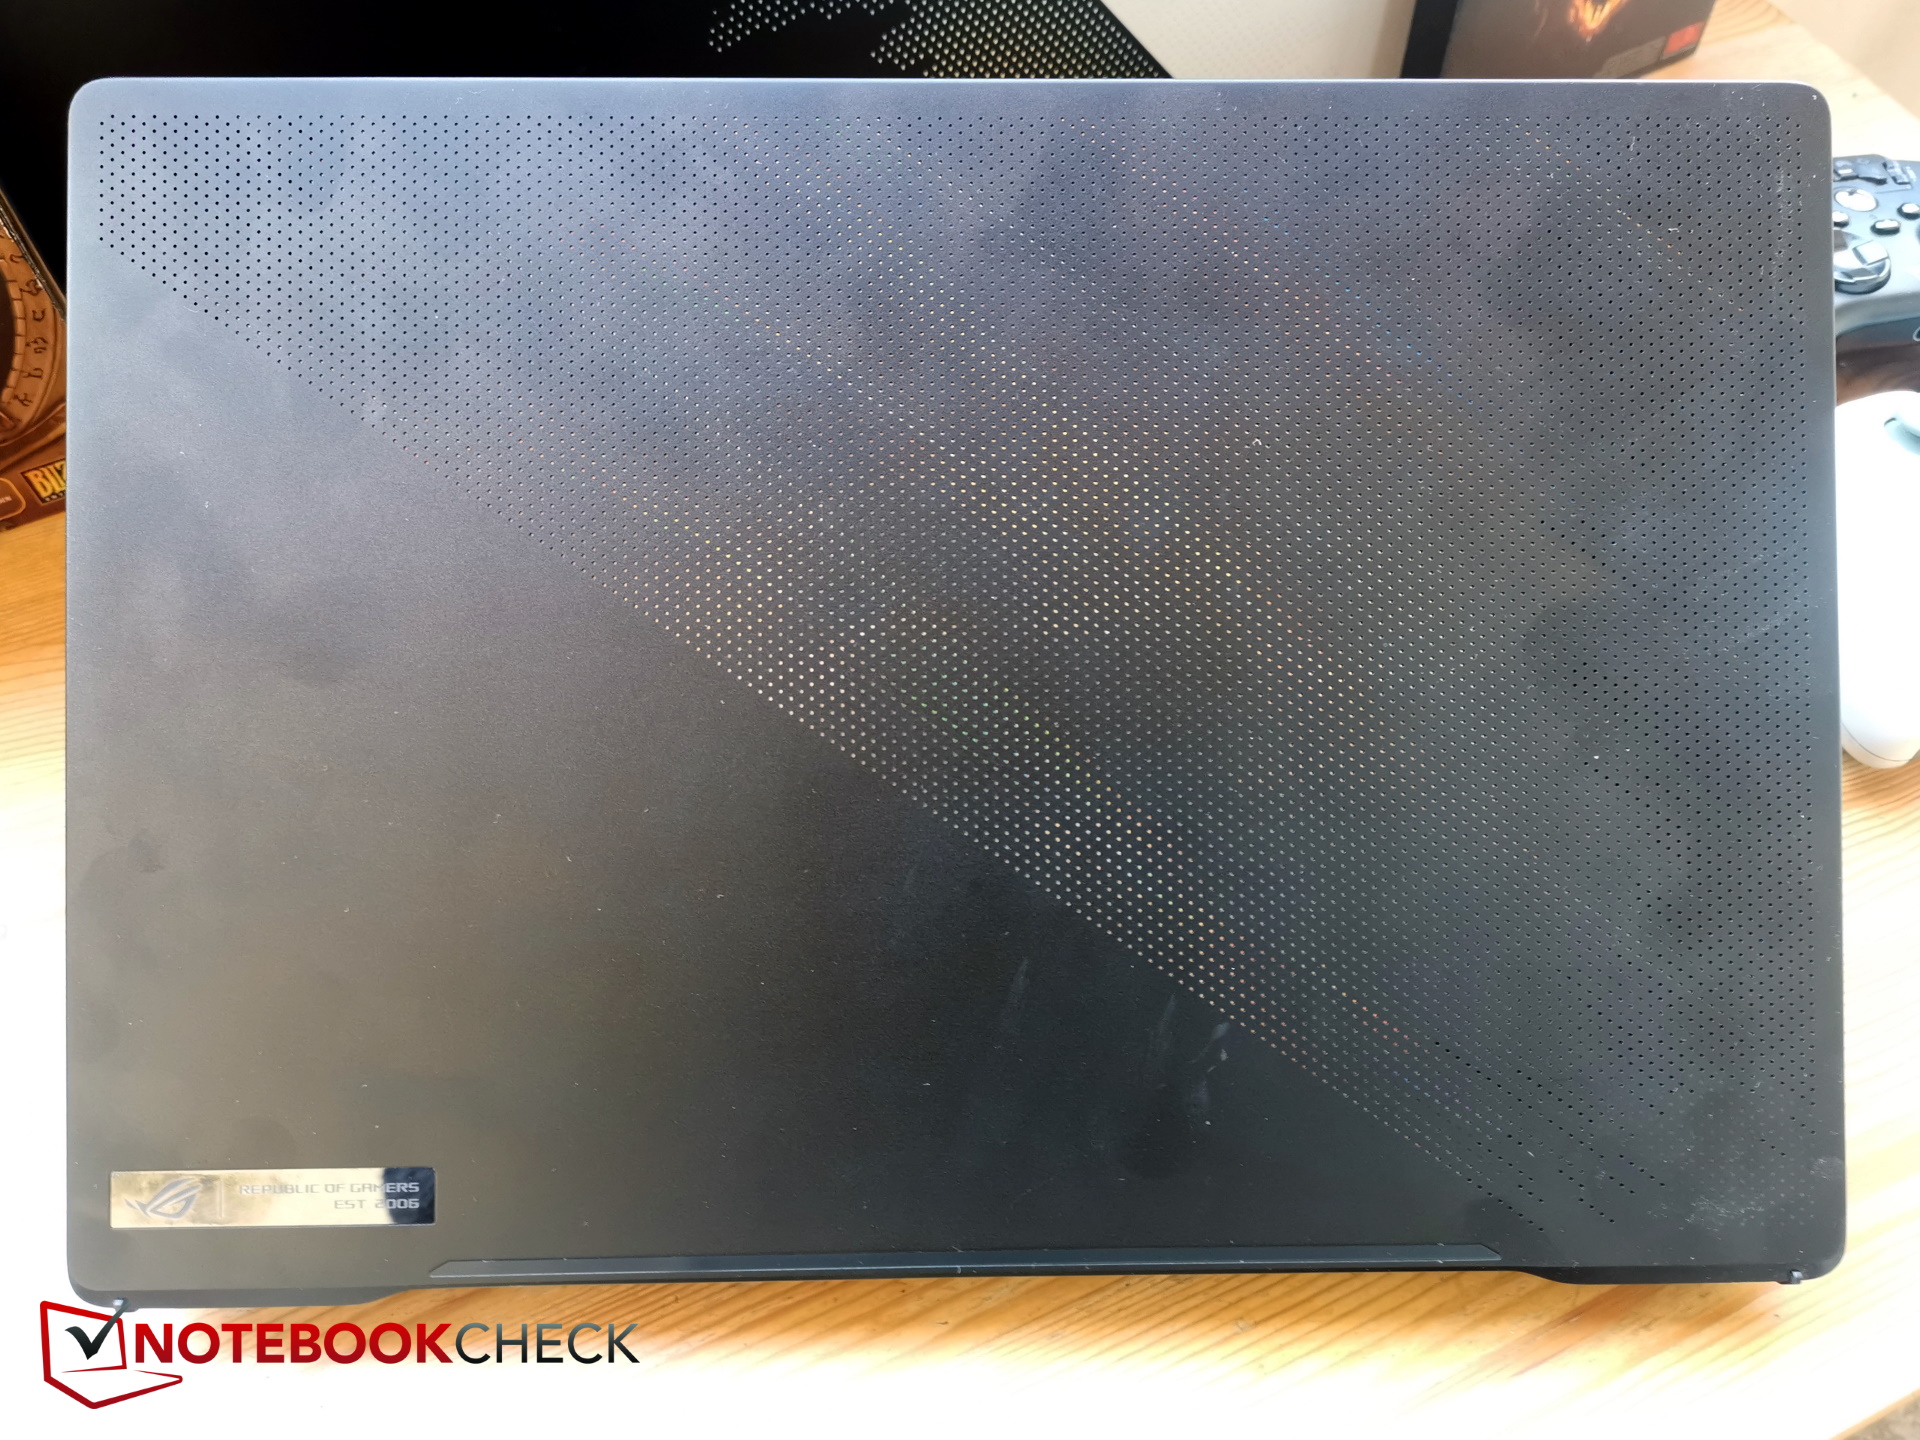
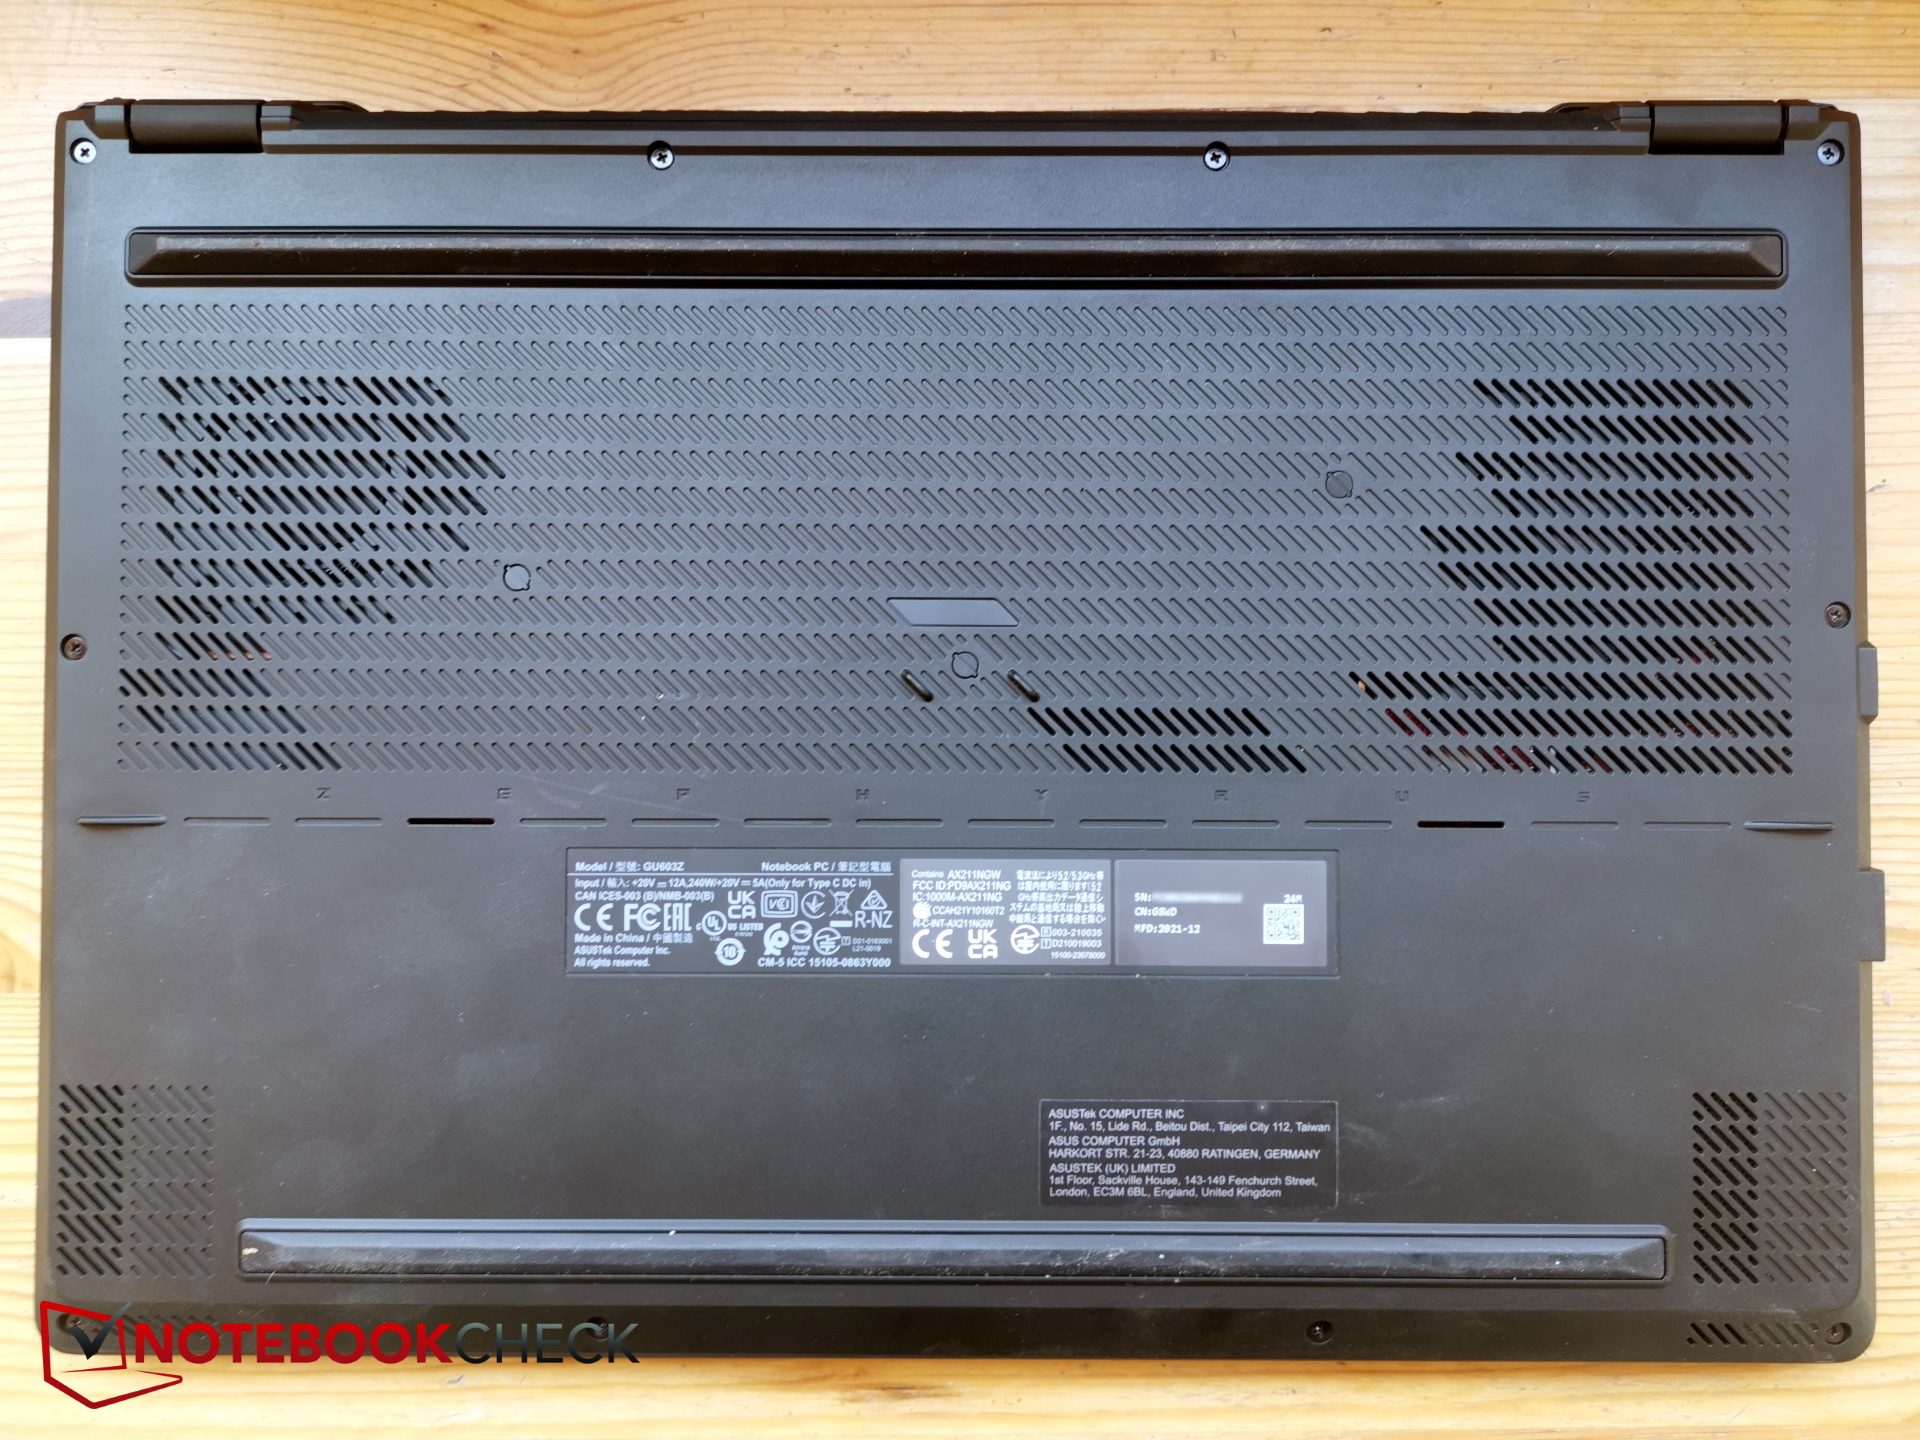
Funda - Portátil de 16 pulgadas para juegos
Dado que prácticamente nada ha cambiado en el caso, le remitimos a nuestra prueba del M16 de 2021que ofrece descripciones detalladas de la carcasa, las opciones de mantenimiento y los dispositivos de entrada.
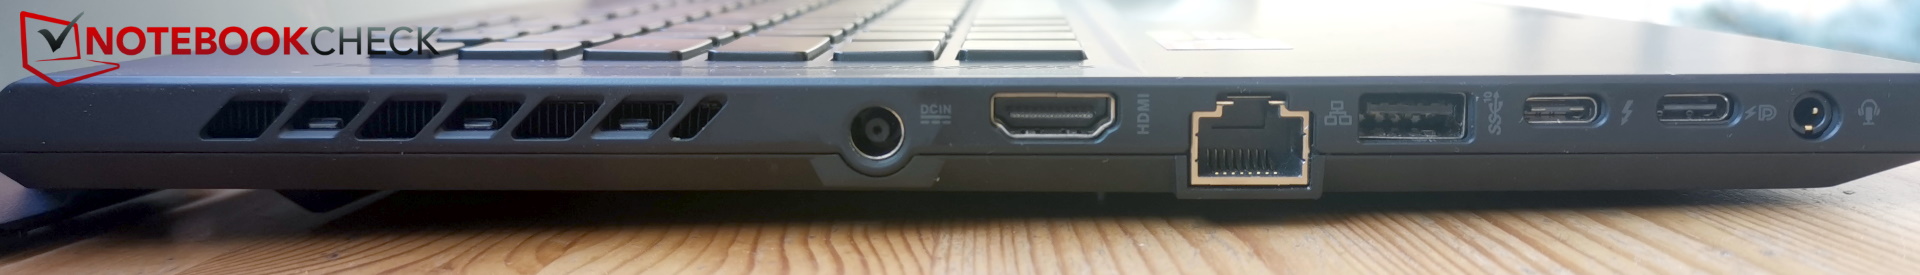
Equipo de conexión - HDMI 2.1 y Thunderbolt 4
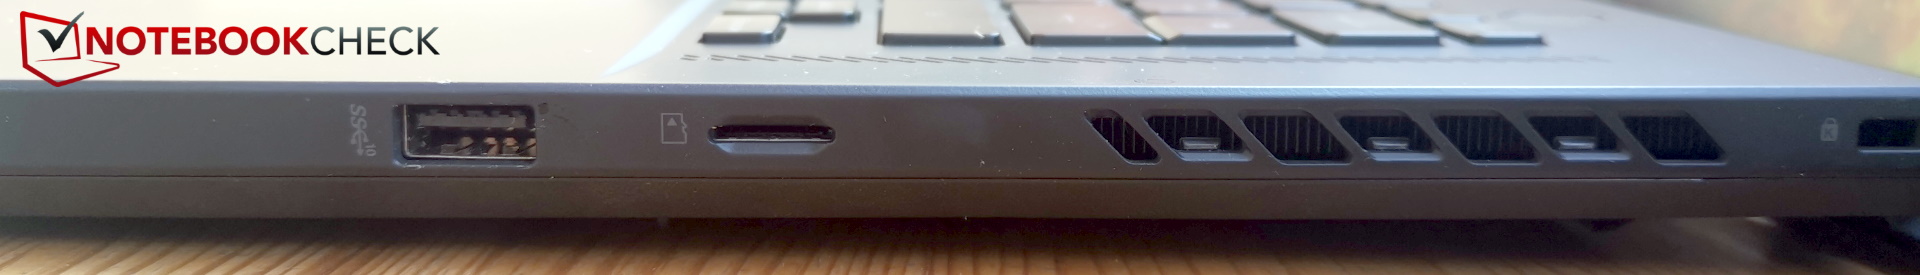
Lector de tarjetas SD
El lector de tarjetas SC está limitado a tarjetas microSD, pero al menos nuestra AV PRO microSD 128 GB V60 cabe perfectamente sin sobresalir. En comparación con el predecesor, que ya tenía un buen rendimiento, la velocidad vuelve a aumentar ligeramente.
| SD Card Reader | |
| average JPG Copy Test (av. of 3 runs) | |
| Asus ROG Zephyrus M16 GU603Z | |
| Media de la clase Gaming (20.9 - 210, n=54, últimos 2 años) | |
| Asus ROG Zephyrus M16 GU603H (AV PRO microSD 128 GB V60) | |
| Corsair Voyager a1600 (AV Pro SD microSD 128 GB V60) | |
| Schenker Vision 16 Pro RTX 3070 Ti (AV Pro V60) | |
| Schenker XMG Focus 16 (i7-12700H, RTX 3060) (AV Pro SD microSD 128 GB V60) | |
| maximum AS SSD Seq Read Test (1GB) | |
| Asus ROG Zephyrus M16 GU603Z | |
| Asus ROG Zephyrus M16 GU603H (AV PRO microSD 128 GB V60) | |
| Media de la clase Gaming (25.5 - 261, n=51, últimos 2 años) | |
| Corsair Voyager a1600 (AV Pro SD microSD 128 GB V60) | |
| Schenker XMG Focus 16 (i7-12700H, RTX 3060) (AV Pro SD microSD 128 GB V60) | |
| Schenker Vision 16 Pro RTX 3070 Ti (AV Pro V60) | |
Comunicación
Asus usa el módulo Intel AX211, que también soporta la red de 6 Ghz. Comparado con el módulo MediaTek del predecesor, las tasas de transferencia aumentan significativamente. El rendimiento es muy constante.
Cámara web


Pantalla - 16 pulgadas con QHD+ y 165 Hz
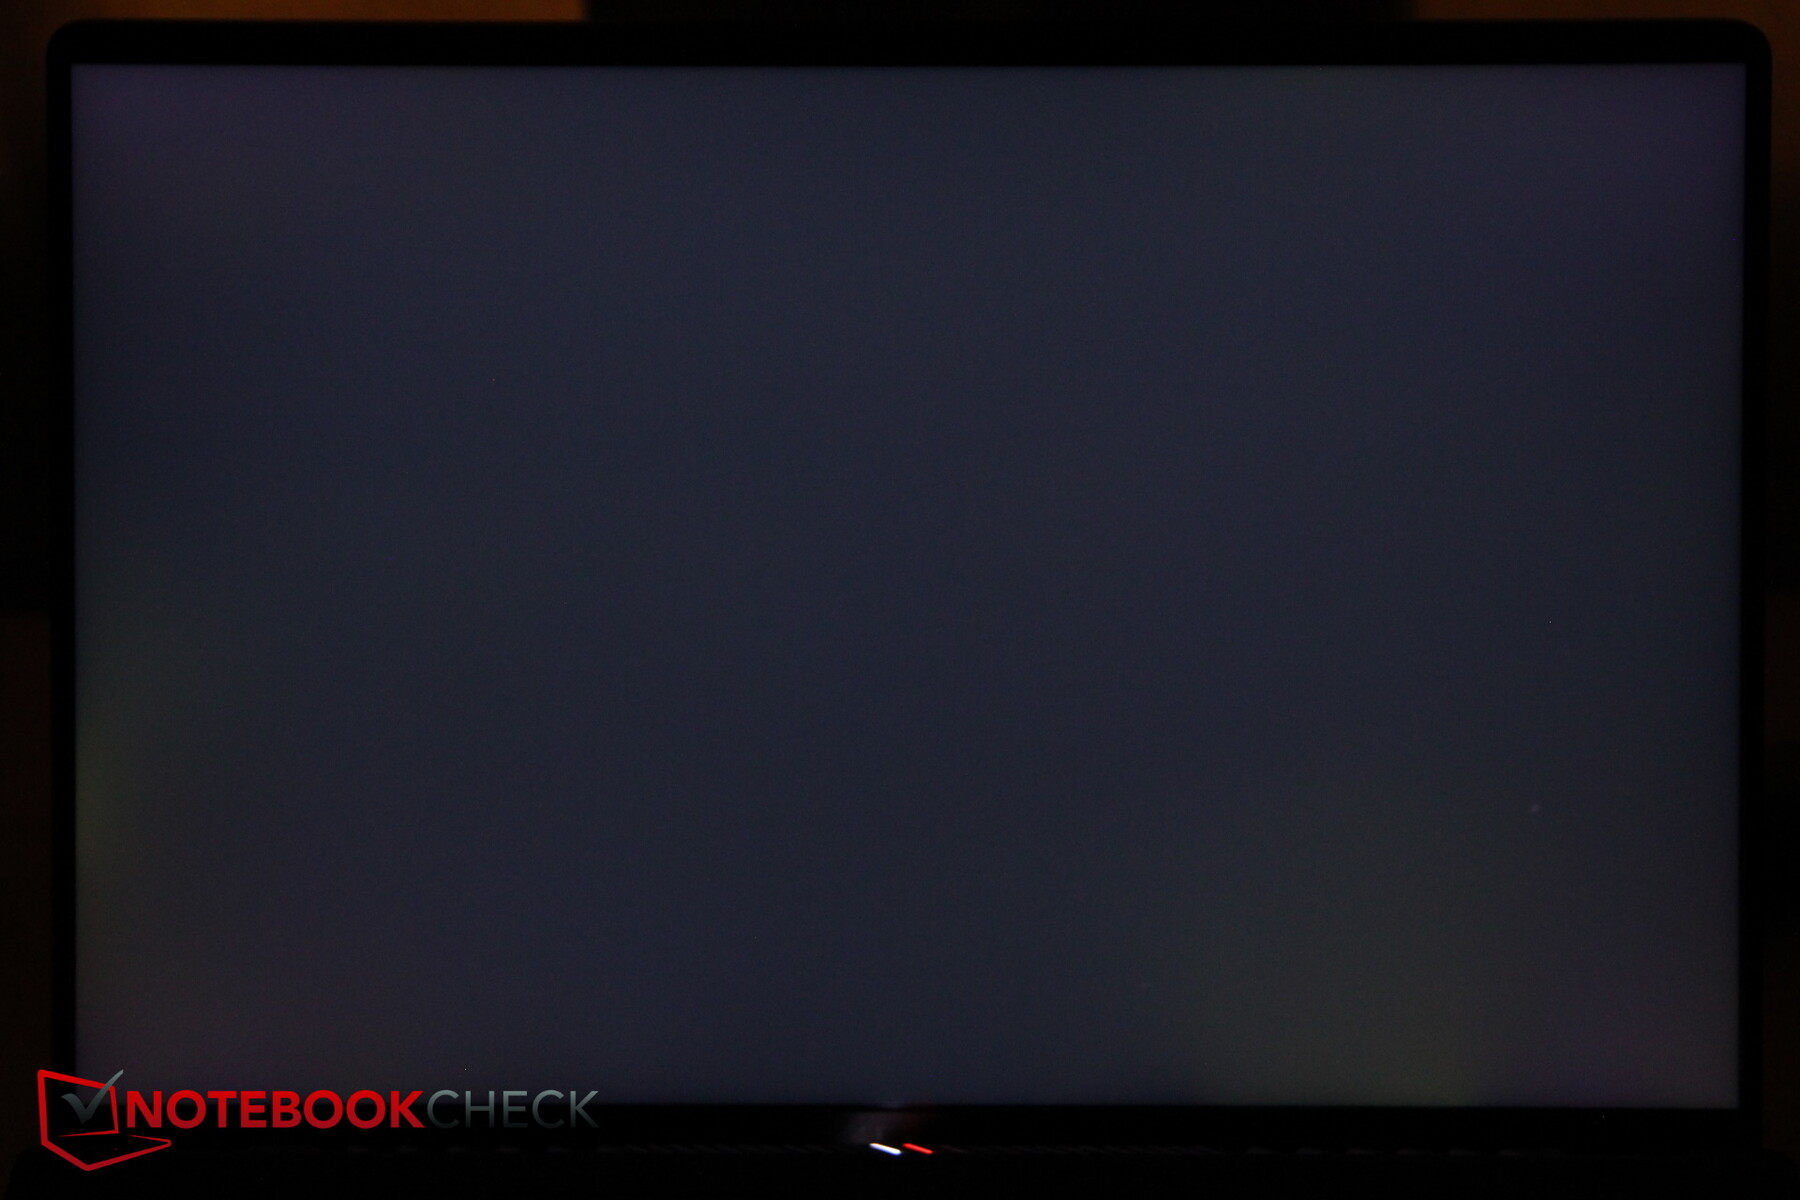
Aunque comparte las mismas especificaciones básicas (16 pulgadas, IPS, 16:10, 2.560 x 1.600, 165 Hz) con el predecesor, Asus usa ahora un panel diferente. En vez de usar un panel de AU Optronics, esta vez viene de BOE. Si bien el panel es incluso ligeramente más brillante (481 nits), la distribución del brillo es más desigual, y el brillo disminuye considerablemente hacia la esquina inferior izquierda en particular. Debido a un valor de negro significativamente mejorado, el valor de contraste aumenta positivamente.
Los tiempos de respuesta son relativamente rápidos, aunque el predecesor respondía aún más rápido aquí. No se usa PWM para controlar el brillo, y sólo se aprecia un ligero sangrado de pantalla en escenas oscuras.
| |||||||||||||||||||||||||
iluminación: 82 %
Brillo con batería: 484 cd/m²
Contraste: 2367:1 (Negro: 0.21 cd/m²)
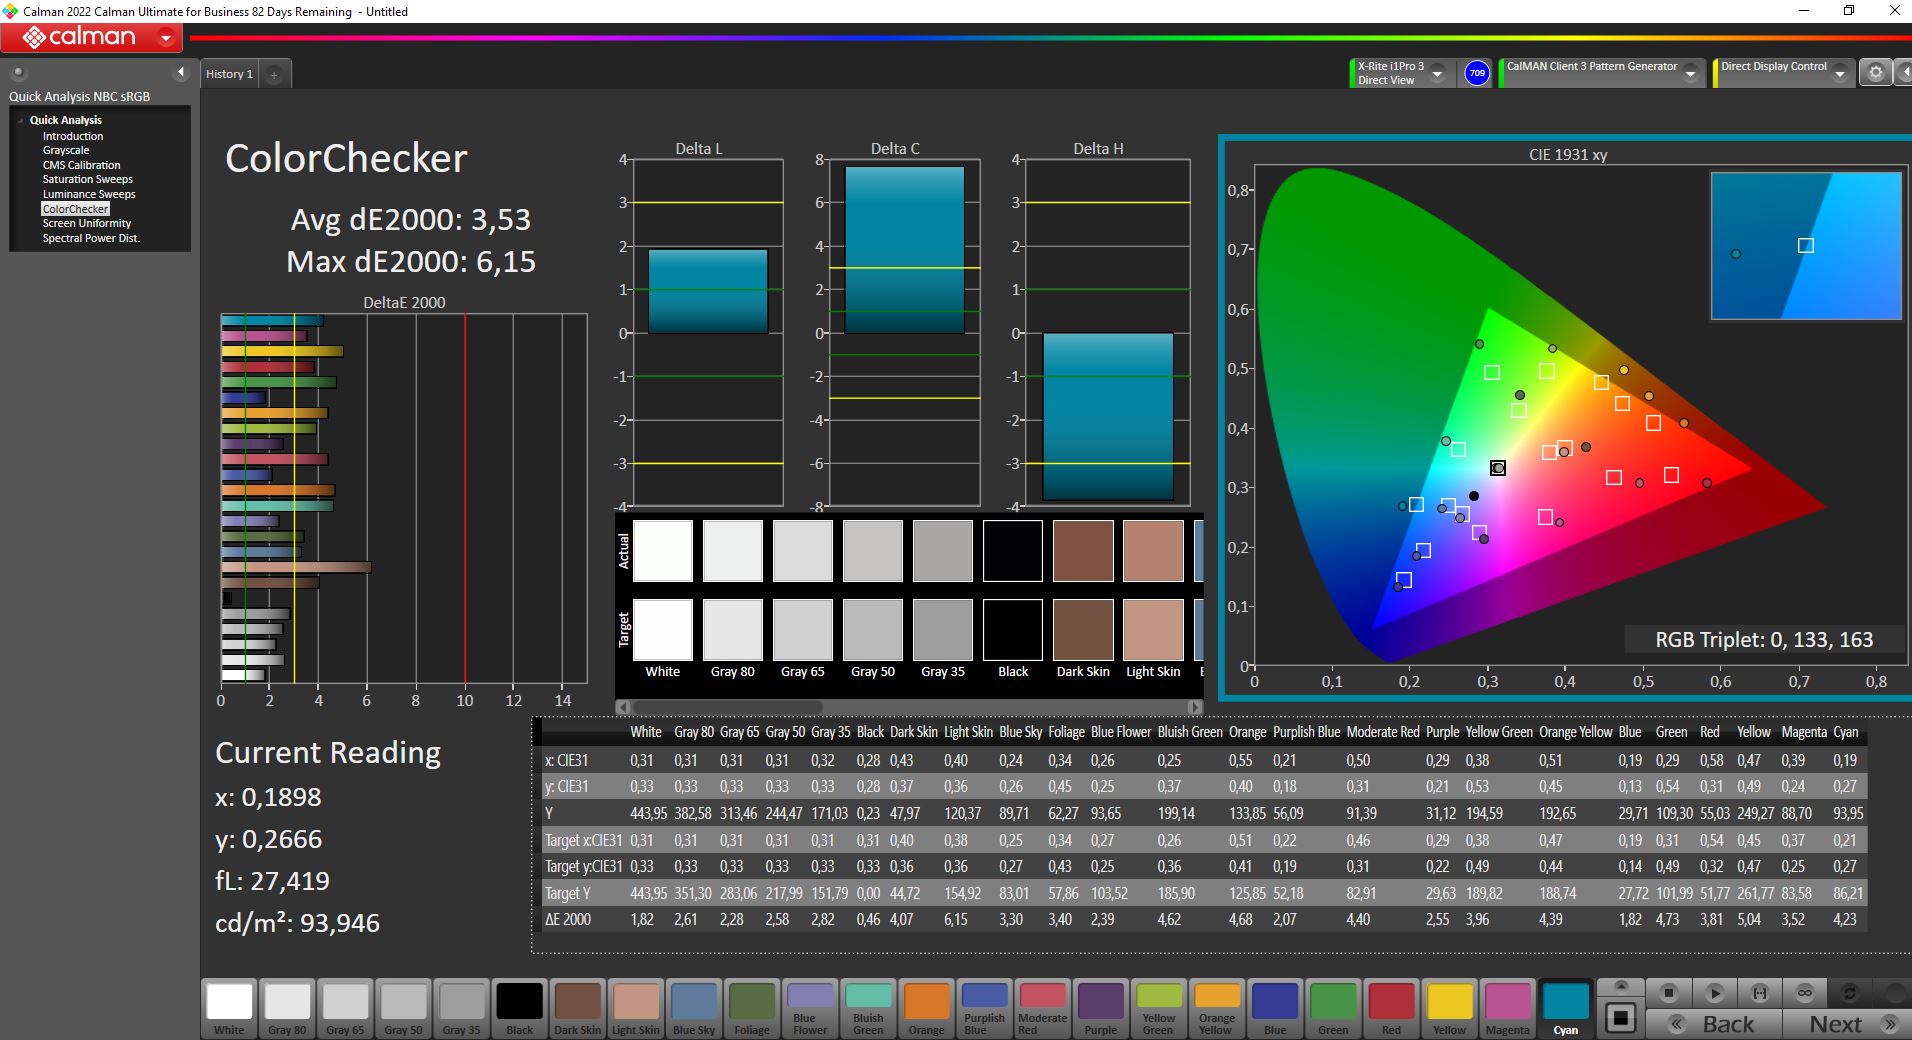
ΔE ColorChecker Calman: 3.53 | ∀{0.5-29.43 Ø4.71}
calibrated: 3.53
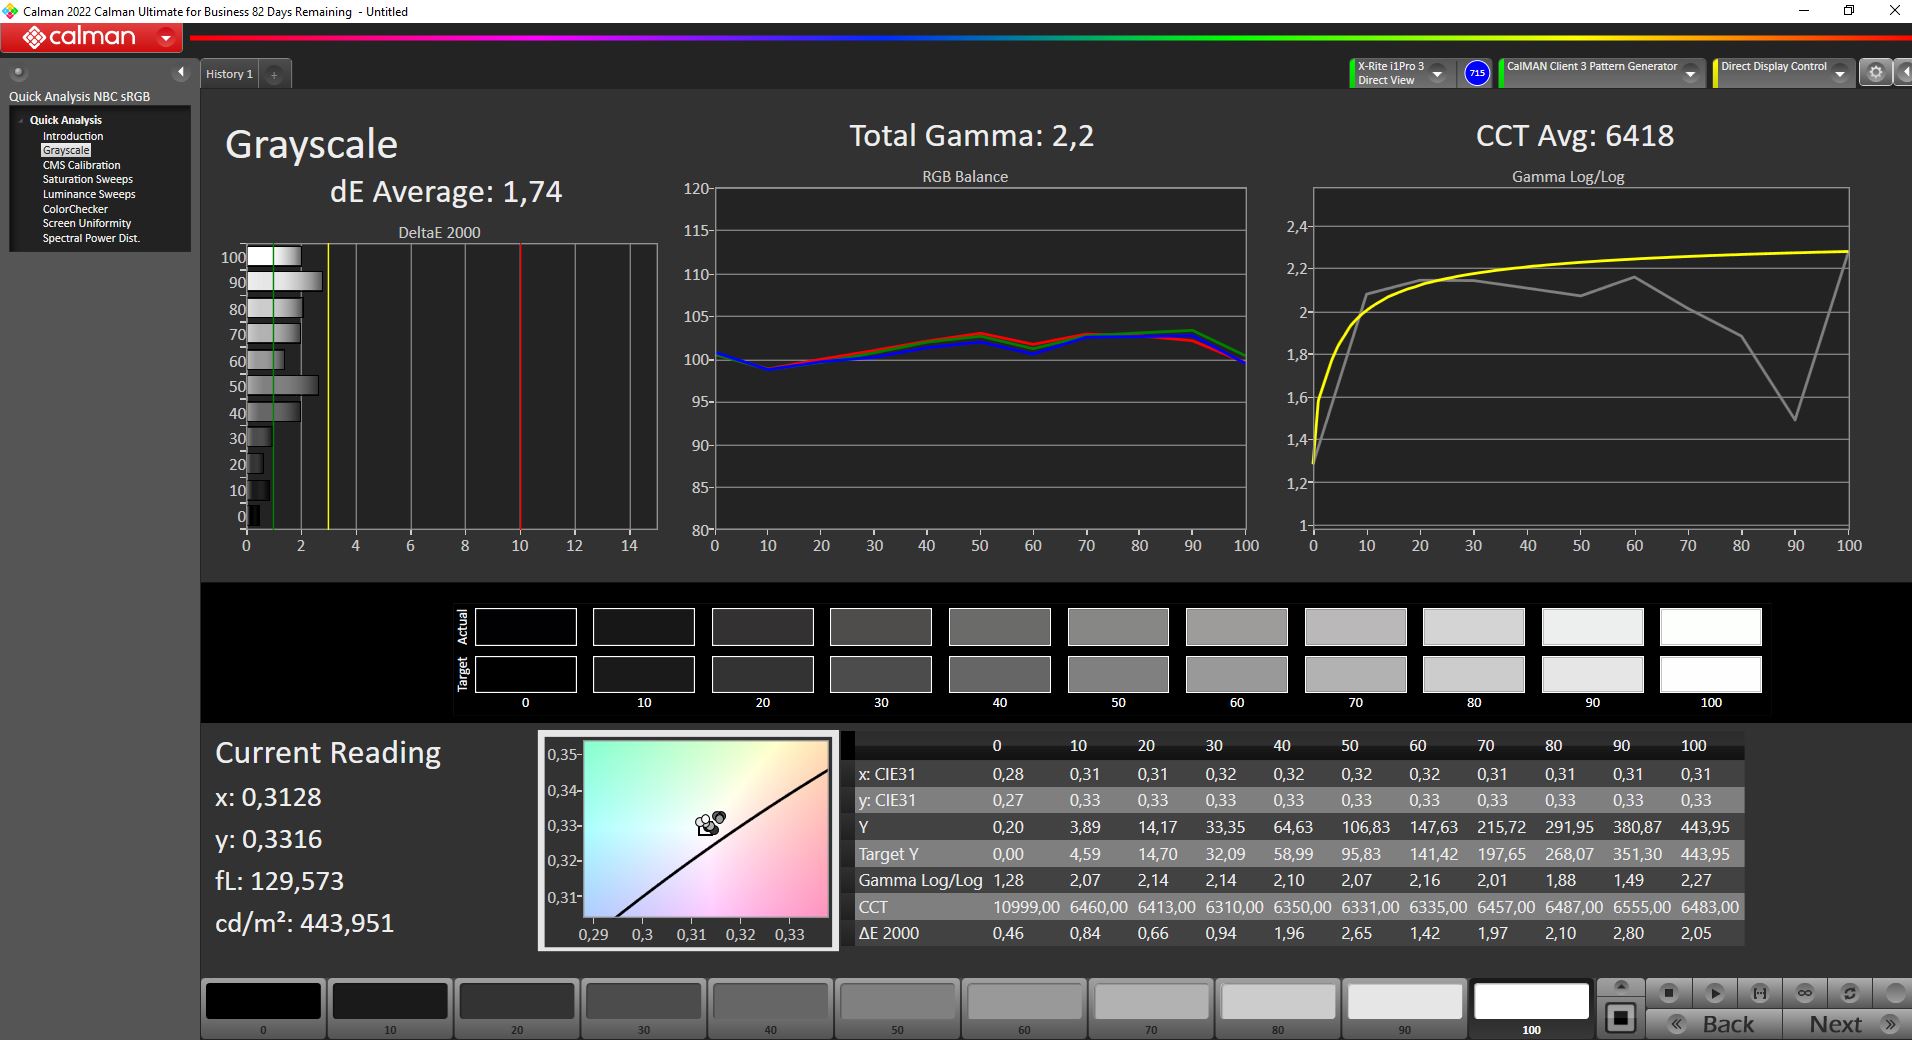
ΔE Greyscale Calman: 1.74 | ∀{0.09-98 Ø4.96}
83.1% AdobeRGB 1998 (Argyll 3D)
98.5% sRGB (Argyll 3D)
92.8% Display P3 (Argyll 3D)
Gamma: 2.2
CCT: 6418 K
| Asus ROG Zephyrus M16 GU603Z BOE0A0B (BOE CQ NE160QDM-NY3), IPS, 2560x1600, 16" | Asus ROG Zephyrus M16 GU603H AU Optronics AUOC199, IPS, 2560x1600, 16" | Schenker Vision 16 Pro RTX 3070 Ti N160QDM-NZ1, IPS, 2560x1600, 16" | Lenovo Legion 5 Pro 16ARH7H RTX 3070 Ti BOE CQ NE160QDM-NY1, IPS, 2560x1600, 16" | Schenker XMG Focus 16 (i7-12700H, RTX 3060) BOE NE16oQDM-NY1, IPS, 2560x1600, 16" | Corsair Voyager a1600 BOE0A3B, IPS, 2560x1600, 16" | |
|---|---|---|---|---|---|---|
| Display | -15% | -15% | -14% | -14% | ||
| Display P3 Coverage (%) | 92.8 | 68.7 -26% | 67.3 -27% | 68.3 -26% | 68.7 -26% | |
| sRGB Coverage (%) | 98.5 | 96.7 -2% | 96.1 -2% | 96.6 -2% | 98.2 0% | |
| AdobeRGB 1998 Coverage (%) | 83.1 | 70 -16% | 69.5 -16% | 70.6 -15% | 70.1 -16% | |
| Response Times | 39% | -37% | -51% | -62% | -36% | |
| Response Time Grey 50% / Grey 80% * (ms) | 7.6 ? | 4.8 ? 37% | 14.3 ? -88% | 14.4 ? -89% | 16.4 ? -116% | 13 ? -71% |
| Response Time Black / White * (ms) | 10 ? | 6 ? 40% | 8.6 ? 14% | 11.2 ? -12% | 10.8 ? -8% | 10 ? -0% |
| PWM Frequency (Hz) | ||||||
| Screen | -28% | -34% | -11% | -40% | -21% | |
| Brightness middle (cd/m²) | 497 | 448 -10% | 364 -27% | 522.8 5% | 460 -7% | 355 -29% |
| Brightness (cd/m²) | 481 | 446 -7% | 347 -28% | 503 5% | 442 -8% | 340 -29% |
| Brightness Distribution (%) | 82 | 86 5% | 89 9% | 84 2% | 89 9% | 91 11% |
| Black Level * (cd/m²) | 0.21 | 0.48 -129% | 0.3 -43% | 0.41 -95% | 0.32 -52% | 0.53 -152% |
| Contrast (:1) | 2367 | 933 -61% | 1213 -49% | 1275 -46% | 1438 -39% | 670 -72% |
| Colorchecker dE 2000 * | 3.53 | 2.76 22% | 3.3 7% | 2.47 30% | 3.65 -3% | 2.43 31% |
| Colorchecker dE 2000 max. * | 6.15 | 7.09 -15% | 6.6 -7% | 6.56 -7% | 7.49 -22% | 4.31 30% |
| Colorchecker dE 2000 calibrated * | 3.53 | 2.86 19% | 2.5 29% | 0.61 83% | 3.65 -3% | 1.14 68% |
| Greyscale dE 2000 * | 1.74 | 3.1 -78% | 5.2 -199% | 3 -72% | 5.87 -237% | 2.62 -51% |
| Gamma | 2.2 100% | 2.153 102% | 2.14 103% | 2.27 97% | 2.42 91% | 2.28 96% |
| CCT | 6418 101% | 6826 95% | 6331 103% | 6719 97% | 6711 97% | 6909 94% |
| Color Space (Percent of AdobeRGB 1998) (%) | 87 | |||||
| Color Space (Percent of sRGB) (%) | 100 | |||||
| Media total (Programa/Opciones) | 6% /
-16% | -29% /
-30% | -26% /
-17% | -39% /
-38% | -24% /
-22% |
* ... más pequeño es mejor
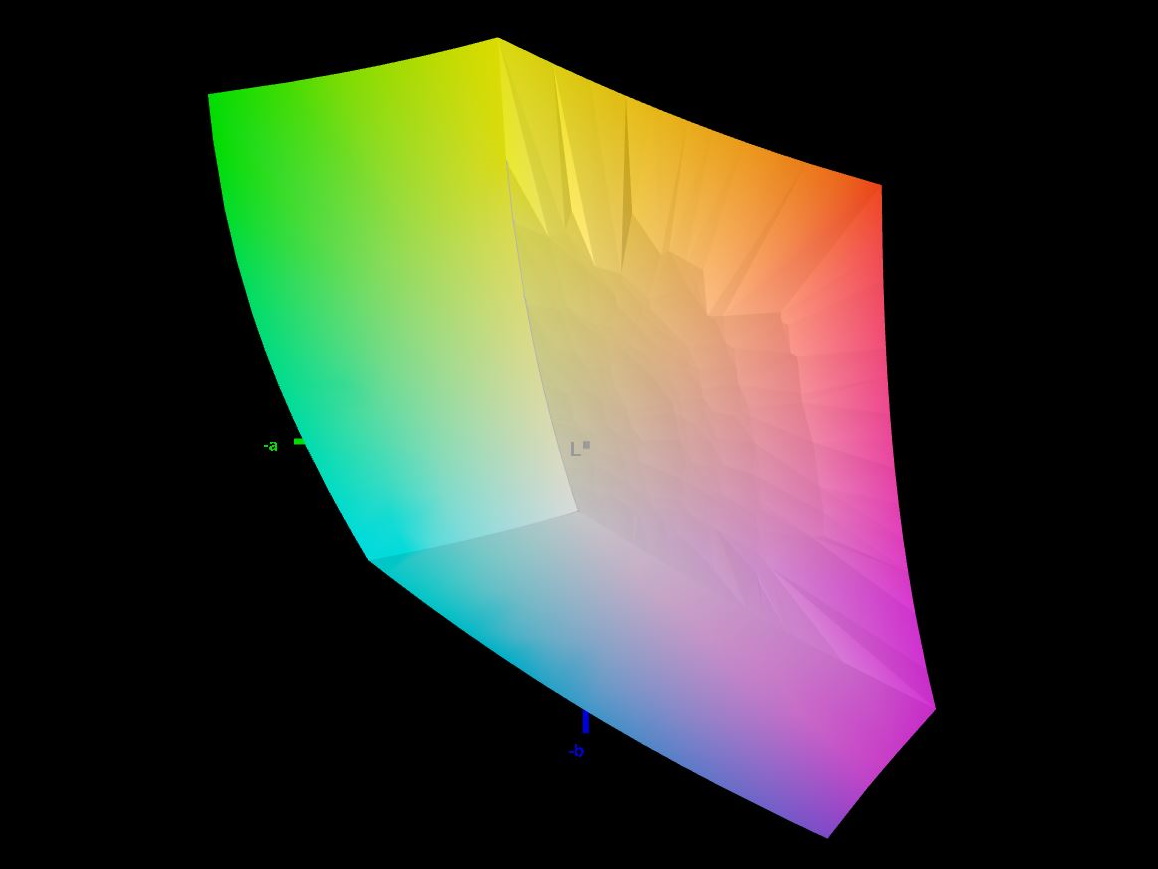
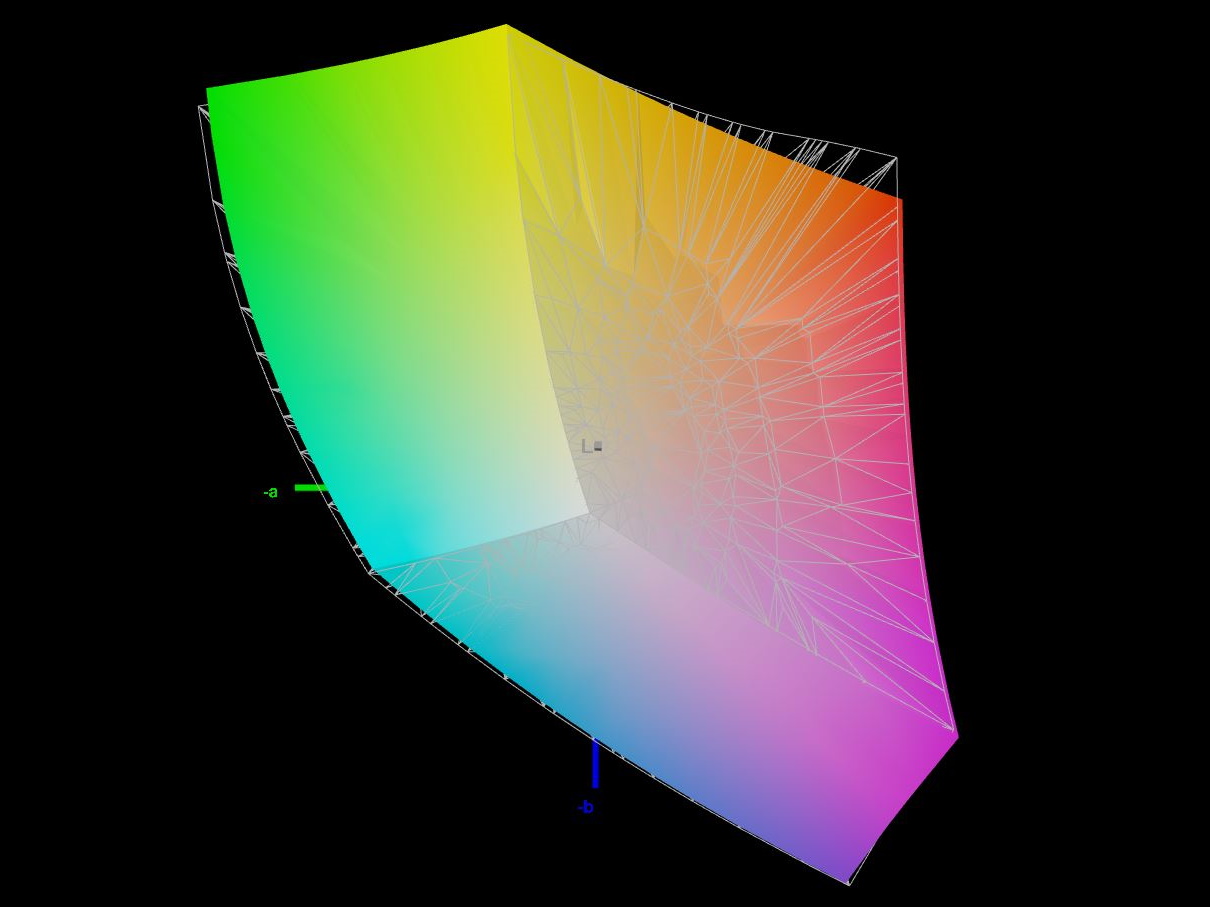
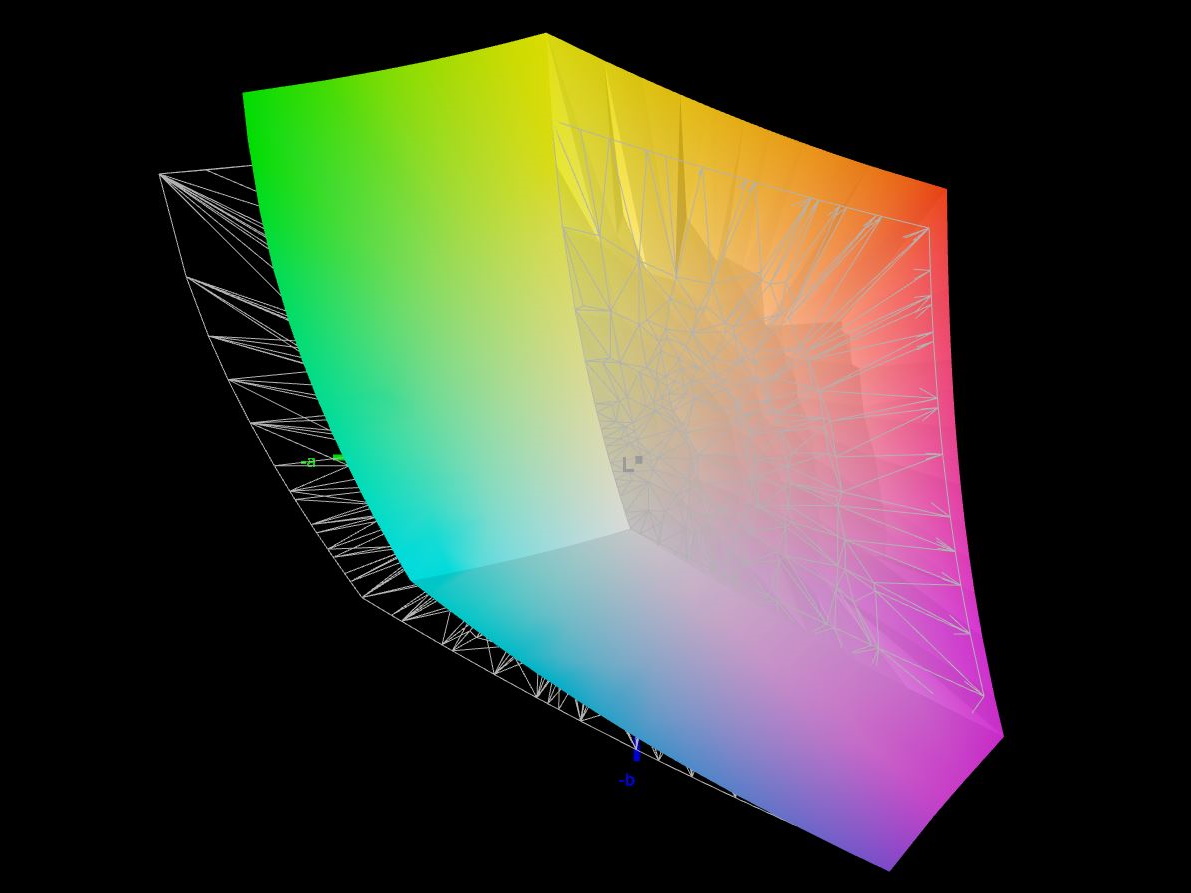
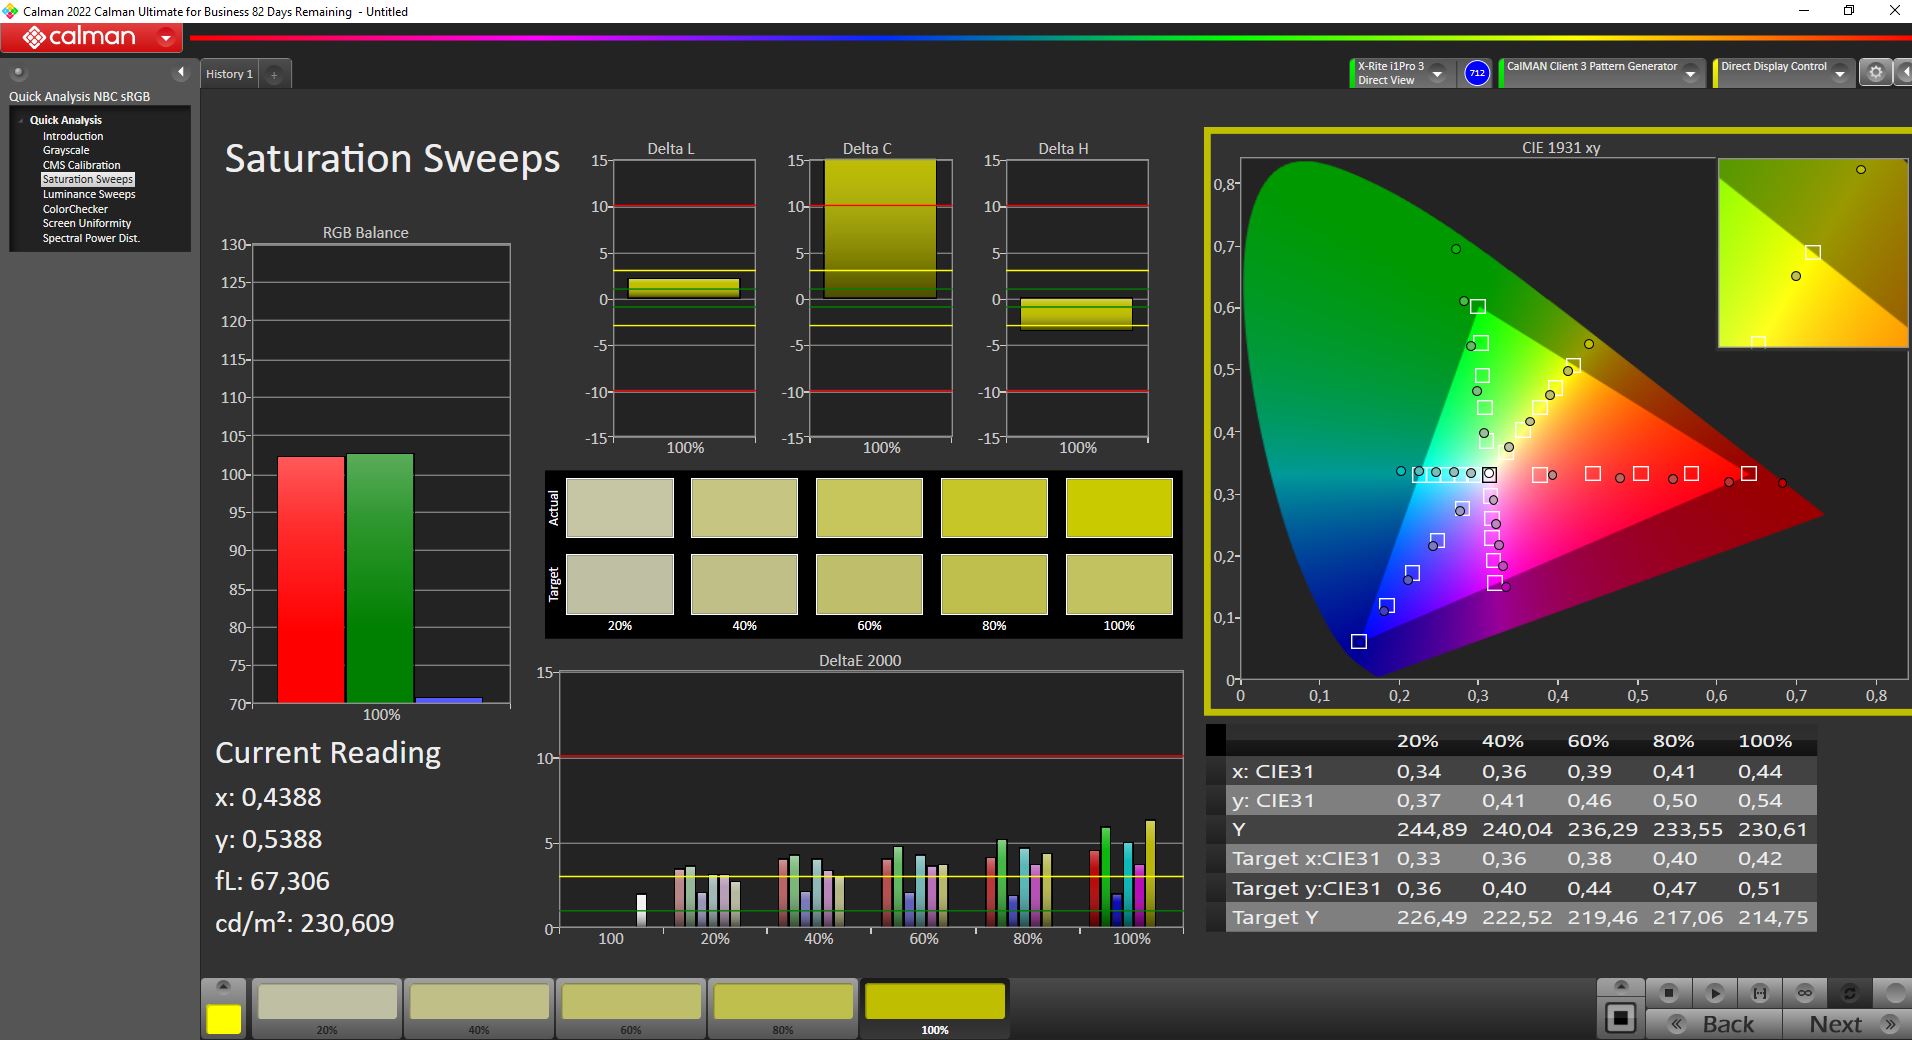
Asus anuncia una cobertura del 100% del espacio de color DCI-P3, pero medimos "sólo" el 92.8%. El espacio de color AdobeRGB sigue cubierto al 83%. Al menos en el campo de pruebas de nuestros competidores seleccionados, esto sigue resultando en la primera posición. En general, la pantalla también es adecuada para la edición profesional de fotos y vídeos.
En el estado de entrega, el panel ya está bien calibrado. Con sólo 1,74, el valor DeltaE de la escala de grises es especialmente bajo. En el ColorChecker, nuestra herramienta de calibración del color Portrait Display Calman mide desviaciones ligeramente superiores. Una calibración adicional no mejora aún más estos valores, sino que estropea la escala de grises que ya es muy buena.
Tiempos de respuesta del display
| ↔ Tiempo de respuesta de Negro a Blanco | ||
|---|---|---|
| 10 ms ... subida ↗ y bajada ↘ combinada | ↗ 4.6 ms subida | 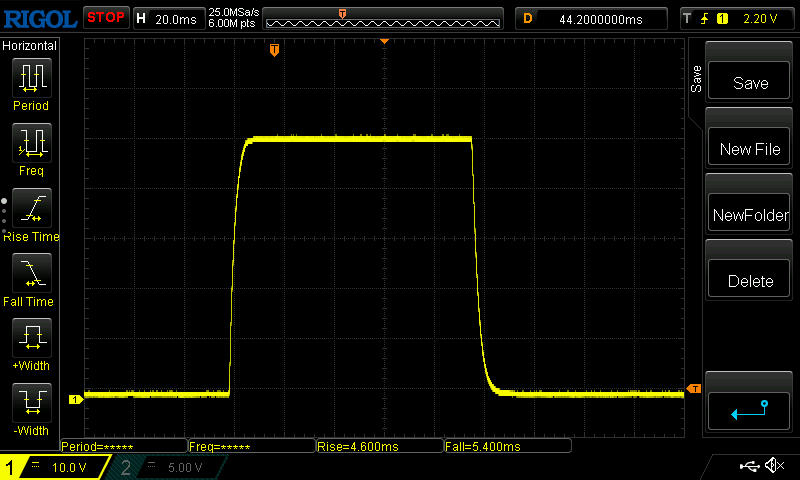 |
| ↘ 5.4 ms bajada | ||
| La pantalla mostró buenos tiempos de respuesta en nuestros tests pero podría ser demasiado lenta para los jugones competitivos. En comparación, todos los dispositivos de prueba van de ##min### (mínimo) a 240 (máximo) ms. » 27 % de todos los dispositivos son mejores. Esto quiere decir que el tiempo de respuesta medido es mejor que la media (19.8 ms) de todos los dispositivos testados. | ||
| ↔ Tiempo de respuesta 50% Gris a 80% Gris | ||
| 7.6 ms ... subida ↗ y bajada ↘ combinada | ↗ 3.4 ms subida | 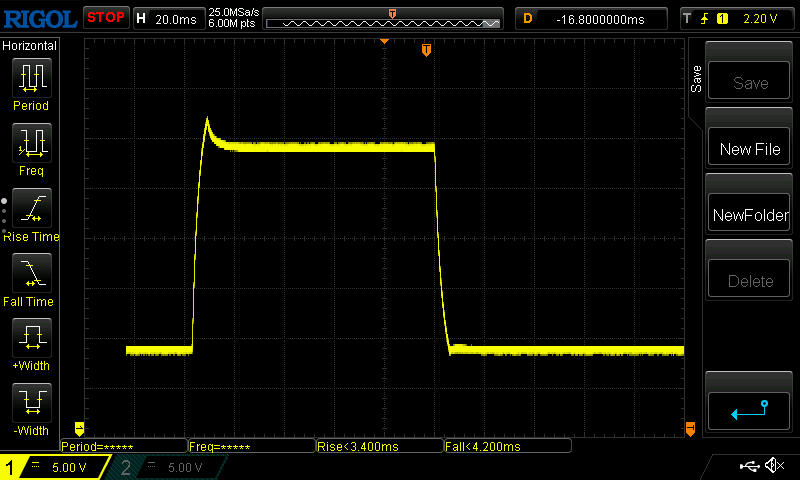 |
| ↘ 4.2 ms bajada | ||
| La pantalla mostró tiempos de respuesta muy rápidos en nuestros tests y debería ser adecuada para juegos frenéticos. En comparación, todos los dispositivos de prueba van de ##min### (mínimo) a 636 (máximo) ms. » 20 % de todos los dispositivos son mejores. Esto quiere decir que el tiempo de respuesta medido es mejor que la media (31 ms) de todos los dispositivos testados. | ||
Parpadeo de Pantalla / PWM (Pulse-Width Modulation)
| Parpadeo de Pantalla / PWM no detectado | 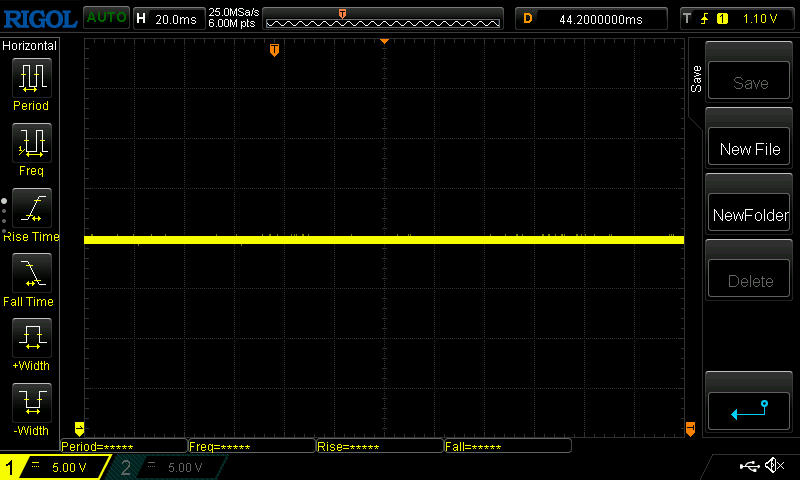 | ||
Comparación: 52 % de todos los dispositivos testados no usaron PWM para atenuar el display. Si se usó, medimos una media de 7757 (mínimo: 5 - máxmo: 343500) Hz. | |||
A pesar del buen brillo de la pantalla, debes evitar la luz solar directa en exteriores y asegurarte de mirar la pantalla de frente, ya que de lo contrario la visibilidad disminuye rápidamente.

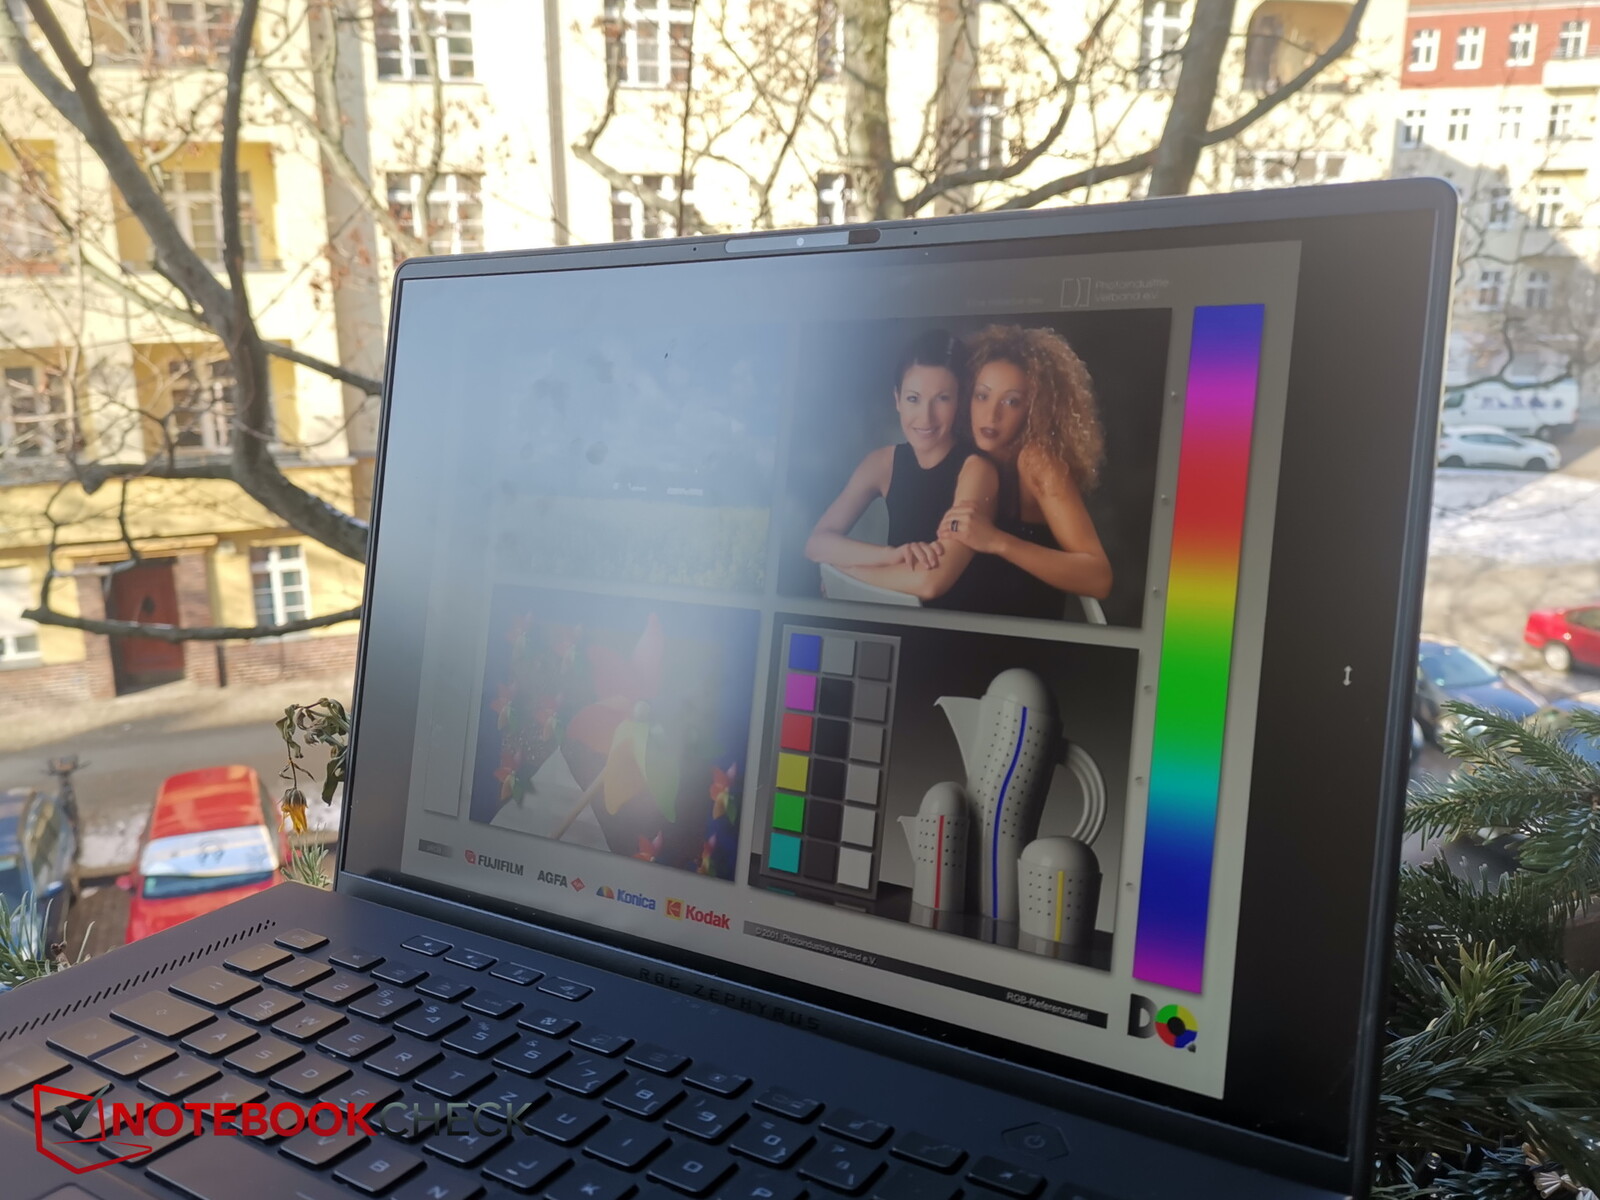
El contenido de la pantalla puede leerse fácilmente incluso desde ángulos de visión extremos. Cuando se mira la pantalla desde los lados, el brillo es menor que cuando se mira desde los ángulos de visión superior o inferior.

Rendimiento - RTX 3070-Ti de 120 vatios ligeramente por debajo de la media
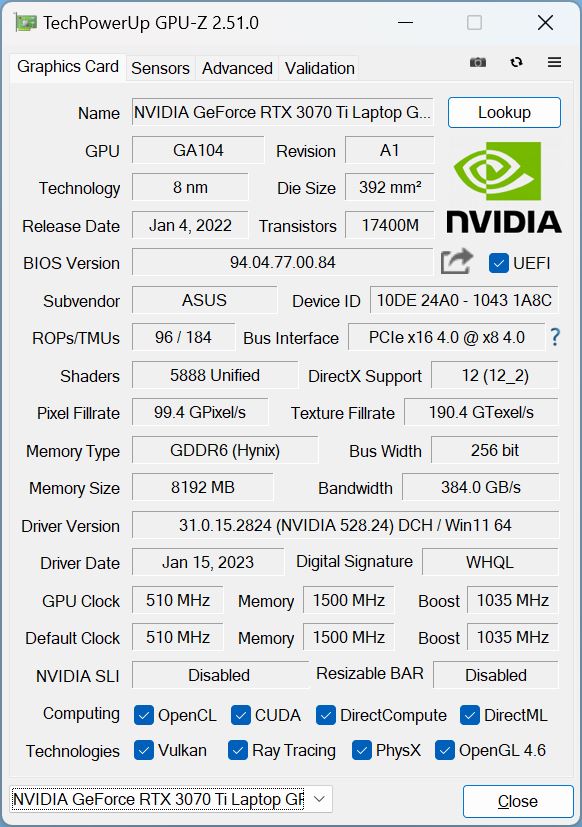
El ROG Zephyrus está disponible en varias configuraciones de equipo. Se supone que el M16 también estará disponible con una CPU Intel de 13ª generación y RTX 40xx próximamente, mientras que nuestra unidad de pruebas sigue utilizando unCore i9-12900HyRTX 3070 Ti.
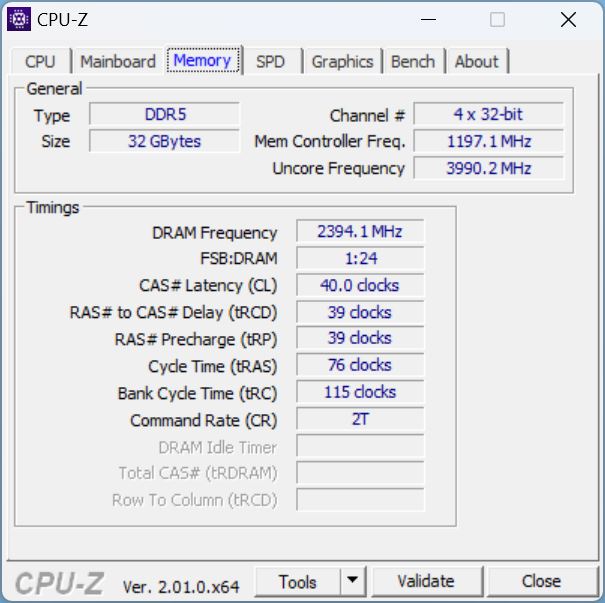
Alternativamente, casi todo es posible a partir de laRTX 3050 Tihasta la RTX 3080 Ti. En cuanto al procesador, actualmente puedes elegir entre el i7-12700Hy nuestro modelo superior. El equipo se completa con 32 GB de RAM, pero también hay numerosas opciones disponibles aquí.
Condiciones de la prueba
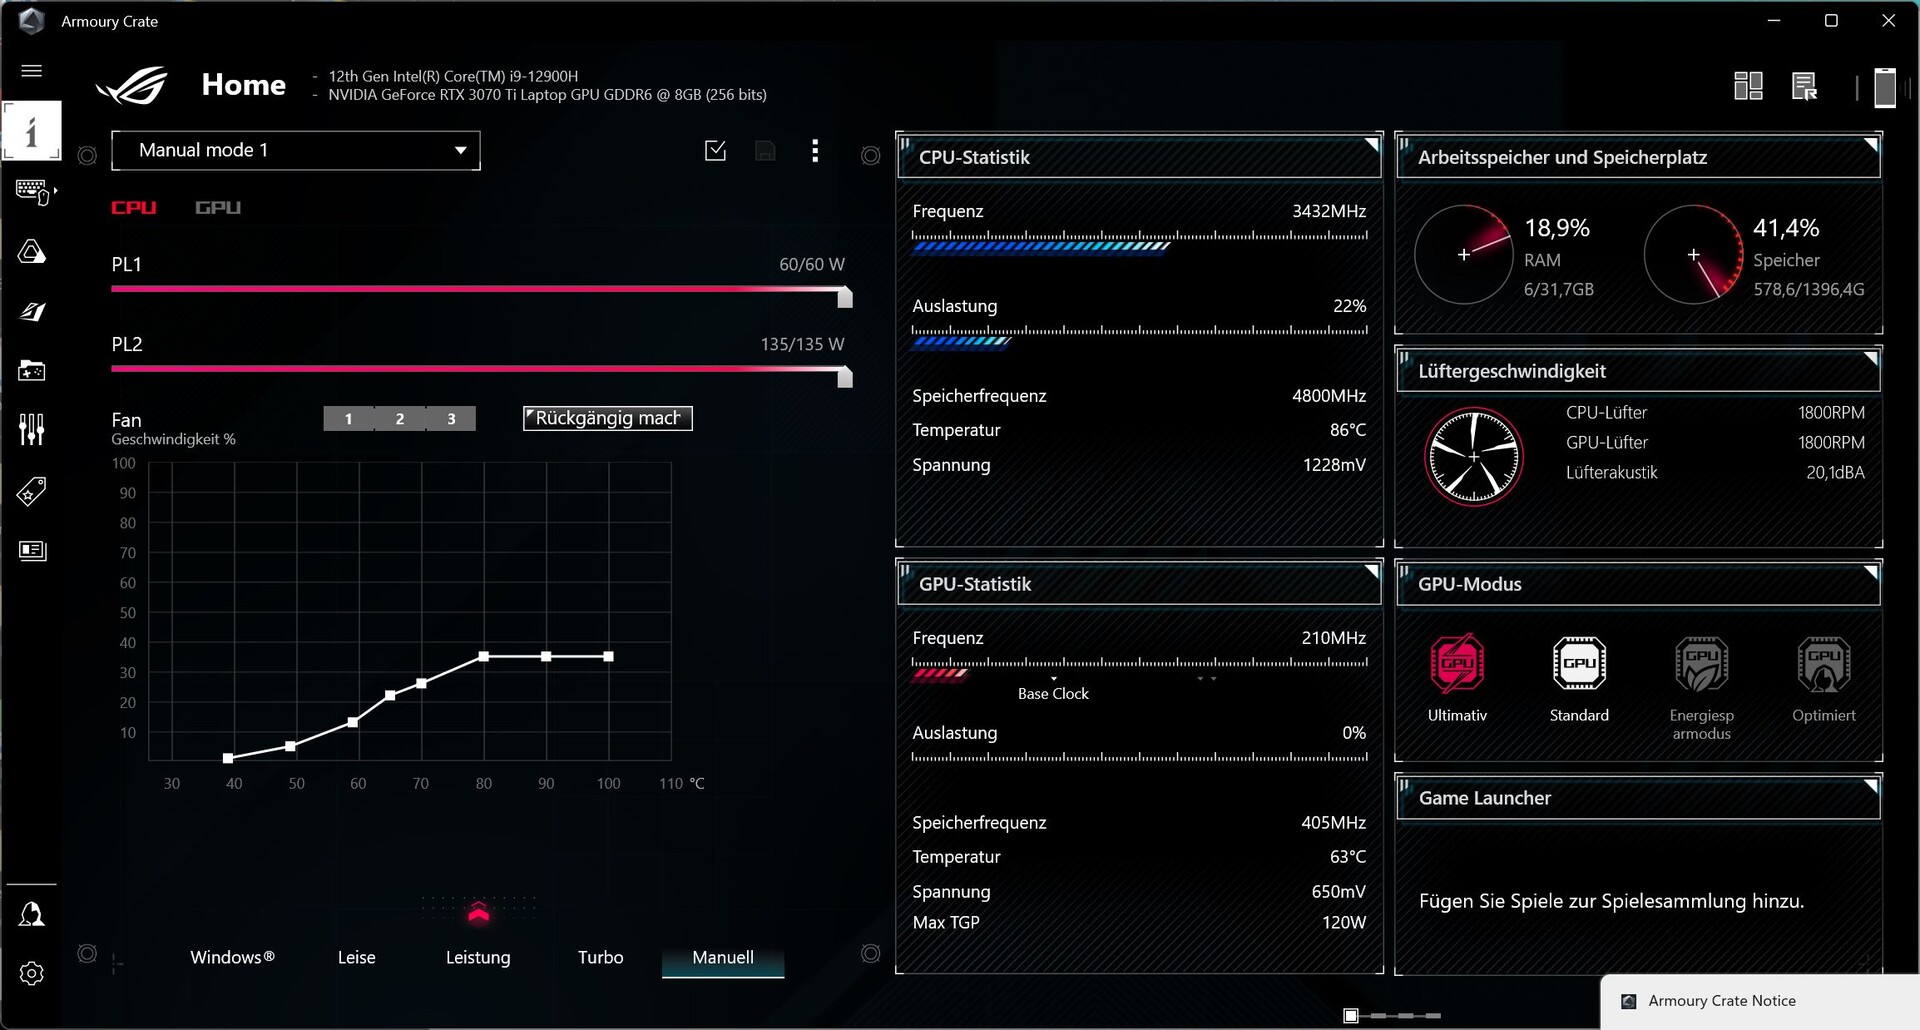
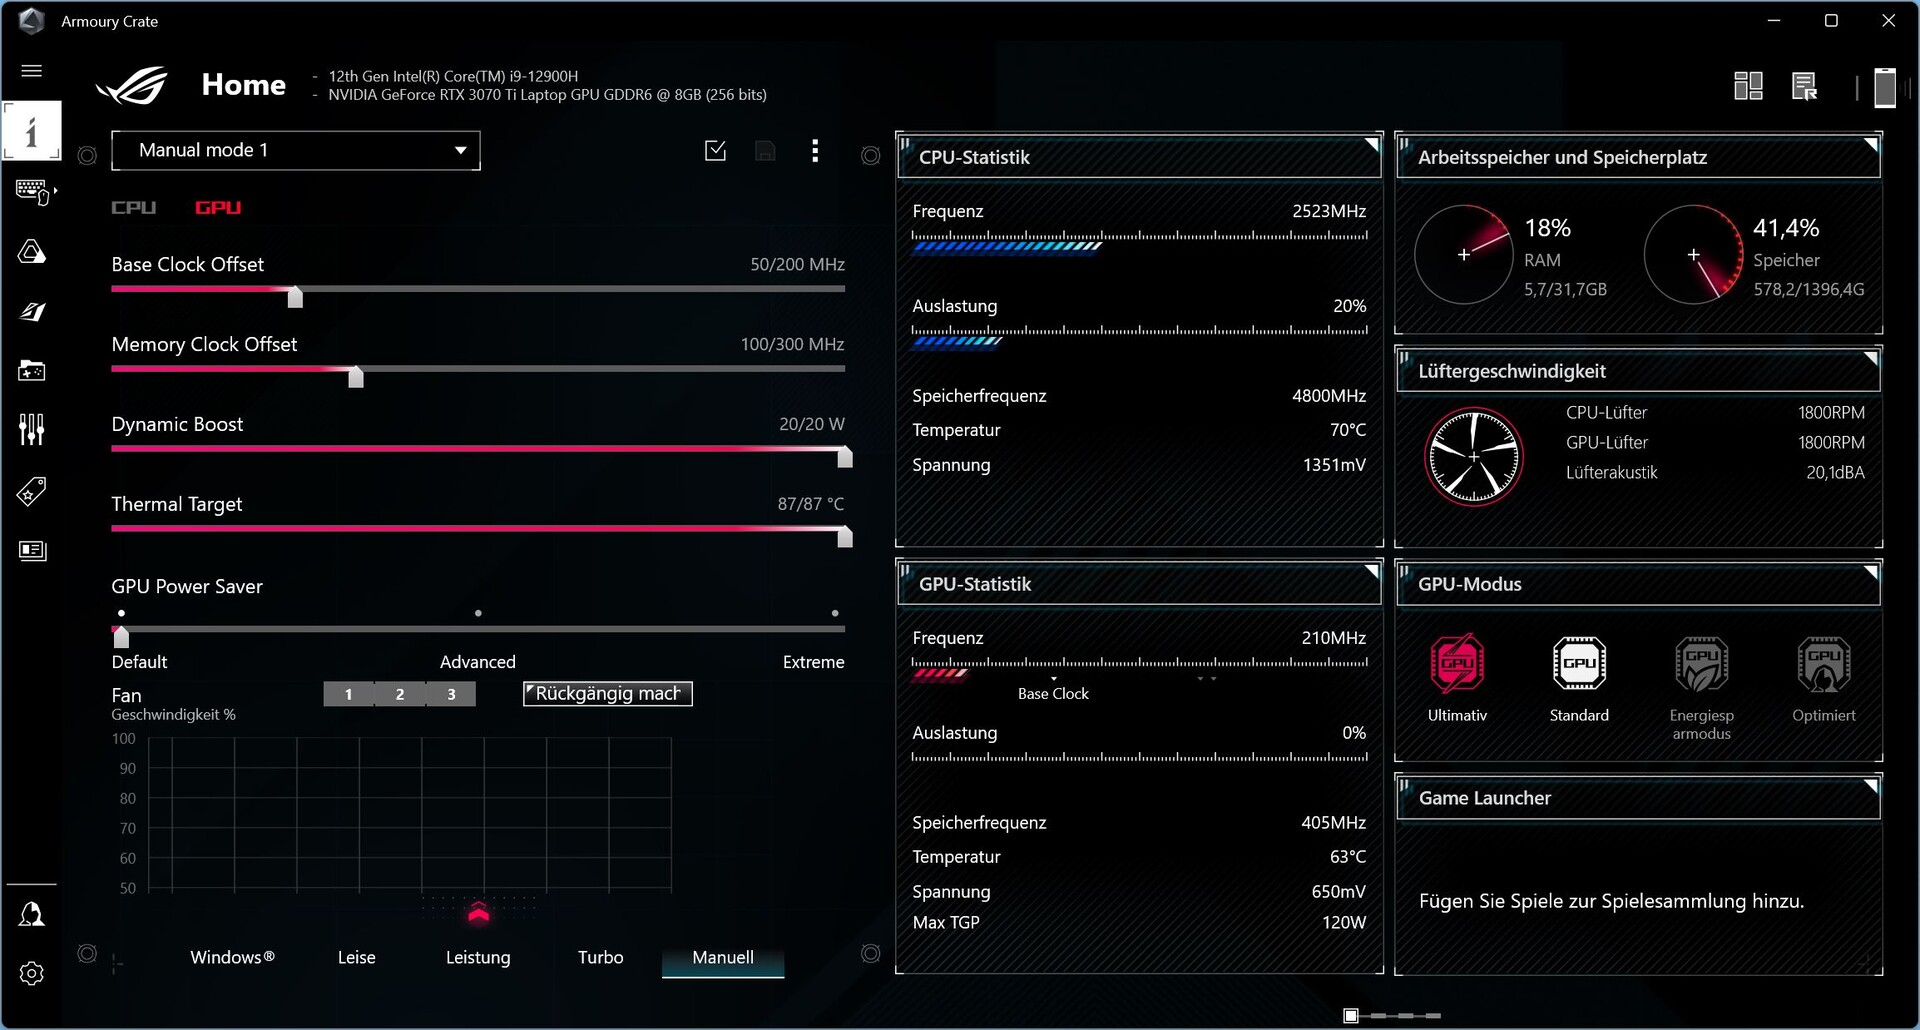
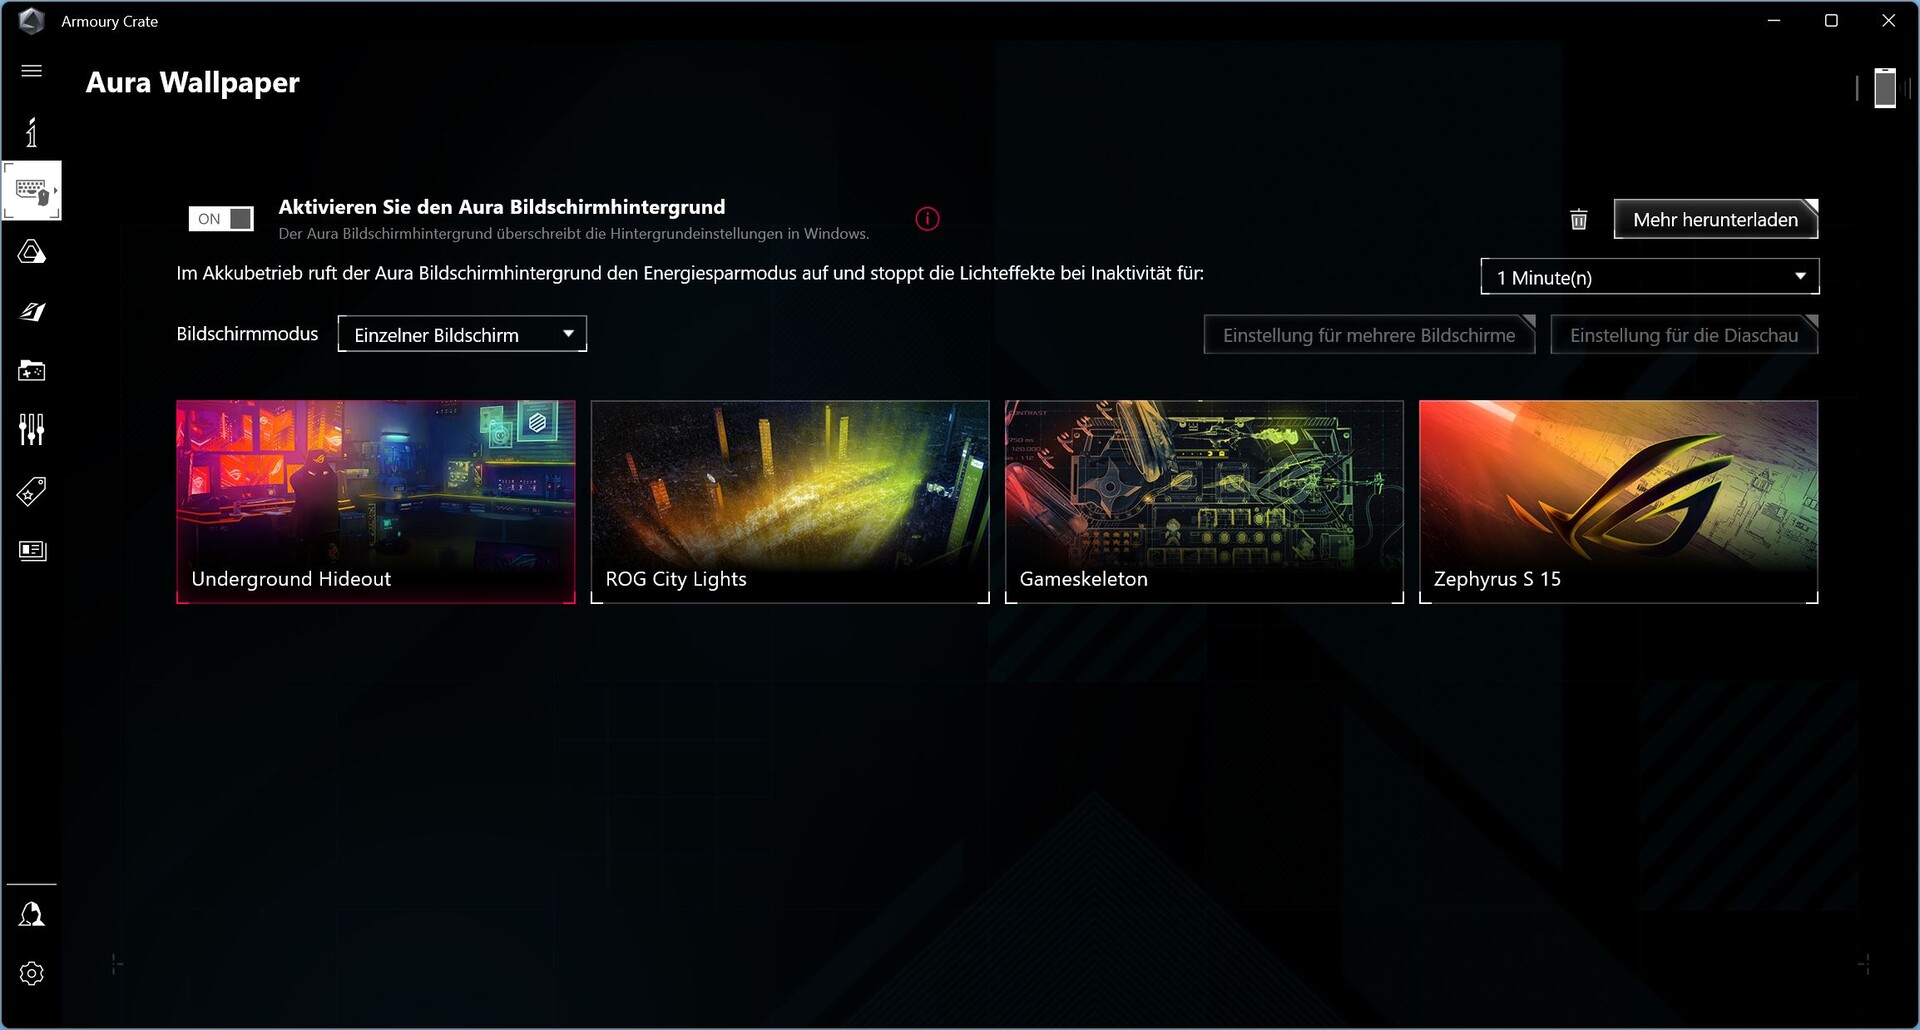
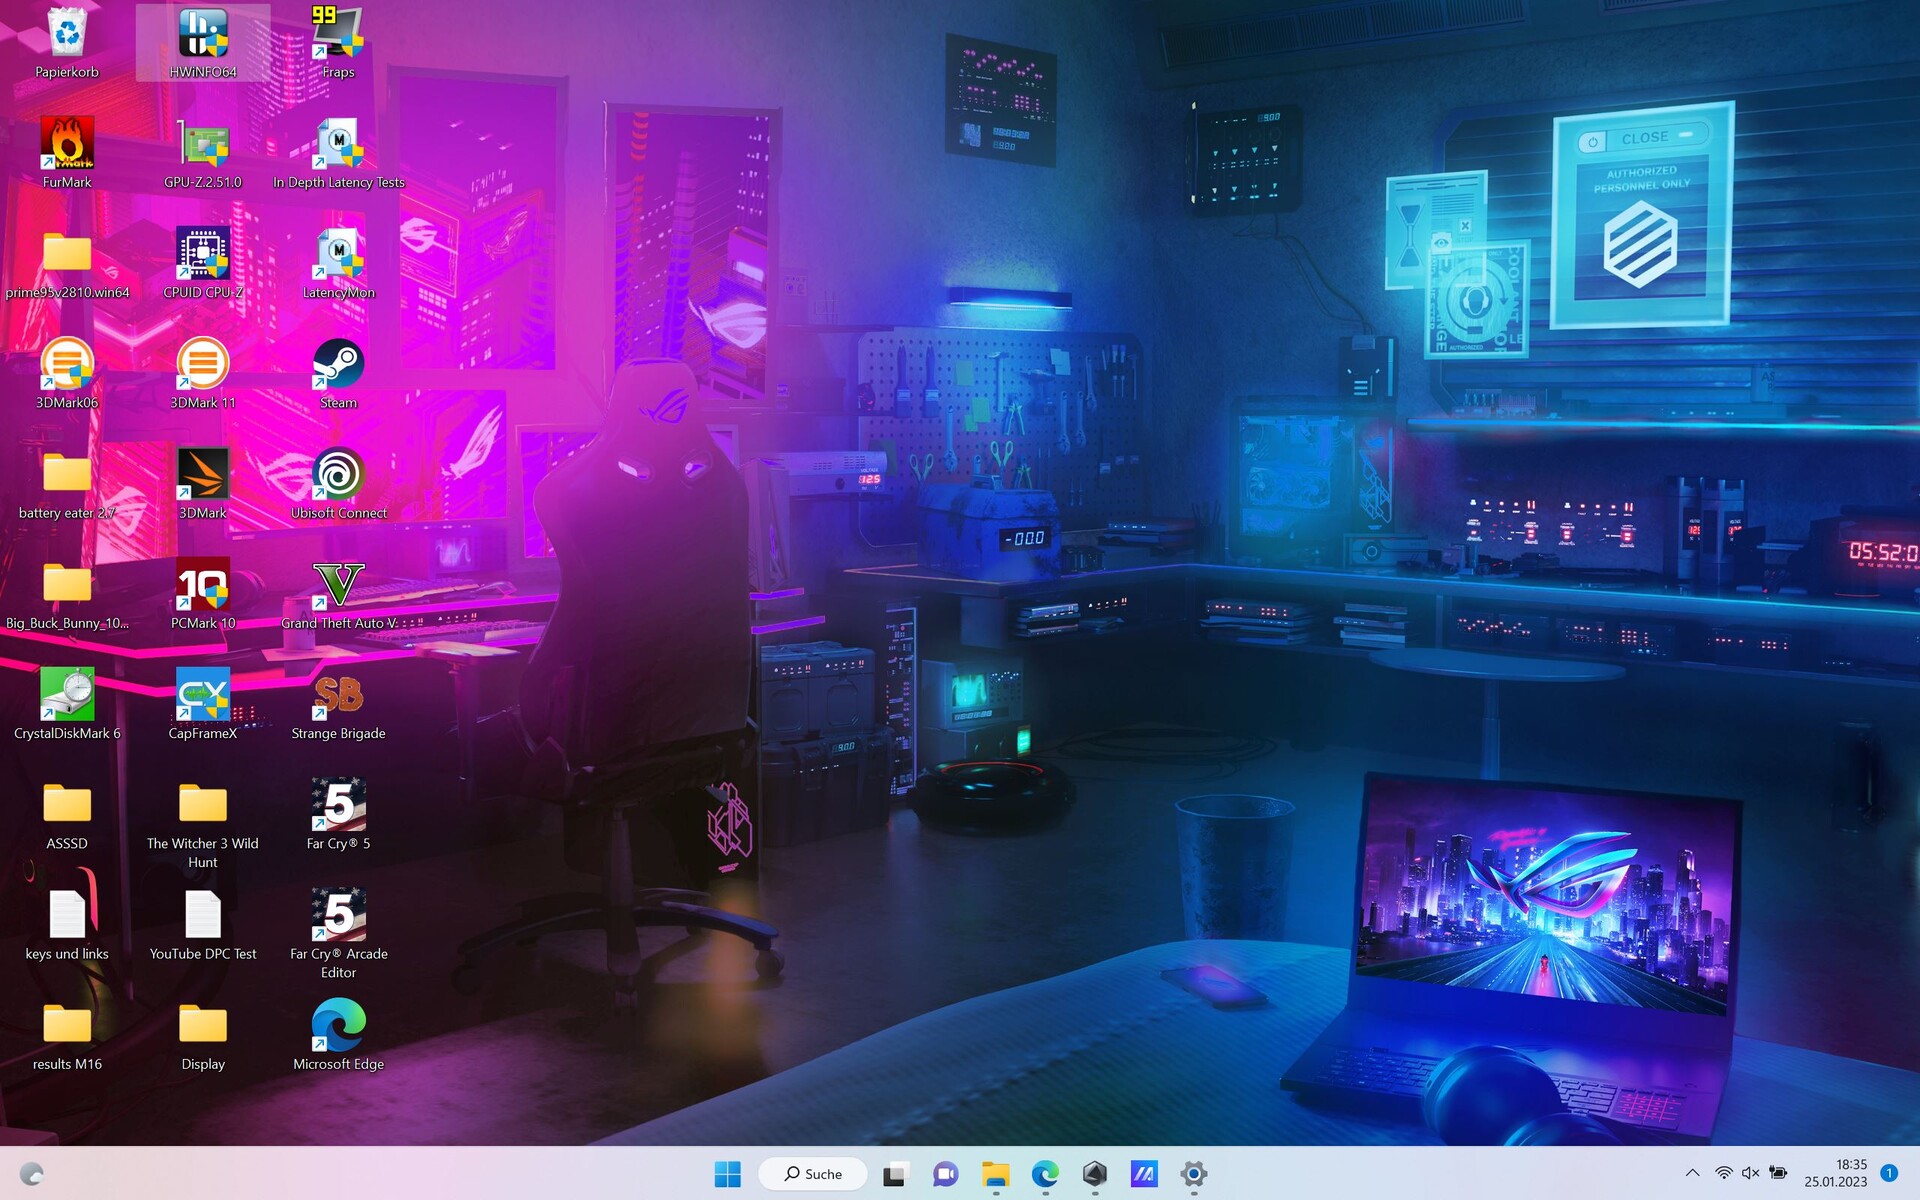
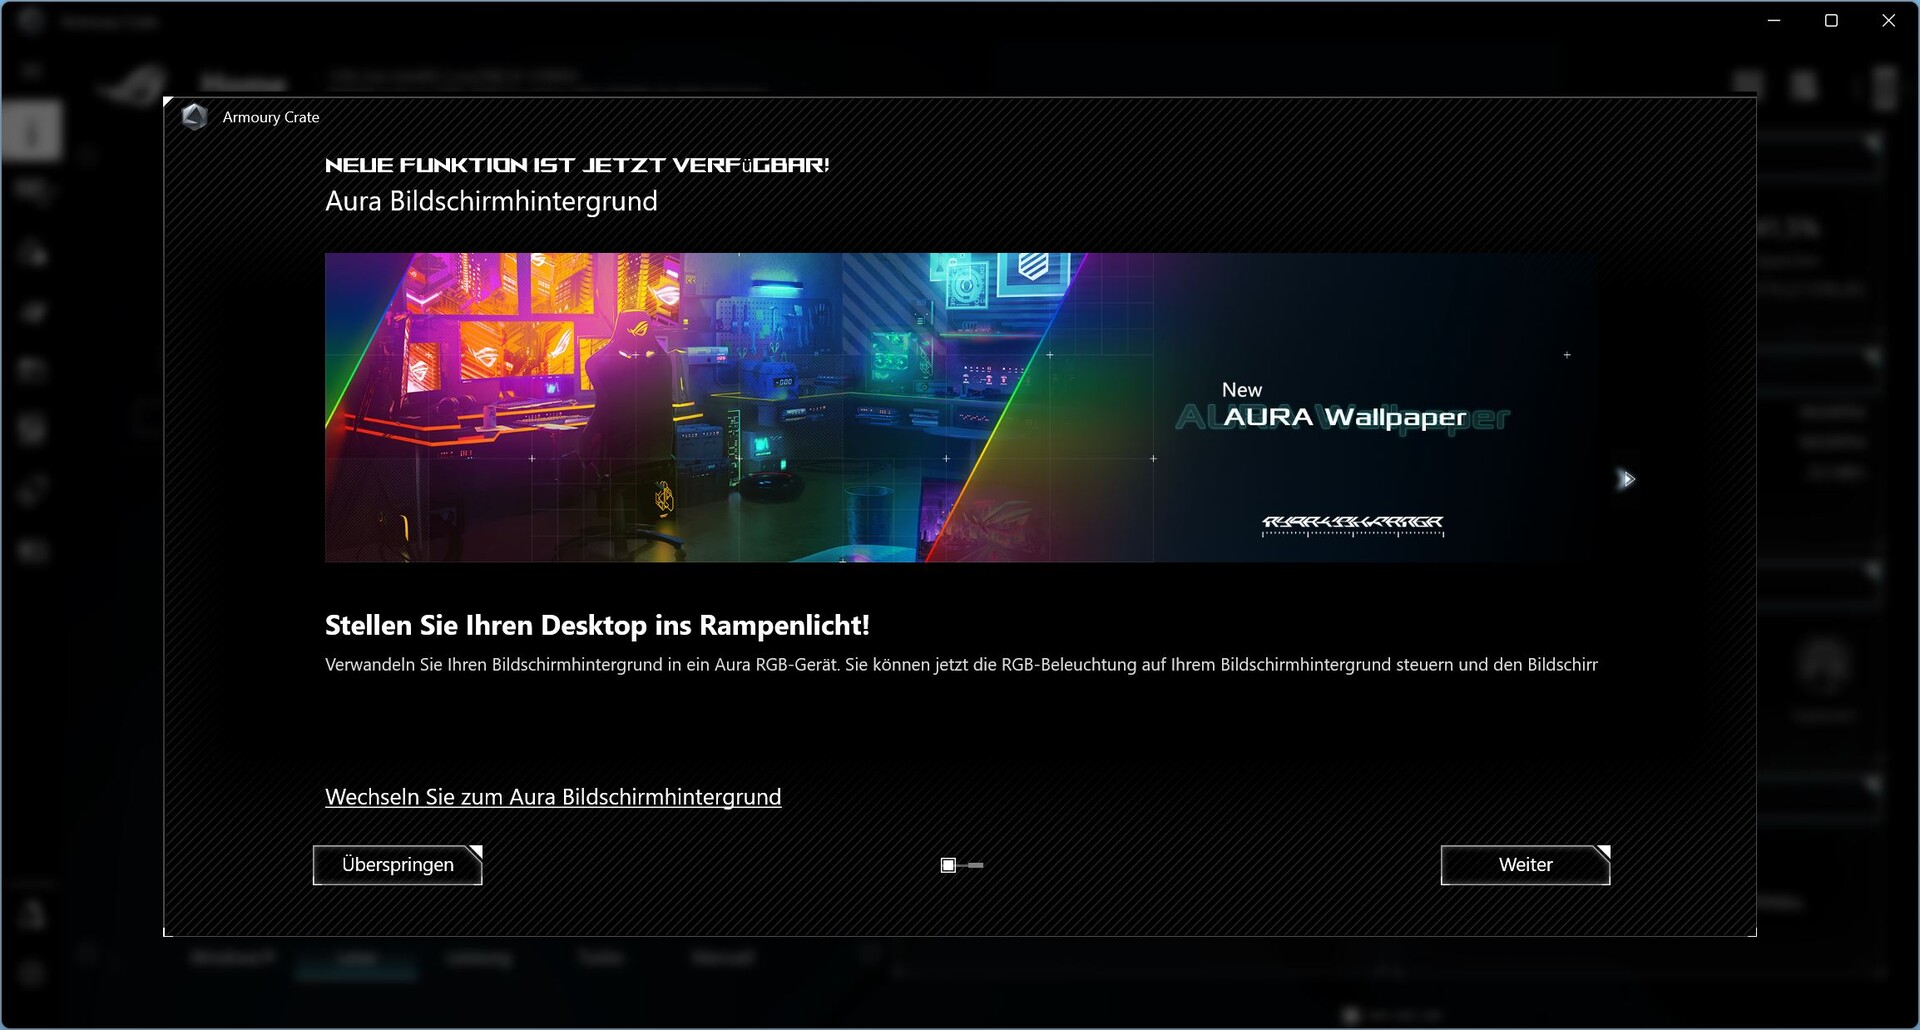
El software Asus Armoury Crate permite ajustar diversas configuraciones del portátil, por lo que el usuario debería familiarizarse con él. Ofrece las opciones de buscar actualizaciones del dispositivo, seleccionar fondos de pantalla Aura coloridos y dinámicos, o controlar el rendimiento.
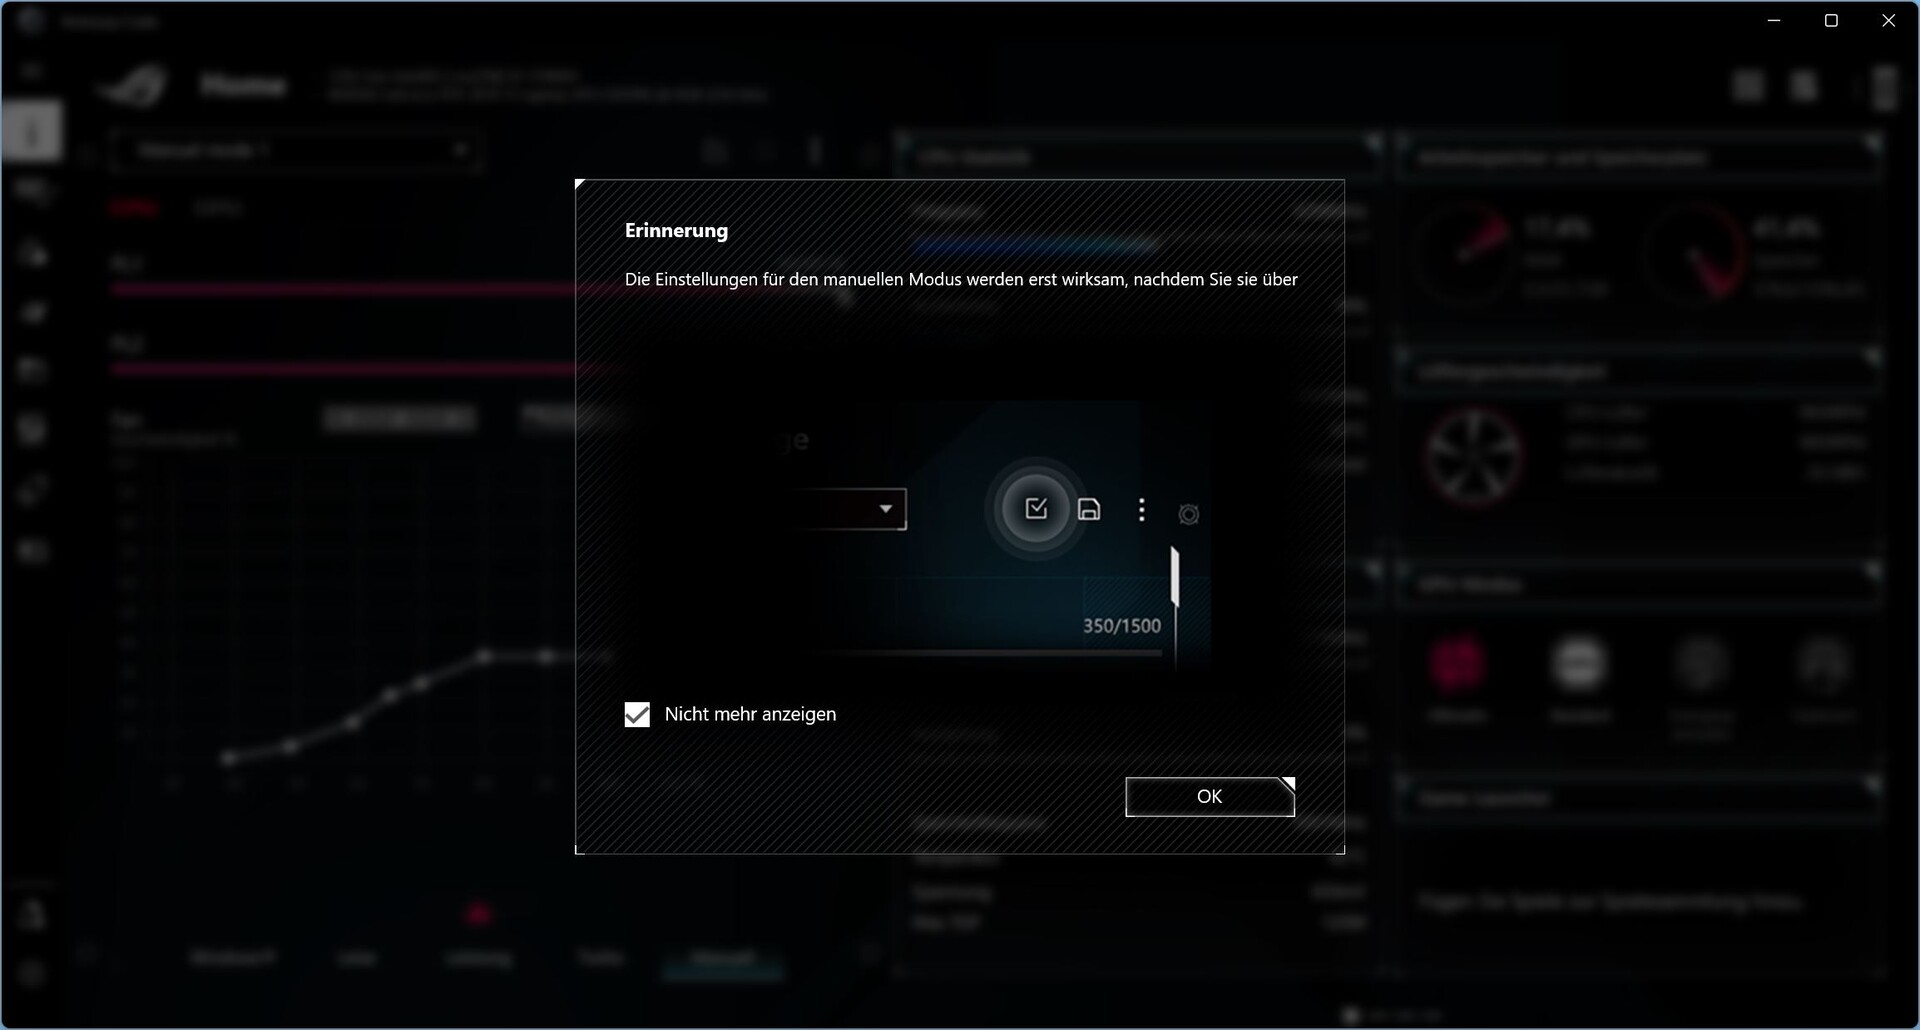
El fabricante ofrece tres modos de rendimiento (Silencioso, Rendimiento y Turbo) y también da la opción de controlar el rendimiento usando los modos de rendimiento de Windows o incluso establecer uno mismo varios límites de potencia en un modo manual, opciones de las que carecen muchos otros fabricantes.
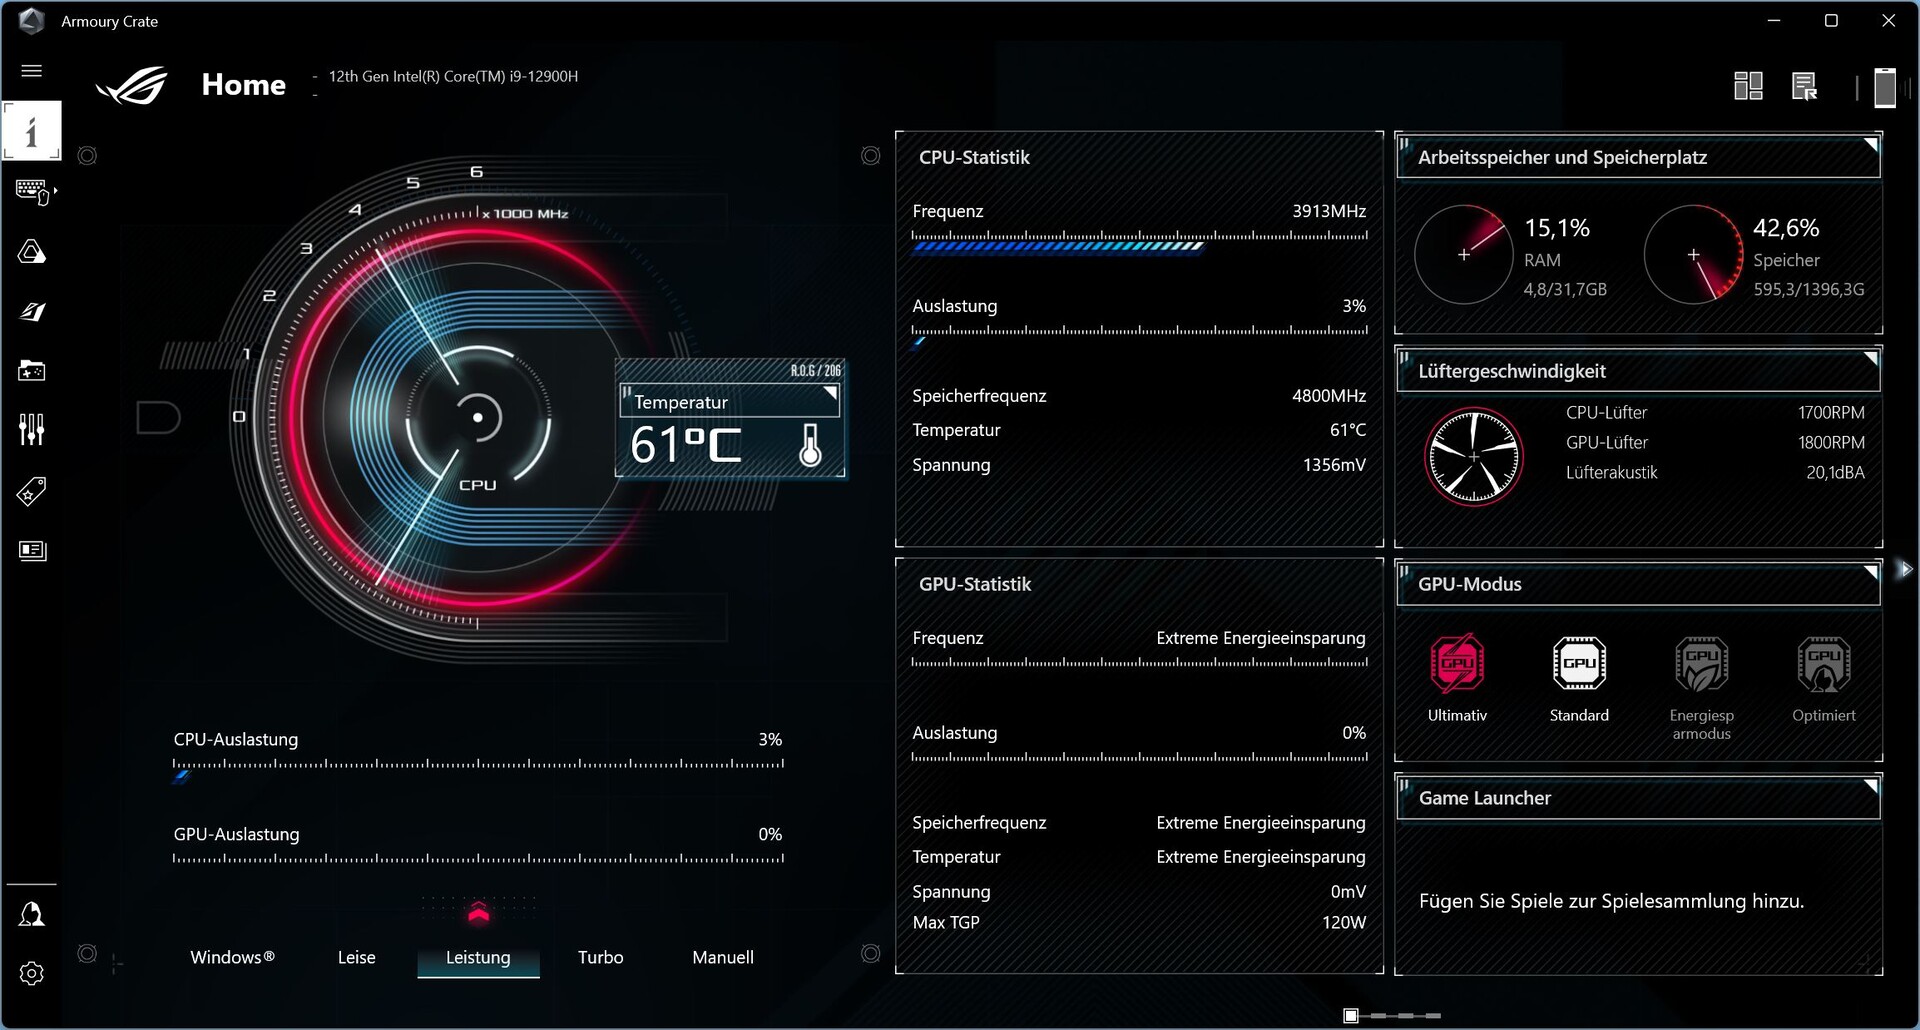
Como en modo Turbo el portátil ya es muy ruidoso en reposo, ejecutamos todas las pruebas en modo "Rendimiento". El modo "Silencioso" sólo se usa para las pruebas de batería - no hay un modo de ahorro de energía separado.
Aunque el software en sí está bien organizado, varios errores de traducción o frases incompletas (en la versión alemana) impiden una buena impresión general.
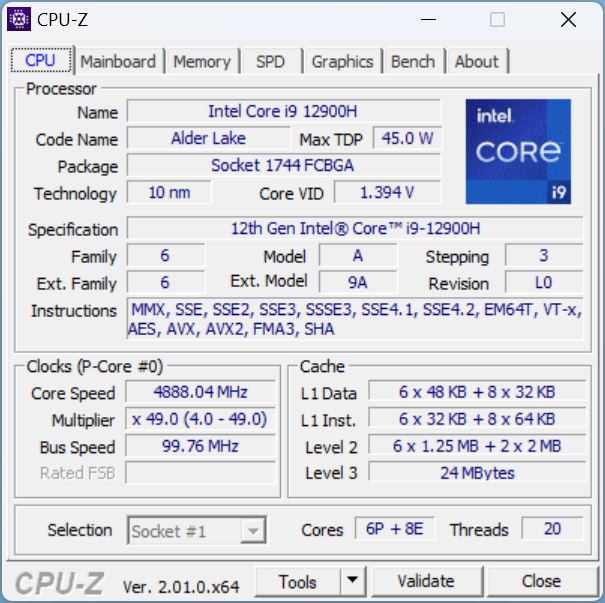
Procesador
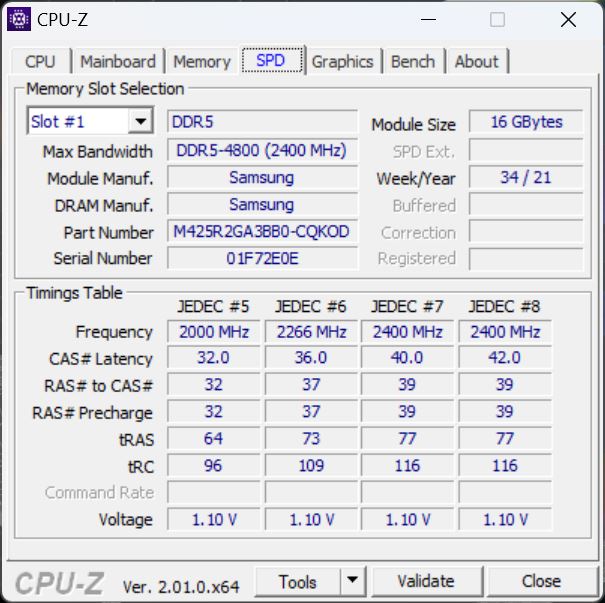
Asus ya ha anunciado el M16 con Intel Gen13. Hasta que esté disponible, seguimos usando un Intel Core i9-12900Hen nuestra unidad de pruebas. La CPU de gama alta ofrece 6 núcleos de Rendimiento y 8 de Eficiencia. Los núcleos de Rendimiento tienen una velocidad de reloj de hasta 5 GHz, y la velocidad de reloj básica de los núcleos de Eficiencia es de 1,8 GHz. Como sólo los núcleos P admiten hyperthreading, tenemos un total de 12 hilos.
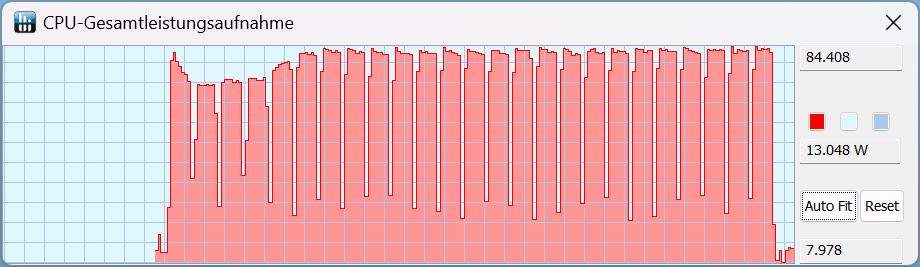
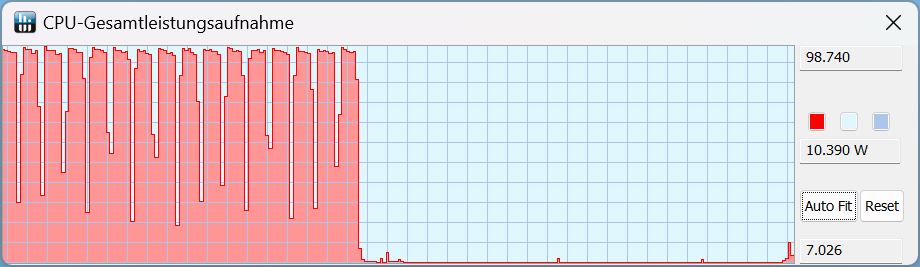
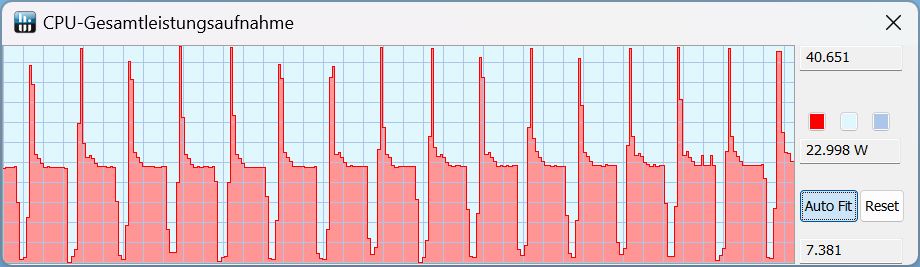
En el bucle Cinebench, el rendimiento constante es muy estable, con el TDP máximo alcanzando unos 84 vatios en el modo Rendimiento. El rendimiento deli7-12700H en el potentísimoXMG Focus 16resulta incluso ligeramente mejor al principio. Pero tras la 4ª ejecución como muy tarde, su rendimiento cae por debajo del de nuestro M16, que también vence alRyzen 7 6800 en losLegion 5.
Por cierto, en lugar de 84 vatios, ¡se dispone de unos potentes 99 vatios en modo Turbo! Durante el funcionamiento en batería, son sólo unos 40 vatios, con la correspondiente caída del rendimiento.
En todas las pruebas, el 2022 M16 es alrededor de un 20% más rápido que su predecesor con uni9-11900H.
Cinebench R15 Multi Constant Load Test
Cinebench R23: Multi Core | Single Core
Cinebench R20: CPU (Multi Core) | CPU (Single Core)
Cinebench R15: CPU Multi 64Bit | CPU Single 64Bit
Blender: v2.79 BMW27 CPU
7-Zip 18.03: 7z b 4 | 7z b 4 -mmt1
Geekbench 5.5: Multi-Core | Single-Core
HWBOT x265 Benchmark v2.2: 4k Preset
LibreOffice : 20 Documents To PDF
R Benchmark 2.5: Overall mean
| CPU Performance rating | |
| Media de la clase Gaming | |
| Asus ROG Zephyrus M16 GU603Z | |
| Schenker XMG Focus 16 (i7-12700H, RTX 3060) | |
| Medio Intel Core i9-12900H | |
| Schenker Vision 16 Pro RTX 3070 Ti | |
| Lenovo Legion 5 Pro 16ARH7H RTX 3070 Ti | |
| Corsair Voyager a1600 | |
| Asus ROG Zephyrus M16 GU603H -2! | |
| Cinebench R23 / Multi Core | |
| Media de la clase Gaming (10488 - 42661, n=107, últimos 2 años) | |
| Schenker XMG Focus 16 (i7-12700H, RTX 3060) | |
| Asus ROG Zephyrus M16 GU603Z | |
| Medio Intel Core i9-12900H (7359 - 19648, n=28) | |
| Lenovo Legion 5 Pro 16ARH7H RTX 3070 Ti | |
| Corsair Voyager a1600 | |
| Schenker Vision 16 Pro RTX 3070 Ti | |
| Cinebench R23 / Single Core | |
| Media de la clase Gaming (1166 - 2415, n=107, últimos 2 años) | |
| Asus ROG Zephyrus M16 GU603Z | |
| Medio Intel Core i9-12900H (1634 - 1930, n=28) | |
| Schenker Vision 16 Pro RTX 3070 Ti | |
| Schenker XMG Focus 16 (i7-12700H, RTX 3060) | |
| Corsair Voyager a1600 | |
| Lenovo Legion 5 Pro 16ARH7H RTX 3070 Ti | |
| Cinebench R20 / CPU (Multi Core) | |
| Media de la clase Gaming (4029 - 16433, n=106, últimos 2 años) | |
| Schenker XMG Focus 16 (i7-12700H, RTX 3060) | |
| Asus ROG Zephyrus M16 GU603Z | |
| Medio Intel Core i9-12900H (2681 - 7471, n=28) | |
| Lenovo Legion 5 Pro 16ARH7H RTX 3070 Ti | |
| Asus ROG Zephyrus M16 GU603H | |
| Corsair Voyager a1600 | |
| Schenker Vision 16 Pro RTX 3070 Ti | |
| Cinebench R20 / CPU (Single Core) | |
| Media de la clase Gaming (442 - 913, n=106, últimos 2 años) | |
| Asus ROG Zephyrus M16 GU603Z | |
| Medio Intel Core i9-12900H (624 - 738, n=28) | |
| Schenker Vision 16 Pro RTX 3070 Ti | |
| Schenker XMG Focus 16 (i7-12700H, RTX 3060) | |
| Asus ROG Zephyrus M16 GU603H | |
| Lenovo Legion 5 Pro 16ARH7H RTX 3070 Ti | |
| Corsair Voyager a1600 | |
| Cinebench R15 / CPU Multi 64Bit | |
| Media de la clase Gaming (1578 - 6330, n=105, últimos 2 años) | |
| Schenker Vision 16 Pro RTX 3070 Ti | |
| Schenker Vision 16 Pro RTX 3070 Ti | |
| Schenker XMG Focus 16 (i7-12700H, RTX 3060) | |
| Asus ROG Zephyrus M16 GU603Z | |
| Medio Intel Core i9-12900H (1395 - 3077, n=28) | |
| Lenovo Legion 5 Pro 16ARH7H RTX 3070 Ti | |
| Asus ROG Zephyrus M16 GU603H | |
| Corsair Voyager a1600 | |
| Cinebench R15 / CPU Single 64Bit | |
| Media de la clase Gaming (188.8 - 350, n=106, últimos 2 años) | |
| Asus ROG Zephyrus M16 GU603Z | |
| Medio Intel Core i9-12900H (235 - 277, n=29) | |
| Schenker Vision 16 Pro RTX 3070 Ti | |
| Schenker XMG Focus 16 (i7-12700H, RTX 3060) | |
| Lenovo Legion 5 Pro 16ARH7H RTX 3070 Ti | |
| Corsair Voyager a1600 | |
| Asus ROG Zephyrus M16 GU603H | |
| Blender / v2.79 BMW27 CPU | |
| Schenker Vision 16 Pro RTX 3070 Ti | |
| Asus ROG Zephyrus M16 GU603H | |
| Medio Intel Core i9-12900H (160 - 451, n=28) | |
| Corsair Voyager a1600 | |
| Lenovo Legion 5 Pro 16ARH7H RTX 3070 Ti | |
| Schenker XMG Focus 16 (i7-12700H, RTX 3060) | |
| Asus ROG Zephyrus M16 GU603Z | |
| Media de la clase Gaming (79 - 330, n=104, últimos 2 años) | |
| 7-Zip 18.03 / 7z b 4 | |
| Media de la clase Gaming (33491 - 148086, n=105, últimos 2 años) | |
| Asus ROG Zephyrus M16 GU603Z | |
| Lenovo Legion 5 Pro 16ARH7H RTX 3070 Ti | |
| Schenker XMG Focus 16 (i7-12700H, RTX 3060) | |
| Corsair Voyager a1600 | |
| Medio Intel Core i9-12900H (34684 - 76677, n=28) | |
| Asus ROG Zephyrus M16 GU603H | |
| Schenker Vision 16 Pro RTX 3070 Ti | |
| 7-Zip 18.03 / 7z b 4 -mmt1 | |
| Media de la clase Gaming (4199 - 7436, n=105, últimos 2 años) | |
| Asus ROG Zephyrus M16 GU603Z | |
| Schenker Vision 16 Pro RTX 3070 Ti | |
| Medio Intel Core i9-12900H (5302 - 6289, n=28) | |
| Corsair Voyager a1600 | |
| Lenovo Legion 5 Pro 16ARH7H RTX 3070 Ti | |
| Schenker XMG Focus 16 (i7-12700H, RTX 3060) | |
| Asus ROG Zephyrus M16 GU603H | |
| Geekbench 5.5 / Multi-Core | |
| Media de la clase Gaming (6460 - 28263, n=105, últimos 2 años) | |
| Asus ROG Zephyrus M16 GU603Z | |
| Schenker XMG Focus 16 (i7-12700H, RTX 3060) | |
| Medio Intel Core i9-12900H (8519 - 14376, n=31) | |
| Schenker Vision 16 Pro RTX 3070 Ti | |
| Lenovo Legion 5 Pro 16ARH7H RTX 3070 Ti | |
| Corsair Voyager a1600 | |
| Asus ROG Zephyrus M16 GU603H | |
| Geekbench 5.5 / Single-Core | |
| Media de la clase Gaming (986 - 2474, n=105, últimos 2 años) | |
| Asus ROG Zephyrus M16 GU603Z | |
| Schenker Vision 16 Pro RTX 3070 Ti | |
| Medio Intel Core i9-12900H (1631 - 1897, n=31) | |
| Schenker XMG Focus 16 (i7-12700H, RTX 3060) | |
| Asus ROG Zephyrus M16 GU603H | |
| Lenovo Legion 5 Pro 16ARH7H RTX 3070 Ti | |
| Corsair Voyager a1600 | |
| HWBOT x265 Benchmark v2.2 / 4k Preset | |
| Media de la clase Gaming (11.5 - 44.4, n=105, últimos 2 años) | |
| Asus ROG Zephyrus M16 GU603Z | |
| Lenovo Legion 5 Pro 16ARH7H RTX 3070 Ti | |
| Schenker XMG Focus 16 (i7-12700H, RTX 3060) | |
| Medio Intel Core i9-12900H (8.05 - 22.5, n=28) | |
| Corsair Voyager a1600 | |
| Asus ROG Zephyrus M16 GU603H | |
| Schenker Vision 16 Pro RTX 3070 Ti | |
| LibreOffice / 20 Documents To PDF | |
| Corsair Voyager a1600 | |
| Lenovo Legion 5 Pro 16ARH7H RTX 3070 Ti | |
| Media de la clase Gaming (33.2 - 88.8, n=105, últimos 2 años) | |
| Schenker XMG Focus 16 (i7-12700H, RTX 3060) | |
| Schenker Vision 16 Pro RTX 3070 Ti | |
| Medio Intel Core i9-12900H (36.8 - 59.8, n=28) | |
| Asus ROG Zephyrus M16 GU603Z | |
| Asus ROG Zephyrus M16 GU603H | |
| R Benchmark 2.5 / Overall mean | |
| Asus ROG Zephyrus M16 GU603H | |
| Corsair Voyager a1600 | |
| Lenovo Legion 5 Pro 16ARH7H RTX 3070 Ti | |
| Schenker XMG Focus 16 (i7-12700H, RTX 3060) | |
| Schenker Vision 16 Pro RTX 3070 Ti | |
| Medio Intel Core i9-12900H (0.4218 - 0.506, n=28) | |
| Asus ROG Zephyrus M16 GU603Z | |
| Media de la clase Gaming (0.3439 - 0.759, n=106, últimos 2 años) | |
* ... más pequeño es mejor
AIDA64: FP32 Ray-Trace | FPU Julia | CPU SHA3 | CPU Queen | FPU SinJulia | FPU Mandel | CPU AES | CPU ZLib | FP64 Ray-Trace | CPU PhotoWorxx
| Performance rating | |
| Media de la clase Gaming | |
| Lenovo Legion 5 Pro 16ARH7H RTX 3070 Ti | |
| Corsair Voyager a1600 | |
| Asus ROG Zephyrus M16 GU603Z | |
| Schenker XMG Focus 16 (i7-12700H, RTX 3060) | |
| Medio Intel Core i9-12900H | |
| Schenker Vision 16 Pro RTX 3070 Ti | |
| Asus ROG Zephyrus M16 GU603H -9! | |
| AIDA64 / FP32 Ray-Trace | |
| Media de la clase Gaming (10227 - 85542, n=105, últimos 2 años) | |
| Lenovo Legion 5 Pro 16ARH7H RTX 3070 Ti | |
| Corsair Voyager a1600 | |
| Asus ROG Zephyrus M16 GU603Z | |
| Schenker XMG Focus 16 (i7-12700H, RTX 3060) | |
| Schenker Vision 16 Pro RTX 3070 Ti | |
| Medio Intel Core i9-12900H (4074 - 18289, n=29) | |
| AIDA64 / FPU Julia | |
| Media de la clase Gaming (51376 - 238426, n=105, últimos 2 años) | |
| Lenovo Legion 5 Pro 16ARH7H RTX 3070 Ti | |
| Corsair Voyager a1600 | |
| Schenker XMG Focus 16 (i7-12700H, RTX 3060) | |
| Asus ROG Zephyrus M16 GU603Z | |
| Schenker Vision 16 Pro RTX 3070 Ti | |
| Medio Intel Core i9-12900H (22307 - 93236, n=29) | |
| AIDA64 / CPU SHA3 | |
| Media de la clase Gaming (2180 - 10115, n=105, últimos 2 años) | |
| Schenker XMG Focus 16 (i7-12700H, RTX 3060) | |
| Lenovo Legion 5 Pro 16ARH7H RTX 3070 Ti | |
| Asus ROG Zephyrus M16 GU603Z | |
| Corsair Voyager a1600 | |
| Medio Intel Core i9-12900H (1378 - 4215, n=29) | |
| Schenker Vision 16 Pro RTX 3070 Ti | |
| AIDA64 / CPU Queen | |
| Media de la clase Gaming (49785 - 173351, n=90, últimos 2 años) | |
| Lenovo Legion 5 Pro 16ARH7H RTX 3070 Ti | |
| Asus ROG Zephyrus M16 GU603Z | |
| Corsair Voyager a1600 | |
| Schenker XMG Focus 16 (i7-12700H, RTX 3060) | |
| Medio Intel Core i9-12900H (78172 - 111241, n=28) | |
| Schenker Vision 16 Pro RTX 3070 Ti | |
| AIDA64 / FPU SinJulia | |
| Media de la clase Gaming (4424 - 33636, n=105, últimos 2 años) | |
| Corsair Voyager a1600 | |
| Lenovo Legion 5 Pro 16ARH7H RTX 3070 Ti | |
| Schenker XMG Focus 16 (i7-12700H, RTX 3060) | |
| Asus ROG Zephyrus M16 GU603Z | |
| Medio Intel Core i9-12900H (5709 - 10410, n=29) | |
| Schenker Vision 16 Pro RTX 3070 Ti | |
| AIDA64 / FPU Mandel | |
| Media de la clase Gaming (25115 - 128721, n=105, últimos 2 años) | |
| Lenovo Legion 5 Pro 16ARH7H RTX 3070 Ti | |
| Corsair Voyager a1600 | |
| Schenker XMG Focus 16 (i7-12700H, RTX 3060) | |
| Asus ROG Zephyrus M16 GU603Z | |
| Schenker Vision 16 Pro RTX 3070 Ti | |
| Medio Intel Core i9-12900H (11257 - 45581, n=29) | |
| AIDA64 / CPU AES | |
| Lenovo Legion 5 Pro 16ARH7H RTX 3070 Ti | |
| Corsair Voyager a1600 | |
| Asus ROG Zephyrus M16 GU603Z | |
| Media de la clase Gaming (39258 - 247074, n=105, últimos 2 años) | |
| Medio Intel Core i9-12900H (31935 - 151546, n=29) | |
| Schenker XMG Focus 16 (i7-12700H, RTX 3060) | |
| Schenker Vision 16 Pro RTX 3070 Ti | |
| AIDA64 / CPU ZLib | |
| Media de la clase Gaming (574 - 2531, n=105, últimos 2 años) | |
| Schenker XMG Focus 16 (i7-12700H, RTX 3060) | |
| Asus ROG Zephyrus M16 GU603Z | |
| Medio Intel Core i9-12900H (449 - 1193, n=29) | |
| Lenovo Legion 5 Pro 16ARH7H RTX 3070 Ti | |
| Corsair Voyager a1600 | |
| Schenker Vision 16 Pro RTX 3070 Ti | |
| Asus ROG Zephyrus M16 GU603H | |
| AIDA64 / FP64 Ray-Trace | |
| Media de la clase Gaming (5509 - 45446, n=105, últimos 2 años) | |
| Lenovo Legion 5 Pro 16ARH7H RTX 3070 Ti | |
| Corsair Voyager a1600 | |
| Asus ROG Zephyrus M16 GU603Z | |
| Schenker XMG Focus 16 (i7-12700H, RTX 3060) | |
| Schenker Vision 16 Pro RTX 3070 Ti | |
| Medio Intel Core i9-12900H (2235 - 10511, n=29) | |
| AIDA64 / CPU PhotoWorxx | |
| Media de la clase Gaming (12271 - 89891, n=105, últimos 2 años) | |
| Schenker Vision 16 Pro RTX 3070 Ti | |
| Asus ROG Zephyrus M16 GU603Z | |
| Medio Intel Core i9-12900H (20960 - 48269, n=30) | |
| Lenovo Legion 5 Pro 16ARH7H RTX 3070 Ti | |
| Schenker XMG Focus 16 (i7-12700H, RTX 3060) | |
| Corsair Voyager a1600 | |
Rendimiento del sistema
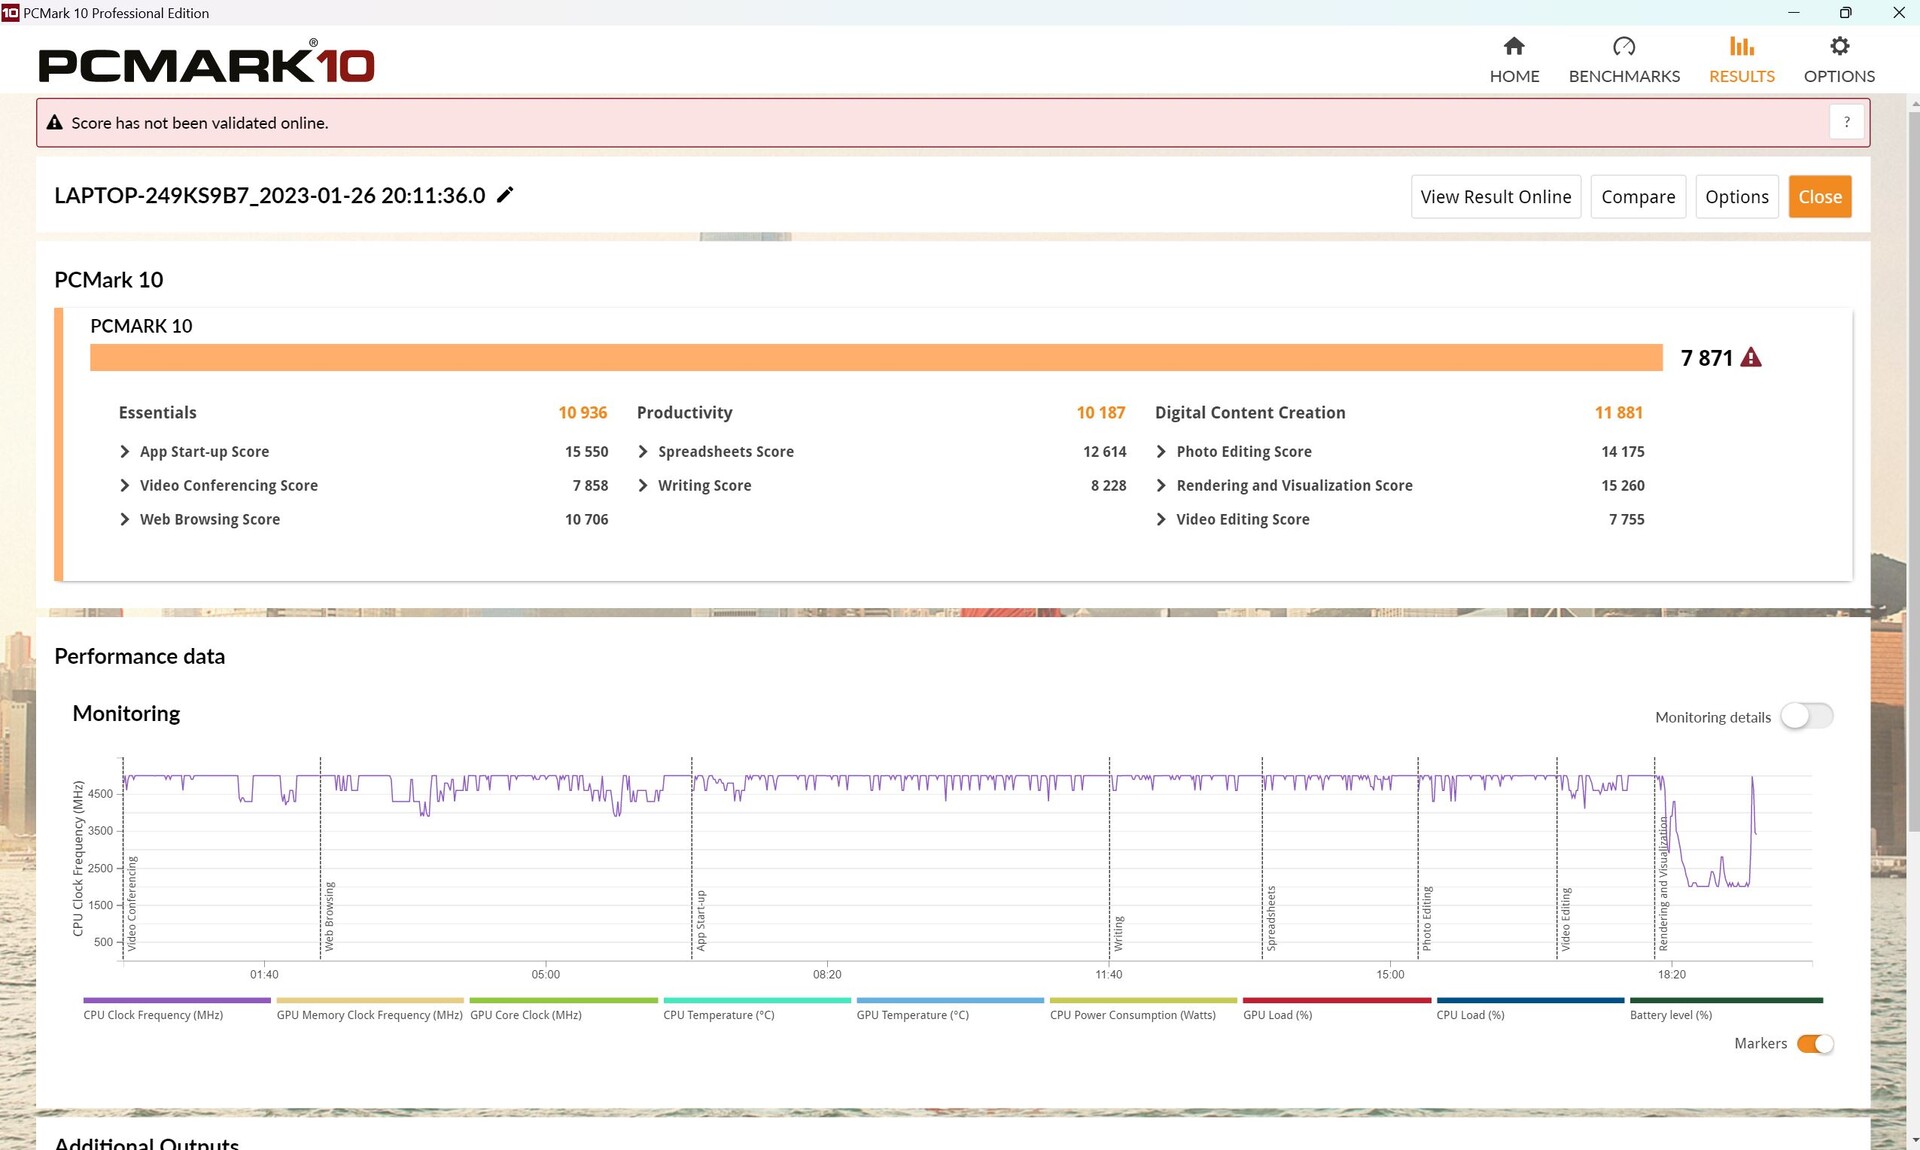
En PCMark, la combinación de i9 y RTX 3070 Titoma la delantera en todas las pruebas, pero este es también el nivel de rendimiento que se espera. Lo mismo cabe decir de las pruebas CrossMark.
CrossMark: Overall | Productivity | Creativity | Responsiveness
| PCMark 10 / Score | |
| Media de la clase Gaming (5828 - 12414, n=93, últimos 2 años) | |
| Asus ROG Zephyrus M16 GU603Z | |
| Medio Intel Core i9-12900H, NVIDIA GeForce RTX 3070 Ti Laptop GPU (7087 - 8072, n=6) | |
| Lenovo Legion 5 Pro 16ARH7H RTX 3070 Ti | |
| Corsair Voyager a1600 | |
| Schenker XMG Focus 16 (i7-12700H, RTX 3060) | |
| Asus ROG Zephyrus M16 GU603H | |
| PCMark 10 / Essentials | |
| Asus ROG Zephyrus M16 GU603Z | |
| Medio Intel Core i9-12900H, NVIDIA GeForce RTX 3070 Ti Laptop GPU (10266 - 11663, n=6) | |
| Media de la clase Gaming (8810 - 11935, n=97, últimos 2 años) | |
| Asus ROG Zephyrus M16 GU603H | |
| Lenovo Legion 5 Pro 16ARH7H RTX 3070 Ti | |
| Schenker XMG Focus 16 (i7-12700H, RTX 3060) | |
| Corsair Voyager a1600 | |
| PCMark 10 / Productivity | |
| Media de la clase Gaming (6845 - 25323, n=95, últimos 2 años) | |
| Asus ROG Zephyrus M16 GU603Z | |
| Medio Intel Core i9-12900H, NVIDIA GeForce RTX 3070 Ti Laptop GPU (9402 - 10742, n=6) | |
| Schenker XMG Focus 16 (i7-12700H, RTX 3060) | |
| Lenovo Legion 5 Pro 16ARH7H RTX 3070 Ti | |
| Asus ROG Zephyrus M16 GU603H | |
| Corsair Voyager a1600 | |
| PCMark 10 / Digital Content Creation | |
| Media de la clase Gaming (7602 - 19954, n=95, últimos 2 años) | |
| Asus ROG Zephyrus M16 GU603Z | |
| Lenovo Legion 5 Pro 16ARH7H RTX 3070 Ti | |
| Medio Intel Core i9-12900H, NVIDIA GeForce RTX 3070 Ti Laptop GPU (10009 - 12541, n=6) | |
| Corsair Voyager a1600 | |
| Asus ROG Zephyrus M16 GU603H | |
| Schenker XMG Focus 16 (i7-12700H, RTX 3060) | |
| CrossMark / Overall | |
| Media de la clase Gaming (1366 - 2409, n=94, últimos 2 años) | |
| Asus ROG Zephyrus M16 GU603Z | |
| Medio Intel Core i9-12900H, NVIDIA GeForce RTX 3070 Ti Laptop GPU (1664 - 2044, n=6) | |
| Schenker XMG Focus 16 (i7-12700H, RTX 3060) | |
| Schenker Vision 16 Pro RTX 3070 Ti | |
| Lenovo Legion 5 Pro 16ARH7H RTX 3070 Ti | |
| Corsair Voyager a1600 | |
| CrossMark / Productivity | |
| Media de la clase Gaming (1386 - 2254, n=94, últimos 2 años) | |
| Asus ROG Zephyrus M16 GU603Z | |
| Medio Intel Core i9-12900H, NVIDIA GeForce RTX 3070 Ti Laptop GPU (1591 - 1968, n=6) | |
| Lenovo Legion 5 Pro 16ARH7H RTX 3070 Ti | |
| Schenker XMG Focus 16 (i7-12700H, RTX 3060) | |
| Schenker Vision 16 Pro RTX 3070 Ti | |
| Corsair Voyager a1600 | |
| CrossMark / Creativity | |
| Media de la clase Gaming (1343 - 2786, n=94, últimos 2 años) | |
| Asus ROG Zephyrus M16 GU603Z | |
| Medio Intel Core i9-12900H, NVIDIA GeForce RTX 3070 Ti Laptop GPU (1797 - 2148, n=6) | |
| Schenker Vision 16 Pro RTX 3070 Ti | |
| Schenker XMG Focus 16 (i7-12700H, RTX 3060) | |
| Lenovo Legion 5 Pro 16ARH7H RTX 3070 Ti | |
| Corsair Voyager a1600 | |
| CrossMark / Responsiveness | |
| Asus ROG Zephyrus M16 GU603Z | |
| Medio Intel Core i9-12900H, NVIDIA GeForce RTX 3070 Ti Laptop GPU (1514 - 2069, n=6) | |
| Media de la clase Gaming (1226 - 2334, n=94, últimos 2 años) | |
| Lenovo Legion 5 Pro 16ARH7H RTX 3070 Ti | |
| Schenker XMG Focus 16 (i7-12700H, RTX 3060) | |
| Schenker Vision 16 Pro RTX 3070 Ti | |
| Corsair Voyager a1600 | |
| PCMark 10 Score | 7871 puntos | |
ayuda | ||
| AIDA64 / Memory Copy | |
| Media de la clase Gaming (21750 - 129946, n=105, últimos 2 años) | |
| Asus ROG Zephyrus M16 GU603Z | |
| Schenker Vision 16 Pro RTX 3070 Ti | |
| Medio Intel Core i9-12900H (34438 - 74264, n=29) | |
| Lenovo Legion 5 Pro 16ARH7H RTX 3070 Ti | |
| Corsair Voyager a1600 | |
| Schenker XMG Focus 16 (i7-12700H, RTX 3060) | |
| AIDA64 / Memory Read | |
| Media de la clase Gaming (22956 - 118858, n=105, últimos 2 años) | |
| Asus ROG Zephyrus M16 GU603Z | |
| Schenker Vision 16 Pro RTX 3070 Ti | |
| Medio Intel Core i9-12900H (36365 - 74642, n=29) | |
| Lenovo Legion 5 Pro 16ARH7H RTX 3070 Ti | |
| Corsair Voyager a1600 | |
| Schenker XMG Focus 16 (i7-12700H, RTX 3060) | |
| AIDA64 / Memory Write | |
| Media de la clase Gaming (22297 - 135096, n=105, últimos 2 años) | |
| Asus ROG Zephyrus M16 GU603Z | |
| Schenker Vision 16 Pro RTX 3070 Ti | |
| Medio Intel Core i9-12900H (32276 - 67858, n=29) | |
| Lenovo Legion 5 Pro 16ARH7H RTX 3070 Ti | |
| Corsair Voyager a1600 | |
| Schenker XMG Focus 16 (i7-12700H, RTX 3060) | |
| AIDA64 / Memory Latency | |
| Media de la clase Gaming (75.3 - 259, n=105, últimos 2 años) | |
| Corsair Voyager a1600 | |
| Schenker Vision 16 Pro RTX 3070 Ti | |
| Schenker XMG Focus 16 (i7-12700H, RTX 3060) | |
| Asus ROG Zephyrus M16 GU603Z | |
| Lenovo Legion 5 Pro 16ARH7H RTX 3070 Ti | |
| Medio Intel Core i9-12900H (74.7 - 118.1, n=28) | |
| Asus ROG Zephyrus M16 GU603H | |
* ... más pequeño es mejor
Latencias del CPD
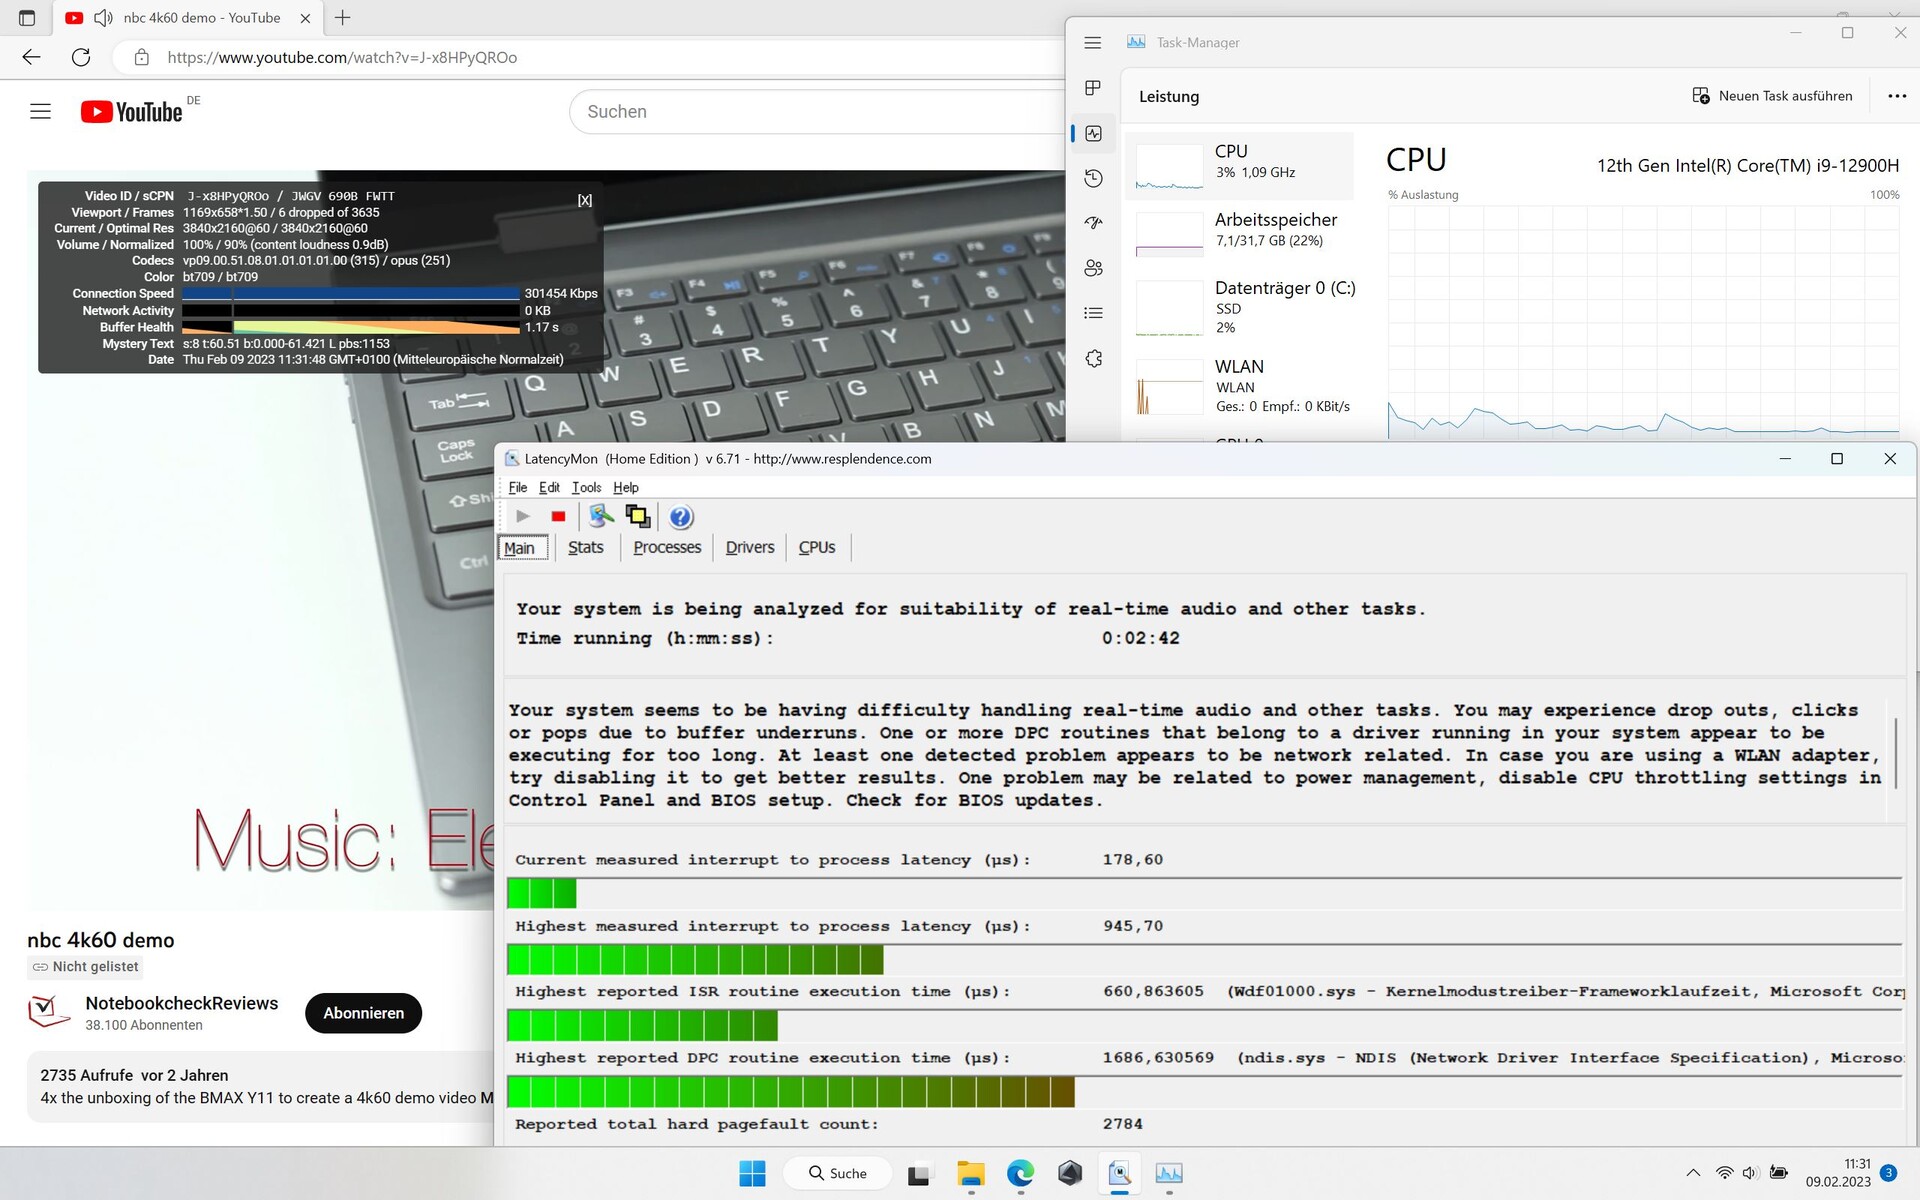
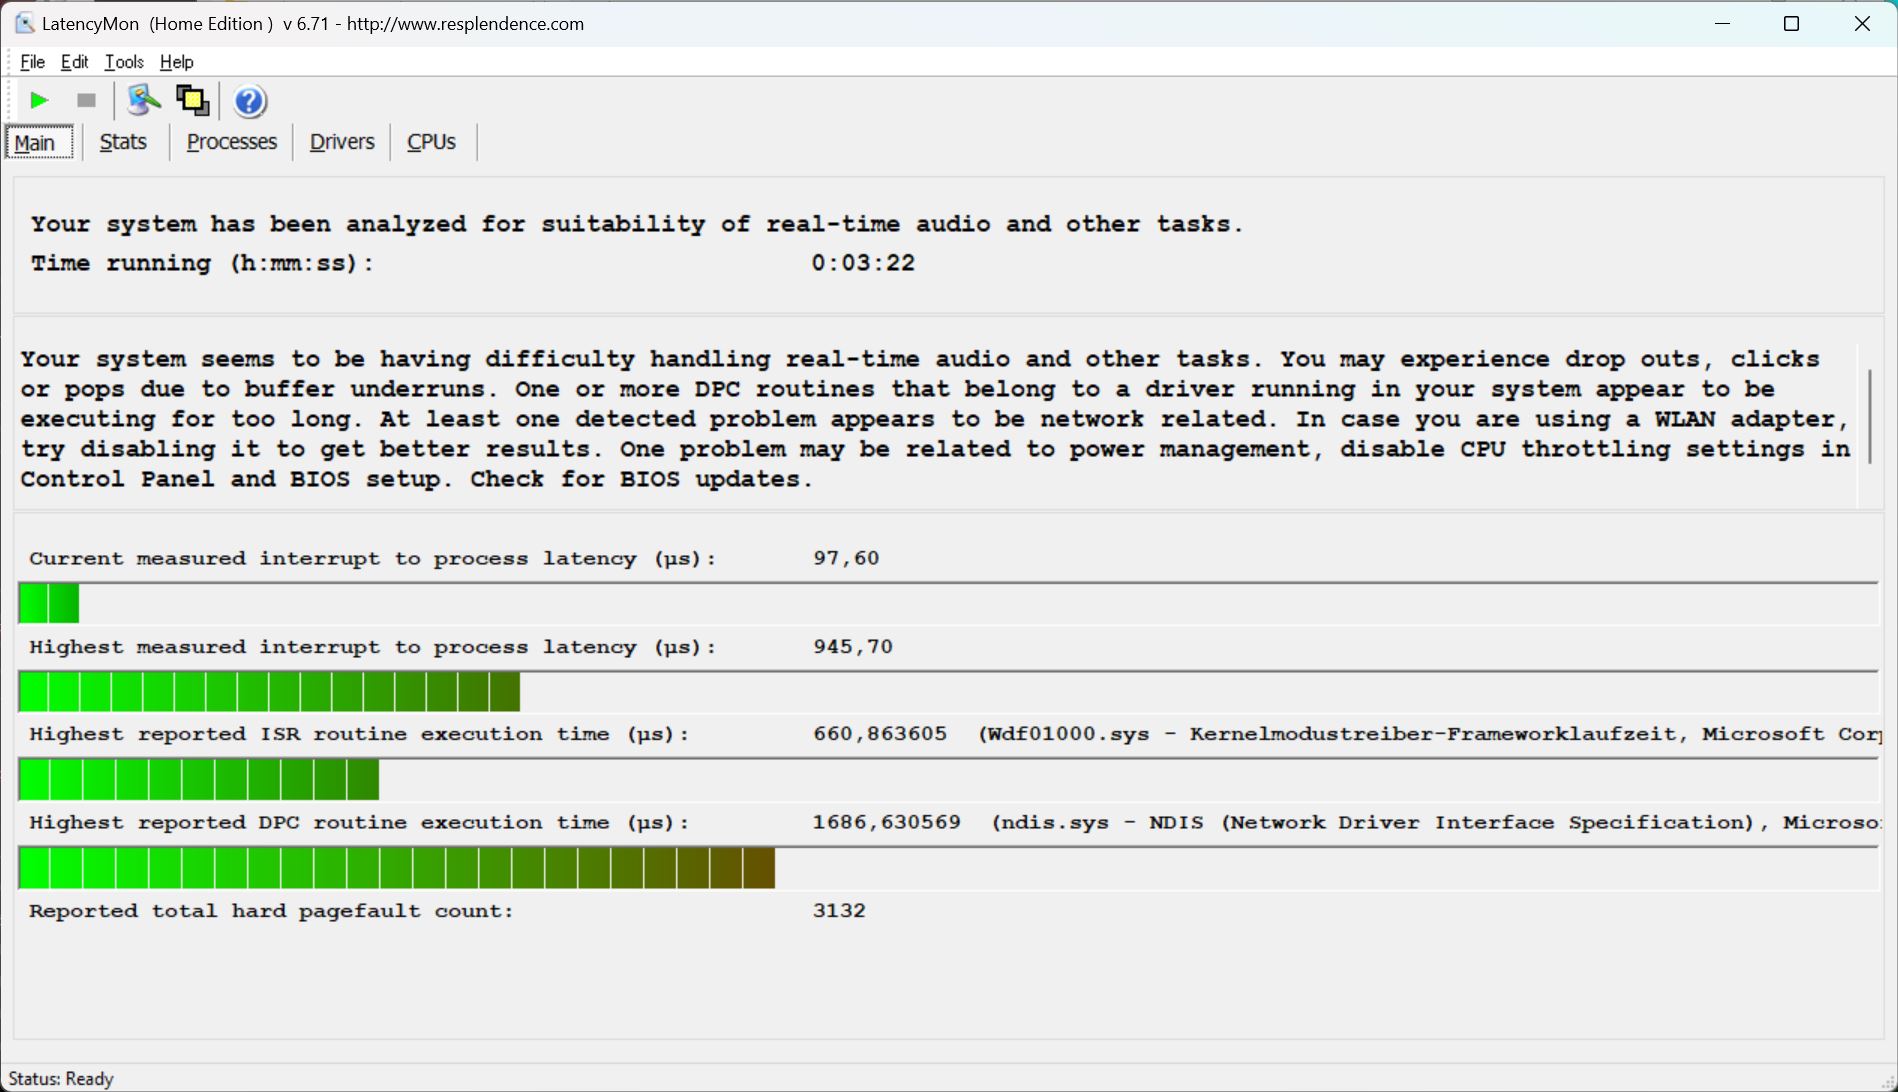
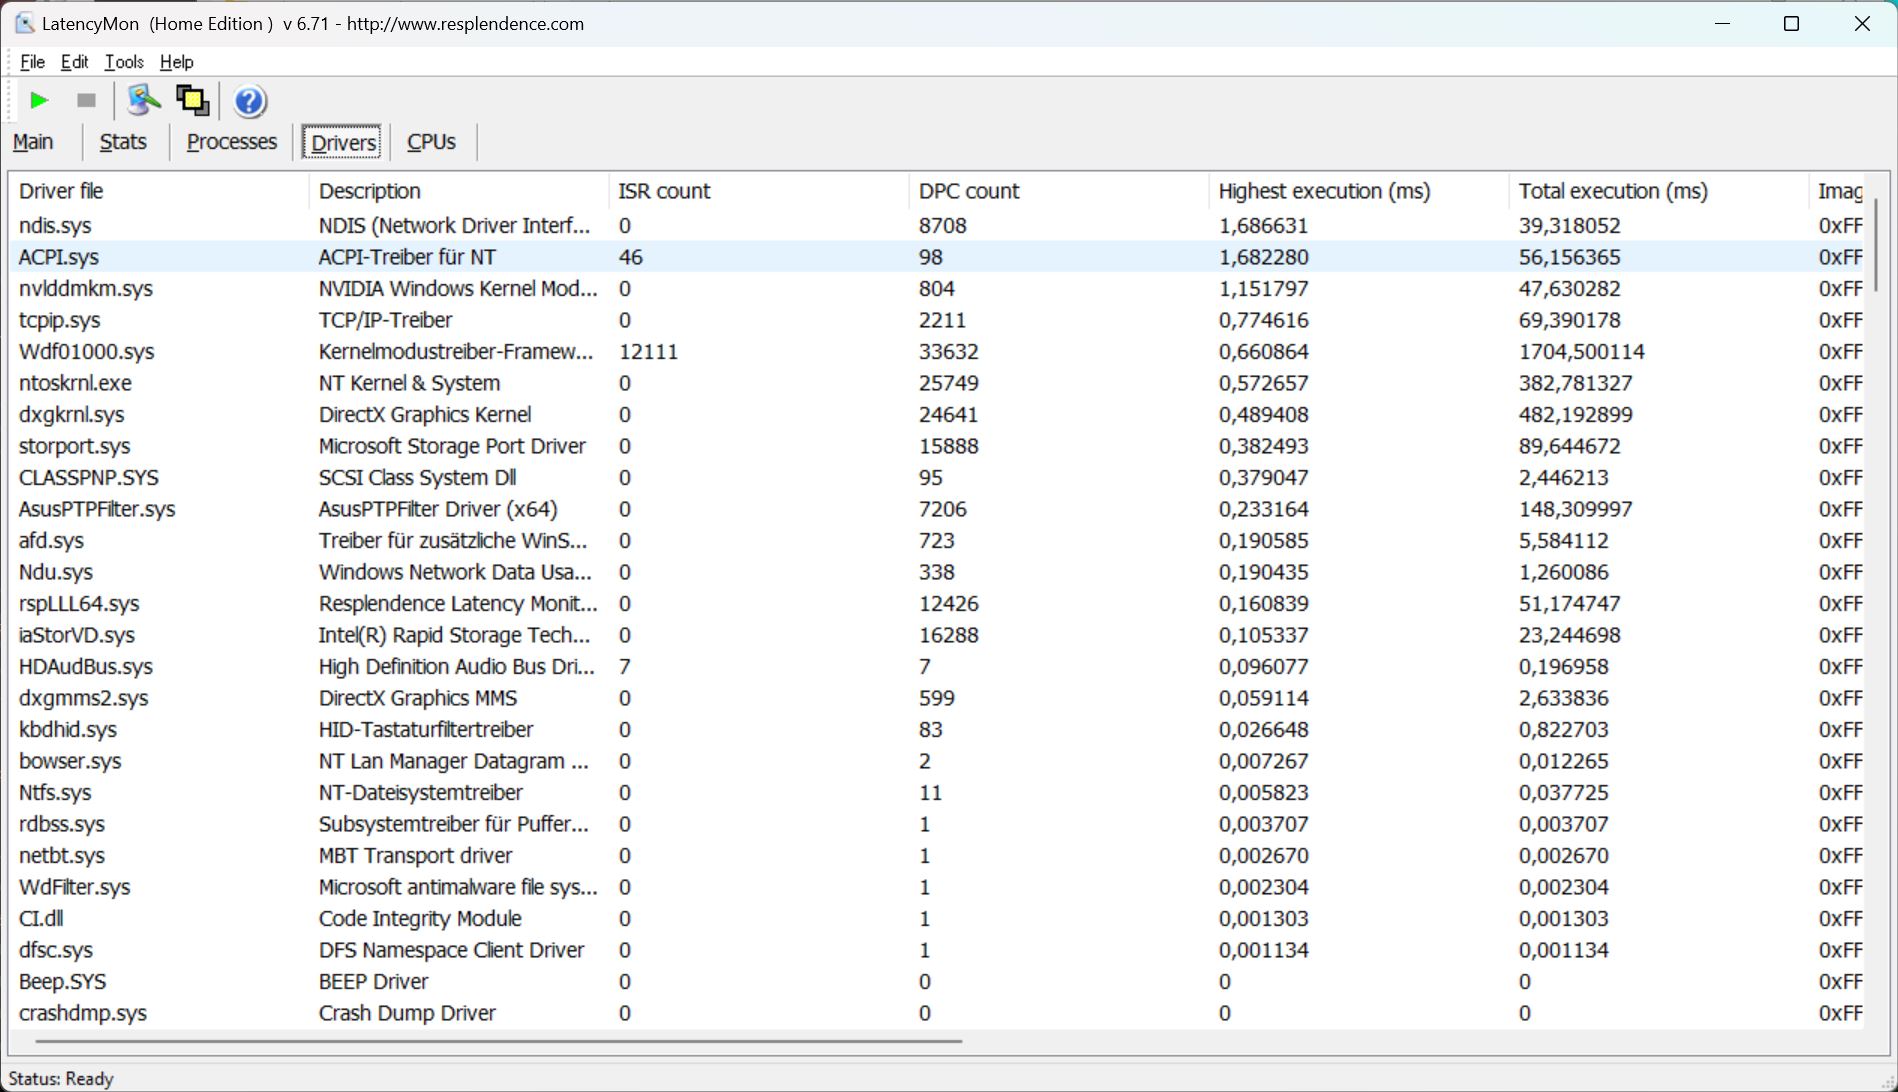
Lamentablemente, LatencyMon ya encuentra las primeras latencias al iniciar el software, aunque no haya ninguna acción adicional. Al abrir el navegador con varias pestañas, las latencias aumentan aún más.
Nuestro vídeo 4K/60-fps de YouTube tampoco se reproduce sin caídas de fotogramas (6). Sin embargo, los valores de latencia no son particularmente altos en general y son inferiores a los del XMG Focus 16por ejemplo. Por otra parte, se hacen evidentes antes.
| DPC Latencies / LatencyMon - interrupt to process latency (max), Web, Youtube, Prime95 | |
| Schenker XMG Focus 16 (i7-12700H, RTX 3060) | |
| Asus ROG Zephyrus M16 GU603H | |
| Asus ROG Zephyrus M16 GU603Z | |
| Lenovo Legion 5 Pro 16ARH7H RTX 3070 Ti | |
| Corsair Voyager a1600 | |
| Schenker Vision 16 Pro RTX 3070 Ti | |
* ... más pequeño es mejor
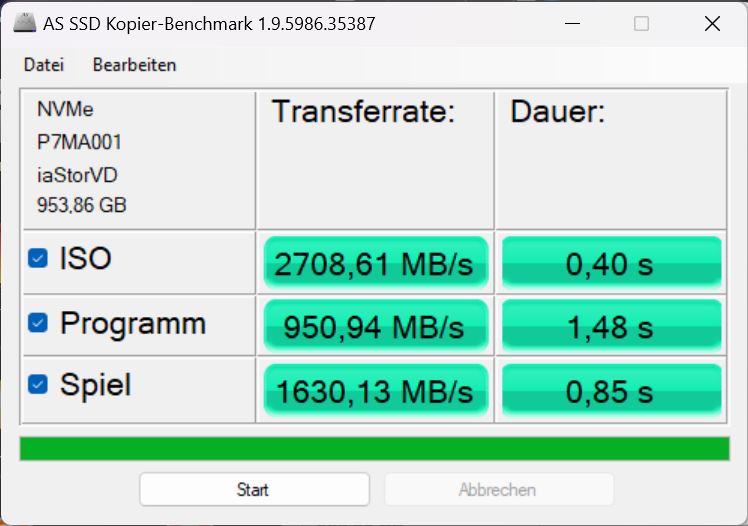
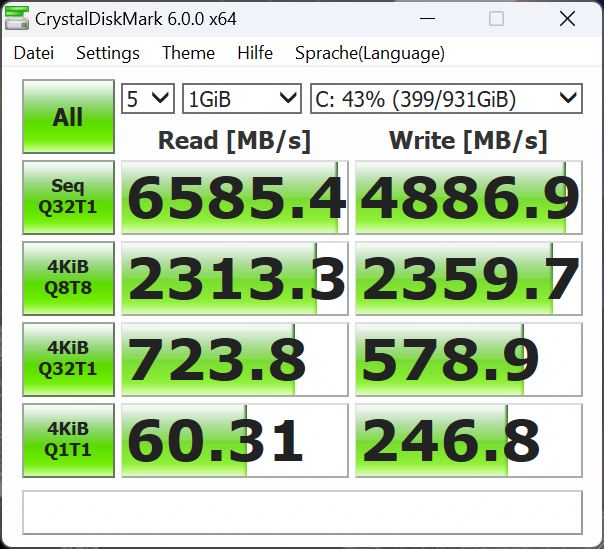
Solución de almacenamiento
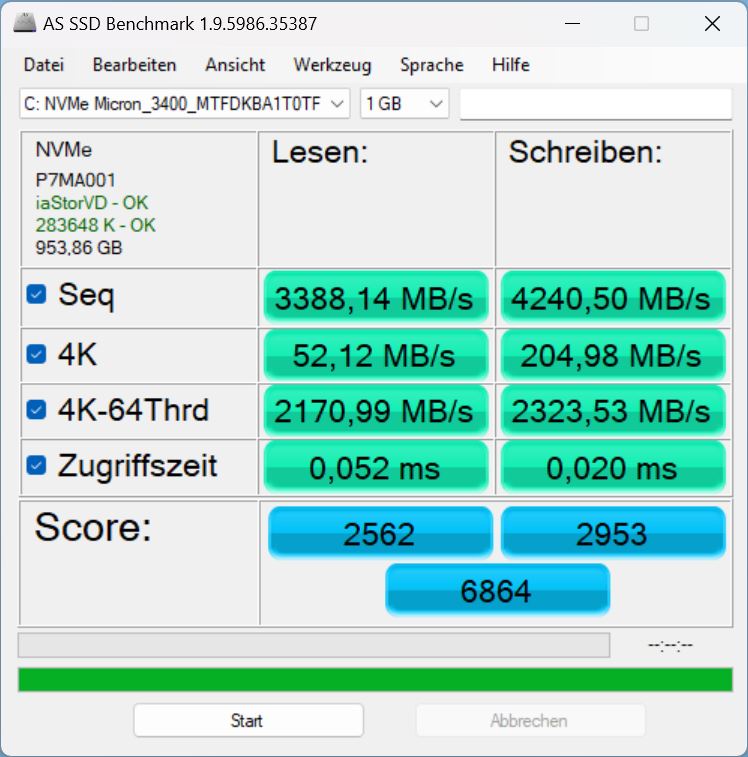
Nuestro modelo de pruebas utiliza un SSD PCIe Gen4 de Micron con 1 TB de almacenamiento. En nuestra lista de mejores SSDsse sitúa en el puesto 74, por lo que también hay muchos modelos más rápidos. Las pruebas confirman valores decentes para la solución de almacenamiento. Sin embargo, los valores medidos del almacenamiento Samsung en el predecesor o el Legion 5son más rápidos.
El SSD no es capaz de mantener su rendimiento a largo plazo, pero la caída de rendimiento es pequeña.

* ... más pequeño es mejor
Disk Throttling: DiskSpd Read Loop, Queue Depth 8
Tarjeta gráfica
Nuestro sistema de prueba utiliza unaRTX 3070 Tiaunque es una de las GPUs más potentes para portátiles, "sólo" se le permite usar 100 W más 20 W de Dynamic Boost en el M16. No es muy sorprendente que cuando se le permite usar 150 W, la misma GPU sea más rápida en el Legion 5 Pro¡incluso hasta un 27%!
Al menos, el predecesor con RTX 3070 (sin "Ti") es superado en un 38%. ElXMG Vision 16 Prosólo permite un máximo de 95 W para la GPU, por lo que también queda bastante por detrás del M16.
En general, la velocidad de la tarjeta gráfica 120-W es entre un 7 y un 12% más lenta que la media de las RTX 3070 Ti de nuestra base de datos.
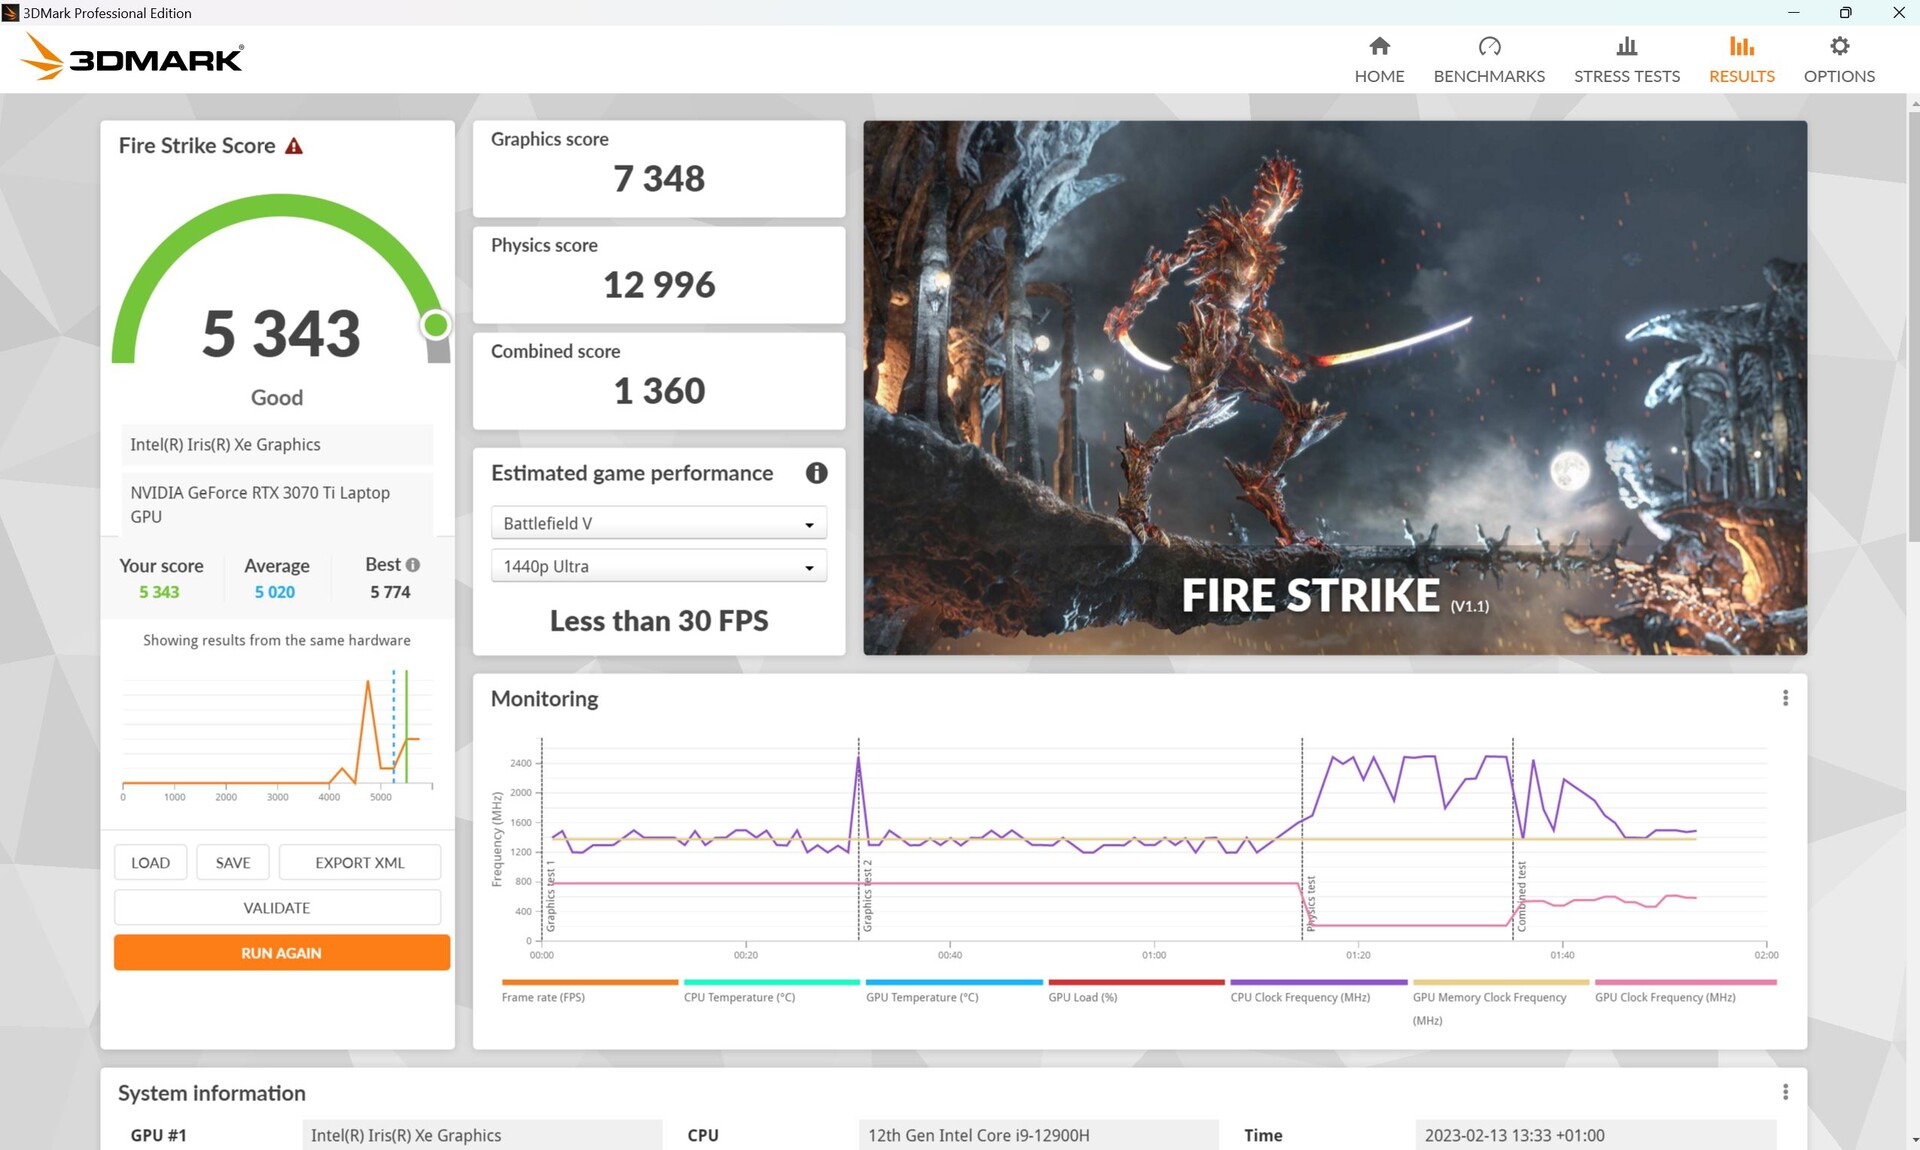
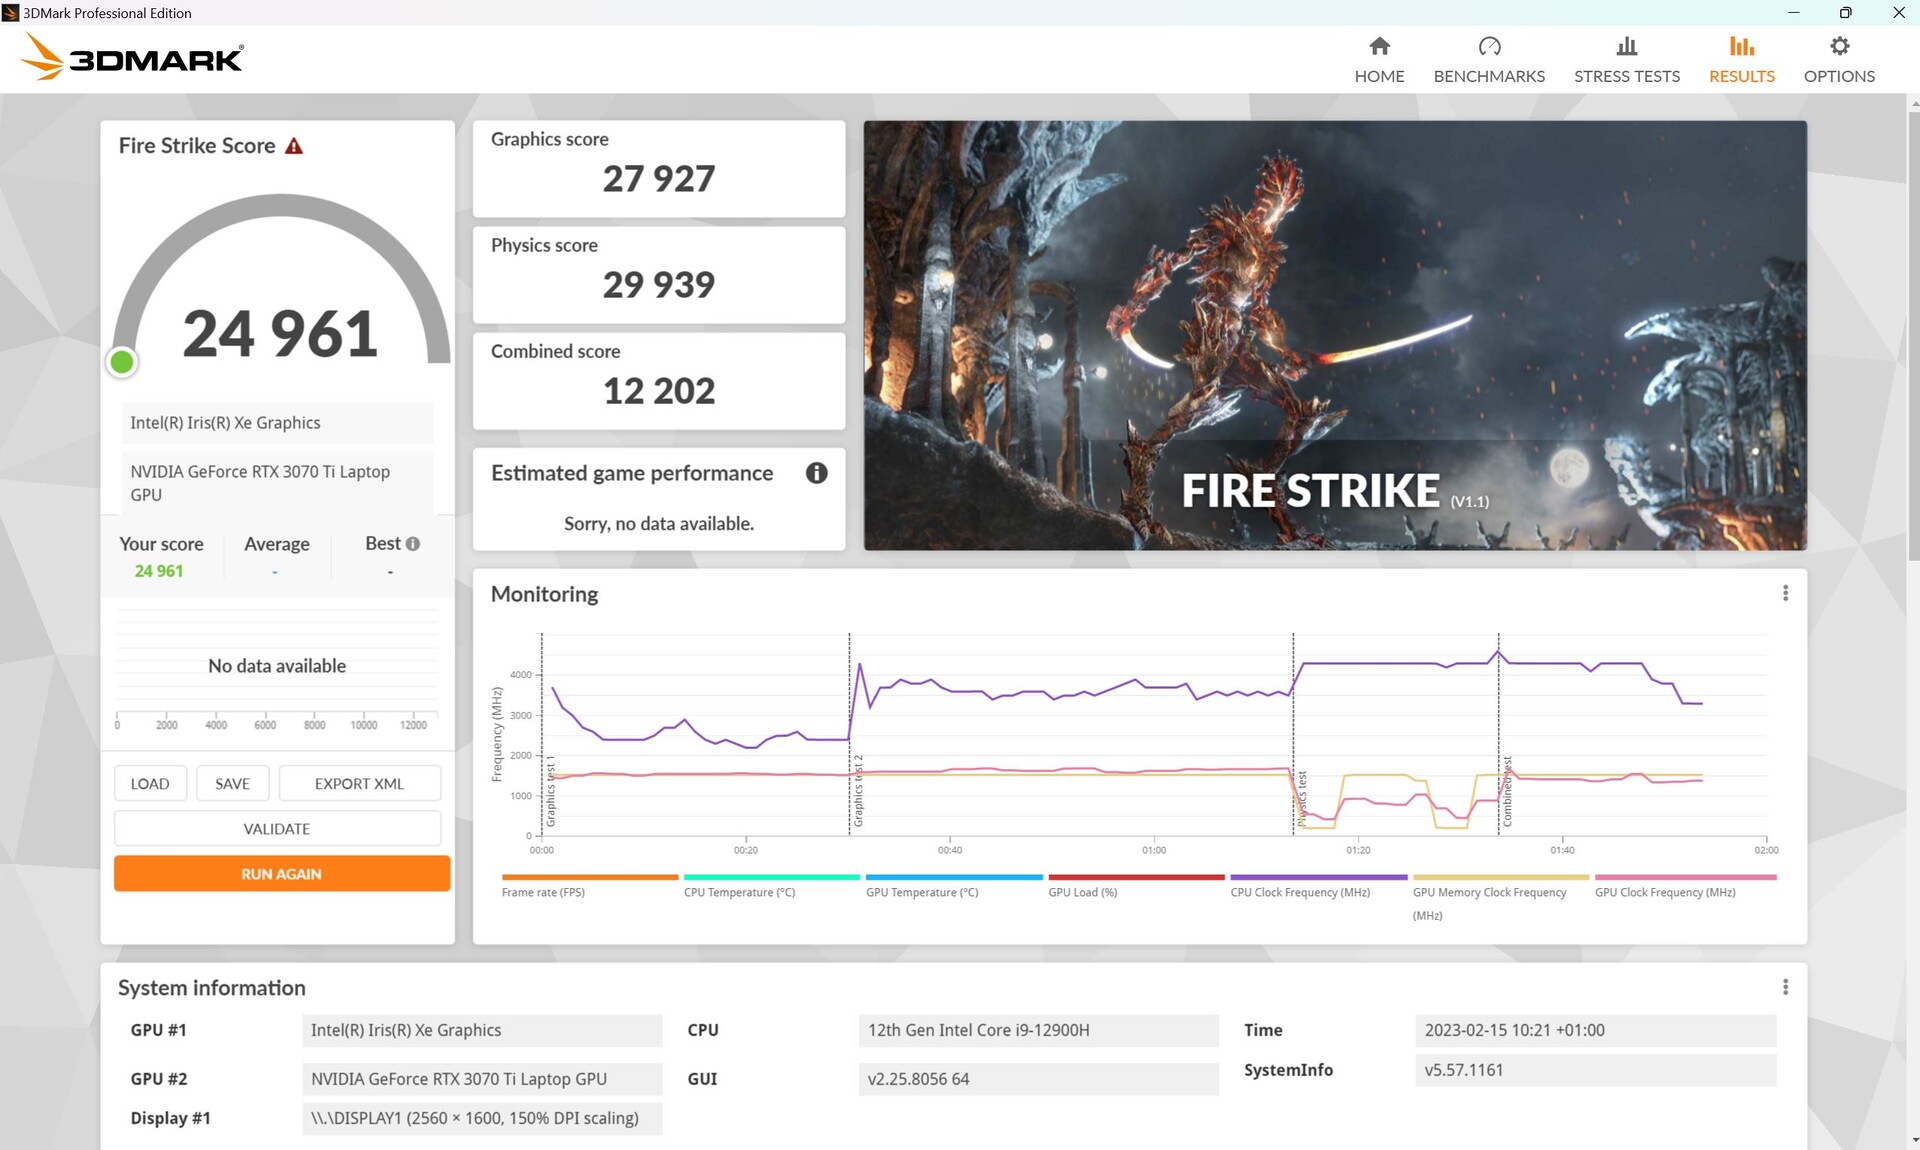
En modo Turbo, el rendimiento y el consumo aumentan ligeramente, y otra prueba Fire-Strike resulta en una puntuación gráfica en torno a un 13% superior.
Durante el funcionamiento en batería, el rendimiento 3D cae significativamente. Comparados con los 24.618 puntos gráficos de Fire Strike durante el funcionamiento en red, sólo quedan 7.348 puntos 3D en funcionamiento en batería, ¡lo que corresponde a una caída del 70%!
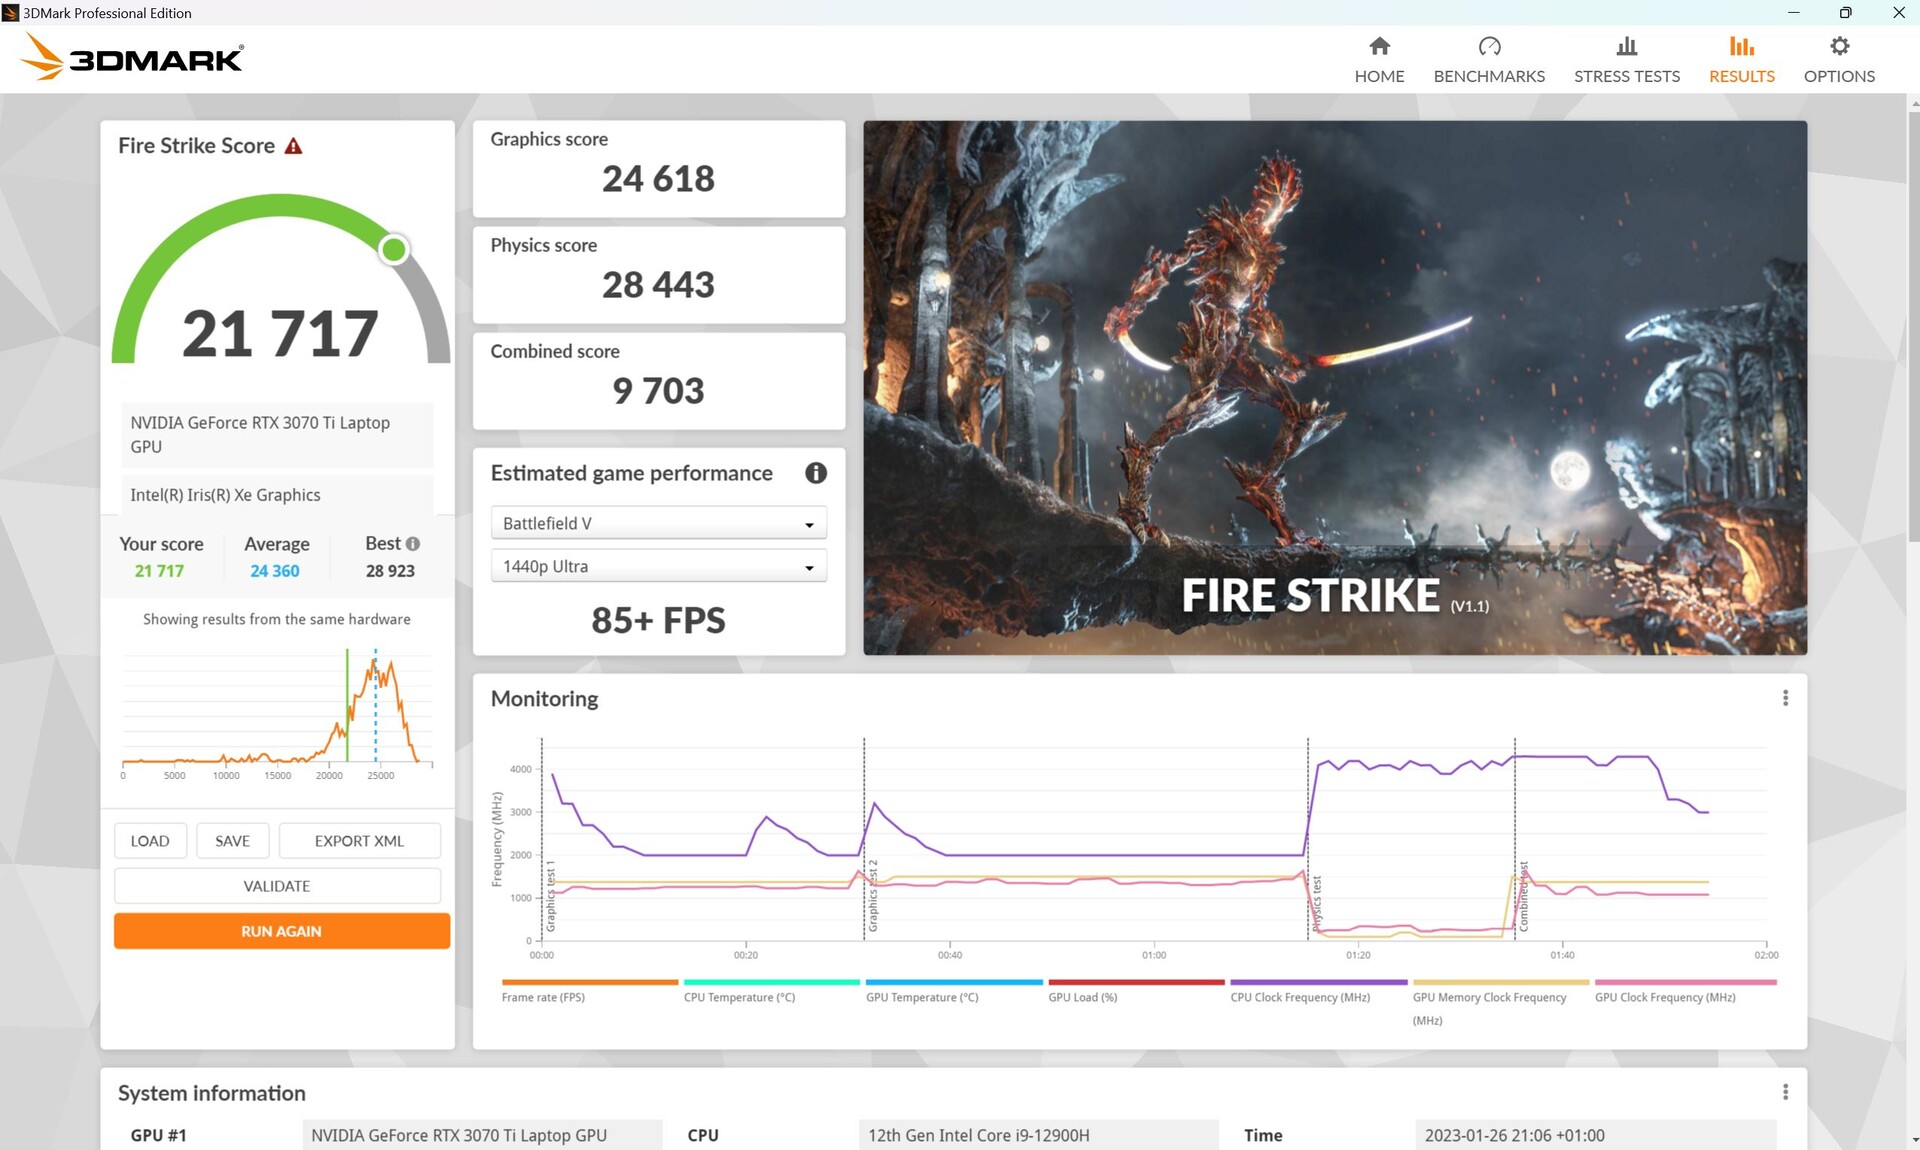
| 3DMark 11 Performance | 29169 puntos | |
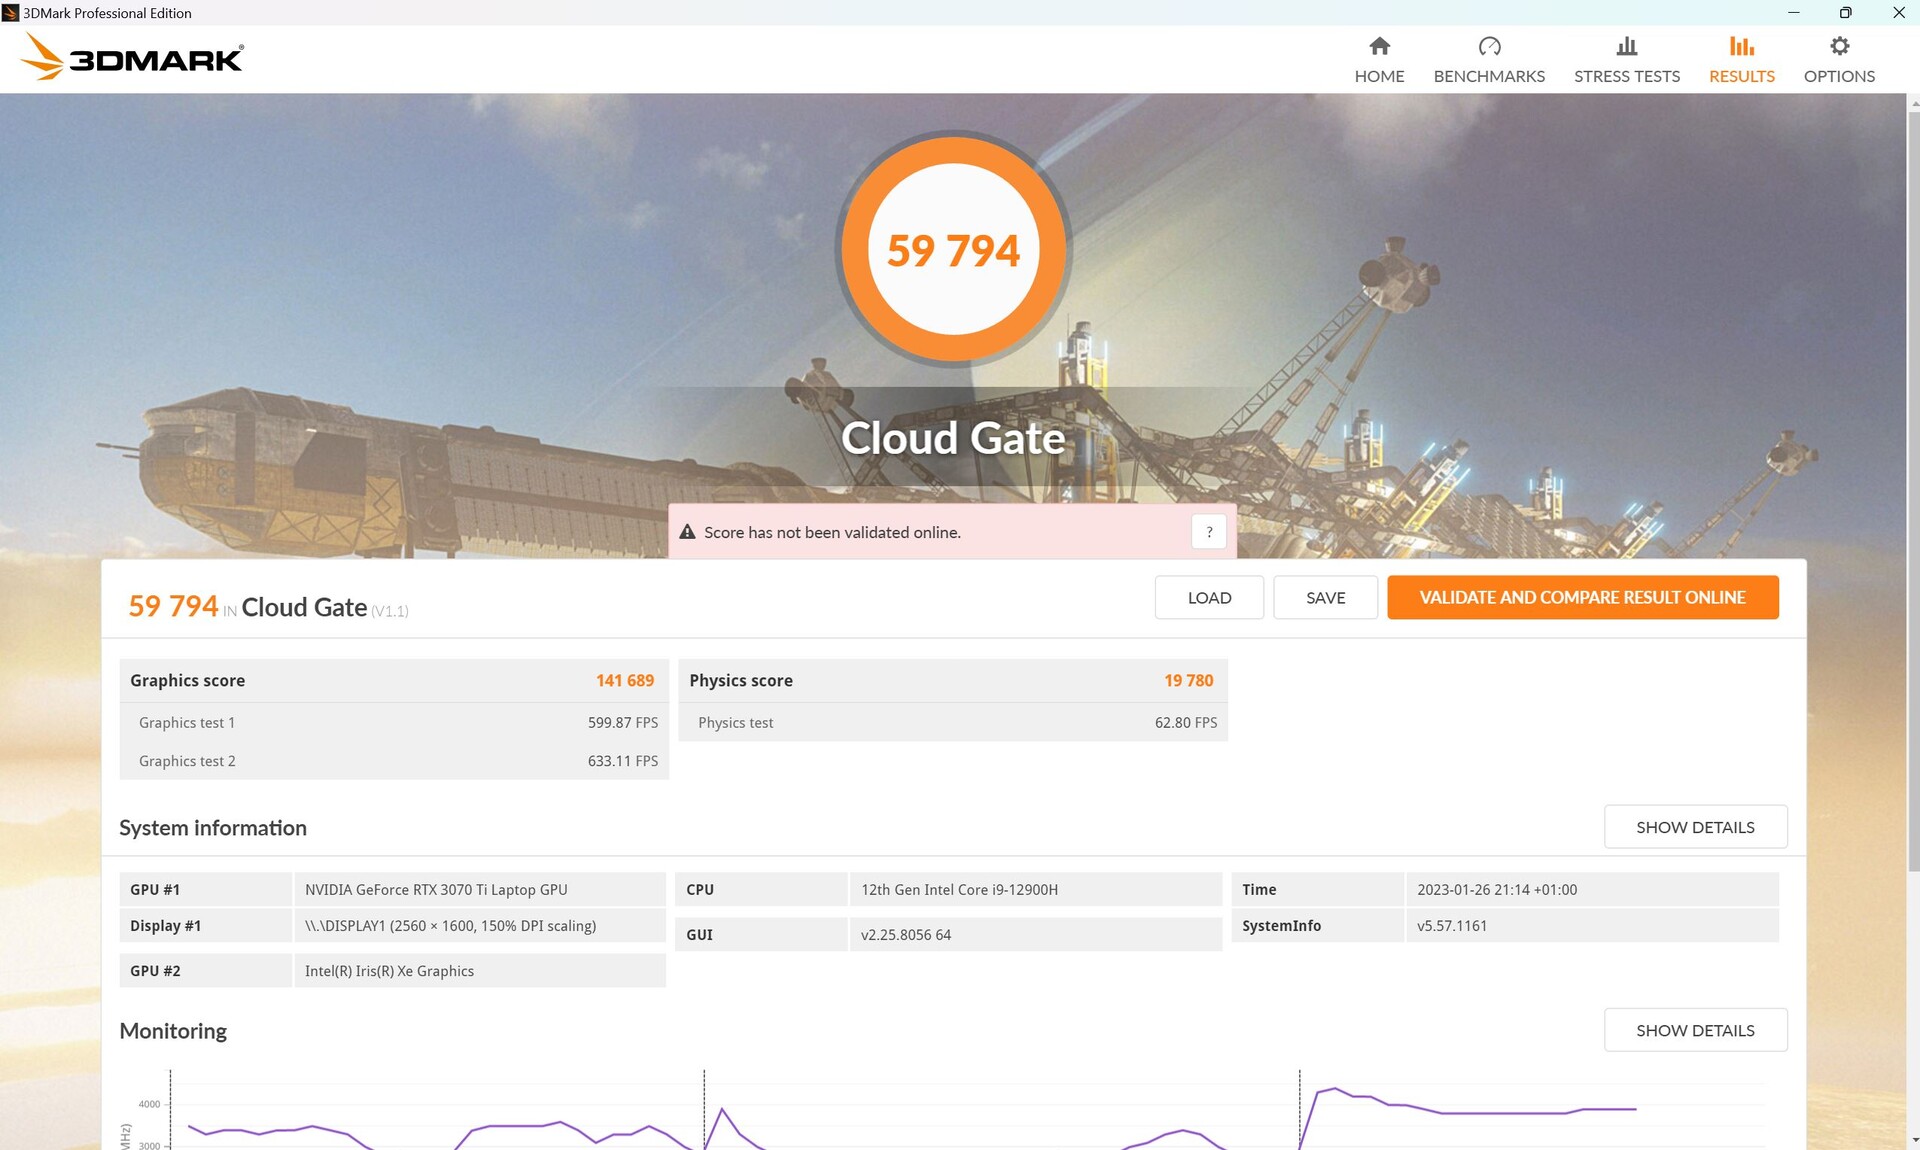
| 3DMark Cloud Gate Standard Score | 59794 puntos | |
| 3DMark Fire Strike Score | 21717 puntos | |
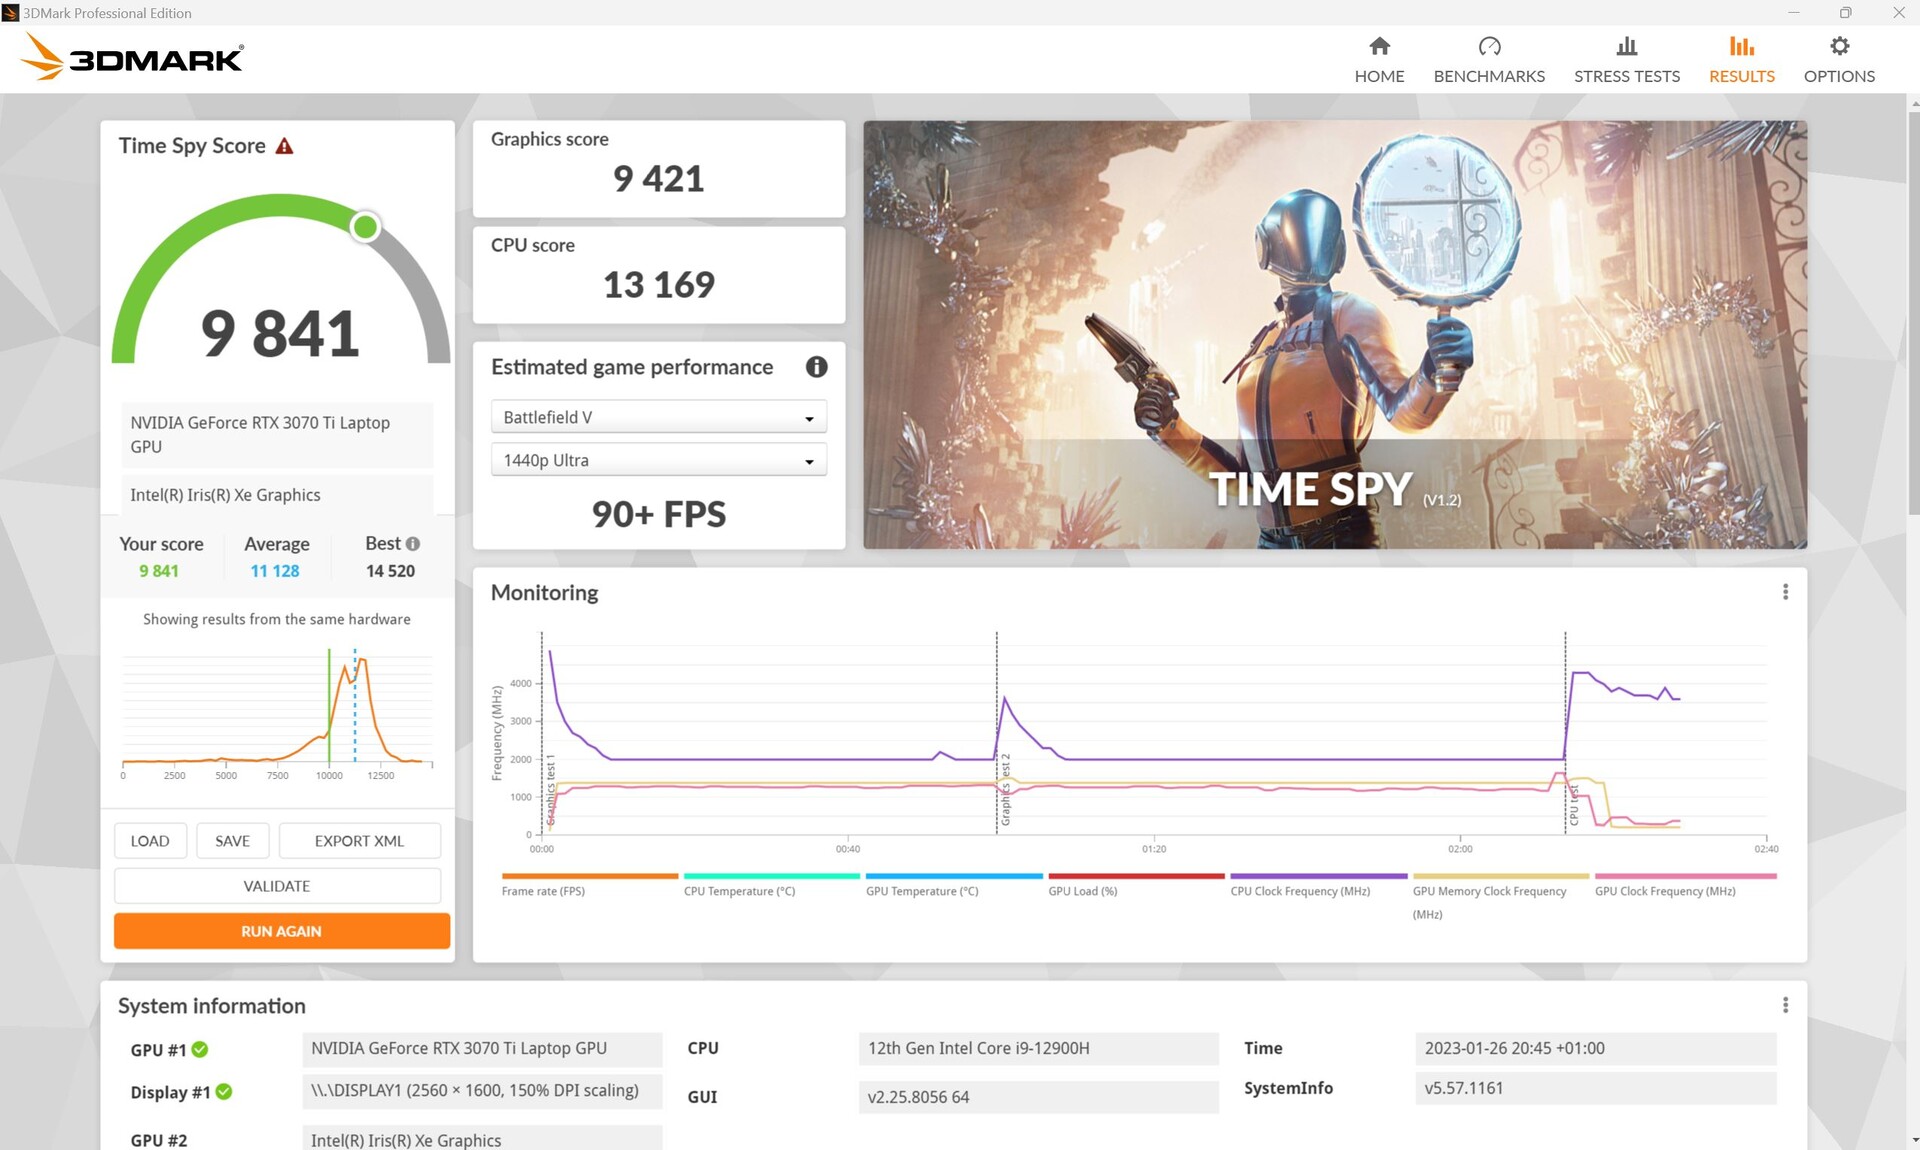
| 3DMark Time Spy Score | 9841 puntos | |
ayuda | ||
* ... más pequeño es mejor
Rendimiento en juegos
A la hora de jugar, la diferencia no es tan grande, también porque la potente CPU es capaz de ponerse al día en los juegos que requieren mucha CPU. En juegos con mucha GPU, como The Witcher 3 o Strange Brigade, elLegion 5 Procon su RTX 3070-Ti de 150 W está claramente por delante. En DOTA 2 Reborn o X-Plane 11.11, el M16 es capaz de colocarse en cabeza.
| The Witcher 3 - 1920x1080 Ultra Graphics & Postprocessing (HBAO+) | |
| Media de la clase Gaming (104.7 - 240, n=7, últimos 2 años) | |
| Lenovo Legion 5 Pro 16ARH7H RTX 3070 Ti | |
| Corsair Voyager a1600 | |
| Asus ROG Zephyrus M16 GU603Z | |
| Asus ROG Zephyrus M16 GU603H | |
| Schenker Vision 16 Pro RTX 3070 Ti | |
| Schenker XMG Focus 16 (i7-12700H, RTX 3060) | |
El portátil no es compatible con Advanced Optimus, sino con Optimus normal, y también ofrece un conmutador MUX, que permite cambiar activamente entre la GPU integrada (o modo híbrido) y la GPU dedicada.
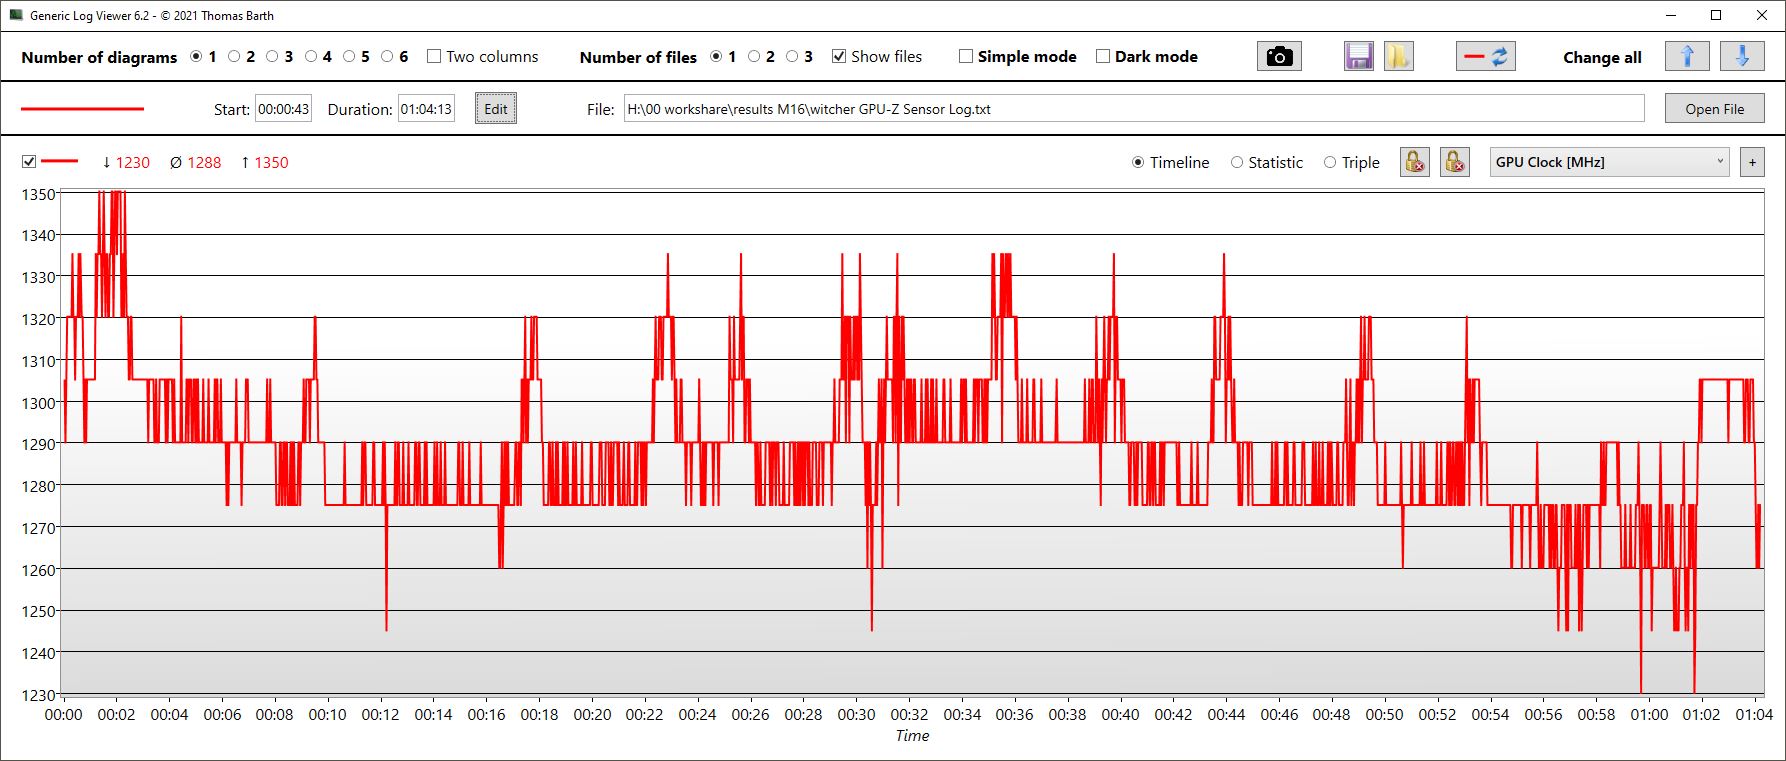
Nuestro El bucle Witcher 3 da como resultado velocidades de fotogramas relativamente constantes. Aquí se aprecian fácilmente las diferencias de rendimiento entre los competidores: mientras que elLegion 5 Pro es significativamente más rápido, el Schenker Vision 16 Proapenas es superado.
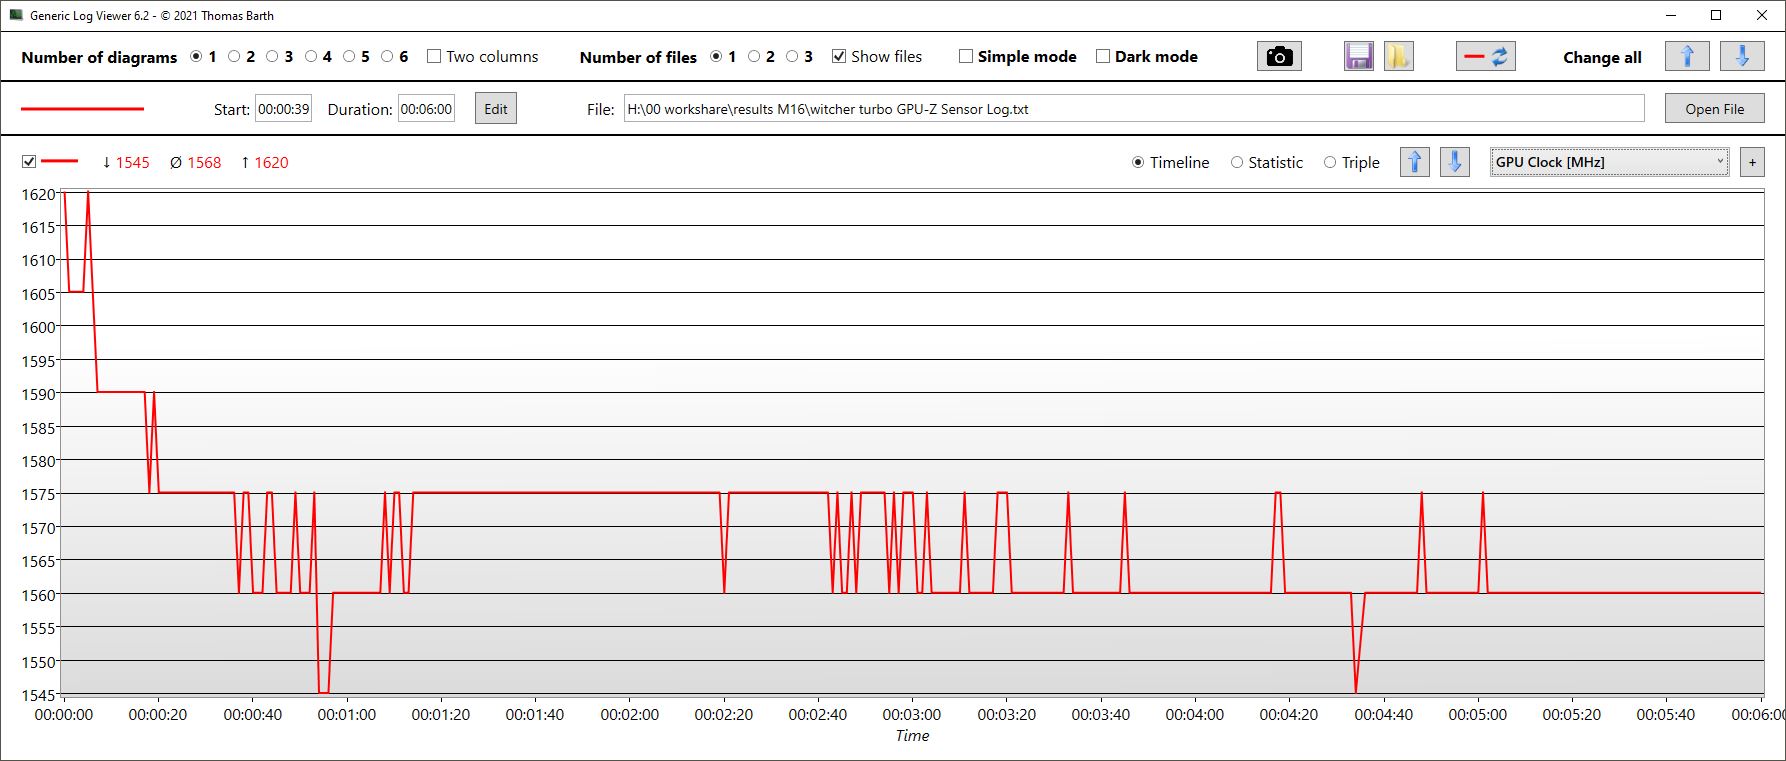
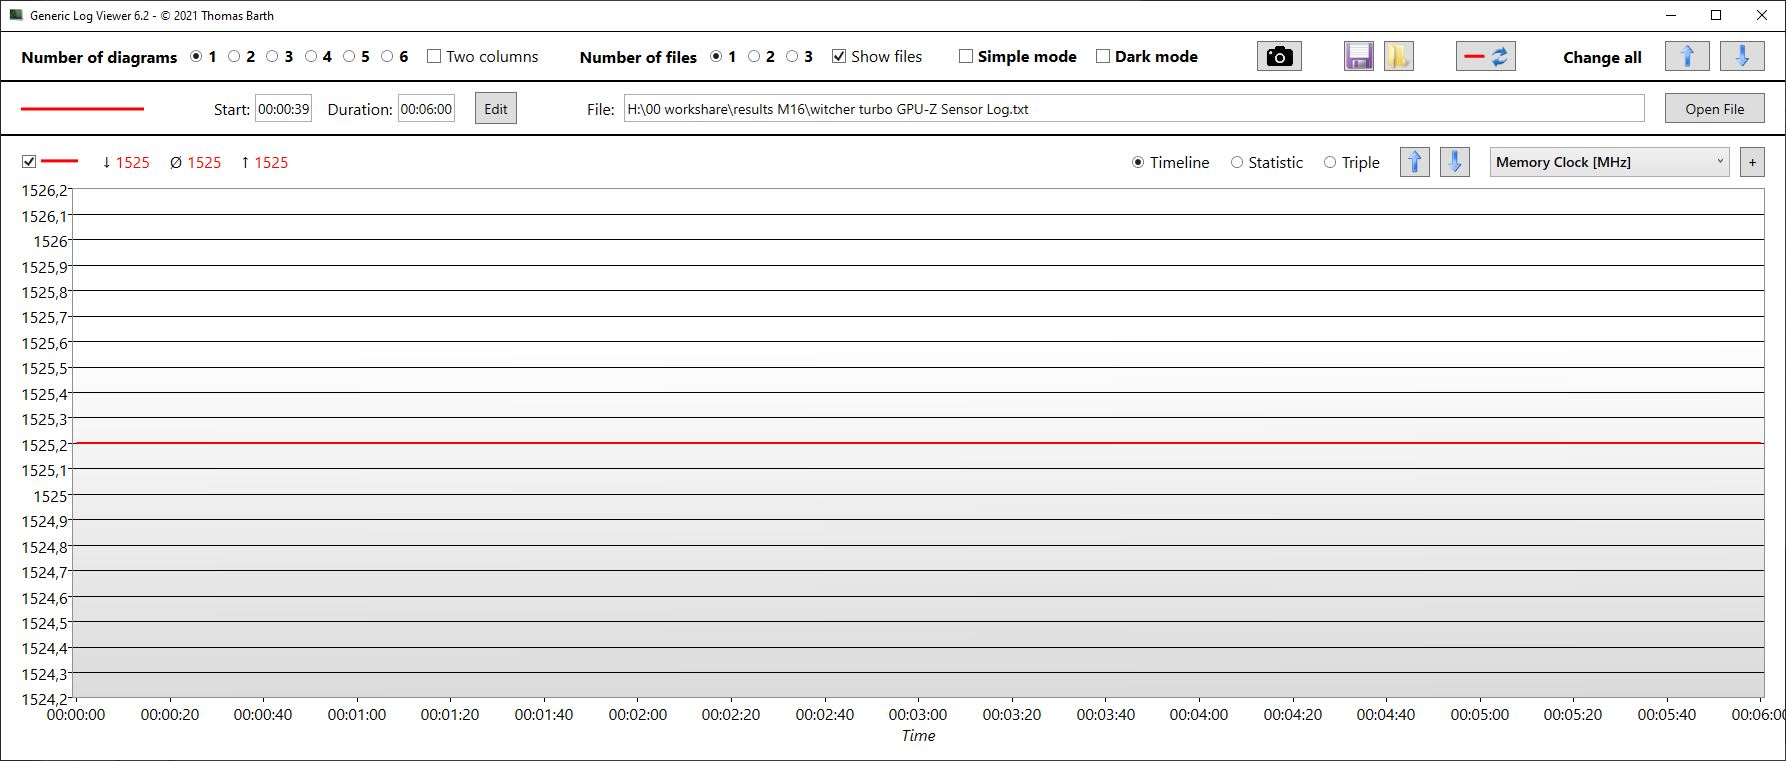
En modo Turbo (gráfico azul, medido durante 6 minutos), el rendimiento aumenta considerablemente, acercándose al del Legion 5 Pro en algunas partes. El ruido producido por el portátil es entonces igualmente alto, como también puedes ver en la sección Emisiones más abajo. La velocidad de la GPU y el almacenamiento aumentan, y el consumo de energía sube a casi 120 W.
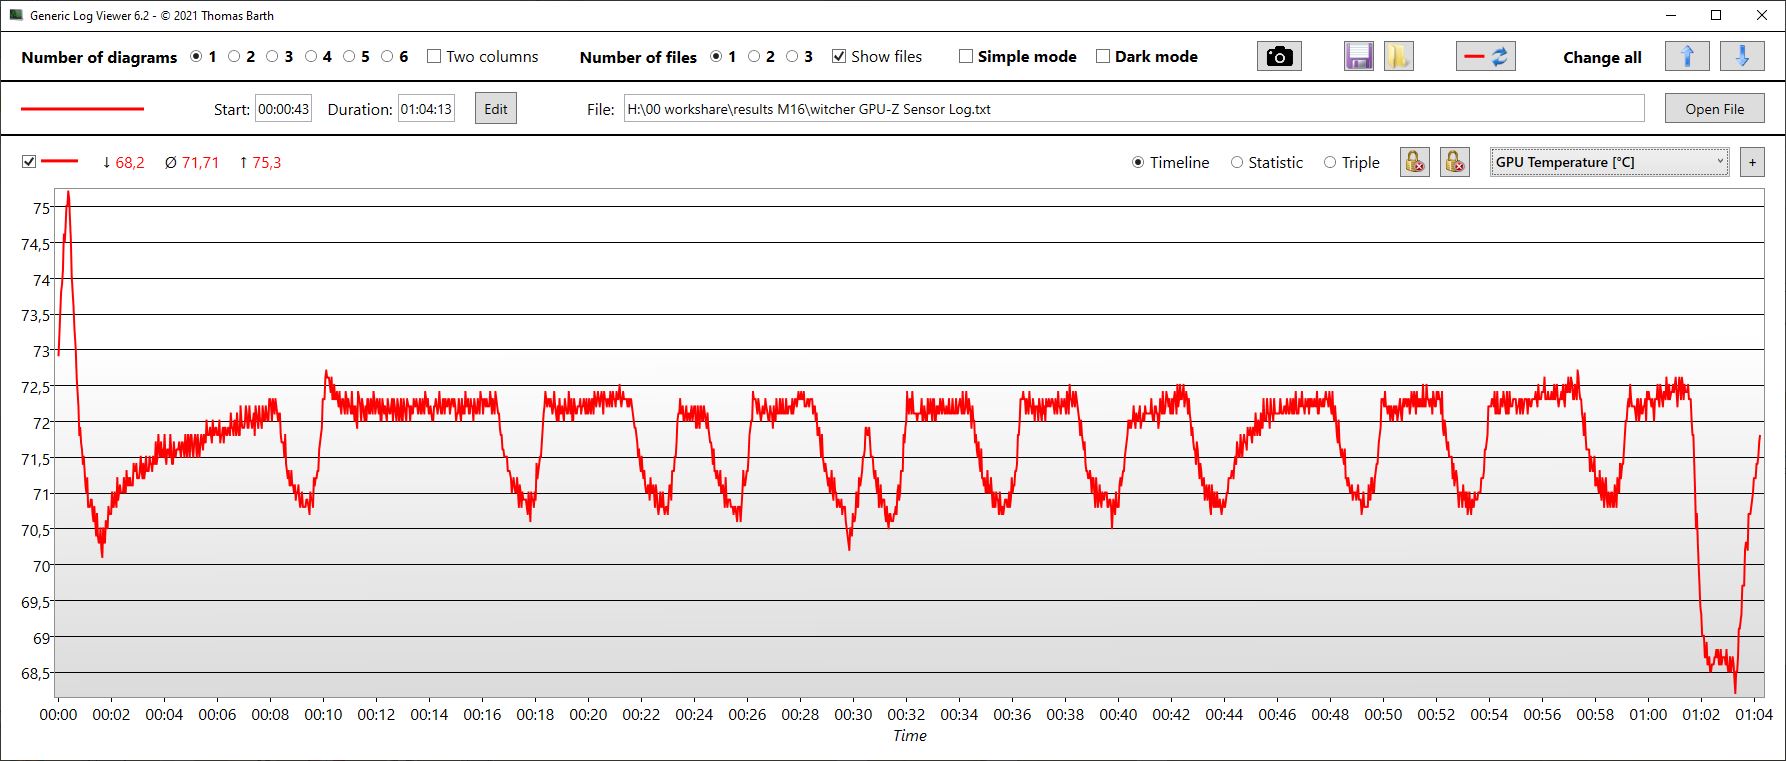
Con el tiempo, la velocidad de reloj de la GPU sigue disminuyendo ligeramente, terminando en 1.288 MHz de media. La tarjeta se calienta hasta unos 72 °C , mientras que sólo consume 93 W de media, lo que sigue estando lejos de su valor objetivo TGP.
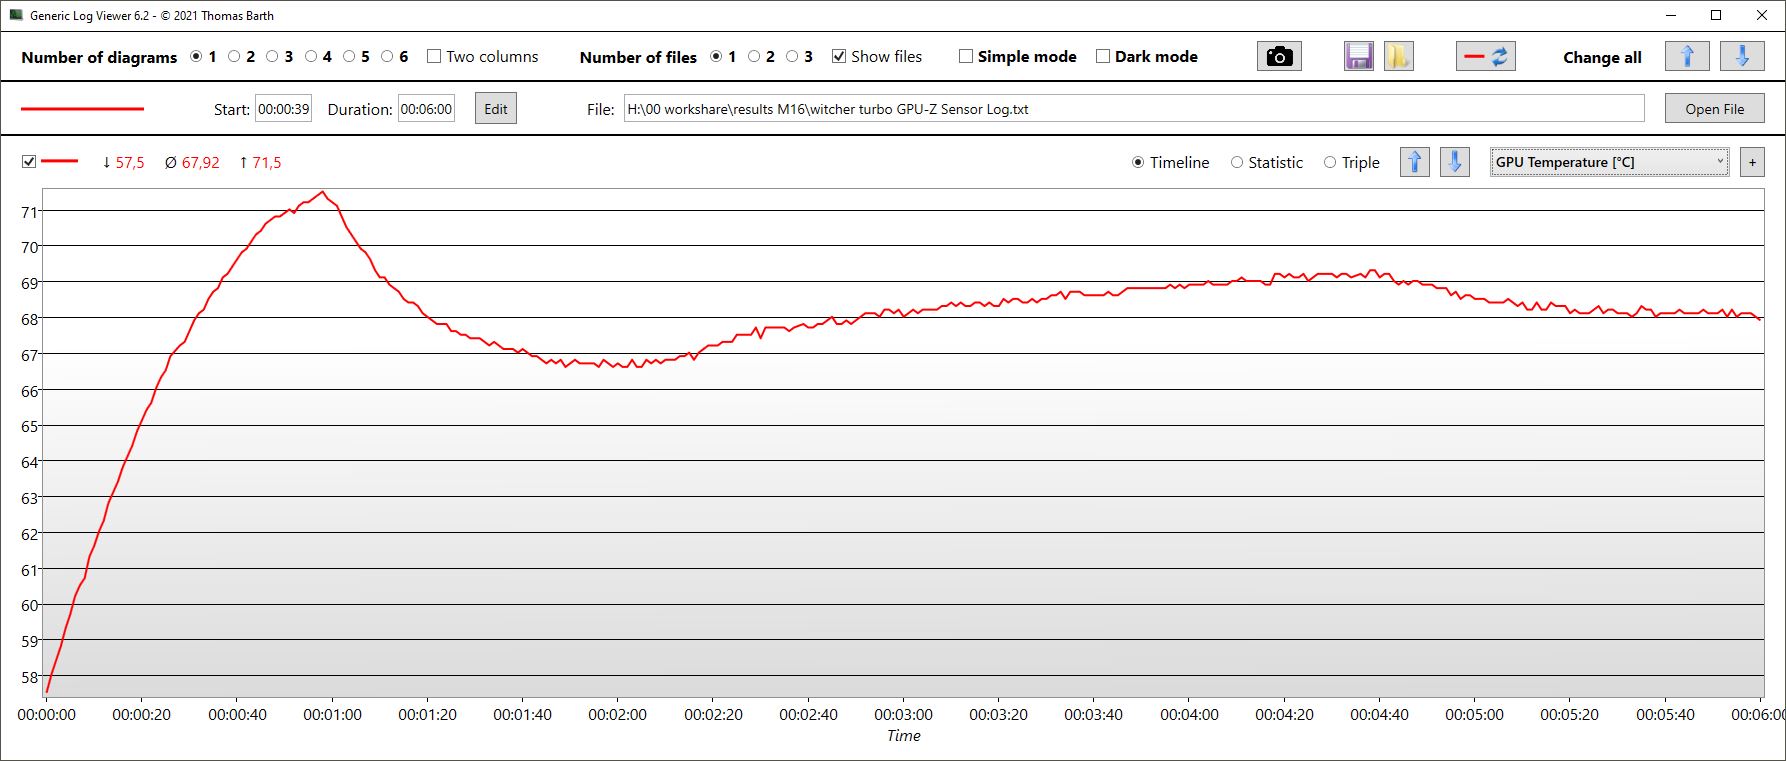
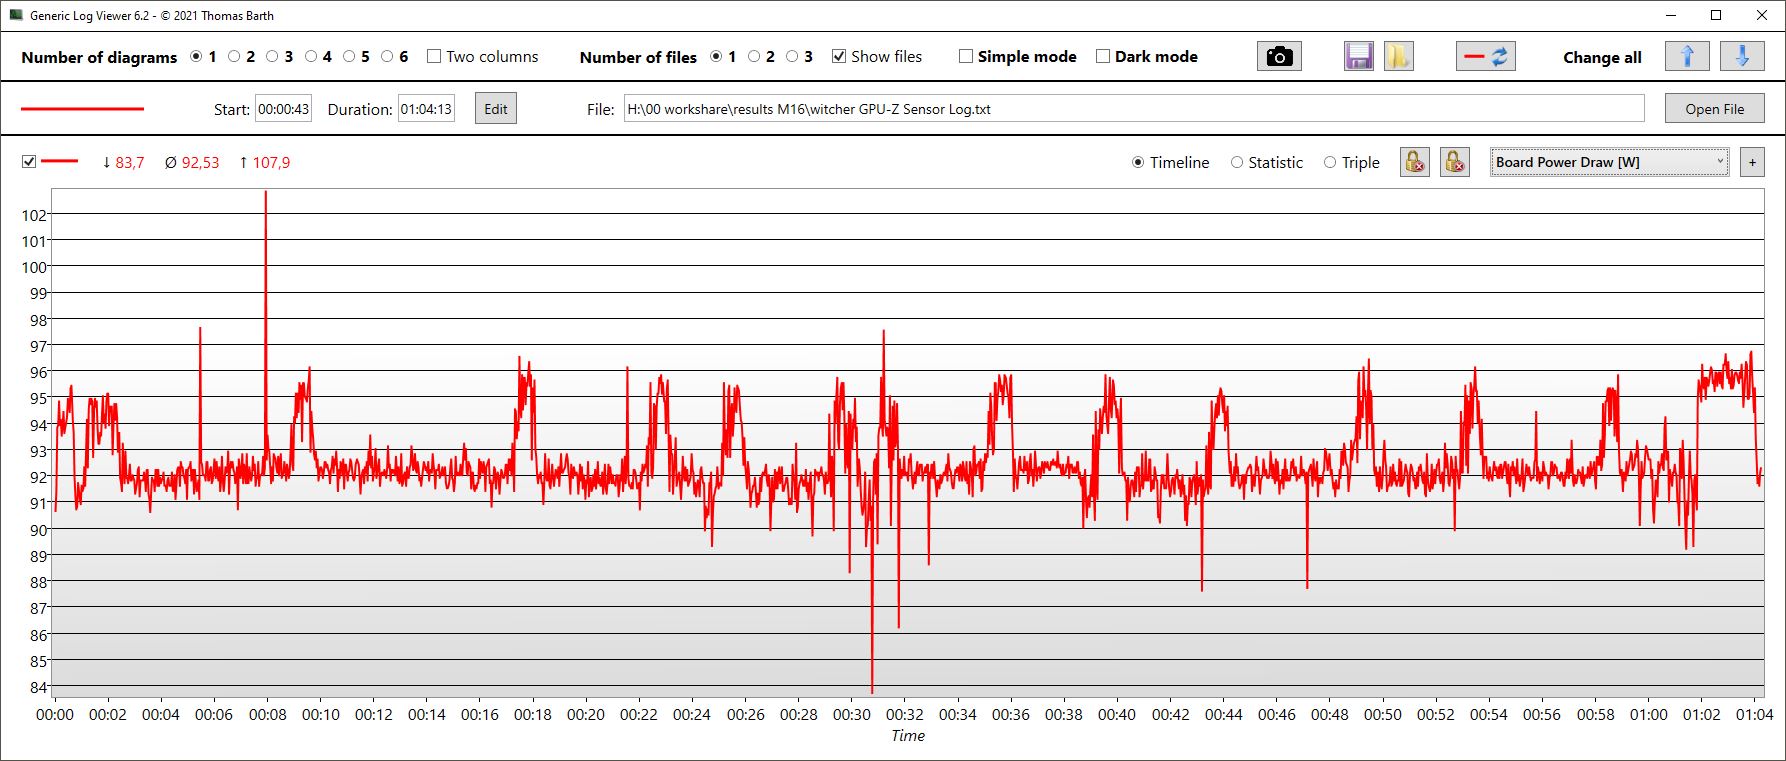
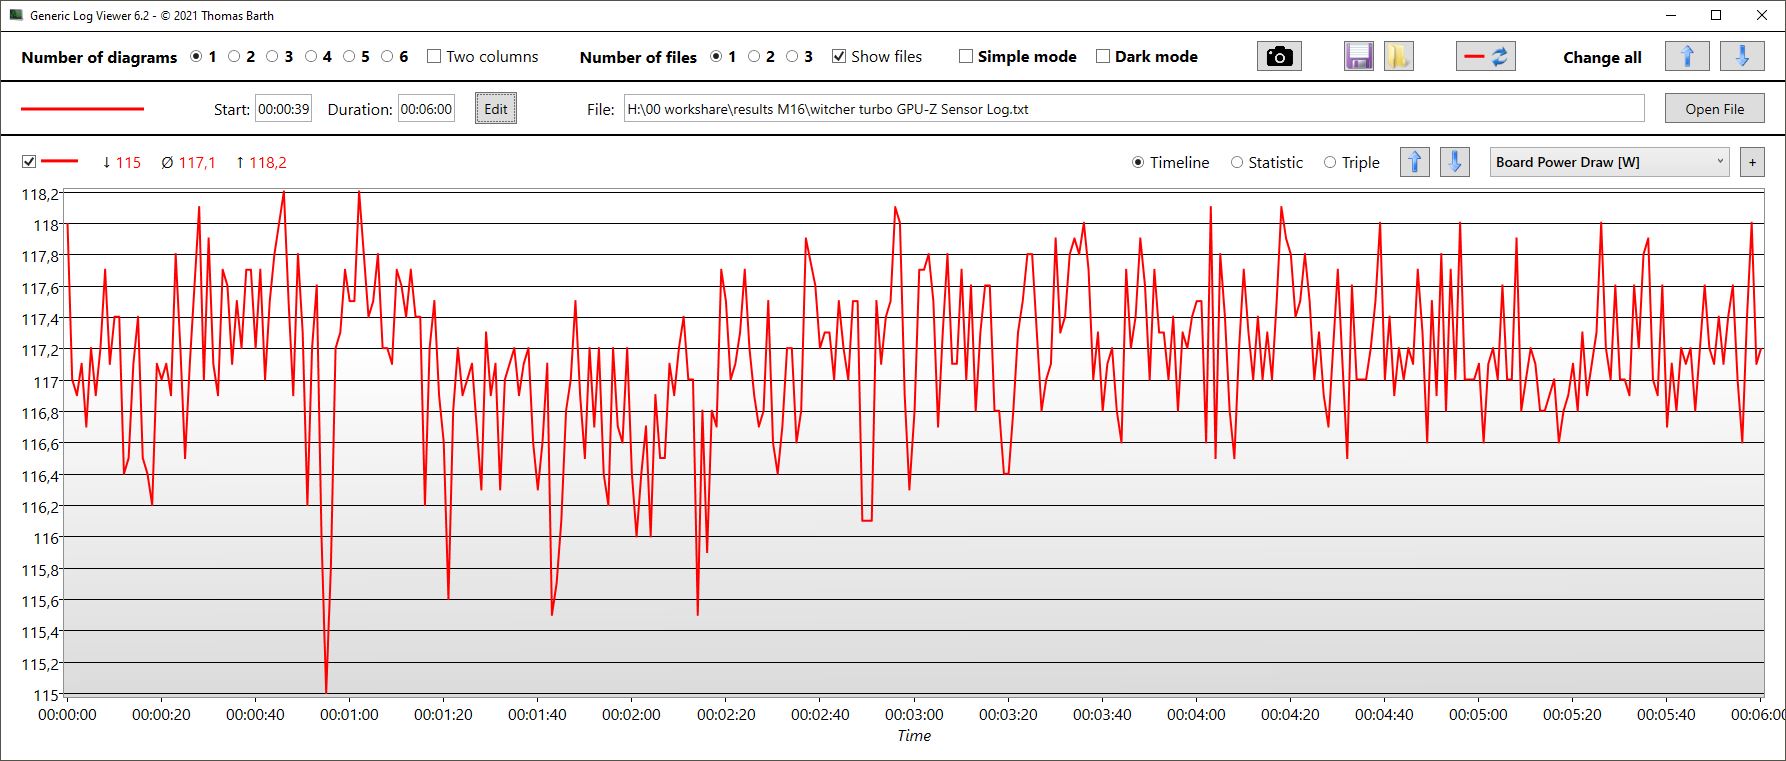
The Witcher 3 FPS Chart
| bajo | medio | alto | ultra | QHD | 4K | |
|---|---|---|---|---|---|---|
| GTA V (2015) | 184.6 | 171.4 | 108.1 | |||
| The Witcher 3 (2015) | 370.2 | 273.2 | 171 | 99.5 | ||
| Dota 2 Reborn (2015) | 195.2 | 174.7 | 170.2 | 160.5 | ||
| Final Fantasy XV Benchmark (2018) | 123.8 | 94.8 | 72.1 | 43 | ||
| X-Plane 11.11 (2018) | 166.8 | 145.7 | 115 | |||
| Far Cry 5 (2018) | 174 | 128 | 128 | 124 | 90 | |
| Strange Brigade (2018) | 376 | 227 | 187.9 | 163.8 | ||
| Dying Light 2 (2022) | 98.5 | 79 | 66 | 46.7 |
Emisiones - Un Asus M16 moderado
Niveles de ruido
Durante el funcionamiento en reposo, los ventiladores suelen apagarse, pero no siempre. De vez en cuando, pueden alcanzar fácilmente los 47 dB, por ejemplo, justo después de reiniciar Windows.
Durante la primera escena de la prueba 3DMark 06, los ventiladores permanecen casi silenciosos a 34 dB, y el ruido del ventilador sólo aumenta a 47 dB justo antes del final. El Schenker Vision 16 Pro y el Legion 5 Pro son capaces de permanecer silenciosos incluso más tiempo.
Cuando se juega, el funcionamiento del M16 sigue siendo bastante silencioso en comparación con sus competidores, algunos de los cuales producen un nivel de ruido significativamente superior a 50 dB, mientras que el del M16 se mantiene por debajo. Sin embargo, esto sólo ocurre en el modo Rendimiento. Si usas el modo Turbo, los ventiladores se aceleran a casi 55 dB, que está al mismo nivel que el Legion 5 Pro y significativamente más ruidoso que el Vision 16 Pro.
Ruido
| Ocioso |
| 23 / 24 / 47 dB(A) |
| Carga |
| 47.91 / 50.25 dB(A) |
 | ||
30 dB silencioso 40 dB(A) audible 50 dB(A) ruidosamente alto |
||
min: | ||
| Asus ROG Zephyrus M16 GU603Z GeForce RTX 3070 Ti Laptop GPU, i9-12900H, Micron 3400 1TB MTFDKBA1T0TFH | Asus ROG Zephyrus M16 GU603H GeForce RTX 3070 Laptop GPU, i9-11900H, Samsung PM9A1 MZVL22T0HBLB | Schenker Vision 16 Pro RTX 3070 Ti GeForce RTX 3070 Ti Laptop GPU, i7-12700H, Samsung SSD 980 Pro 1TB MZ-V8P1T0BW | Lenovo Legion 5 Pro 16ARH7H RTX 3070 Ti GeForce RTX 3070 Ti Laptop GPU, R7 6800H, Samsung PM9A1 MZVL21T0HCLR | Schenker XMG Focus 16 (i7-12700H, RTX 3060) GeForce RTX 3060 Laptop GPU, i7-12700H, Samsung SSD 980 Pro 1TB MZ-V8P1T0BW | Corsair Voyager a1600 Radeon RX 6800M, R9 6900HS, Samsung PM9A1 MZVL22T0HBLB | |
|---|---|---|---|---|---|---|
| Noise | -8% | 8% | -1% | 0% | -9% | |
| apagado / medio ambiente * (dB) | 23 | 25 -9% | 22.9 -0% | 23.5 -2% | 23 -0% | 29.9 -30% |
| Idle Minimum * (dB) | 23 | 25 -9% | 24.3 -6% | 23.7 -3% | 23 -0% | 30.5 -33% |
| Idle Average * (dB) | 24 | 31 -29% | 24.3 -1% | 31.1 -30% | 23 4% | 30.6 -28% |
| Idle Maximum * (dB) | 47 | 42 11% | 24.3 48% | 32.2 31% | 32.07 32% | 30.7 35% |
| Load Average * (dB) | 47.91 | 48 -0% | 38.5 20% | 38.4 20% | 53.7 -12% | 44.5 7% |
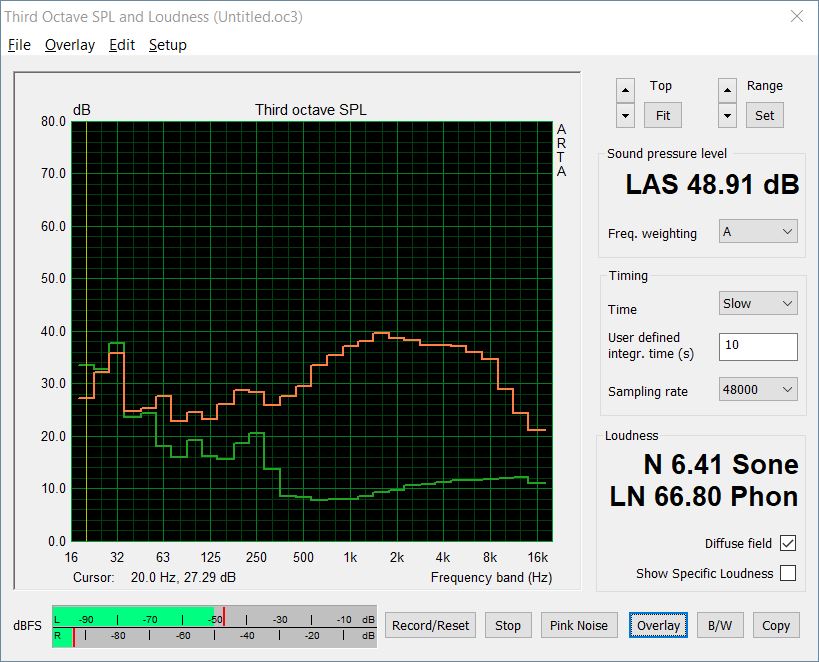
| Witcher 3 ultra * (dB) | 48.91 | 52 -6% | 51 -4% | 54.8 -12% | 54.58 -12% | |
| Load Maximum * (dB) | 50.25 | 56 -11% | 51 -1% | 54.8 -9% | 54.58 -9% | 51.1 -2% |
* ... más pequeño es mejor
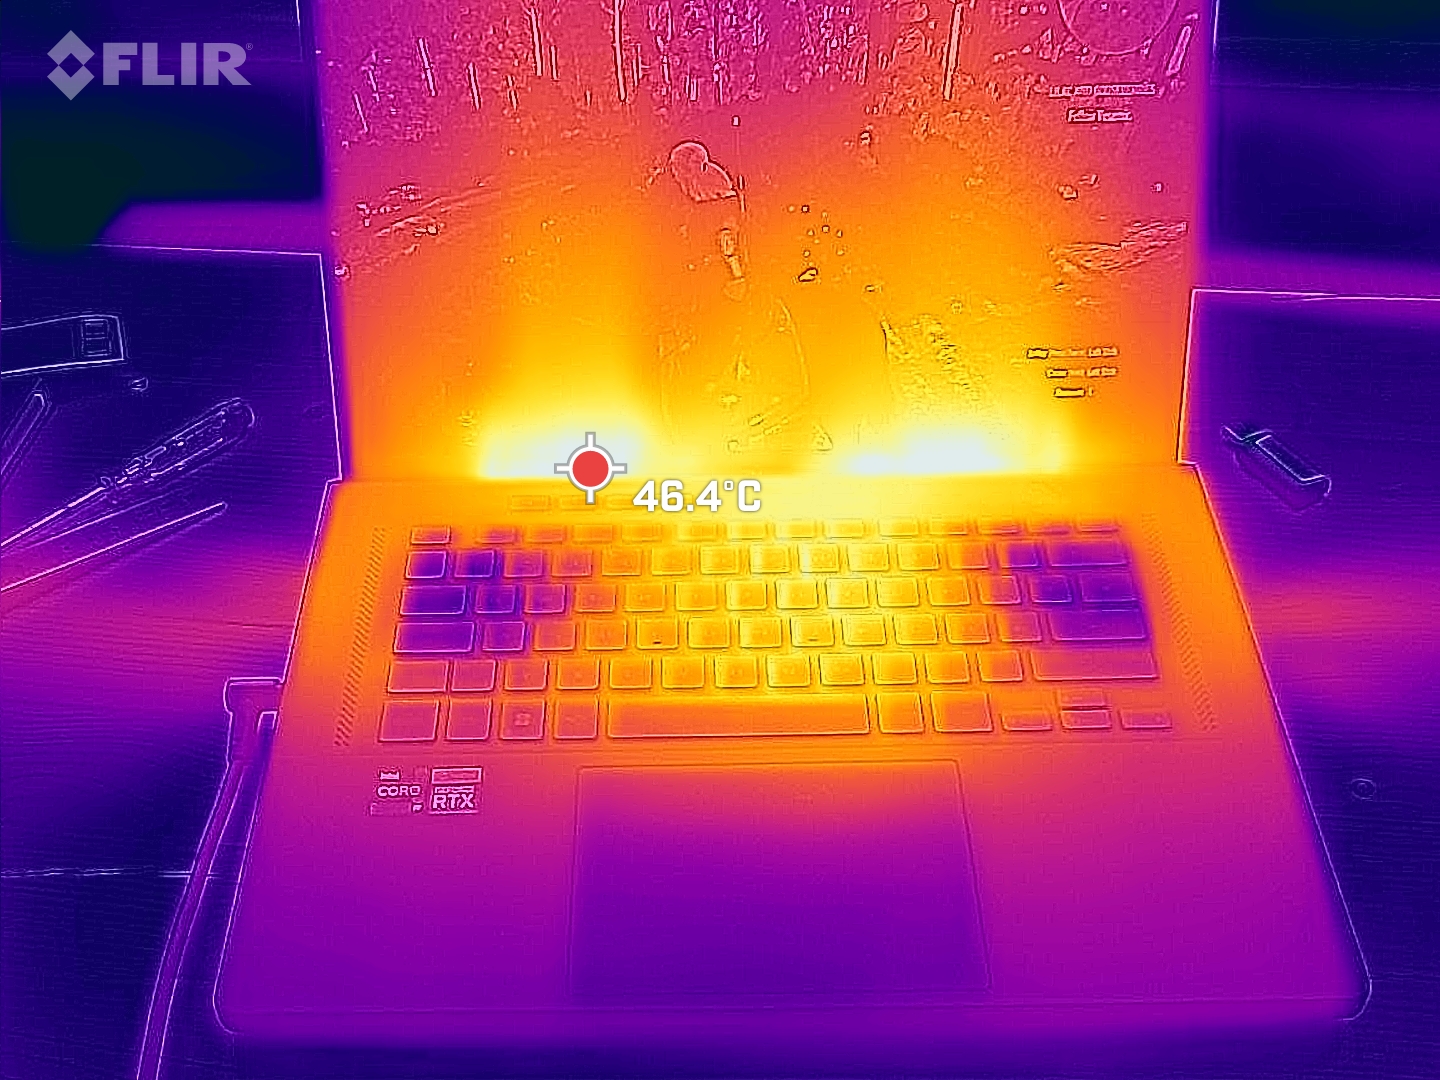
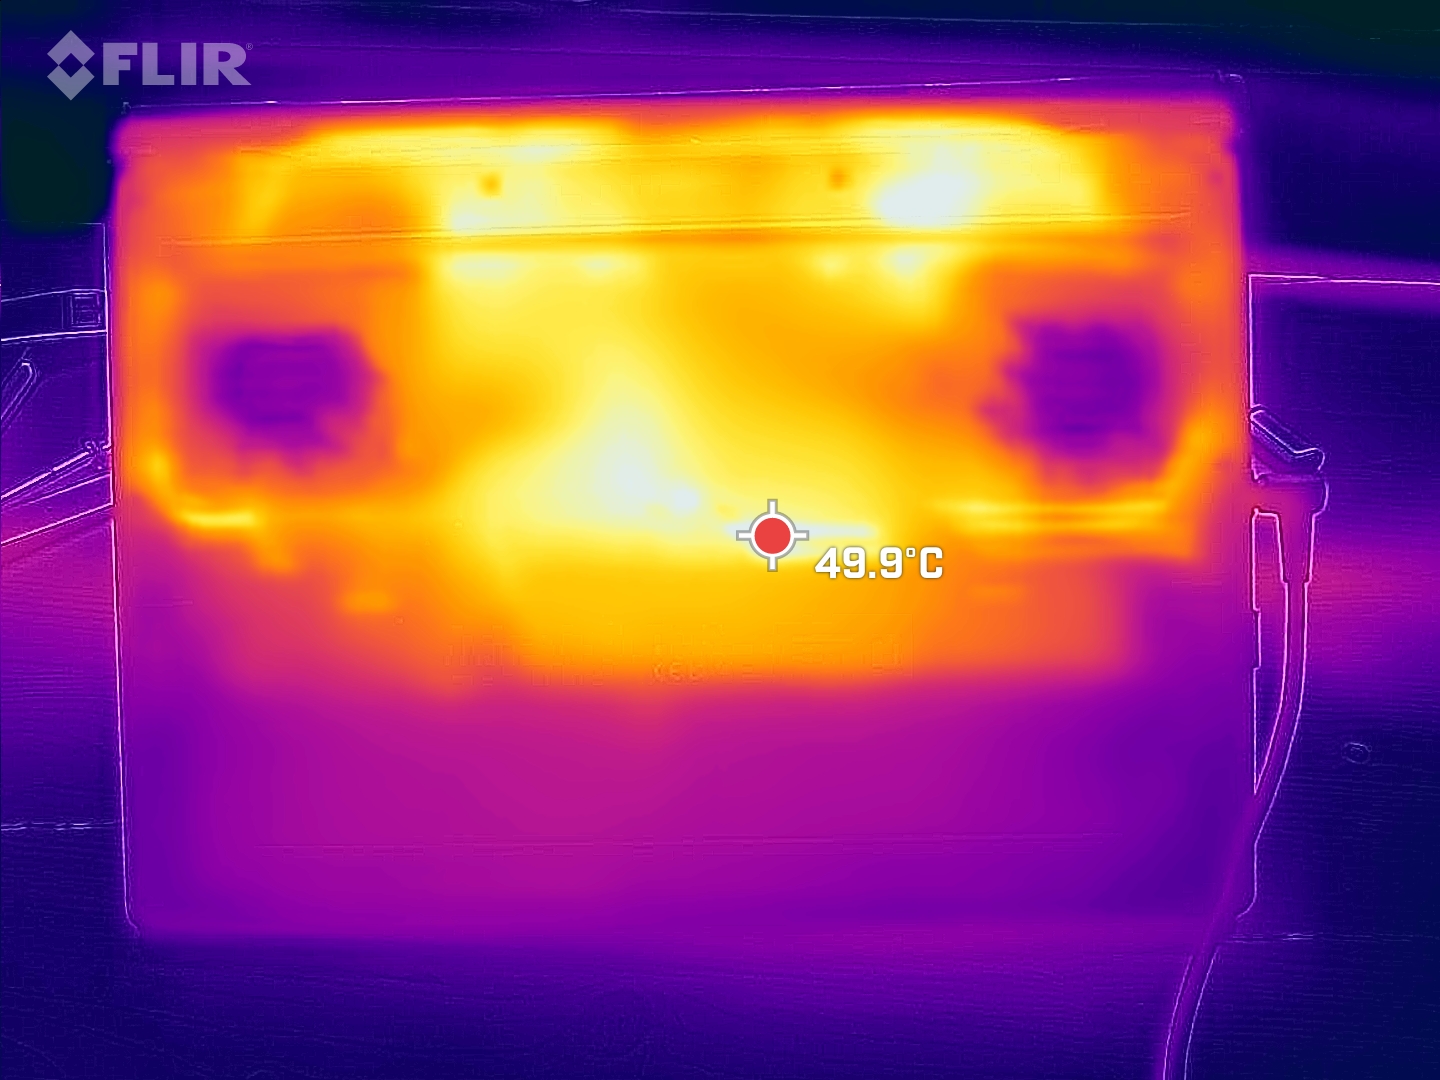
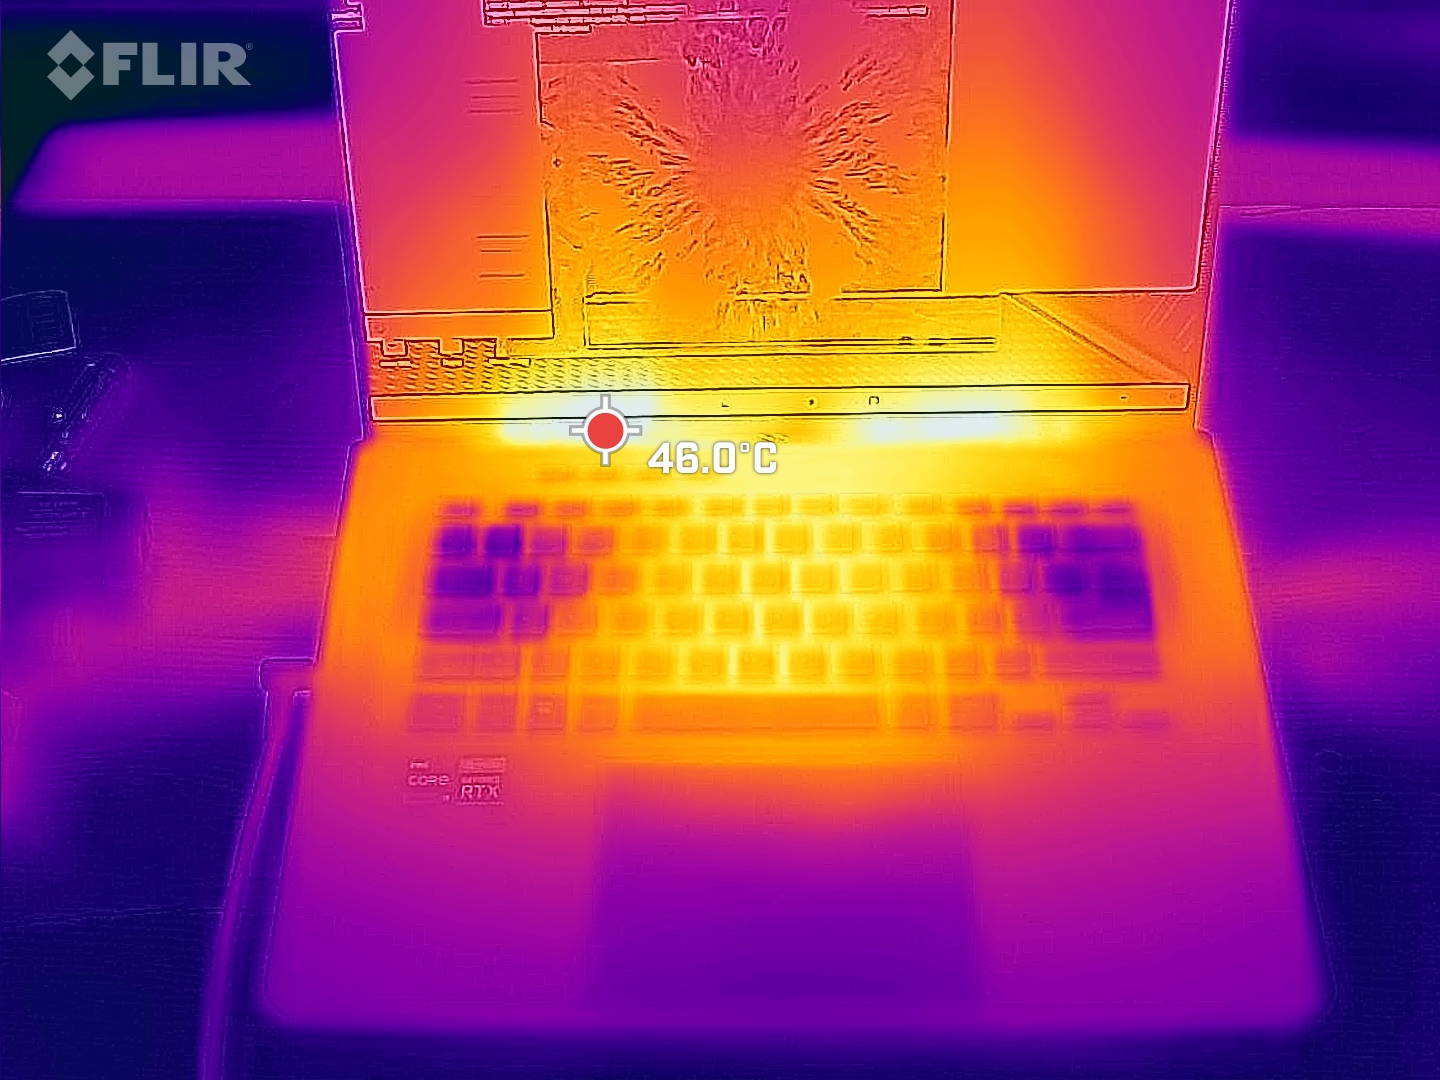
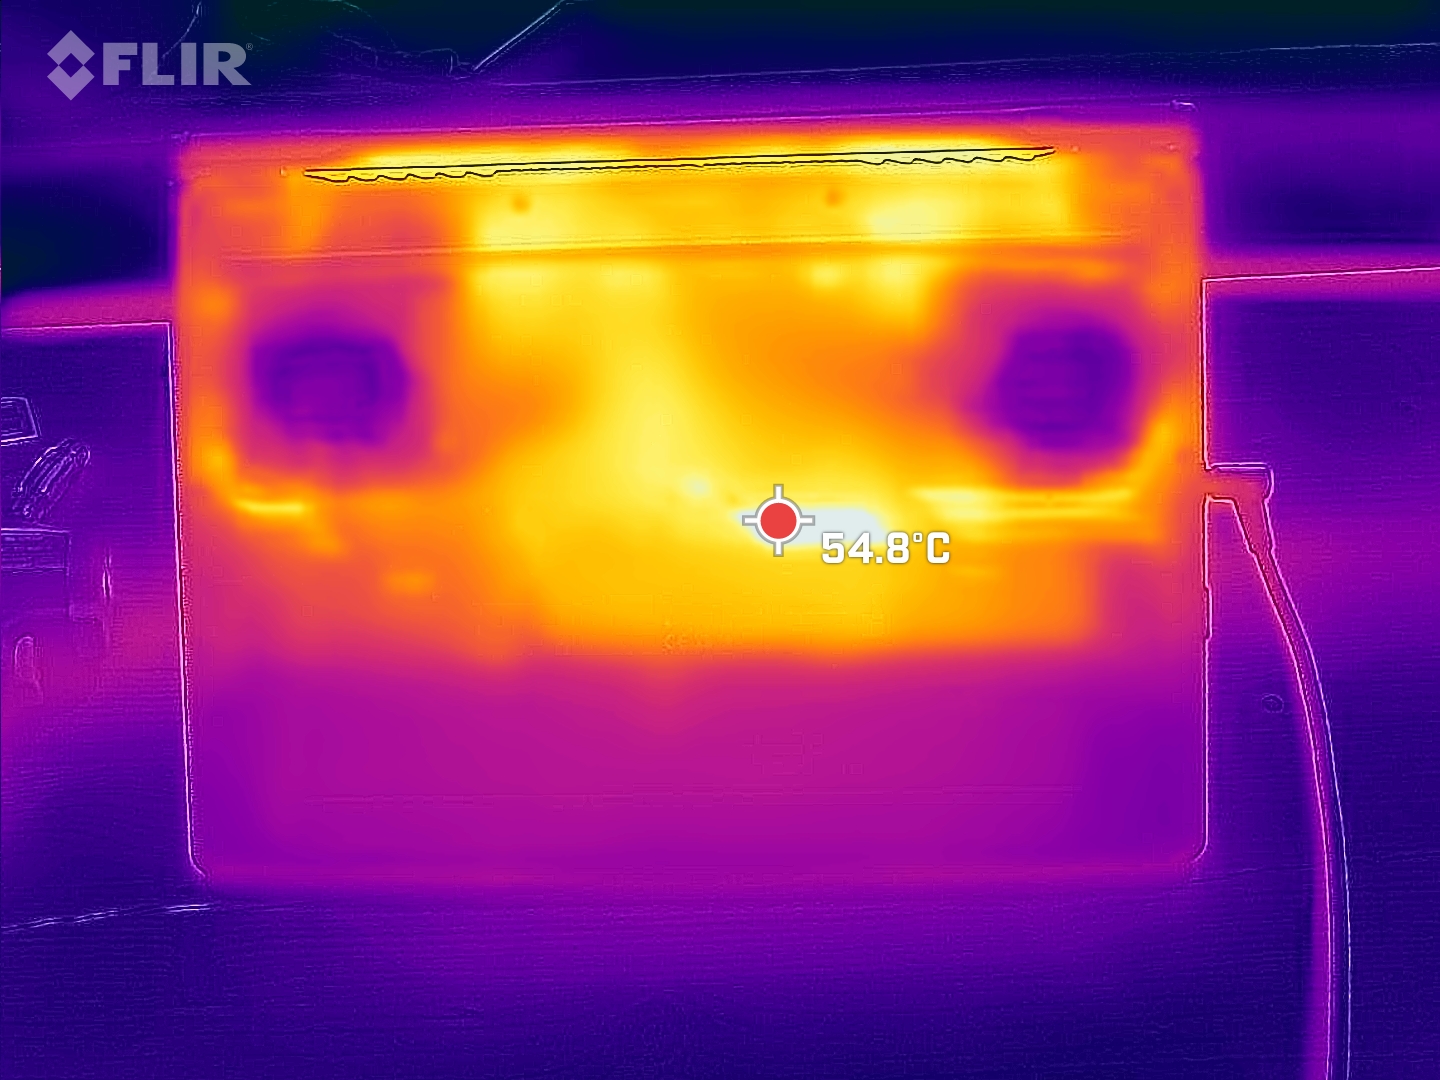
Temperaturas
Bajo carga pesada, la parte superior e inferior de la carcasa se calientan ligeramente por encima de los 50 °C (122 °F). Esto se mantiene dentro de los límites habituales y es incluso ligeramente mejor que el predecesor. El Legion 5 Pro se mantiene ligeramente más fría en la parte superior, y la Vision 16 Pro es ligeramente más frío en la parte inferior.
(-) La temperatura máxima en la parte superior es de 52 °C / 126 F, frente a la media de 40.4 °C / 105 F, que oscila entre 21.2 y 68.8 °C para la clase Gaming.
(-) El fondo se calienta hasta un máximo de 51 °C / 124 F, frente a la media de 43.2 °C / 110 F
(+) En reposo, la temperatura media de la parte superior es de 26.4 °C / 80# F, frente a la media del dispositivo de 33.9 °C / 93 F.
(-) Jugando a The Witcher 3, la temperatura media de la parte superior es de 40.2 °C / 104 F, frente a la media del dispositivo de 33.9 °C / 93 F.
(+) Los reposamanos y el panel táctil alcanzan como máximo la temperatura de la piel (32 °C / 89.6 F) y, por tanto, no están calientes.
(-) La temperatura media de la zona del reposamanos de dispositivos similares fue de 28.8 °C / 83.8 F (-3.2 °C / -5.8 F).
| Asus ROG Zephyrus M16 GU603Z Intel Core i9-12900H, NVIDIA GeForce RTX 3070 Ti Laptop GPU | Asus ROG Zephyrus M16 GU603H Intel Core i9-11900H, NVIDIA GeForce RTX 3070 Laptop GPU | Schenker Vision 16 Pro RTX 3070 Ti Intel Core i7-12700H, NVIDIA GeForce RTX 3070 Ti Laptop GPU | Lenovo Legion 5 Pro 16ARH7H RTX 3070 Ti AMD Ryzen 7 6800H, NVIDIA GeForce RTX 3070 Ti Laptop GPU | Schenker XMG Focus 16 (i7-12700H, RTX 3060) Intel Core i7-12700H, NVIDIA GeForce RTX 3060 Laptop GPU | Corsair Voyager a1600 AMD Ryzen 9 6900HS, AMD Radeon RX 6800M | |
|---|---|---|---|---|---|---|
| Heat | -15% | 9% | 3% | 4% | -7% | |
| Maximum Upper Side * (°C) | 52 | 52 -0% | 50.8 2% | 43.8 16% | 50 4% | 50.7 2% |
| Maximum Bottom * (°C) | 51 | 53 -4% | 46.3 9% | 53 -4% | 48 6% | 54.2 -6% |
| Idle Upper Side * (°C) | 29 | 38 -31% | 27.2 6% | 30 -3% | 28 3% | 35.8 -23% |
| Idle Bottom * (°C) | 33 | 41 -24% | 26.6 19% | 31.8 4% | 32 3% | 33 -0% |
* ... más pequeño es mejor
Prueba de resistencia
Los núcleos de la CPU comienzan nuestra prueba de estrés brevemente a 3,5 GHz. Tras unos segundos, la velocidad de reloj empieza a caer, nivelándose en torno a los 2.4 GHz. La temperatura varía con un máximo de 97 °C (207 °F) y 83 °C (181 °F) de media. El TDP de la CPU es de 44 W de media.
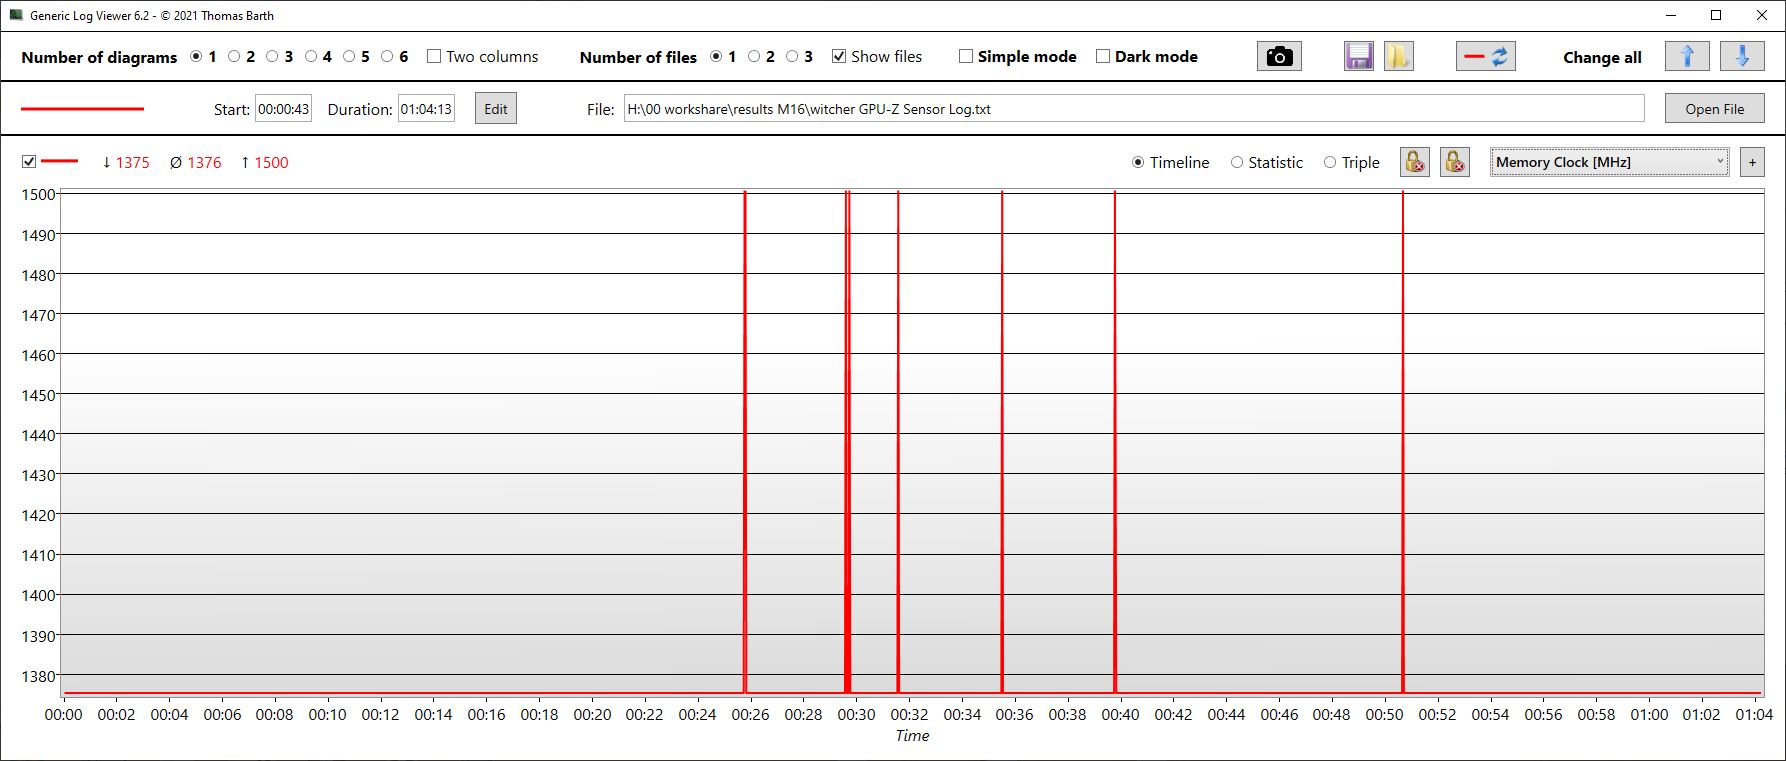
La velocidad de los gráficos varía significativamente entre 500 y 1.600 MHz, con una media de 838 MHz. La velocidad de almacenamiento ronda los 1,4 GHz, y la GPU se calienta hasta unos 70 °C (158 °F ). Medimos un consumo de energía de unos 66 W.
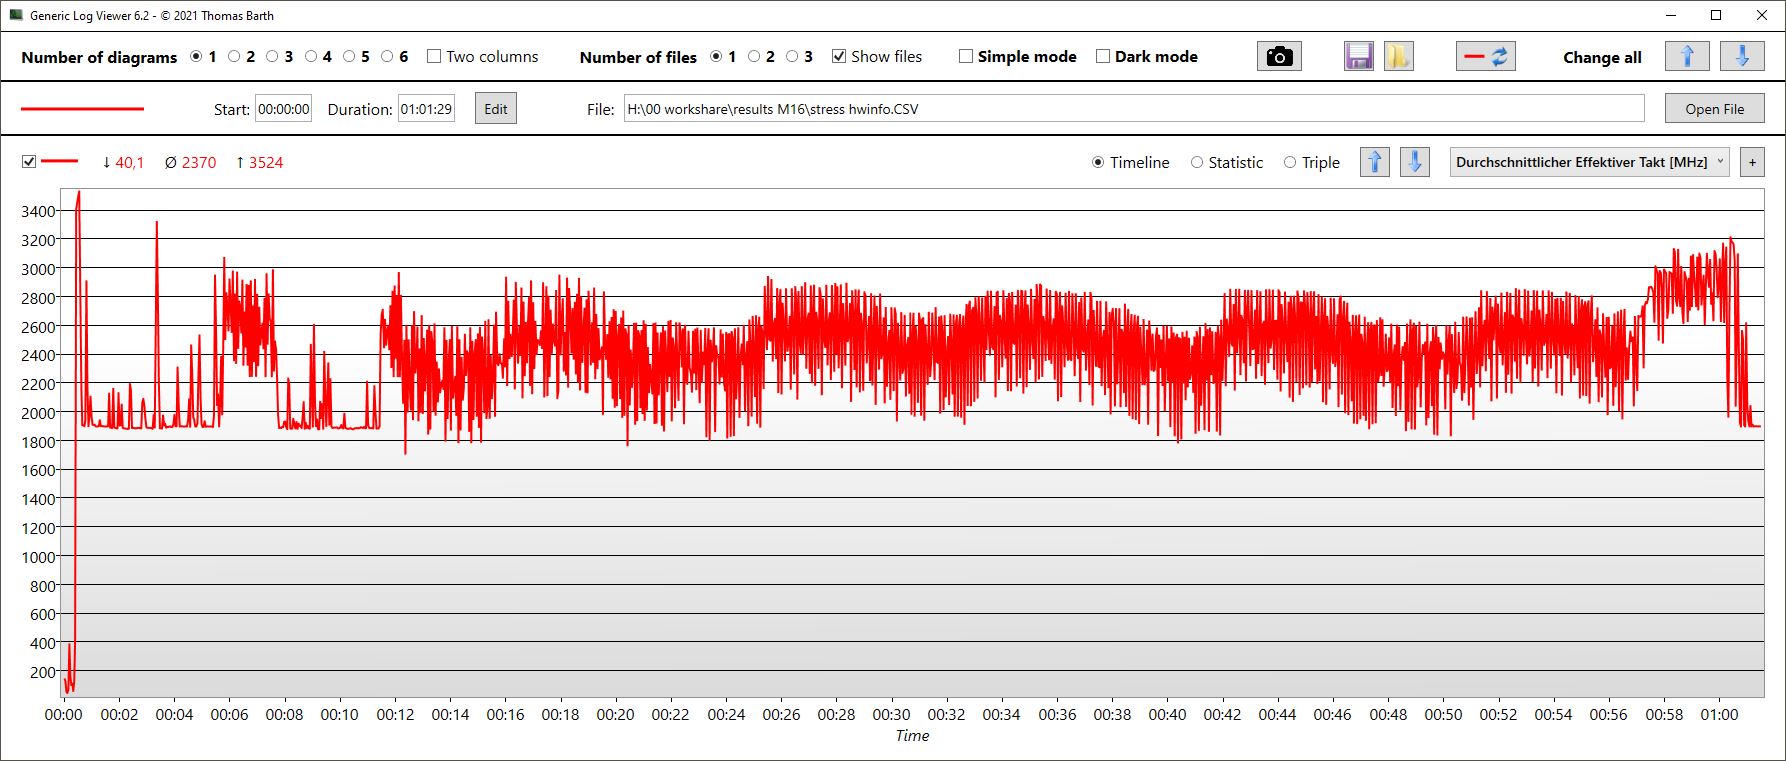
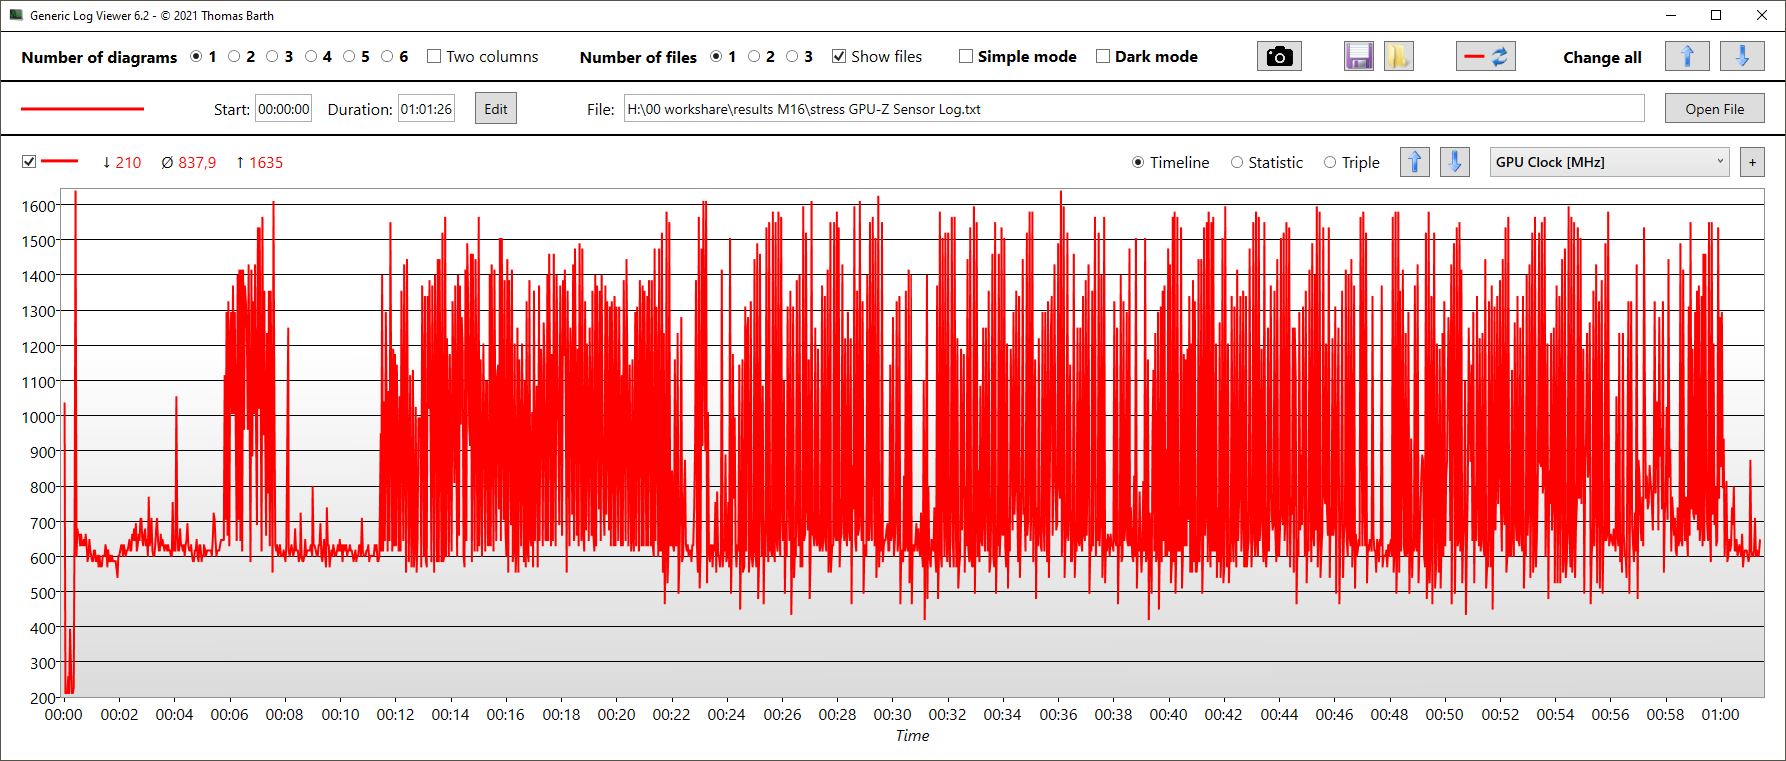
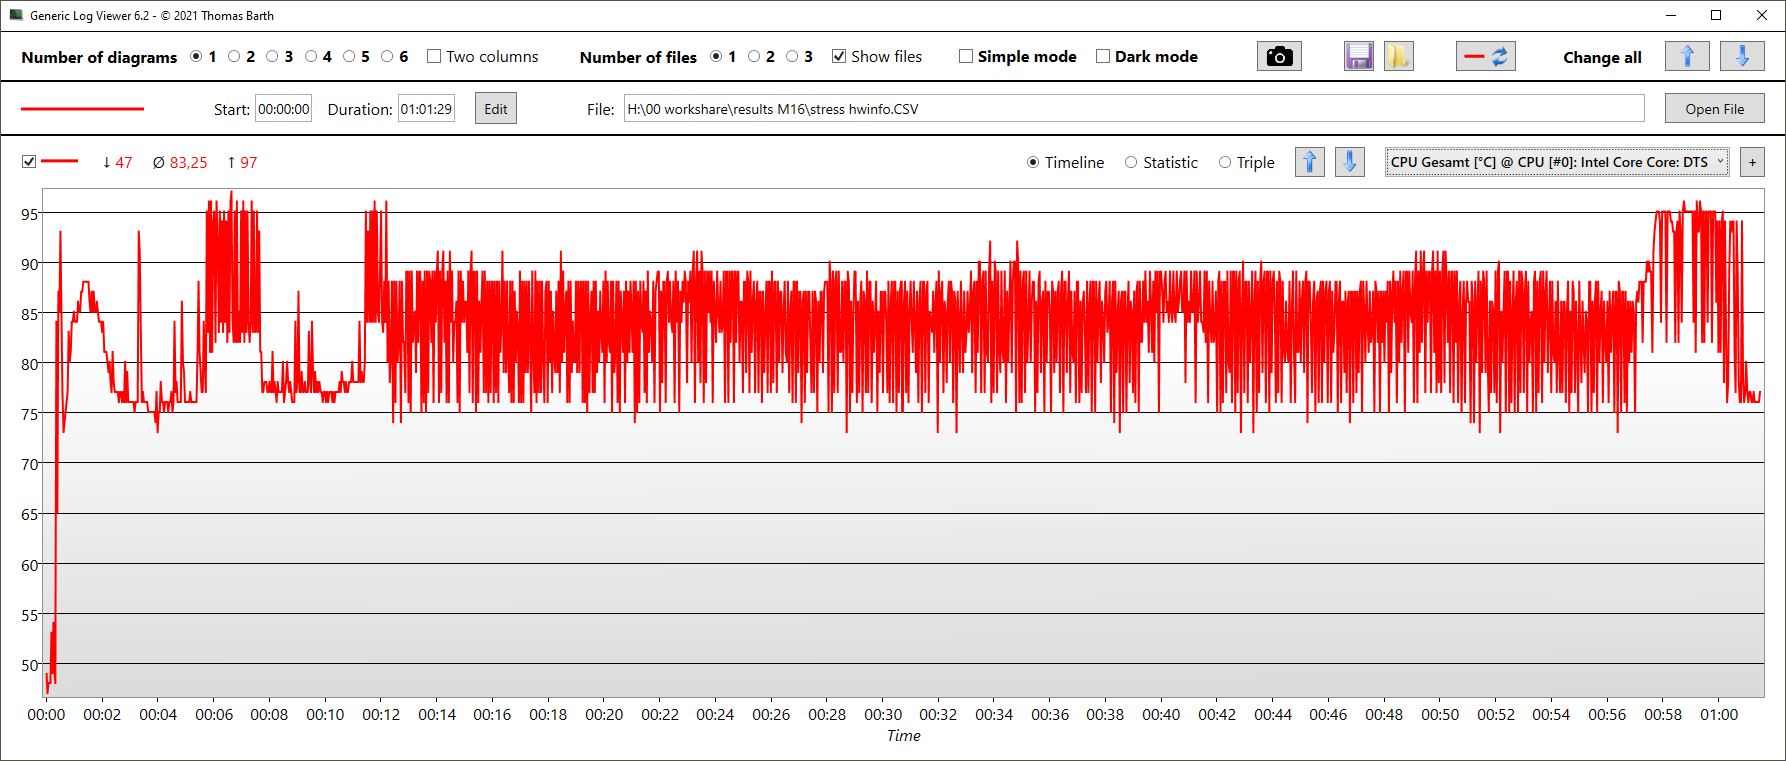
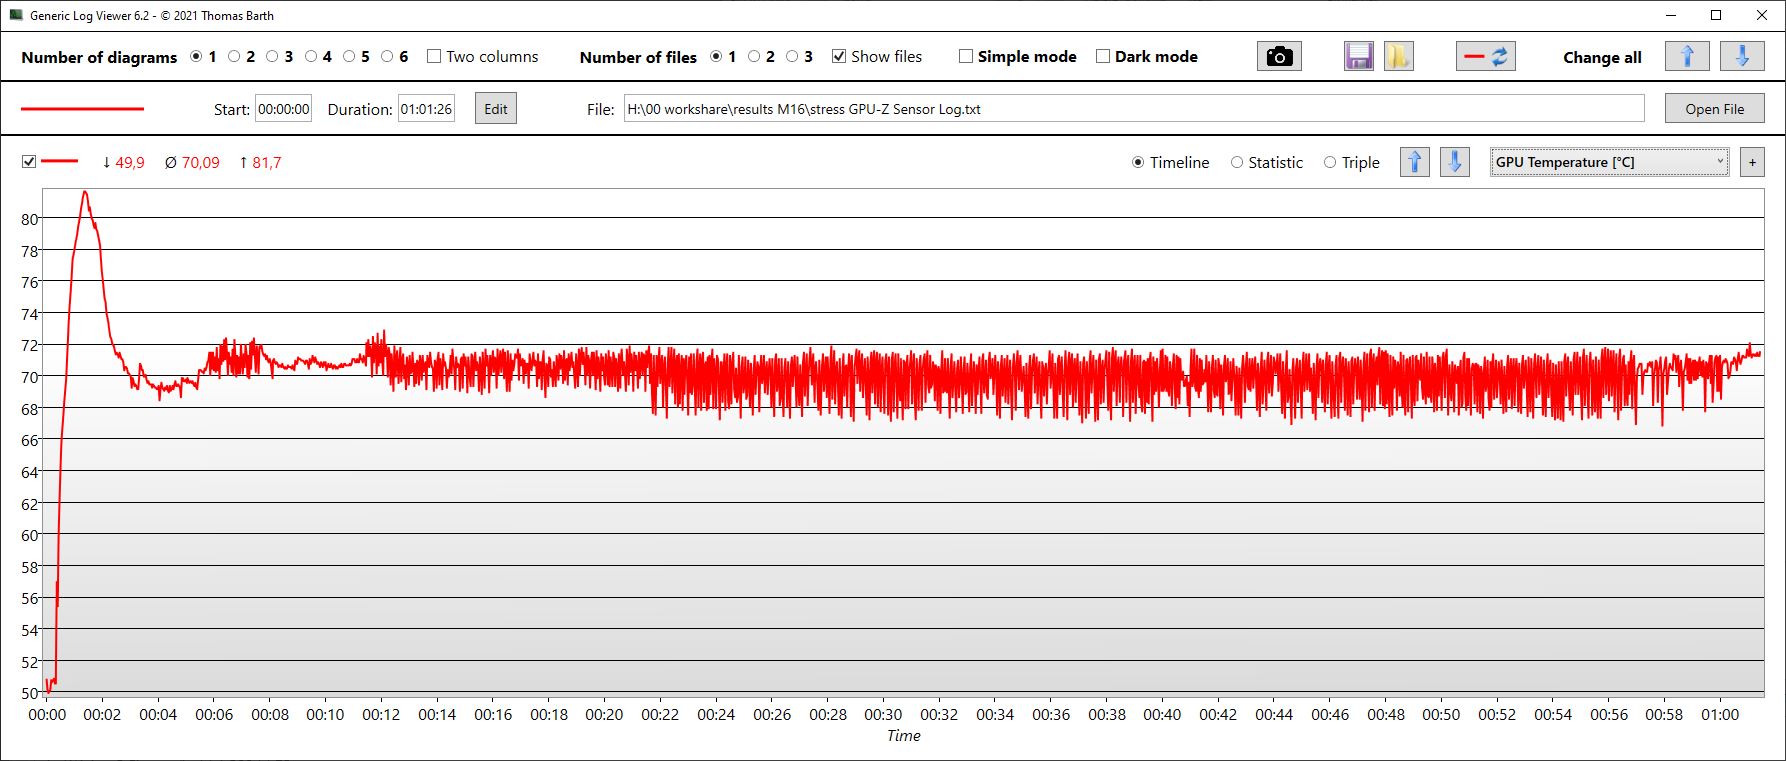
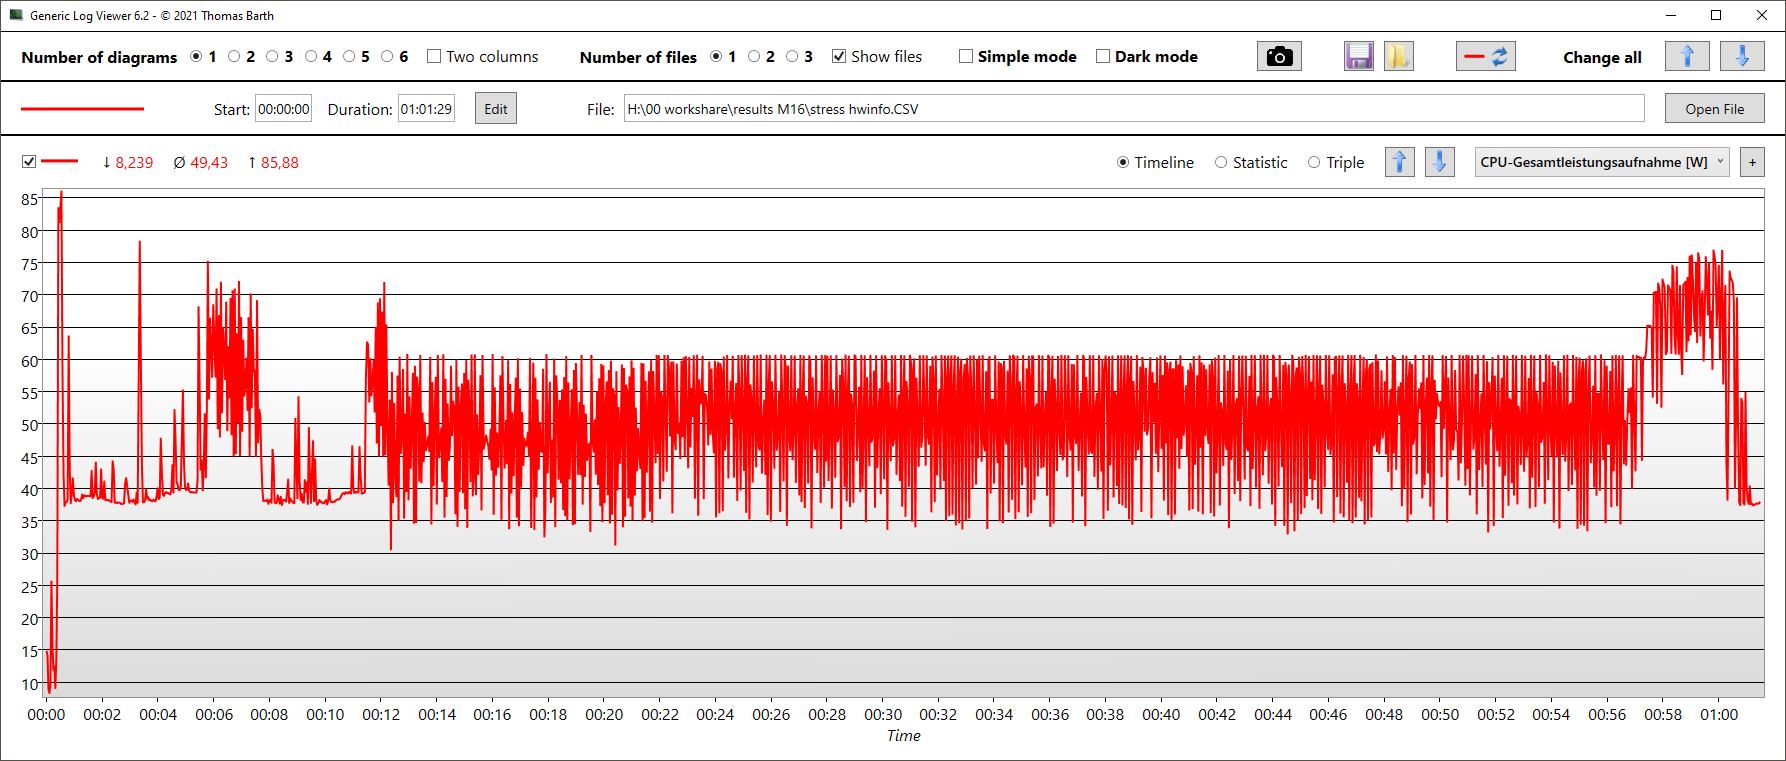
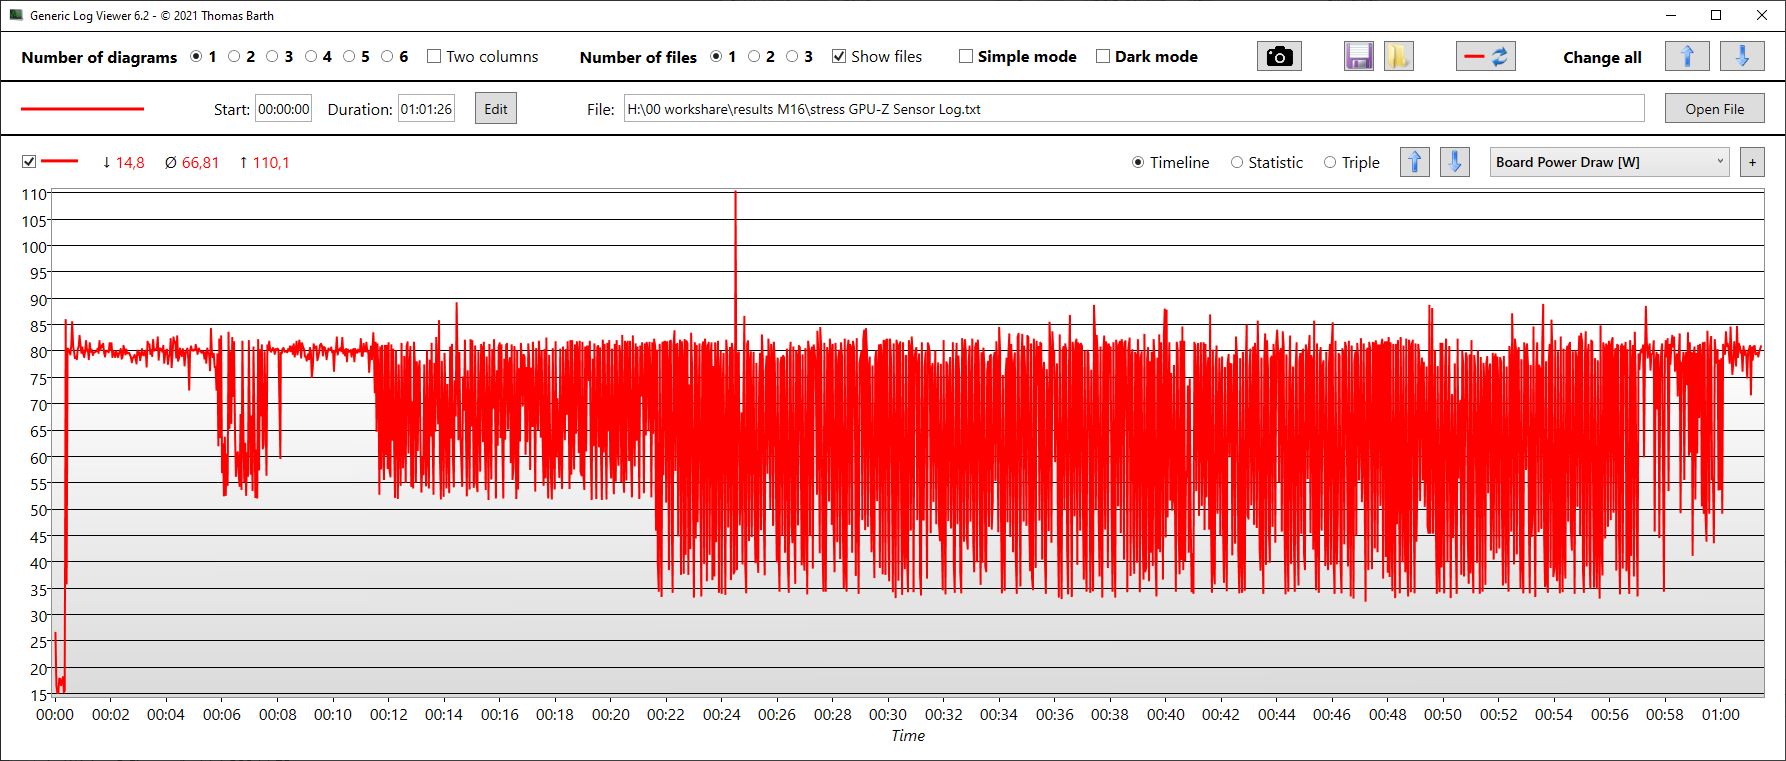
| RelojCPU (GHz) | Reloj GPU (MHz) | Temperatura mediaCPU (°C) | Temperatura media GPU (°C) | |
| Prime95 + FurMark Stress | 2,4 | 838 | 83 | 70 |
| El Witcher 3 Stress | 1,1 | 1.288 | 68 | 72 |
Altavoces
Asus toma un camino especial con los altavoces del M16: En lugar de los habituales altavoces estéreo, el fabricante usa cuatro altavoces de 2 W cada uno, dos para las frecuencias altas y dos para los tonos bajos. Esto se nota bastante, y los altavoces no sólo son relativamente altos, sino que también ofrecen medios y agudos equilibrados, e incluso los graves no están tan poco representados como en muchos competidores.
Sin embargo, siguen sin poder sustituir a unos altavoces externos medianamente decentes. Para la conexión de dispositivos de audio analógicos, se puede utilizar un puerto de audio combinado.
Asus ROG Zephyrus M16 GU603Z análisis de audio
(+) | los altavoces pueden reproducir a un volumen relativamente alto (#82.96 dB)
Graves 100 - 315 Hz
(±) | lubina reducida - en promedio 11.6% inferior a la mediana
(±) | la linealidad de los graves es media (9.2% delta a frecuencia anterior)
Medios 400 - 2000 Hz
(+) | medios equilibrados - a sólo 4.3% de la mediana
(+) | los medios son lineales (5.7% delta a la frecuencia anterior)
Altos 2 - 16 kHz
(+) | máximos equilibrados - a sólo 1.6% de la mediana
(+) | los máximos son lineales (3.9% delta a la frecuencia anterior)
Total 100 - 16.000 Hz
(+) | el sonido global es lineal (10.1% de diferencia con la mediana)
En comparación con la misma clase
» 5% de todos los dispositivos probados de esta clase eran mejores, 2% similares, 93% peores
» El mejor tuvo un delta de 6%, la media fue 18%, el peor fue ###max##%
En comparación con todos los dispositivos probados
» 5% de todos los dispositivos probados eran mejores, 2% similares, 94% peores
» El mejor tuvo un delta de 4%, la media fue 23%, el peor fue ###max##%
Lenovo Legion 5 Pro 16ARH7H RTX 3070 Ti análisis de audio
(±) | la sonoridad del altavoz es media pero buena (72.5 dB)
Graves 100 - 315 Hz
(-) | casi sin bajos - de media 22.3% inferior a la mediana
(-) | los graves no son lineales (15.4% delta a la frecuencia anterior)
Medios 400 - 2000 Hz
(±) | medias más altas - de media 7.1% más altas que la mediana
(±) | la linealidad de los medios es media (9.5% delta respecto a la frecuencia anterior)
Altos 2 - 16 kHz
(+) | máximos equilibrados - a sólo 1.9% de la mediana
(+) | los máximos son lineales (3.6% delta a la frecuencia anterior)
Total 100 - 16.000 Hz
(-) | el sonido global no es lineal (30.3% de diferencia con la mediana)
En comparación con la misma clase
» 96% de todos los dispositivos probados de esta clase eran mejores, 2% similares, 3% peores
» El mejor tuvo un delta de 6%, la media fue 18%, el peor fue ###max##%
En comparación con todos los dispositivos probados
» 89% de todos los dispositivos probados eran mejores, 3% similares, 9% peores
» El mejor tuvo un delta de 4%, la media fue 23%, el peor fue ###max##%
Gestión de la energía: eficiente cuando se juega, pero incoherente en reposo
Consumo de energía
Por desgracia, el consumo en reposo varía mucho y llega a ser bastante alto, aunque el administrador de tareas no muestre ningún proceso molesto. Este también es el caso incluso tras un funcionamiento prolongado. Agradeceríamos algunas actualizaciones de drivers por parte de Asus.
Mientras juega, el consumo del M16 es sorprendentemente bajo (144 W). El Vision 16 Pro consume alrededor de un 8% más, y el más potente Legion 5 Pro ¡incluso un 45%! Teniendo en cuenta el rendimiento adicional del Legion 5, esto no es muy sorprendente, pero la magnitud de la diferencia sí lo es, ya que incluso el considerablemente más débil predecesor consumía más energía cuando jugaba.
Si seleccionamos el modo Turbo para el M16, consume 175 W mientras juega(El Witcher 3 )en lugar de 144 W (gráfico azul). Esto es un poco más que el Vision 16 Pro, pero aún menos que los 209 W del Legion 5 Pro.
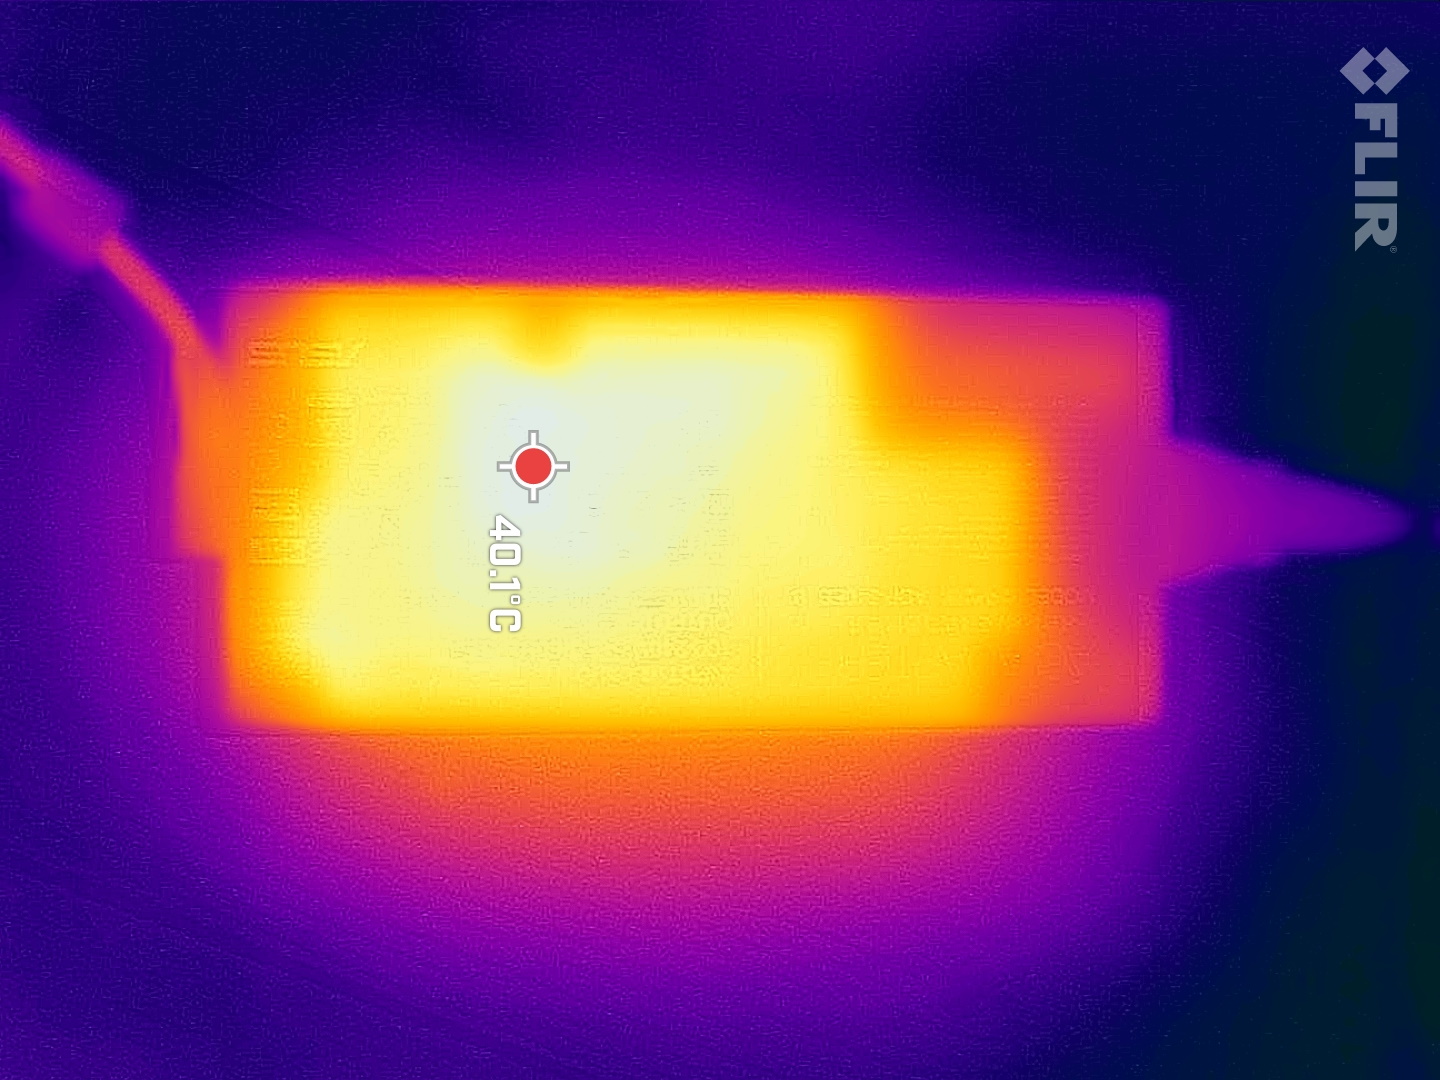
Medimos picos de carga temporales de hasta 220 W de la fuente de alimentación de 240 W, por lo que debería estar suficientemente equipada para todos los escenarios de uso.
| Off / Standby | |
| Ocioso | |
| Carga |
|
Clave:
min: | |
| Asus ROG Zephyrus M16 GU603Z i9-12900H, GeForce RTX 3070 Ti Laptop GPU, Micron 3400 1TB MTFDKBA1T0TFH, IPS, 2560x1600, 16" | Asus ROG Zephyrus M16 GU603H i9-11900H, GeForce RTX 3070 Laptop GPU, Samsung PM9A1 MZVL22T0HBLB, IPS, 2560x1600, 16" | Schenker Vision 16 Pro RTX 3070 Ti i7-12700H, GeForce RTX 3070 Ti Laptop GPU, Samsung SSD 980 Pro 1TB MZ-V8P1T0BW, IPS, 2560x1600, 16" | Lenovo Legion 5 Pro 16ARH7H RTX 3070 Ti R7 6800H, GeForce RTX 3070 Ti Laptop GPU, Samsung PM9A1 MZVL21T0HCLR, IPS, 2560x1600, 16" | Schenker XMG Focus 16 (i7-12700H, RTX 3060) i7-12700H, GeForce RTX 3060 Laptop GPU, Samsung SSD 980 Pro 1TB MZ-V8P1T0BW, IPS, 2560x1600, 16" | Corsair Voyager a1600 R9 6900HS, Radeon RX 6800M, Samsung PM9A1 MZVL22T0HBLB, IPS, 2560x1600, 16" | Medio NVIDIA GeForce RTX 3070 Ti Laptop GPU | Media de la clase Gaming | |
|---|---|---|---|---|---|---|---|---|
| Power Consumption | -14% | 14% | -30% | -16% | -32% | -23% | -17% | |
| Idle Minimum * (Watt) | 10.8 | 11 -2% | 9 17% | 9.7 10% | 14.7 -36% | 16.9 -56% | 14.2 ? -31% | 13 ? -20% |
| Idle Average * (Watt) | 17 | 20 -18% | 13.3 22% | 14.8 13% | 18.6 -9% | 20.3 -19% | 19.9 ? -17% | 19 ? -12% |
| Idle Maximum * (Watt) | 17.8 | 30 -69% | 14.3 20% | 45.8 -157% | 21.2 -19% | 22.2 -25% | 26.2 ? -47% | 24.6 ? -38% |
| Load Average * (Watt) | 116 | 111 4% | 107 8% | 87.2 25% | 121 -4% | 133.4 -15% | 125.8 ? -8% | 110.7 ? 5% |
| Witcher 3 ultra * (Watt) | 144 | 156 -8% | 155.2 -8% | 209 -45% | 174 -21% | 206 -43% | ||
| Load Maximum * (Watt) | 220 | 197 10% | 172 22% | 275.3 -25% | 235 -7% | 248 ? -13% | 259 ? -18% |
* ... más pequeño es mejor
Power Consumption The Witcher 3 / Stress Test
Power Consumption with External Monitor
Duración de la batería
Asus no lista ningún modo de ahorro de energía real en las opciones de rendimiento. Si desconectas el enchufe, el M16 cambia automáticamente al modo silencioso.
La capacidad de la batería es de 90 Wh, que es decente en comparación. El Vision 16 Pro y el Legion 5 sólo ofrecen una capacidad de 80 Wh. Esto hace que el M16 dure mucho más.
Dependiendo del brillo de la pantalla, la duración varía significativamente. En nuestra prueba WiFi, el M16 dura entre 5 horas (a brillo máximo) y unas 7,5 horas (a 150 nits).
Puedes esperar más o menos lo mismo viendo películas.
| Asus ROG Zephyrus M16 GU603Z i9-12900H, GeForce RTX 3070 Ti Laptop GPU, 90 Wh | Asus ROG Zephyrus M16 GU603H i9-11900H, GeForce RTX 3070 Laptop GPU, 90 Wh | Schenker Vision 16 Pro RTX 3070 Ti i7-12700H, GeForce RTX 3070 Ti Laptop GPU, 80 Wh | Lenovo Legion 5 Pro 16ARH7H RTX 3070 Ti R7 6800H, GeForce RTX 3070 Ti Laptop GPU, 80 Wh | Schenker XMG Focus 16 (i7-12700H, RTX 3060) i7-12700H, GeForce RTX 3060 Laptop GPU, 54 Wh | Corsair Voyager a1600 R9 6900HS, Radeon RX 6800M, 99 Wh | Media de la clase Gaming | |
|---|---|---|---|---|---|---|---|
| Duración de Batería | 9% | -14% | -41% | -18% | 3% | 6% | |
| H.264 (h) | 7.3 | 6.1 -16% | 6 -18% | 8.32 ? 14% | |||
| WiFi v1.3 (h) | 7.4 | 7.7 4% | 6 -19% | 4.4 -41% | 4.8 -35% | 5.8 -22% | 7.11 ? -4% |
| Load (h) | 1.4 | 1.6 14% | 1.3 -7% | 1.4 0% | 2.1 50% | 1.502 ? 7% | |
| Reader / Idle (h) | 13.3 | 7 | 8.27 ? |
Pro
Contra
Veredicto - Un portátil para juegos muy completo con pantalla 16:10
El Asus ROG Zephyrus M16 es un portátil de juego bien optimizado en general sin áreas problemáticas significativas. Además del muy buen rendimiento de CPU y la decente duración de batería, el gran display QHD+ de 16" en formato 16:10 también sabe cómo agradar con sus potentes contrastes y una cobertura de espacio de color bastante alta.
Teniendo en cuenta que muchos competidores carecen por completo de lector de tarjetas SD, podemos perdonar que Asus sólo use un lector de tarjetas microSD, particularmente porque el dispositivo usado aquí es bastante rápido. LaRTX 3070 Tisólo tiene un TGP de 120 W, pero esto también significa que el portátil no se calienta demasiado y los niveles de ruido también se mantienen dentro de los límites. Por otro lado, Asus podría optimizar el control del ventilador, ya que de vez en cuando, los ventiladores pueden acelerarse repentinamente hasta los 47 dB incluso en inactivo.
El M16 se presenta sobre todo como un paquete de juego completo. Aunque no ofrece el máximo rendimiento, el paquete es consistente con temperaturas y niveles de ruido moderados.
Aquellos que necesiten un mayor rendimiento pueden echar un vistazo al Lenovo Legion 5 Proo puedes simplemente activar el modo Turbo en el M16, lo que lleva a un aumento de rendimiento notable y medible aquí también.
Precio y disponibilidad
Amazon lista varias configuraciones del Asus ROG Zephyrus M16 de 2022 a partir de 2249 dólares.
Asus ROG Zephyrus M16 GU603Z
- 02/14/2023 v7 (old)
Christian Hintze
Transparencia
La selección de los dispositivos que se van a reseñar corre a cargo de nuestro equipo editorial. La muestra de prueba fue proporcionada al autor en calidad de préstamo por el fabricante o el minorista a los efectos de esta reseña. El prestamista no tuvo ninguna influencia en esta reseña, ni el fabricante recibió una copia de la misma antes de su publicación. No había ninguna obligación de publicar esta reseña. Como empresa de medios independiente, Notebookcheck no está sujeta a la autoridad de fabricantes, minoristas o editores.
Así es como prueba Notebookcheck
Cada año, Notebookcheck revisa de forma independiente cientos de portátiles y smartphones utilizando procedimientos estandarizados para asegurar que todos los resultados son comparables. Hemos desarrollado continuamente nuestros métodos de prueba durante unos 20 años y hemos establecido los estándares de la industria en el proceso. En nuestros laboratorios de pruebas, técnicos y editores experimentados utilizan equipos de medición de alta calidad. Estas pruebas implican un proceso de validación en varias fases. Nuestro complejo sistema de clasificación se basa en cientos de mediciones y puntos de referencia bien fundamentados, lo que mantiene la objetividad.Price comparison

