Intel UHD Graphics 630
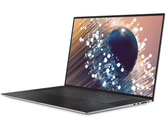
La Intel UHD Graphics 630 (GT2) es una tarjeta gráfica integrada que puede encontrarse en varios procesadores de sobremesa y portátiles de la generación Coffee-Lake. La versión "GT2" de la GPU ofrece 24 unidades de ejecución (UE) y los relojes dependen del modelo de CPU. Debido a su falta de memoria gráfica dedicada o caché eDRAM, la UHD 630 debe acceder a la memoria principal (2x DDR3L-1600 / DDR4-2133 de 64 bits). En comparación con la antigua HD Graphics 630 (Kaby-Lake), la nueva GPU UHD es idéntica pero puede tener una velocidad de reloj ligeramente superior.
El rendimiento exacto de la UHD Graphics 630 depende de varios factores como el TDP, la caché L3, la memoria (DDR3/DDR4) y la frecuencia de reloj máxima del modelo específico. Sin embargo, debería ser bastante similar a la HD Graphics 530 y la HD Graphics 630 y, por tanto, solo es adecuada para juegos poco exigentes como Overwatch o Farming Simulator 2017 (detalles bajos).
Las características de la UHD 630 son las mismas que las de la HD 630 y, por tanto, el perfil de profundidad de color H.265/HEVC Main10 de 10 bits es compatible con el hardware. Además, el HDCP 2.2 es compatible en todos los chips, lo que permite, por ejemplo, los vídeos 4K de Netflix. Sin embargo, HDMI 2.0 sólo es compatible con un chip conversor externo (LSPCon).
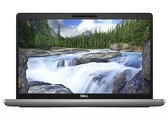
La UHD Graphics 630 se puede encontrar en varios procesadores para portátiles y ordenadores de sobremesa de diferentes clases de TDP (35 - 91 W).
Gen. 9.5 Serie Nombre Código Kaby-Lake-H-GT2 Arquitectura Gen. 9.5 Pipelines 24 - unificado Velocidad del núcleo 300 - 1150 (Boost) MHz Ancho de Bus de Memoria 64/128 Bit Memoria Compartida si API DirectX 12_1, OpenGL 4.4 tecnología 14 nm Características QuickSync Fecha de Anuncio 01.10.2017
CPU in UHD Graphics 630 GPU Base Speed GPU Boost / Turbo Intel Core i9-10900K 10 x 3700 MHz, 125 W ? MHz ? MHz Intel Core i9-10850K 10 x 3600 MHz, 125 W ? MHz ? MHz Intel Core i9-10910 10 x 3600 MHz, 125 W ? MHz ? MHz » show 42 more Intel Core i9-9900KS 8 x 4000 MHz, 127 W 350 MHz 1200 MHz Intel Core i7-10700K 8 x 3800 MHz, 125 W ? MHz ? MHz Intel Core i9-9900K 8 x 3600 MHz, 95 W 350 MHz 1200 MHz Intel Core i7-10700 8 x 2900 MHz, 65 W 350 MHz 1200 MHz Intel Core i9-10980HK 8 x 2400 MHz, 45 W 350 MHz 1250 MHz Intel Core i9-10885H 8 x 2400 MHz, 45 W 350 MHz 1200 MHz Intel Core i9-10880H 8 x 2300 MHz, 45 W 350 MHz 1200 MHz Intel Core i7-10875H 8 x 2300 MHz, 45 W 350 MHz 1200 MHz Intel Core i9-9980HK 8 x 2400 MHz, 45 W 350 MHz 1250 MHz Intel Core i7-10870H 8 x 2200 MHz, 45 W 350 MHz 1200 MHz Intel Core i7-9700K 8 x 3600 MHz, 95 W 350 MHz 1200 MHz Intel Core i5-10600K 6 x 4100 MHz, 125 W ? MHz ? MHz Intel Core i9-9880H 8 x 2300 MHz, 45 W 350 MHz 1200 MHz Intel Core i7-8086K 6 x 3700 MHz, 95 W 350 MHz 1200 MHz Intel Core i7-8700K 6 x 3700 MHz, 95 W 350 MHz 1200 MHz Intel Core i7-9700 8 x 3000 MHz, 65 W 350 MHz 1200 MHz Intel Core i9-8950HK 6 x 2900 MHz, 45 W 350 MHz 1200 MHz Intel Xeon E-2186M 6 x 2900 MHz, 45 W 350 MHz ? MHz Intel Core i7-8700 6 x 3200 MHz, 65 W 350 MHz 1200 MHz Intel Core i5-9600K 6 x 3700 MHz, 95 W 350 MHz 1150 MHz Intel Core i9-9900T 8 x 2100 MHz, 35 W 350 MHz 1200 MHz Intel Core i7-9850H 6 x 2600 MHz, 45 W 350 MHz 1150 MHz Intel Core i7-9750H 6 x 2600 MHz, 45 W 350 MHz 1150 MHz Intel Core i7-10850H 6 x 2700 MHz, 45 W 350 MHz 1150 MHz Intel Core i7-10750H 6 x 2600 MHz, 45 W 350 MHz 1150 MHz Intel Xeon E-2176M 6 x 2700 MHz, 45 W 350 MHz ? MHz Intel Core i5-10500H 6 x 2500 MHz, 45 W 350 MHz 1050 MHz Intel Core i7-8850H 6 x 2600 MHz, 45 W 350 MHz 1150 MHz Intel Core i5-8600K 6 x 3600 MHz, 95 W 350 MHz 1150 MHz Intel Core i5-8500 6 x 3000 MHz, 65 W 350 MHz 1100 MHz Intel Core i7-8750H 6 x 2200 MHz, 45 W 350 MHz 1100 MHz Intel Core i5-8400 6 x 2800 MHz, 65 W 350 MHz 1050 MHz Intel Core i5-10400H 4 x 2600 MHz, 45 W 350 MHz 1100 MHz Intel Core i3-10320 4 x 3800 MHz, 65 W 350 MHz 1150 MHz Intel Core i5-10300H 4 x 2500 MHz, 45 W 350 MHz 1050 MHz Intel Core i5-8500T 6 x 2100 MHz, 35 W 350 MHz 1100 MHz Intel Core i5-9400H 4 x 2500 MHz, 45 W 350 MHz 1100 MHz Intel Core i5-10200H 4 x 2400 MHz, 45 W 350 MHz 1050 MHz Intel Core i5-9300H 4 x 2400 MHz, 45 W 350 MHz 1050 MHz Intel Core i5-8400H 4 x 2500 MHz, 45 W 350 MHz 1100 MHz Intel Core i5-8300H 4 x 2300 MHz, 45 W 350 MHz 1000 MHz Intel Core i3-8100H 4 x 3000 MHz, 45 W 350 MHz 1000 MHz min. - max. 350 MHz 1000 - 1250 MHz
Benchmarks Performance Rating - 3DMark 11 + Fire Strike + Time Spy
4.9 pt (5%)
...
AMD Radeon R6 M340DX -4%
Intel UHD Graphics G1 (Ice Lake 32 EU) 0%
...
3DMark - 3DMark Time Spy Score
min: 425 de promedio: 474.5 mediana: 479.5 (2%) max: 534 Points
...
Intel HD Graphics 630 -10%
Intel UHD Graphics Xe 16EUs (Tiger Lake-H) -9%
Intel UHD Graphics G1 (Ice Lake 32 EU) 1%
AMD Radeon R7 M445 12%
...
3DMark - 3DMark Time Spy Graphics
min: 367 de promedio: 409.5 mediana: 414.5 (2%) max: 459 Points
...
Intel UHD Graphics G7 (Lakefield GT2 64 EU) -15%
Intel HD Graphics 630 -10%
Intel UHD Graphics Xe 16EUs (Tiger Lake-H) -9%
Intel UHD Graphics G1 (Ice Lake 32 EU) 2%
AMD Radeon R7 M445 15%
...
3DMark - 3DMark Ice Storm Unlimited Graphics
min: 37815 de promedio: 97120 mediana: 106362 (14%) max: 122355 Points
...
Intel UHD Graphics G7 (Lakefield GT2 64 EU) -10%
Intel HD Graphics 630 -2%
Intel UHD Graphics G1 (Ice Lake 32 EU) 0%
Intel UHD Graphics Xe G4 48EUs 0%
AMD Radeon RX Vega 10 19%
AMD Radeon RX Vega 8 (Ryzen 2000/3000) 21%
...
3DMark - 3DMark Ice Storm Extreme Graphics
min: 19075 de promedio: 40640 mediana: 45176 (6%) max: 48377 Points
...
AMD Radeon R5 (Bristol Ridge) -9%
NVIDIA GeForce GTX 1050 Ti Max-Q -2%
AMD Radeon R6 M340DX -1%
Intel UHD Graphics G1 (Ice Lake 32 EU) 5%
...
NVIDIA GeForce RTX 3080 Laptop GPU 922%
3DMark - 3DMark Cloud Gate Score
min: 3712 de promedio: 9196 mediana: 9545 (12%) max: 11286 Points
...
Intel HD Graphics 630 -7%
Intel UHD Graphics Xe G4 48EUs -5%
Intel UHD Graphics G1 (Ice Lake 32 EU) -4%
NVIDIA Quadro P500 1%
AMD Radeon RX Vega 10 10%
...
3DMark - 3DMark Cloud Gate Graphics
min: 3863 de promedio: 9333 mediana: 9798 (4%) max: 11199 Points
...
AMD Radeon R6 M340DX -4%
Intel HD Graphics 630 0%
AMD Radeon R7 M445 3%
Intel UHD Graphics Xe 16EUs (Tiger Lake-H) 8%
Intel UHD Graphics G1 (Ice Lake 32 EU) 16%
...
3DMark - 3DMark Fire Strike Standard Score
min: 779 de promedio: 1143 mediana: 1115 (3%) max: 1355 Points
...
AMD Radeon R5 (Bristol Ridge) -8%
AMD Radeon R7 M340 2%
AMD Radeon R6 M340DX 2%
Intel UHD Graphics G7 (Lakefield GT2 64 EU) 4%
...
3DMark - 3DMark Fire Strike Standard Graphics
min: 722 de promedio: 1228 mediana: 1211 (2%) max: 1472 Points
...
AMD Radeon R5 (Bristol Ridge) 5%
Intel UHD Graphics G7 (Lakefield GT2 64 EU) 6%
...
3DMark - 3DMark Ice Storm Graphics
min: 43334 de promedio: 63184 mediana: 68228 (9%) max: 74772 Points
...
NVIDIA GeForce RTX 3050 Laptop GPU -2%
Intel UHD Graphics Xe G4 48EUs -1%
AMD Radeon RX 560X (Laptop) -1%
...
3DMark - 3DMark Night Raid
6929 Points (8%)
...
Intel UHD Graphics 615 -57%
Intel UHD Graphics G7 (Lakefield GT2 64 EU) -47%
Intel UHD Graphics 617 -46%
Intel UHD Graphics G1 (Ice Lake 32 EU) -16%
AMD Radeon RX Vega 8 (Ryzen 2000/3000) 10%
Intel UHD Graphics Xe G4 48EUs 11%
AMD Radeon RX Vega 10 17%
Intel Iris Plus Graphics G7 (Ice Lake 64 EU) 18%
Intel Iris Plus Graphics G4 (Ice Lake 48 EU) 19%
AMD Radeon RX Vega 7 79%
...
NVIDIA GeForce RTX 3070 Laptop GPU 651%
3DMark - 3DMark Night Raid Graphics Score
6446 Points (4%)
...
Intel UHD Graphics 615 -47%
Intel UHD Graphics 617 -30%
Intel UHD Graphics G7 (Lakefield GT2 64 EU) -26%
Intel UHD Graphics G1 (Ice Lake 32 EU) -2%
AMD Radeon RX Vega 8 (Ryzen 2000/3000) 39%
Intel Iris Plus Graphics G4 (Ice Lake 48 EU) 42%
Intel Iris Plus Graphics G7 (Ice Lake 64 EU) 44%
AMD Radeon RX Vega 10 51%
Intel UHD Graphics Xe G4 48EUs 66%
Intel UHD Graphics Xe 32EUs (Tiger Lake-H) 77%
...
3DMark 11 - 3DM11 Performance Score
min: 790 de promedio: 1990 mediana: 2030 (4%) max: 2326 Points
...
AMD Radeon R7 M260 -2%
Qualcomm Adreno 685 -1%
Intel UHD Graphics Xe 16EUs (Tiger Lake-H) -1%
...
3DMark 11 - 3DM11 Performance GPU
min: 642 de promedio: 1742 mediana: 1789.5 (3%) max: 2025 Points
...
Intel HD Graphics 630 -3%
AMD Radeon R5 (Bristol Ridge) -2%
AMD Radeon R5 (Carrizo) -2%
Intel UHD Graphics G7 (Lakefield GT2 64 EU) 3%
...
3DMark Vantage 3DM Vant. Perf. total + 3DMark Vantage - 3DM Vant. Perf. total
7704 Points (2%)
...
Intel UHD Graphics Xe 16EUs (Tiger Lake-H) -1%
Intel HD Graphics 630 0%
...
3DM Vant. Perf. GPU no PhysX + 3DMark Vantage - 3DM Vant. Perf. GPU no PhysX
6111 Points (5%)
...
Intel UHD Graphics Xe 16EUs (Tiger Lake-H) -2%
AMD Radeon R7 M445 -2%
Intel HD Graphics 630 2%
...
3DMark 06 3DMark 06 - Standard 1280x1024 +
min: 11920 de promedio: 13425 mediana: 13216.5 (20%) max: 15020 Points
...
AMD Radeon RX Vega 9 0%
AMD Radeon RX Vega 8 (Ryzen 2000/3000) 0%
...
Unigine Valley 1.0 - Unigine Valley 1.0 DX
min: 5.7 de promedio: 6.1 mediana: 6.1 (3%) max: 6.4 fps
Intel HD Graphics (Cherry Trail) -80%
...
Intel HD Graphics 630 -12%
AMD Radeon R7 M445 9%
AMD Radeon RX Vega 10 16%
AMD FirePro W4190M 20%
...
NVIDIA GeForce RTX 3070 Laptop GPU 2075%
Unigine Heaven 3.0 - Unigine Heaven 3.0 DX 11
18.9 fps (6%)
...
AMD Radeon R6 M340DX -3%
Intel HD Graphics 630 -1%
...
SPECviewperf 12 specvp12 sw-03 + SPECviewperf 12 - specvp12 sw-03
min: 28.56 de promedio: 28.8 mediana: 28.8 (13%) max: 29.03 fps
...
AMD Radeon Pro WX 3100 0%
AMD FirePro W4190M 7%
AMD FirePro W5130M 11%
...
specvp12 snx-02 + SPECviewperf 12 - specvp12 snx-02
min: 3.14 de promedio: 3.3 mediana: 3.3 (1%) max: 3.37 fps
...
...
specvp12 showcase-01 + SPECviewperf 12 - specvp12 showcase-01
min: 7.98 de promedio: 8.2 mediana: 8.2 (3%) max: 8.38 fps
...
AMD Radeon Pro WX 3100 -24%
AMD FirePro W4190M -7%
AMD Radeon RX Vega 10 39%
...
specvp12 mediacal-01 + SPECviewperf 12 - specvp12 mediacal-01
min: 2.96 de promedio: 3.1 mediana: 3.1 (2%) max: 3.32 fps
...
AMD Radeon Pro WX 3100 23%
...
specvp12 maya-04 + SPECviewperf 12 - specvp12 maya-04
min: 14.66 de promedio: 15.2 mediana: 15.2 (5%) max: 15.67 fps
...
NVIDIA Quadro P500 -7%
AMD FirePro W4190M 9%
NVIDIA Quadro P520 38%
...
specvp12 energy-01 + SPECviewperf 12 - specvp12 energy-01
min: 0.29 de promedio: 0.3 mediana: 0.3 (1%) max: 0.32 fps
...
AMD Radeon Pro WX 3100 -7%
AMD Radeon Pro 555 5%
AMD FirePro W4190M 23%
AMD FirePro W5130M 25%
...
specvp12 creo-01 + SPECviewperf 12 - specvp12 creo-01
min: 13.57 de promedio: 14 mediana: 14 (8%) max: 14.51 fps
...
AMD Radeon RX Vega 10 16%
AMD FirePro W4190M 20%
AMD Radeon Pro WX 3100 28%
...
specvp12 catia-04 + SPECviewperf 12 - specvp12 catia-04
min: 15.36 de promedio: 16 mediana: 16 (5%) max: 16.61 fps
...
AMD Radeon Pro WX 3100 1%
AMD FirePro W4190M 15%
...
specvp12 3dsmax-05 + SPECviewperf 12 - specvp12 3dsmax-05
min: 11.27 de promedio: 12.6 mediana: 12.6 (3%) max: 14 fps
AMD Radeon RX Vega 10 95%
NVIDIA Quadro P520 97%
AMD Radeon Pro 455 109%
AMD Radeon Pro 555 111%
...
NVIDIA GeForce RTX 3070 Laptop GPU 1743%
SPECviewperf 13 specvp13 sw-04 + SPECviewperf 13 - specvp13 sw-04
min: 35.74 de promedio: 36.9 mediana: 36.9 (17%) max: 37.96 fps
Intel Iris Plus Graphics G7 (Ice Lake 64 EU) -81%
AMD Radeon RX Vega 10 -54%
NVIDIA Quadro P520 54%
AMD Radeon RX Vega 7 55%
...
specvp13 snx-03 + SPECviewperf 13 - specvp13 snx-03
min: 5.64 de promedio: 5.9 mediana: 5.9 (1%) max: 6.07 fps
Intel Iris Plus Graphics G7 (Ice Lake 64 EU) -52%
...
specvp13 showcase-02 + SPECviewperf 13 - specvp13 showcase-02
min: 7.91 de promedio: 8.1 mediana: 8.1 (3%) max: 8.34 fps
AMD Radeon RX Vega 10 18%
Intel Iris Plus Graphics G7 (Ice Lake 64 EU) 22%
NVIDIA Quadro P520 72%
AMD Radeon RX Vega 7 90%
...
specvp13 medical-02 + SPECviewperf 13 - specvp13 medical-02
min: 2.13 de promedio: 2.2 mediana: 2.2 (1%) max: 2.28 fps
Intel Iris Plus Graphics G7 (Ice Lake 64 EU) 95%
AMD Radeon RX Vega 10 234%
NVIDIA Quadro P600 389%
...
specvp13 maya-05 + SPECviewperf 13 - specvp13 maya-05
min: 21.35 de promedio: 22.2 mediana: 22.2 (4%) max: 23.03 fps
Intel Iris Plus Graphics G7 (Ice Lake 64 EU) -10%
...
Intel Iris Plus Graphics G7 (Ice Lake 64 EU) -10%
AMD Radeon RX Vega 10 7%
NVIDIA Quadro P520 77%
AMD Radeon RX Vega 7 102%
...
specvp13 energy-02 + SPECviewperf 13 - specvp13 energy-02
0.8 fps (1%)
AMD Radeon RX Vega 10 -28%
AMD Radeon RX Vega 7 17%
AMD Radeon RX 5300M 44%
NVIDIA Quadro P520 251%
...
specvp13 creo-02 + SPECviewperf 13 - specvp13 creo-02
min: 17.54 de promedio: 18.2 mediana: 18.2 (5%) max: 18.83 fps
Intel Iris Plus Graphics G7 (Ice Lake 64 EU) -91%
AMD Radeon RX Vega 10 22%
NVIDIA Quadro P520 107%
...
specvp13 catia-05 + SPECviewperf 13 - specvp13 catia-05
min: 21.7 de promedio: 22.5 mediana: 22.5 (5%) max: 23.36 fps
Intel Iris Plus Graphics G7 (Ice Lake 64 EU) 11%
AMD Radeon RX Vega 10 17%
NVIDIA Quadro P520 99%
...
specvp13 3dsmax-06 + SPECviewperf 13 - specvp13 3dsmax-06
min: 14 de promedio: 14.5 mediana: 14.5 (4%) max: 14.98 fps
Intel Iris Plus Graphics G7 (Ice Lake 64 EU) 28%
AMD Radeon RX Vega 10 70%
NVIDIA Quadro P520 89%
...
Cinebench R10 Cinebench R10 Shading (32bit) + Cinebench R10 - Cinebench R10 Shading (32bit)
min: 6430 de promedio: 8262 mediana: 8164 (35%) max: 10037 puntos
...
AMD Radeon RX Vega 8 (Ryzen 2000/3000) -4%
AMD Radeon Pro WX 3100 3%
...
Cinebench R11.5 Cinebench R11.5 OpenGL 64 Bit + Cinebench R11.5 - Cinebench R11.5 OpenGL 64 Bit
min: 42.77 de promedio: 46.8 mediana: 46.9 (17%) max: 50.6 fps
...
AMD Radeon RX Vega 9 0%
NVIDIA GeForce GTX 1050 Max-Q 1%
...
Cinebench R15 Cinebench R15 OpenGL 64 Bit + Cinebench R15 - Cinebench R15 OpenGL 64 Bit
min: 17 de promedio: 51.7 mediana: 54.1 (15%) max: 63.1 fps
...
Intel UHD Graphics Xe 16EUs (Tiger Lake-H) -5%
Intel HD Graphics 630 1%
Intel Iris Plus Graphics G4 (Ice Lake 48 EU) 3%
AMD Radeon RX Vega 9 6%
...
Cinebench R15 OpenGL Ref. Match 64 Bit + Cinebench R15 - Cinebench R15 OpenGL Ref. Match 64 Bit
min: 97.8 de promedio: 97.8 mediana: 97.8 (98%) max: 98 %
...
Intel UHD Graphics G1 (Ice Lake 32 EU) 0%
Intel UHD Graphics Xe G4 48EUs 0%
Intel UHD Graphics Xe 32EUs (Tiger Lake-H) 0%
Intel UHD Graphics Xe 750 32EUs (Rocket Lake) 0%
...
Basemark GPU 1.2 - Basemark GPU 1.2 Vulkan Official Medium Offscreen 1080
105 fps (9%)
...
Intel UHD Graphics Xe G4 48EUs -48%
Intel Iris Plus Graphics G7 (Ice Lake 64 EU) -3%
AMD Radeon Pro 560X 71%
LuxMark v2.0 64Bit - LuxMark v2.0 Room GPU
363 Samples/s (2%)
...
AMD Radeon RX Vega 8 (Ryzen 2000/3000) -6%
AMD Radeon 540X -6%
NVIDIA Quadro P500 -5%
Intel UHD Graphics G1 (Ice Lake 32 EU) -4%
AMD FirePro W5130M -1%
Intel Iris Pro Graphics 580 0%
...
LuxMark v2.0 64Bit - LuxMark v2.0 Sala GPU
696 Samples/s (1%)
...
AMD FirePro W5130M -10%
Intel HD Graphics 630 -7%
AMD Radeon 540X -4%
Intel UHD Graphics G1 (Ice Lake 32 EU) 7%
...
ComputeMark v2.1 - ComputeMark v2.1 Result
894 puntos (2%)
...
Intel UHD Graphics Xe 16EUs (Tiger Lake-H) -11%
Intel UHD Graphics 615 -4%
AMD FirePro W5130M 0%
AMD FirePro W4190M 1%
Intel HD Graphics 630 6%
...
Power Consumption - Furmark Stress Test Power Consumption - external Monitor *
min: 35.2 de promedio: 50.7 mediana: 54.9 (8%) max: 61.9 Watt
...
AMD Radeon Pro 455 11%
NVIDIA Quadro M600M 17%
...
0 10 20 30 40 50 60 70 80 90 100 110 Tooltip Asus Maximus XIII Hero : Ø61.9 (59-116)
- Gama de valores de las pruebas para esta tarjeta gráfica
- Valores medios de las pruebas para esta tarjeta gráfica
* Smaller numbers mean a higher performance
Pruebas de juegos Los siguientes benchmarks se derivan de nuestros benchmarks de los portátiles de análisis. El rendimiento depende de la memoria gráfica utilizada, velocidad de reloj, procesador, configuración del sistema, controladores y sistemas operativos. Así que los resultados no tienen que ser representativos de todos los portátiles con esta GPU. Para información más detallada sobre los resultados del benchmark, haga clic en el número de fps.
11.8 fps [X] Medion Erazer Beast X20 Intel Core i7-10870H 2.2GHz
UHD Graphics 630
min:
3.39 fps, P0.1:
4.05 fps, P1:
7.89 fps, max:
72.8 fps
Your browser does not support the canvas
element! fps
+ Comparar
- Ocultar comparación
Intel UHD Graphics Xe 16EUs (Tiger Lake-H) 10%
Intel UHD Graphics G1 (Ice Lake 32 EU) 16%
AMD Radeon RX Vega 8 (Ryzen 2000/3000) 44%
AMD Radeon RX Vega 10 51%
Intel UHD Graphics Xe 32EUs (Tiger Lake-H) 92%
AMD Radeon RX Vega 7 114%
...
NVIDIA GeForce RTX 3080 Laptop GPU 1430%
» No jugable la mayor parte de los portátiles probados.
Additional Benchmarks
Low Preset 1920x1080
7.9 fps [X] Medion Erazer Beast X20 Intel Core i7-10870H 2.2GHz
UHD Graphics 630
min:
2.33 fps, P0.1:
2.41 fps, P1:
5.21 fps, max:
65 fps
Your browser does not support the canvas
element!
38.5 fps [X] Medion Erazer Beast X20 Intel Core i7-10870H 2.2GHz
UHD Graphics 630
min:
13.2 fps, P0.1:
16.2 fps, P1:
24.3 fps, max:
74.4 fps
Your browser does not support the canvas
element! fps
+ Comparar
- Ocultar comparación
Intel UHD Graphics G1 (Ice Lake 32 EU) -33%
AMD Radeon RX Vega 10 -24%
Intel UHD Graphics Xe G4 48EUs -14%
AMD Radeon 540X 3%
AMD Radeon RX Vega 7 25%
Intel UHD Graphics Xe 32EUs (Tiger Lake-H) 49%
...
16.1 fps [X] Medion Erazer Beast X20 Intel Core i7-10870H 2.2GHz
UHD Graphics 630
min:
9.69 fps, P0.1:
10.5 fps, P1:
11.9 fps, max:
30 fps
Your browser does not support the canvas
element! fps
+ Comparar
- Ocultar comparación
Intel UHD Graphics G1 (Ice Lake 32 EU) 6%
AMD Radeon RX Vega 10 12%
AMD Radeon 540X 19%
Intel UHD Graphics Xe G4 48EUs 34%
AMD Radeon RX Vega 7 57%
Intel UHD Graphics Xe 32EUs (Tiger Lake-H) 65%
...
9.6 fps [X] Medion Erazer Beast X20 Intel Core i7-10870H 2.2GHz
UHD Graphics 630
min:
1.075 fps, P0.1:
1.502 fps, P1:
6.88 fps, max:
26.1 fps
Your browser does not support the canvas
element! fps
+ Comparar
- Ocultar comparación
NVIDIA GeForce RTX 3050 Laptop GPU 715%
...
» Jugable con todos los portátiles probados en ajustes de detalle bajo.
20.7 fps [X] Medion Erazer Beast X20 Intel Core i7-10870H 2.2GHz
UHD Graphics 630
min:
1.589 fps, P0.1:
2.12 fps, P1:
7.07 fps, max:
63.8 fps
Your browser does not support the canvas
element! fps
+ Comparar
- Ocultar comparación
Intel UHD Graphics Xe 16EUs (Tiger Lake-H) 6%
Intel UHD Graphics G1 (Ice Lake 32 EU) 24%
AMD Radeon RX Vega 10 30%
AMD Radeon RX Vega 8 (Ryzen 2000/3000) 38%
...
13.2 fps [X] Medion Erazer Beast X20 Intel Core i7-10870H 2.2GHz
UHD Graphics 630
min:
8.35 fps, P0.1:
8.6 fps, P1:
9.62 fps, max:
19.8 fps
Your browser does not support the canvas
element! fps
+ Comparar
- Ocultar comparación
AMD Radeon RX Vega 10 -29%
Intel UHD Graphics Xe 16EUs (Tiger Lake-H) -2%
Intel UHD Graphics G1 (Ice Lake 32 EU) 3%
AMD Radeon RX Vega 8 (Ryzen 2000/3000) 35%
Intel UHD Graphics Xe 32EUs (Tiger Lake-H) 75%
AMD Radeon 540X 79%
...
» No jugable la mayor parte de los portátiles probados.
Additional Benchmarks
Low Preset 1920x1080
14.5 fps [X] Medion Erazer Beast X20 Intel Core i7-10870H 2.2GHz
UHD Graphics 630
min:
8.29 fps, P0.1:
8.57 fps, P1:
10 fps, max:
42.4 fps
Your browser does not support the canvas
element!
Intel UHD Graphics G1 (Ice Lake 32 EU) -3%
Intel UHD Graphics Xe 16EUs (Tiger Lake-H) 4%
Intel UHD Graphics Xe G4 48EUs 93%
AMD Radeon RX Vega 10 94%
Intel UHD Graphics Xe 32EUs (Tiger Lake-H) 95%
...
Intel UHD Graphics G1 (Ice Lake 32 EU) 4%
AMD Radeon RX Vega 10 98%
Intel UHD Graphics Xe 32EUs (Tiger Lake-H) 100%
Intel UHD Graphics Xe G4 48EUs 103%
...
» No jugable la mayor parte de los portátiles probados.
Additional Benchmarks
Minimum Settings 1920x1080
11.8 fps [X] Medion Erazer Beast X20 Intel Core i7-10870H 2.2GHz
UHD Graphics 630
Your browser does not support the canvas
element!
16 fps [X] Medion Erazer Beast X20 Intel Core i7-10870H 2.2GHz
UHD Graphics 630
min:
5.24 fps, P0.1:
5.42 fps, P1:
10.2 fps, max:
58.9 fps
Your browser does not support the canvas
element! fps
+ Comparar
- Ocultar comparación
Intel UHD Graphics G1 (Ice Lake 32 EU) 6%
AMD Radeon RX Vega 10 56%
Intel UHD Graphics Xe G4 48EUs 57%
AMD Radeon RX Vega 8 (Ryzen 2000/3000) 63%
Intel UHD Graphics Xe 32EUs (Tiger Lake-H) 83%
AMD Radeon 540X 119%
...
NVIDIA GeForce RTX 2070 Super Mobile 875%
5.7 fps [X] Medion Erazer Beast X20 Intel Core i7-10870H 2.2GHz
UHD Graphics 630
min:
1.948 fps, P0.1:
1.965 fps, P1:
3.99 fps, max:
50.4 fps
Your browser does not support the canvas
element! fps
+ Comparar
- Ocultar comparación
Intel UHD Graphics G1 (Ice Lake 32 EU) 6%
AMD Radeon RX Vega 10 63%
AMD Radeon RX Vega 8 (Ryzen 2000/3000) 65%
Intel UHD Graphics Xe G4 48EUs 67%
Intel UHD Graphics Xe 32EUs (Tiger Lake-H) 71%
AMD Radeon 540X 88%
...
» No jugable la mayor parte de los portátiles probados.
59.1 fps [X] Medion Erazer Beast X20 Intel Core i7-10870H 2.2GHz
UHD Graphics 630
min:
43.8 fps, P0.1:
45.4 fps, P1:
51.2 fps, max:
83.9 fps
Your browser does not support the canvas
element! fps
+ Comparar
- Ocultar comparación
AMD Radeon RX Vega 8 (Ryzen 2000/3000) 61%
AMD Radeon RX Vega 10 68%
Intel UHD Graphics Xe 32EUs (Tiger Lake-H) 68%
Intel Iris Plus Graphics G7 (Ice Lake 64 EU) 78%
...
29.8 fps [X] Medion Erazer Beast X20 Intel Core i7-10870H 2.2GHz
UHD Graphics 630
min:
23.2 fps, P0.1:
23.6 fps, P1:
24.5 fps, max:
42.7 fps
Your browser does not support the canvas
element! fps
+ Comparar
- Ocultar comparación
Intel UHD Graphics Xe 32EUs (Tiger Lake-H) 59%
Intel Iris Plus Graphics G7 (Ice Lake 64 EU) 85%
AMD Radeon RX Vega 10 111%
AMD Radeon RX Vega 8 (Ryzen 2000/3000) 118%
...
27.5 fps [X] Medion Erazer Beast X20 Intel Core i7-10870H 2.2GHz
UHD Graphics 630
min:
5.03 fps, P0.1:
12.4 fps, P1:
22.7 fps, max:
190 fps
Your browser does not support the canvas
element! fps
+ Comparar
- Ocultar comparación
AMD Radeon RX Vega 10 49%
Intel UHD Graphics Xe 32EUs (Tiger Lake-H) 55%
Intel Iris Plus Graphics G7 (Ice Lake 64 EU) 85%
AMD Radeon RX Vega 8 (Ryzen 2000/3000) 101%
AMD Radeon RX Vega 7 189%
...
NVIDIA GeForce RTX 2080 Super Mobile 911%
» Jugable con todos los portátiles probados en ajustes de detalle bajo.
31.9 fps [X] Medion Erazer Beast X20 Intel Core i7-10870H 2.2GHz
UHD Graphics 630
min:
3.49 fps, P0.1:
7.2 fps, P1:
11.8 fps, max:
150 fps
Your browser does not support the canvas
element! fps
+ Comparar
- Ocultar comparación
Intel UHD Graphics G1 (Ice Lake 32 EU) 5%
Intel UHD Graphics Xe 16EUs (Tiger Lake-H) 6%
Intel Iris Plus Graphics G7 (Ice Lake 64 EU) 27%
Intel UHD Graphics Xe 32EUs (Tiger Lake-H) 84%
Intel UHD Graphics Xe G4 48EUs 92%
AMD Radeon RX Vega 7 116%
...
7 fps [X] Medion Erazer Beast X20 Intel Core i7-10870H 2.2GHz
UHD Graphics 630
min:
1.281 fps, P0.1:
1.611 fps, P1:
3.09 fps, max:
55.1 fps
Your browser does not support the canvas
element! fps
+ Comparar
- Ocultar comparación
Intel UHD Graphics Xe 16EUs (Tiger Lake-H) -13%
Intel Iris Plus Graphics G7 (Ice Lake 64 EU) 6%
Intel UHD Graphics Xe G4 48EUs 71%
Intel UHD Graphics Xe 32EUs (Tiger Lake-H) 72%
AMD Radeon RX Vega 7 207%
...
» No jugable la mayor parte de los portátiles probados.
21.6 fps [X] Medion Erazer Beast X20 Intel Core i7-10870H 2.2GHz
UHD Graphics 630
min:
4.18 fps, P0.1:
4.21 fps, P1:
4.46 fps, max:
147 fps
Your browser does not support the canvas
element! fps
+ Comparar
- Ocultar comparación
Intel UHD Graphics G1 (Ice Lake 32 EU) 13%
Intel UHD Graphics Xe G4 48EUs 44%
AMD Radeon RX Vega 10 52%
Intel UHD Graphics Xe 32EUs (Tiger Lake-H) 54%
AMD Radeon RX Vega 8 (Ryzen 2000/3000) 64%
AMD Radeon 540X 82%
...
4.9 fps [X] Medion Erazer Beast X20 Intel Core i7-10870H 2.2GHz
UHD Graphics 630
min:
1.134 fps, P0.1:
1.138 fps, P1:
1.188 fps, max:
124 fps
Your browser does not support the canvas
element! fps
+ Comparar
- Ocultar comparación
Intel UHD Graphics G1 (Ice Lake 32 EU) 22%
AMD Radeon 540X 39%
AMD Radeon RX Vega 8 (Ryzen 2000/3000) 43%
Intel UHD Graphics Xe G4 48EUs 83%
Intel UHD Graphics Xe 32EUs (Tiger Lake-H) 96%
AMD Radeon RX Vega 10 152%
...
» No jugable la mayor parte de los portátiles probados.
13.7 fps [X] Medion Erazer Beast X20 Intel Core i7-10870H 2.2GHz
UHD Graphics 630
min:
3.55 fps, P0.1:
5.92 fps, P1:
11.9 fps, max:
24.9 fps
Your browser does not support the canvas
element! fps
+ Comparar
- Ocultar comparación
Intel UHD Graphics G1 (Ice Lake 32 EU) 10%
Intel UHD Graphics Xe 16EUs (Tiger Lake-H) 15%
AMD Radeon RX Vega 10 77%
Intel UHD Graphics Xe G4 48EUs 80%
AMD Radeon RX Vega 8 (Ryzen 2000/3000) 85%
Intel Iris Plus Graphics G7 (Ice Lake 64 EU) 88%
...
7.8 fps [X] Medion Erazer Beast X20 Intel Core i7-10870H 2.2GHz
UHD Graphics 630
min:
5.62 fps, P0.1:
5.83 fps, P1:
6.44 fps, max:
9.07 fps
Your browser does not support the canvas
element! fps
+ Comparar
- Ocultar comparación
Intel UHD Graphics Xe 16EUs (Tiger Lake-H) 8%
Intel UHD Graphics G1 (Ice Lake 32 EU) 17%
AMD Radeon 540X 85%
Intel UHD Graphics Xe 32EUs (Tiger Lake-H) 94%
...
» No jugable la mayor parte de los portátiles probados.
Intel UHD Graphics Xe 16EUs (Tiger Lake-H) 13%
Intel UHD Graphics G1 (Ice Lake 32 EU) 17%
Intel Iris Plus Graphics G7 (Ice Lake 64 EU) 96%
Intel UHD Graphics Xe 32EUs (Tiger Lake-H) 131%
AMD Radeon RX Vega 10 147%
...
Intel UHD Graphics Xe 32EUs (Tiger Lake-H) 96%
Intel Iris Plus Graphics G7 (Ice Lake 64 EU) 100%
AMD Radeon RX Vega 8 (Ryzen 2000/3000) 125%
AMD Radeon RX Vega 10 130%
...
» No jugable la mayor parte de los portátiles probados.
Intel HD Graphics 630 -24%