Análisis del portátil Lenovo ThinkPad P16 G1: Una estación de trabajo HX55 potente y de nuevo diseño
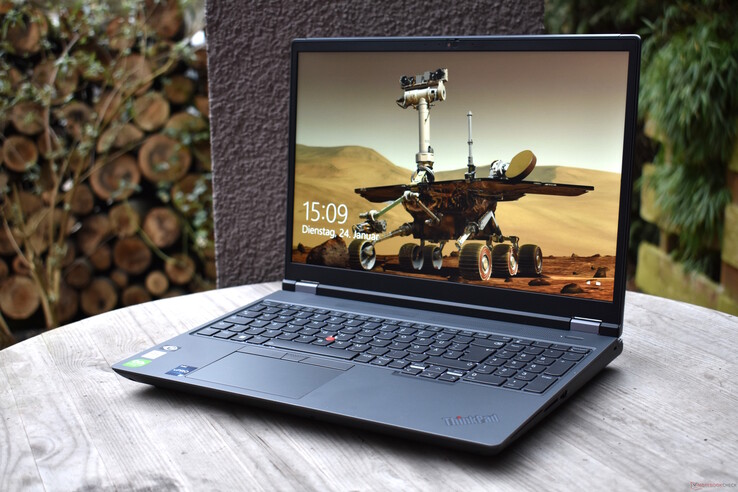
Desde 2015, Lenovo ha tenido dos modelos en el segmento de las estaciones de trabajo clásicas y móviles, donde la atención se centra principalmente en el rendimiento. Más recientemente, esos modelos recibieron el nombre deLenovo ThinkPad P15 Gen 2y elLenovo ThinkPad P17 Gen 2. Como su nombre indica, cada dispositivo venía con una pantalla de 15 y 17 pulgadas. En 2022, Lenovo decidió poner fin a esta dualidad de estaciones de trabajo y ahora ofrecen una estación de trabajo móvil completa: el Lenovo ThinkPad P16 Gen 1, que sustituye a los dos modelos anteriores. En particular, una comparación con sus competidores directos de Dell y Asus mostrará lo bien que le va con dispositivos similares en los que el rendimiento móvil es una prioridad.
Posibles contendientes en la comparación
Valoración | Fecha | Modelo | Peso | Altura | Tamaño | Resolución | Precio |
|---|---|---|---|---|---|---|---|
| 88.2 % v7 (old) | 02/2023 | Lenovo ThinkPad P16 G1 21D6001DMB i7-12850HX, RTX A2000 Laptop GPU | 3 kg | 30.23 mm | 16.00" | 2560x1600 | |
| 87.2 % v7 (old) | 10/2021 | Lenovo ThinkPad P15 G2-20YQ001JGE i7-11800H, RTX A3000 Laptop GPU | 2.9 kg | 31.5 mm | 15.60" | 1920x1080 | |
| 87.8 % v7 (old) | 10/2021 | Lenovo ThinkPad P17 G2-20YU0025G i7-11800H, RTX A2000 Laptop GPU | 3.6 kg | 28.38 mm | 17.30" | 1920x1080 | |
| 89.7 % v7 (old) | 02/2022 | HP ZBook Fury 17 G8-4A6A9EA i9-11950H, RTX A3000 Laptop GPU | 2.9 kg | 27 mm | 17.30" | 3840x2160 | |
| 88.4 % v7 (old) | 10/2022 | Dell Precision 7670 i7-12850HX, RTX A2000 Laptop GPU | 2.7 kg | 24.7 mm | 16.00" | 3840x2400 | |
| 89.6 % v7 (old) | 01/2023 | Asus ExpertBook B6 Flip B6602FC2 i9-12950HX, RTX A2000 Laptop GPU | 2.8 kg | 27.2 mm | 16.00" | 2560x1600 |
Caja: Una tapa gris de aluminio con un marco de magnesio
Desde la creación de la serie ThinkPad P, elP15y P17eran la representación más clásica del diseño ThinkPad. Con sus carcasas cuadradas de plástico con marco de magnesio y el clásico mecanismo de bisagra en la base, eran los portátiles ThinkPad que más se acercaban a modelos como el clásicoLenovo ThinkPad T60. Para los fans de ThinkPad, sin duda, una característica positiva, pero el diseño también podría considerarse como pasado de moda - especialmente en lo que respecta a los grandes biseles de la pantalla.
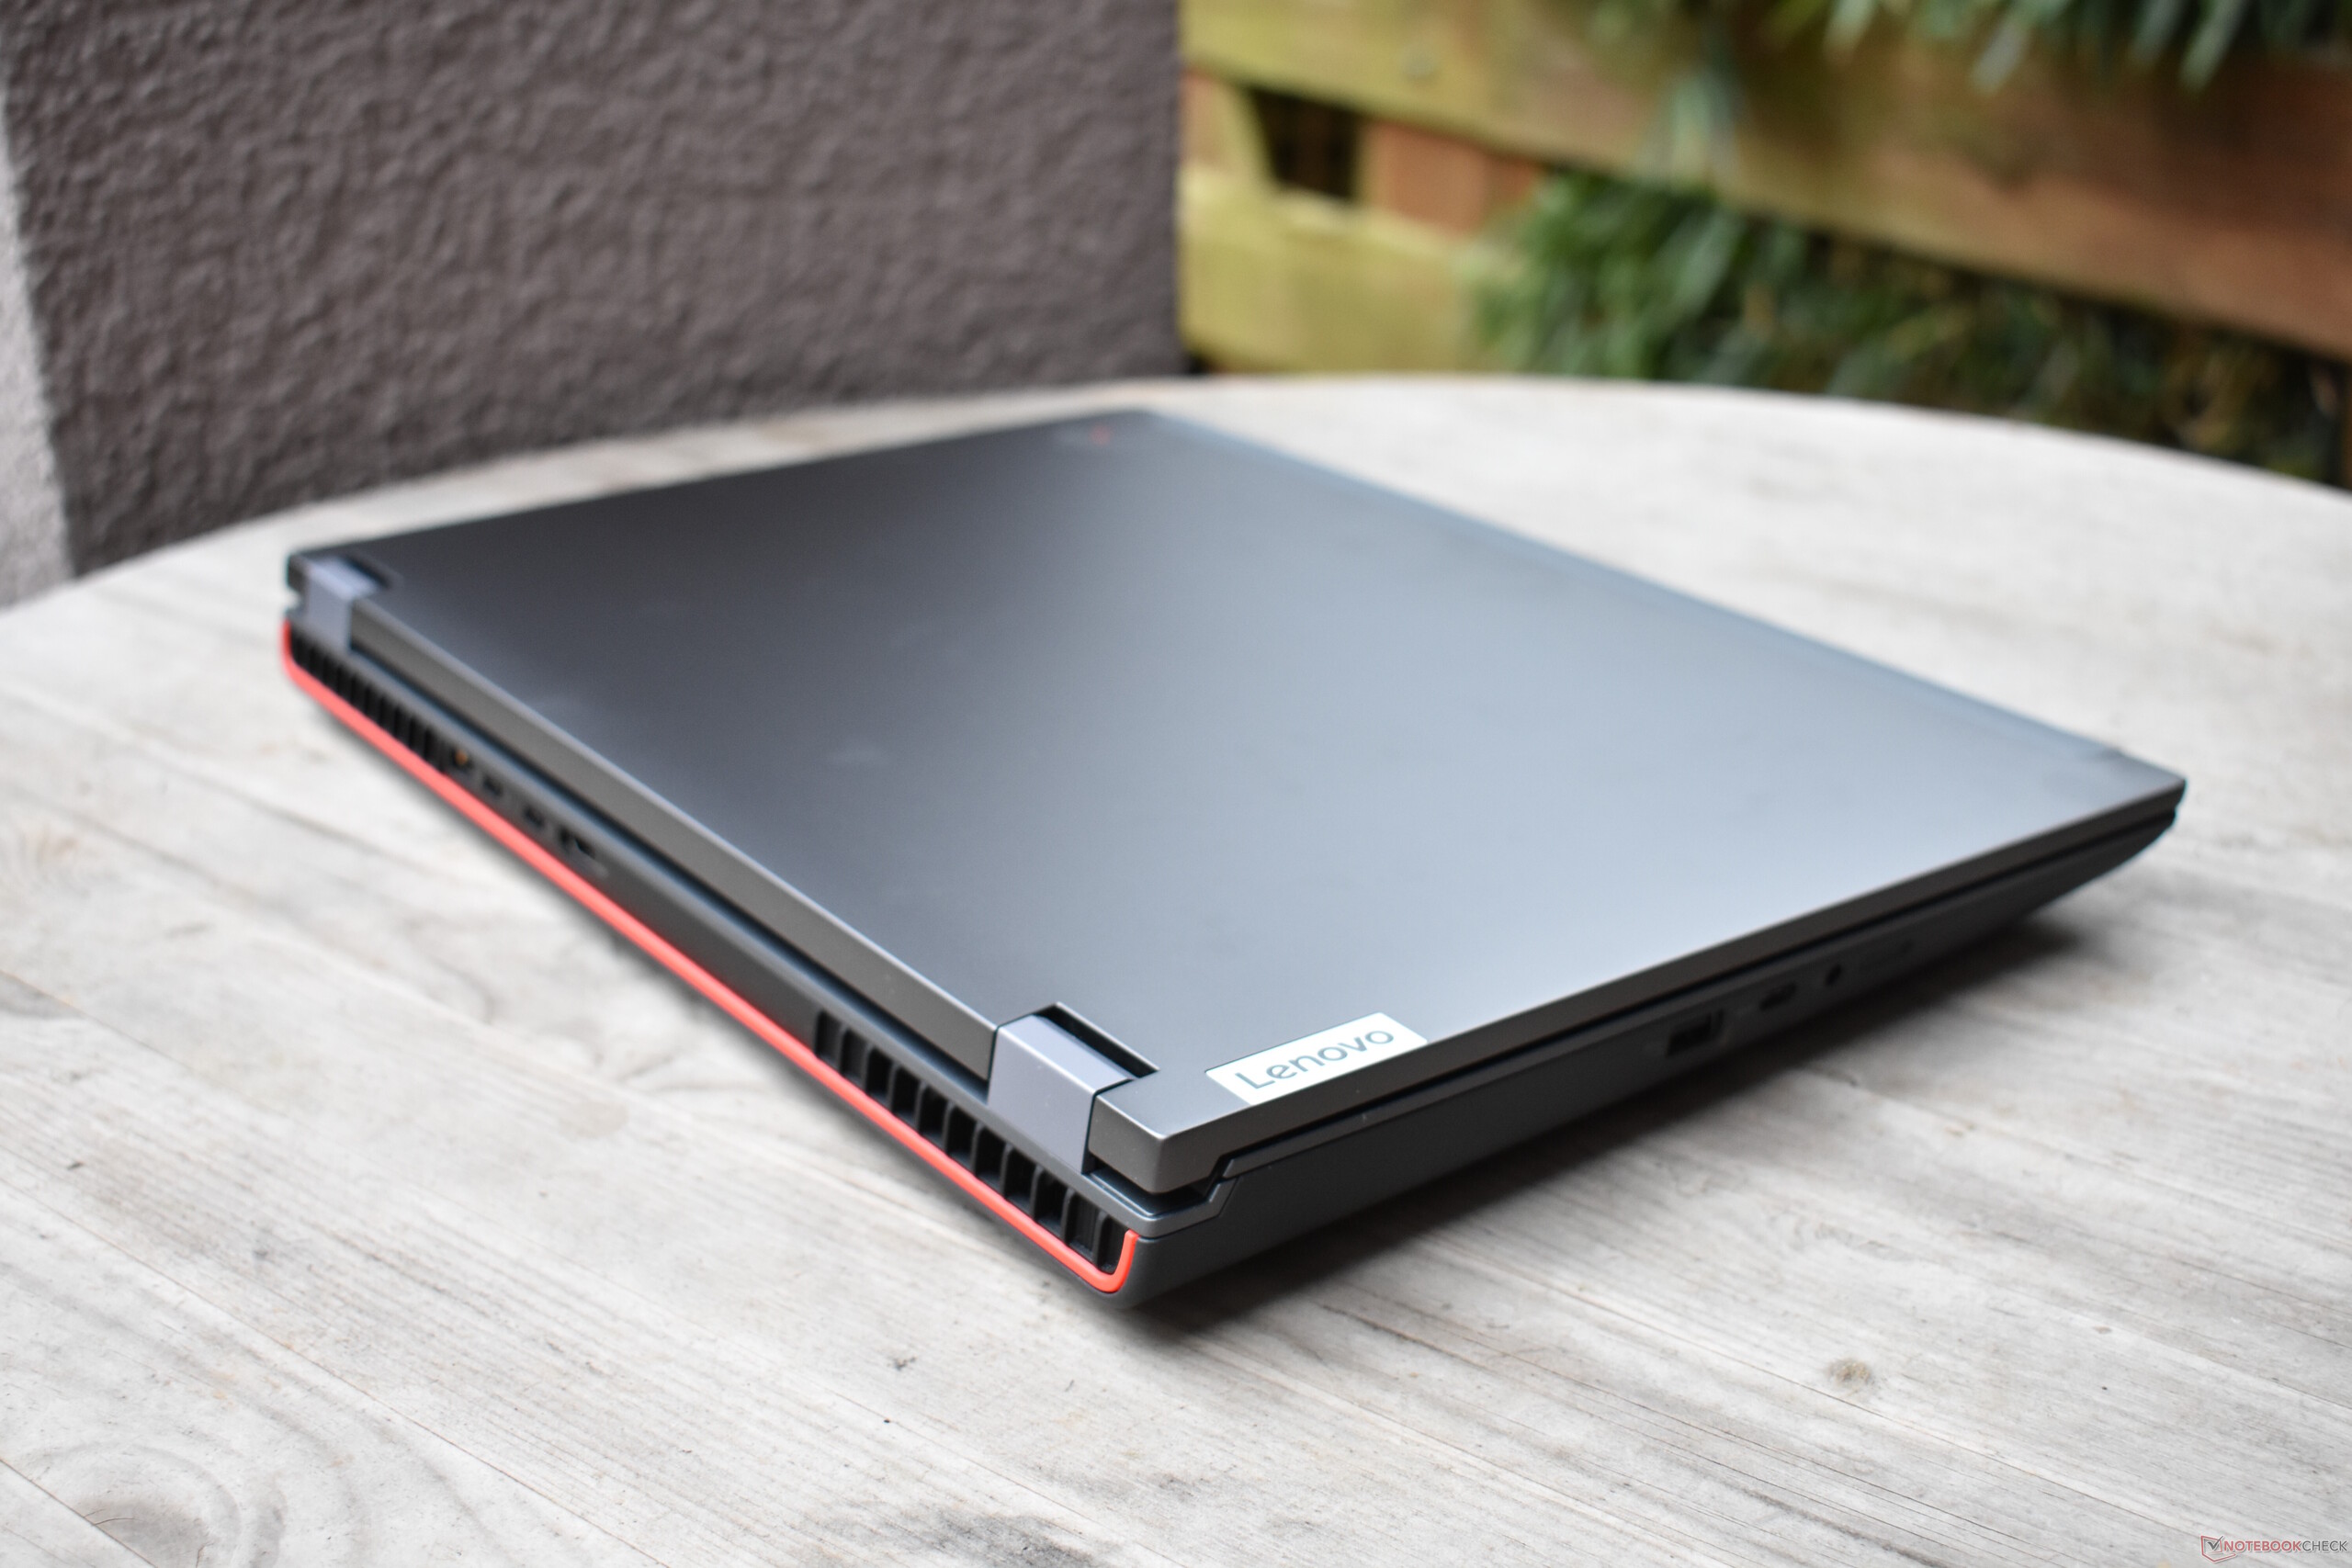
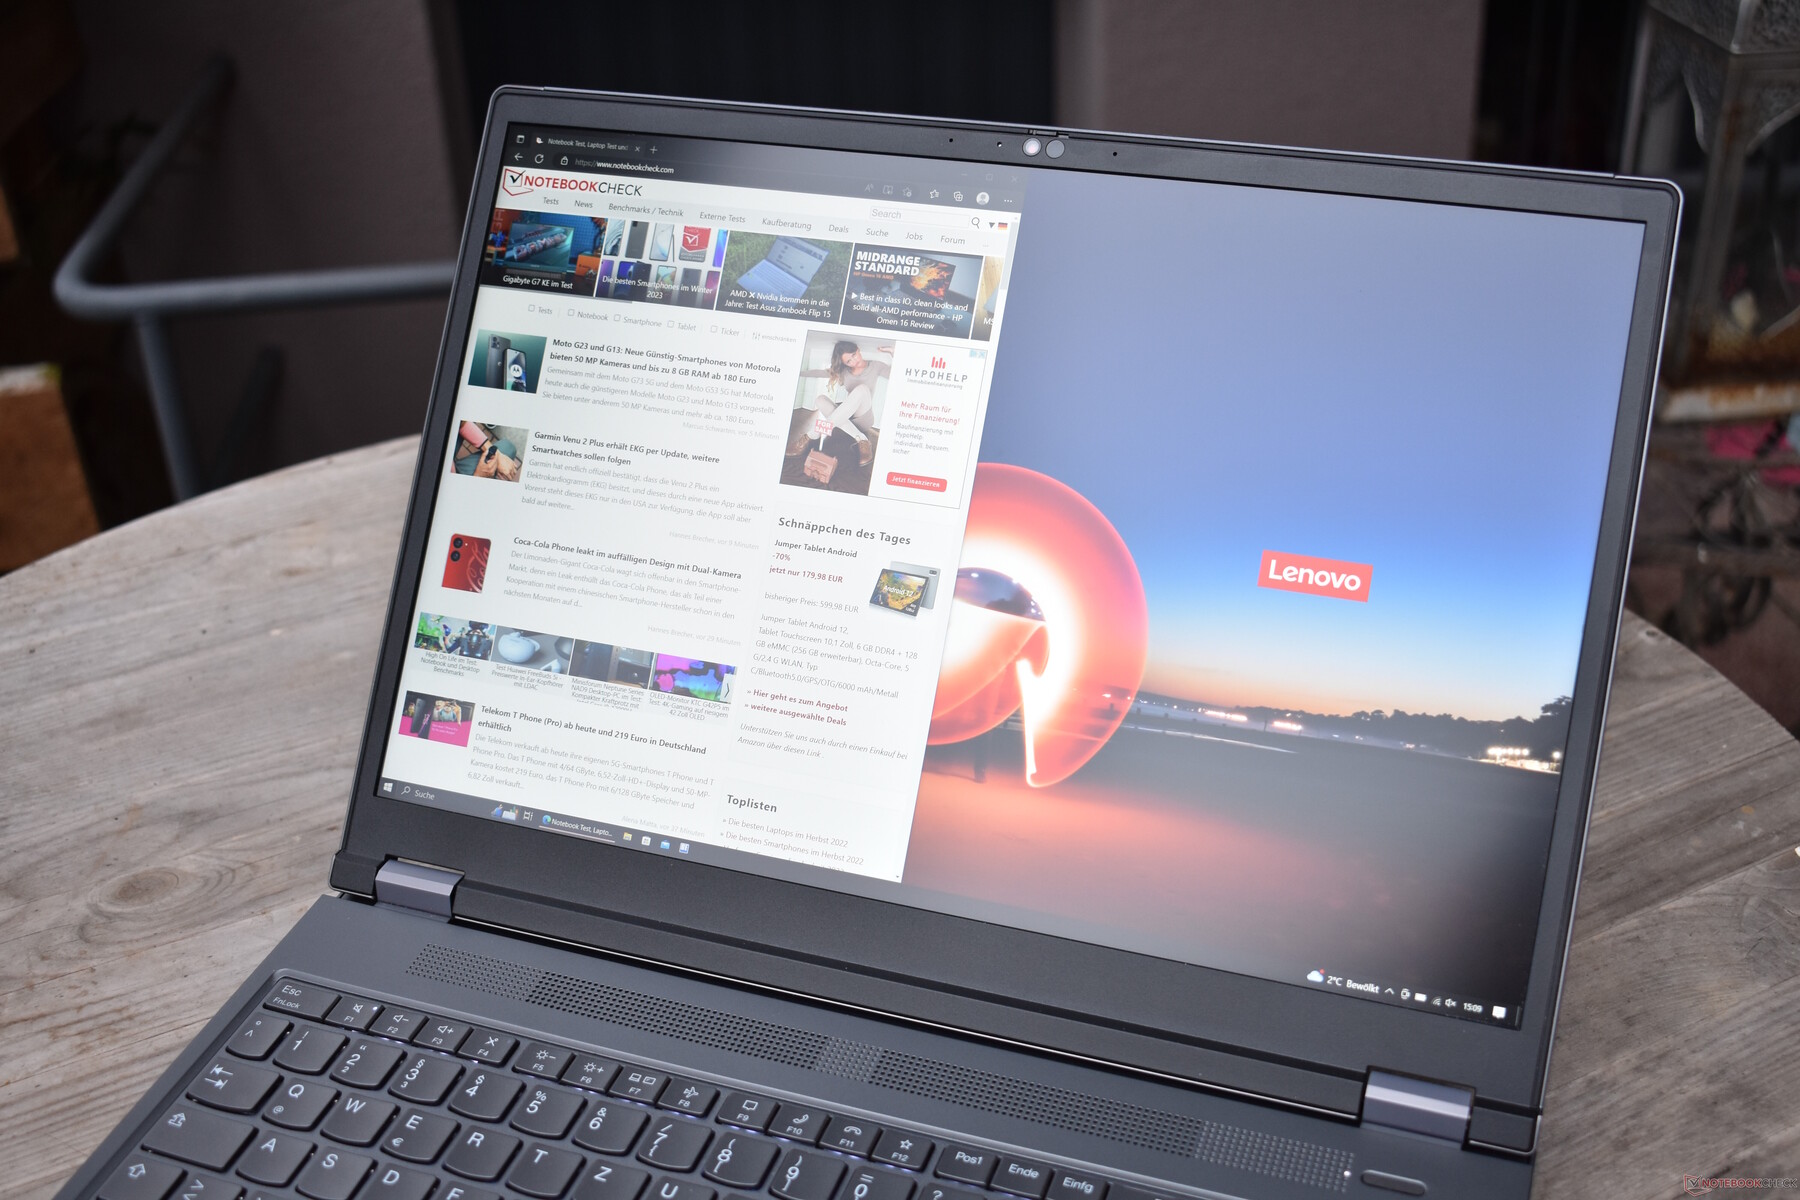
El ThinkPad P16 cambia muchas cosas. El reposamanos, el teclado y la cubierta de la pantalla son completamente de color "Gris Tormenta". Los bordes redondeados aseguran una forma ligeramente menos cuadrada. En cuanto a la parte trasera del dispositivo, Lenovo ha demostrado tener ganas de experimentar, ya que esta zona está decorada con toques rojos. El P16 también parece más moderno que su predecesor, ya que los biseles de la pantalla son mucho más delgados. Sin embargo, para un dispositivo moderno, siguen siendo relativamente grandes, en particular en la parte inferior de la pantalla.
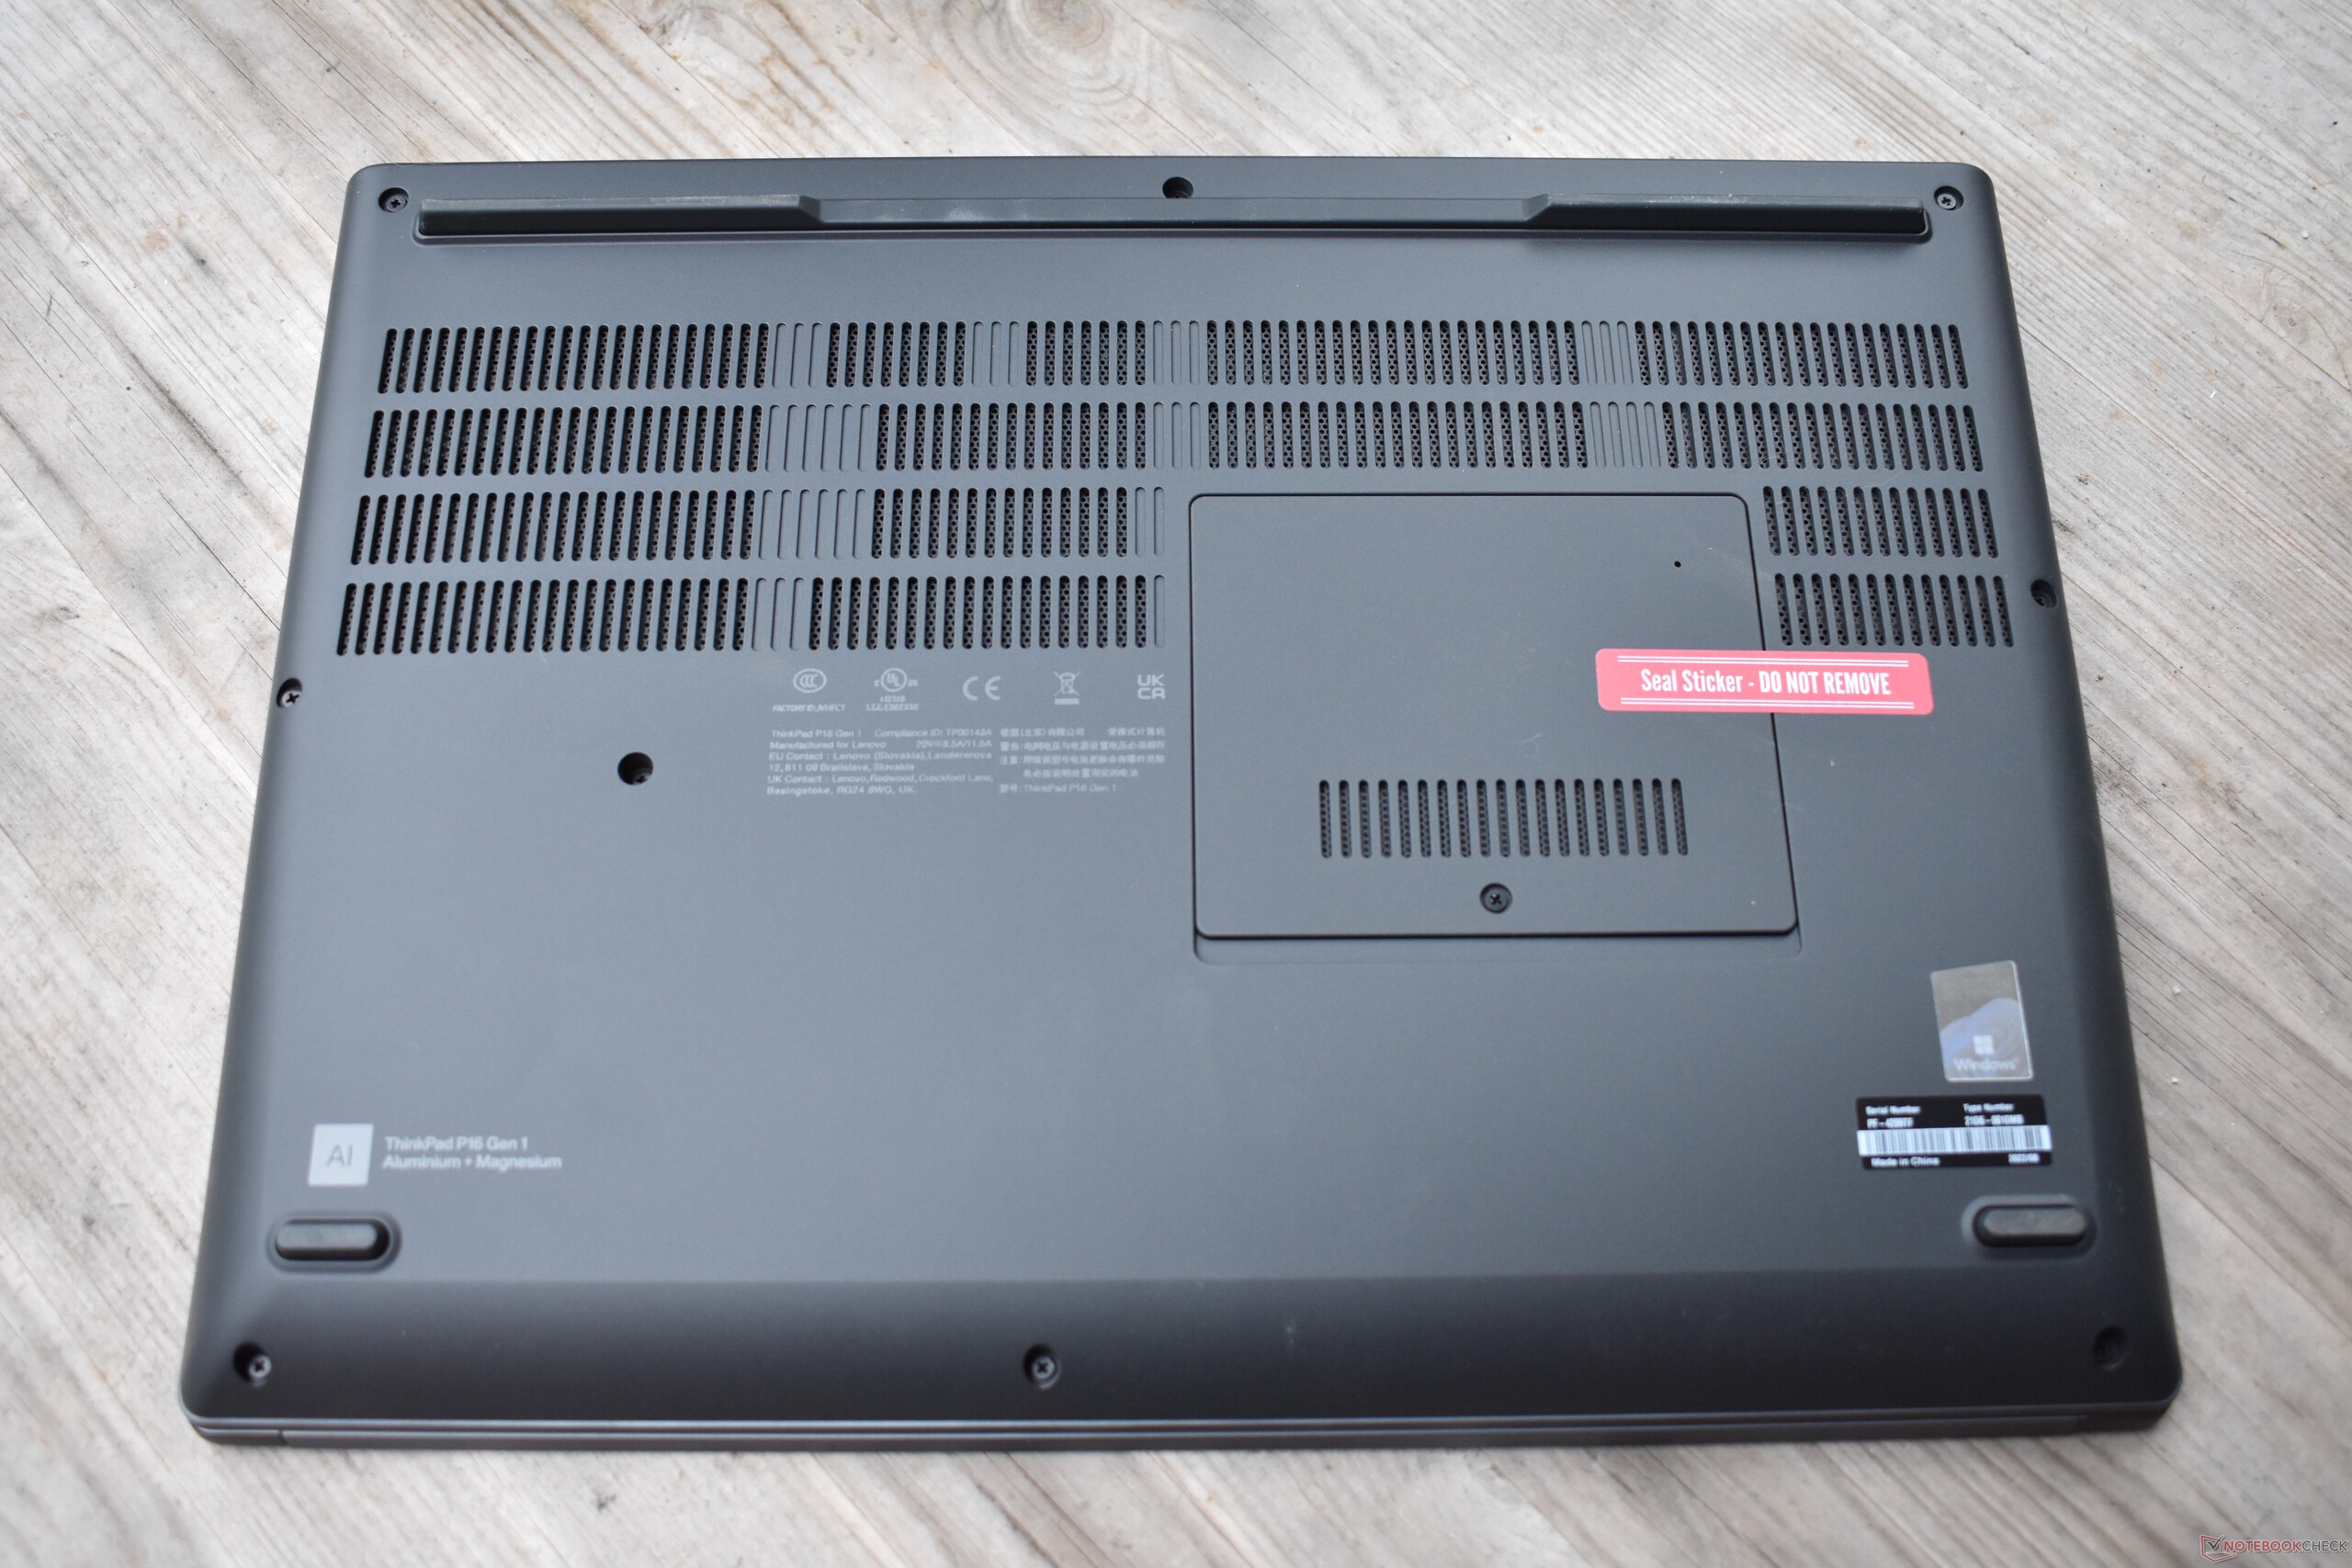
La unidad base está hecha de plástico de fibra de vidrio reforzado con un marco de magnesio; igual que los anteriores. Las superficies tienen un revestimiento aterciopelado y el plástico gris es menos propenso a las huellas dactilares que el plástico negro de los modelos ThinkPad anteriores. La base no puede retorcerse y la única zona débil es el lector de tarjetas inteligentes, donde el reposamanos se flexiona ligeramente. Lenovo ha optado por usar aluminio para la cubierta de la pantalla LCD y, del mismo modo, ha recibido un refuerzo adicional en forma de jaula antivuelco de magnesio. La estabilidad de la cubierta de la pantalla ha mejorado mucho en comparación con el P15 y el P17.
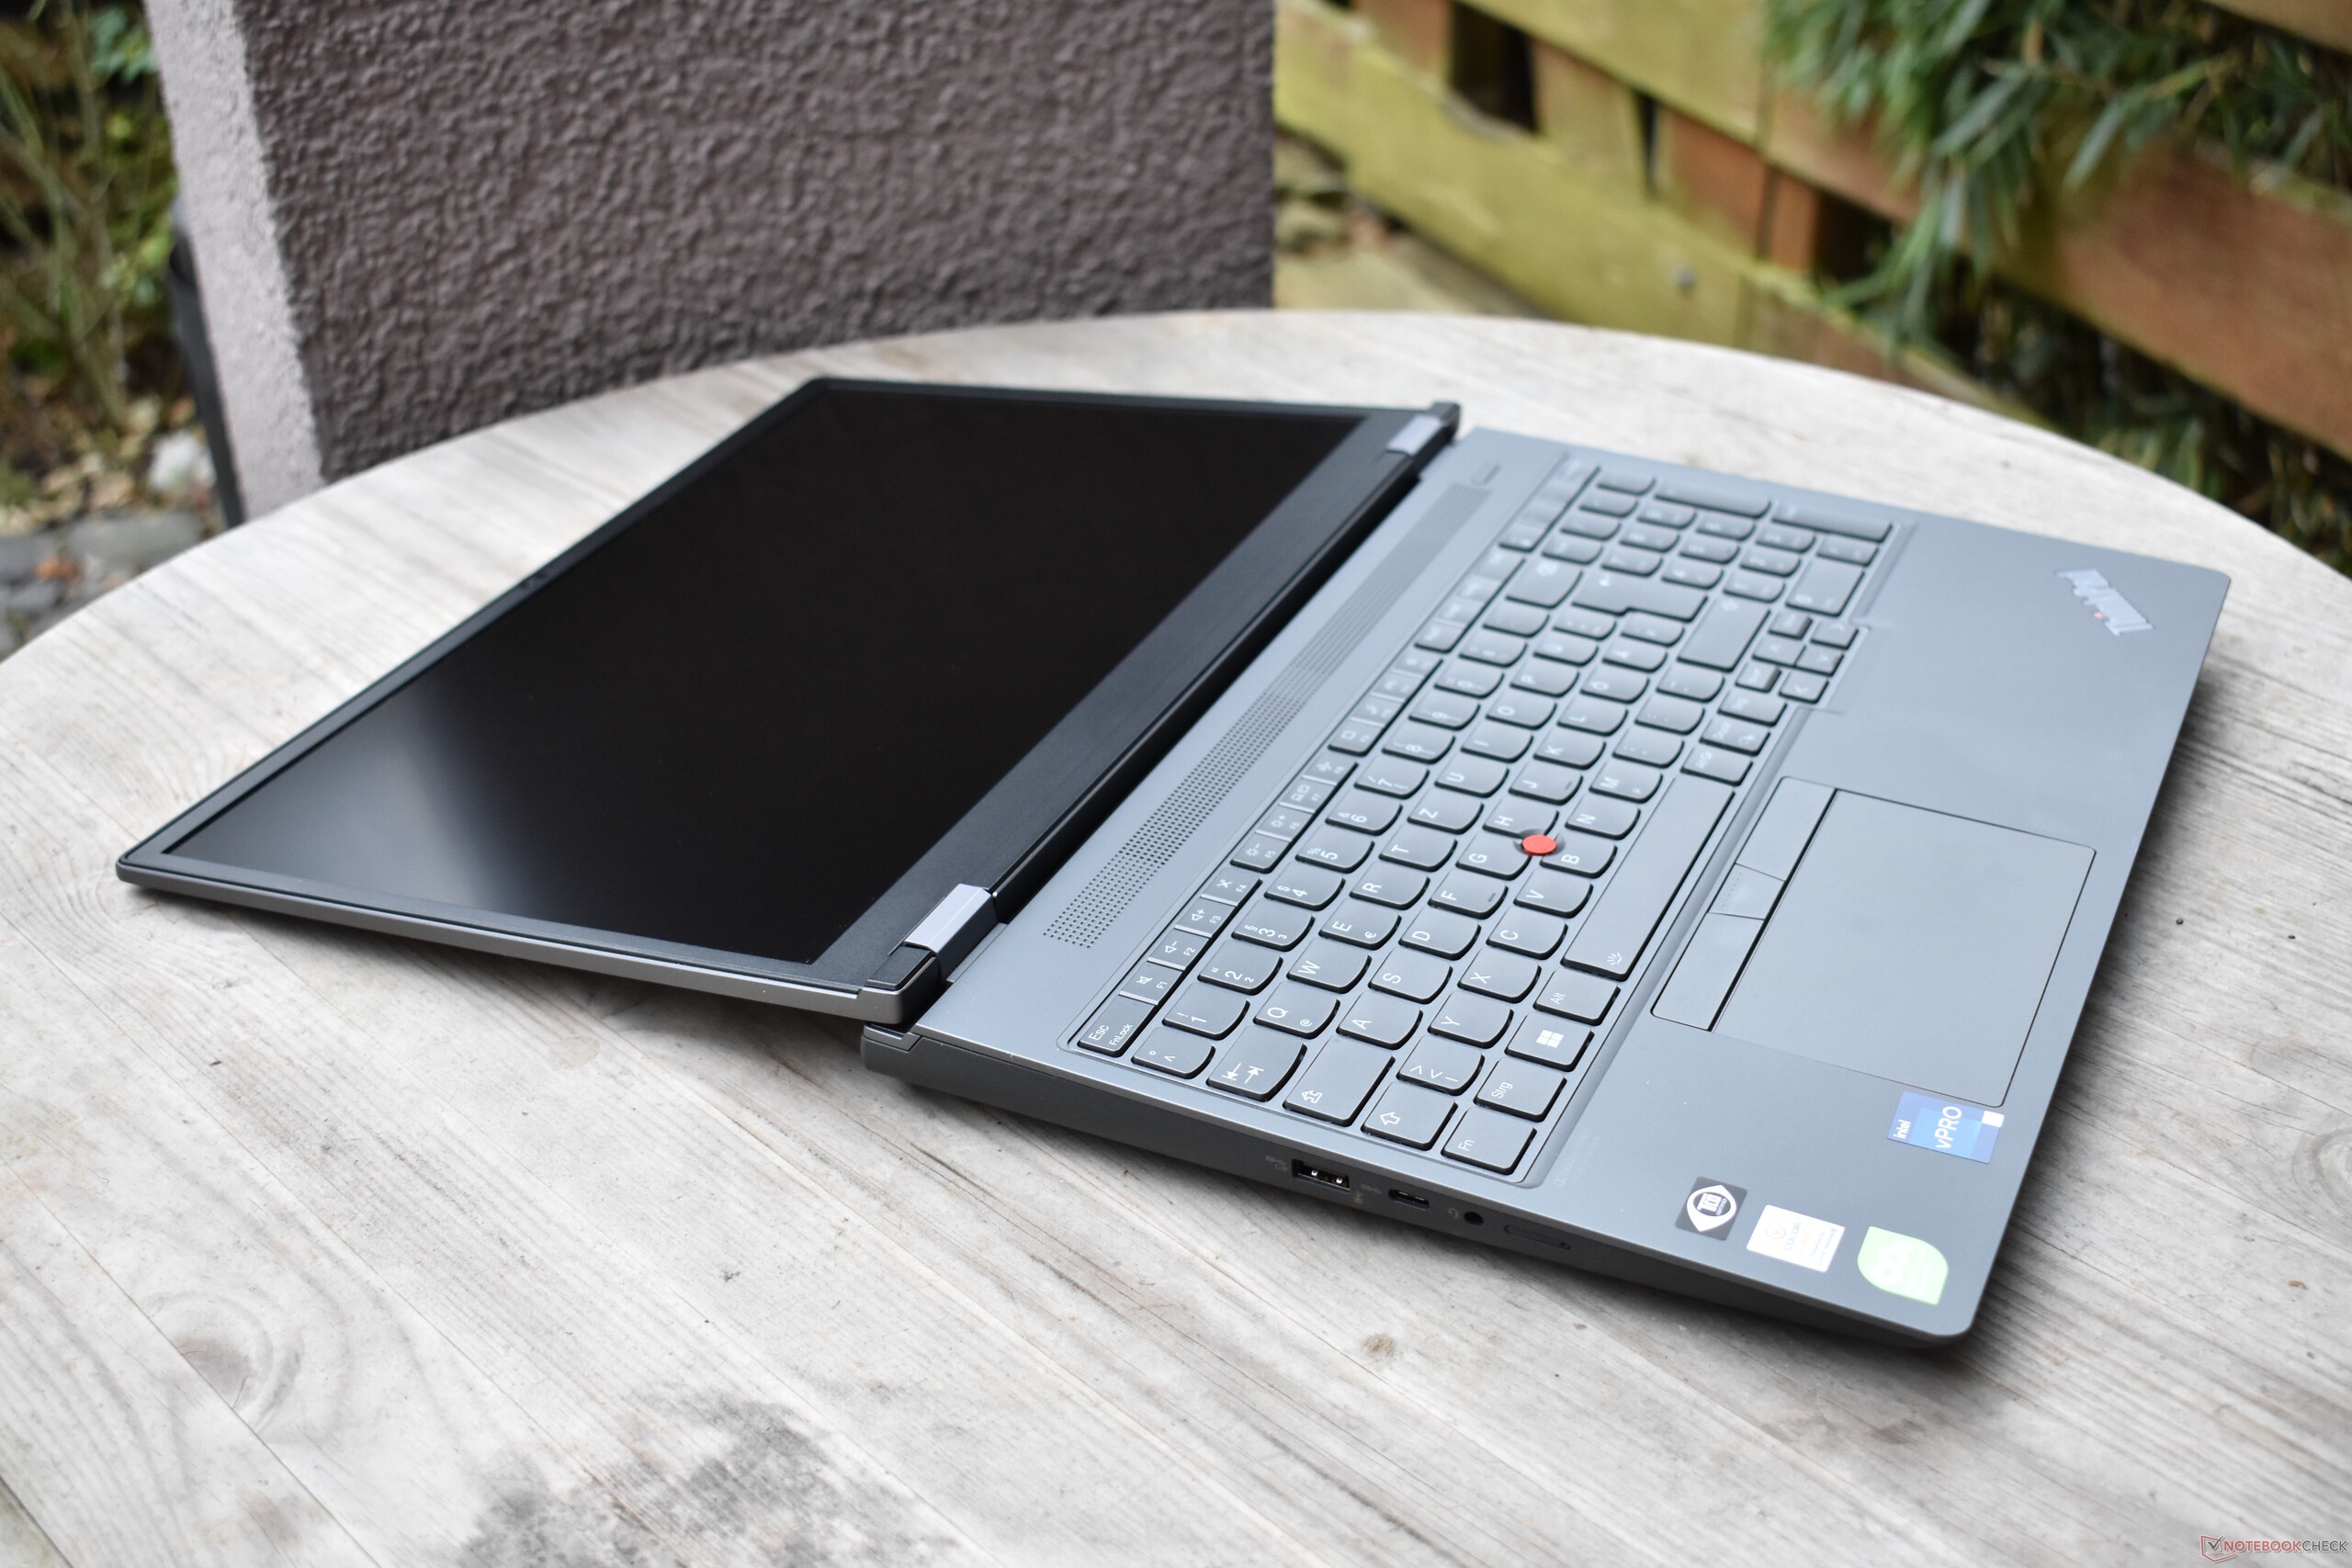
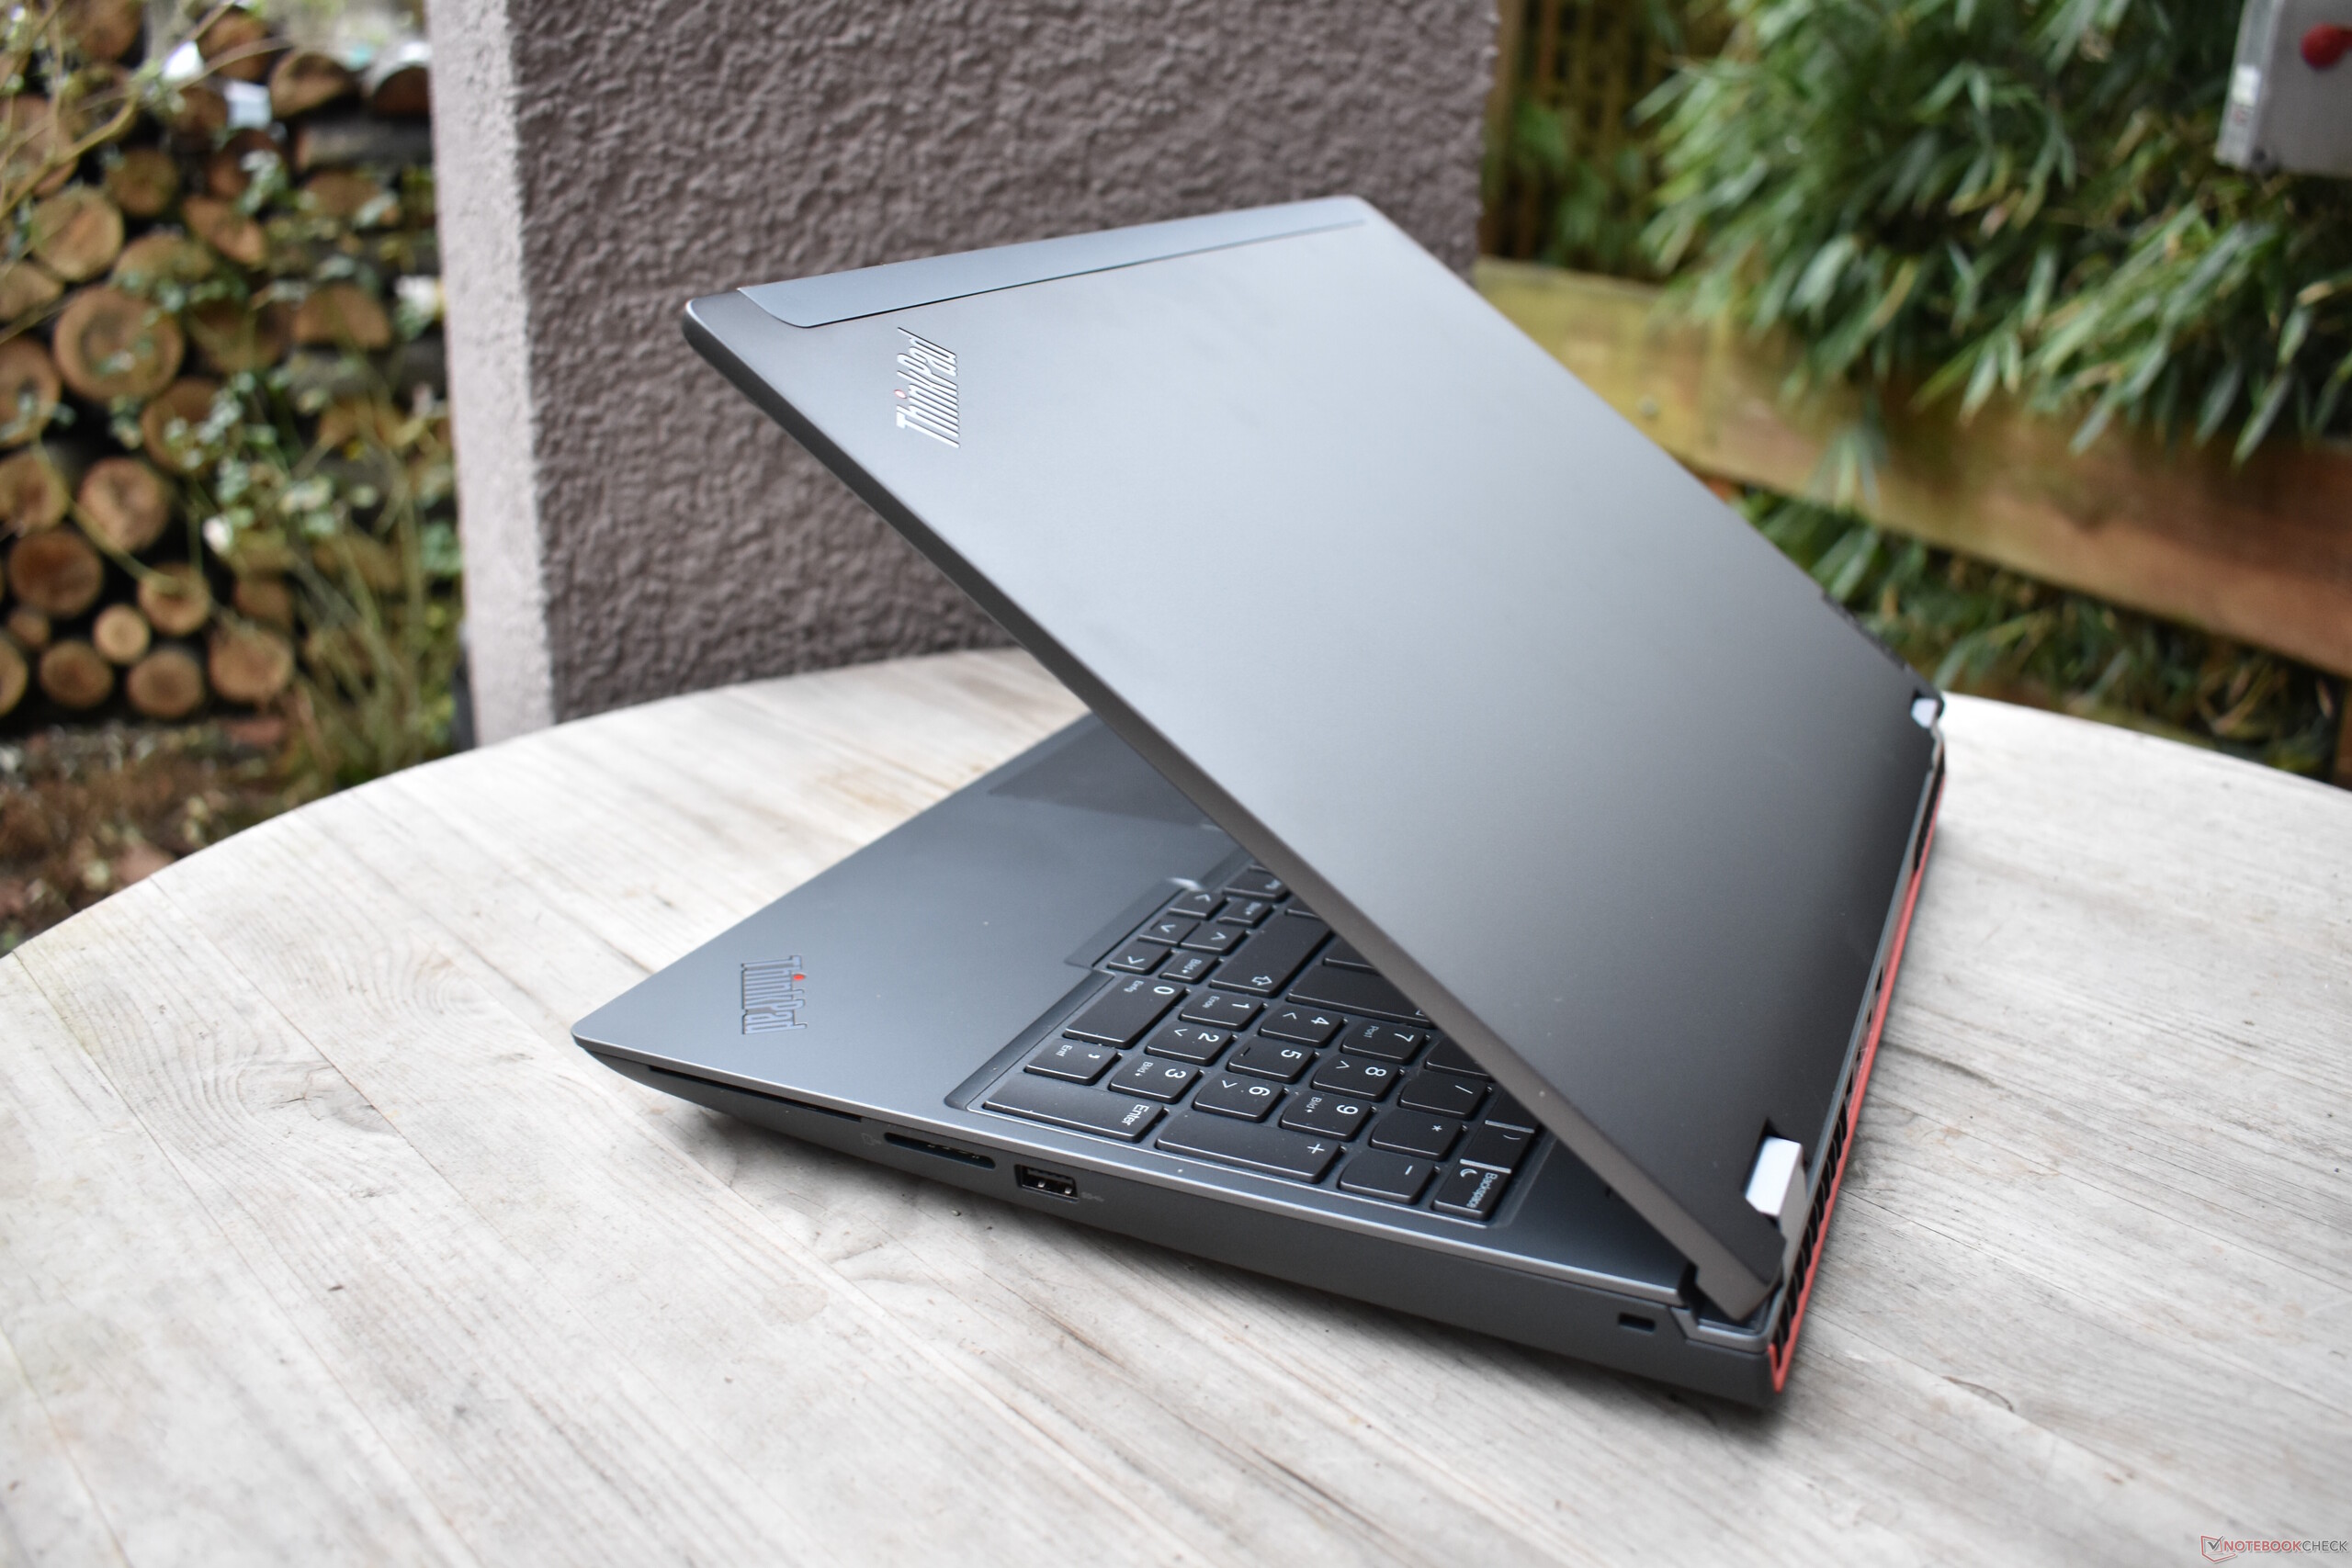
Las grandes bisagras superior e inferior, con sus destacadas tapas plateadas, son prácticamente idénticas a las de esos modelos y mantienen la pantalla firmemente en su sitio sin ningún atisbo de tambaleo. La pantalla se puede abrir con una sola mano hasta un ángulo de más de 180 grados.
Más un ThinkPad P15 G3 que un P17 G3: En términos de tamaño y peso, el Lenovo ThinkPad P16 G1 está mucho más cerca de su predecesor más pequeño que del más grande.
También es interesante la comparación con el Dell Precision 7670: La estación de trabajo Dell de 16 pulgadas es más móvil en todos los sentidos, ya que no sólo es más pequeña, sino también más delgada y ligera. Con el Precision 7770, Dell sigue ofreciendo una variante LCD de 17 pulgadas aún más grande y potente.
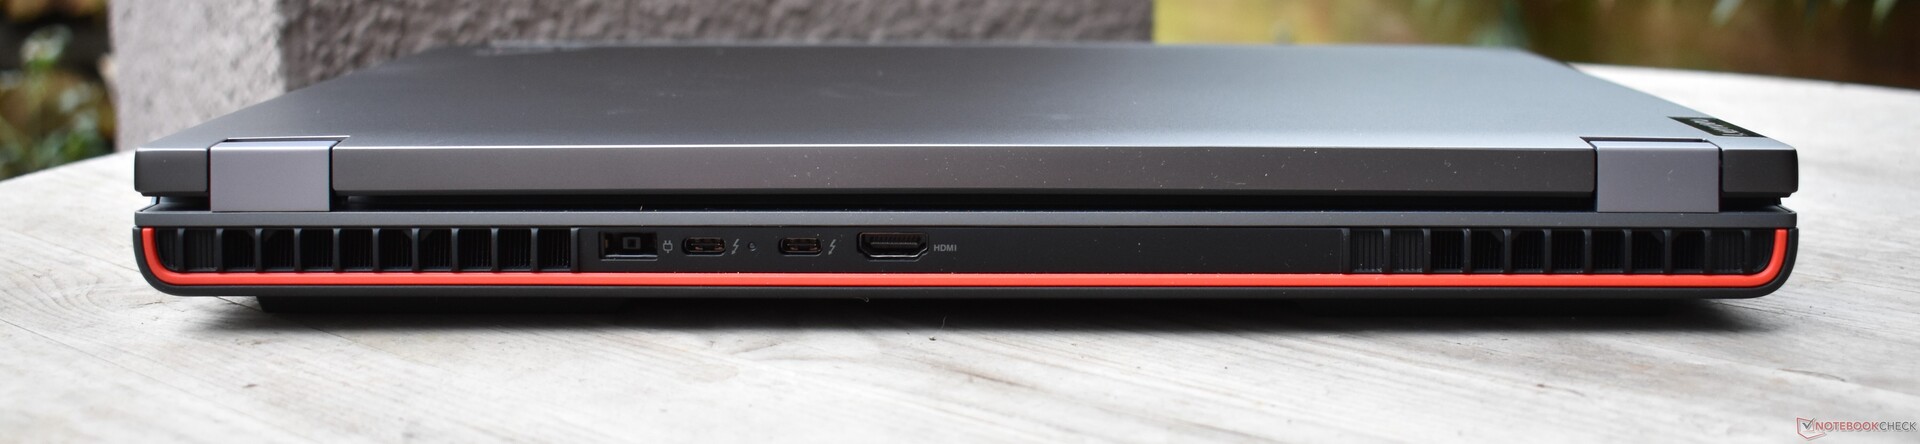
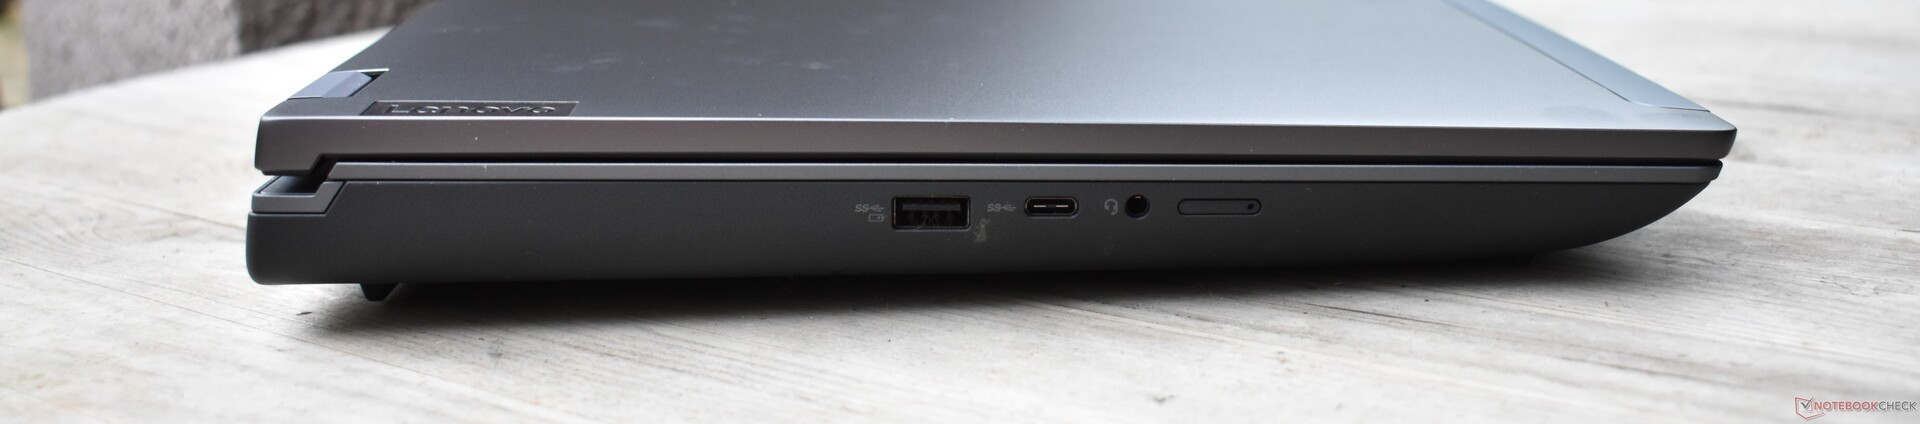
Características: Un ThinkPad P16 sin RJ45
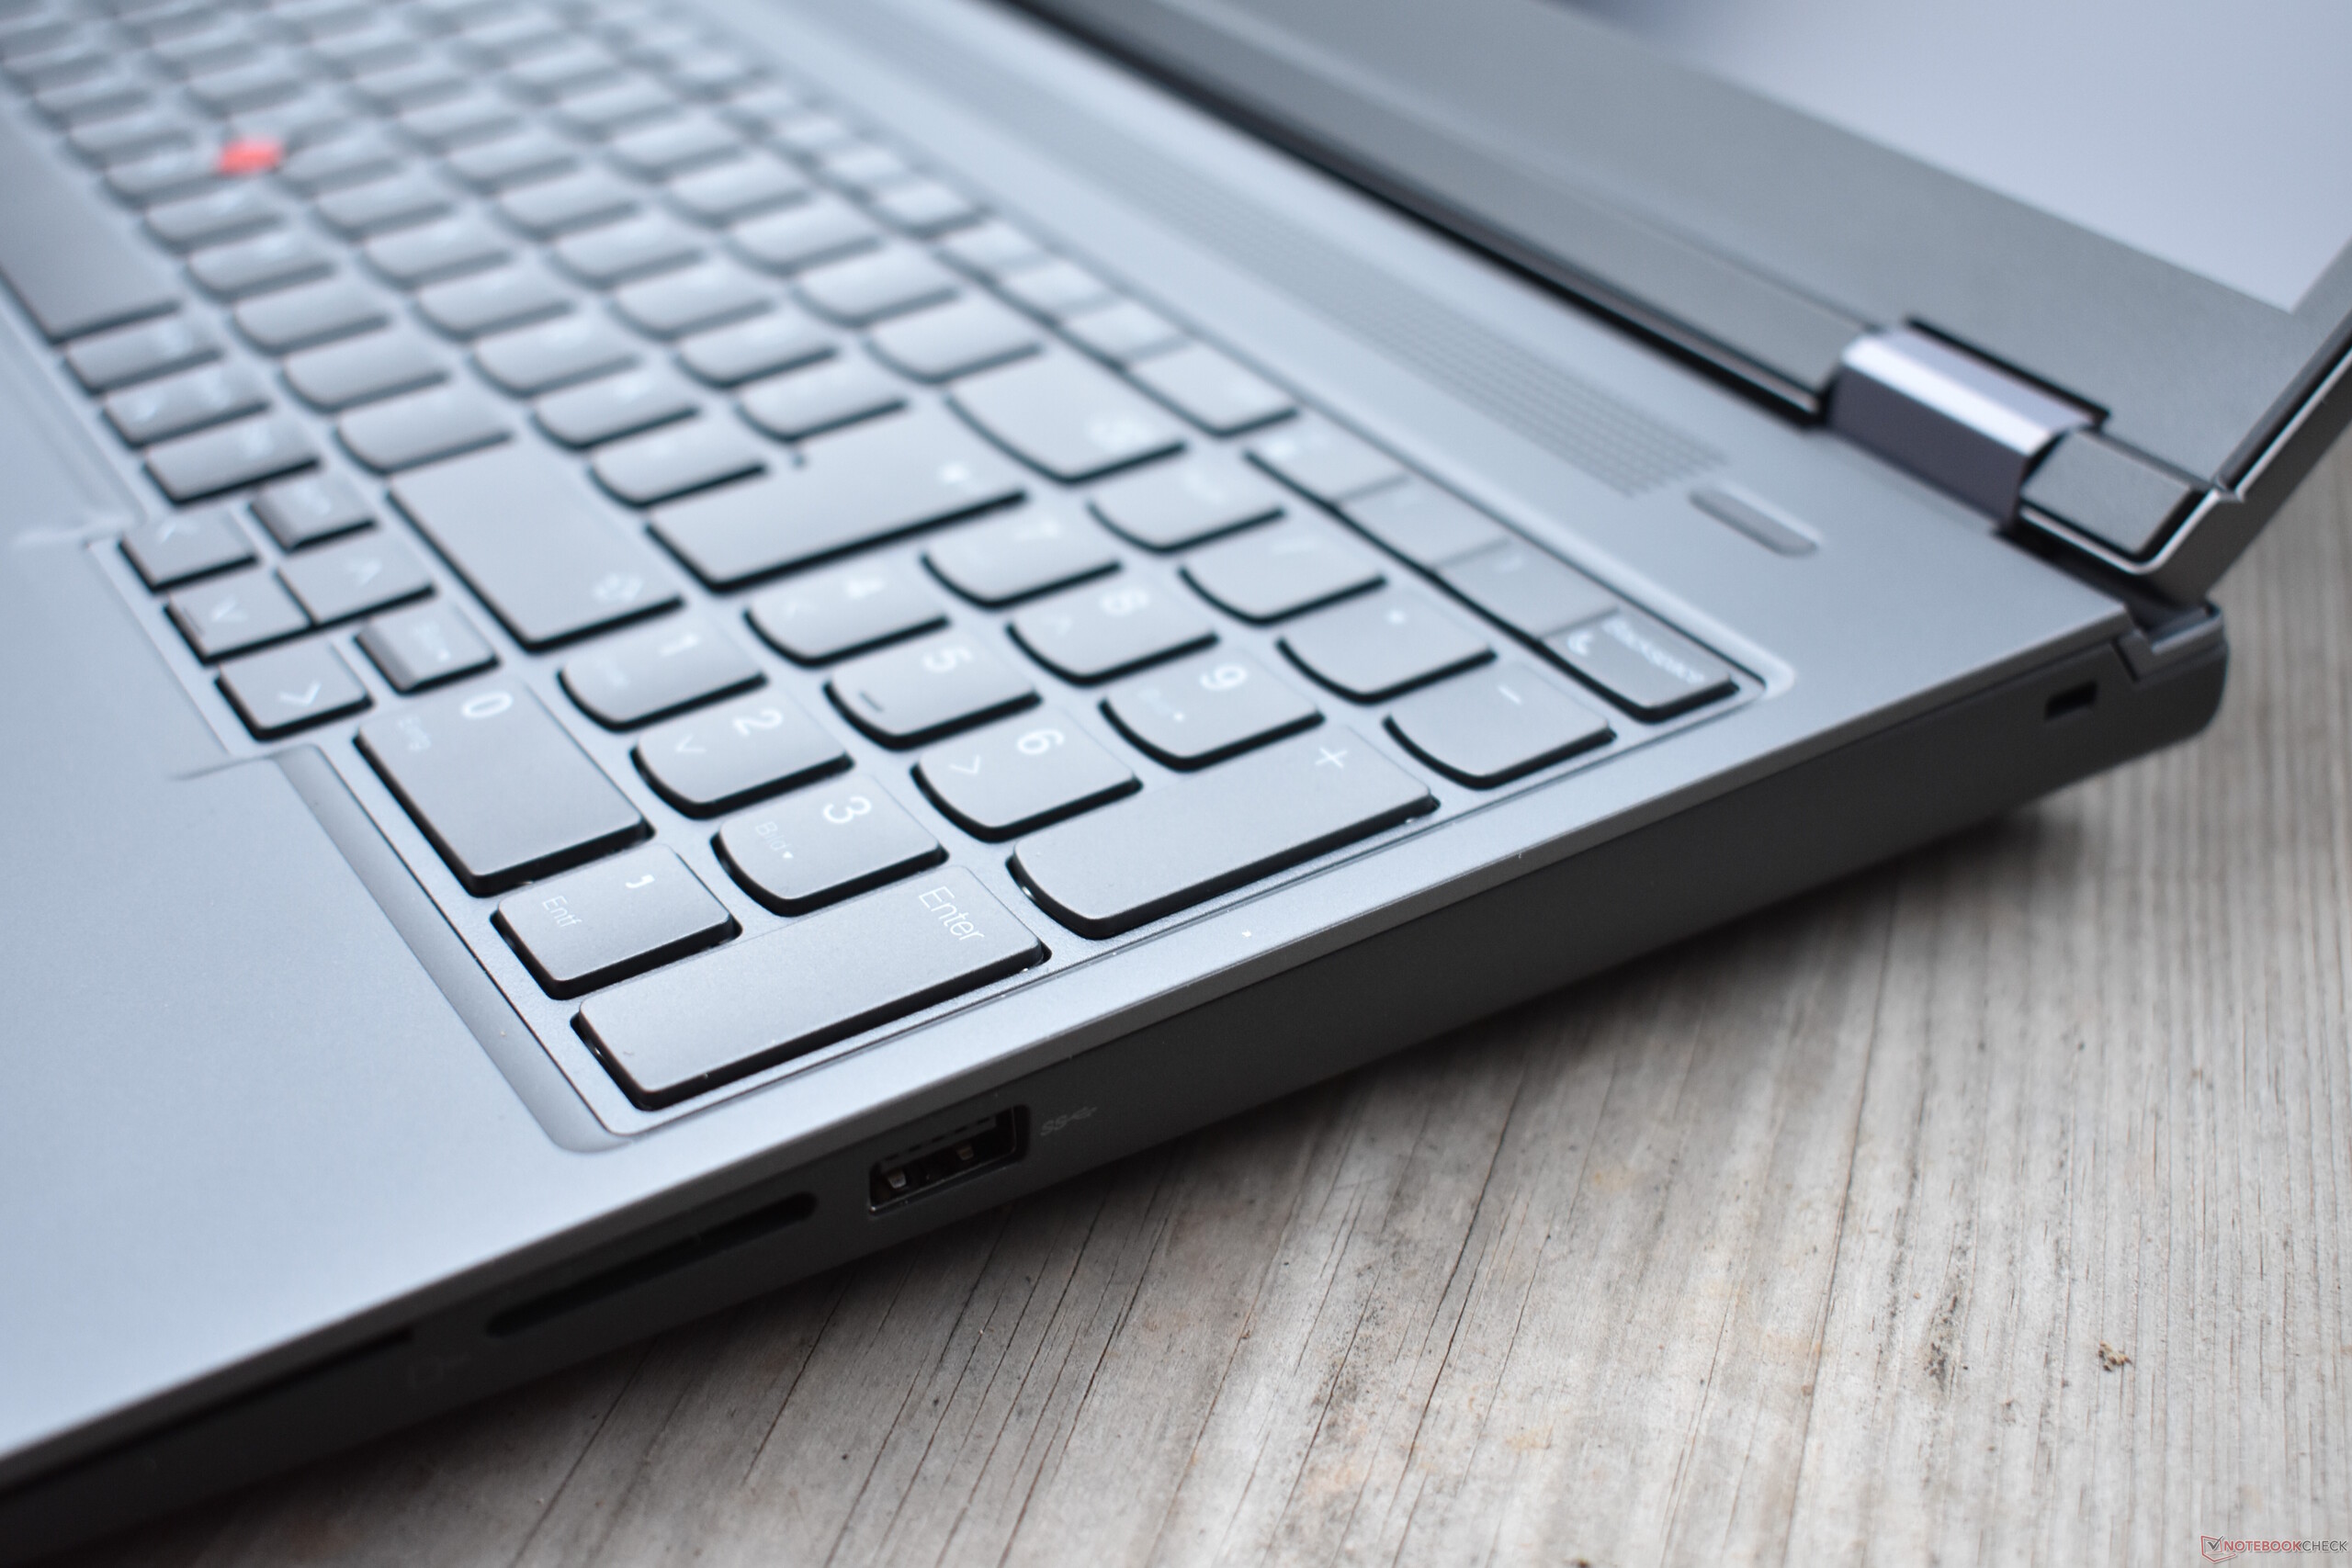
Lenovo ha actualizado el diseño sin alterar drásticamente las opciones de conectividad. Sólo hay un cambio además de la ubicación de los puertos: Se ha eliminado la funcionalidad ethernet RJ45. El uso de internet por cable se hace con una base o uno de los puertos Thunderbolt.
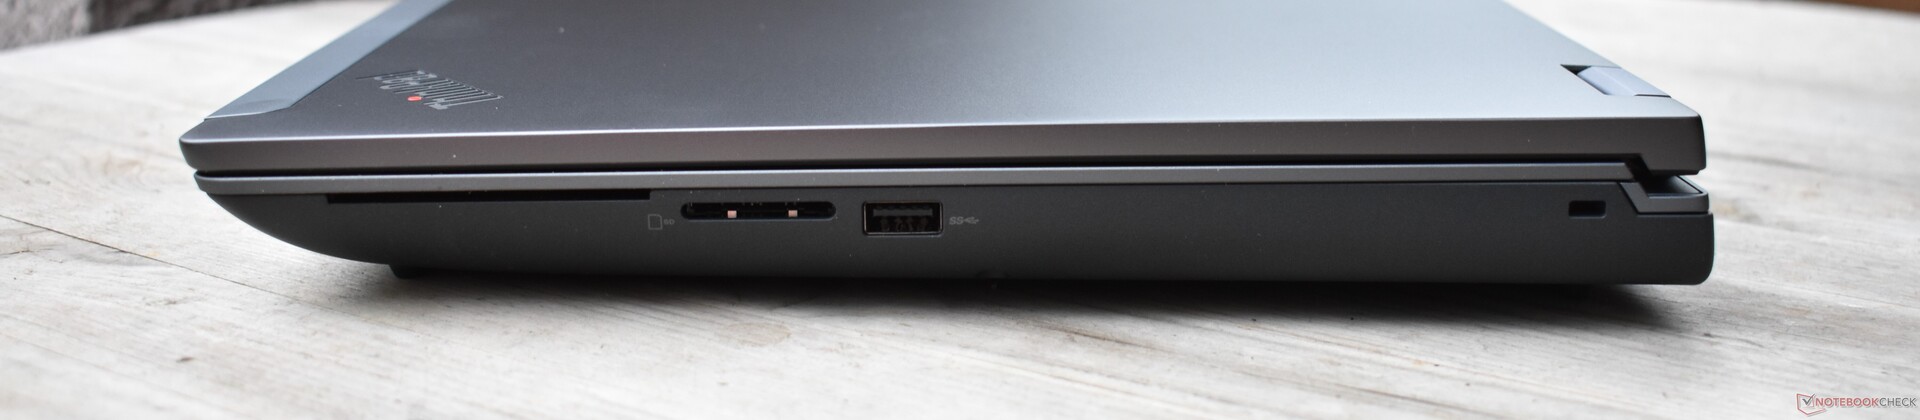
Lector de tarjetas SD
Los resultados del benchmark del lector de tarjetas SD -que probamos con nuestra tarjeta de referencia AV Pro microSD de 128 GB- son sorprendentemente malos. Las puntuaciones están muy por debajo de la media para un dispositivo de clase estación de trabajo, así como su propio predecesor.
| SD Card Reader | |
| average JPG Copy Test (av. of 3 runs) | |
| Lenovo ThinkPad P15 G2-20YQ001JGE (AV Pro V60) | |
| Dell Precision 7670 (Toshiba Exceria Pro SDXC 64 GB UHS-II) | |
| Lenovo ThinkPad P17 G2-20YU0025G (Toshiba Exceria Pro SDXC 64 GB UHS-II) | |
| Media de la clase Workstation (49.6 - 681, n=14, últimos 2 años) | |
| HP ZBook Fury 17 G8-4A6A9EA (Angelbird AV Pro V60) | |
| Lenovo ThinkPad P16 G1 21D6001DMB (AV Pro V60) | |
| maximum AS SSD Seq Read Test (1GB) | |
| Media de la clase Workstation (87.6 - 1455, n=14, últimos 2 años) | |
| Lenovo ThinkPad P15 G2-20YQ001JGE (AV Pro V60) | |
| Lenovo ThinkPad P17 G2-20YU0025G (Toshiba Exceria Pro SDXC 64 GB UHS-II) | |
| Dell Precision 7670 (Toshiba Exceria Pro SDXC 64 GB UHS-II) | |
| HP ZBook Fury 17 G8-4A6A9EA (Angelbird AV Pro V60) | |
| Lenovo ThinkPad P16 G1 21D6001DMB (AV Pro V60) | |
Comunicación
El rendimiento de la tarjeta Intel AX211WiFi-6E es mejor que la AX210 que se encuentra en los modelos predecesores ThinkPad P15 y P17. Sobre todo, rinde bien en el área de recepción, pero el envío de datos es un poco más lento y menos estable.
Nuestro modelo de pruebas no tenía módulo WWAN (4G LTE), pero puede equiparse con uno.
| Networking | |
| Lenovo ThinkPad P16 G1 21D6001DMB | |
| iperf3 transmit AXE11000 | |
| iperf3 receive AXE11000 | |
| Lenovo ThinkPad P15 G2-20YQ001JGE | |
| iperf3 transmit AX12 | |
| iperf3 receive AX12 | |
| Lenovo ThinkPad P17 G2-20YU0025G | |
| iperf3 transmit AX12 | |
| iperf3 receive AX12 | |
| HP ZBook Fury 17 G8-4A6A9EA | |
| iperf3 transmit AX12 | |
| iperf3 receive AX12 | |
| Dell Precision 7670 | |
| iperf3 transmit AXE11000 6GHz | |
| iperf3 receive AXE11000 6GHz | |
| Asus ExpertBook B6 Flip B6602FC2 | |
| iperf3 transmit AXE11000 6GHz | |
| iperf3 receive AXE11000 6GHz | |
| iperf3 transmit AXE11000 | |
| iperf3 receive AXE11000 | |
Cámara web
En general, la webcam 1080p produce imágenes desvaídas, borrosas y ruidosas.


Seguridad
Además del lector de huellas integrado en el botón de encendido, el Lenovo ThinkPad P16 2022 tiene una cámara de infrarrojos compatible con Windows Hello. El bloqueo Kensington puede ofrecer protección y también hay un lector de tarjetas inteligentes opcional. El Lenovo ThinkPad P16 tiene un chip TPM dedicado y la webcam posee un obturador mecánico.
Accesorios
Aparte de la fuente de alimentación de 170 vatios, completa con un conector Slim Tip, el portátil viene sin accesorios adicionales. El accesorio opcional más importante debería ser un dock como el ThinkPad Thunderbolt 4 Workstation dock
Mantenimiento
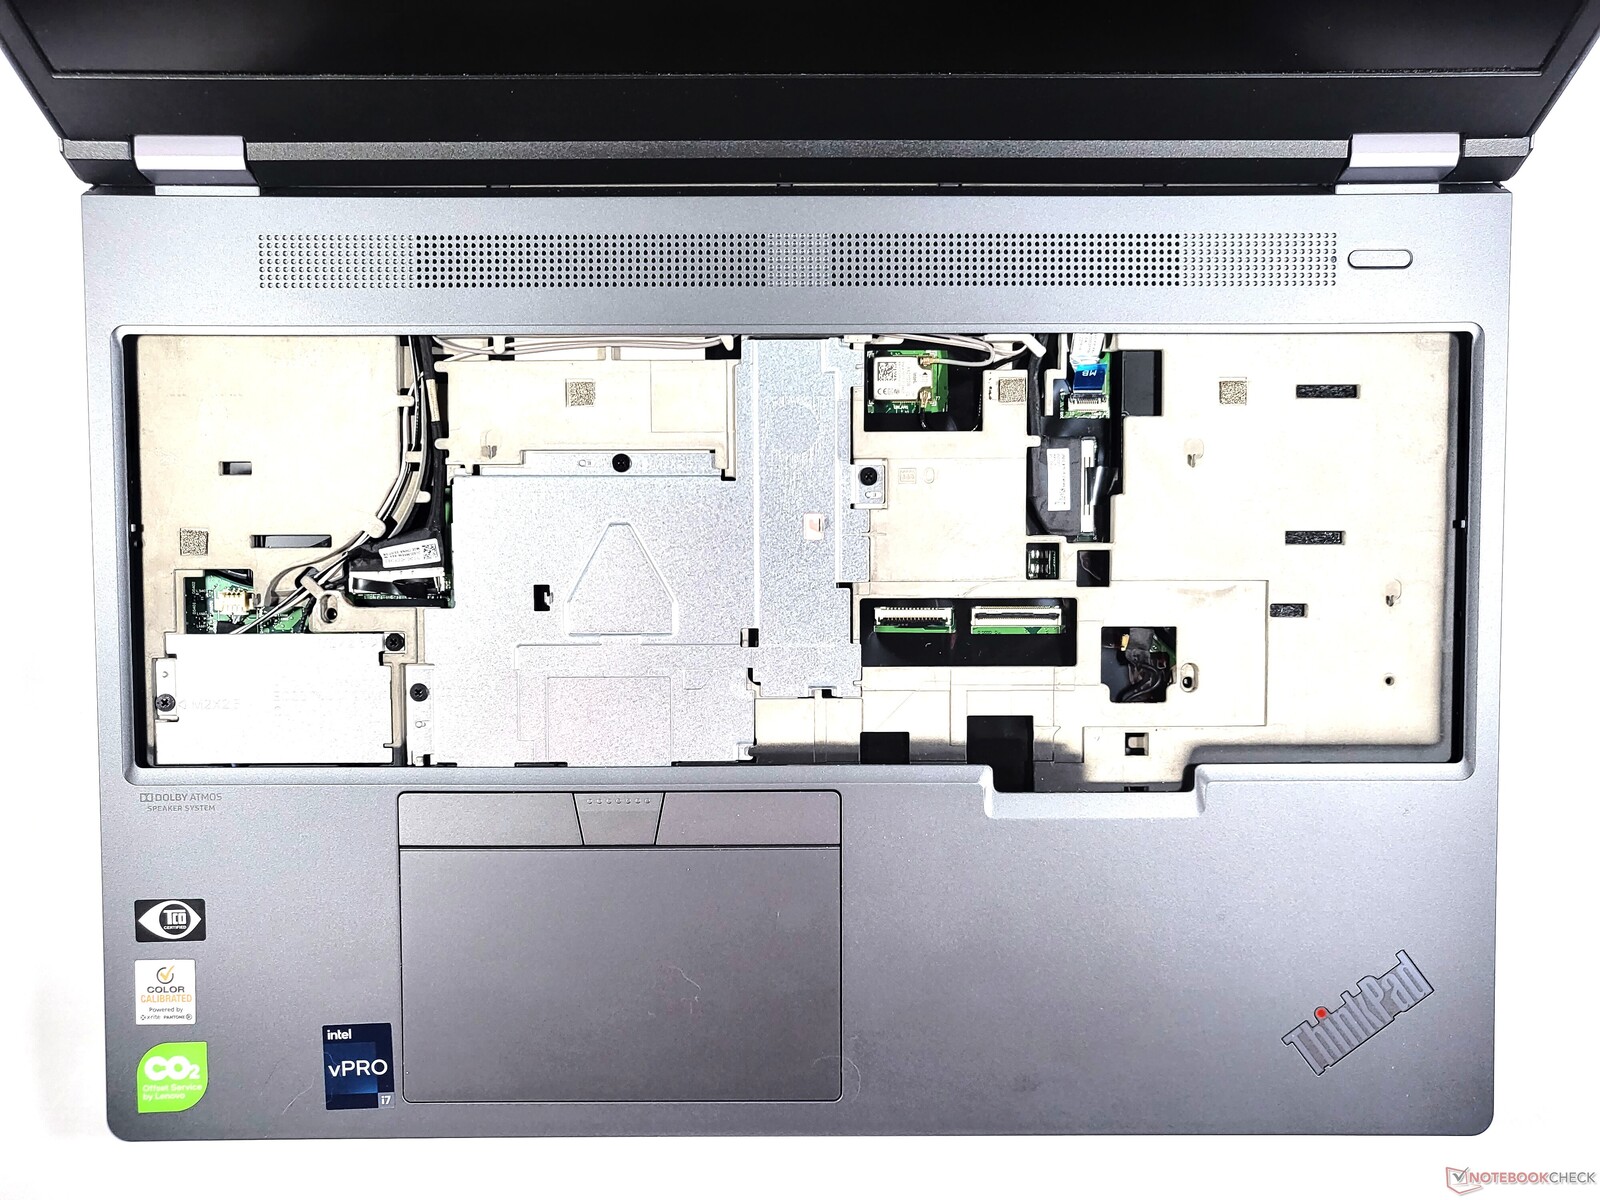
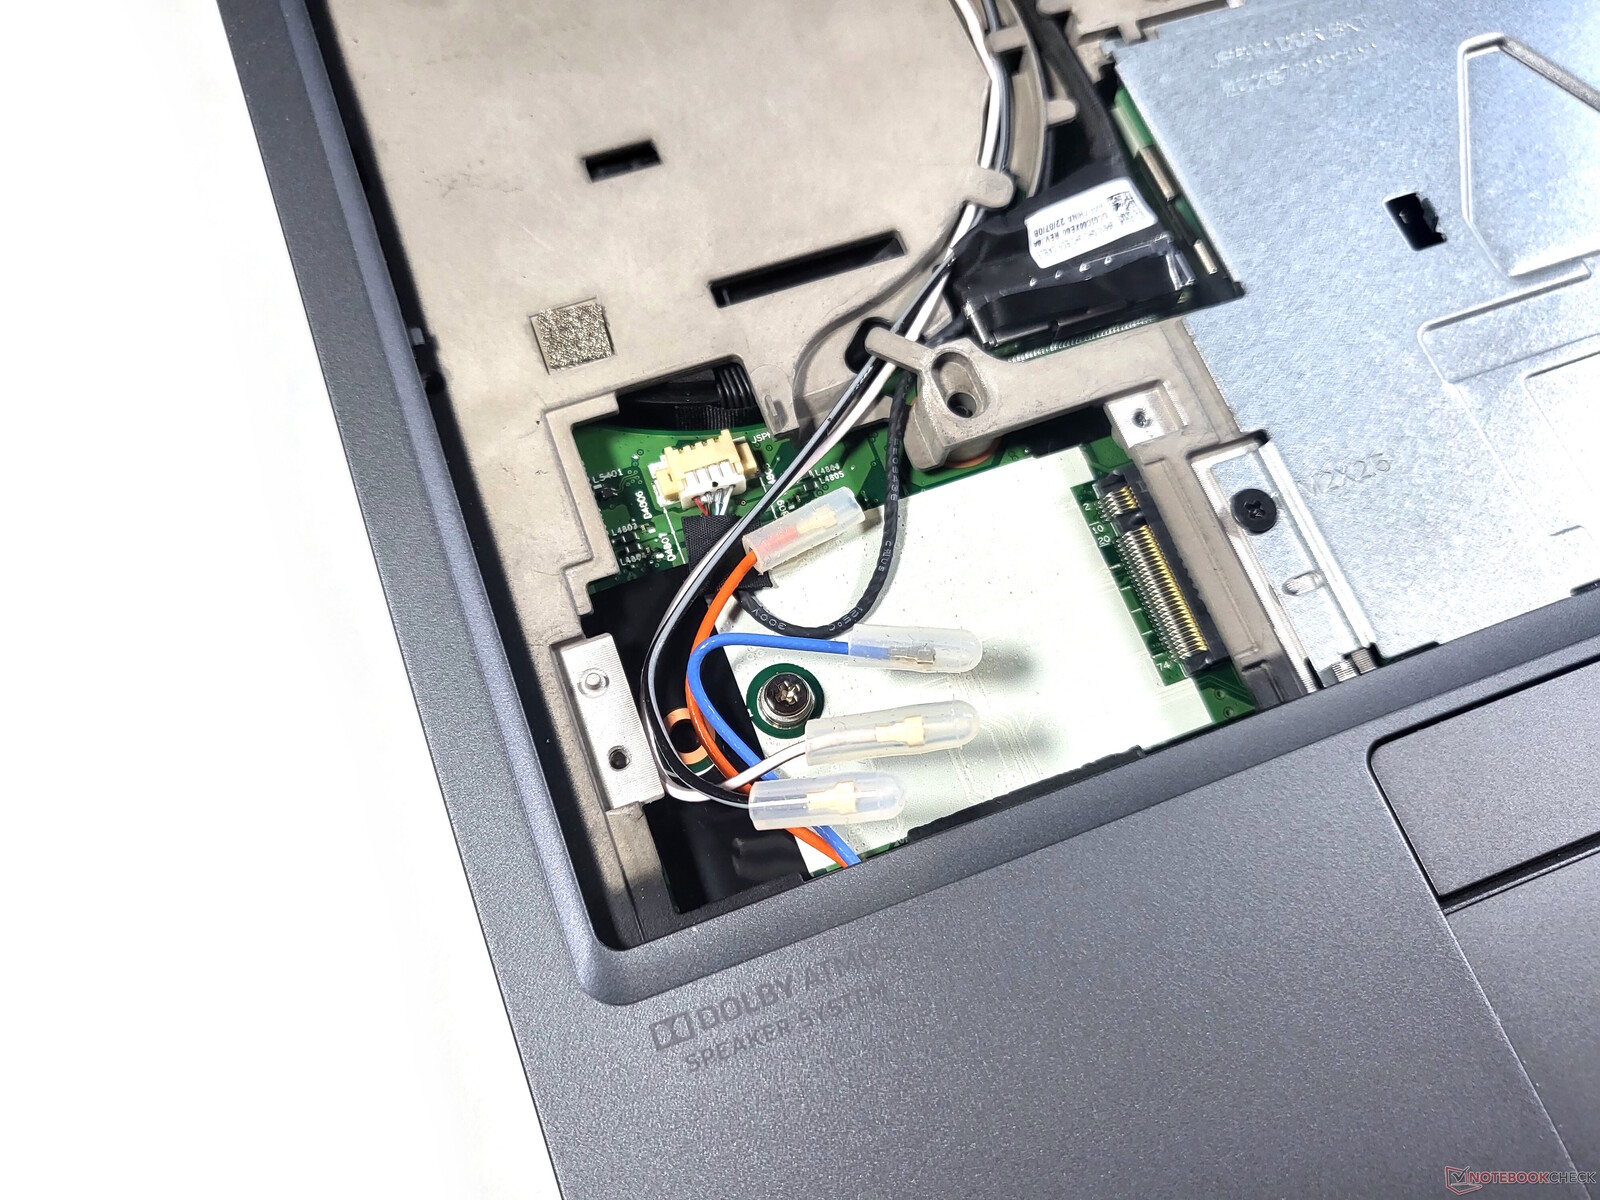
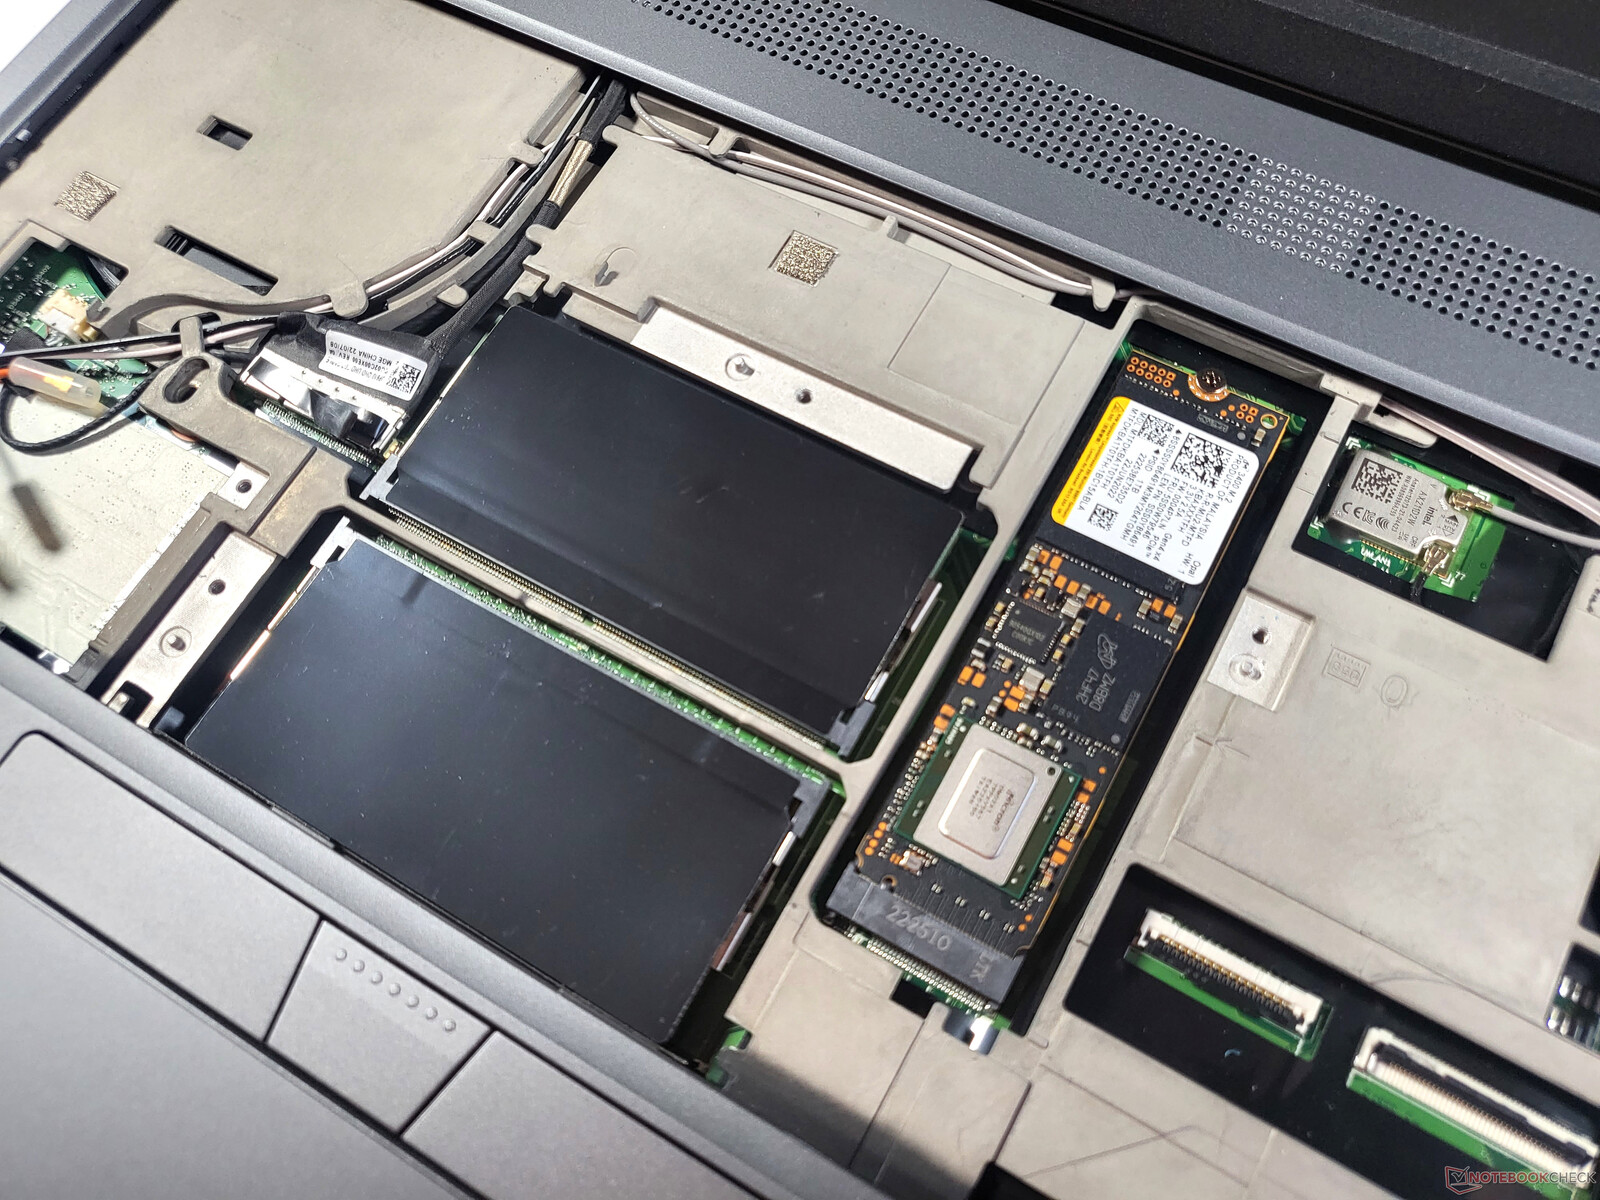
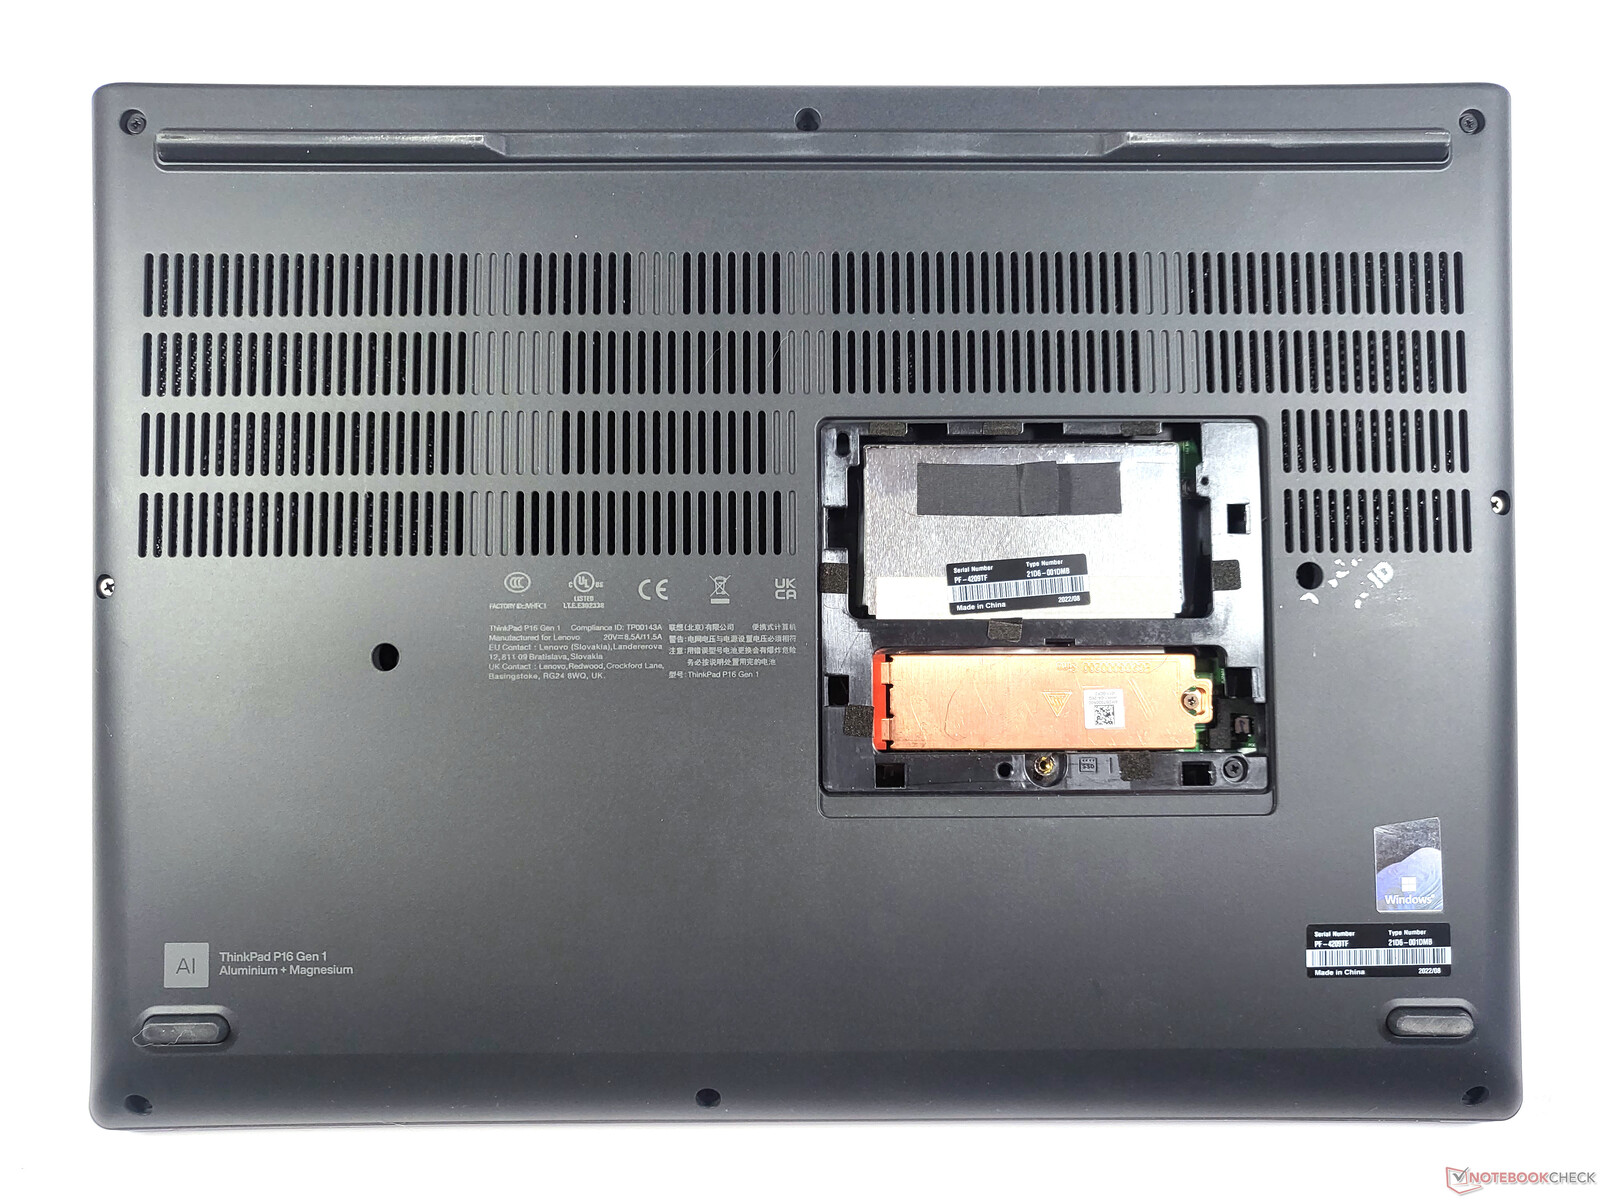
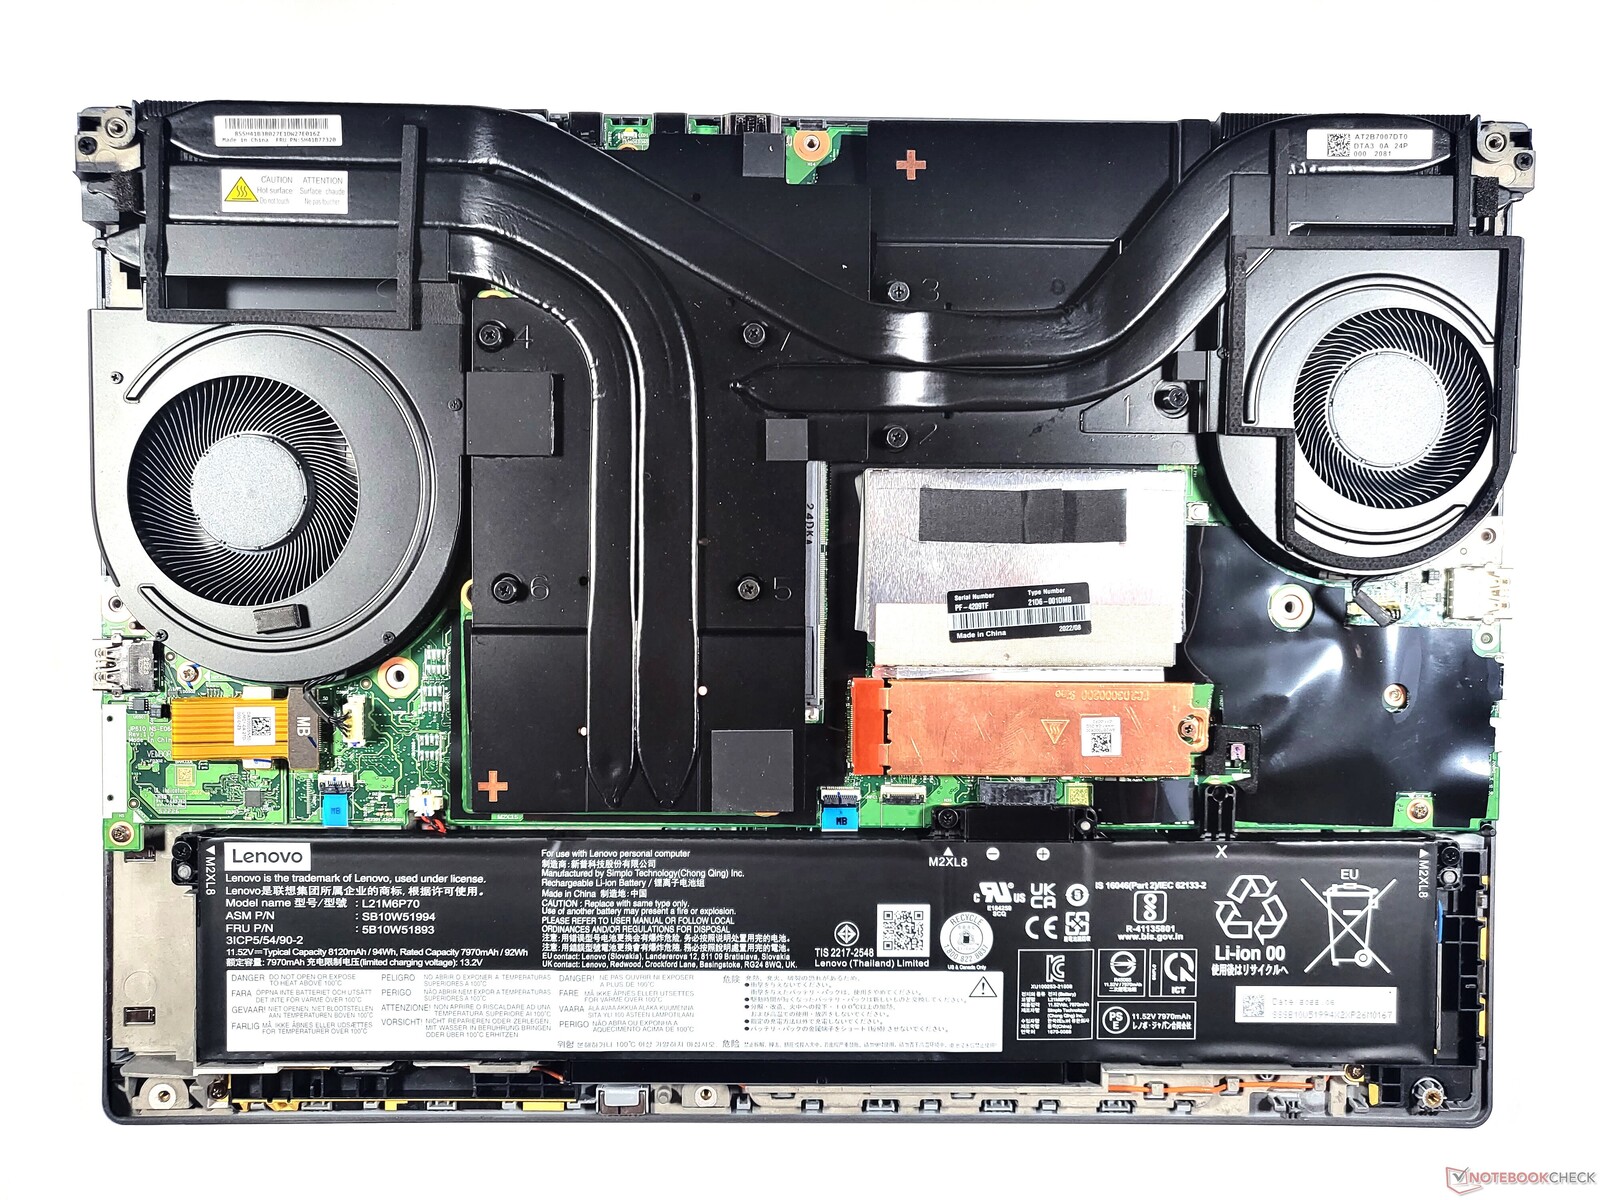
Lenovo ha facilitado mucho el acceso a dos de las cuatro ranuras de RAM, ya que sólo hay que retirar la pequeña tapa de la parte inferior del dispositivo. Aquí también puedes encontrar una ranura M.2 2280 libre. Es un poco más difícil acceder a las otras ranuras RAM, la segunda ranura M.2, el módulo WiFi soldado así como la ranura WWAN: el teclado tiene que abrirse paso para ello. El último obstáculo se presenta en forma de dos cubiertas metálicas. En total, hay otros diez tornillos de estrella adicionales asegurados con ganchos de plástico en la parte inferior del portátil. Al retirar esta parte, se obtiene una visión clara del gran sistema de refrigeración con un total de dos ventiladores y la batería interna.
Todos estos pasos pueden llevarse a cabo sin anular la garantía. Con el manual de mantenimiento del hardware https://download.lenovo.com/pccbbs/mobiles_pdf/p16_gen1_hmm_en.pdf , Lenovo ha proporcionado un conjunto adecuado de instrucciones.
Garantía
El portátil empresarial Lenovo ThinkPad P16 Gen 1 viene con una garantía de 3 años. Por un recargo, también se puede ampliar a cinco años. Nuestro dispositivo de análisis tiene soporte Premier con servicio in situ. Sin embargo, la mayoría de configuraciones ThinkPad P16 requieren el recargo adicional para disfrutar de esta característica. Los clientes sólo tienen derecho a estas opciones de servicio ampliado en Alemania. Internacionalmente, la garantía Bring In está disponible.
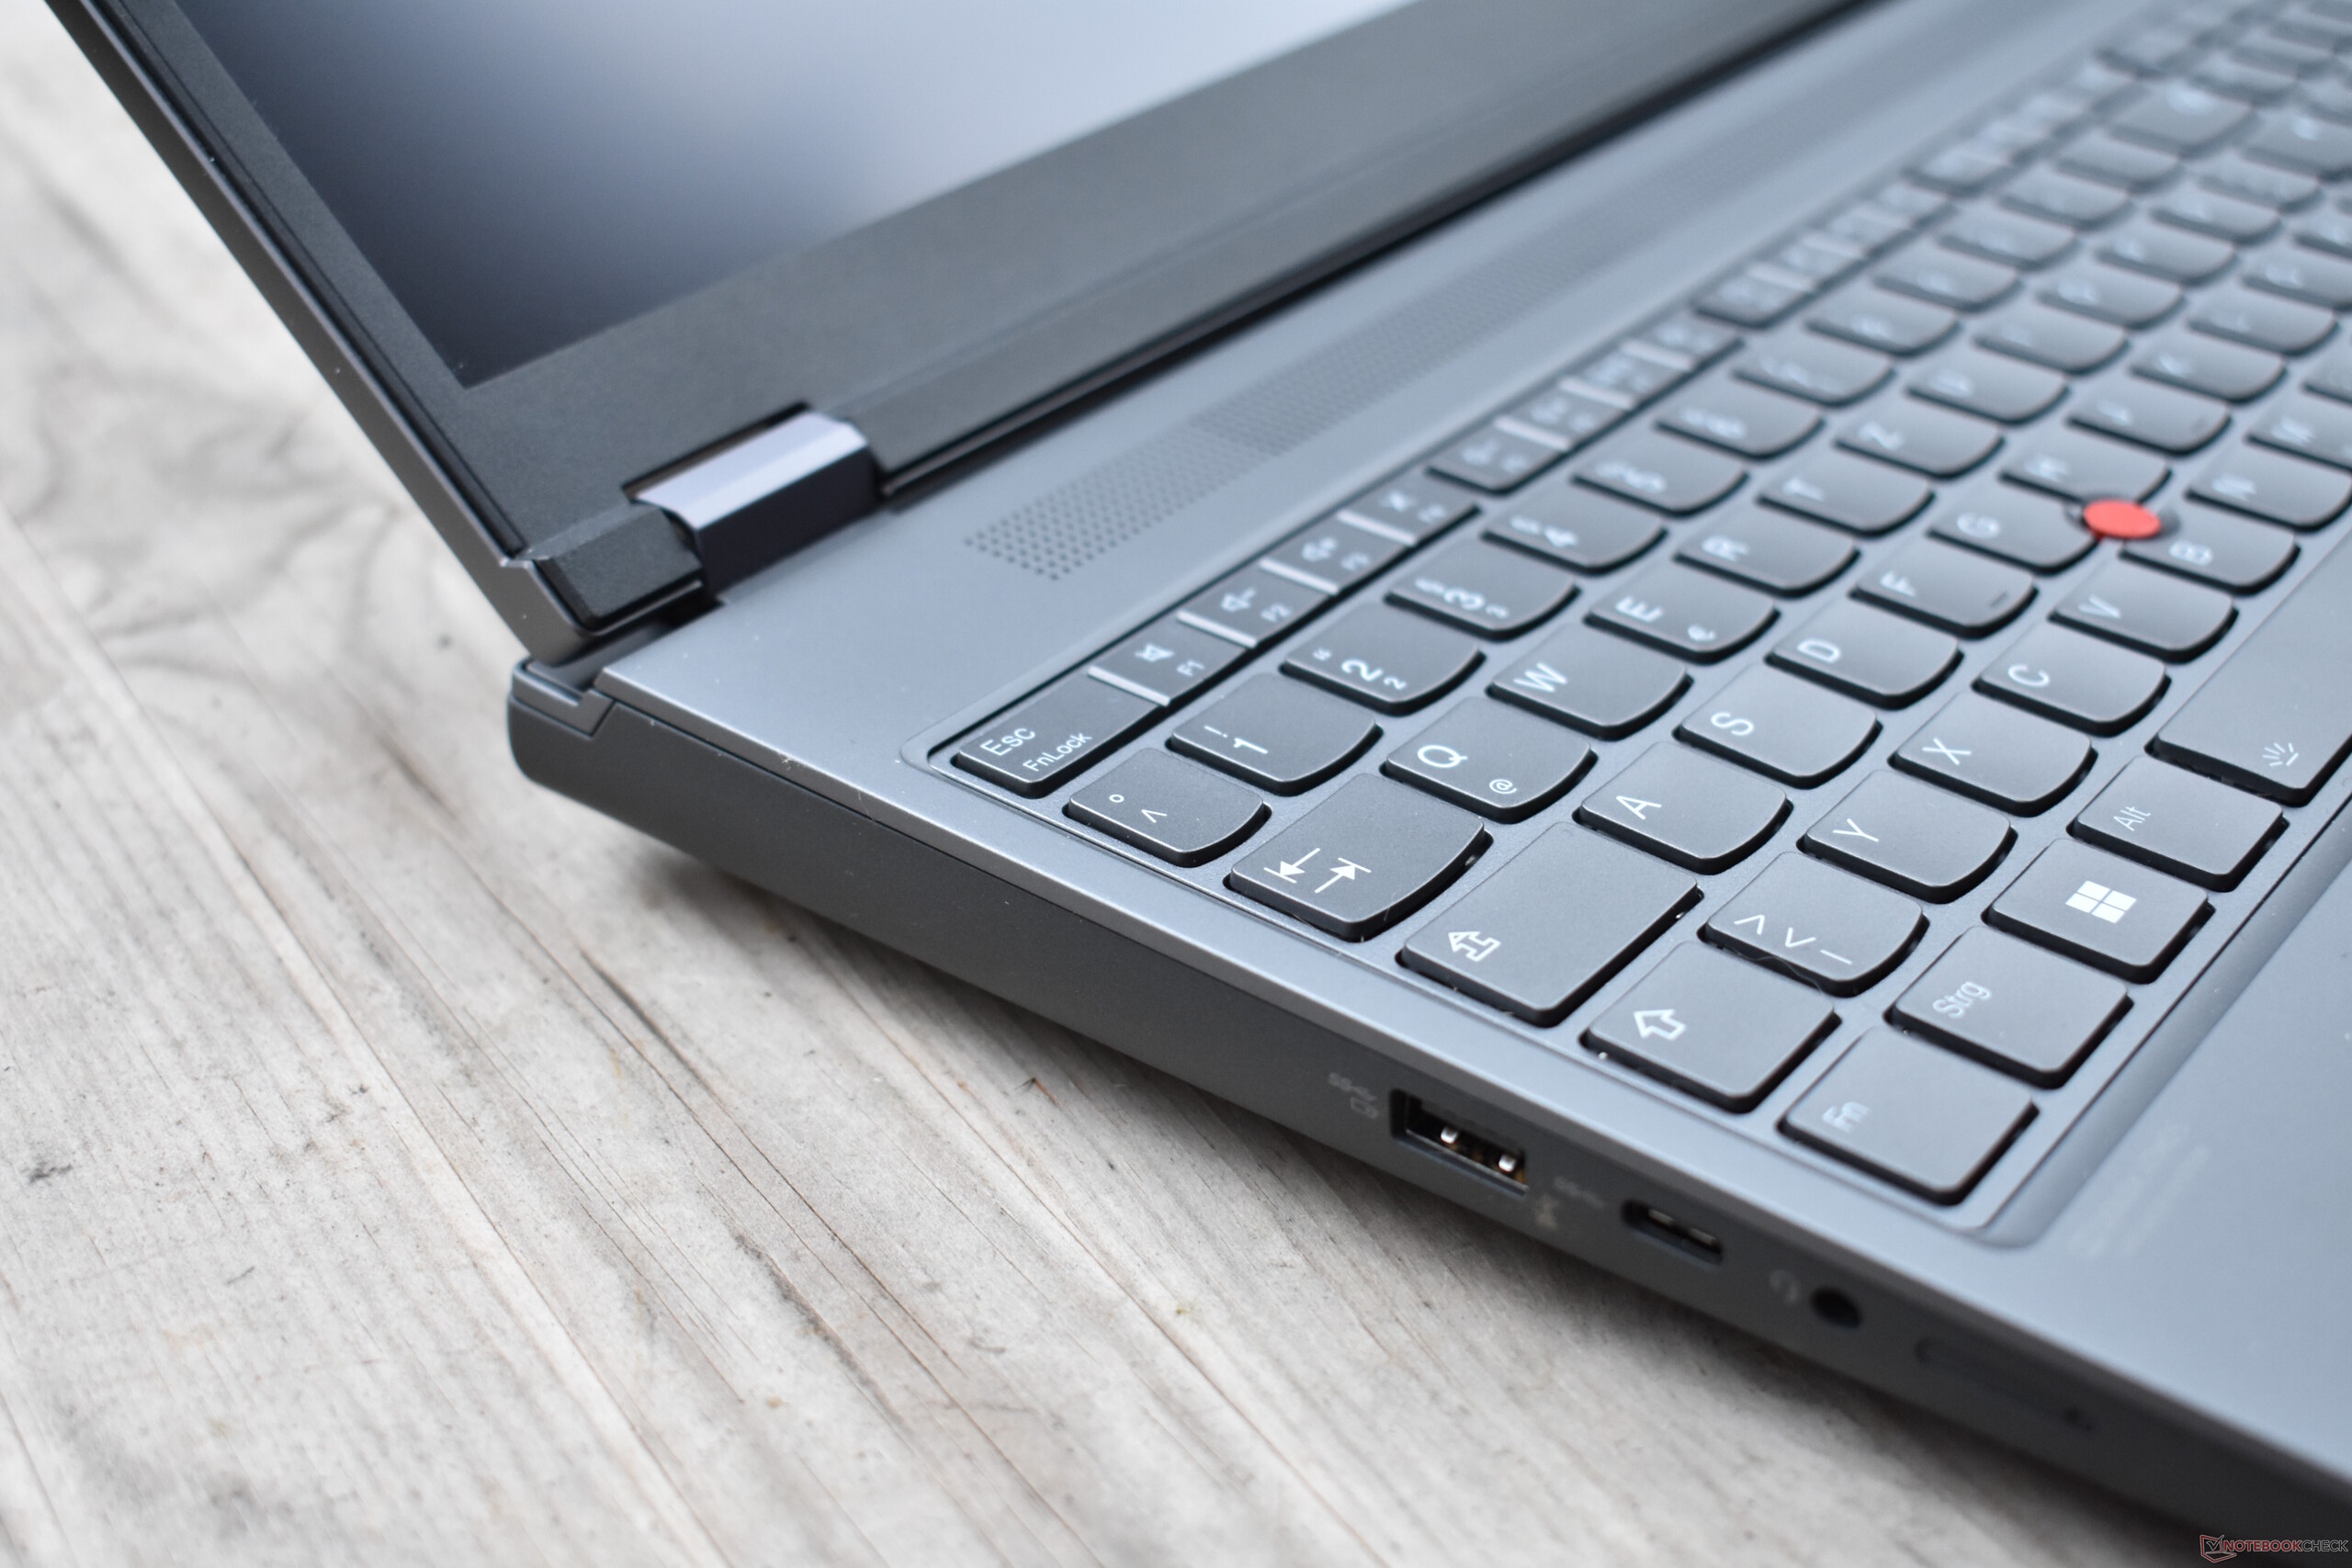
Dispositivos de entrada: El ThinkPad P ahora también tiene un recorrido de tecla de 1,5 mm
Teclado
Empezando por el color, Lenovo ha renovado completamente el teclado del ThinkPad P16. El teclado es ahora gris, lo que, en nuestra opinión, no parece tan premium. Aunque este es un punto de crítica relativamente insignificante, la decisión de reducir el recorrido de las teclas del teclado retroiluminado de 1.8 a ahora sólo 1.5 mm, así como la altura reducida de las teclas, pesan mucho: Como resultado, el teclado ThinkPad pierde un poco del toque especial que tenía antes. No obstante, seguimos ante un teclado muy bueno que ofrece una experiencia de escritura maravillosamente agradable - aunque ahora no hay mucho que separe al dispositivo Lenovo de sus competidores HP y Dell. Es un misterio por qué la propia Lenovo decidió acortar el recorrido de las teclas en una estación de trabajo tan grande y gruesa.
Lenovo no ha hecho ningún cambio en la distribución, con todo como estaba antes. Un cambio es de naturaleza óptica ya que las teclas exteriores son ahora cuadradas en lugar de redondeadas. Como estas no son las teclas de letras, no ha causado un impacto negativo en la experiencia de tecleo. Al igual que las teclas redondeadas, las cuadradas tienen una forma algo cóncava.
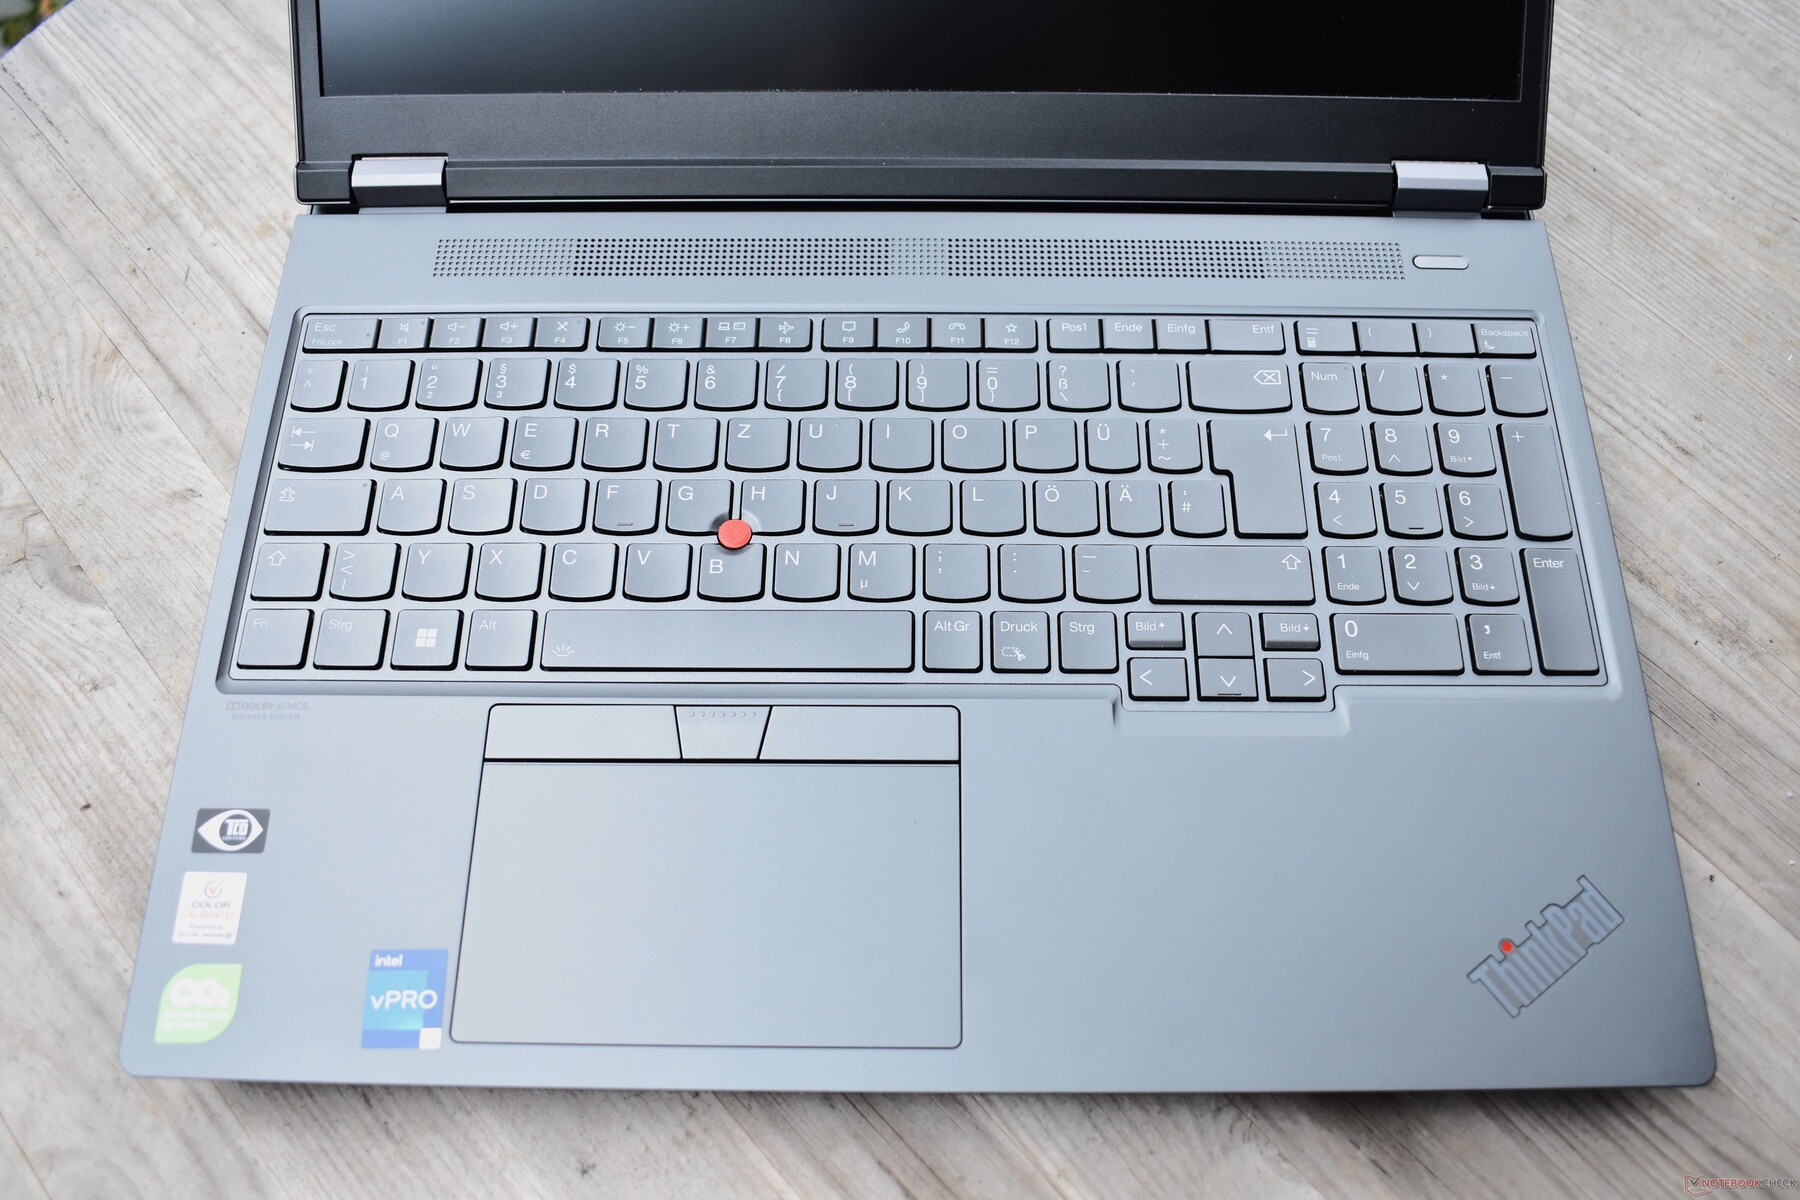
Touchpad y TrackPoint
El touchpad del Lenovo ThinkPad P16 G1 parece más ancho que los modelos predecesores y, a lo ancho, ha crecido 11.5 cm. La superficie está hecha de plástico que se siente aún más suave que su predecesor. En términos de manejo, el touchpad es muy bueno y traduce los gestos multitáctiles de forma excelente. Sin embargo, la respuesta háptica es inferior a la de los trackpads de cristal. Al tratarse de un trackpad mecánico, sólo es posible aplicar clics en la parte inferior del pad. El mecanismo de clic es más bien sordo, pero no traquetea ni se tambalea.
El TrackPoint sigue siendo una buena alternativa al touchpad si hay que mover rápidamente el puntero del ratón mientras se teclea. En comparación con su predecesor, el puntero rojo con tapa de goma no ha cambiado. En cambio, Lenovo ha rediseñado las teclas dedicadas del TrackPoint, que ahora tienen un aspecto más moderno sin perder nada en cuanto a usabilidad.
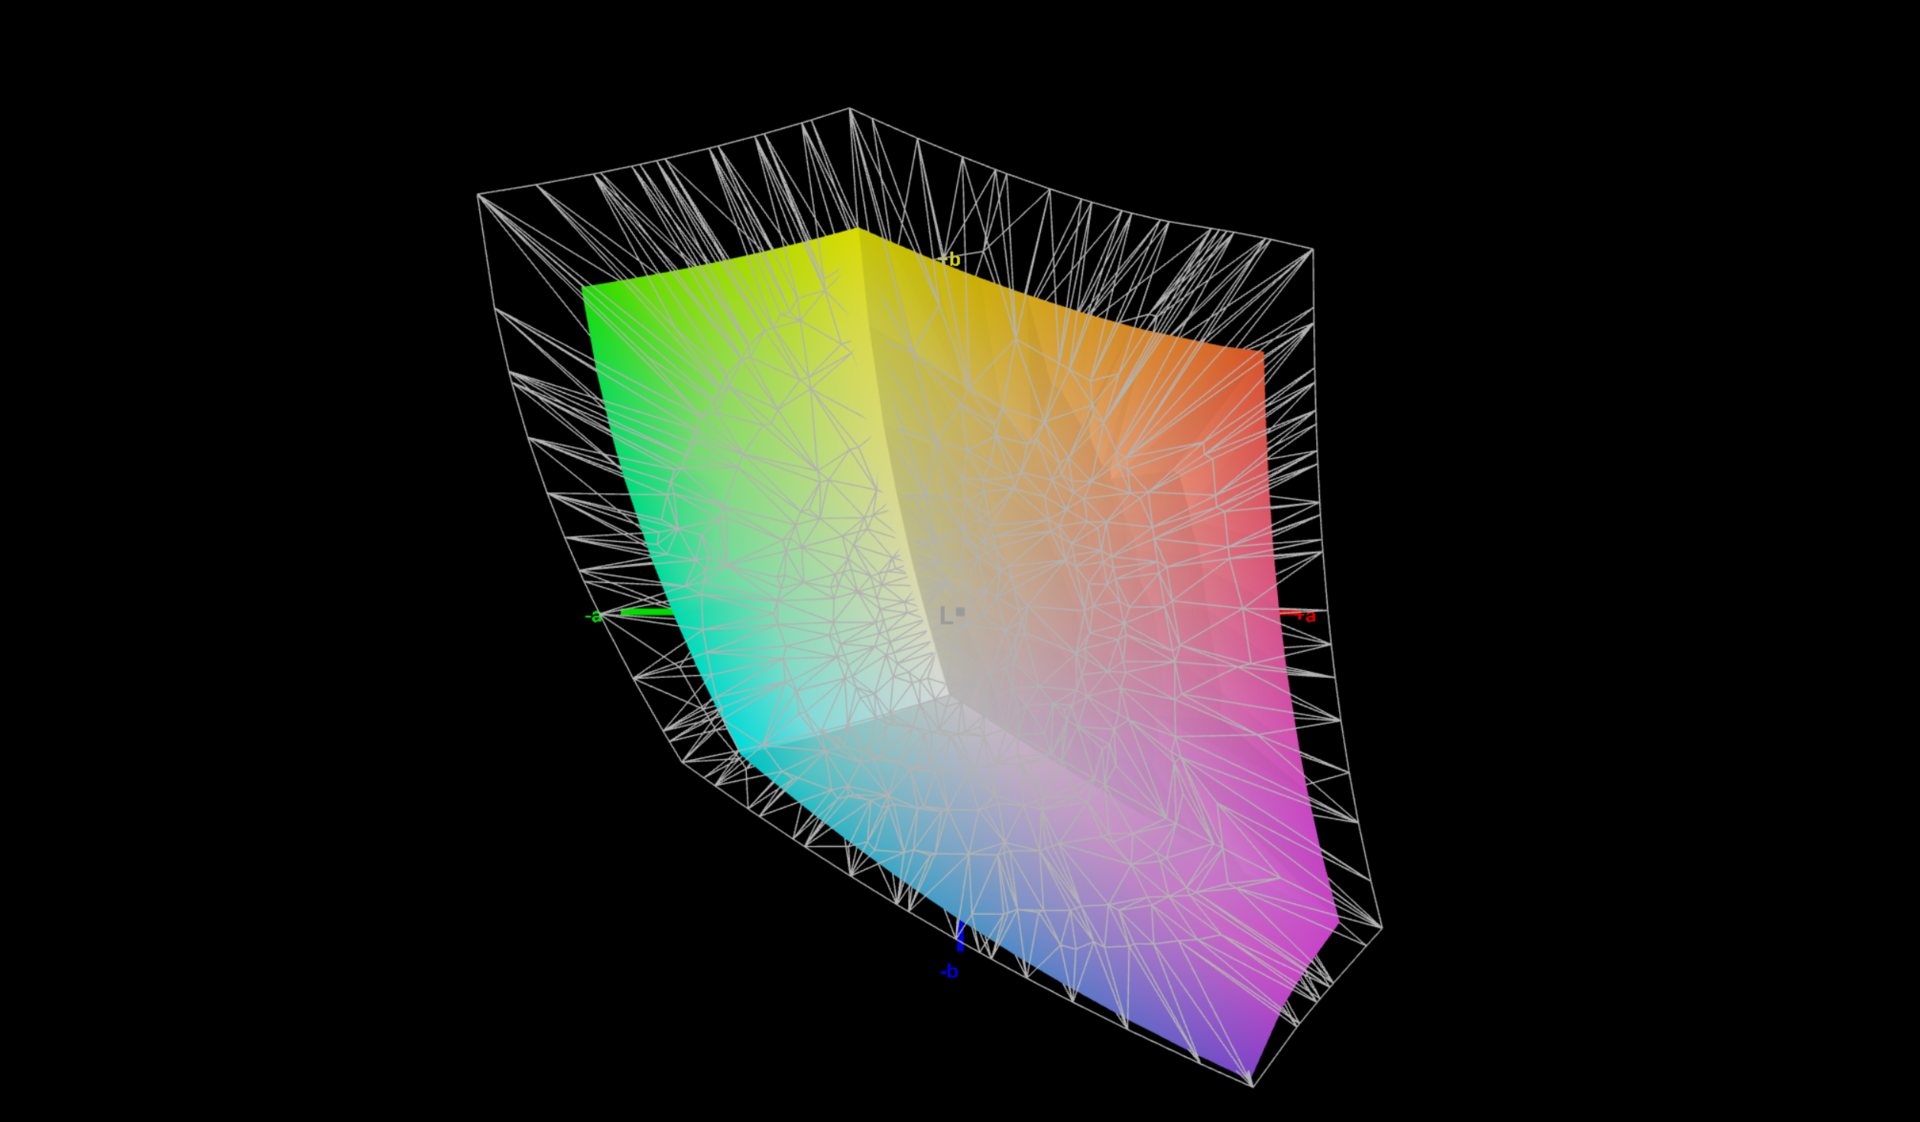
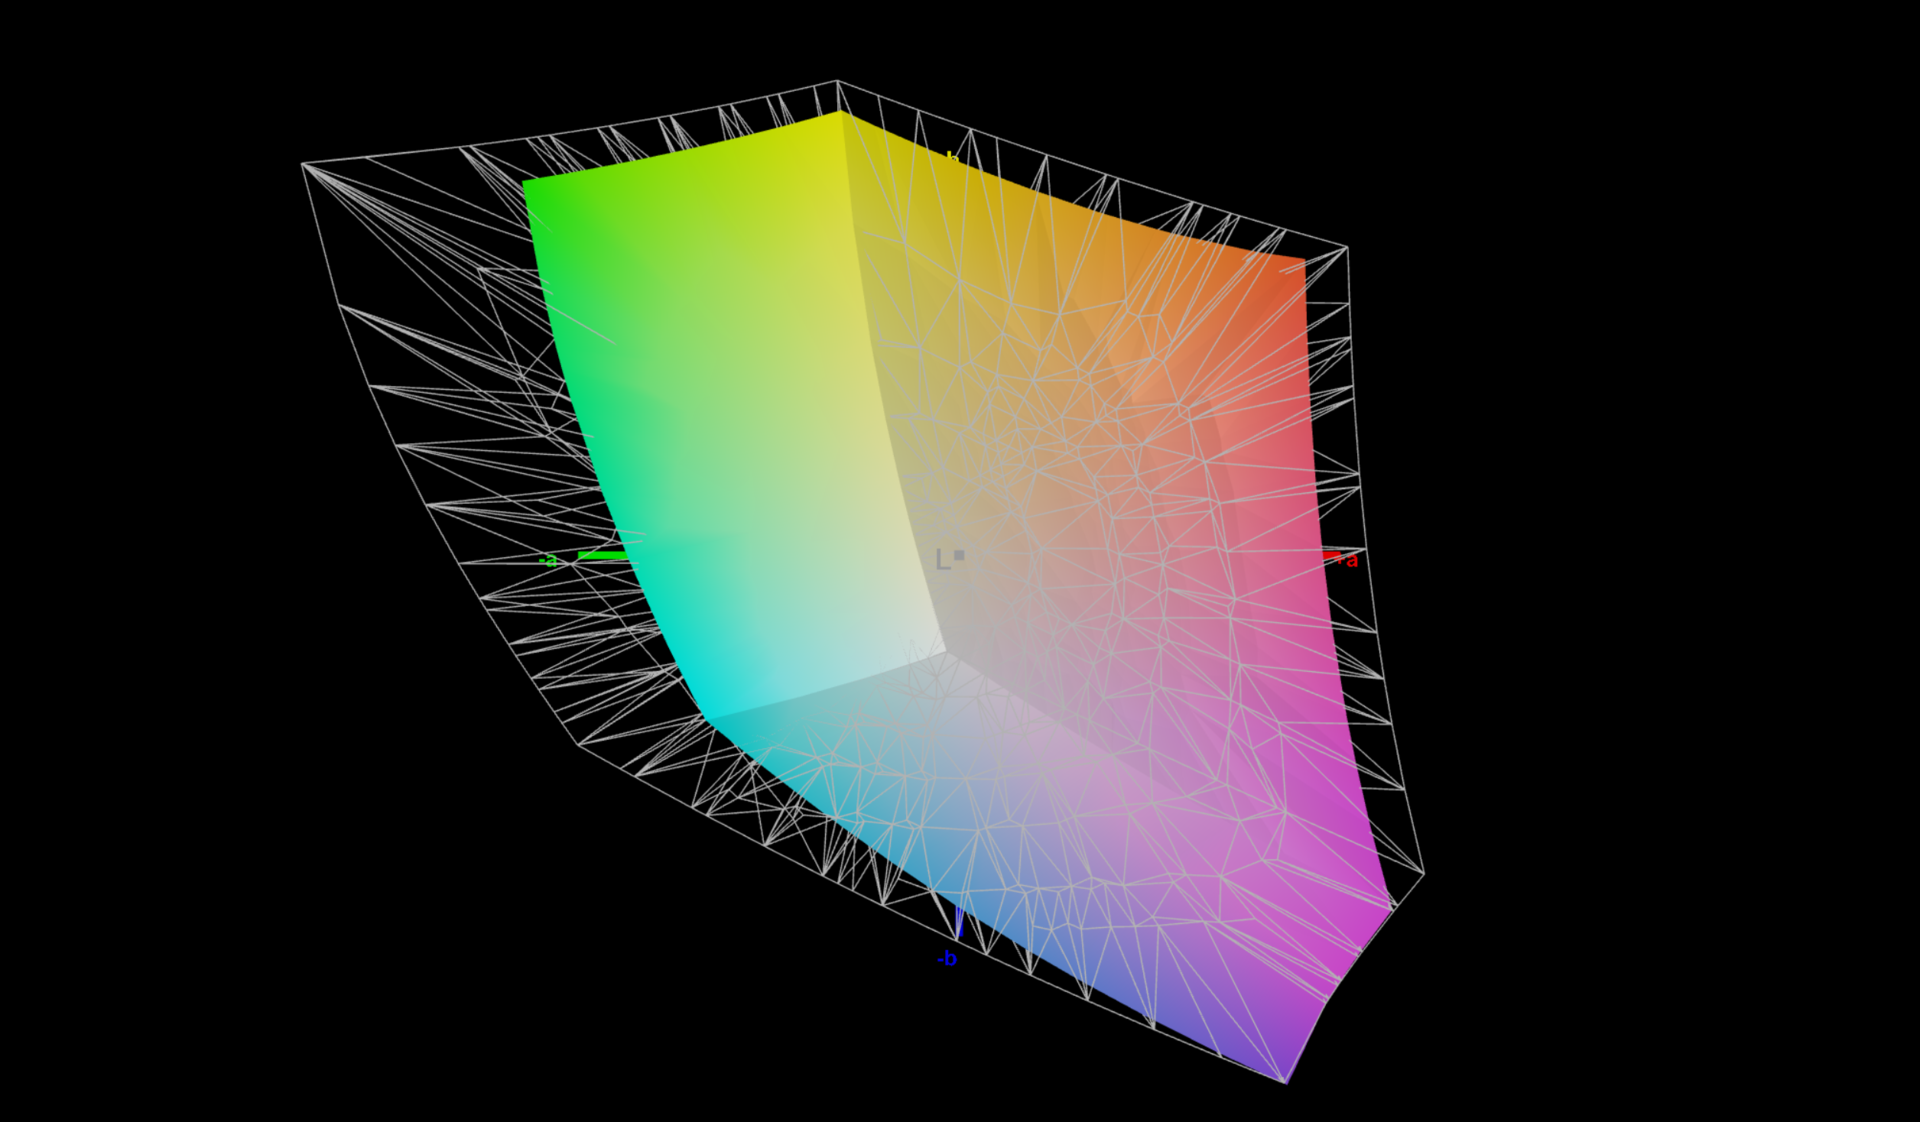
Pantalla: Una nueva opción de pantalla LCD WQXGA para la estación de trabajo Thinkpad
Como es habitual en los portátiles ThinkPad, el Lenovo ThinkPad P16 2022 ofrece una selección de varias opciones de pantalla que cubren una gran variedad de aplicaciones y categorías de precio. Lo que todos tienen en común es una relación de aspecto 16:10 además de ser paneles de 16 pulgadas:
- WUXGA (1920 x 1200), IPS, 300 cd/m², 100 % sRGB, mate
- WQXGA (2560 x 1600), IPS, 400 cd/m², 100 % sRGB, mate
- WQUXGA (3840 x 2400), IPS, 600 cd/m², 100 % AdobeRGB, mate
- WQUXGA (3840 x 2400), OLED, 400 cd/m², 100 % DCI-P3, antirreflejos, multitáctil
El nivel de resolución medio de 2,5K del P16 es nuevo, ya que el P15 y el P17 sólo estaban disponibles en 16:9 con Full-HD (1920 x 1080) o 4K UHD (3840 x 2160). La pantalla WQXGA integrada ofrece los 400 cd/m² anunciados casi en el botón con una media de 398 cd/m². Comparado con sus homólogos directos, esto lo sitúa en la mitad del pelotón. La pantalla del Asus ExpertBook B6 Flip es marginalmente más brillante.
| |||||||||||||||||||||||||
iluminación: 90 %
Brillo con batería: 424 cd/m²
Contraste: 1767:1 (Negro: 0.24 cd/m²)
ΔE ColorChecker Calman: 2.6 | ∀{0.5-29.43 Ø4.71}
calibrated: 0.8
ΔE Greyscale Calman: 4.1 | ∀{0.09-98 Ø4.96}
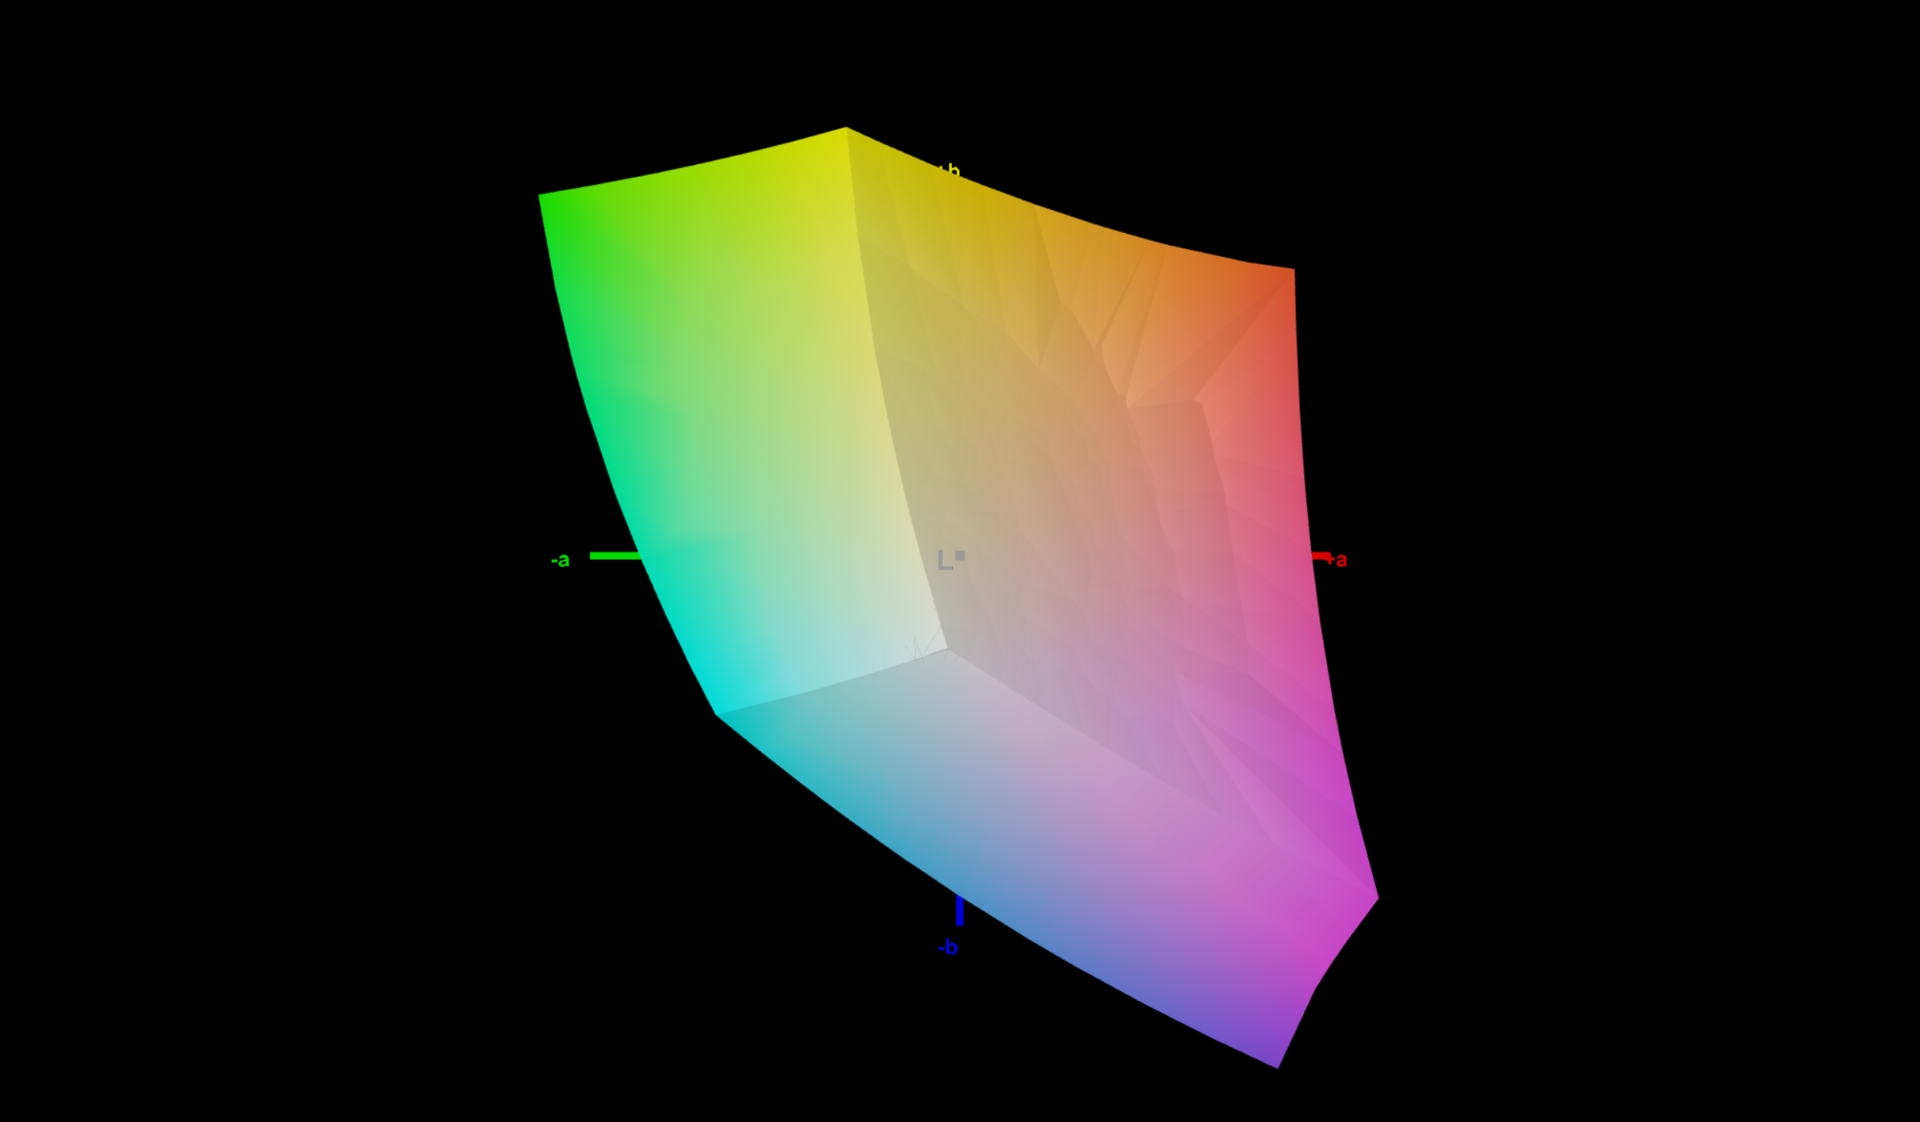
73.3% AdobeRGB 1998 (Argyll 3D)
100% sRGB (Argyll 3D)
71.5% Display P3 (Argyll 3D)
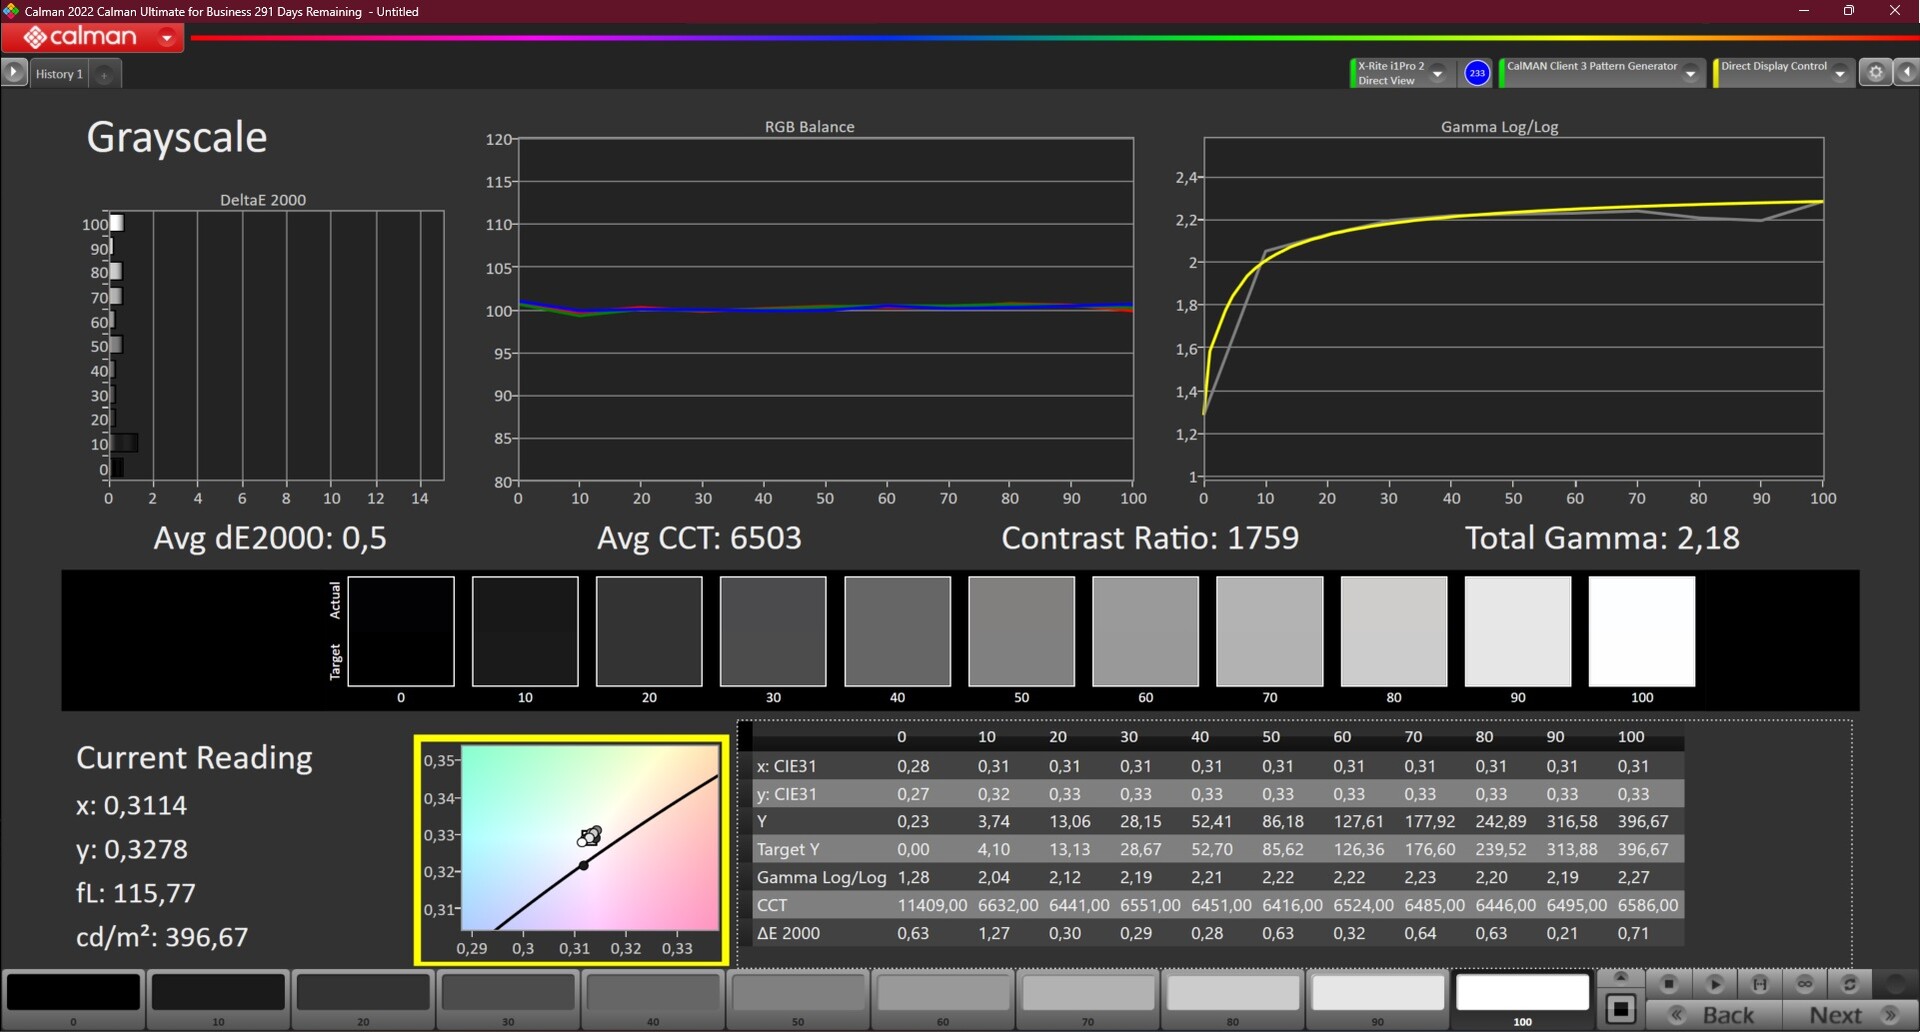
Gamma: 2.13
CCT: 7252 K
| Lenovo ThinkPad P16 G1 21D6001DMB NE160QDM-N63 , IPS LED, 2560x1600, 16" | Lenovo ThinkPad P15 G2-20YQ001JGE N156HCE_GN1, IPS, 1920x1080, 15.6" | Lenovo ThinkPad P17 G2-20YU0025G LP173WF4-SPF7, IPS LED, 1920x1080, 17.3" | HP ZBook Fury 17 G8-4A6A9EA AUOCD8C, IPS, 3840x2160, 17.3" | Dell Precision 7670 Samsung 160YV03, OLED, 3840x2400, 16" | Asus ExpertBook B6 Flip B6602FC2 AU Optronics Model: AUOE495, IPS, 2560x1600, 16" | |
|---|---|---|---|---|---|---|
| Display | -3% | -10% | 19% | 24% | 18% | |
| Display P3 Coverage (%) | 71.5 | 68.6 -4% | 67.9 -5% | 99.1 39% | 99.9 40% | 97.9 37% |
| sRGB Coverage (%) | 100 | 99.8 0% | 87.3 -13% | 100 0% | 100 0% | 99.89 0% |
| AdobeRGB 1998 Coverage (%) | 73.3 | 70.6 -4% | 63.9 -13% | 86.8 18% | 97.5 33% | 85.52 17% |
| Response Times | 20% | 6% | -41% | 94% | 20% | |
| Response Time Grey 50% / Grey 80% * (ms) | 37.7 ? | 37.6 ? -0% | 39.2 ? -4% | 67.6 ? -79% | 1.9 ? 95% | 36 ? 5% |
| Response Time Black / White * (ms) | 26.3 ? | 16 ? 39% | 22.4 ? 15% | 26.8 ? -2% | 2 ? 92% | 17 ? 35% |
| PWM Frequency (Hz) | 26040 ? | 59.5 ? | ||||
| Screen | -3% | -77% | 27% | -12% | -27% | |
| Brightness middle (cd/m²) | 424 | 498 17% | 361 -15% | 568 34% | 340.1 -20% | 440 4% |
| Brightness (cd/m²) | 398 | 490 23% | 334 -16% | 564 42% | 342 -14% | 418 5% |
| Brightness Distribution (%) | 90 | 95 6% | 87 -3% | 88 -2% | 98 9% | 82 -9% |
| Black Level * (cd/m²) | 0.24 | 0.39 -63% | 0.35 -46% | 0.33 -38% | 0.3 -25% | |
| Contrast (:1) | 1767 | 1277 -28% | 1031 -42% | 1721 -3% | 1467 -17% | |
| Colorchecker dE 2000 * | 2.6 | 2.1 19% | 5.4 -108% | 1 62% | 2.5 4% | 2.81 -8% |
| Colorchecker dE 2000 max. * | 4.9 | 5.6 -14% | 9.9 -102% | 2.4 51% | 8.19 -67% | 4.62 6% |
| Colorchecker dE 2000 calibrated * | 0.8 | 0.8 -0% | 3.2 -300% | 0.5 37% | 2.99 -274% | |
| Greyscale dE 2000 * | 4.1 | 3.4 17% | 6.5 -59% | 1.7 59% | 3.5 15% | 0.91 78% |
| Gamma | 2.13 103% | 2.32 95% | 2.23 99% | 2.18 101% | 2.12 104% | 2.2 100% |
| CCT | 7252 90% | 7162 91% | 7351 88% | 6461 101% | 6704 97% | 6600 98% |
| Media total (Programa/Opciones) | 5% /
1% | -27% /
-51% | 2% /
16% | 35% /
17% | 4% /
-10% |
* ... más pequeño es mejor
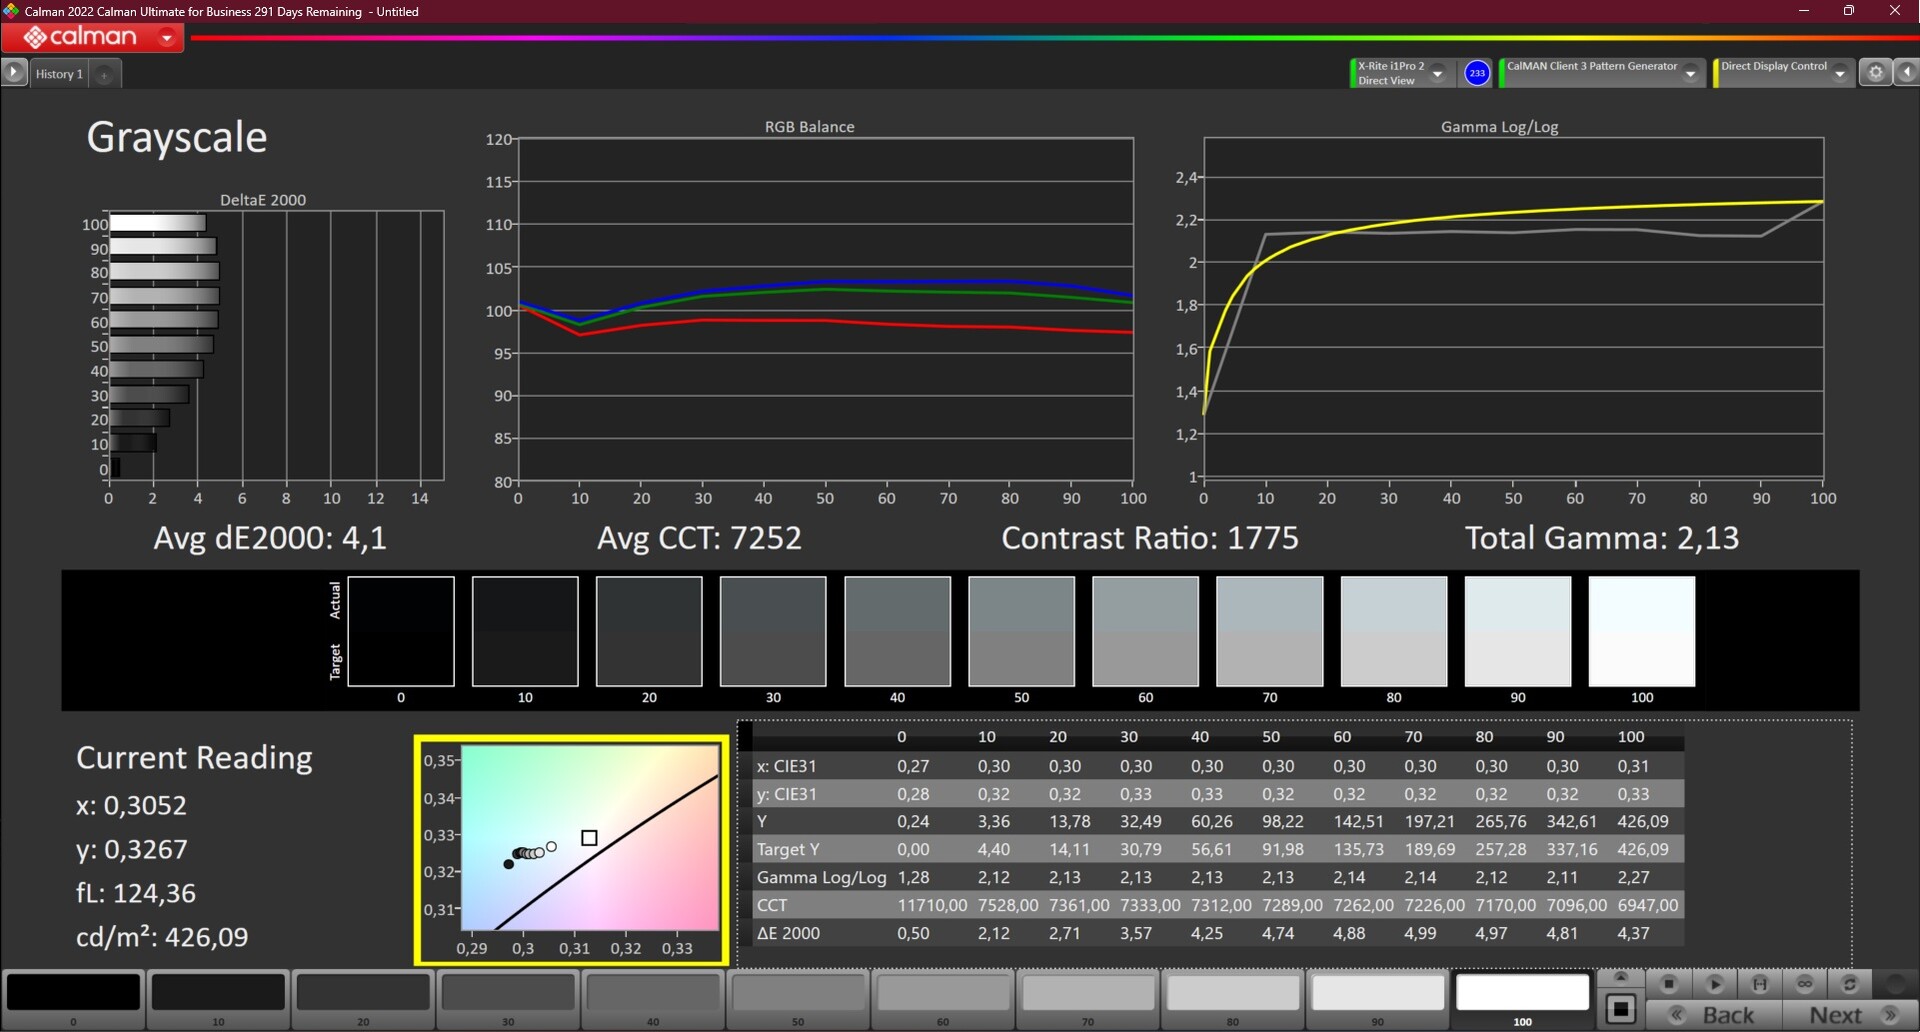
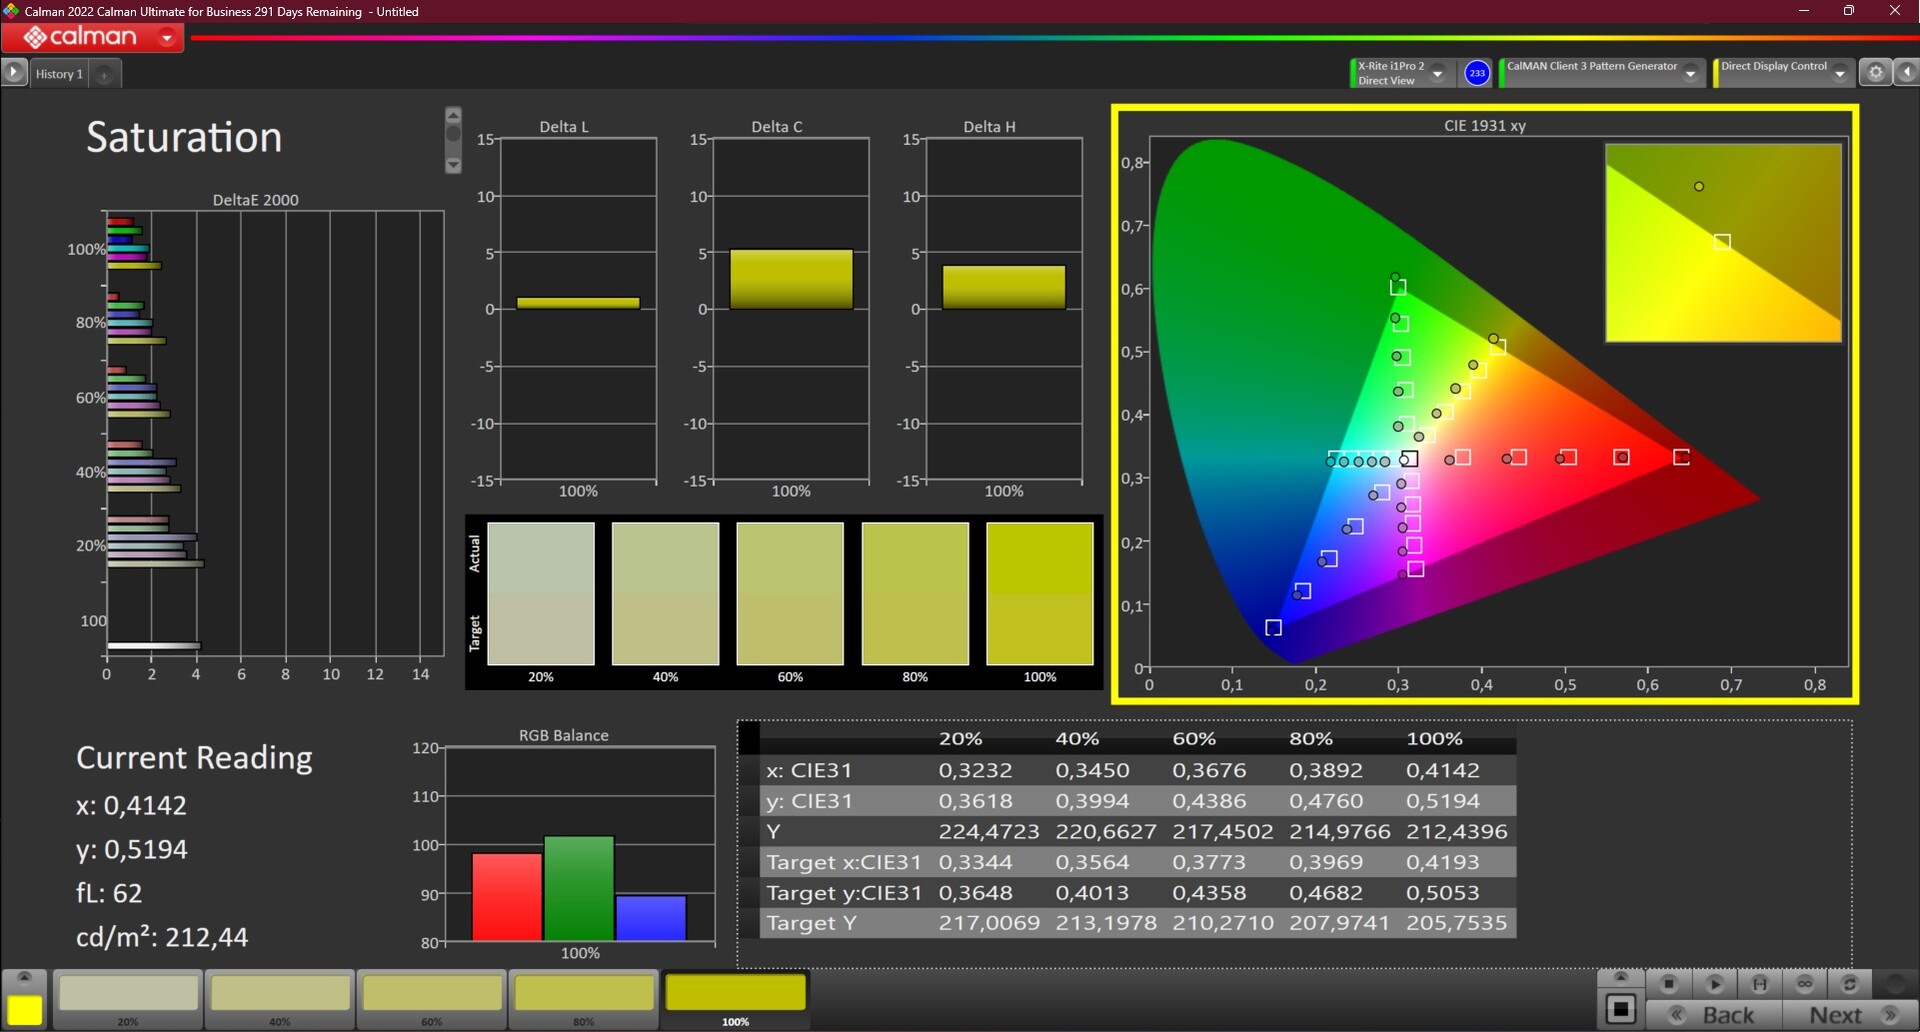
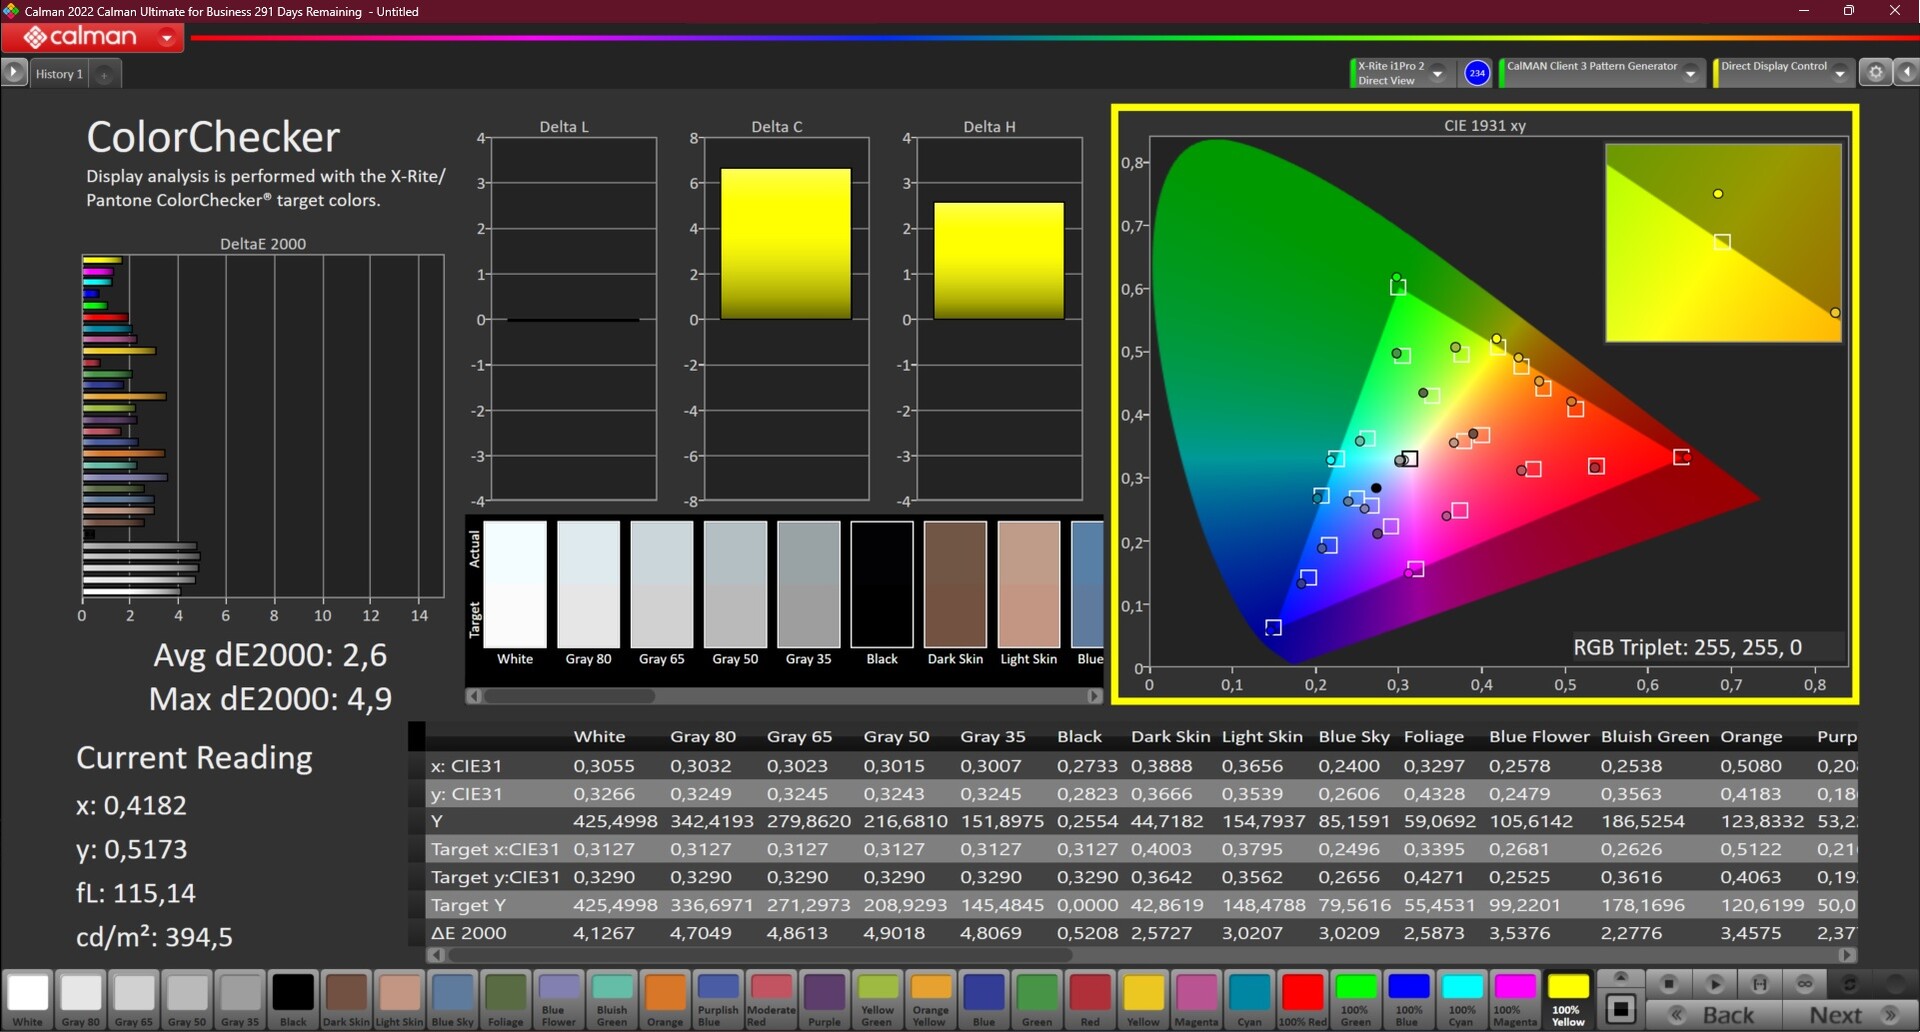
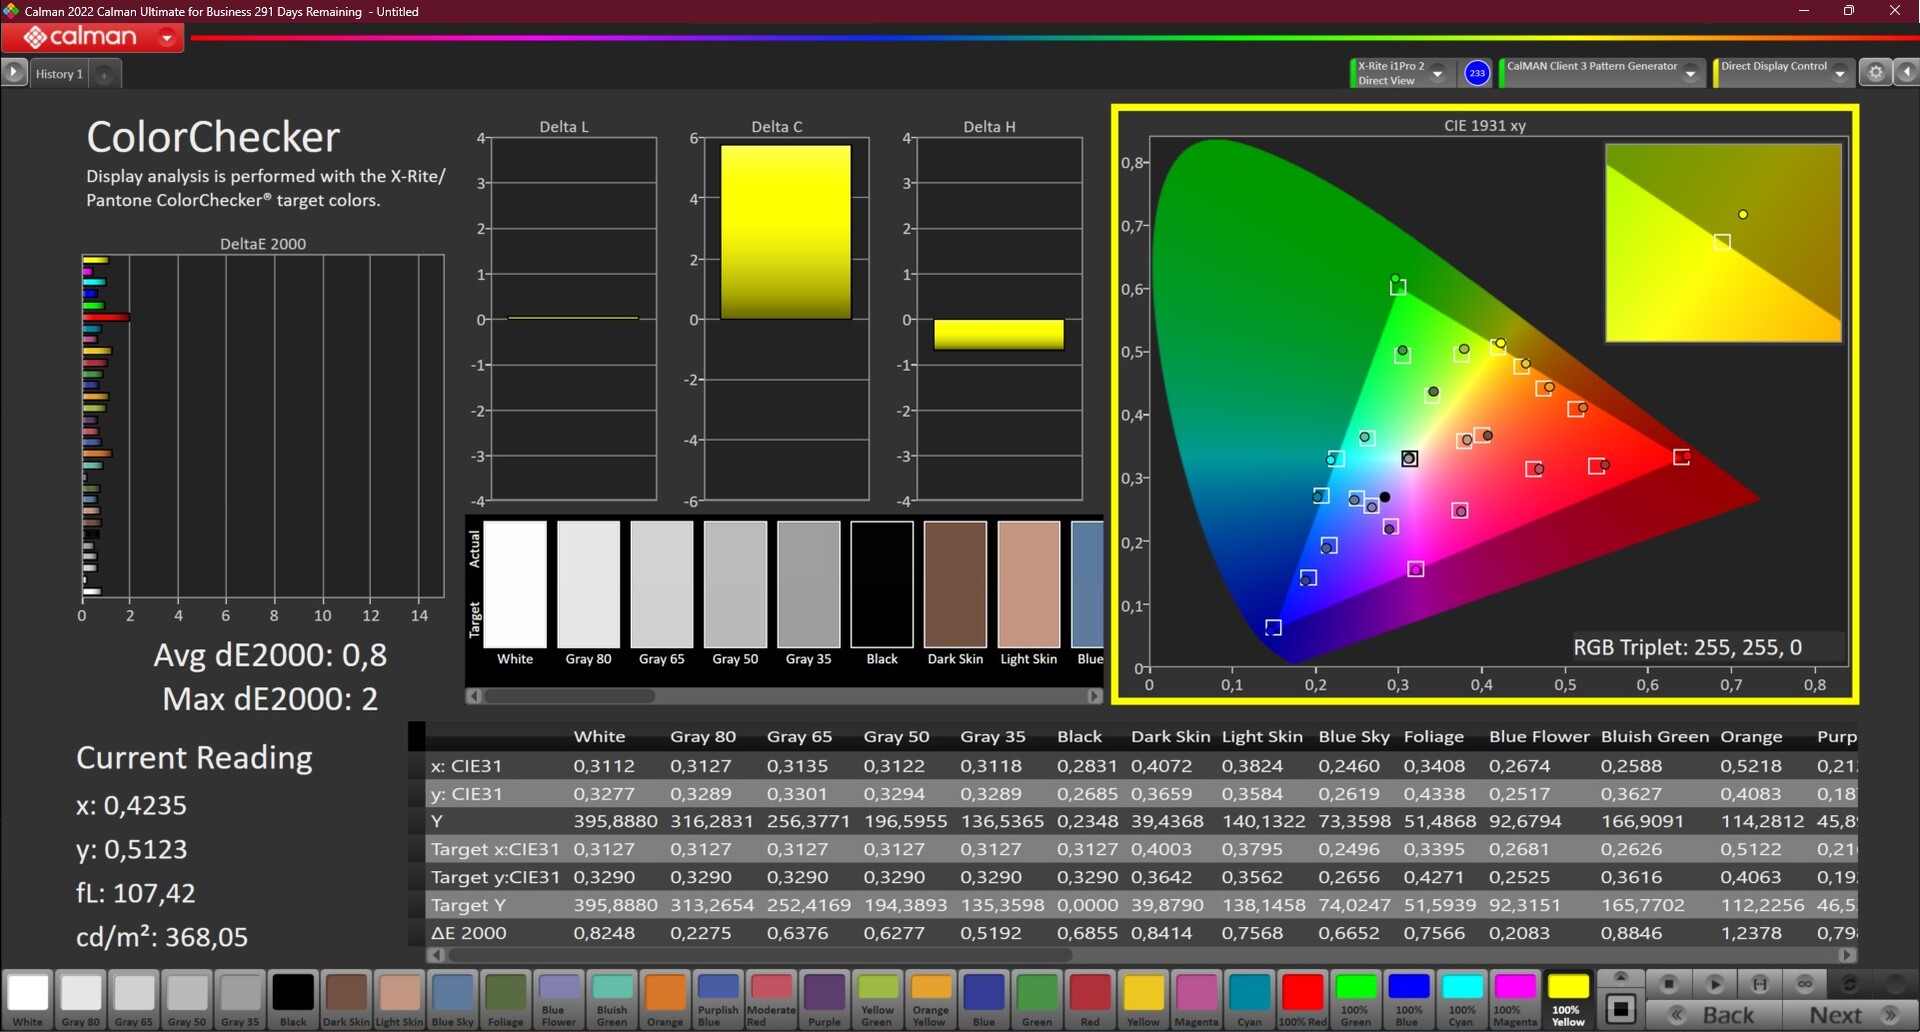
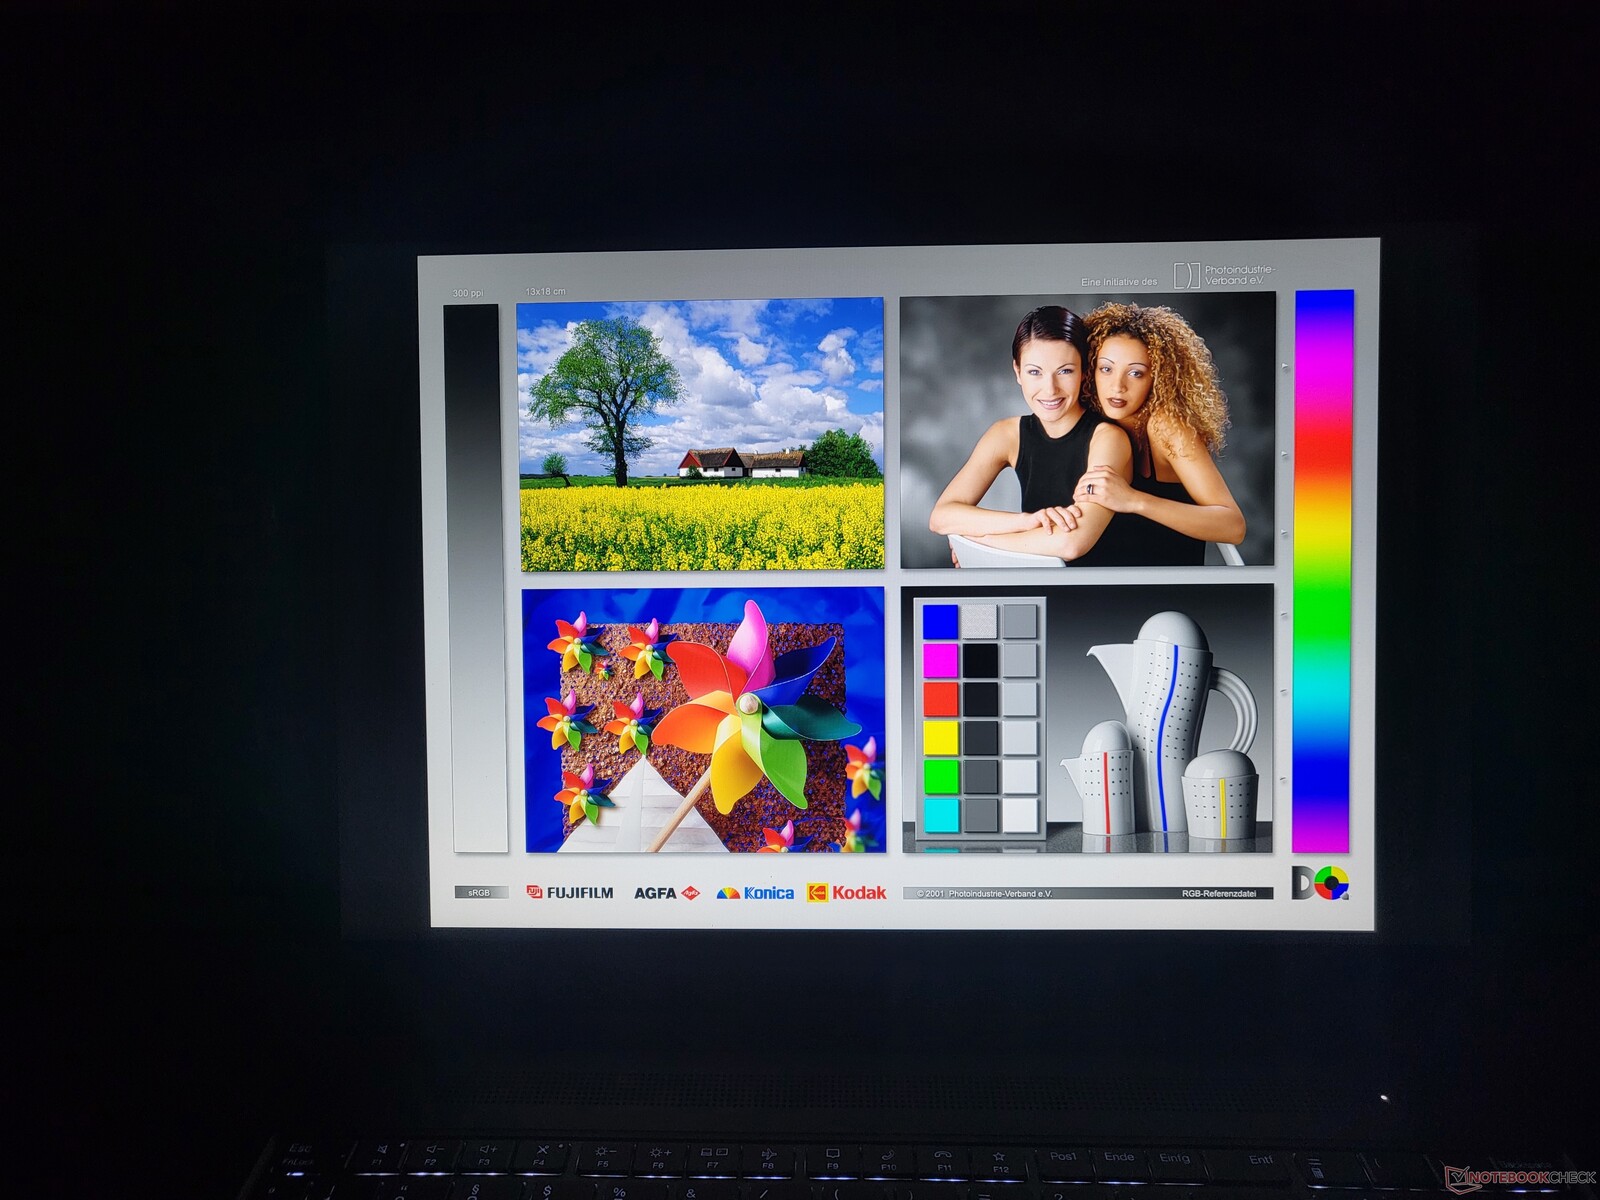
Al sacarlo de la caja, los colores estaban ajustados un poco demasiado fríos, lo que pudimos medir utilizando CalMan y el colorímetro X-Rite i1Pro 2. La calibración ayudó a corregirlo y también contribuyó a lograr un excelente valor DeltaE de 0,8. La calibración ayudó a corregirlo y también contribuyó a lograr un excelente valor DeltaE de 0,8. Como siempre, el perfil que creamos está disponible para su descarga gratuita.
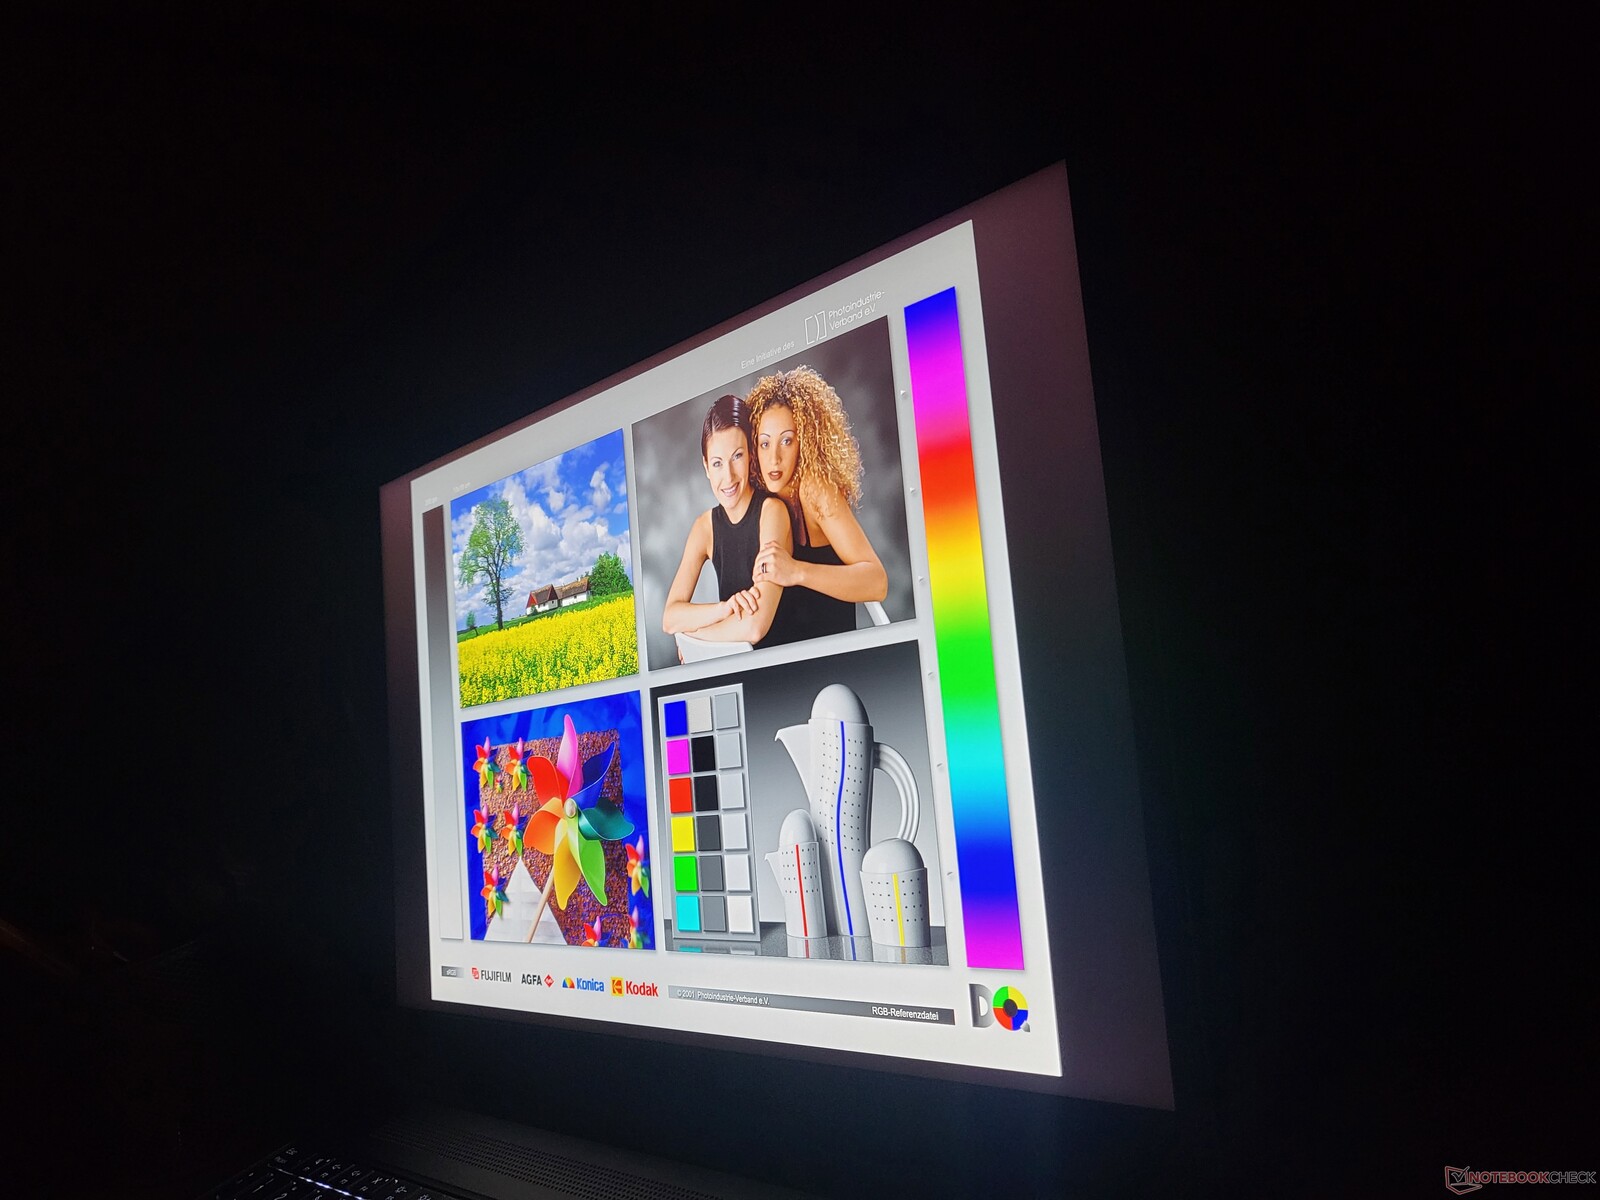
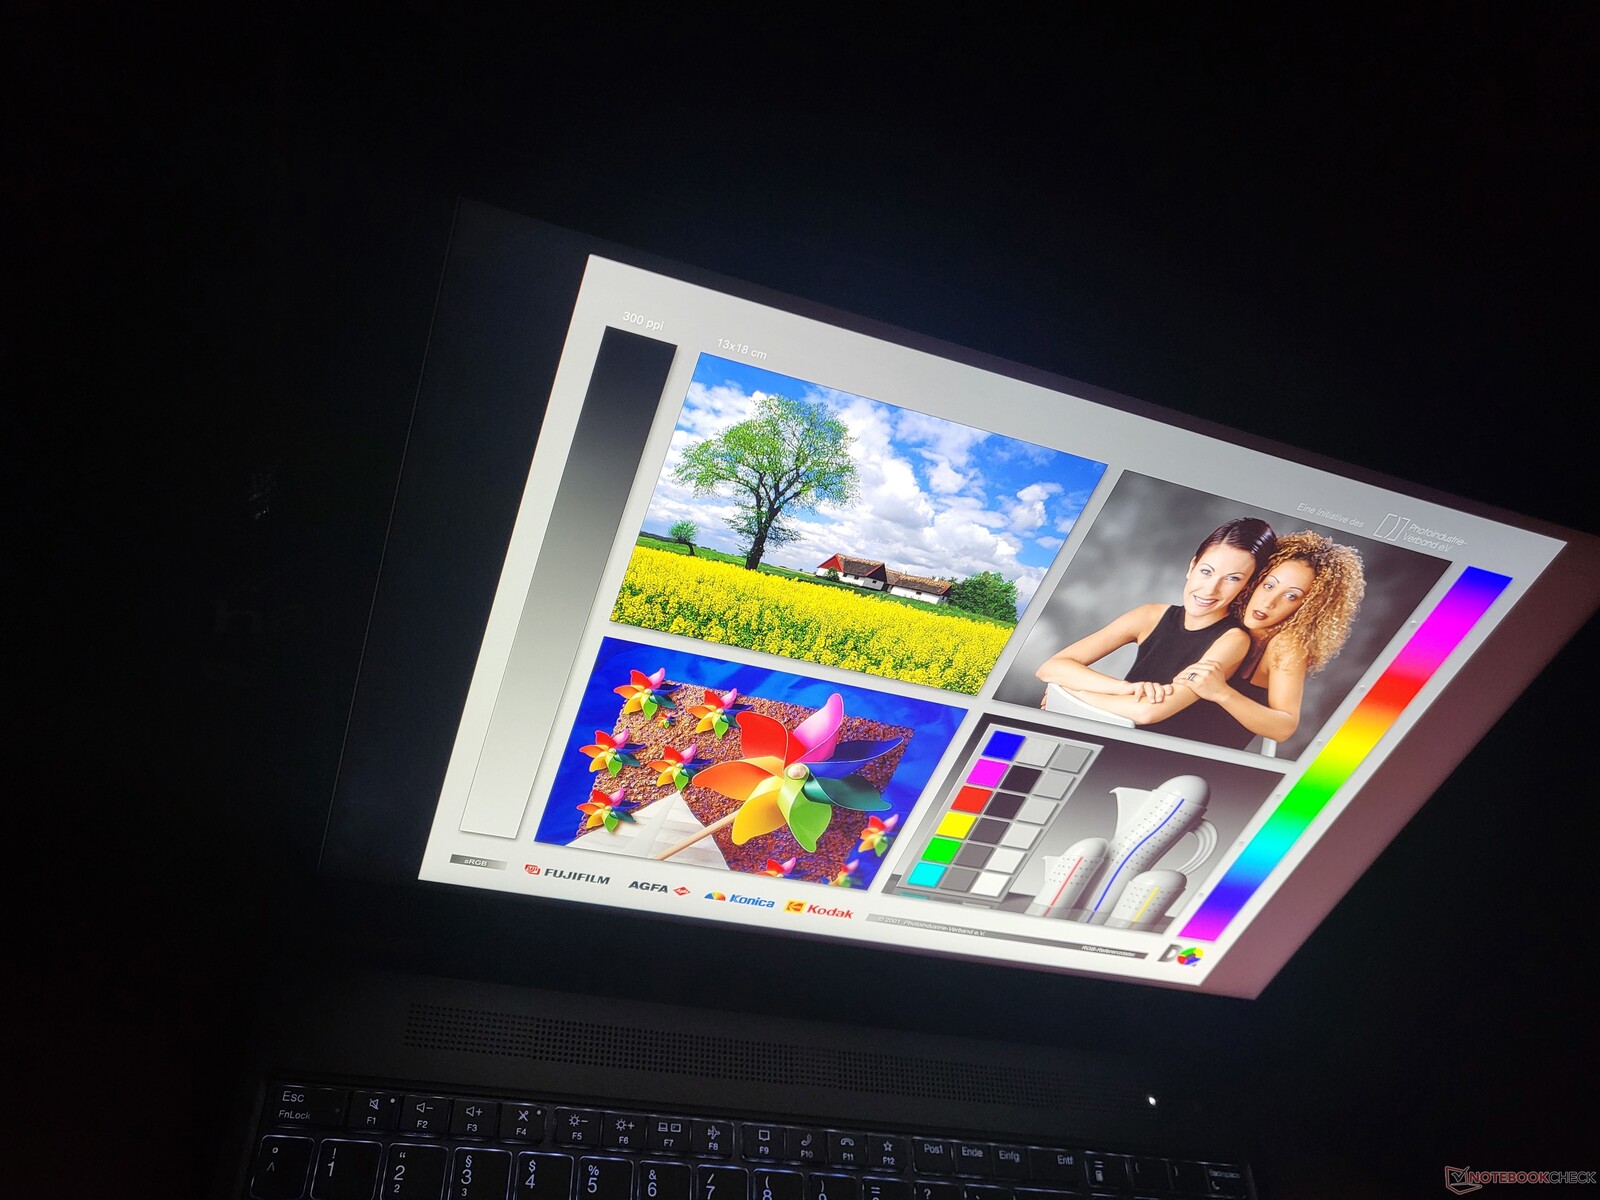
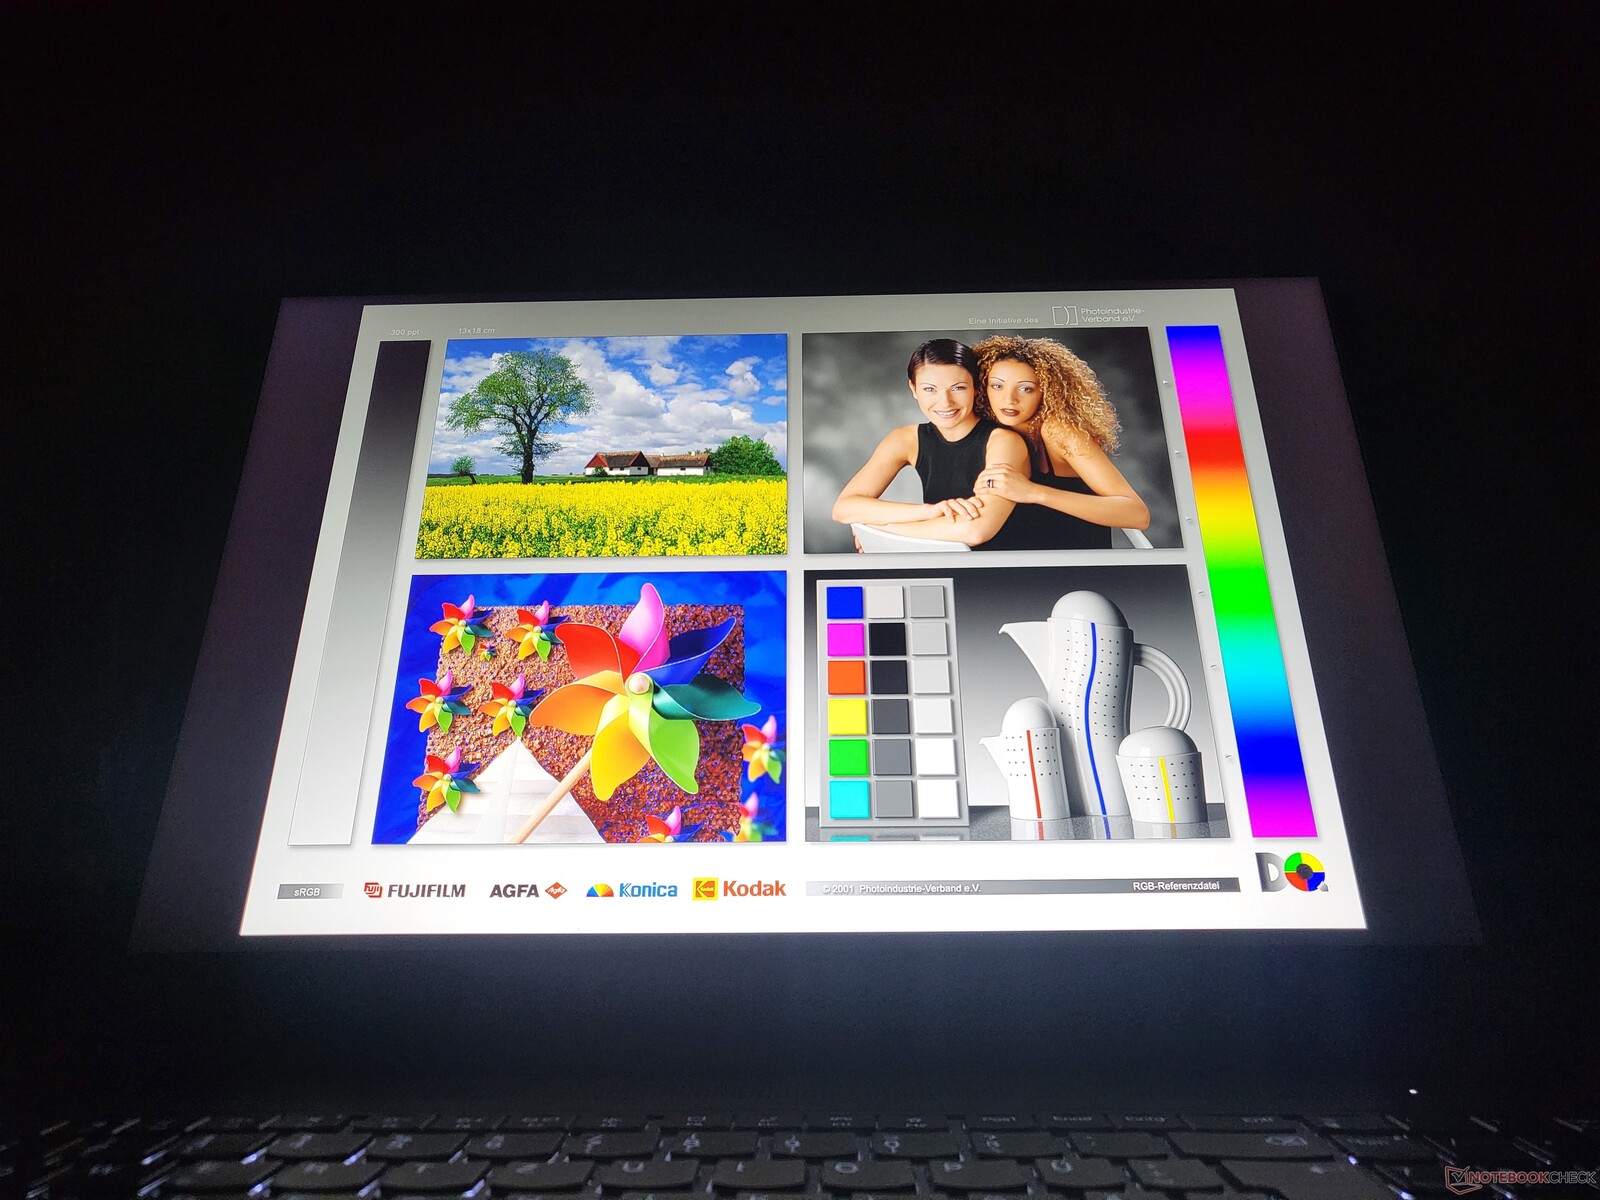
Una vez calibrada, la pantalla también se puede utilizar para el procesamiento sencillo de imágenes, ya que cubre por completo el espacio de color sRGB. Para espacios de color mayores, debe seleccionarse una de las opciones WQUXGA.
En exteriores, el Lenovo ThinkPad P16 G1 lo hace muy bien gracias a los buenos niveles de brillo de la pantalla mate.
Tiempos de respuesta del display
| ↔ Tiempo de respuesta de Negro a Blanco | ||
|---|---|---|
| 26.3 ms ... subida ↗ y bajada ↘ combinada | ↗ 14 ms subida |  |
| ↘ 12.3 ms bajada | ||
| La pantalla mostró tiempos de respuesta relativamente lentos en nuestros tests pero podría ser demasiado lenta para los jugones. En comparación, todos los dispositivos de prueba van de ##min### (mínimo) a 240 (máximo) ms. » 66 % de todos los dispositivos son mejores. Eso quiere decir que el tiempo de respuesta es peor que la media (19.8 ms) de todos los dispositivos testados. | ||
| ↔ Tiempo de respuesta 50% Gris a 80% Gris | ||
| 37.7 ms ... subida ↗ y bajada ↘ combinada | ↗ 18.6 ms subida |  |
| ↘ 19.1 ms bajada | ||
| La pantalla mostró tiempos de respuesta lentos en nuestros tests y podría ser demasiado lenta para los jugones. En comparación, todos los dispositivos de prueba van de ##min### (mínimo) a 636 (máximo) ms. » 55 % de todos los dispositivos son mejores. Eso quiere decir que el tiempo de respuesta es peor que la media (31 ms) de todos los dispositivos testados. | ||
Parpadeo de Pantalla / PWM (Pulse-Width Modulation)
| Parpadeo de Pantalla / PWM no detectado |  | ||
Comparación: 52 % de todos los dispositivos testados no usaron PWM para atenuar el display. Si se usó, medimos una media de 7754 (mínimo: 5 - máxmo: 343500) Hz. | |||
Rendimiento: Una potente CPU Intel y una GPU Nvidia bastante débil
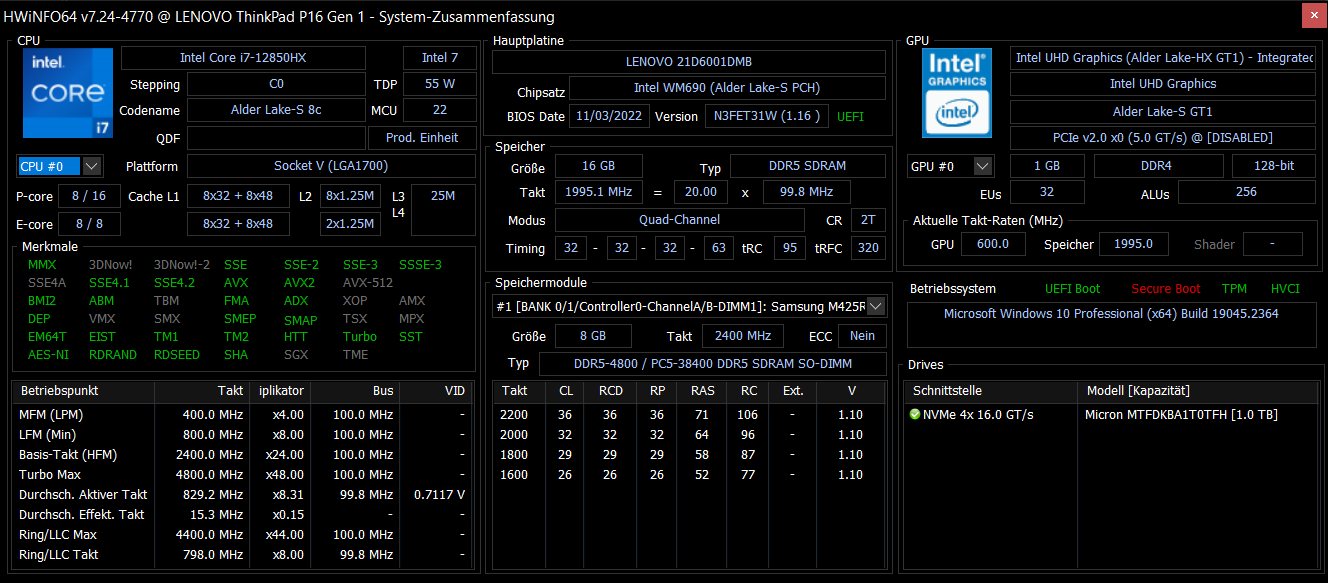
Lenovo ofrece el ThinkPad P16 G1 en una amplia variedad de configuraciones. Todas contienen un procesador Intel de la serie Alder Lake HX, siendo las opciones elIntel Core i5-12600HX, i7-12800HX, i7-12850HX, i9-12900HXasí como eli9-12950HX. Por desgracia, las CPU Xeon ya no están disponibles y su trabajo lo hacen ahora las CPU que terminan en 50. Como Lenovo no suelda sus GPUs, cada uno de estos procesadores se puede configurar con una de las siguientes GPUs: Intel ARC Pro A30M, Nvidia RTX A1000, RTX A2000, RTX A3000, RTX A4500 y RTX A5500.
Las posibles variaciones no terminan aquí ya que el Lenovo ThinkPad P16 G1 tiene cuatro ranuras de RAM. Eso hace que sea posible tener hasta 128 GB de RAM DDR5-3600 por lo que también RAM ECC está disponible para CPUs de 50 modelos. Hay un total de dos ranuras SSD y ambas pueden aceptar SSDs M.2 2280. La capacidad máxima de almacenamiento masivo que Lenovo vende en su portátil ThinkPad es de hasta ocho terabytes y viene en forma de dos SSD de 4 terabytes.
Condiciones de la prueba
Lenovo utiliza los modos de energía propios de Windows para los modos de energía de sus ThinkPads. Durante un breve periodo de tiempo, el procesador puede consumir hasta 125 vatios, pero se limita a 95 vatios durante periodos más largos. Si se selecciona el modo de energía "Mejor Rendimiento" en lugar de "Mejor Rendimiento" el consumo se sitúa brevemente en 100 vatios y en 80 vatios bajo carga continua. Usando el modo "Más Eficiencia de Batería", las limitaciones son considerablemente más severas con el turbo a 70 vatios y el consumo sostenido asentado en 30 vatios. Aparte del test de batería WiFi, nuestras pruebas se llevaron a cabo usando el modo "Mejor rendimiento".
Una característica especial de nuestro dispositivo de pruebas: Todavía viene con Windows 10 Pro. Para la mayoría de pruebas, esto no es un problema, pero esta versión antigua de Windows fue responsable de una puntuación muy baja en Cinebench R15. Por esta razón decidimos no hacer el bucle Cinebench R15 con este dispositivo.
Procesador
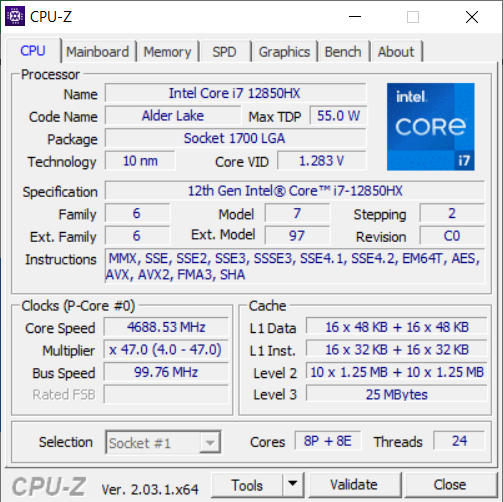
ElIntel Core i7-12850HXes un procesador con un total de 16 núcleos. Dado que la arquitectura "Alder Lake" posee una estructura asimétrica, ocho de estos núcleos son los potentes núcleos P (de 2,1 a 4,8 GHz) y los otros ocho núcleos son los eficientes núcleos E (de 1,5 a 3,4 GHz). Gracias al hyperthreading, el procesador dispone de más de 24 hilos. Como miembro de la serie HX55, el TDP típico ronda los 55 vatios. Para una comparación detallada con otros procesadores actuales, consulte nuestra Lista de CPU.
El rendimiento de la CPU del sistema es excelente y superior a la media para este procesador. El ThinkPad P16 vence al Dell Precision 7670 de forma bastante convincente. Sin embargo, el Asus ExpertBook B6 Flip es más rápido gracias a su i9. Curiosamente, el X1 Extreme G5 está casi a la par con el P16 aunque sólo tiene los seis núcleos P. Comparado con el P15 G2 y el P17 G2, el rendimiento de la CPU es entre un 31 y un 35 % mejor.
En modo batería, el ThinkPad P16 obtuvo 14.844 puntos en Cinebench R23. Sin una fuente de alimentación conectada, el rendimiento de la CPU es alrededor de un 15 % inferior.
Cinebench R23 Multi Endurance Test
Cinebench R23: Multi Core | Single Core
Cinebench R20: CPU (Multi Core) | CPU (Single Core)
Cinebench R15: CPU Multi 64Bit | CPU Single 64Bit
Blender: v2.79 BMW27 CPU
7-Zip 18.03: 7z b 4 | 7z b 4 -mmt1
Geekbench 5.5: Multi-Core | Single-Core
HWBOT x265 Benchmark v2.2: 4k Preset
LibreOffice : 20 Documents To PDF
R Benchmark 2.5: Overall mean
| CPU Performance rating | |
| Media de la clase Workstation | |
| Asus ExpertBook B6 Flip B6602FC2 | |
| Lenovo ThinkPad P16 G1 21D6001DMB | |
| Lenovo ThinkPad X1 Extreme G5-21DE003RGE | |
| Medio Intel Core i7-12850HX | |
| Dell Precision 7670 | |
| HP ZBook Fury 17 G8-4A6A9EA | |
| Lenovo ThinkPad Z16 G1 21D5S00T00 | |
| Lenovo ThinkPad P17 G2-20YU0025G | |
| Lenovo ThinkPad P15 G2-20YQ001JGE | |
| Cinebench R23 / Multi Core | |
| Media de la clase Workstation (14621 - 38520, n=23, últimos 2 años) | |
| Asus ExpertBook B6 Flip B6602FC2 | |
| Lenovo ThinkPad X1 Extreme G5-21DE003RGE | |
| Lenovo ThinkPad P16 G1 21D6001DMB | |
| Medio Intel Core i7-12850HX (15093 - 17510, n=2) | |
| Dell Precision 7670 | |
| HP ZBook Fury 17 G8-4A6A9EA | |
| Lenovo ThinkPad P17 G2-20YU0025G | |
| Lenovo ThinkPad Z16 G1 21D5S00T00 | |
| Lenovo ThinkPad P15 G2-20YQ001JGE | |
| Cinebench R23 / Single Core | |
| Media de la clase Workstation (1712 - 2228, n=23, últimos 2 años) | |
| Asus ExpertBook B6 Flip B6602FC2 | |
| Lenovo ThinkPad P16 G1 21D6001DMB | |
| Lenovo ThinkPad X1 Extreme G5-21DE003RGE | |
| Medio Intel Core i7-12850HX (1596 - 1845, n=2) | |
| HP ZBook Fury 17 G8-4A6A9EA | |
| Dell Precision 7670 | |
| Lenovo ThinkPad P17 G2-20YU0025G | |
| Lenovo ThinkPad P15 G2-20YQ001JGE | |
| Lenovo ThinkPad Z16 G1 21D5S00T00 | |
| Cinebench R20 / CPU (Multi Core) | |
| Media de la clase Workstation (5760 - 15043, n=23, últimos 2 años) | |
| Asus ExpertBook B6 Flip B6602FC2 | |
| Lenovo ThinkPad X1 Extreme G5-21DE003RGE | |
| Lenovo ThinkPad P16 G1 21D6001DMB | |
| Medio Intel Core i7-12850HX (6217 - 6764, n=2) | |
| Dell Precision 7670 | |
| Lenovo ThinkPad P17 G2-20YU0025G | |
| HP ZBook Fury 17 G8-4A6A9EA | |
| Lenovo ThinkPad Z16 G1 21D5S00T00 | |
| Lenovo ThinkPad P15 G2-20YQ001JGE | |
| Cinebench R20 / CPU (Single Core) | |
| Media de la clase Workstation (671 - 857, n=23, últimos 2 años) | |
| Asus ExpertBook B6 Flip B6602FC2 | |
| Lenovo ThinkPad P16 G1 21D6001DMB | |
| Lenovo ThinkPad X1 Extreme G5-21DE003RGE | |
| Medio Intel Core i7-12850HX (687 - 708, n=2) | |
| Dell Precision 7670 | |
| HP ZBook Fury 17 G8-4A6A9EA | |
| Lenovo ThinkPad Z16 G1 21D5S00T00 | |
| Lenovo ThinkPad P17 G2-20YU0025G | |
| Lenovo ThinkPad P15 G2-20YQ001JGE | |
| Cinebench R15 / CPU Multi 64Bit | |
| Media de la clase Workstation (2489 - 5810, n=23, últimos 2 años) | |
| Asus ExpertBook B6 Flip B6602FC2 | |
| Lenovo ThinkPad P16 G1 21D6001DMB | |
| Lenovo ThinkPad X1 Extreme G5-21DE003RGE | |
| Medio Intel Core i7-12850HX (2432 - 2926, n=2) | |
| Dell Precision 7670 | |
| Lenovo ThinkPad P17 G2-20YU0025G | |
| HP ZBook Fury 17 G8-4A6A9EA | |
| Lenovo ThinkPad Z16 G1 21D5S00T00 | |
| Lenovo ThinkPad P15 G2-20YQ001JGE | |
| Cinebench R15 / CPU Single 64Bit | |
| Media de la clase Workstation (191.4 - 328, n=23, últimos 2 años) | |
| Asus ExpertBook B6 Flip B6602FC2 | |
| Lenovo ThinkPad P16 G1 21D6001DMB | |
| Medio Intel Core i7-12850HX (253 - 268, n=2) | |
| Lenovo ThinkPad X1 Extreme G5-21DE003RGE | |
| Dell Precision 7670 | |
| HP ZBook Fury 17 G8-4A6A9EA | |
| Lenovo ThinkPad Z16 G1 21D5S00T00 | |
| Lenovo ThinkPad P17 G2-20YU0025G | |
| Lenovo ThinkPad P15 G2-20YQ001JGE | |
| Blender / v2.79 BMW27 CPU | |
| Lenovo ThinkPad P15 G2-20YQ001JGE | |
| Lenovo ThinkPad P17 G2-20YU0025G | |
| HP ZBook Fury 17 G8-4A6A9EA | |
| Lenovo ThinkPad Z16 G1 21D5S00T00 | |
| Dell Precision 7670 | |
| Medio Intel Core i7-12850HX (181 - 205, n=2) | |
| Asus ExpertBook B6 Flip B6602FC2 | |
| Lenovo ThinkPad X1 Extreme G5-21DE003RGE | |
| Lenovo ThinkPad P16 G1 21D6001DMB | |
| Media de la clase Workstation (91 - 222, n=23, últimos 2 años) | |
| 7-Zip 18.03 / 7z b 4 | |
| Media de la clase Workstation (60489 - 116969, n=23, últimos 2 años) | |
| Asus ExpertBook B6 Flip B6602FC2 | |
| Lenovo ThinkPad P16 G1 21D6001DMB | |
| Lenovo ThinkPad X1 Extreme G5-21DE003RGE | |
| Medio Intel Core i7-12850HX (53893 - 69464, n=2) | |
| Lenovo ThinkPad Z16 G1 21D5S00T00 | |
| Dell Precision 7670 | |
| HP ZBook Fury 17 G8-4A6A9EA | |
| Lenovo ThinkPad P15 G2-20YQ001JGE | |
| Lenovo ThinkPad P17 G2-20YU0025G | |
| 7-Zip 18.03 / 7z b 4 -mmt1 | |
| Media de la clase Workstation (5126 - 6960, n=23, últimos 2 años) | |
| Asus ExpertBook B6 Flip B6602FC2 | |
| HP ZBook Fury 17 G8-4A6A9EA | |
| Lenovo ThinkPad P16 G1 21D6001DMB | |
| Lenovo ThinkPad X1 Extreme G5-21DE003RGE | |
| Medio Intel Core i7-12850HX (5608 - 5916, n=2) | |
| Dell Precision 7670 | |
| Lenovo ThinkPad P15 G2-20YQ001JGE | |
| Lenovo ThinkPad P17 G2-20YU0025G | |
| Lenovo ThinkPad Z16 G1 21D5S00T00 | |
| Geekbench 5.5 / Multi-Core | |
| Media de la clase Workstation (11542 - 25554, n=23, últimos 2 años) | |
| Asus ExpertBook B6 Flip B6602FC2 | |
| Lenovo ThinkPad P16 G1 21D6001DMB | |
| Medio Intel Core i7-12850HX (11509 - 13095, n=2) | |
| Lenovo ThinkPad X1 Extreme G5-21DE003RGE | |
| Dell Precision 7670 | |
| Lenovo ThinkPad P15 G2-20YQ001JGE | |
| Lenovo ThinkPad Z16 G1 21D5S00T00 | |
| HP ZBook Fury 17 G8-4A6A9EA | |
| Lenovo ThinkPad P17 G2-20YU0025G | |
| Geekbench 5.5 / Single-Core | |
| Media de la clase Workstation (1783 - 2183, n=23, últimos 2 años) | |
| Asus ExpertBook B6 Flip B6602FC2 | |
| Lenovo ThinkPad X1 Extreme G5-21DE003RGE | |
| Lenovo ThinkPad P16 G1 21D6001DMB | |
| Medio Intel Core i7-12850HX (1777 - 1787, n=2) | |
| Dell Precision 7670 | |
| HP ZBook Fury 17 G8-4A6A9EA | |
| Lenovo ThinkPad P15 G2-20YQ001JGE | |
| Lenovo ThinkPad P17 G2-20YU0025G | |
| Lenovo ThinkPad Z16 G1 21D5S00T00 | |
| HWBOT x265 Benchmark v2.2 / 4k Preset | |
| Media de la clase Workstation (17.8 - 40.5, n=23, últimos 2 años) | |
| Asus ExpertBook B6 Flip B6602FC2 | |
| Dell Precision 7670 | |
| Medio Intel Core i7-12850HX (17.2 - 17.3, n=2) | |
| Lenovo ThinkPad P16 G1 21D6001DMB | |
| Lenovo ThinkPad X1 Extreme G5-21DE003RGE | |
| Lenovo ThinkPad Z16 G1 21D5S00T00 | |
| Lenovo ThinkPad P17 G2-20YU0025G | |
| HP ZBook Fury 17 G8-4A6A9EA | |
| Lenovo ThinkPad P15 G2-20YQ001JGE | |
| LibreOffice / 20 Documents To PDF | |
| HP ZBook Fury 17 G8-4A6A9EA | |
| Lenovo ThinkPad P17 G2-20YU0025G | |
| Lenovo ThinkPad Z16 G1 21D5S00T00 | |
| Dell Precision 7670 | |
| Lenovo ThinkPad P15 G2-20YQ001JGE | |
| Medio Intel Core i7-12850HX (46.9 - 48.6, n=2) | |
| Media de la clase Workstation (37.1 - 74.7, n=23, últimos 2 años) | |
| Lenovo ThinkPad P16 G1 21D6001DMB | |
| Asus ExpertBook B6 Flip B6602FC2 | |
| Lenovo ThinkPad X1 Extreme G5-21DE003RGE | |
| R Benchmark 2.5 / Overall mean | |
| Lenovo ThinkPad P17 G2-20YU0025G | |
| Lenovo ThinkPad P15 G2-20YQ001JGE | |
| HP ZBook Fury 17 G8-4A6A9EA | |
| Lenovo ThinkPad Z16 G1 21D5S00T00 | |
| Dell Precision 7670 | |
| Lenovo ThinkPad X1 Extreme G5-21DE003RGE | |
| Medio Intel Core i7-12850HX (0.45 - 0.4698, n=2) | |
| Asus ExpertBook B6 Flip B6602FC2 | |
| Lenovo ThinkPad P16 G1 21D6001DMB | |
| Media de la clase Workstation (0.3825 - 0.603, n=23, últimos 2 años) | |
* ... más pequeño es mejor
AIDA64: FP32 Ray-Trace | FPU Julia | CPU SHA3 | CPU Queen | FPU SinJulia | FPU Mandel | CPU AES | CPU ZLib | FP64 Ray-Trace | CPU PhotoWorxx
| Performance rating | |
| Media de la clase Workstation | |
| Lenovo ThinkPad P16 G1 21D6001DMB | |
| Asus ExpertBook B6 Flip B6602FC2 | |
| Medio Intel Core i7-12850HX | |
| HP ZBook Fury 17 G8-4A6A9EA | |
| Dell Precision 7670 | |
| AIDA64 / FP32 Ray-Trace | |
| Media de la clase Workstation (16730 - 61611, n=23, últimos 2 años) | |
| Lenovo ThinkPad P16 G1 21D6001DMB | |
| Asus ExpertBook B6 Flip B6602FC2 | |
| HP ZBook Fury 17 G8-4A6A9EA | |
| Medio Intel Core i7-12850HX (12983 - 16752, n=2) | |
| Dell Precision 7670 | |
| AIDA64 / FPU Julia | |
| Media de la clase Workstation (89597 - 186971, n=23, últimos 2 años) | |
| Lenovo ThinkPad P16 G1 21D6001DMB | |
| Asus ExpertBook B6 Flip B6602FC2 | |
| Medio Intel Core i7-12850HX (68219 - 87231, n=2) | |
| Dell Precision 7670 | |
| HP ZBook Fury 17 G8-4A6A9EA | |
| AIDA64 / CPU SHA3 | |
| Media de la clase Workstation (4178 - 8975, n=23, últimos 2 años) | |
| HP ZBook Fury 17 G8-4A6A9EA | |
| Lenovo ThinkPad P16 G1 21D6001DMB | |
| Asus ExpertBook B6 Flip B6602FC2 | |
| Medio Intel Core i7-12850HX (3098 - 3818, n=2) | |
| Dell Precision 7670 | |
| AIDA64 / CPU Queen | |
| Media de la clase Workstation (60778 - 144411, n=23, últimos 2 años) | |
| Asus ExpertBook B6 Flip B6602FC2 | |
| HP ZBook Fury 17 G8-4A6A9EA | |
| Lenovo ThinkPad P16 G1 21D6001DMB | |
| Medio Intel Core i7-12850HX (26716 - 95664, n=2) | |
| Dell Precision 7670 | |
| AIDA64 / FPU SinJulia | |
| Media de la clase Workstation (8165 - 29343, n=23, últimos 2 años) | |
| Lenovo ThinkPad P16 G1 21D6001DMB | |
| Asus ExpertBook B6 Flip B6602FC2 | |
| Medio Intel Core i7-12850HX (9869 - 11286, n=2) | |
| HP ZBook Fury 17 G8-4A6A9EA | |
| Dell Precision 7670 | |
| AIDA64 / FPU Mandel | |
| Media de la clase Workstation (44497 - 98153, n=23, últimos 2 años) | |
| Lenovo ThinkPad P16 G1 21D6001DMB | |
| Asus ExpertBook B6 Flip B6602FC2 | |
| HP ZBook Fury 17 G8-4A6A9EA | |
| Medio Intel Core i7-12850HX (34218 - 42580, n=2) | |
| Dell Precision 7670 | |
| AIDA64 / CPU AES | |
| Media de la clase Workstation (73133 - 187841, n=23, últimos 2 años) | |
| HP ZBook Fury 17 G8-4A6A9EA | |
| Lenovo ThinkPad P16 G1 21D6001DMB | |
| Asus ExpertBook B6 Flip B6602FC2 | |
| Medio Intel Core i7-12850HX (63362 - 80775, n=2) | |
| Dell Precision 7670 | |
| AIDA64 / CPU ZLib | |
| Media de la clase Workstation (929 - 2148, n=23, últimos 2 años) | |
| Lenovo ThinkPad P16 G1 21D6001DMB | |
| Asus ExpertBook B6 Flip B6602FC2 | |
| Medio Intel Core i7-12850HX (817 - 1102, n=2) | |
| Dell Precision 7670 | |
| HP ZBook Fury 17 G8-4A6A9EA | |
| AIDA64 / FP64 Ray-Trace | |
| Media de la clase Workstation (8545 - 32891, n=23, últimos 2 años) | |
| Lenovo ThinkPad P16 G1 21D6001DMB | |
| Asus ExpertBook B6 Flip B6602FC2 | |
| HP ZBook Fury 17 G8-4A6A9EA | |
| Medio Intel Core i7-12850HX (7671 - 9145, n=2) | |
| Dell Precision 7670 | |
| AIDA64 / CPU PhotoWorxx | |
| Media de la clase Workstation (37151 - 93684, n=23, últimos 2 años) | |
| Dell Precision 7670 | |
| Medio Intel Core i7-12850HX (33415 - 42035, n=2) | |
| Asus ExpertBook B6 Flip B6602FC2 | |
| Lenovo ThinkPad P16 G1 21D6001DMB | |
| HP ZBook Fury 17 G8-4A6A9EA | |
Rendimiento del sistema
Aunque las puntuaciones PCMark 10 son comparativamente más bajas, el Lenovo ThinkPad P16 G1 ofrece un rendimiento muy bueno en el uso diario - algo lógico teniendo en cuenta los potentes componentes. En consecuencia, CrossMark resulta ser considerablemente mejor.
CrossMark: Overall | Productivity | Creativity | Responsiveness
| PCMark 10 / Score | |
| Media de la clase Workstation (6563 - 10409, n=19, últimos 2 años) | |
| Asus ExpertBook B6 Flip B6602FC2 | |
| Dell Precision 7670 | |
| Lenovo ThinkPad P15 G2-20YQ001JGE | |
| Medio Intel Core i7-12850HX, NVIDIA RTX A2000 Laptop GPU (6226 - 6663, n=2) | |
| Lenovo ThinkPad P17 G2-20YU0025G | |
| Lenovo ThinkPad P16 G1 21D6001DMB | |
| HP ZBook Fury 17 G8-4A6A9EA | |
| PCMark 10 / Essentials | |
| Asus ExpertBook B6 Flip B6602FC2 | |
| Dell Precision 7670 | |
| Media de la clase Workstation (9622 - 11157, n=19, últimos 2 años) | |
| Medio Intel Core i7-12850HX, NVIDIA RTX A2000 Laptop GPU (10128 - 10555, n=2) | |
| Lenovo ThinkPad P15 G2-20YQ001JGE | |
| Lenovo ThinkPad P16 G1 21D6001DMB | |
| Lenovo ThinkPad P17 G2-20YU0025G | |
| HP ZBook Fury 17 G8-4A6A9EA | |
| PCMark 10 / Productivity | |
| Media de la clase Workstation (8789 - 20616, n=19, últimos 2 años) | |
| Asus ExpertBook B6 Flip B6602FC2 | |
| Lenovo ThinkPad P16 G1 21D6001DMB | |
| Medio Intel Core i7-12850HX, NVIDIA RTX A2000 Laptop GPU (9008 - 9349, n=2) | |
| Dell Precision 7670 | |
| Lenovo ThinkPad P15 G2-20YQ001JGE | |
| Lenovo ThinkPad P17 G2-20YU0025G | |
| HP ZBook Fury 17 G8-4A6A9EA | |
| PCMark 10 / Digital Content Creation | |
| Media de la clase Workstation (8108 - 15631, n=19, últimos 2 años) | |
| HP ZBook Fury 17 G8-4A6A9EA | |
| Asus ExpertBook B6 Flip B6602FC2 | |
| Lenovo ThinkPad P15 G2-20YQ001JGE | |
| Lenovo ThinkPad P17 G2-20YU0025G | |
| Dell Precision 7670 | |
| Medio Intel Core i7-12850HX, NVIDIA RTX A2000 Laptop GPU (6918 - 8443, n=2) | |
| Lenovo ThinkPad P16 G1 21D6001DMB | |
| CrossMark / Overall | |
| Asus ExpertBook B6 Flip B6602FC2 | |
| Media de la clase Workstation (1307 - 2267, n=22, últimos 2 años) | |
| Lenovo ThinkPad P16 G1 21D6001DMB | |
| Medio Intel Core i7-12850HX, NVIDIA RTX A2000 Laptop GPU (1509 - 1720, n=2) | |
| Dell Precision 7670 | |
| HP ZBook Fury 17 G8-4A6A9EA | |
| CrossMark / Productivity | |
| Asus ExpertBook B6 Flip B6602FC2 | |
| Media de la clase Workstation (1130 - 2122, n=22, últimos 2 años) | |
| Lenovo ThinkPad P16 G1 21D6001DMB | |
| Medio Intel Core i7-12850HX, NVIDIA RTX A2000 Laptop GPU (1445 - 1611, n=2) | |
| HP ZBook Fury 17 G8-4A6A9EA | |
| Dell Precision 7670 | |
| CrossMark / Creativity | |
| Media de la clase Workstation (1657 - 2725, n=22, últimos 2 años) | |
| Asus ExpertBook B6 Flip B6602FC2 | |
| Lenovo ThinkPad P16 G1 21D6001DMB | |
| Medio Intel Core i7-12850HX, NVIDIA RTX A2000 Laptop GPU (1682 - 1943, n=2) | |
| Dell Precision 7670 | |
| HP ZBook Fury 17 G8-4A6A9EA | |
| CrossMark / Responsiveness | |
| Asus ExpertBook B6 Flip B6602FC2 | |
| Media de la clase Workstation (993 - 2096, n=22, últimos 2 años) | |
| Lenovo ThinkPad P16 G1 21D6001DMB | |
| Medio Intel Core i7-12850HX, NVIDIA RTX A2000 Laptop GPU (1238 - 1454, n=2) | |
| Dell Precision 7670 | |
| HP ZBook Fury 17 G8-4A6A9EA | |
| PCMark 10 Score | 6226 puntos | |
ayuda | ||
| AIDA64 / Memory Copy | |
| Media de la clase Workstation (56003 - 164795, n=23, últimos 2 años) | |
| Dell Precision 7670 | |
| Asus ExpertBook B6 Flip B6602FC2 | |
| Medio Intel Core i7-12850HX (53840 - 62841, n=2) | |
| Lenovo ThinkPad P16 G1 21D6001DMB | |
| HP ZBook Fury 17 G8-4A6A9EA | |
| AIDA64 / Memory Read | |
| Media de la clase Workstation (55795 - 121563, n=23, últimos 2 años) | |
| Dell Precision 7670 | |
| Medio Intel Core i7-12850HX (58944 - 68747, n=2) | |
| Asus ExpertBook B6 Flip B6602FC2 | |
| Lenovo ThinkPad P16 G1 21D6001DMB | |
| HP ZBook Fury 17 G8-4A6A9EA | |
| AIDA64 / Memory Write | |
| Media de la clase Workstation (55663 - 214520, n=23, últimos 2 años) | |
| Dell Precision 7670 | |
| Asus ExpertBook B6 Flip B6602FC2 | |
| Medio Intel Core i7-12850HX (52160 - 64365, n=2) | |
| Lenovo ThinkPad P16 G1 21D6001DMB | |
| HP ZBook Fury 17 G8-4A6A9EA | |
| AIDA64 / Memory Latency | |
| Media de la clase Workstation (84.5 - 165.2, n=23, últimos 2 años) | |
| Lenovo ThinkPad P16 G1 21D6001DMB | |
| Asus ExpertBook B6 Flip B6602FC2 | |
| Medio Intel Core i7-12850HX (88.5 - 95.4, n=2) | |
| Dell Precision 7670 | |
| HP ZBook Fury 17 G8-4A6A9EA | |
| Lenovo ThinkPad P17 G2-20YU0025G | |
| Lenovo ThinkPad P15 G2-20YQ001JGE | |
* ... más pequeño es mejor
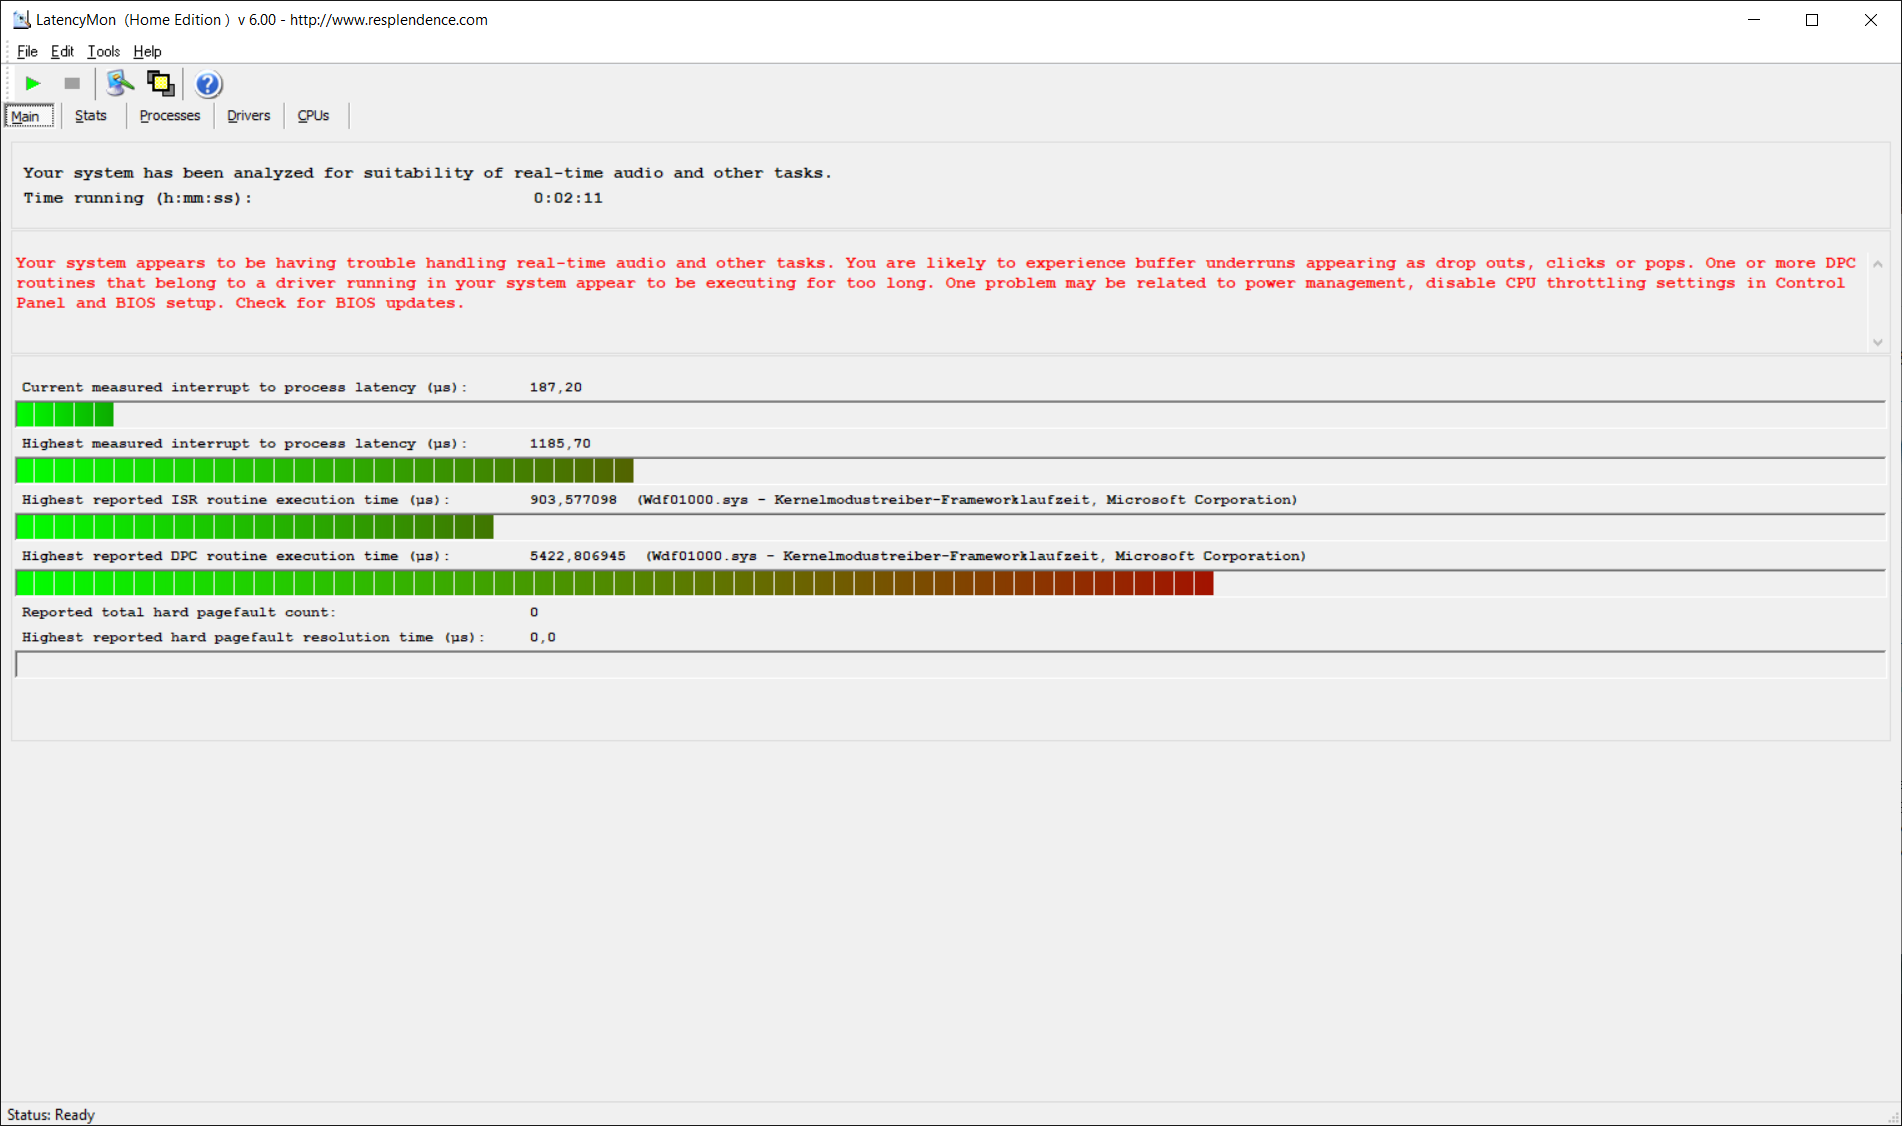
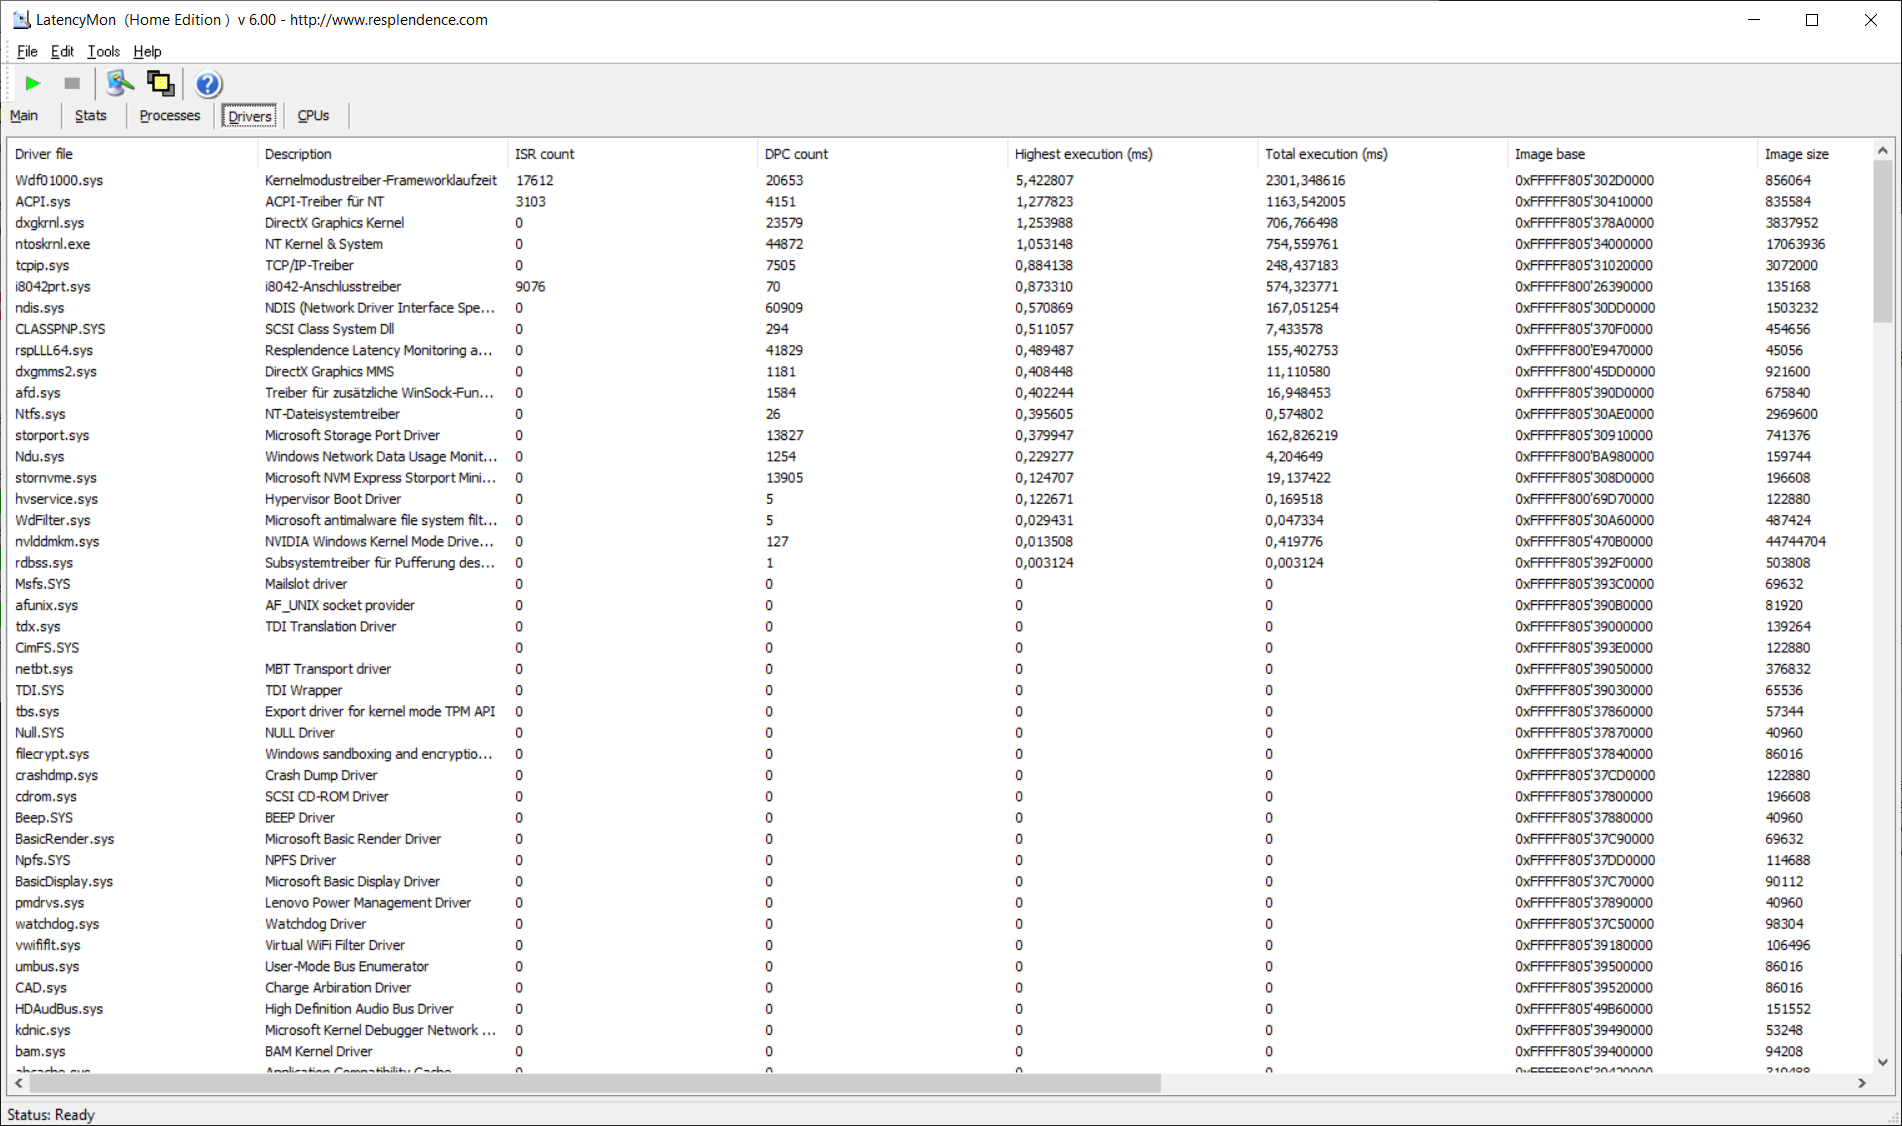
Latencias del CPD
Las latencias del CPD son notablemente inferiores a las de su predecesor, pero siguen siendo demasiado altas. No obstante, esto puede cambiar en cualquier momento con la ayuda de actualizaciones de los controladores.
| DPC Latencies / LatencyMon - interrupt to process latency (max), Web, Youtube, Prime95 | |
| Lenovo ThinkPad P17 G2-20YU0025G | |
| Lenovo ThinkPad P15 G2-20YQ001JGE | |
| Asus ExpertBook B6 Flip B6602FC2 | |
| Dell Precision 7670 | |
| Lenovo ThinkPad P16 G1 21D6001DMB | |
| HP ZBook Studio 16 G9 62U04EA | |
* ... más pequeño es mejor
Almacenamiento masivo
El SSD del Lenovo ThinkPad P16 G1 es de Micron, tiene una capacidad de un terabyte y es un SSD NVMe PCIe 4.0 muy veloz en formato M.2 2280. El SSD es más lento que el Samsung SSD que se encuentra en el Asus ExpertBook pero más rápido que el resto de sus competidores.

* ... más pequeño es mejor
Continuous Performance Read: DiskSpd Read Loop, Queue Depth 8
Tarjeta gráfica
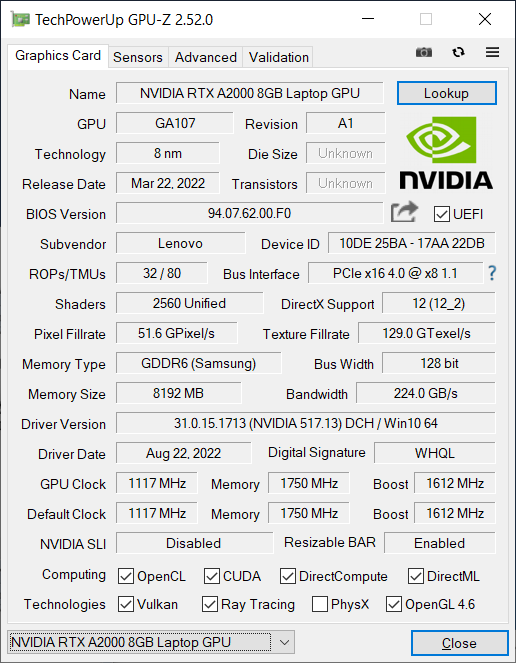
EnNvidia RTX A2000 es una GPU de la generación Ampere de la serie profesional RTX de Nvidia, antes conocida como "Quadro". Las 2560 unidades de sombreado tienen una velocidad de reloj máxima de 1,678 GHz. El TDP típico de este chip gráfico oscila entre 35 y 95 vatios; la RTX A2000 tiene 8 GB de RAM dedicada conectados a un bus de memoria de 128 bits. EnLista de GPUes un recurso excelente para realizar comparaciones con otros chips gráficos.
La RTX A2000 del Lenovo ThinkPad P16 puede consumir hasta 60 vatios, lo que la convierte en una de las opciones básicas, con la siguiente mejor GPU, la RTX A3000, capaz de consumir hasta 115 vatios. En consonancia con el limitado consumo, el rendimiento de la RTX A2000 no es especialmente sobresaliente. De todas las estaciones de trabajo comparadas, la Lenovo ThinkPad P16 fue la que peor rindió, ya fuera en la prueba 3DMark o en el benchmark SPECviewperf específico para estaciones de trabajo. En particular, elDell Precision 7670así como el Asus ExpertBook B6 Fliples fue mejor con casi las mismas GPUs que funcionan a 90 y 95 vatios TDP, respectivamente, en estos portátiles.
Este resultado también se refleja en la prueba de Blender: En las pruebas de aceleración GPU, el ThinkPad P16 G1 es más lento que la competencia. Sin embargo, en la prueba de CPU de Blender, es la estación de trabajo móvil más rápida.
Al igual que con el procesador, el rendimiento de la GPU se ve limitado en modo batería, con una caída del rendimiento de alrededor del 15 % en comparación con el funcionamiento con fuente de alimentación.
| 3DMark 11 Performance | 15998 puntos | |
| 3DMark Cloud Gate Standard Score | 40815 puntos | |
| 3DMark Fire Strike Score | 10381 puntos | |
| 3DMark Time Spy Score | 5184 puntos | |
ayuda | ||
* ... más pequeño es mejor
Rendimiento en juegos
Como estación de trabajo móvil, el Lenovo ThinkPad P16 no es un portátil de juegos. Sin embargo, los juegos más nuevos también son posibles, aunque no en 4K. Como en las pruebas sintéticas, la competencia directa es más rápida que el P16. El bajo TDP se complica aún más por el hecho de que el P16 no logra mantener un rendimiento GPU constante bajo carga constante.
| The Witcher 3 - 1920x1080 Ultra Graphics & Postprocessing (HBAO+) | |
| Media de la clase Workstation (n=1últimos 2 años) | |
| Lenovo ThinkPad P15 G2-20YQ001JGE | |
| Asus ExpertBook B6 Flip B6602FC2 | |
| HP ZBook Fury 17 G8-4A6A9EA | |
| Dell Precision 7670 | |
| Lenovo ThinkPad P17 G2-20YU0025G | |
| Lenovo ThinkPad P16 G1 21D6001DMB | |
Witcher 3 FPS diagram
| bajo | medio | alto | ultra | QHD | |
|---|---|---|---|---|---|
| The Witcher 3 (2015) | 273 | 150.5 | 79.7 | 43.6 | |
| Dota 2 Reborn (2015) | 177.5 | 160.8 | 149.3 | 139.5 | |
| Final Fantasy XV Benchmark (2018) | 96.7 | 51.9 | 38.3 | 31.1 | |
| X-Plane 11.11 (2018) | 140.3 | 119.2 | 95.6 | ||
| Strange Brigade (2018) | 280 | 118.6 | 91.1 | 77.8 | 54.3 |
Emisiones: El ventilador hace ruido, pero el portátil ThinkPad se mantiene fresco
Emisiones sonoras
En reposo, los ventiladores del Lenovo ThinkPad P16" permanecen silenciosos. Con 56,3 dB(a) bajo carga, pueden llegar a ser ruidosos - incluso más ruidosos que los homólogos directos del portátil. Sin embargo, ese no es el caso con todas las aplicaciones. En el test Witcher 3, los ventiladores funcionaron comparativamente en silencio, midiendo sólo 34,1 dB(a).
No pudimos detectar ningún ruido de bobina en el portátil Lenovo.
Ruido
| Ocioso |
| 23.2 / 23.2 / 23.2 dB(A) |
| Carga |
| 47.8 / 56.3 dB(A) |
 | ||
30 dB silencioso 40 dB(A) audible 50 dB(A) ruidosamente alto |
||
min: | ||
| Lenovo ThinkPad P16 G1 21D6001DMB RTX A2000 Laptop GPU, i7-12850HX, Micron 3400 1TB MTFDKBA1T0TFH | Lenovo ThinkPad P15 G2-20YQ001JGE RTX A3000 Laptop GPU, i7-11800H, Kioxia XG7 KXG7AZNV512G | Lenovo ThinkPad P17 G2-20YU0025G RTX A2000 Laptop GPU, i7-11800H, Kioxia XG7 KXG7AZNV512G | HP ZBook Fury 17 G8-4A6A9EA RTX A3000 Laptop GPU, i9-11950H, Toshiba XG6 KXG60ZNV1T02 | Dell Precision 7670 RTX A2000 Laptop GPU, i7-12850HX, SK Hynix HFS001TEJ9X115N | Asus ExpertBook B6 Flip B6602FC2 RTX A2000 Laptop GPU, i9-12950HX, Samsung PM9A1 MZVL21T0HCLR | |
|---|---|---|---|---|---|---|
| Noise | -6% | -4% | -5% | -4% | -22% | |
| apagado / medio ambiente * (dB) | 23.2 | 24.3 -5% | 26.4 -14% | 24.5 -6% | 22.7 2% | 26 -12% |
| Idle Minimum * (dB) | 23.2 | 24.3 -5% | 26.4 -14% | 24.5 -6% | 22.9 1% | 32.4 -40% |
| Idle Average * (dB) | 23.2 | 24.3 -5% | 26.4 -14% | 24.5 -6% | 22.9 1% | 32.4 -40% |
| Idle Maximum * (dB) | 23.2 | 28.6 -23% | 26.4 -14% | 26.8 -16% | 24.5 -6% | 32.4 -40% |
| Load Average * (dB) | 47.8 | 47.5 1% | 38.1 20% | 41.8 13% | 48.7 -2% | 51.9 -9% |
| Witcher 3 ultra * (dB) | 34.1 | 38.1 -12% | 44.9 -32% | 45.2 -33% | ||
| Load Maximum * (dB) | 56.3 | 54.9 2% | 45 20% | 47.1 16% | 52.1 7% | 52.1 7% |
* ... más pequeño es mejor
Temperatura
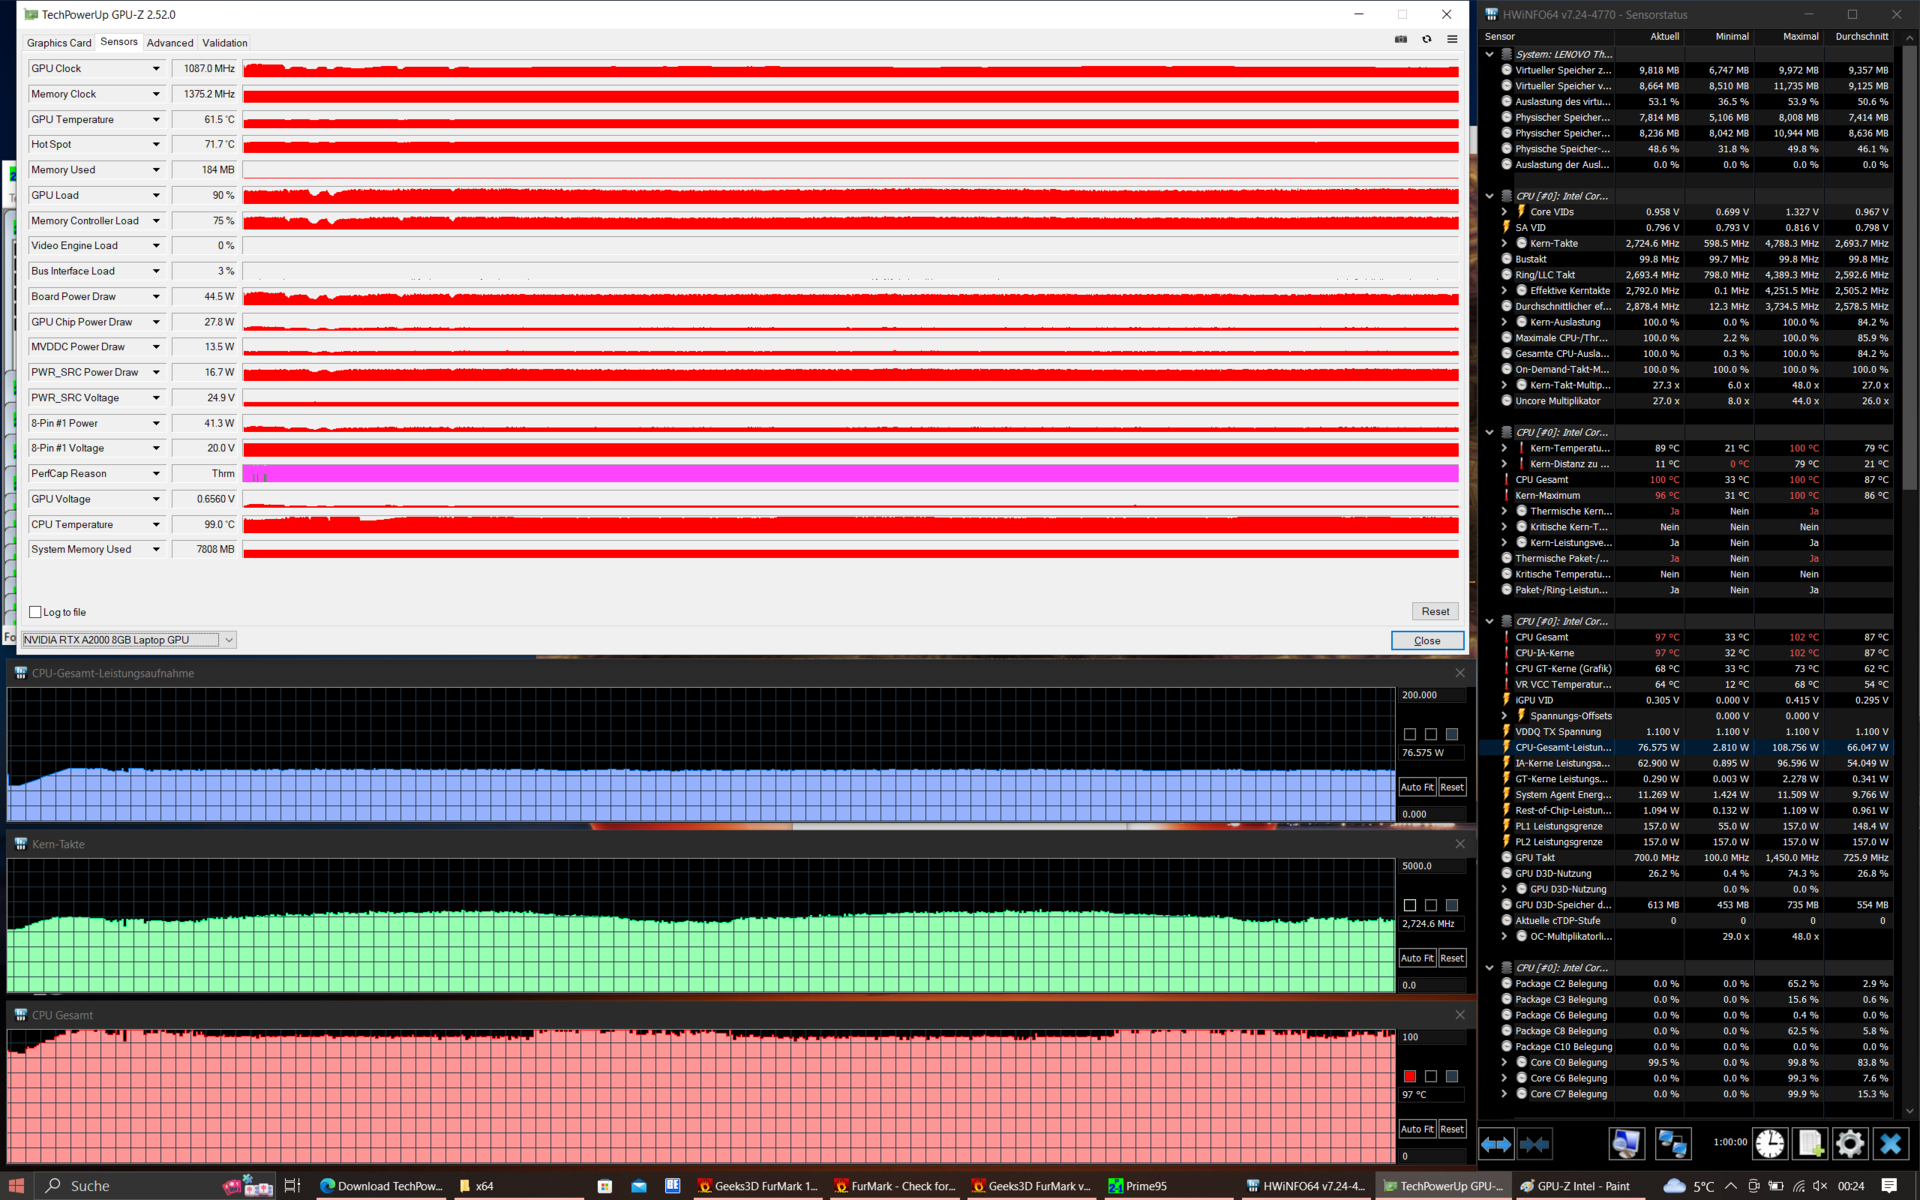
La espaciosa carcasa, con su construcción de jaula antivuelco y cámara de vapor, asegura una distribución relativamente uniforme del calor residual. Como resultado, el reposamanos del Lenovo ThinkPad P16 se calienta un poco pero las temperaturas máximas se mantuvieron dentro de límites aceptables. En la prueba de estrés, la temperatura del hotspot midió 43,1 grados y puede considerarse un buen resultado.
Aunque el procesador no se ralentizó durante la prueba de estrés, el rendimiento de la GPU cayó: Después de una hora, sólo puede consumir 45 vatios en lugar de 60.
(±) La temperatura máxima en la parte superior es de 43.1 °C / 110 F, frente a la media de 38.2 °C / 101 F, que oscila entre 22.2 y 69.8 °C para la clase Workstation.
(+) El fondo se calienta hasta un máximo de 39.9 °C / 104 F, frente a la media de 41.1 °C / 106 F
(+) En reposo, la temperatura media de la parte superior es de 24.7 °C / 76# F, frente a la media del dispositivo de 32 °C / 90 F.
(+) Jugando a The Witcher 3, la temperatura media de la parte superior es de 31.2 °C / 88 F, frente a la media del dispositivo de 32 °C / 90 F.
(±) El reposamanos y el touchpad pueden calentarse mucho al tacto con un máximo de 36.7 °C / 98.1 F.
(-) La temperatura media de la zona del reposamanos de dispositivos similares fue de 27.8 °C / 82 F (-8.9 °C / -16.1 F).
| Lenovo ThinkPad P16 G1 21D6001DMB Intel Core i7-12850HX, NVIDIA RTX A2000 Laptop GPU | Lenovo ThinkPad P15 G2-20YQ001JGE Intel Core i7-11800H, NVIDIA RTX A3000 Laptop GPU | Lenovo ThinkPad P17 G2-20YU0025G Intel Core i7-11800H, NVIDIA RTX A2000 Laptop GPU | HP ZBook Fury 17 G8-4A6A9EA Intel Core i9-11950H, NVIDIA RTX A3000 Laptop GPU | Dell Precision 7670 Intel Core i7-12850HX, NVIDIA RTX A2000 Laptop GPU | Asus ExpertBook B6 Flip B6602FC2 Intel Core i9-12950HX, NVIDIA RTX A2000 Laptop GPU | |
|---|---|---|---|---|---|---|
| Heat | -21% | -12% | -12% | -18% | -15% | |
| Maximum Upper Side * (°C) | 43.1 | 49.7 -15% | 49.6 -15% | 41.9 3% | 51 -18% | 48.4 -12% |
| Maximum Bottom * (°C) | 39.9 | 63.2 -58% | 52.1 -31% | 52.9 -33% | 45.8 -15% | 52.3 -31% |
| Idle Upper Side * (°C) | 26 | 27.1 -4% | 26 -0% | 28.2 -8% | 31.8 -22% | 27.8 -7% |
| Idle Bottom * (°C) | 27.6 | 29.8 -8% | 27.6 -0% | 30.7 -11% | 32.6 -18% | 30.3 -10% |
* ... más pequeño es mejor
Altavoces
Los altavoces estéreo están situados en la parte superior del teclado. En comparación con elThinkPad P15 G2los altavoces son un poco más silenciosos en general, pero producen un sonido más equilibrado con graves adicionales. Aunque la calidad del sonido es buena para un portátil, sigue sin ser rival para un sistema de sonido externo.
Lenovo ThinkPad P16 G1 21D6001DMB análisis de audio
(±) | la sonoridad del altavoz es media pero buena (73.8 dB)
Graves 100 - 315 Hz
(±) | lubina reducida - en promedio 9.7% inferior a la mediana
(±) | la linealidad de los graves es media (12.8% delta a frecuencia anterior)
Medios 400 - 2000 Hz
(+) | medios equilibrados - a sólo 2.9% de la mediana
(+) | los medios son lineales (6.3% delta a la frecuencia anterior)
Altos 2 - 16 kHz
(+) | máximos equilibrados - a sólo 3.1% de la mediana
(+) | los máximos son lineales (4.3% delta a la frecuencia anterior)
Total 100 - 16.000 Hz
(+) | el sonido global es lineal (13% de diferencia con la mediana)
En comparación con la misma clase
» 22% de todos los dispositivos probados de esta clase eran mejores, 6% similares, 72% peores
» El mejor tuvo un delta de 7%, la media fue 17%, el peor fue ###max##%
En comparación con todos los dispositivos probados
» 13% de todos los dispositivos probados eran mejores, 3% similares, 85% peores
» El mejor tuvo un delta de 4%, la media fue 23%, el peor fue ###max##%
Lenovo ThinkPad P15 G2-20YQ001JGE análisis de audio
(±) | la sonoridad del altavoz es media pero buena (78 dB)
Graves 100 - 315 Hz
(-) | casi sin bajos - de media 15.5% inferior a la mediana
(±) | la linealidad de los graves es media (9.6% delta a frecuencia anterior)
Medios 400 - 2000 Hz
(±) | medias más altas - de media 7.5% más altas que la mediana
(+) | los medios son lineales (6.6% delta a la frecuencia anterior)
Altos 2 - 16 kHz
(+) | máximos equilibrados - a sólo 2.4% de la mediana
(+) | los máximos son lineales (5.8% delta a la frecuencia anterior)
Total 100 - 16.000 Hz
(±) | la linealidad del sonido global es media (20.6% de diferencia con la mediana)
En comparación con la misma clase
» 74% de todos los dispositivos probados de esta clase eran mejores, 6% similares, 21% peores
» El mejor tuvo un delta de 7%, la media fue 17%, el peor fue ###max##%
En comparación con todos los dispositivos probados
» 55% de todos los dispositivos probados eran mejores, 8% similares, 37% peores
» El mejor tuvo un delta de 4%, la media fue 23%, el peor fue ###max##%
Gestión de la energía: La GPU afecta negativamente a la gestión de la energía
Consumo de energía
El Lenovo ThinkPad P16 funciona de forma más eficiente que otros dispositivos comparables. Incluso en inactivo, es más eficiente energéticamente que la competencia. Sin embargo, para ser justos, también hay que decir que portátiles similares de HP y Dell tienen pantallas 4K. Del mismo modo, a pesar de su LCD WQXGA de mayor resolución, es más eficiente que los P15 y P17 con sus paneles Full HD.
El adaptador de corriente Slim Tip proporciona 170 vatios, bastante justo para el consumo máximo de 168,9 vatios.
| Off / Standby | |
| Ocioso | |
| Carga |
|
Clave:
min: | |
| Lenovo ThinkPad P16 G1 21D6001DMB i7-12850HX, RTX A2000 Laptop GPU, Micron 3400 1TB MTFDKBA1T0TFH, IPS LED, 2560x1600, 16" | Lenovo ThinkPad P15 G2-20YQ001JGE i7-11800H, RTX A3000 Laptop GPU, Kioxia XG7 KXG7AZNV512G, IPS, 1920x1080, 15.6" | Lenovo ThinkPad P17 G2-20YU0025G i7-11800H, RTX A2000 Laptop GPU, Kioxia XG7 KXG7AZNV512G, IPS LED, 1920x1080, 17.3" | HP ZBook Fury 17 G8-4A6A9EA i9-11950H, RTX A3000 Laptop GPU, Toshiba XG6 KXG60ZNV1T02, IPS, 3840x2160, 17.3" | Dell Precision 7670 i7-12850HX, RTX A2000 Laptop GPU, SK Hynix HFS001TEJ9X115N, OLED, 3840x2400, 16" | Asus ExpertBook B6 Flip B6602FC2 i9-12950HX, RTX A2000 Laptop GPU, Samsung PM9A1 MZVL21T0HCLR, IPS, 2560x1600, 16" | Medio NVIDIA RTX A2000 Laptop GPU | Media de la clase Workstation | |
|---|---|---|---|---|---|---|---|---|
| Power Consumption | -23% | -15% | -49% | -56% | -67% | -24% | -39% | |
| Idle Minimum * (Watt) | 5.1 | 6.3 -24% | 6.1 -20% | 7.6 -49% | 7.5 -47% | 10.5 -106% | 6.6 ? -29% | 9.11 ? -79% |
| Idle Average * (Watt) | 9.2 | 10.7 -16% | 10.9 -18% | 16.7 -82% | 9.5 -3% | 11.9 -29% | 11.8 ? -28% | 13.8 ? -50% |
| Idle Maximum * (Watt) | 9.9 | 11.6 -17% | 12.3 -24% | 17.5 -77% | 28.4 -187% | 18 -82% | 16.7 ? -69% | 17.9 ? -81% |
| Load Average * (Watt) | 124.1 | 99.3 20% | 106.3 14% | 117 6% | 139.1 -12% | 182 -47% | 116.3 ? 6% | 96 ? 23% |
| Witcher 3 ultra * (Watt) | 87.7 | 154 -76% | 124 -41% | 150 -71% | 134 -53% | 177.5 -102% | ||
| Load Maximum * (Watt) | 168.9 | 210 -24% | 168.9 -0% | 202 -20% | 220.8 -31% | 229 -36% | 171.2 ? -1% | 180.3 ? -7% |
* ... más pequeño es mejor
Power consumption Witcher 3 / stress test
Power consumption with an external monitor
Duración de la batería
Lenovo no ha realizado cambios en la batería interna de polímero de litio de 94 vatios/hora. En consecuencia, la duración de la batería está a un nivel similar al de sus predecesores con unas nueve horas en la prueba WiFi (brillo de pantalla de 150 cd/m²). El ThinkPad P16 tiene una clara ventaja sobre el Dell Precision 7670que no dura tanto en el test WiFi debido a su batería más pequeña de 83 vatios/hora y su pantalla 4K.
| Lenovo ThinkPad P16 G1 21D6001DMB i7-12850HX, RTX A2000 Laptop GPU, 94 Wh | Lenovo ThinkPad P15 G2-20YQ001JGE i7-11800H, RTX A3000 Laptop GPU, 94 Wh | Lenovo ThinkPad P17 G2-20YU0025G i7-11800H, RTX A2000 Laptop GPU, 94 Wh | HP ZBook Fury 17 G8-4A6A9EA i9-11950H, RTX A3000 Laptop GPU, 94 Wh | Dell Precision 7670 i7-12850HX, RTX A2000 Laptop GPU, 83 Wh | Asus ExpertBook B6 Flip B6602FC2 i9-12950HX, RTX A2000 Laptop GPU, 90 Wh | Media de la clase Workstation | |
|---|---|---|---|---|---|---|---|
| Duración de Batería | -12% | -9% | -5% | -33% | -7% | -15% | |
| WiFi v1.3 (h) | 9.4 | 9.9 5% | 9.8 4% | 7.4 -21% | 5.9 -37% | 8.7 -7% | 8.55 ? -9% |
| Load (h) | 1.8 | 1.3 -28% | 1.4 -22% | 2 11% | 1.3 -28% | 1.7 -6% | 1.441 ? -20% |
Pro
Contra
Veredicto: La nueva estación de trabajo ThinkPad queda al descubierto por el chip gráfico
Con el ThinkPad P16 Gen 1, Lenovo ha dado un gran paso y ha pasado de tener dos estaciones de trabajo de 15 y 17 pulgadas a un único modelo de 16 pulgadas, una simplificación de la gama poco habitual pero bienvenida. Al mismo tiempo, Lenovo también se ha atrevido a cambiar el lenguaje de diseño anterior de la serie ThinkPad P. En conjunto, el resultado es una estación de trabajo muy buena que, sin embargo, no está exenta de defectos.
Uno de los puntos fuertes del portátil de Lenovo es, sin duda, su capacidad de ampliación. Sólo este tipo de estaciones de trabajo pueden ofrecer hasta cuatro ranuras de RAM. El dispositivo también viene repleto de funciones y está preparado para WWAN. Sin embargo, echamos de menos el puerto ethernet RJ45. Si el nuevo diseño es una mejora óptica, es cuestión de gustos, pero la nueva tapa de la pantalla reforzada con metal es, sin duda, muy sólida. La pantalla WQXGA mate impresiona por su gran brillo, pero es una pena que Lenovo no ofrezca el panel de 165 Hz delX1 Extreme Gen 5. Los dispositivos de entrada del ThinkPad P16 siguen siendo muy buenos, pero la reducción del recorrido de las teclas hace que no esté al mismo nivel que su predecesor, elThinkPad P17.
Cuando se trata de estaciones de trabajo móviles, el rendimiento es clave. Aquí podemos ver que el rendimiento del procesador ha mejorado significativamente. Sin embargo, eso no se aplica a la GPU: innecesariamente, Lenovo ha dejado la RTX A2000 en un consumo de sólo 60 vatios. Extrañamente, los ventiladores no funcionan con potencia bajo carga pura de la CPU, así que por esta razón, el rendimiento del portátil bajo carga se ralentiza. Hablando del ventilador: Bajo carga sostenida, la refrigeración activa funciona muy ruidosamente. Sin embargo, esto tiene el beneficio de que en casi todas las áreas, el ThinkPad P16 se mantiene considerablemente más fresco que sus modelos predecesores, el P15 y el P17.
El rendimiento de la CPU es potente, pero la GPU se queda atrás en esta versión de pruebas del ThinkPad P16.
En resumen, nuestro modelo de pruebas Lenovo ThinkPad P16 G1 es una elección excelente cuando se le piden tareas pesadas para la CPU. Si la GPU es importante, deberías abstenerte de comprar la versión RTX-A2000. Sin embargo, eso no significa que un ThinkPad P16 con una de las GPU más potentes sufra el mismo problema: nuestro análisis del modelo Nvidia RTX A5500 ya está en línea.
Para alguien que busque una estación de trabajo más móvil, una alternativa interesante podría ser el Dell Precision 7670, con su carcasa más delgada y compacta. El Asus ExpertBook B6 Flip combina la potencia de una estación de trabajo con un diseño convertible y podría ser una opción interesante para los usuarios que trabajan frecuentemente con un lápiz óptico.
Precio y disponibilidad
El alto rendimiento tiene un precio: El ThinkPad P16 cuesta al menos 2.050 dólares y los modelos mejor equipados superan los 3.500 dólares. Un dispositivo similar a nuestro modelo de pruebas cuesta unos 2.800 dólares en Amazon: .
Lenovo ThinkPad P16 G1 21D6001DMB
- 01/27/2023 v7 (old)
Benjamin Herzig
Price comparison

