Análisis del portátil HP Elite Dragonfly G3 13.5: Diseño y rendimiento totalmente nuevos
El Dragonfly G3 sucede directamente al Dragonfly Max (es decir, el Dragonfly G2) con un nuevo hardware de arriba a abajo. Aparte de la obvia actualización de la CPU de la 11ª generación Tiger Lake-U a la 12ª generación Alder Lake-U, el G3 presenta un nuevo factor de forma 3:2 y una pantalla de 13,5 pulgadas que contrasta con el antiguo diseño 16:9 de 13,3 pulgadas. HP dice que todos los cambios se dirigen colectivamente a una fuerza de trabajo híbrida fuera y dentro de casa
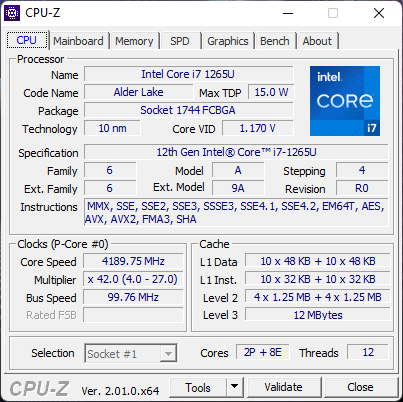
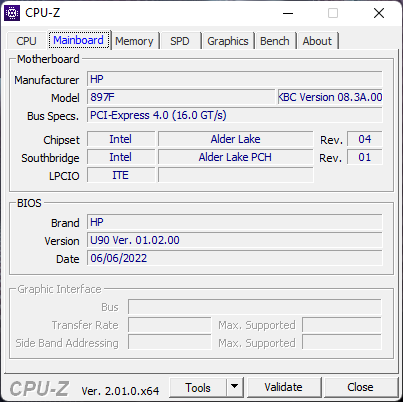
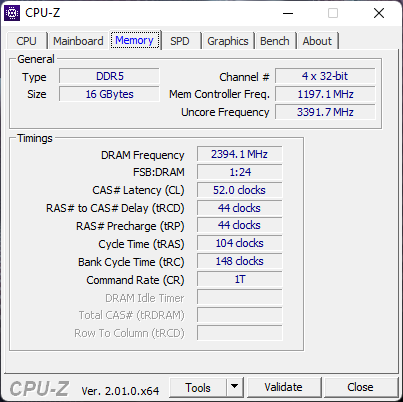
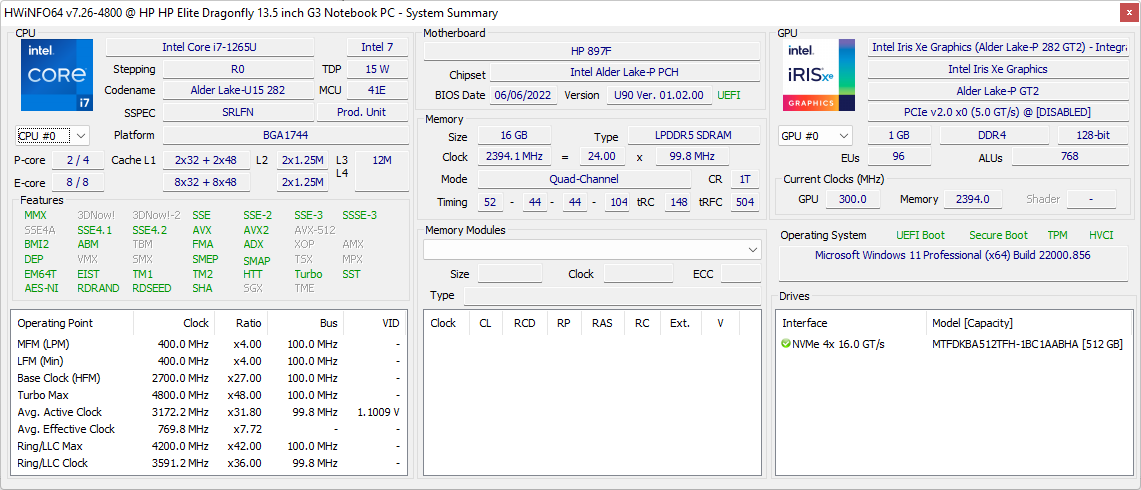
Nuestra unidad de análisis viene configurada con la CPU Core i7-1265U vPro, pantalla IPS de 1280p, WWAN 5G y SSD de 512 GB por unos 2700 dólares. Hay otras configuraciones disponibles con el Core i5-1235U de menor potencia hasta una pantalla táctil OLED, pero todas las opciones vienen con gráficos Iris Xe integrados y al menos 16 GB de RAM LPDDR5
Entre las alternativas al Dragonfly G3 se encuentran otros portátiles insignia de 13 pulgadas para la oficina o la empresa, como el Dell Latitude 13 7330, Lenovo ThinkPad X1 Yoga G1, MSI Summit E13o el Portátil Framework
Más opiniones de HP
Posibles contendientes en la comparación
Valoración | Fecha | Modelo | Peso | Altura | Tamaño | Resolución | Precio |
|---|---|---|---|---|---|---|---|
| 91 % v7 (old) | 08/2022 | HP Elite Dragonfly G3 i7-1265U, Iris Xe G7 96EUs | 1.2 kg | 16.3 mm | 13.50" | 1920x1280 | |
| 89.4 % v7 (old) | 12/2020 | HP Spectre x360 14t-ea000 i7-1165G7, Iris Xe G7 96EUs | 1.3 kg | 17.2 mm | 13.50" | 1920x1280 | |
| 86.1 % v7 (old) | 08/2022 | Dell XPS 13 Plus 9320 i5-1240p i5-1240P, Iris Xe G7 80EUs | 1.2 kg | 15.3 mm | 13.40" | 1920x1200 | |
| 85.1 % v7 (old) | 07/2022 | Framework Laptop 13.5 12th Gen Intel i7-1260P, Iris Xe G7 96EUs | 1.3 kg | 15.85 mm | 13.50" | 2256x1504 | |
| 84 % v7 (old) | 08/2021 | HP EliteBook Folio 13.5-3G2L2EA SD 8cx Gen 2 5G, Adreno 680 | 1.3 kg | 16 mm | 13.50" | 1920x1280 | |
| 87.3 % v7 (old) | 04/2021 | Lenovo ThinkPad X1 Titanium Yoga G1 20QA001RGE i7-1160G7, Iris Xe G7 96EUs | 1.2 kg | 11.5 mm | 13.50" | 2256x1504 |
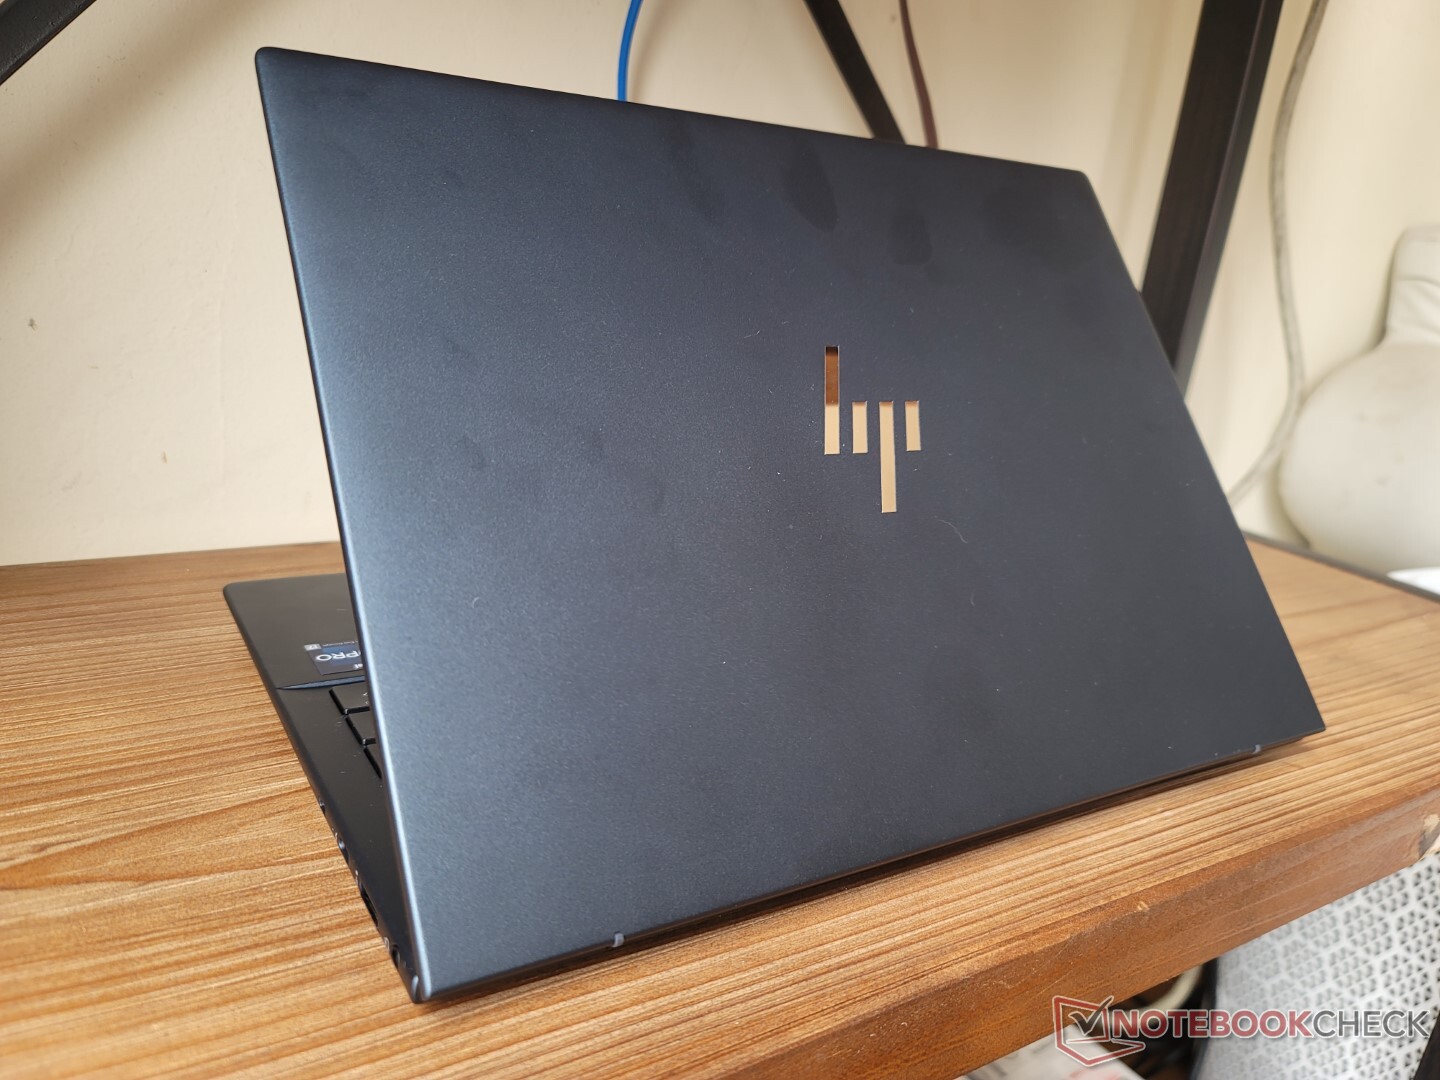
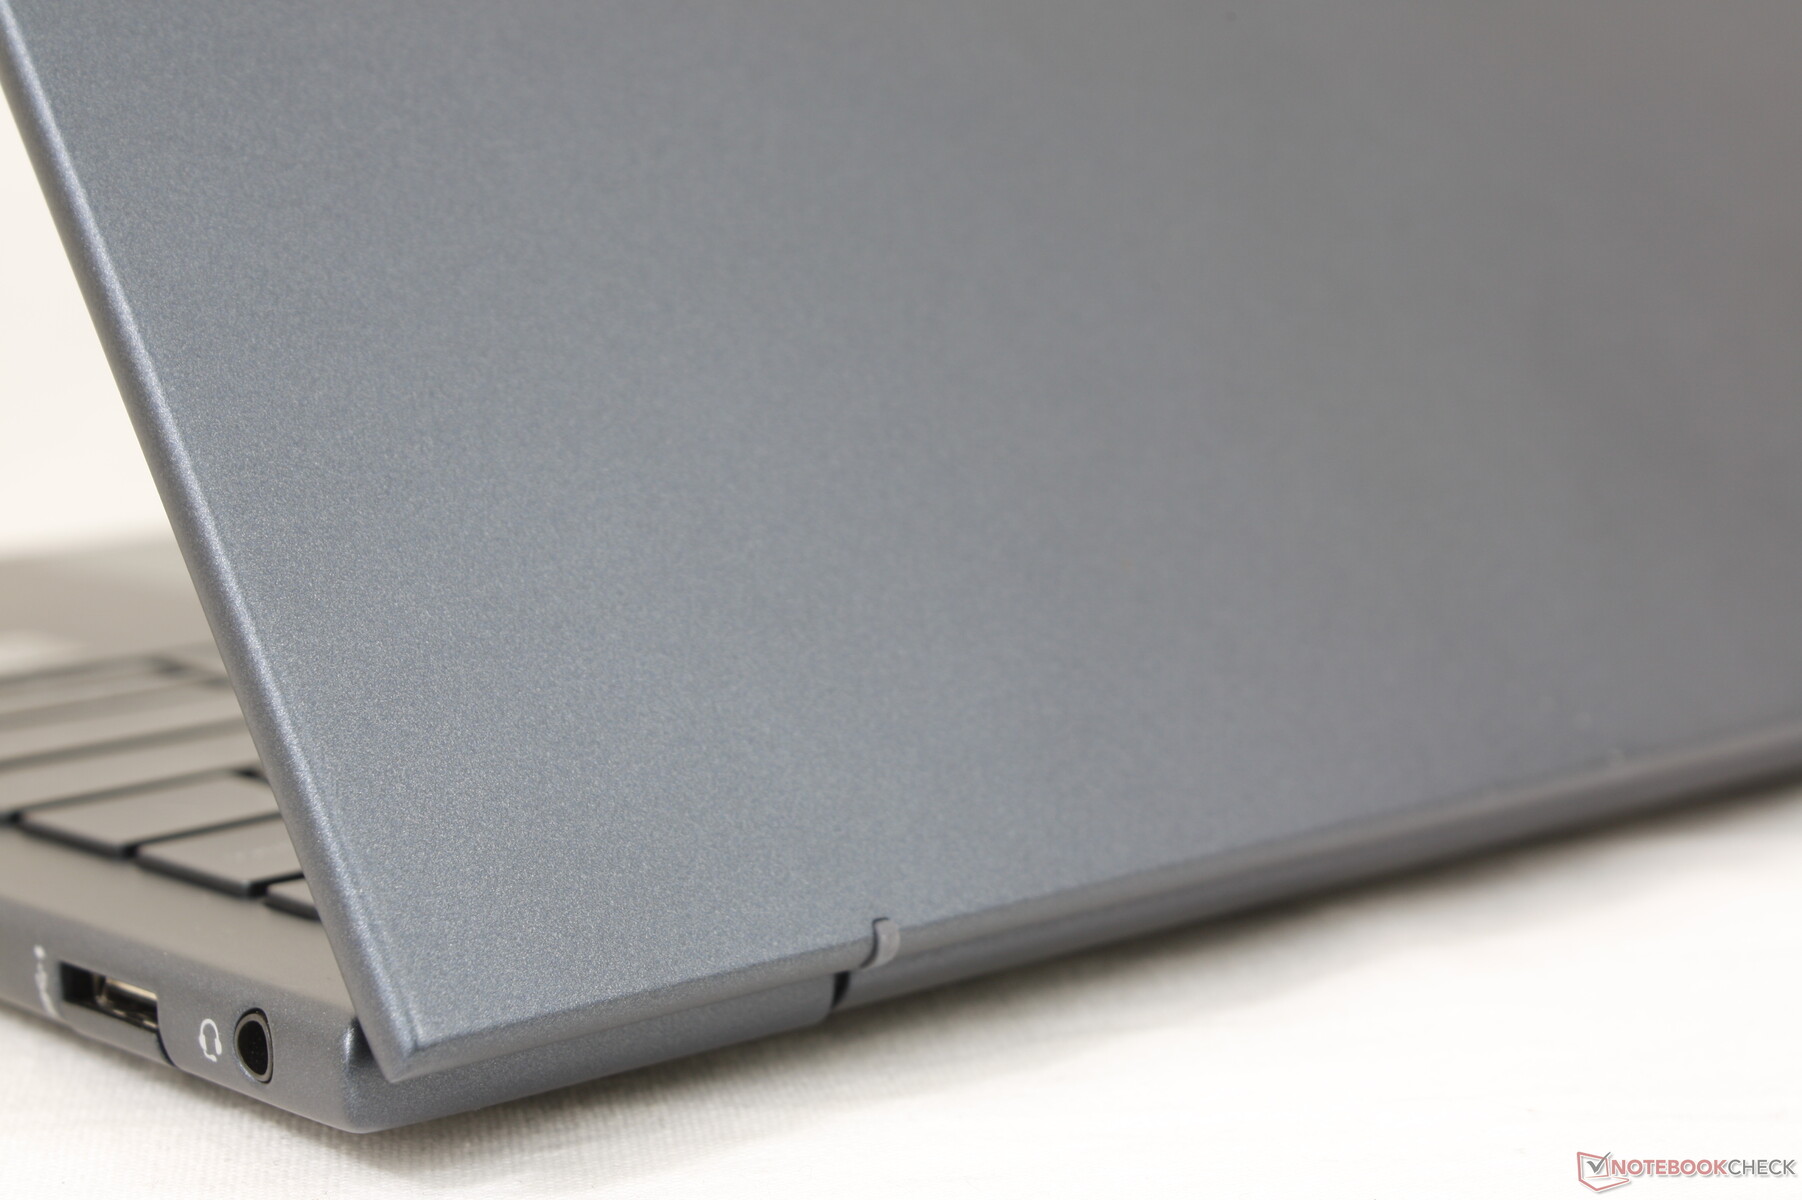
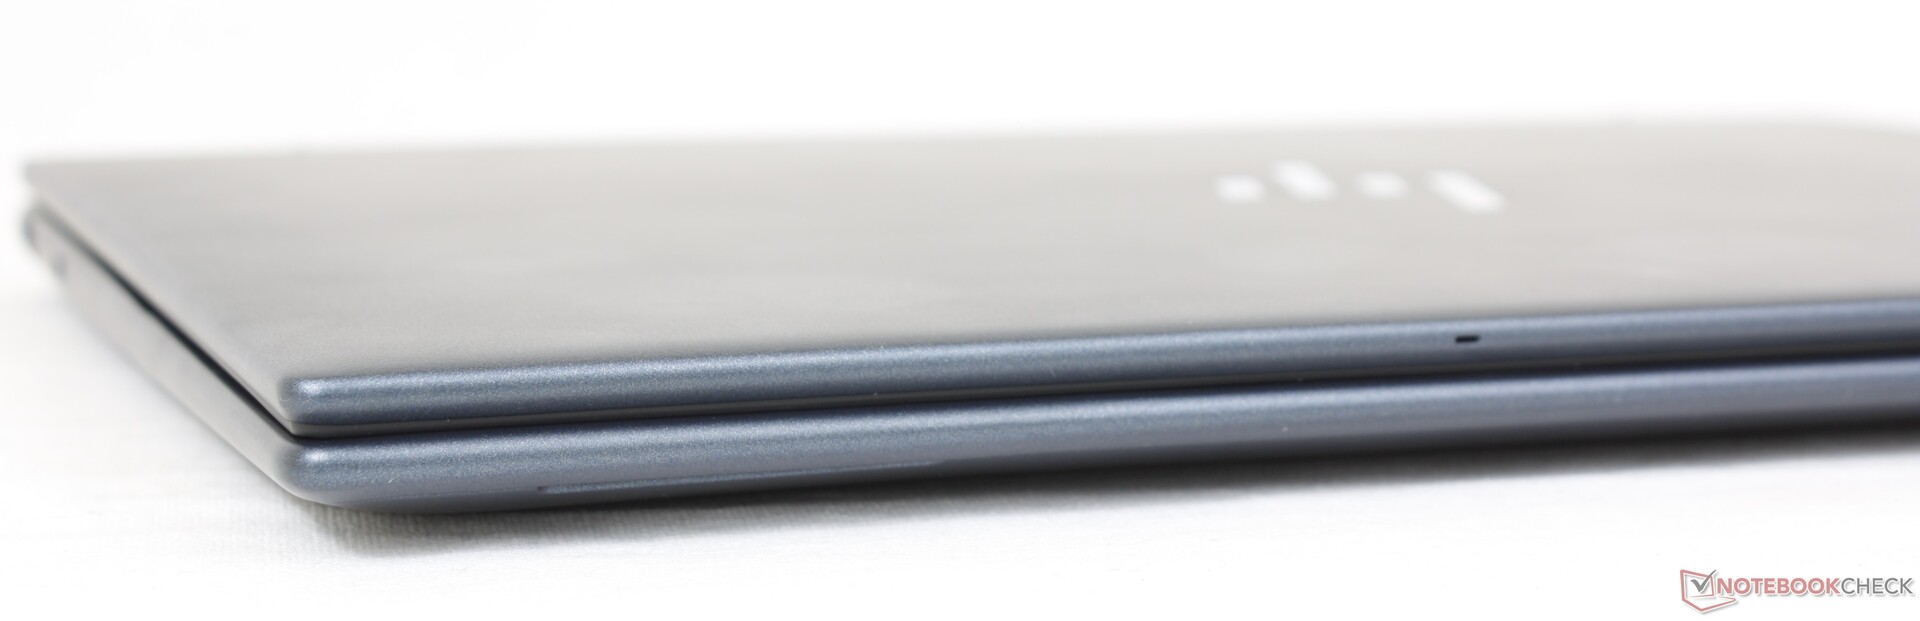
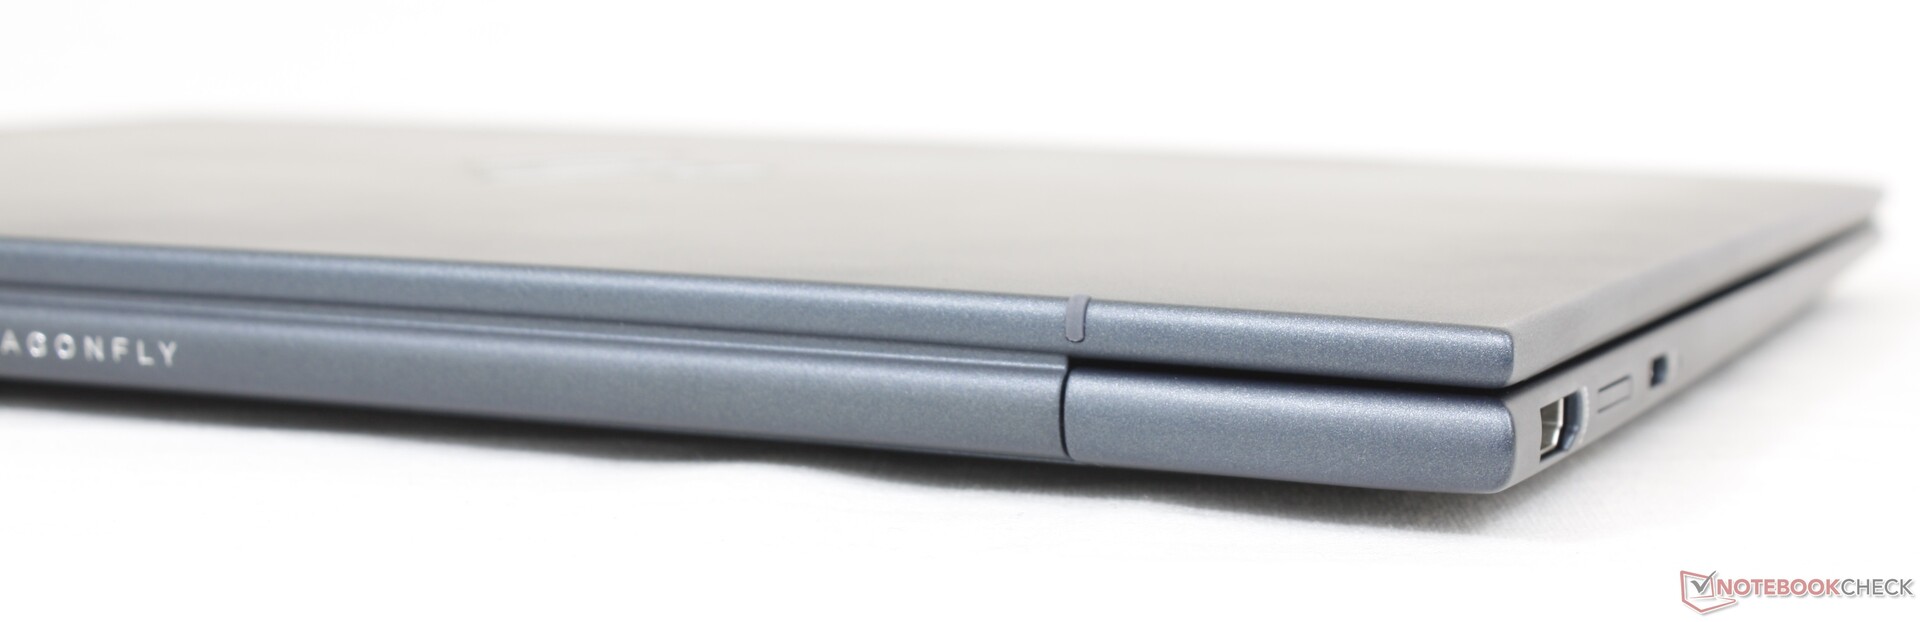
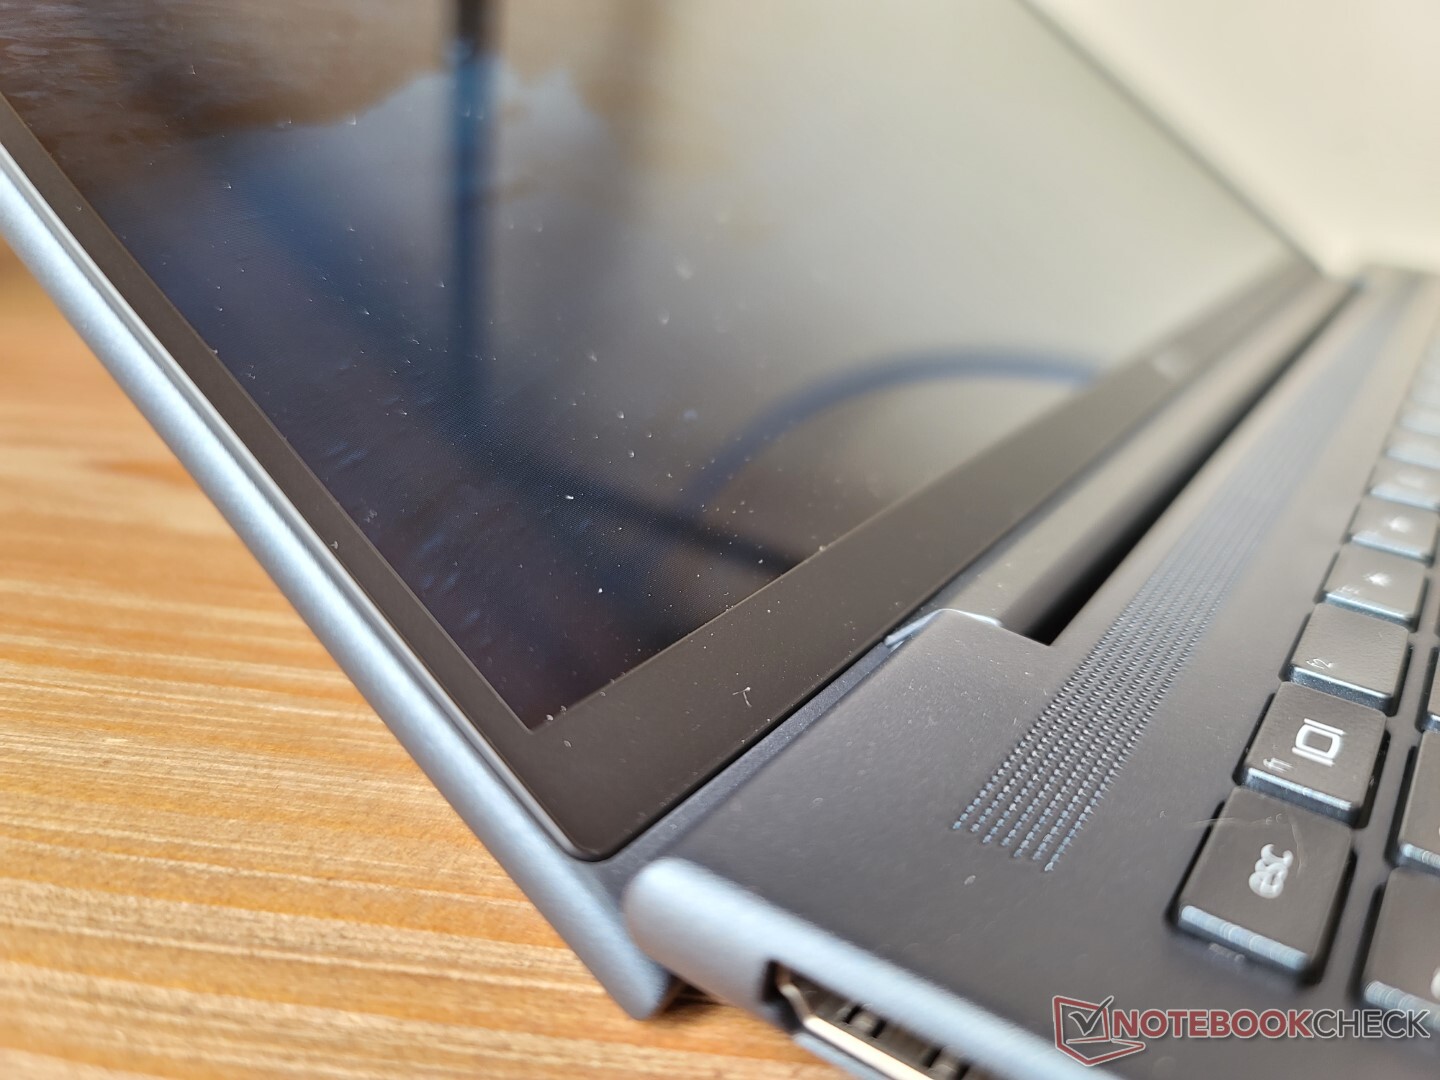
Caja - Base fuerte, tapa débil
El chasis metálico se mantiene fuerte y rígido alrededor de la base y el centro del teclado. Sin embargo, no se puede decir lo mismo de la tapa, ya que se tuerce y flexiona con la misma facilidad que las tapas del LG gram o Samsung Galaxy Book. Aplicar presión en el centro de la tapa exterior deforma la superficie más fácilmente que la tapa de un Spectre. El peso muy bajo y la falta de cualquier refuerzo Gorilla Glass contribuyen a la tapa más débil del Dragonfly G3.
Cabe destacar que el Dragonfly G3 no viene con ninguna de las opciones de colores vibrantes que ofrecía el modelo de lanzamiento original de 2020. Las nuevas opciones de color se han vuelto más mates y estériles en comparación. Para una serie llamada "Dragonfly", sus colores se están pareciendo demasiado a los de un típico modelo EliteBook.
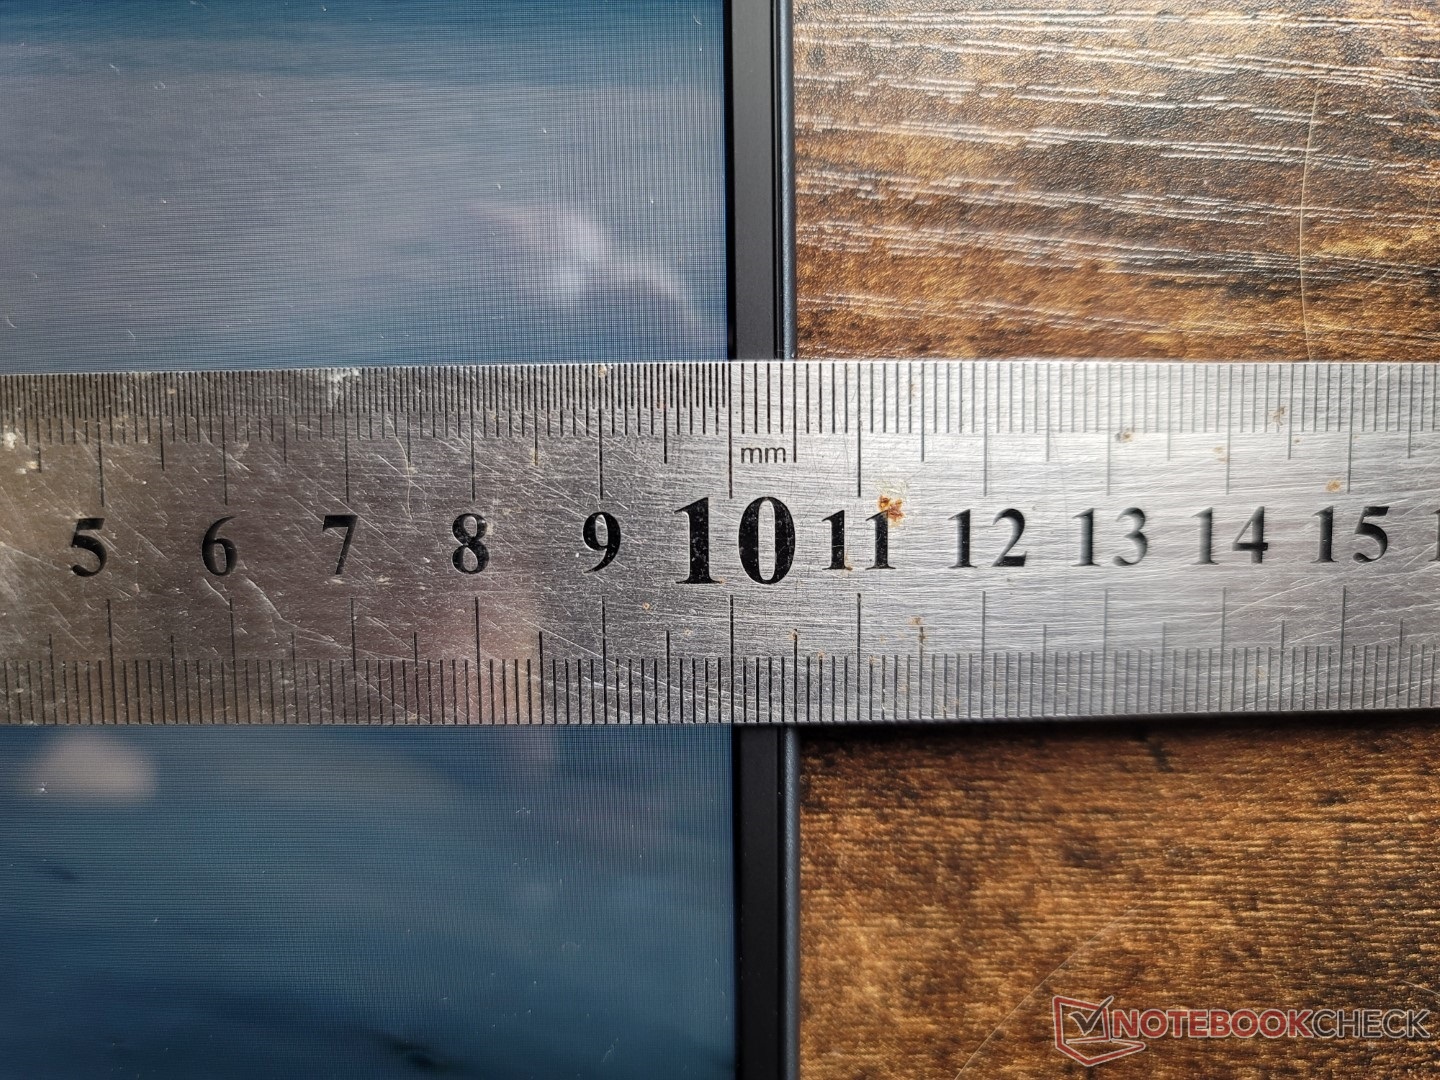
El nuevo modelo es más largo que el Dragonfly Max saliente en más de 20 mm debido a su nuevo factor de forma de 13,5 pulgadas, pero afortunadamente no es más pesado con 1,2 kg a pesar del mayor volumen. Tal vez no sorprenda que las dimensiones sean casi idénticas a las del reciente Spectre x360 13.5 de 13,5 pulgadas.
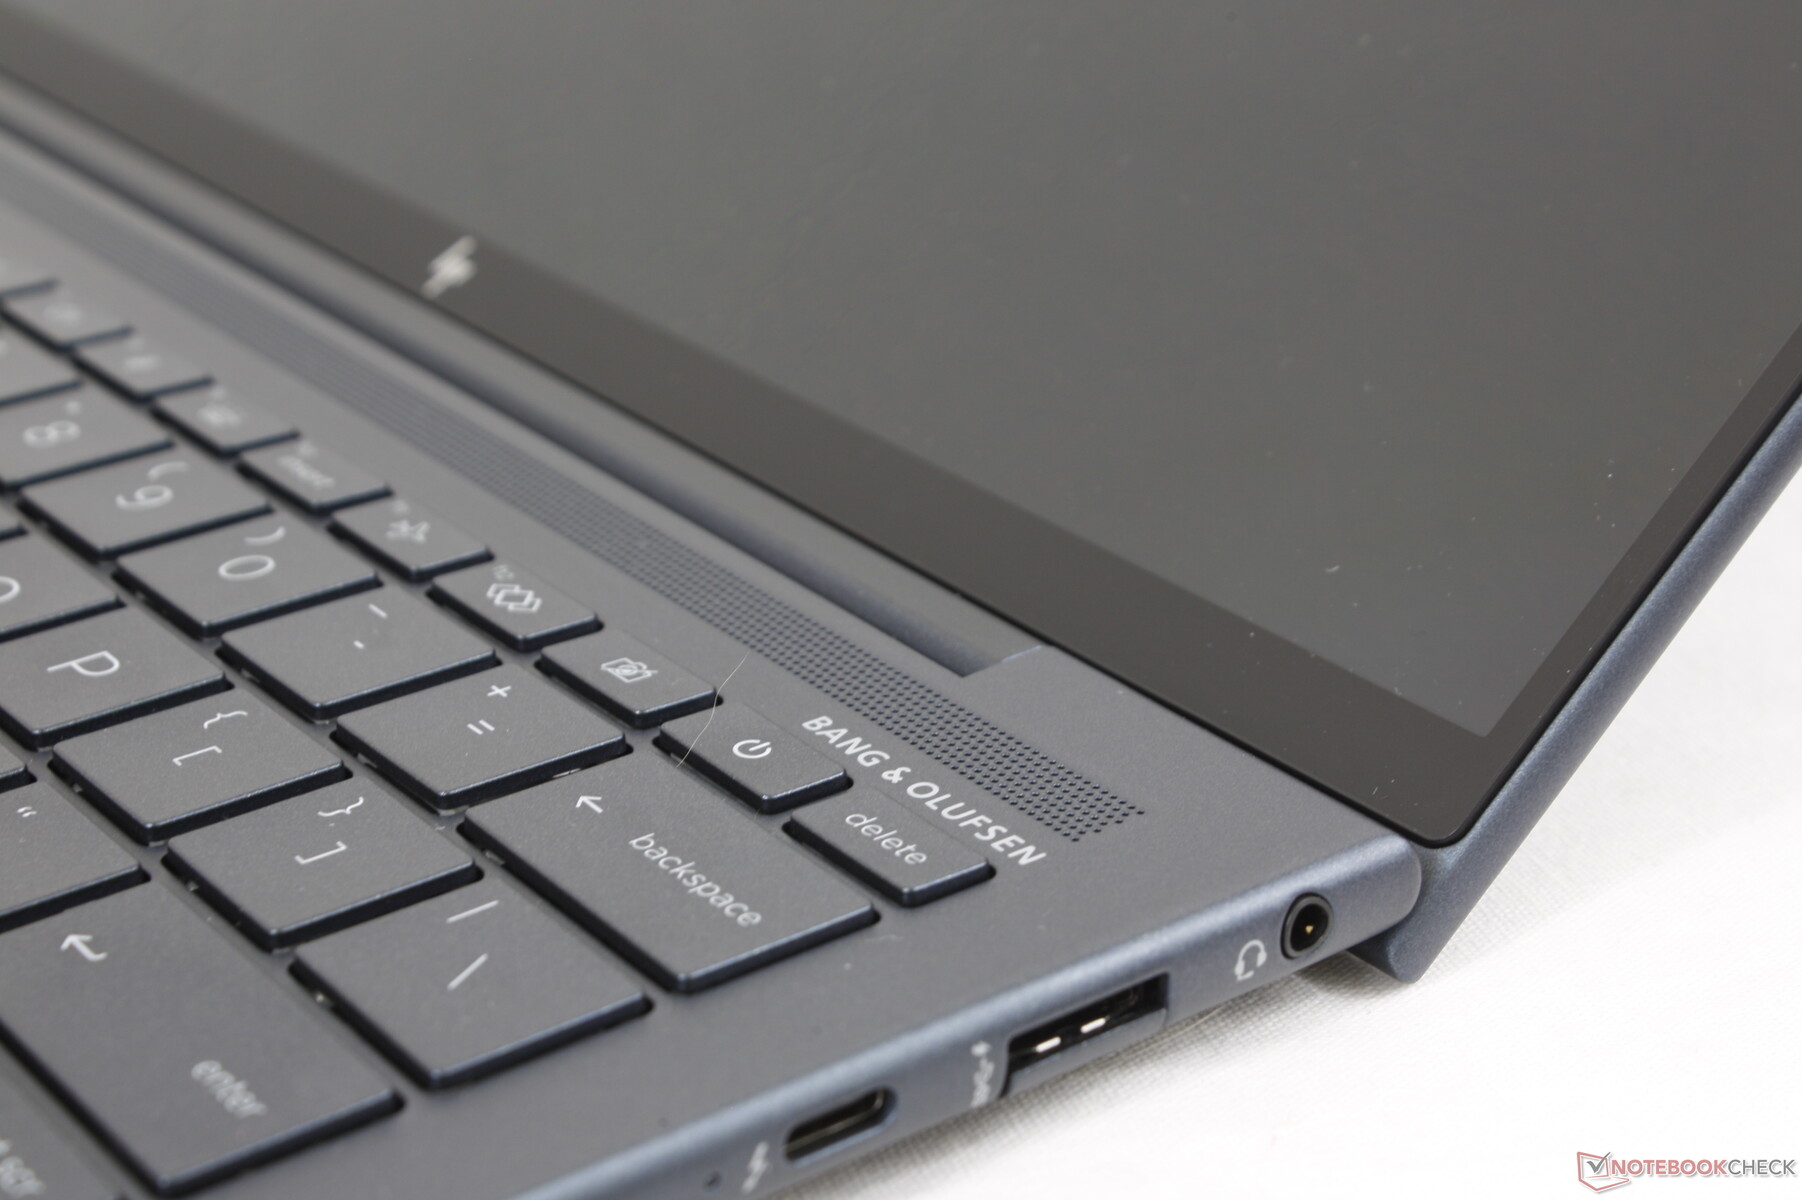
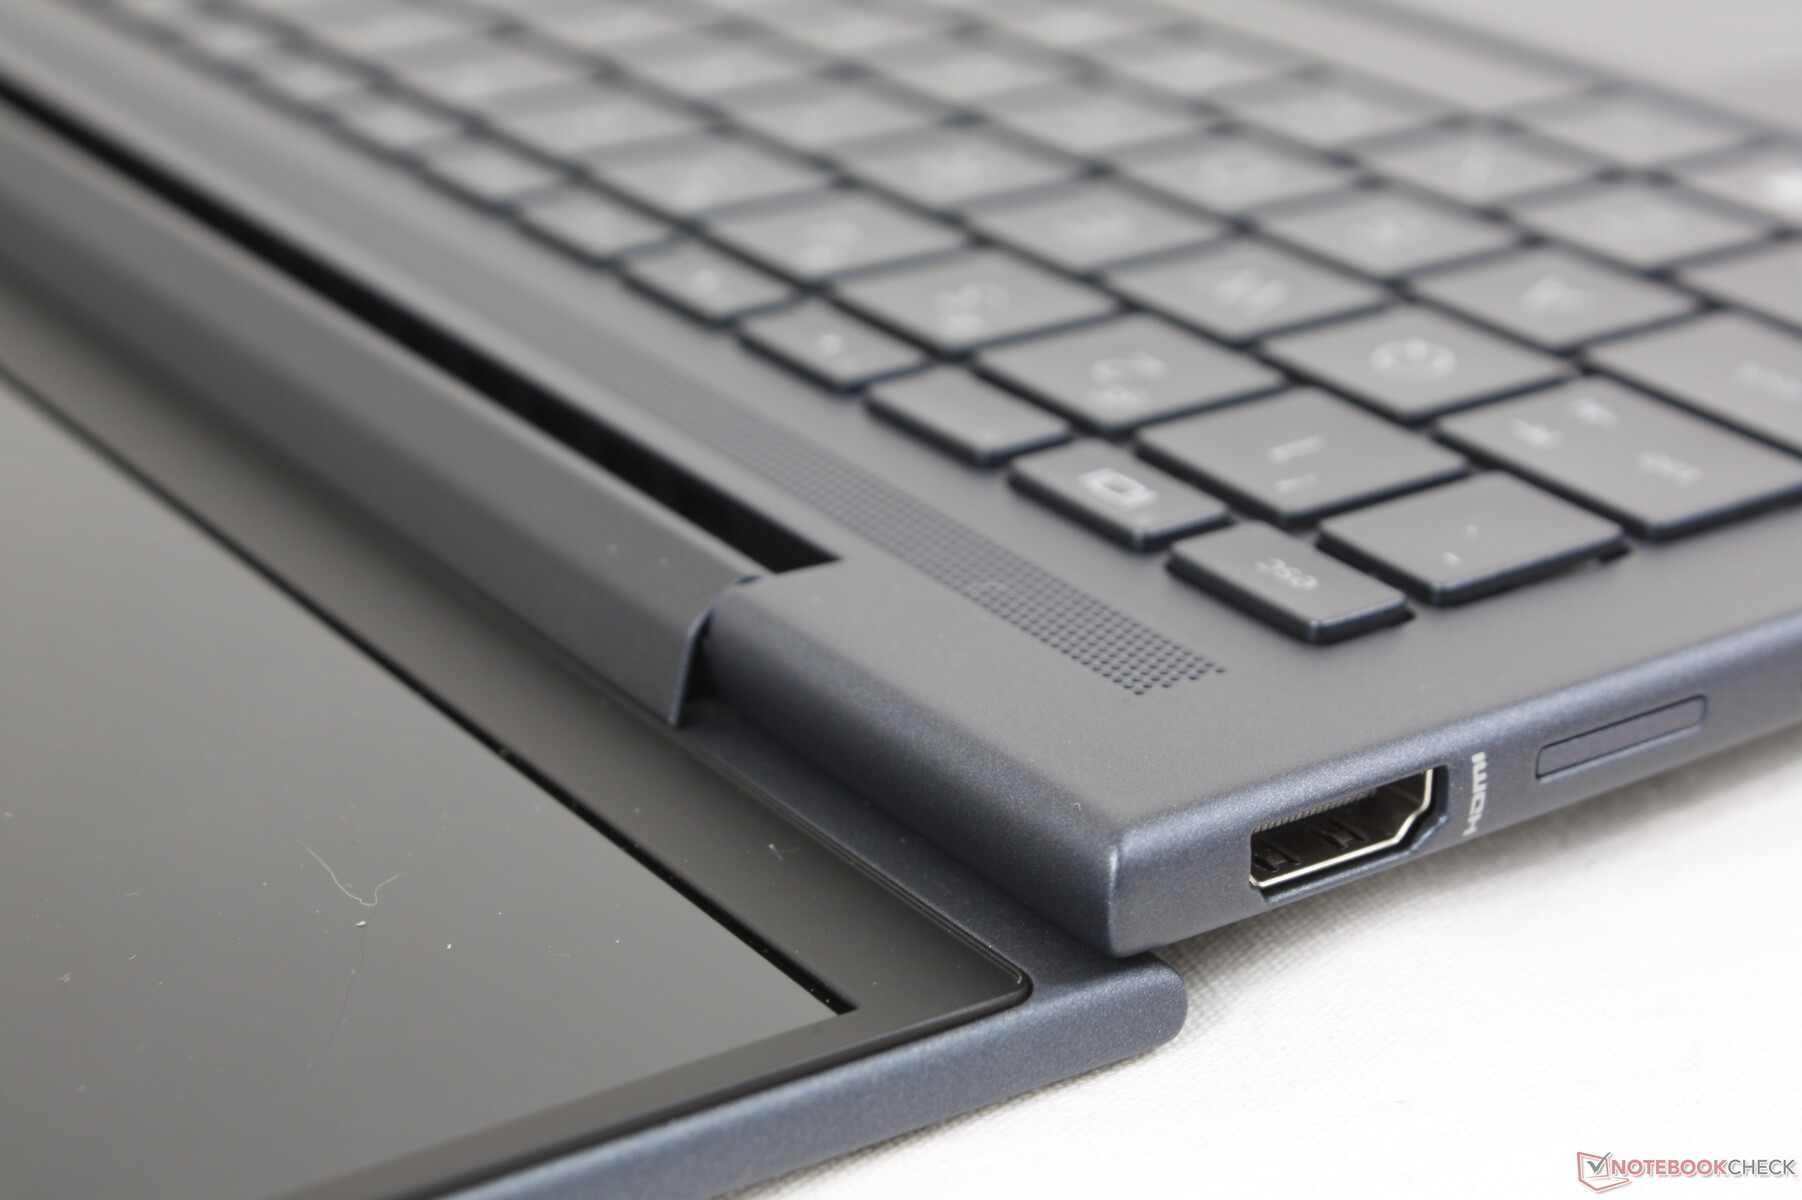
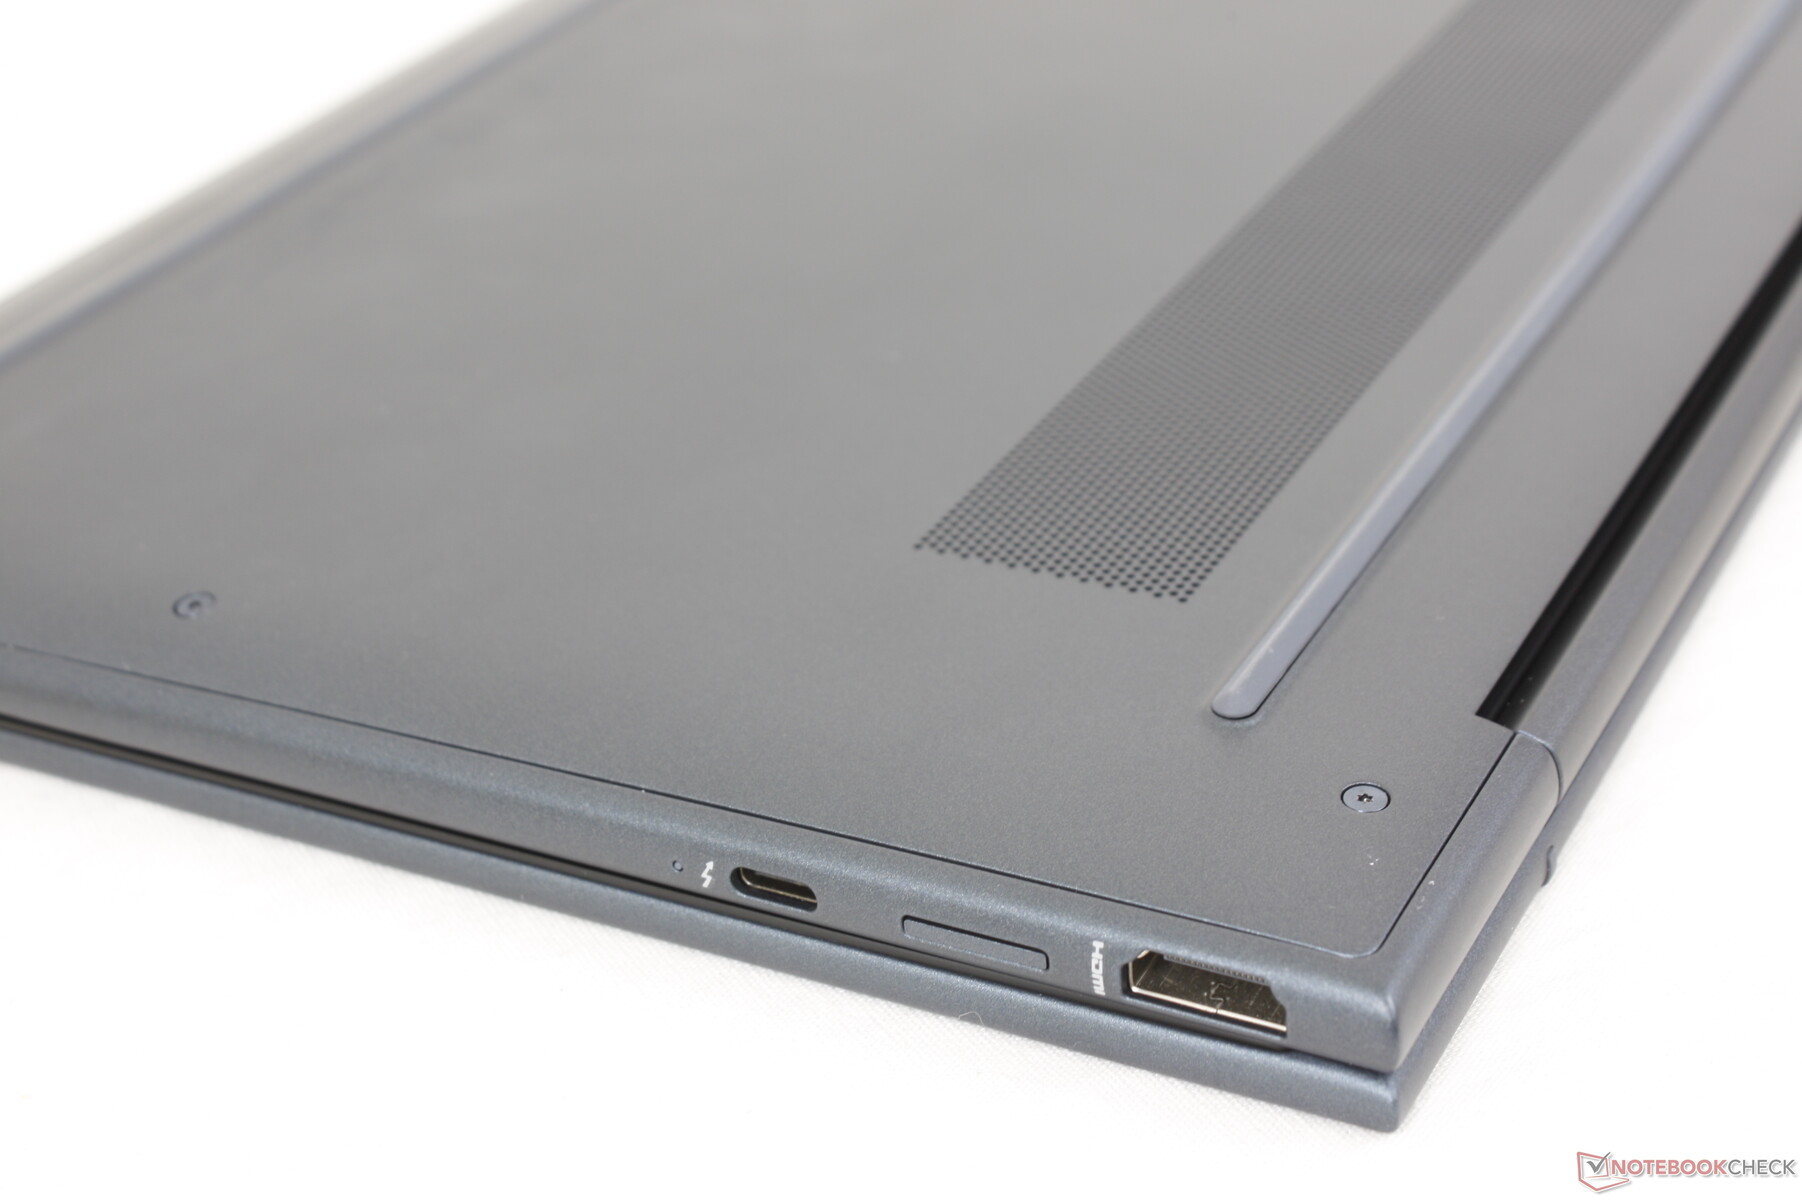
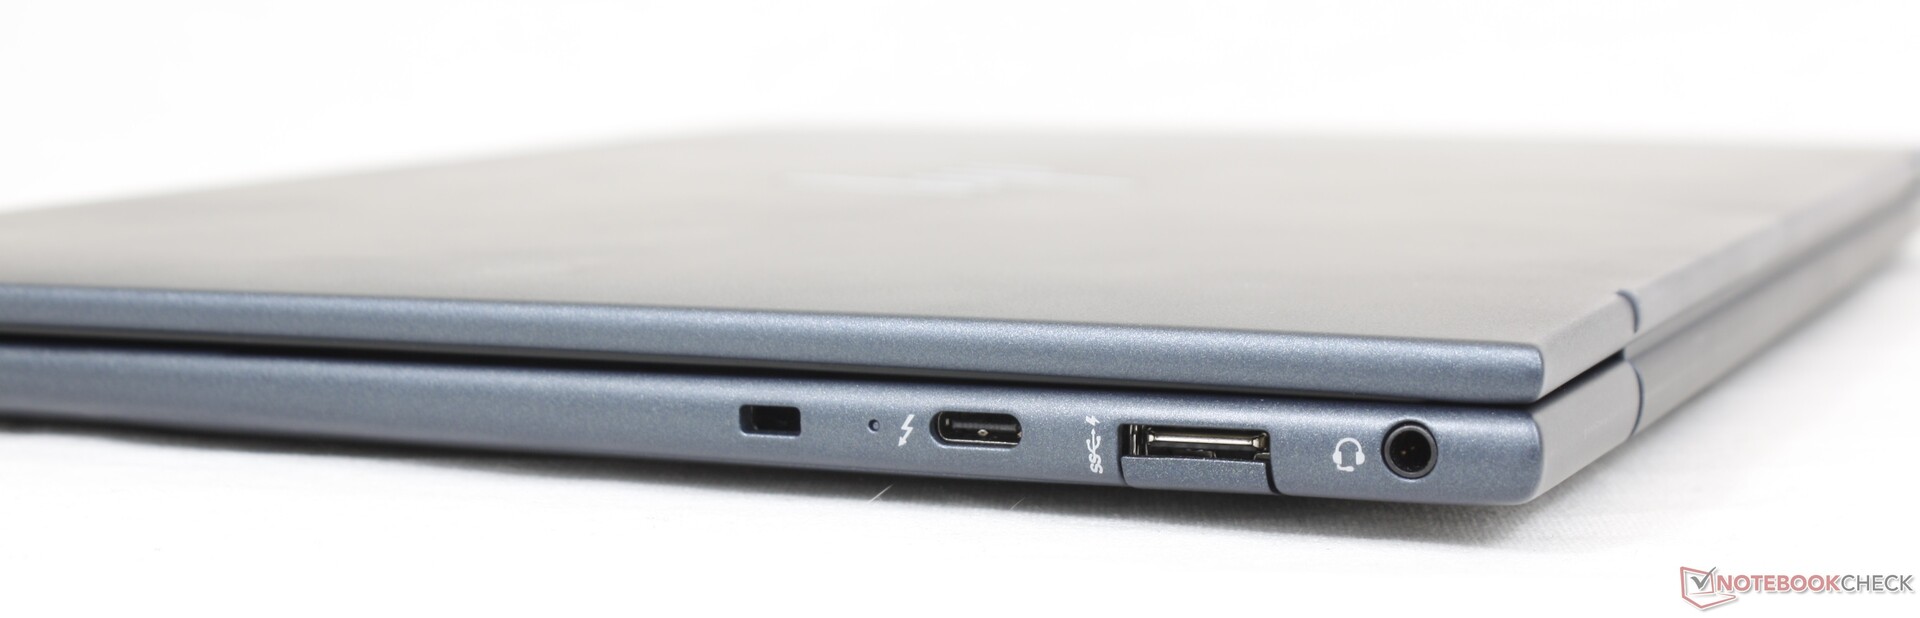
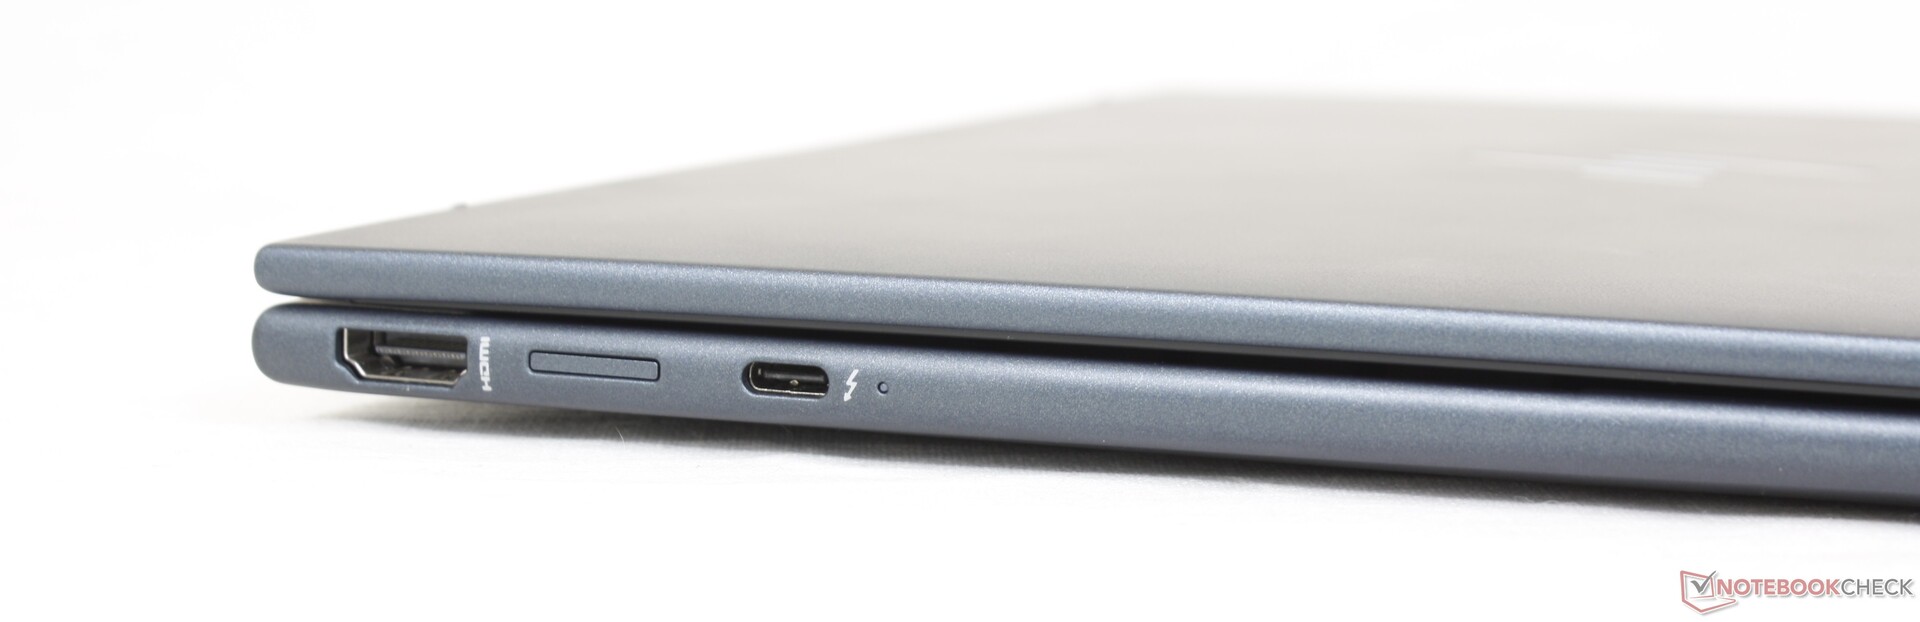
Conectividad - Soporte de Thunderbolt 4
Las opciones de puerto son esencialmente las mismas que en el Dragonfly Max, pero reorganizadas para mejor. Los dos puertos USB-C, por ejemplo, están ahora a lo largo de los bordes izquierdo y derecho del portátil en vez de sólo en el borde derecho para permitir la carga en cualquier lado del portátil.
No hay lector de tarjetas SD integrado de nuevo, ya que HP está impulsando su propia solución de software inalámbrico QuickDrop. QuickDrop funciona bastante bien para los smartphones, pero los usuarios de cámaras dedicadas que dependen de las tarjetas SD siguen sin tener suerte.
Comunicación
Un Intel AX211 viene de serie para la conectividad Wi-Fi 6E y Bluetooth 5.2. Experimentamos excelentes tasas de transferencia de recepción cuando se emparejó a nuestra red de 6 GHz, pero las tasas de transmisión podrían haber sido más estables
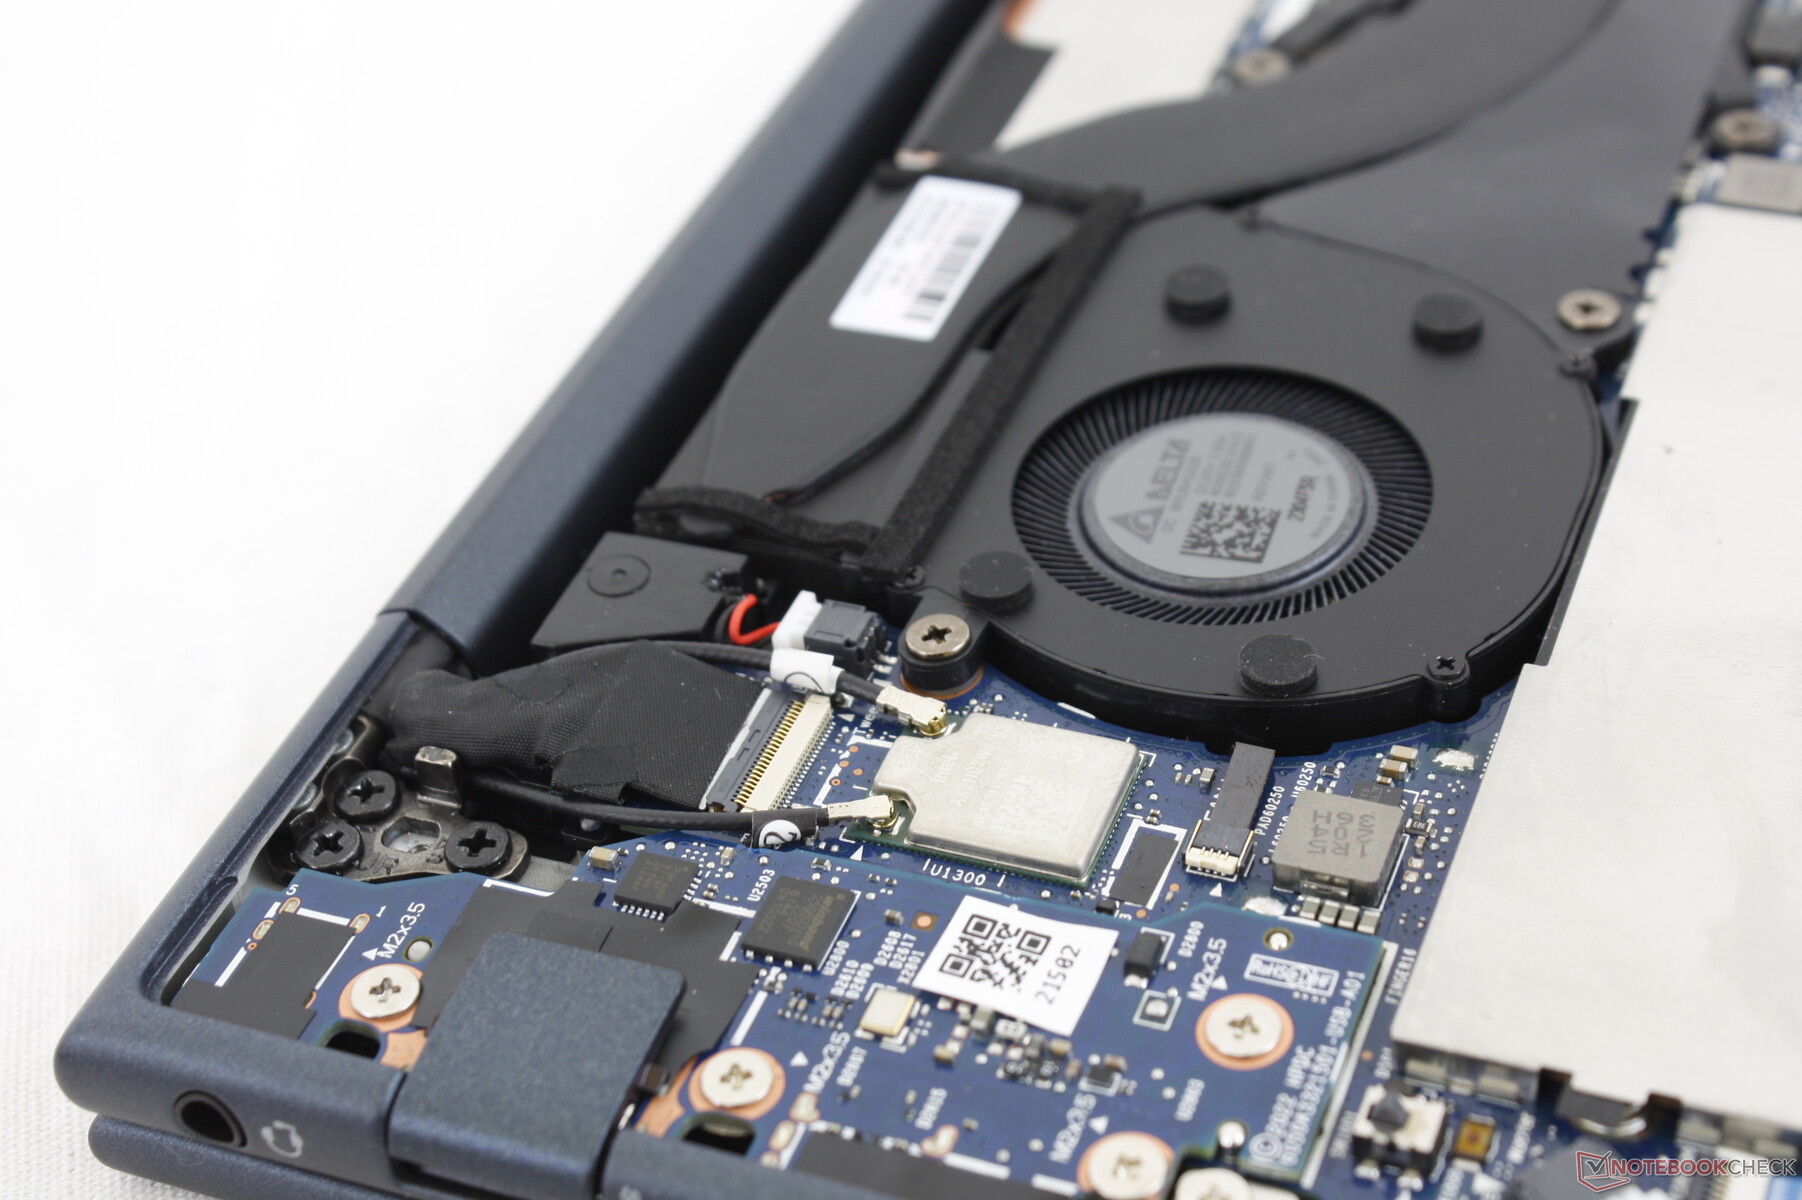
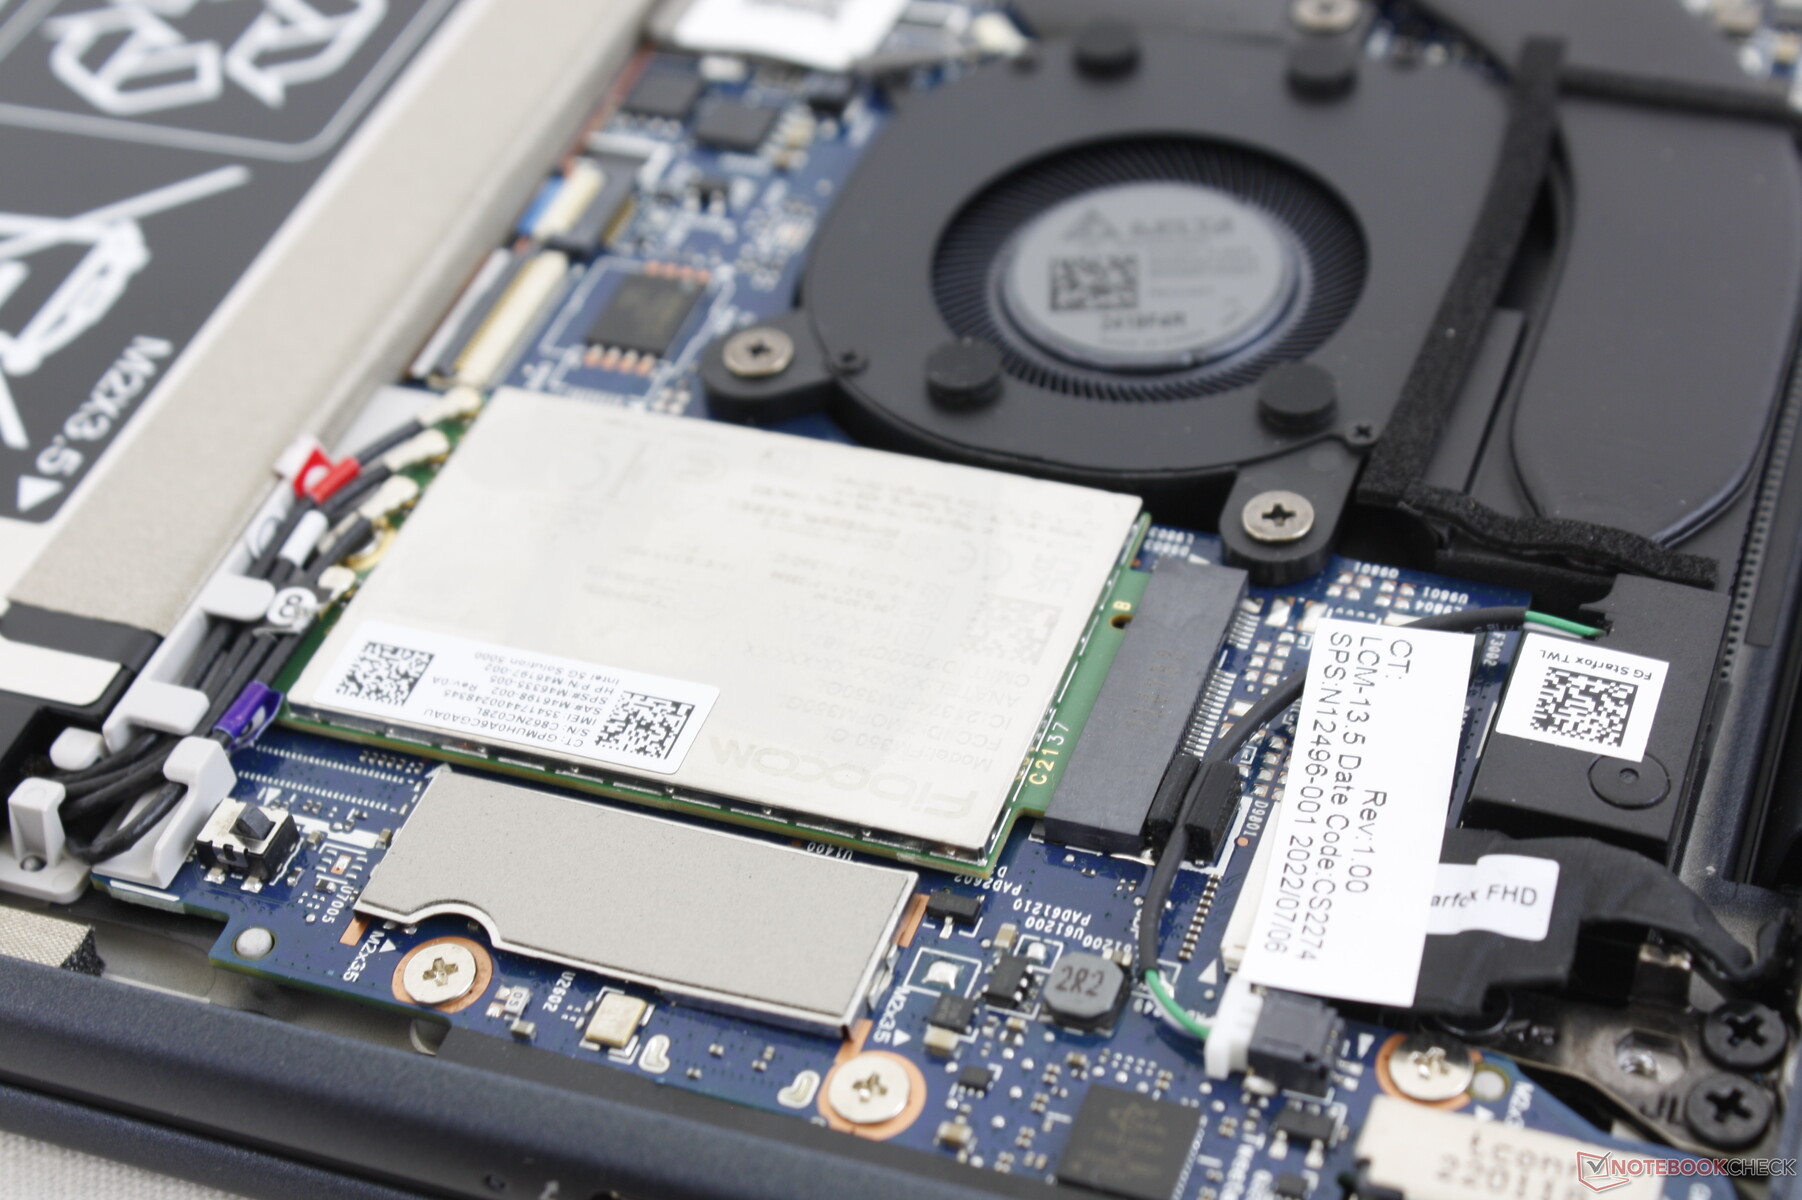
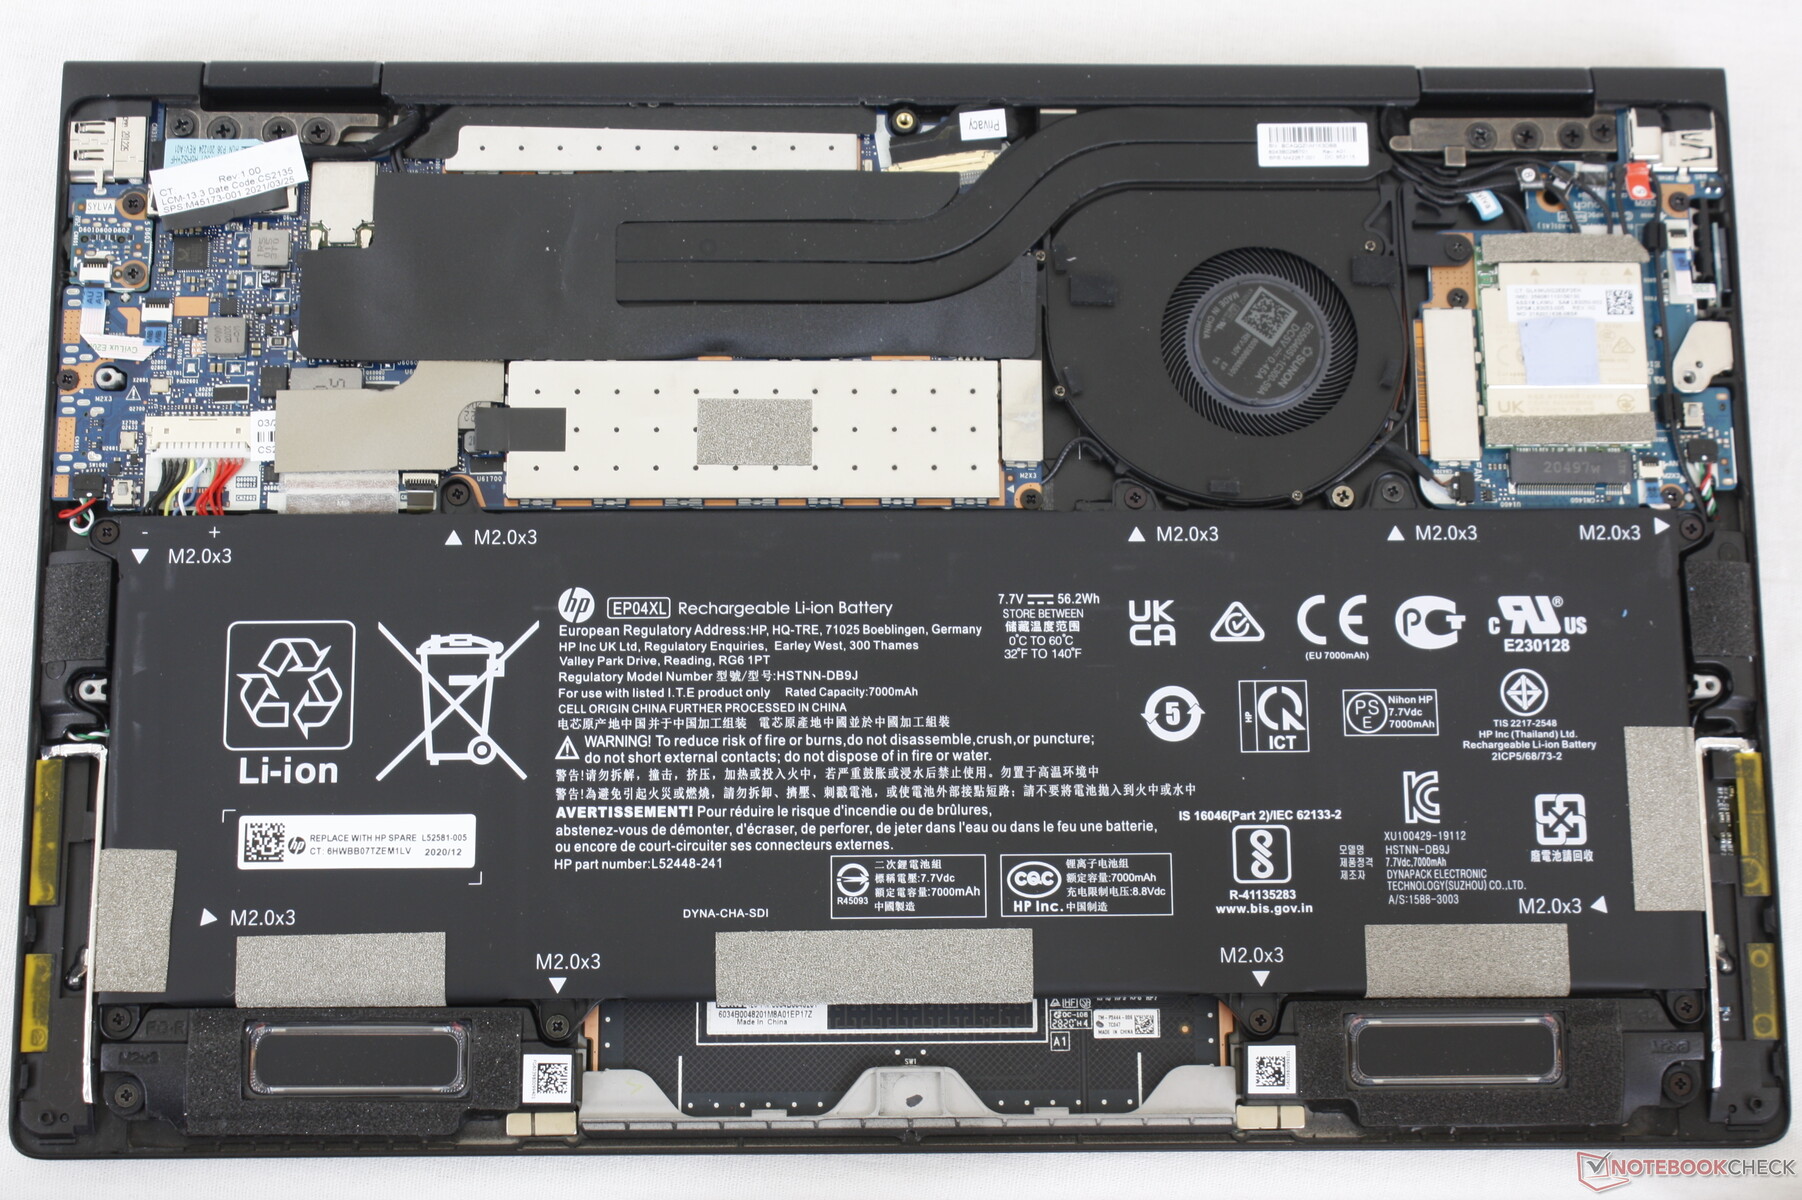
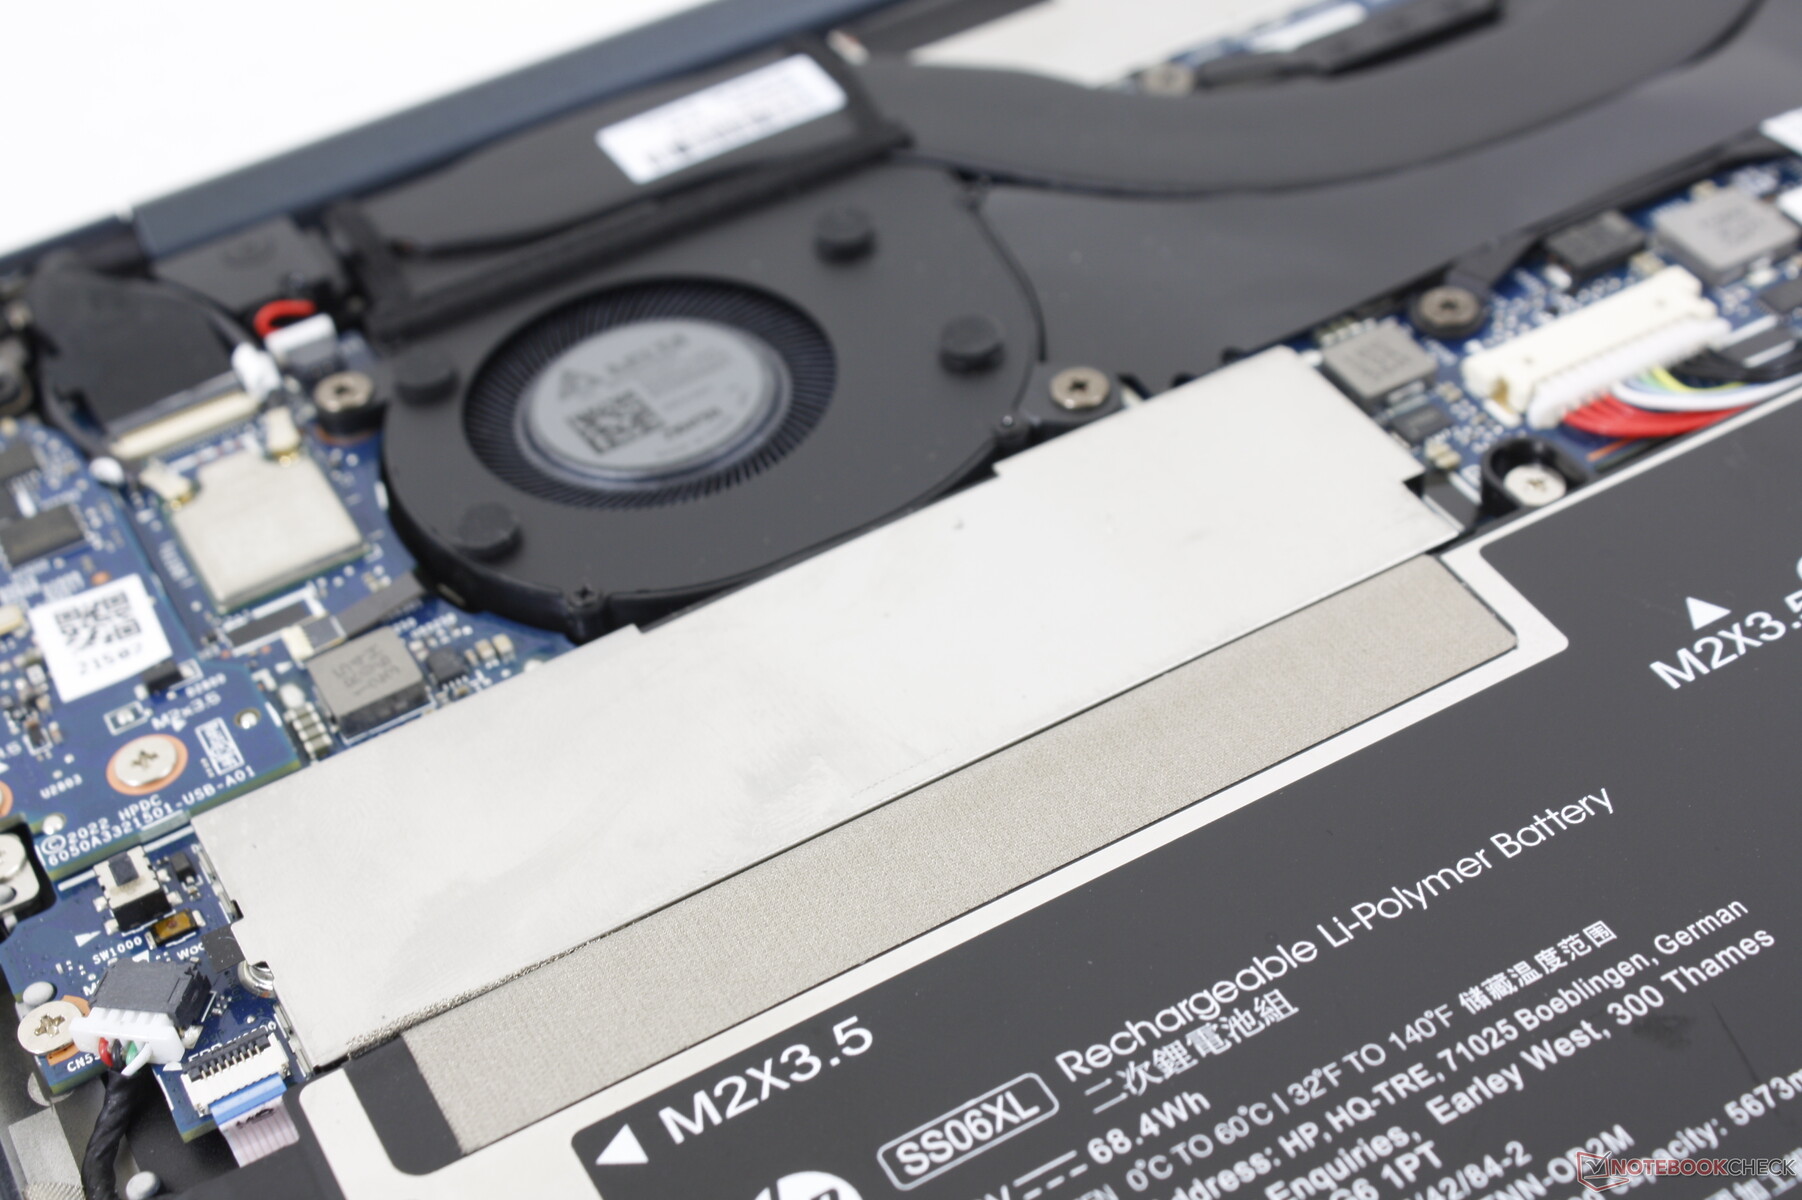
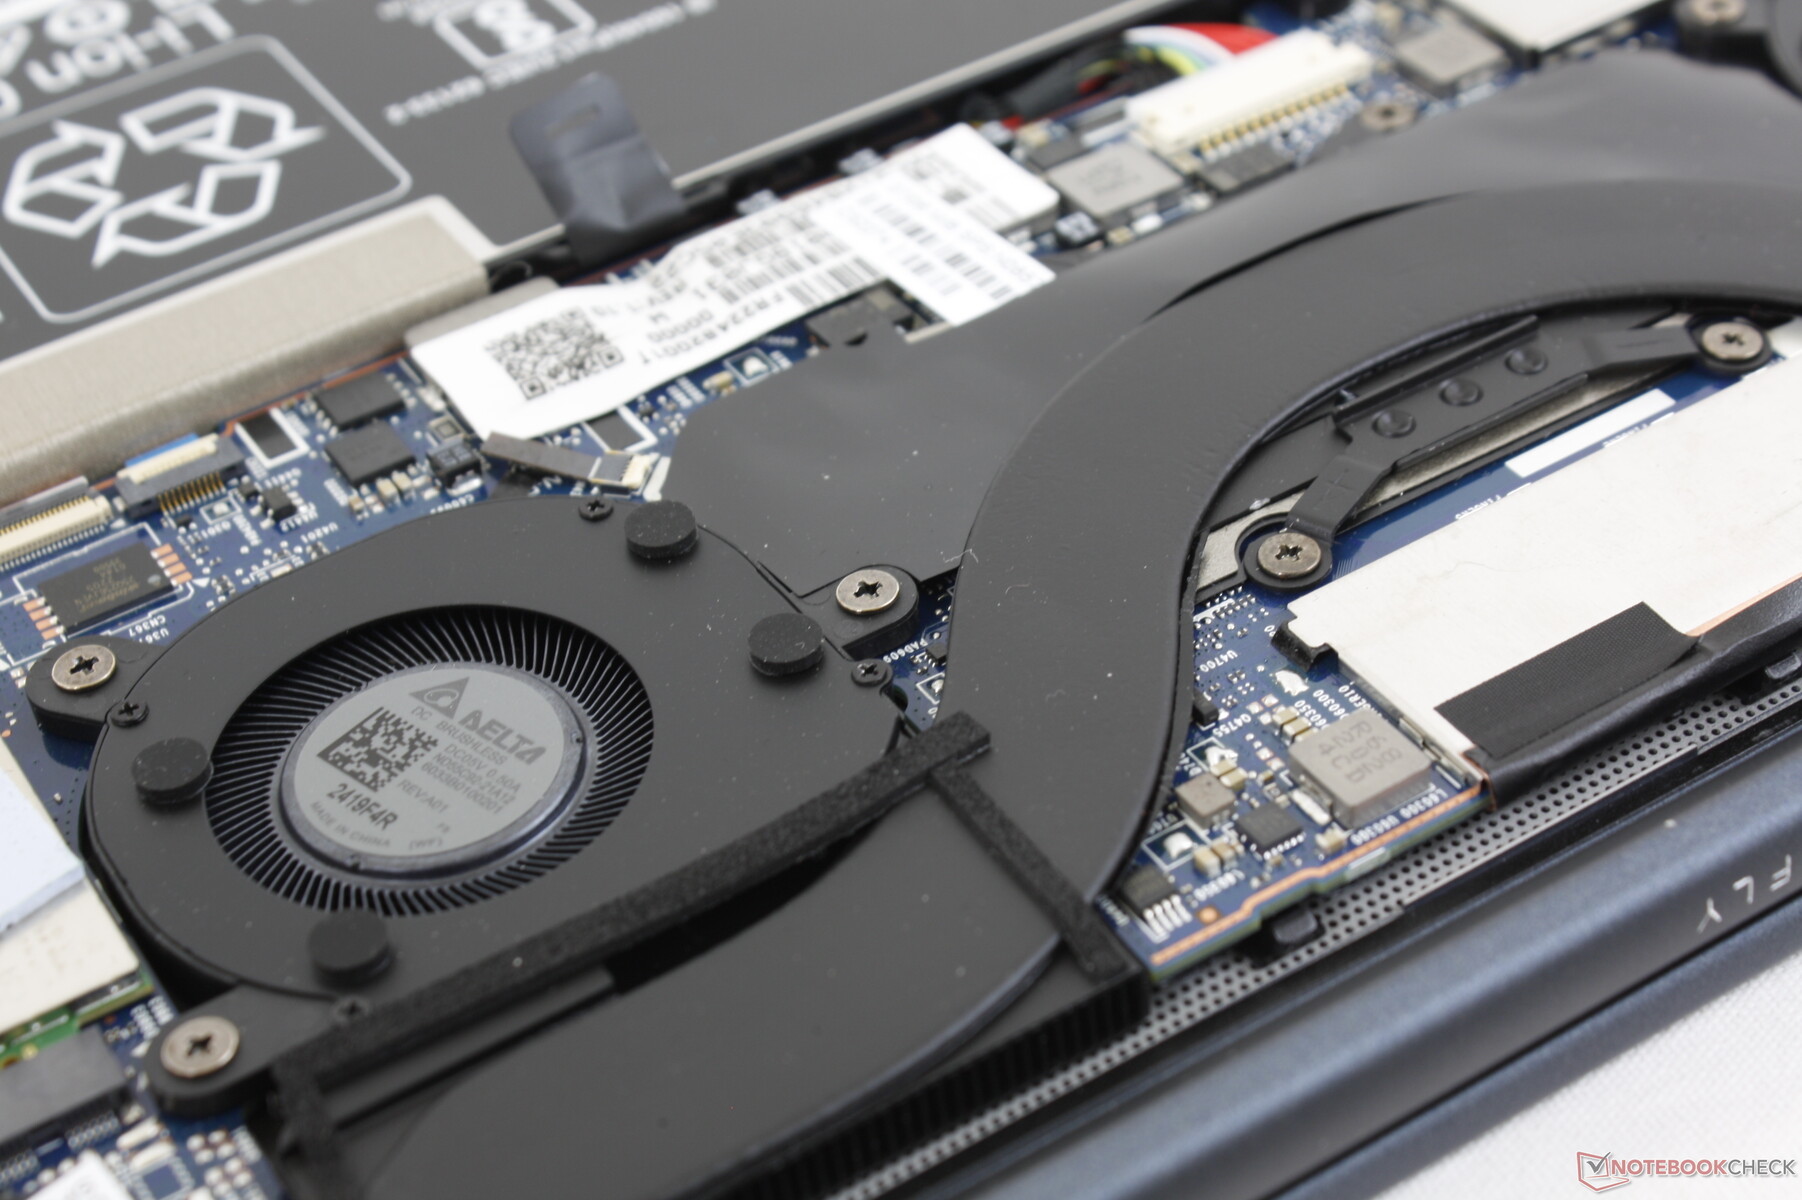
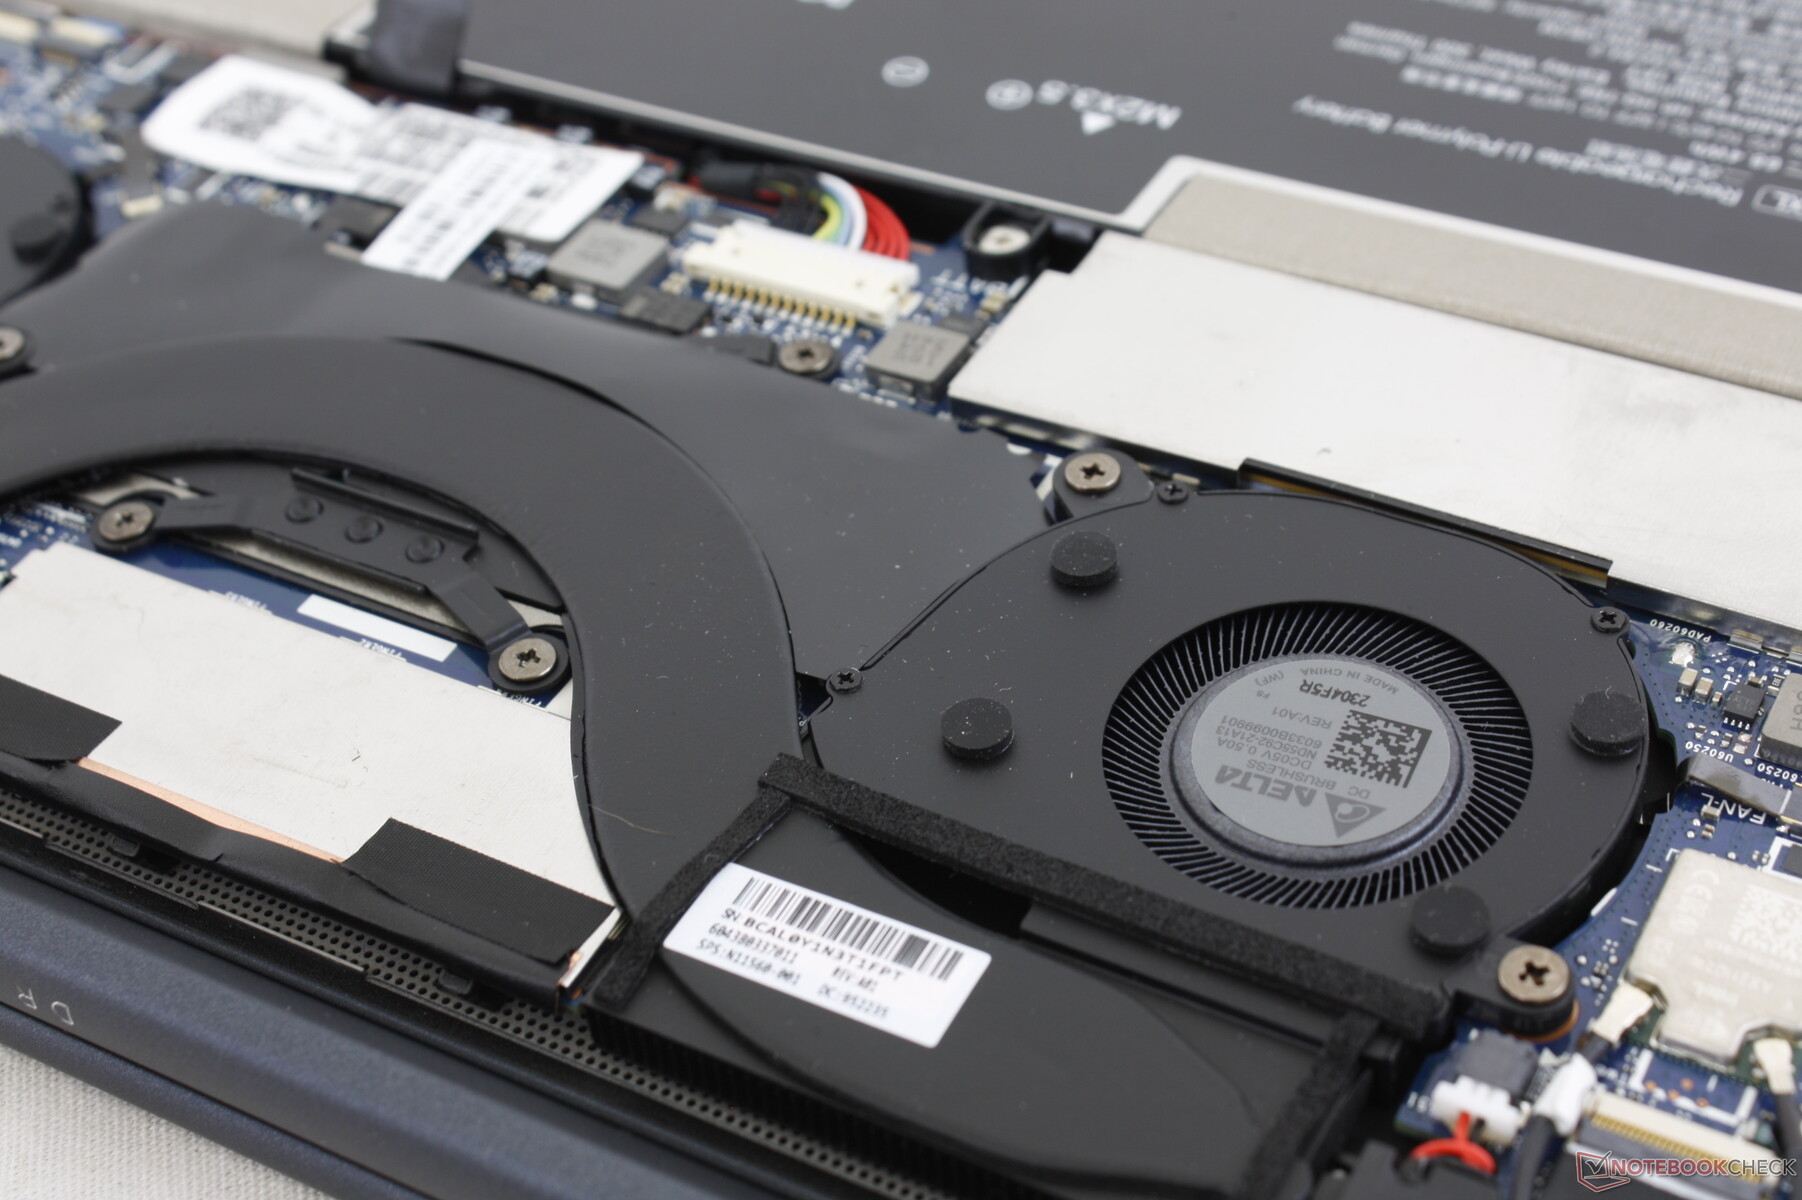
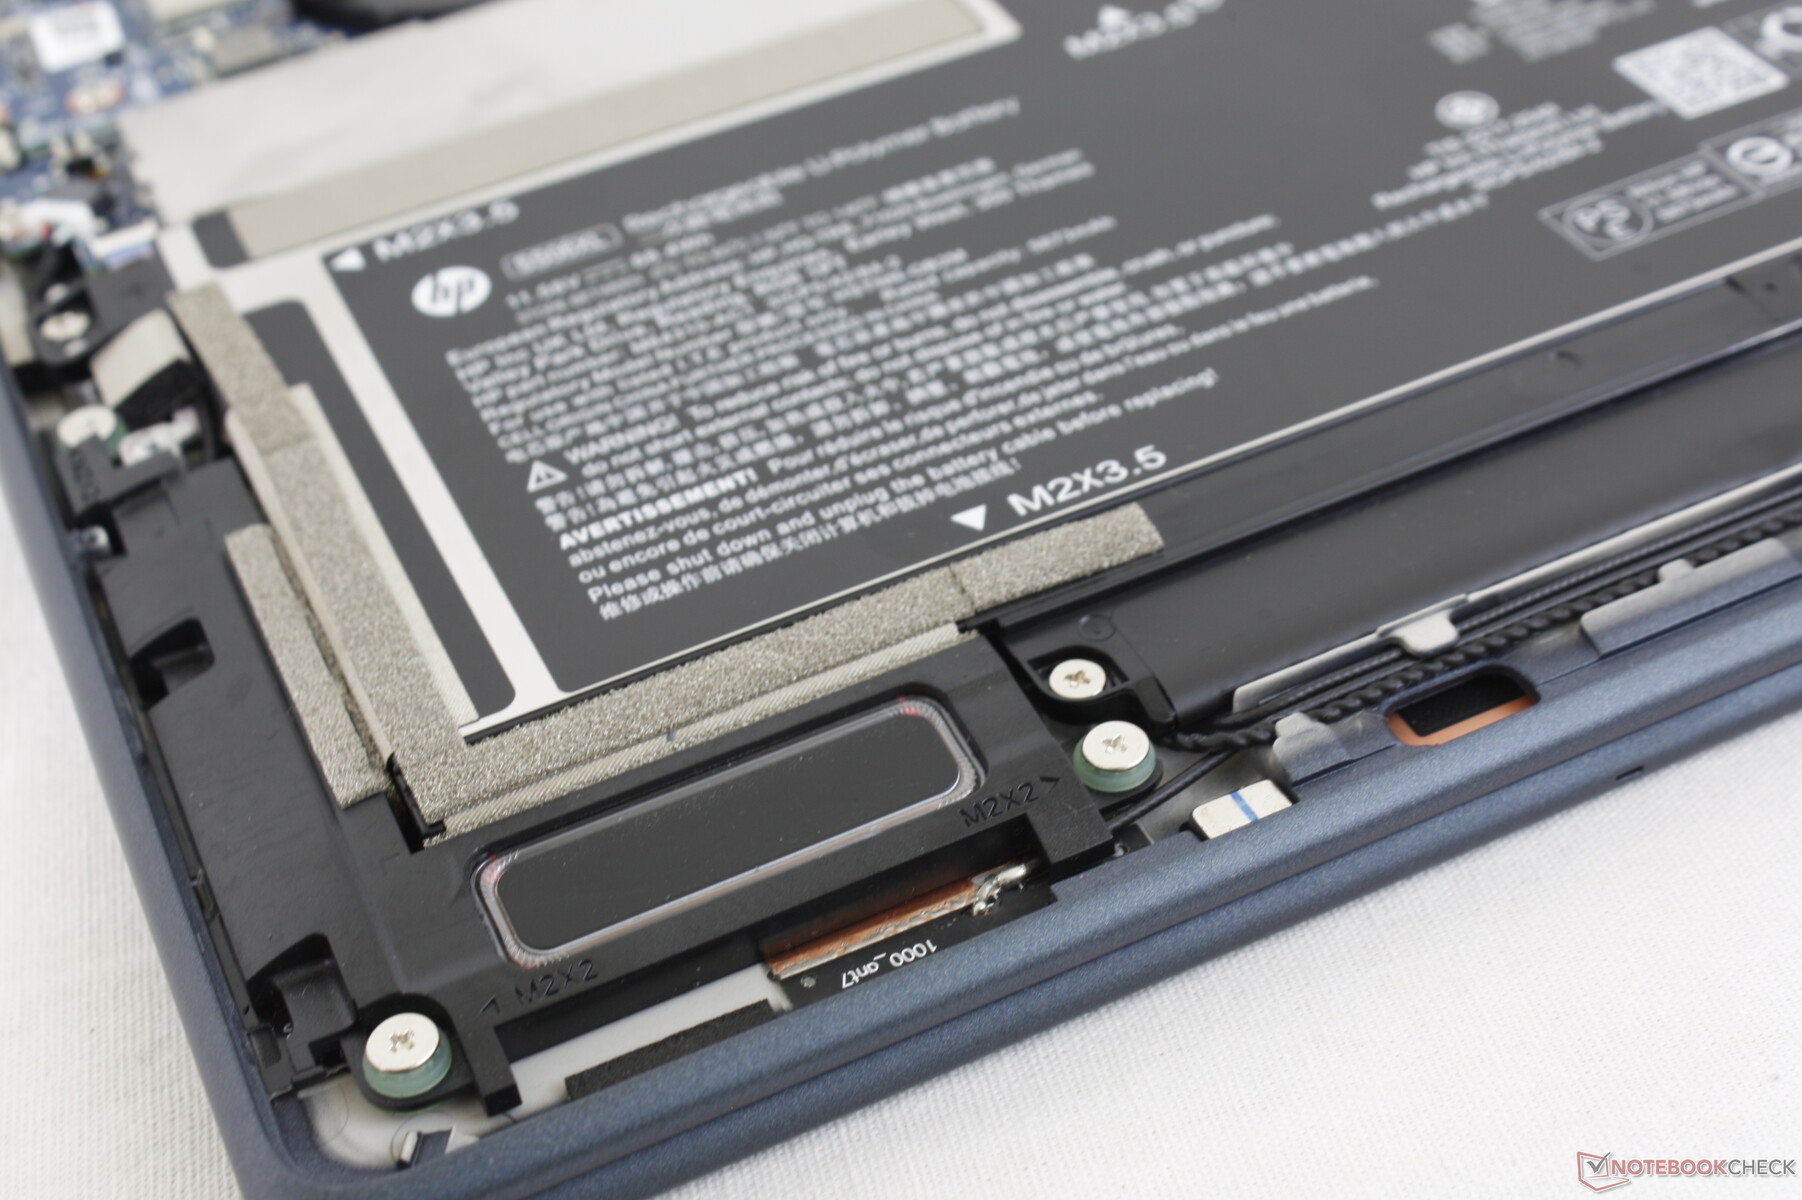
Un módulo Intel XMM 7560 R+ o 5G 5000 WWAN son opcionales. El módulo WWAN es extraíble, mientras que el módulo WLAN no lo es, como muestran las imágenes siguientes.
| Networking | |
| iperf3 transmit AX12 | |
| Lenovo ThinkPad X1 Titanium Yoga G1 20QA001RGE | |
| HP Spectre x360 14t-ea000 | |
| HP EliteBook Folio 13.5-3G2L2EA | |
| iperf3 receive AX12 | |
| Lenovo ThinkPad X1 Titanium Yoga G1 20QA001RGE | |
| HP Spectre x360 14t-ea000 | |
| HP EliteBook Folio 13.5-3G2L2EA | |
| iperf3 receive AXE11000 6GHz | |
| Dell XPS 13 Plus 9320 i5-1240p | |
| Framework Laptop 13.5 12th Gen Intel | |
| HP Elite Dragonfly G3 | |
| iperf3 transmit AXE11000 6GHz | |
| Framework Laptop 13.5 12th Gen Intel | |
| HP Elite Dragonfly G3 | |
| Dell XPS 13 Plus 9320 i5-1240p | |
Cámara web - 5 MP estándar
Aunque el Dragonfly Max del año pasado también venía con una webcam de 5 MP, la del Dragonfly G3 es notablemente más nítida y brillante en general para ser una de las mejores webcams integradas que hemos visto en cualquier portátil independientemente del tamaño de la pantalla. El obturador y los infrarrojos están presentes para la privacidad y el soporte de Hello, respectivamente.


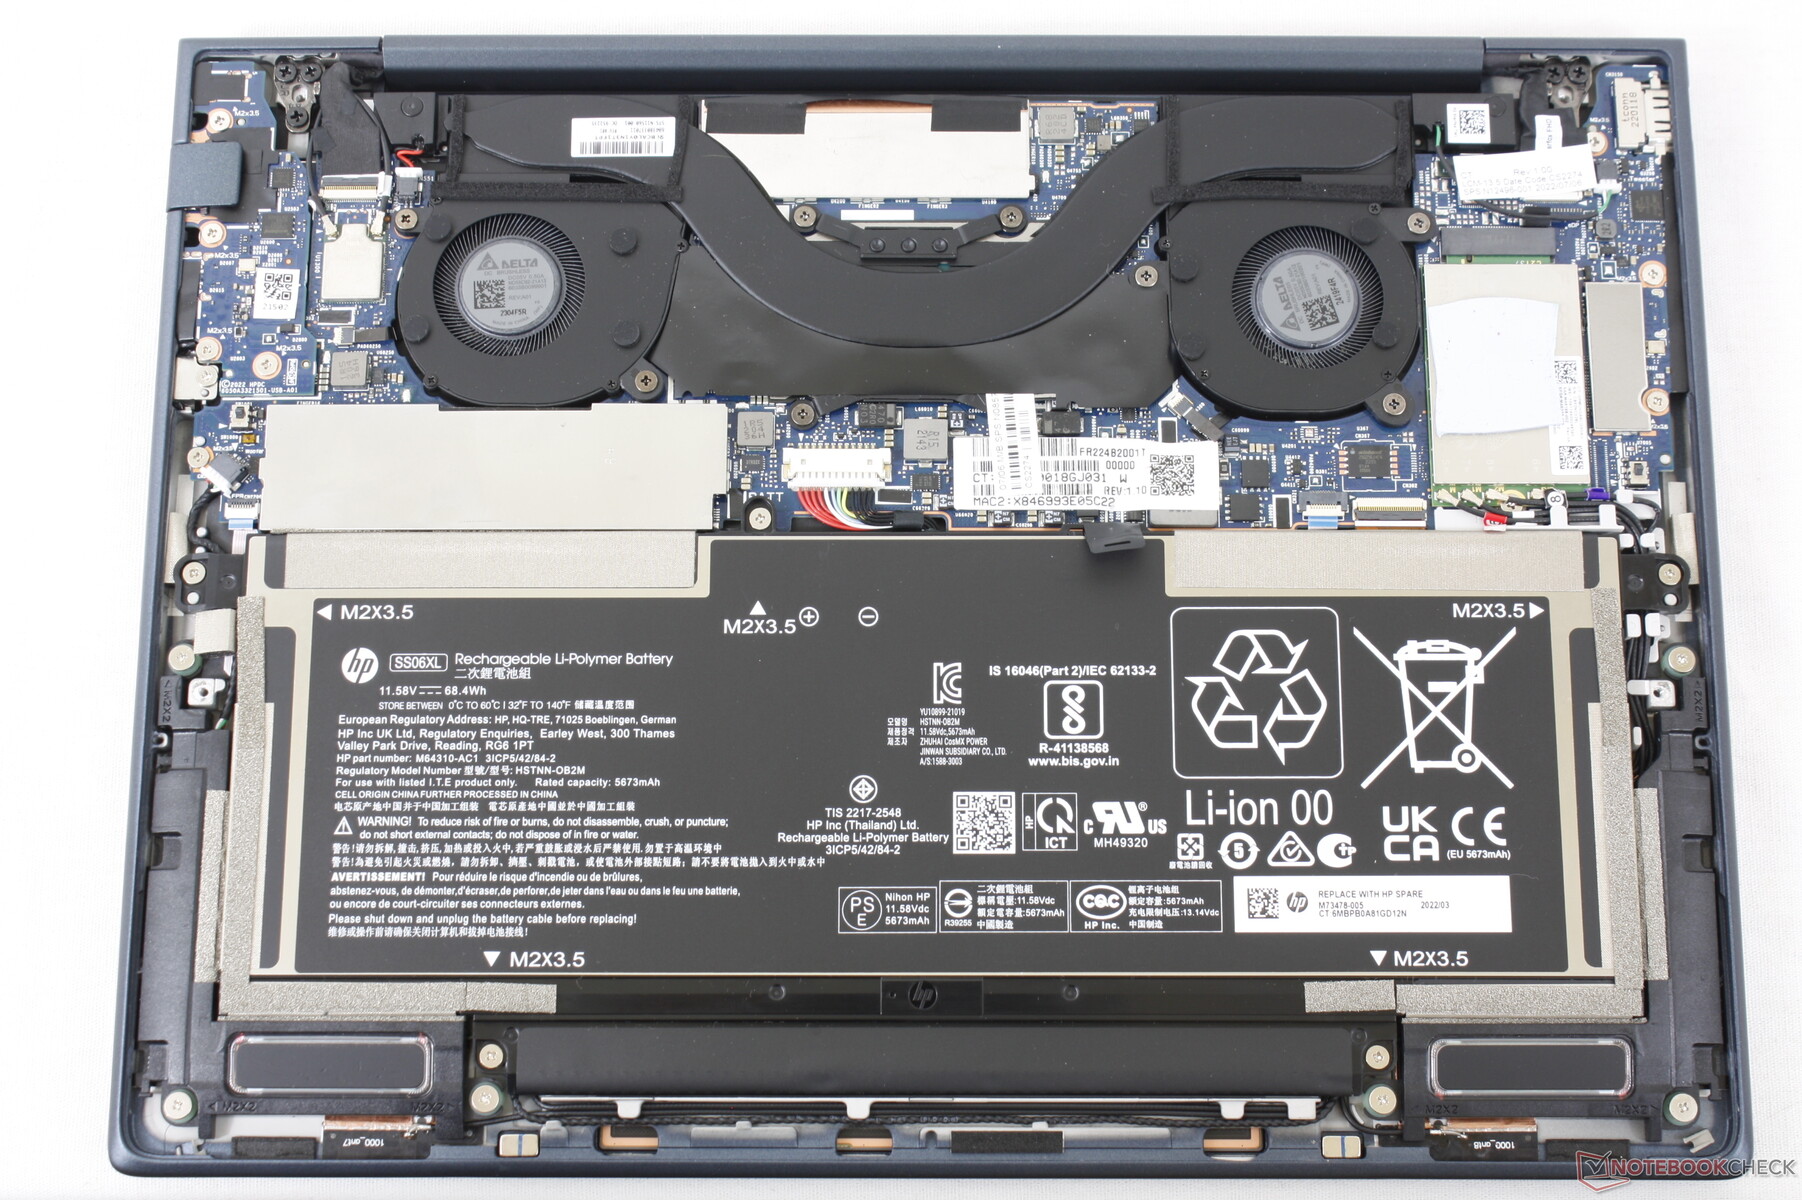
Mantenimiento
El panel inferior está asegurado por sólo cuatro tornillos T5 Torx accesibles para facilitar el mantenimiento. Los usuarios pueden cambiar la batería, la WWAN M.2 o el SSD M.2 según sea necesario mientras los módulos de RAM están fijos.
Accesorios y garantía
No hay más extras en la caja que el adaptador de CA y la documentación. Habría estado bien ver una funda de transporte similar a la que se incluye con ciertos modelos de Spectre.
La garantía básica de un año limitada por el fabricante viene de serie si se compra en EEUU. Nos parece decepcionante, ya que el Dragonfly es uno de los portátiles empresariales estrella de HP, del que se espera una garantía básica de 3 años. El Dell Latitude 7330, por ejemplo, viene con una garantía de 3 años sin coste adicional.
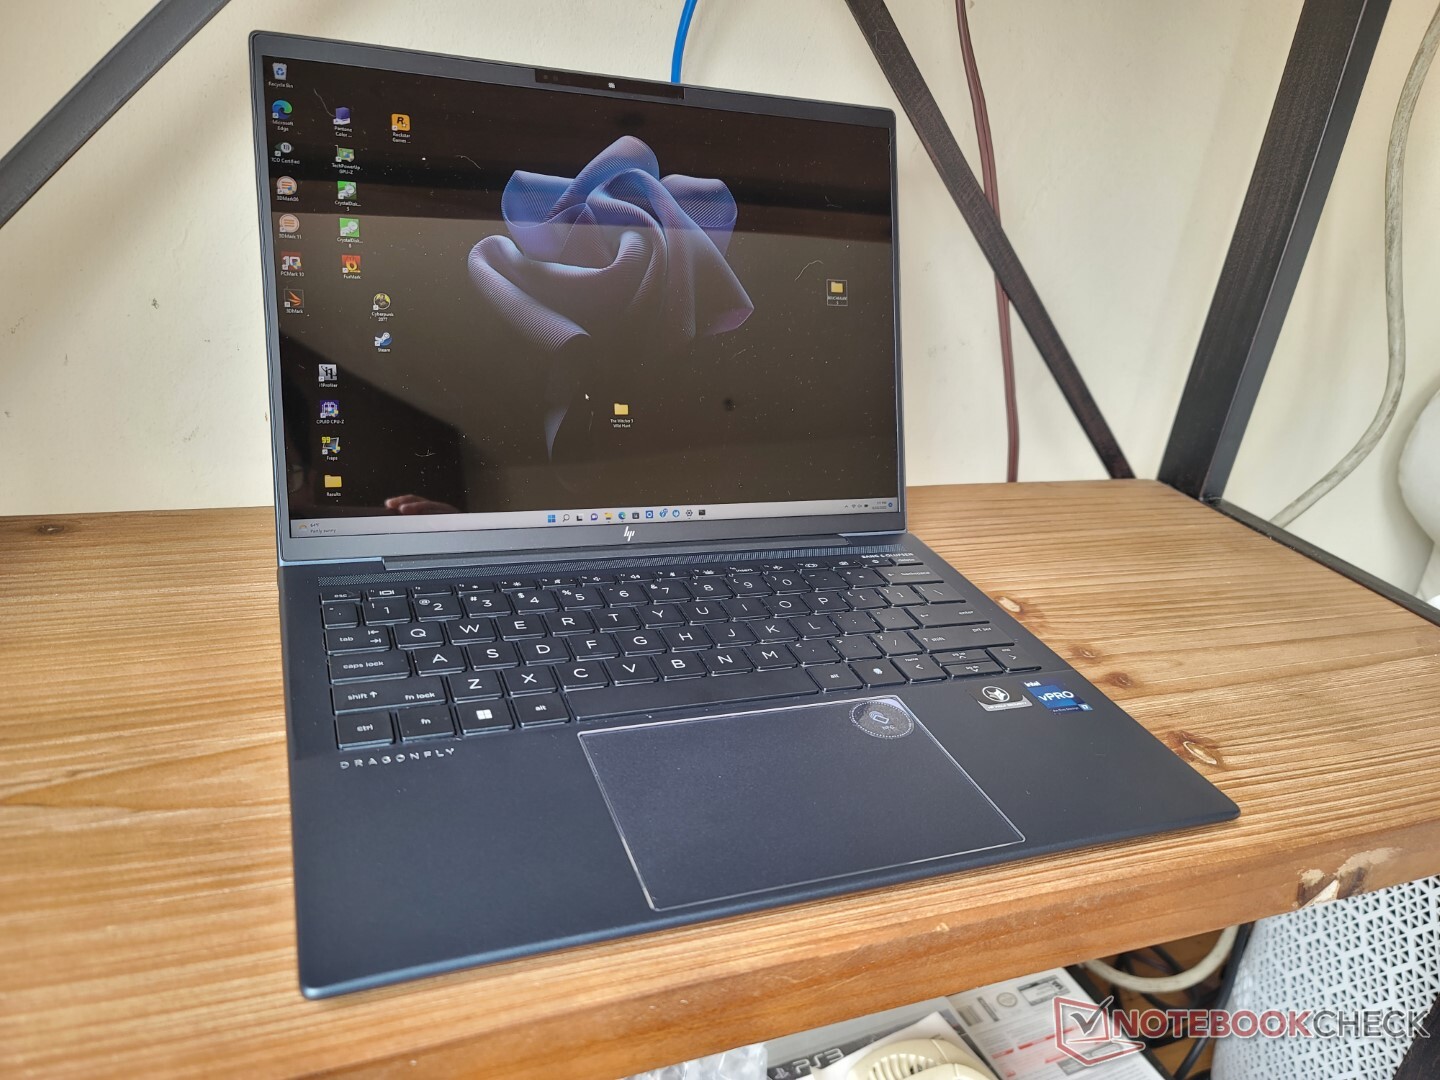
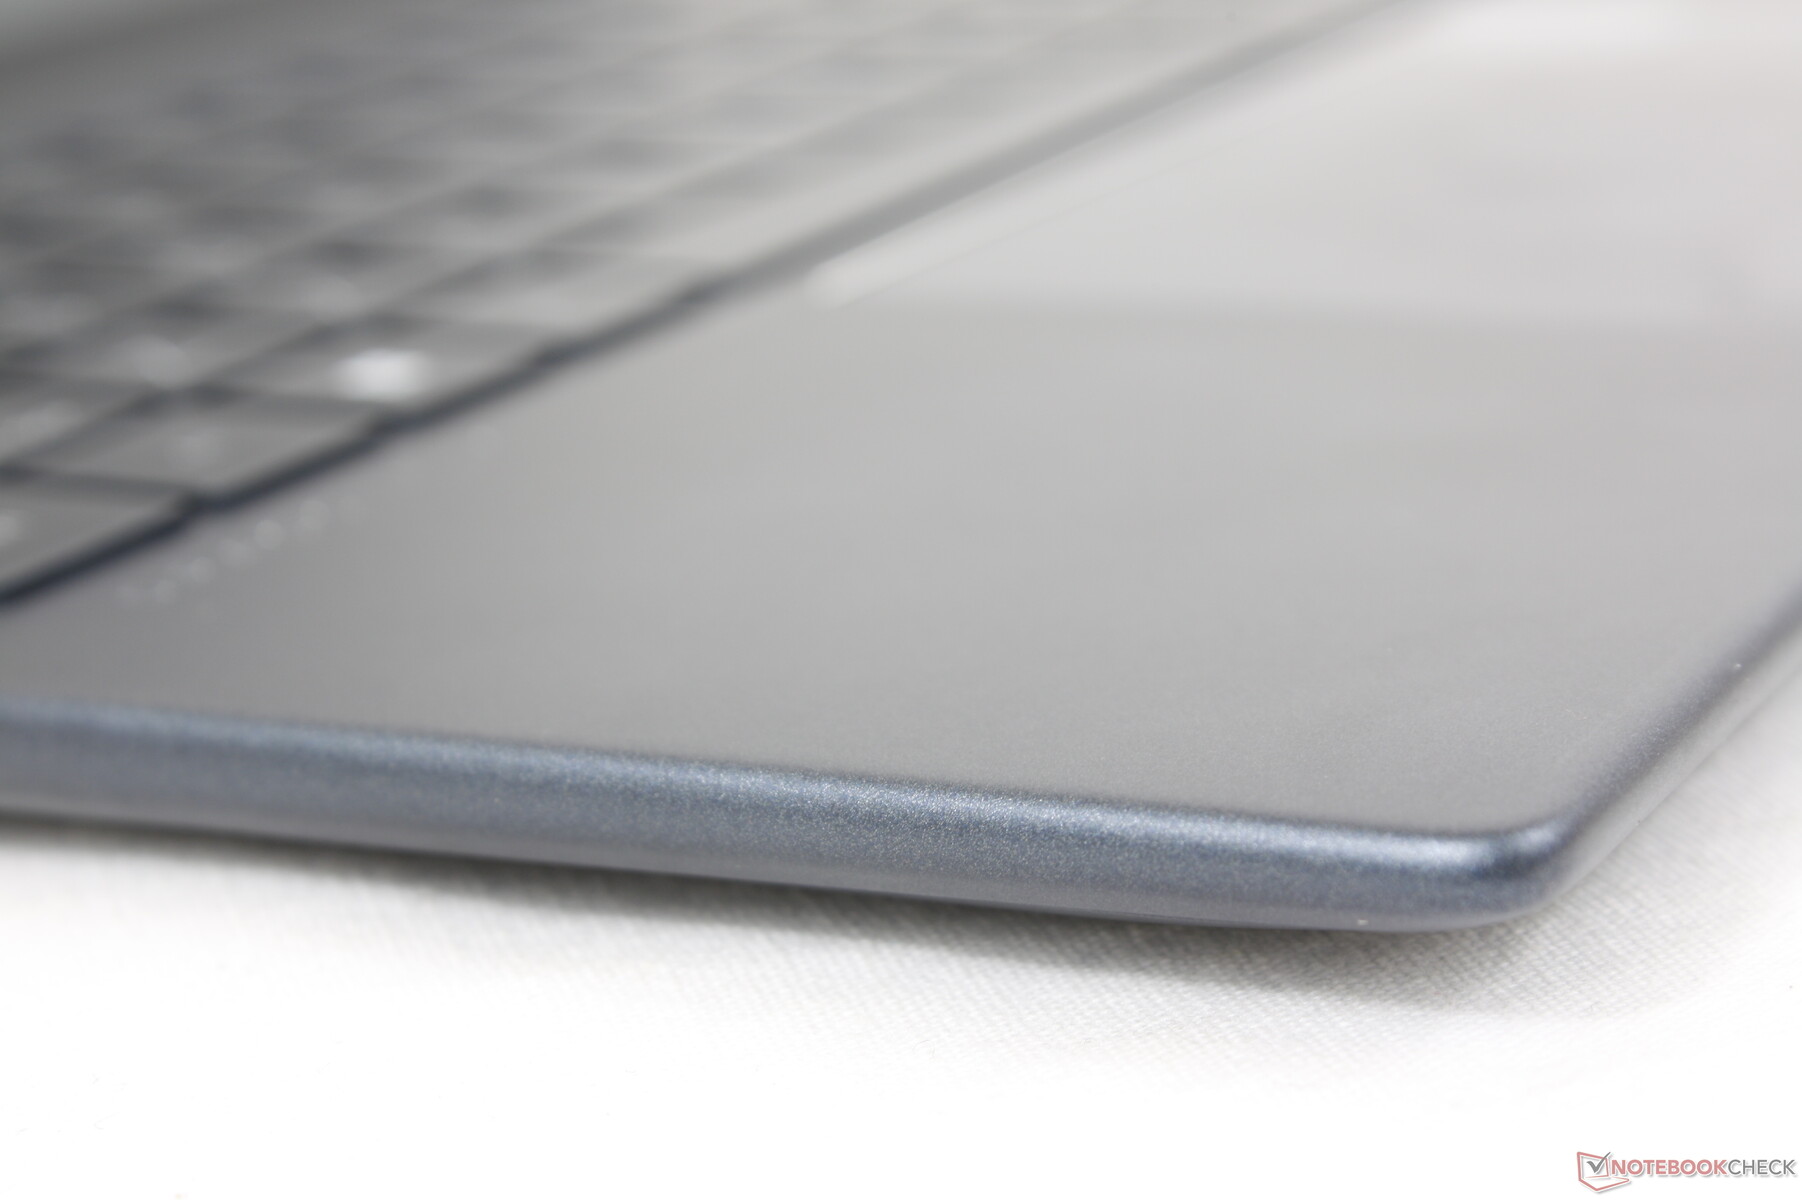
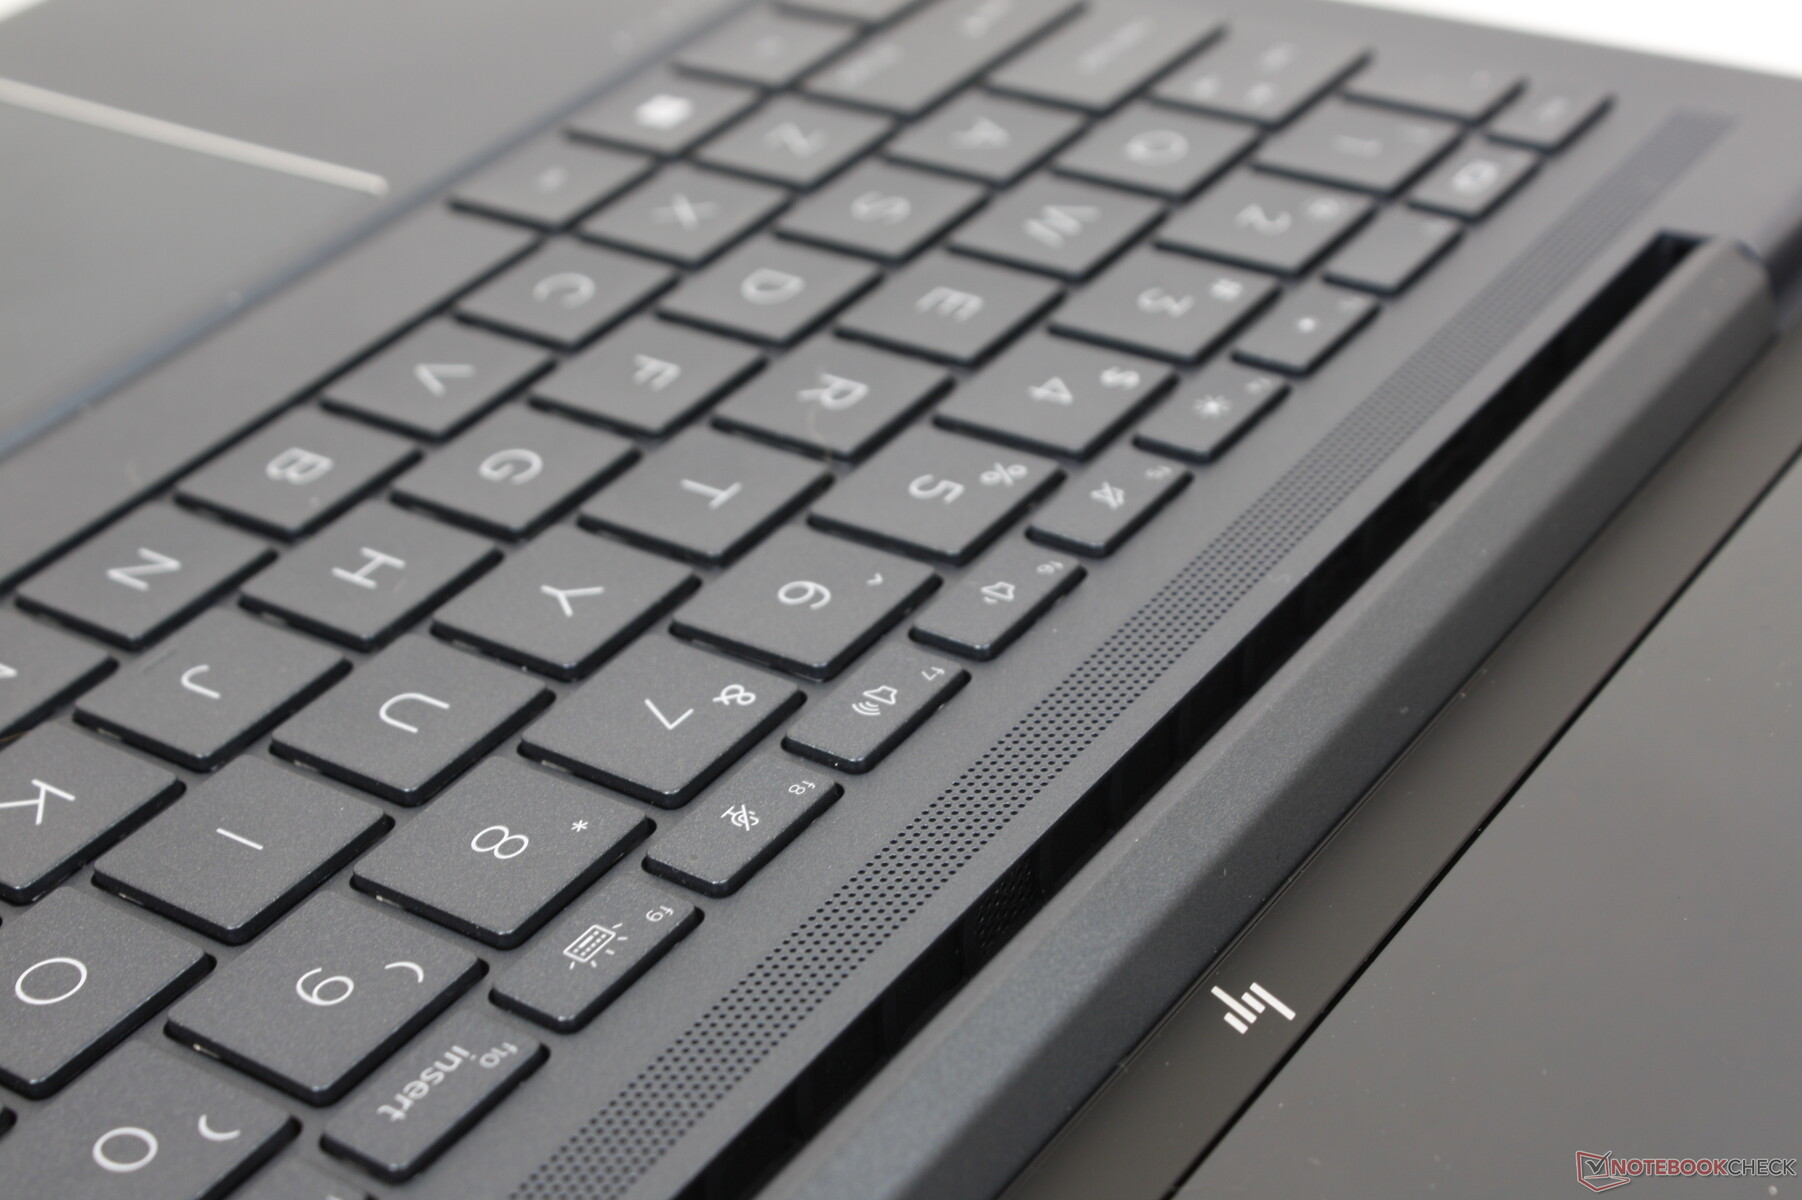
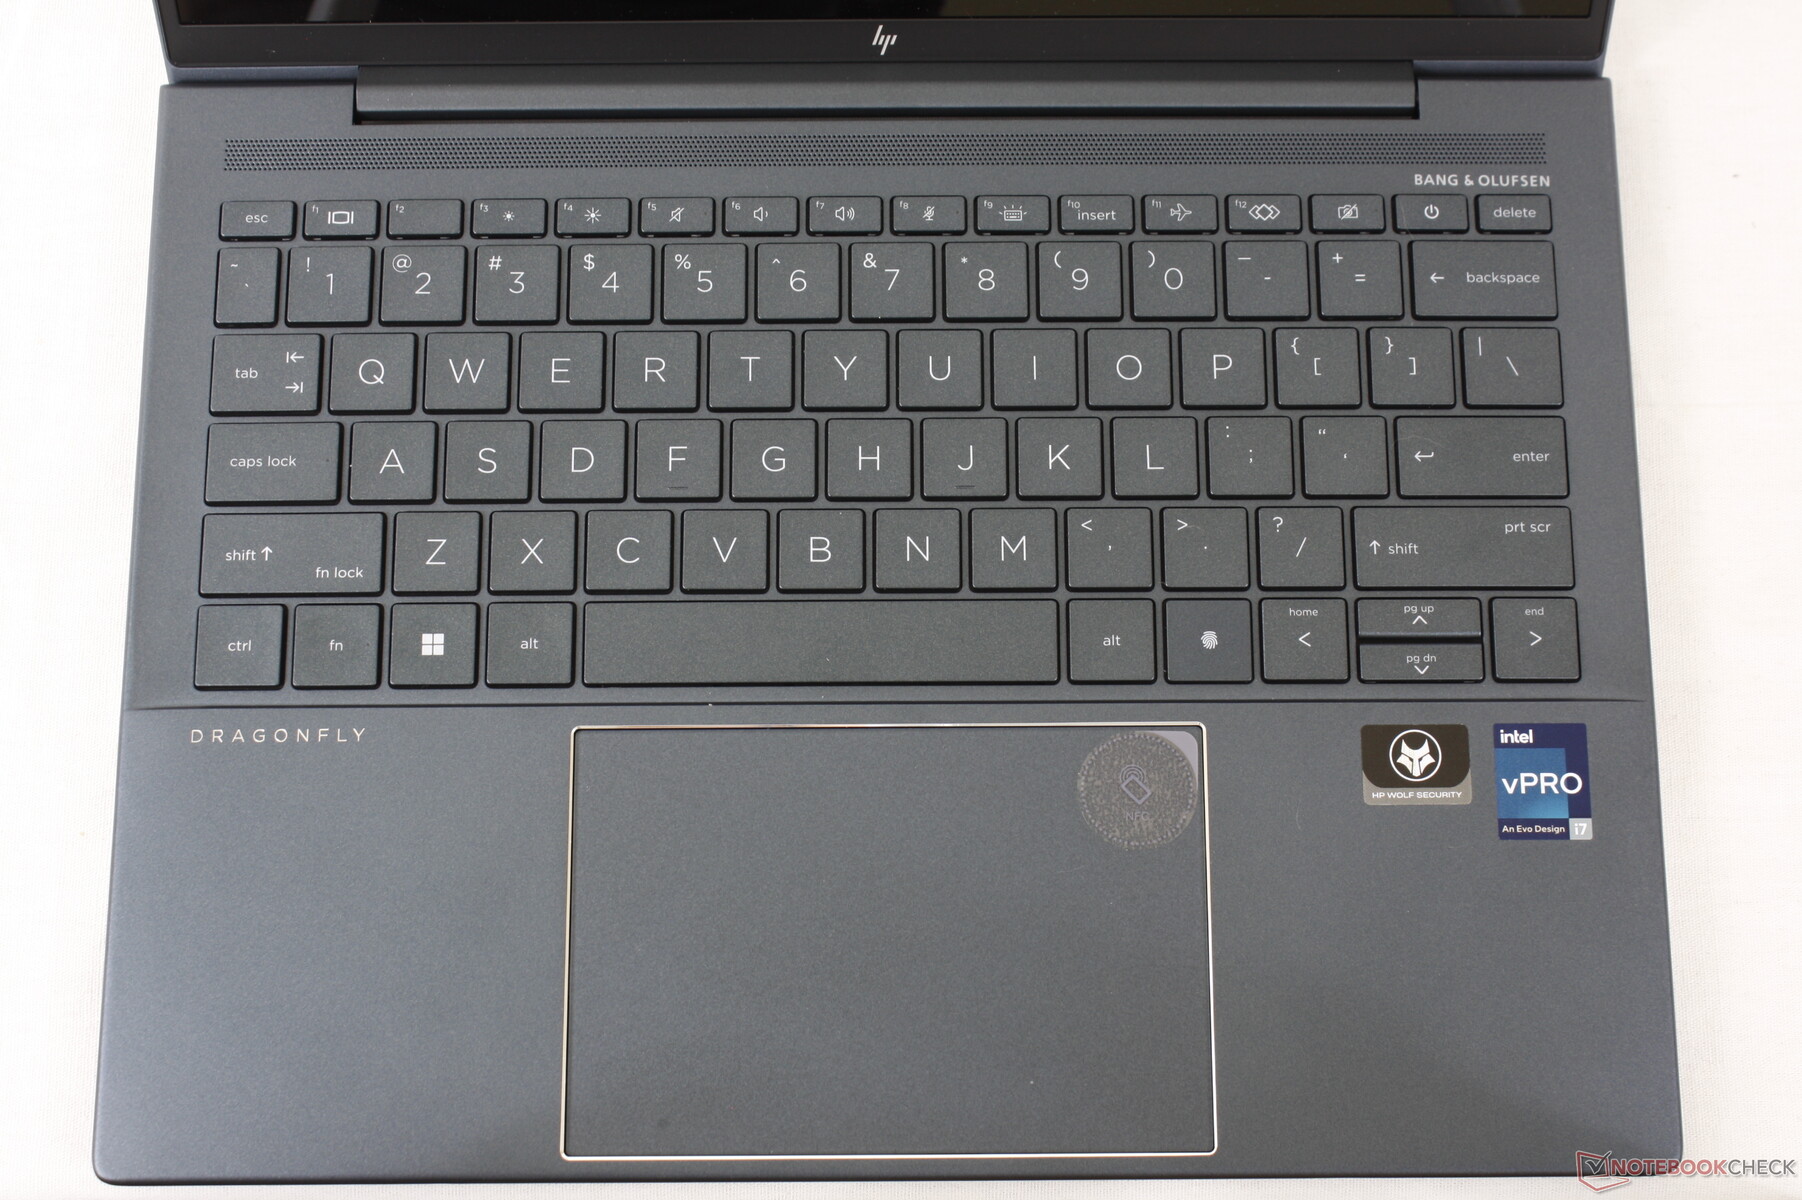
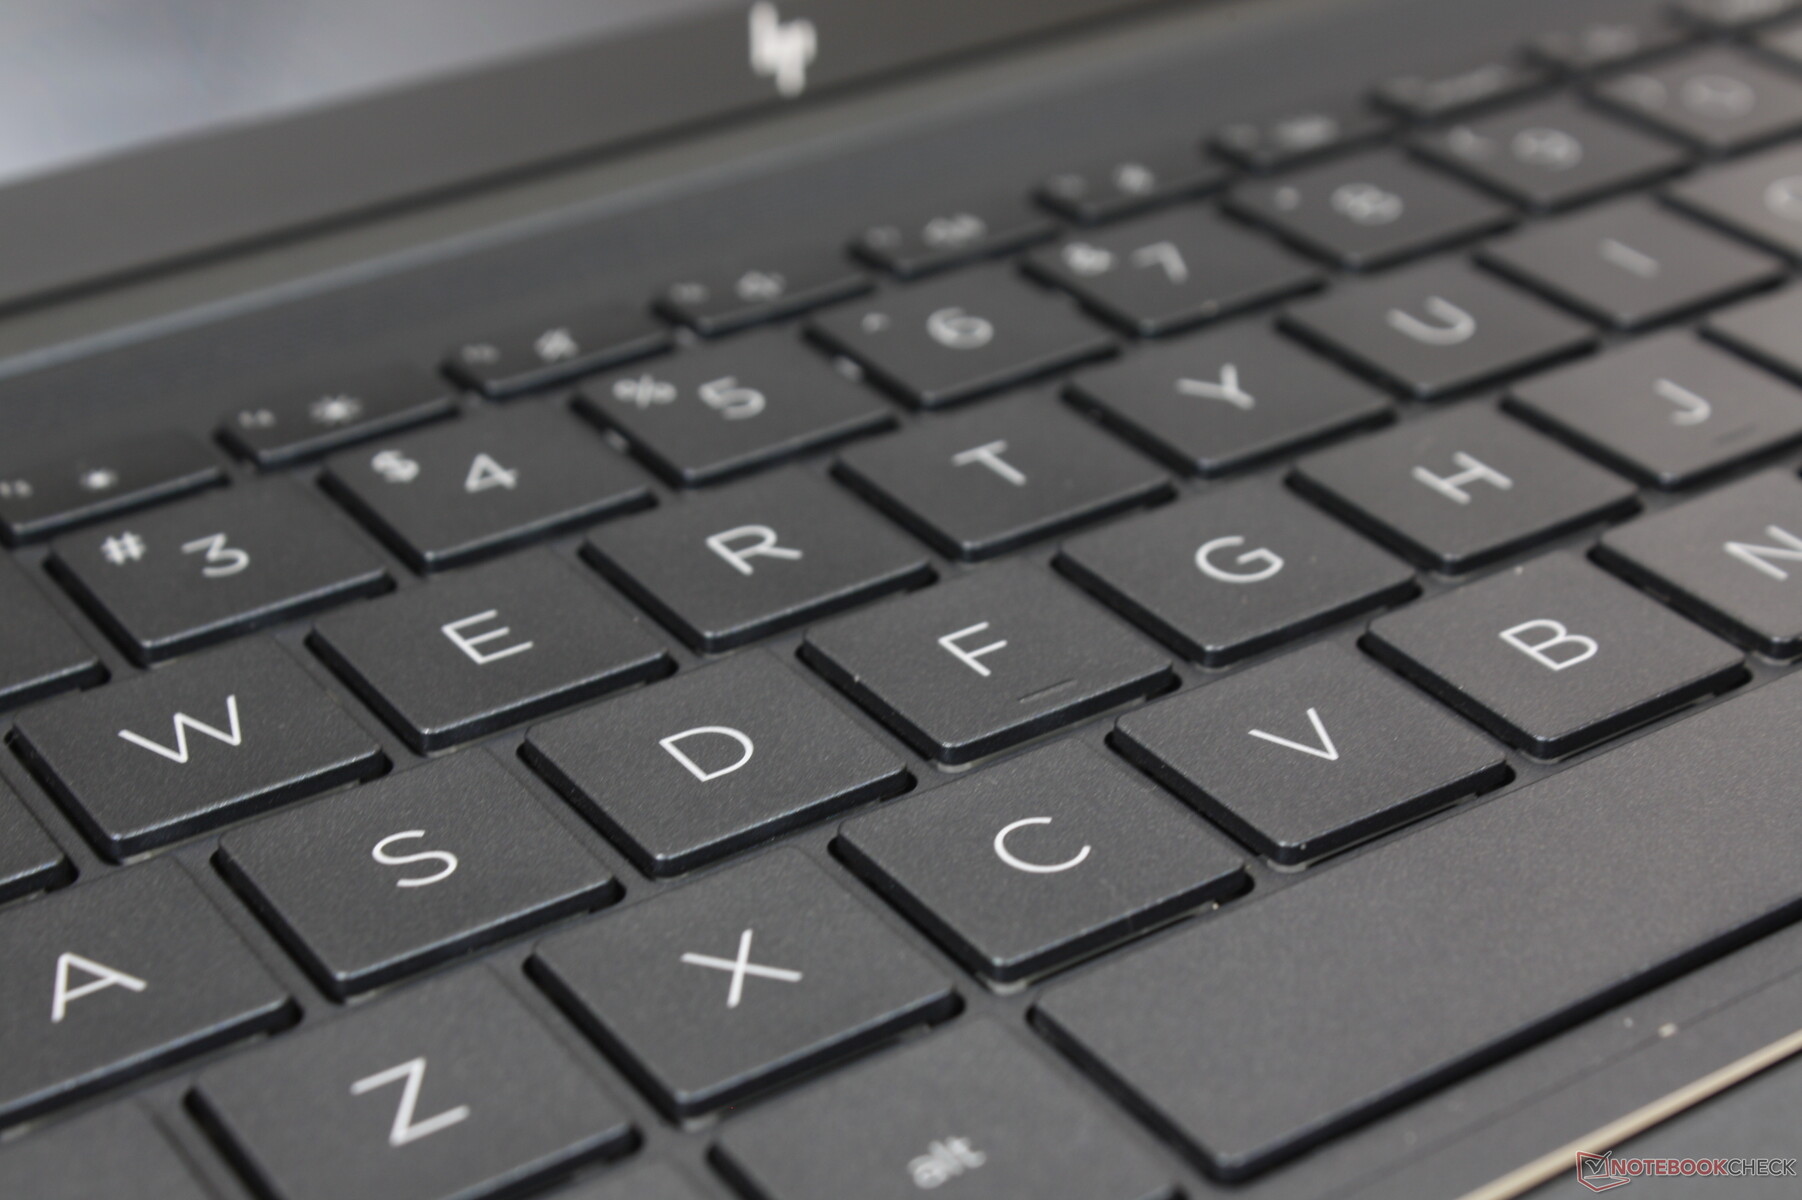
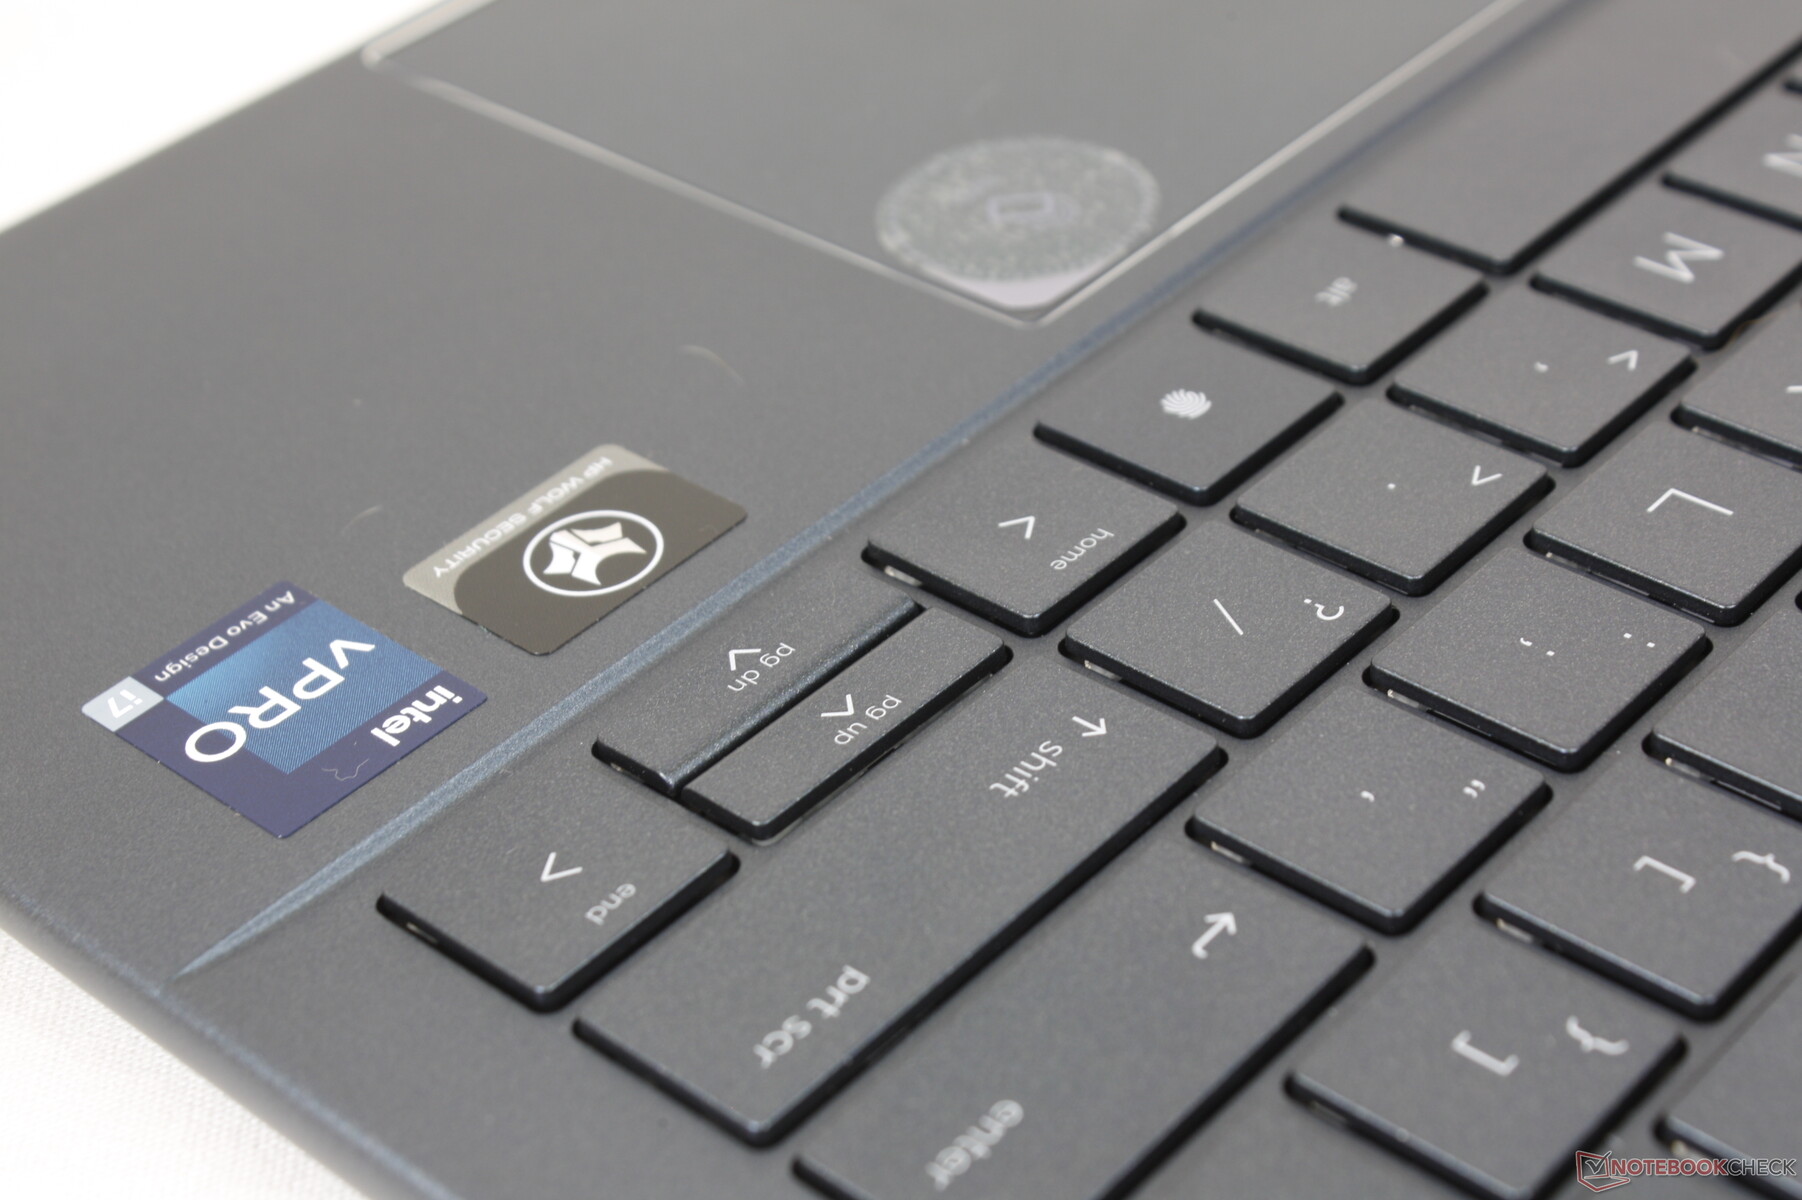
Dispositivos de entrada - Letras más grandes, clickpad más grande
Teclado
La experiencia de tecleo entre los modelos Spectre y EliteBook/Dragonfly es casi idéntica. Si ya has tecleado en un portátil Spectre, sabrás qué esperar del Dragonfly G3. La respuesta es nítida y con un recorrido aparentemente más profundo que en el ThinkPad X1 Nano Gen 2. Las apretadas teclas Arriba y Abajo son quizá la peor parte del teclado.
Si se configura con Sure View, la tecla F2 tendrá una opción de cambio de pantalla. De lo contrario, la tecla no tendrá ninguna función secundaria como se muestra en nuestra imagen de abajo.
Teclado táctil
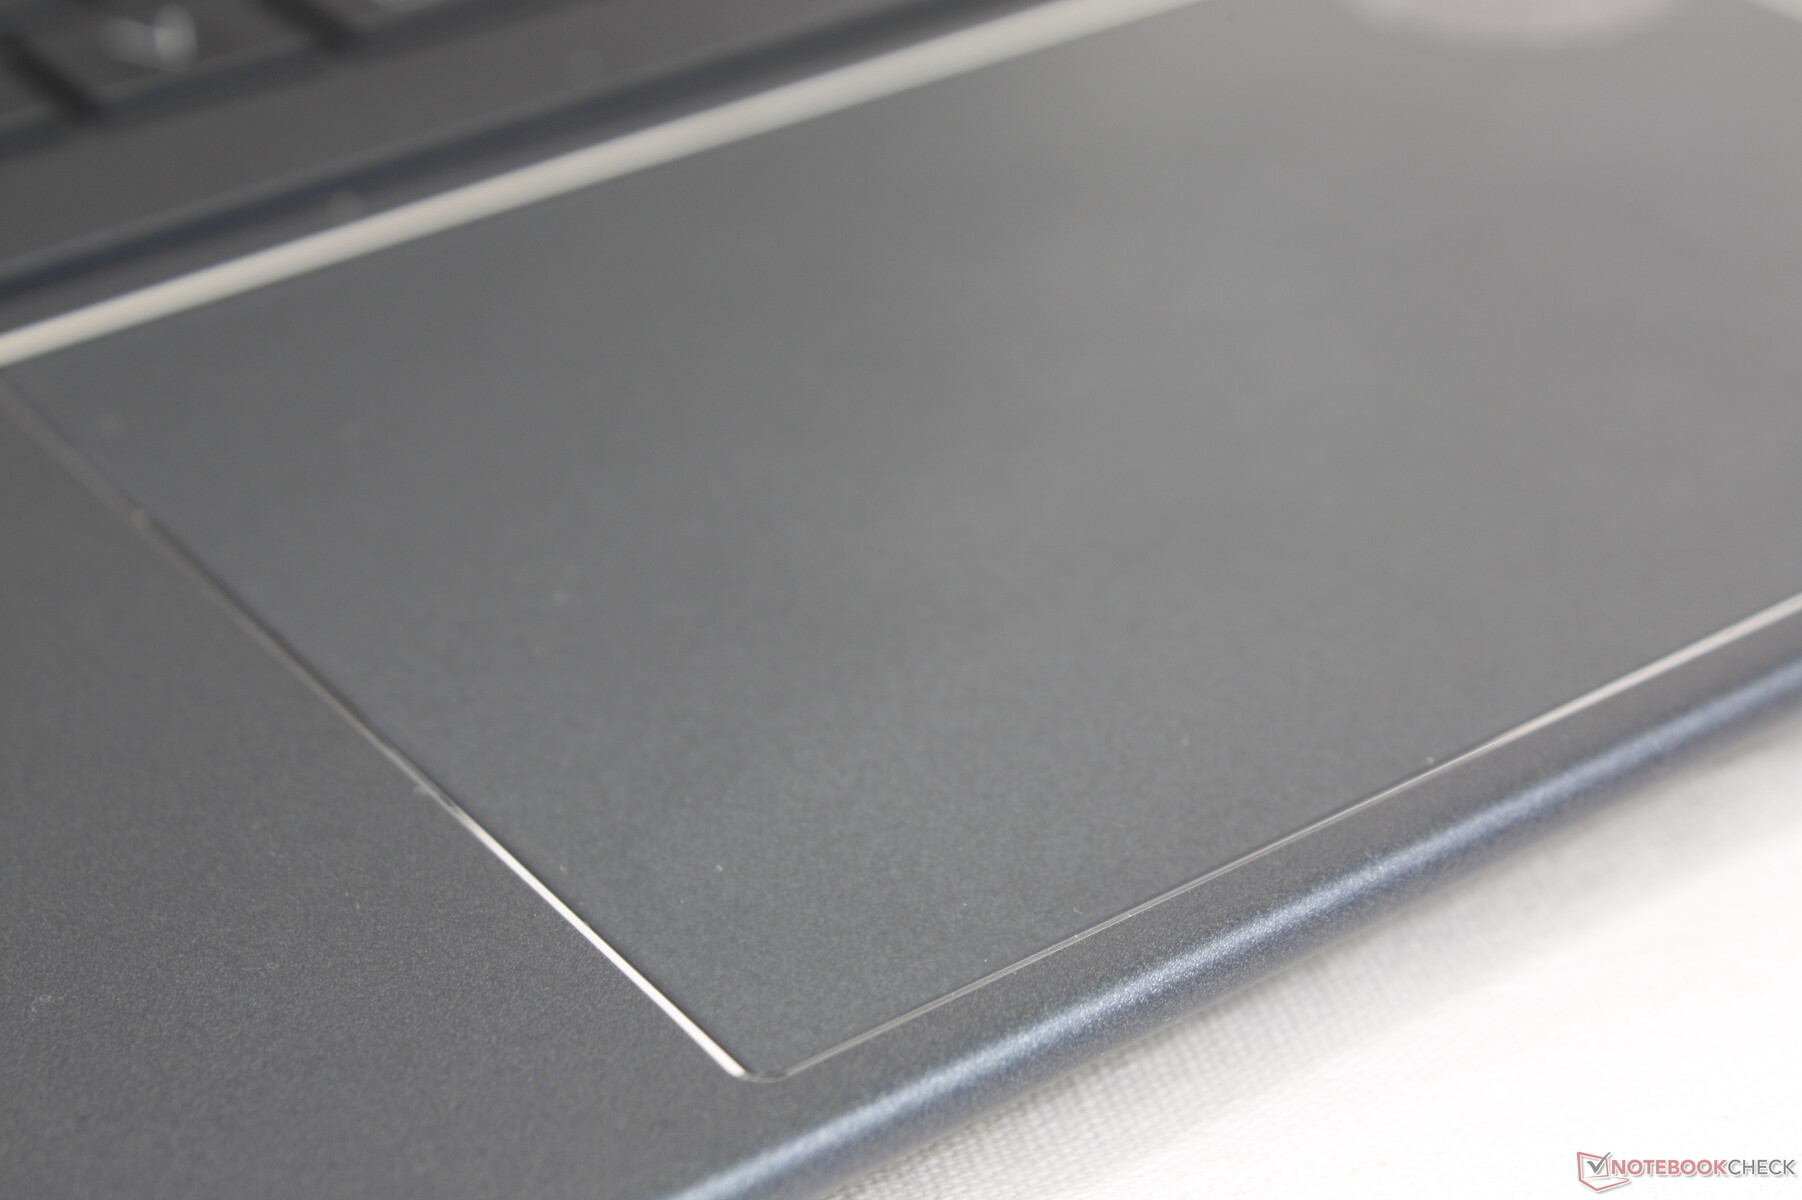
El clickpad es más grande que el del Dragonfly Max para facilitar el control del cursor (12 x 8 cm frente a 11 x 6,5 cm). La respuesta al pulsar el clickpad es poco profunda pero satisfactoria a pesar de que el traqueteo es más silencioso de lo esperado.
Pantalla - Muchas opciones
Hay un total de seis opciones de pantalla de 13,5 pulgadas disponibles:
- 1920 x 1280, 400 nits, brillante, no táctil, IPS
- 1920 x 1280, 400 nits, brillante, táctil, IPS
- 1920 x 1280, 400 nits, mate, táctil, IPS
- 1920 x 1280, 1000 nits, Sure View, mate, no táctil, IPS
- 1920 x 1280, 1000 nits, Sure View, mate, táctil, IPS
- 3000 x 2000, 400 nits, brillante, táctil, OLED
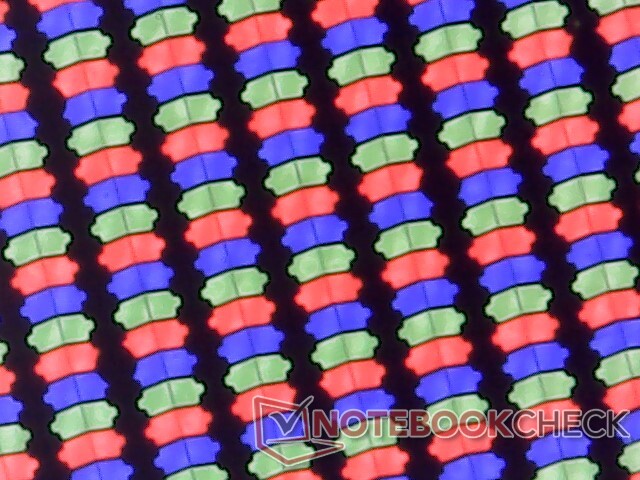
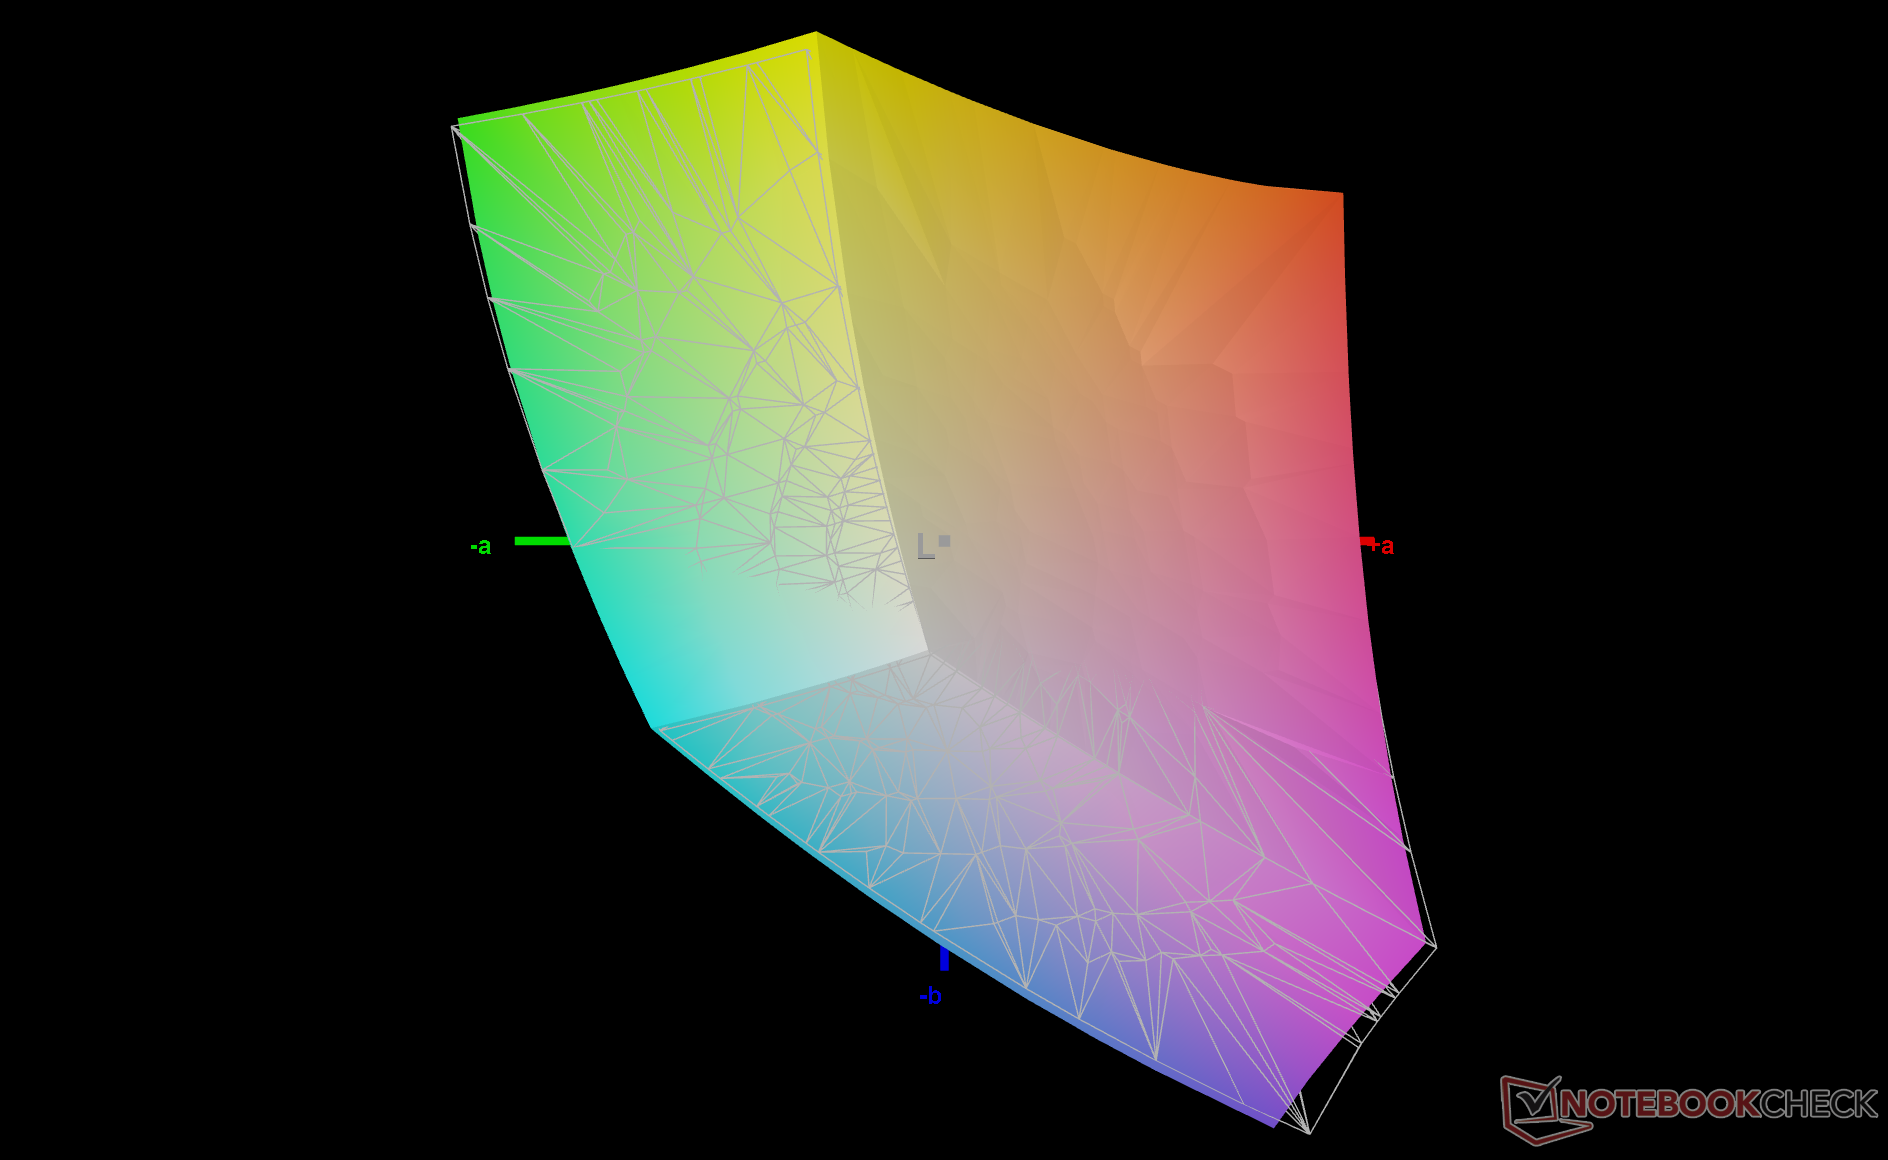
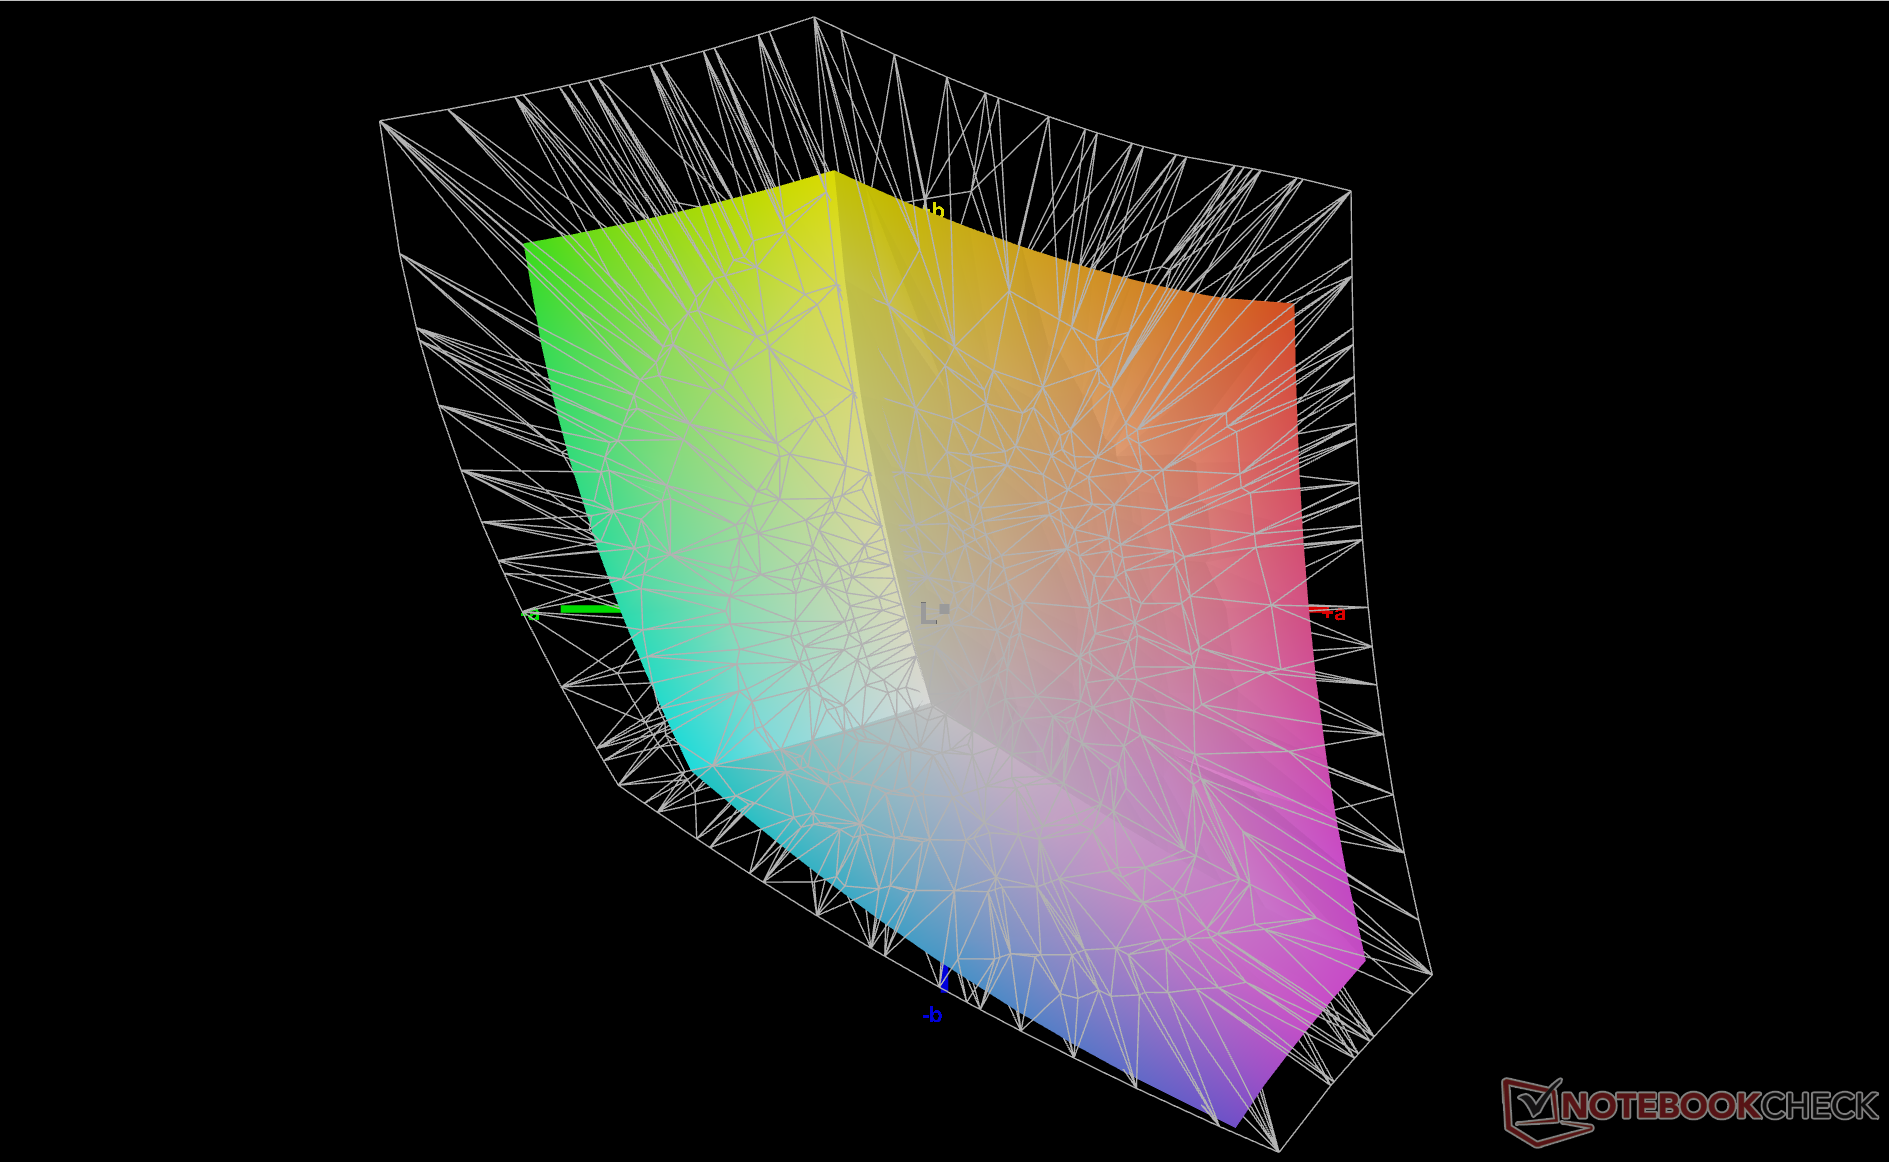
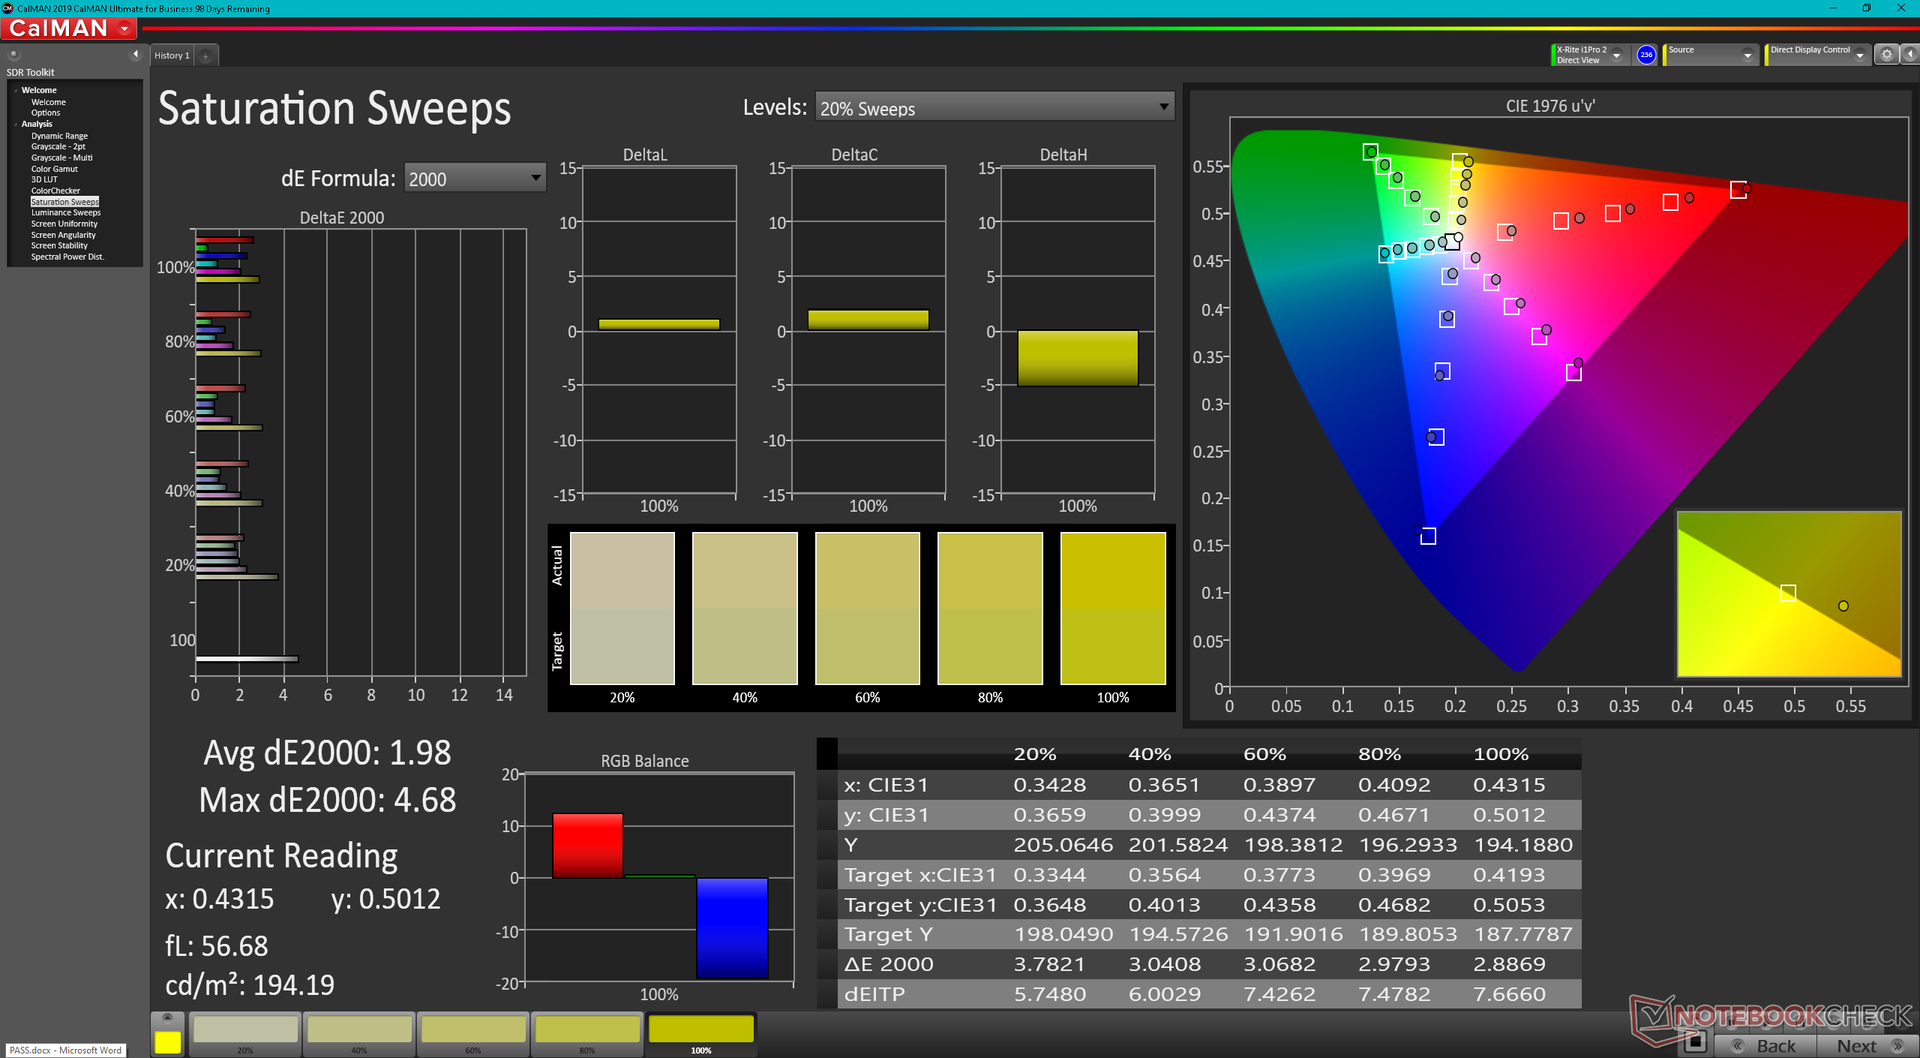
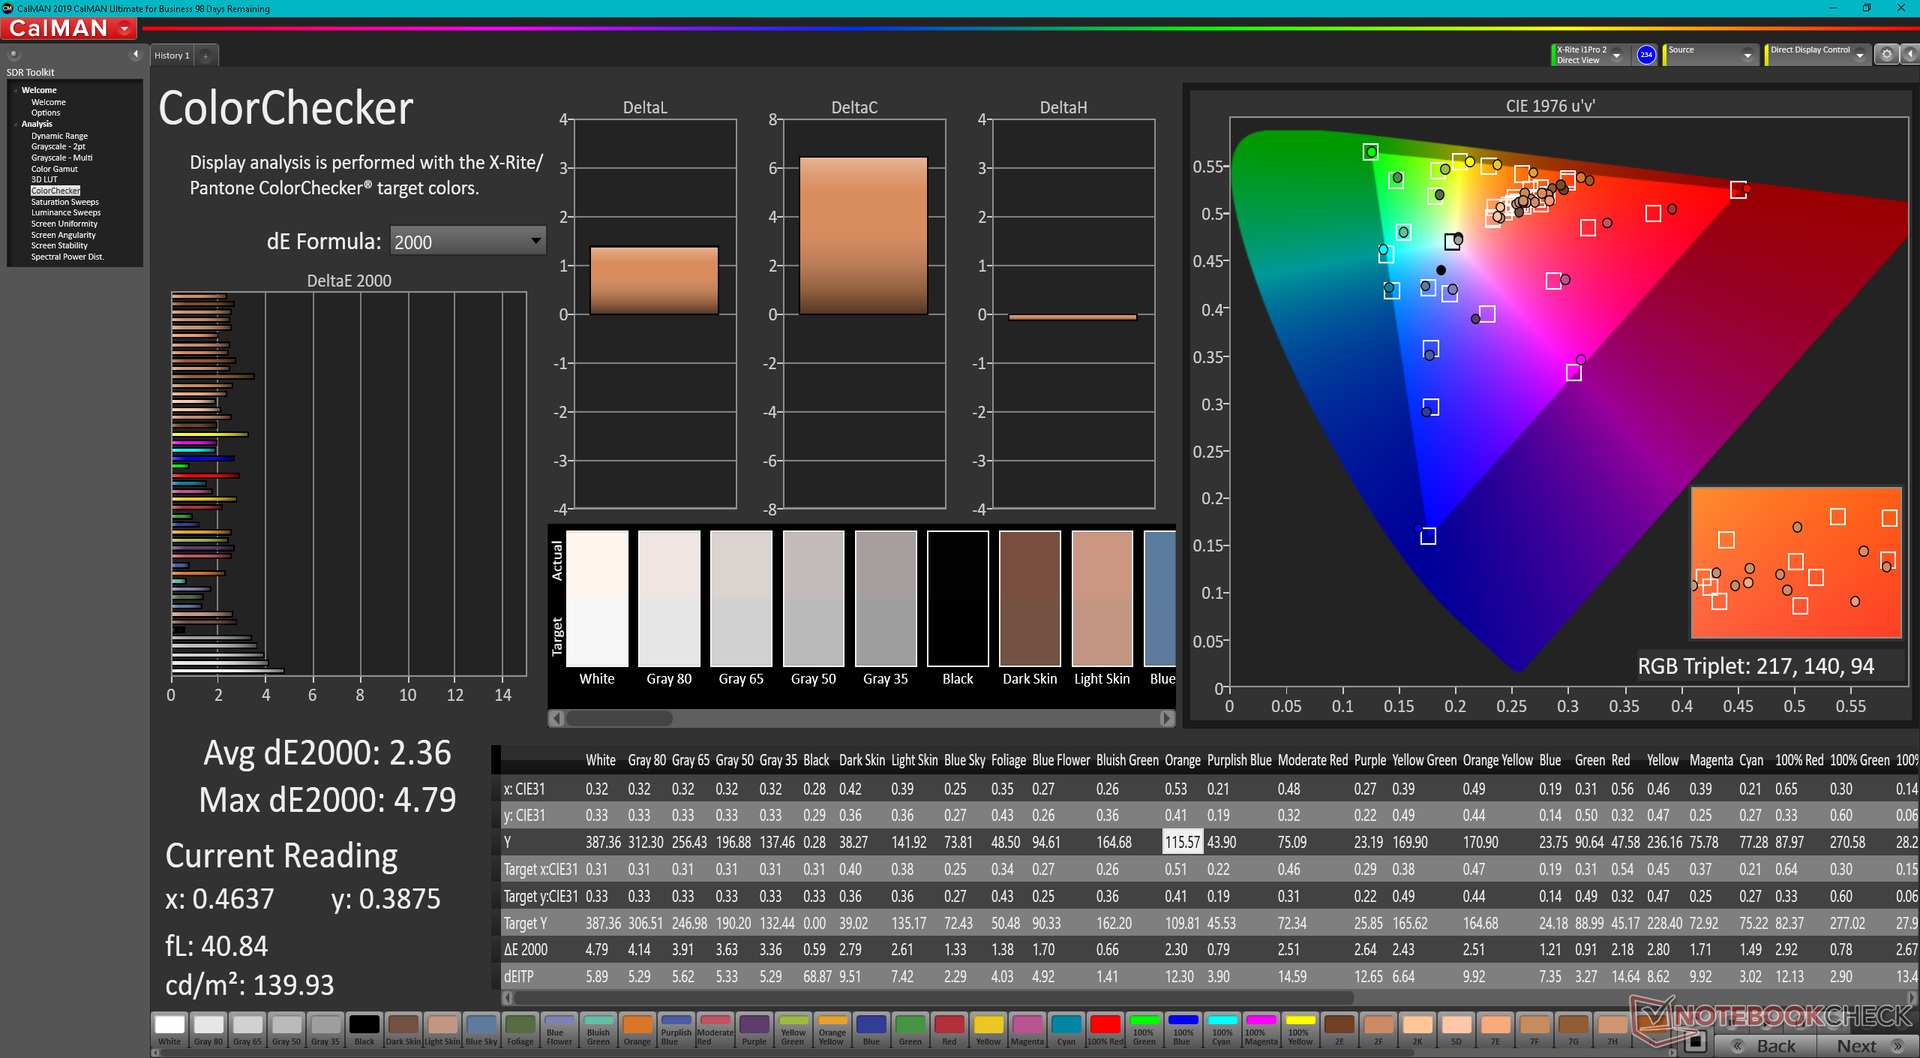
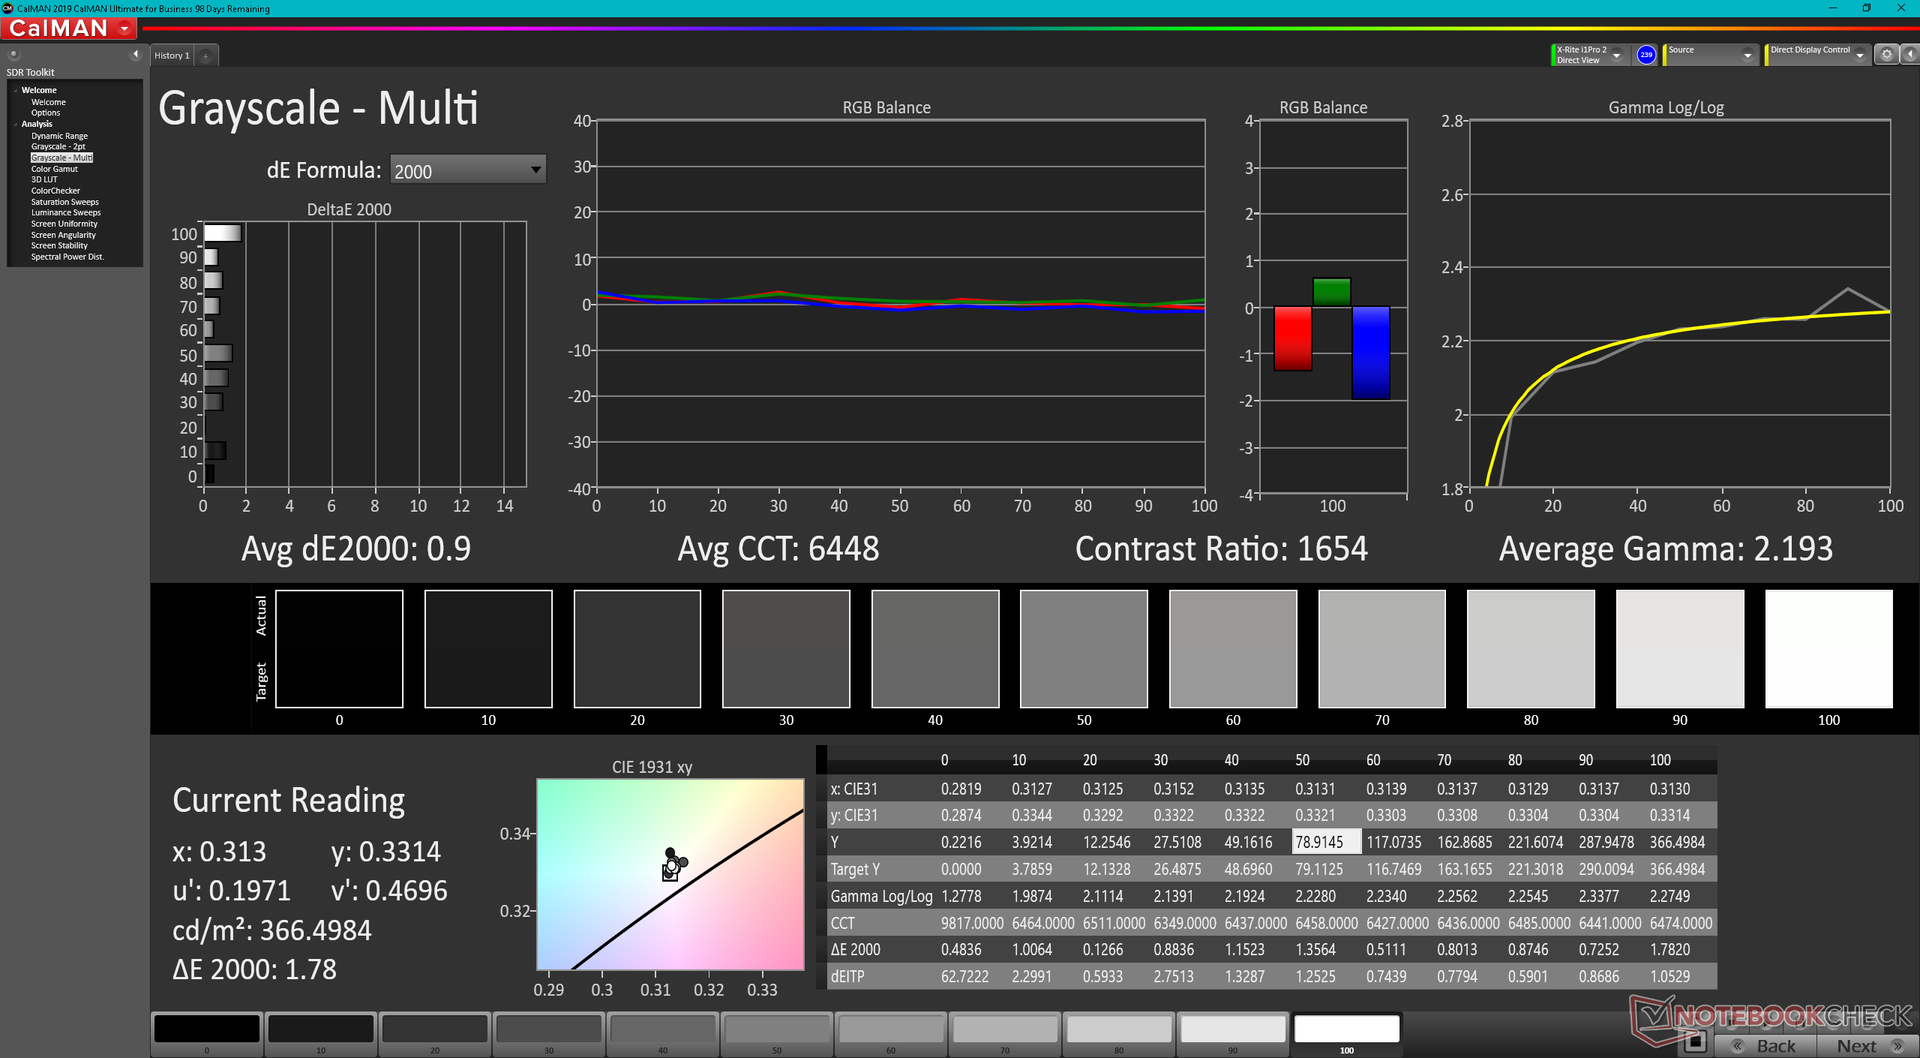
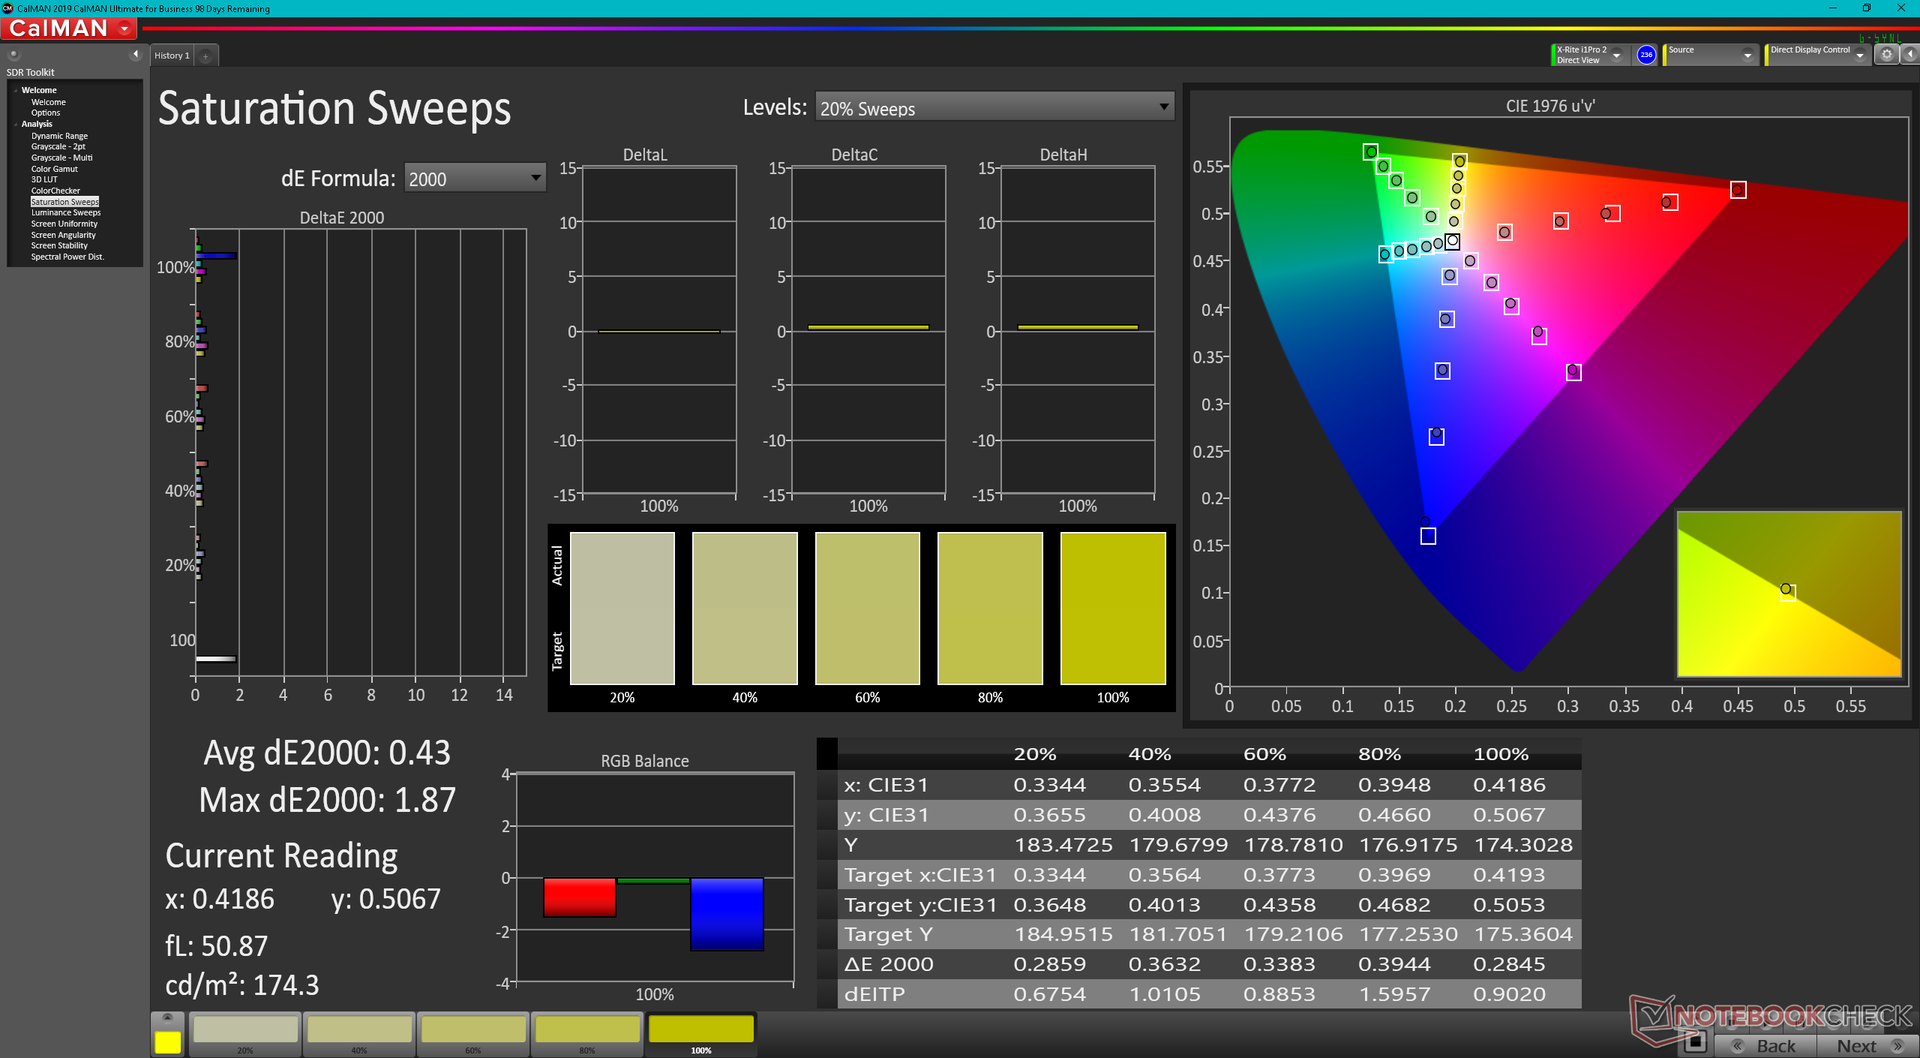
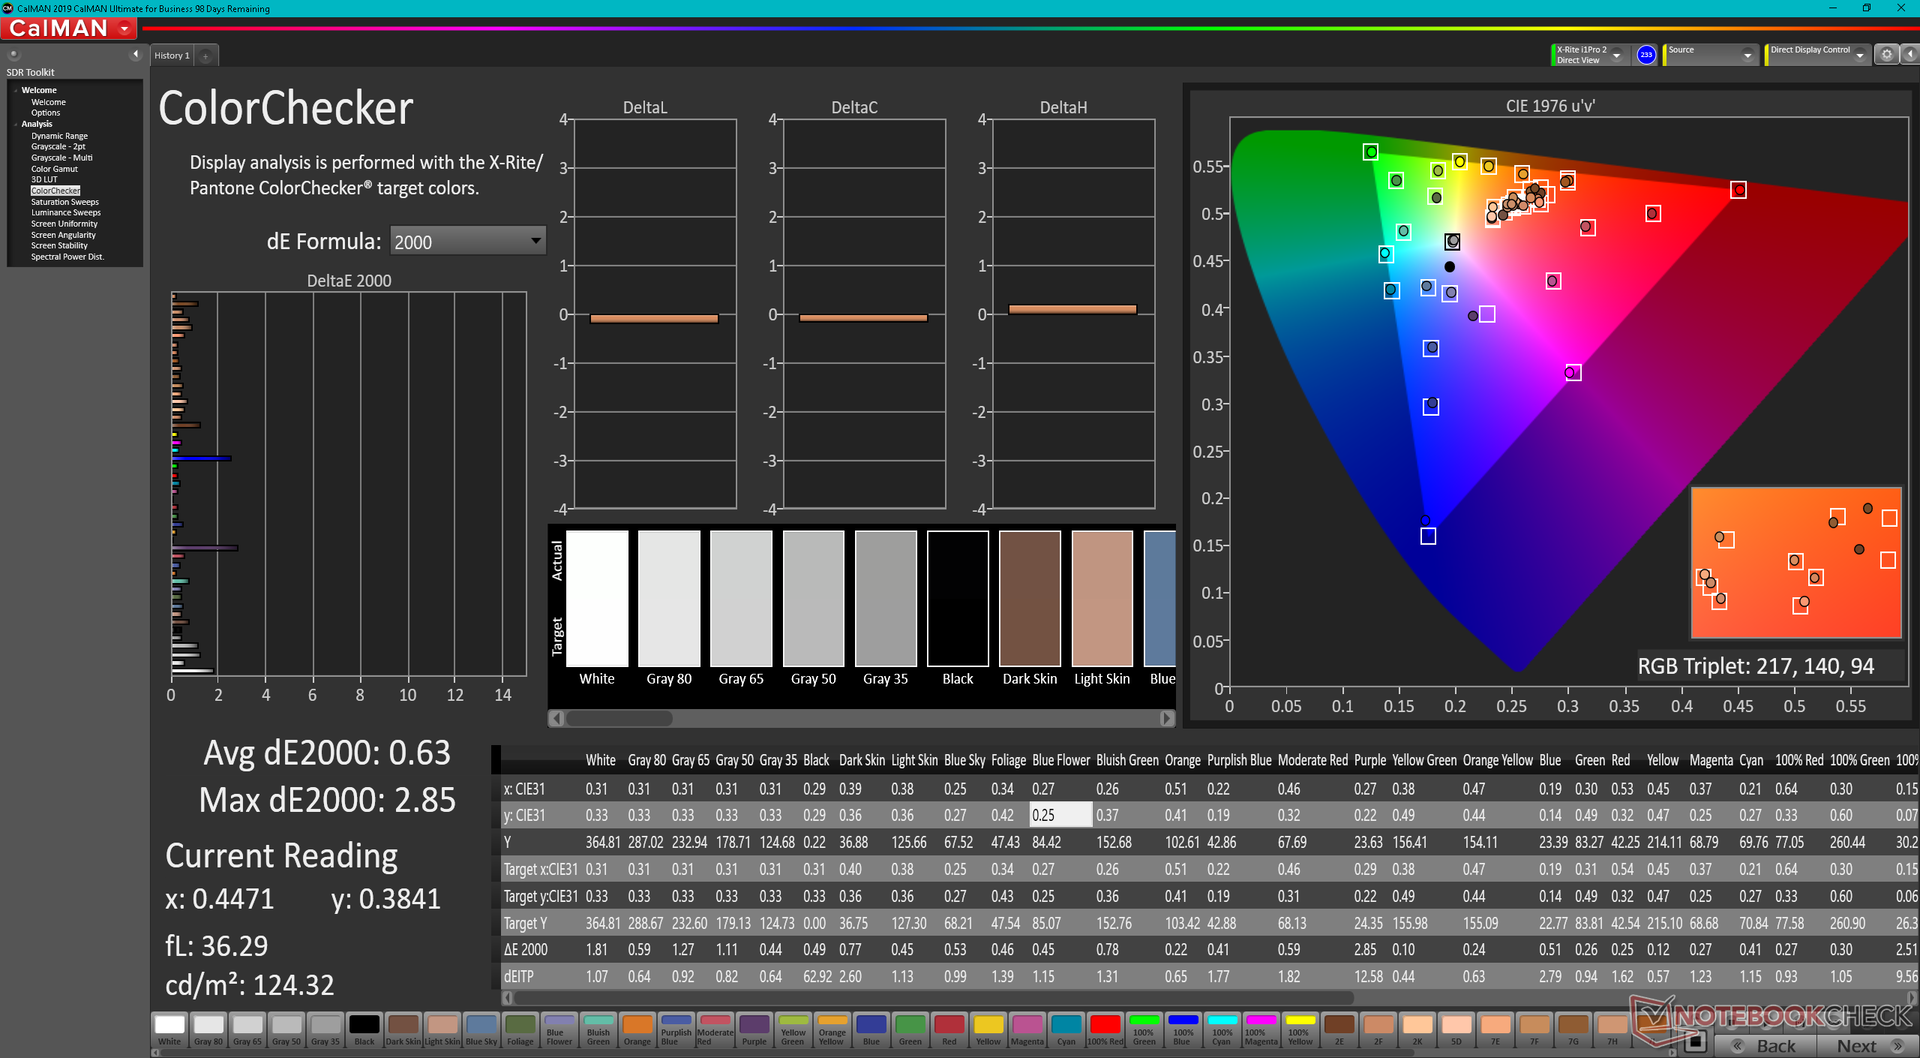
Nuestras mediciones a continuación reflejan sólo la configuración de arriba en negrita. Curiosamente, nuestra unidad utiliza un panel Chi Mei en lugar del panel LG Philips que se encuentra en el Spectre x360 de 13.5 pulgadas, pero los atributos principales son por lo demás casi los mismos entre ellos, incluyendo la cobertura sRGB completa, la alta relación de contraste de ~1500:1, y los tiempos de respuesta muy lentos en blanco y negro y gris. Es de esperar que se produzcan algunas imágenes fantasma si se ejecuta algún juego de ritmo rápido en el Dragonfly G3. La calidad de la imagen es nítida y vibrante incluso con la opción de pantalla base en nuestra unidad de análisis. Para colores más profundos, sospechamos que la opción OLED puede ofrecer una cobertura P3 completa como en el 2022 Spectre x360 13.5.
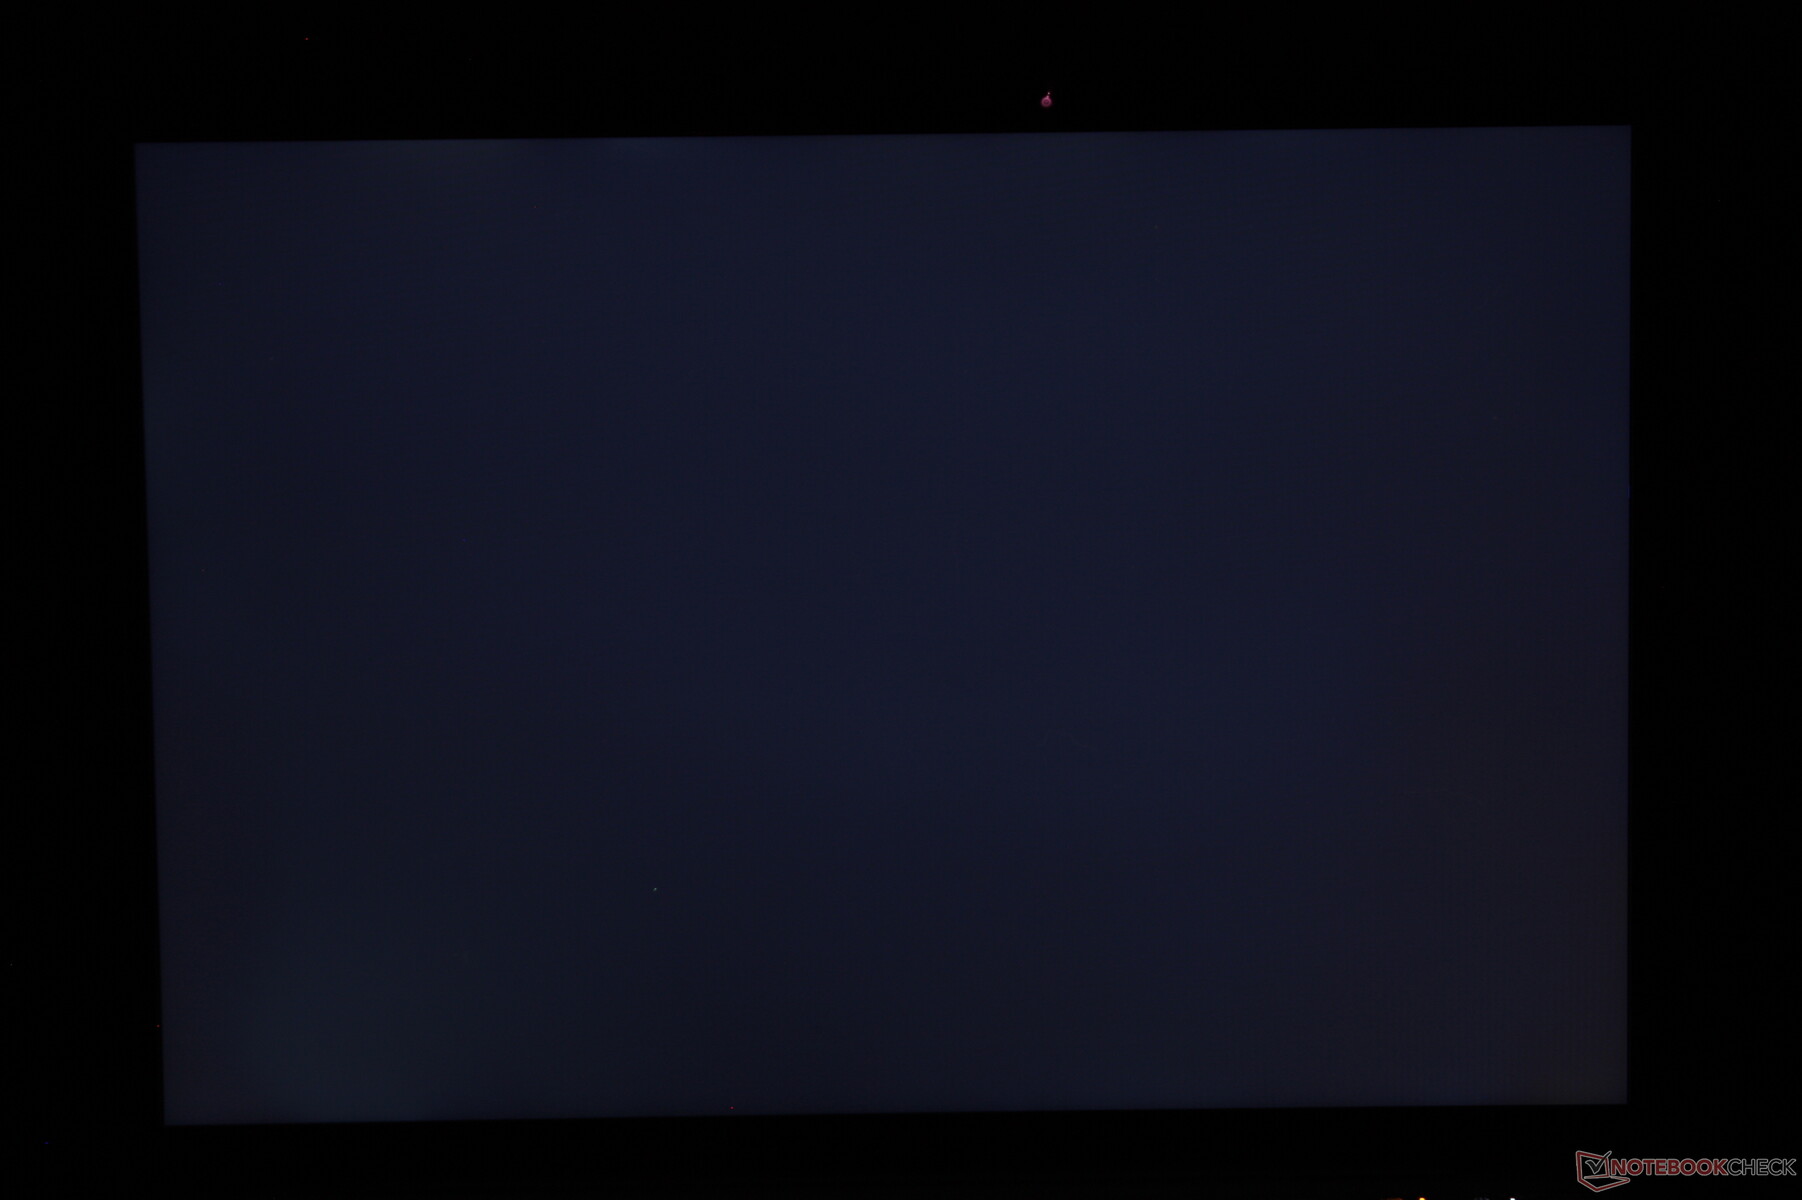
La distribución del brillo podría ser mejor. La esquina inferior izquierda de nuestra pantalla sólo tiene 314 nits, mientras que la superior derecha tiene 389 nits, lo que supone una disminución de brillo de esquina a esquina del 20%. Aunque la diferencia no distrae durante el uso habitual, esperábamos algo mejor de un portátil de gama alta como éste.
| |||||||||||||||||||||||||
iluminación: 80 %
Brillo con batería: 387.2 cd/m²
Contraste: 1489:1 (Negro: 0.26 cd/m²)
ΔE ColorChecker Calman: 2.36 | ∀{0.5-29.43 Ø4.71}
calibrated: 0.63
ΔE Greyscale Calman: 3 | ∀{0.09-98 Ø4.96}
69.9% AdobeRGB 1998 (Argyll 3D)
98.3% sRGB (Argyll 3D)
68% Display P3 (Argyll 3D)
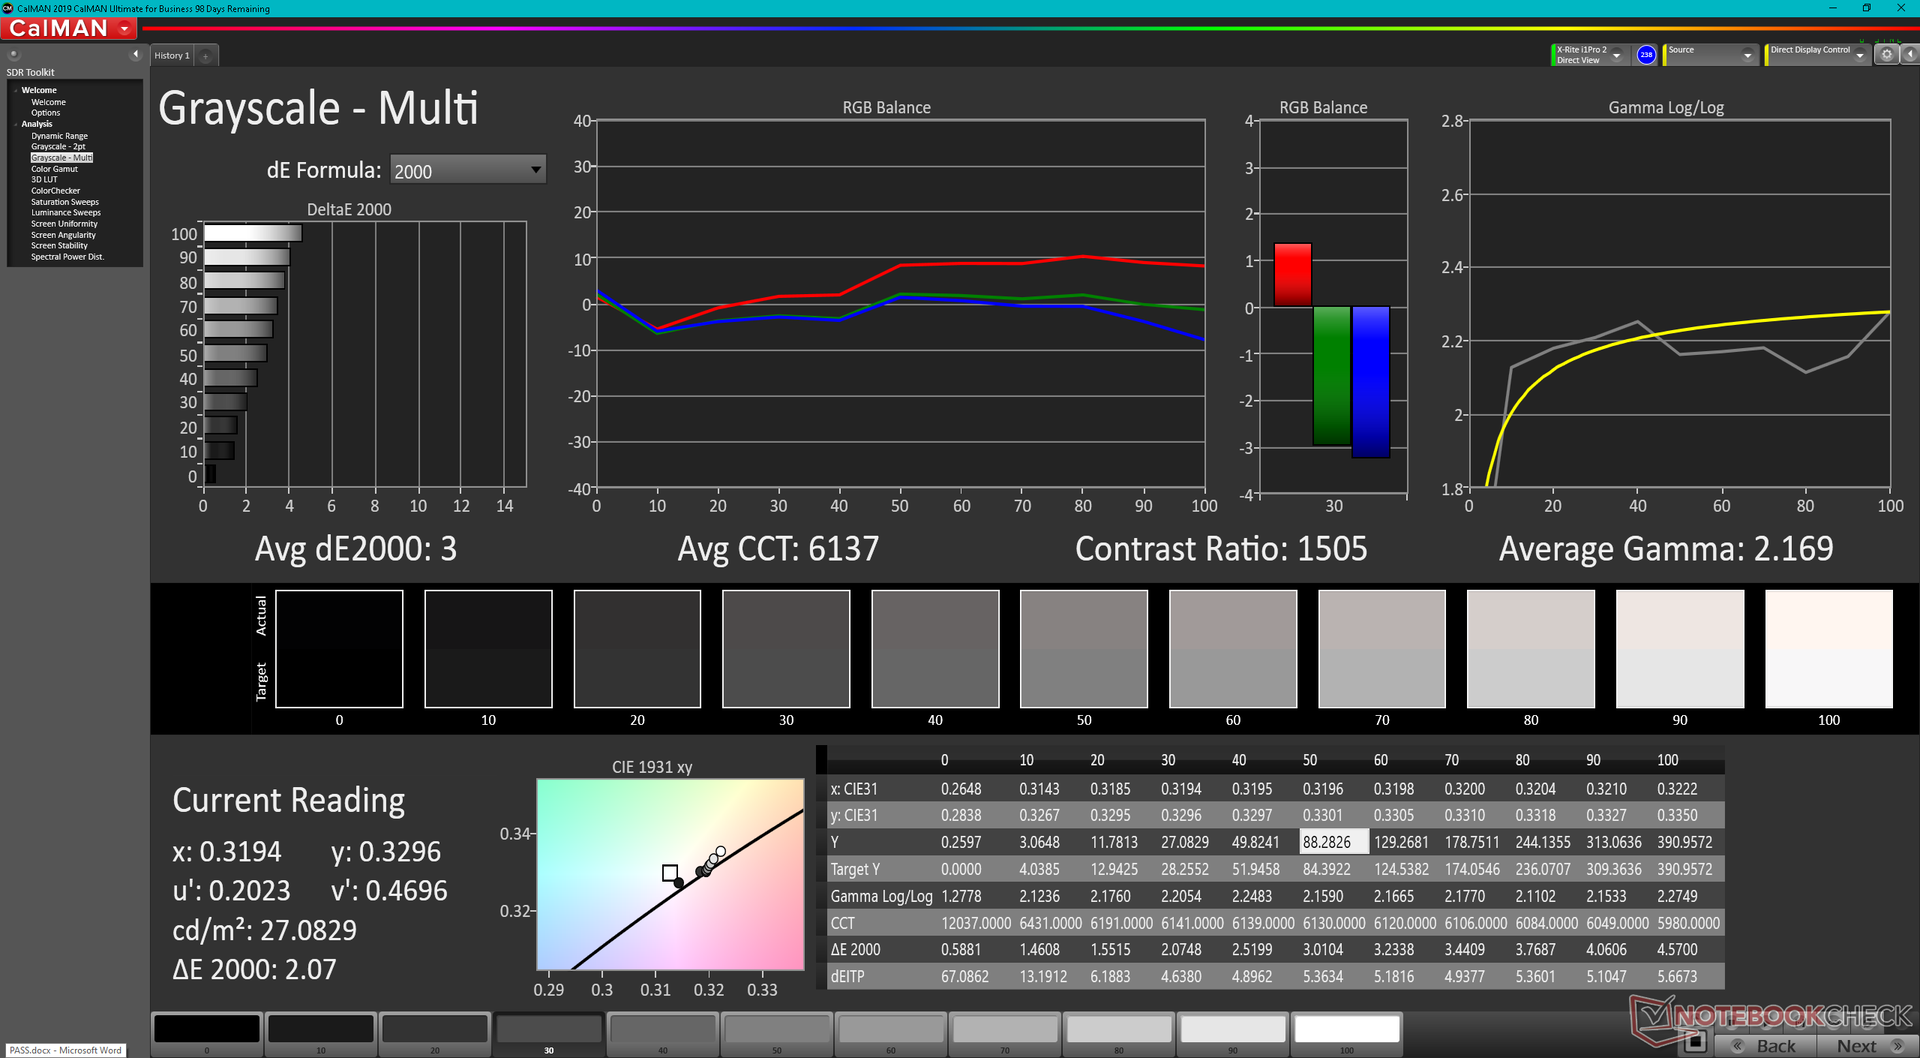
Gamma: 2.17
CCT: 6137 K
| HP Elite Dragonfly G3 Chi Mei CMN13C0, IPS, 1920x1280, 13.5" | HP Spectre x360 14t-ea000 LG Philips LGD0663, IPS, 1920x1280, 13.5" | Dell XPS 13 Plus 9320 i5-1240p Sharp SHP1548 LQ134N1, IPS, 1920x1200, 13.4" | Framework Laptop 13.5 12th Gen Intel BOE CQ NE135FBM-N41, IPS, 2256x1504, 13.5" | HP EliteBook Folio 13.5-3G2L2EA LGD0663, IPS, 1920x1280, 13.5" | Lenovo ThinkPad X1 Titanium Yoga G1 20QA001RGE LPM135M467, IPS, 2256x1504, 13.5" | |
|---|---|---|---|---|---|---|
| Display | -2% | 1% | 2% | |||
| Display P3 Coverage (%) | 68 | 65.8 -3% | 69 1% | 69.9 3% | ||
| sRGB Coverage (%) | 98.3 | 98.2 0% | 99 1% | 99.4 1% | ||
| AdobeRGB 1998 Coverage (%) | 69.9 | 67.9 -3% | 71 2% | 71.1 2% | ||
| Response Times | -18% | 26% | 27% | 18% | 13% | |
| Response Time Grey 50% / Grey 80% * (ms) | 50.8 ? | 62 ? -22% | 45 ? 11% | 34.7 ? 32% | 44 ? 13% | 53.6 ? -6% |
| Response Time Black / White * (ms) | 35.2 ? | 39.6 ? -13% | 21 ? 40% | 27.5 ? 22% | 27 ? 23% | 24 ? 32% |
| PWM Frequency (Hz) | ||||||
| Screen | -22% | -52% | -13% | -23% | 17% | |
| Brightness middle (cd/m²) | 387.2 | 443.5 15% | 498 29% | 449.6 16% | 250 -35% | 466 20% |
| Brightness (cd/m²) | 360 | 394 9% | 460 28% | 431 20% | 226 -37% | 454 26% |
| Brightness Distribution (%) | 80 | 78 -2% | 85 6% | 90 13% | 82 2% | 94 18% |
| Black Level * (cd/m²) | 0.26 | 0.17 35% | 0.53 -104% | 0.31 -19% | 0.215 17% | 0.23 12% |
| Contrast (:1) | 1489 | 2609 75% | 940 -37% | 1450 -3% | 1163 -22% | 2026 36% |
| Colorchecker dE 2000 * | 2.36 | 2.7 -14% | 3.65 -55% | 2.76 -17% | 3.59 -52% | 2.1 11% |
| Colorchecker dE 2000 max. * | 4.79 | 4.36 9% | 7.11 -48% | 7.96 -66% | 5.9 -23% | 4.5 6% |
| Colorchecker dE 2000 calibrated * | 0.63 | 2.61 -314% | 2.16 -243% | 0.58 8% | ||
| Greyscale dE 2000 * | 3 | 3.4 -13% | 4.25 -42% | 5.2 -73% | 3.99 -33% | 2.7 10% |
| Gamma | 2.17 101% | 2.09 105% | 2.45 90% | 2.23 99% | 2.98 74% | 2.08 106% |
| CCT | 6137 106% | 6144 106% | 6690 97% | 6475 100% | 6765 96% | 6210 105% |
| Color Space (Percent of AdobeRGB 1998) (%) | 62.1 | 61.1 | ||||
| Color Space (Percent of sRGB) (%) | 98.5 | 94.9 | ||||
| Media total (Programa/Opciones) | -14% /
-17% | -8% /
-29% | 5% /
-4% | -3% /
-15% | 15% /
17% |
* ... más pequeño es mejor
La pantalla está decentemente calibrada al sacarla de la caja, con unos valores medios de deltaE en escala de grises y color de 3 y 2,36, respectivamente. Calibrar la pantalla nosotros mismos mejoraría aún más los valores medios de DeltaE a menos de uno cada uno.
Tiempos de respuesta del display
| ↔ Tiempo de respuesta de Negro a Blanco | ||
|---|---|---|
| 35.2 ms ... subida ↗ y bajada ↘ combinada | ↗ 18.8 ms subida | 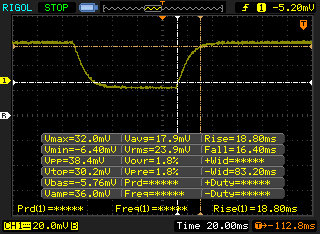 |
| ↘ 16.4 ms bajada | ||
| La pantalla mostró tiempos de respuesta lentos en nuestros tests y podría ser demasiado lenta para los jugones. En comparación, todos los dispositivos de prueba van de ##min### (mínimo) a 240 (máximo) ms. » 93 % de todos los dispositivos son mejores. Eso quiere decir que el tiempo de respuesta es peor que la media (19.8 ms) de todos los dispositivos testados. | ||
| ↔ Tiempo de respuesta 50% Gris a 80% Gris | ||
| 50.8 ms ... subida ↗ y bajada ↘ combinada | ↗ 27.2 ms subida | 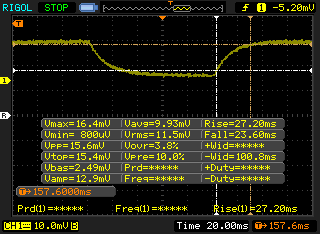 |
| ↘ 23.6 ms bajada | ||
| La pantalla mostró tiempos de respuesta lentos en nuestros tests y podría ser demasiado lenta para los jugones. En comparación, todos los dispositivos de prueba van de ##min### (mínimo) a 636 (máximo) ms. » 87 % de todos los dispositivos son mejores. Eso quiere decir que el tiempo de respuesta es peor que la media (31 ms) de todos los dispositivos testados. | ||
Parpadeo de Pantalla / PWM (Pulse-Width Modulation)
| Parpadeo de Pantalla / PWM no detectado | 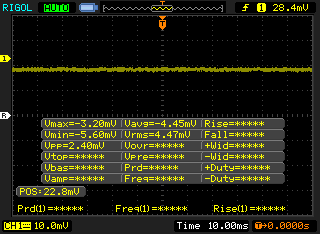 | ||
Comparación: 52 % de todos los dispositivos testados no usaron PWM para atenuar el display. Si se usó, medimos una media de 7754 (mínimo: 5 - máxmo: 343500) Hz. | |||
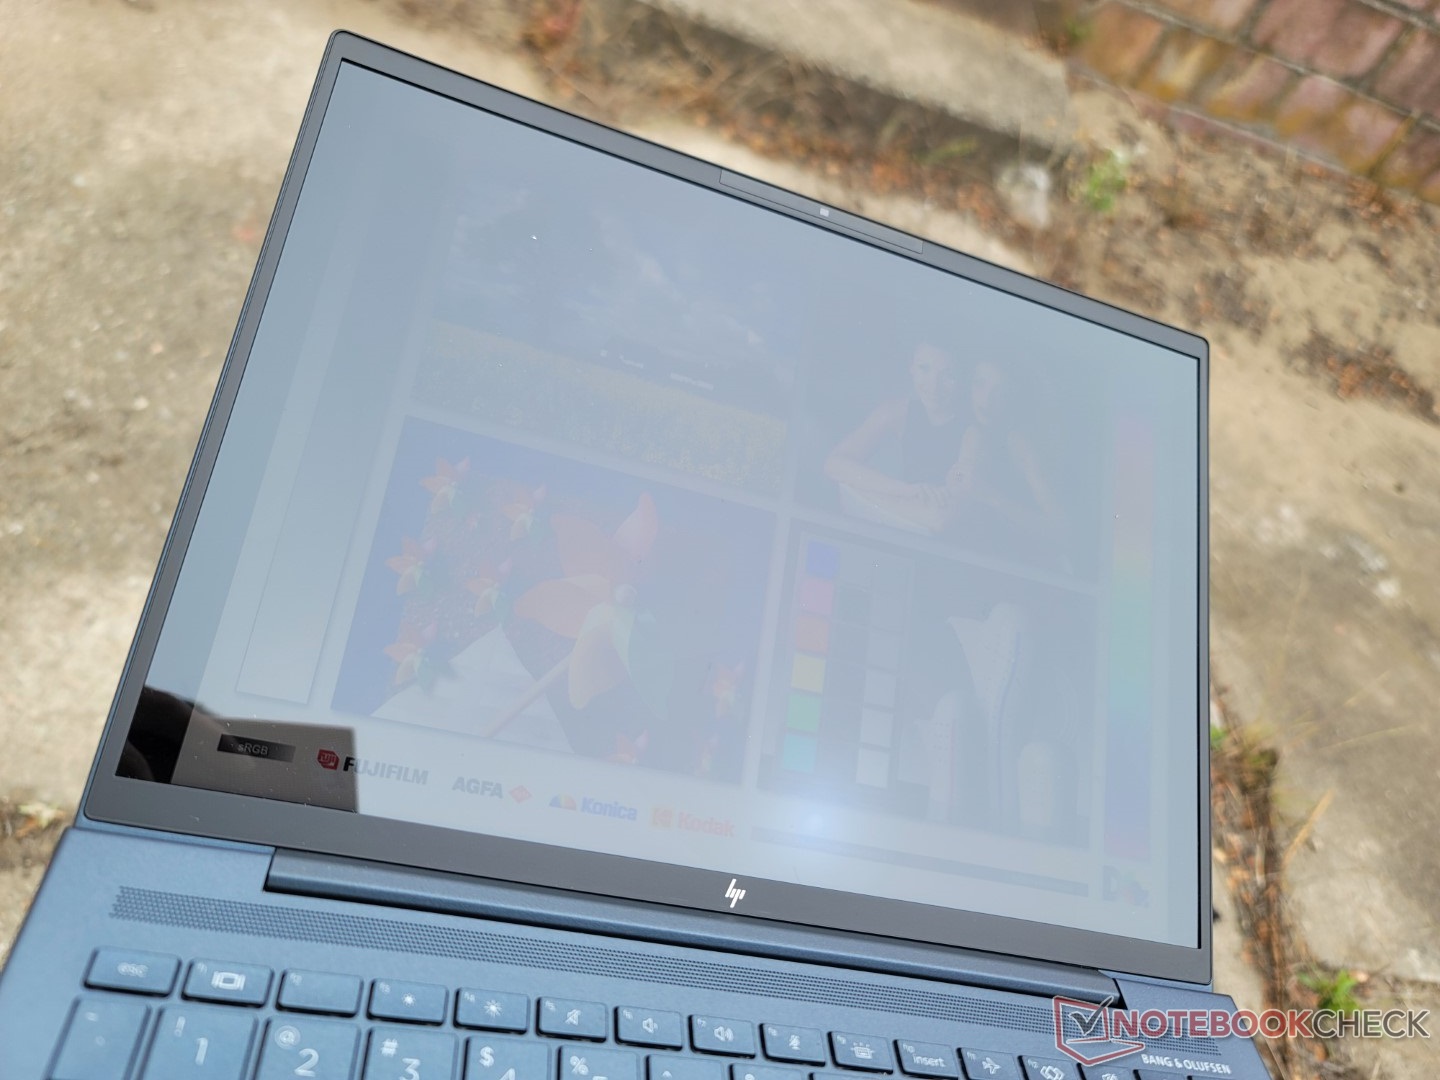
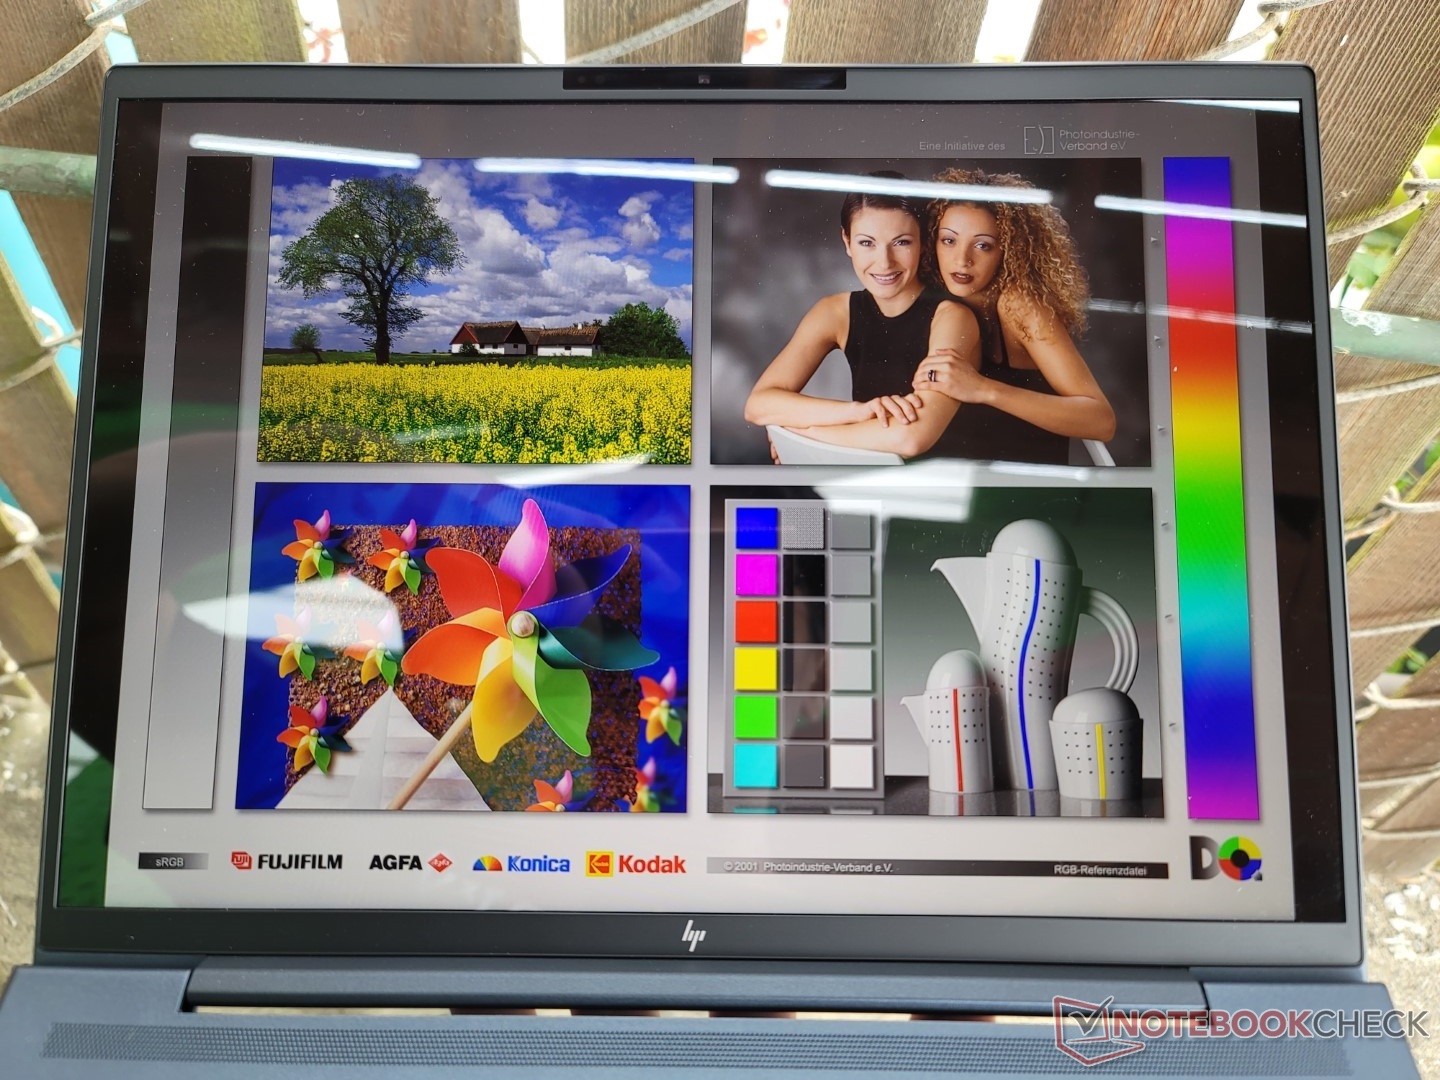
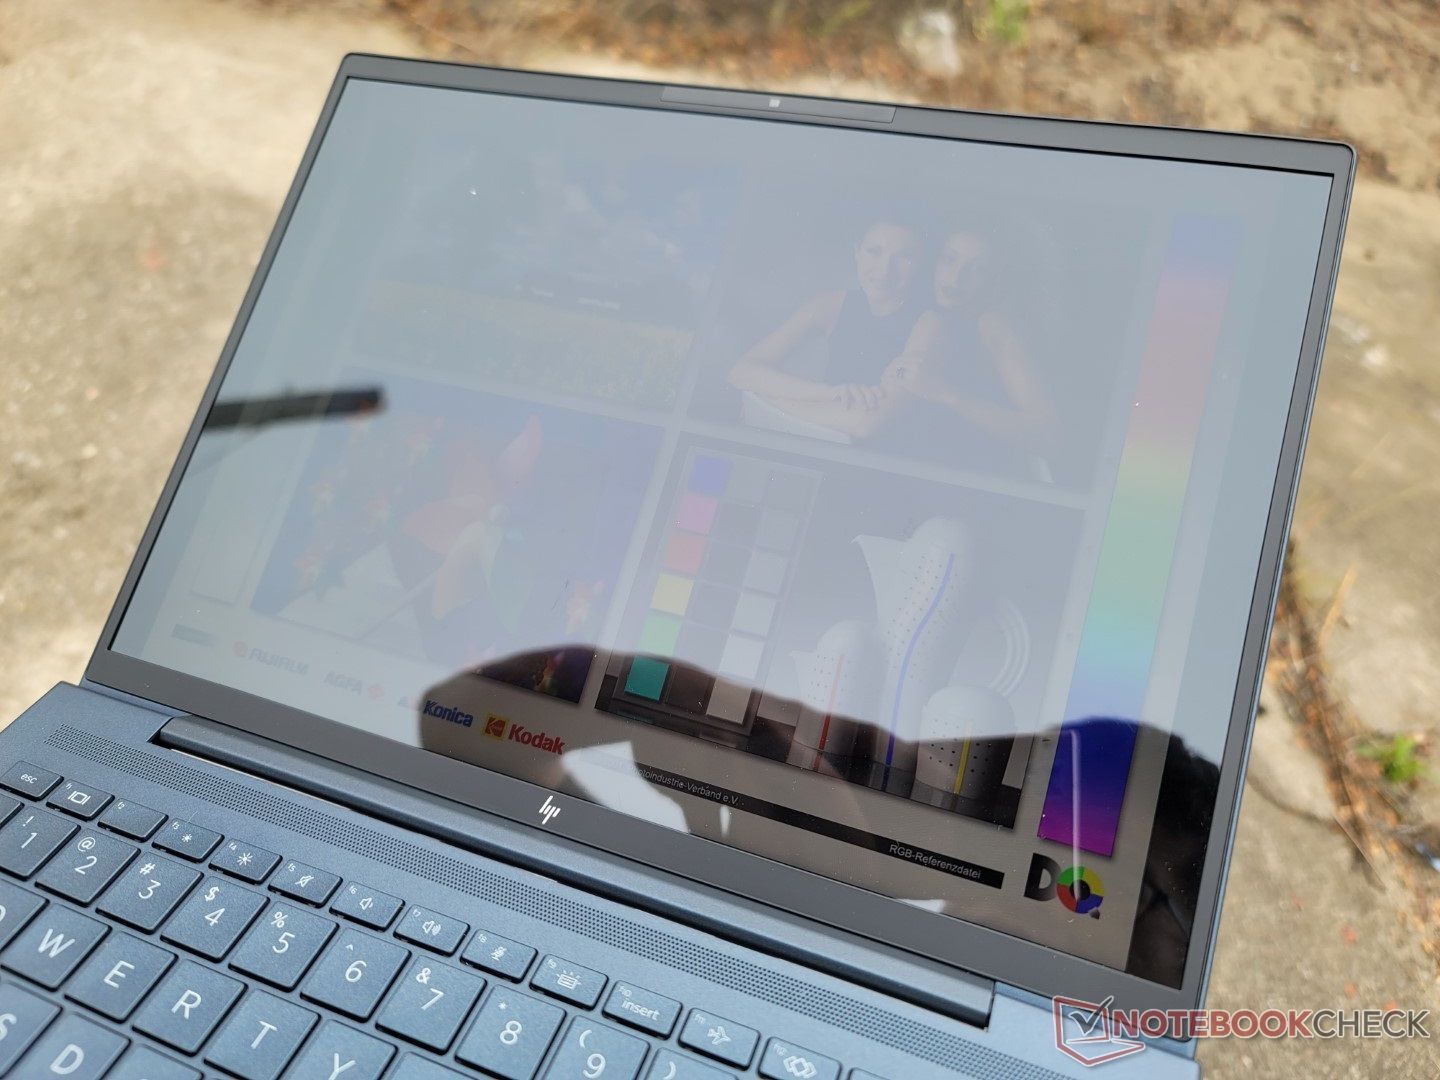
La pantalla básica de 400 nits es apenas visible en la mayoría de las condiciones de luz exterior. HP ofrece su panel de 1000 nits como opción para mejorar la visibilidad en exteriores, pero lamentablemente está vinculado a Sure View, lo que puede ser no es deseable para algunos usuarios.

Rendimiento - Intel 12ª generación
Condiciones de la prueba
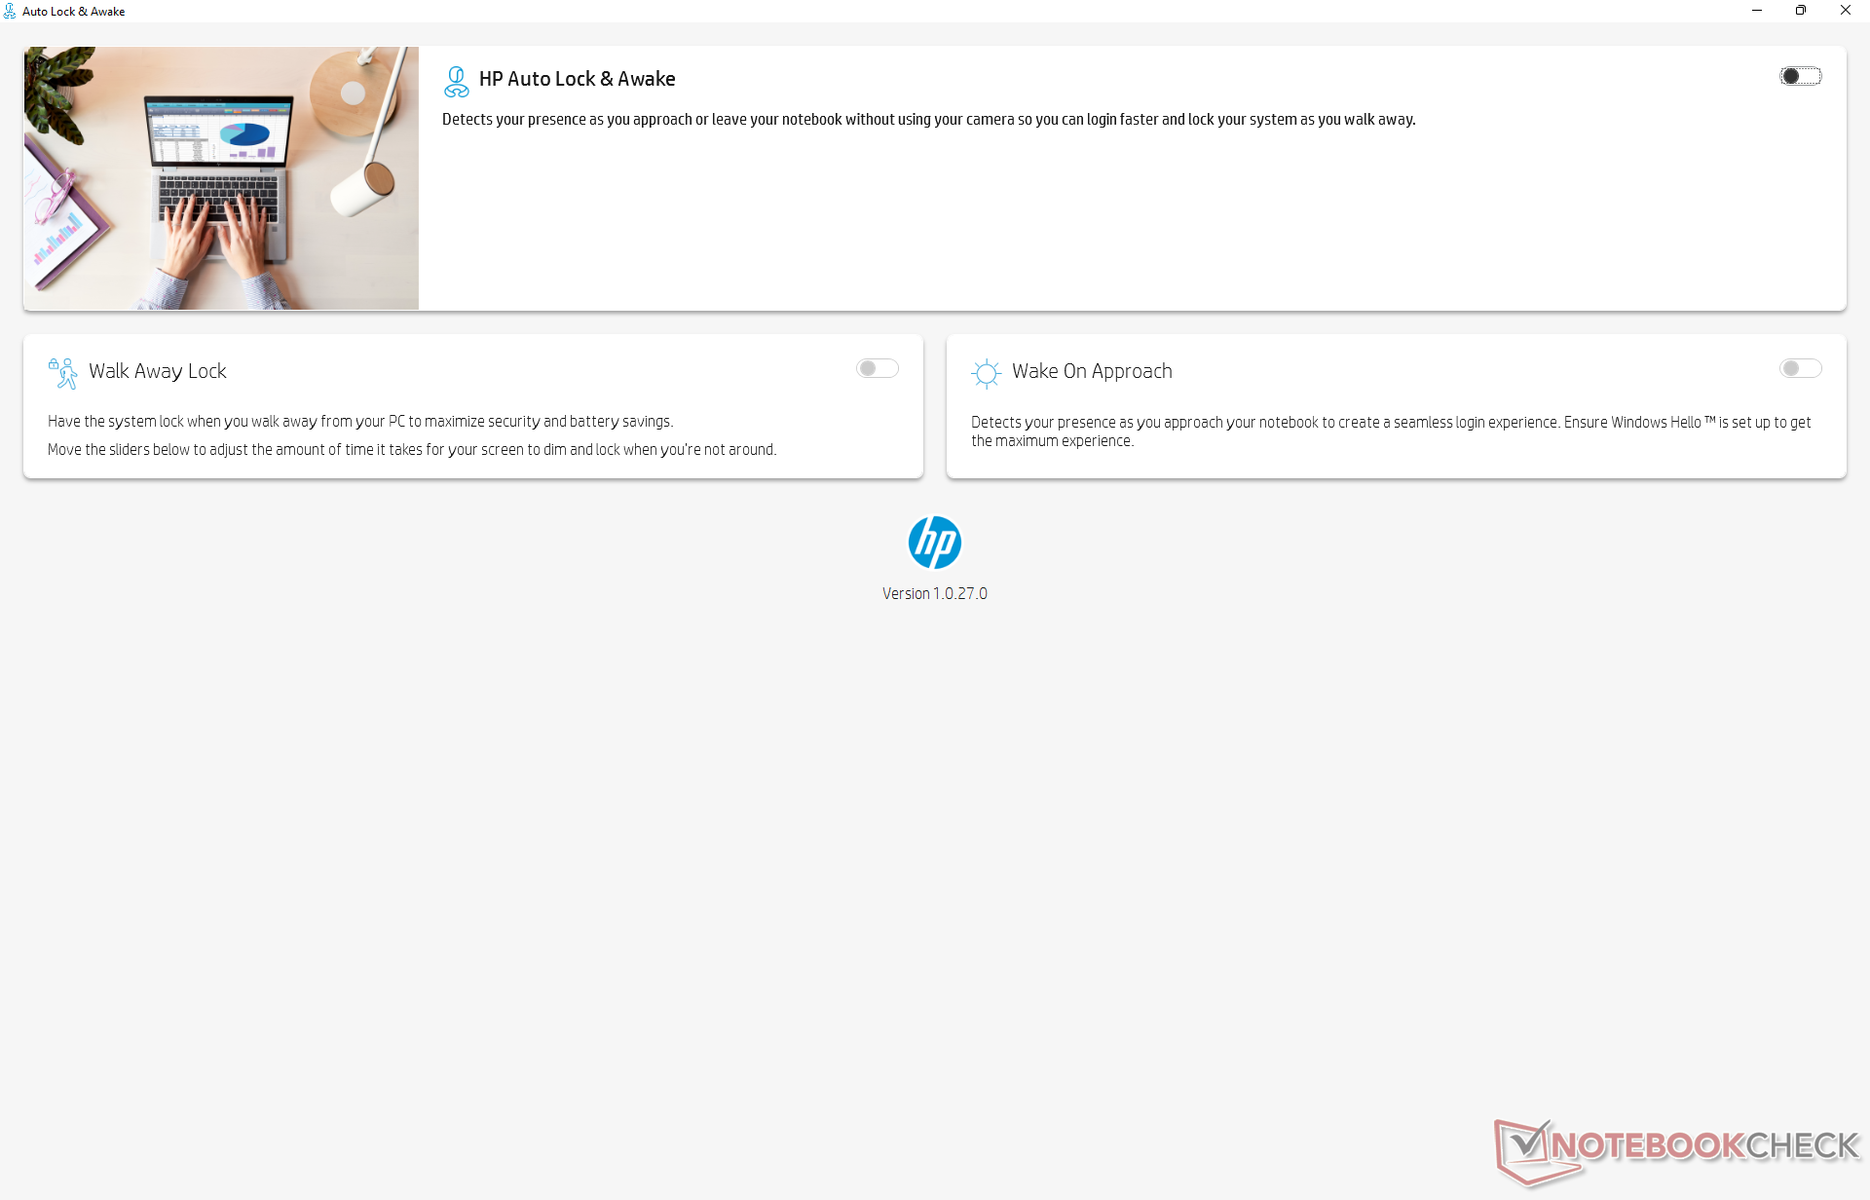
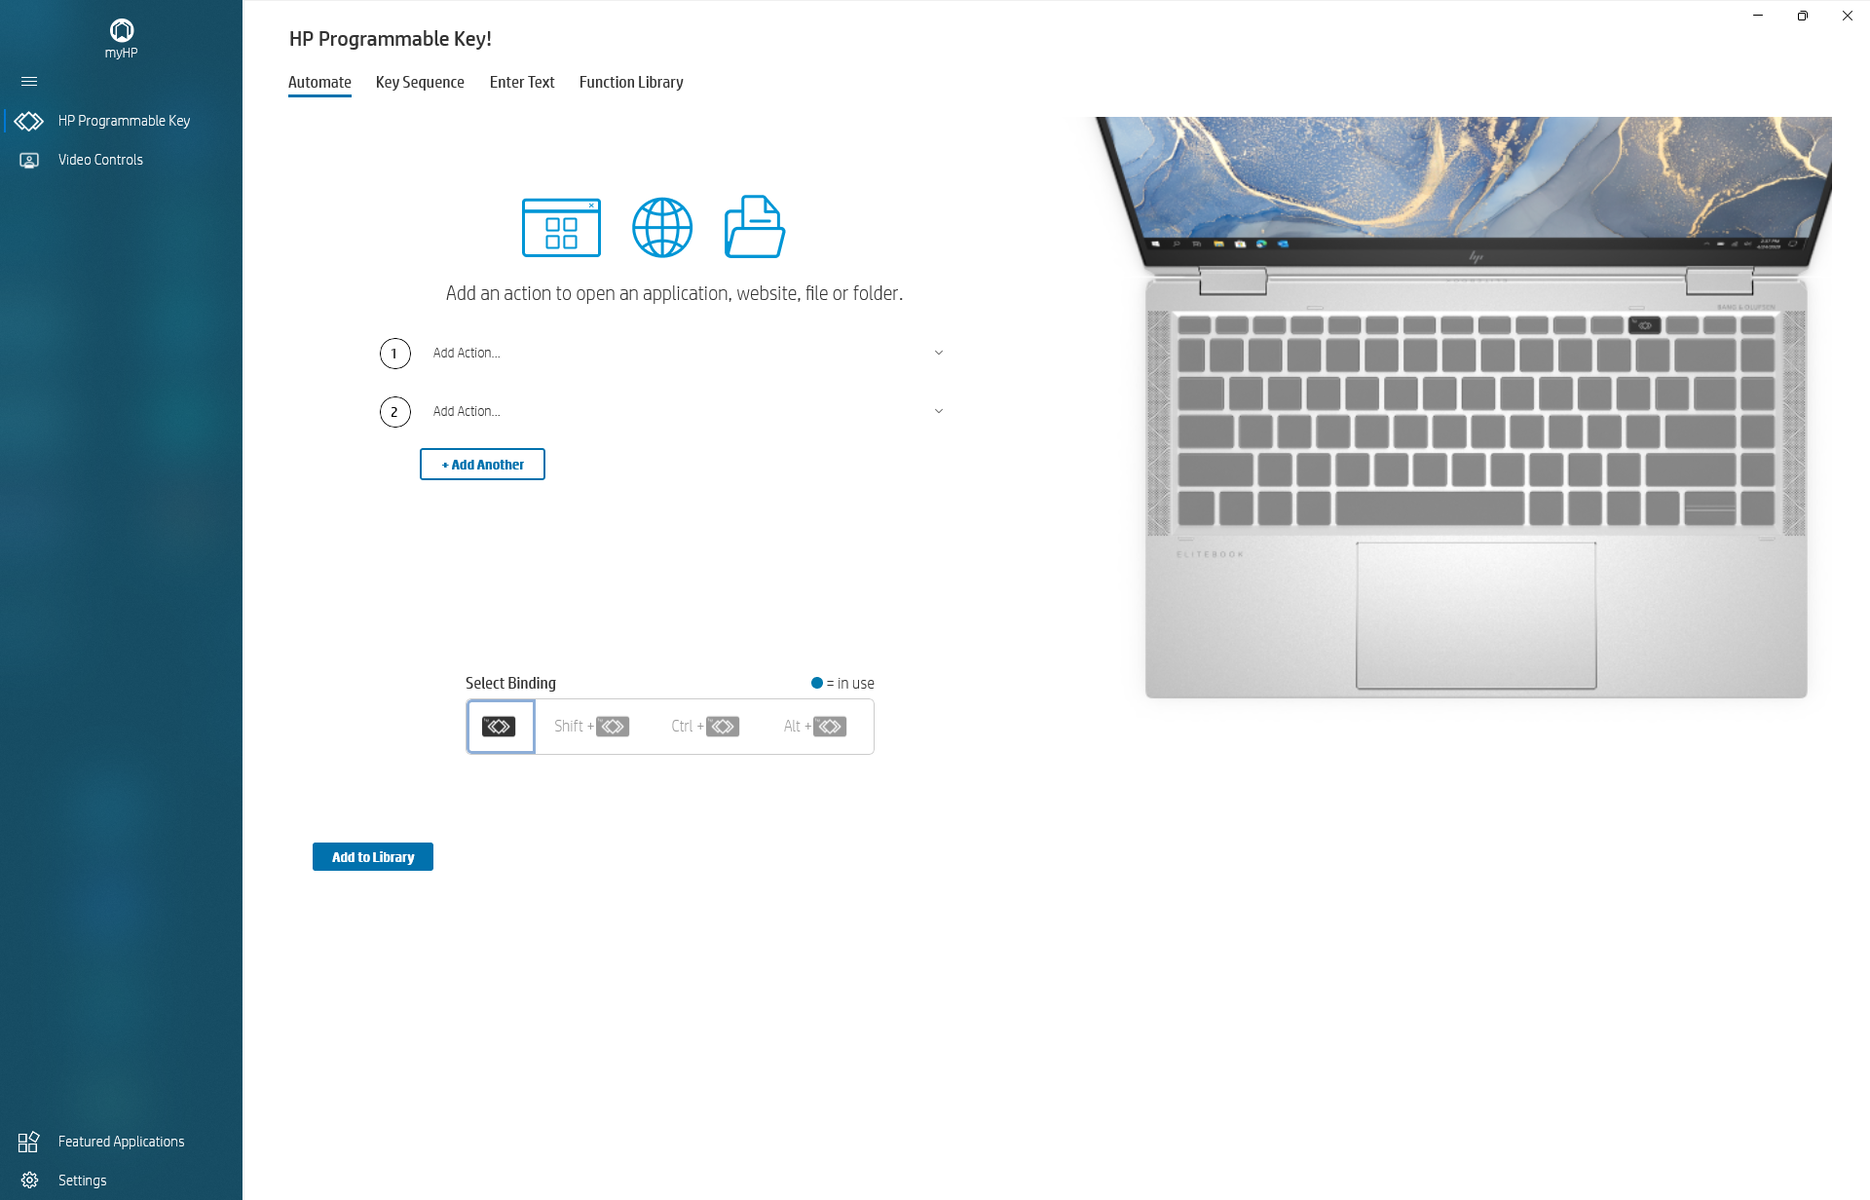
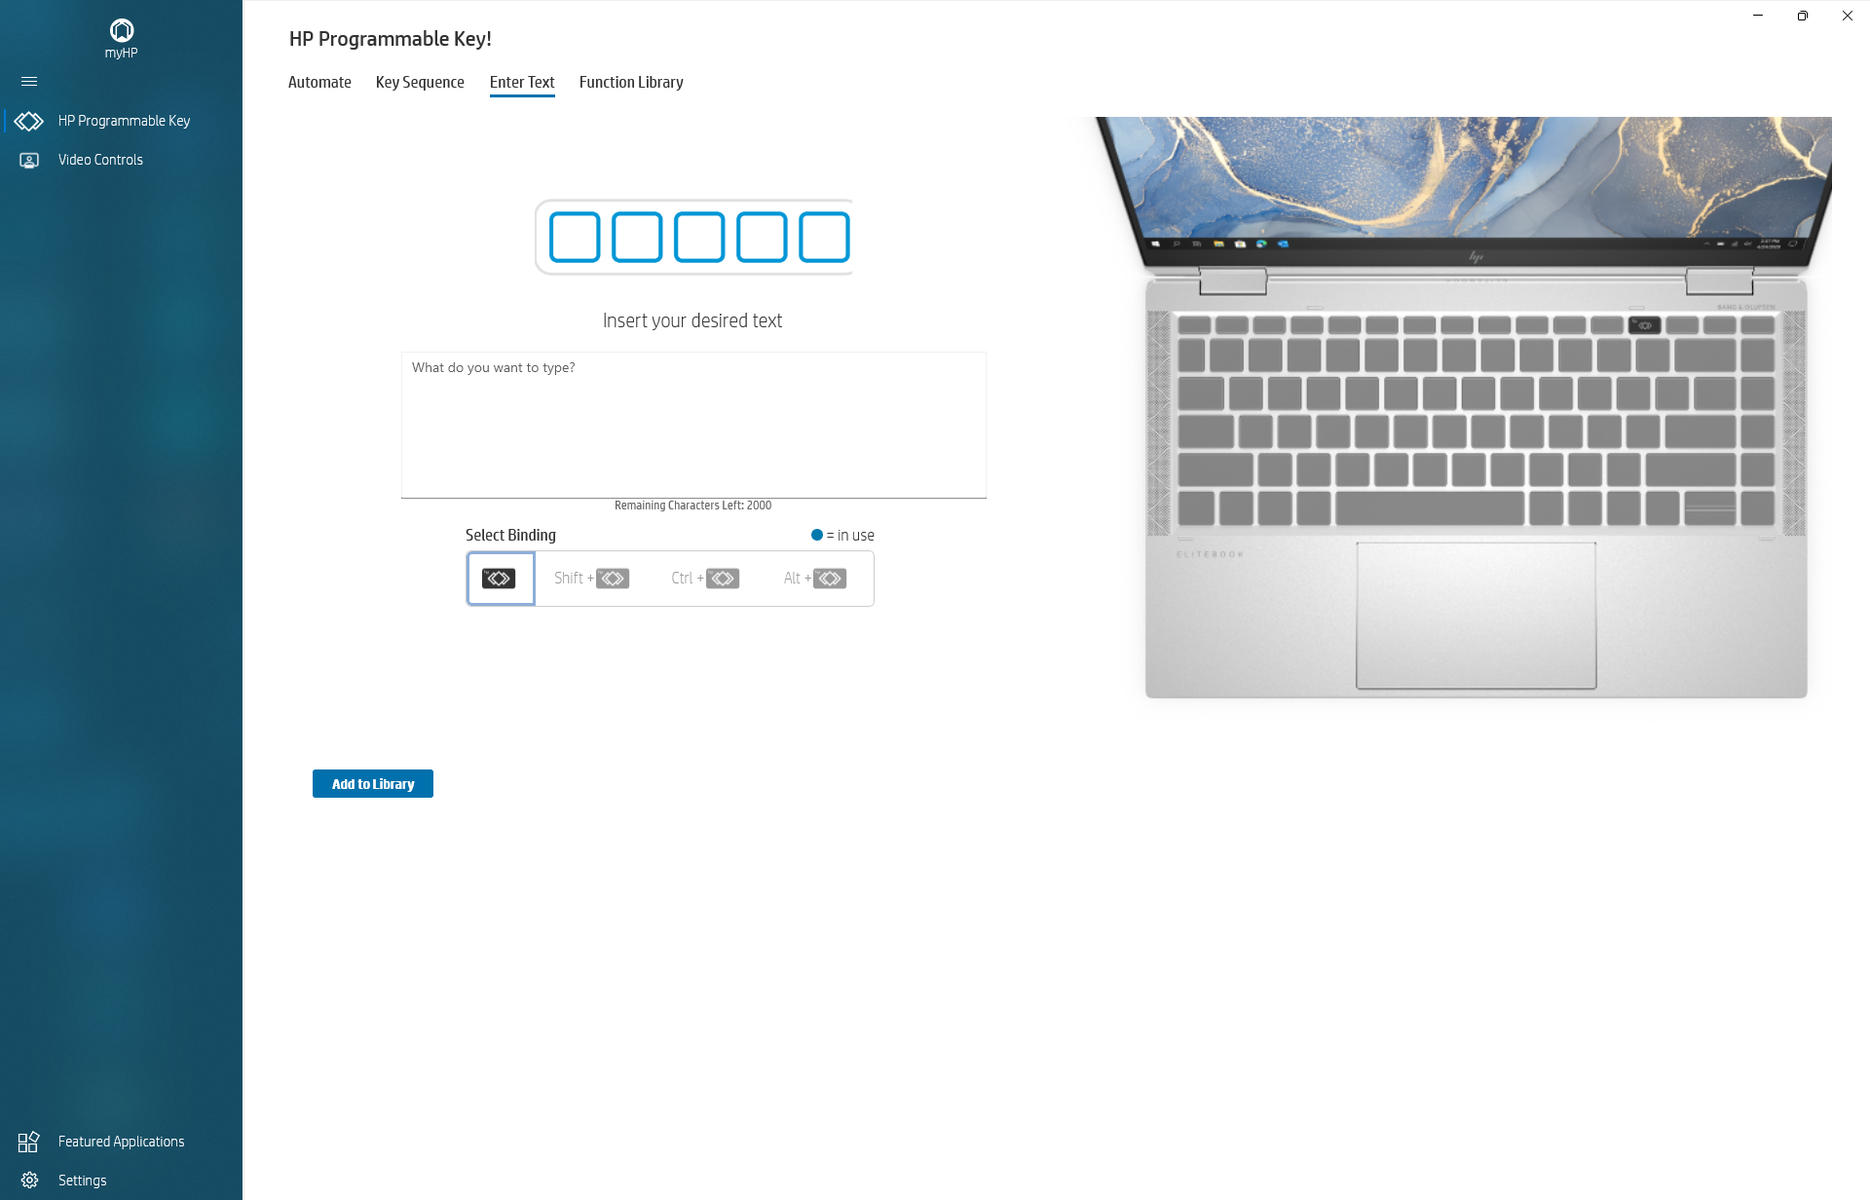
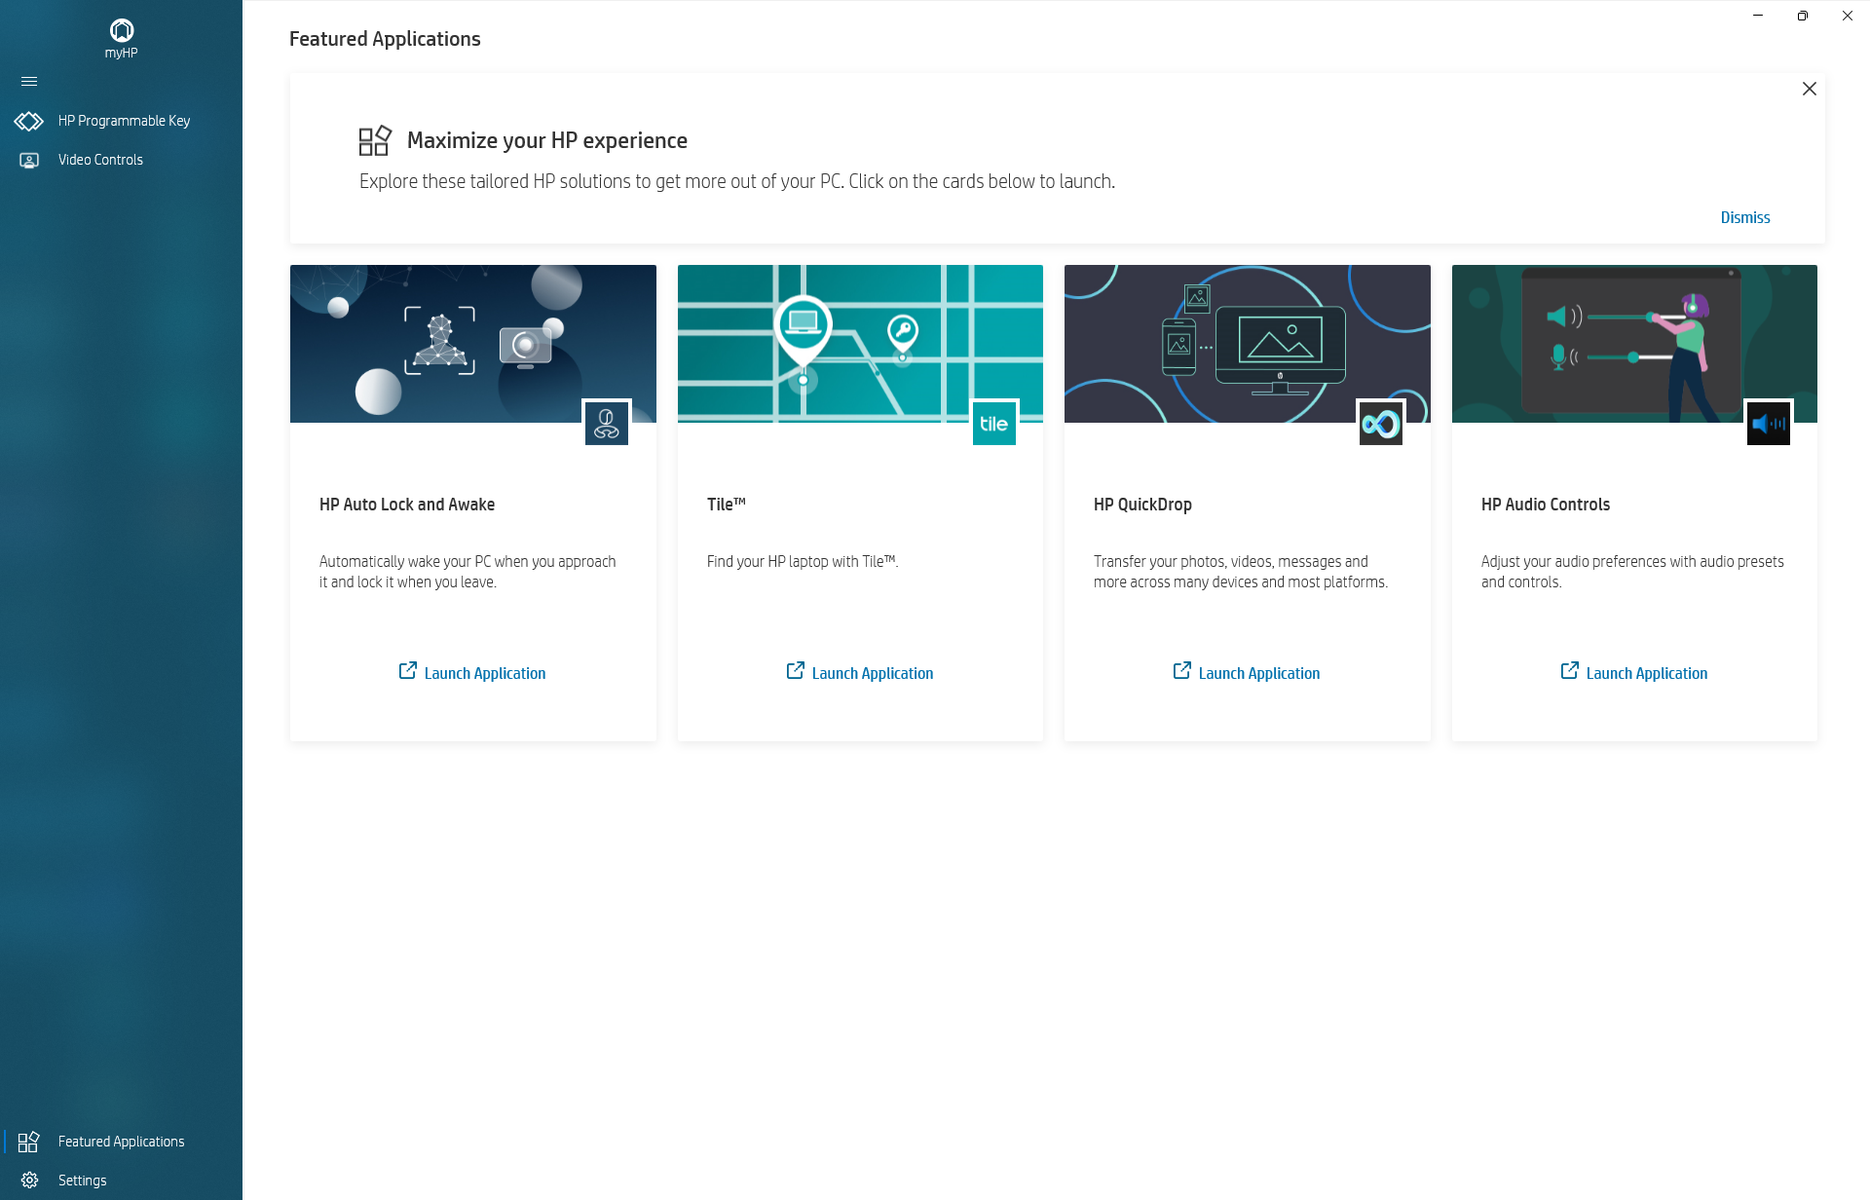
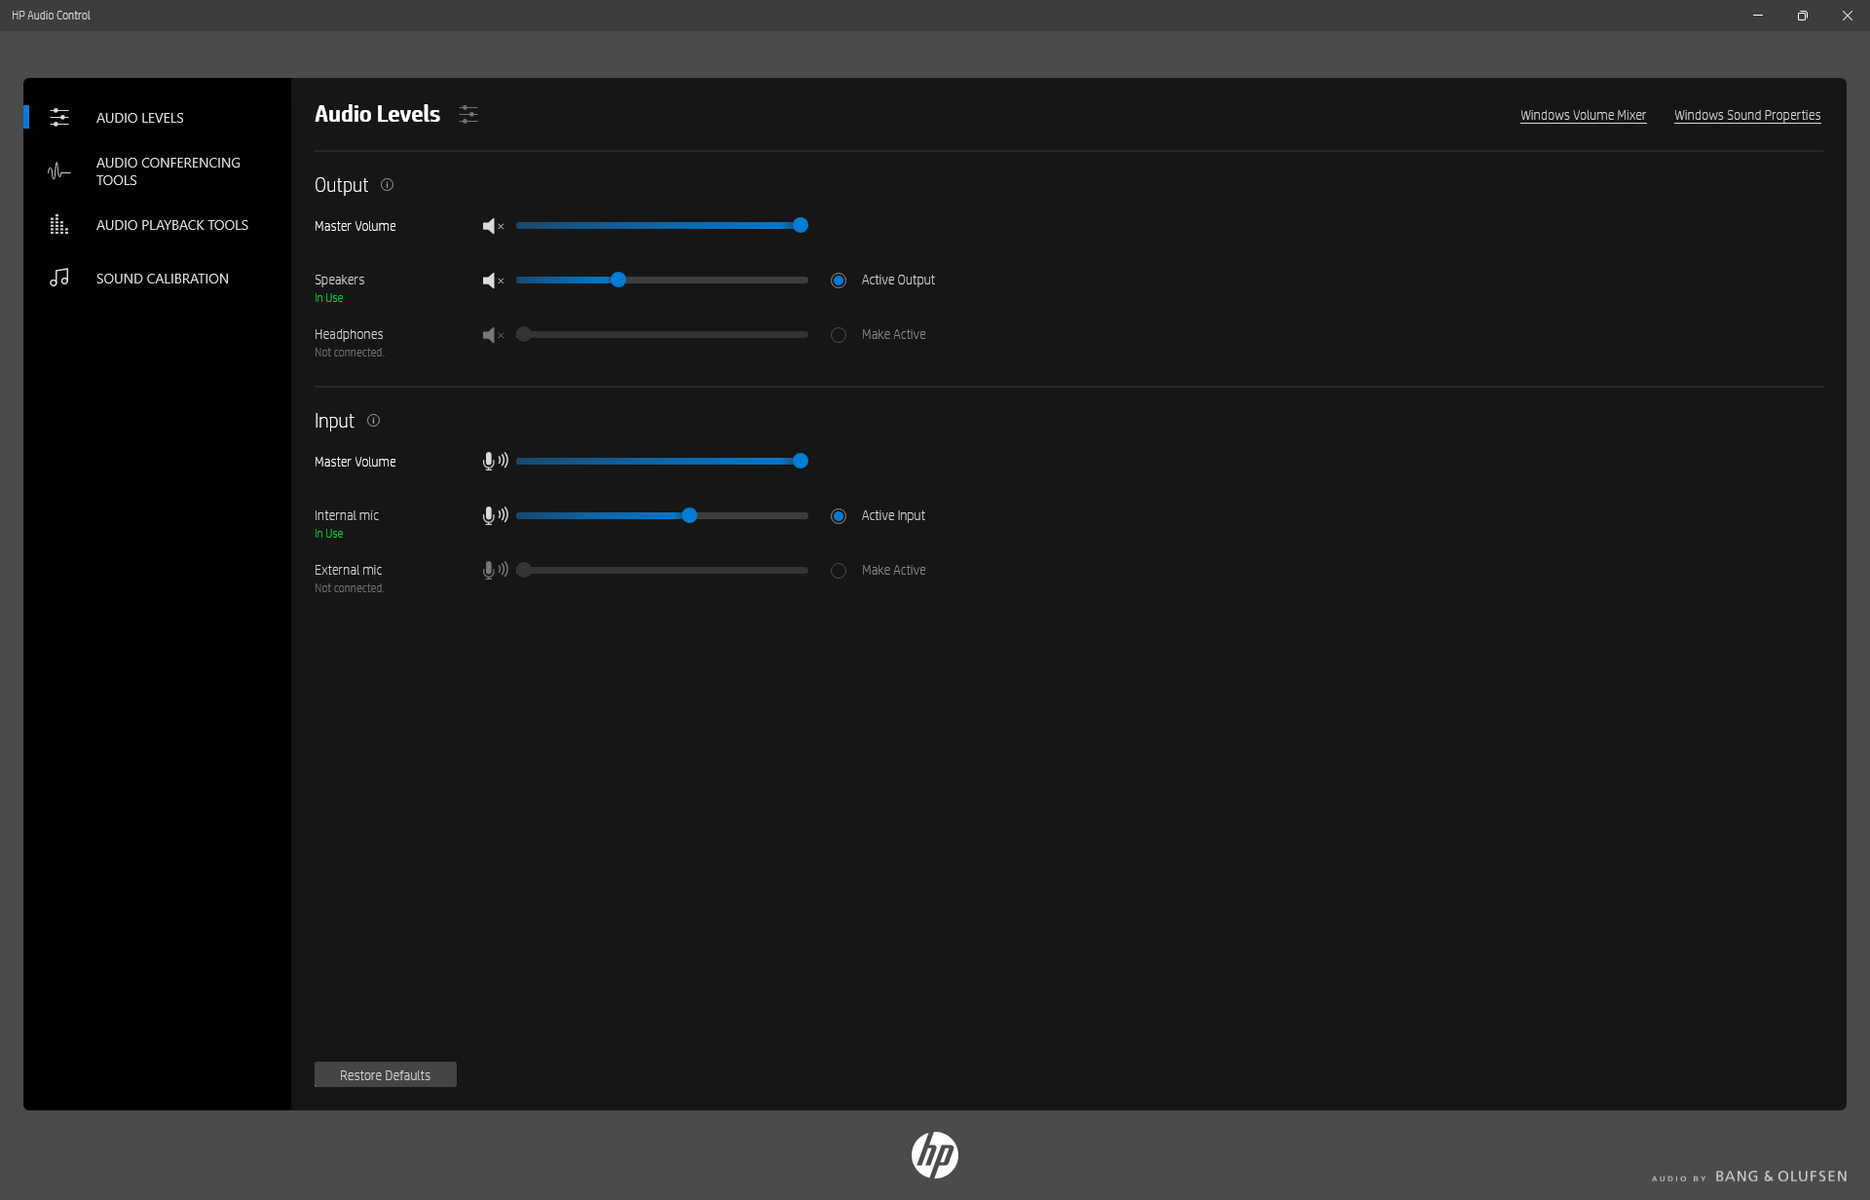
Nuestra unidad se configuró en modo Rendimiento a través de Windows antes de ejecutar cualquier punto de referencia a continuación. HP Command Center, que viene preinstalado en los portátiles Spectre y Envy, no está presente en el Dragonfly centrado en la empresa. En su lugar, el modelo viene con HP Programmable Key, Auto Lock and Awake, Tile, QuickDrop, y Audio Controls. Recomendamos familiarizarse con Programmable Key y Auto Lock and Awake ya que tienen las características más útiles para el trabajo diario. Esta última utiliza los infrarrojos para iniciar o cerrar sesión automáticamente si detecta a un usuario frente a la cámara, de forma similar a los modelos de gama alta de Dell Latitude. A continuación se muestran algunas capturas de pantalla de algunos de los programas.

Procesador
De los tres portátiles que hemos probado hasta ahora con el Core i7-1265Unuestro Dragonfly G3 es el más lento con bastante margen. El Core i7-1265U del Dell Latitude 9430 2-en-1 supera a nuestro HP en un 20 y un 50 por ciento en las pruebas de un solo hilo y de varios hilos, respectivamente. De hecho, el Core i7-1255U de nuestro Spectre x360 13.5 es un 40 por ciento más rápido que nuestro Dragonfly G3 con Core i7-1265U, incluso después de tener en cuenta cualquier ralentización del rendimiento
Ejecutar CineBench R15 xT en un bucle revela un potencial limitado de Turbo Boost, ya que el rendimiento de la CPU caería un 19% después del primer bucle. La misma CPU en el Latitude 7330 es capaz de mantener puntuaciones más altas y, por tanto, un rendimiento más rápido durante más tiempo cuando se somete a la misma prueba en bucle, como se muestra en nuestro gráfico de comparación a continuación
Se espera que el cambio al Core i5-1235U desde nuestro Core i7-1265U afecte al rendimiento en un 25 por ciento.
Cinebench R15 Multi Loop
Cinebench R23: Multi Core | Single Core
Cinebench R15: CPU Multi 64Bit | CPU Single 64Bit
Blender: v2.79 BMW27 CPU
7-Zip 18.03: 7z b 4 | 7z b 4 -mmt1
Geekbench 5.5: Multi-Core | Single-Core
HWBOT x265 Benchmark v2.2: 4k Preset
LibreOffice : 20 Documents To PDF
R Benchmark 2.5: Overall mean
Cinebench R23: Multi Core | Single Core
Cinebench R15: CPU Multi 64Bit | CPU Single 64Bit
Blender: v2.79 BMW27 CPU
7-Zip 18.03: 7z b 4 | 7z b 4 -mmt1
Geekbench 5.5: Multi-Core | Single-Core
HWBOT x265 Benchmark v2.2: 4k Preset
LibreOffice : 20 Documents To PDF
R Benchmark 2.5: Overall mean
* ... más pequeño es mejor
AIDA64: FP32 Ray-Trace | FPU Julia | CPU SHA3 | CPU Queen | FPU SinJulia | FPU Mandel | CPU AES | CPU ZLib | FP64 Ray-Trace | CPU PhotoWorxx
| Performance rating | |
| Framework Laptop 13.5 12th Gen Intel | |
| Dell XPS 13 Plus 9320 i5-1240p | |
| Medio Intel Core i7-1265U | |
| HP Elite Dragonfly G3 | |
| Lenovo ThinkPad X1 Titanium Yoga G1 20QA001RGE | |
| AIDA64 / FP32 Ray-Trace | |
| Medio Intel Core i7-1265U (2619 - 8178, n=10) | |
| HP Elite Dragonfly G3 | |
| Framework Laptop 13.5 12th Gen Intel | |
| Dell XPS 13 Plus 9320 i5-1240p | |
| Lenovo ThinkPad X1 Titanium Yoga G1 20QA001RGE | |
| AIDA64 / FPU Julia | |
| Medio Intel Core i7-1265U (12909 - 41649, n=10) | |
| HP Elite Dragonfly G3 | |
| Framework Laptop 13.5 12th Gen Intel | |
| Dell XPS 13 Plus 9320 i5-1240p | |
| Lenovo ThinkPad X1 Titanium Yoga G1 20QA001RGE | |
| AIDA64 / CPU SHA3 | |
| Framework Laptop 13.5 12th Gen Intel | |
| Dell XPS 13 Plus 9320 i5-1240p | |
| Medio Intel Core i7-1265U (824 - 2183, n=10) | |
| HP Elite Dragonfly G3 | |
| Lenovo ThinkPad X1 Titanium Yoga G1 20QA001RGE | |
| AIDA64 / CPU Queen | |
| Framework Laptop 13.5 12th Gen Intel | |
| Dell XPS 13 Plus 9320 i5-1240p | |
| Medio Intel Core i7-1265U (63615 - 67065, n=10) | |
| HP Elite Dragonfly G3 | |
| Lenovo ThinkPad X1 Titanium Yoga G1 20QA001RGE | |
| AIDA64 / FPU SinJulia | |
| Framework Laptop 13.5 12th Gen Intel | |
| Dell XPS 13 Plus 9320 i5-1240p | |
| Medio Intel Core i7-1265U (3105 - 5135, n=10) | |
| HP Elite Dragonfly G3 | |
| Lenovo ThinkPad X1 Titanium Yoga G1 20QA001RGE | |
| AIDA64 / FPU Mandel | |
| Medio Intel Core i7-1265U (6967 - 20804, n=10) | |
| HP Elite Dragonfly G3 | |
| Framework Laptop 13.5 12th Gen Intel | |
| Dell XPS 13 Plus 9320 i5-1240p | |
| Lenovo ThinkPad X1 Titanium Yoga G1 20QA001RGE | |
| AIDA64 / CPU AES | |
| Framework Laptop 13.5 12th Gen Intel | |
| Lenovo ThinkPad X1 Titanium Yoga G1 20QA001RGE | |
| Dell XPS 13 Plus 9320 i5-1240p | |
| Medio Intel Core i7-1265U (19489 - 42966, n=10) | |
| HP Elite Dragonfly G3 | |
| AIDA64 / CPU ZLib | |
| Framework Laptop 13.5 12th Gen Intel | |
| Dell XPS 13 Plus 9320 i5-1240p | |
| Medio Intel Core i7-1265U (314 - 632, n=10) | |
| HP Elite Dragonfly G3 | |
| Lenovo ThinkPad X1 Titanium Yoga G1 20QA001RGE | |
| AIDA64 / FP64 Ray-Trace | |
| Medio Intel Core i7-1265U (1473 - 4376, n=10) | |
| HP Elite Dragonfly G3 | |
| Framework Laptop 13.5 12th Gen Intel | |
| Dell XPS 13 Plus 9320 i5-1240p | |
| Lenovo ThinkPad X1 Titanium Yoga G1 20QA001RGE | |
| AIDA64 / CPU PhotoWorxx | |
| Lenovo ThinkPad X1 Titanium Yoga G1 20QA001RGE | |
| HP Elite Dragonfly G3 | |
| Dell XPS 13 Plus 9320 i5-1240p | |
| Medio Intel Core i7-1265U (20213 - 47031, n=10) | |
| Framework Laptop 13.5 12th Gen Intel | |
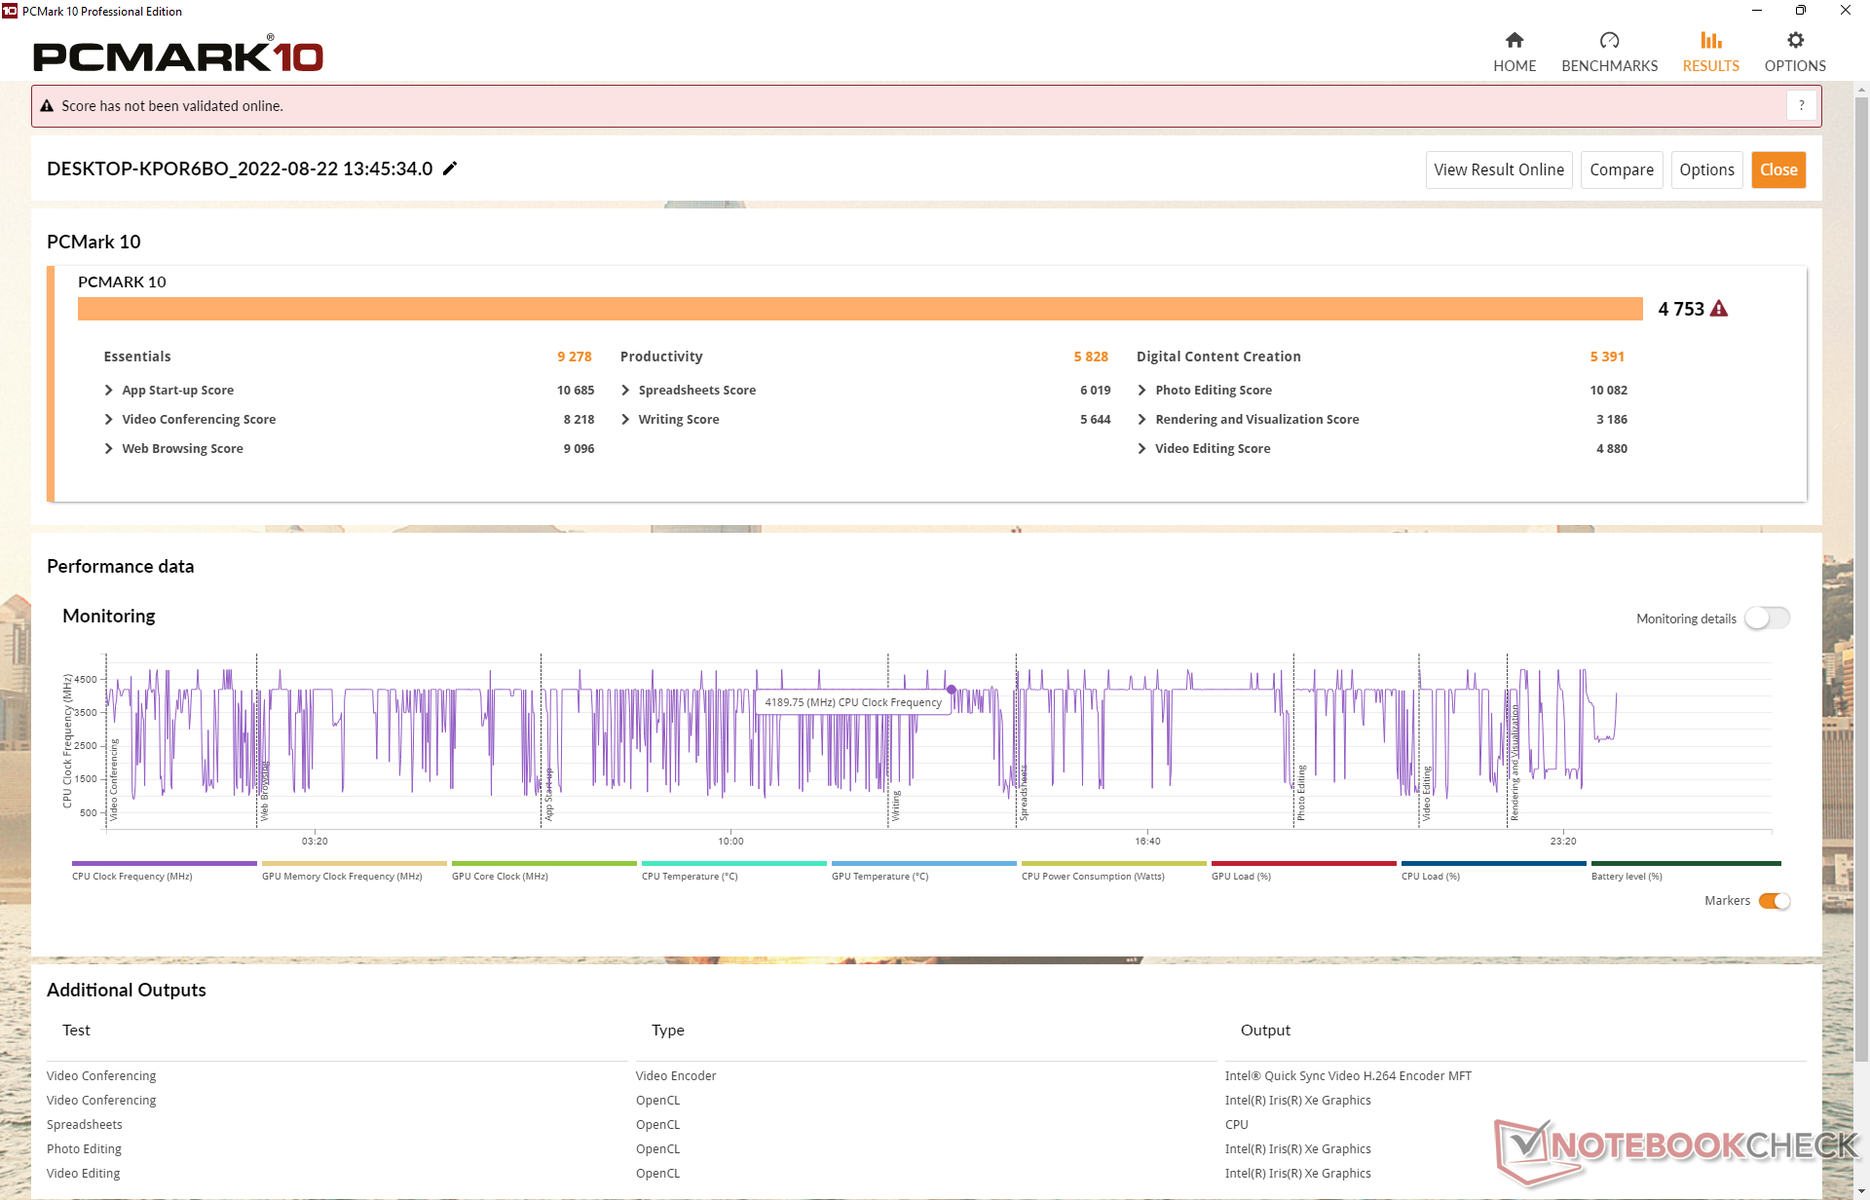
Rendimiento del sistema
Curiosamente, los resultados de PCMark son ligeramente inferiores a los que registramos en el Spectre x360 14 equipado con la CPU Core i7 de última generación. No esperes que el Dragonfly G3 sea tangiblemente más rápido al navegar, hacer streaming de vídeo o ejecutar otras cargas de trabajo poco exigentes.
CrossMark: Overall | Productivity | Creativity | Responsiveness
| PCMark 10 / Score | |
| Framework Laptop 13.5 12th Gen Intel | |
| Medio Intel Core i7-1265U, Intel Iris Xe Graphics G7 96EUs (4753 - 5766, n=7) | |
| HP Spectre x360 14t-ea000 | |
| Dell XPS 13 Plus 9320 i5-1240p | |
| HP Elite Dragonfly G3 | |
| Lenovo ThinkPad X1 Titanium Yoga G1 20QA001RGE | |
| PCMark 10 / Essentials | |
| Framework Laptop 13.5 12th Gen Intel | |
| Medio Intel Core i7-1265U, Intel Iris Xe Graphics G7 96EUs (9278 - 11418, n=7) | |
| Lenovo ThinkPad X1 Titanium Yoga G1 20QA001RGE | |
| HP Spectre x360 14t-ea000 | |
| HP Elite Dragonfly G3 | |
| Dell XPS 13 Plus 9320 i5-1240p | |
| PCMark 10 / Productivity | |
| Framework Laptop 13.5 12th Gen Intel | |
| HP Spectre x360 14t-ea000 | |
| Medio Intel Core i7-1265U, Intel Iris Xe Graphics G7 96EUs (5828 - 7311, n=7) | |
| Lenovo ThinkPad X1 Titanium Yoga G1 20QA001RGE | |
| Dell XPS 13 Plus 9320 i5-1240p | |
| HP Elite Dragonfly G3 | |
| PCMark 10 / Digital Content Creation | |
| Framework Laptop 13.5 12th Gen Intel | |
| Medio Intel Core i7-1265U, Intel Iris Xe Graphics G7 96EUs (5127 - 6330, n=7) | |
| Dell XPS 13 Plus 9320 i5-1240p | |
| HP Elite Dragonfly G3 | |
| HP Spectre x360 14t-ea000 | |
| Lenovo ThinkPad X1 Titanium Yoga G1 20QA001RGE | |
| CrossMark / Overall | |
| Framework Laptop 13.5 12th Gen Intel | |
| Medio Intel Core i7-1265U, Intel Iris Xe Graphics G7 96EUs (1301 - 1615, n=7) | |
| Dell XPS 13 Plus 9320 i5-1240p | |
| HP Elite Dragonfly G3 | |
| CrossMark / Productivity | |
| Framework Laptop 13.5 12th Gen Intel | |
| Medio Intel Core i7-1265U, Intel Iris Xe Graphics G7 96EUs (1230 - 1586, n=7) | |
| Dell XPS 13 Plus 9320 i5-1240p | |
| HP Elite Dragonfly G3 | |
| CrossMark / Creativity | |
| Framework Laptop 13.5 12th Gen Intel | |
| Medio Intel Core i7-1265U, Intel Iris Xe Graphics G7 96EUs (1413 - 1706, n=7) | |
| Dell XPS 13 Plus 9320 i5-1240p | |
| HP Elite Dragonfly G3 | |
| CrossMark / Responsiveness | |
| Framework Laptop 13.5 12th Gen Intel | |
| Medio Intel Core i7-1265U, Intel Iris Xe Graphics G7 96EUs (1193 - 1521, n=7) | |
| Dell XPS 13 Plus 9320 i5-1240p | |
| HP Elite Dragonfly G3 | |
| PCMark 10 Score | 4753 puntos | |
ayuda | ||
| AIDA64 / Memory Copy | |
| HP Elite Dragonfly G3 | |
| Dell XPS 13 Plus 9320 i5-1240p | |
| Medio Intel Core i7-1265U (40212 - 72204, n=10) | |
| Lenovo ThinkPad X1 Titanium Yoga G1 20QA001RGE | |
| Framework Laptop 13.5 12th Gen Intel | |
| AIDA64 / Memory Read | |
| Dell XPS 13 Plus 9320 i5-1240p | |
| HP Elite Dragonfly G3 | |
| Lenovo ThinkPad X1 Titanium Yoga G1 20QA001RGE | |
| Medio Intel Core i7-1265U (41808 - 69493, n=10) | |
| Framework Laptop 13.5 12th Gen Intel | |
| AIDA64 / Memory Write | |
| Lenovo ThinkPad X1 Titanium Yoga G1 20QA001RGE | |
| Dell XPS 13 Plus 9320 i5-1240p | |
| Medio Intel Core i7-1265U (41382 - 76027, n=10) | |
| HP Elite Dragonfly G3 | |
| Framework Laptop 13.5 12th Gen Intel | |
| AIDA64 / Memory Latency | |
| HP Elite Dragonfly G3 | |
| Medio Intel Core i7-1265U (74.6 - 112.4, n=10) | |
| Lenovo ThinkPad X1 Titanium Yoga G1 20QA001RGE | |
| Framework Laptop 13.5 12th Gen Intel | |
* ... más pequeño es mejor
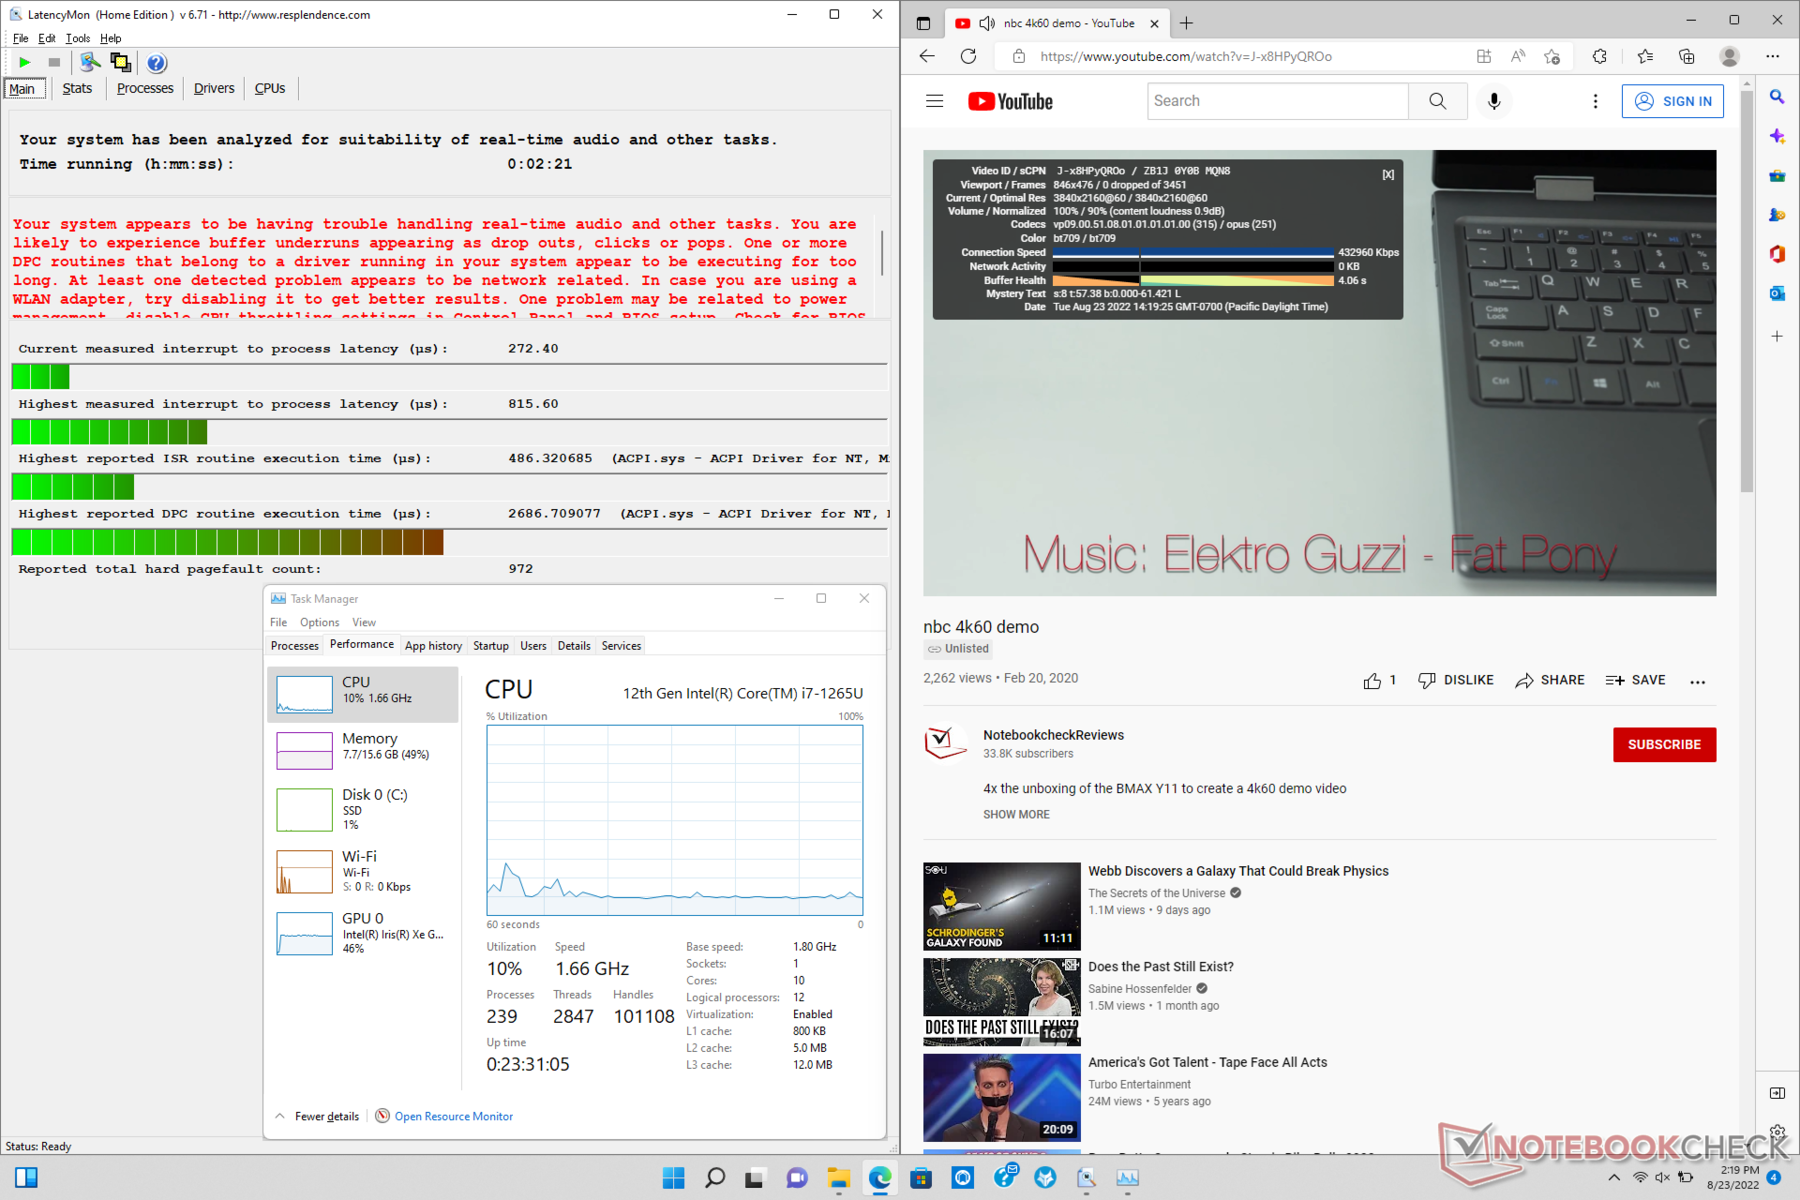
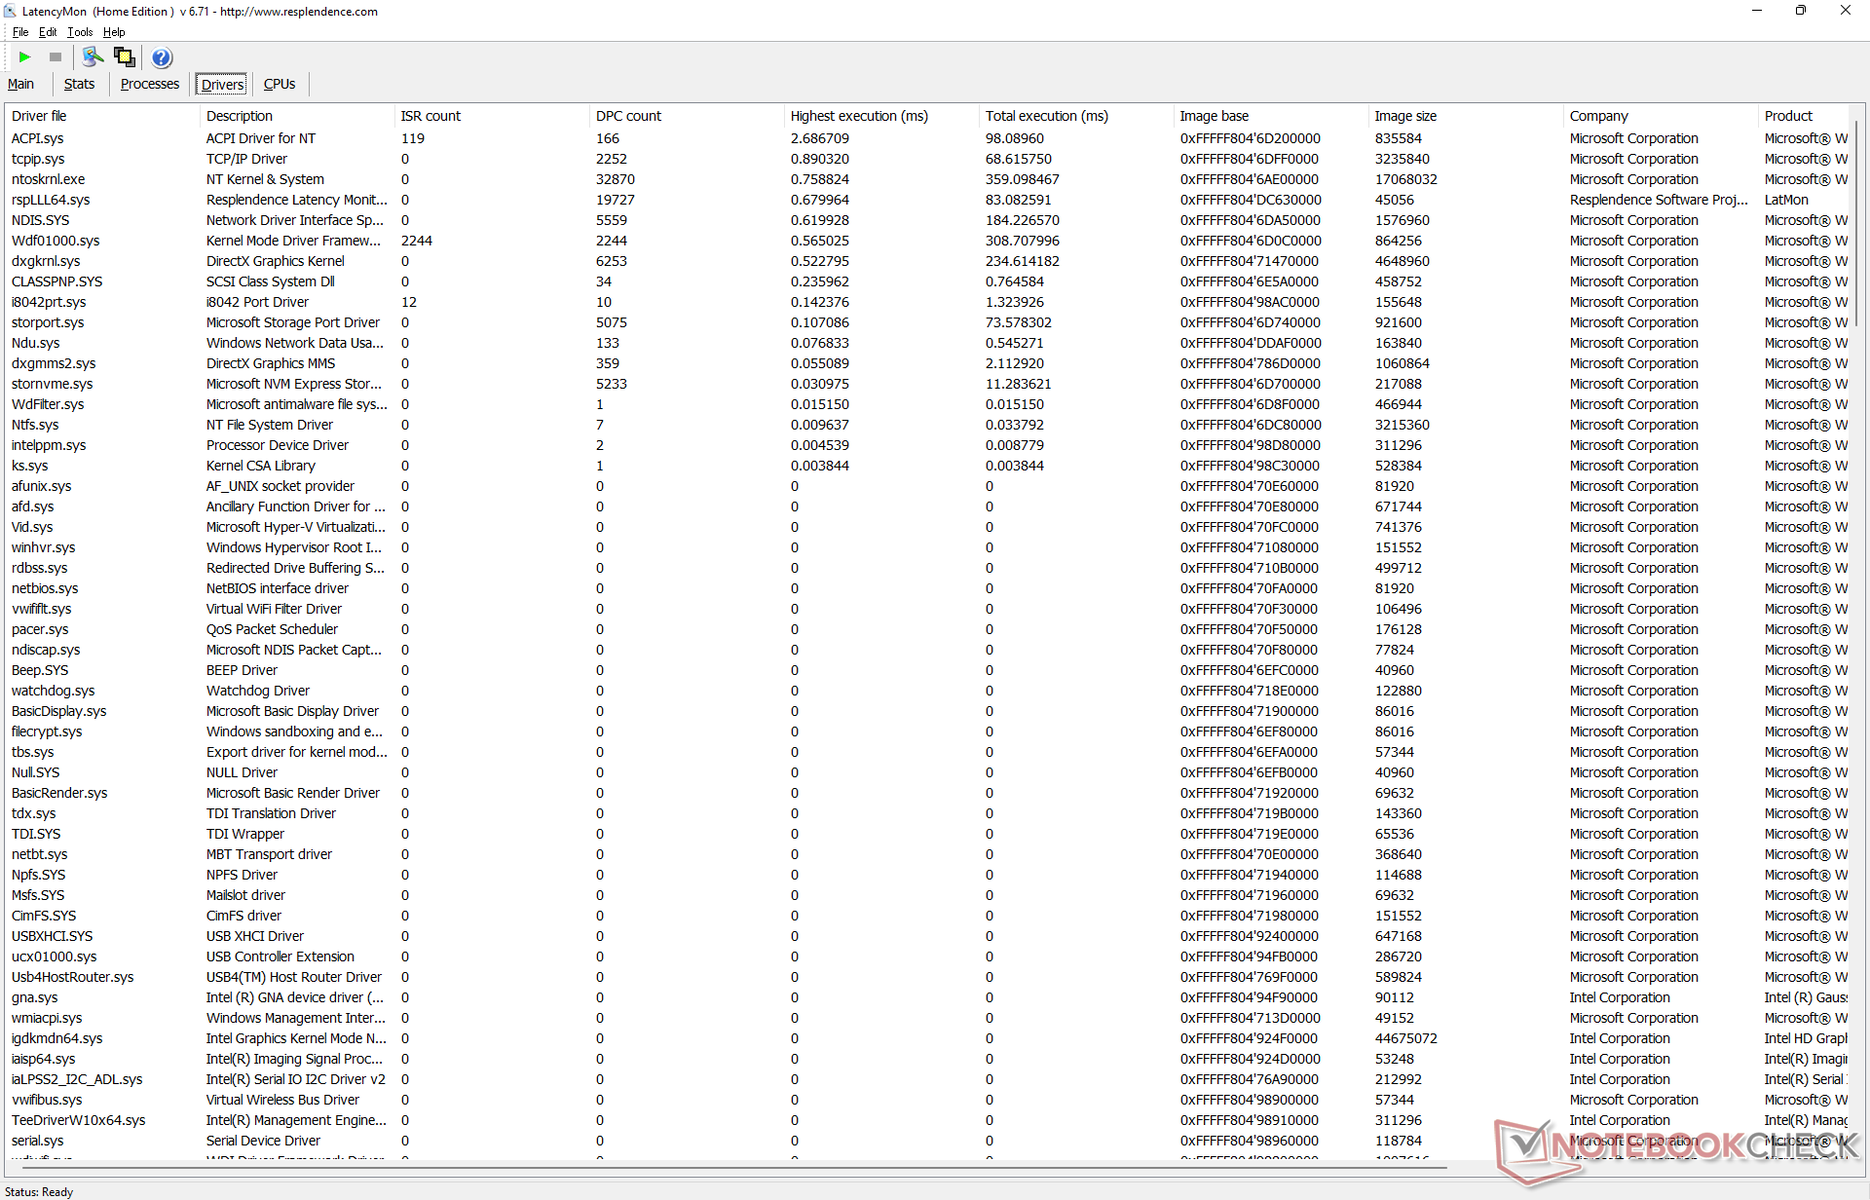
Latencia del CPD
LatencyMon revela problemas de CPD al abrir varias pestañas del navegador de nuestra página web. por lo demás, la reproducción de vídeo 4K a 60 FPS es perfecta, sin caídas de frames durante nuestras pruebas.
| DPC Latencies / LatencyMon - interrupt to process latency (max), Web, Youtube, Prime95 | |
| Dell XPS 13 Plus 9320 i5-1240p | |
| HP Spectre x360 14t-ea000 | |
| Lenovo ThinkPad X1 Titanium Yoga G1 20QA001RGE | |
| Framework Laptop 13.5 12th Gen Intel | |
| HP Elite Dragonfly G3 | |
* ... más pequeño es mejor
Dispositivos de almacenamiento
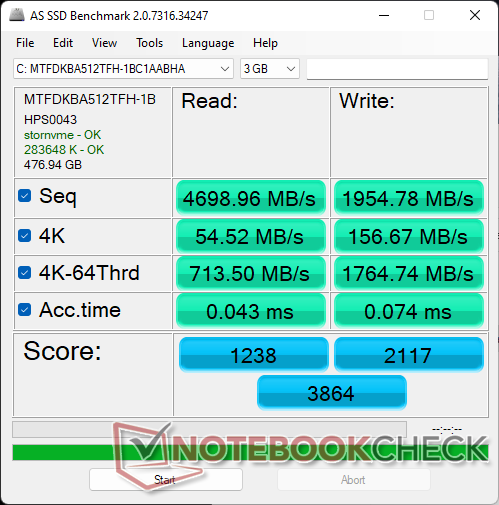
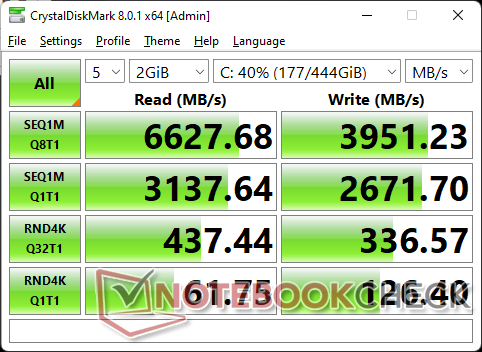
HP ofrece opciones de SSD que van desde 256 GB a 1 TB OPAL2 NVMe. Nuestra configuración específica viene con el 512 GB Micron MTFDKBA512TFH PCIe4 SSD para velocidades de lectura y escritura secuenciales de unos 6500 MB/s y 4000 MB/s, respectivamente. La unidad no mostró problemas importantes de rendimiento al ejecutar DiskSpd en un bucle.

* ... más pequeño es mejor
Disk Throttling: DiskSpd Read Loop, Queue Depth 8
Rendimiento de la GPU
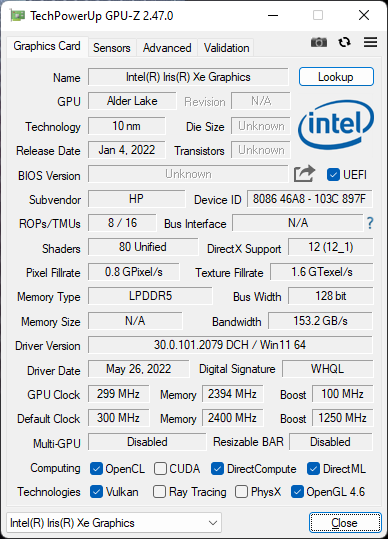
El sistema integrado Iris Xe 96 EUs está rindiendo donde esperamos que lo haga en relación a otros portátiles con la misma GPU. Esto es genial, ya que significa que HP no ha reducido artificialmente el rendimiento gráfico, pero también es decepcionante, ya que significa que los usuarios no deberían esperar ninguna mejora significativa de la GPU respecto a la última generación de Core i7-1165G7.
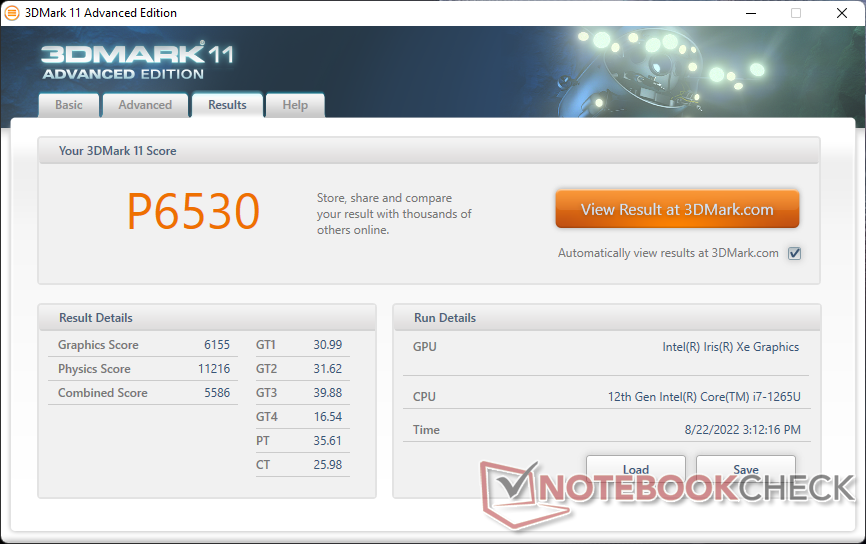
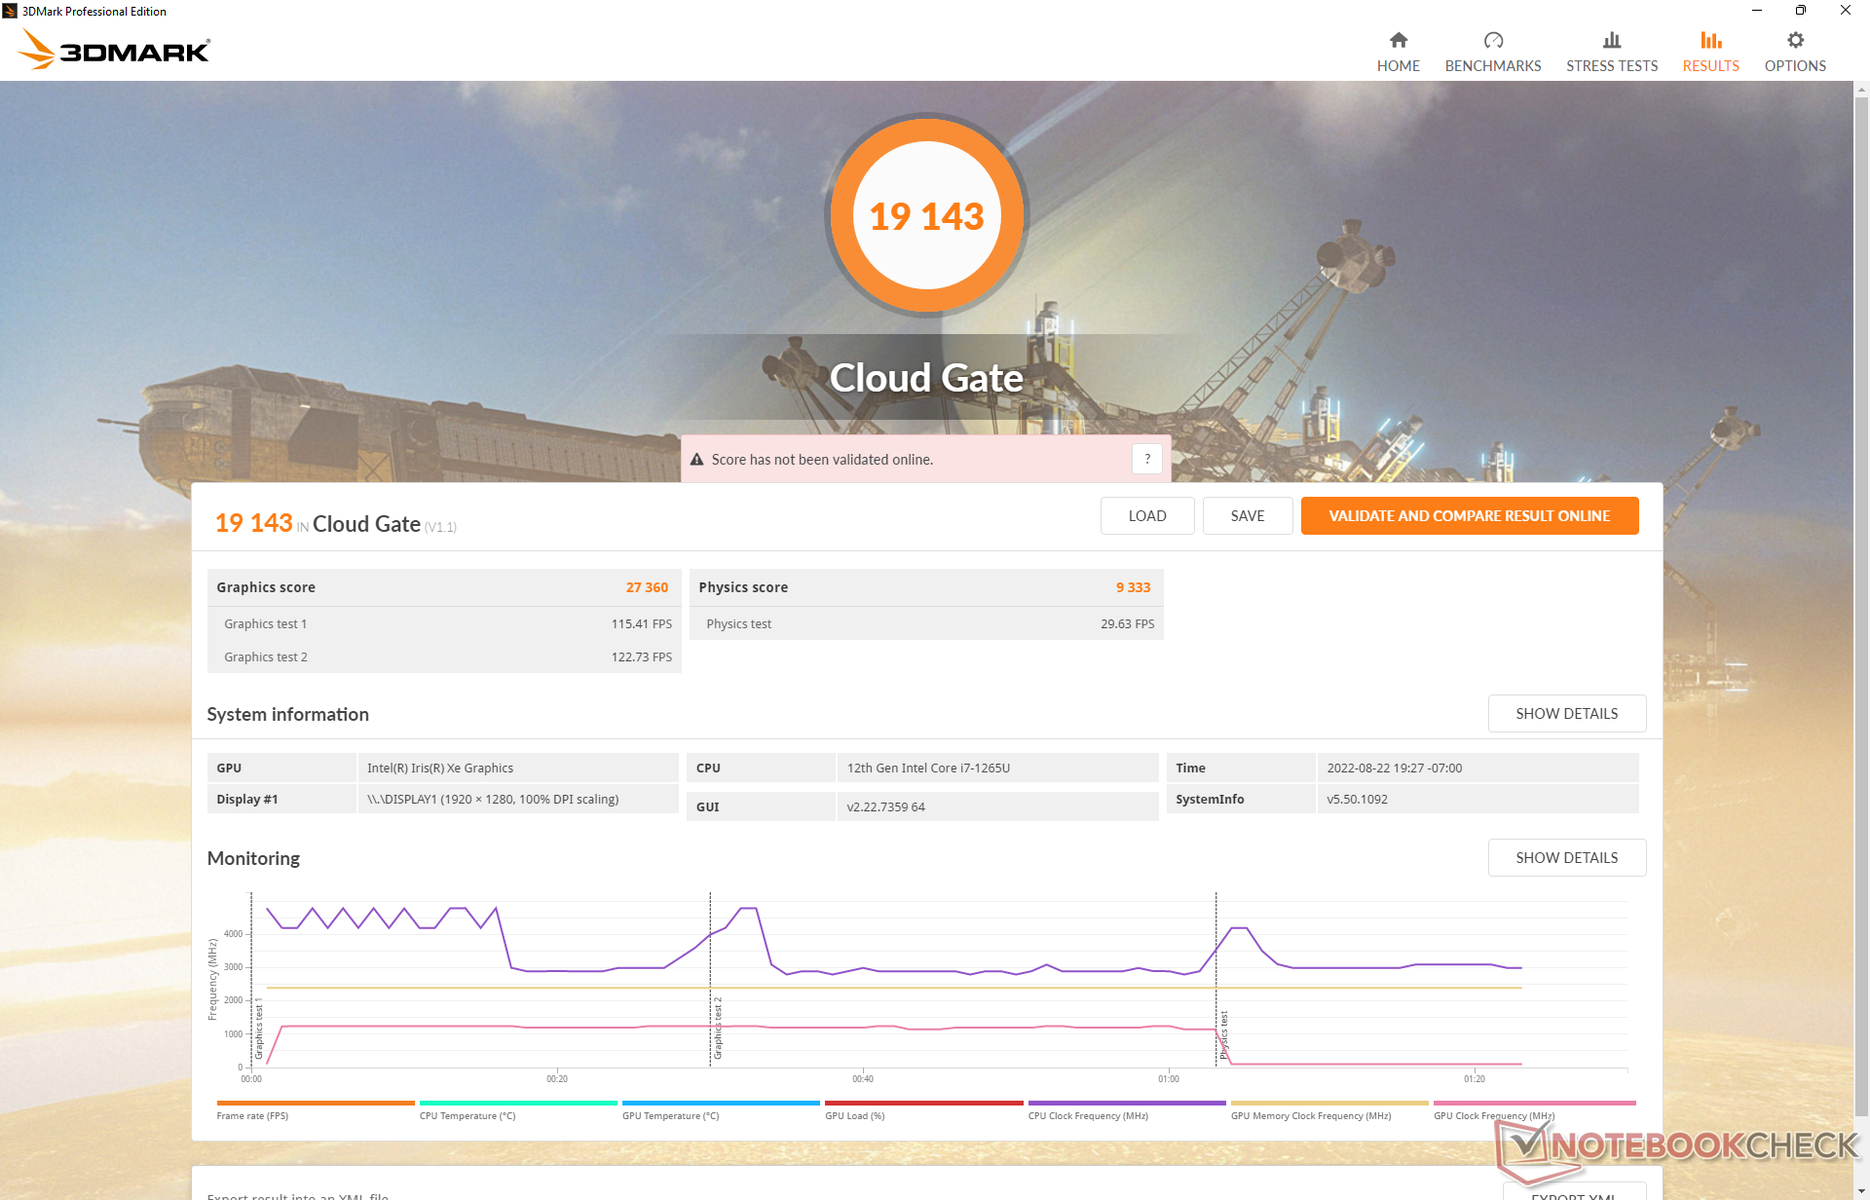
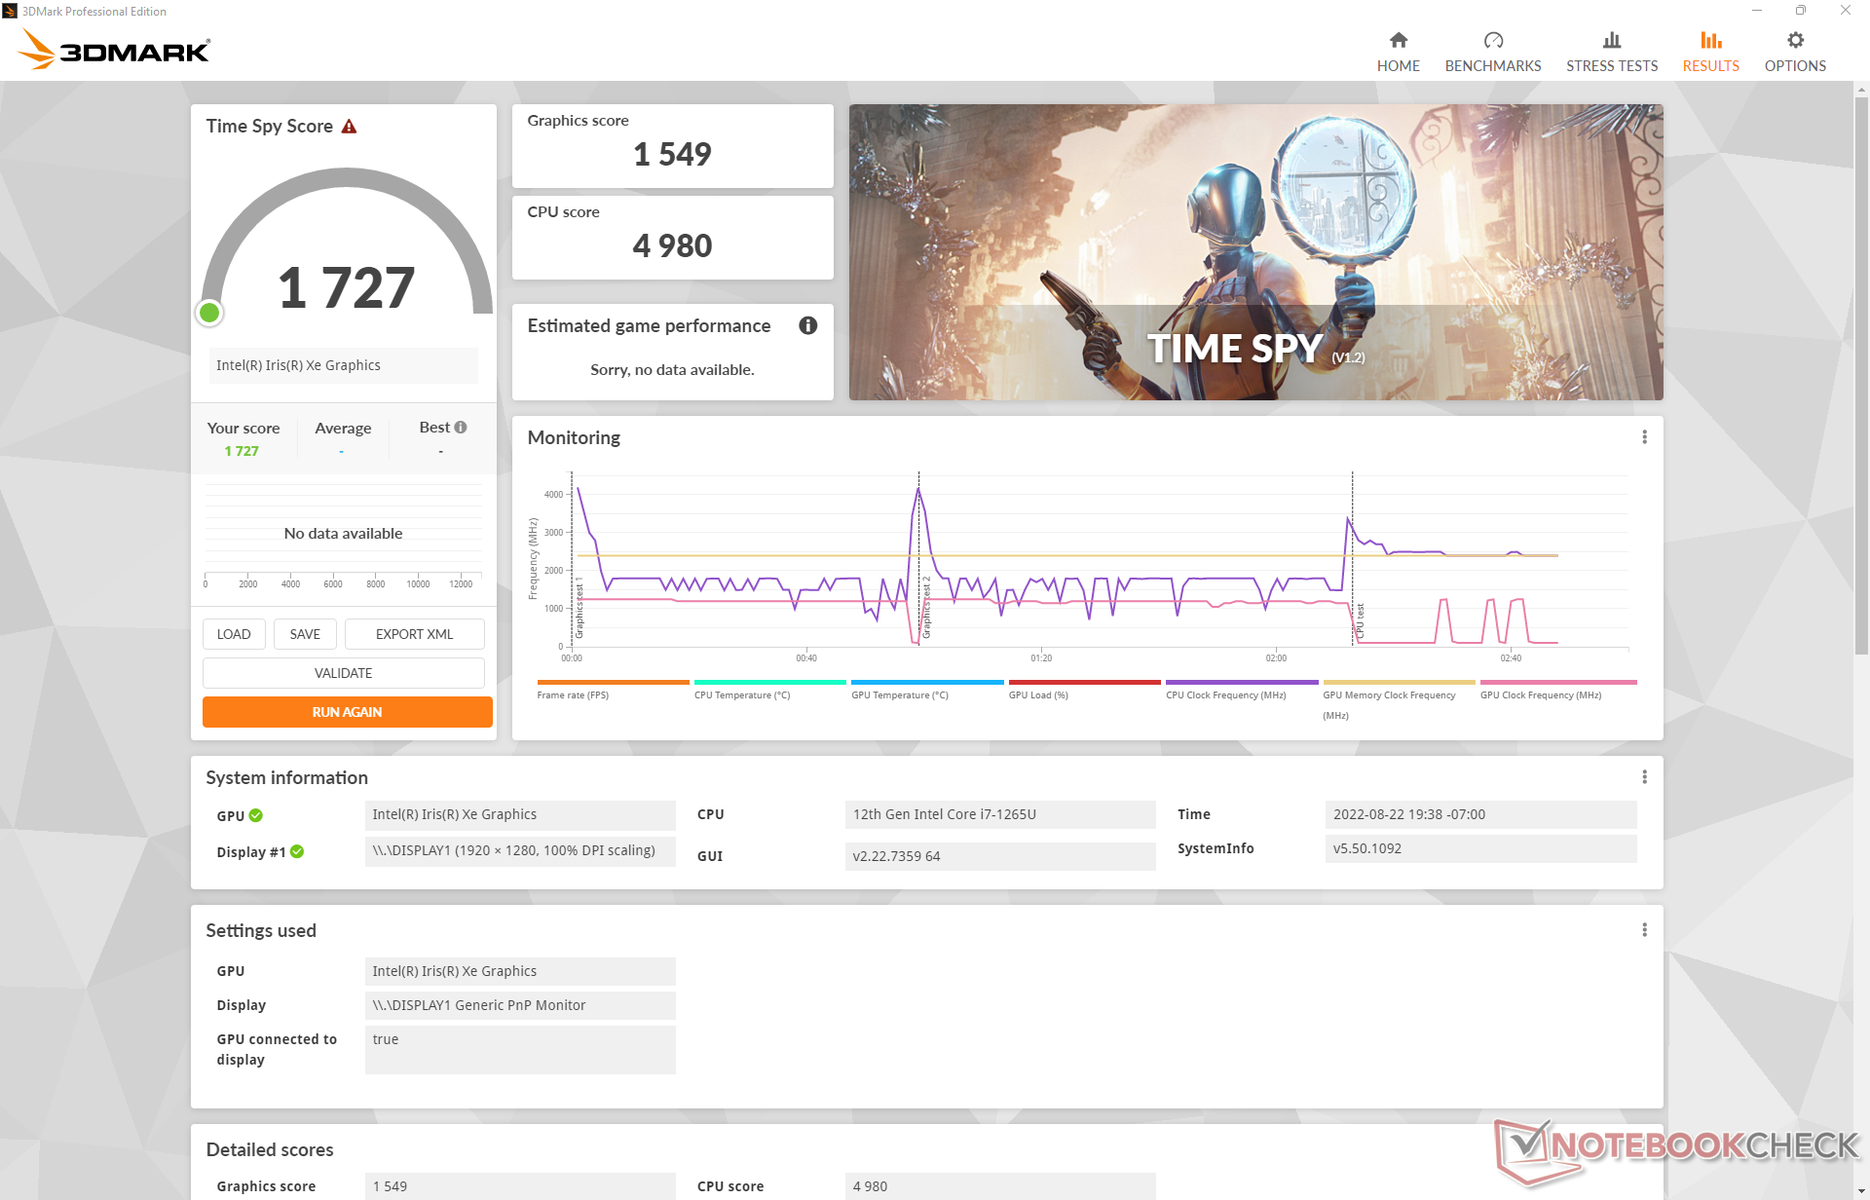
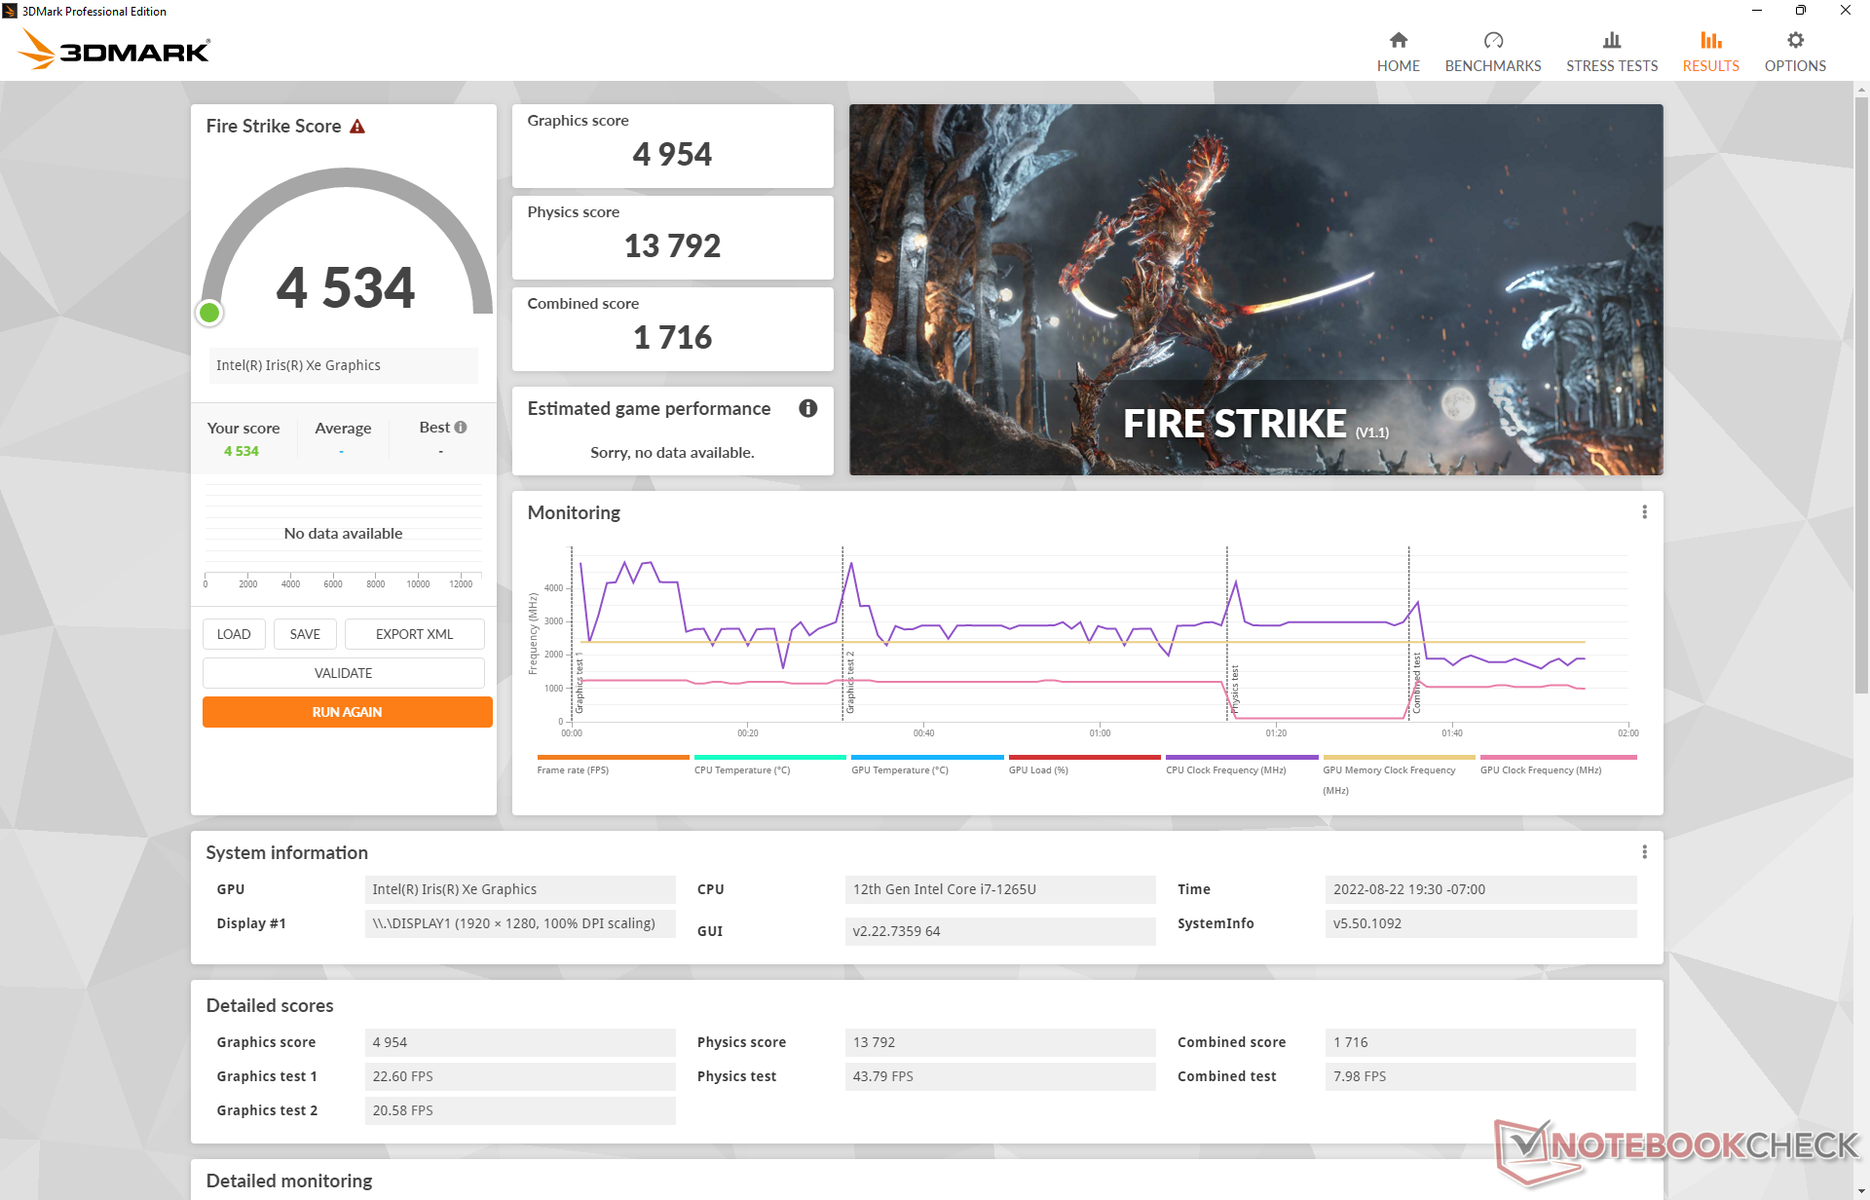
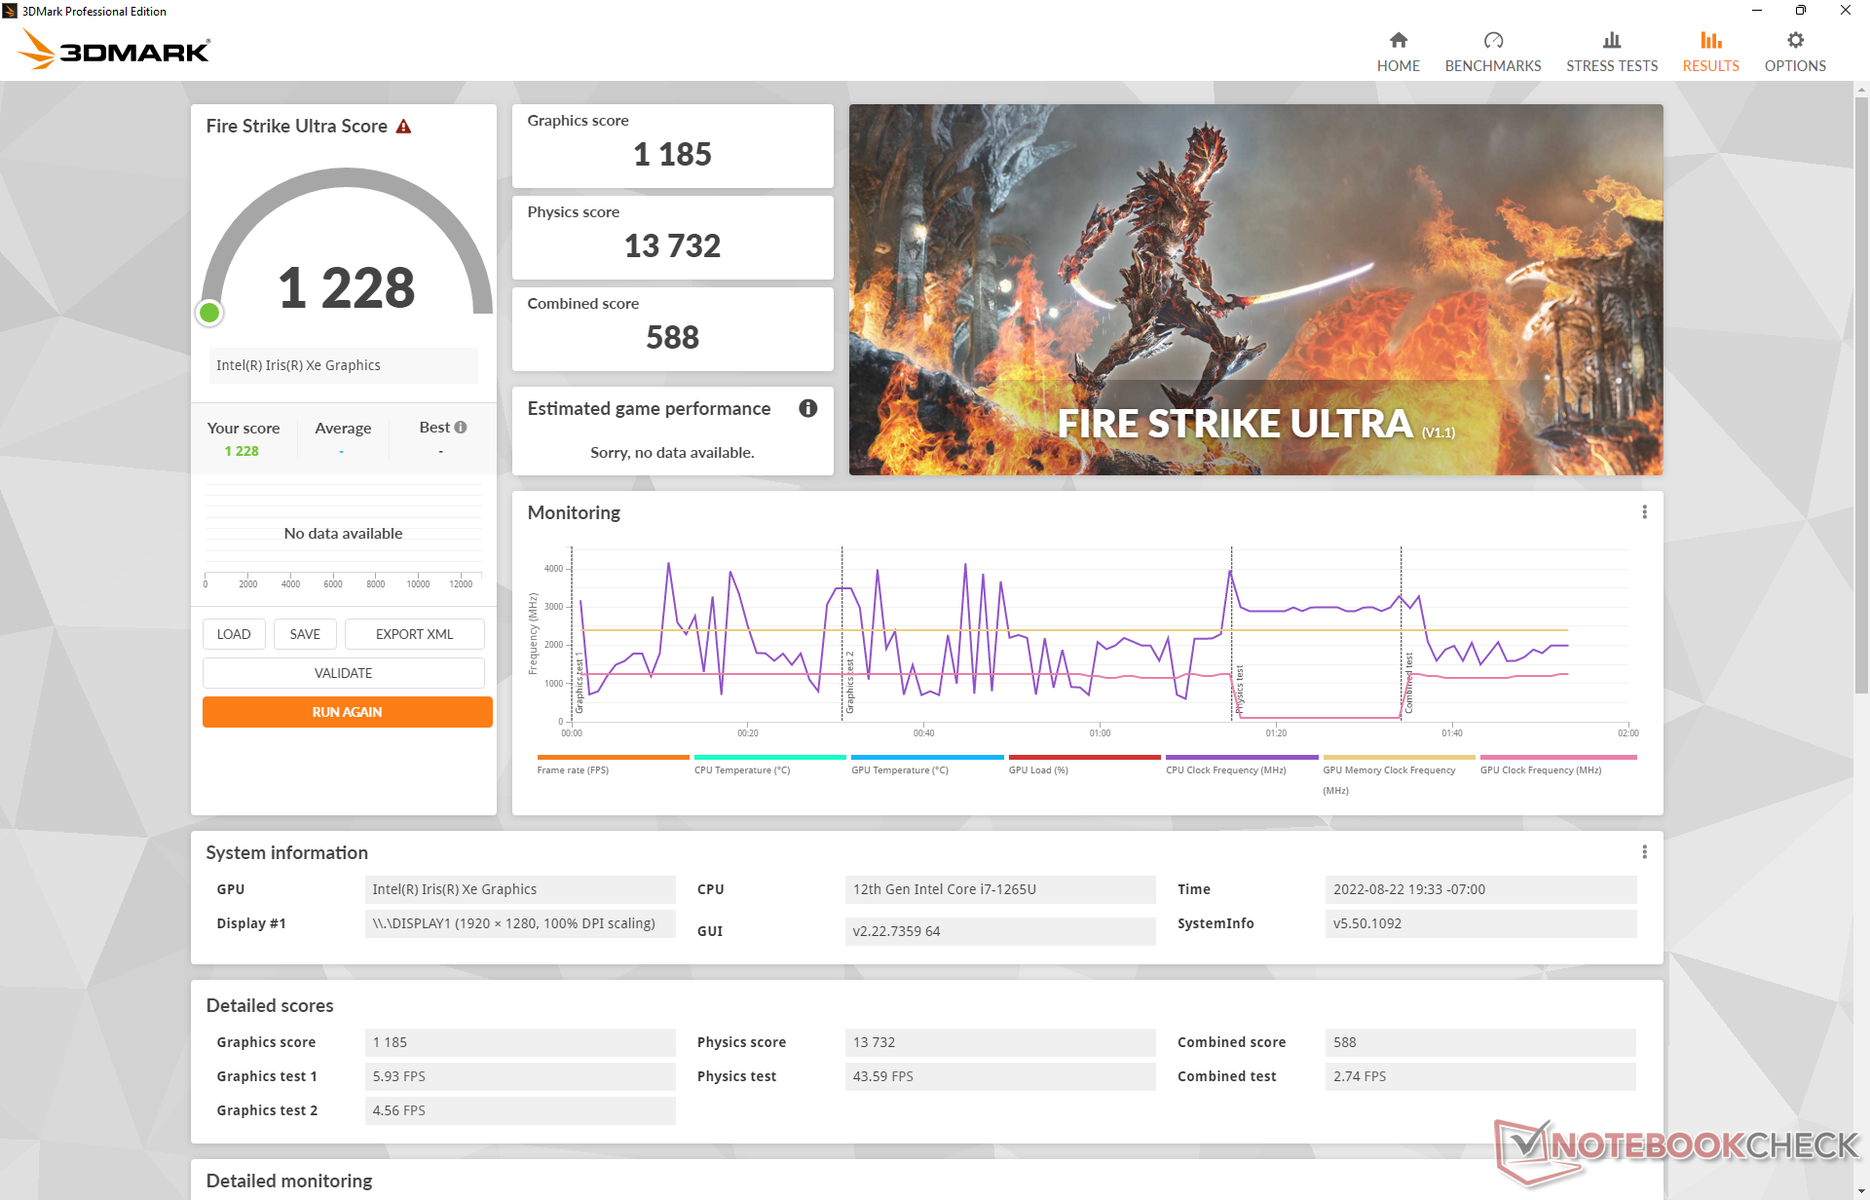
| 3DMark 11 Performance | 6530 puntos | |
| 3DMark Cloud Gate Standard Score | 19143 puntos | |
| 3DMark Fire Strike Score | 4534 puntos | |
| 3DMark Time Spy Score | 1727 puntos | |
ayuda | ||
| Cyberpunk 2077 1.6 | |
| 1920x1080 Low Preset | |
| Framework Laptop 13.5 12th Gen Intel | |
| HP Elite Dragonfly G3 | |
| Medio Intel Iris Xe Graphics G7 96EUs (13 - 25.9, n=42) | |
| 1920x1080 Medium Preset | |
| Framework Laptop 13.5 12th Gen Intel | |
| HP Elite Dragonfly G3 | |
| Medio Intel Iris Xe Graphics G7 96EUs (10.8 - 21.7, n=37) | |
| 1920x1080 High Preset | |
| Framework Laptop 13.5 12th Gen Intel | |
| HP Elite Dragonfly G3 | |
| Medio Intel Iris Xe Graphics G7 96EUs (9.8 - 16.9, n=34) | |
Witcher 3 FPS Chart
| bajo | medio | alto | ultra | |
|---|---|---|---|---|
| GTA V (2015) | 90.6 | 79.2 | 23.3 | 10.2 |
| The Witcher 3 (2015) | 76.1 | 52 | 28.4 | 13.8 |
| Dota 2 Reborn (2015) | 97.4 | 71.1 | 57 | 50.9 |
| Final Fantasy XV Benchmark (2018) | 39.7 | 22.7 | 15.8 | |
| X-Plane 11.11 (2018) | 37.3 | 34.7 | 31.2 | |
| Strange Brigade (2018) | 84.9 | 39.3 | 31.4 | 25.4 |
| Cyberpunk 2077 1.6 (2022) | 19.8 | 16.8 | 12.8 | 10.2 |
Emisiones - Súper silencioso
Ruido del sistema
En el Dragonfly Max, encontramos que el ruido del ventilador es más silencioso que la media, lo que coincide con su rendimiento de CPU más lento que la media. Esta tendencia continúa en el Dragonfly G3 para bien o para mal. En su nivel más alto, sólo pudimos registrar un ruido de ventilador de apenas 35 dB(A) en comparación con los 40 dB(A) o más de los modelos de la competencia, como muestra la tabla siguiente. Los usuarios que valoran el rendimiento de la CPU pueden sentirse decepcionados, mientras que a los que valoran los ventiladores más silenciosos no les importará que el procesador sea más lento.
Ruido
| Ocioso |
| 23.2 / 23.2 / 23.2 dB(A) |
| Carga |
| 25.1 / 35.2 dB(A) |
 | ||
30 dB silencioso 40 dB(A) audible 50 dB(A) ruidosamente alto |
||
min: | ||
| HP Elite Dragonfly G3 Iris Xe G7 96EUs, i7-1265U, Micron 3400 MTFDKBA512TFH 512GB | HP Spectre x360 14t-ea000 Iris Xe G7 96EUs, i7-1165G7, Samsung SSD PM981a MZVLB512HBJQ | Dell XPS 13 Plus 9320 i5-1240p Iris Xe G7 80EUs, i5-1240P, Micron 3400 MTFDKBA512TFH 512GB | Framework Laptop 13.5 12th Gen Intel Iris Xe G7 96EUs, i7-1260P, WDC PC SN730 SDBPNTY-512G | HP EliteBook Folio 13.5-3G2L2EA Adreno 680, SD 8cx Gen 2 5G, Toshiba XG6 KXG60ZNV512G | Lenovo ThinkPad X1 Titanium Yoga G1 20QA001RGE Iris Xe G7 96EUs, i7-1160G7, Toshiba BG4 KBG40ZNT512G | |
|---|---|---|---|---|---|---|
| Noise | -12% | -23% | -25% | -11% | ||
| apagado / medio ambiente * (dB) | 22.8 | 25.8 -13% | 26 -14% | 22.8 -0% | 25.1 -10% | |
| Idle Minimum * (dB) | 23.2 | 25.9 -12% | 26.2 -13% | 23 1% | 25.1 -8% | |
| Idle Average * (dB) | 23.2 | 25.9 -12% | 26.2 -13% | 23 1% | 25.1 -8% | |
| Idle Maximum * (dB) | 23.2 | 25.9 -12% | 26.2 -13% | 23 1% | 27.1 -17% | |
| Load Average * (dB) | 25.1 | 26.4 -5% | 38.4 -53% | 47.3 -88% | 32.7 -30% | |
| Witcher 3 ultra * (dB) | 32 | 36.9 -15% | 47.3 -48% | 32.7 -2% | ||
| Load Maximum * (dB) | 35.2 | 41.5 -18% | 47.1 -34% | 49.8 -41% | 35.8 -2% |
* ... más pequeño es mejor
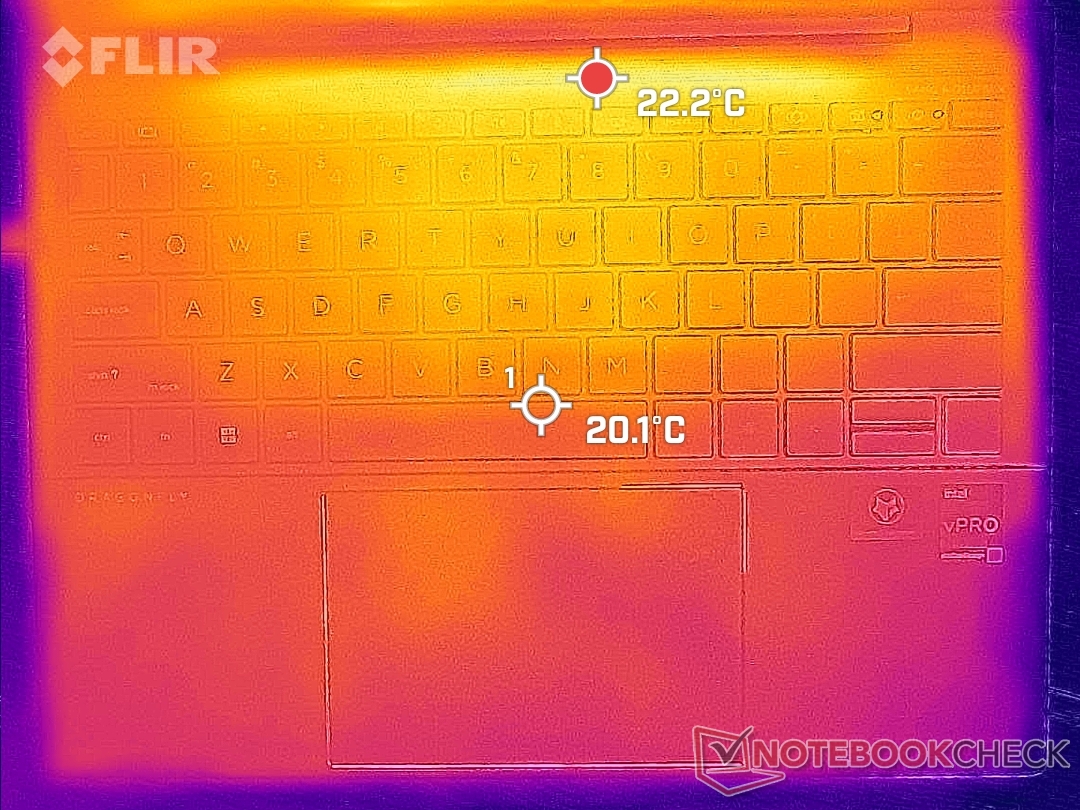
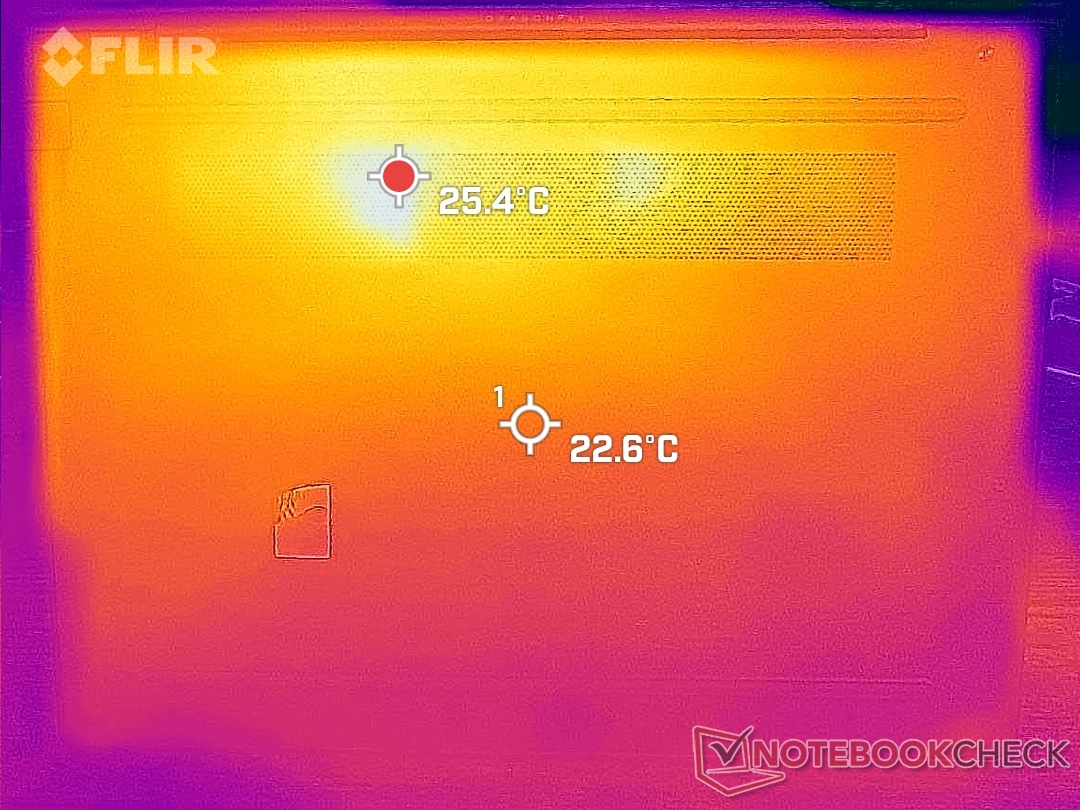
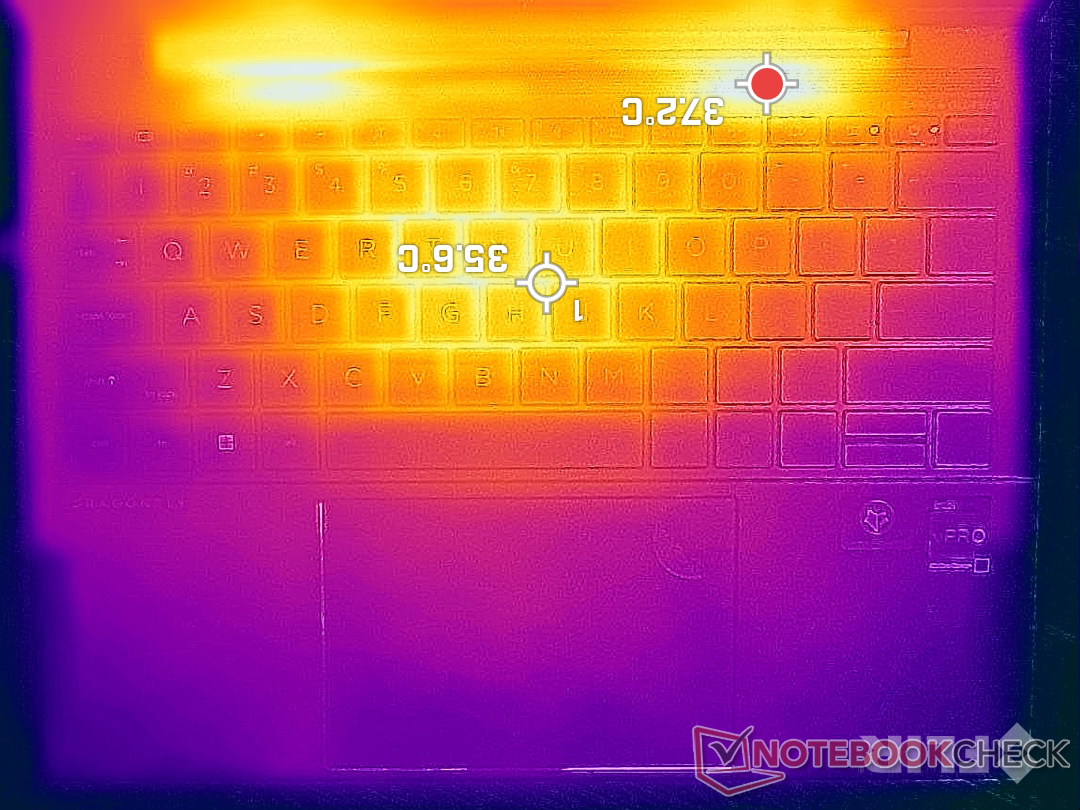
Temperatura
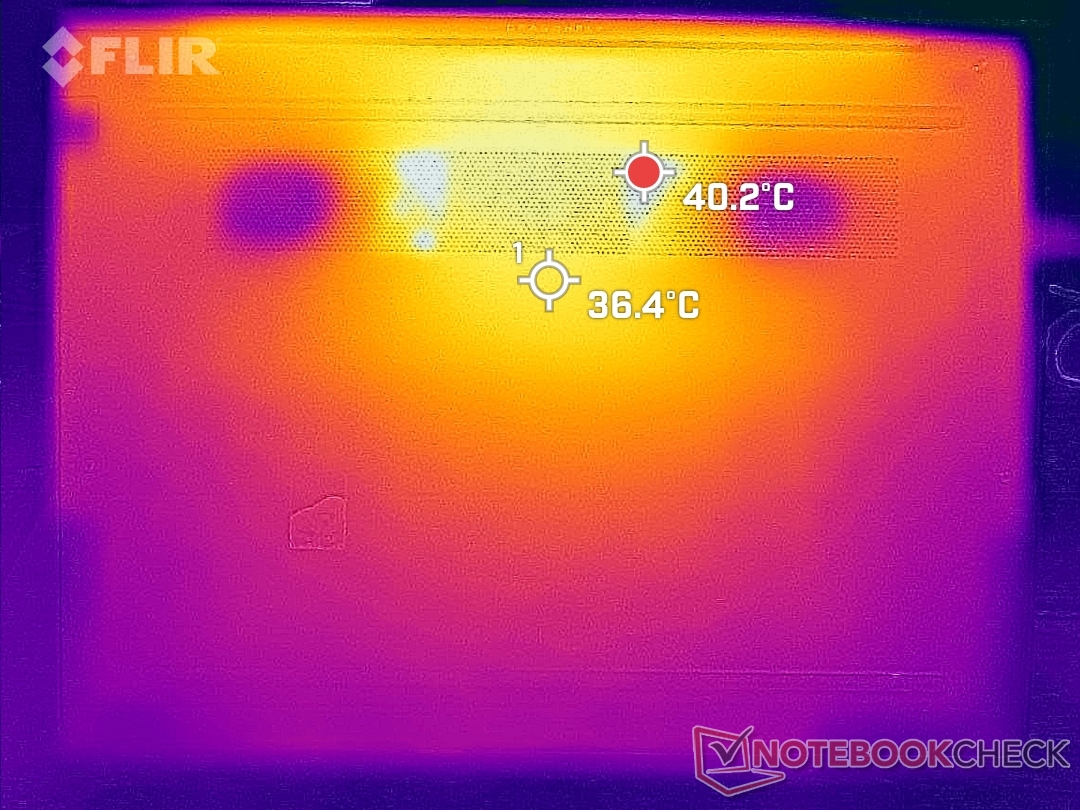
El gradiente de temperatura de la superficie es más simétrico que en el antiguo Dragonfly Max debido a la solución de refrigeración revisada. Esto significa que el punto caliente en el Dragonfly G3 está más cerca del centro del teclado en lugar de la mitad derecha del mismo. Estas áreas pueden llegar a calentarse hasta 40 C cuando se someten a altas cargas durante periodos prolongados, pero afortunadamente están hacia la parte trasera y en ningún lugar cerca de los reposamanos o del clickpad.
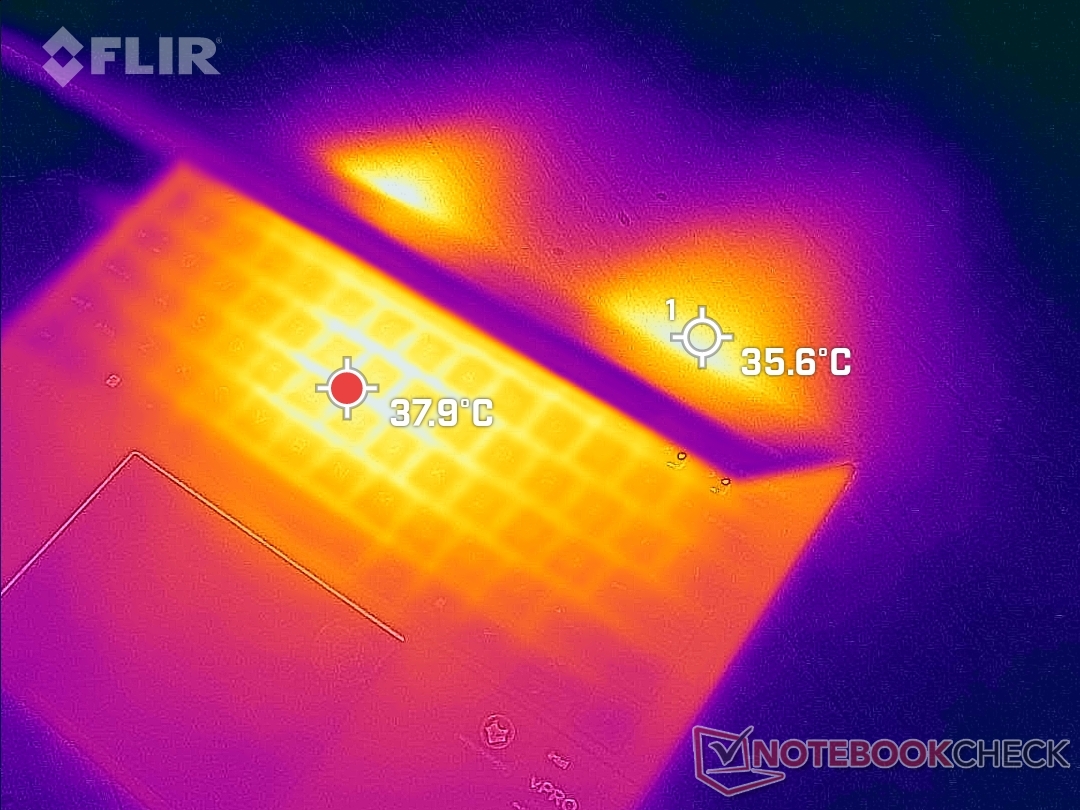
(+) La temperatura máxima en la parte superior es de 39 °C / 102 F, frente a la media de 34.3 °C / 94 F, que oscila entre 21.2 y 62.5 °C para la clase Office.
(±) El fondo se calienta hasta un máximo de 42.2 °C / 108 F, frente a la media de 36.8 °C / 98 F
(+) En reposo, la temperatura media de la parte superior es de 25.4 °C / 78# F, frente a la media del dispositivo de 29.5 °C / 85 F.
(+) El reposamanos y el panel táctil están a una temperatura inferior a la de la piel, con un máximo de 28.4 °C / 83.1 F y, por tanto, son fríos al tacto.
(±) La temperatura media de la zona del reposamanos de dispositivos similares fue de 27.5 °C / 81.5 F (-0.9 °C / -1.6 F).
| HP Elite Dragonfly G3 Intel Core i7-1265U, Intel Iris Xe Graphics G7 96EUs | HP Spectre x360 14t-ea000 Intel Core i7-1165G7, Intel Iris Xe Graphics G7 96EUs | Dell XPS 13 Plus 9320 i5-1240p Intel Core i5-1240P, Intel Iris Xe Graphics G7 80EUs | Framework Laptop 13.5 12th Gen Intel Intel Core i7-1260P, Intel Iris Xe Graphics G7 96EUs | HP EliteBook Folio 13.5-3G2L2EA Qualcomm Snapdragon 8cx Gen 2 5G, Qualcomm Adreno 680 | Lenovo ThinkPad X1 Titanium Yoga G1 20QA001RGE Intel Core i7-1160G7, Intel Iris Xe Graphics G7 96EUs | |
|---|---|---|---|---|---|---|
| Heat | -9% | -37% | 3% | 11% | -7% | |
| Maximum Upper Side * (°C) | 39 | 40.4 -4% | 47.6 -22% | 36.8 6% | 34.3 12% | 46.5 -19% |
| Maximum Bottom * (°C) | 42.2 | 52.8 -25% | 57 -35% | 42.4 -0% | 35.4 16% | 45.2 -7% |
| Idle Upper Side * (°C) | 26.8 | 27.2 -1% | 38.8 -45% | 24.2 10% | 25.7 4% | 27.3 -2% |
| Idle Bottom * (°C) | 28.2 | 29.2 -4% | 41 -45% | 29 -3% | 25.1 11% | 27.7 2% |
* ... más pequeño es mejor
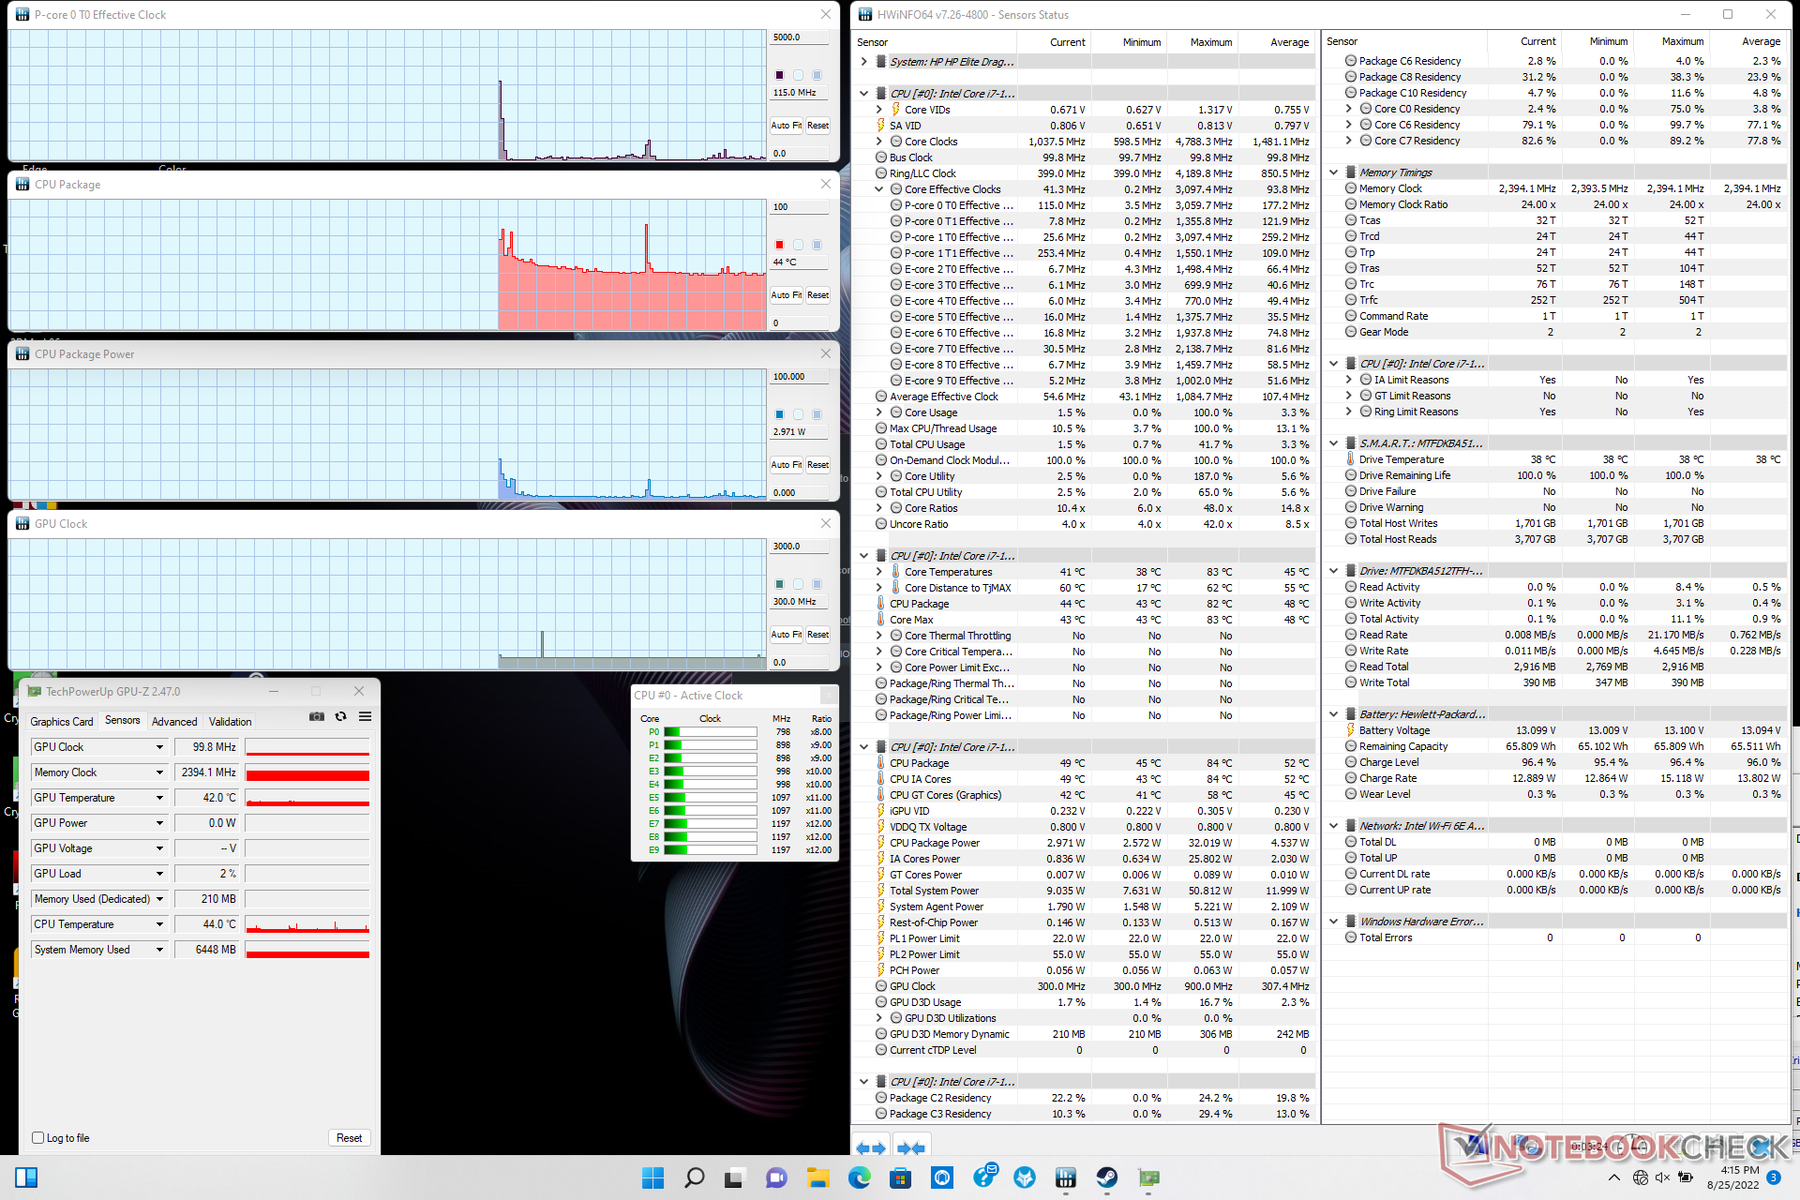
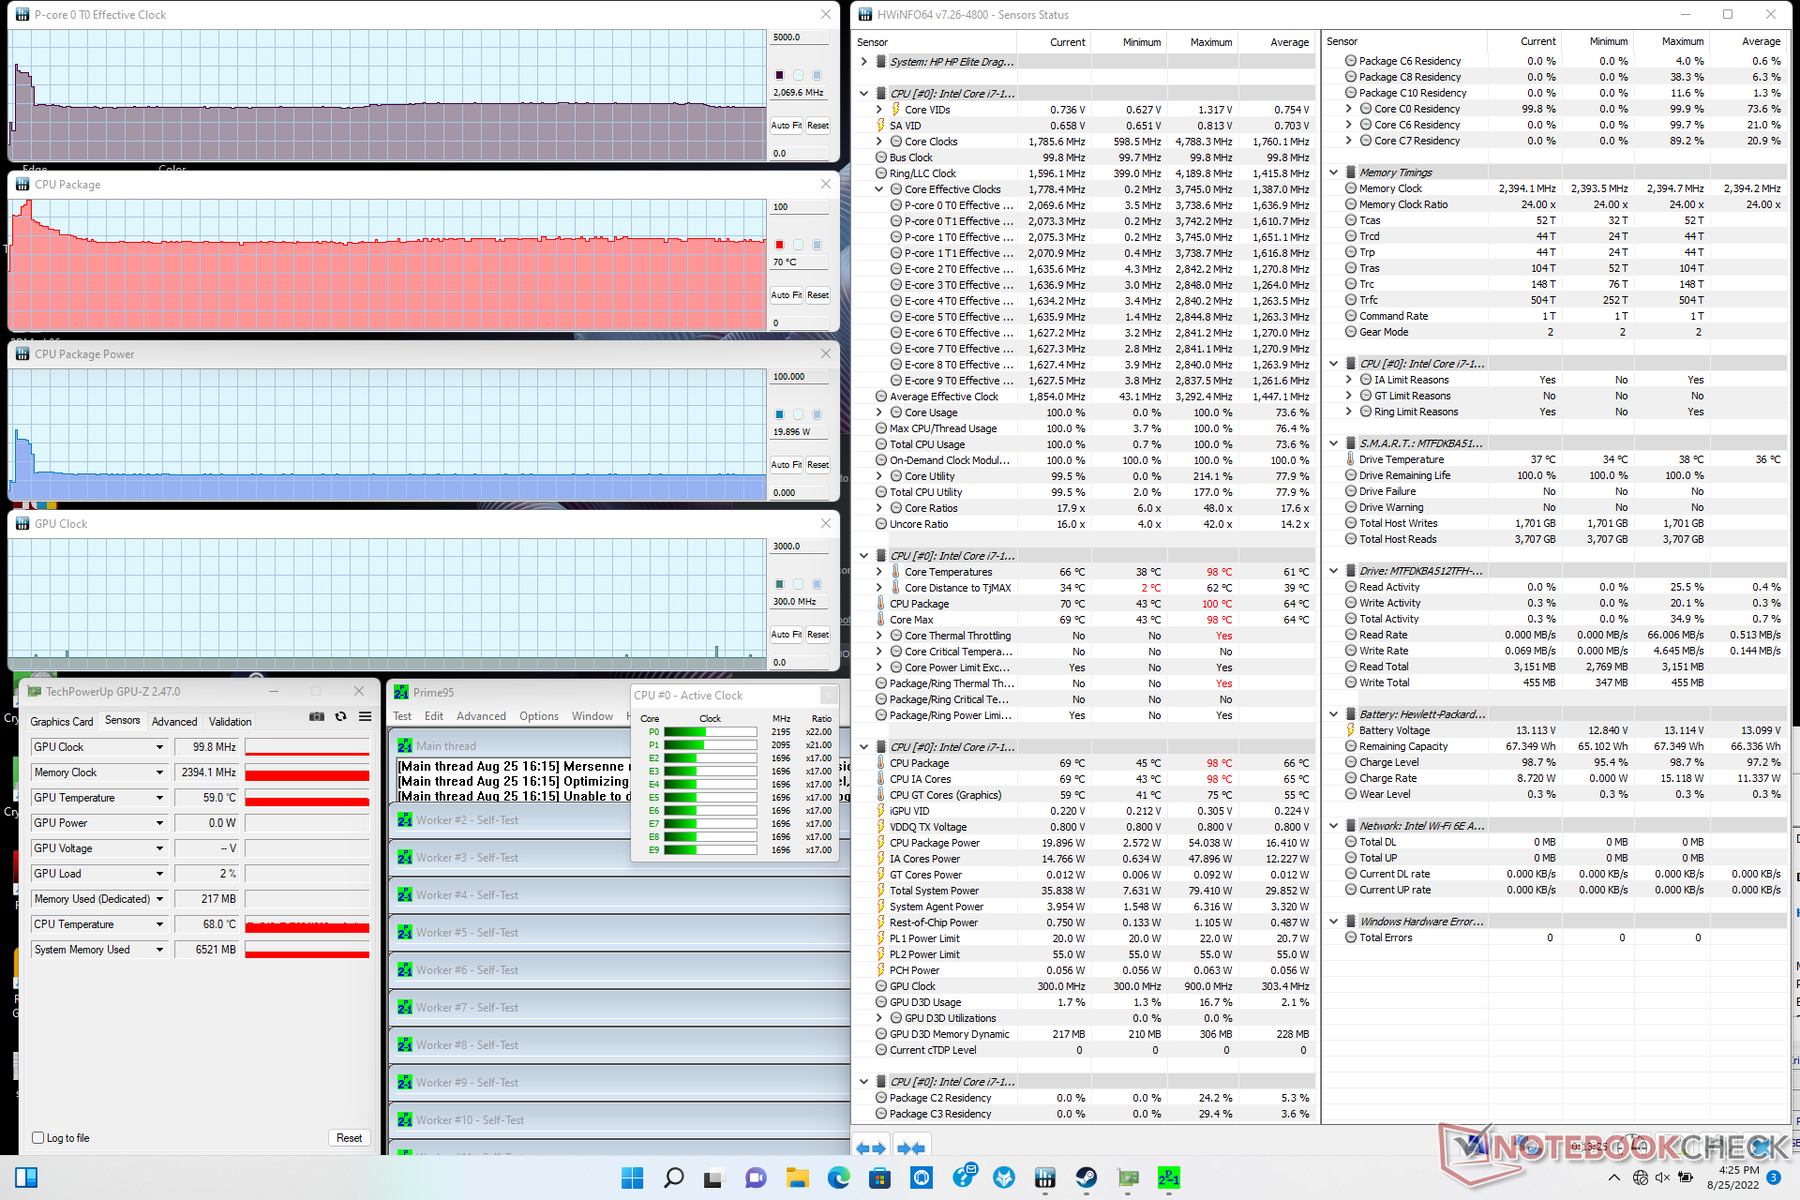
Prueba de esfuerzo
La velocidad de reloj de la CPU, la temperatura y el consumo de energía de la placa se disparan a 3,7 GHz, 100 C y 54 W, respectivamente, al iniciar el estrés de Prime95. Sin embargo, después de 10 a 15 segundos, las velocidades de reloj y el consumo de energía de la placa caen y se estabilizan en 2,1 GHz y 20 W, respectivamente, para mantener una temperatura del núcleo más manejable de 70 C. Repitiendo esta misma prueba en el Dell Latitude 7330 con la misma CPU Core i7-1265U se verían velocidades de reloj estables más altas, temperaturas y consumo de energía de la placa de 2,4 GHz, >80 C y 25 W, respectivamente. HP ejecuta el Core i7-1265U de forma más conservadora en comparación con la competencia.
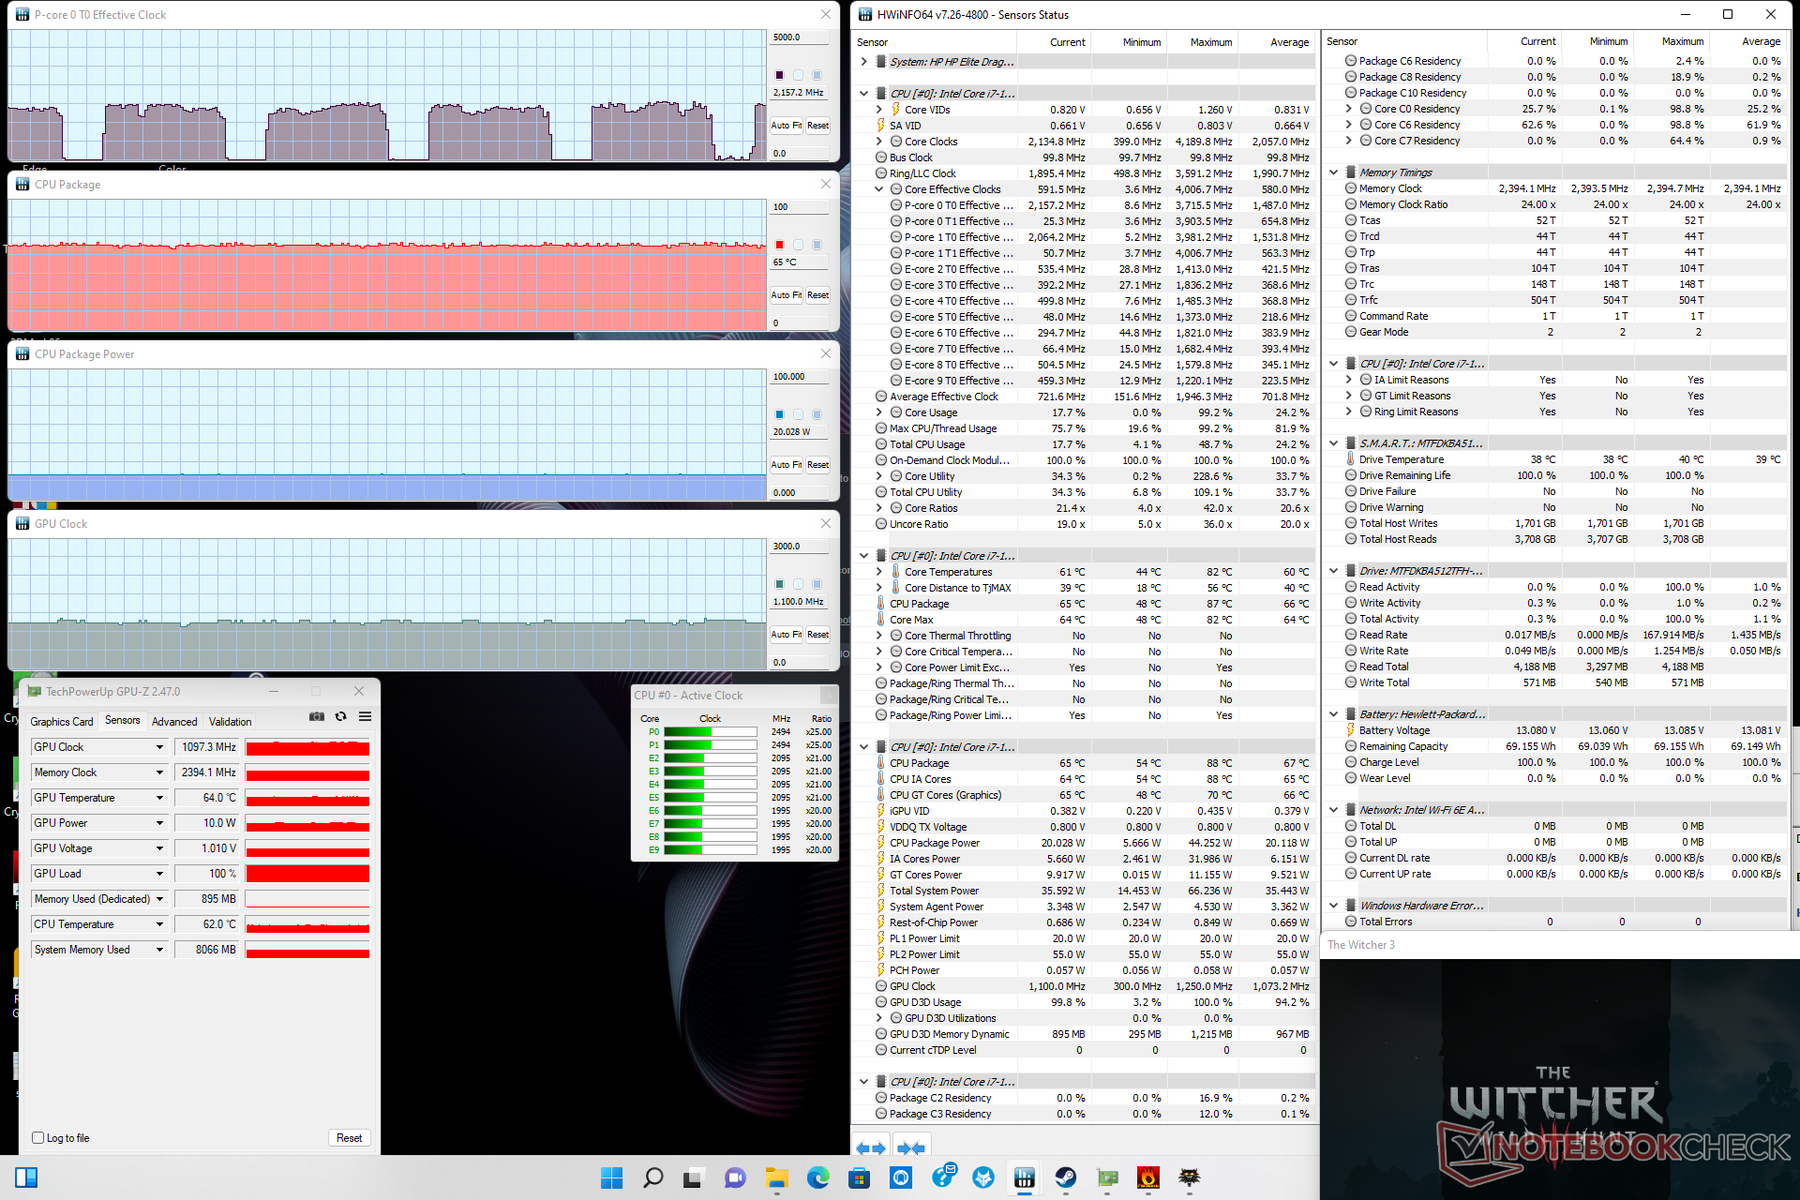
Cuando se ejecuta Witcher 3 para representar cargas exigentes, la velocidad de reloj de la GPU y la temperatura se estabilizarían en 1097 MHz y 65 C, respectivamente, en comparación con 1247 MHz y 83 C en el mencionado Dell.
El uso de la batería limita el rendimiento. Un test 3DMark en baterías devolvería puntuaciones de Física y Gráficos de 9619 y 5532 puntos, respectivamente, comparado con los 11216 y 6155 puntos cuando está conectado a la red eléctrica.
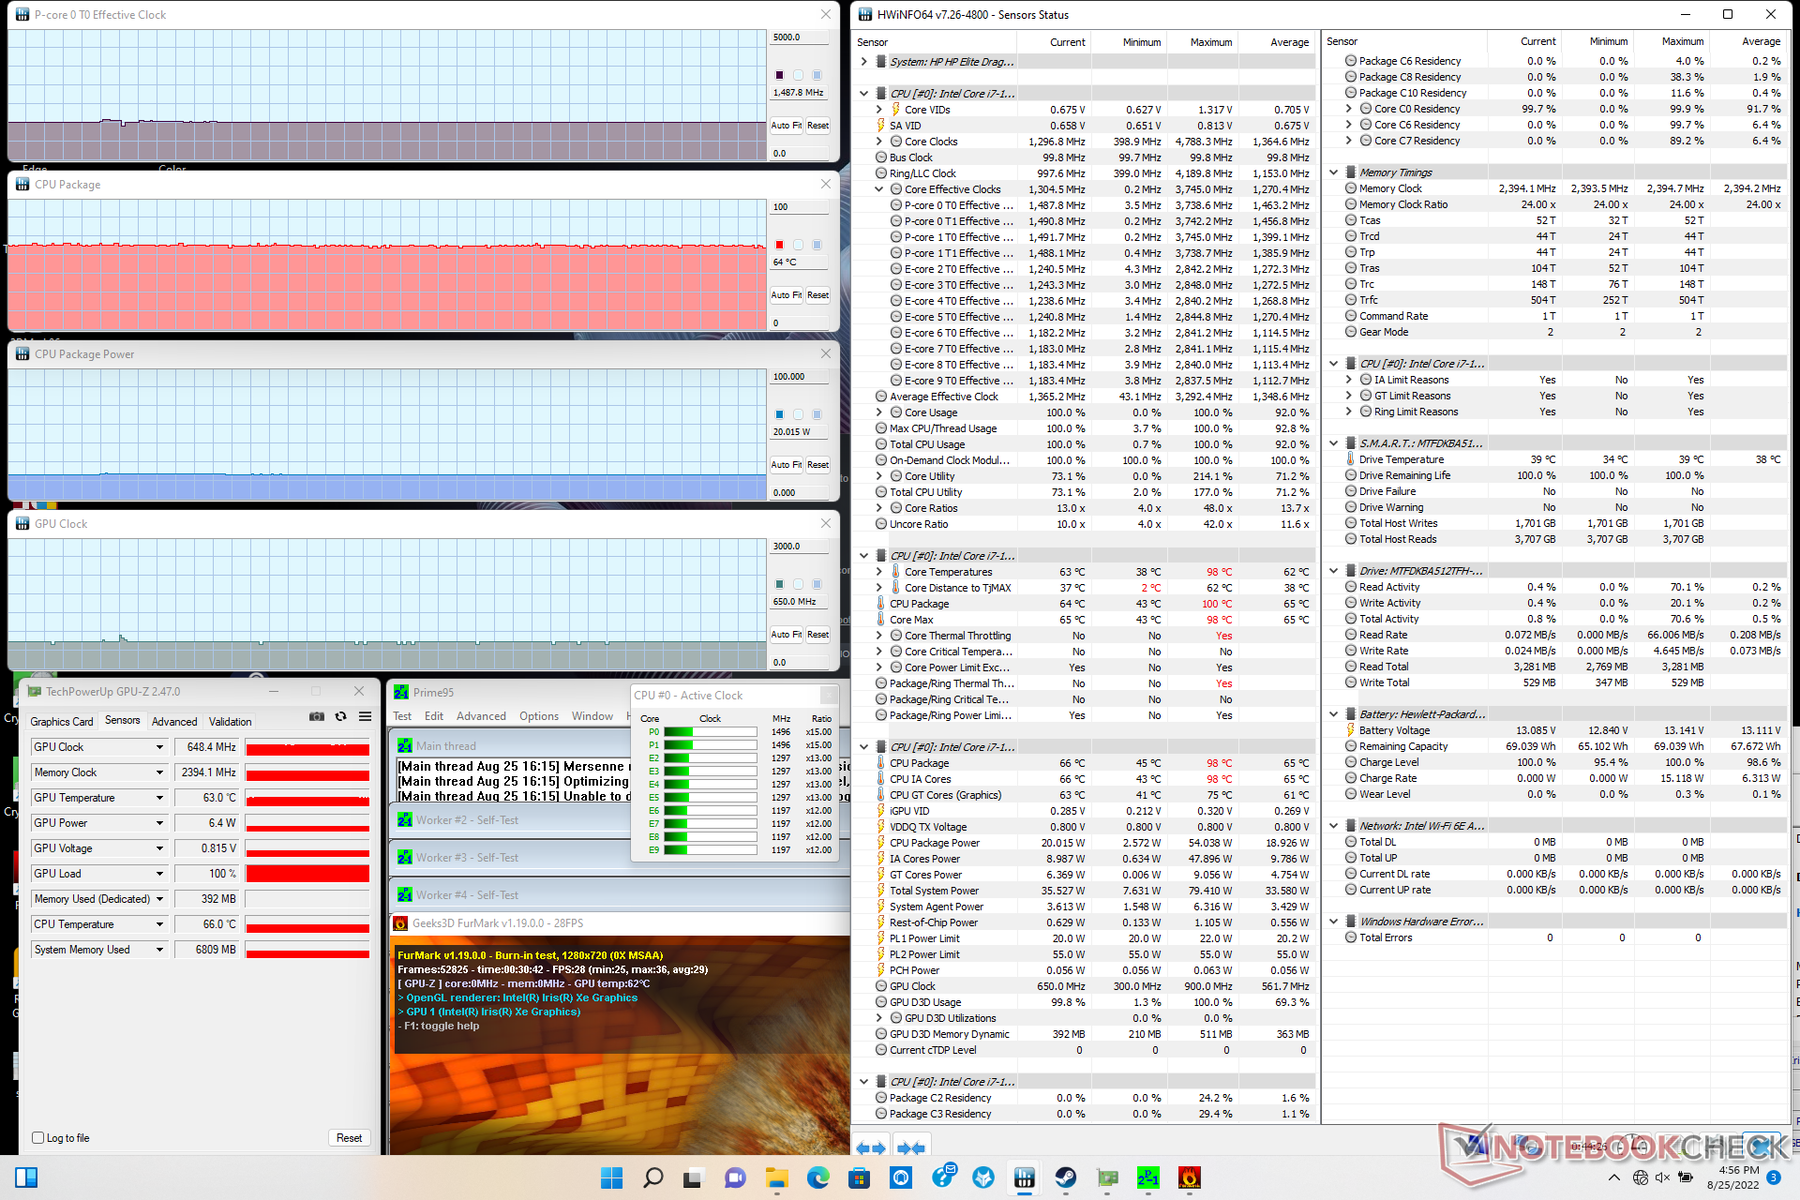
| Reloj dela CPU (GHz) | Reloj de la GPU (MHz) | Temperatura media de la CPU (°C) | |
| Sistema en reposo | -- | -- | 2.1 |
| Prime95 Stress | 2.1 | -- | 70 |
| Prime95+ FurMark Stress | 1,5 | 648 | 64 |
| Witcher 3 Estrés | ~2,1 | 1097 | 65 |
Altavoces
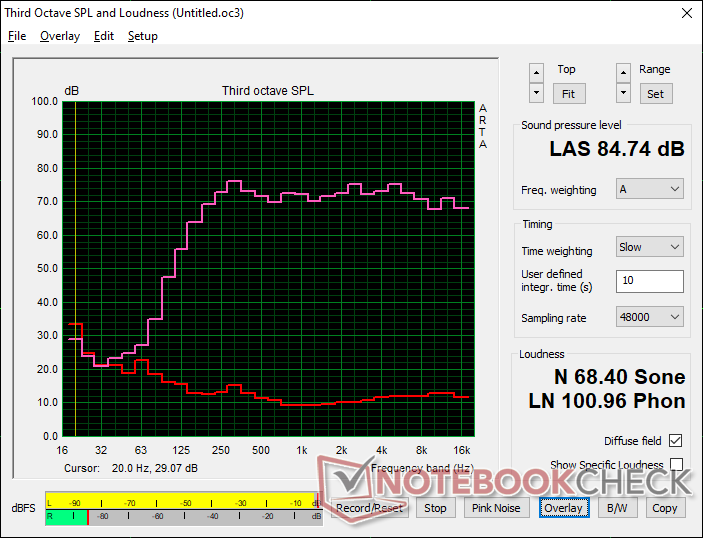
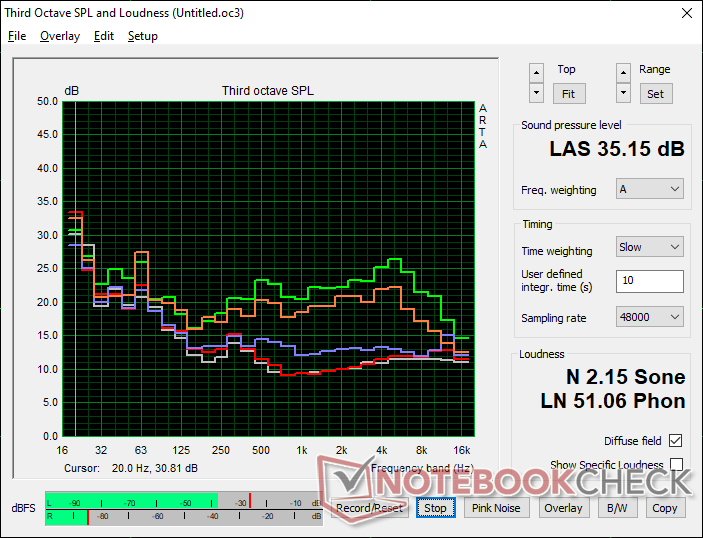
HP Elite Dragonfly G3 análisis de audio
(+) | los altavoces pueden reproducir a un volumen relativamente alto (#84.7 dB)
Graves 100 - 315 Hz
(±) | lubina reducida - en promedio 9.4% inferior a la mediana
(±) | la linealidad de los graves es media (11.4% delta a frecuencia anterior)
Medios 400 - 2000 Hz
(+) | medios equilibrados - a sólo 0.9% de la mediana
(+) | los medios son lineales (2.8% delta a la frecuencia anterior)
Altos 2 - 16 kHz
(+) | máximos equilibrados - a sólo 2.1% de la mediana
(+) | los máximos son lineales (3.9% delta a la frecuencia anterior)
Total 100 - 16.000 Hz
(+) | el sonido global es lineal (6.6% de diferencia con la mediana)
En comparación con la misma clase
» 0% de todos los dispositivos probados de esta clase eran mejores, 0% similares, 100% peores
» El mejor tuvo un delta de 7%, la media fue 21%, el peor fue ###max##%
En comparación con todos los dispositivos probados
» 1% de todos los dispositivos probados eran mejores, 0% similares, 99% peores
» El mejor tuvo un delta de 4%, la media fue 23%, el peor fue ###max##%
Apple MacBook Pro 16 2021 M1 Pro análisis de audio
(+) | los altavoces pueden reproducir a un volumen relativamente alto (#84.7 dB)
Graves 100 - 315 Hz
(+) | buen bajo - sólo 3.8% lejos de la mediana
(+) | el bajo es lineal (5.2% delta a la frecuencia anterior)
Medios 400 - 2000 Hz
(+) | medios equilibrados - a sólo 1.3% de la mediana
(+) | los medios son lineales (2.1% delta a la frecuencia anterior)
Altos 2 - 16 kHz
(+) | máximos equilibrados - a sólo 1.9% de la mediana
(+) | los máximos son lineales (2.7% delta a la frecuencia anterior)
Total 100 - 16.000 Hz
(+) | el sonido global es lineal (4.6% de diferencia con la mediana)
En comparación con la misma clase
» 0% de todos los dispositivos probados de esta clase eran mejores, 0% similares, 100% peores
» El mejor tuvo un delta de 5%, la media fue 17%, el peor fue ###max##%
En comparación con todos los dispositivos probados
» 0% de todos los dispositivos probados eran mejores, 0% similares, 100% peores
» El mejor tuvo un delta de 4%, la media fue 23%, el peor fue ###max##%
Gestión de la energía
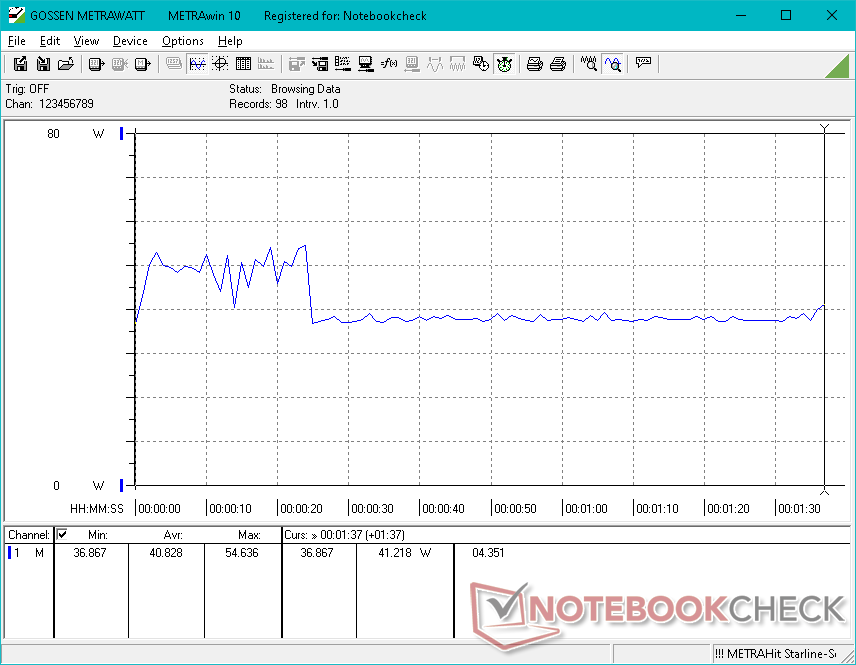
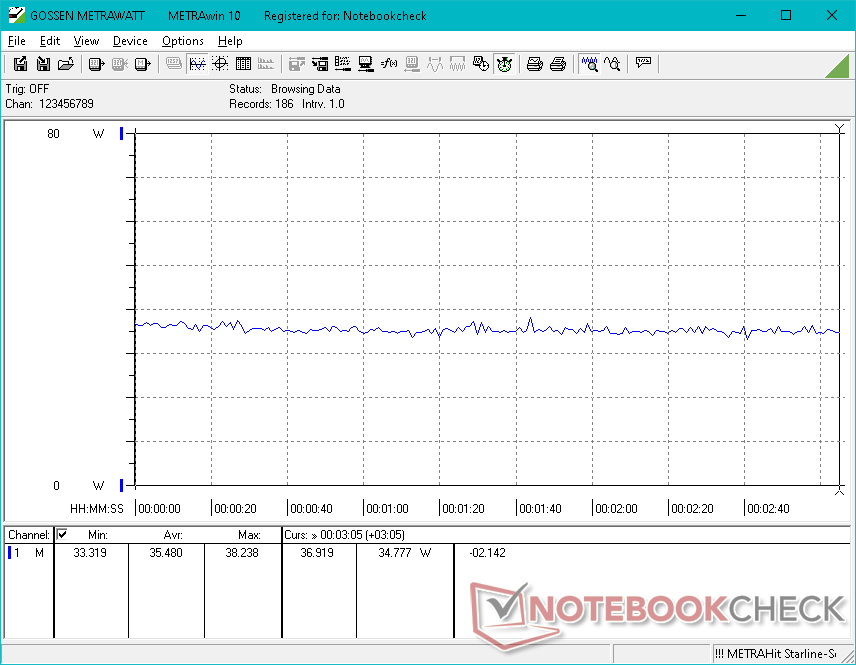
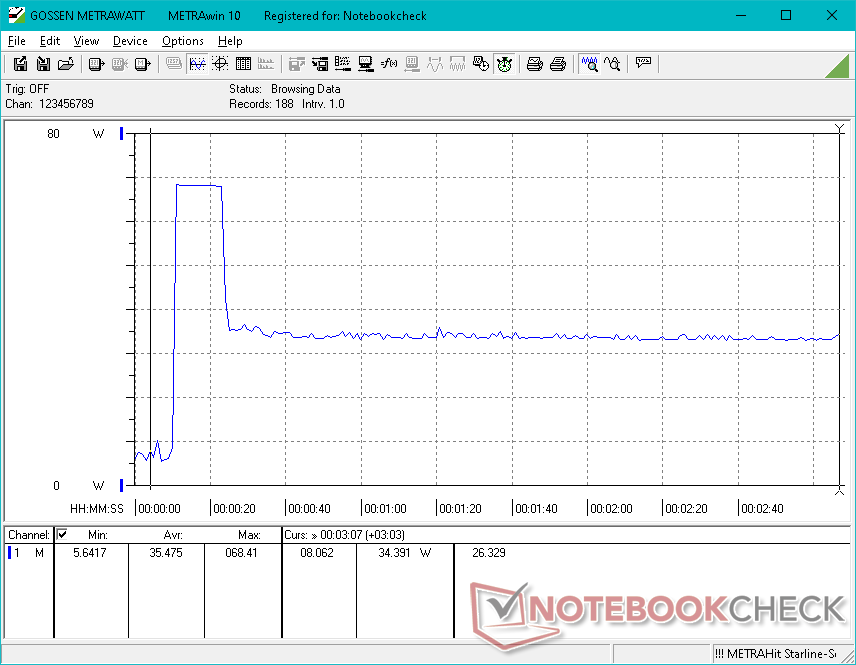
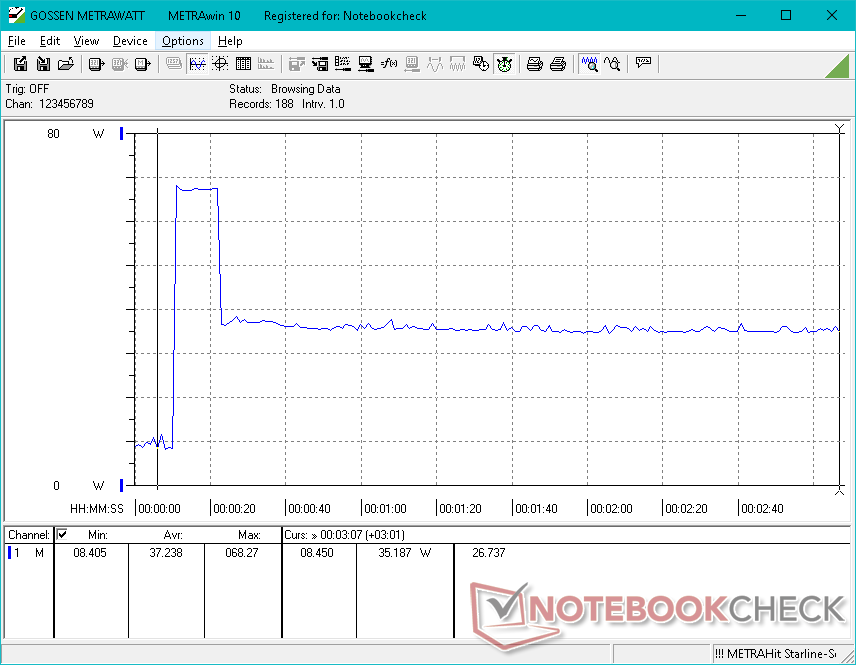
Consumo de energía
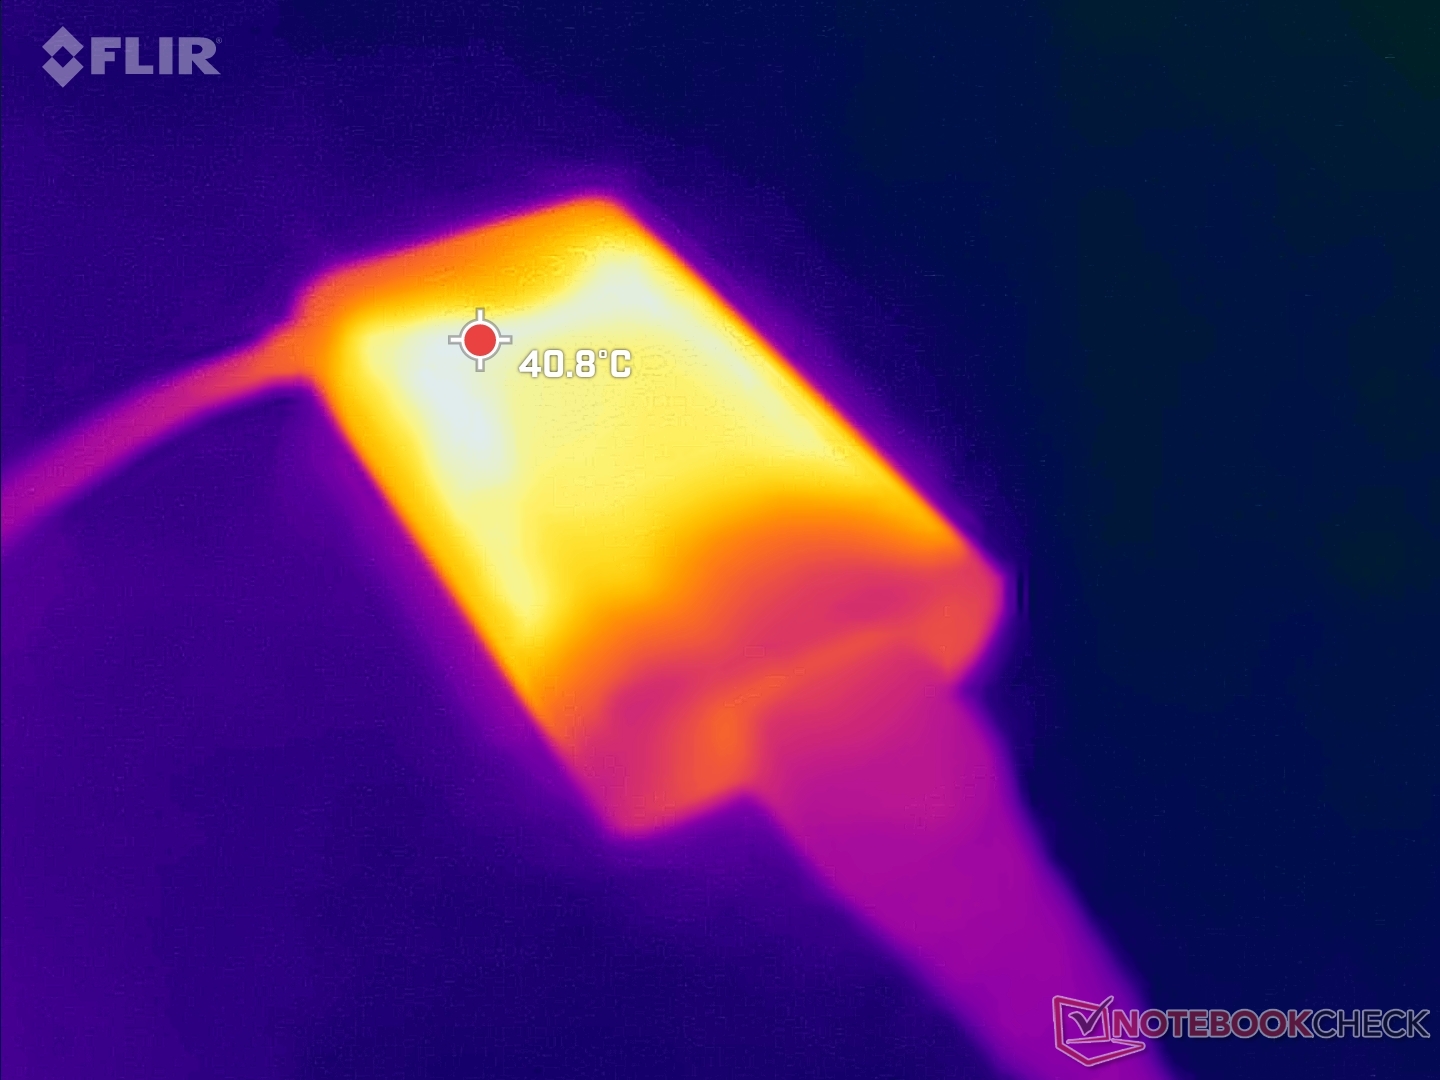
El consumo de energía es casi idéntico al del Dell Latitude 7330 equipado con la misma CPU cuando se ejecutan cargas poco exigentes como la navegación por Internet o la transmisión de vídeo. Sin embargo, el sistema Dell es más exigente cuando ejecuta tareas intensivas de la CPU, ya que es capaz de mantener velocidades de reloj y niveles de TDP más altos durante más tiempo que en el HP. El consumo general no es tan diferente del Spectre x360 14 con el Core i7-1165G7 de última generación a pesar del aumento del 15-30% en el rendimiento multihilo.
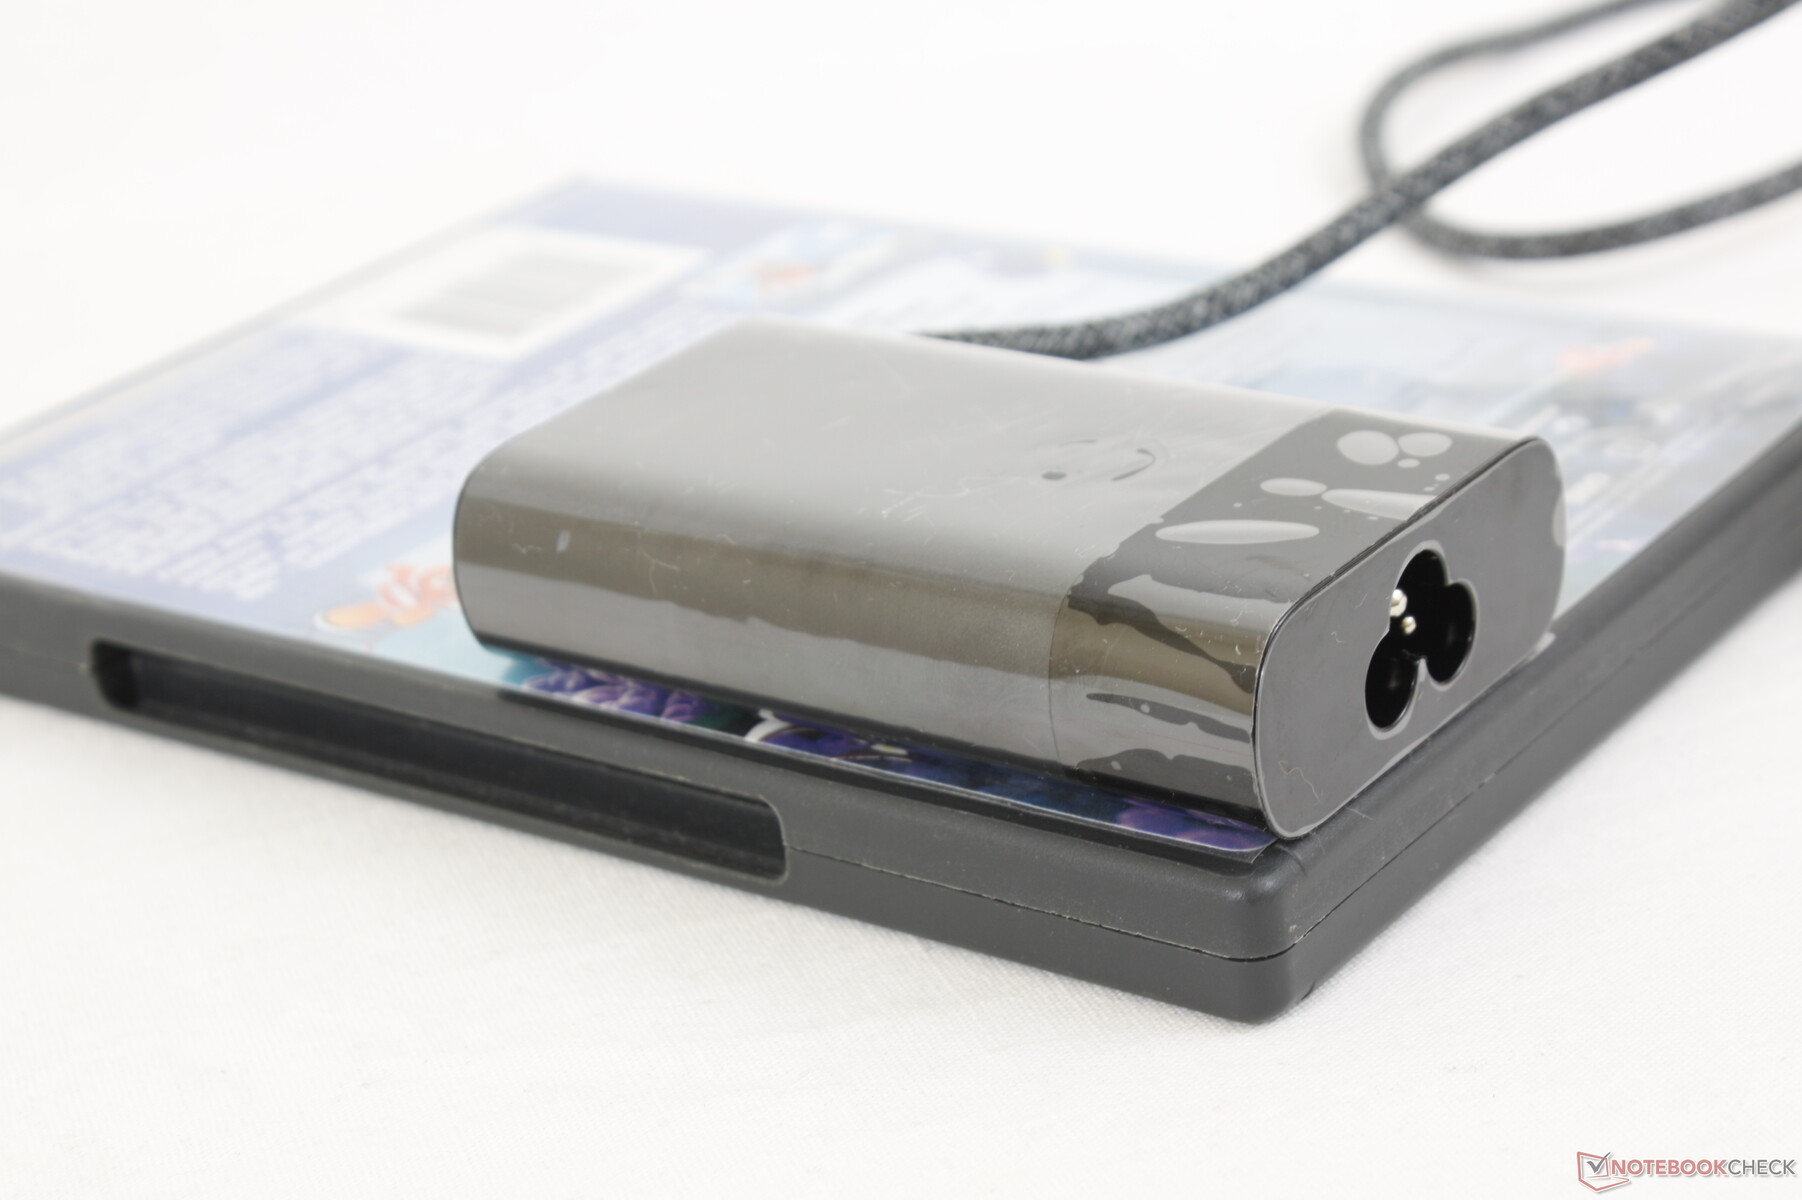
Registramos un consumo máximo temporal de 68,4 W en el pequeño (~8,8 x 5,3 x 2,1 cm) adaptador de CA de 65 W cuando la CPU está al 100% de utilización. Las limitaciones térmicas impiden que la CPU funcione a sus velocidades de reloj Turbo Boost más altas durante periodos prolongados.
| Off / Standby | |
| Ocioso | |
| Carga |
|
Clave:
min: | |
| HP Elite Dragonfly G3 i7-1265U, Iris Xe G7 96EUs, Micron 3400 MTFDKBA512TFH 512GB, IPS, 1920x1280, 13.5" | HP Spectre x360 14t-ea000 i7-1165G7, Iris Xe G7 96EUs, Samsung SSD PM981a MZVLB512HBJQ, IPS, 1920x1280, 13.5" | Dell XPS 13 Plus 9320 i5-1240p i5-1240P, Iris Xe G7 80EUs, Micron 3400 MTFDKBA512TFH 512GB, IPS, 1920x1200, 13.4" | Framework Laptop 13.5 12th Gen Intel i7-1260P, Iris Xe G7 96EUs, WDC PC SN730 SDBPNTY-512G, IPS, 2256x1504, 13.5" | HP EliteBook Folio 13.5-3G2L2EA SD 8cx Gen 2 5G, Adreno 680, Toshiba XG6 KXG60ZNV512G, IPS, 1920x1280, 13.5" | Lenovo ThinkPad X1 Titanium Yoga G1 20QA001RGE i7-1160G7, Iris Xe G7 96EUs, Toshiba BG4 KBG40ZNT512G, IPS, 2256x1504, 13.5" | |
|---|---|---|---|---|---|---|
| Power Consumption | 9% | -70% | -34% | 46% | 0% | |
| Idle Minimum * (Watt) | 3.4 | 3 12% | 10 -194% | 5.3 -56% | 2.3 32% | 3.9 -15% |
| Idle Average * (Watt) | 5.6 | 5.1 9% | 12.3 -120% | 8.4 -50% | 3.7 34% | 7.3 -30% |
| Idle Maximum * (Watt) | 8.4 | 6.4 24% | 15.5 -85% | 11.2 -33% | 5.6 33% | 10.3 -23% |
| Load Average * (Watt) | 40.8 | 39.6 3% | 43 -5% | 57.4 -41% | 13 68% | 30.6 25% |
| Witcher 3 ultra * (Watt) | 35.5 | 39.6 -12% | 43.1 -21% | 46.7 -32% | 25.5 28% | |
| Load Maximum * (Watt) | 68.4 | 56.2 18% | 62.8 8% | 61.2 11% | 25 63% | 57.1 17% |
* ... más pequeño es mejor
Power Consumption Witcher 3 / Stresstest
Power Consumption external Monitor
Duración de la batería - Larga duración
La capacidad de la batería ha aumentado de 56 Wh en el Dragonfly Max a 68 Wh en el Dragonfly G3. Sin embargo, la duración de la WLAN es ligeramente superior, con casi 12 horas.
La carga de vacío a lleno tarda unos 90 minutos. El adaptador USB-C AC puede usarse para cargar rápidamente otros dispositivos USB-C, incluyendo smartphones y tablets.
| HP Elite Dragonfly G3 i7-1265U, Iris Xe G7 96EUs, 68 Wh | HP Spectre x360 14t-ea000 i7-1165G7, Iris Xe G7 96EUs, 66 Wh | Dell XPS 13 Plus 9320 i5-1240p i5-1240P, Iris Xe G7 80EUs, 55 Wh | Framework Laptop 13.5 12th Gen Intel i7-1260P, Iris Xe G7 96EUs, 55 Wh | HP EliteBook Folio 13.5-3G2L2EA SD 8cx Gen 2 5G, Adreno 680, 46 Wh | Lenovo ThinkPad X1 Titanium Yoga G1 20QA001RGE i7-1160G7, Iris Xe G7 96EUs, 44.5 Wh | |
|---|---|---|---|---|---|---|
| Duración de Batería | -12% | -43% | -36% | 22% | -38% | |
| Reader / Idle (h) | 37.8 | 36.4 -4% | ||||
| WiFi v1.3 (h) | 11.8 | 11.8 0% | 8 -32% | 7.5 -36% | 14.6 24% | 8.4 -29% |
| Load (h) | 3.5 | 2.4 -31% | 1.6 -54% | 4.2 20% | 1.9 -46% | |
| H.264 (h) | 11.4 |
Pro
Contra
Veredicto - Maximizar la funcionalidad, las características y la apariencia
La Dragonfly G3 responde a una de nuestras mayores quejas sobre la Dragonfly G2 alejando la serie del factor de forma 16:9 y acercándola a una relación de aspecto 3:2. el formato 16:9 funciona bien para los portátiles de consumo y la mayoría de las reproducciones de vídeo, pero el 3:2 o el 16:10 suelen ser más apropiados para el público objetivo de usuarios de oficina y profesionales.
Aparte de la revisión visual, la cámara web en particular merece elogios por ser una de las mejores que hemos visto en cualquier portátil. 5 MP pueden parecer míseros para los usuarios de smartphones, pero es literalmente 5 veces la resolución (¡!) de las cámaras web de la mayoría de los portátiles de hoy en día. Si valoras la calidad de vídeo y haces muchas videoconferencias, no busques más que el Dragonfly G3. Otros aspectos destacados son los ventiladores más silenciosos, el gran clickpad, el rápido rendimiento del SSD sin ralentización del rendimiento y la excelente calidad de audio para su clase de tamaño.
El Dragonfly G3 tiene un aspecto estupendo y se siente aún mejor al usarlo. Sin embargo, los cazadores de rendimiento de la CPU pueden querer buscar en otra parte, ya que los objetivos de TDP son relativamente bajos en el HP.
El gran asterisco del Dragonfly G3 se refiere al rendimiento de su procesador. Cuando la competencia Dell Latitude 9430 2-en-1 es capaz de ejecutar la misma CPU Core i7-1265U un 50 por ciento más rápido, entonces sabes que no estás obteniendo todos los beneficios de la 12ª generación de Intel en el modelo de HP. El ruido del ventilador es más silencioso, sin duda, pero habríamos preferido una opción que permitiera ventiladores más ruidosos si hubiera significado un rendimiento más rápido para aquellos que lo necesitan.
Para el modelo del año que viene, nos encantaría que Sure View se separara de la opción de panel de 1000 nits. Tendrás que aceptarlos como un par a partir de este escrito si configuras con uno u otro. Además, las opciones de frecuencia de refresco de las pantallas más altas, como las que se encuentran en la serie Asus ZenBook, mejorarían la experiencia del usuario. Una tapa más rígida y una garantía base de 36 meses más larga ayudarían a mejorar la robustez y la longevidad, respectivamente.
Precio y disponibilidad
El HP Elite Dragonfly G3 aún no está disponible en Amazon, Best Buy u otros puntos de venta importantes. Recomendamos comprar directamente a HP para obtener las opciones más configurables. Las configuraciones básicas comienzan en $1999 USD mientras que nuestra configuración específica se vende por poco menos de $2700.
HP Elite Dragonfly G3
- 08/28/2022 v7 (old)
Allen Ngo
Price comparison

