Análisis del portátil Razer Blade 17 2022 Core i7 RTX 3080 Ti: Rendimiento sobrealimentado
Cada vez que una nueva generación de procesadores de Intel o Nvidia está disponible, puedes contar con Razer para actualizar su serie Blade con las últimas opciones de CPU o GPU. El Blade 17 2022 es una actualización interna del Blade 17 2021 con CPUs Intel Alder Lake-H de 12ª generación y GPUs GeForce RTX 3070 Ti y 3080 Ti que sustituyen a las opciones Tiger Lake-H y RTX 3070 y 3080 de 11ª generación de antaño. Como se detalla en nuestro resumen de Alder Lakelas nuevas CPU de 12ª generación introducen núcleos P de alto rendimiento y núcleos E eficientes, mientras que la serie GeForce Ti para móviles pretende exprimir más rendimiento del mismo chipset Nvidia Ampere
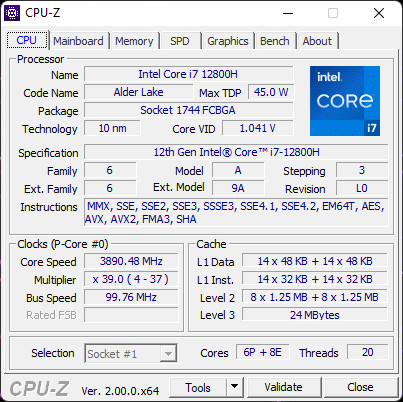
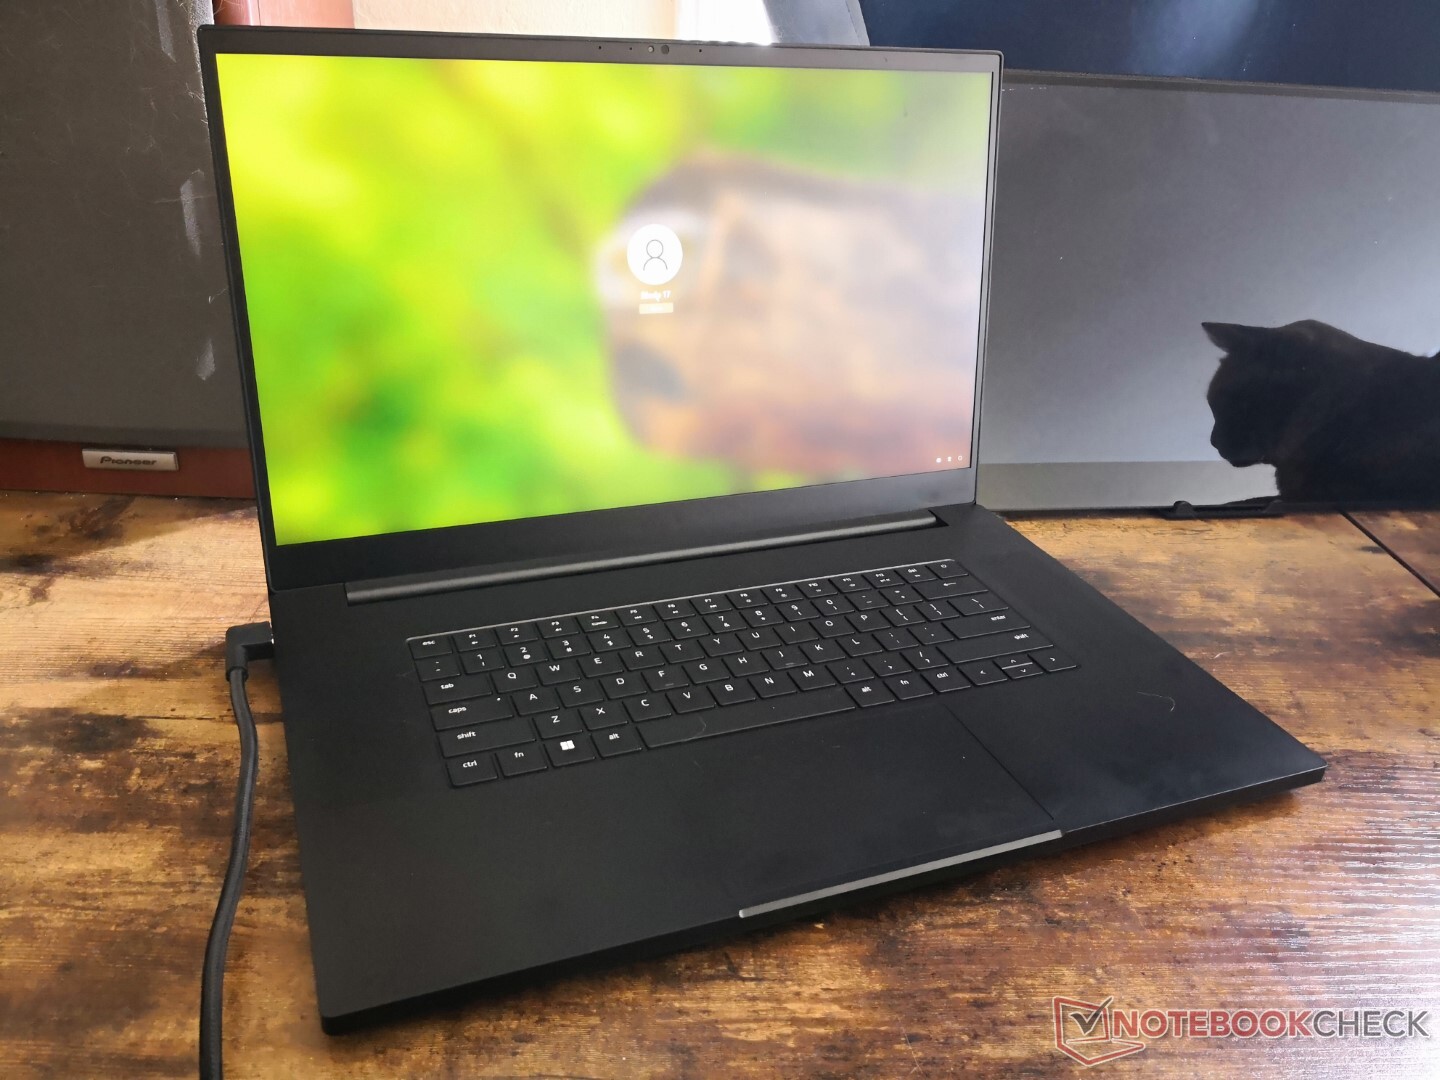
Nuestra unidad Blade 17 analizada es una configuración de gama alta con el Core i7-12800H, la GPU RTX 3080 Ti y el panel QHD de 240 Hz por unos 4000 dólares. Hay otros modelos disponibles con las GPUs RTX 3060 o RTX 3070 Ti, pantallas FHD o UHD, o la CPU Core i9-12900H a distintos precios. A diferencia de la GPU de 100 W de la décima generación de Intel Blade 17 o de la GPU de 130 W de la undécima generación de Blade 17, la GPU de esta duodécima generación de Blade 17 tiene como objetivo un TGP aún mayor de 165 W para un rendimiento potencialmente mayor
Entre las alternativas al Blade 17 se encuentran otros portátiles de juego ultradelgados emblemáticos como el MSI GS76 o el GS77, Asus Zephyrus S17, Aorus 17G, Alienware x17o Maingear Vector Pro
Más opiniones de Razer
Posibles contendientes en la comparación
Valoración | Fecha | Modelo | Peso | Altura | Tamaño | Resolución | Precio |
|---|---|---|---|---|---|---|---|
| 91.2 % v7 (old) | 03/2022 | Razer Blade 17 RTX 3080 Ti i7-12800H, GeForce RTX 3080 Ti Laptop GPU | 2.7 kg | 19.9 mm | 17.30" | 2560x1440 | |
| 87.8 % v7 (old) | 02/2021 | Razer Blade Pro 17 2021 (QHD Touch) i7-10875H, GeForce RTX 3080 Laptop GPU | 3 kg | 19.9 mm | 17.30" | 3840x2160 | |
| 86.2 % v7 (old) | 09/2021 | MSI GS76 Stealth 11UH i9-11900H, GeForce RTX 3080 Laptop GPU | 2.4 kg | 20 mm | 17.30" | 3840x2160 | |
| 90.1 % v7 (old) | 07/2021 | Asus ROG Zephyrus S17 GX703HSD i9-11900H, GeForce RTX 3080 Laptop GPU | 2.8 kg | 19.9 mm | 17.30" | 2560x1440 | |
| 86 % v7 (old) | 06/2021 | Aorus 17G YD i7-11800H, GeForce RTX 3080 Laptop GPU | 2.8 kg | 26 mm | 17.30" | 1920x1080 | |
| 89 % v7 (old) | 09/2021 | Alienware x17 RTX 3080 P48E i7-11800H, GeForce RTX 3080 Laptop GPU | 3.2 kg | 21.4 mm | 17.30" | 3840x2160 |
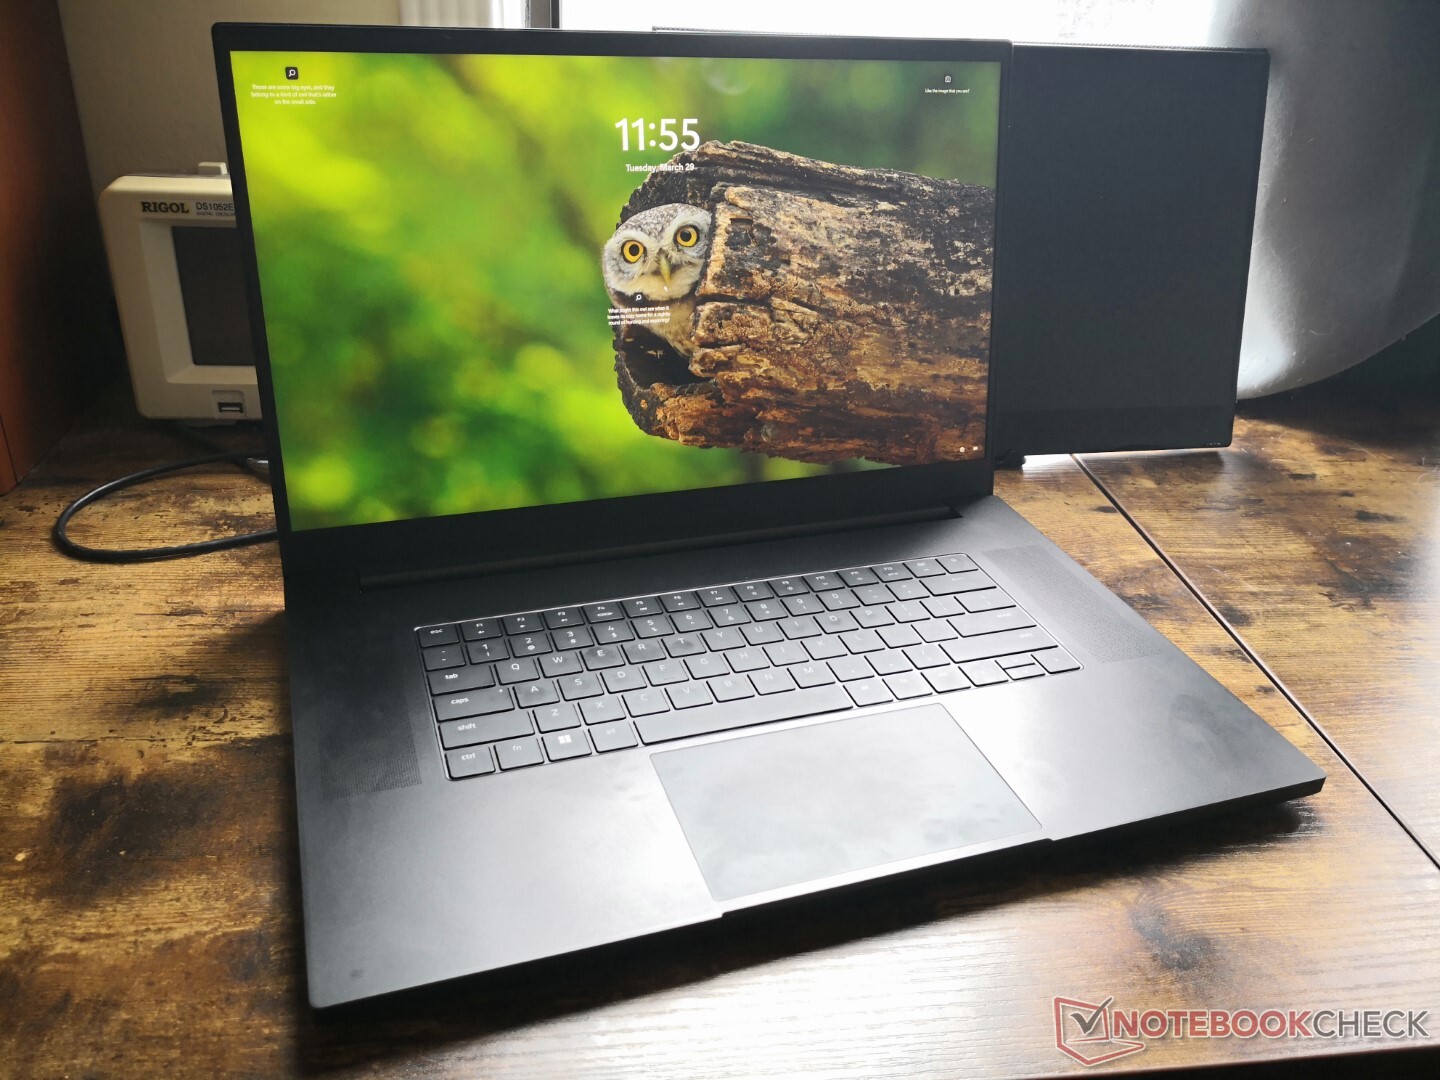
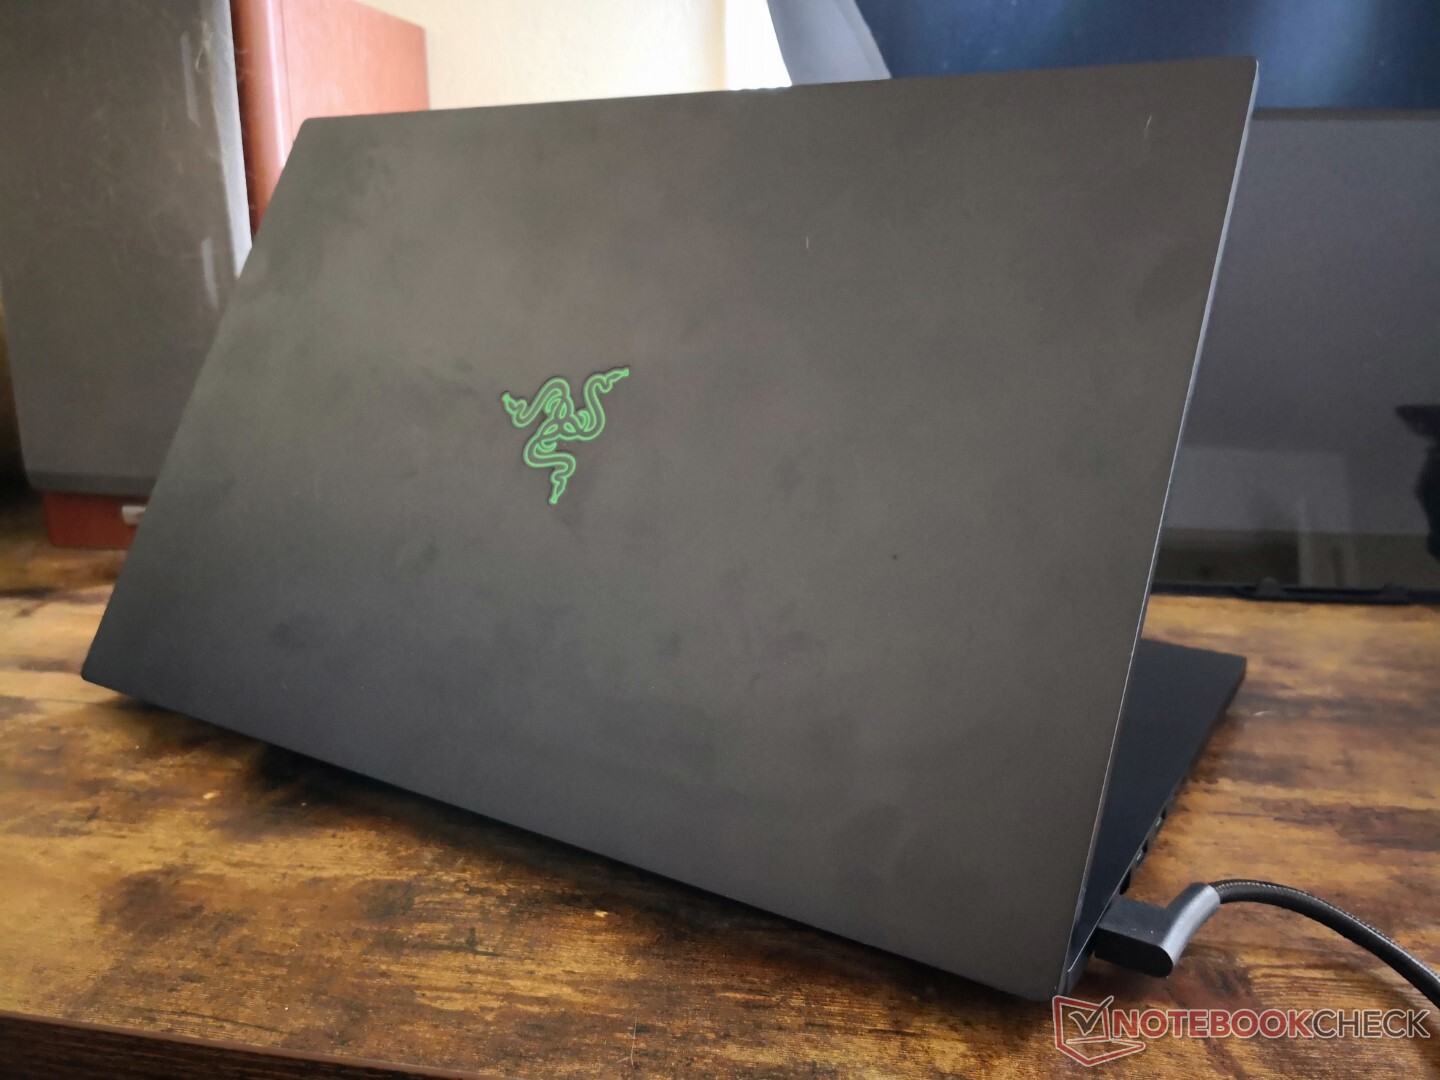
Caso - Igual, pero diferente
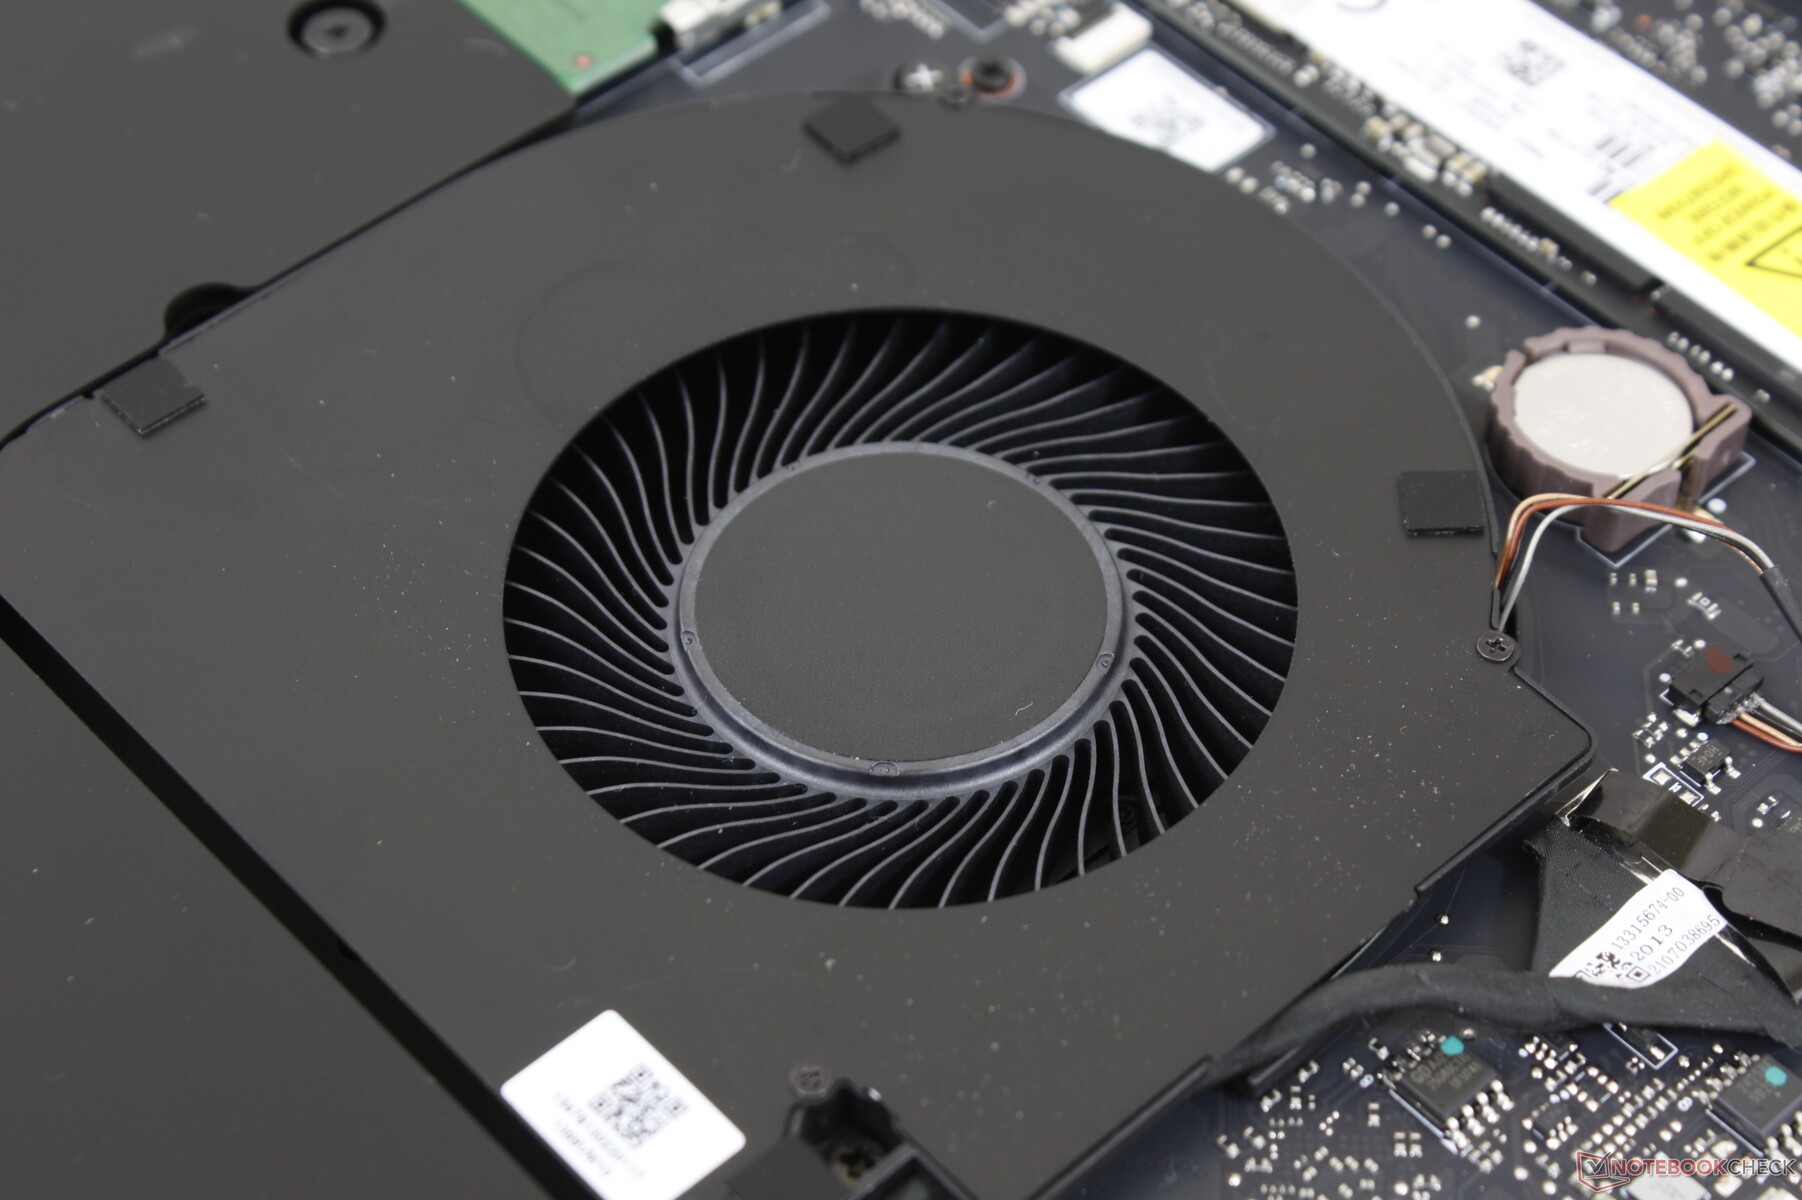
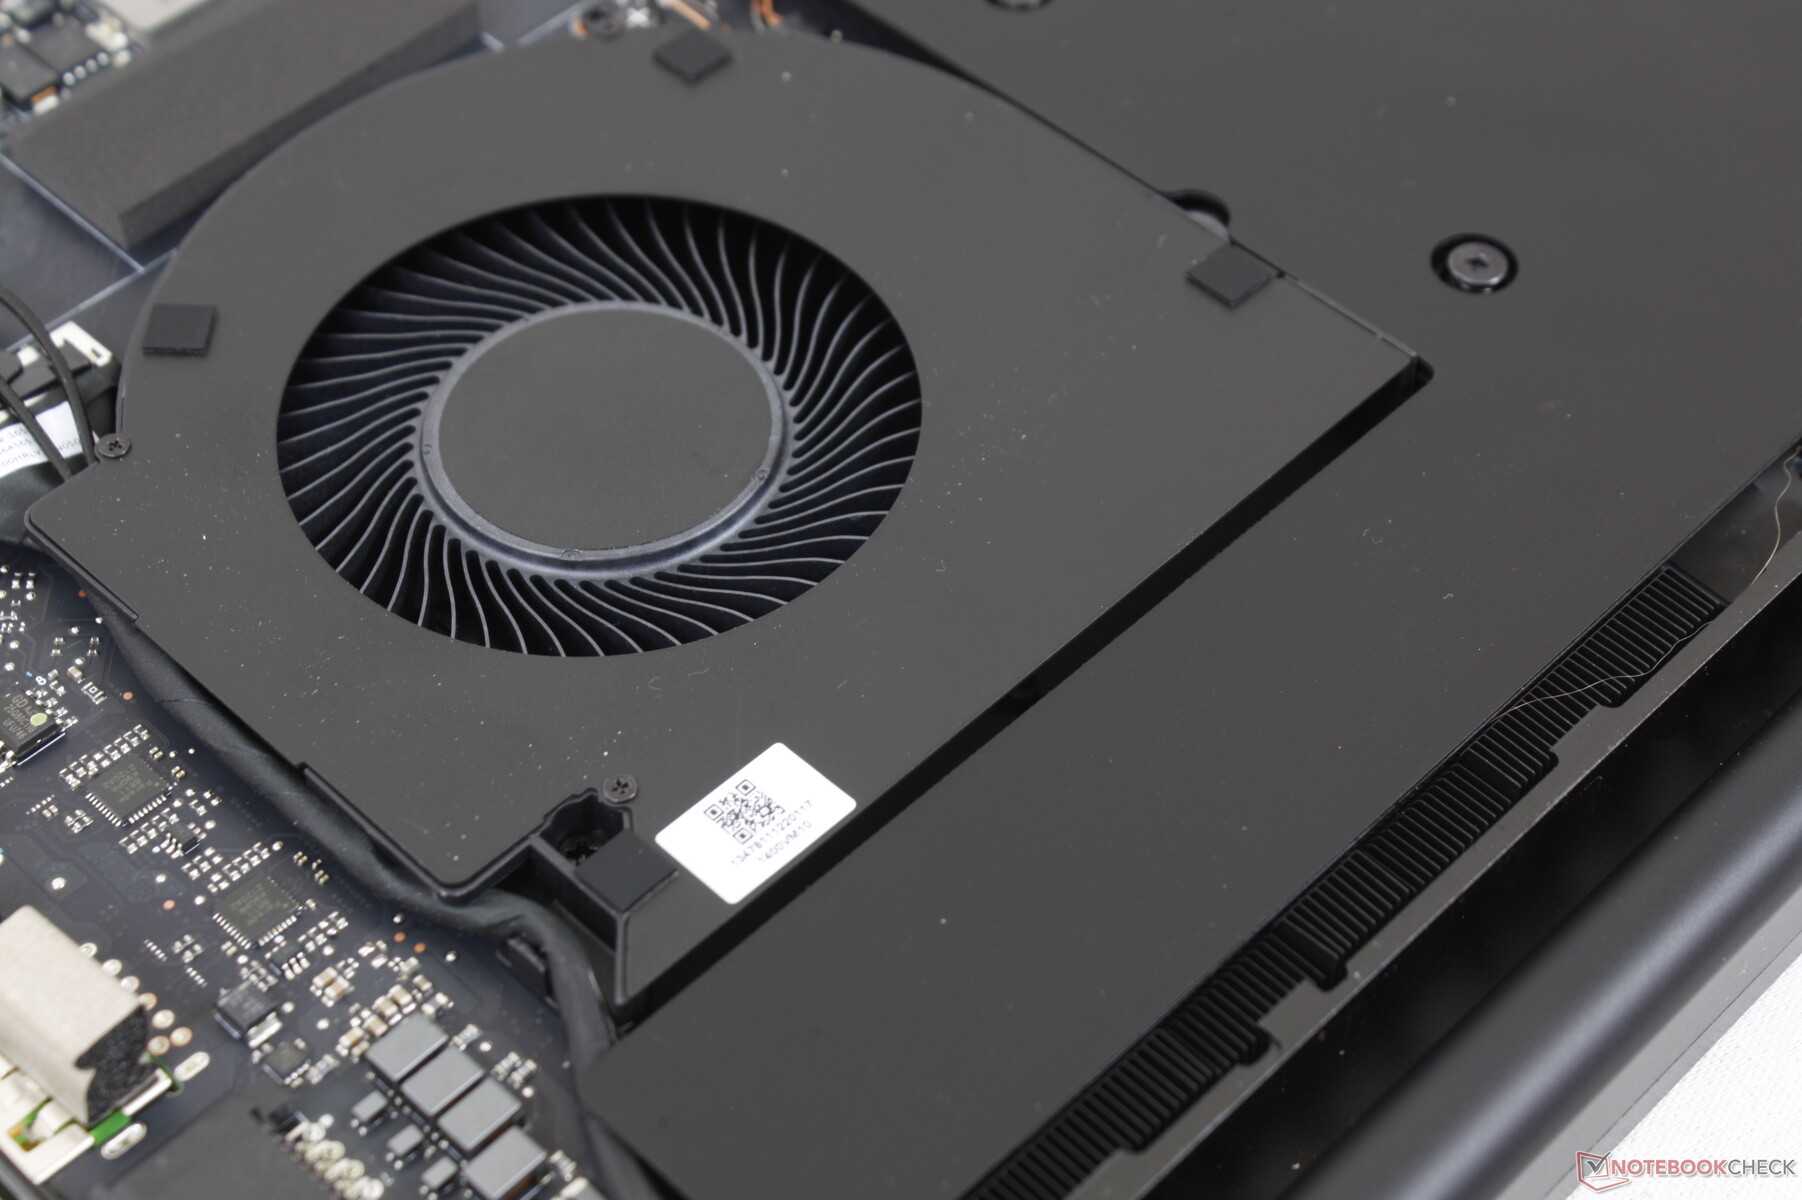
El chasis externo es idéntico al del modelo del año pasado, pero con dos diferencias visuales clave. En primer lugar, las tapas del teclado son ahora más grandes que en los modelos anteriores. En segundo lugar, ahora sólo se pueden ver tres ventiladores a través de las rejillas de la parte inferior de la unidad en lugar de cuatro, ya que Razer ha eliminado uno de los ventiladores. Estos pequeños cambios tienen un impacto en la batería y en las temperaturas generales, como mostrará nuestro análisis.
Conectividad: ahora con dos puertos Thunderbolt 4
Las opciones de puerto siguen siendo idénticas a las del modelo Intel de 10ª generación salvo por una diferencia clave: los dos puertos USB-C ahora soportan Thunderbolt en vez de sólo uno. El nuevo modelo también es compatible con el adaptador de CA del año pasado, pero el rendimiento puede verse afectado ya que el nuevo modelo 2022 utiliza un adaptador de mayor capacidad de 280 W.
Lector de tarjetas SD
| SD Card Reader | |
| average JPG Copy Test (av. of 3 runs) | |
| Razer Blade Pro 17 2021 (QHD Touch) (Toshiba Exceria Pro SDXC 64 GB UHS-II) | |
| MSI GS76 Stealth 11UH (AV PRO microSD 128 GB V60) | |
| Aorus 17G YD (AV PRO microSD 128 GB V60) | |
| Asus ROG Zephyrus S17 GX703HSD | |
| Alienware x17 RTX 3080 P48E (AV Pro V60) | |
| Razer Blade 17 RTX 3080 Ti (AV Pro V60) | |
| maximum AS SSD Seq Read Test (1GB) | |
| Asus ROG Zephyrus S17 GX703HSD | |
| Alienware x17 RTX 3080 P48E (AV Pro V60) | |
| MSI GS76 Stealth 11UH (AV PRO microSD 128 GB V60) | |
| Aorus 17G YD (AV PRO microSD 128 GB V60) | |
| Razer Blade Pro 17 2021 (QHD Touch) (Toshiba Exceria Pro SDXC 64 GB UHS-II) | |
| Razer Blade 17 RTX 3080 Ti (AV Pro V60) | |
Comunicación
Módulos de comunicación por cable e inalámbricos incorporados, comparación de los datos de las pruebas de red con los de la competencia, soluciones alternativas disponibles (5G/LTE)..., Irregularidades (recepción de radio)..
Cámara web
La webcam es de 1080p o 2 MP a diferencia de las webcams de 720p o 1 MP de la mayoría de los otros portátiles para una imagen más nítida. También es compatible con Windows Hello, pero sigue sin haber obturador de privacidad.


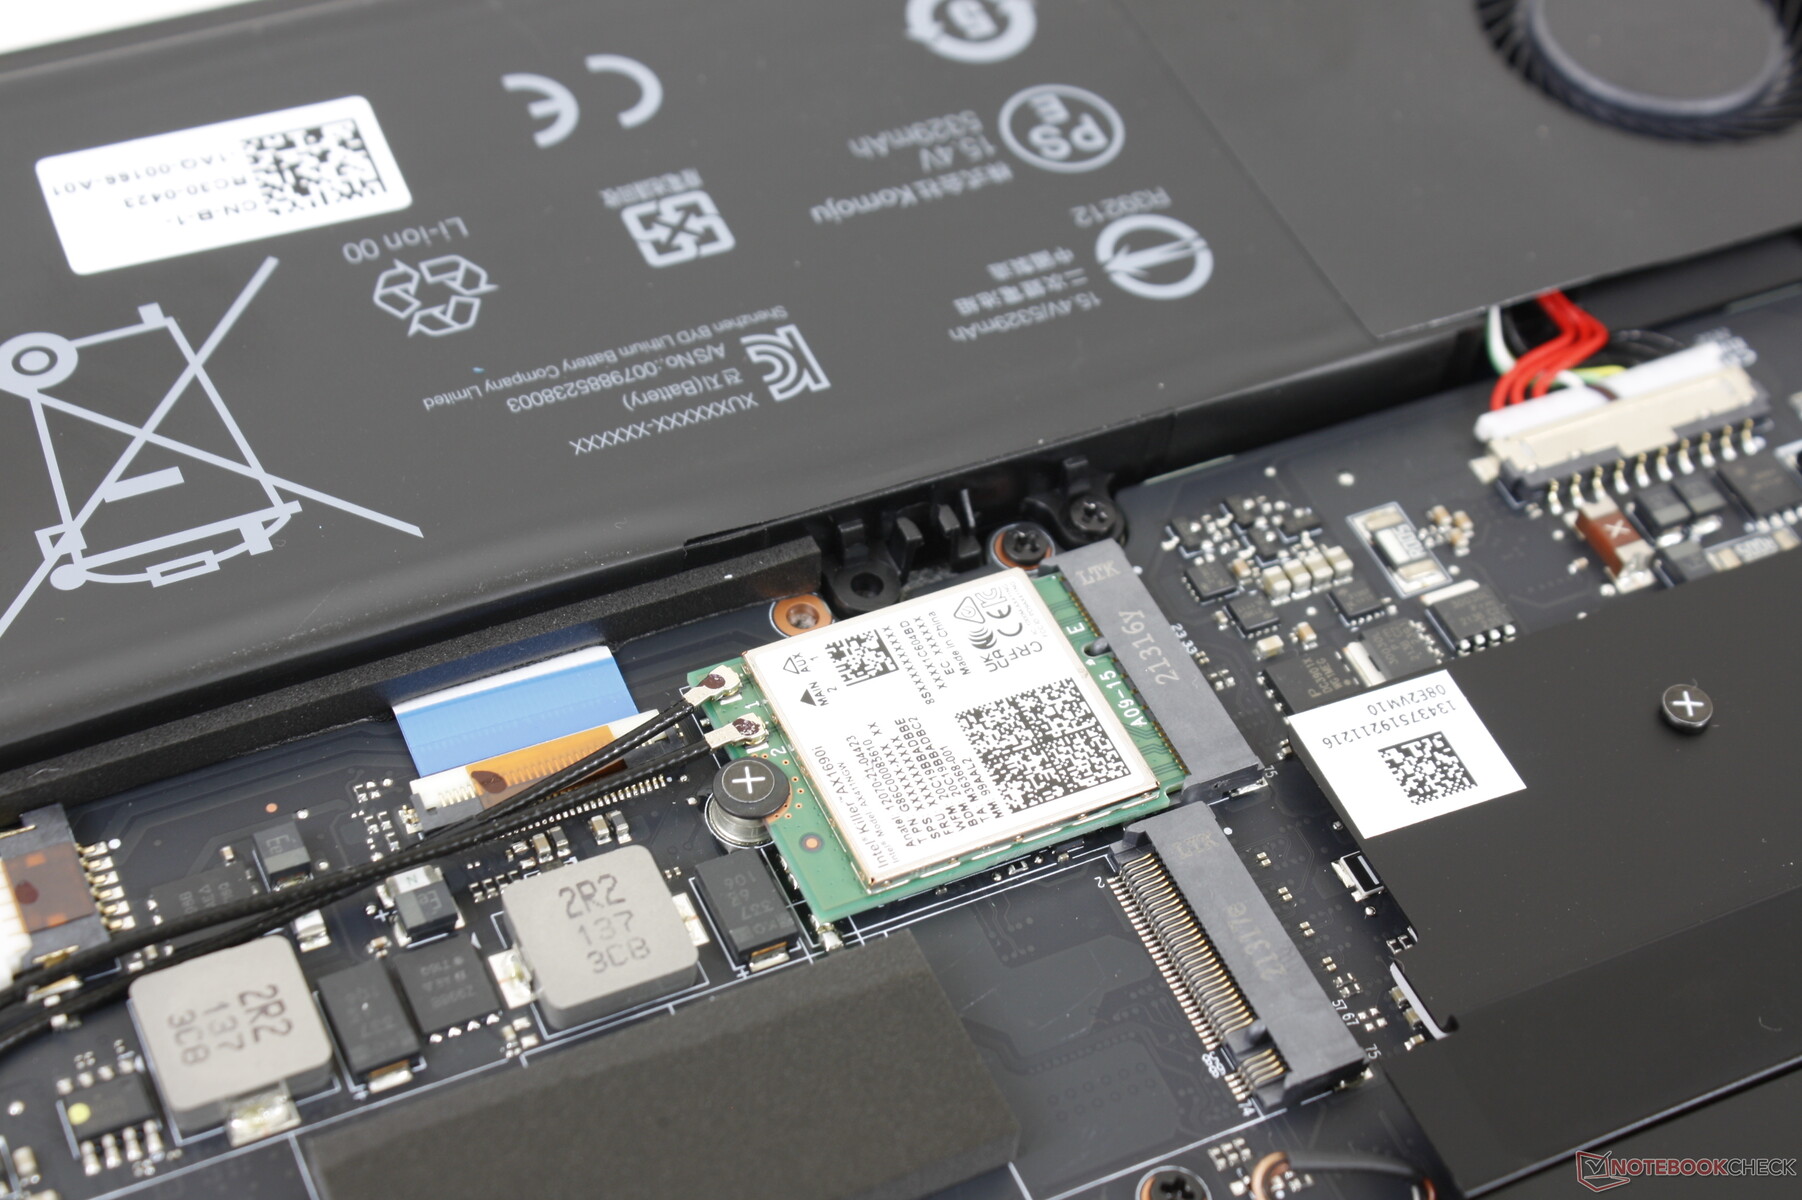
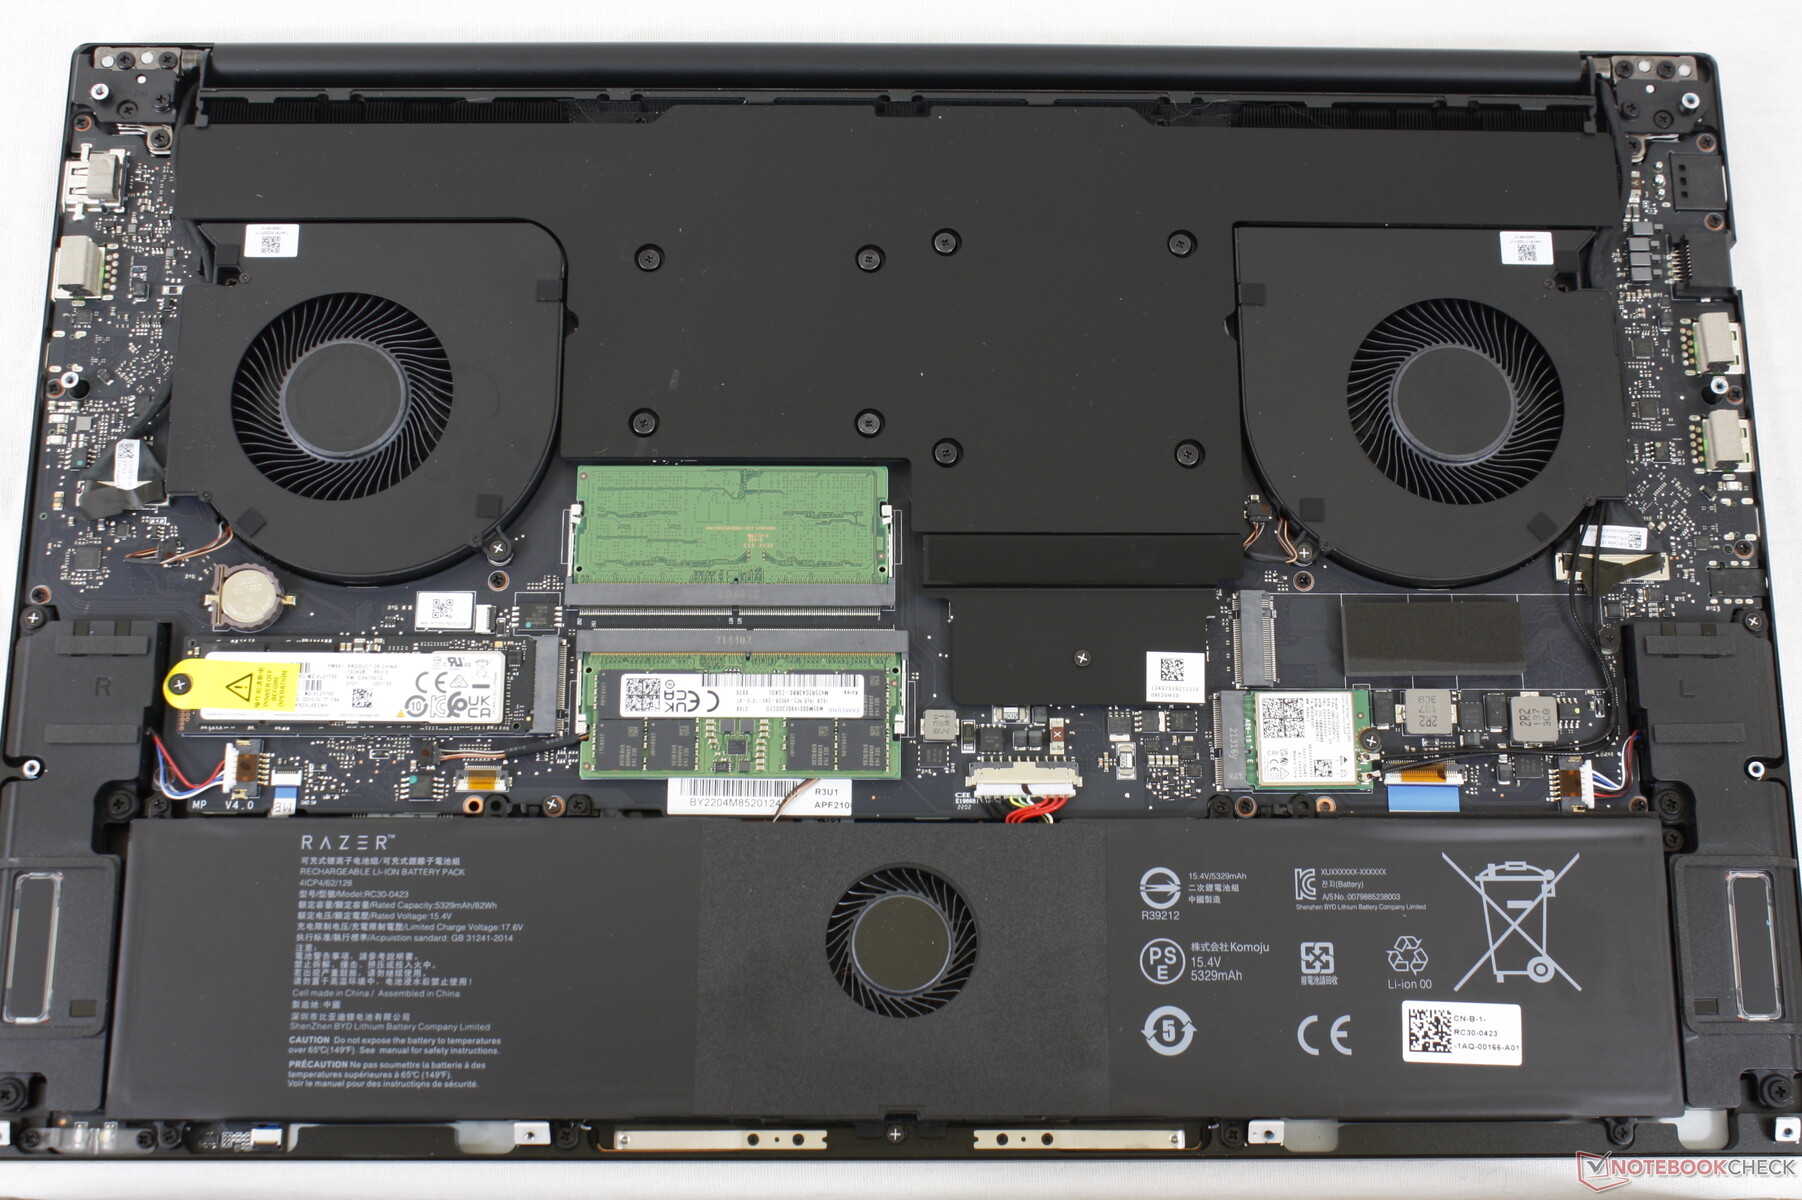
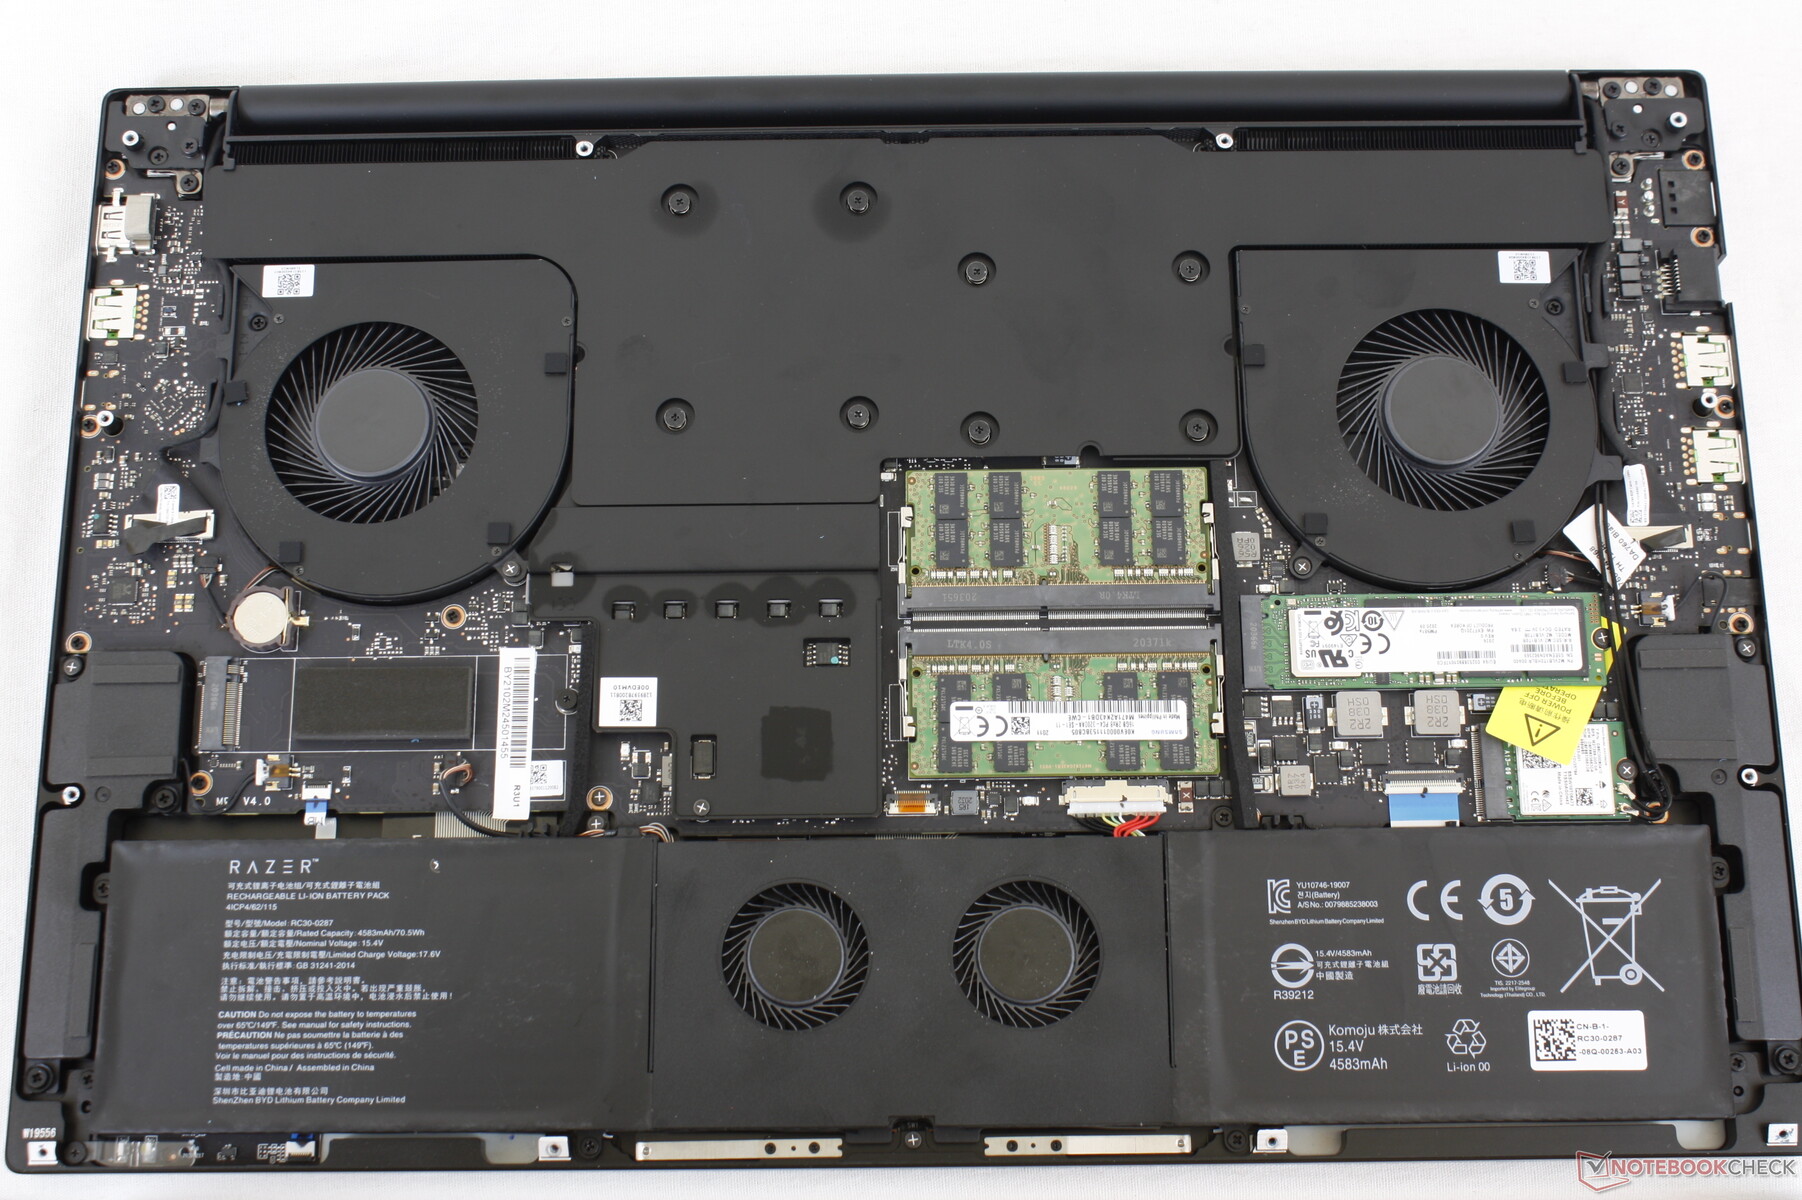
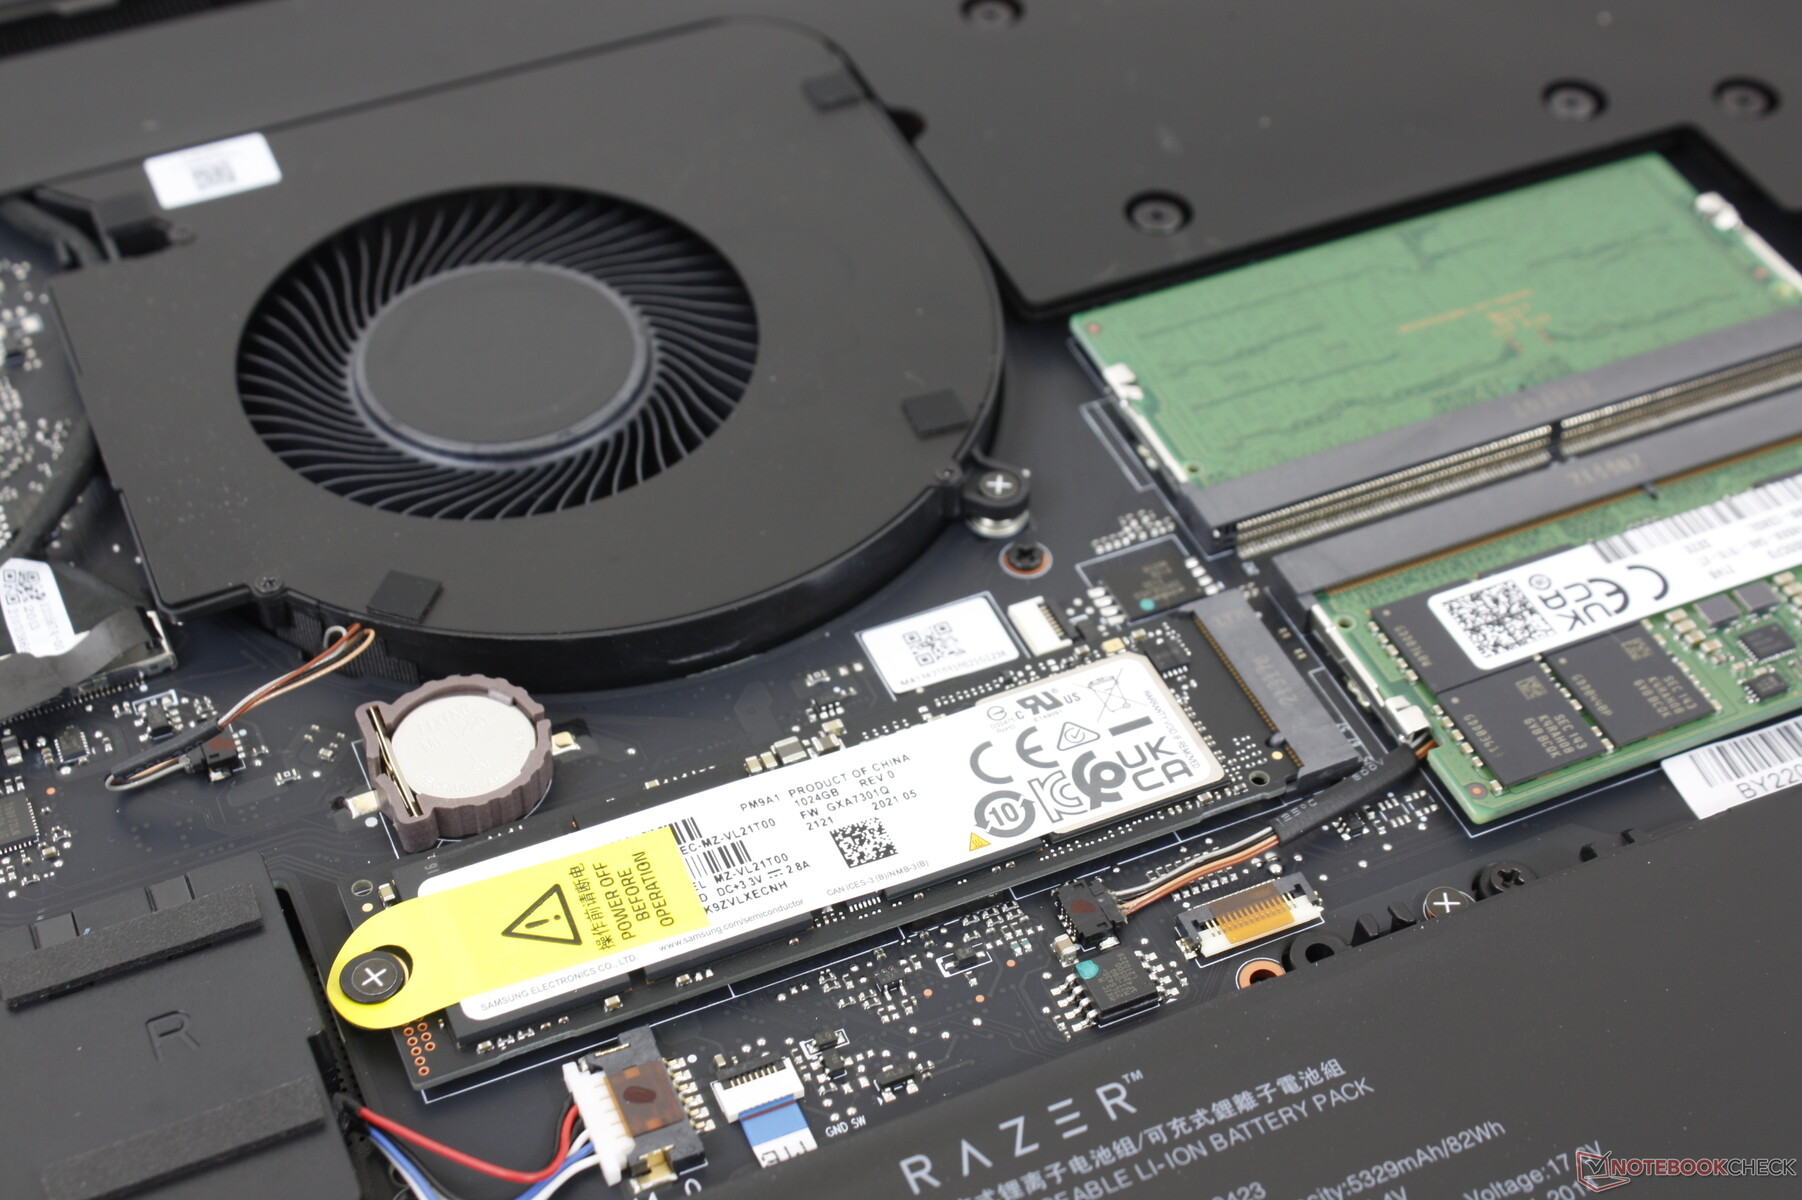
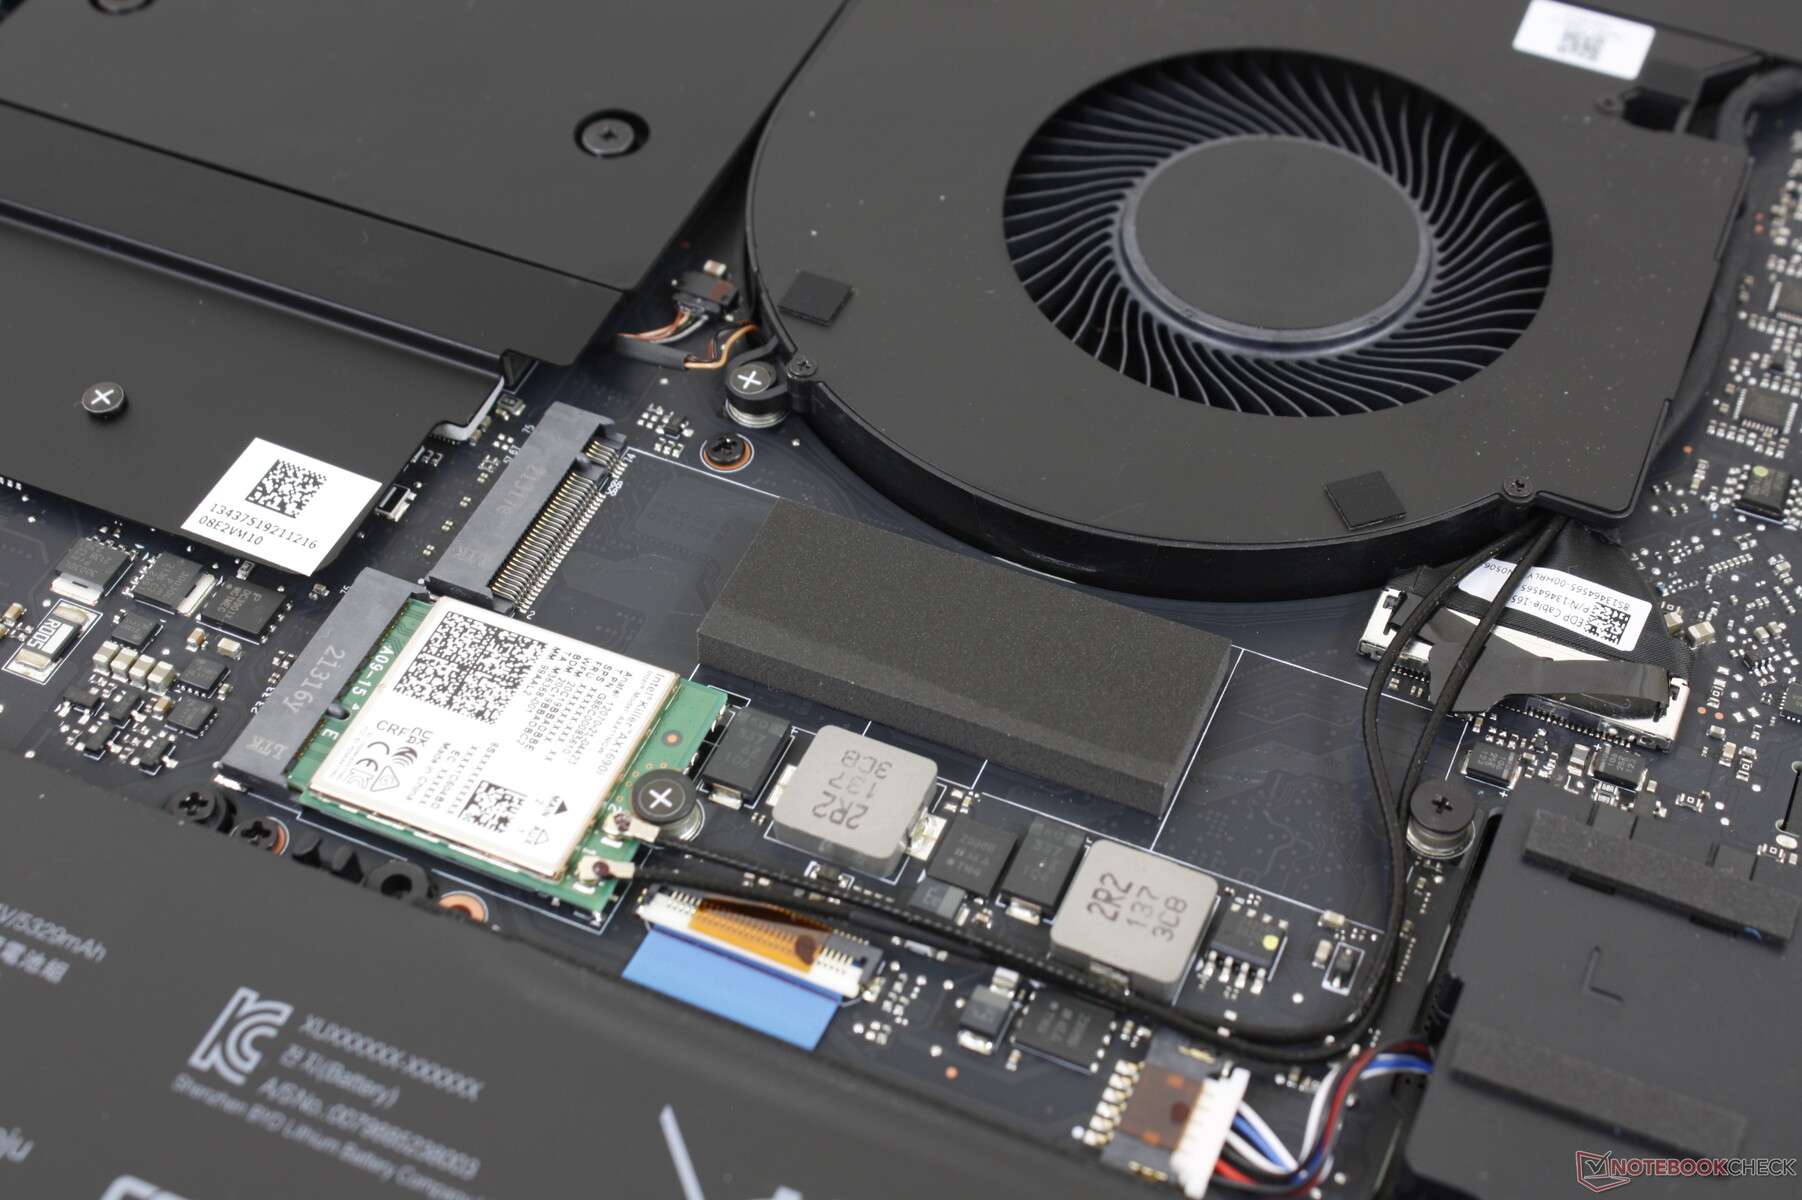
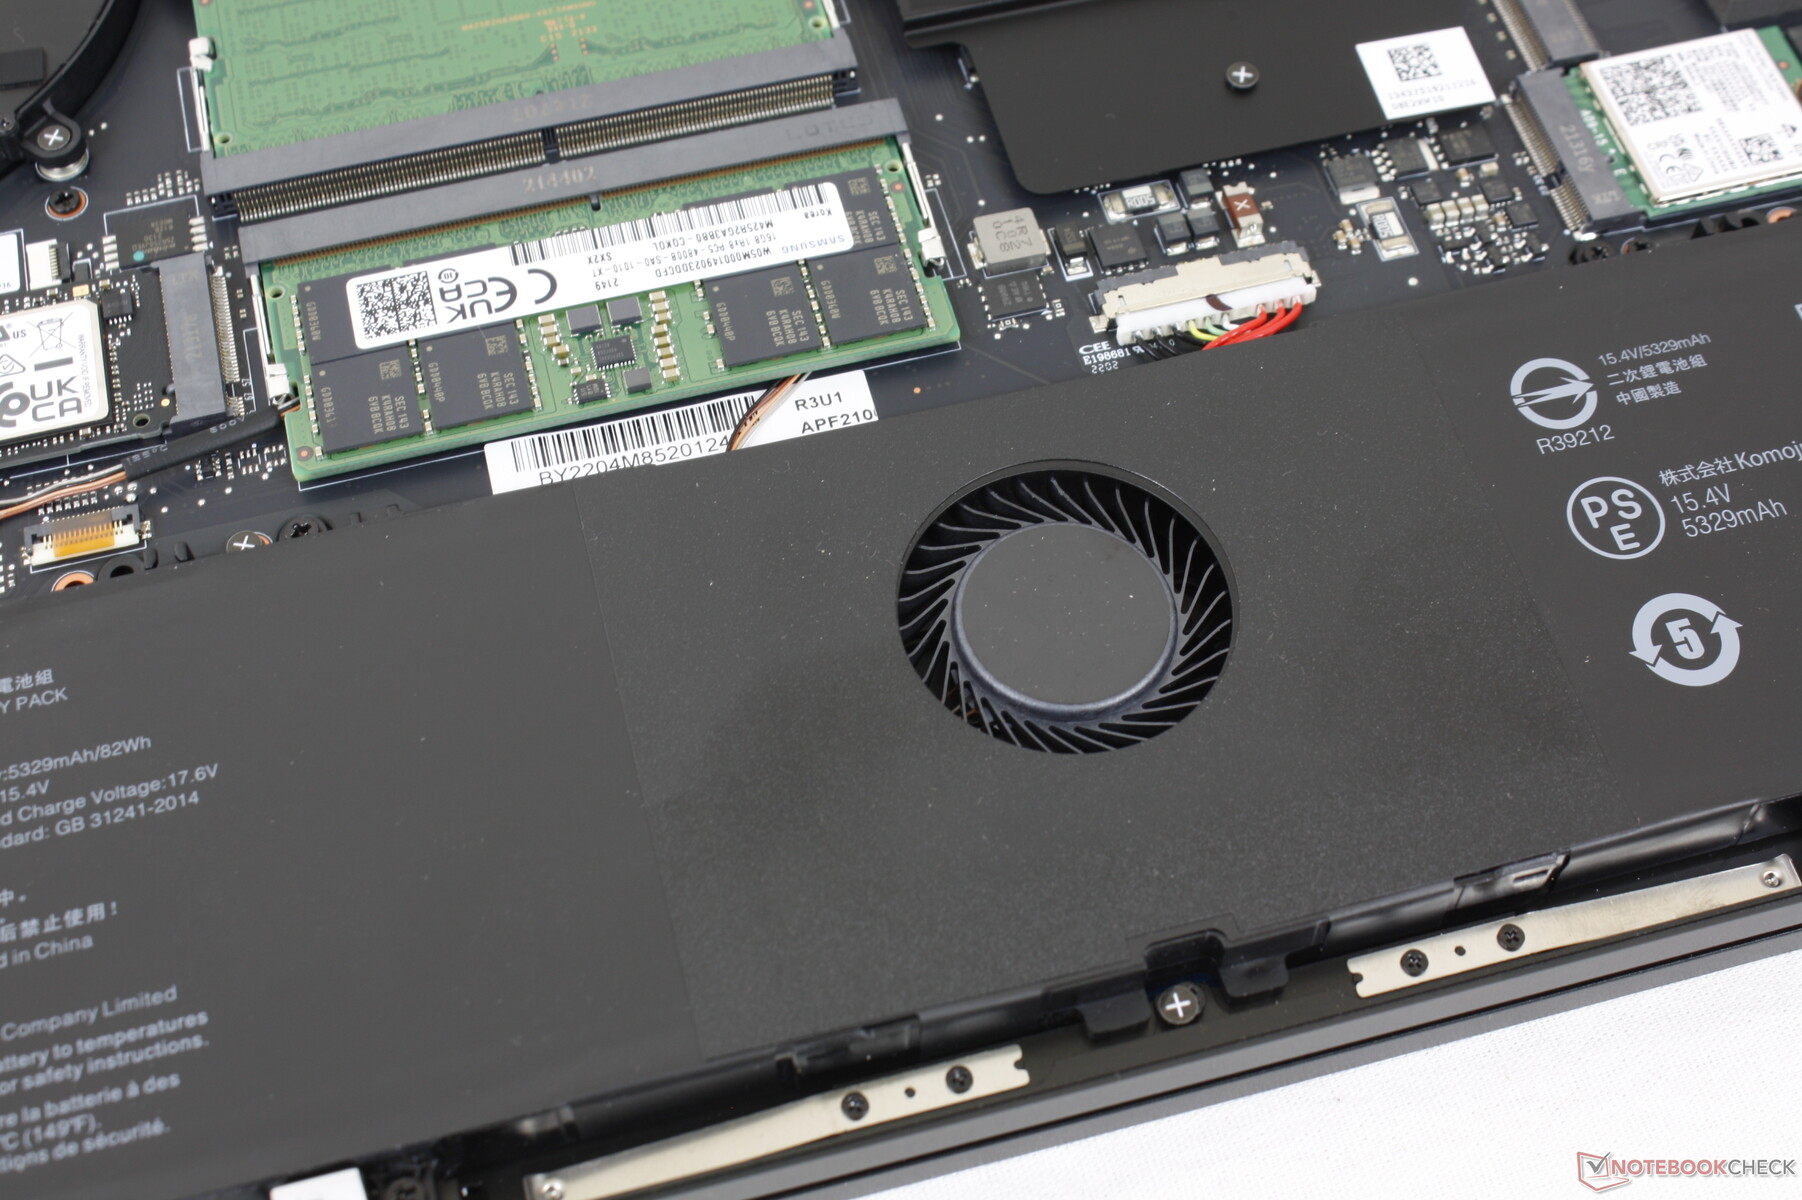
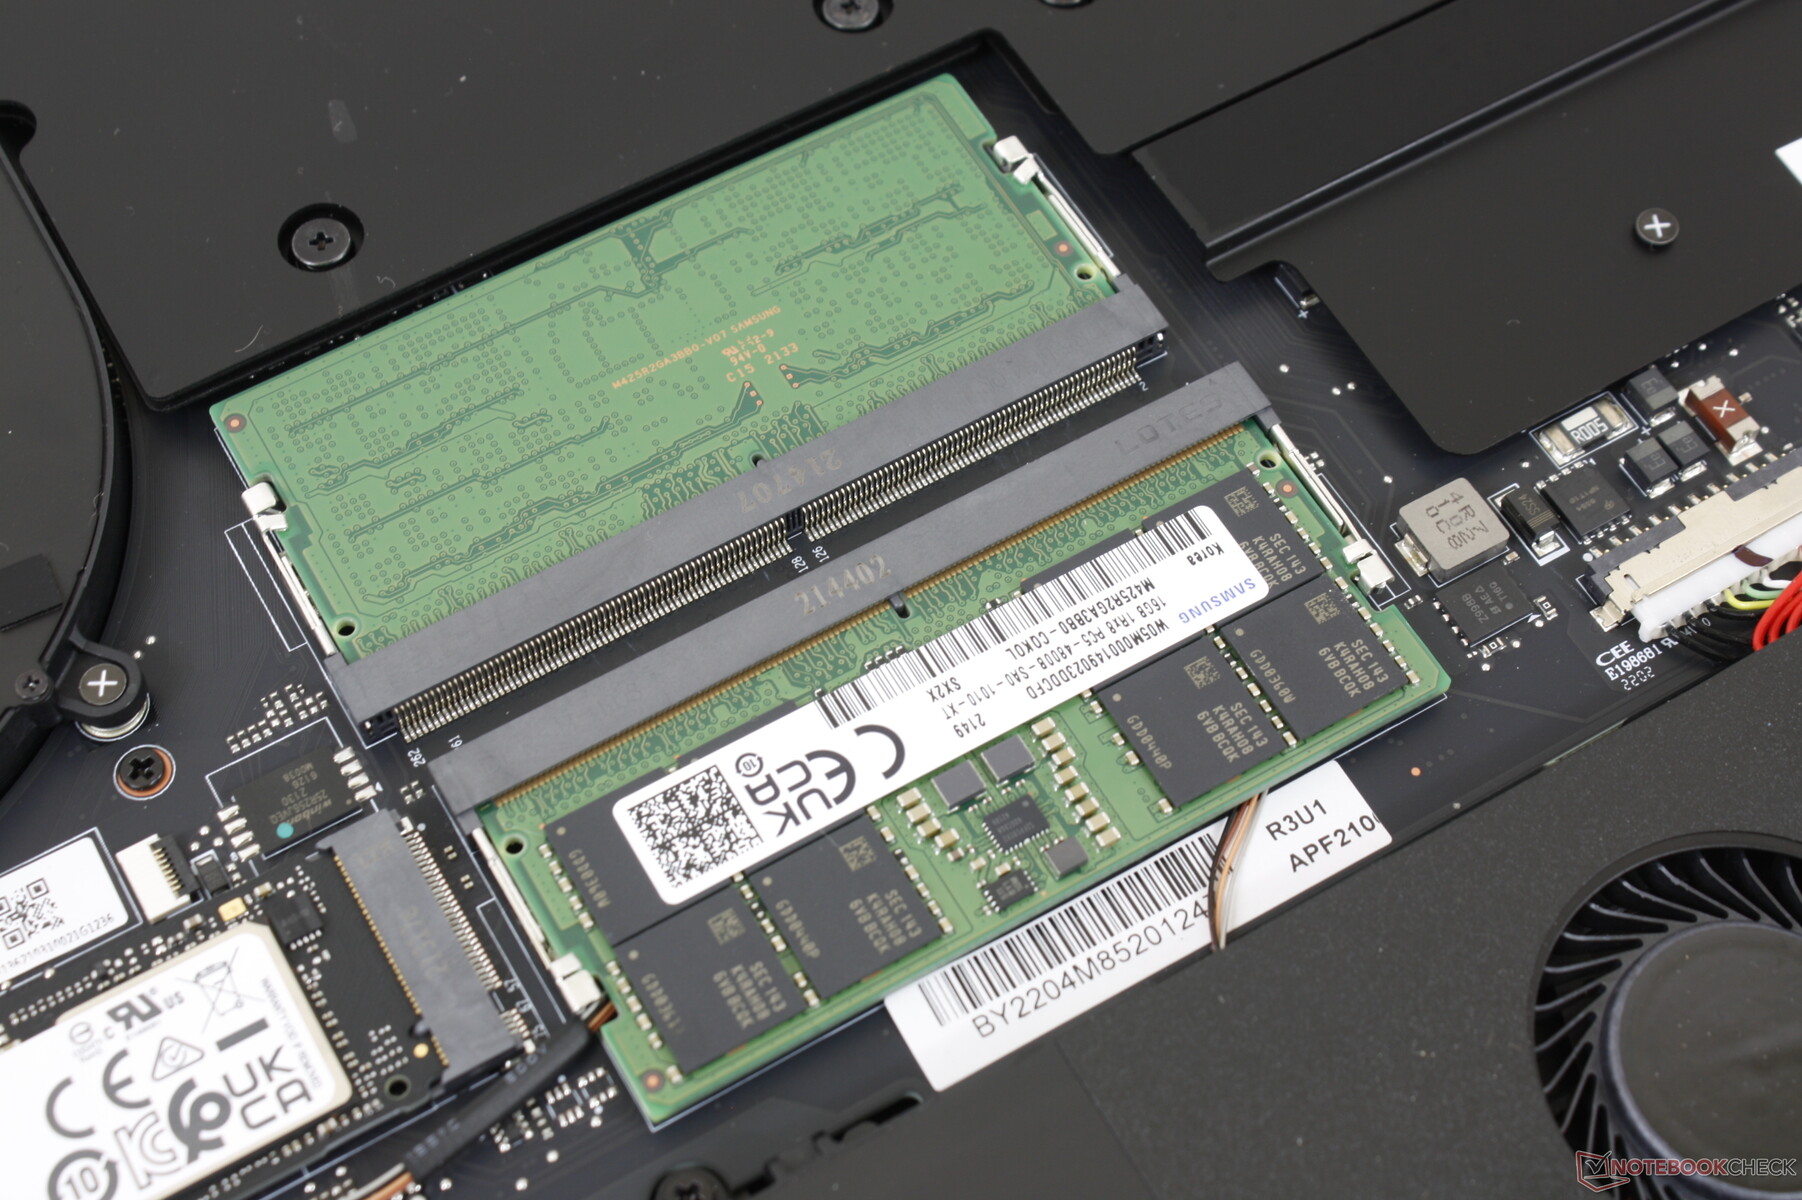
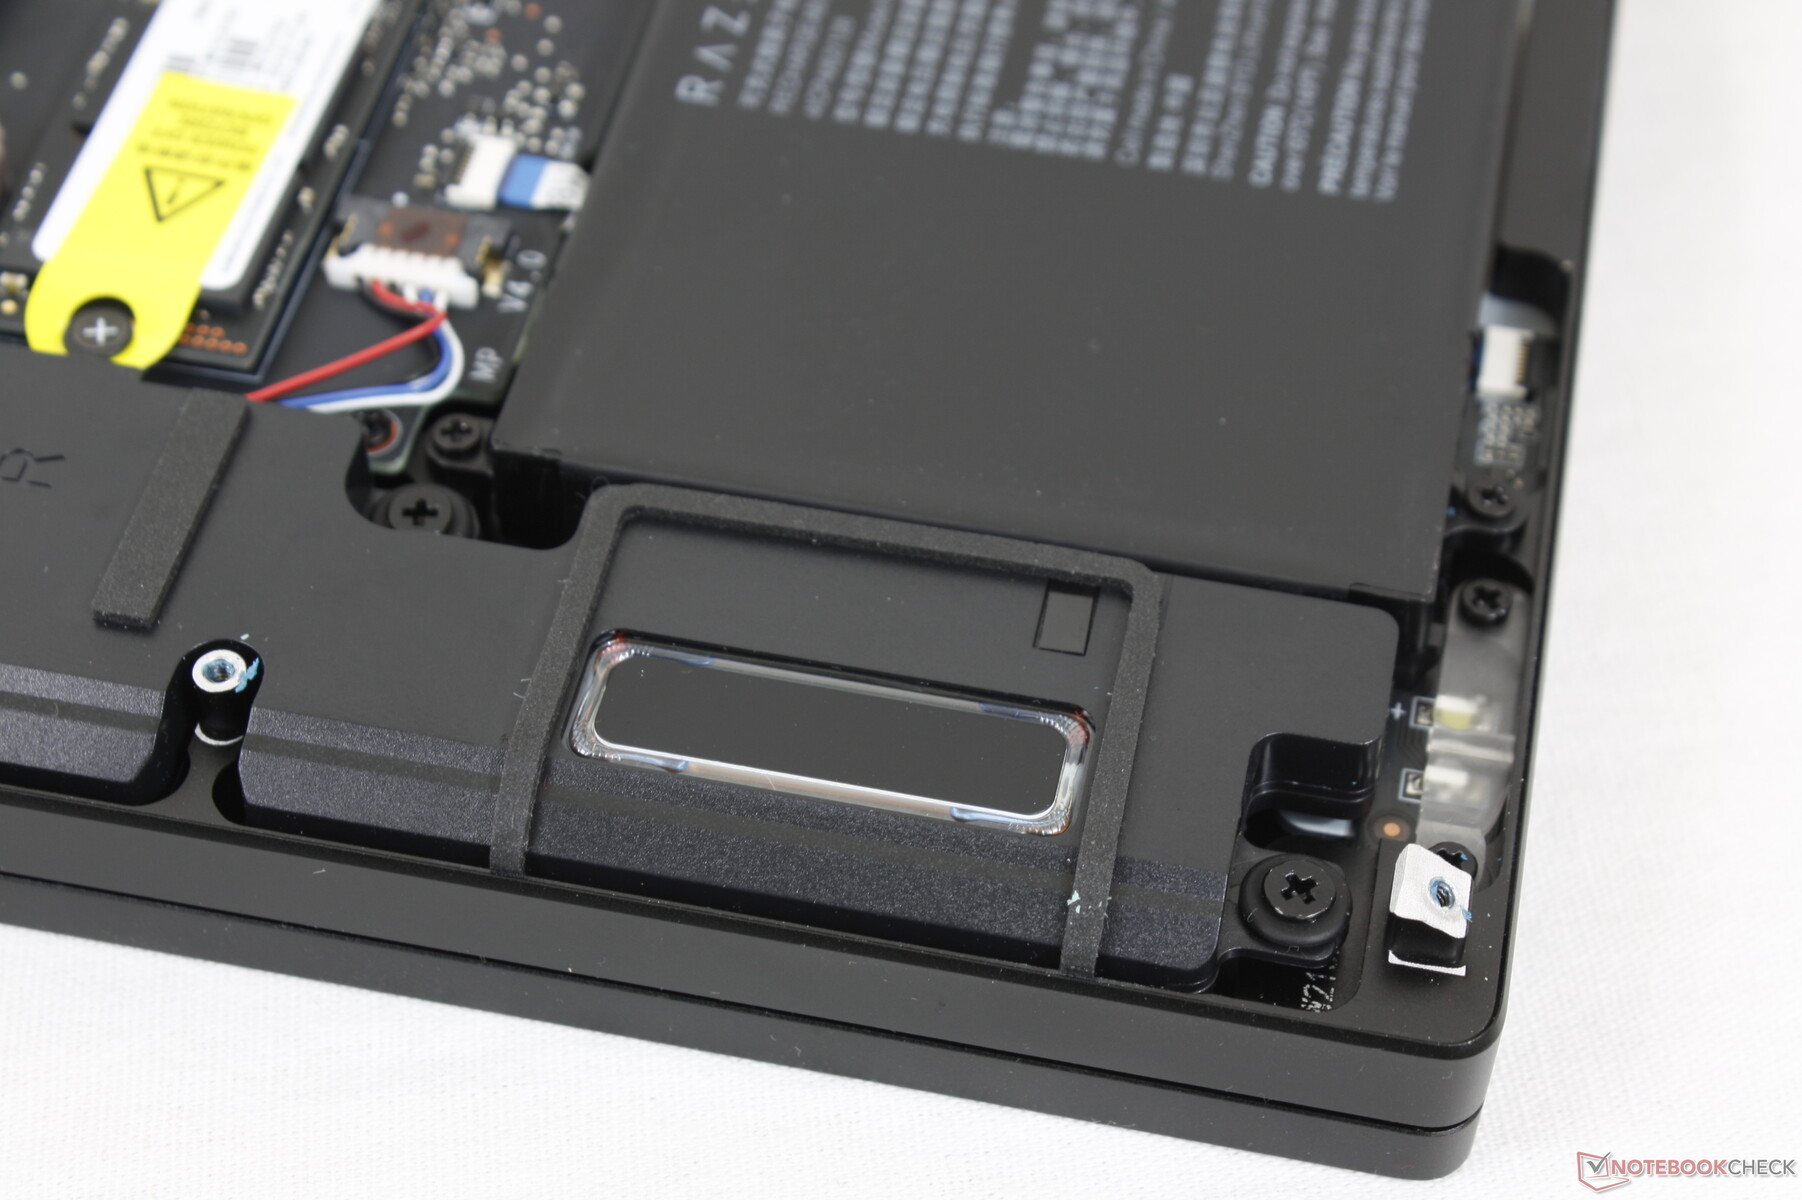
Mantenimiento
El panel inferior es de nuevo relativamente fácil de quitar con una llave Torx T5. Aunque los usuarios tienen acceso directo a las 2 ranuras SODIMM DDR5 y a las 2 ranuras SSD M.2 PCIe4, la disposición de la placa base ha cambiado notablemente con respecto al modelo del año pasado, como muestran las imágenes comparativas de abajo.
Accesorios y garantía
La caja incluye el adaptador de CA, documentación y una hoja de pegatinas con el logotipo de Razer. Razer introduce una garantía limitada de dos años para la batería como estándar junto con la garantía básica de un año para el portátil con cada nueva compra de un modelo Blade de 12ª generación.
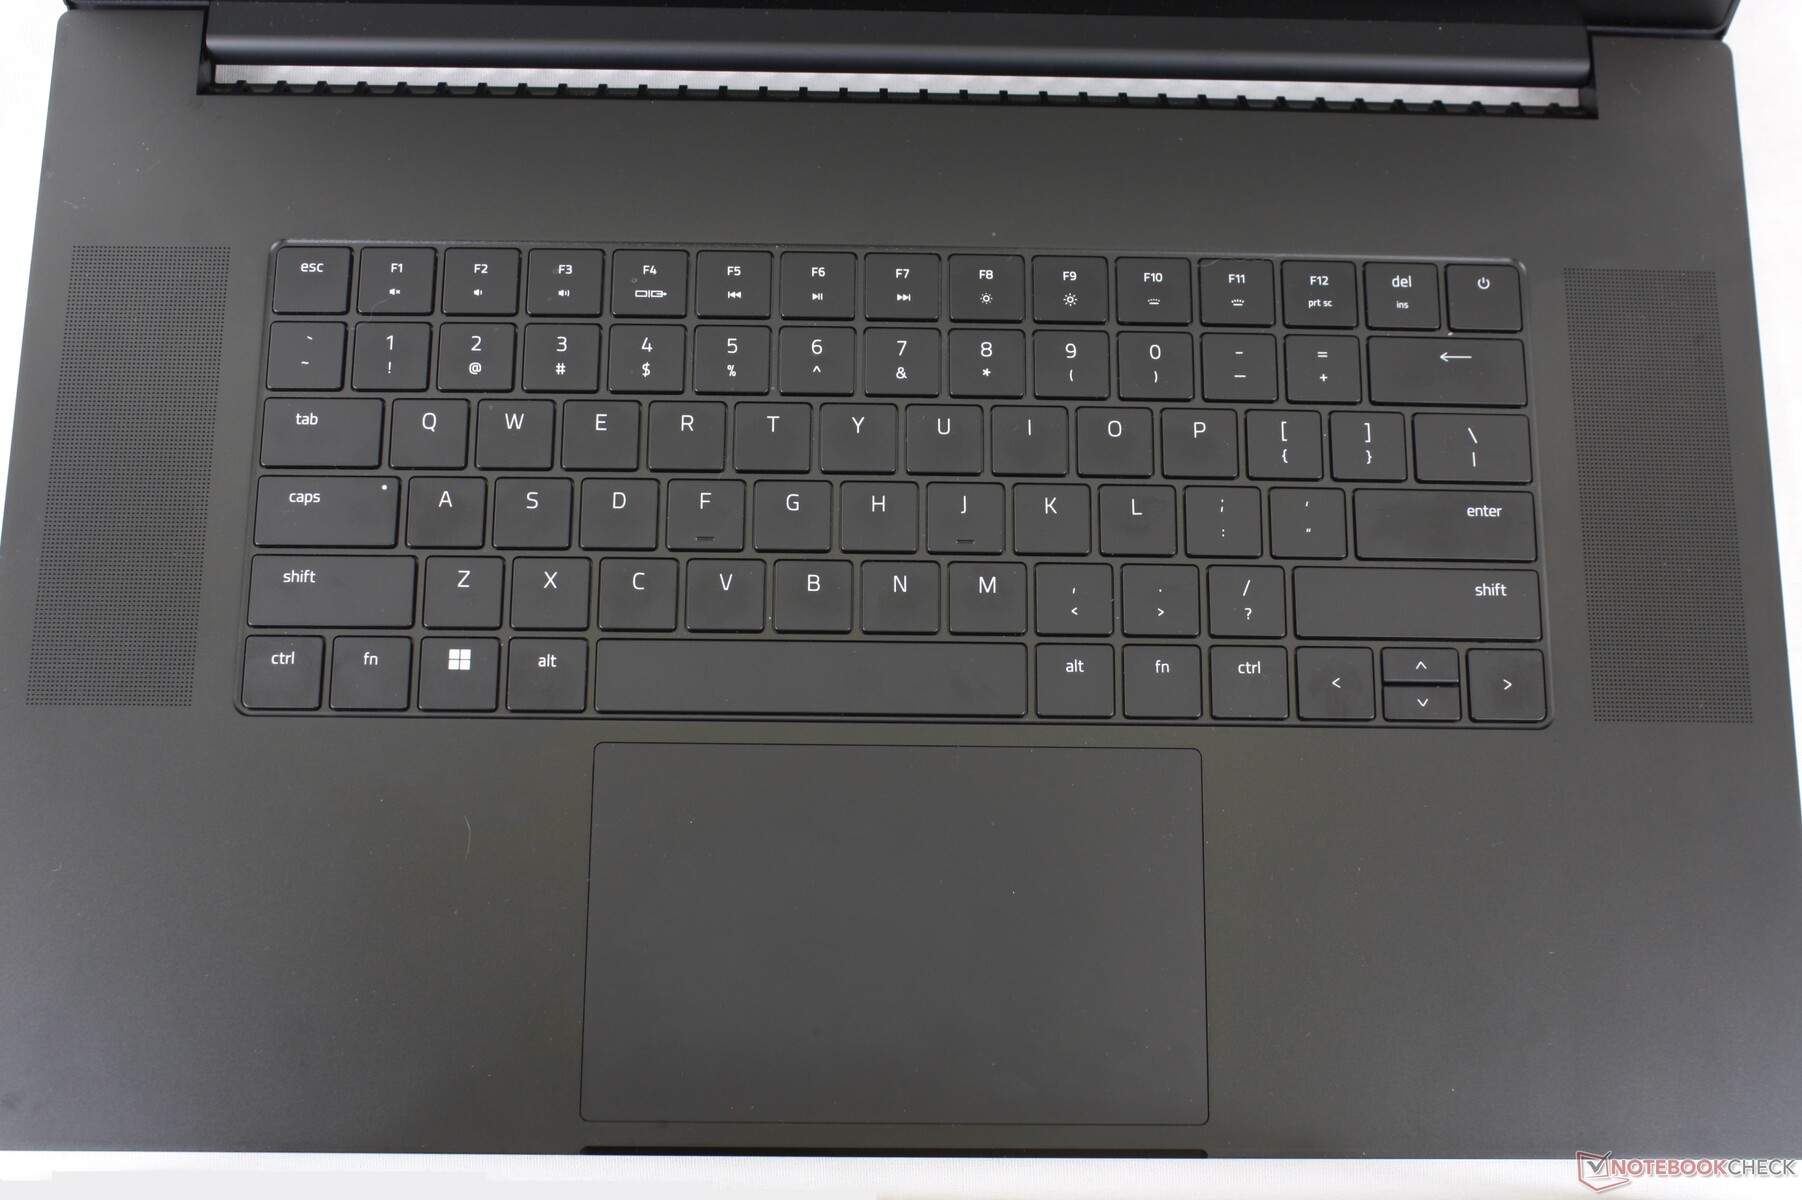
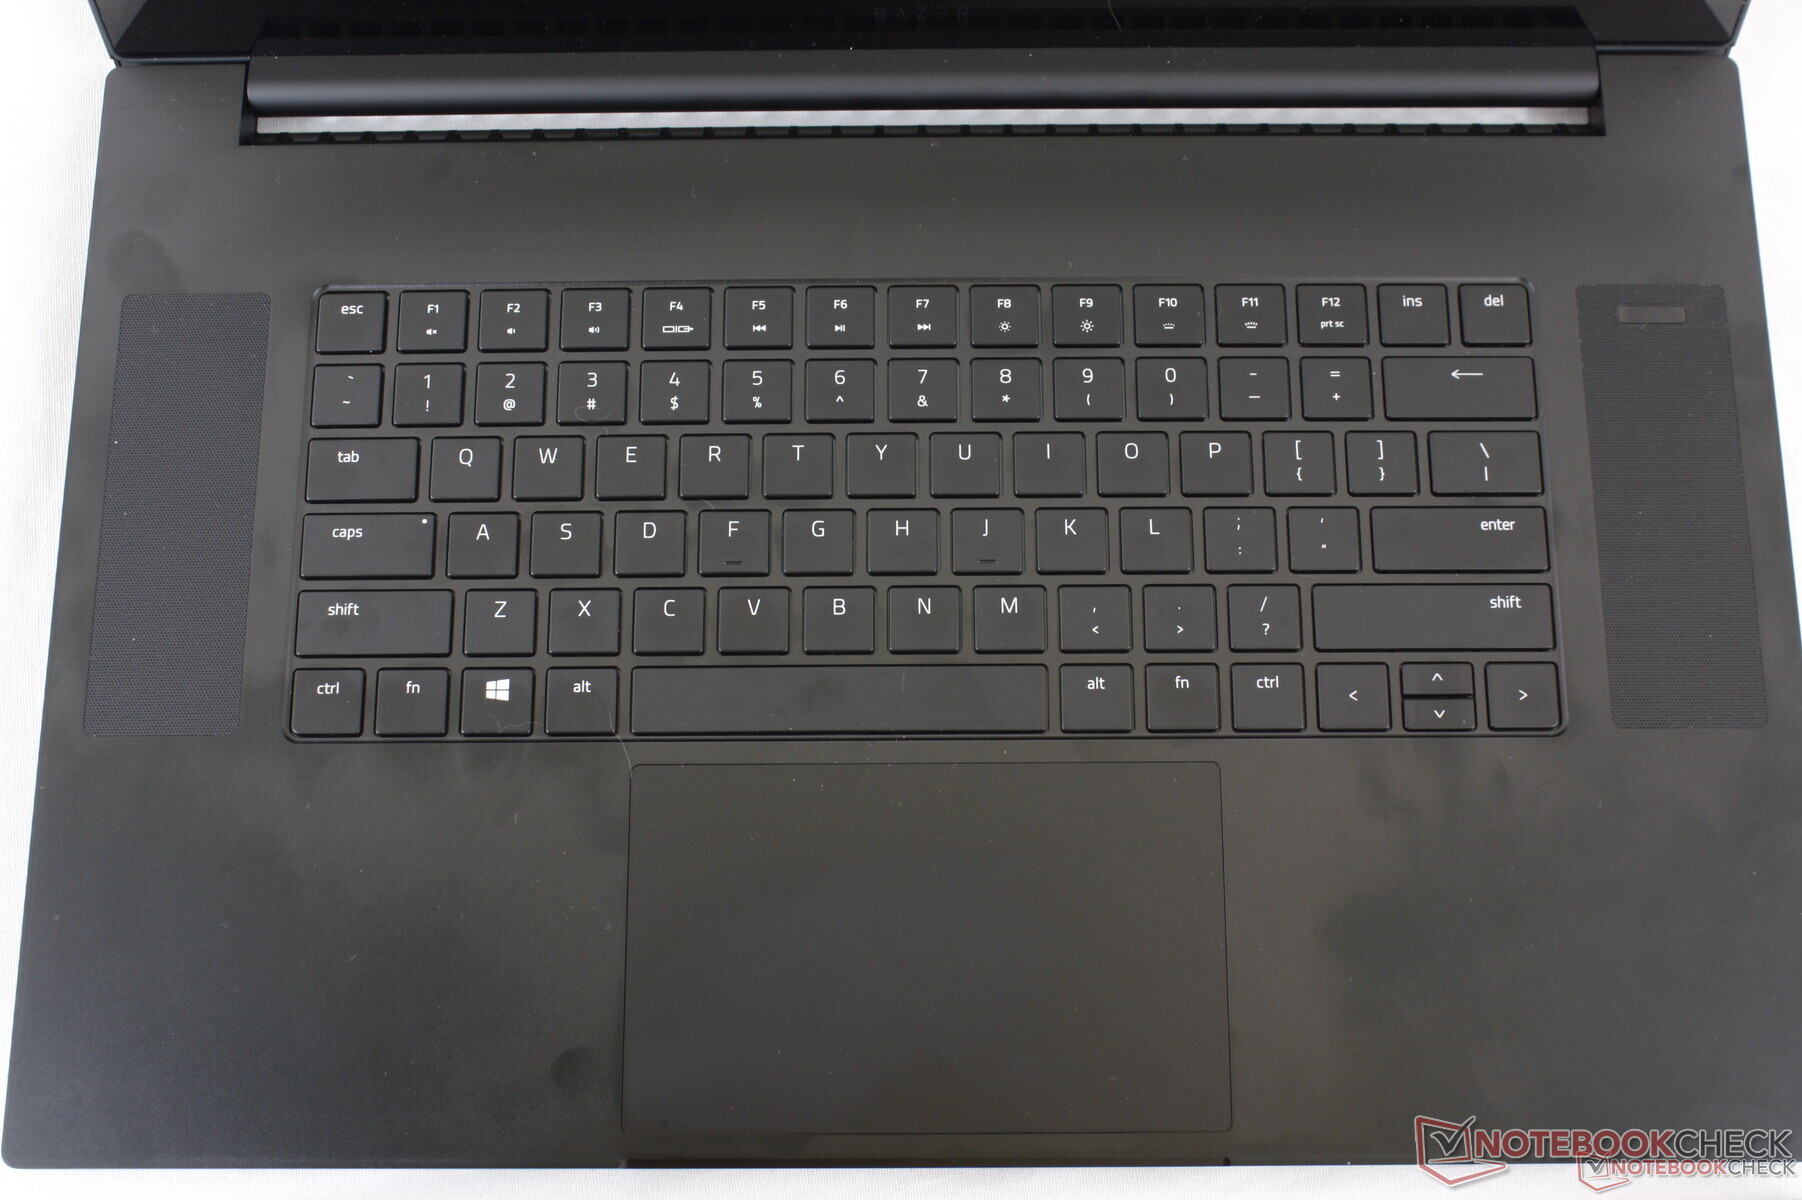
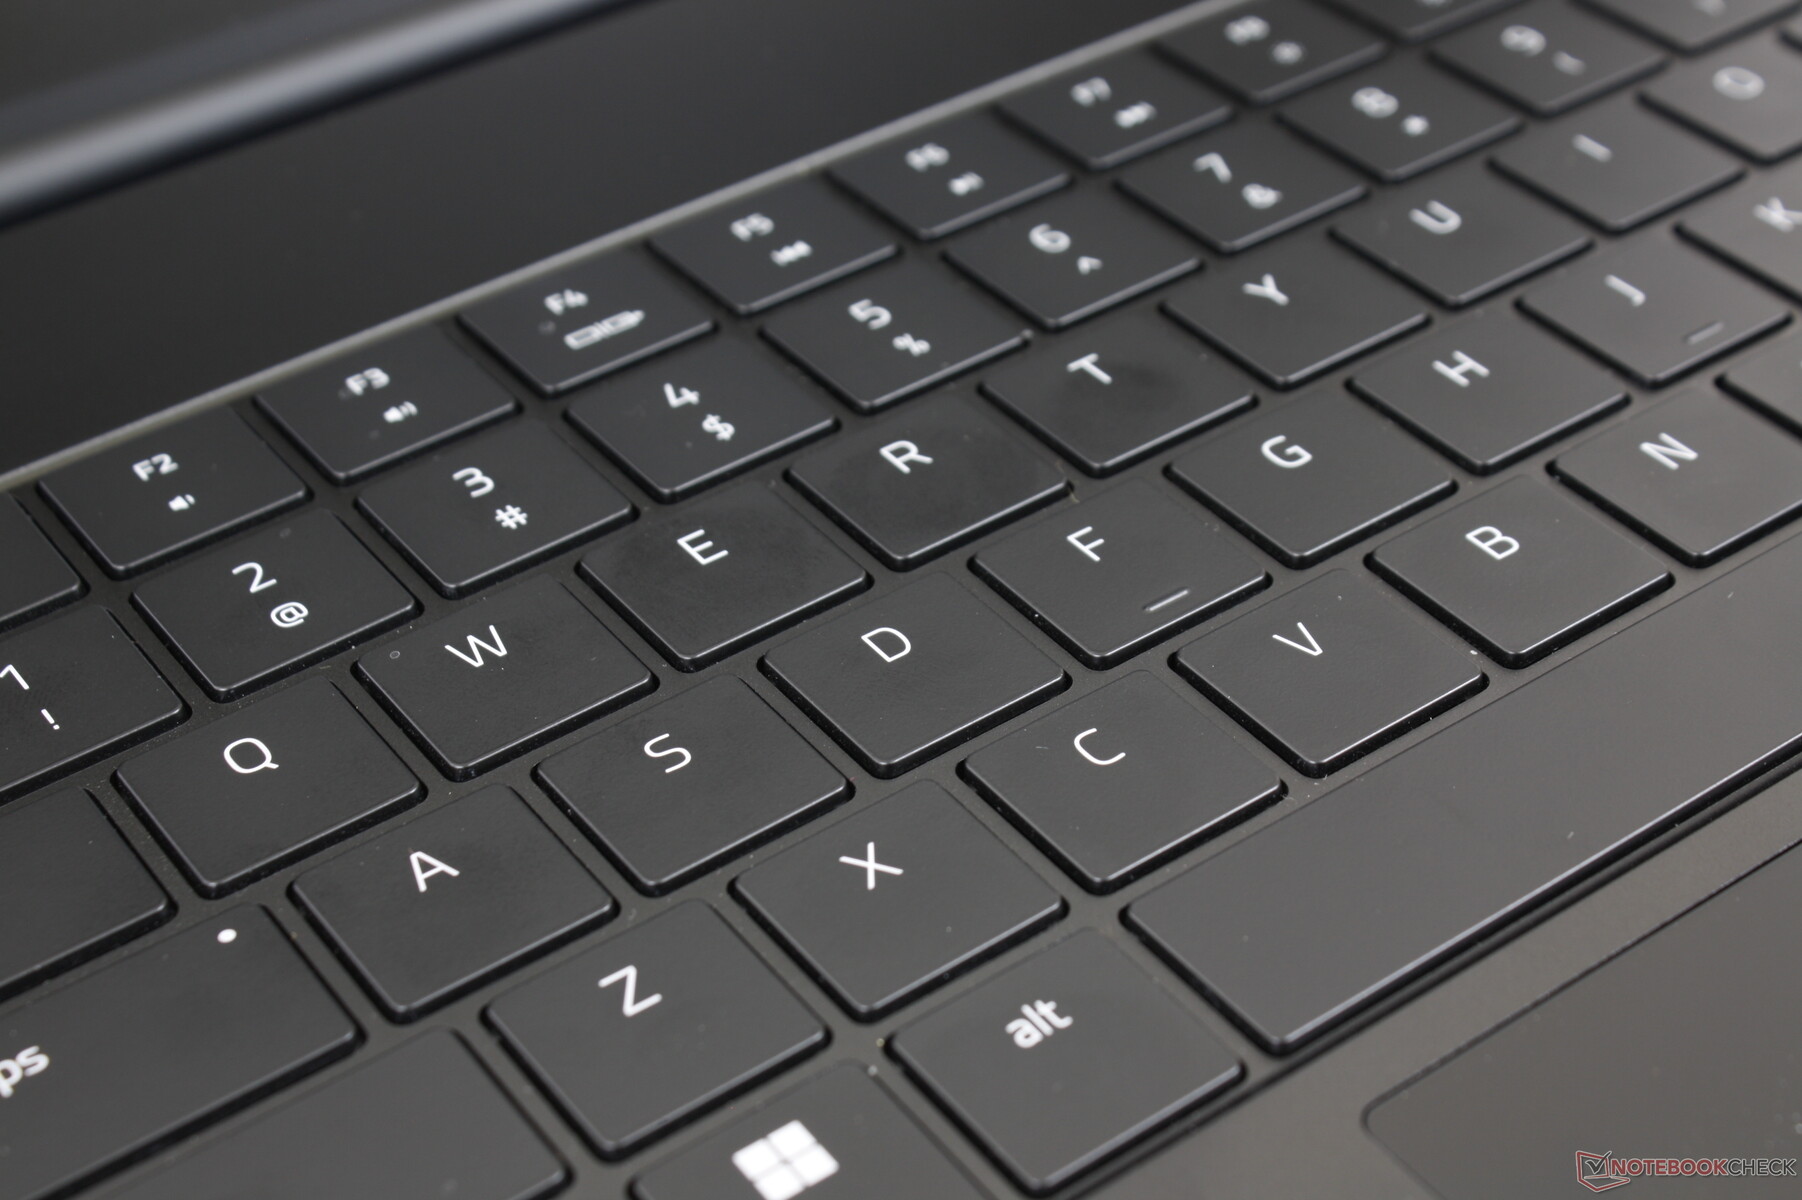
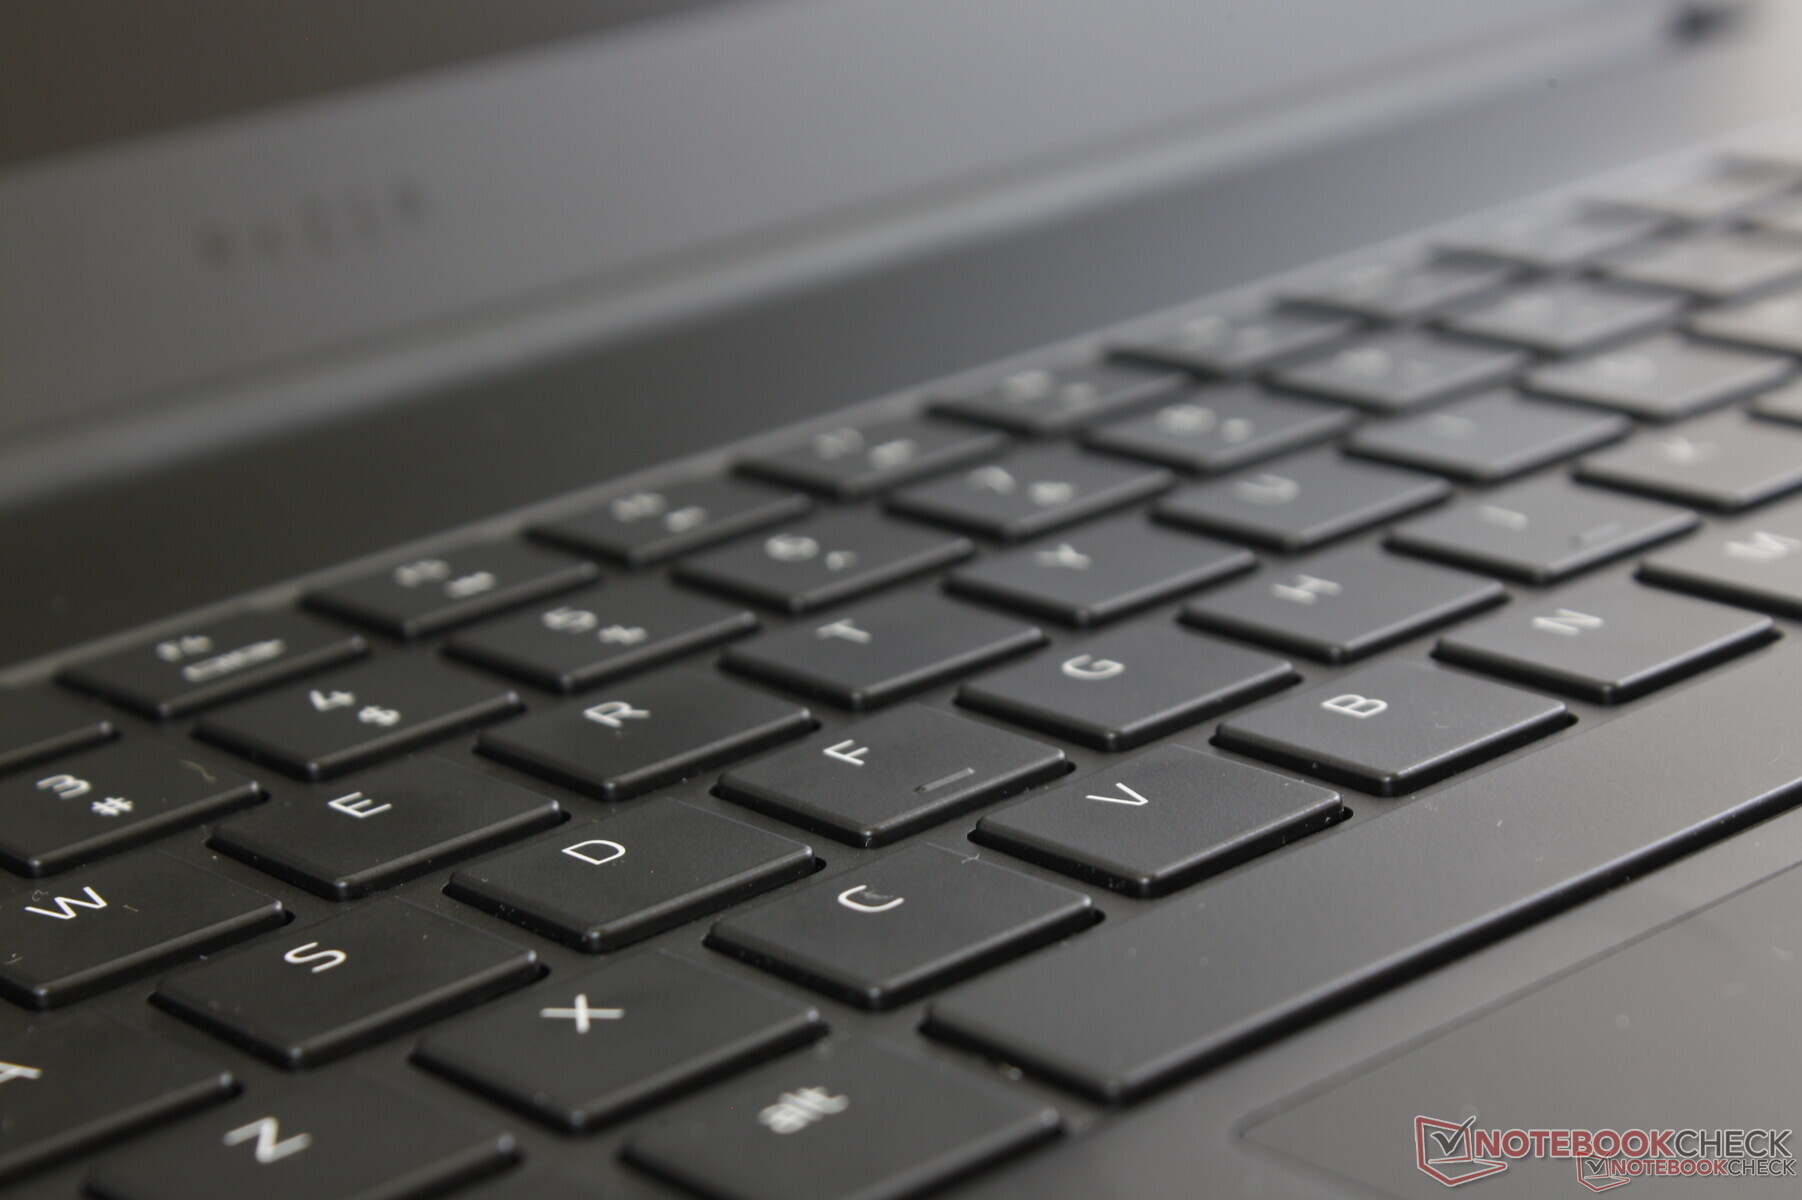
Dispositivos de entrada - Teclas más grandes, el mismo clickpad
Teclado
El 2022 Blade 17 comparte el mismo teclado que en el 2022 Blade 15. Razer ha aumentado el tamaño de las teclas manteniendo la misma longitud y anchura total del teclado para facilitar la escritura. Por lo demás, la respuesta y el recorrido son idénticos a los del modelo del año pasado a pesar del cambio de tamaño. Sospechamos que más usuarios aceptarán esta pequeña actualización anual en lugar de un cambio completo a teclas ópticas o mecánicas que probablemente habría dividido a los fans de Razer.
Teclado táctil
No hay cambios en el touchpad para bien o para mal. Aunque nos gusta la amplia superficie (13 x 8 cm) y la suave tracción, la esponjosa respuesta al pulsar sigue siendo insatisfactoria. Las acciones de arrastrar y soltar son, por tanto, más difíciles en comparación con los portátiles con botones de ratón dedicados como el Asus TUF FX506 de Asus. La desagradable grasa tiende a acumularse en la superficie mate también.
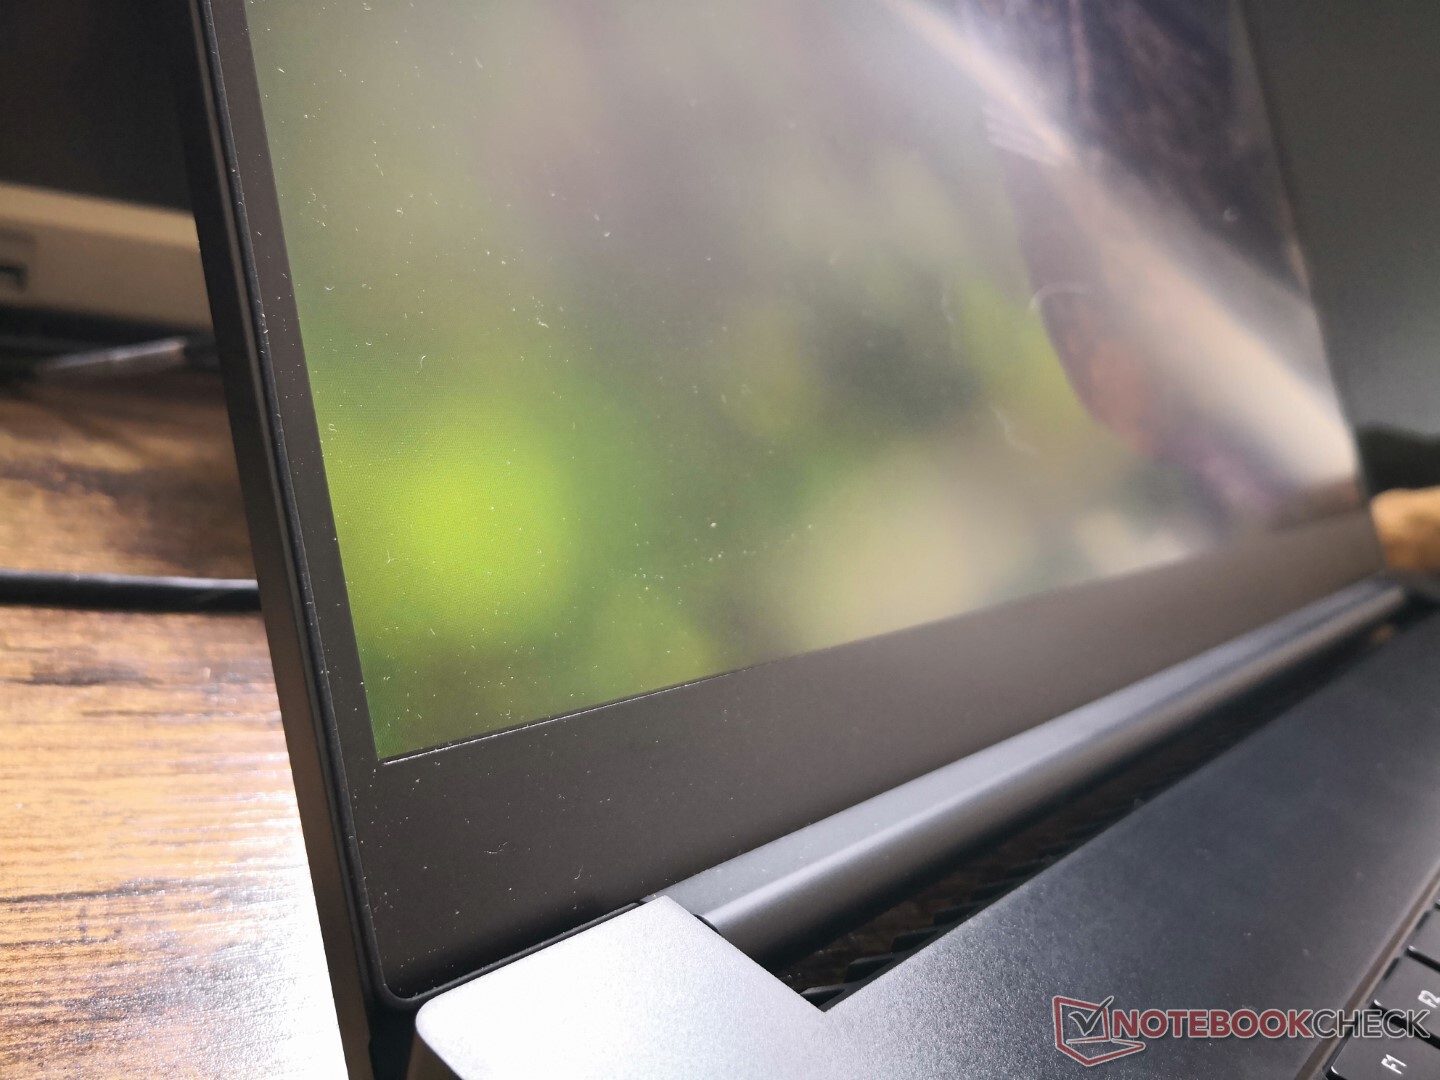
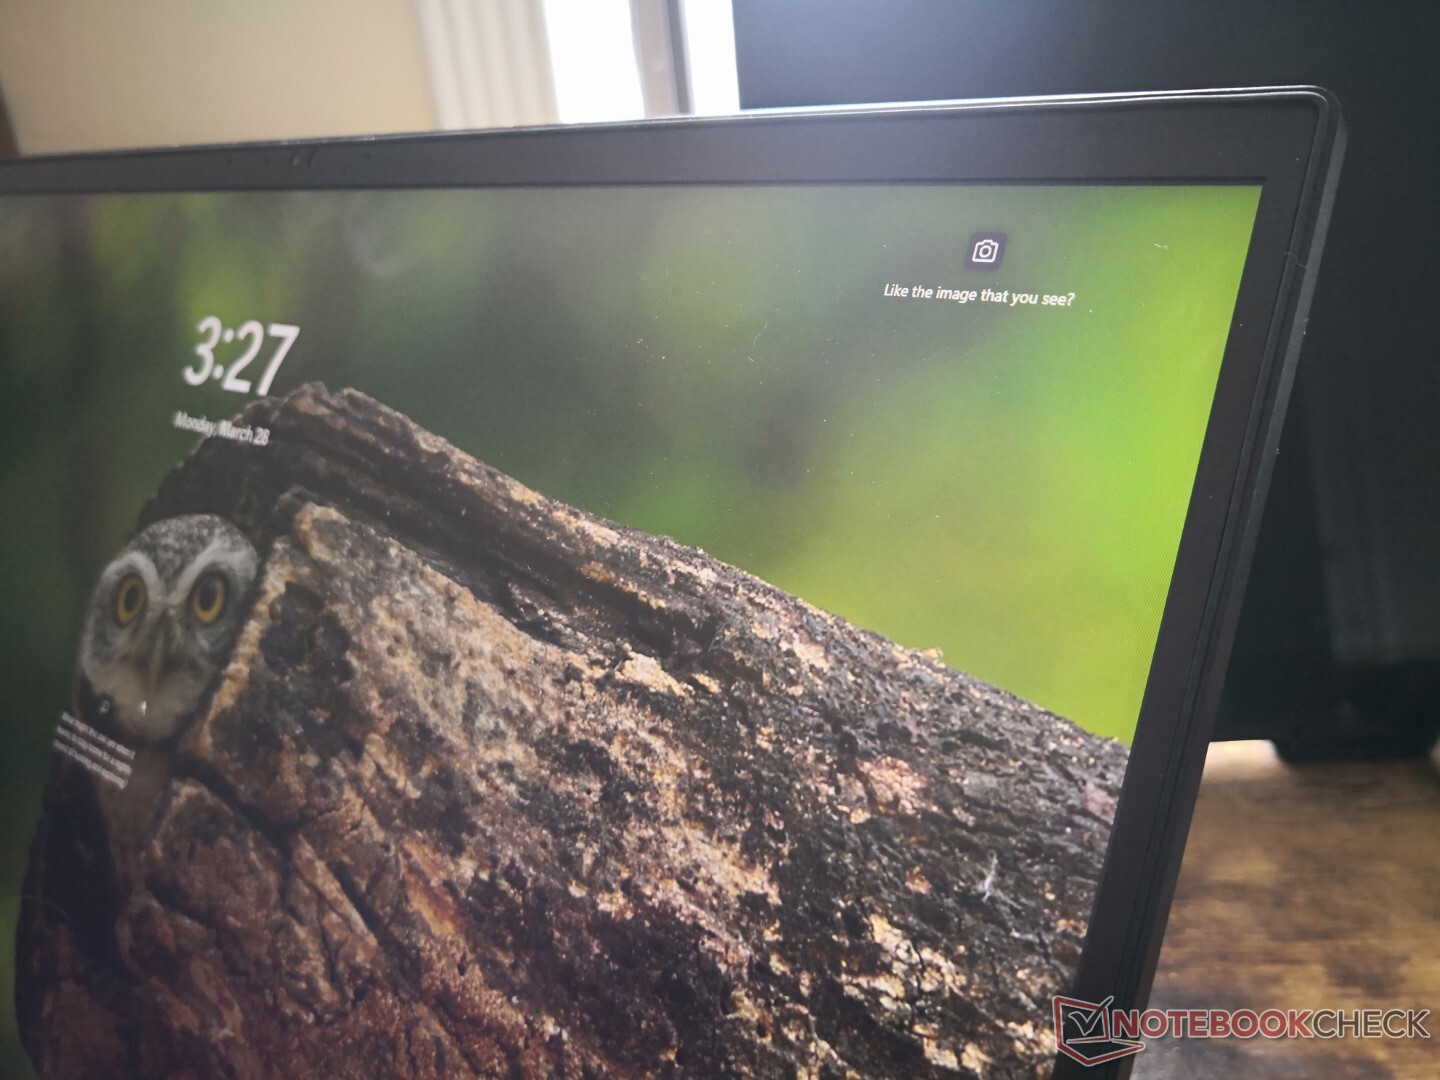
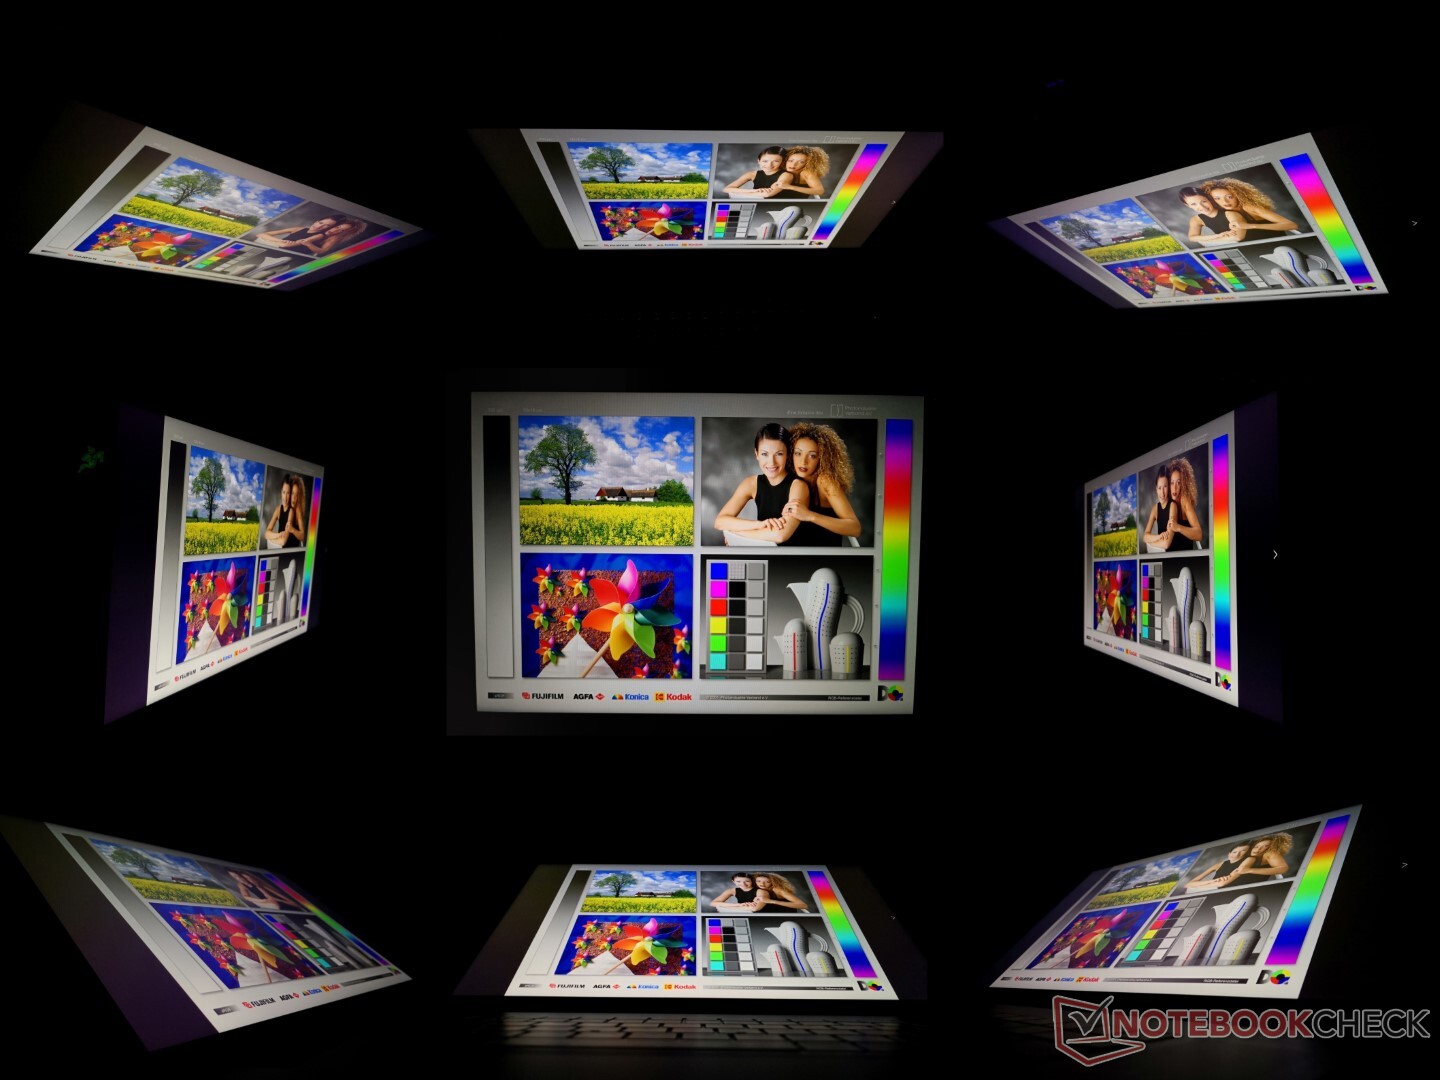
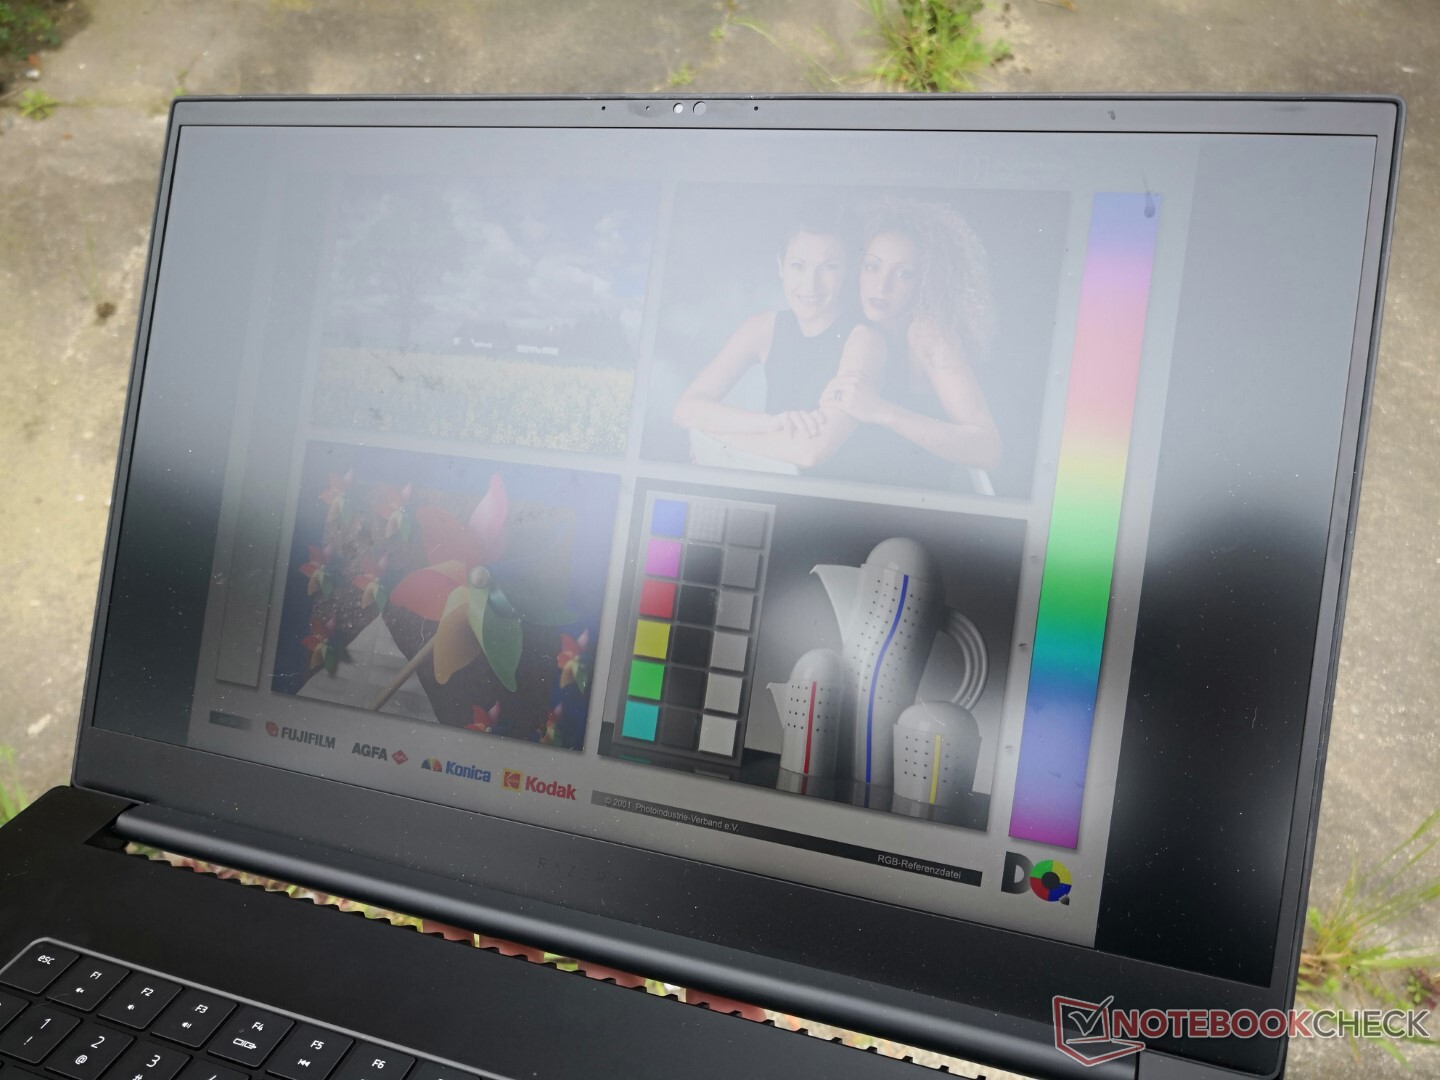
Pantalla - No hay opciones OLED por ahora
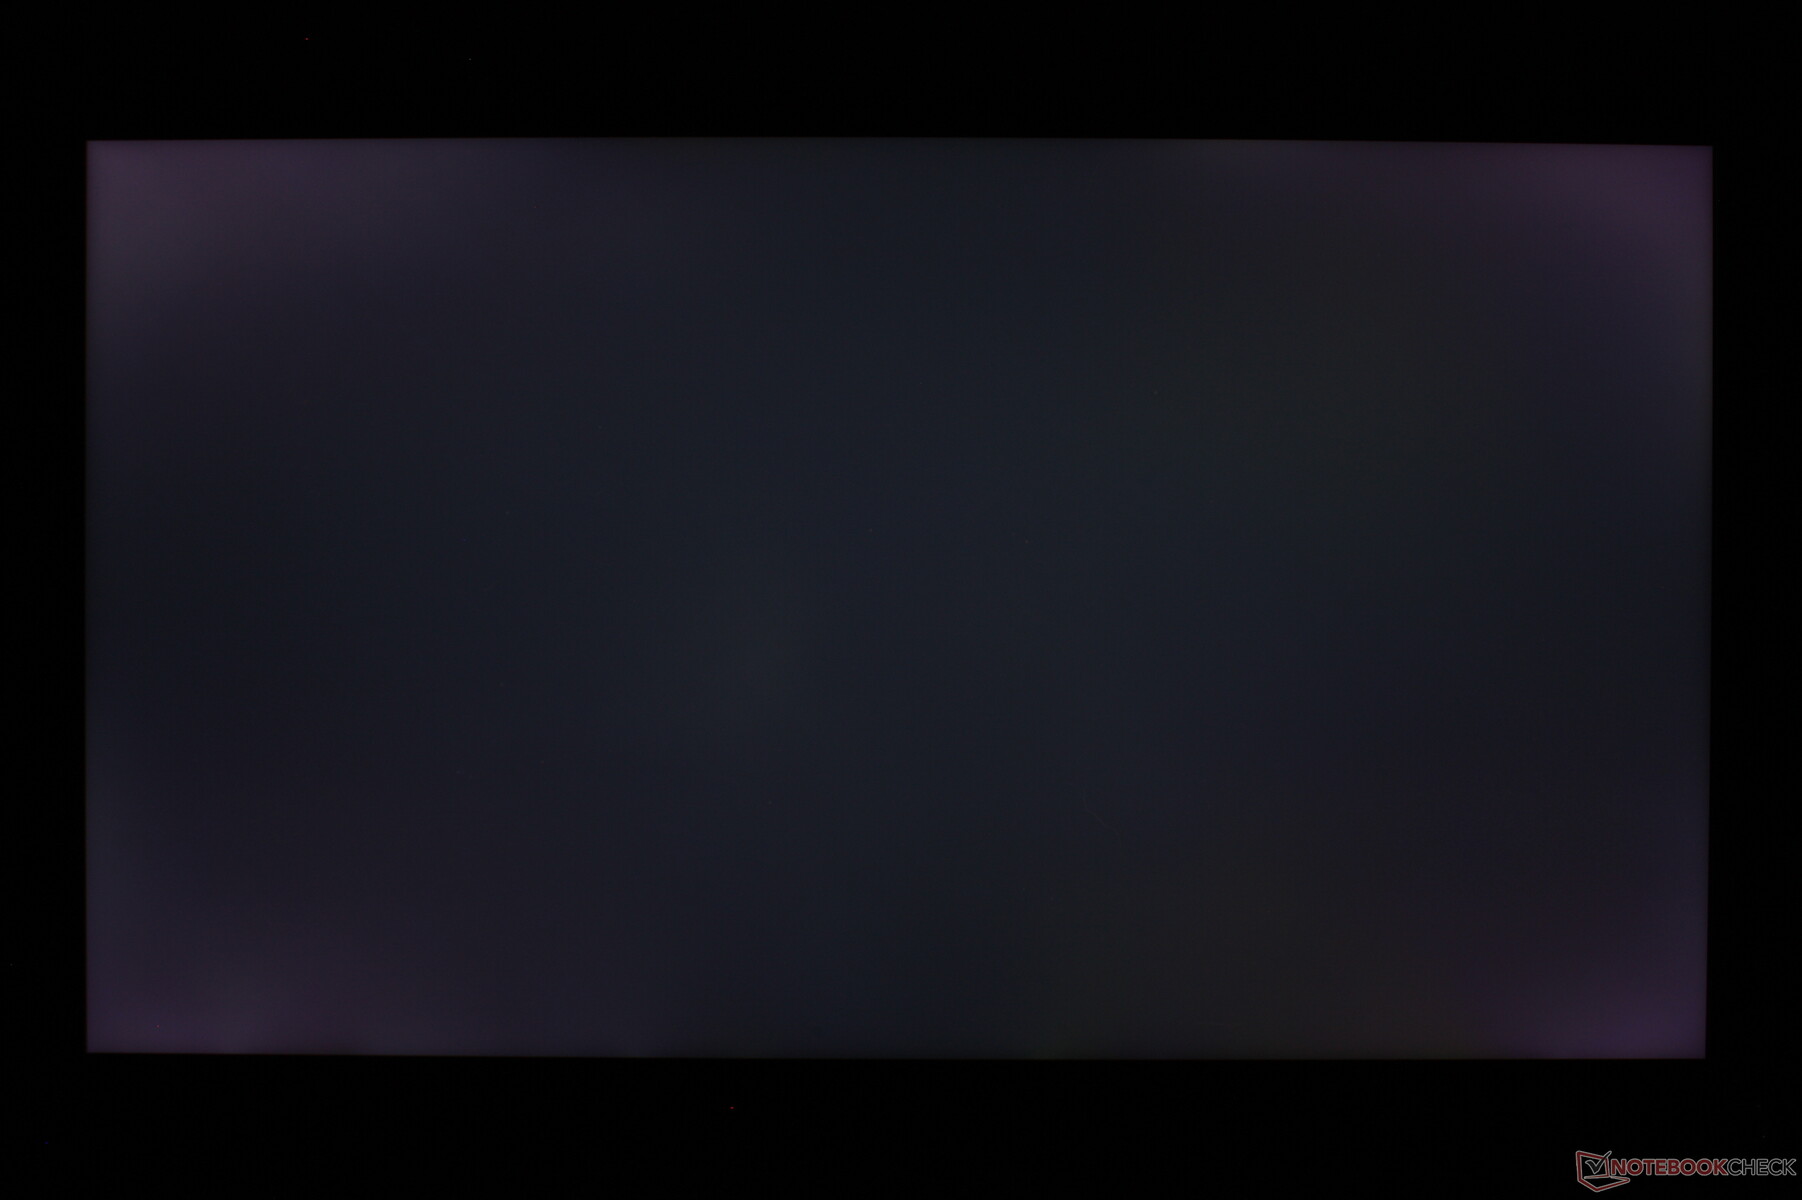
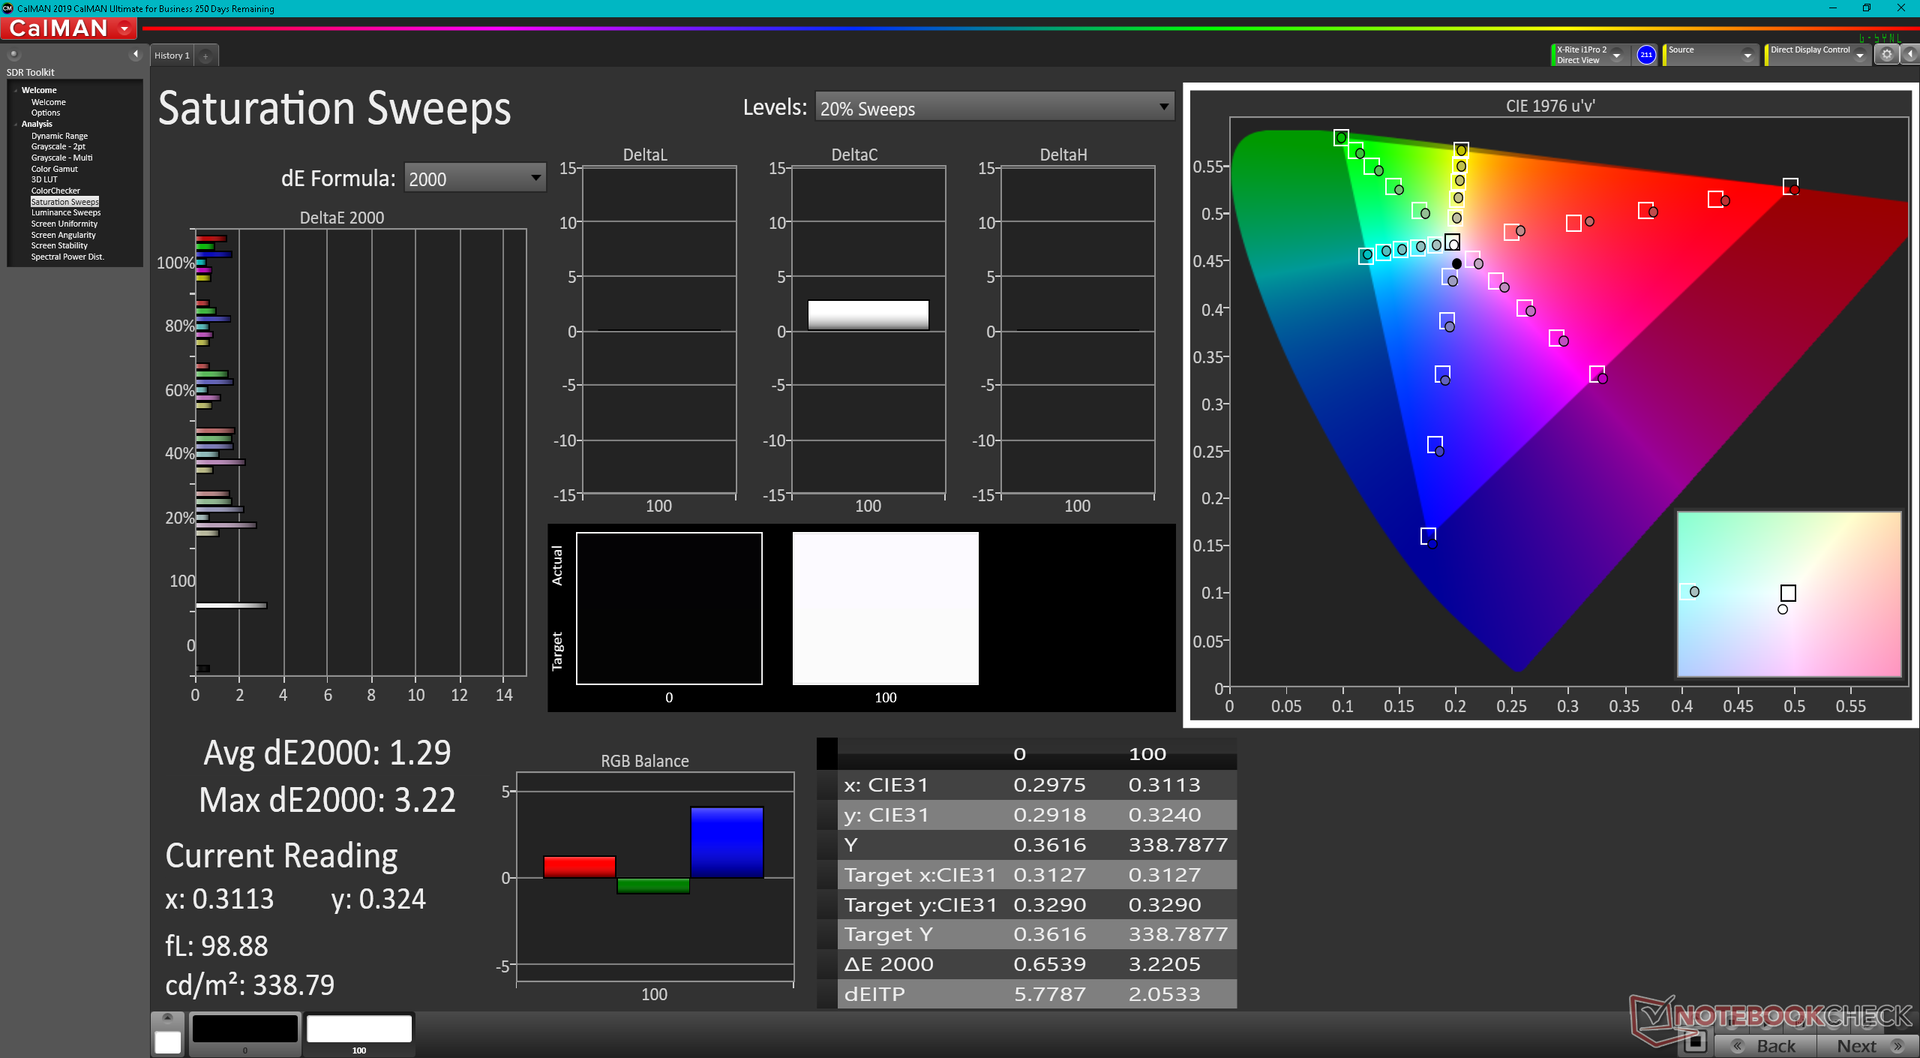
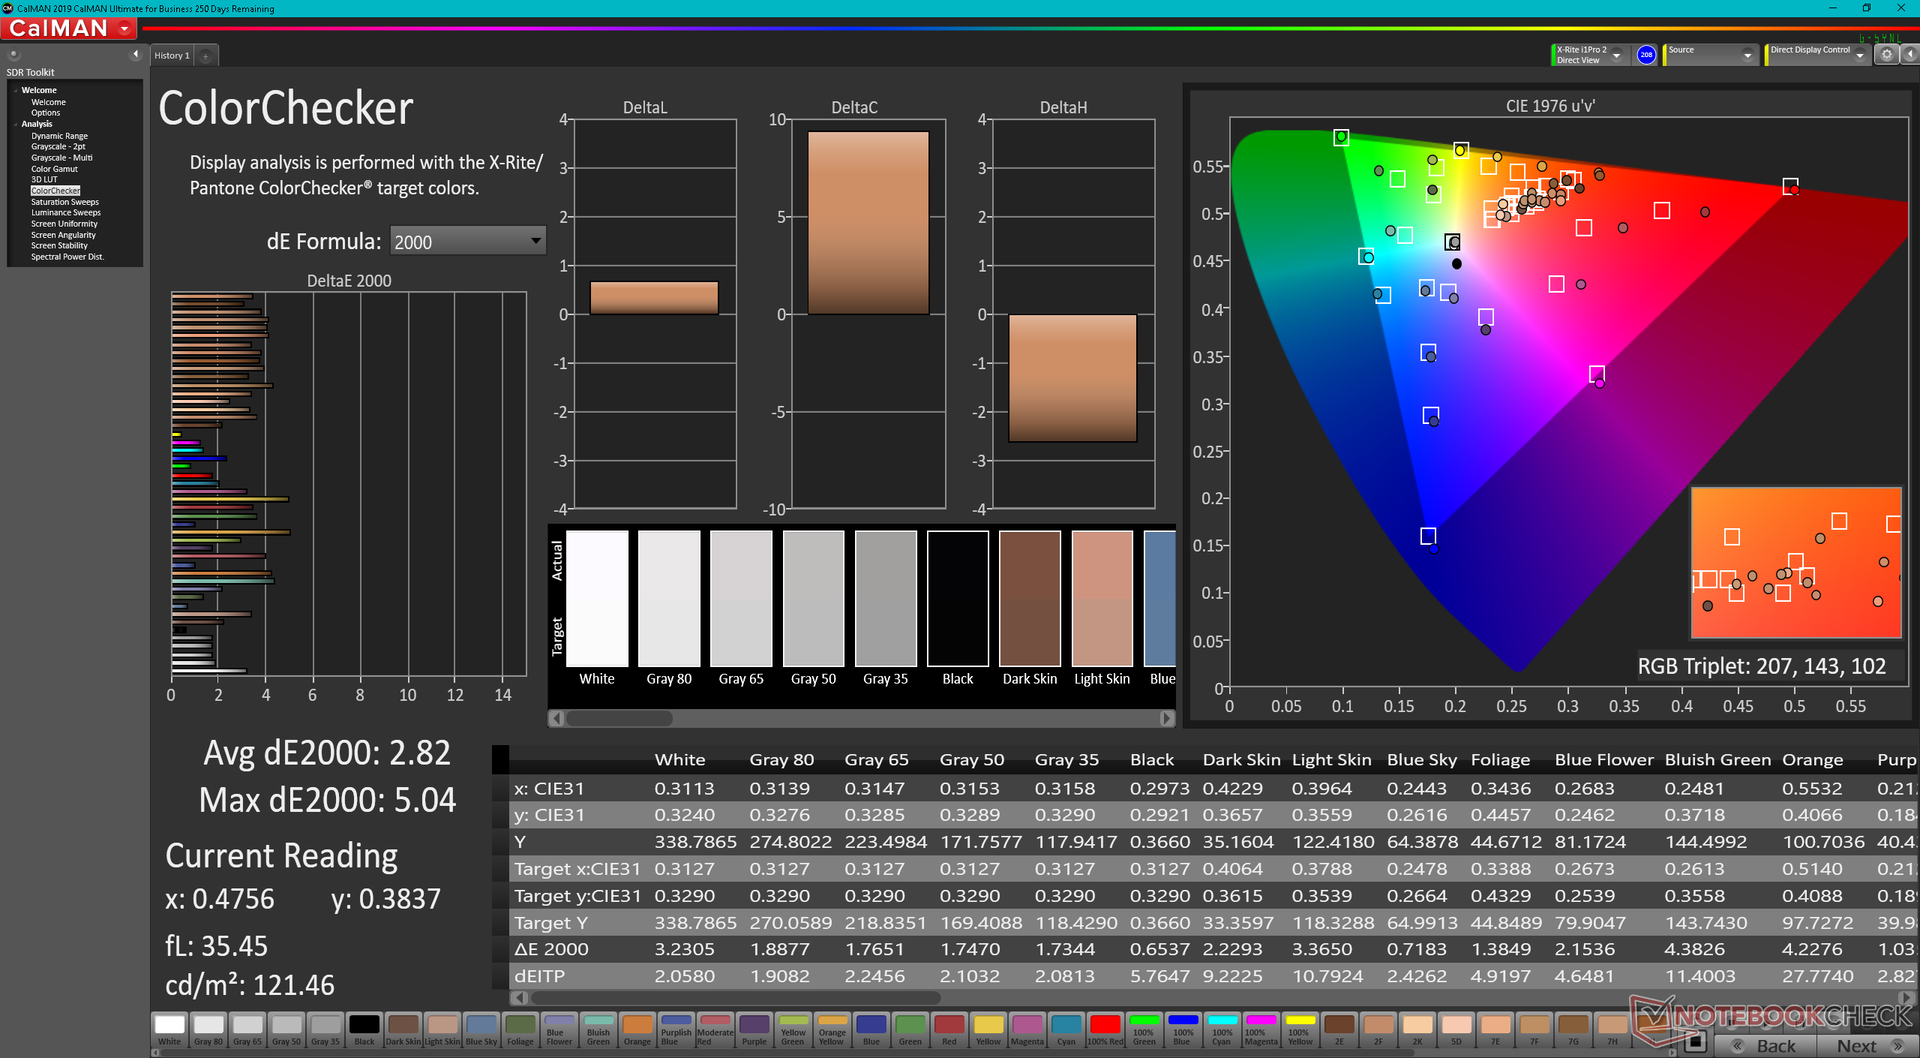
El panel IPS BOE NE173QHM-NZ1 de nuestra unidad de prueba es apto tanto para la edición de gráficos como para los juegos. Cubre por completo la gama de colores DCI-P3 para satisfacer a los artistas digitales, al tiempo que ofrece los rápidos tiempos de respuesta en blanco y negro, las rápidas frecuencias de actualización y la compatibilidad con G-Sync que querrán los jugadores. El contraste podría ser mejor, especialmente si se compara con las opciones OLED que Razer tiene disponibles en algunas unidades del Blade 15, pero esto es típico de los paneles IPS.

| |||||||||||||||||||||||||
iluminación: 75 %
Brillo con batería: 335.8 cd/m²
Contraste: 884:1 (Negro: 0.38 cd/m²)
ΔE ColorChecker Calman: 2.82 | ∀{0.5-29.43 Ø4.71}
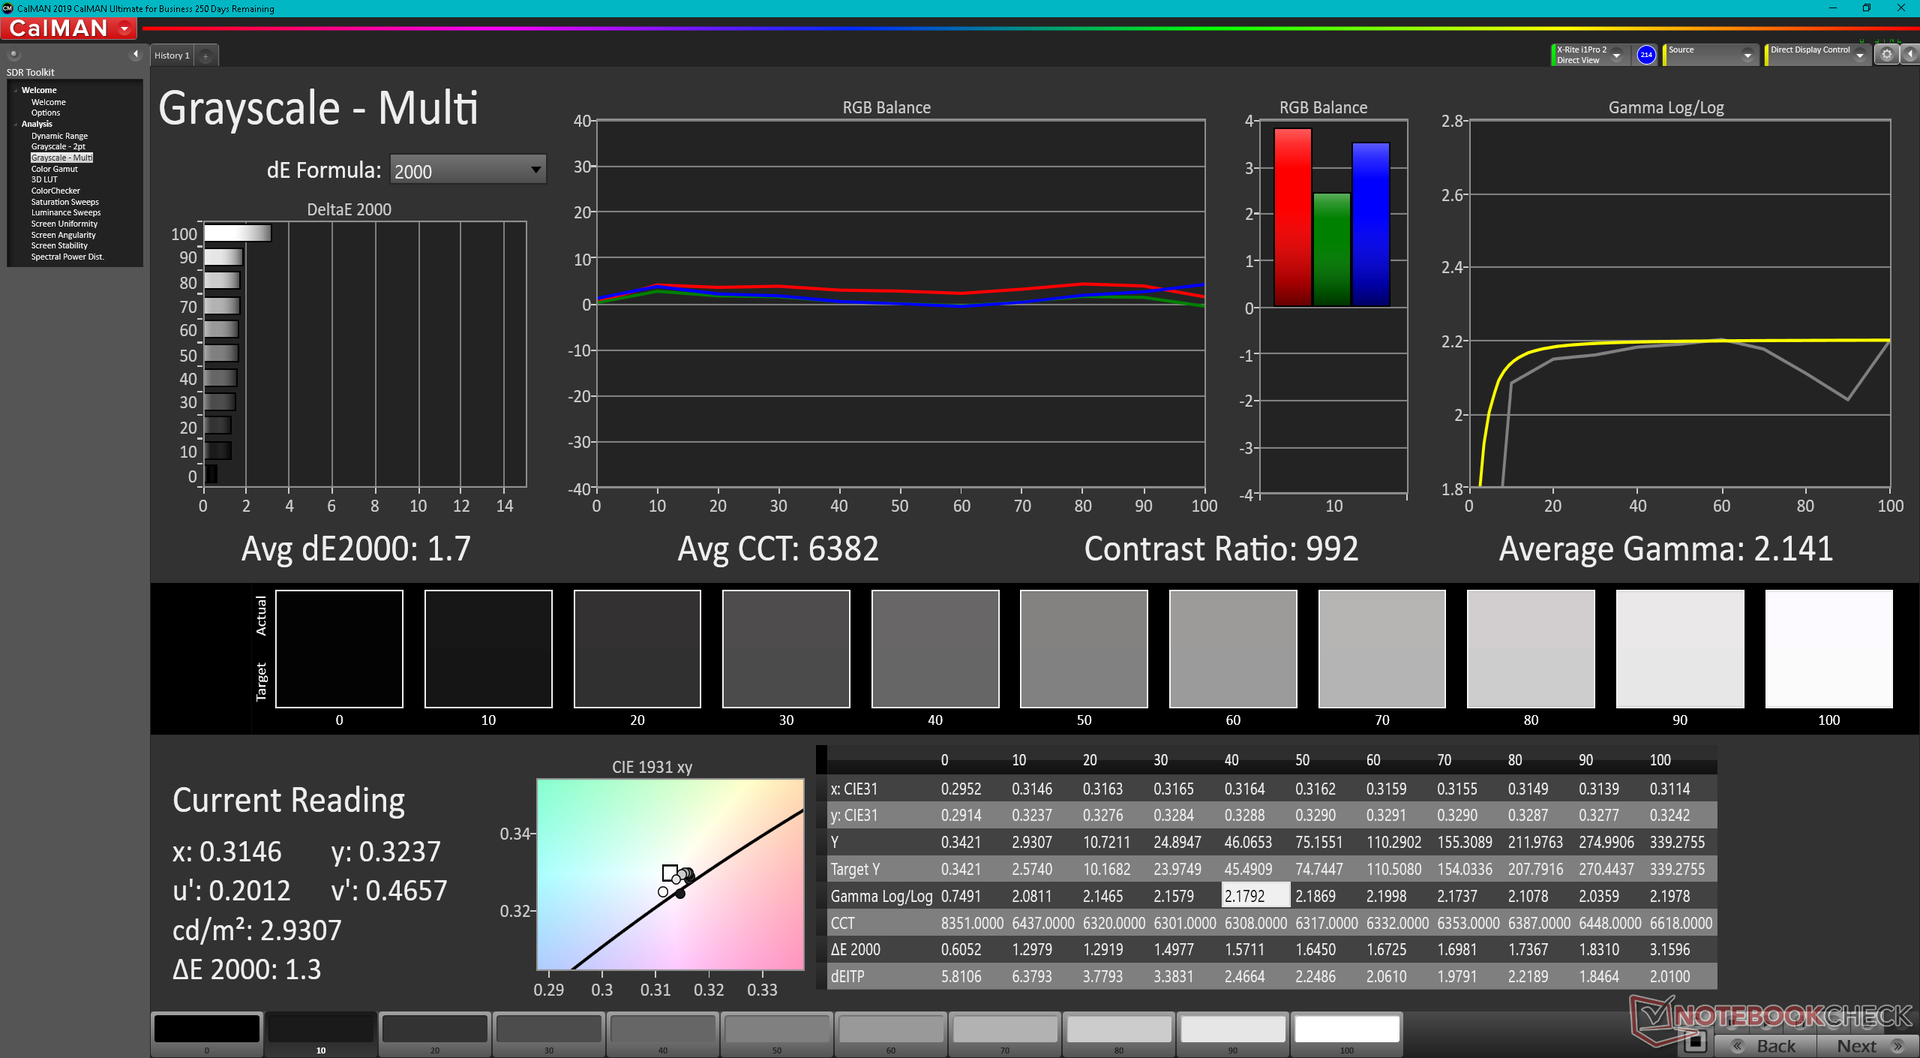
ΔE Greyscale Calman: 1.7 | ∀{0.09-98 Ø4.96}
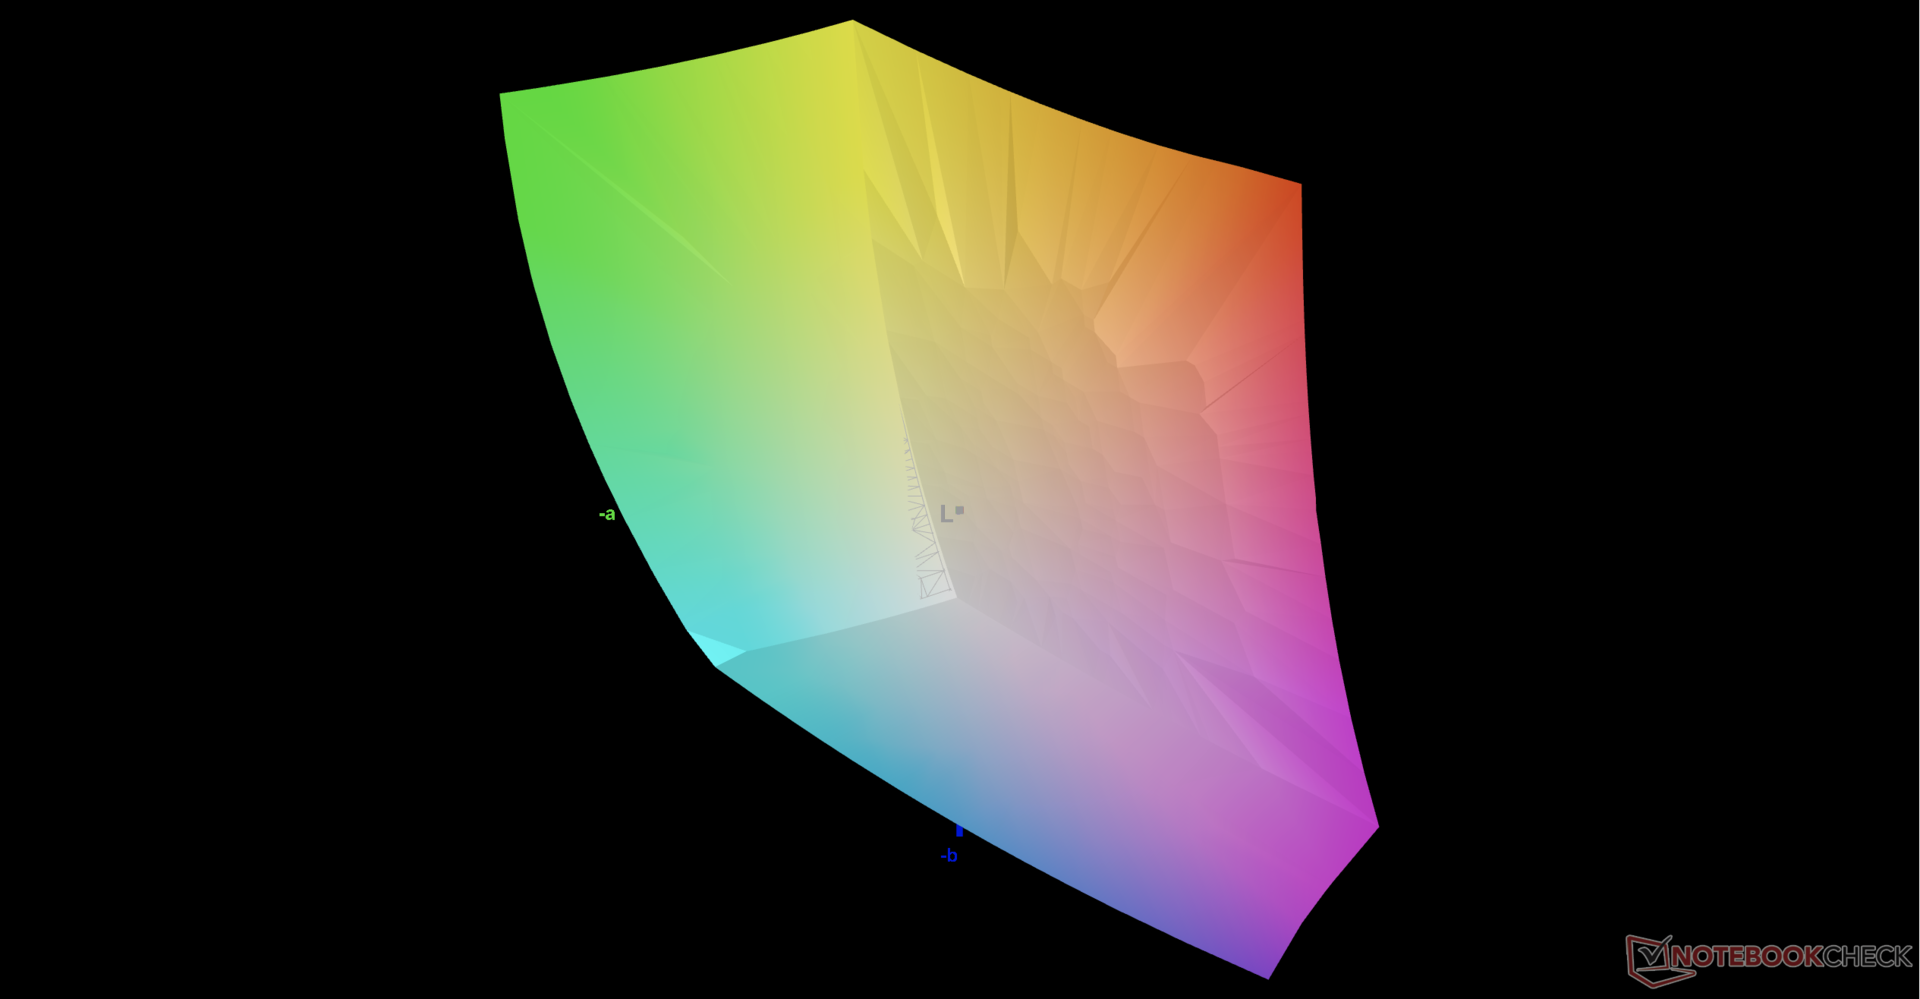
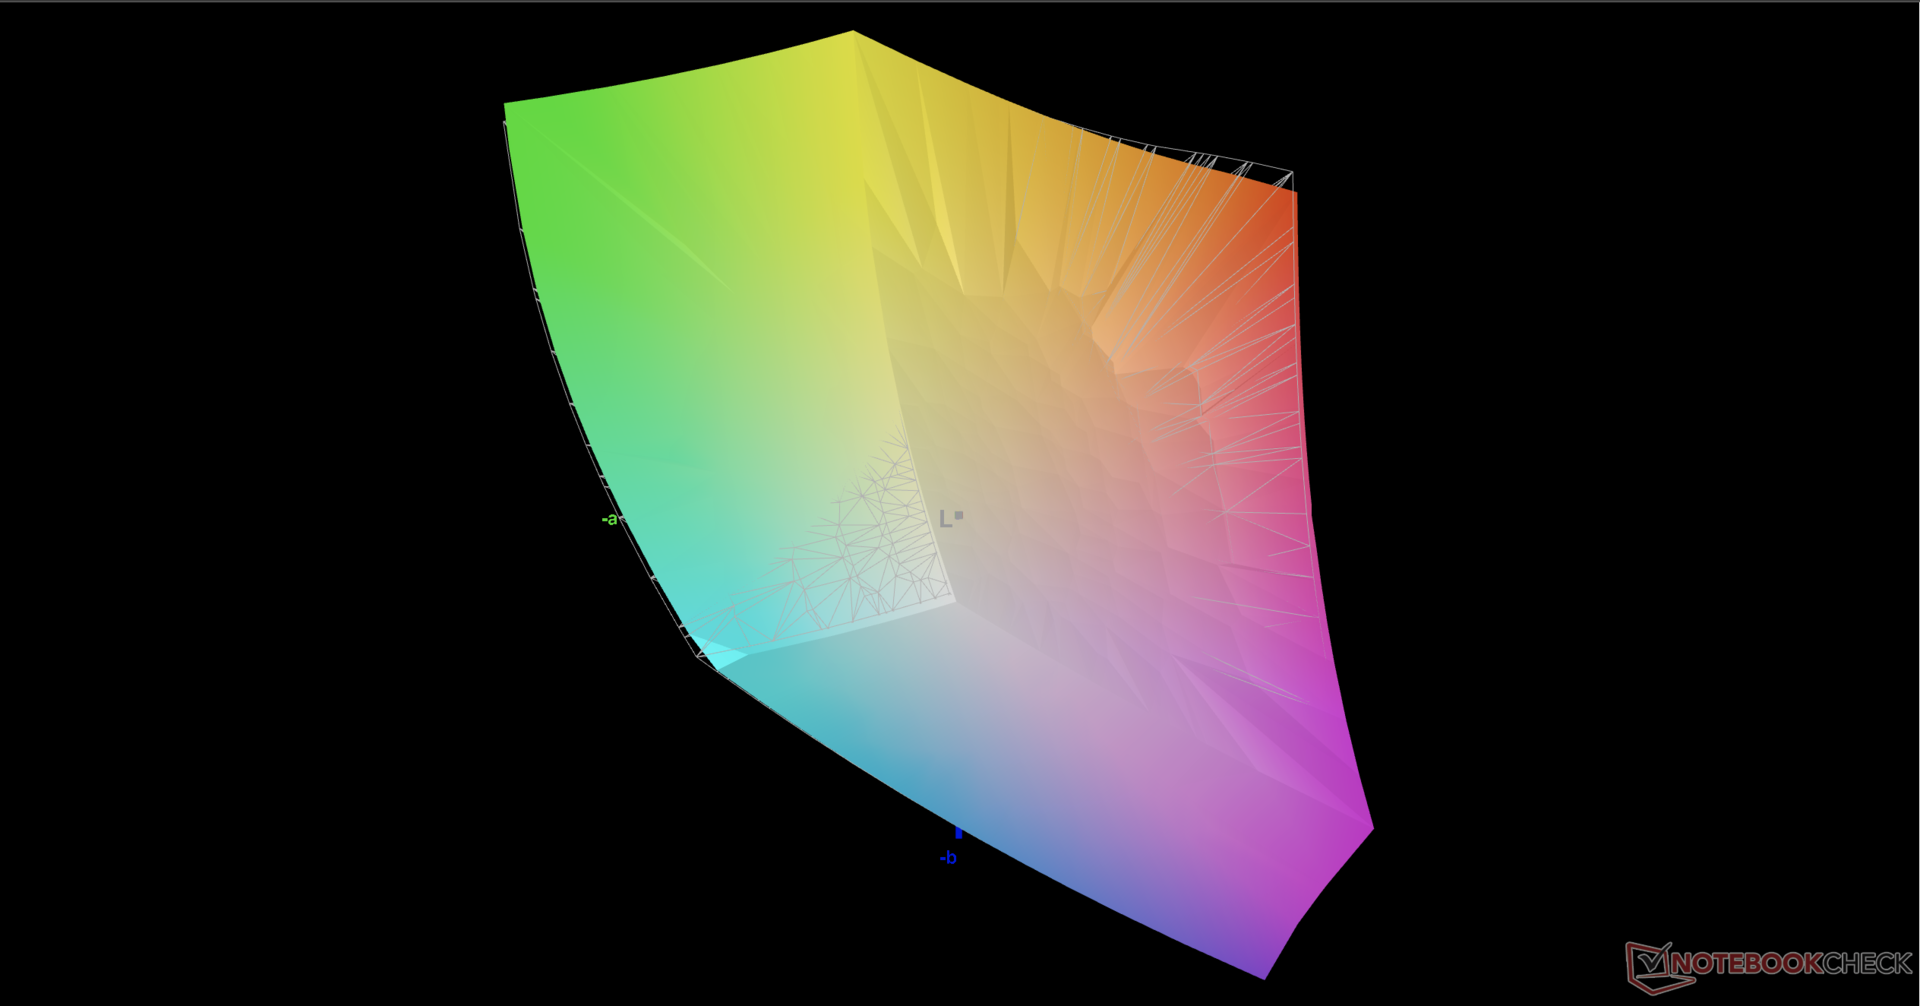
86.2% AdobeRGB 1998 (Argyll 3D)
99.9% sRGB (Argyll 3D)
98.7% Display P3 (Argyll 3D)
Gamma: 2.14
CCT: 6382 K
| Razer Blade 17 RTX 3080 Ti BOE NE173QHM-NZ1, IPS, 2560x1440, 17.3" | Razer Blade Pro 17 2021 (QHD Touch) AU Optronics B173ZAN03.3, IPS, 3840x2160, 17.3" | MSI GS76 Stealth 11UH AUO B173ZAN06.1 (AUODE95), IPS, 3840x2160, 17.3" | Asus ROG Zephyrus S17 GX703HSD BOE099D (BOE CQ NE173QHM-NY3), IPS, 2560x1440, 17.3" | Aorus 17G YD Sharp LQ173M1JW04, IPS, 1920x1080, 17.3" | Alienware x17 RTX 3080 P48E AU Optronics B173ZAN, IPS, 3840x2160, 17.3" | |
|---|---|---|---|---|---|---|
| Display | 2% | -22% | -3% | -14% | 2% | |
| Display P3 Coverage (%) | 98.7 | 88.6 -10% | 63 -36% | 94.2 -5% | 72.3 -27% | 88.3 -11% |
| sRGB Coverage (%) | 99.9 | 100 0% | 94.8 -5% | 98.7 -1% | 100 0% | 100 0% |
| AdobeRGB 1998 Coverage (%) | 86.2 | 99.9 16% | 65 -25% | 84.4 -2% | 73.7 -15% | 100 16% |
| Response Times | 5% | 47% | 52% | 21% | 14% | |
| Response Time Grey 50% / Grey 80% * (ms) | 17.6 ? | 15.2 ? 14% | 8.8 ? 50% | 4.8 73% | 13.6 ? 23% | 14.4 ? 18% |
| Response Time Black / White * (ms) | 11.4 ? | 12 ? -5% | 6.4 ? 44% | 8 30% | 9.2 ? 19% | 10.4 ? 9% |
| PWM Frequency (Hz) | ||||||
| Screen | -76% | 10% | -8% | -10% | -8% | |
| Brightness middle (cd/m²) | 335.9 | 407.2 21% | 474 41% | 322 -4% | 286 -15% | 438.7 31% |
| Brightness (cd/m²) | 294 | 403 37% | 454 54% | 288 -2% | 282 -4% | 435 48% |
| Brightness Distribution (%) | 75 | 90 20% | 88 17% | 72 -4% | 73 -3% | 91 21% |
| Black Level * (cd/m²) | 0.38 | 0.42 -11% | 0.46 -21% | 0.3 21% | 0.24 37% | 0.48 -26% |
| Contrast (:1) | 884 | 970 10% | 1030 17% | 1073 21% | 1192 35% | 914 3% |
| Colorchecker dE 2000 * | 2.82 | 7.25 -157% | 1.5 47% | 3.05 -8% | 2.79 1% | 4.34 -54% |
| Colorchecker dE 2000 max. * | 5.04 | 12.51 -148% | 5.59 -11% | 5.23 -4% | 6.23 -24% | 7.3 -45% |
| Greyscale dE 2000 * | 1.7 | 8.1 -376% | 2.8 -65% | 3.11 -83% | 3.5 -106% | 2.4 -41% |
| Gamma | 2.14 103% | 2.24 98% | 2.158 102% | 2.13 103% | 2.358 93% | 2.09 105% |
| CCT | 6382 102% | 5925 110% | 6597 99% | 6553 99% | 6147 106% | 6413 101% |
| Colorchecker dE 2000 calibrated * | 3.62 | 0.86 | 1.92 | 0.82 | 0.72 | |
| Color Space (Percent of AdobeRGB 1998) (%) | 88.1 | 84 | 74 | |||
| Color Space (Percent of sRGB) (%) | 100 | 99 | 96 | |||
| Media total (Programa/Opciones) | -23% /
-45% | 12% /
8% | 14% /
2% | -1% /
-6% | 3% /
-2% |
* ... más pequeño es mejor
Razer calibra cada pantalla en fábrica y nuestras mediciones independientes con un colorímetro X-Rite así lo demuestran. Los valores medios de escala de grises y DeltaE de ColorChecker son de solo 1,7 y 2,82, respectivamente, lo que demuestra que no es necesaria la calibración por parte del usuario final.
Tiempos de respuesta del display
| ↔ Tiempo de respuesta de Negro a Blanco | ||
|---|---|---|
| 11.4 ms ... subida ↗ y bajada ↘ combinada | ↗ 4.8 ms subida | 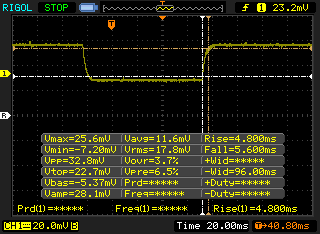 |
| ↘ 5.6 ms bajada | ||
| La pantalla mostró buenos tiempos de respuesta en nuestros tests pero podría ser demasiado lenta para los jugones competitivos. En comparación, todos los dispositivos de prueba van de ##min### (mínimo) a 240 (máximo) ms. » 31 % de todos los dispositivos son mejores. Esto quiere decir que el tiempo de respuesta medido es mejor que la media (19.8 ms) de todos los dispositivos testados. | ||
| ↔ Tiempo de respuesta 50% Gris a 80% Gris | ||
| 17.6 ms ... subida ↗ y bajada ↘ combinada | ↗ 8.4 ms subida | 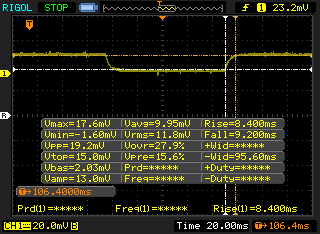 |
| ↘ 9.2 ms bajada | ||
| La pantalla mostró buenos tiempos de respuesta en nuestros tests pero podría ser demasiado lenta para los jugones competitivos. En comparación, todos los dispositivos de prueba van de ##min### (mínimo) a 636 (máximo) ms. » 32 % de todos los dispositivos son mejores. Esto quiere decir que el tiempo de respuesta medido es mejor que la media (31 ms) de todos los dispositivos testados. | ||
Parpadeo de Pantalla / PWM (Pulse-Width Modulation)
| Parpadeo de Pantalla / PWM no detectado |  | ||
Comparación: 52 % de todos los dispositivos testados no usaron PWM para atenuar el display. Si se usó, medimos una media de 7754 (mínimo: 5 - máxmo: 343500) Hz. | |||
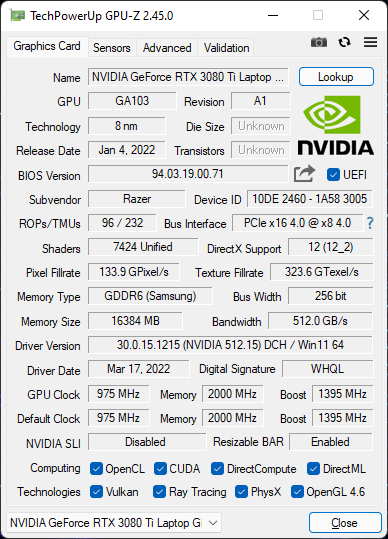
Rendimiento - Gráficos de 165 W con Intel de 12ª generación
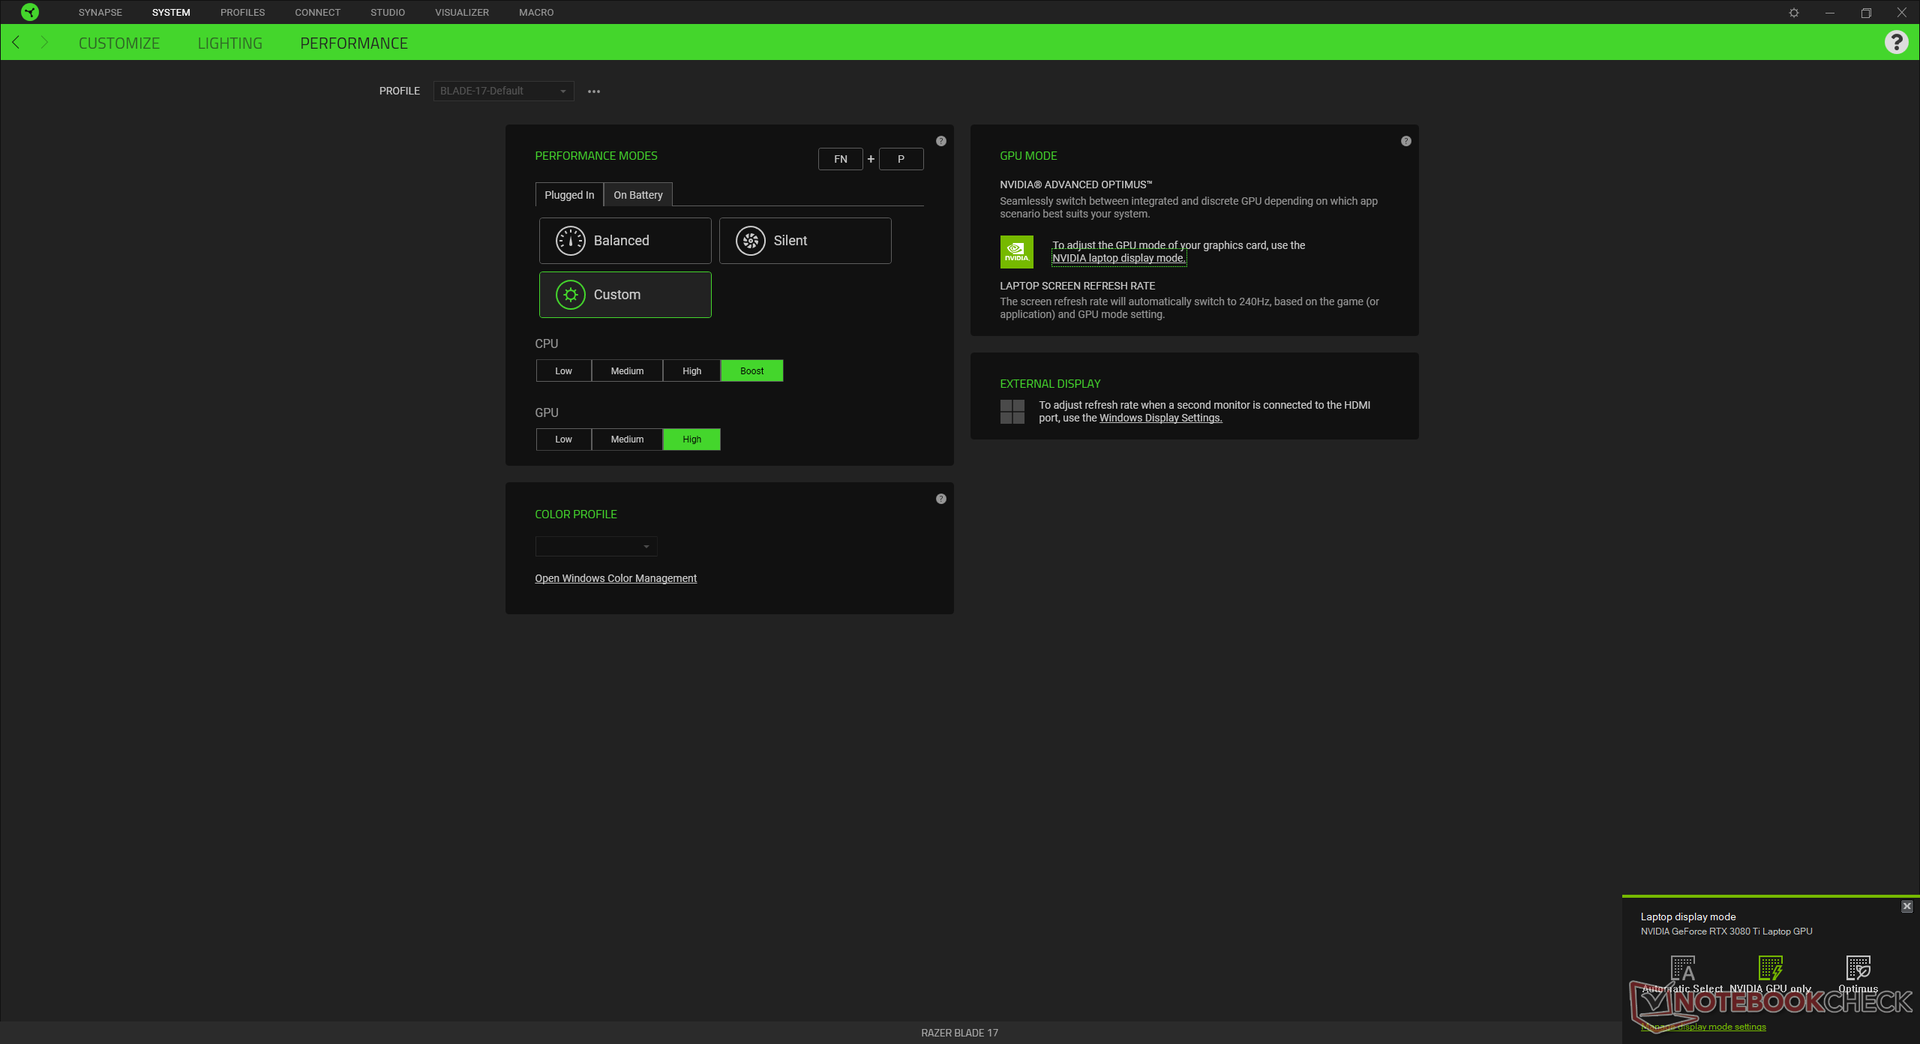
Condiciones de la prueba
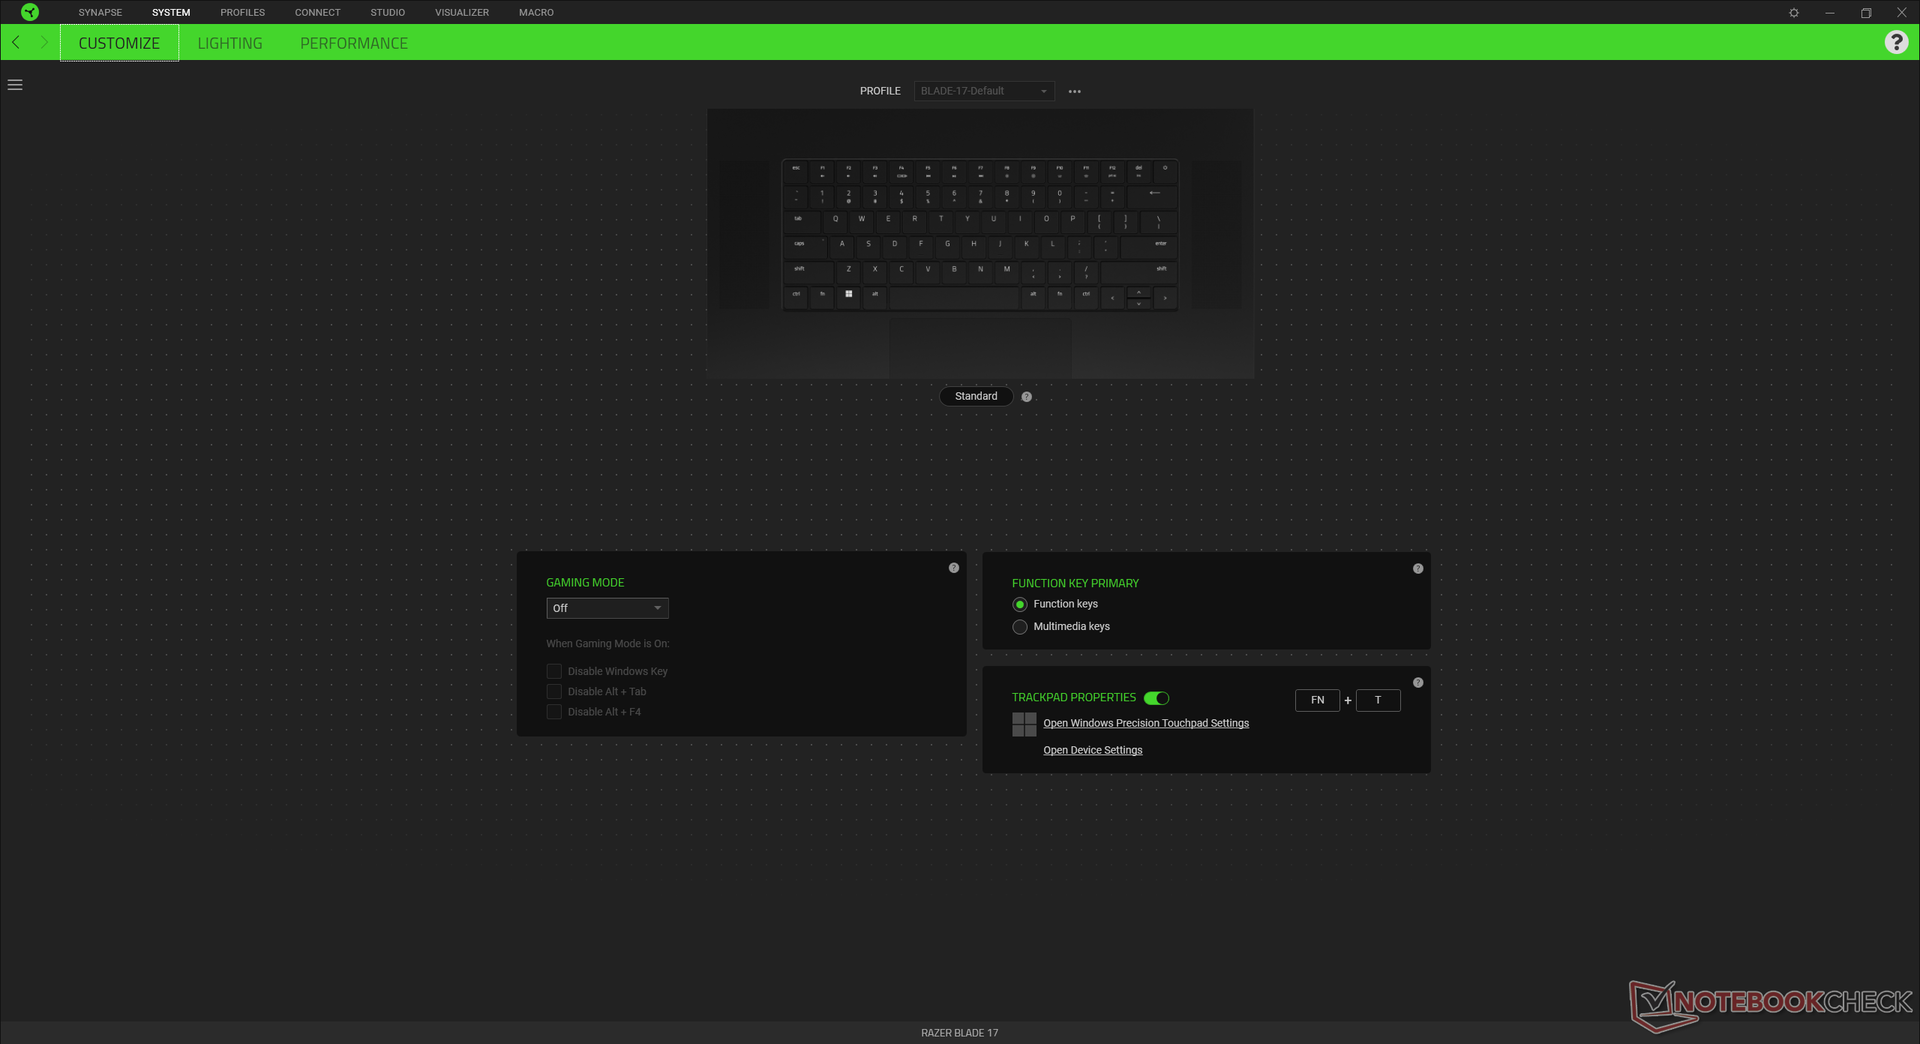
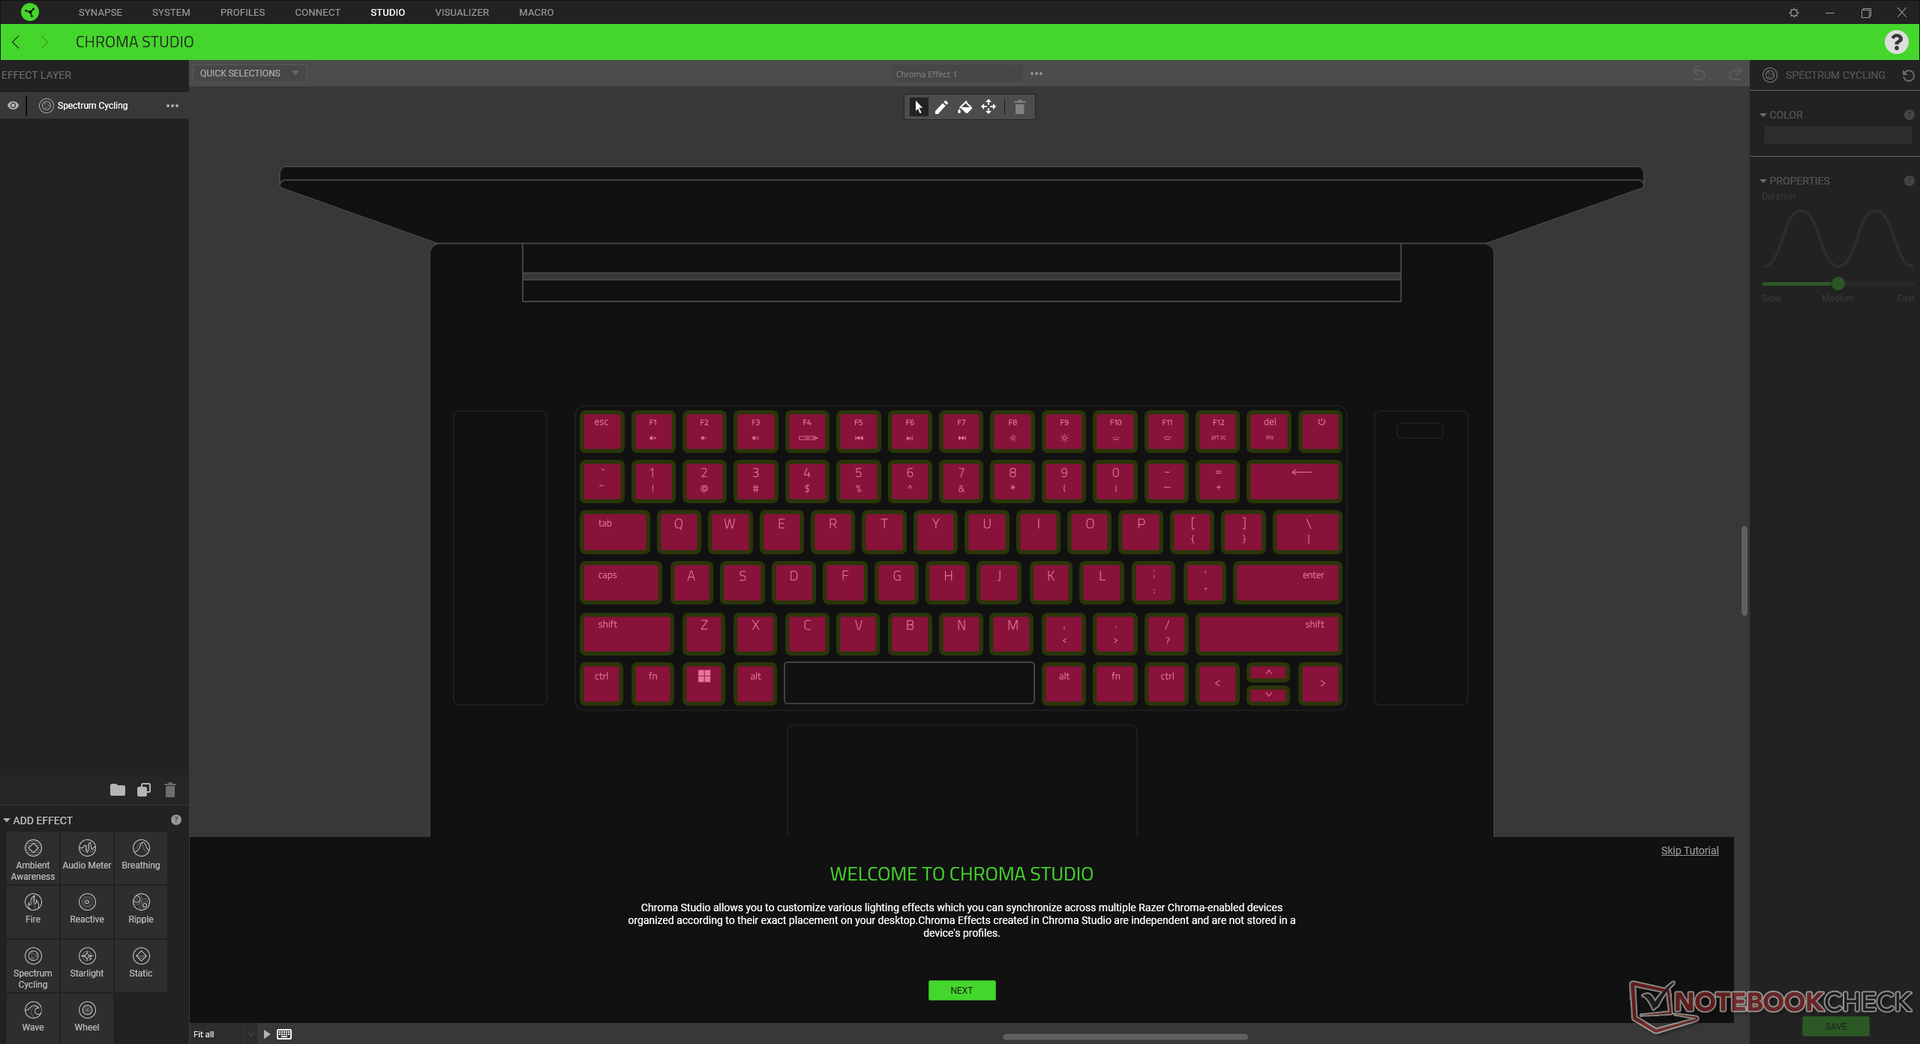
Nuestra unidad se configuró en modo manual con la CPU y la GPU en Boost y High, respectivamente, para obtener las puntuaciones más altas posibles en los benchmarks. Los usuarios deberían familiarizarse con el software Synapse, ya que sirve como centro de control para las características específicas del sistema y los perfiles de rendimiento.
El Blade 17 es uno de los pocos portátiles para juegos que soporta Advanced Optimus, lo que significa que los usuarios pueden cambiar entre los modos Optimus y dGPU G-Sync sin necesidad de reiniciar.
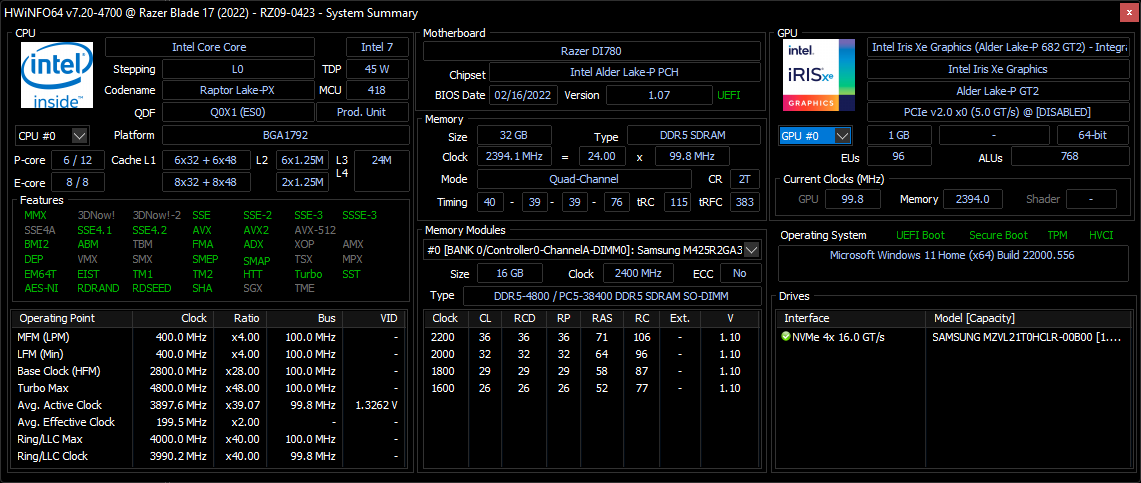
Procesador
El rendimiento de la CPU está donde esperamos que esté en relación con otros portátiles que funcionan con el mismo Core i7-12800H que el procesador Core i7-100H. El rendimiento bruto es de entre un 20 y un 25 por ciento y entre un 50 y un 70 por ciento más que el Core i7-11800H y el Core i7-10875H de 10ª generación Core i7-10875Hrespectivamente, en los modelos Blade 17 de la generación anterior. Se espera que la actualización a la SKU Core i9-12900H sólo ofrezca un 10 por ciento de aumento de rendimiento sobre nuestra configuración Core i7-12800H.
La sostenibilidad del rendimiento es excelente, sin caídas importantes en las velocidades de reloj a lo largo del tiempo cuando se ejecuta CineBench R15 xT en un bucle.
Cinebench R15 Multi Loop
Cinebench R20: CPU (Multi Core) | CPU (Single Core)
Cinebench R15: CPU Multi 64Bit | CPU Single 64Bit
Blender: v2.79 BMW27 CPU
7-Zip 18.03: 7z b 4 | 7z b 4 -mmt1
Geekbench 5.5: Multi-Core | Single-Core
HWBOT x265 Benchmark v2.2: 4k Preset
LibreOffice : 20 Documents To PDF
R Benchmark 2.5: Overall mean
| HWBOT x265 Benchmark v2.2 / 4k Preset | |
| MSI GE76 Raider | |
| Schenker Uniwill Technology GM7AG8P | |
| Razer Blade 17 RTX 3080 Ti | |
| Medio Intel Core i7-12800H (11.7 - 19.4, n=5) | |
| Schenker XMG Apex 17 M21 | |
| Razer Blade 17 RTX 3070 | |
| Gigabyte A7 X1 | |
| MSI GE76 Raider 10UH | |
| Lenovo Legion 5 17ACH6H-82JY0003GE | |
| Razer Blade Pro 17 2021 (QHD Touch) | |
| Acer Nitro 5 AN517-53-54DQ | |
* ... más pequeño es mejor
AIDA64: FP32 Ray-Trace | FPU Julia | CPU SHA3 | CPU Queen | FPU SinJulia | FPU Mandel | CPU AES | CPU ZLib | FP64 Ray-Trace | CPU PhotoWorxx
| Performance rating | |
| Schenker XMG Pro 17 (Late 2021, RTX 3080) | |
| MSI GE76 Raider | |
| Lenovo Legion 5 17ACH6H-82JY0003GE | |
| Schenker Uniwill Technology GM7AG8P | |
| Medio Intel Core i7-12800H | |
| Razer Blade 17 RTX 3080 Ti | |
| AIDA64 / FP32 Ray-Trace | |
| Schenker XMG Pro 17 (Late 2021, RTX 3080) | |
| Lenovo Legion 5 17ACH6H-82JY0003GE | |
| MSI GE76 Raider | |
| Medio Intel Core i7-12800H (5839 - 15206, n=5) | |
| Schenker Uniwill Technology GM7AG8P | |
| Razer Blade 17 RTX 3080 Ti | |
| AIDA64 / FPU Julia | |
| Lenovo Legion 5 17ACH6H-82JY0003GE | |
| Schenker XMG Pro 17 (Late 2021, RTX 3080) | |
| Medio Intel Core i7-12800H (27801 - 80002, n=5) | |
| MSI GE76 Raider | |
| Schenker Uniwill Technology GM7AG8P | |
| Razer Blade 17 RTX 3080 Ti | |
| AIDA64 / CPU SHA3 | |
| Schenker XMG Pro 17 (Late 2021, RTX 3080) | |
| MSI GE76 Raider | |
| Schenker Uniwill Technology GM7AG8P | |
| Medio Intel Core i7-12800H (2013 - 3684, n=5) | |
| Lenovo Legion 5 17ACH6H-82JY0003GE | |
| Razer Blade 17 RTX 3080 Ti | |
| AIDA64 / CPU Queen | |
| MSI GE76 Raider | |
| Razer Blade 17 RTX 3080 Ti | |
| Schenker Uniwill Technology GM7AG8P | |
| Medio Intel Core i7-12800H (85965 - 108084, n=5) | |
| Schenker XMG Pro 17 (Late 2021, RTX 3080) | |
| Lenovo Legion 5 17ACH6H-82JY0003GE | |
| AIDA64 / FPU SinJulia | |
| MSI GE76 Raider | |
| Schenker Uniwill Technology GM7AG8P | |
| Schenker XMG Pro 17 (Late 2021, RTX 3080) | |
| Lenovo Legion 5 17ACH6H-82JY0003GE | |
| Razer Blade 17 RTX 3080 Ti | |
| Medio Intel Core i7-12800H (7027 - 9658, n=5) | |
| AIDA64 / FPU Mandel | |
| Lenovo Legion 5 17ACH6H-82JY0003GE | |
| Schenker XMG Pro 17 (Late 2021, RTX 3080) | |
| MSI GE76 Raider | |
| Medio Intel Core i7-12800H (15765 - 38179, n=5) | |
| Schenker Uniwill Technology GM7AG8P | |
| Razer Blade 17 RTX 3080 Ti | |
| AIDA64 / CPU AES | |
| Schenker XMG Pro 17 (Late 2021, RTX 3080) | |
| MSI GE76 Raider | |
| Lenovo Legion 5 17ACH6H-82JY0003GE | |
| Schenker Uniwill Technology GM7AG8P | |
| Medio Intel Core i7-12800H (55371 - 73928, n=5) | |
| Razer Blade 17 RTX 3080 Ti | |
| AIDA64 / CPU ZLib | |
| MSI GE76 Raider | |
| Schenker Uniwill Technology GM7AG8P | |
| Medio Intel Core i7-12800H (701 - 1047, n=5) | |
| Razer Blade 17 RTX 3080 Ti | |
| Schenker XMG Pro 17 (Late 2021, RTX 3080) | |
| Lenovo Legion 5 17ACH6H-82JY0003GE | |
| AIDA64 / FP64 Ray-Trace | |
| Schenker XMG Pro 17 (Late 2021, RTX 3080) | |
| Lenovo Legion 5 17ACH6H-82JY0003GE | |
| MSI GE76 Raider | |
| Schenker Uniwill Technology GM7AG8P | |
| Medio Intel Core i7-12800H (3257 - 8559, n=5) | |
| Razer Blade 17 RTX 3080 Ti | |
| AIDA64 / CPU PhotoWorxx | |
| Razer Blade 17 RTX 3080 Ti | |
| Schenker Uniwill Technology GM7AG8P | |
| MSI GE76 Raider | |
| Medio Intel Core i7-12800H (31329 - 40992, n=5) | |
| Schenker XMG Pro 17 (Late 2021, RTX 3080) | |
| Lenovo Legion 5 17ACH6H-82JY0003GE | |
Rendimiento del sistema
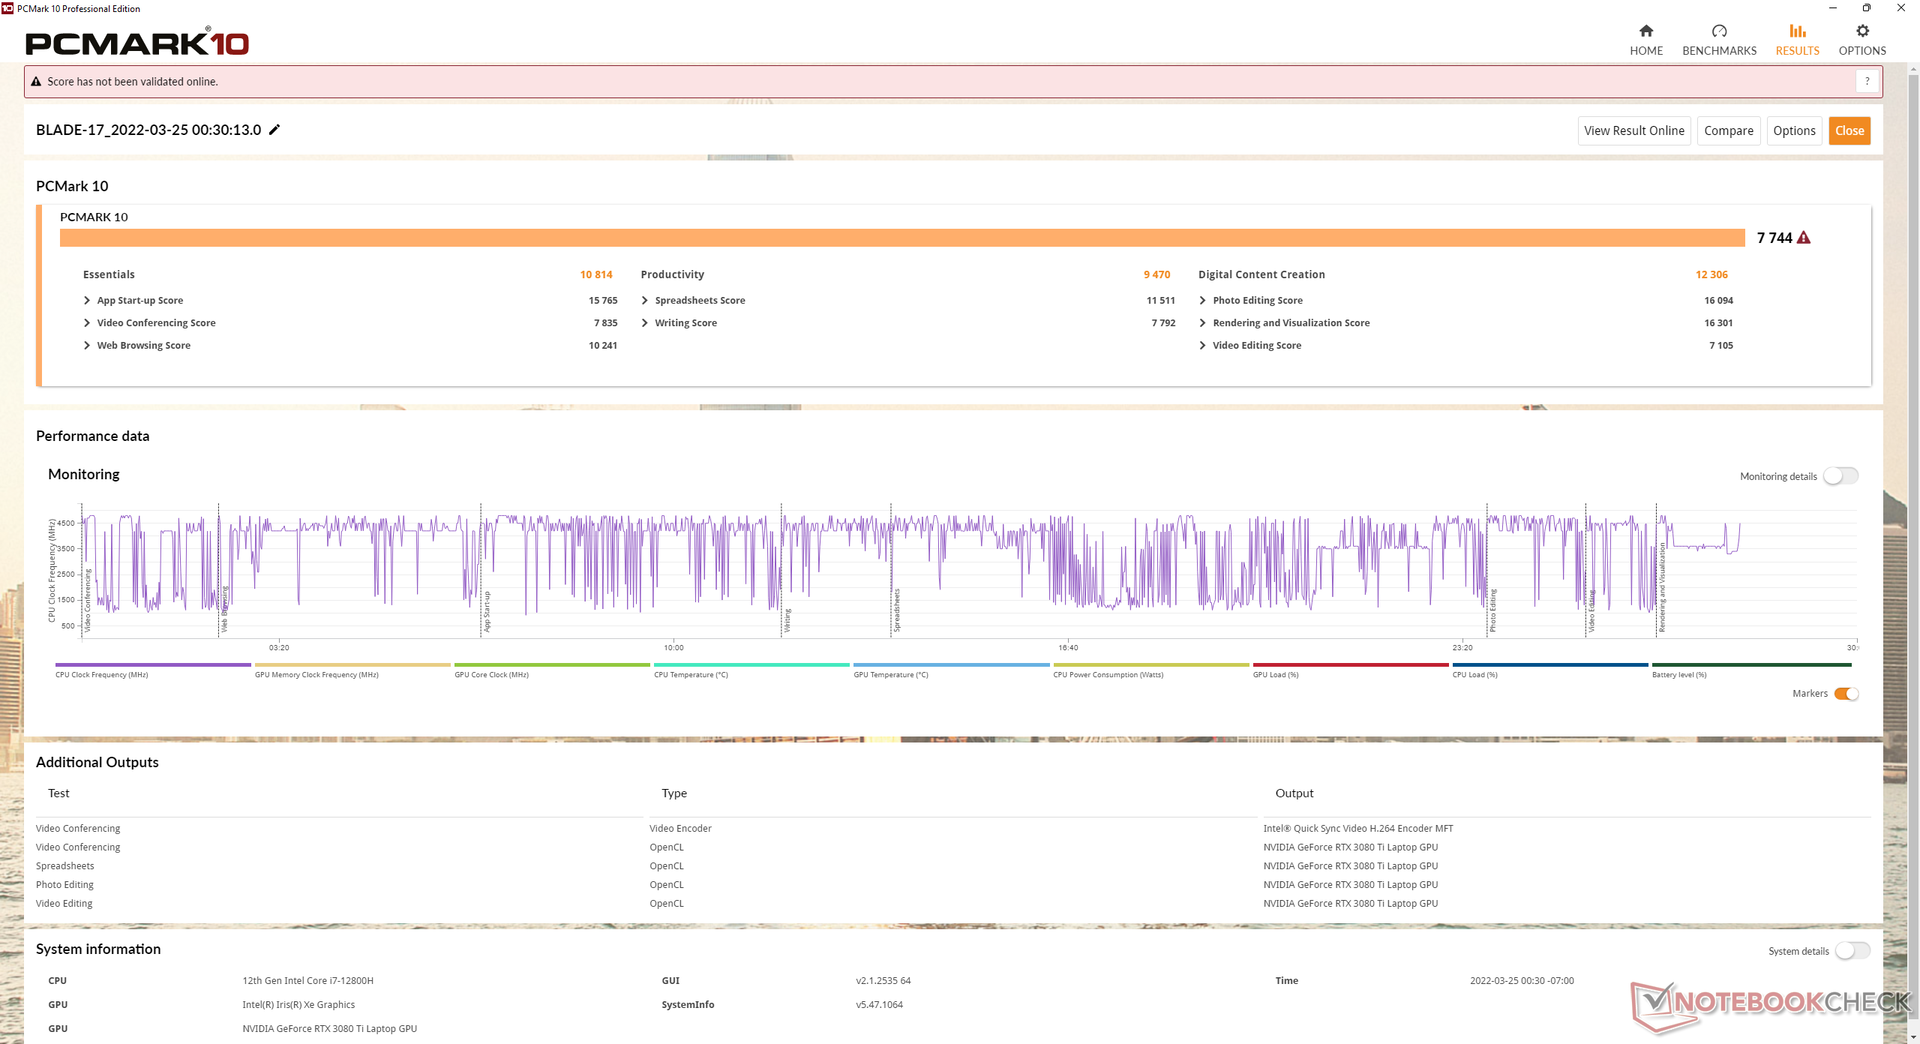
Los resultados de PCMark 10 son sistemáticamente superiores a los que registramos en el modelo del año pasado, especialmente en la subprueba de creación de contenidos digitales. Razer también parece haber solucionado el problema relacionado con el software Synapse que no se iniciaba cuando no estaba conectado a Internet.
| PCMark 10 / Score | |
| Razer Blade 17 RTX 3080 Ti | |
| Medio Intel Core i7-12800H, NVIDIA GeForce RTX 3080 Ti Laptop GPU (7313 - 7744, n=3) | |
| Alienware x17 RTX 3080 P48E | |
| Asus ROG Zephyrus S17 GX703HSD | |
| Aorus 17G YD | |
| MSI GS76 Stealth 11UH | |
| Razer Blade Pro 17 2021 (QHD Touch) | |
| PCMark 10 / Essentials | |
| Razer Blade 17 RTX 3080 Ti | |
| Medio Intel Core i7-12800H, NVIDIA GeForce RTX 3080 Ti Laptop GPU (10597 - 10814, n=3) | |
| Asus ROG Zephyrus S17 GX703HSD | |
| Aorus 17G YD | |
| Alienware x17 RTX 3080 P48E | |
| Razer Blade Pro 17 2021 (QHD Touch) | |
| MSI GS76 Stealth 11UH | |
| PCMark 10 / Productivity | |
| Alienware x17 RTX 3080 P48E | |
| Medio Intel Core i7-12800H, NVIDIA GeForce RTX 3080 Ti Laptop GPU (9470 - 9675, n=3) | |
| Razer Blade 17 RTX 3080 Ti | |
| Aorus 17G YD | |
| Asus ROG Zephyrus S17 GX703HSD | |
| MSI GS76 Stealth 11UH | |
| Razer Blade Pro 17 2021 (QHD Touch) | |
| PCMark 10 / Digital Content Creation | |
| Razer Blade 17 RTX 3080 Ti | |
| Medio Intel Core i7-12800H, NVIDIA GeForce RTX 3080 Ti Laptop GPU (10351 - 12306, n=3) | |
| Alienware x17 RTX 3080 P48E | |
| Asus ROG Zephyrus S17 GX703HSD | |
| Aorus 17G YD | |
| MSI GS76 Stealth 11UH | |
| Razer Blade Pro 17 2021 (QHD Touch) | |
| PCMark 10 Score | 7744 puntos | |
ayuda | ||
| AIDA64 / Memory Copy | |
| MSI GE76 Raider | |
| Razer Blade 17 RTX 3080 Ti | |
| Schenker Uniwill Technology GM7AG8P | |
| Medio Intel Core i7-12800H (48643 - 62522, n=5) | |
| Schenker XMG Pro 17 (Late 2021, RTX 3080) | |
| Schenker XMG Apex 17 M21 | |
| Lenovo Legion 5 17ACH6H-82JY0003GE | |
| AIDA64 / Memory Read | |
| Razer Blade 17 RTX 3080 Ti | |
| MSI GE76 Raider | |
| Schenker Uniwill Technology GM7AG8P | |
| Medio Intel Core i7-12800H (56629 - 66199, n=5) | |
| Schenker XMG Pro 17 (Late 2021, RTX 3080) | |
| Schenker XMG Apex 17 M21 | |
| Lenovo Legion 5 17ACH6H-82JY0003GE | |
| AIDA64 / Memory Write | |
| Razer Blade 17 RTX 3080 Ti | |
| Schenker Uniwill Technology GM7AG8P | |
| MSI GE76 Raider | |
| Medio Intel Core i7-12800H (50923 - 66074, n=5) | |
| Schenker XMG Apex 17 M21 | |
| Schenker XMG Pro 17 (Late 2021, RTX 3080) | |
| Lenovo Legion 5 17ACH6H-82JY0003GE | |
| AIDA64 / Memory Latency | |
| MSI GE76 Raider | |
| Schenker XMG Pro 17 (Late 2021, RTX 3080) | |
| Schenker XMG Apex 17 M21 | |
| Lenovo Legion 5 17ACH6H-82JY0003GE | |
| Medio Intel Core i7-12800H (89.3 - 95.2, n=5) | |
| Schenker Uniwill Technology GM7AG8P | |
| Razer Blade 17 RTX 3080 Ti | |
* ... más pequeño es mejor
Latencia del CPD
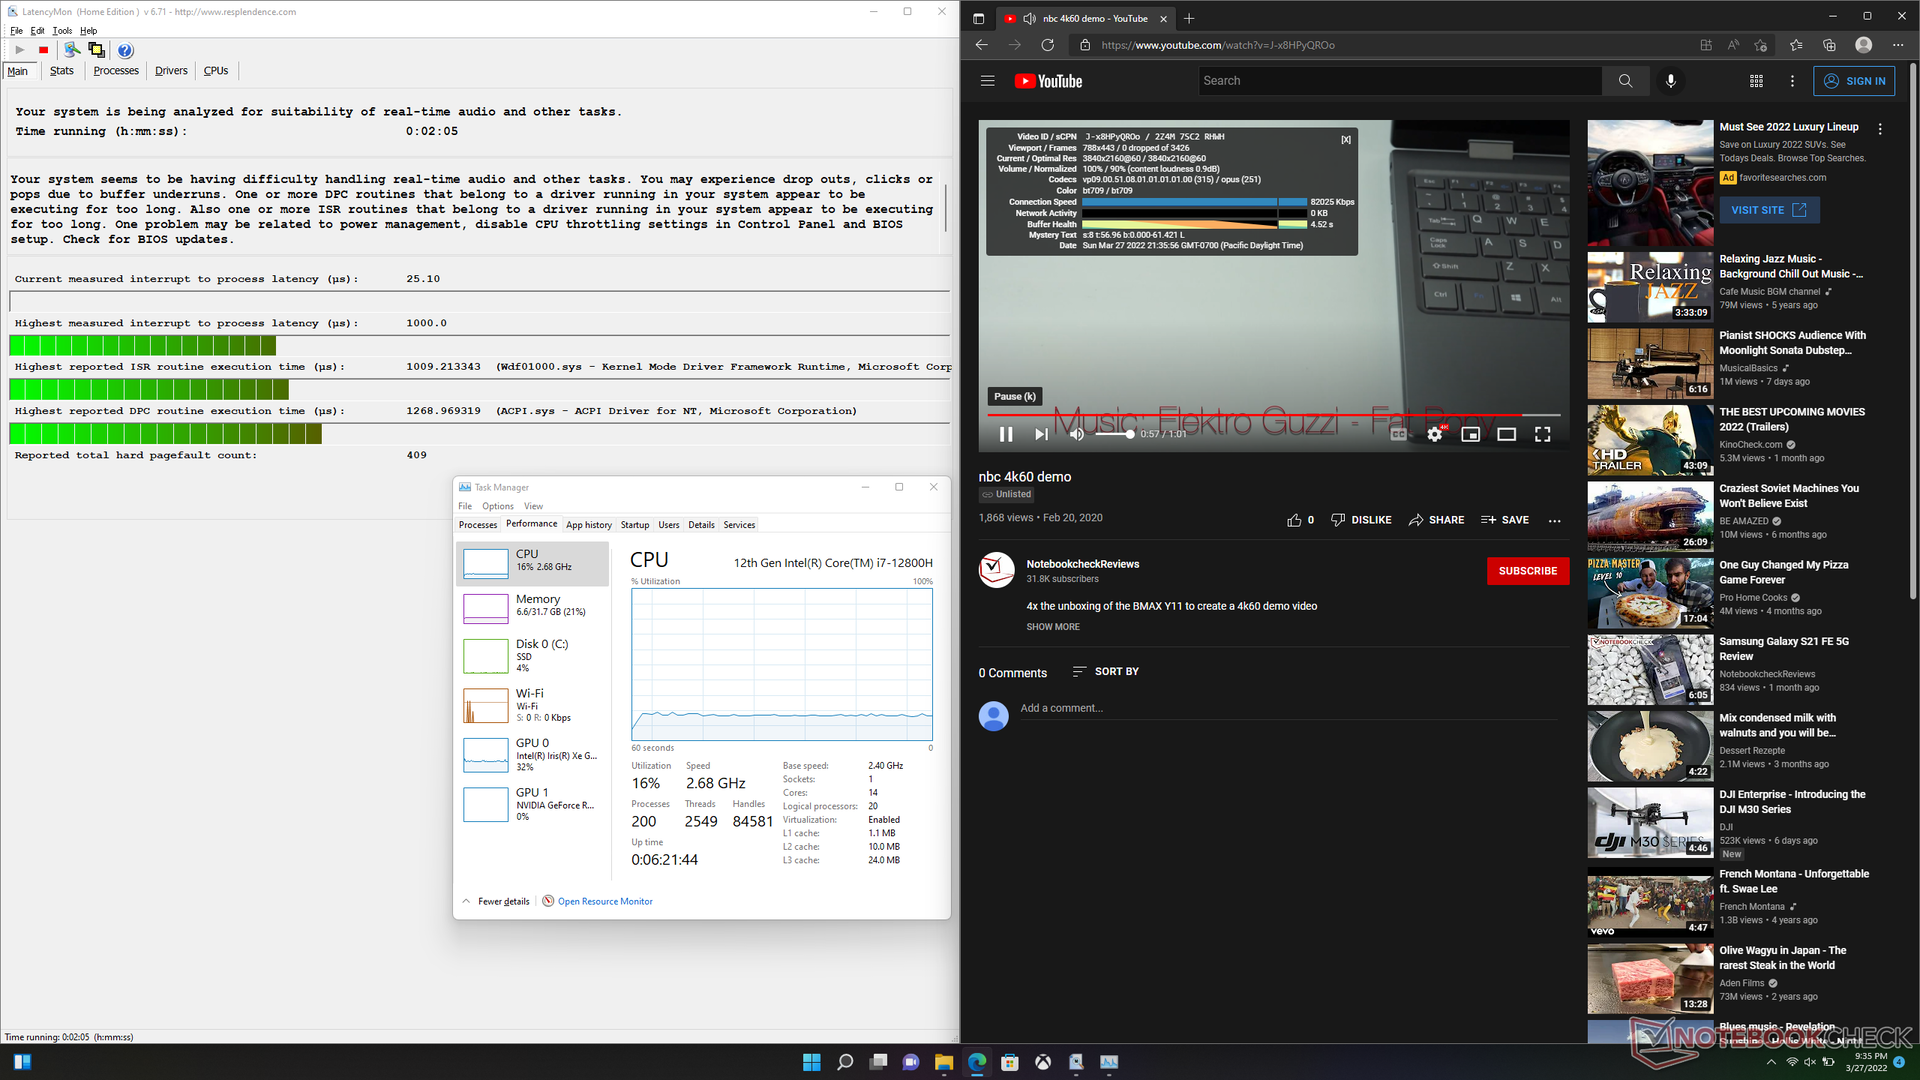
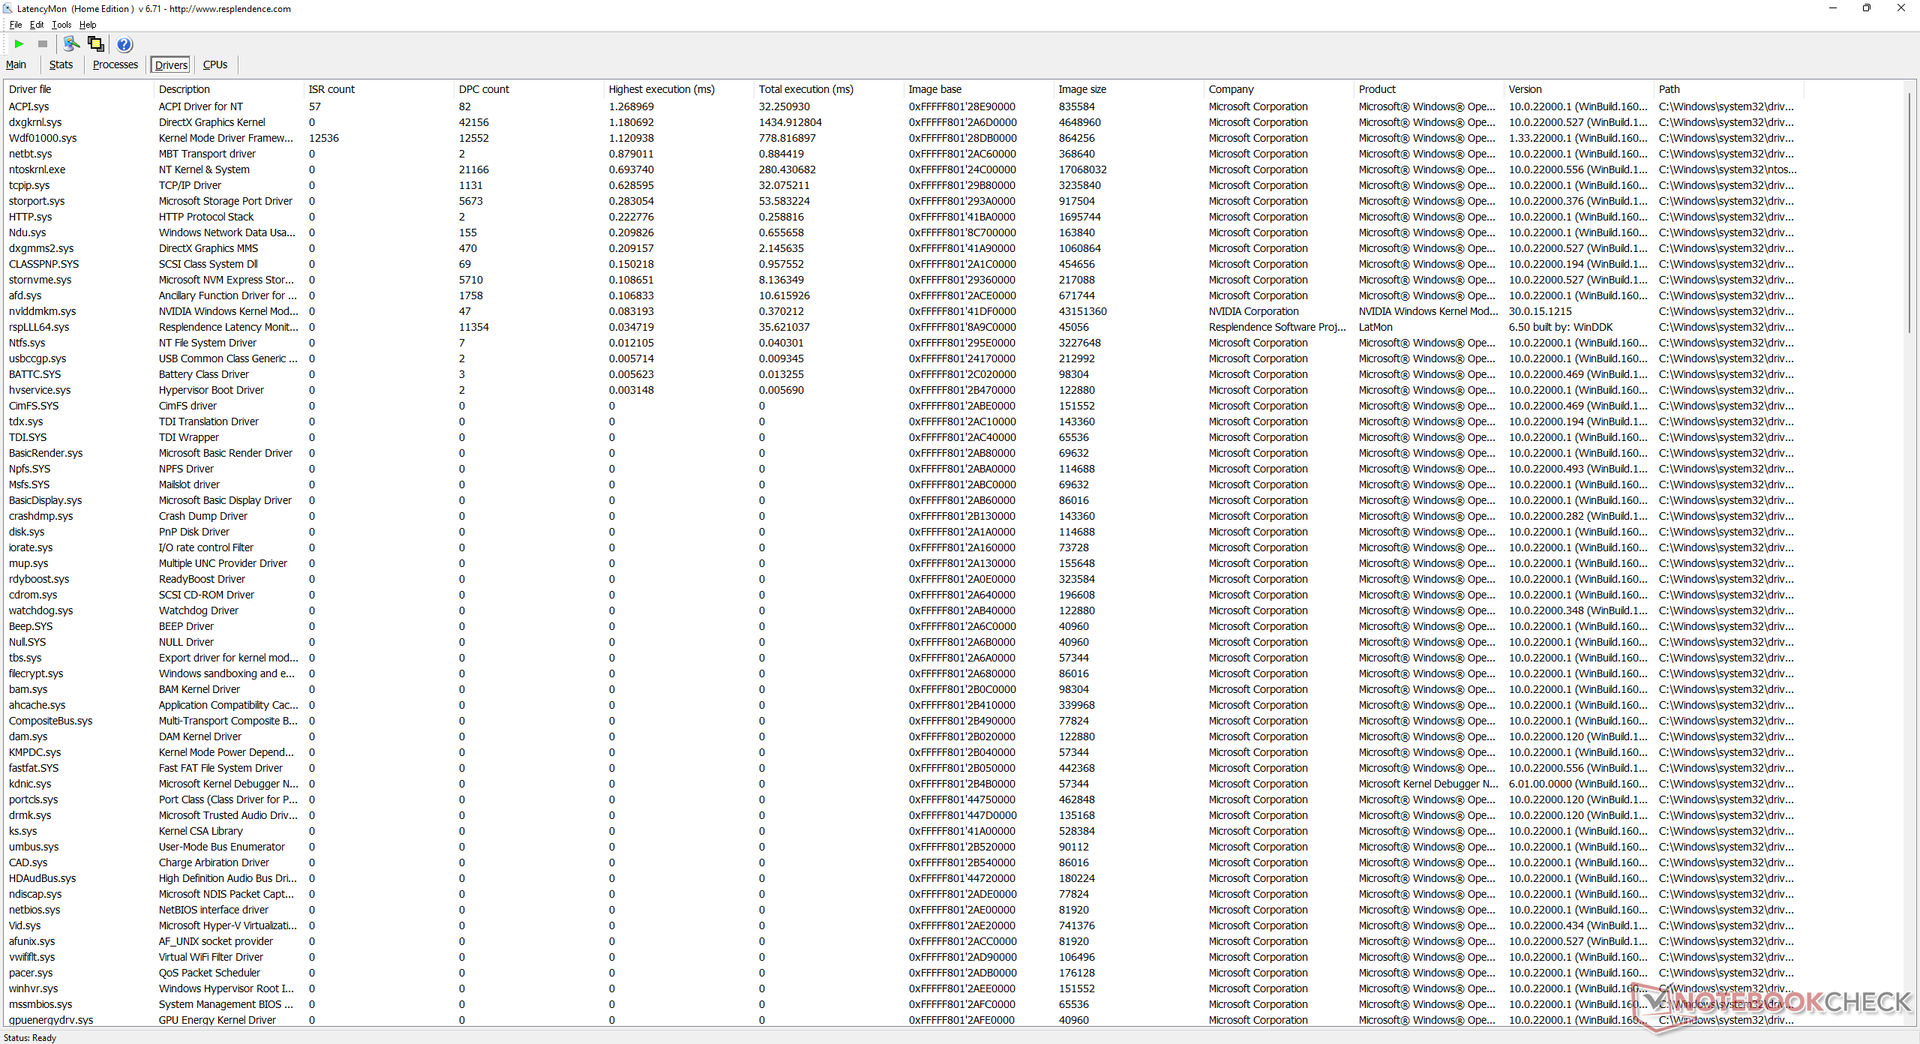
LatencyMon muestra problemas menores de CPD al abrir varias pestañas del navegador en nuestra página web. por lo demás, la reproducción de vídeo 4K a 60 FPS es perfecta, sin pérdida de fotogramas.
| DPC Latencies / LatencyMon - interrupt to process latency (max), Web, Youtube, Prime95 | |
| Alienware x17 RTX 3080 P48E | |
| Razer Blade Pro 17 2021 (QHD Touch) | |
| Asus ROG Zephyrus S17 GX703HSD | |
| Aorus 17G YD | |
| Razer Blade 17 RTX 3080 Ti | |
| MSI GS76 Stealth 11UH | |
* ... más pequeño es mejor
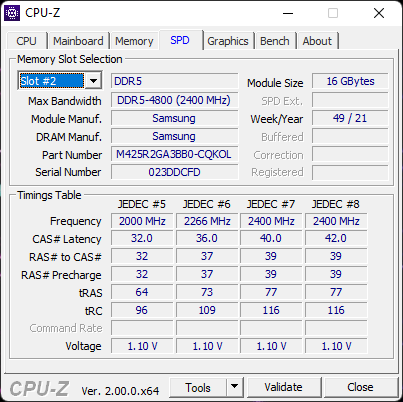
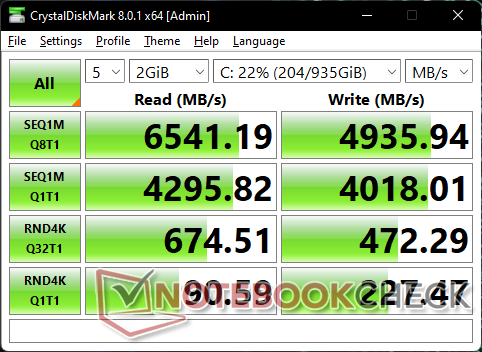
Dispositivos de almacenamiento: hasta dos SSD M.2 PCIe4 x4
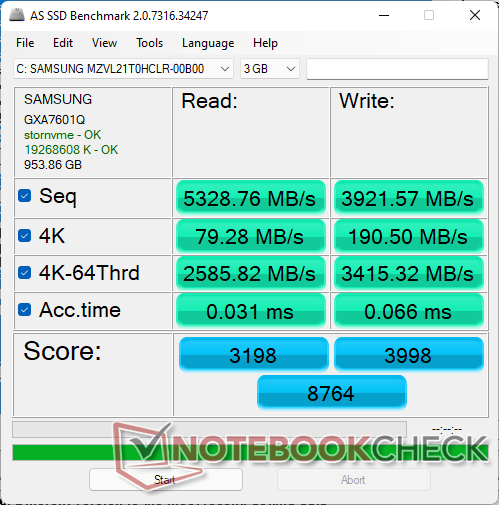
La mayoría de las unidades Blade 17, si no todas, se entregan con discos SSD de Samsung. Nuestra unidad de prueba viene con elSamsung PM9A1 que es uno de los SSDs PCIe4 x4 más rápidos disponibles para el consumidor. La unidad no muestra problemas para mantener tasas de transferencia muy rápidas de más de 6600 MB/s en nuestra unidad, lo que sugiere una excelente disipación del calor, a diferencia delUniwill Technology GM7AG8P.

* ... más pequeño es mejor
Disk Throttling: DiskSpd Read Loop, Queue Depth 8
Rendimiento de la GPU
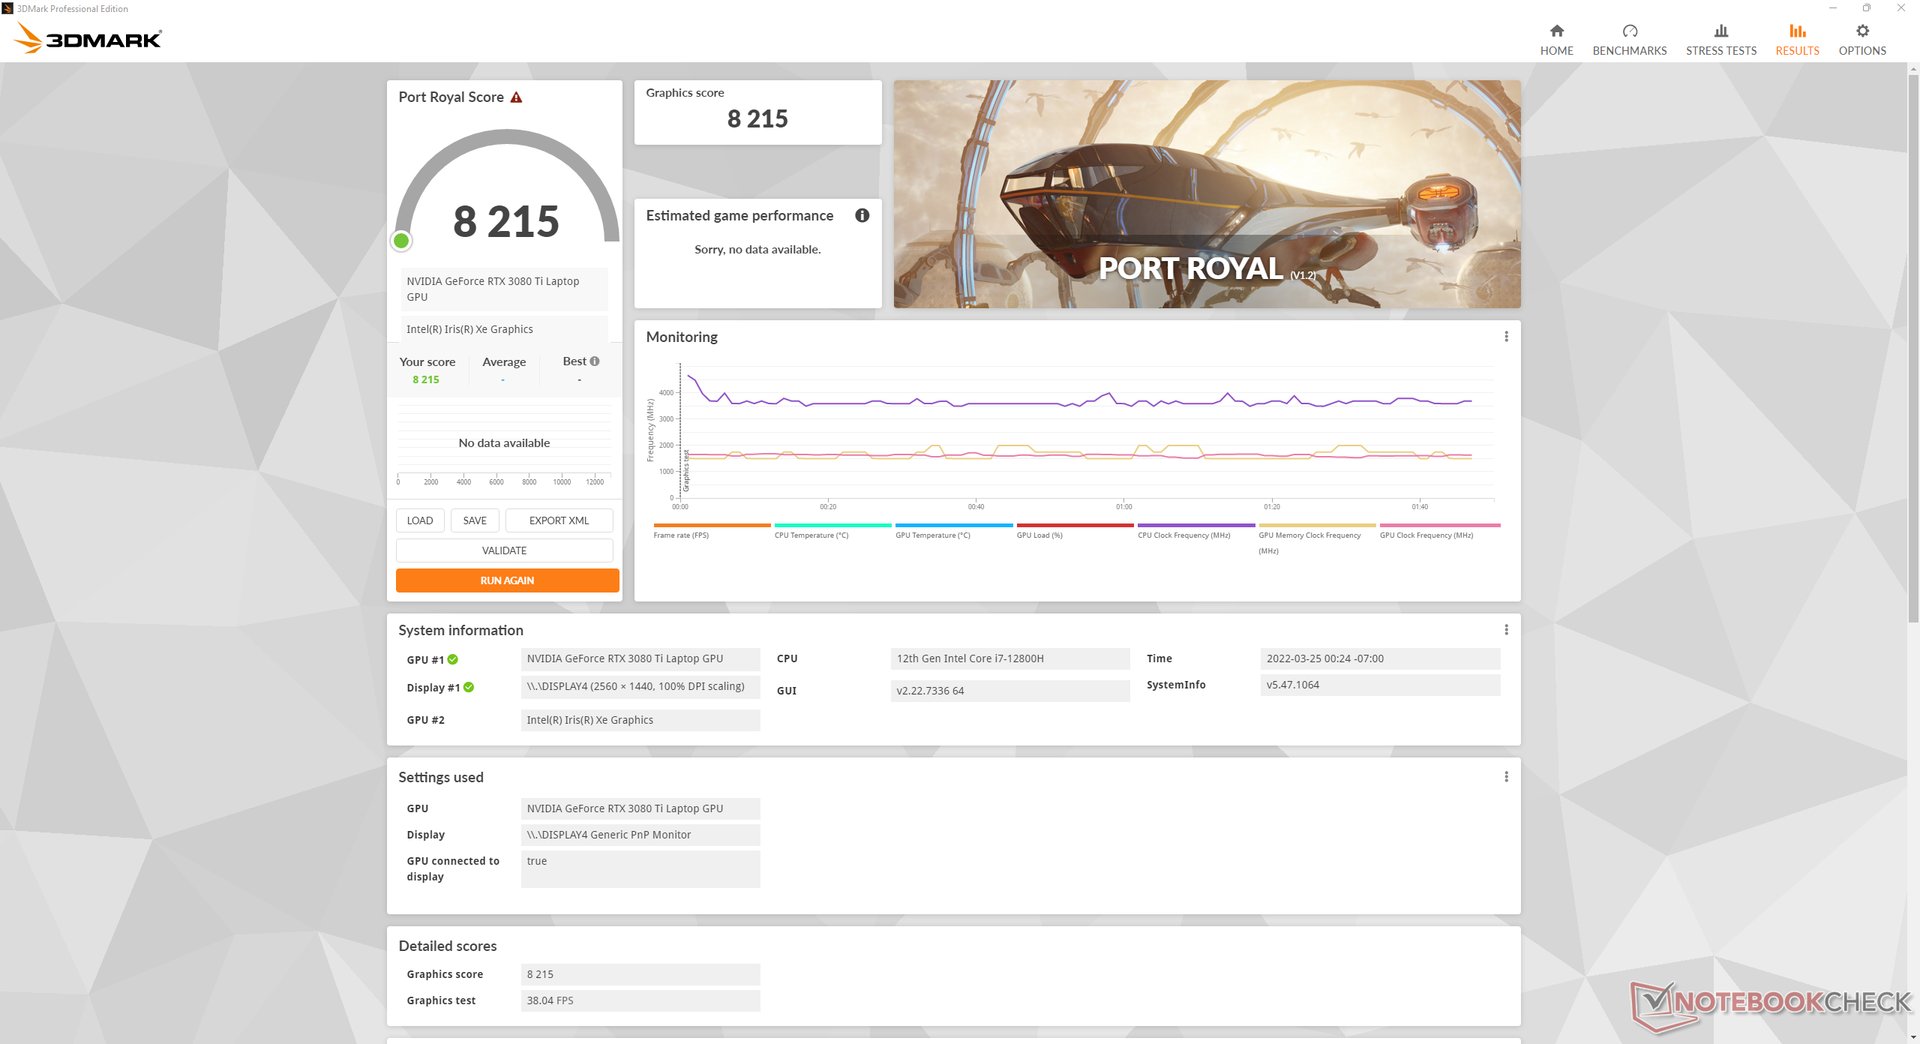
Tras probar más de media docena de portátiles con móviles GeForce RTX 3080 Ti en el momento del análisis, el de nuestro Blade 17 rinde cómodamente por encima de la media en torno a un 15 por ciento. El elevado objetivo TGP de 165 W es sin duda una gran razón para la ventaja de rendimiento, ya que otros portátiles con la misma GPU RTX 3080 Ti como el Blade 15 o el Gigabyte Aero 16 YE5 suelen apuntar a objetivos TGP mucho más bajos, de unos 100 W. Los usuarios pueden esperar un aumento del rendimiento gráfico bruto de alrededor del 20 por ciento sobre el Intel Blade 17 de 10ª o 11ª generación con la rTX 3080 para portátiles normales.
Ejecutar el sistema en modo dGPU equilibrado en lugar de en modo dGPU de máximo rendimiento supondrá un déficit de rendimiento gráfico de solo un 5 a 7 por ciento.
El cambio a la gráfica rTX 3070 Ti móvil desde nuestra RTX 3080 Ti móvil supondrá un déficit de rendimiento de sólo un 10 por ciento
Por supuesto, la rTX 3080 Ti "de verdad" para ordenadores de sobremesa seguirá ofreciendo un gran salto en el rendimiento de la GPU, de casi el 50% respecto a nuestra versión para móviles.
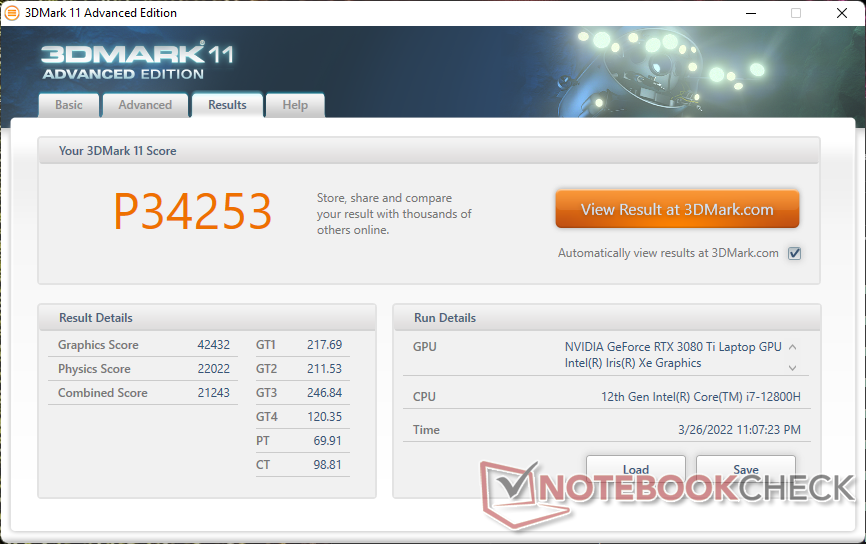

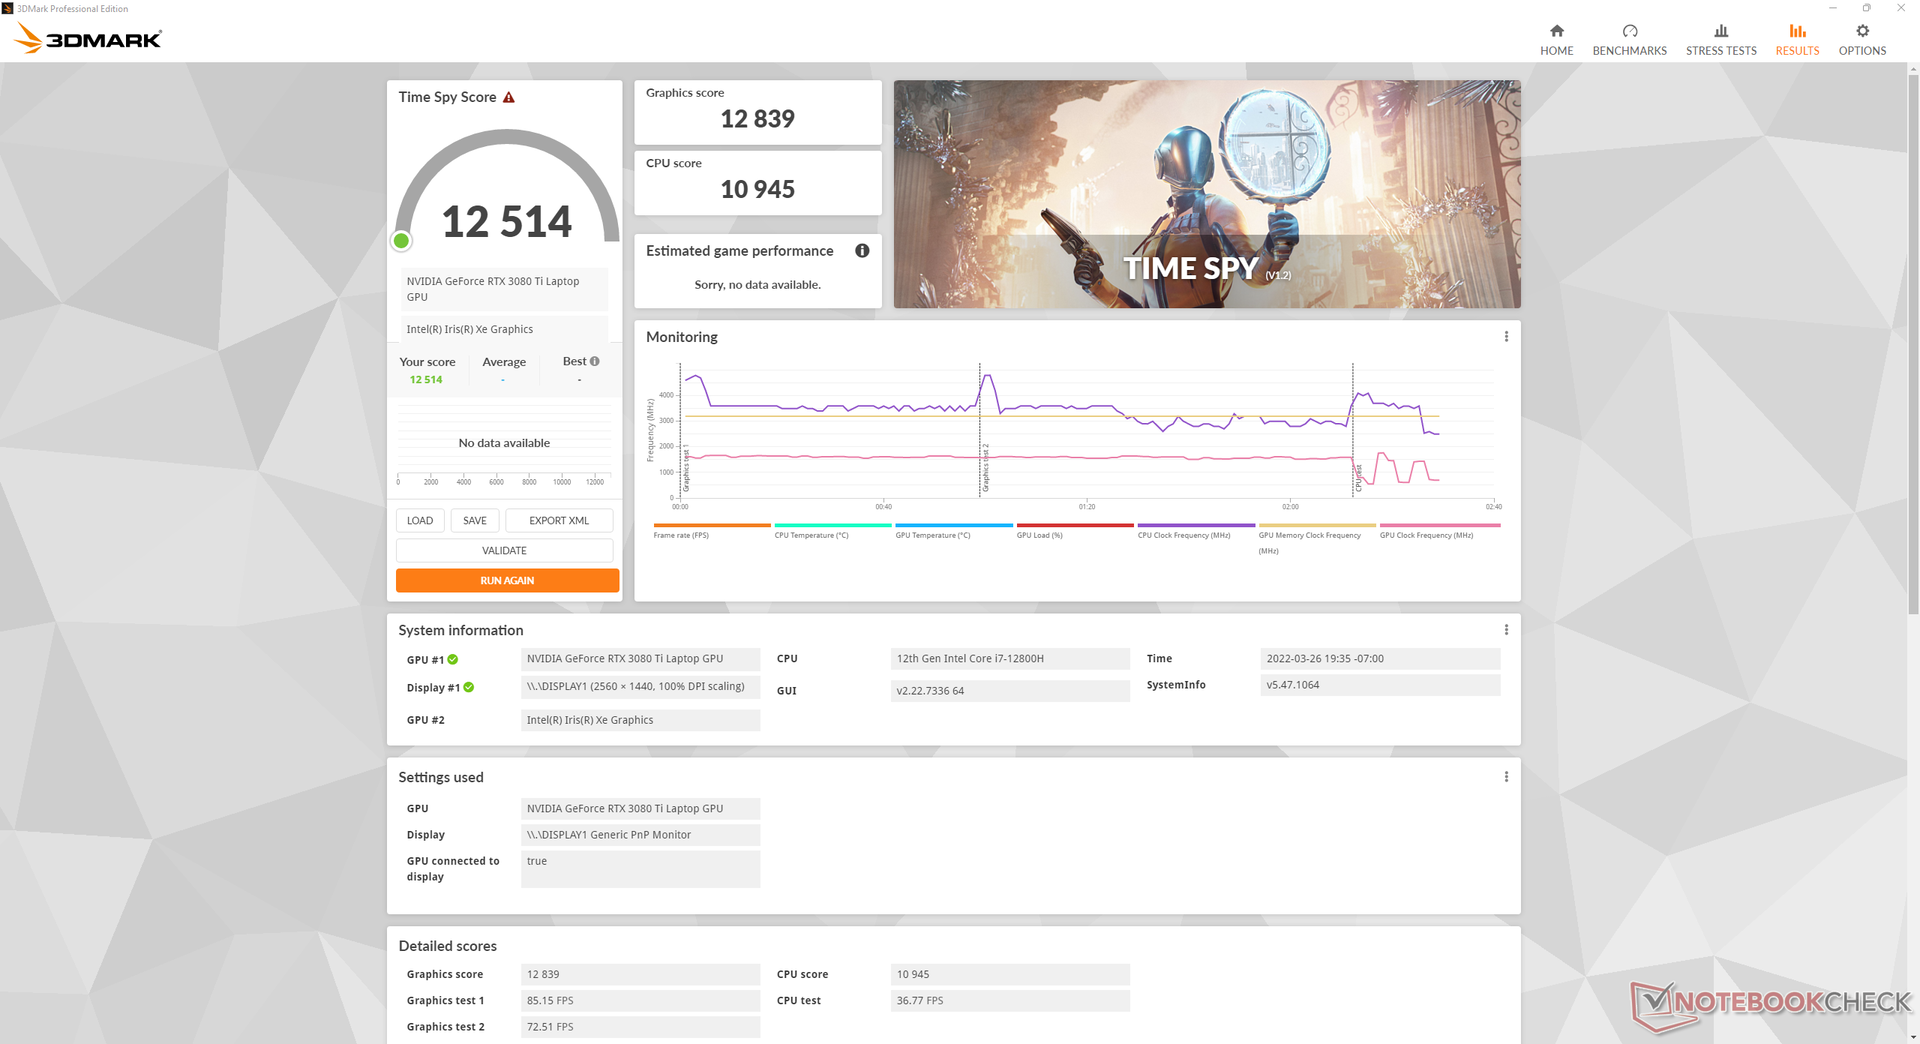

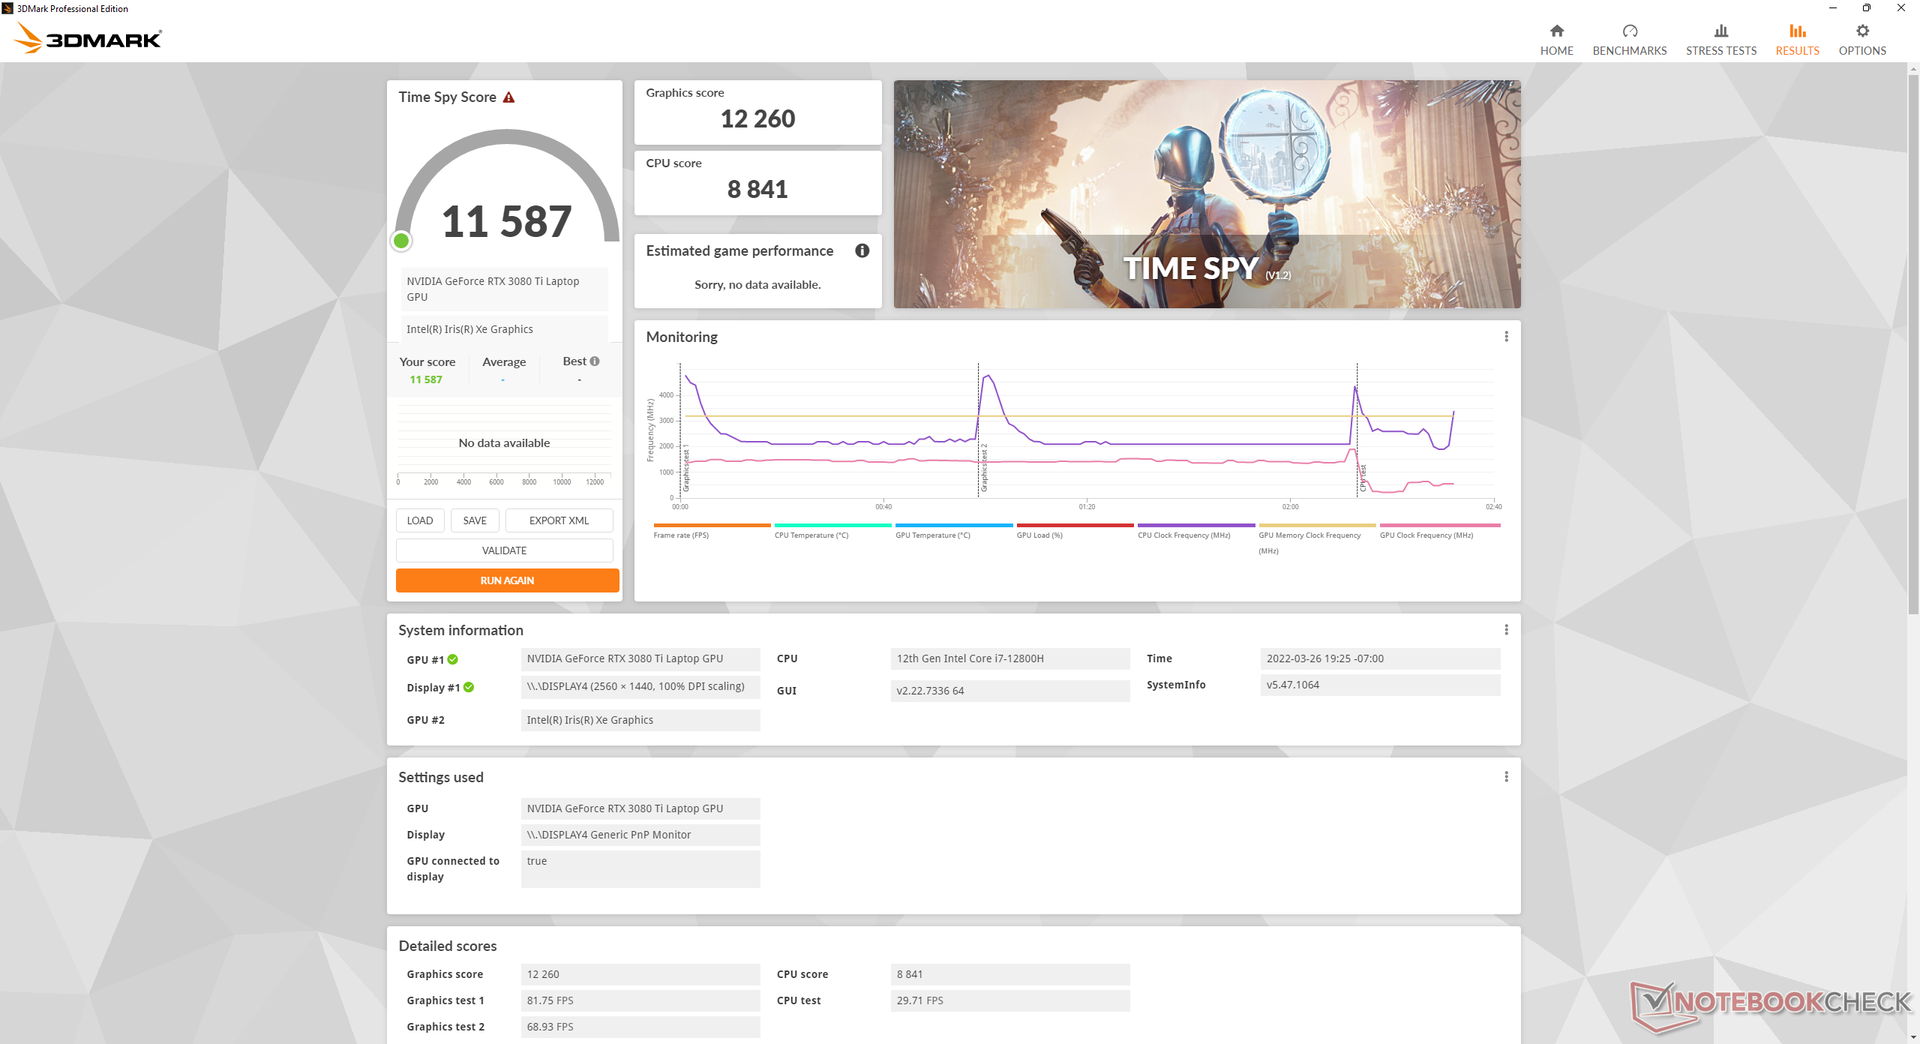
| 3DMark 11 Performance | 34253 puntos | |
| 3DMark Cloud Gate Standard Score | 62059 puntos | |
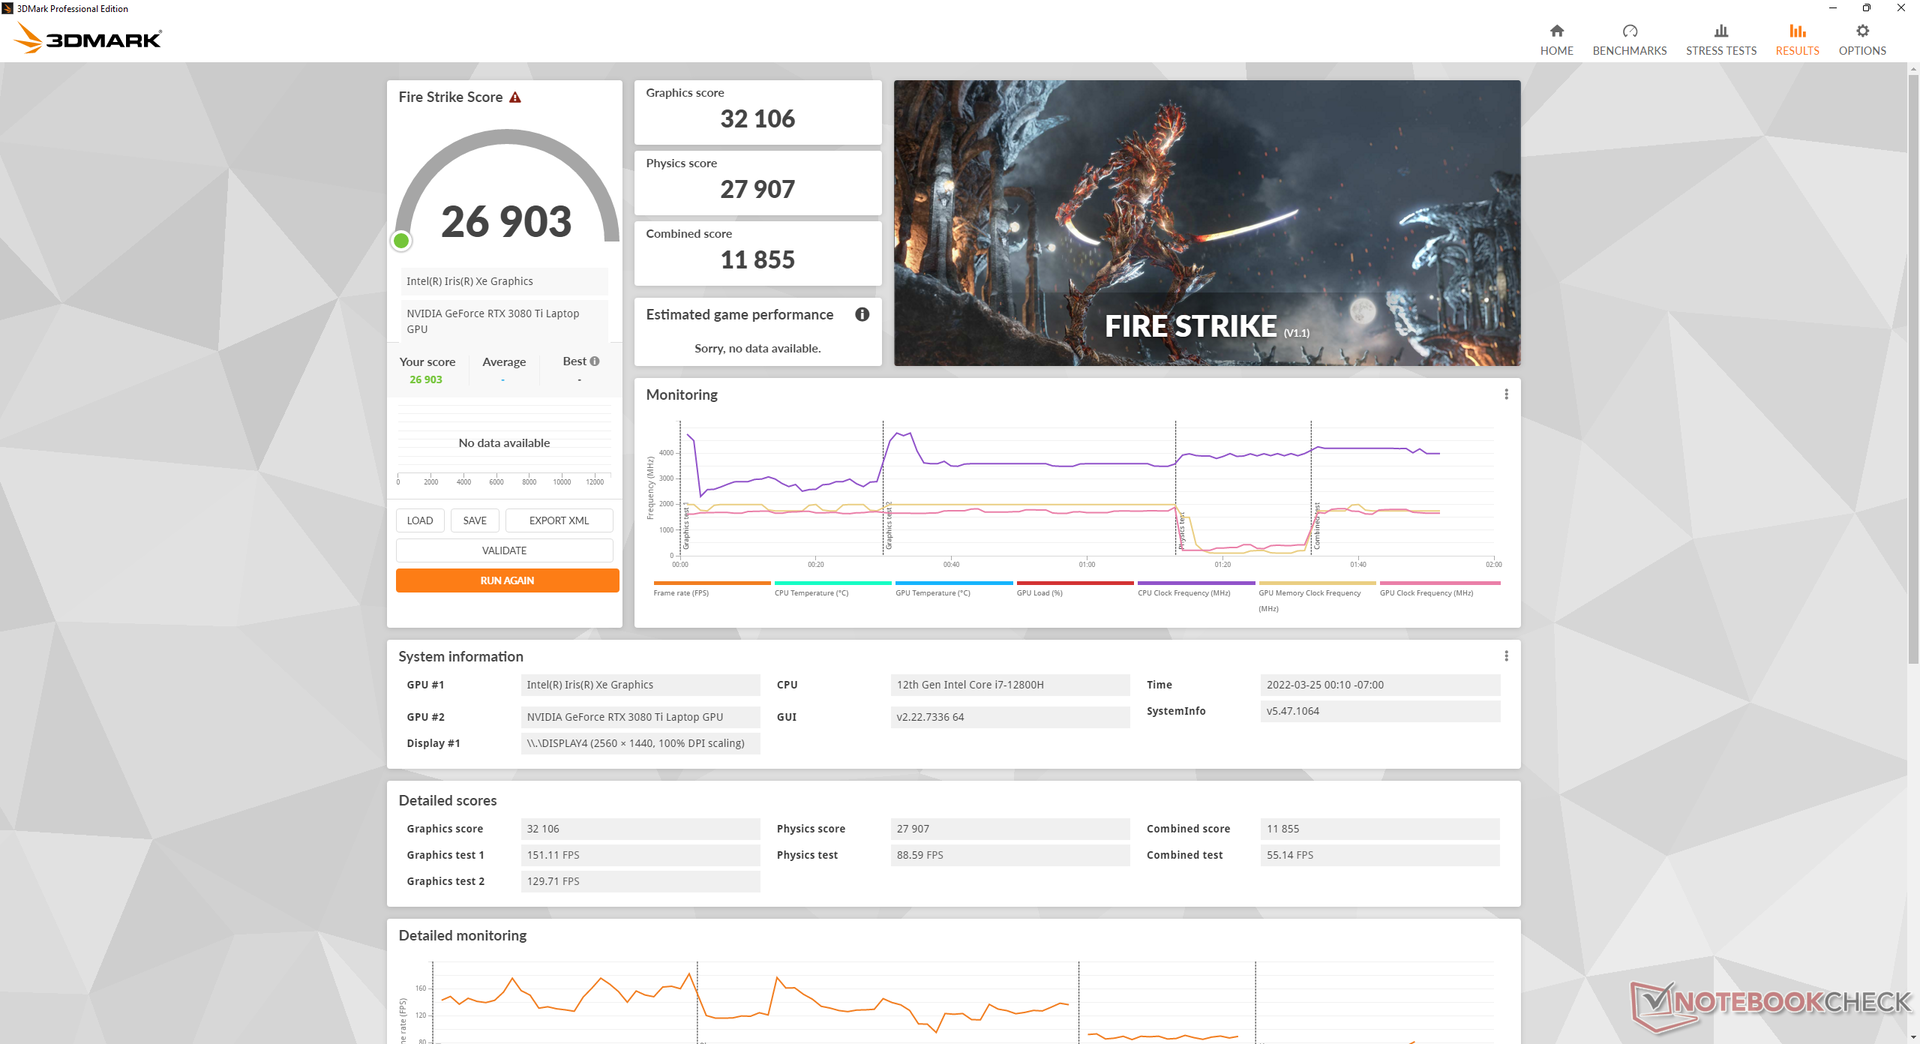
| 3DMark Fire Strike Score | 26903 puntos | |
| 3DMark Time Spy Score | 12913 puntos | |
ayuda | ||
Witcher 3 FPS Chart
| bajo | medio | alto | ultra | QHD | |
|---|---|---|---|---|---|
| GTA V (2015) | 186 | 182 | 176 | 113 | 105 |
| The Witcher 3 (2015) | 459 | 340.9 | 250.4 | 124.6 | |
| Dota 2 Reborn (2015) | 183 | 171 | 165 | 157 | |
| Final Fantasy XV Benchmark (2018) | 168 | 152 | 121 | 93.3 | |
| X-Plane 11.11 (2018) | 158 | 139 | 111 | ||
| Far Cry 5 (2018) | 171 | 149 | 134 | 125 | 120 |
| Strange Brigade (2018) | 431 | 296 | 242 | 215 | 158 |
| Cyberpunk 2077 1.6 (2022) | 119.1 | 112.1 | 106 | 106.5 | 59.7 |
Emisiones
Ruido del sistema: fuerte sólo cuando se juega
No hay cambios significativos en el ruido de los ventiladores a pesar de la reducción de cuatro a tres ventiladores. Los usuarios querrán estar en los modos Ahorro de Energía o Equilibrado cuando no ejecuten aplicaciones exigentes para que los ventiladores sean más silenciosos.
El ruido de los ventiladores cuando se juega en modo equilibrado es de unos 43,2 dB(A) en comparación con los 50,9 dB(A) cuando se juega en modo de máximo rendimiento a pesar del pequeño déficit gráfico del 5 al 7 por ciento. Por lo tanto, los usuarios pueden considerar jugar en modo equilibrado si el ruido del ventilador es una preocupación.
Ruido
| Ocioso |
| 23.3 / 23.3 / 26.3 dB(A) |
| Carga |
| 38.2 / 49.1 dB(A) |
 | ||
30 dB silencioso 40 dB(A) audible 50 dB(A) ruidosamente alto |
||
min: | ||
| Razer Blade 17 RTX 3080 Ti GeForce RTX 3080 Ti Laptop GPU, i7-12800H, Samsung PM9A1 MZVL21T0HCLR | Razer Blade Pro 17 2021 (QHD Touch) GeForce RTX 3080 Laptop GPU, i7-10875H, Samsung PM981a MZVLB1T0HBLR | MSI GS76 Stealth 11UH GeForce RTX 3080 Laptop GPU, i9-11900H, Samsung PM9A1 MZVL22T0HBLB | Asus ROG Zephyrus S17 GX703HSD GeForce RTX 3080 Laptop GPU, i9-11900H, Samsung PM9A1 MZVL22T0HBLB | Aorus 17G YD GeForce RTX 3080 Laptop GPU, i7-11800H, Samsung PM9A1 MZVL2512HCJQ | Alienware x17 RTX 3080 P48E GeForce RTX 3080 Laptop GPU, i7-11800H, 2x WDC PC SN730 SDBPNTY-1T00 (RAID 0) | |
|---|---|---|---|---|---|---|
| Noise | -12% | -12% | 2% | -25% | -4% | |
| apagado / medio ambiente * (dB) | 23.3 | 26.1 -12% | 24 -3% | 23 1% | 25 -7% | 24.9 -7% |
| Idle Minimum * (dB) | 23.3 | 26.1 -12% | 24 -3% | 23 1% | 32 -37% | 24.9 -7% |
| Idle Average * (dB) | 23.3 | 26.5 -14% | 25 -7% | 23 1% | 33 -42% | 24.9 -7% |
| Idle Maximum * (dB) | 26.3 | 30.7 -17% | 42 -60% | 23 13% | 39 -48% | 29.6 -13% |
| Load Average * (dB) | 38.2 | 43.5 -14% | 46 -20% | 41 -7% | 43 -13% | 31.1 19% |
| Witcher 3 ultra * (dB) | 50.9 | 54 -6% | 48 6% | 45 12% | 52 -2% | 49.7 2% |
| Load Maximum * (dB) | 49.1 | 55 -12% | 48 2% | 52 -6% | 61 -24% | 54.8 -12% |
* ... más pequeño es mejor
Temperatura - Más caliente que antes
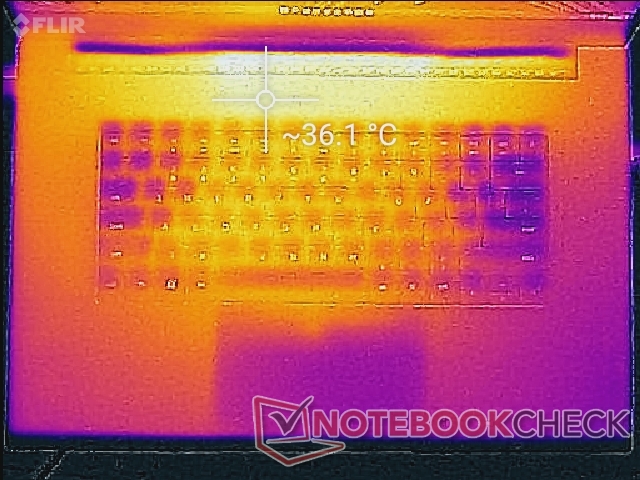
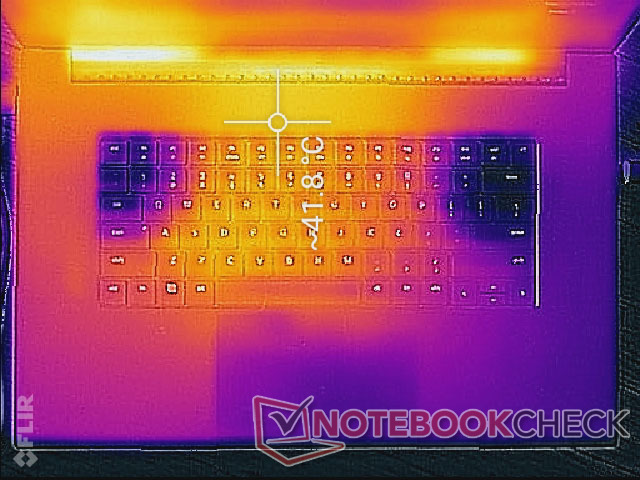
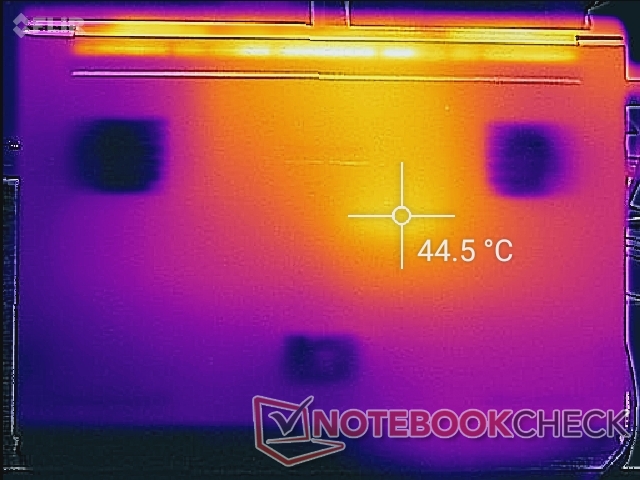
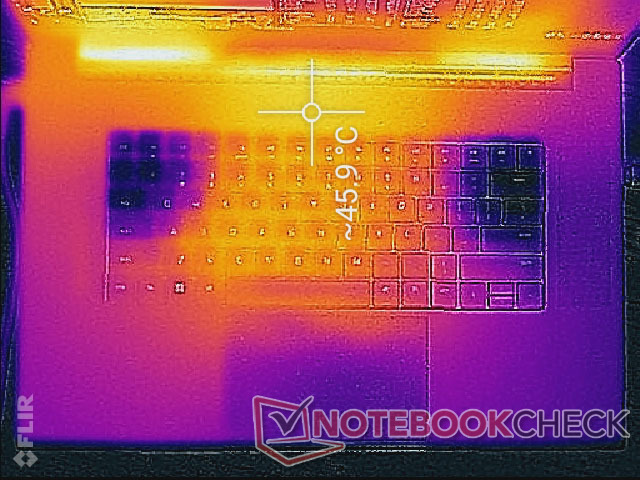
Las temperaturas de la superficie son ligeramente más cálidas en el modelo 2022 en comparación con el modelo 2021. El centro del teclado puede estar tan caliente como 38 C cuando se juega, mientras que este mismo punto en el modelo 2021 estaría un poco más fresco por unos pocos grados. Además, el sistema sigue estando muy caliente, entre 31 C y 35 C cuando no se ejecuta ninguna carga exigente, comparado con los 27 C a 30 C del MSI GS76. Las mayores temperaturas de la piel son el precio a pagar por unos ventiladores más silenciosos durante las cargas de procesamiento bajas.
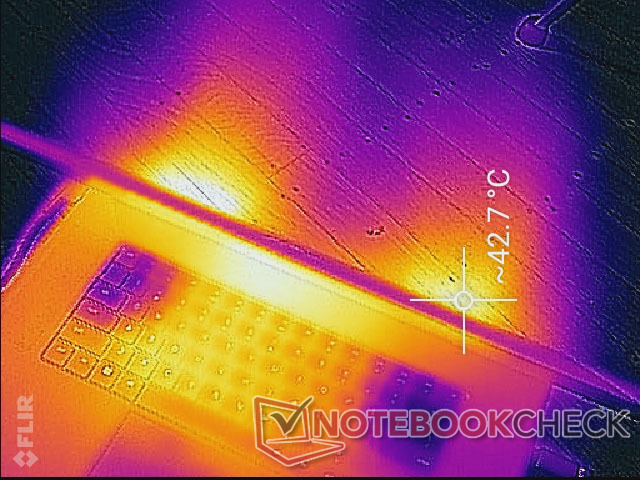
(-) La temperatura máxima en la parte superior es de 46 °C / 115 F, frente a la media de 40.4 °C / 105 F, que oscila entre 21.2 y 68.8 °C para la clase Gaming.
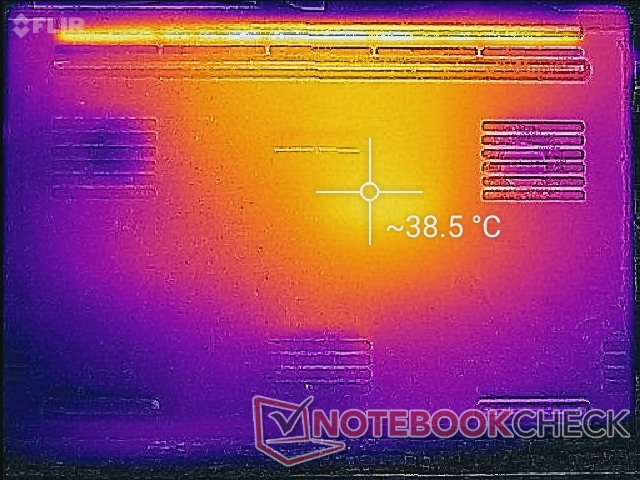
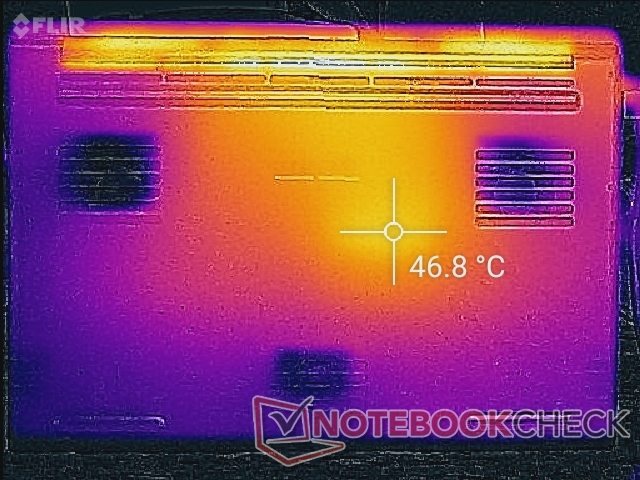
(-) El fondo se calienta hasta un máximo de 46.8 °C / 116 F, frente a la media de 43.2 °C / 110 F
(+) En reposo, la temperatura media de la parte superior es de 31.5 °C / 89# F, frente a la media del dispositivo de 33.9 °C / 93 F.
(±) Jugando a The Witcher 3, la temperatura media de la parte superior es de 33.2 °C / 92 F, frente a la media del dispositivo de 33.9 °C / 93 F.
(+) Los reposamanos y el panel táctil alcanzan como máximo la temperatura de la piel (32.4 °C / 90.3 F) y, por tanto, no están calientes.
(-) La temperatura media de la zona del reposamanos de dispositivos similares fue de 28.8 °C / 83.8 F (-3.6 °C / -6.5 F).
| Razer Blade 17 RTX 3080 Ti Intel Core i7-12800H, NVIDIA GeForce RTX 3080 Ti Laptop GPU | Razer Blade Pro 17 2021 (QHD Touch) Intel Core i7-10875H, NVIDIA GeForce RTX 3080 Laptop GPU | MSI GS76 Stealth 11UH Intel Core i9-11900H, NVIDIA GeForce RTX 3080 Laptop GPU | Asus ROG Zephyrus S17 GX703HSD Intel Core i9-11900H, NVIDIA GeForce RTX 3080 Laptop GPU | Aorus 17G YD Intel Core i7-11800H, NVIDIA GeForce RTX 3080 Laptop GPU | Alienware x17 RTX 3080 P48E Intel Core i7-11800H, NVIDIA GeForce RTX 3080 Laptop GPU | |
|---|---|---|---|---|---|---|
| Heat | 10% | 4% | -7% | 12% | -4% | |
| Maximum Upper Side * (°C) | 46 | 38.2 17% | 49 -7% | 59 -28% | 36 22% | 58.4 -27% |
| Maximum Bottom * (°C) | 46.8 | 42.2 10% | 57 -22% | 53 -13% | 52 -11% | 49 -5% |
| Idle Upper Side * (°C) | 36.2 | 33.6 7% | 28 23% | 35 3% | 29 20% | 33.6 7% |
| Idle Bottom * (°C) | 38.6 | 36.2 6% | 30 22% | 35 9% | 33 15% | 34.6 10% |
* ... más pequeño es mejor
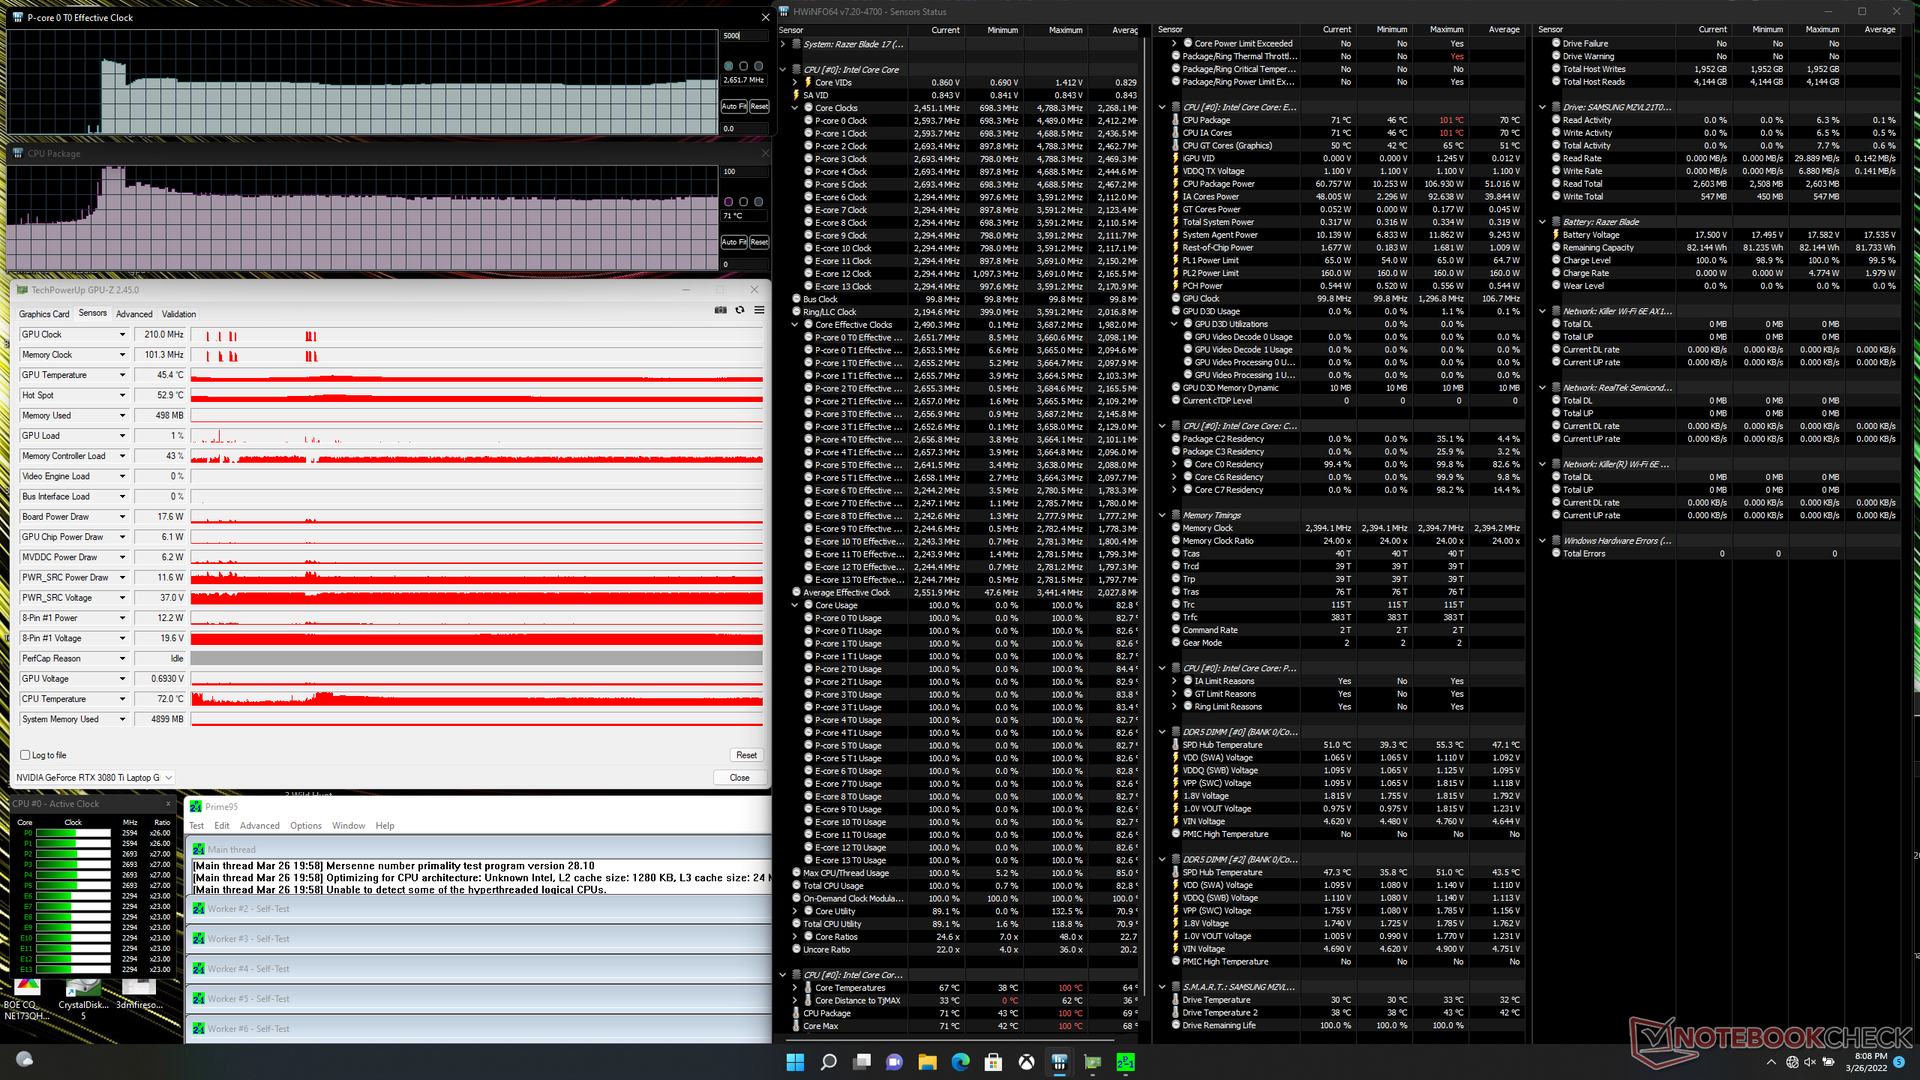
Prueba de esfuerzo
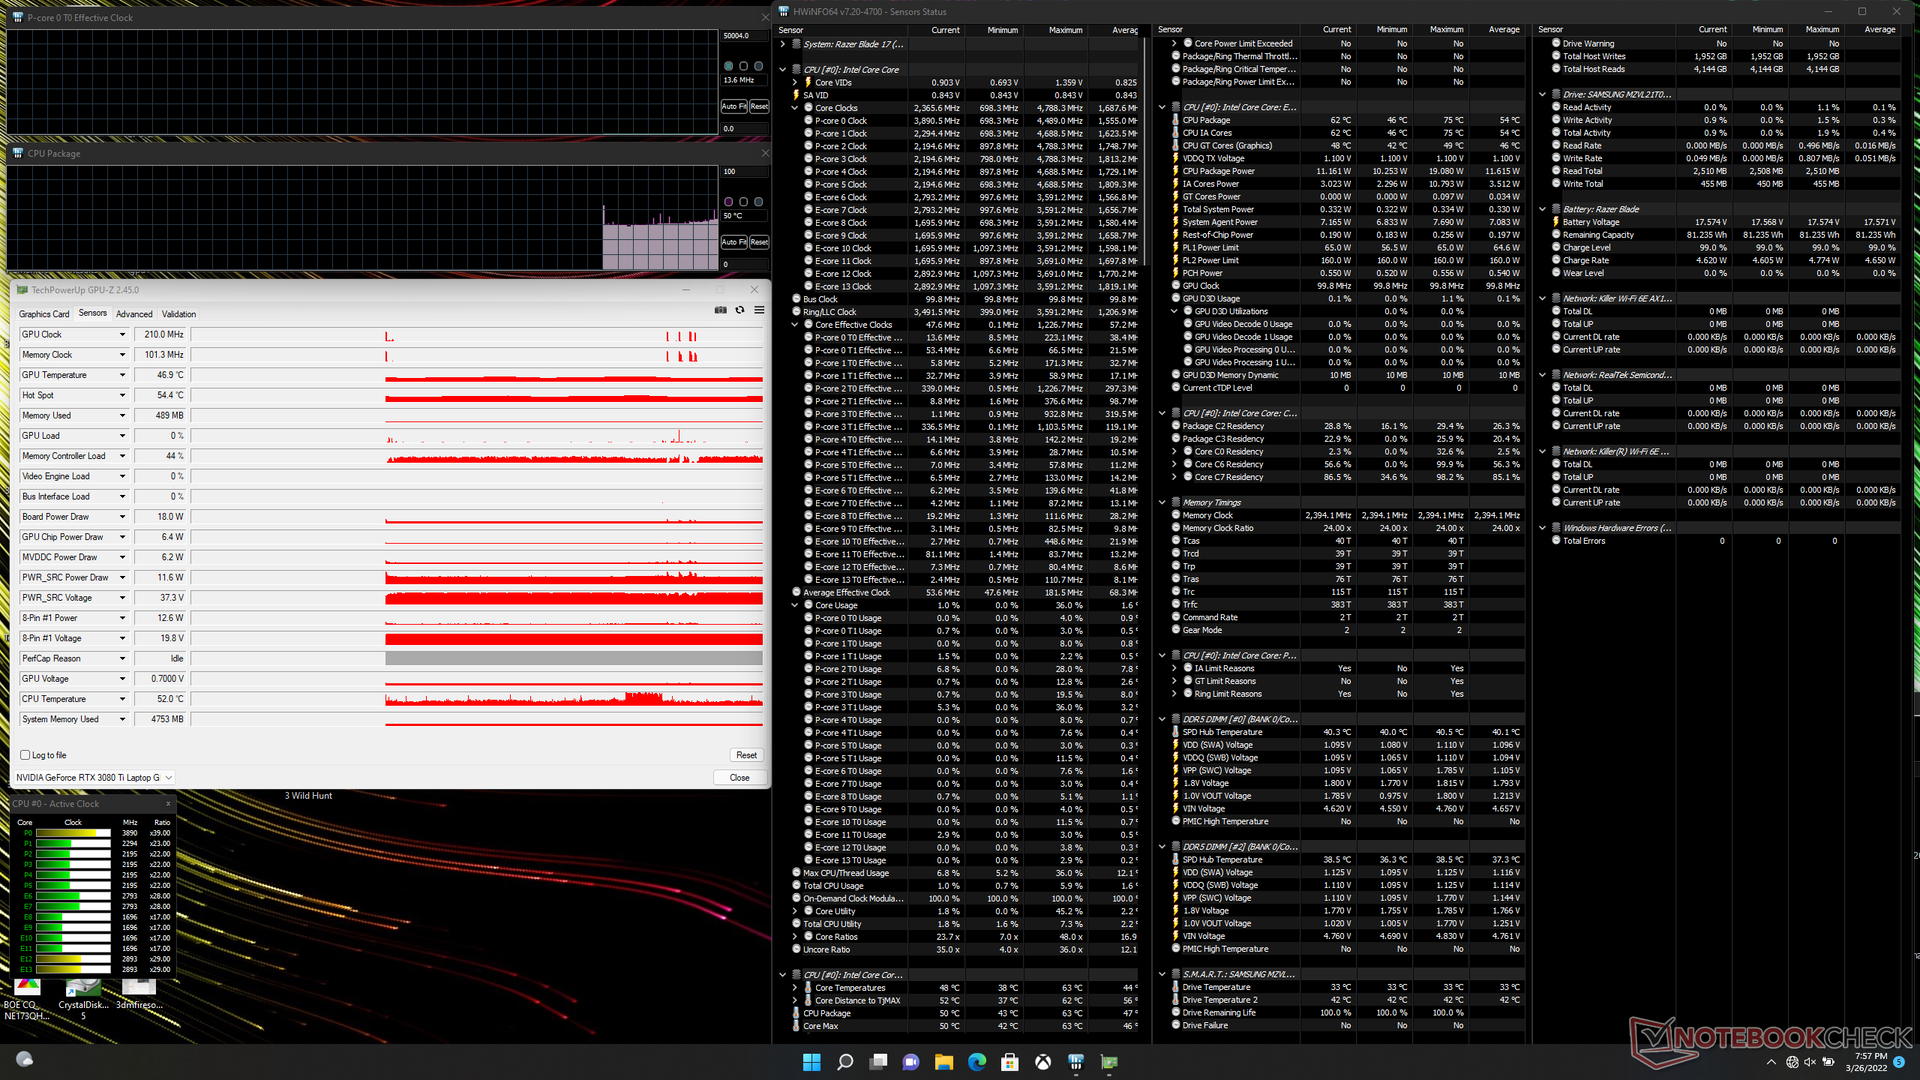
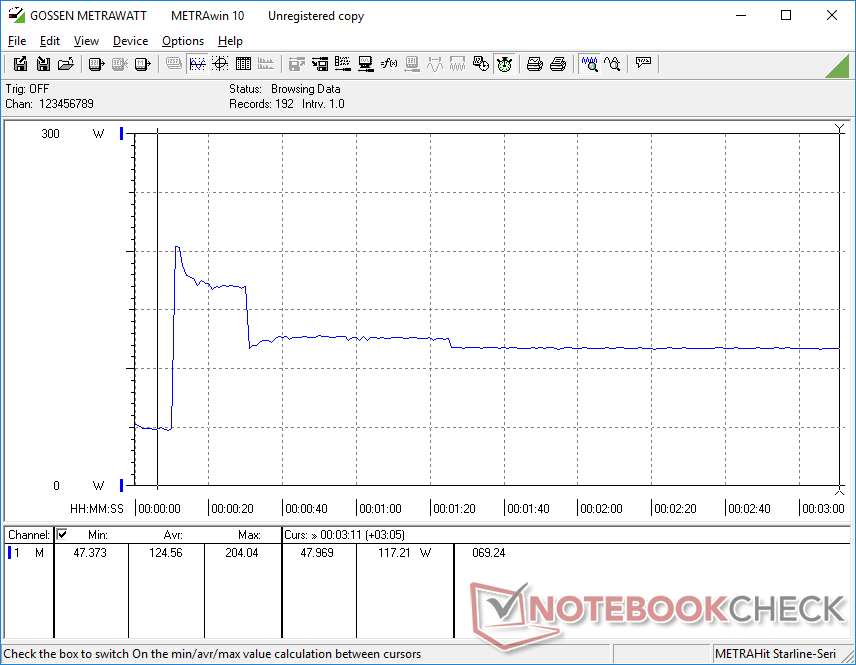
Cuando se estresa con Prime95 en el modo de máximo rendimiento, la CPU se eleva a 3,6 GHz durante los primeros 20 segundos aproximadamente y a una temperatura del núcleo de 99 C. La velocidad de reloj y la temperatura caen entonces a 2,7 GHz y 83 C antes de estabilizarse finalmente en 2,5 GHz y 72 C. La potencia del paquete de la CPU alcanza los 107 W durante el inicio de la prueba de estrés antes de estabilizarse en 61 W, en comparación con los 90 W y 65 W del Blade 17 de Intel de 11ª generación.
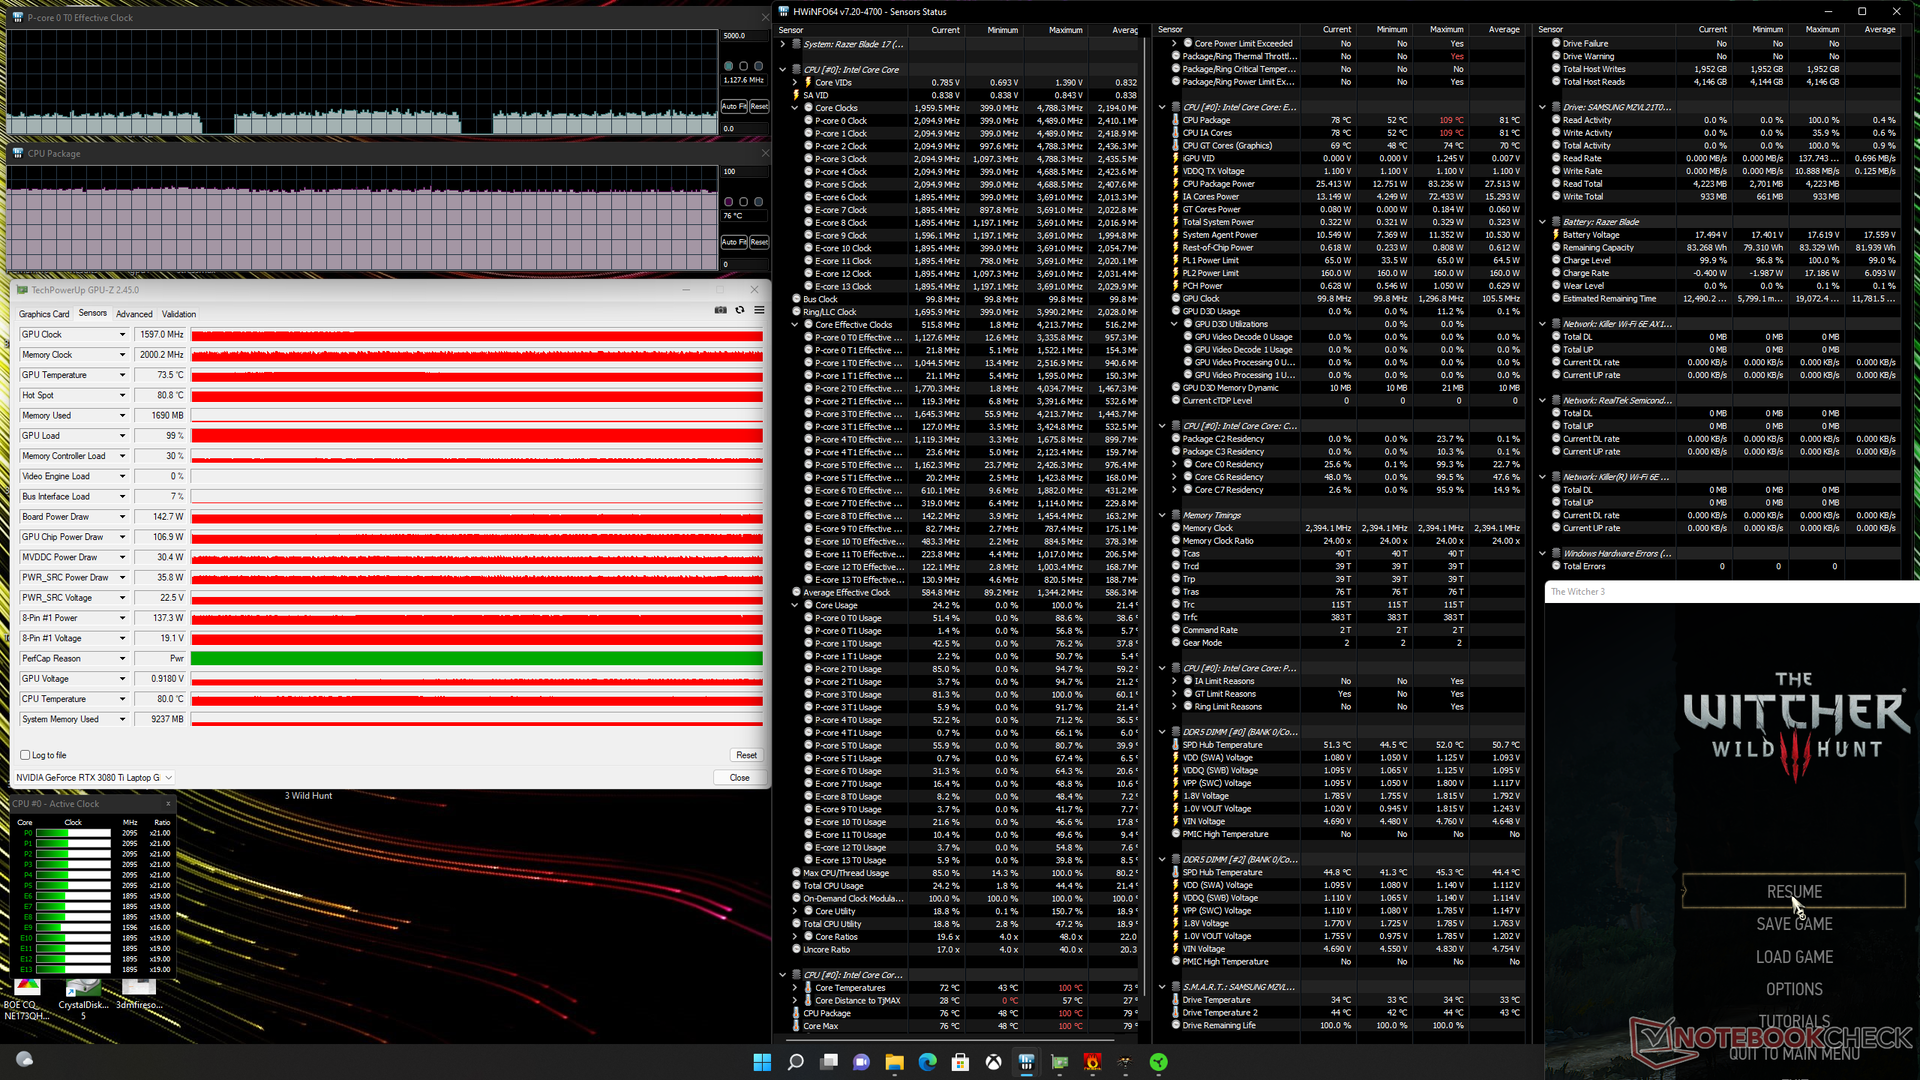
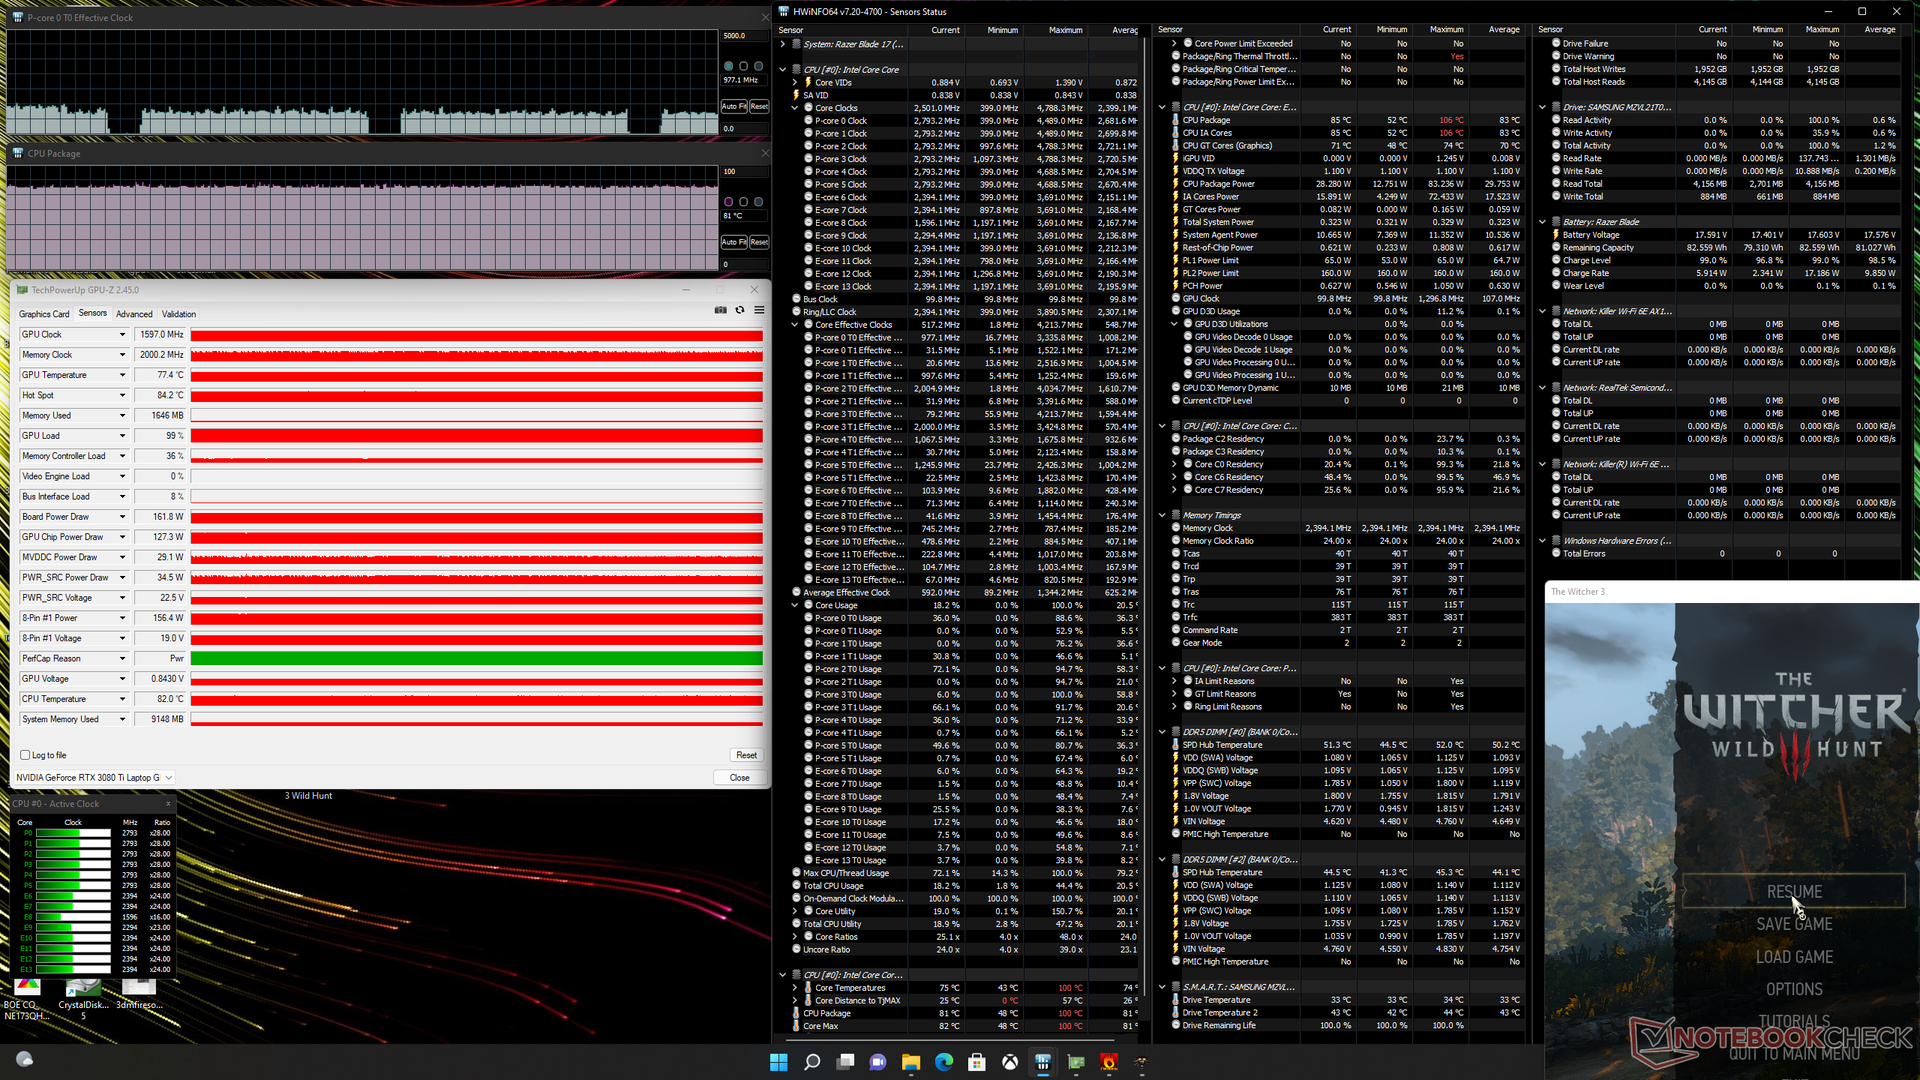
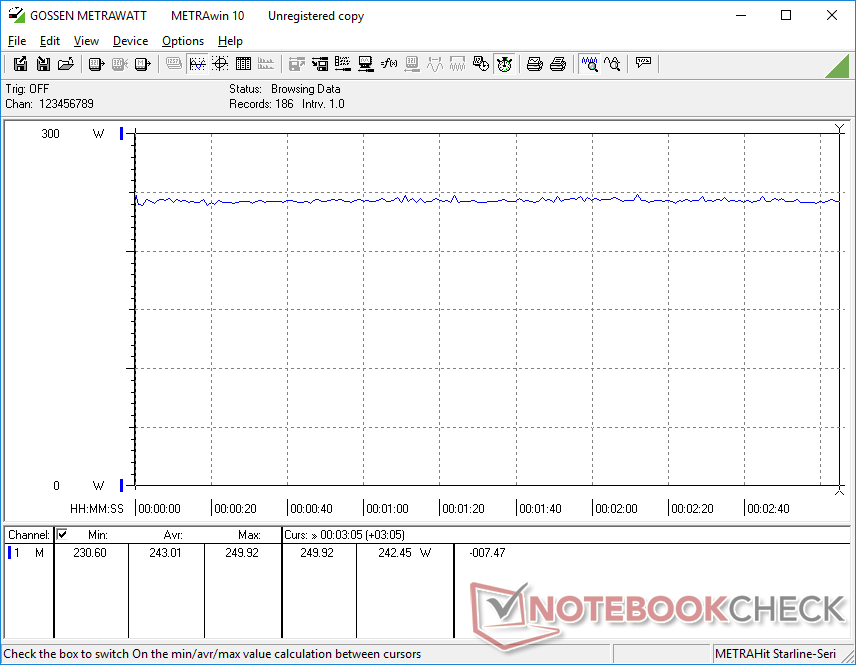
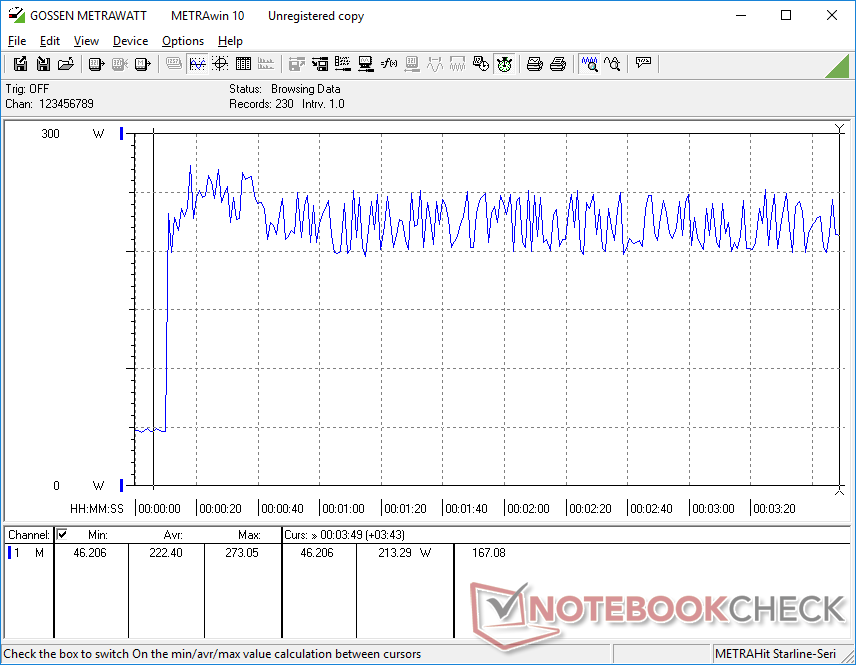
Si se ejecuta Witcher 3 en el modo de máximo rendimiento, el consumo de energía de la GPU es de 162 W, mientras que en el modo equilibrado es de 143 W. Por lo tanto, los usuarios deben ejecutar el Blade 17 en su configuración de máximo rendimiento para extraer el máximo rendimiento posible cuando se juega. Las temperaturas de la CPU y la GPU se estabilizan en 81 C y 77 C, respectivamente, comparadas con los 79 C y 72 C del Intel Blade 17 de 11ª generación con gráficos RTX 3070 o los 65 C y 64 C del Intel Blade 17 de 10ª generación con gráficos RTX 3080. Las mayores temperaturas de núcleo en nuestro modelo Intel de 12ª generación no son sorprendentes dado su mayor TDP y objetivos TGP.
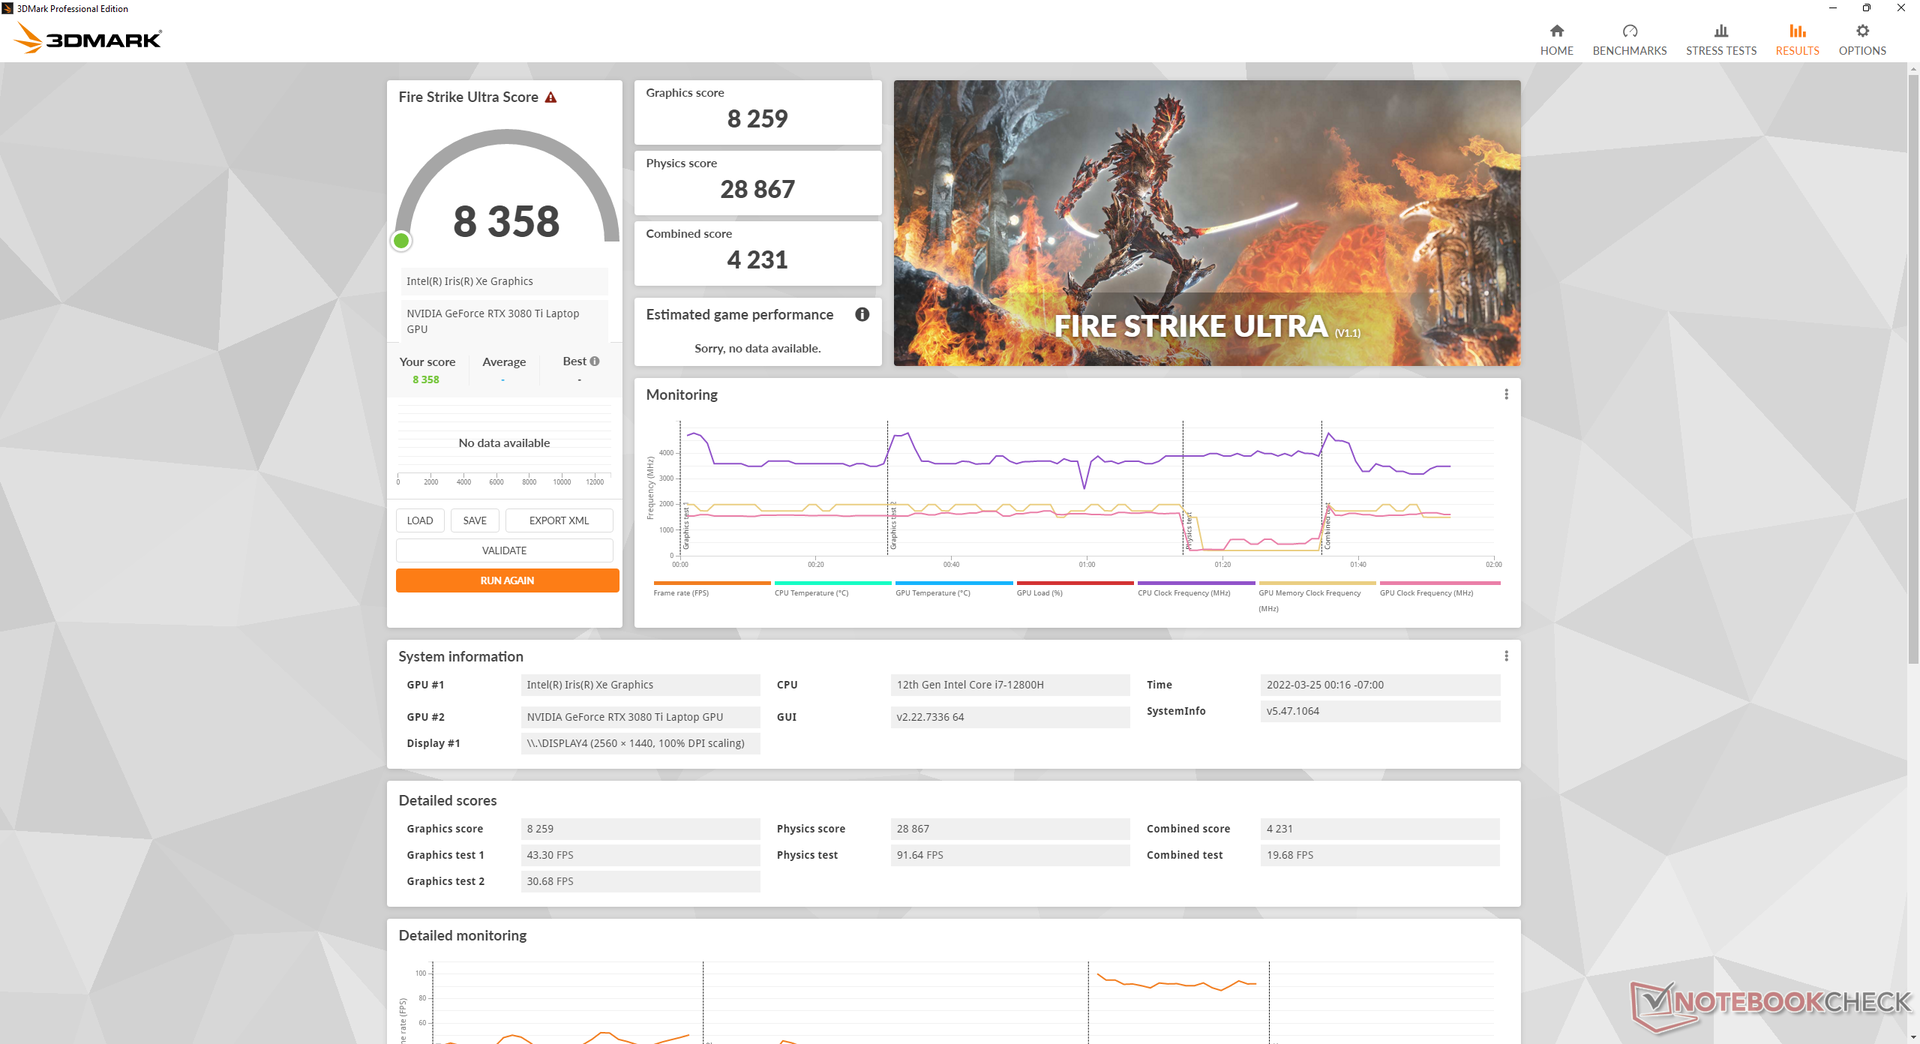
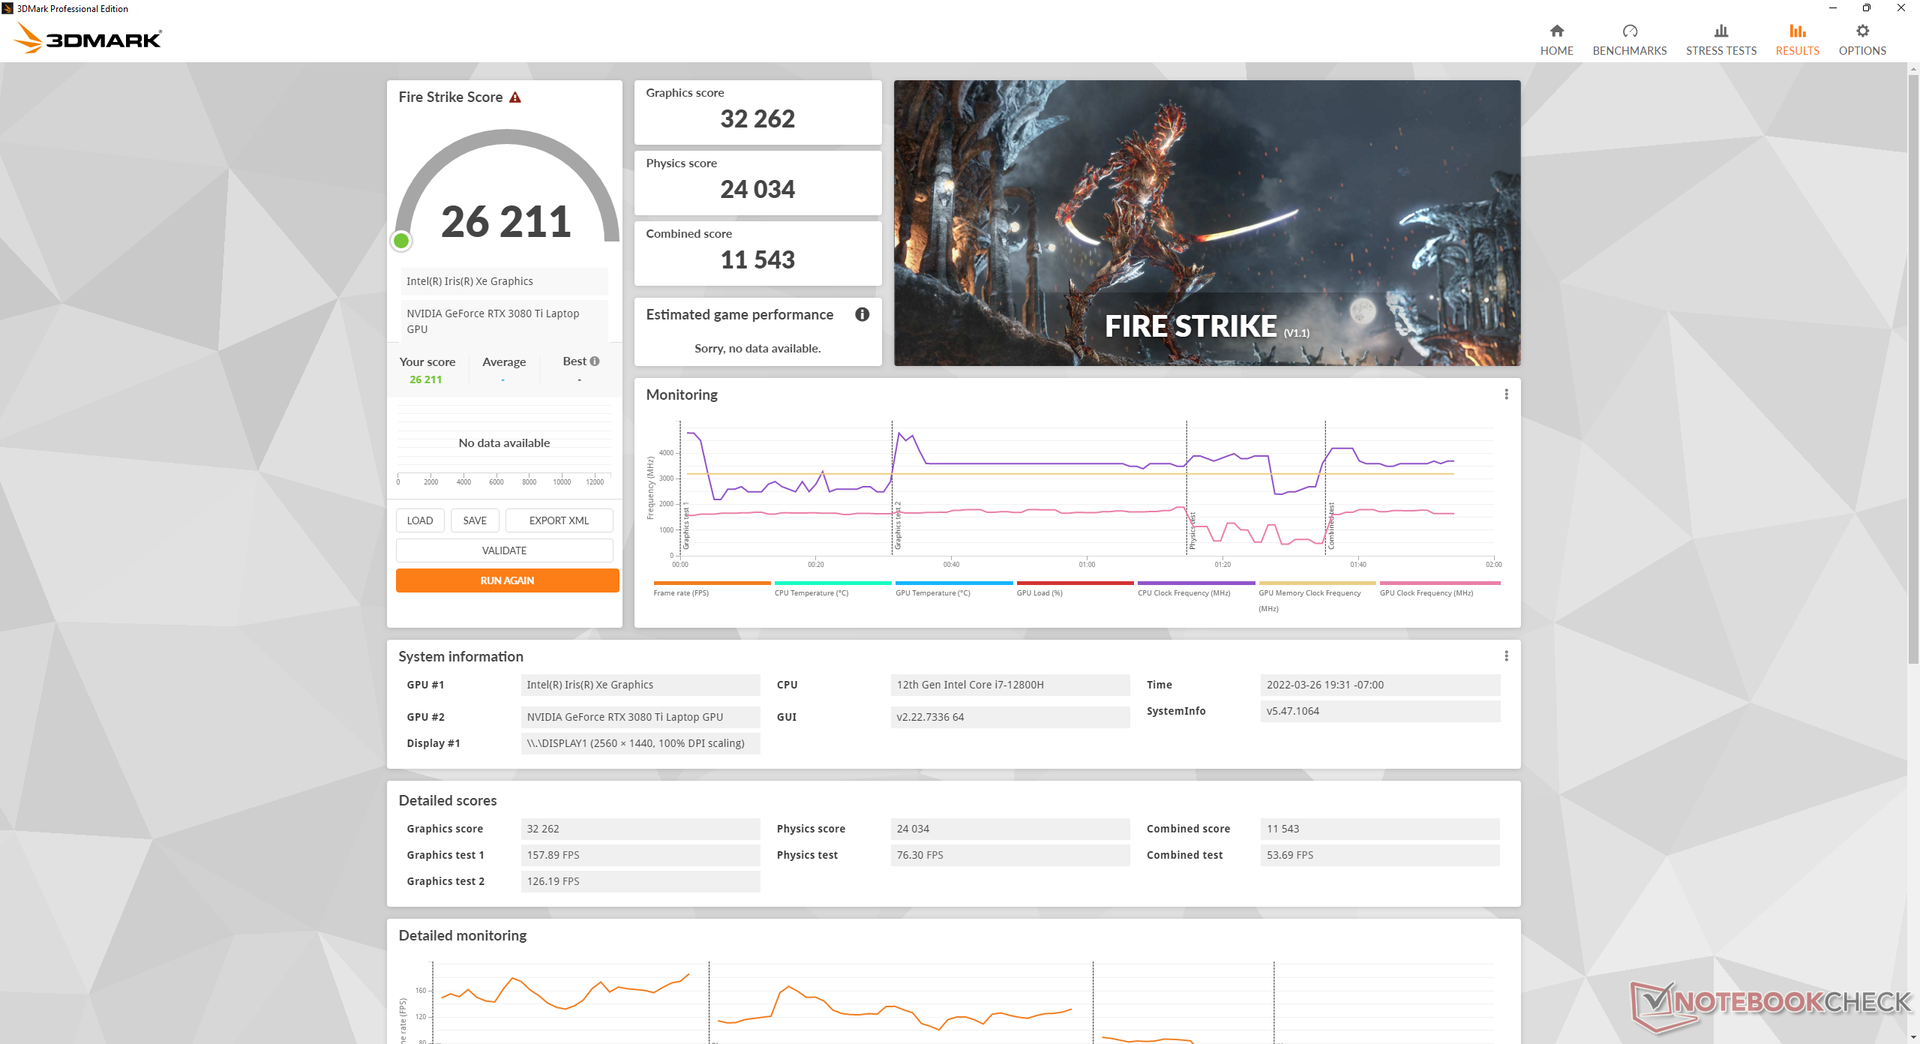
El funcionamiento con batería limita el rendimiento de forma significativa, ya que el sistema no puede ajustarse a nada más que el perfil de energía equilibrado. Una prueba de Fire Strike con baterías arrojaría unas puntuaciones de Física y Gráficos de 11785 y 9465 puntos, respectivamente, comparado con 27907 y 32106 puntos cuando está conectado a la red eléctrica.
| Reloj dela CPU (GHz) | Reloj de la GPU (MHz) | Temperatura media dela CPU (°C) | Temperatura media de la GPU (°C) | |
| Sistema en reposo | -- | -- | 50 | 47 |
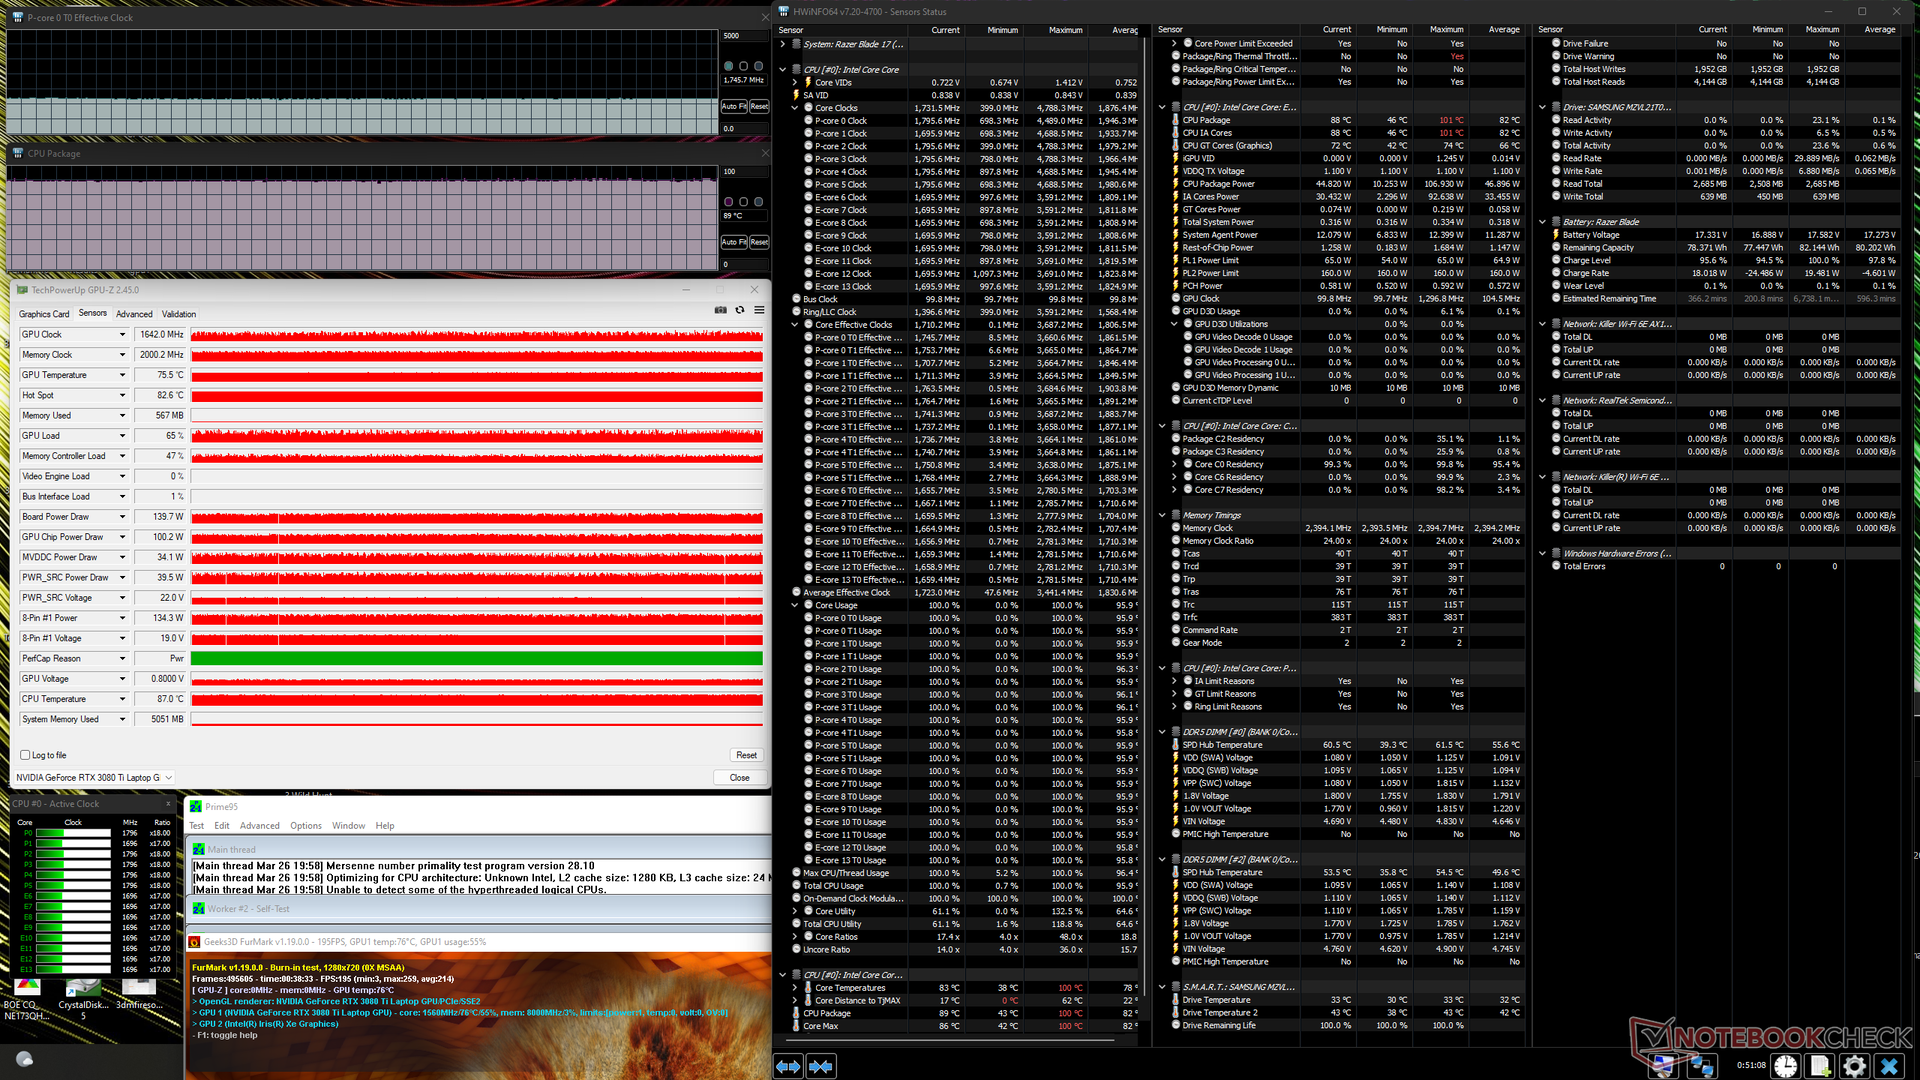
| Prime95Stress | 2,4 - 2,6 | -- | 71 | 45 |
| Prime95+ FurMarkStress | 1,8 | ~1642 | 89 | 76 |
| Witcher 3 Estrés (modoequilibrado) | ~1,1 | 1597 | 76 | 74 |
| Witcher 3 Estrés (modo demáximo rendimiento) | ~1,1 | 1597 | 81 | 77 |
Altavoces
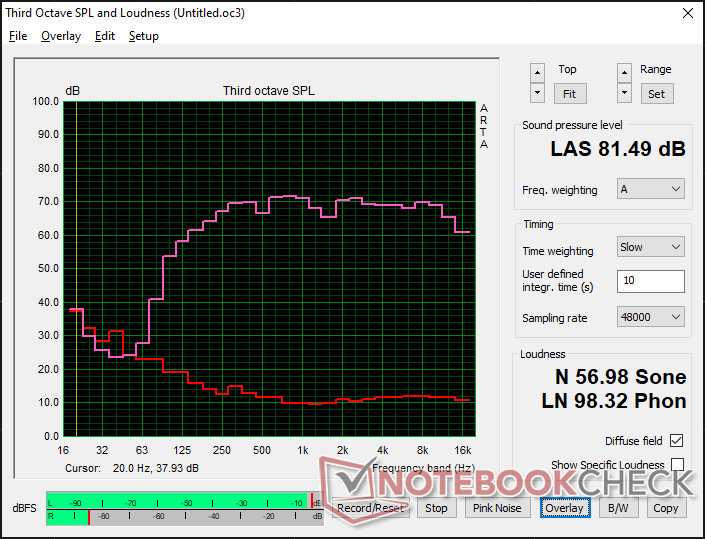
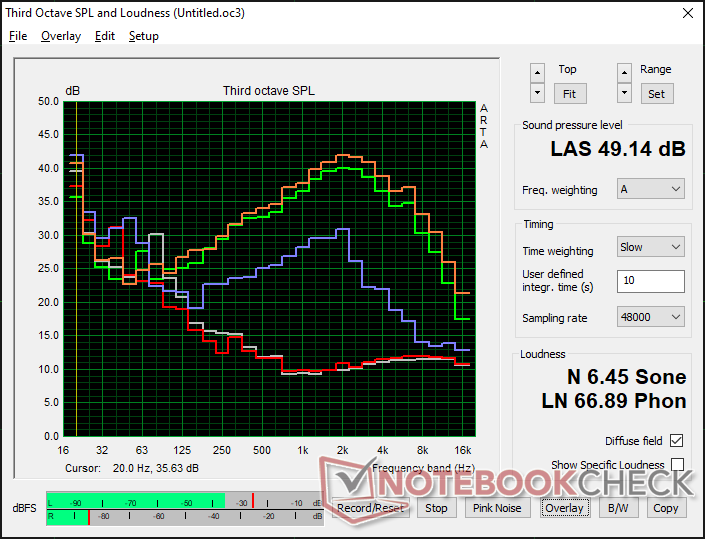
Razer Blade 17 RTX 3080 Ti análisis de audio
(±) | la sonoridad del altavoz es media pero buena (81.5 dB)
Graves 100 - 315 Hz
(±) | lubina reducida - en promedio 6.7% inferior a la mediana
(±) | la linealidad de los graves es media (8.3% delta a frecuencia anterior)
Medios 400 - 2000 Hz
(+) | medios equilibrados - a sólo 2.1% de la mediana
(+) | los medios son lineales (4.3% delta a la frecuencia anterior)
Altos 2 - 16 kHz
(+) | máximos equilibrados - a sólo 0.7% de la mediana
(+) | los máximos son lineales (1.7% delta a la frecuencia anterior)
Total 100 - 16.000 Hz
(+) | el sonido global es lineal (6.8% de diferencia con la mediana)
En comparación con la misma clase
» 0% de todos los dispositivos probados de esta clase eran mejores, 0% similares, 99% peores
» El mejor tuvo un delta de 6%, la media fue 18%, el peor fue ###max##%
En comparación con todos los dispositivos probados
» 1% de todos los dispositivos probados eran mejores, 0% similares, 99% peores
» El mejor tuvo un delta de 4%, la media fue 23%, el peor fue ###max##%
Apple MacBook Pro 16 2021 M1 Pro análisis de audio
(+) | los altavoces pueden reproducir a un volumen relativamente alto (#84.7 dB)
Graves 100 - 315 Hz
(+) | buen bajo - sólo 3.8% lejos de la mediana
(+) | el bajo es lineal (5.2% delta a la frecuencia anterior)
Medios 400 - 2000 Hz
(+) | medios equilibrados - a sólo 1.3% de la mediana
(+) | los medios son lineales (2.1% delta a la frecuencia anterior)
Altos 2 - 16 kHz
(+) | máximos equilibrados - a sólo 1.9% de la mediana
(+) | los máximos son lineales (2.7% delta a la frecuencia anterior)
Total 100 - 16.000 Hz
(+) | el sonido global es lineal (4.6% de diferencia con la mediana)
En comparación con la misma clase
» 0% de todos los dispositivos probados de esta clase eran mejores, 0% similares, 100% peores
» El mejor tuvo un delta de 5%, la media fue 17%, el peor fue ###max##%
En comparación con todos los dispositivos probados
» 0% de todos los dispositivos probados eran mejores, 0% similares, 100% peores
» El mejor tuvo un delta de 4%, la media fue 23%, el peor fue ###max##%
Gestión de la energía
Consumo de energía: el más alto hasta ahora de la serie Blade
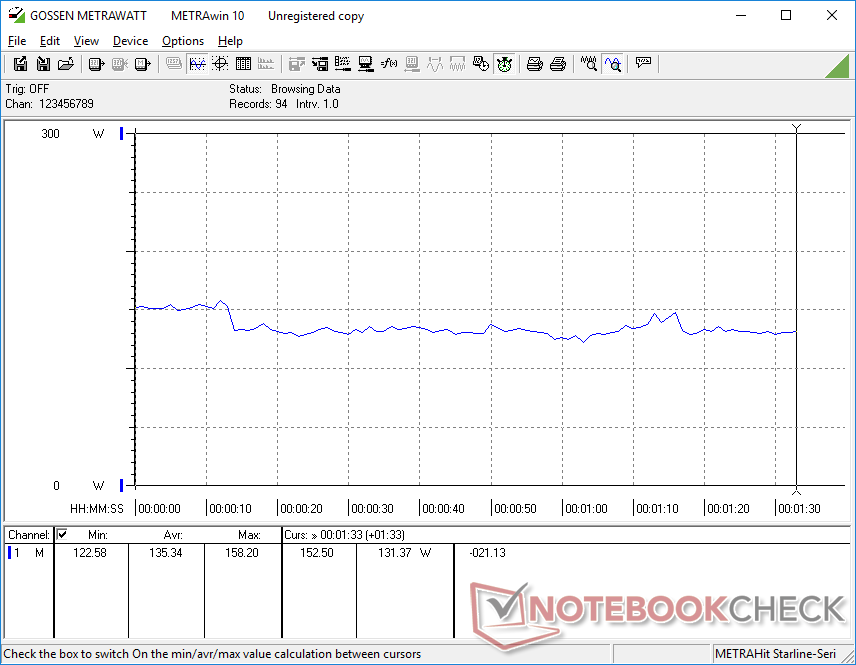
El nuevo modelo consume mucho más energía que antes. Simplemente en reposo en el escritorio consumiría entre 30 W y 61 W dependiendo de la configuración del brillo y el perfil de energía, comparado con casi la mitad en el 2021 Blade 17, el MSI GS76 o el Asus ROG Zephyrus S17. De hecho, el funcionamiento Witcher 3 consumiría un 30 por ciento más de energía para un aumento del 20 al 25 por ciento en el rendimiento gráfico y del 25 por ciento en el rendimiento de la CPU respecto a la RTX 3070 y el Core i7-11800H del 2021 Blade 17.
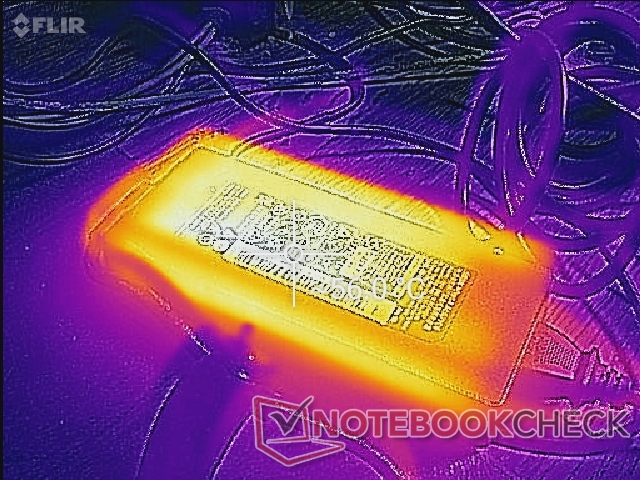
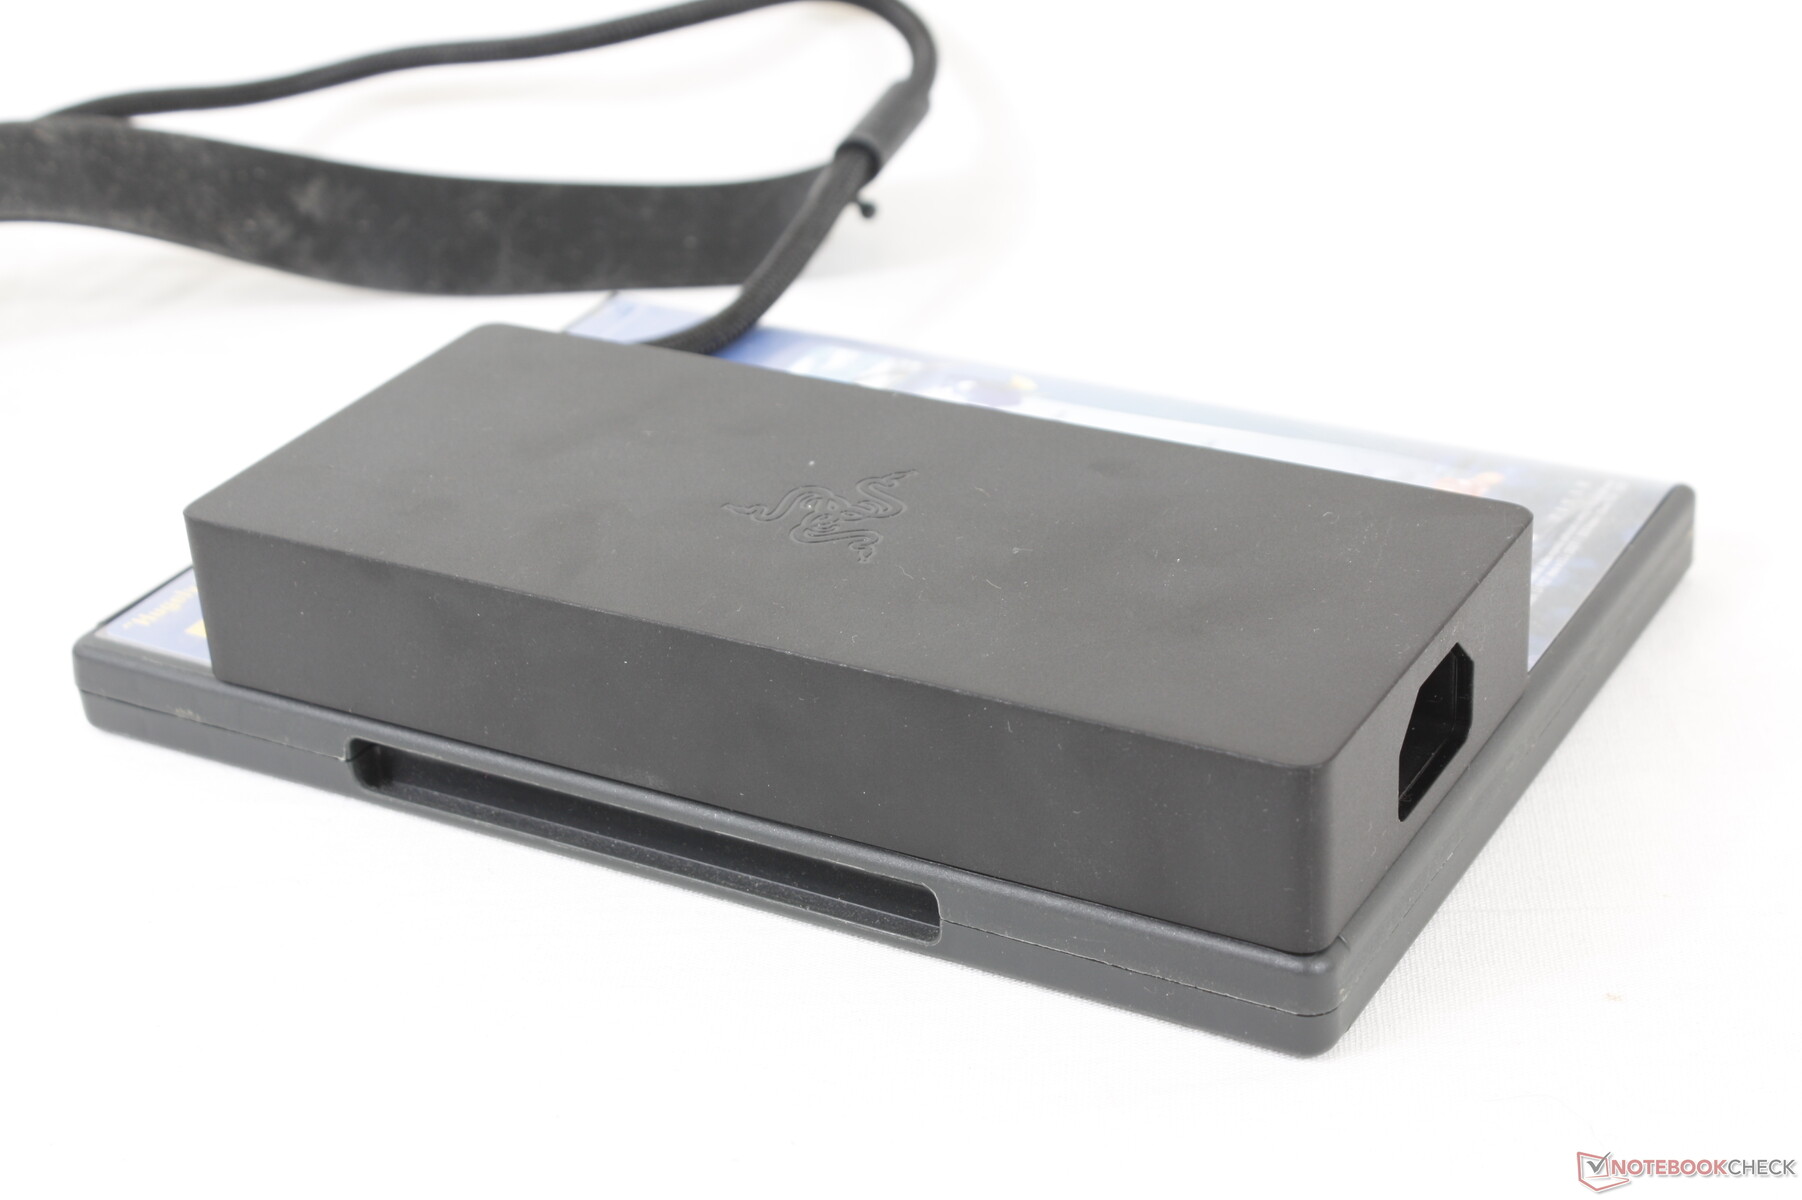
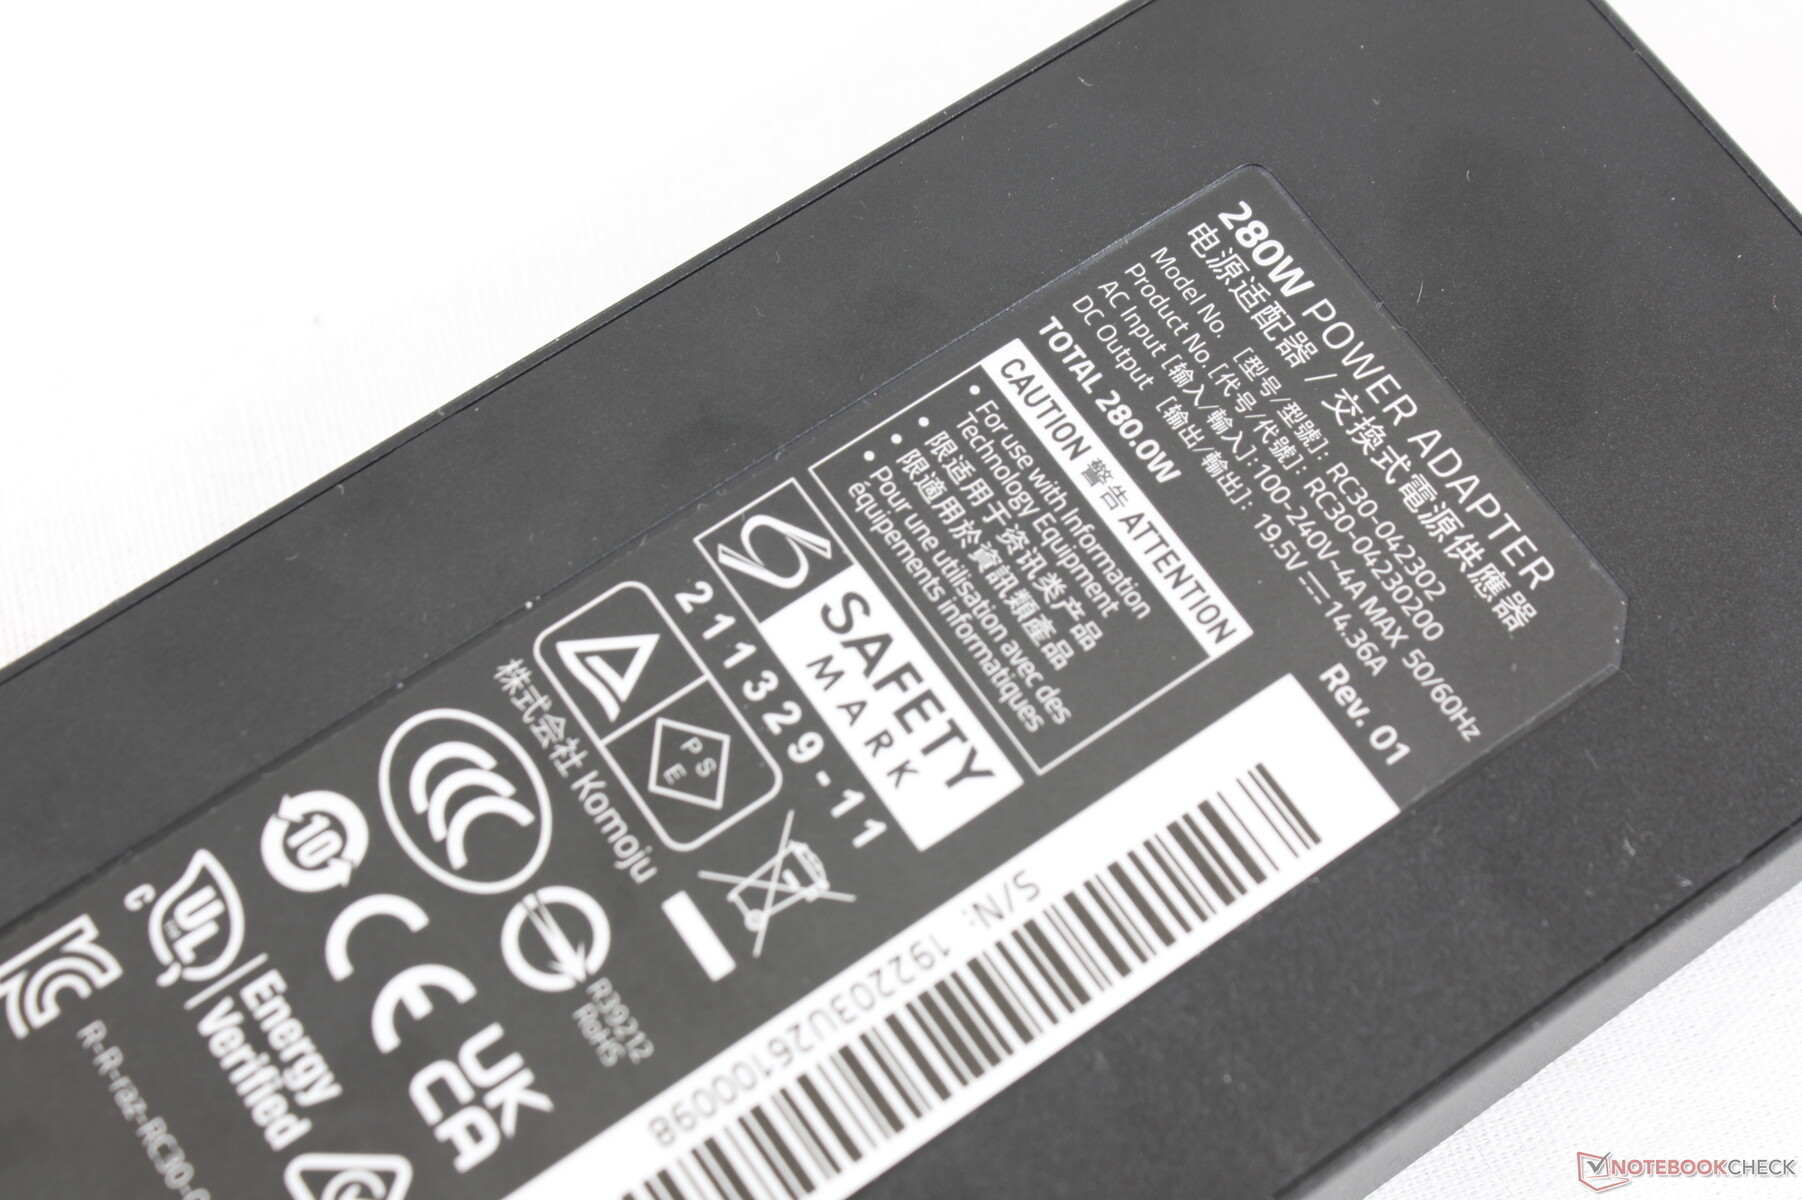
Para dar cabida a los procesadores más exigentes de este año, el Blade 17 2022 se envía con un adaptador de CA de 280 W de mayor capacidad en comparación con el adaptador de CA de 230 W que venía con el modelo 2021. Afortunadamente, el tamaño total del adaptador de CA se ha mantenido prácticamente igual año tras año (~16,4 x 7 x 2,5 cm frente a ~17 x 7 x 2,5 cm) a pesar de la mayor potencia.
| Off / Standby | |
| Ocioso | |
| Carga |
|
Clave:
min: | |
| Razer Blade 17 RTX 3080 Ti i7-12800H, GeForce RTX 3080 Ti Laptop GPU, Samsung PM9A1 MZVL21T0HCLR, IPS, 2560x1440, 17.3" | Razer Blade Pro 17 2021 (QHD Touch) i7-10875H, GeForce RTX 3080 Laptop GPU, Samsung PM981a MZVLB1T0HBLR, IPS, 3840x2160, 17.3" | MSI GS76 Stealth 11UH i9-11900H, GeForce RTX 3080 Laptop GPU, Samsung PM9A1 MZVL22T0HBLB, IPS, 3840x2160, 17.3" | Asus ROG Zephyrus S17 GX703HSD i9-11900H, GeForce RTX 3080 Laptop GPU, Samsung PM9A1 MZVL22T0HBLB, IPS, 2560x1440, 17.3" | Aorus 17G YD i7-11800H, GeForce RTX 3080 Laptop GPU, Samsung PM9A1 MZVL2512HCJQ, IPS, 1920x1080, 17.3" | Alienware x17 RTX 3080 P48E i7-11800H, GeForce RTX 3080 Laptop GPU, 2x WDC PC SN730 SDBPNTY-1T00 (RAID 0), IPS, 3840x2160, 17.3" | |
|---|---|---|---|---|---|---|
| Power Consumption | 34% | 38% | 27% | 27% | 24% | |
| Idle Minimum * (Watt) | 29.8 | 15.2 49% | 14 53% | 21.7 27% | 24 19% | 10.2 66% |
| Idle Average * (Watt) | 37.1 | 20.3 45% | 19 49% | 27 27% | 26 30% | 21.2 43% |
| Idle Maximum * (Watt) | 60.8 | 37.3 39% | 31 49% | 33 46% | 38 37% | 48.4 20% |
| Load Average * (Watt) | 135.3 | 114.9 15% | 97 28% | 108 20% | 101 25% | 118.7 12% |
| Witcher 3 ultra * (Watt) | 243 | 158.4 35% | 156 36% | 195 20% | 164 33% | 249 -2% |
| Load Maximum * (Watt) | 273.1 | 223.7 18% | 231 15% | 210 23% | 230 16% | 262 4% |
* ... más pequeño es mejor
Power Consumption Witcher 3 / Stresstest
Power Consumption external Monitor
Duración de la batería - plana año tras año
La capacidad de la batería es mayor que la del Blade 17 de 2021 debido a la eliminación del cuarto ventilador. Los tiempos de ejecución no son mejores, empero, ya que la nueva CPU y GPU son más exigentes esta vez. Notamos resultados similares entre el 2021 y el 2022 Blade 15 también.
La carga de vacío a lleno con el adaptador incluido tarda unos 90 minutos. La carga por USB-C es compatible a diferencia de la del Asus TUF Gaming F15.
| Razer Blade 17 RTX 3080 Ti i7-12800H, GeForce RTX 3080 Ti Laptop GPU, 82 Wh | Razer Blade Pro 17 2021 (QHD Touch) i7-10875H, GeForce RTX 3080 Laptop GPU, 70.5 Wh | MSI GS76 Stealth 11UH i9-11900H, GeForce RTX 3080 Laptop GPU, 99.9 Wh | Asus ROG Zephyrus S17 GX703HSD i9-11900H, GeForce RTX 3080 Laptop GPU, 90 Wh | Aorus 17G YD i7-11800H, GeForce RTX 3080 Laptop GPU, 99 Wh | Alienware x17 RTX 3080 P48E i7-11800H, GeForce RTX 3080 Laptop GPU, 87 Wh | |
|---|---|---|---|---|---|---|
| Duración de Batería | 19% | 19% | 91% | 22% | -11% | |
| Reader / Idle (h) | 8 | 9.9 24% | 9.9 24% | 9 13% | 7 -12% | |
| WiFi v1.3 (h) | 5.5 | 5.9 7% | 6.4 16% | 7.5 36% | 6 9% | 5.9 7% |
| Load (h) | 1.1 | 1.4 27% | 1.3 18% | 2.7 145% | 1.6 45% | 0.8 -27% |
| H.264 (h) | 7.2 | 6.2 | ||||
| Witcher 3 ultra (h) | 1 |
Pro
Contra
Veredicto: más vatios, más potencia
El diseño del Blade 17 se presentó en 2019 con una gráfica de 100 W GeForce. Esta actualización de 2022 lleva una GPU aún más potente de 165 W sin cambios significativos en el tamaño o el diseño del chasis. El rendimiento ha mejorado, por supuesto, pero el mayor consumo de energía general implica temperaturas más altas, un ladrillo de energía más denso y, en general, una menor duración de la batería que los modelos anteriores de Blade 17 con procesadores más antiguos.
Afortunadamente, Razer ha ajustado algunos aspectos del modelo 2022 para compensar sus mayores necesidades de energía. La batería interna, por ejemplo, es más grande, aunque a costa de un ventilador completo que, de otro modo, habría ayudado a la refrigeración. Mientras tanto, el a menudo olvidado adaptador de CA de 280 W es uno de los más pequeños y ligeros que hemos visto en comparación con otros adaptadores de gran capacidad para facilitar un poco los viajes con el Blade 17. El fabricante era muy consciente de los componentes cada vez más necesitados de energía durante el desarrollo y ha tomado medidas para aliviar algunos de los inevitables inconvenientes.
Al centrarse tanto en el rendimiento, la GPU de 165 W del Razer es capaz de superar a la mayoría de los portátiles equipados con la misma GPU. Otros portátiles ultradelgados tienden a tener objetivos de TGP más bajos que el Blade 17 para un rendimiento siempre más lento. El Blade 17 de 2022 es, por tanto, una de las mejores recomendaciones para los jugadores que quieran maximizar el rendimiento gráfico móvil sin tener que conformarse con opciones más gruesas como la serie MSI GT o un Asus ROG Chimera. Quizá los futuros modelos de Blade 17 puedan incorporar refrigeración por metal líquido para mejorar las temperaturas.
Precio y disponibilidad
Razer está vendiendo ahora nuestra configuración revisada por aproximadamente $4000 USD. Amazon y Best Buy no tienen existencias en el momento de escribir este artículo.
Razer Blade 17 RTX 3080 Ti
- 07/05/2022 v7 (old)
Allen Ngo
Price comparison

