Análisis del portátil Razer Blade 15 modelo base: 95 W GeForce RTX 3060 aguanta bien
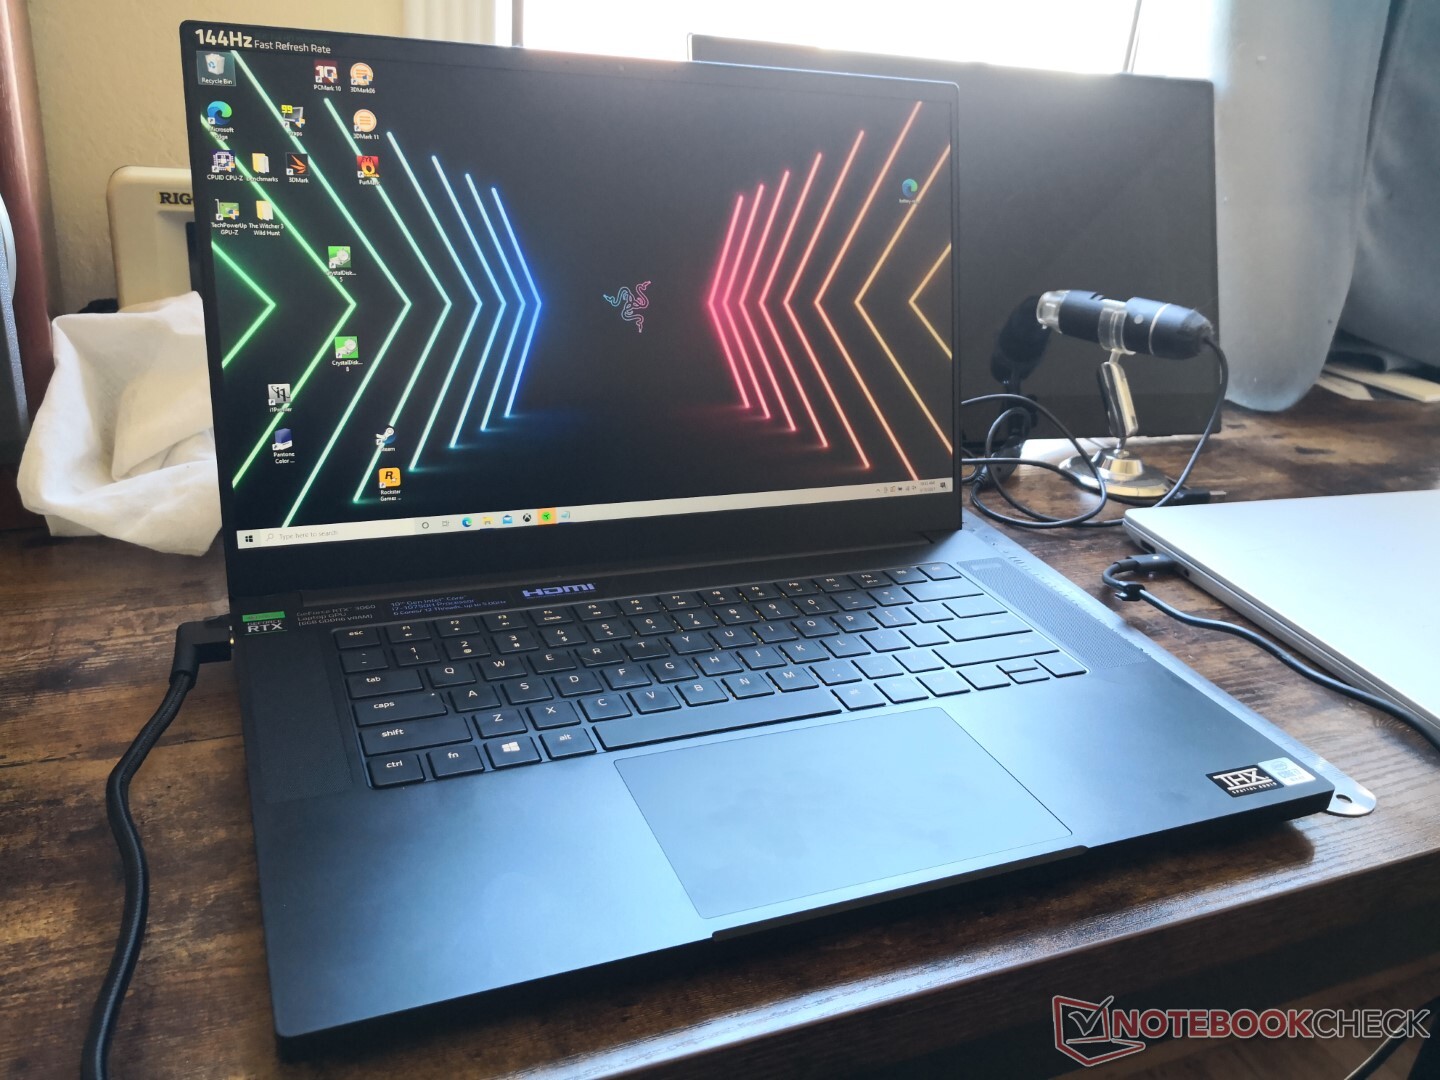
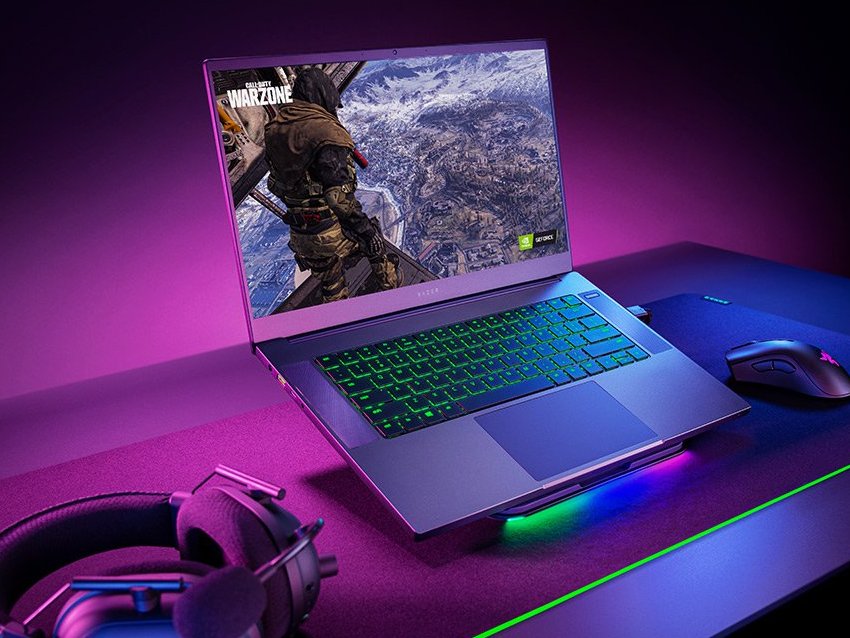
Razer ha renovado su línea Blade 15 este año para incluir GPUs Nvidia Ampere en toda la gama y un diseño de chasis aún más delgado para las últimas SKUs del modelo Advanced. Las opciones van desde la GeForce RTX 3060 hasta la RTX 3080 y un nuevo panel QHD de 165 Hz como intermedio entre las opciones habituales FHD y 4K.
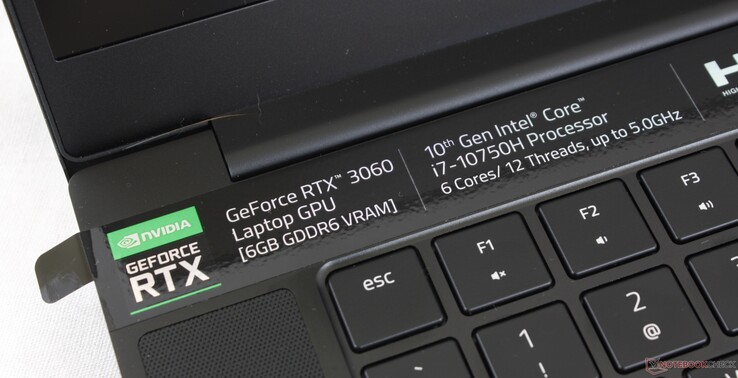
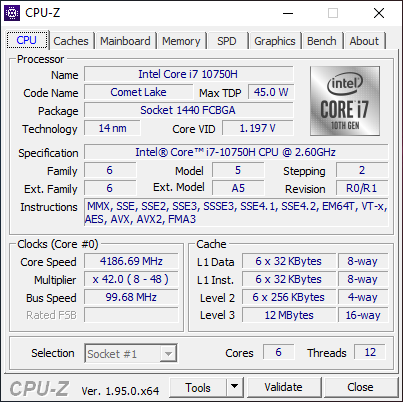
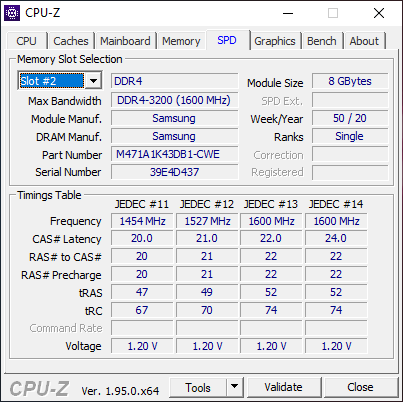
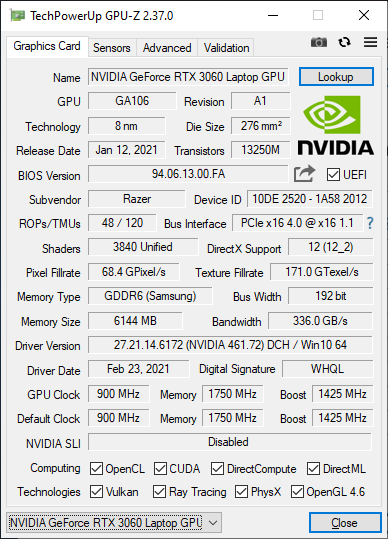
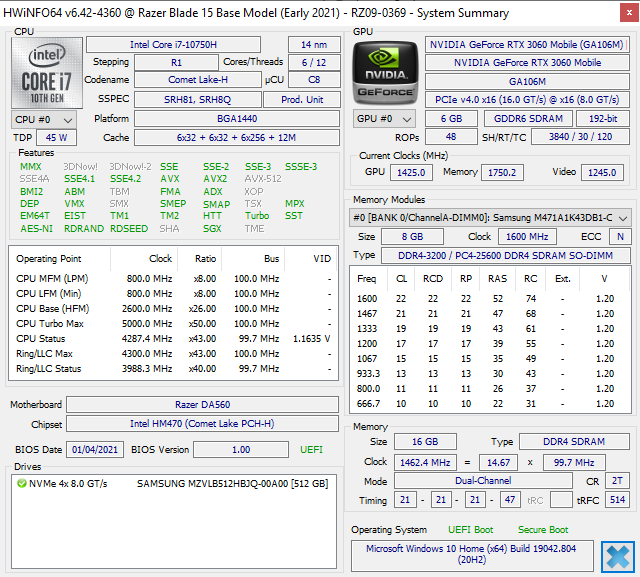
Nuestra unidad de análisis de hoy es el Modelo Base Blade 15 más económico, equipado con la GPU GeForce RTX 3060, pantalla IPS de 144 Hz, CPU Core i7-10750H y 16 GB de RAM por unos 1699 dólares (o 1499 dólares en oferta). Dado que los Ampere móviles no se acercan a sus homólogos de sobremesa en términos de rendimiento, estamos ansiosos por ver cómo el Blade 15 RTX 3060 puede compararse con las configuraciones Blade 15 RTX 2060 y 2070 Max-Q del año pasado.
Entre los competidores del modelo base Blade 15 se encuentran otros portátiles para juegos de gama media alta como el MSI GS66, el Asus Zephyrus S, el Aorus 15 o el Lenovo Legion 7i.
Más análisis de Razer:
potential competitors in comparison
Valoración | Fecha | Modelo | Peso | Altura | Tamaño | Resolución | Precio |
|---|---|---|---|---|---|---|---|
| 85.5 % v7 (old) | 03/2021 | Razer Blade 15 Base Edition 2021, i7-10750H RTX 3060 i7-10750H, GeForce RTX 3060 Laptop GPU | 2.1 kg | 19.9 mm | 15.60" | 1920x1080 | |
| 86.9 % v7 (old) | 08/2020 | Razer Blade 15 RTX 2070 Super Max-Q i7-10875H, GeForce RTX 2070 Super Max-Q | 2.1 kg | 17.8 mm | 15.60" | 1920x1080 | |
| 85 % v7 (old) | 02/2021 | Asus ROG Strix G15 G513QR R9 5900HX, GeForce RTX 3070 Laptop GPU | 2.3 kg | 27.2 mm | 15.60" | 1920x1080 | |
| 84 % v7 (old) | 02/2021 | MSI GS66 Stealth 10UG i7-10870H, GeForce RTX 3070 Laptop GPU | 2.1 kg | 19.8 mm | 15.60" | 1920x1080 | |
| 80.4 % v7 (old) | 03/2021 | MSI GF65 Thin 10UE i7-10750H, GeForce RTX 3060 Laptop GPU | 1.9 kg | 21.7 mm | 15.60" | 1920x1080 | |
| 82.1 % v7 (old) | 10/2020 | Asus ROG Zephyrus M15 GU502LU-BI7N4 i7-10750H, GeForce GTX 1660 Ti Mobile | 2 kg | 18.9 mm | 15.60" | 1920x1080 |
Caso
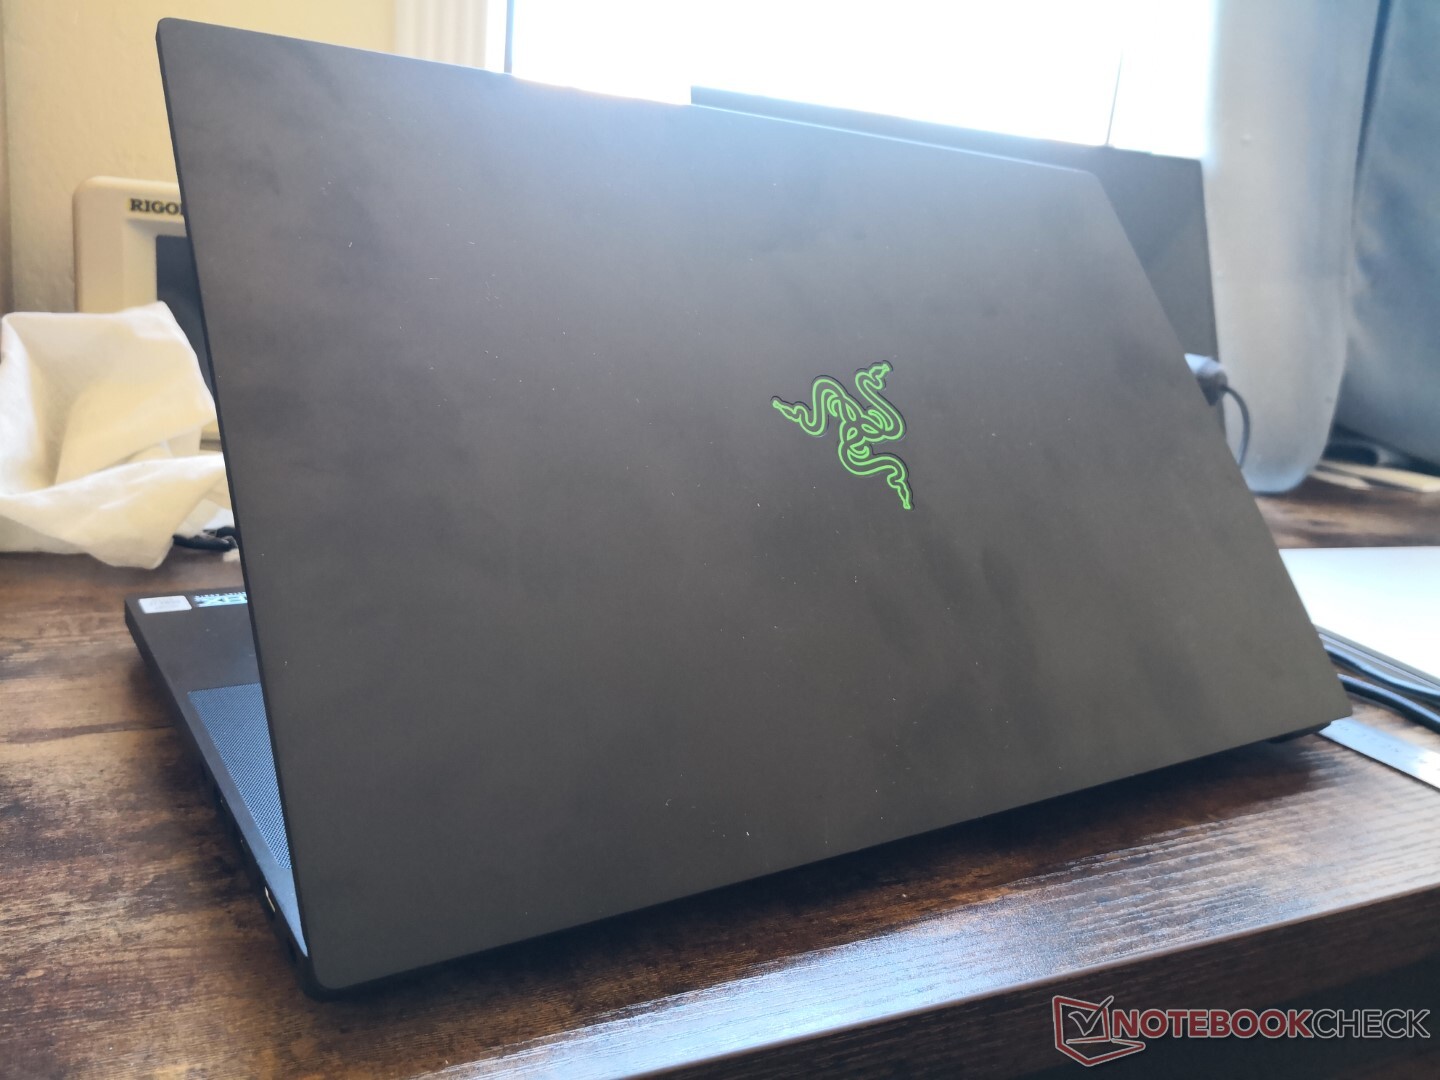
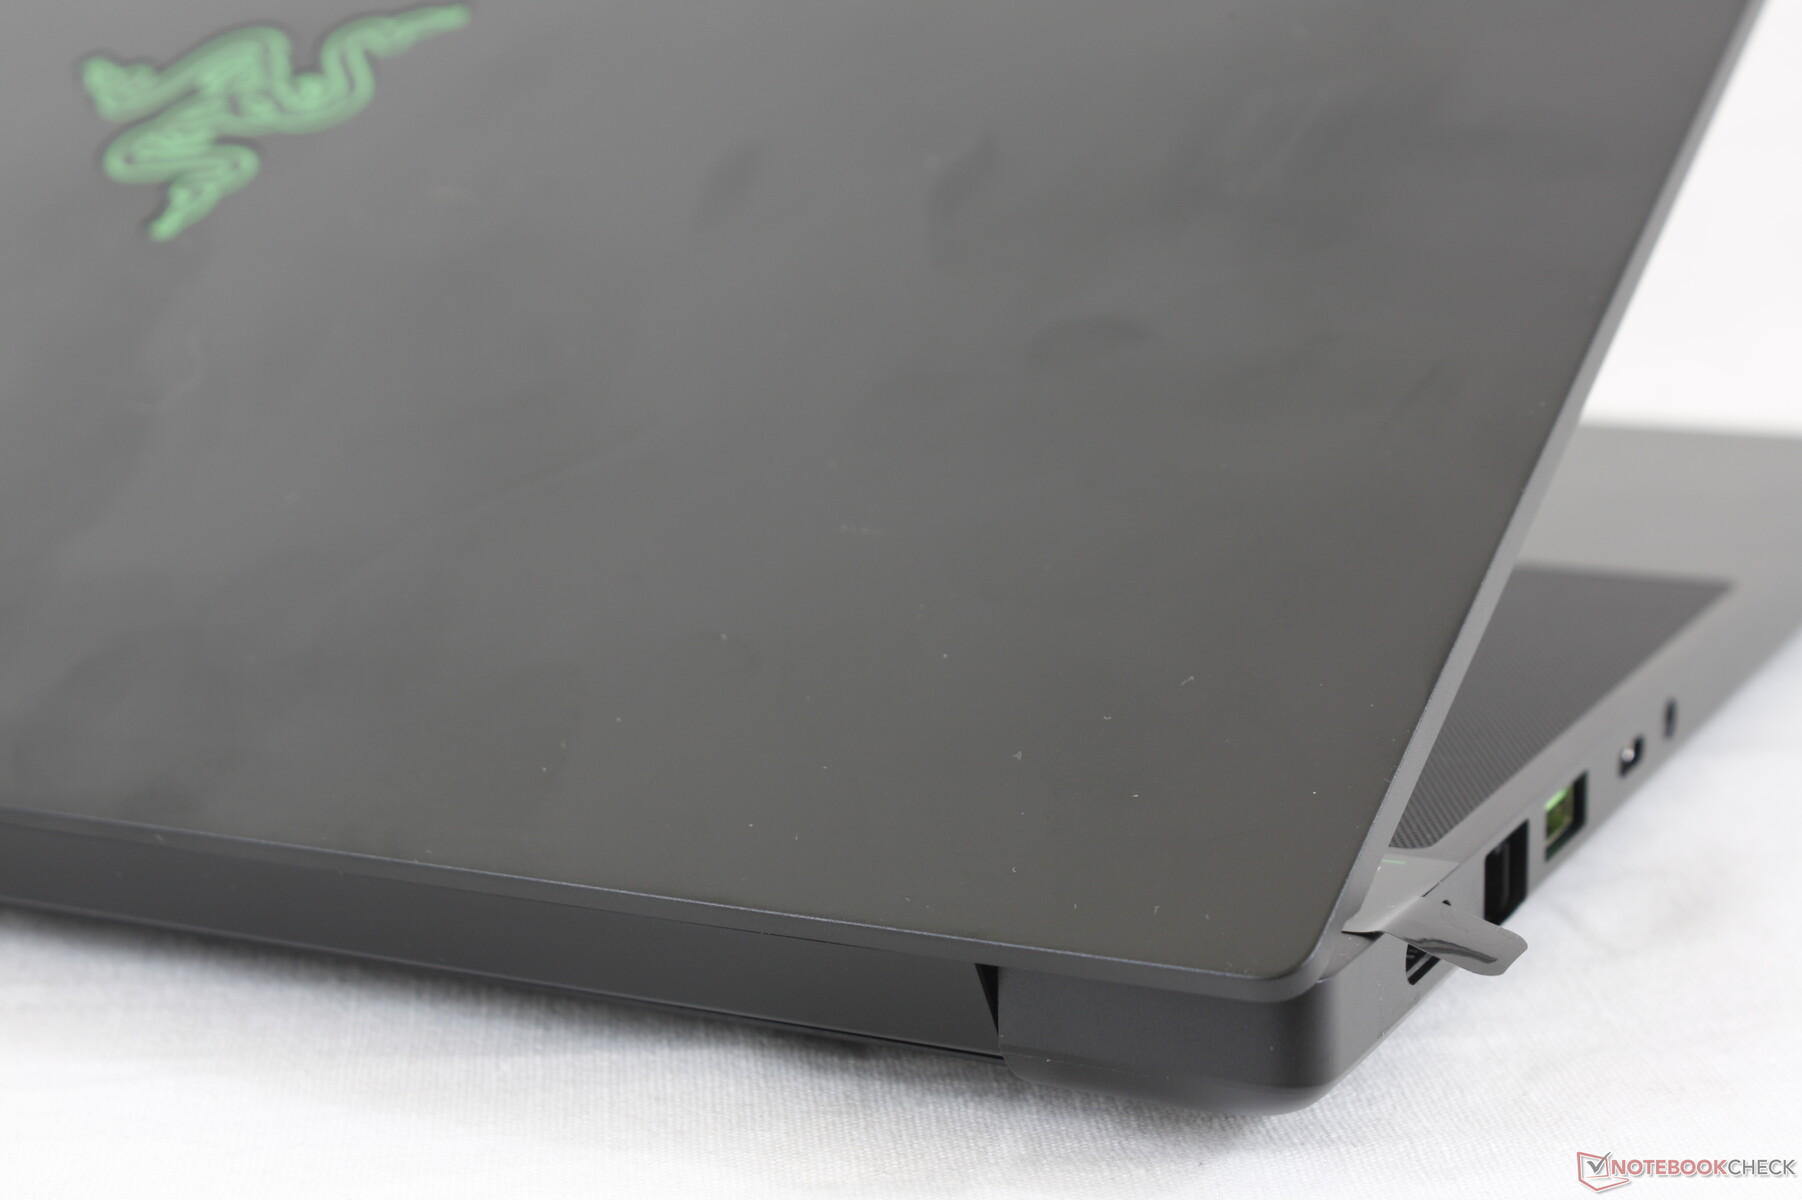
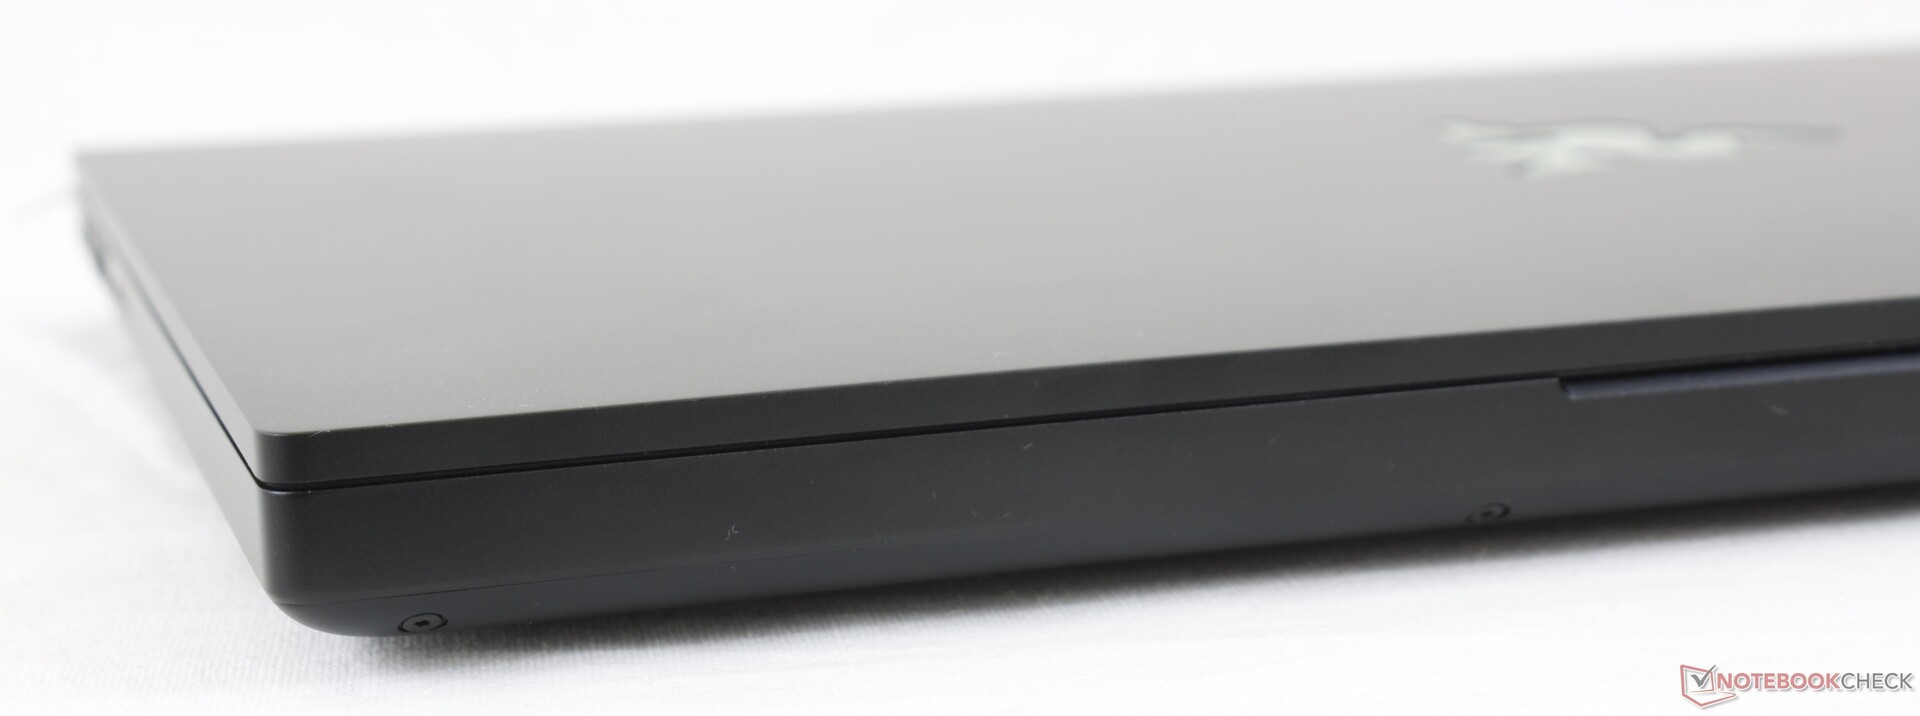
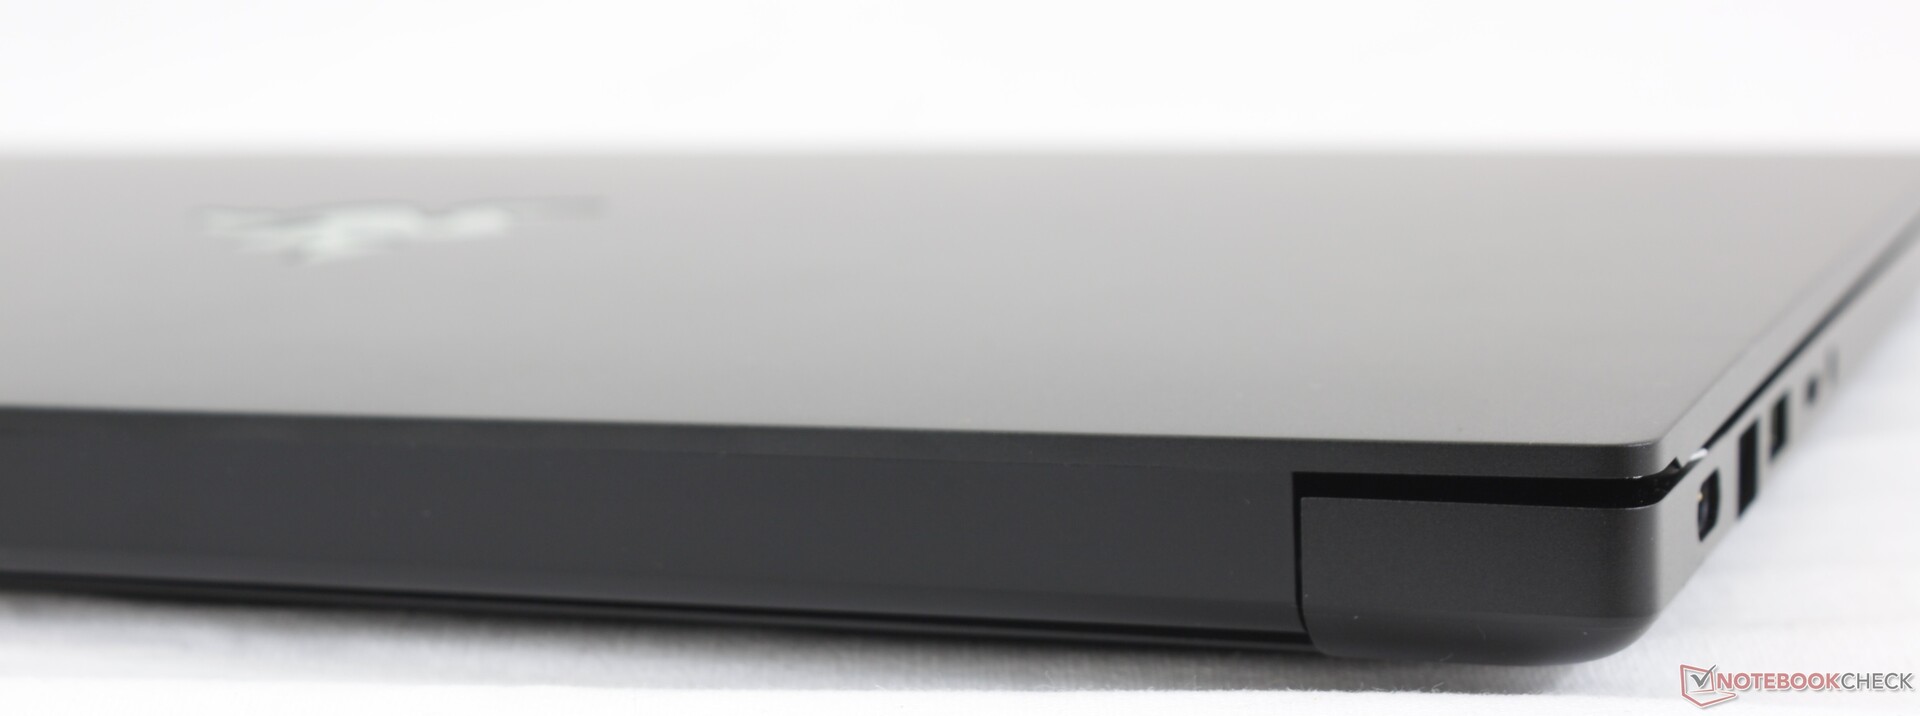
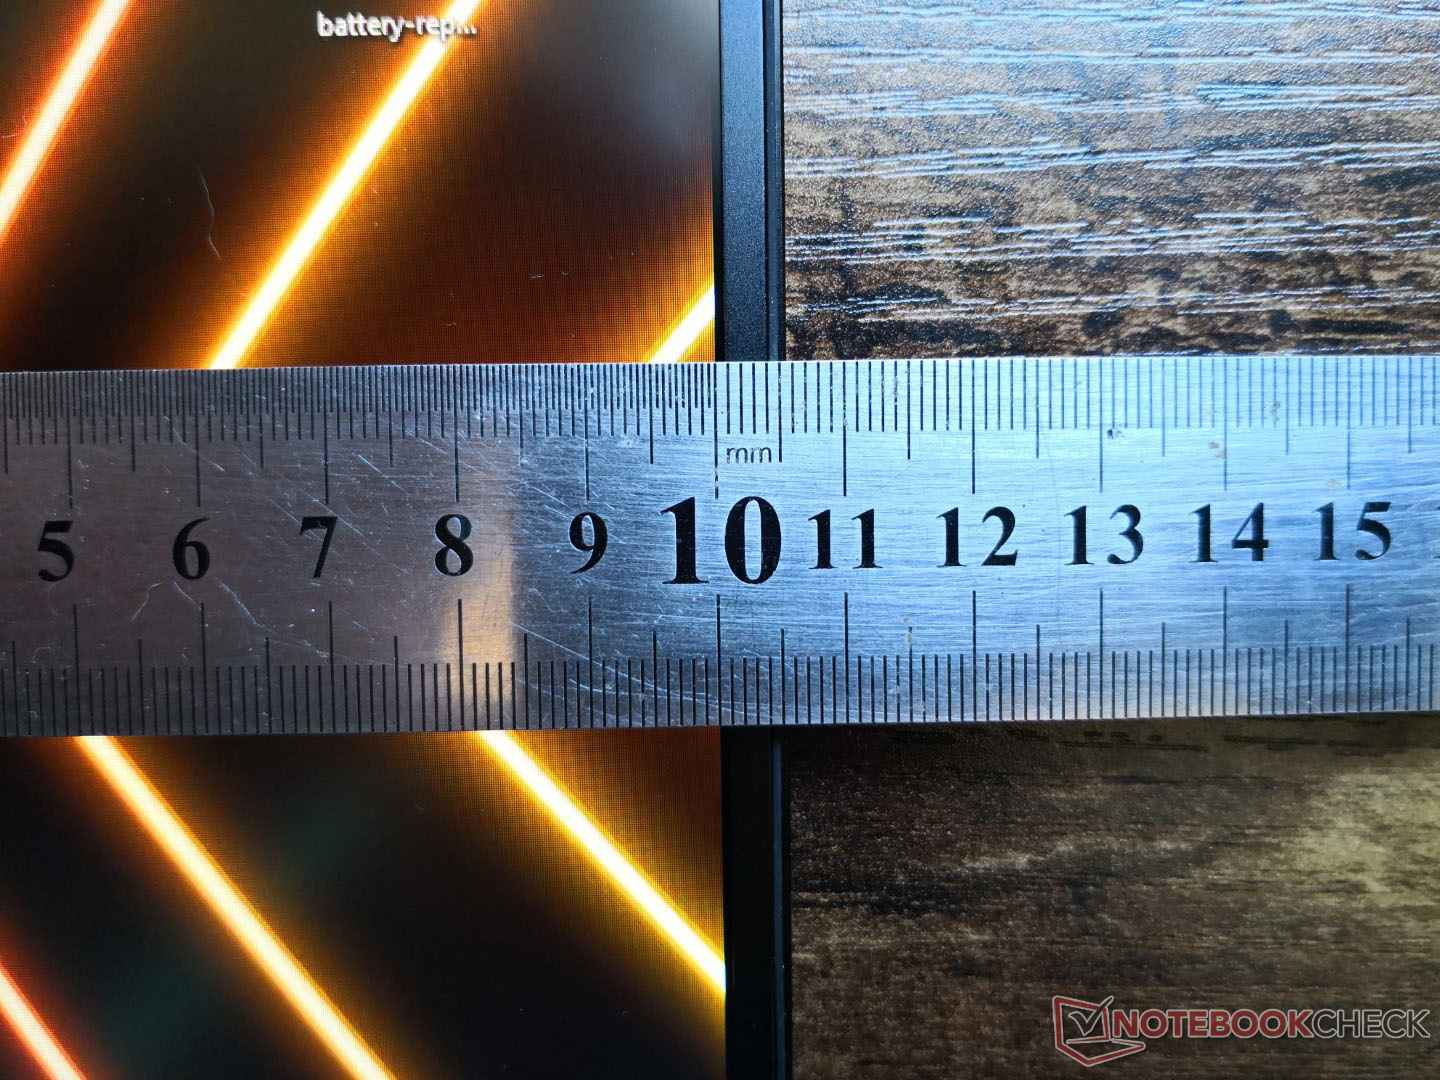
El Blade 15 Base Model de 2021 usa el mismo chasis que los SKUs del Modelo Base de 2019 y 2020, por lo que todos nuestros comentarios existentes sobre las características físicas del portátil siguen siendo válidos. Los usuarios tendrán que desembolsar más dinero para el Blade 15 Advanced Model si quieren el chasis más delgado. Vale la pena señalar que el Modelo Avanzado 2021 es incluso más delgado que el modelo Avanzado 2020 por alrededor de 1 mm (16,99 mm frente a 17,8 mm).
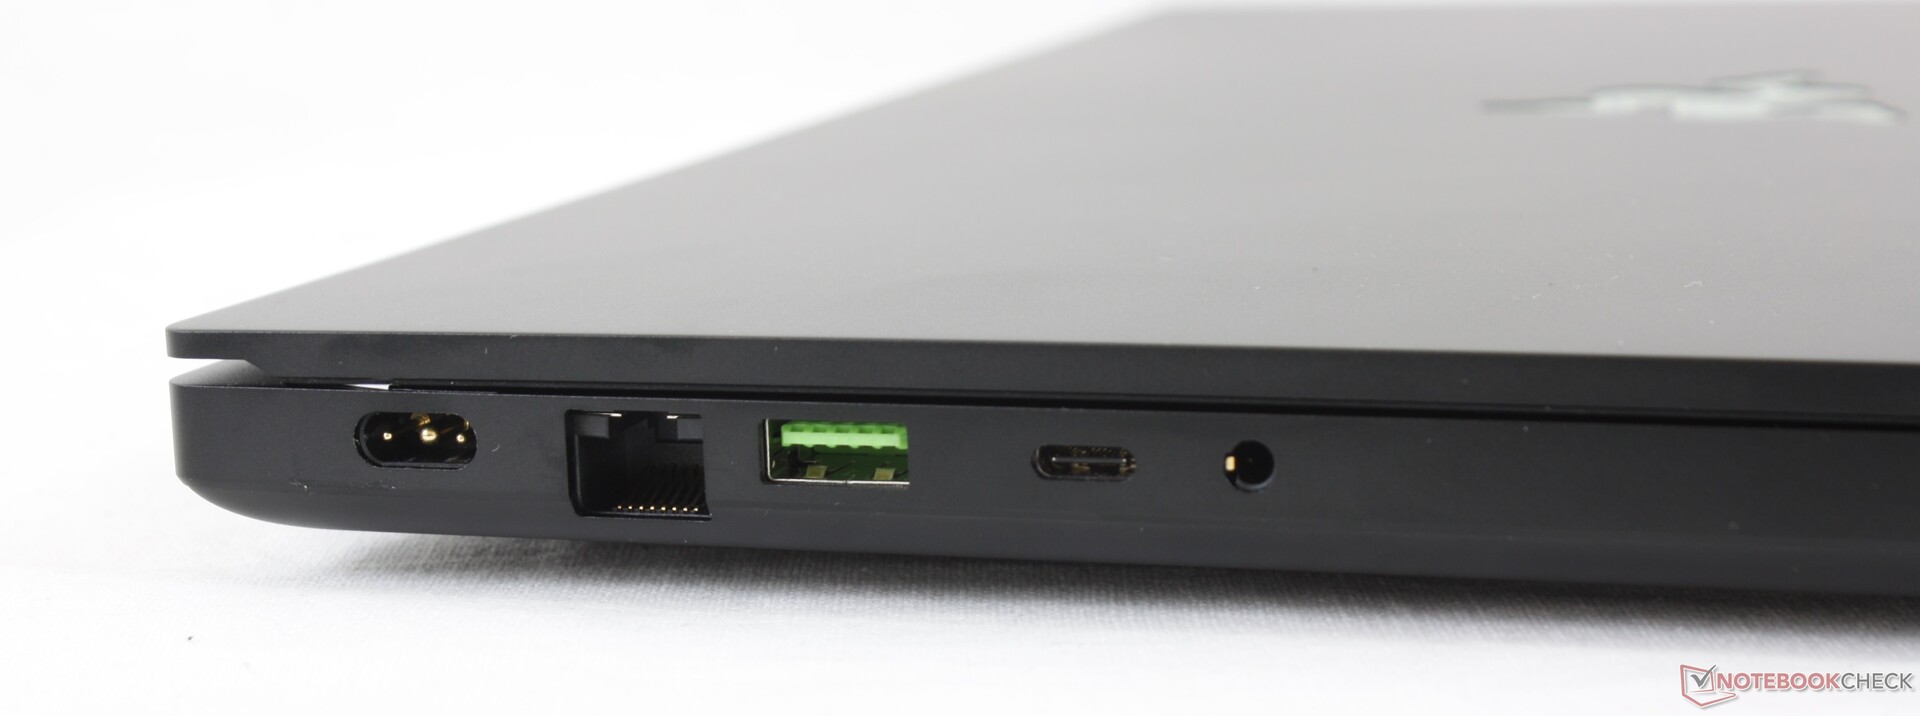
Conectividad
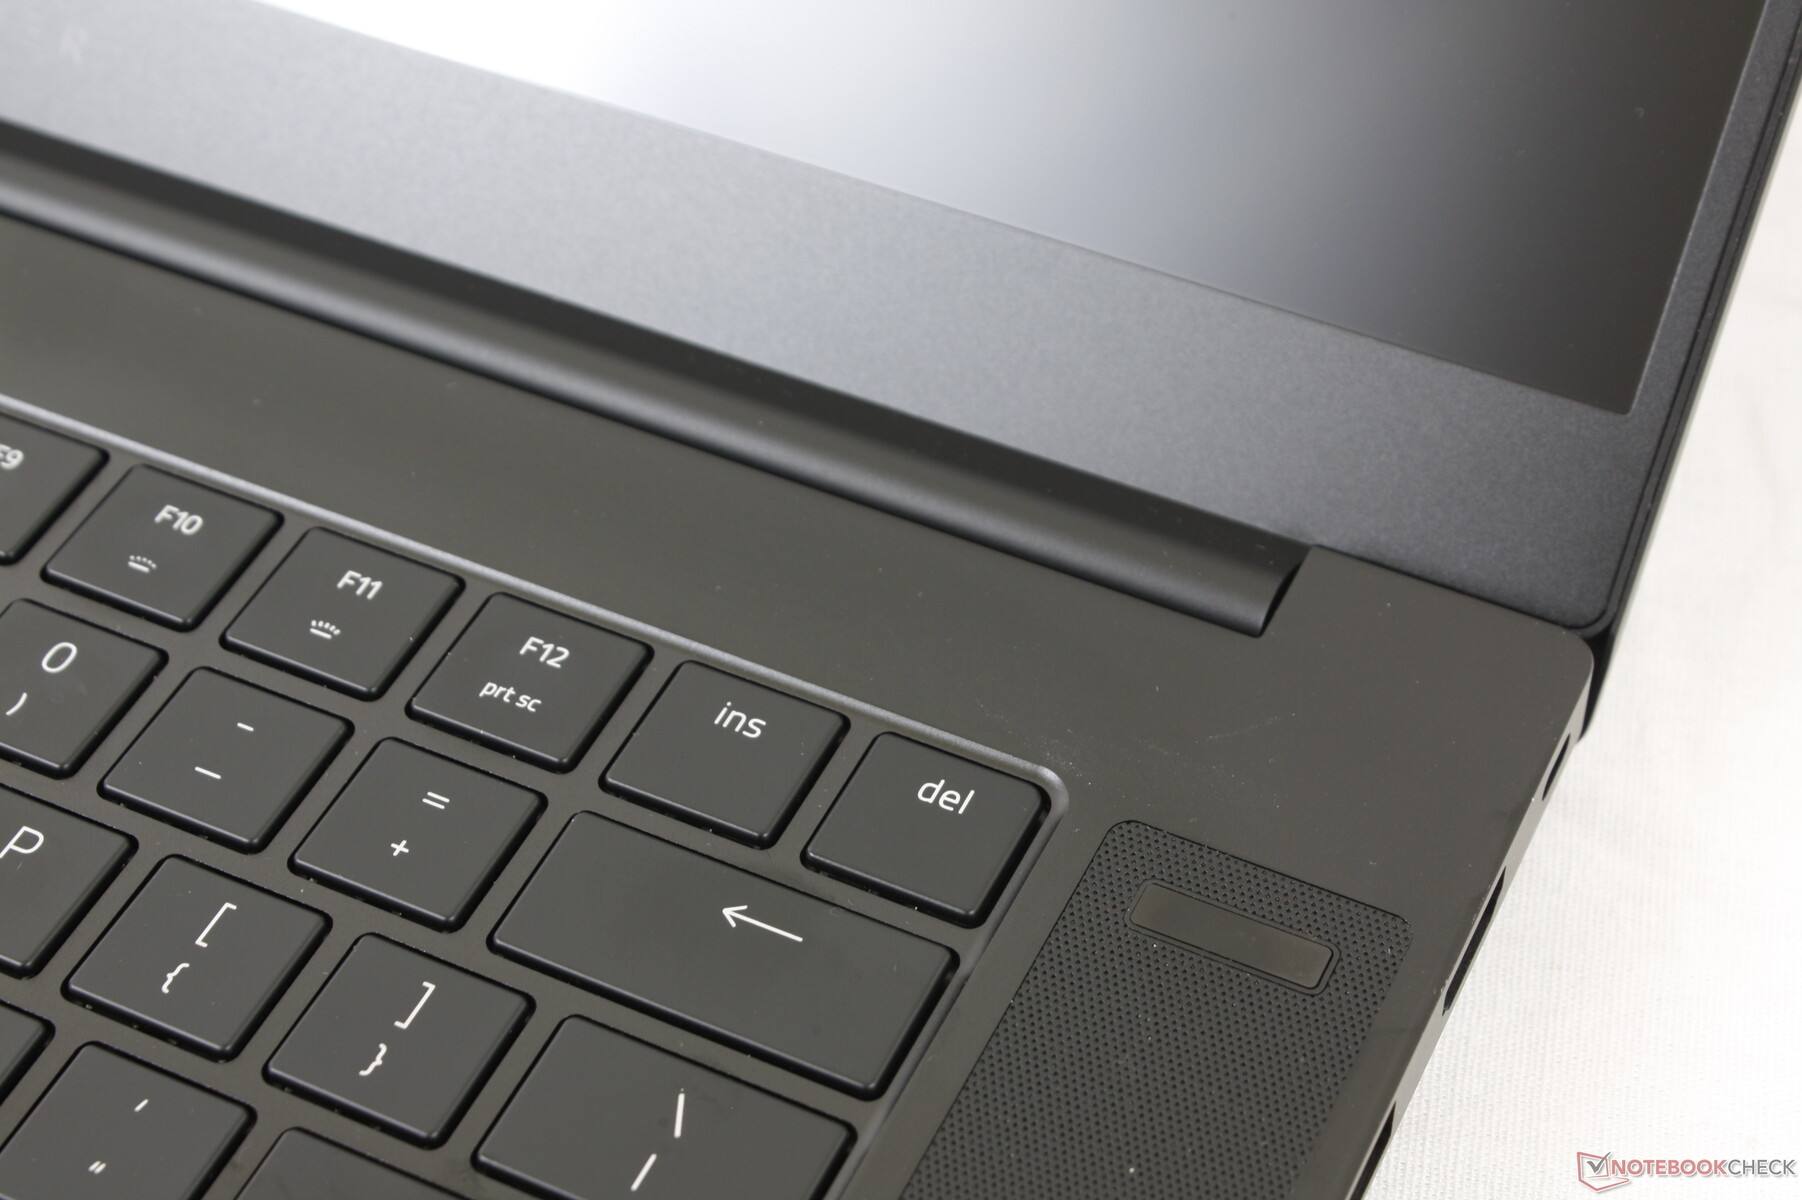
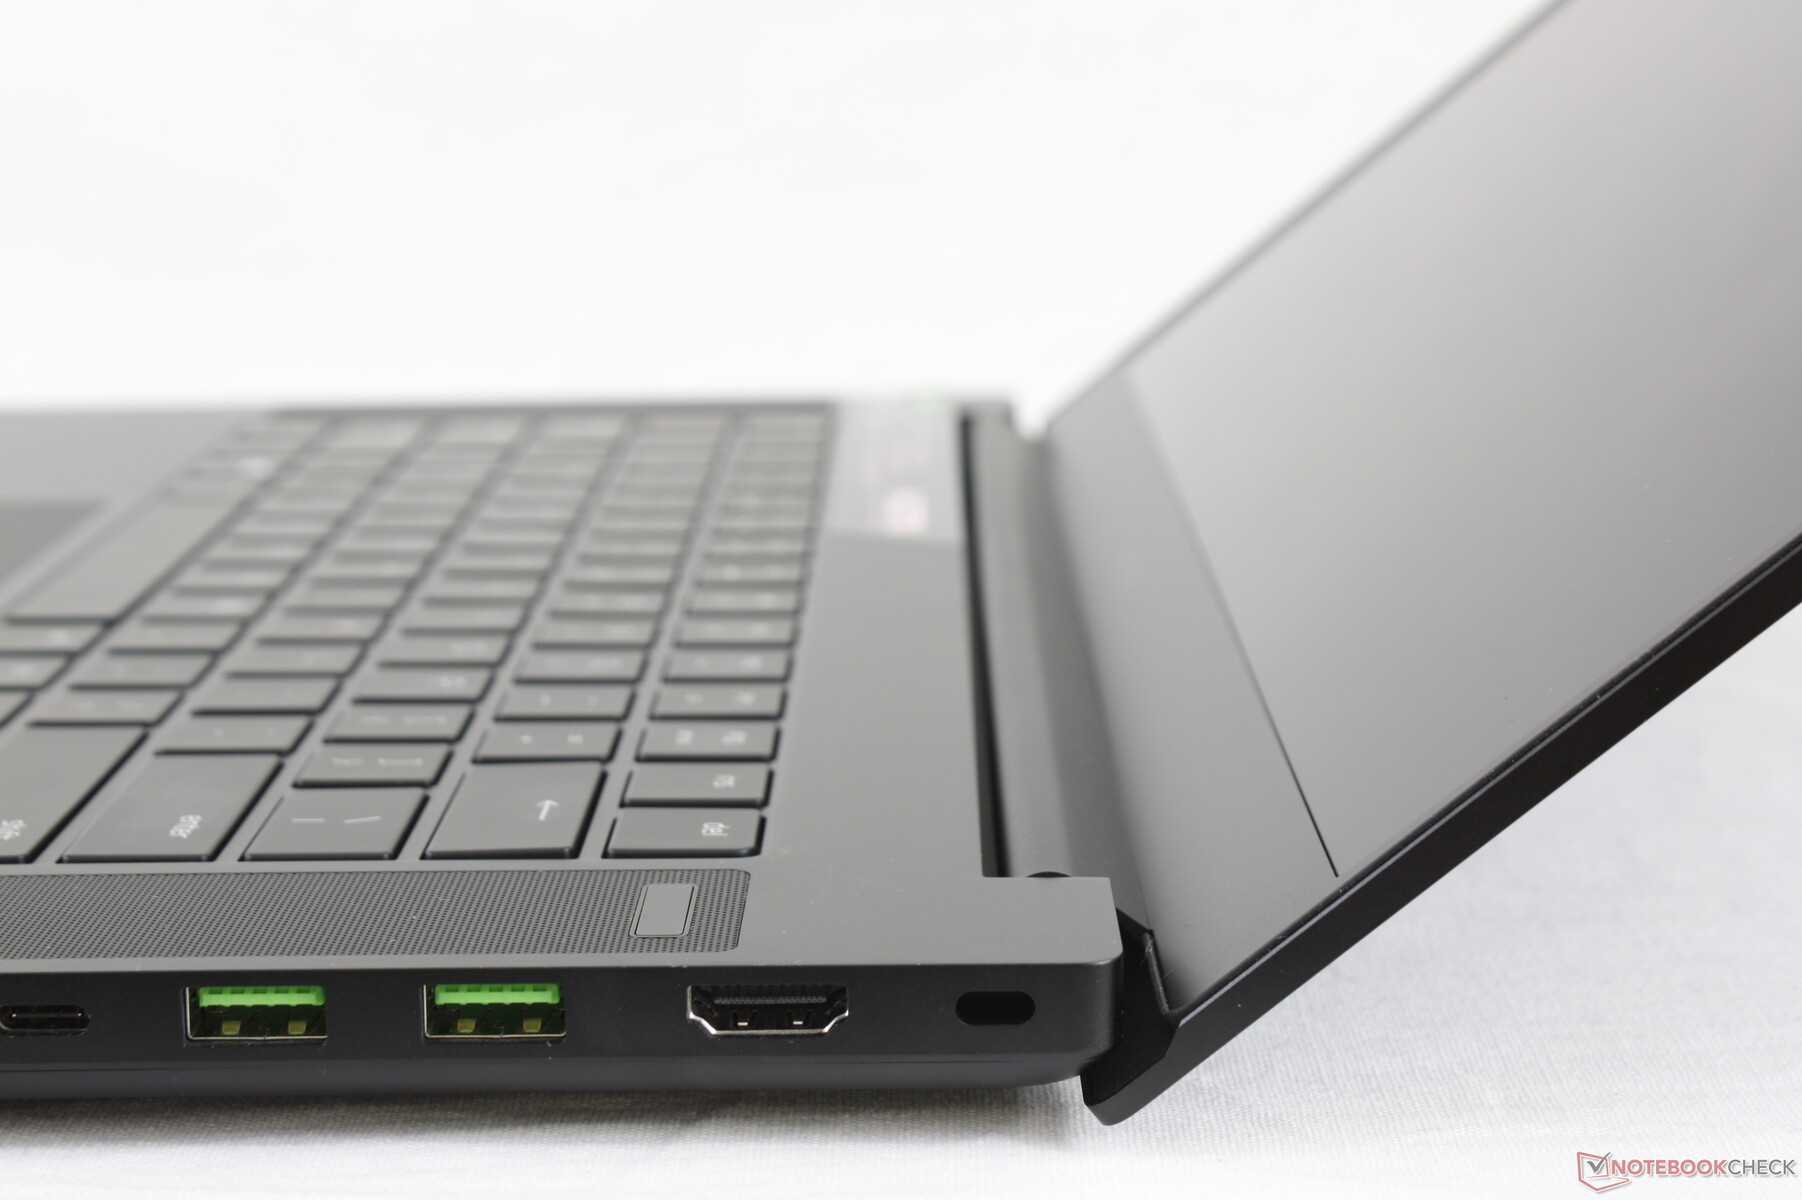
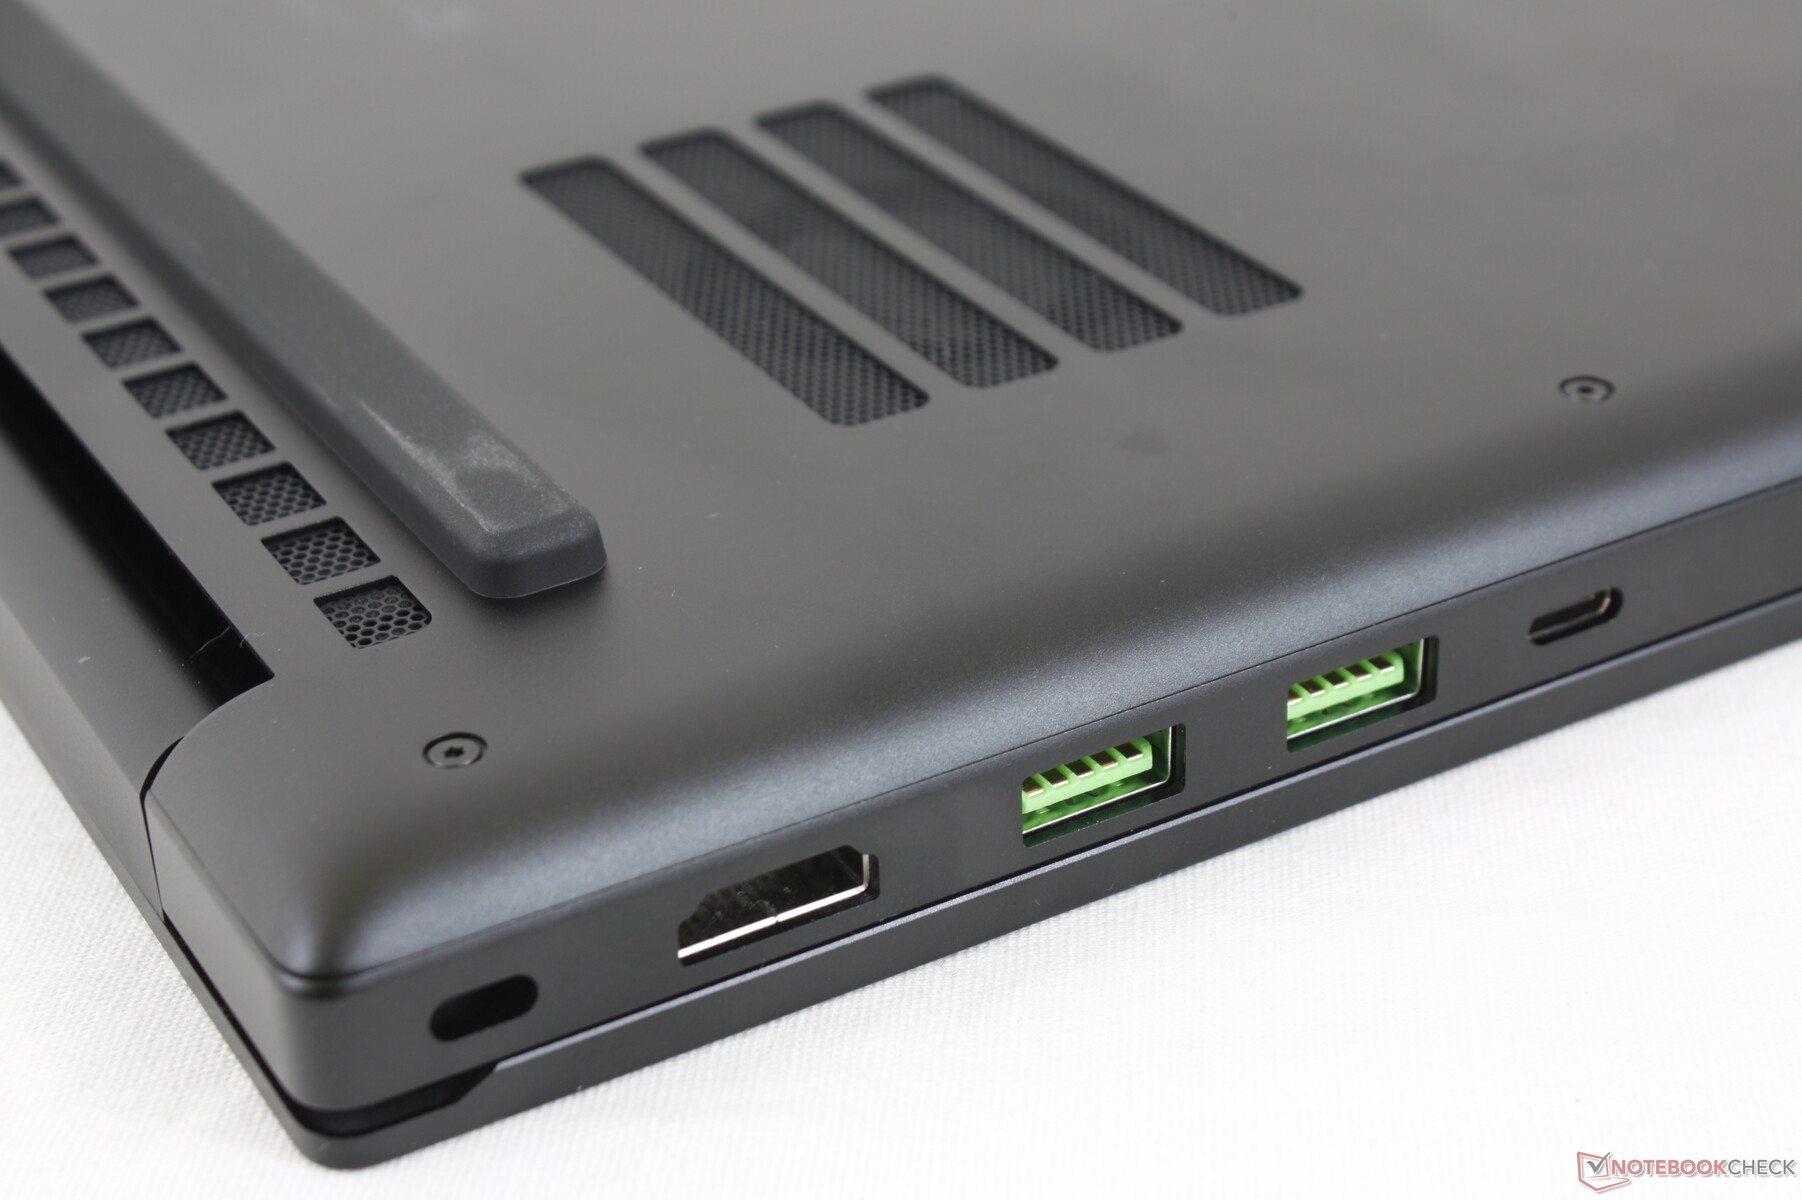
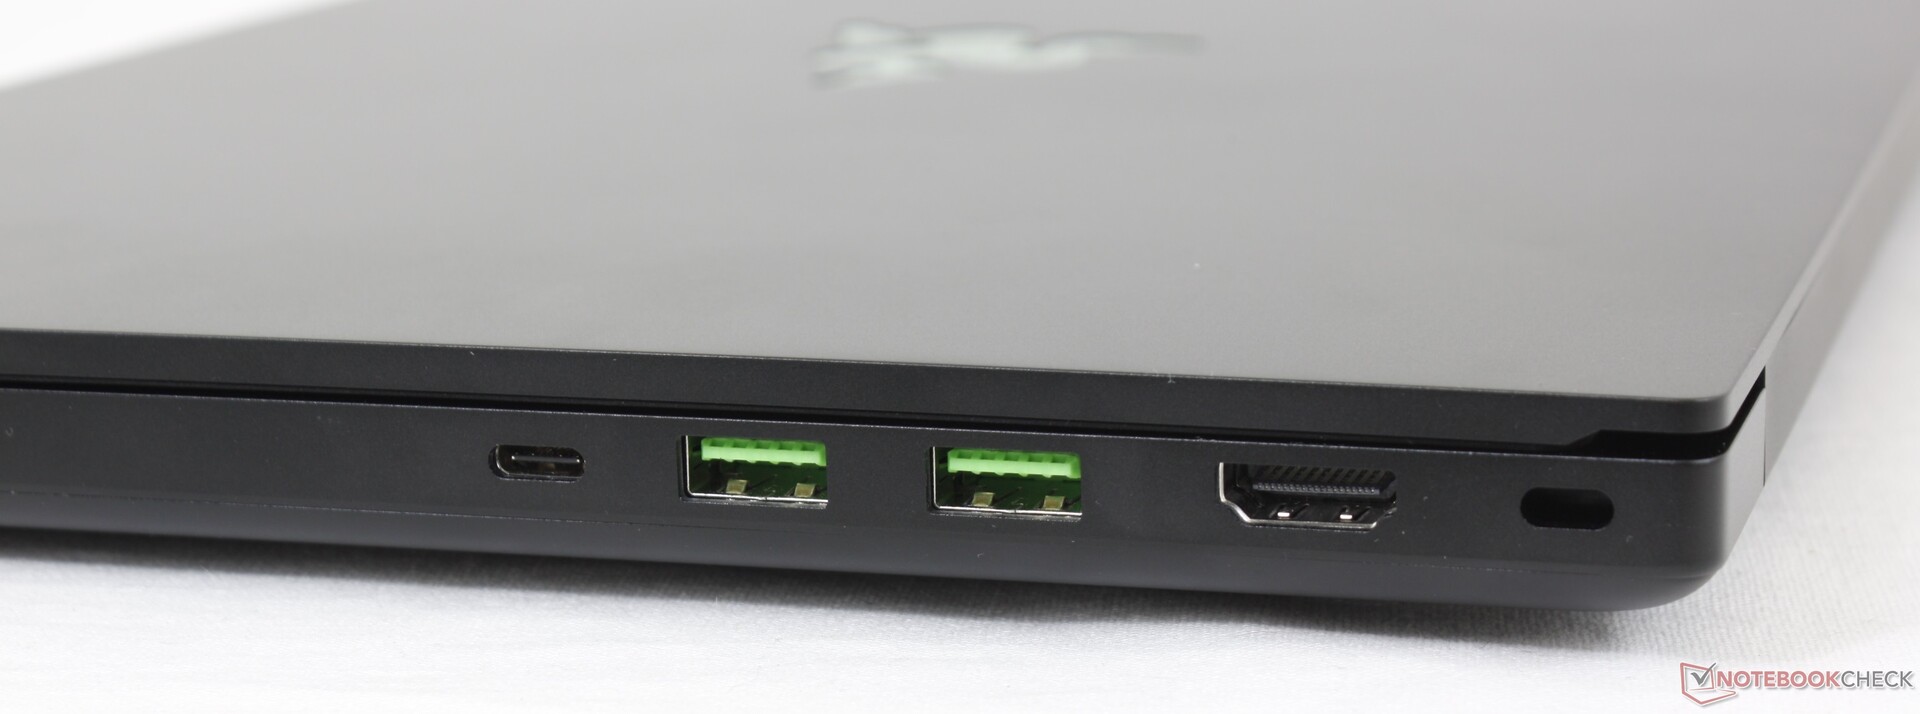
Aparte de las actualizaciones menores de los puertos USB-A y HDMI, que ahora son compatibles con Gen. 2 y 2.1, respectivamente, las opciones de puerto no han cambiado respecto al modelo base del Blade 15 2020. El puerto Gigabit Ethernet sigue siendo la forma más fácil de distinguir entre el Modelo Base y el Modelo Avanzado.
El posicionamiento de los puertos es ligeramente diferente en comparación con el Modelo Base 2019.
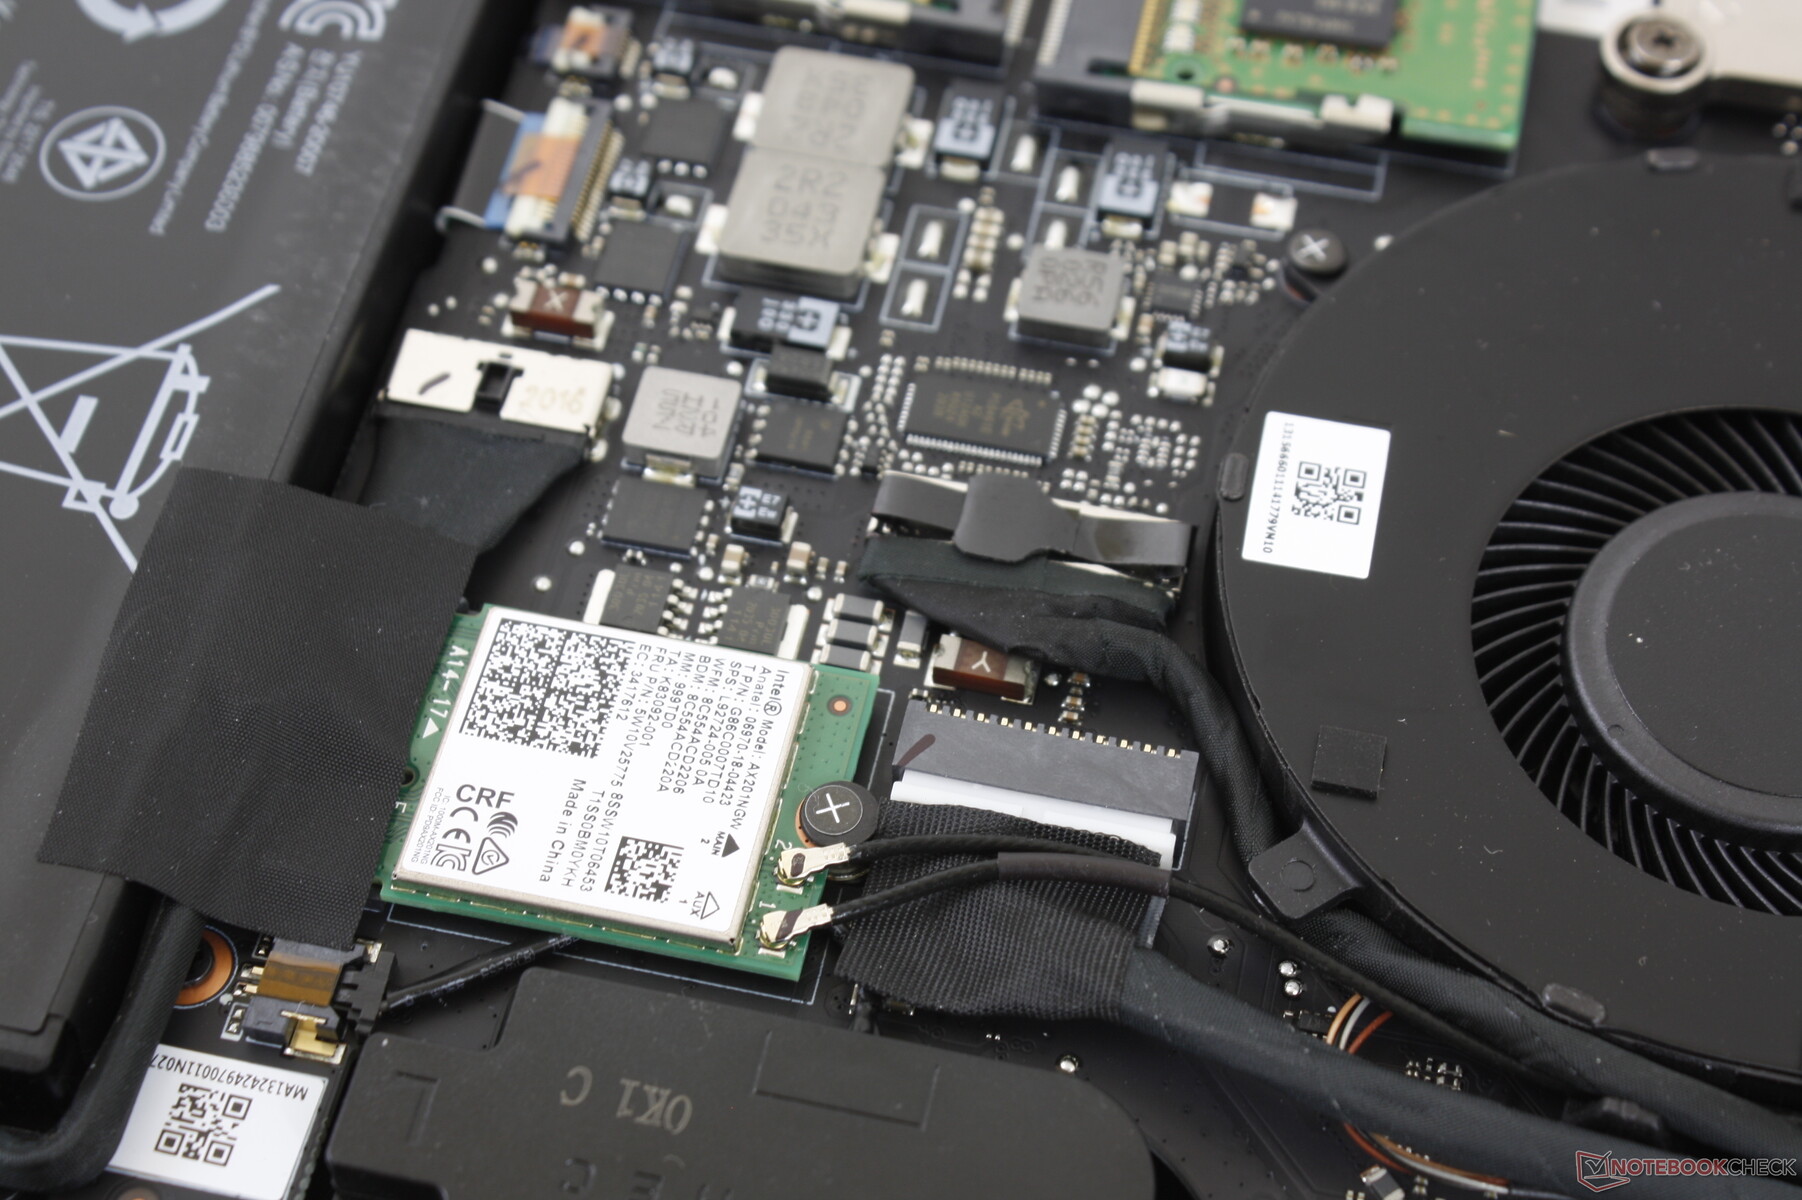
Comunicación
Cámara web


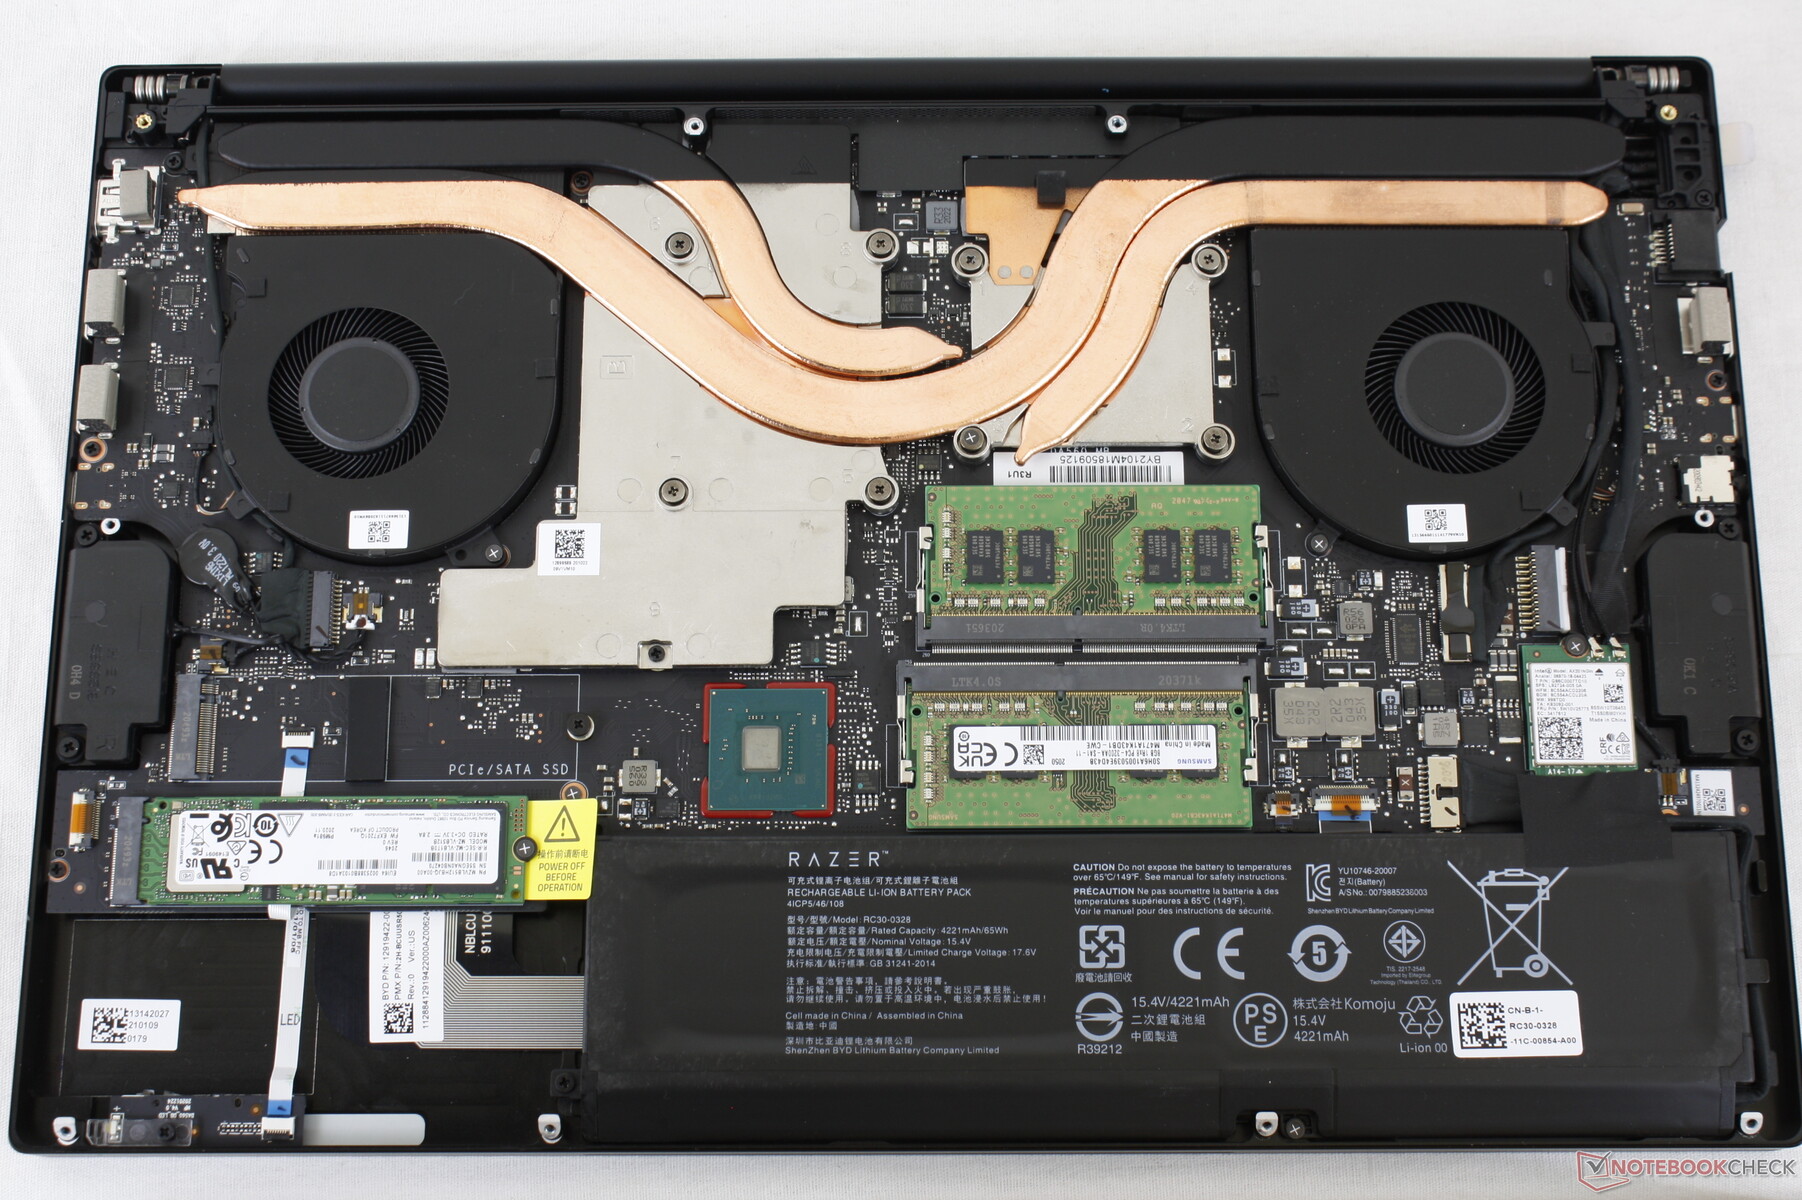
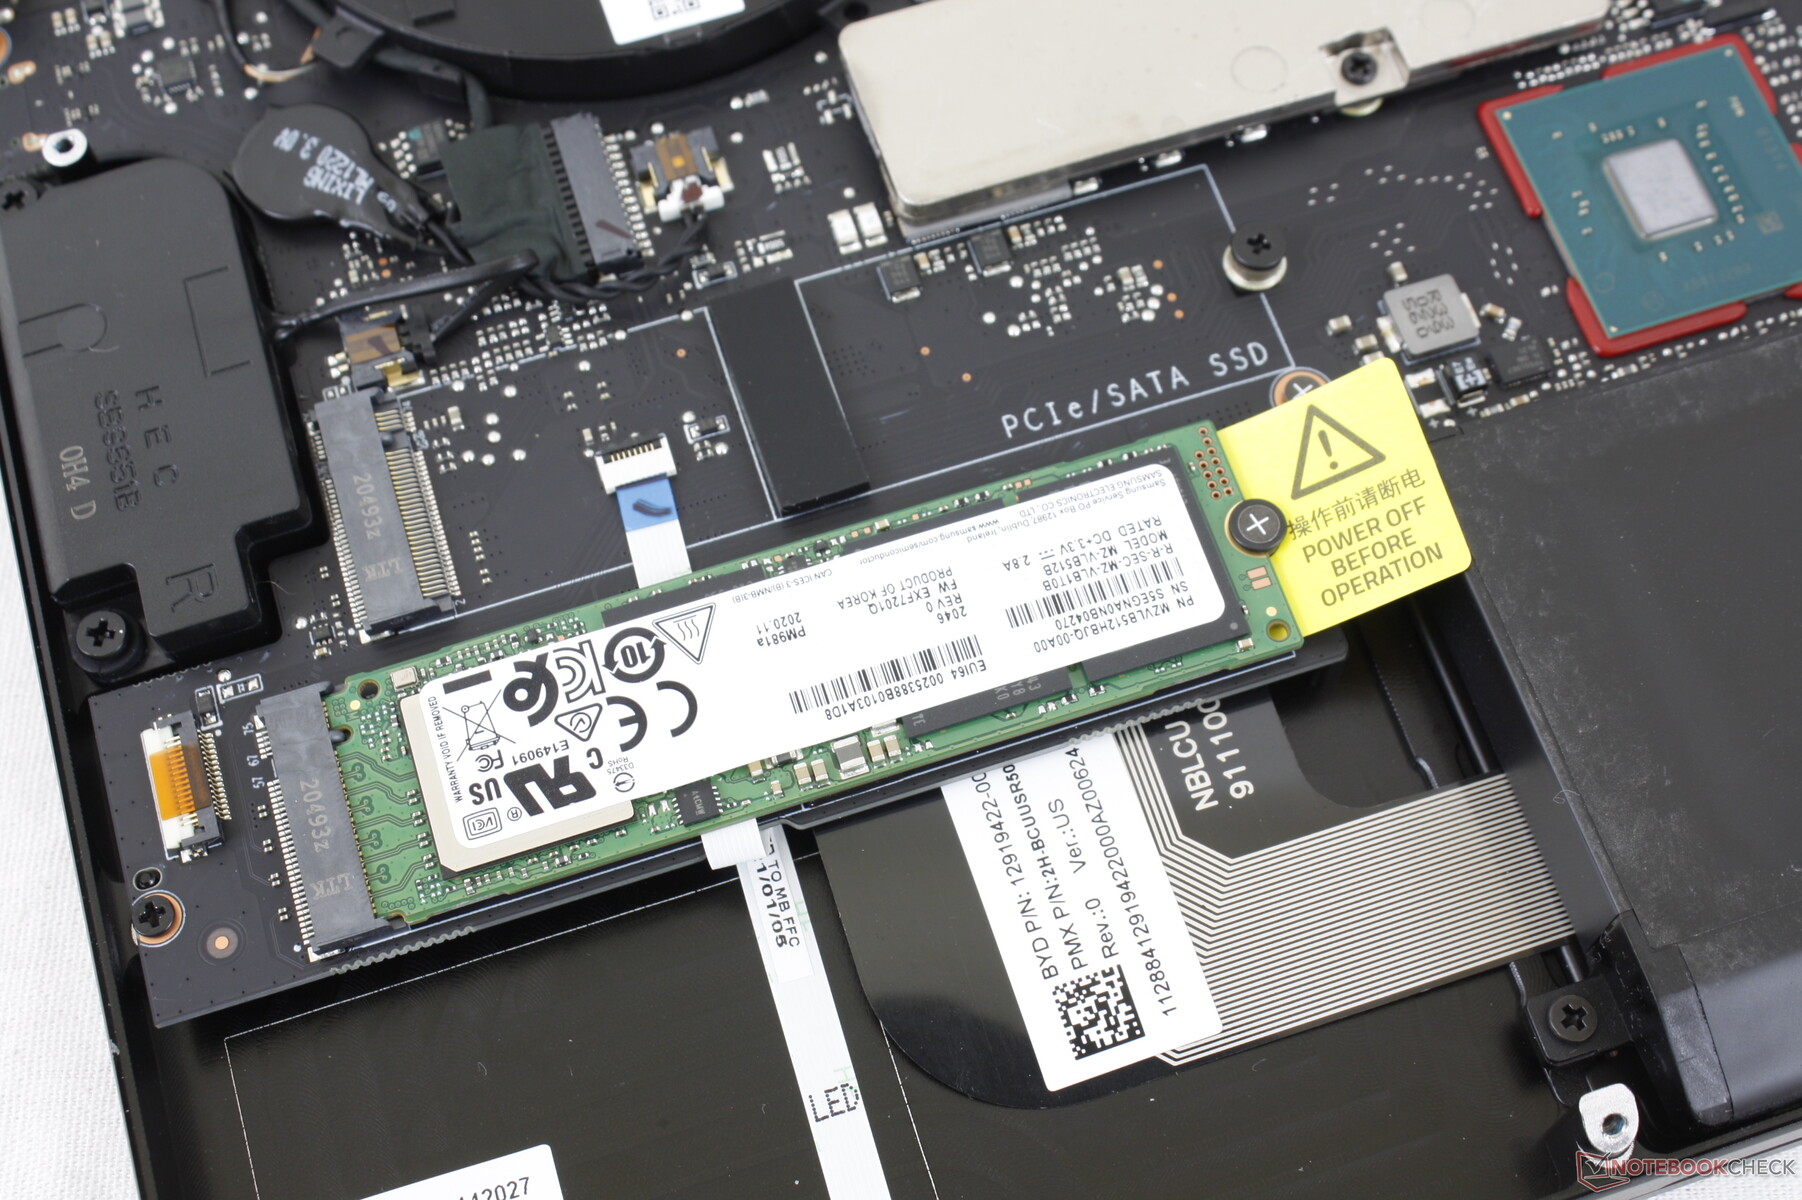
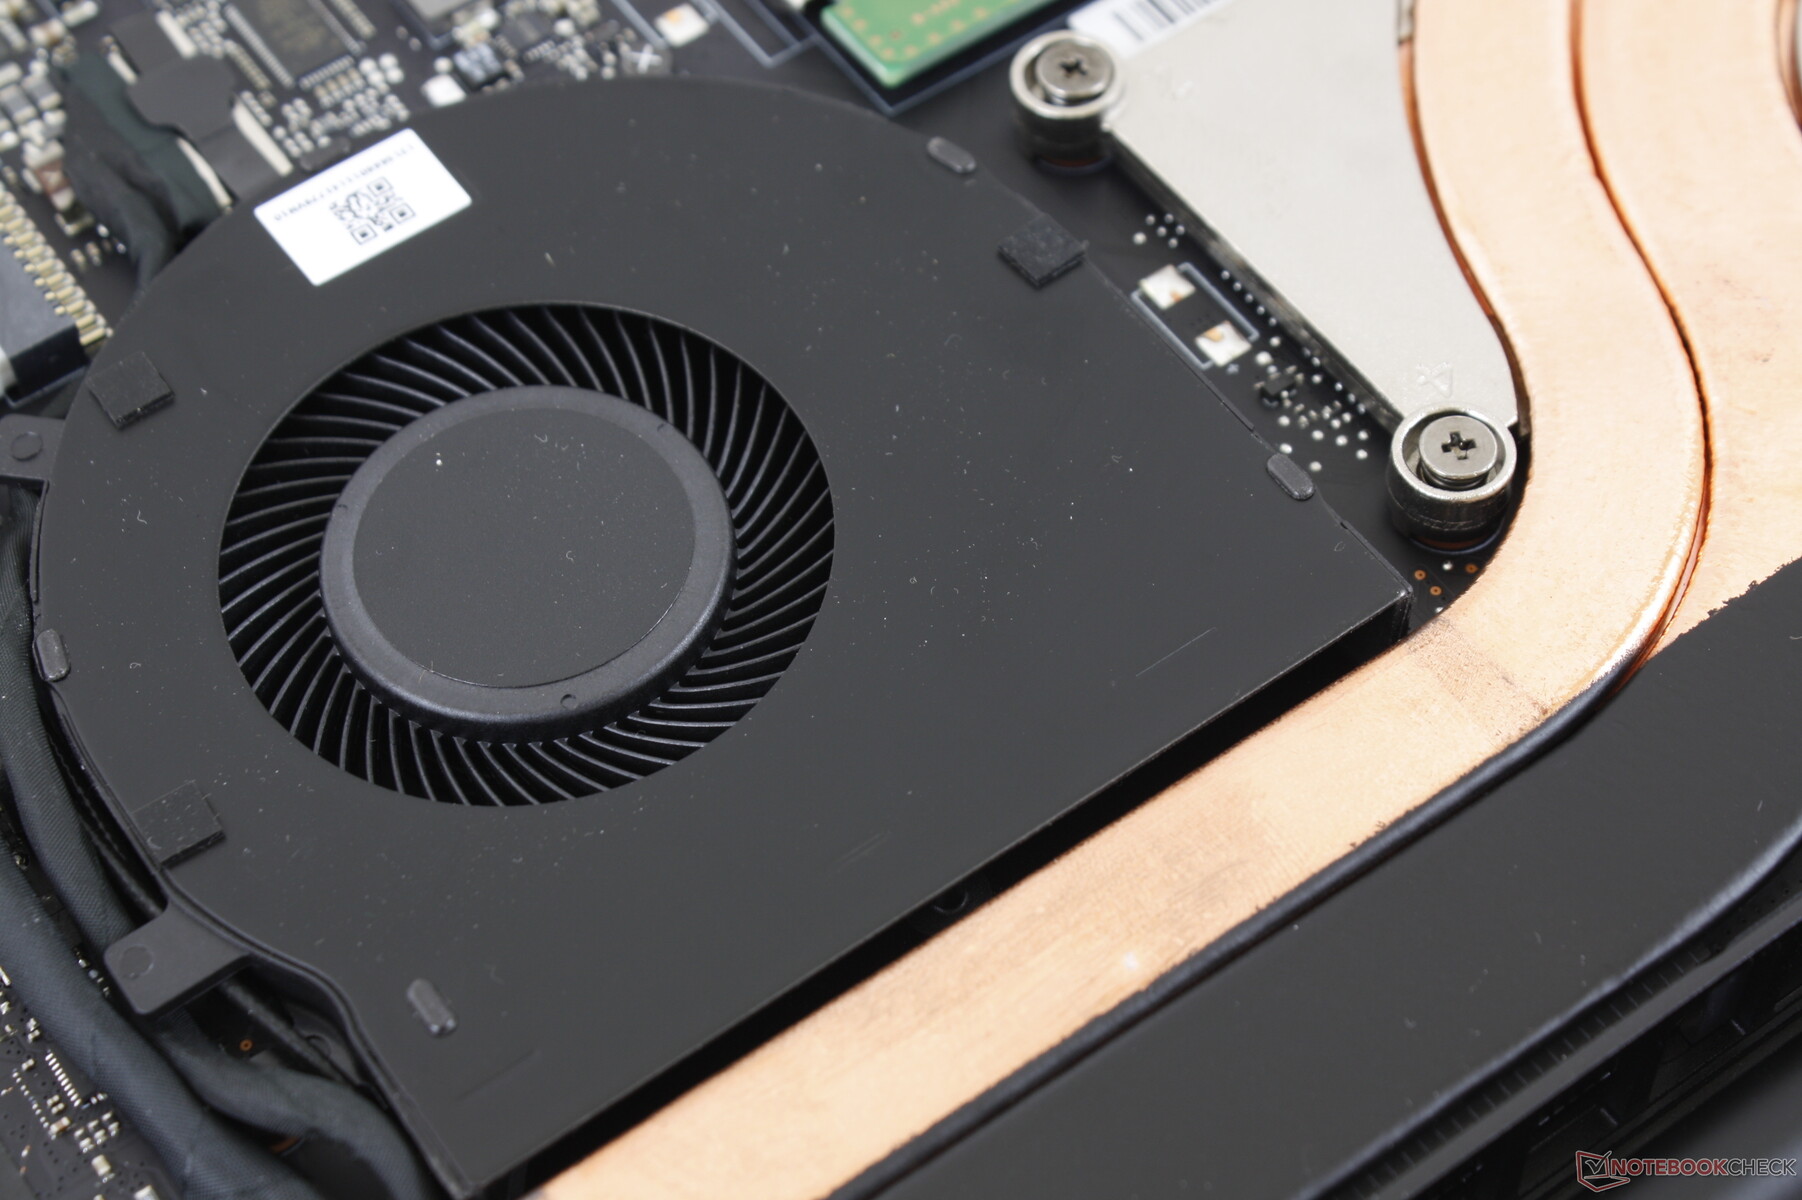
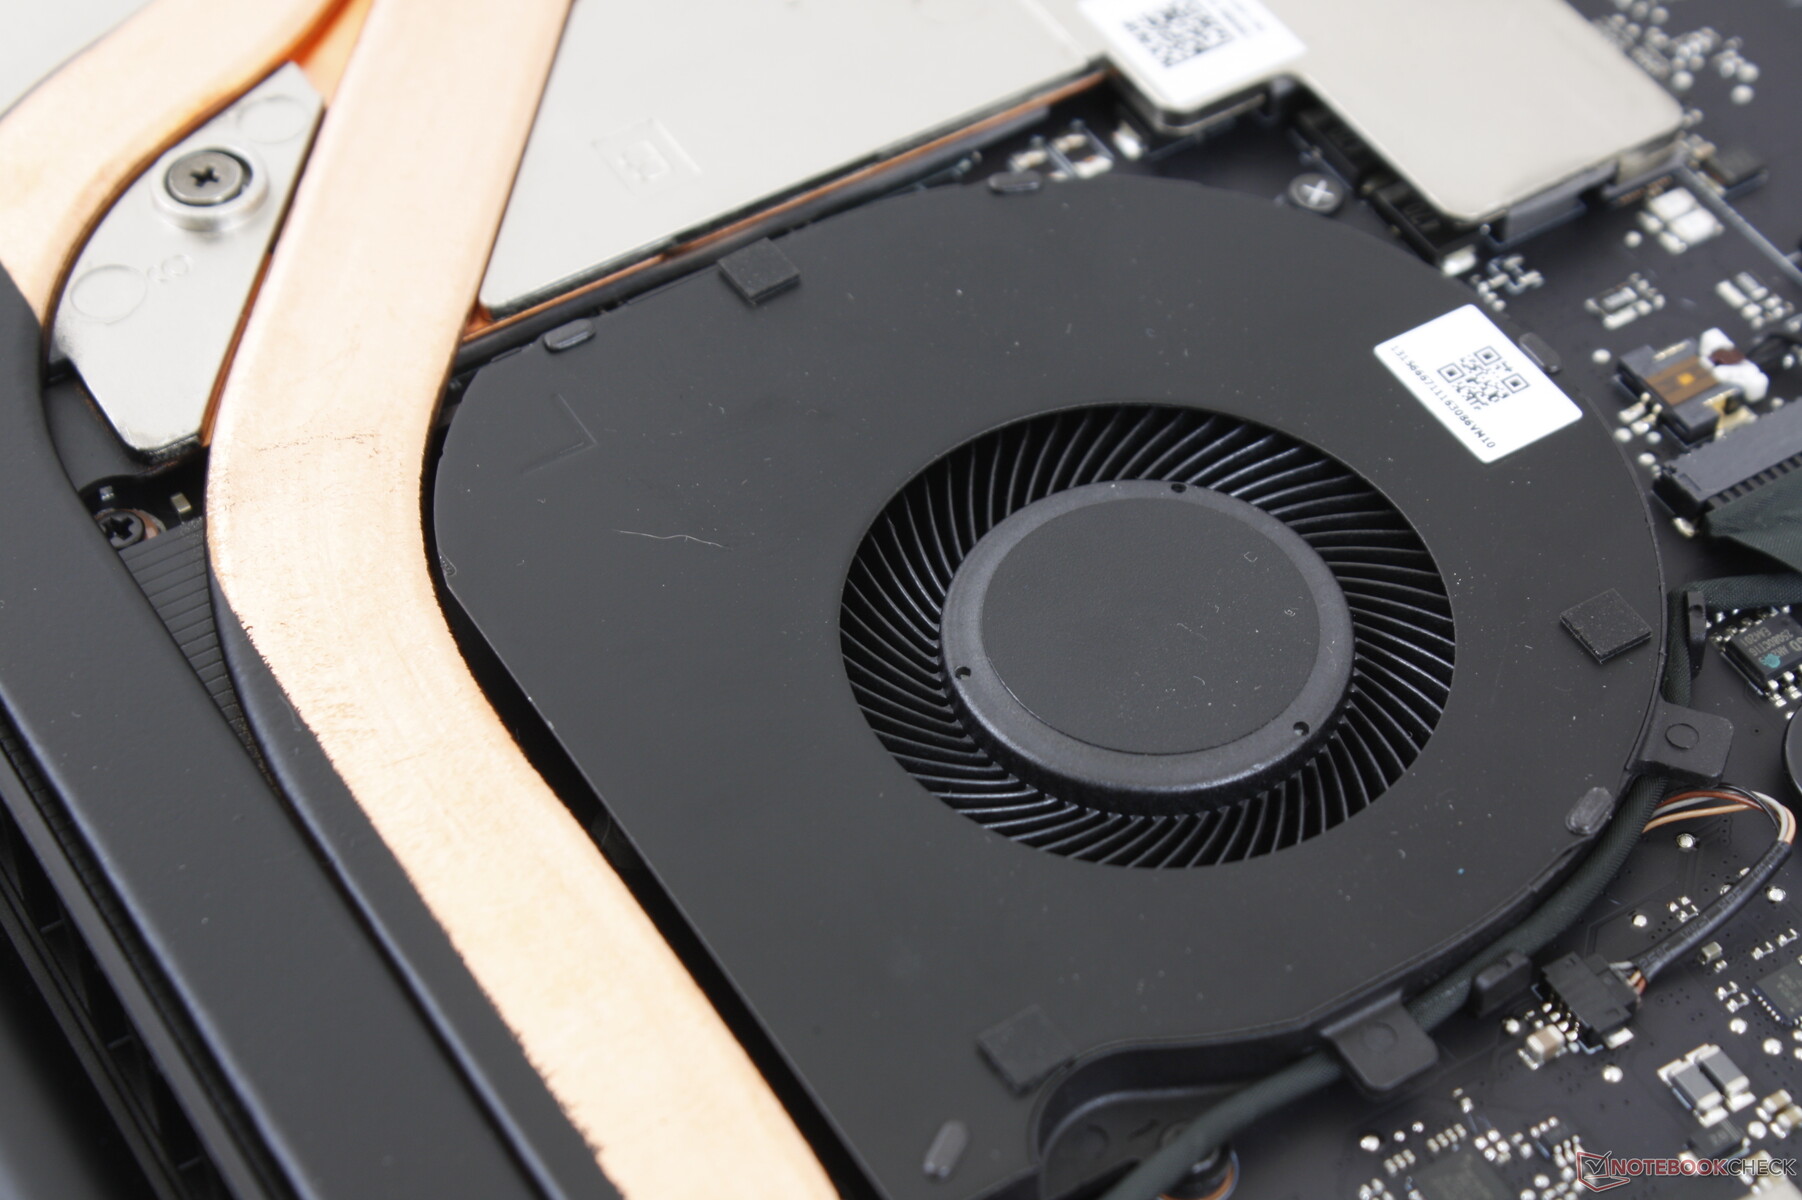
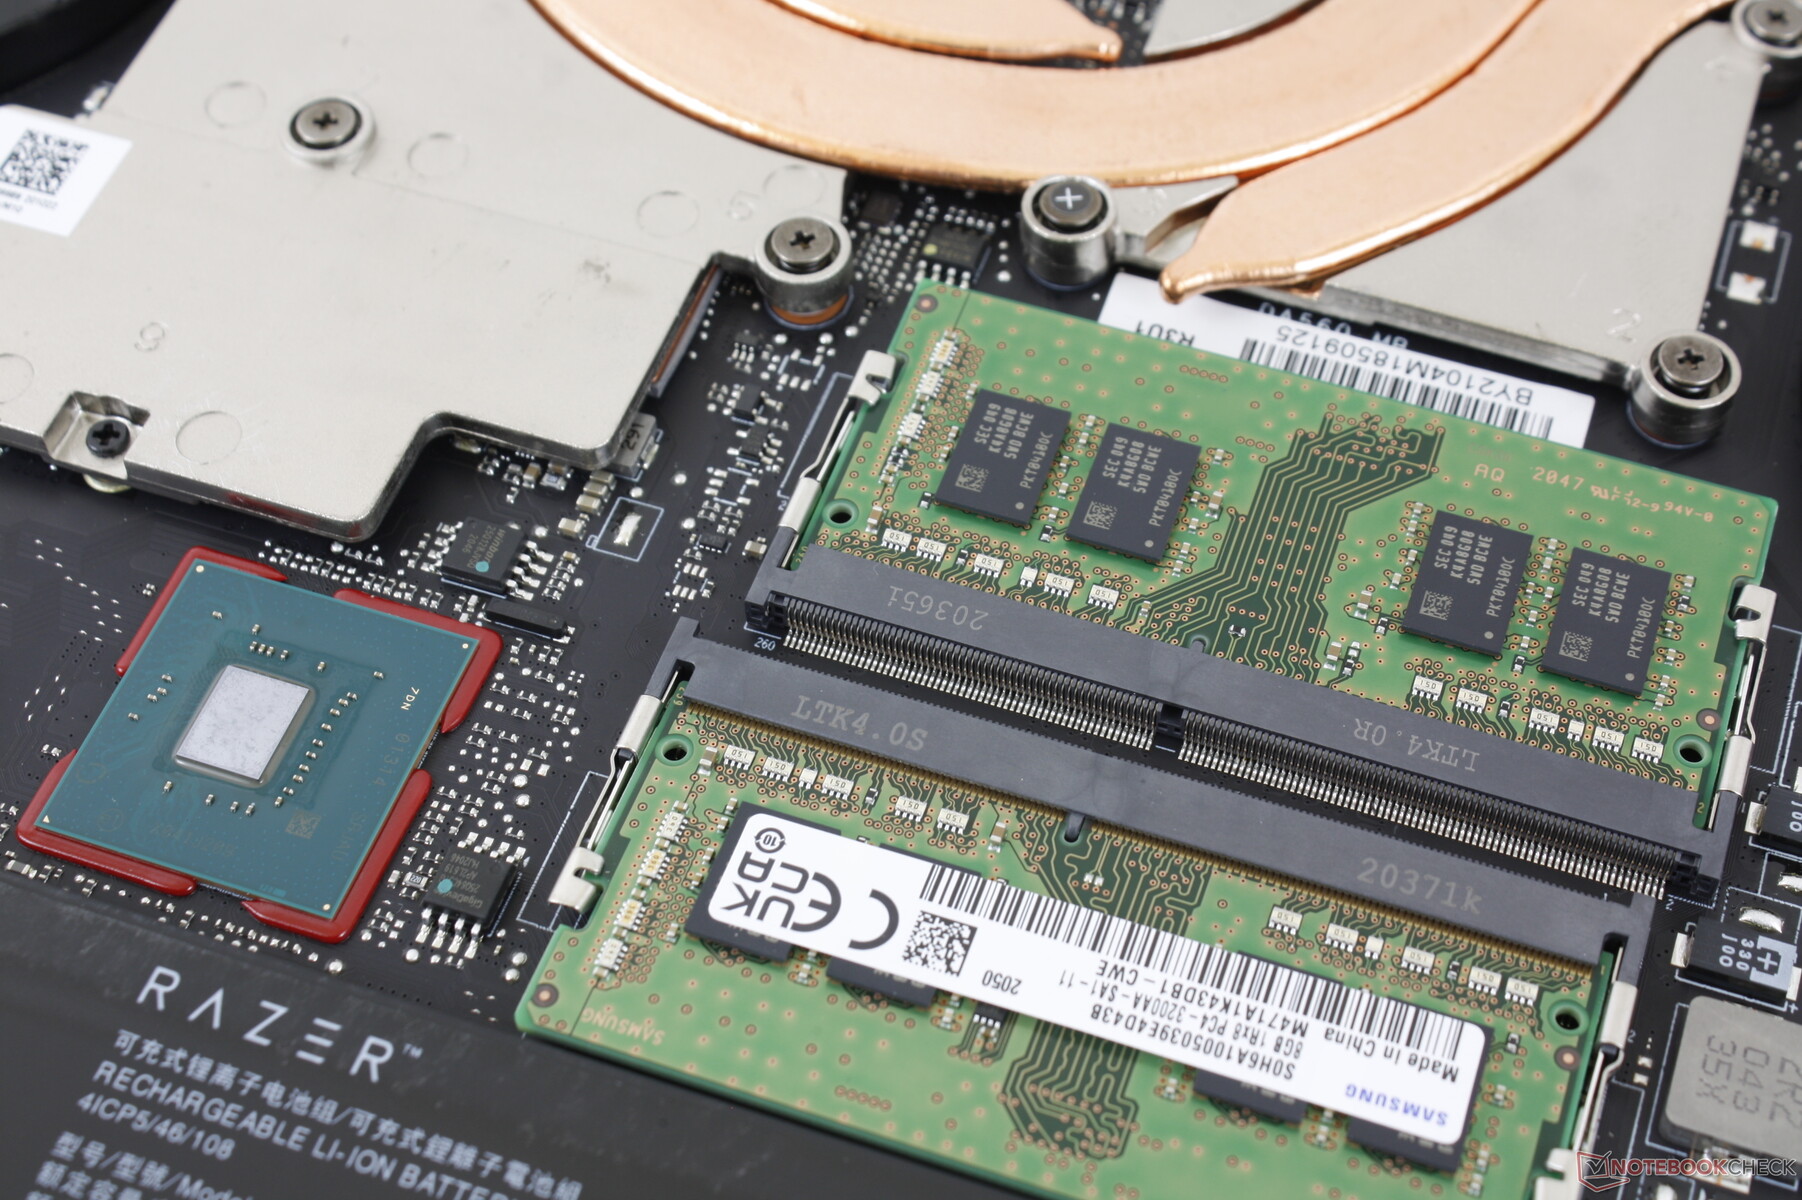
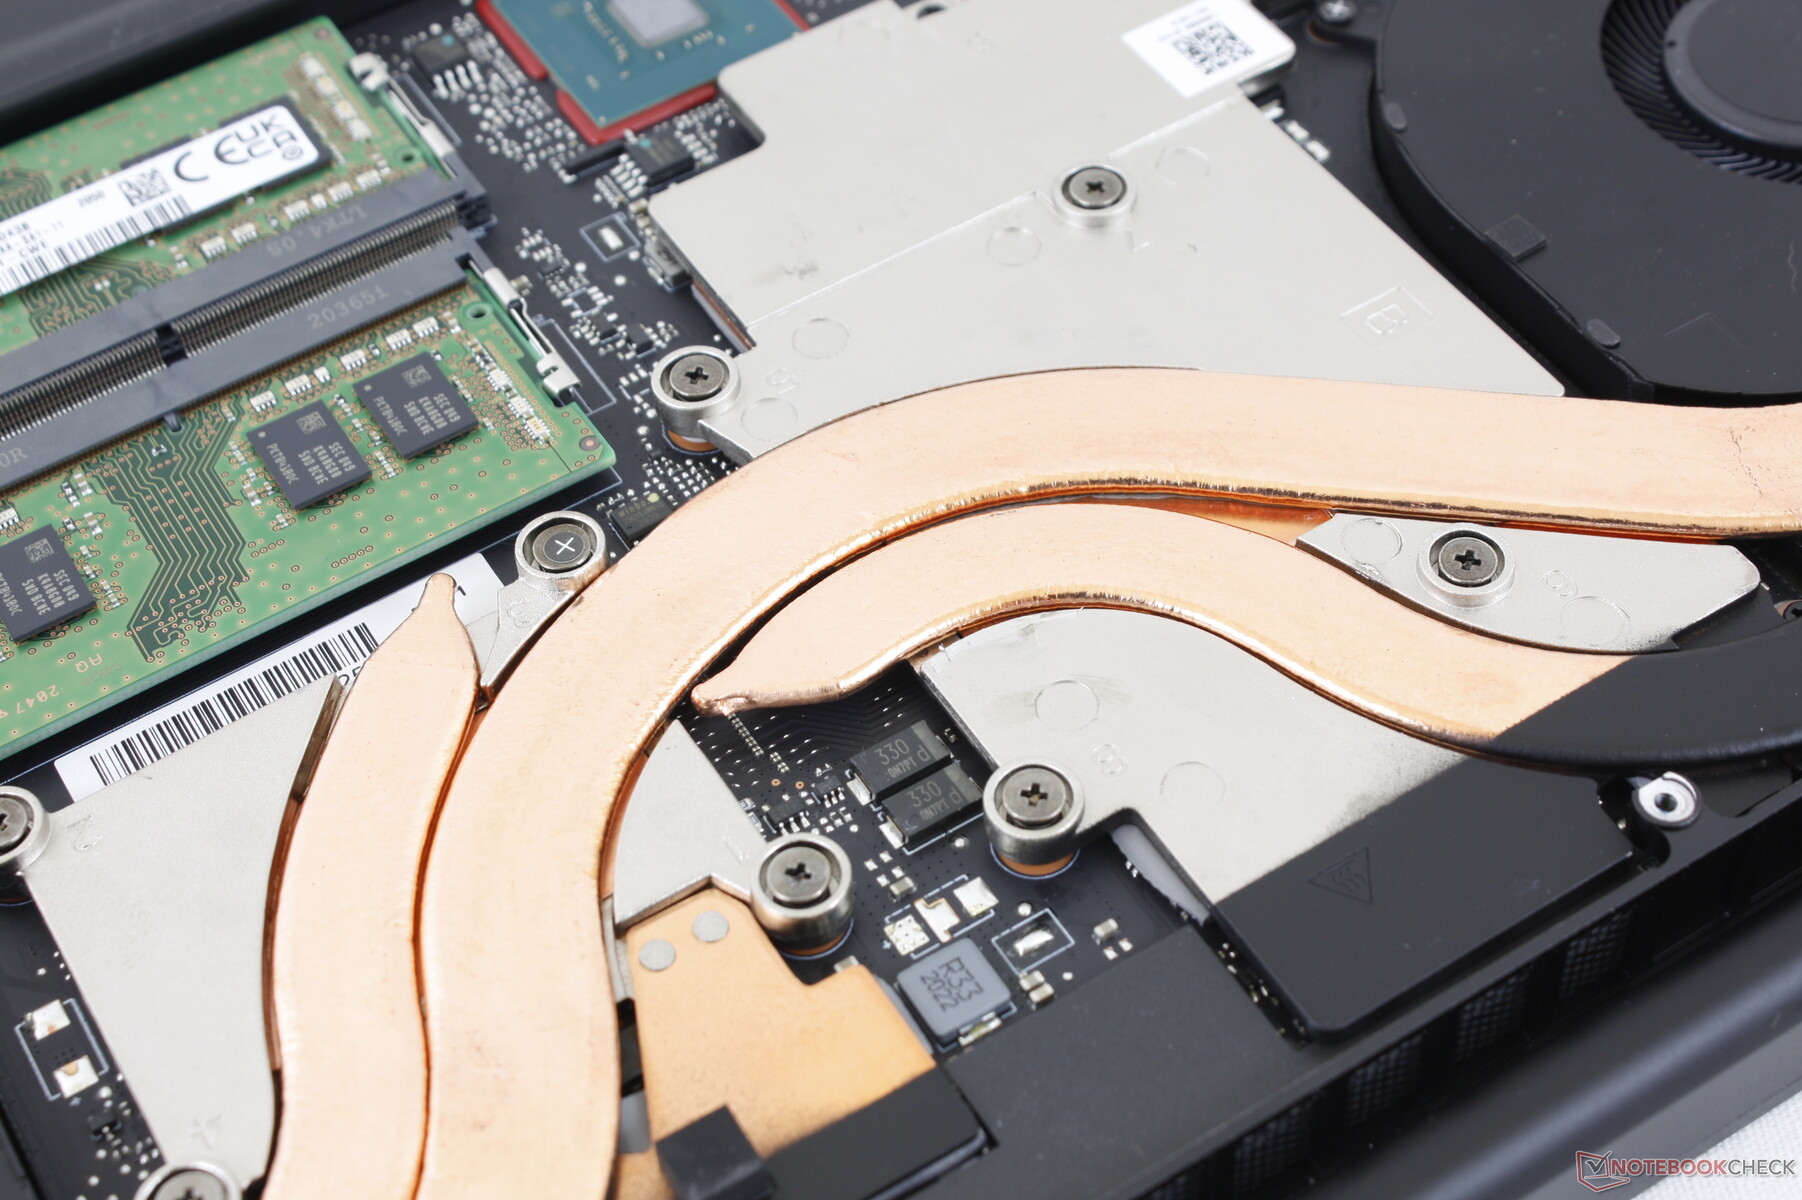
Mantenimiento
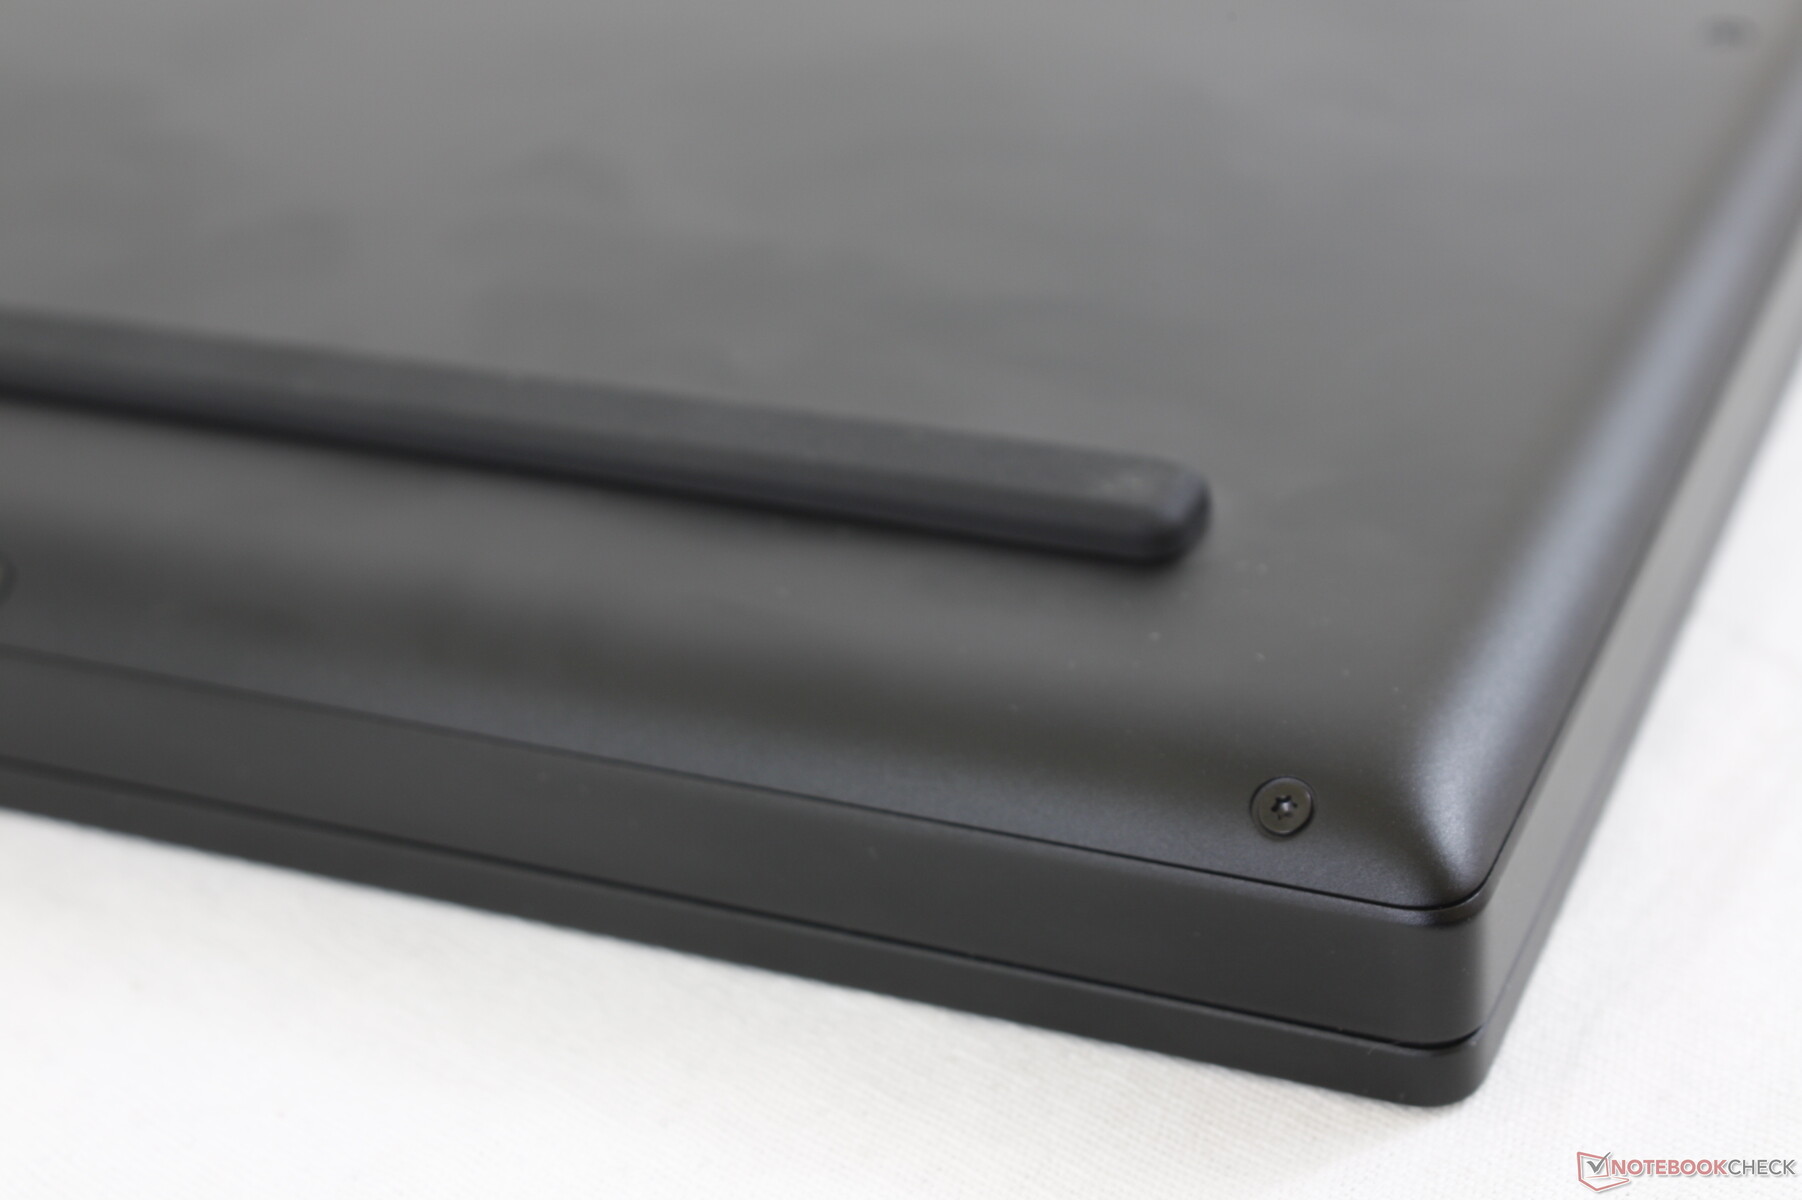
El panel inferior se desprende más fácilmente que en la mayoría de los otros portátiles para juegos para facilitar el mantenimiento. Obsérvese que ya no hay una bahía SATA III de 2,5 pulgadas, a diferencia del modelo base del Blade 15 de primera generación.
Accesorios y garantía
La caja incluye algunas pegatinas con el logotipo de Razer, además de la documentación habitual y el adaptador de CA. Se aplica una garantía limitada de un año.
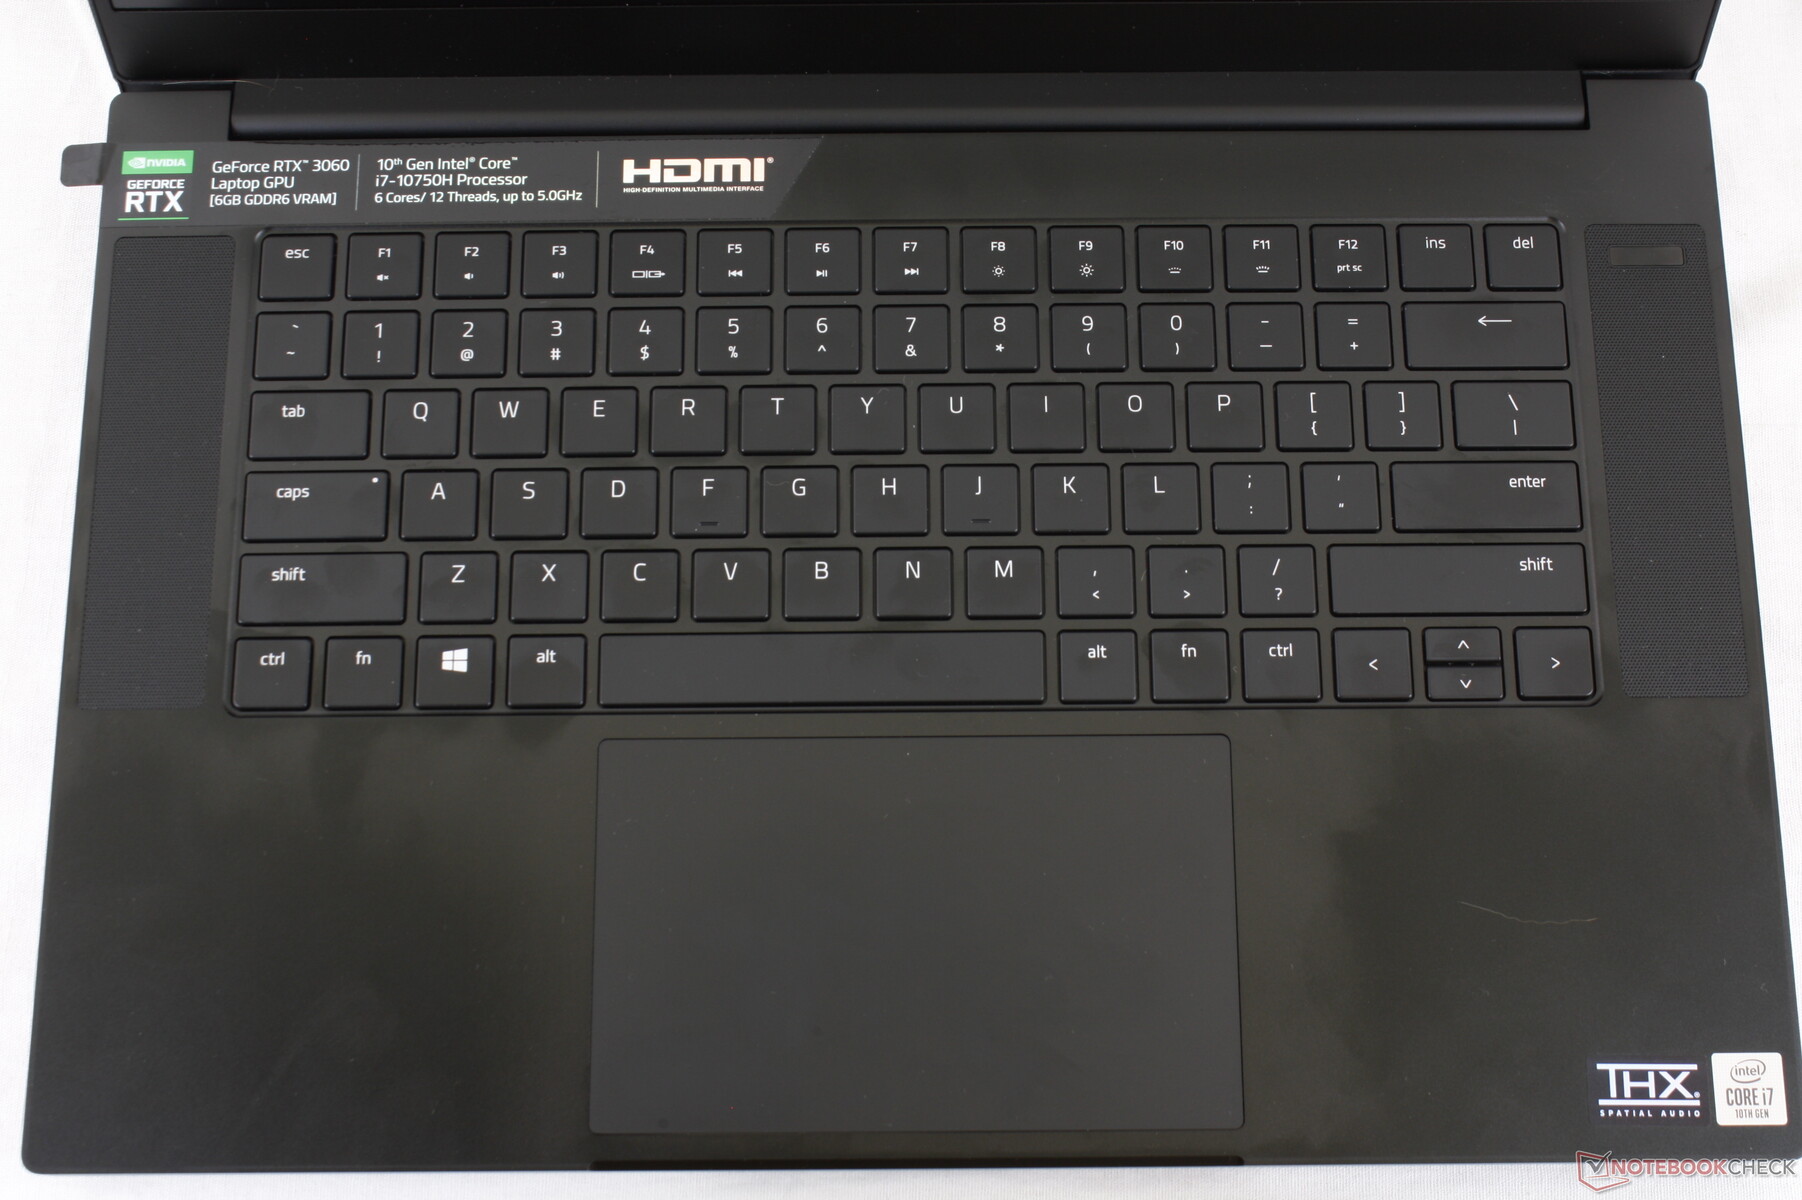
Dispositivos de entrada
Teclado
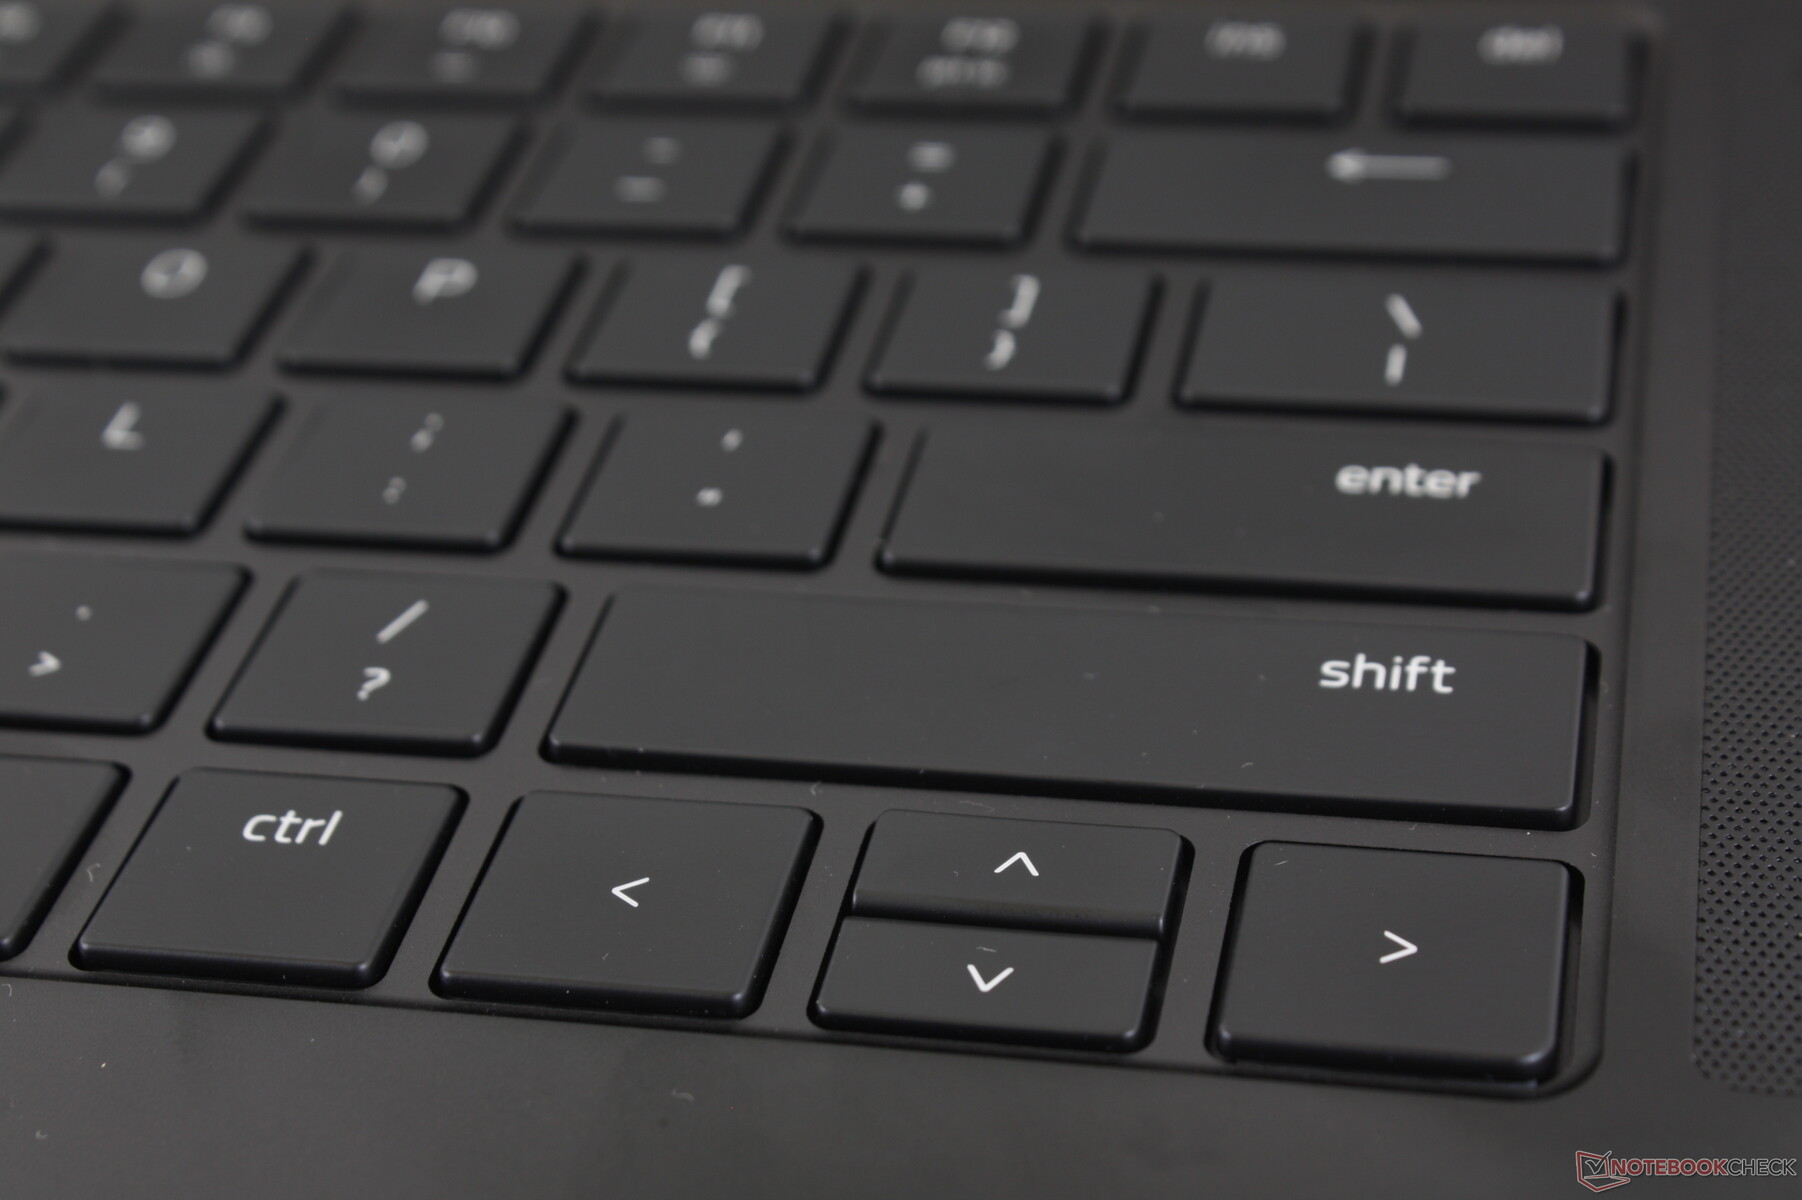
La respuesta y el recorrido de las teclas siguen siendo débiles y poco profundos, respectivamente, similares a los del teclado de la serie Asus Zephyrus GX501/531. La mayoría de portátiles de juego tienen un recorrido de tecla más profundo para una experiencia de tecleo más satisfactoria que nuestro Razer, incluyendo el MSI GS66, HP Omen 15, o Asus ROG Strix. Esperamos que Razer mejore el teclado en futuras iteraciones, que ha permanecido inalterado durante muchos años.
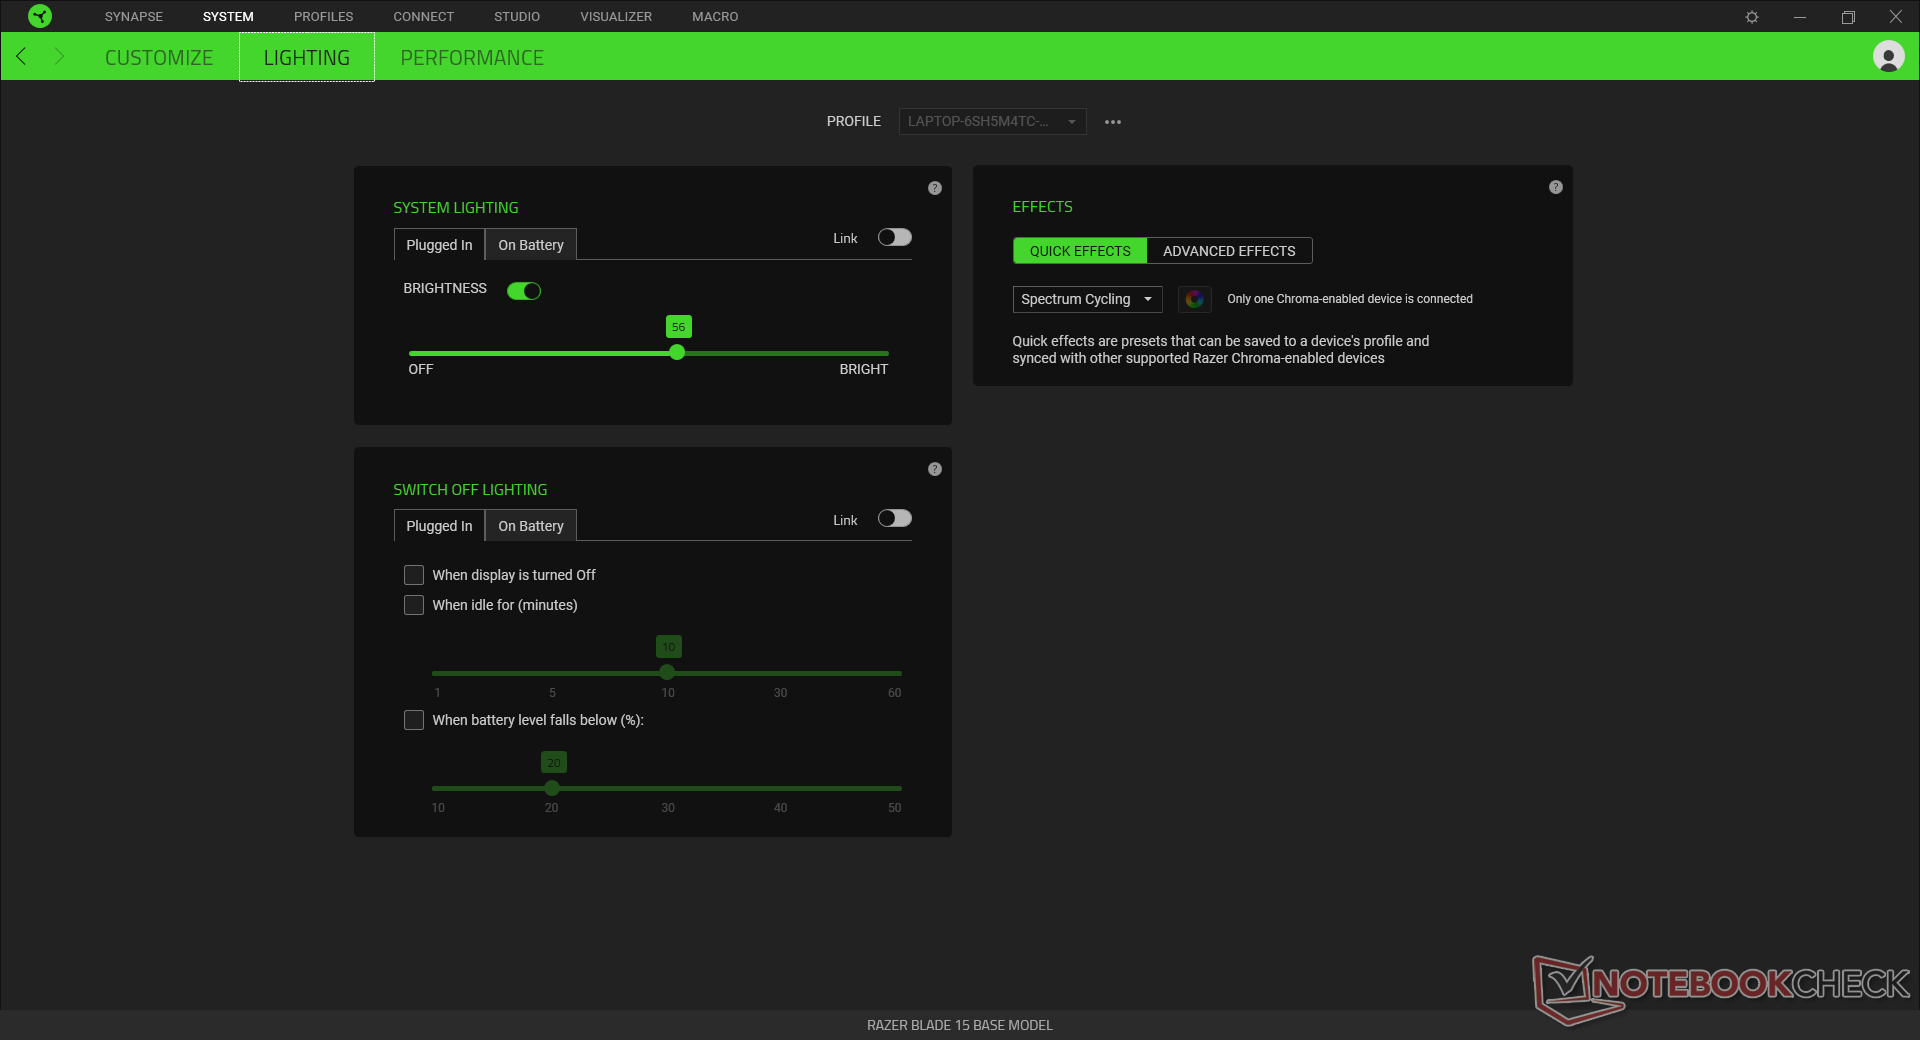
La iluminación del teclado RGB viene de serie, mientras que las opciones por tecla sólo están disponibles en el modelo avanzado.
Panel táctil
El clickpad no ha cambiado respecto al diseño del año pasado. Sigue siendo grande, de 13 x 8 cm, y las teclas integradas del ratón siguen siendo esponjosas y silenciosas. Como resultado, el control del cursor es amplio y cómodo, pero las entradas del ratón tienen una respuesta insatisfactoria.

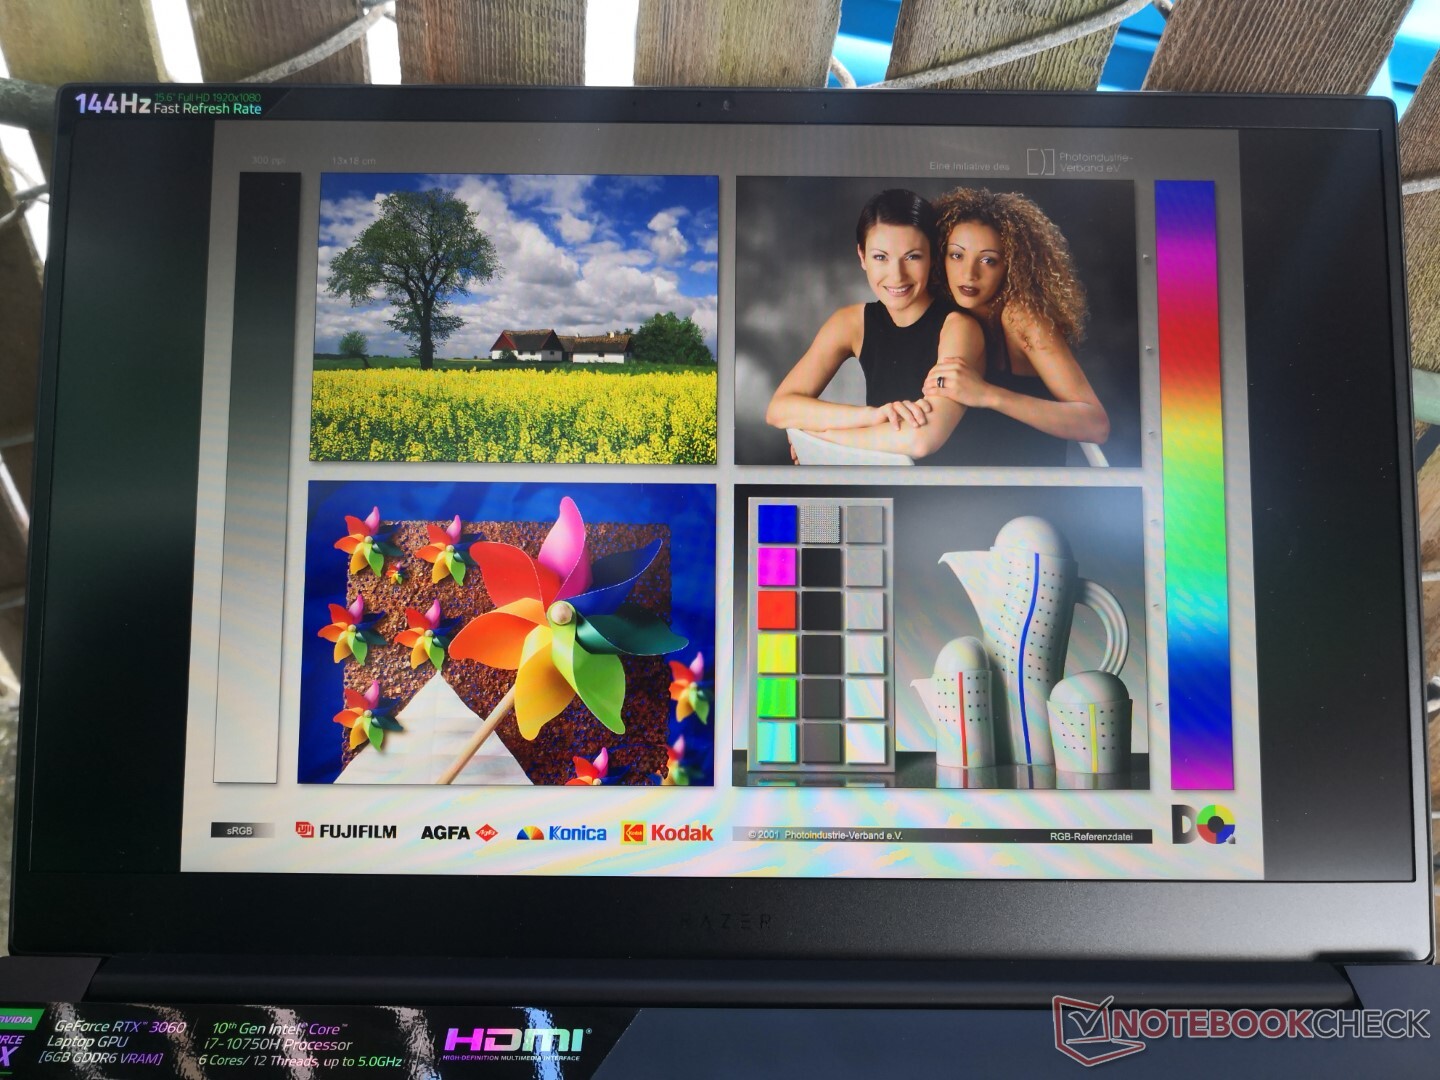
Mostrar
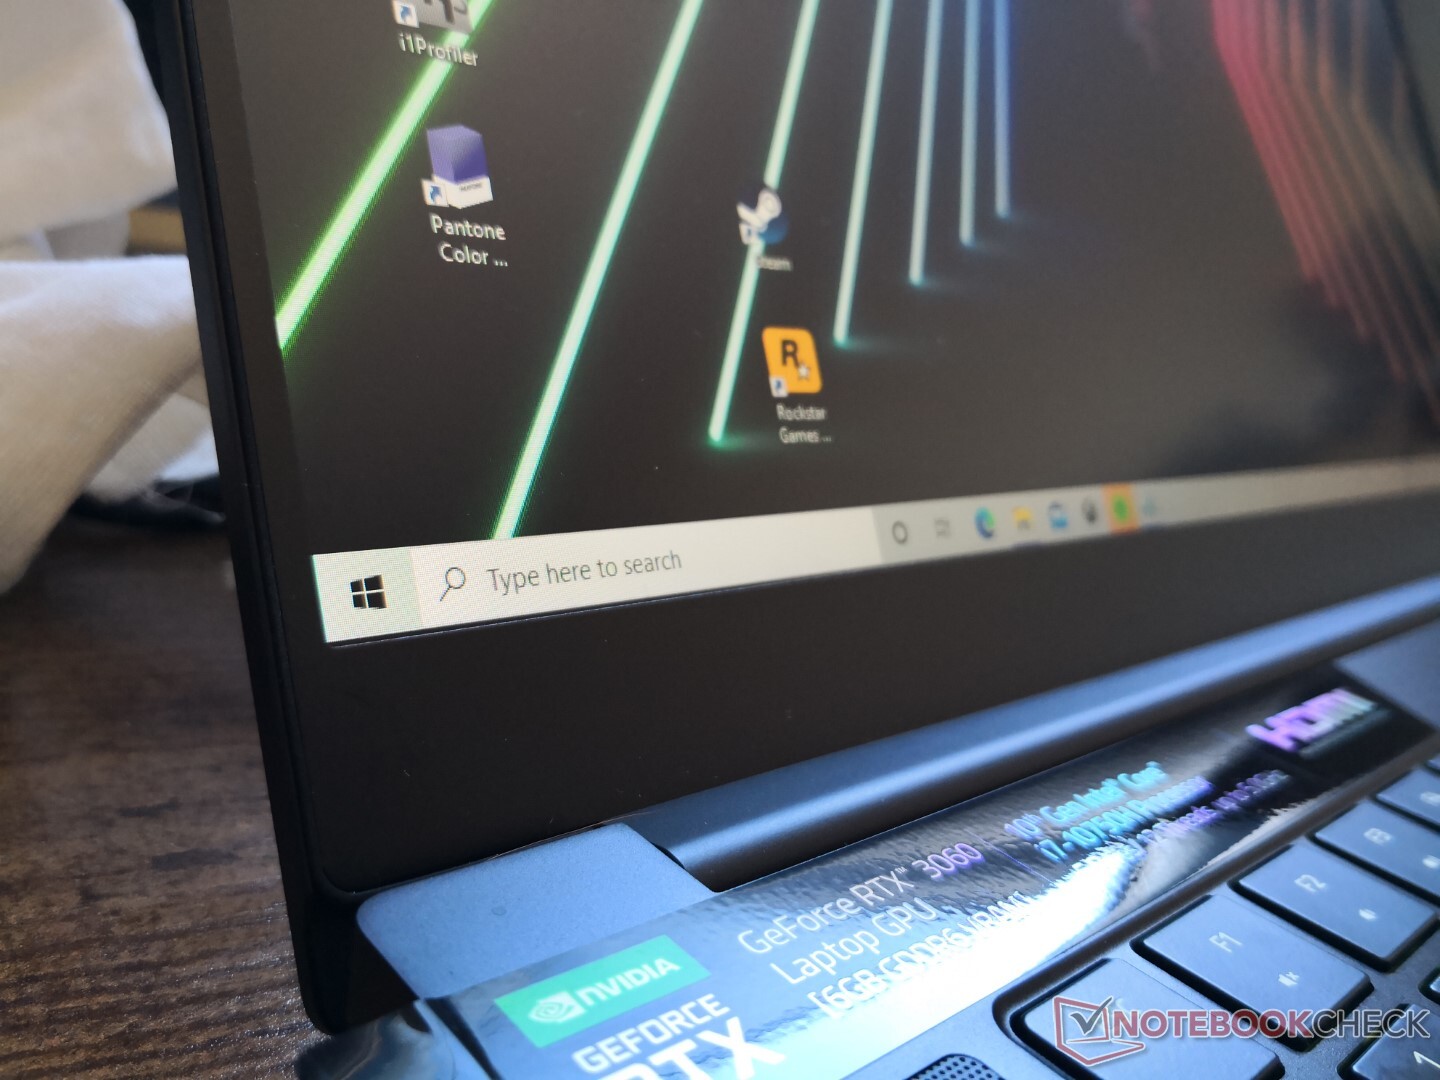
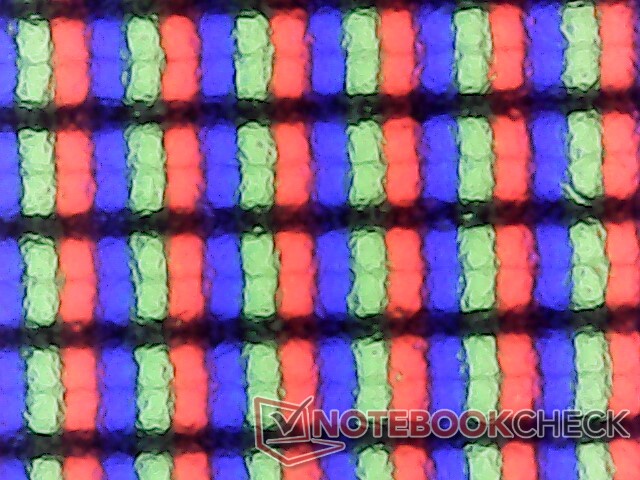
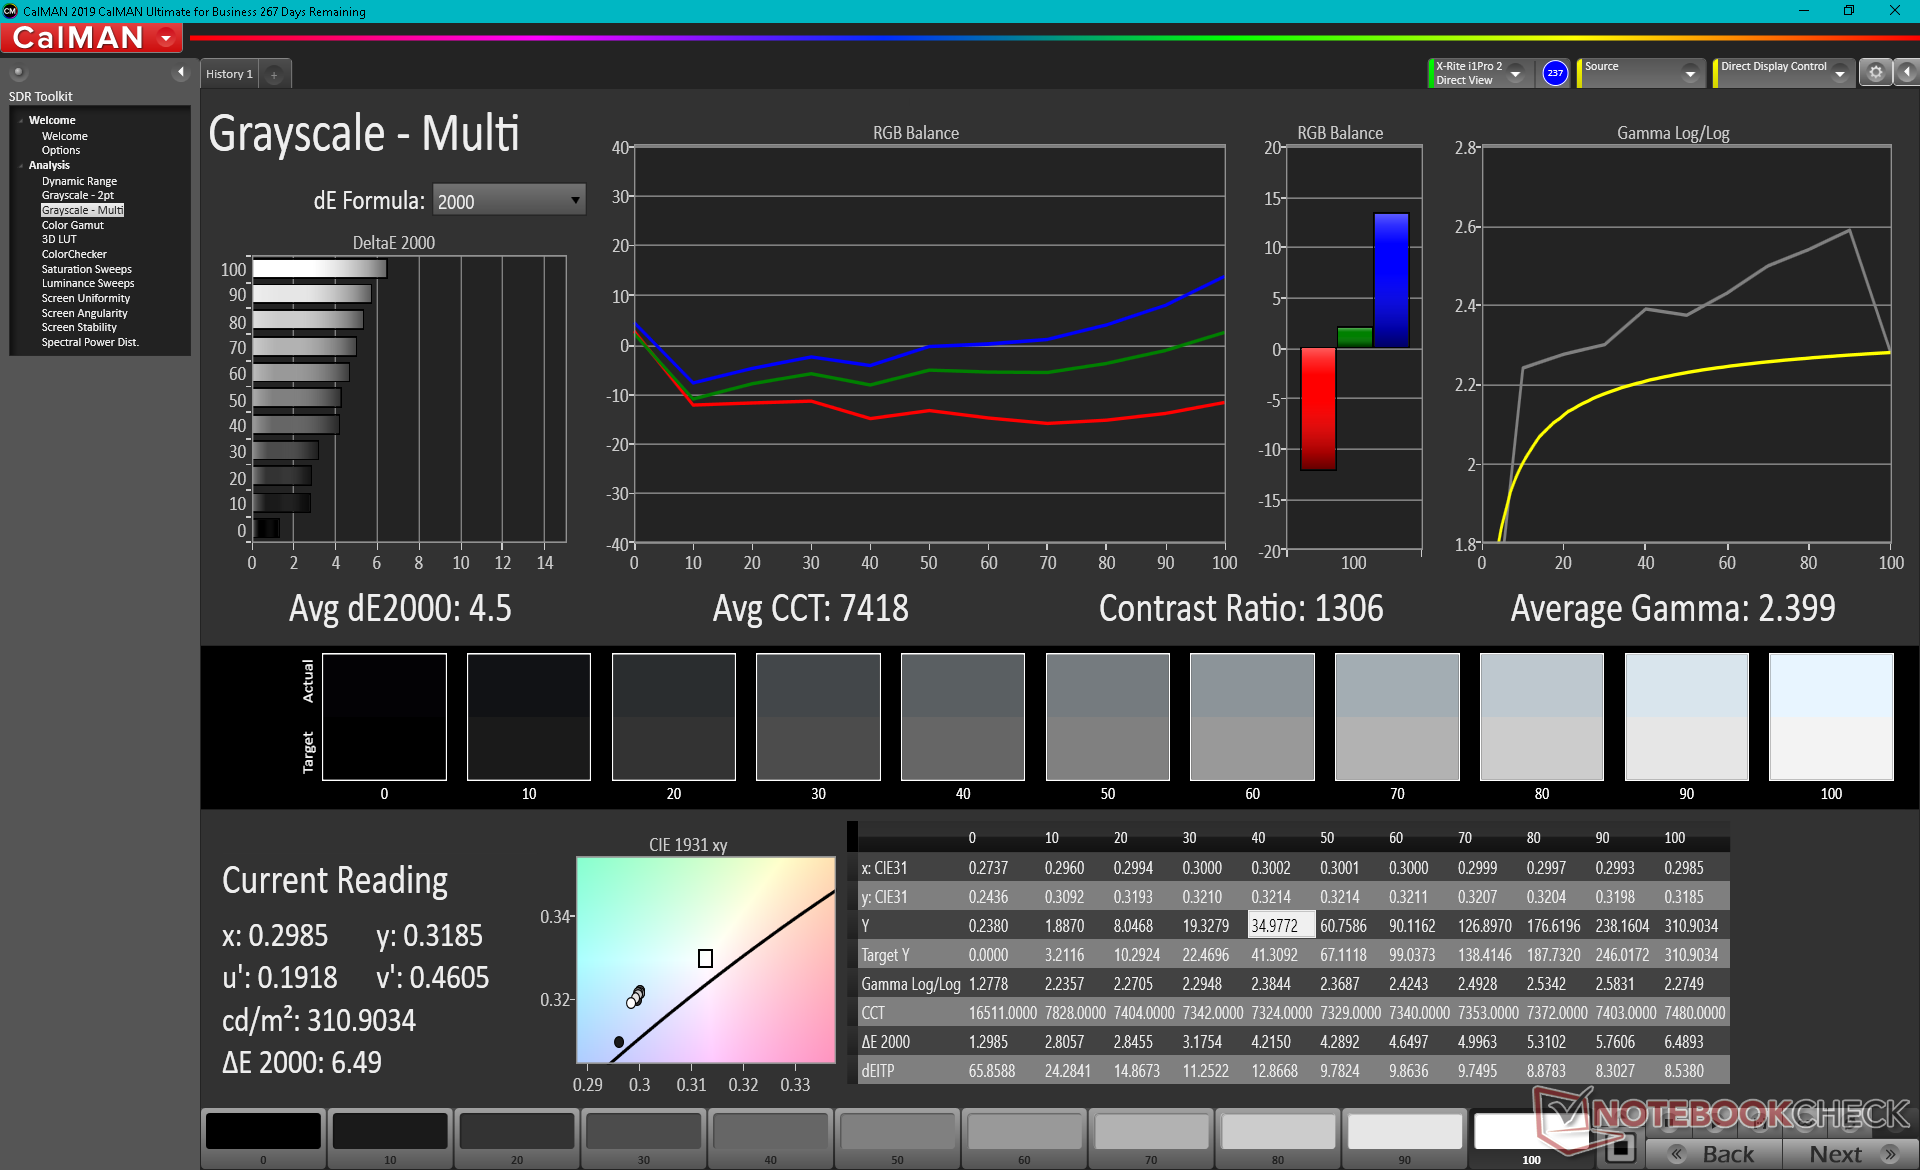
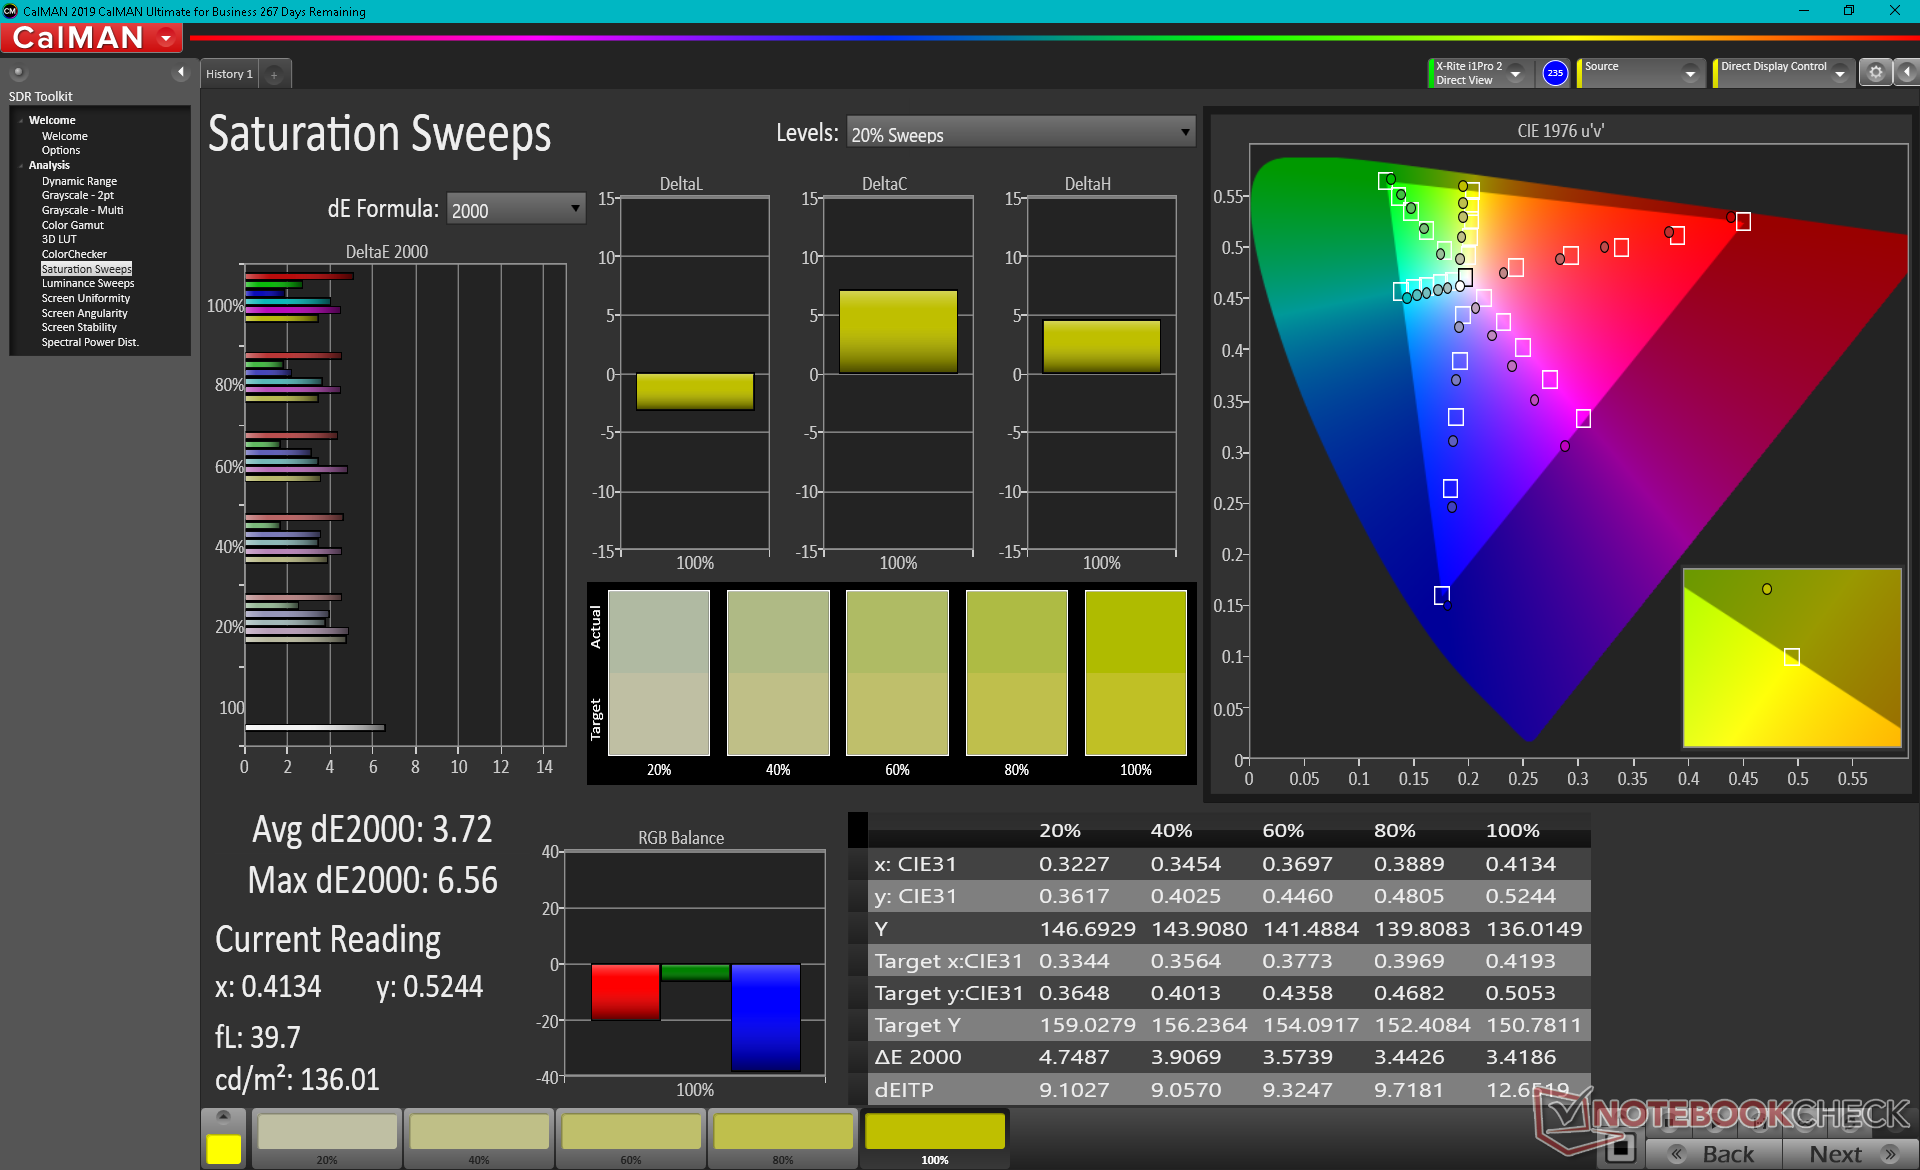
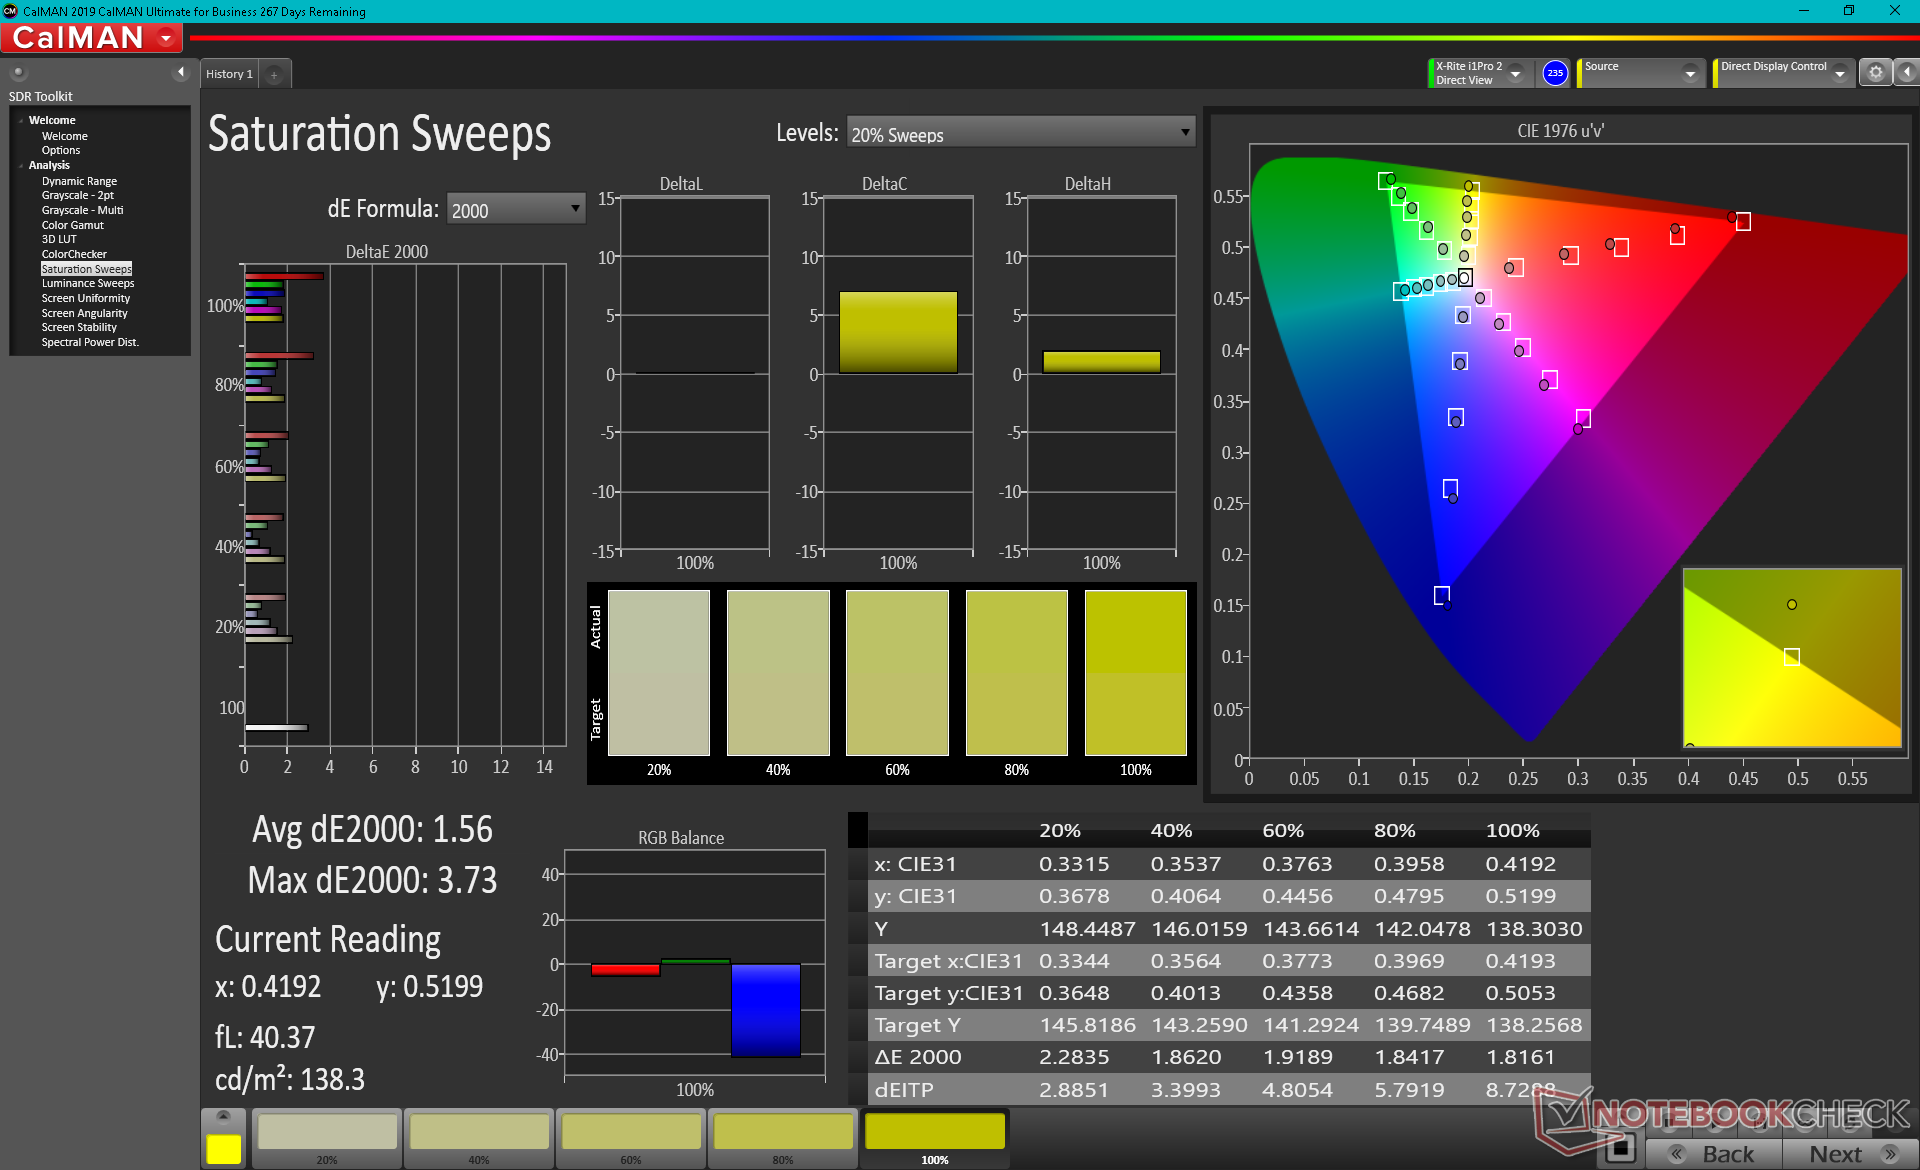
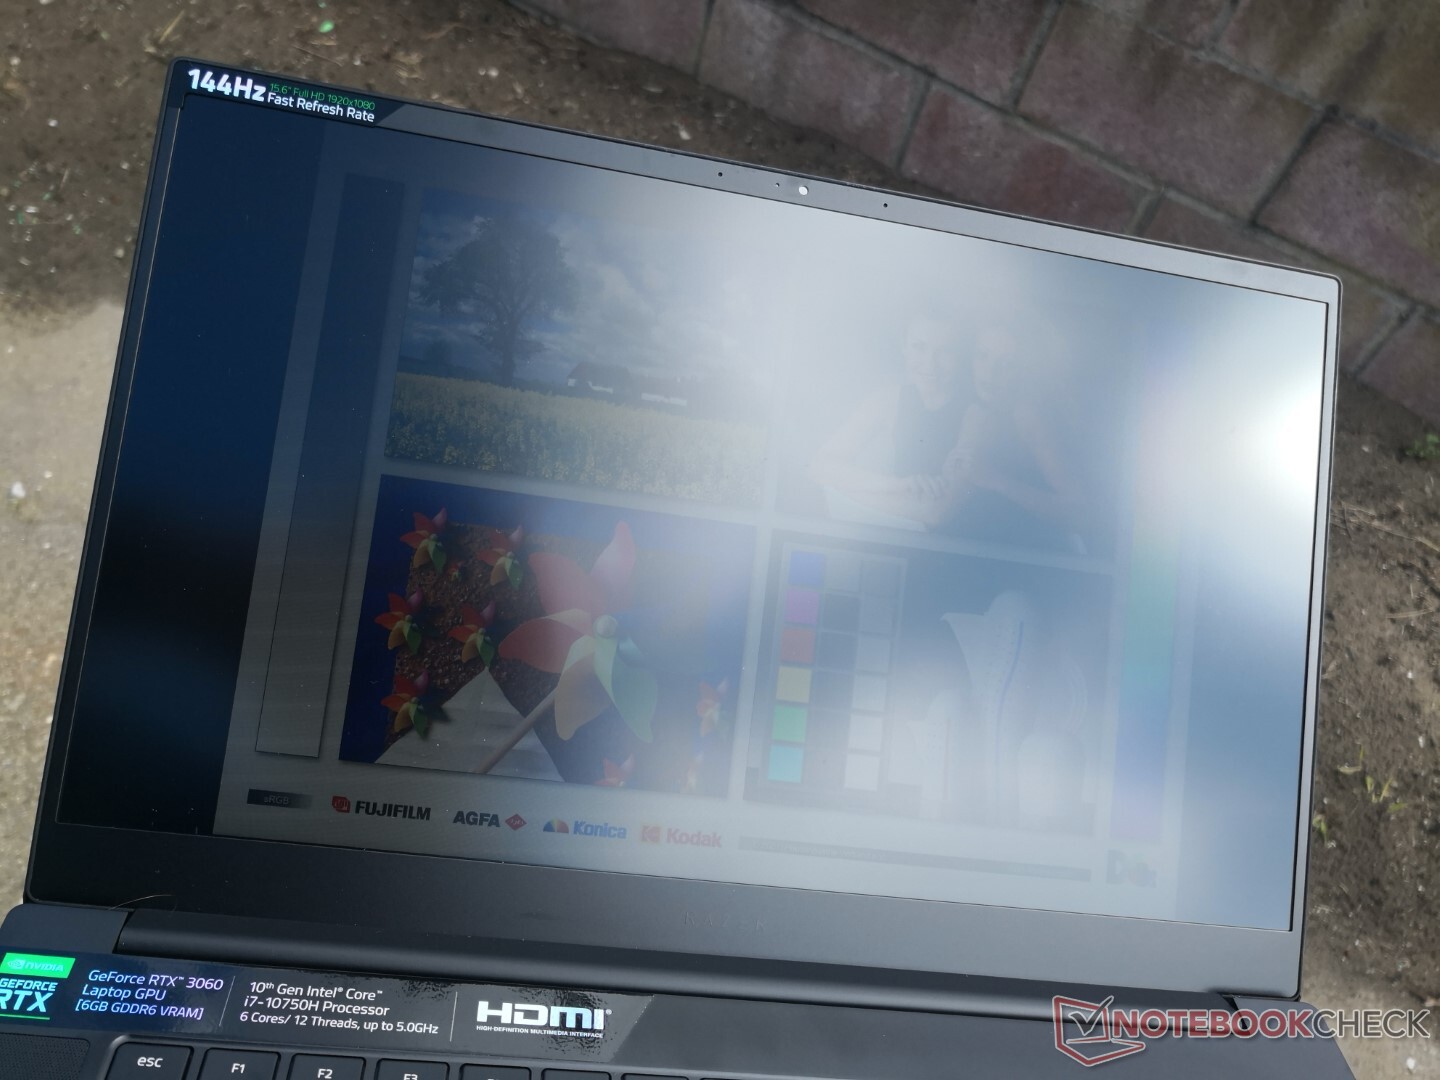
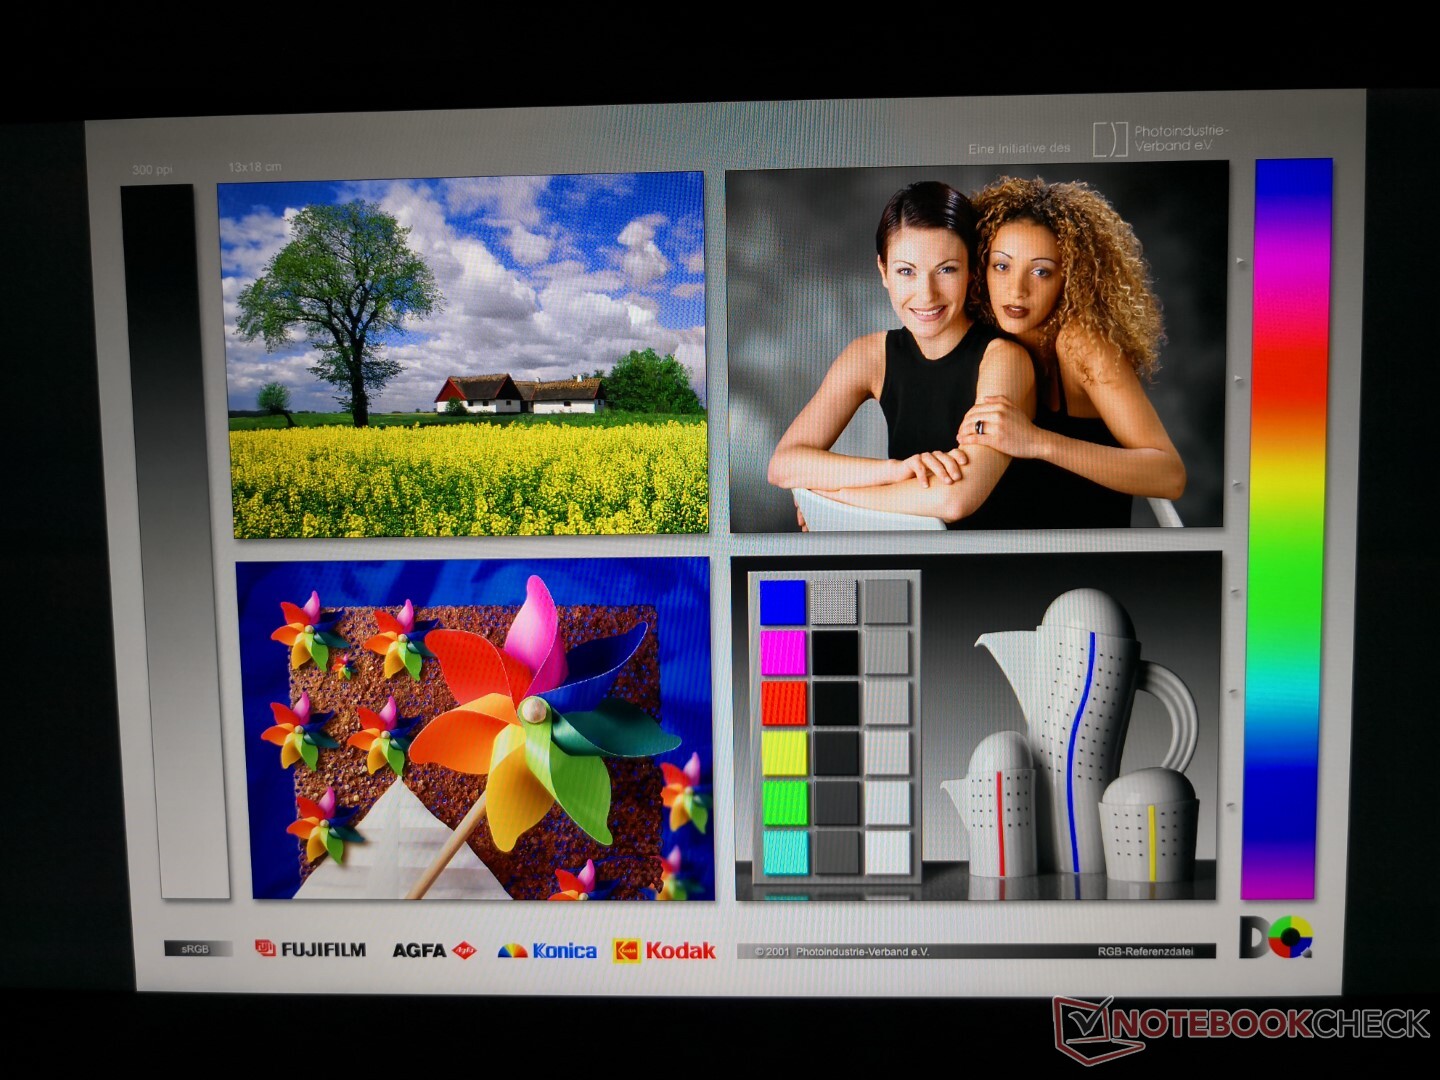
El modelo base del Blade 15 de 2021 utiliza el mismo panel IPS BOE NV156FHM-N4K de 144 Hz que en el modelo base del Blade 15 de 2019 y el Acer Predator Triton 500. Se trata de un panel de gama media alta con una excelente relación de contraste de alrededor de 1000:1, una cobertura sRGB casi completa y tiempos de respuesta rápidos para que casi no haya ghosting. Sin embargo, la modulación de ancho de pulso está presente en todos los niveles de brillo hasta el 99%, algo que no observamos en el panel de 300 Hz del modelo avanzado Blade 15 del año pasado. Los usuarios sensibles al parpadeo en pantalla quizá quieran evitar este panel o elegir una opción diferente.
| |||||||||||||||||||||||||
iluminación: 89 %
Brillo con batería: 317.2 cd/m²
Contraste: 1023:1 (Negro: 0.31 cd/m²)
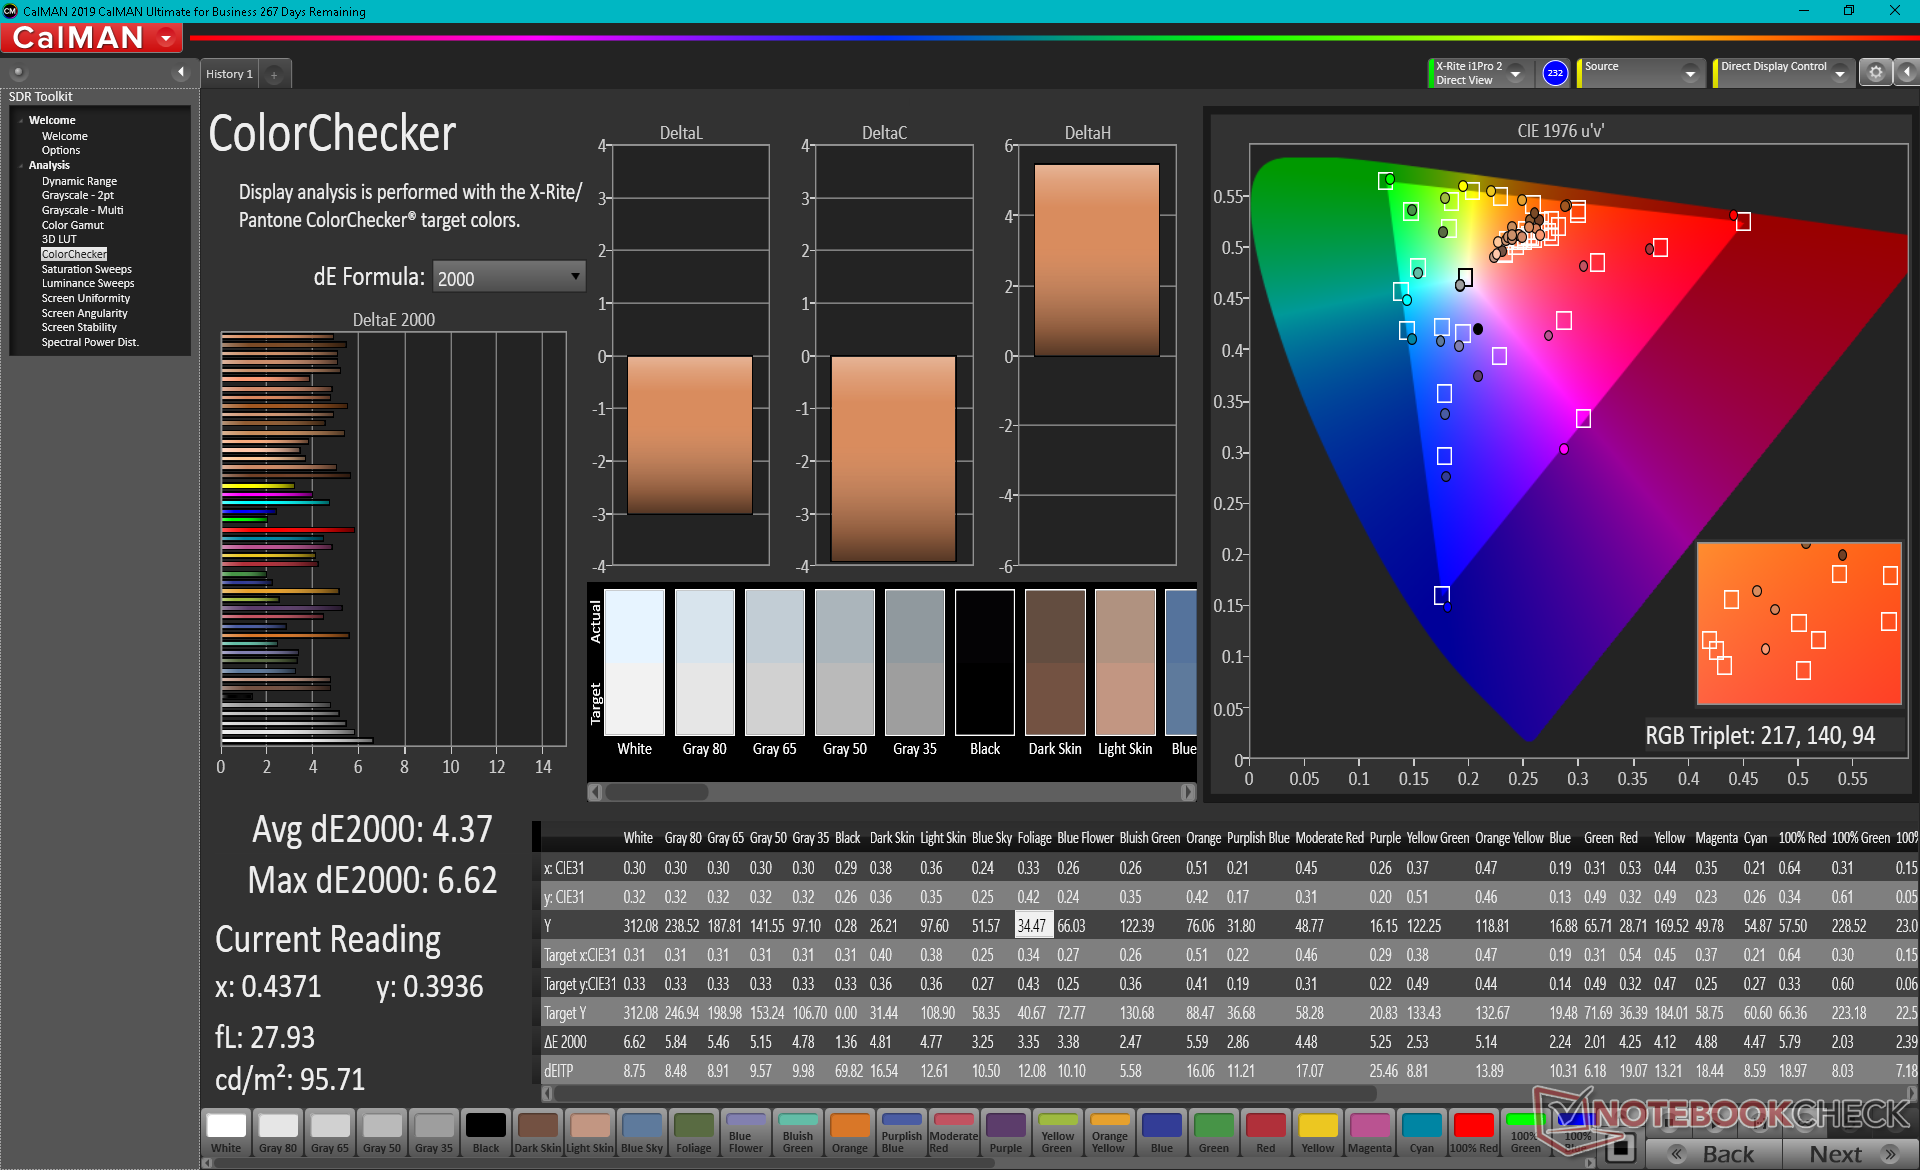
ΔE ColorChecker Calman: 4.37 | ∀{0.5-29.43 Ø4.72}
calibrated: 2.67
ΔE Greyscale Calman: 4.5 | ∀{0.09-98 Ø4.97}
91.4% sRGB (Argyll 1.6.3 3D)
59.2% AdobeRGB 1998 (Argyll 1.6.3 3D)
65.5% AdobeRGB 1998 (Argyll 3D)
91.8% sRGB (Argyll 3D)
64.3% Display P3 (Argyll 3D)
Gamma: 2.4
CCT: 7418 K
| Razer Blade 15 Base Edition 2021, i7-10750H RTX 3060 BOE NV156FHM-N4K, IPS, 15.6", 1920x1080 | Razer Blade 15 RTX 2070 Super Max-Q AU Optronics B156HAN12.0, IPS, 15.6", 1920x1080 | Asus ROG Strix G15 G513QR LQ156M1JW25, IPS, 15.6", 1920x1080 | MSI GS66 Stealth 10UG AU Optronics B156HAN12.0, IPS, 15.6", 1920x1080 | MSI GF65 Thin 10UE AU Optronics B156HAN08.4, IPS, 15.6", 1920x1080 | Asus ROG Zephyrus M15 GU502LU-BI7N4 Panda LM156LF-2F01, IPS, 15.6", 1920x1080 | |
|---|---|---|---|---|---|---|
| Display | 8% | 4% | 6% | -40% | -38% | |
| Display P3 Coverage (%) | 64.3 | 69.4 8% | 67.7 5% | 67.7 5% | 37.65 -41% | 39.32 -39% |
| sRGB Coverage (%) | 91.8 | 98.8 8% | 94.3 3% | 98.4 7% | 56.3 -39% | 59.1 -36% |
| AdobeRGB 1998 Coverage (%) | 65.5 | 70.5 8% | 68.2 4% | 69.1 5% | 38.9 -41% | 40.65 -38% |
| Response Times | 42% | 8% | -40% | -267% | -176% | |
| Response Time Grey 50% / Grey 80% * (ms) | 8.8 ? | 3.2 ? 64% | 8.2 ? 7% | 14.4 ? -64% | 36.8 ? -318% | 26 ? -195% |
| Response Time Black / White * (ms) | 10 ? | 8 ? 20% | 9.2 ? 8% | 11.6 ? -16% | 31.6 ? -216% | 25.6 ? -156% |
| PWM Frequency (Hz) | 1000 ? | |||||
| Screen | 10% | 10% | 14% | -26% | -30% | |
| Brightness middle (cd/m²) | 317.2 | 345.4 9% | 308 -3% | 259.5 -18% | 266.5 -16% | 282.5 -11% |
| Brightness (cd/m²) | 306 | 342 12% | 288 -6% | 264 -14% | 262 -14% | 260 -15% |
| Brightness Distribution (%) | 89 | 90 1% | 86 -3% | 90 1% | 91 2% | 86 -3% |
| Black Level * (cd/m²) | 0.31 | 0.34 -10% | 0.23 26% | 0.25 19% | 0.18 42% | 0.34 -10% |
| Contrast (:1) | 1023 | 1016 -1% | 1339 31% | 1038 1% | 1481 45% | 831 -19% |
| Colorchecker dE 2000 * | 4.37 | 3.18 27% | 3.28 25% | 2.52 42% | 5.33 -22% | 4.89 -12% |
| Colorchecker dE 2000 max. * | 6.62 | 6.57 1% | 8.51 -29% | 5.55 16% | 18.28 -176% | 17.46 -164% |
| Colorchecker dE 2000 calibrated * | 2.67 | 1.77 34% | 0.83 69% | 1.93 28% | 4.36 -63% | 4.75 -78% |
| Greyscale dE 2000 * | 4.5 | 3.8 16% | 5 -11% | 1.7 62% | 4.5 -0% | 2.2 51% |
| Gamma | 2.4 92% | 2.15 102% | 2.057 107% | 2.04 108% | 2.35 94% | 2.14 103% |
| CCT | 7418 88% | 7109 91% | 7393 88% | 6414 101% | 6289 103% | 6850 95% |
| Color Space (Percent of AdobeRGB 1998) (%) | 59.2 | 64.3 9% | 68 15% | 63.3 7% | 35.6 -40% | 37.2 -37% |
| Color Space (Percent of sRGB) (%) | 91.4 | 99 8% | 90 -2% | 98.8 8% | 55.8 -39% | 58.5 -36% |
| Media total (Programa/Opciones) | 20% /
13% | 7% /
9% | -7% /
6% | -111% /
-59% | -81% /
-50% |
* ... más pequeño es mejor
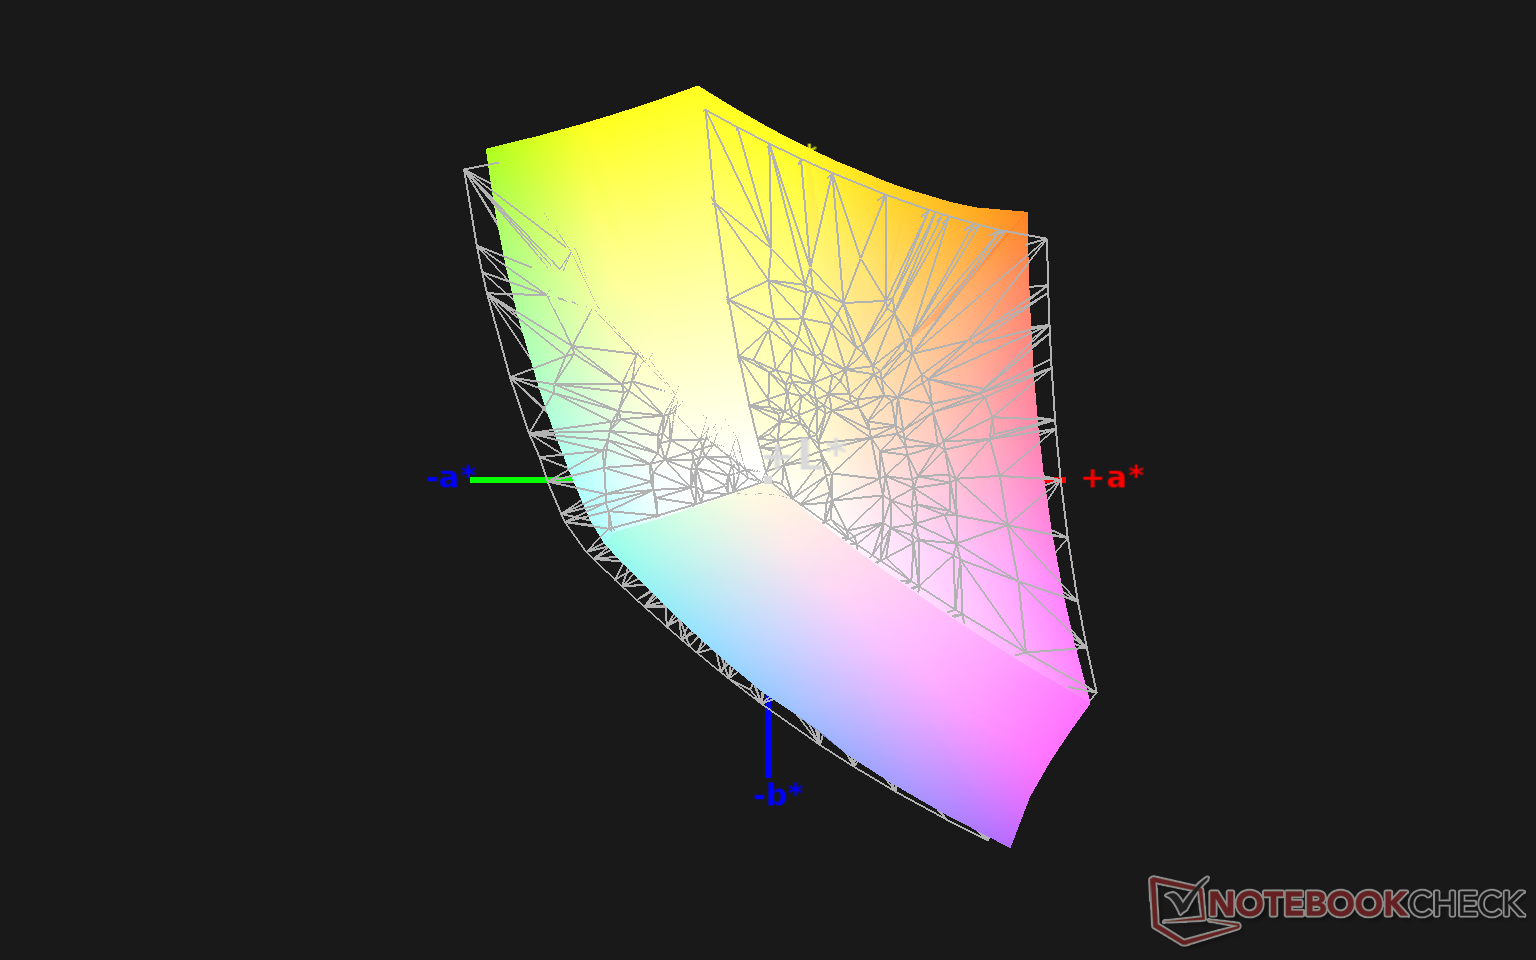
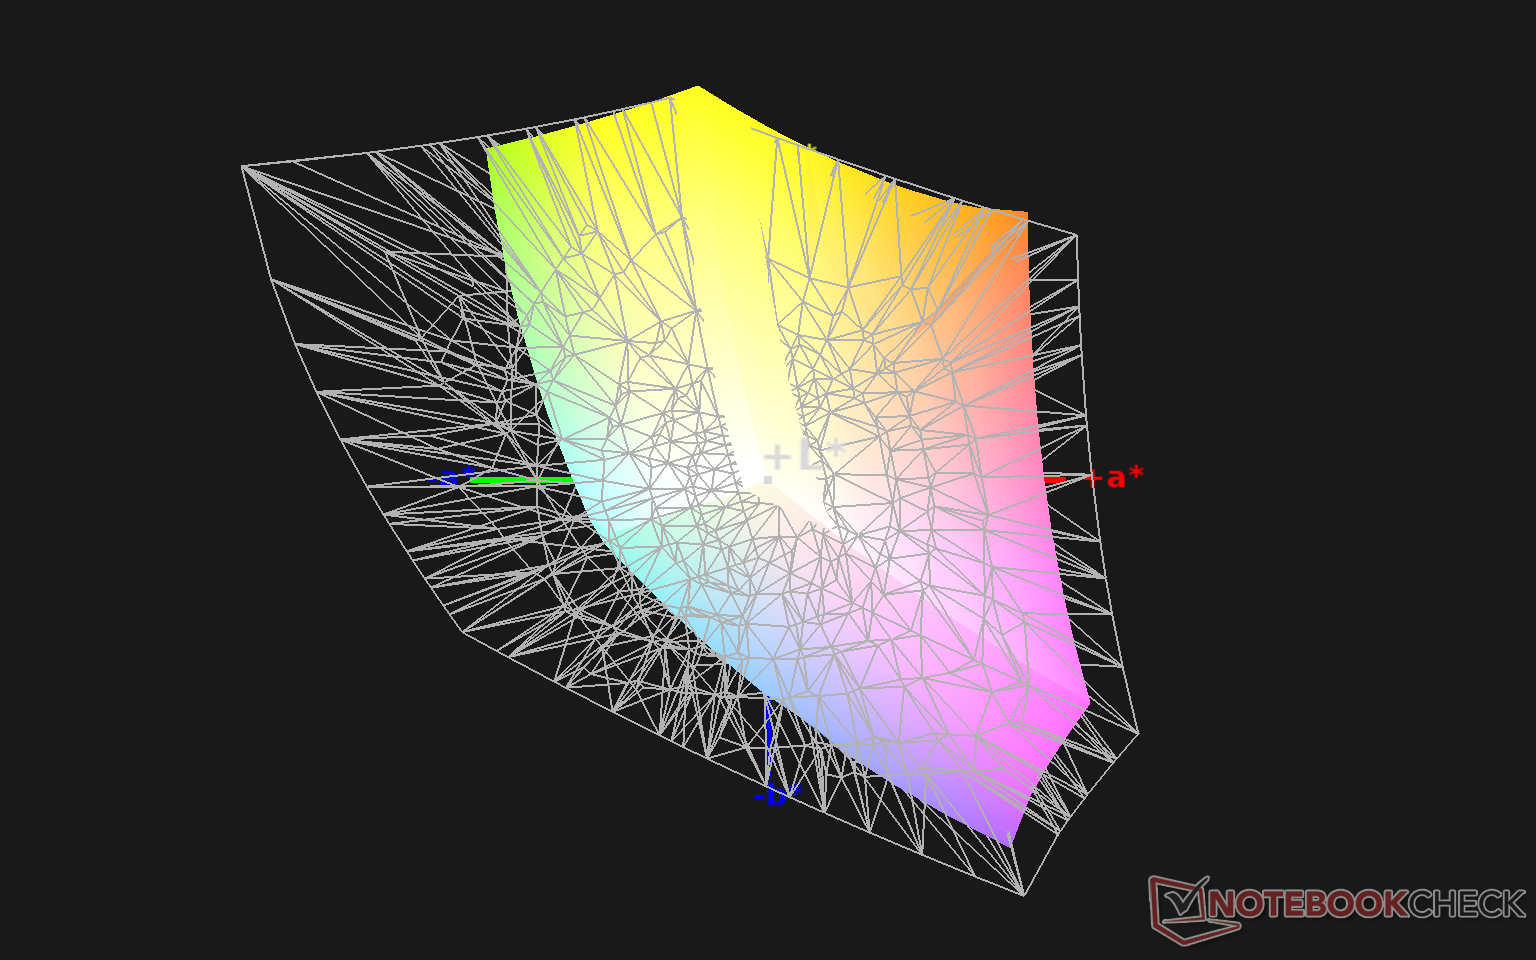
El espacio de color cubre más del 90 por ciento de sRGB, como en la mayoría de los portátiles para juegos de gama media y alta. Portátiles más baratos como el MSI GF65 o el Asus Zephyrus M15 GU502 pueden cubrir sólo el 60% de sRGB en comparación. Para colores más profundos, los usuarios tendrían que considerar la configuración 4K OLED más cara.
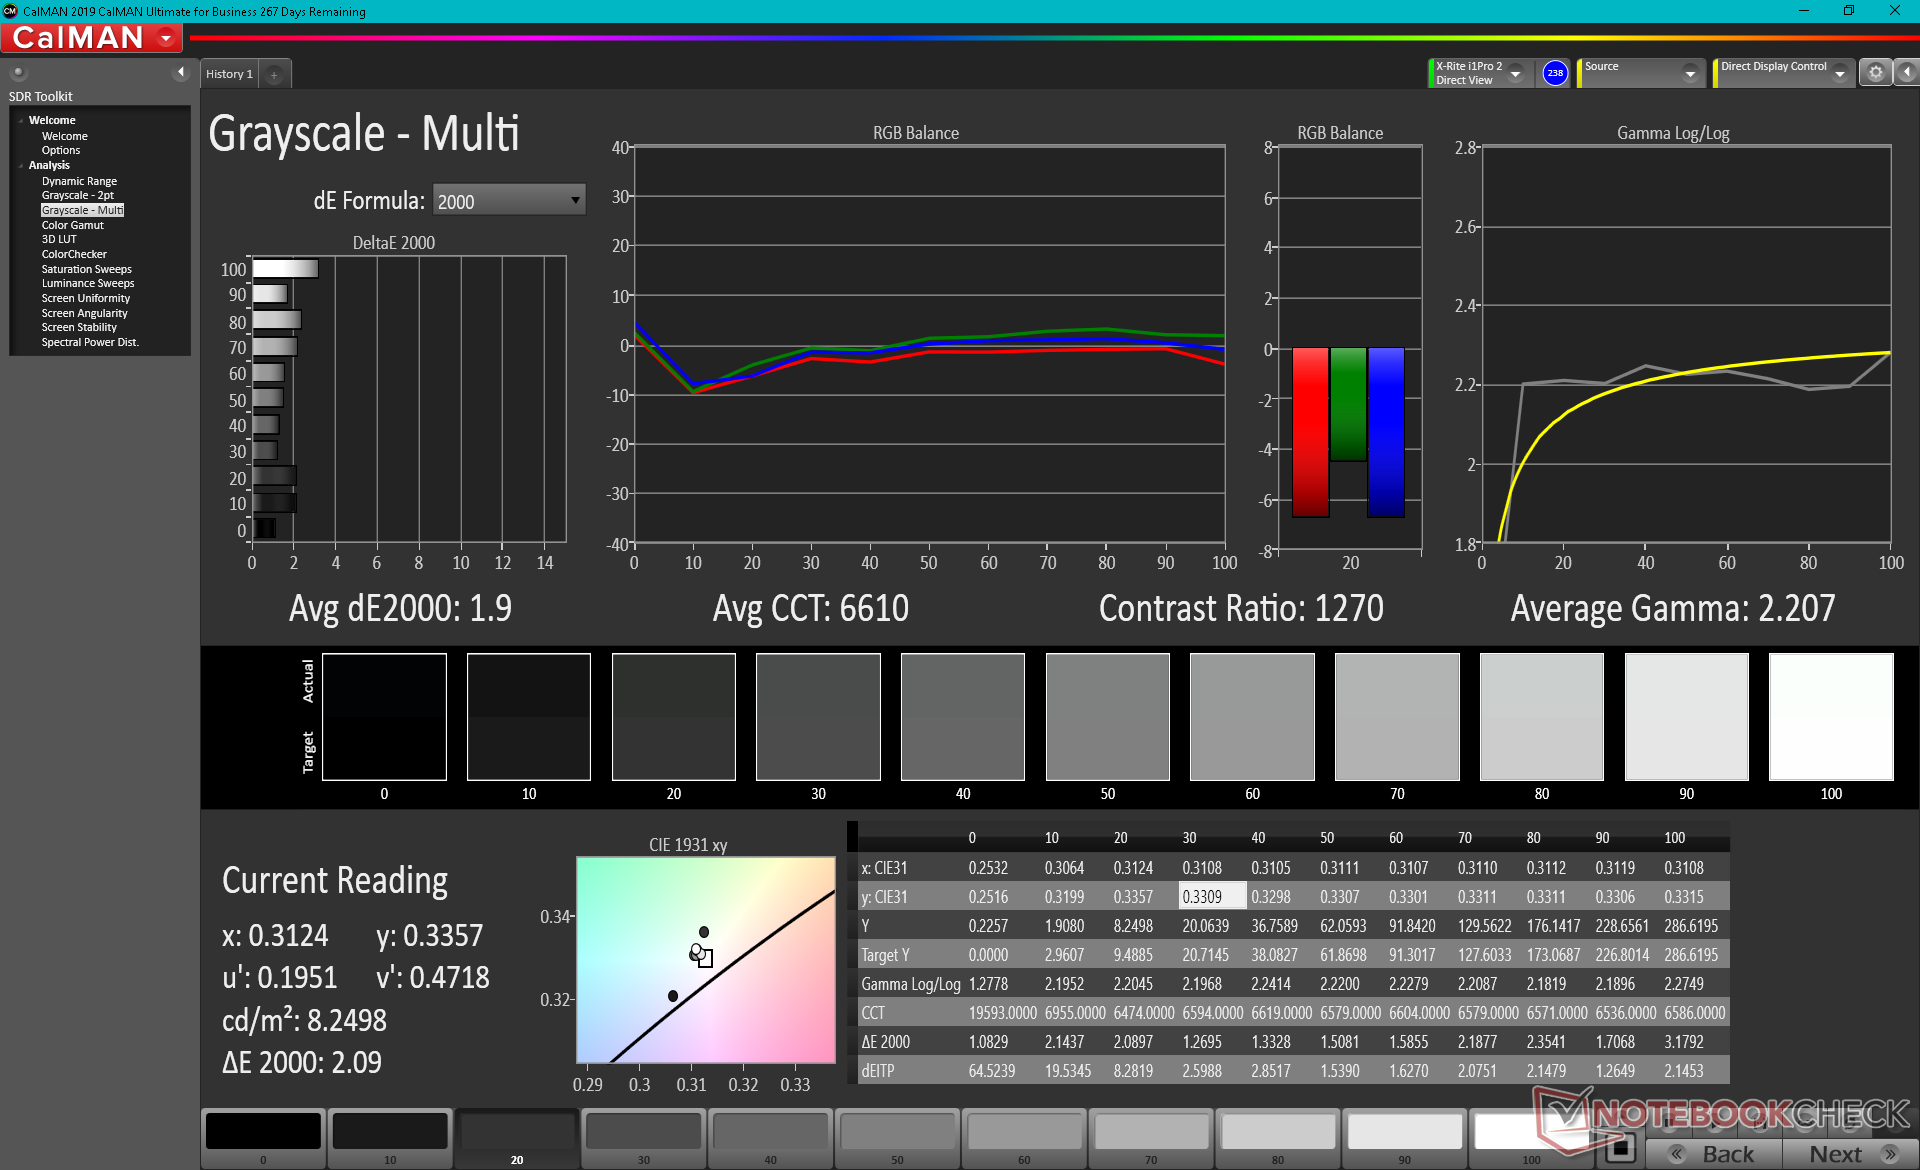
Las mediciones del colorímetro X-Rite muestran que la temperatura del color es demasiado fría al sacarlo de la caja. Después de calibrar el panel nosotros mismos, el promedio de DeltaE en escala de grises disminuiría de 4,5 a sólo 1,9 y la precisión del color mejoraría posteriormente en todos los ámbitos.

Tiempos de respuesta del display
| ↔ Tiempo de respuesta de Negro a Blanco | ||
|---|---|---|
| 10 ms ... subida ↗ y bajada ↘ combinada | ↗ 5.6 ms subida | 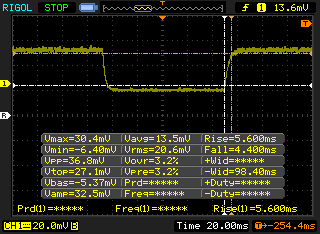 |
| ↘ 4.4 ms bajada | ||
| La pantalla mostró buenos tiempos de respuesta en nuestros tests pero podría ser demasiado lenta para los jugones competitivos. En comparación, todos los dispositivos de prueba van de ##min### (mínimo) a 240 (máximo) ms. » 27 % de todos los dispositivos son mejores. Esto quiere decir que el tiempo de respuesta medido es mejor que la media (19.9 ms) de todos los dispositivos testados. | ||
| ↔ Tiempo de respuesta 50% Gris a 80% Gris | ||
| 8.8 ms ... subida ↗ y bajada ↘ combinada | ↗ 4.4 ms subida | 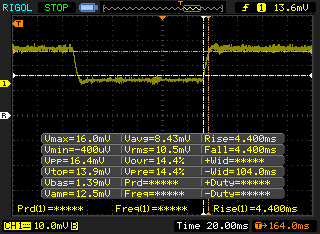 |
| ↘ 4.4 ms bajada | ||
| La pantalla mostró tiempos de respuesta rápidos en nuestros tests y debería ser adecuada para juegos. En comparación, todos los dispositivos de prueba van de ##min### (mínimo) a 636 (máximo) ms. » 22 % de todos los dispositivos son mejores. Esto quiere decir que el tiempo de respuesta medido es mejor que la media (31.1 ms) de todos los dispositivos testados. | ||
Parpadeo de Pantalla / PWM (Pulse-Width Modulation)
| Parpadeo de Pantalla / PWM detectado | 1000 Hz | ≤ 99 % de brillo | 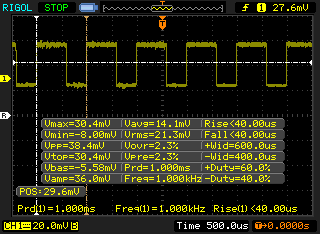 |
La retroiluminación del display parpadea a 1000 Hz (seguramente usa PWM - Pulse-Width Modulation) a un brillo del 99 % e inferior. Sobre este nivel de brillo no debería darse parpadeo / PWM. La frecuencia de 1000 Hz es bastante alta, por lo que la mayoría de gente sensible al parpadeo no debería ver parpadeo o tener fatiga visual. Comparación: 52 % de todos los dispositivos testados no usaron PWM para atenuar el display. Si se usó, medimos una media de 7784 (mínimo: 5 - máxmo: 343500) Hz. | |||
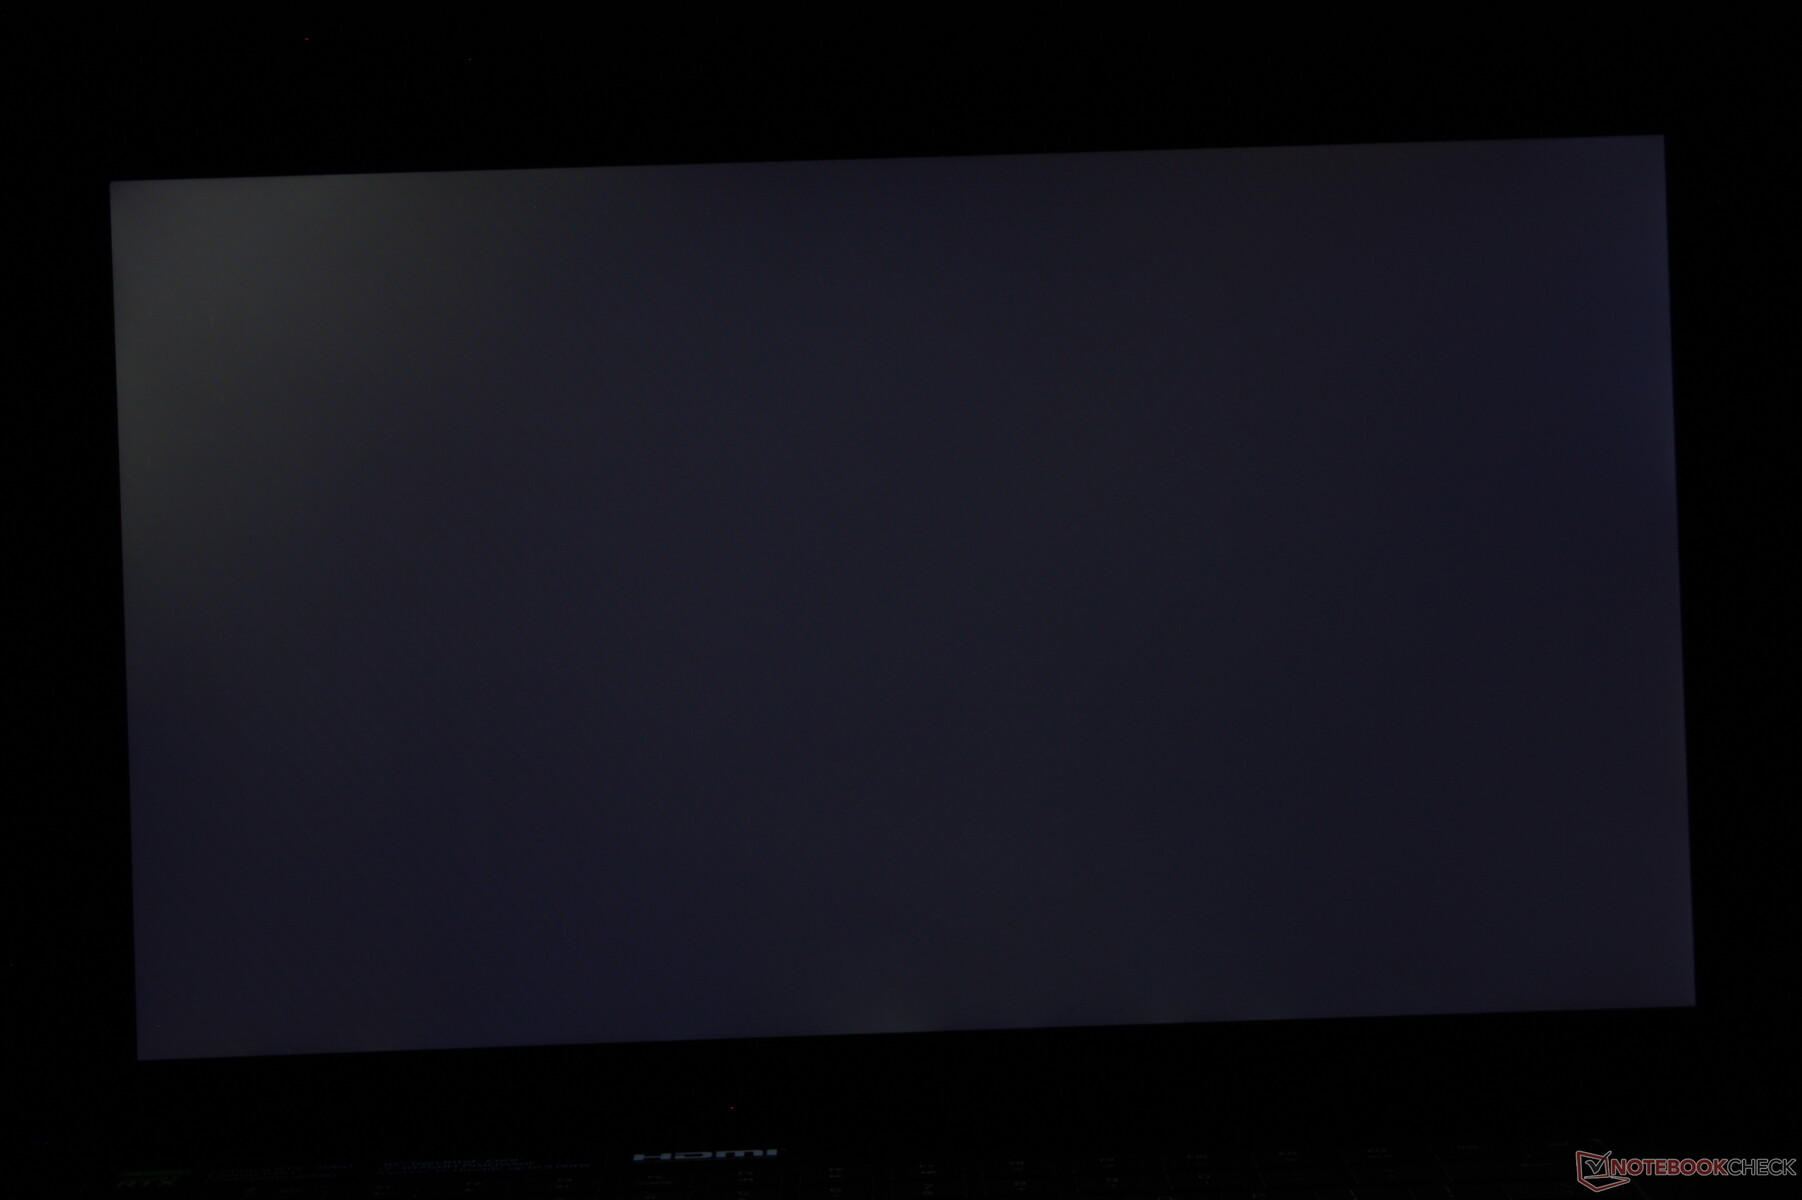
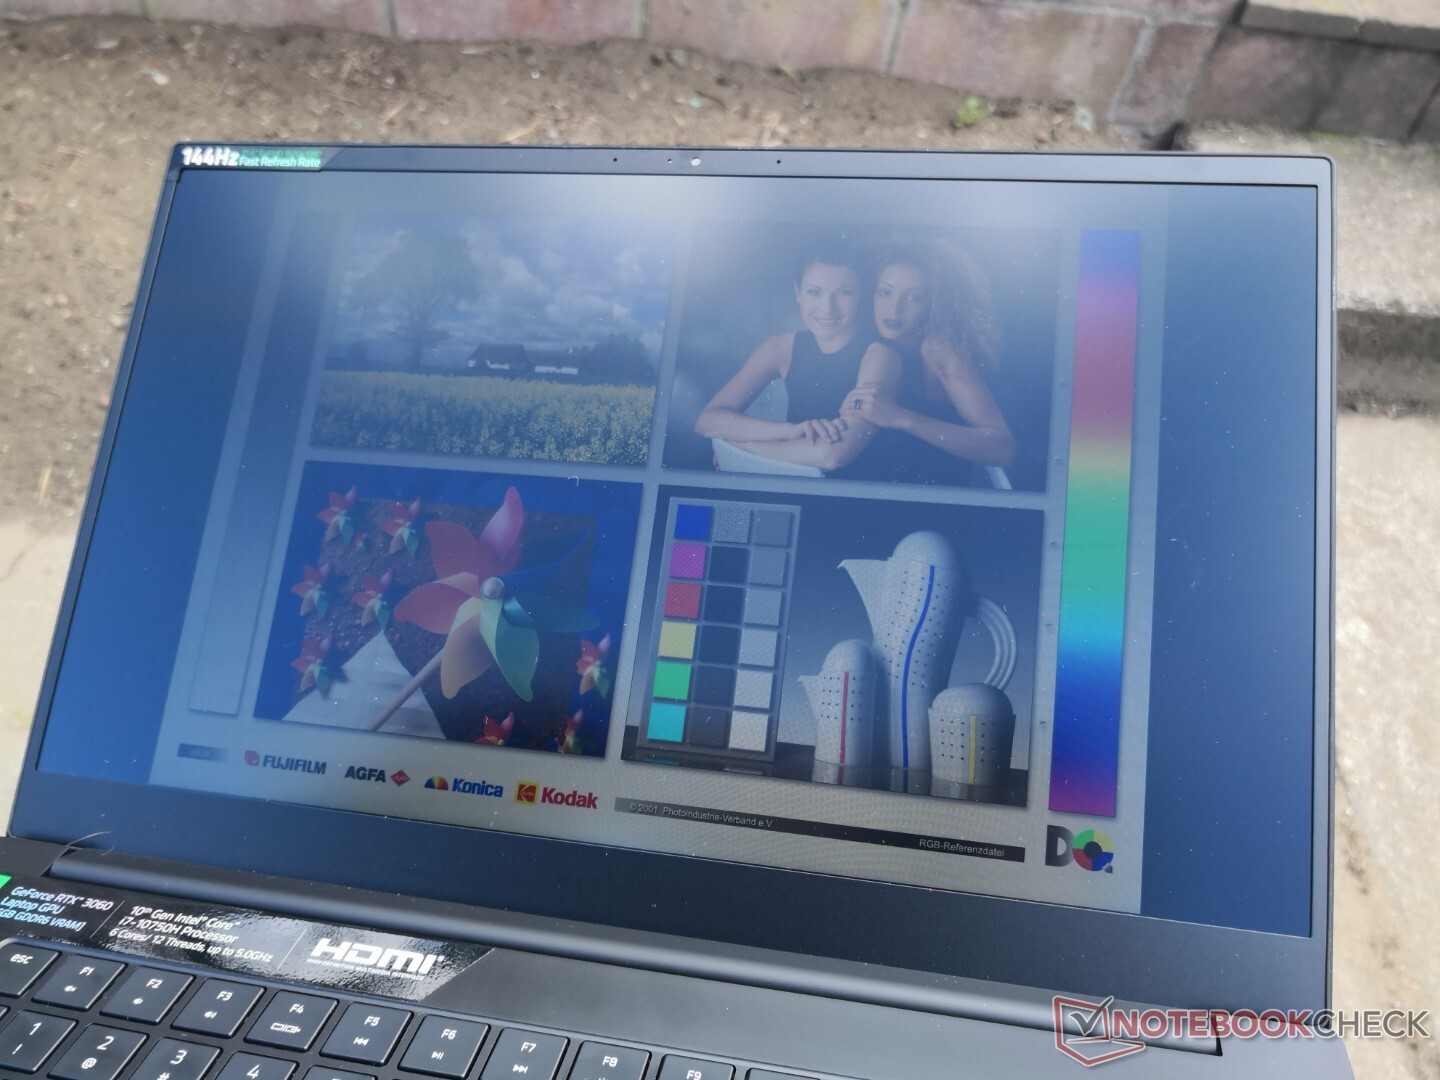
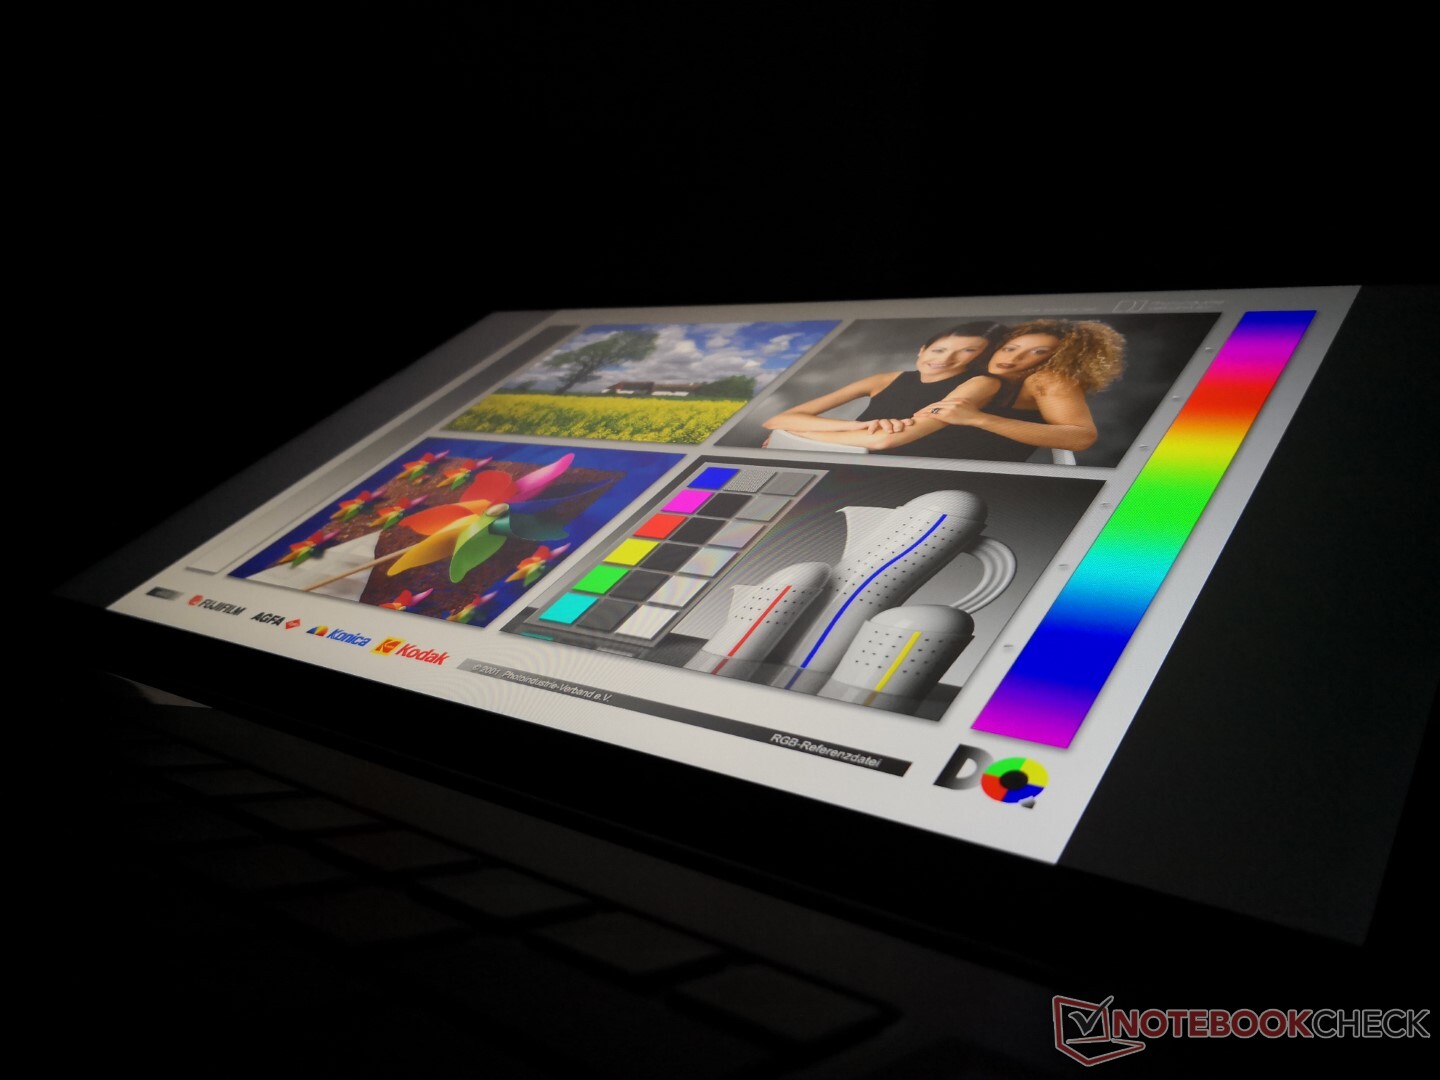
La visibilidad en exteriores es decente sólo cuando está a la sombra, ya que la pantalla no es lo suficientemente brillante como para superar la luz solar directa. La opción de pantalla táctil OLED brillante puede ser ligeramente más brillante que nuestra opción mate, pero esto probablemente se verá compensado por el inevitable aumento de los reflejos.
Rendimiento
Razer solo ofrece opciones de CPU Core i7-10750H y Core i7-10875H sin Core i5 ni Core i9 para "diluir" la serie. Las opciones Max-Q también han desaparecido, ya que Nvidia ha abandonado por completo el apelativo de Ampere móvil.
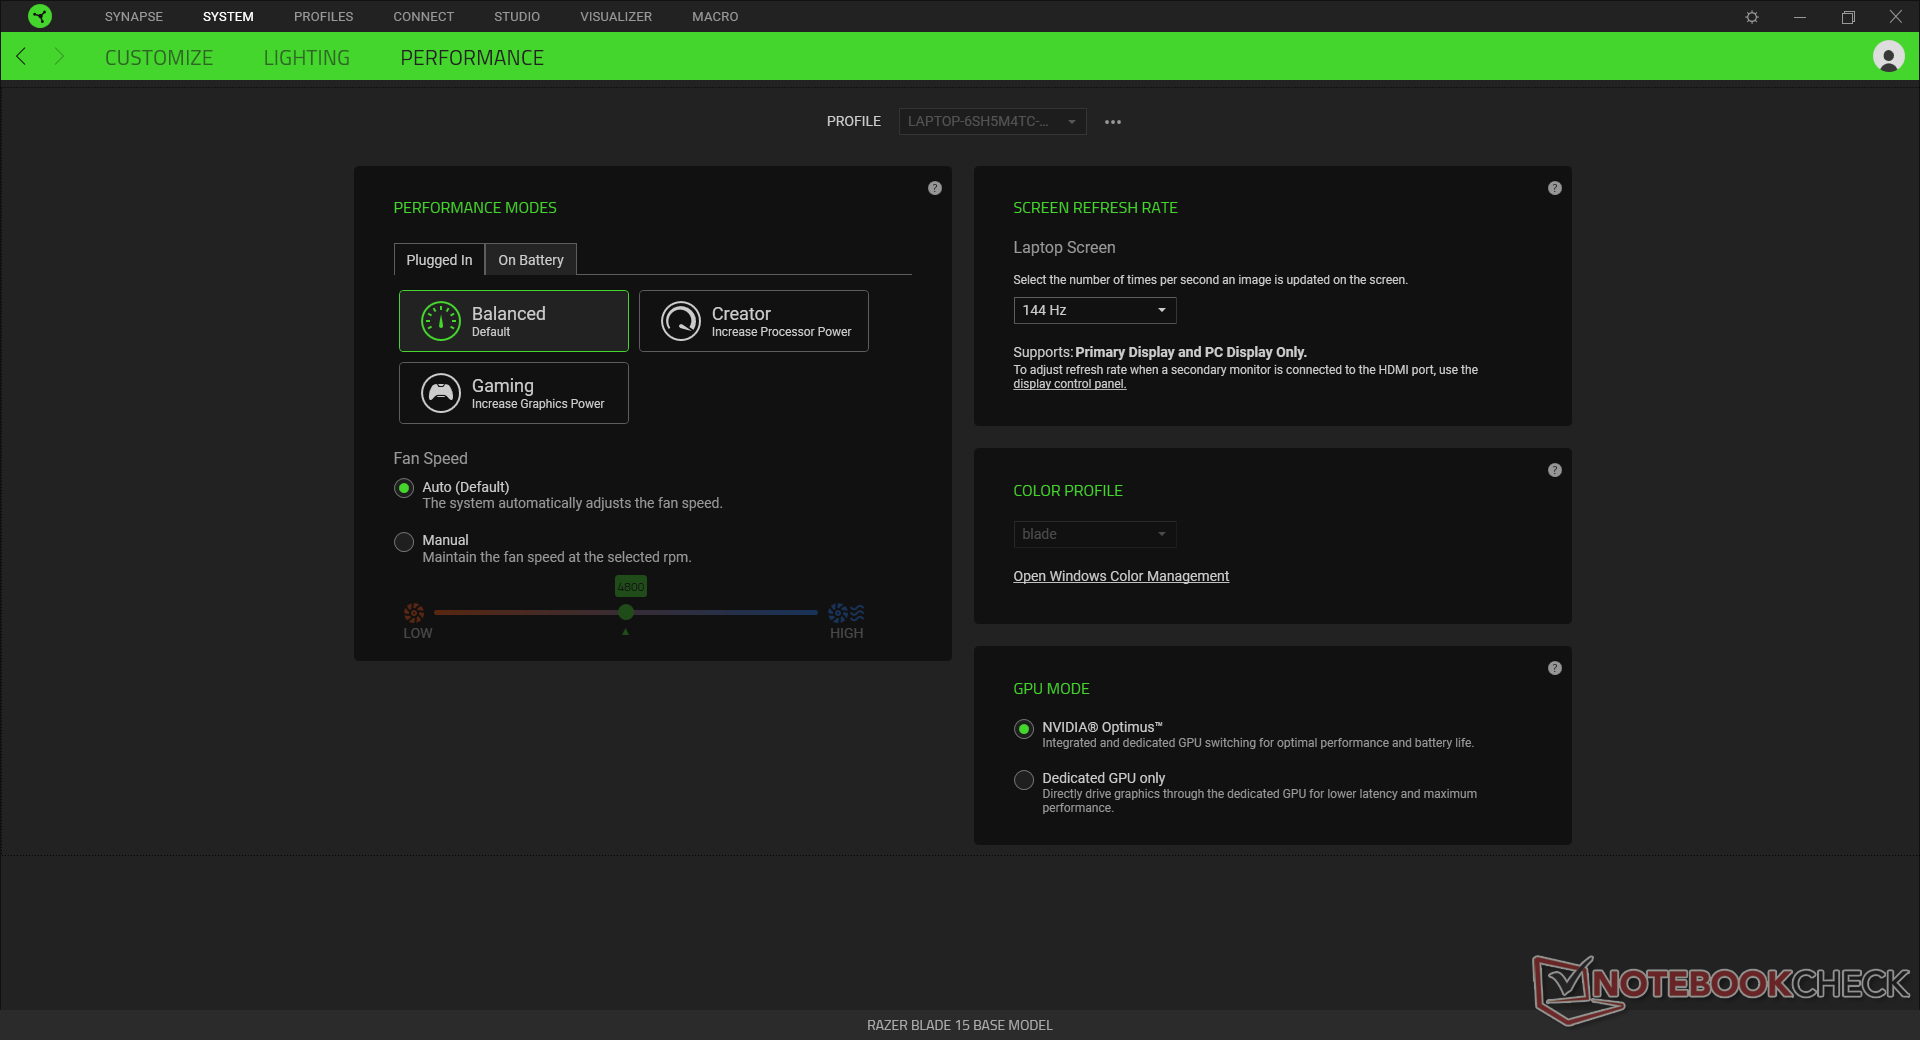
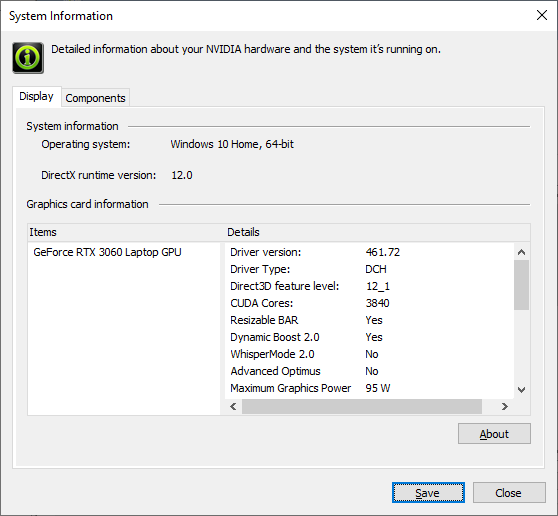
Nvidia Optimus viene de serie y G-Sync vuelve a no estar disponible en ninguna configuración. Sin embargo, la barra redimensionable ahora está soportada. La tasa de refresco nativa de 144 Hz funcionará sin importar qué GPU esté activa.
Recomendamos a los usuarios que se familiaricen con el software Synapse precargado, ya que muchas funciones específicas de Razer se encuentran aquí.
Procesador
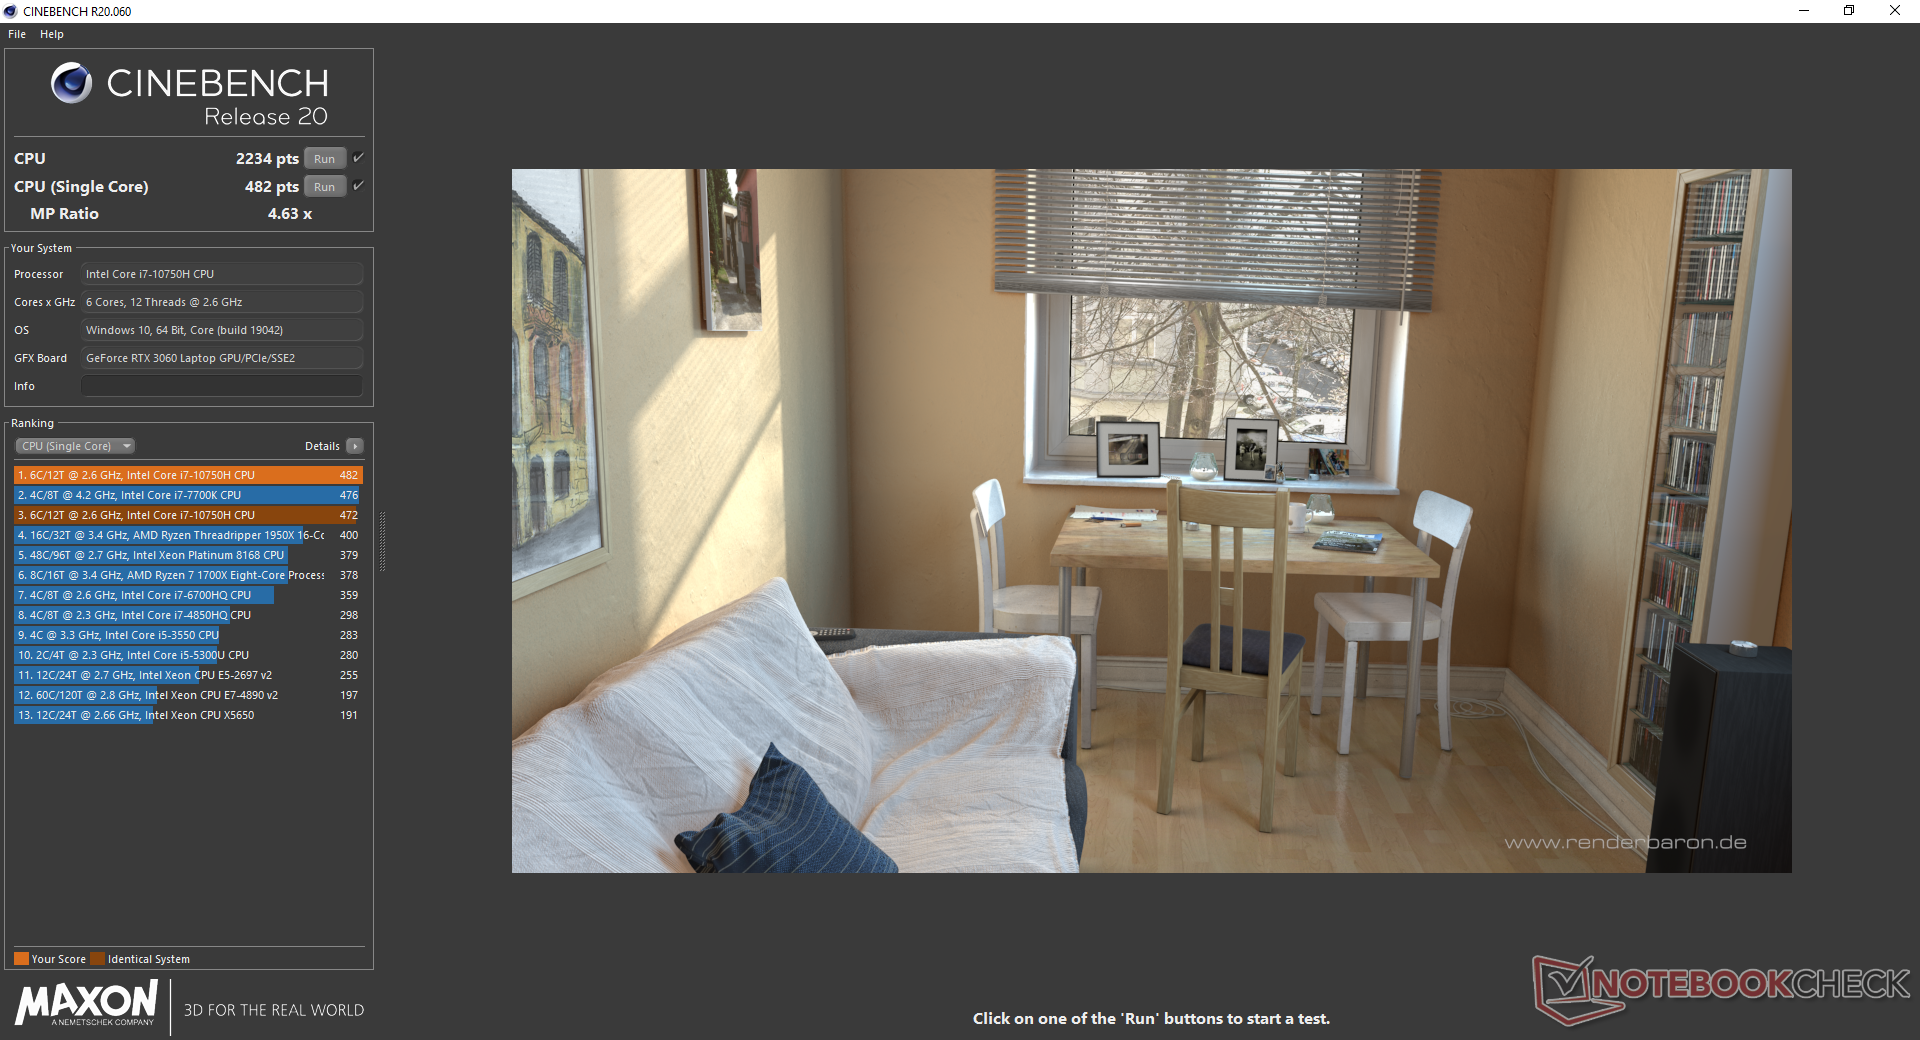
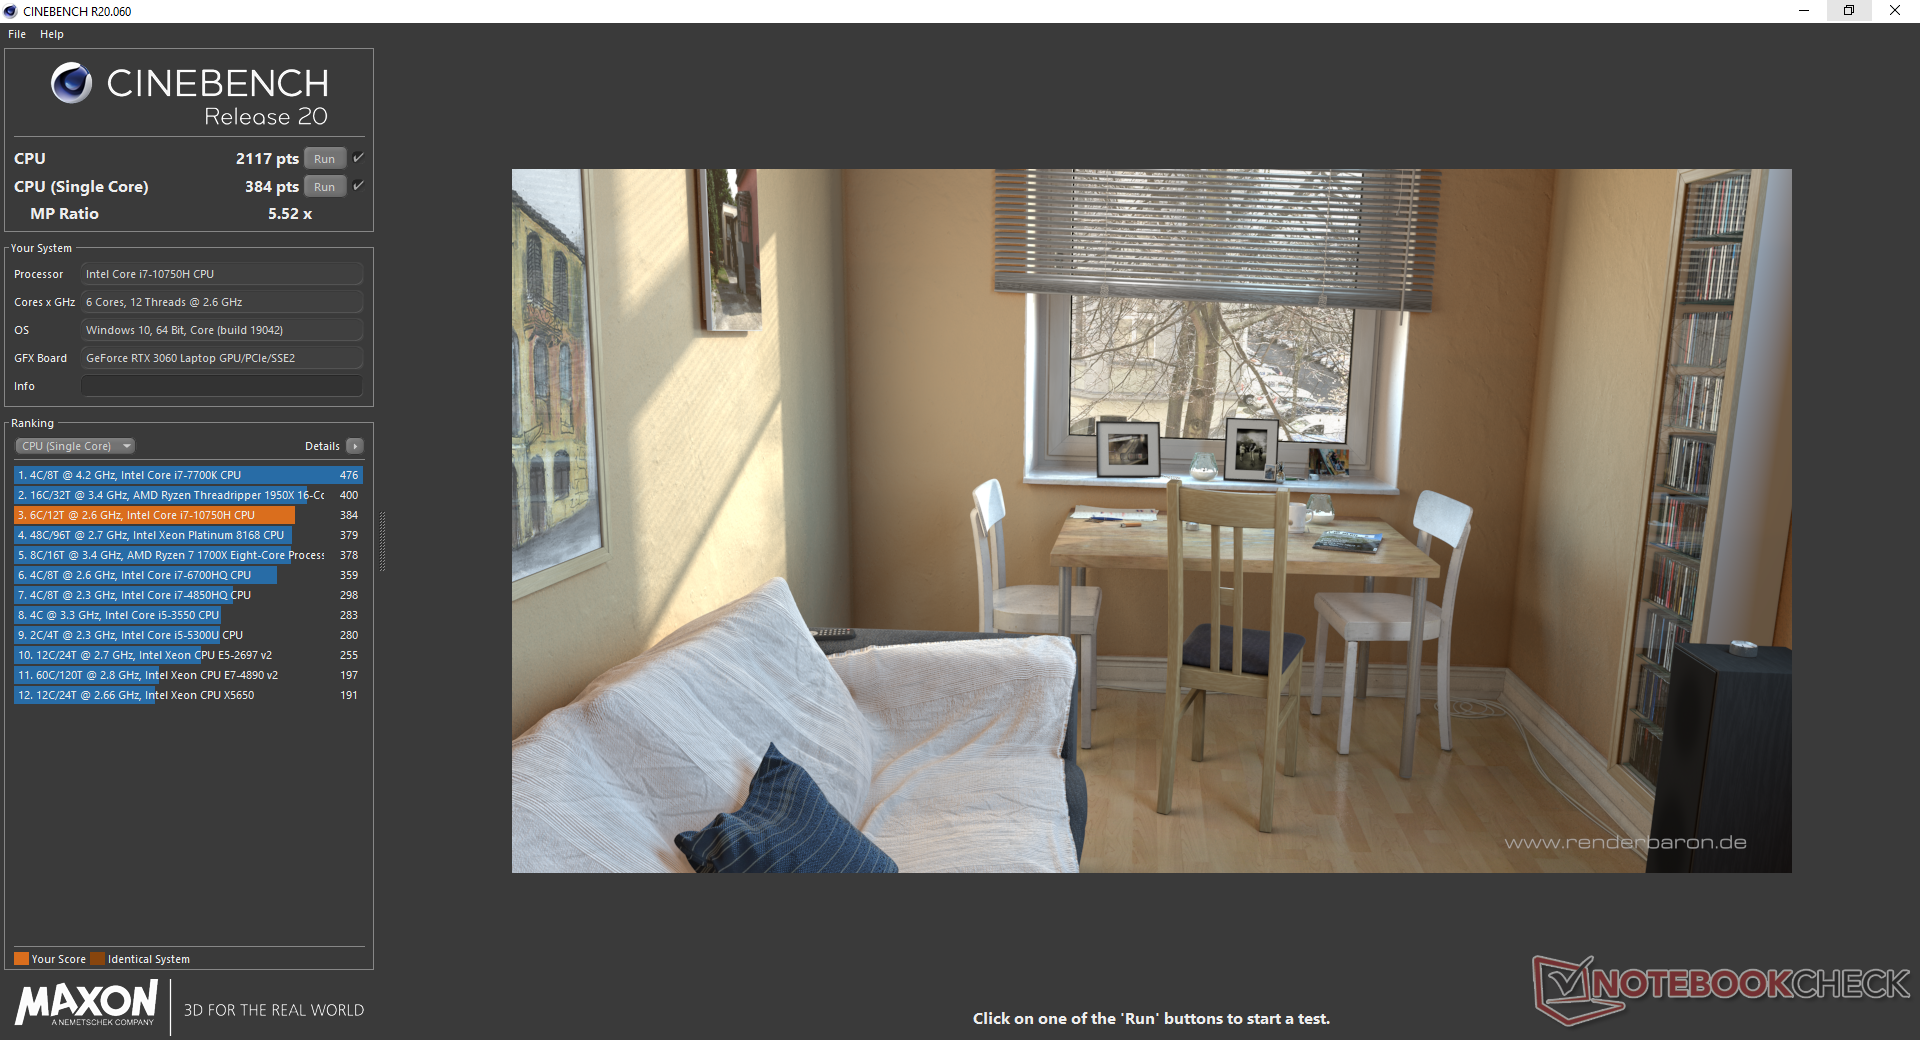
El rendimiento de la CPU depende del perfil de energía elegido -Equilibrado, Juego o Creador-, al que se puede acceder a través del software Razer Synapse. El rendimiento multihilo en modo Creador es aproximadamente un 10 por ciento más lento que el de un portátil medio con la misma CPU Core i7-10750H. Sin embargo, si está en modo Juego, el rendimiento multihilo caerá aún más, hasta un 17 por ciento según nuestra experiencia. La sostenibilidad de Turbo Boost tampoco es tan buena como esperábamos, como se detalla en nuestra sección de pruebas de estrés más abajo. La actualización al modelo Blade 15 Advanced con el octa-core Core i7-10875H puede aumentar el rendimiento del xT hasta en un 80 por ciento en este escenario.
| Perfil de potencia | Puntuación de CineBench R20 Multi-Thread | Puntuación multihilo de CineBench R20 |
|---|---|---|
| Modo equilibrado | 2234 | 482 |
| Modo de juego | 2117 | 384 |
| Modo creador | 2537 | 482 |

Cinebench R15: CPU Multi 64Bit | CPU Single 64Bit
Blender: v2.79 BMW27 CPU
7-Zip 18.03: 7z b 4 -mmt1 | 7z b 4
Geekbench 5.5: Single-Core | Multi-Core
HWBOT x265 Benchmark v2.2: 4k Preset
LibreOffice : 20 Documents To PDF
R Benchmark 2.5: Overall mean
| HWBOT x265 Benchmark v2.2 / 4k Preset | |
| Asus ROG Strix G15 G513QR | |
| Schenker XMG Core 15 Ampere | |
| Asus Zephyrus S15 GX502L | |
| MSI GS66 Stealth 10UG | |
| Acer Nitro 5 AN515-45-R05E | |
| Medio Intel Core i7-10750H (5.54 - 11.6, n=43) | |
| Schenker XMG Pro 15 | |
| Razer Blade 15 Base Edition 2021, i7-10750H RTX 3060 | |
| Dell G5 15 5500 09E2 | |
| LibreOffice / 20 Documents To PDF | |
| Dell G5 15 5500 09E2 | |
| Schenker XMG Core 15 Ampere | |
| Acer Nitro 5 AN515-45-R05E | |
| Medio Intel Core i7-10750H (43.1 - 99.2, n=43) | |
| Asus ROG Strix G15 G513QR | |
| MSI GS66 Stealth 10UG | |
| Razer Blade 15 Base Edition 2021, i7-10750H RTX 3060 | |
| Asus Zephyrus S15 GX502L | |
| R Benchmark 2.5 / Overall mean | |
| Schenker XMG Pro 15 | |
| Dell G5 15 5500 09E2 | |
| Razer Blade 15 Base Edition 2021, i7-10750H RTX 3060 | |
| Medio Intel Core i7-10750H (0.578 - 0.708, n=42) | |
| Asus Zephyrus S15 GX502L | |
| MSI GS66 Stealth 10UG | |
| Schenker XMG Core 15 Ampere | |
| Acer Nitro 5 AN515-45-R05E | |
| Asus ROG Strix G15 G513QR | |
* ... más pequeño es mejor
Rendimiento del sistema
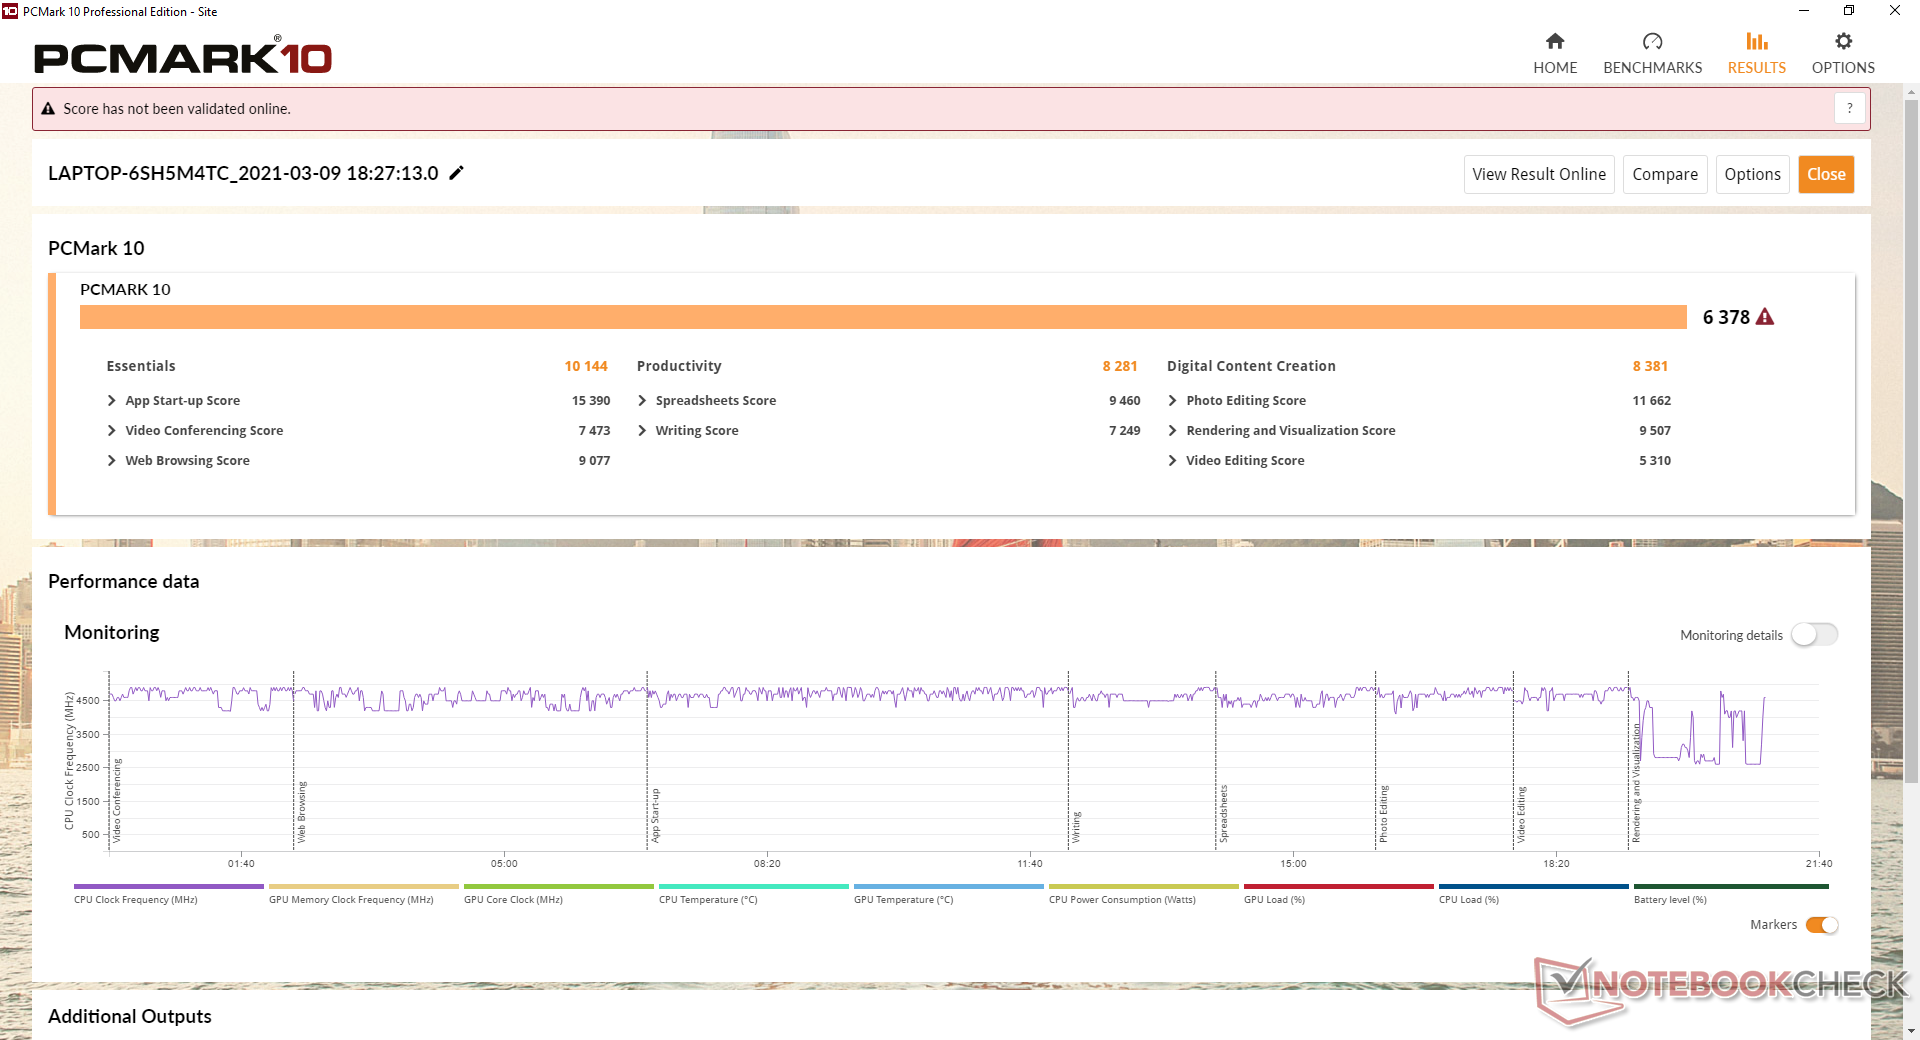
Los resultados de PCMark están ligeramente por debajo del Blade 15 RTX 2070 Max-Q, probablemente debido a la opción más rápida del octa-core Core i7-10875H para el modelo Advanced.
Experimentamos algunos problemas con el software Razer Synapse, donde el programa se colgaba a menudo si se desconectaba de internet. Esto es algo que hemos visto en toda la familia Blade y no sólo en este modelo Blade 15 en particular.
| PCMark 10 Score | 6378 puntos | |
ayuda | ||
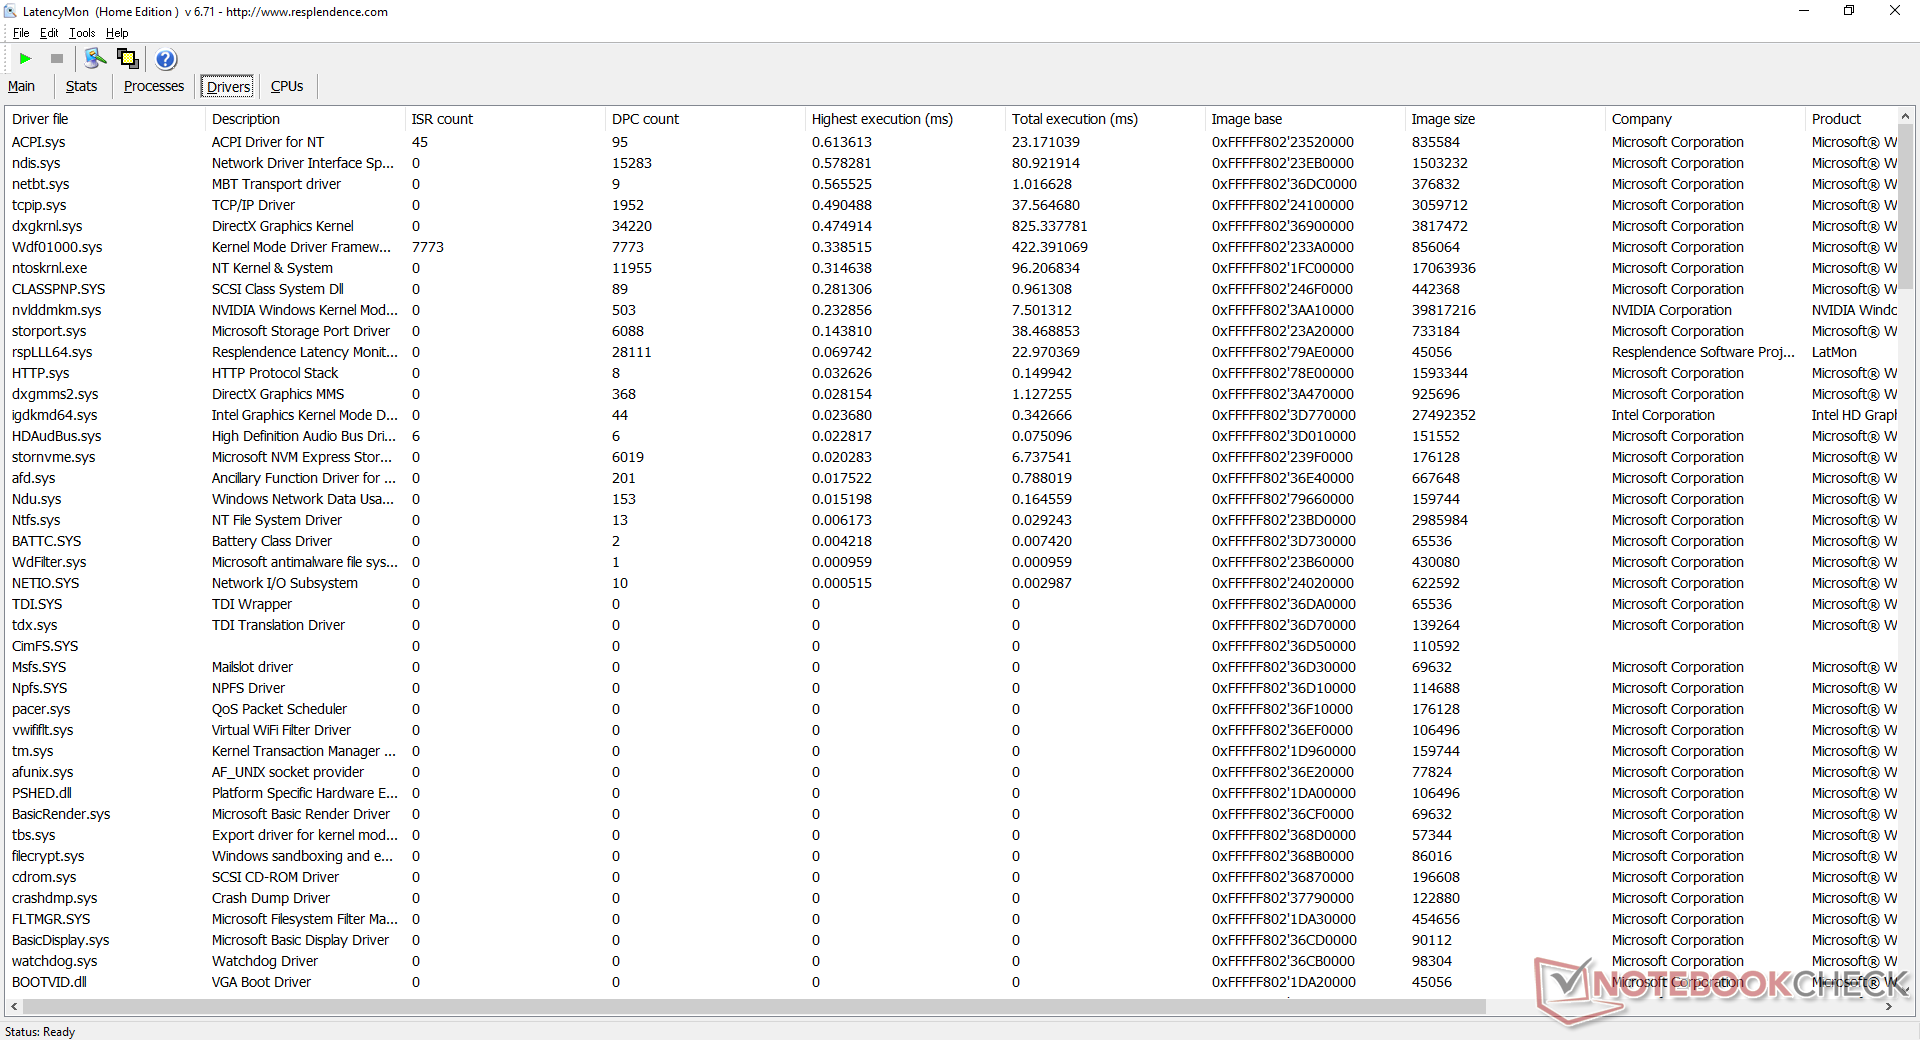
Latencia del CPD
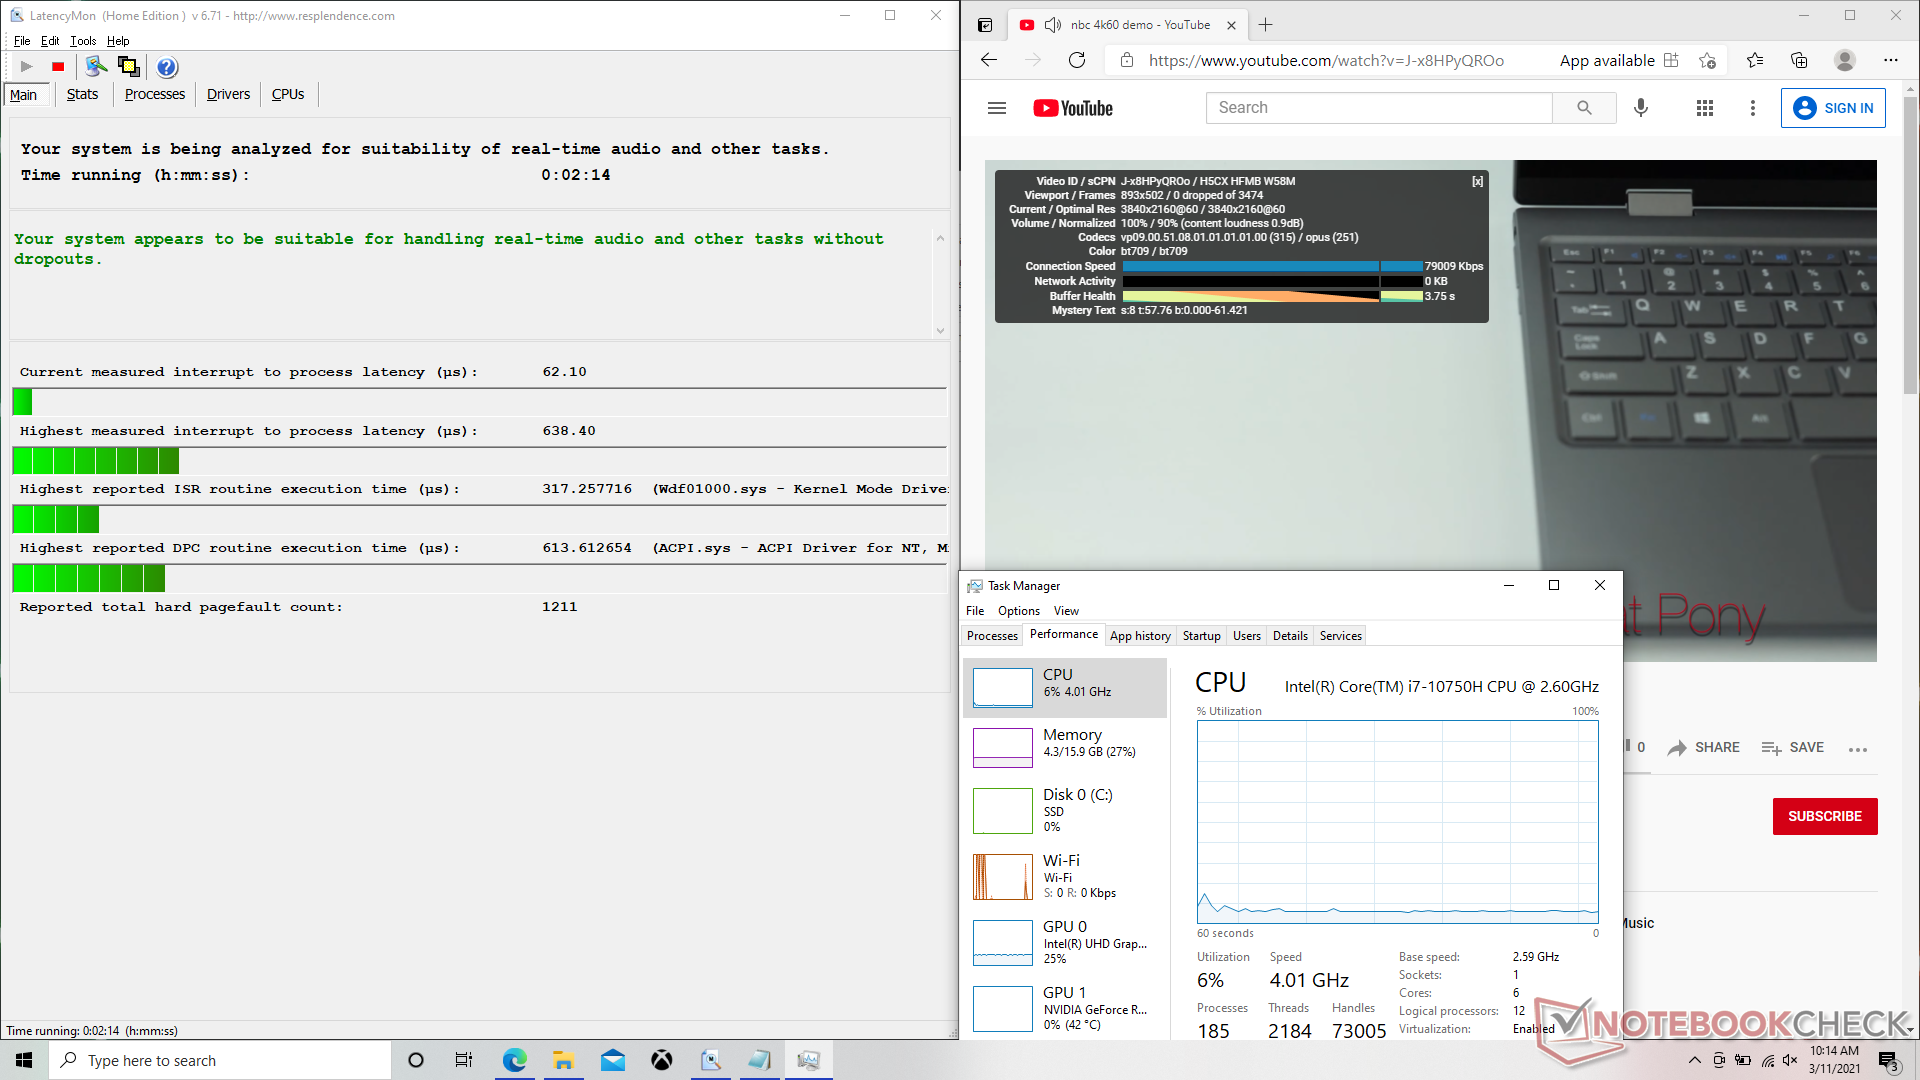
LatencyMon no muestra problemas de latencia del CPD al abrir varias pestañas del navegador en nuestra página web. La reproducción de vídeo 4K a 60 FPS también es fluida y sin pérdida de fotogramas.
| DPC Latencies / LatencyMon - interrupt to process latency (max), Web, Youtube, Prime95 | |
| Asus ROG Zephyrus M15 GU502LU-BI7N4 | |
| Razer Blade 15 RTX 2070 Super Max-Q | |
| MSI GF65 Thin 10UE | |
| MSI GS66 Stealth 10UG | |
| Razer Blade 15 Base Edition 2021, i7-10750H RTX 3060 | |
| Asus ROG Strix G15 G513QR | |
* ... más pequeño es mejor
Dispositivos de almacenamiento
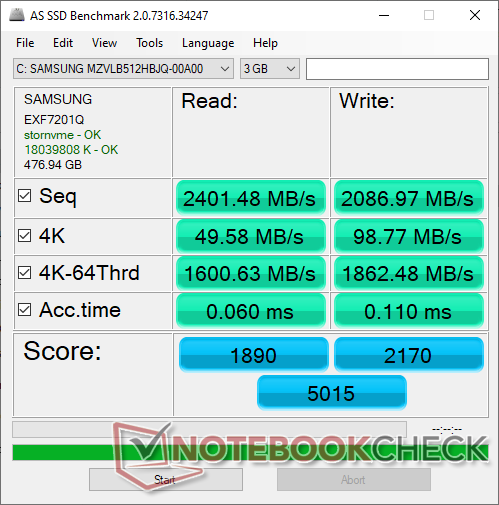
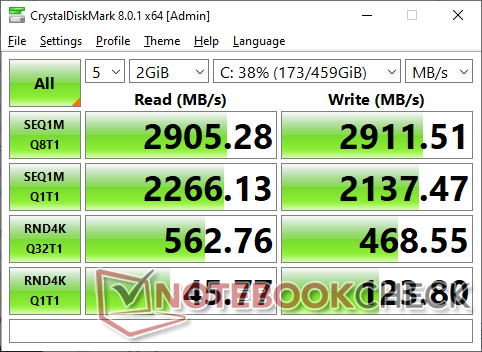
| Razer Blade 15 Base Edition 2021, i7-10750H RTX 3060 Samsung SSD PM981a MZVLB512HBJQ | Razer Blade 15 RTX 2070 Super Max-Q Samsung SSD PM981a MZVLB512HBJQ | MSI GS66 Stealth 10UG WDC PC SN730 SDBPNTY-1T00 | MSI GF65 Thin 10UE Samsung SSD PM981 MZVLB1T0HALR | Dell G5 15 5500 09E2 Toshiba KBG40ZNS512G NVMe | |
|---|---|---|---|---|---|
| AS SSD | -3% | 6% | 10% | -79% | |
| Seq Read (MB/s) | 2401 | 1957 -18% | 2198 -8% | 3002 25% | 1776 -26% |
| Seq Write (MB/s) | 2087 | 2092 0% | 2596 24% | 2420 16% | 721 -65% |
| 4K Read (MB/s) | 49.58 | 50.2 1% | 43.81 -12% | 48.46 -2% | 38.58 -22% |
| 4K Write (MB/s) | 98.8 | 96.5 -2% | 115.5 17% | 114.3 16% | 70.9 -28% |
| 4K-64 Read (MB/s) | 1601 | 1594 0% | 1692 6% | 1873 17% | 945 -41% |
| 4K-64 Write (MB/s) | 1862 | 2005 8% | 2162 16% | 1882 1% | 191.8 -90% |
| Access Time Read * (ms) | 0.06 | 0.057 5% | 0.056 7% | 0.045 25% | 0.111 -85% |
| Access Time Write * (ms) | 0.11 | 0.112 -2% | 0.098 11% | 0.101 8% | 0.588 -435% |
| Score Read (Points) | 1890 | 1840 -3% | 1956 3% | 2221 18% | 1161 -39% |
| Score Write (Points) | 2170 | 2310 6% | 2537 17% | 2238 3% | 335 -85% |
| Score Total (Points) | 5015 | 5103 2% | 5513 10% | 5565 11% | 2043 -59% |
| Copy ISO MB/s (MB/s) | 2206 | 1793 -19% | 2236 1% | 2421 10% | 1037 -53% |
| Copy Program MB/s (MB/s) | 694 | 573 -17% | 690 -1% | 705 2% | 429.7 -38% |
| Copy Game MB/s (MB/s) | 1555 | 1418 -9% | 1546 -1% | 1490 -4% | 892 -43% |
| CrystalDiskMark 5.2 / 6 | 5% | 5% | 2% | -34% | |
| Write 4K (MB/s) | 123.8 | 139.8 13% | 163.1 32% | 157.3 27% | 89.3 -28% |
| Read 4K (MB/s) | 45.53 | 48.62 7% | 48.97 8% | 46.69 3% | 41.42 -9% |
| Write Seq (MB/s) | 2132 | 2260 6% | 2607 22% | 2389 12% | 1182 -45% |
| Read Seq (MB/s) | 2067 | 2135 3% | 2316 12% | 2196 6% | 1532 -26% |
| Write 4K Q32T1 (MB/s) | 462.9 | 499.3 8% | 338 -27% | 407.6 -12% | 283.2 -39% |
| Read 4K Q32T1 (MB/s) | 553 | 552 0% | 475.6 -14% | 519 -6% | 353.2 -36% |
| Write Seq Q32T1 (MB/s) | 2955 | 2960 0% | 3090 5% | 2401 -19% | 1220 -59% |
| Read Seq Q32T1 (MB/s) | 3246 | 3269 1% | 3421 5% | 3344 3% | 2329 -28% |
| Write 4K Q8T8 (MB/s) | 288.1 | ||||
| Read 4K Q8T8 (MB/s) | 1049 | ||||
| Media total (Programa/Opciones) | 1% /
-0% | 6% /
6% | 6% /
7% | -57% /
-63% |
* ... más pequeño es mejor

Disk Throttling: DiskSpd Read Loop, Queue Depth 8
Rendimiento de la GPU
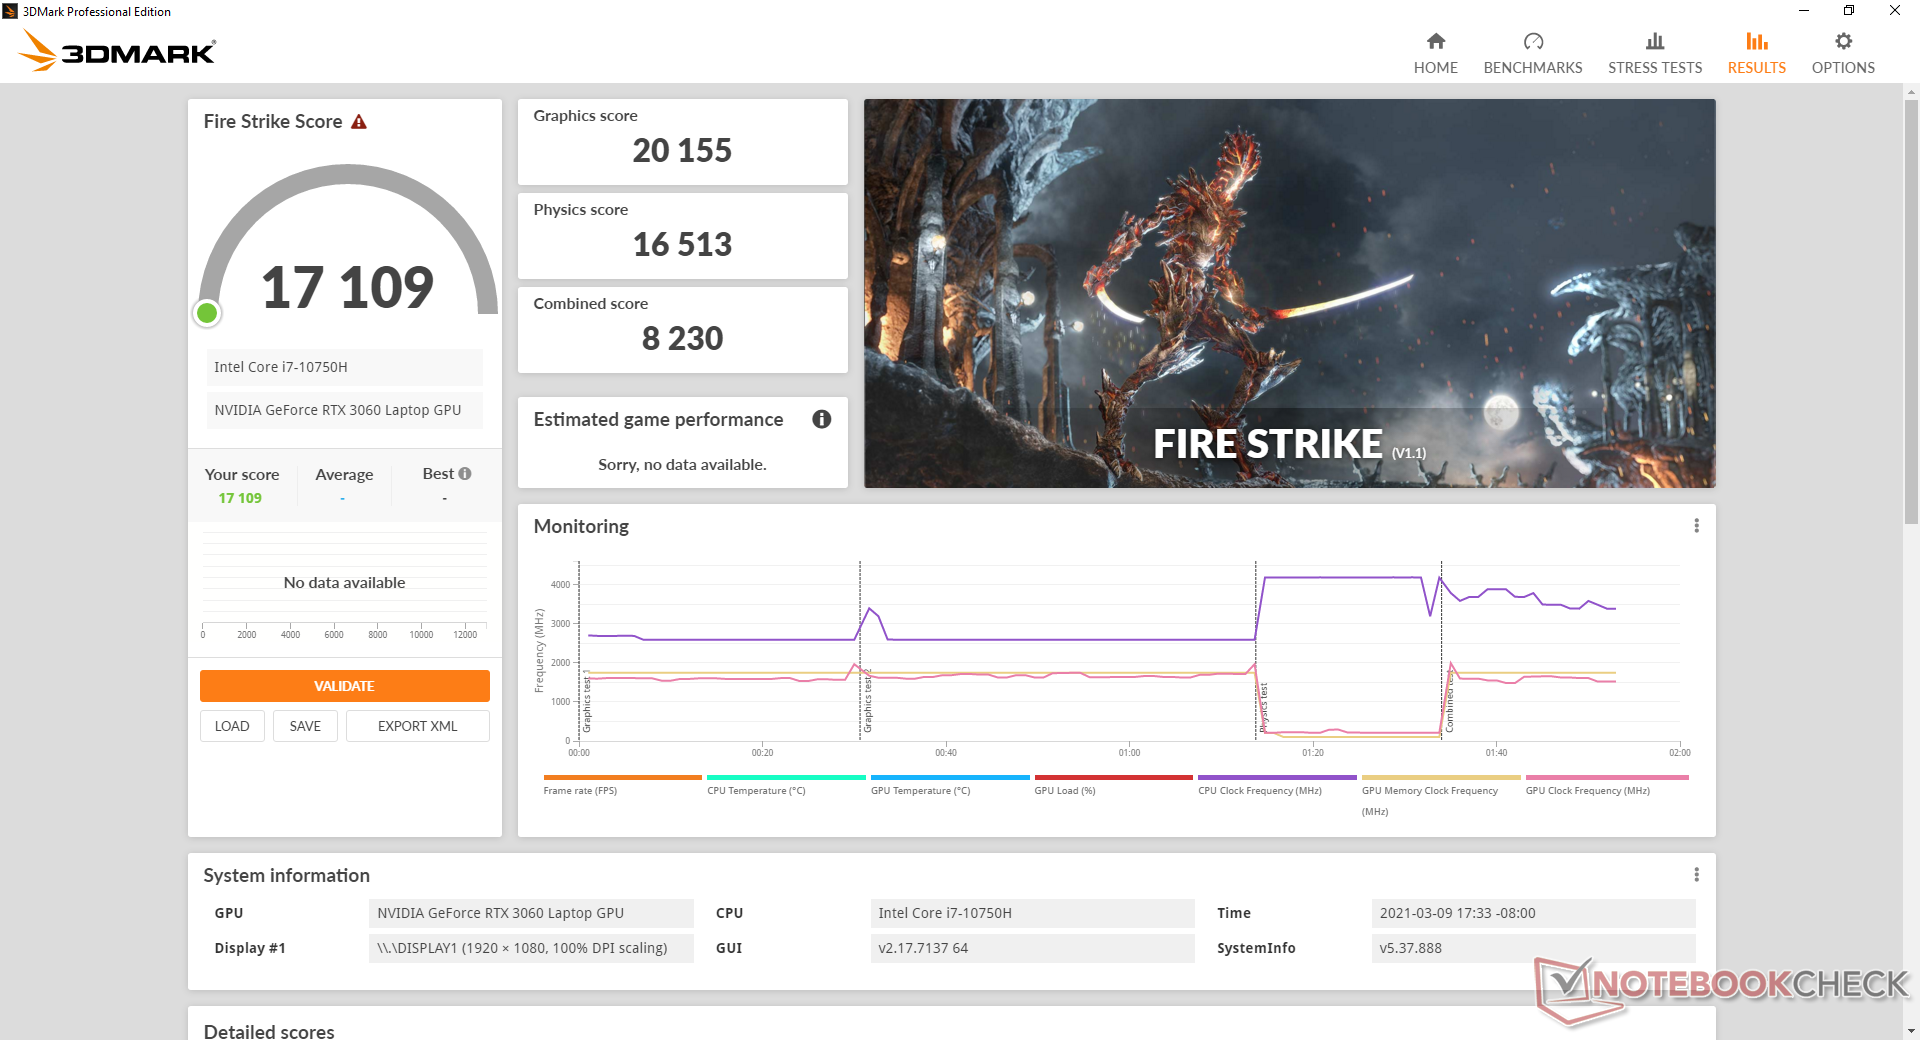
La GeForce RTX 3060 móvil de 95 W se encuentra a unos puntos porcentuales de un solo dígito de la GeForce RTX 2070 Max-Q según 3DMark. Se espera que la actualización a la opción RTX 3070 Blade 15 aumente el rendimiento gráfico entre un 15 y un 30 por ciento, dependiendo del objetivo TGP de Razer.
Sin embargo, cuando se ejecutan juegos reales, la RTX 3060 supera a la RTX 2070 Max-Q, especialmente en los ajustes más altos, donde los juegos están más vinculados a la GPU. GTA V y Final Fantasy XV, por ejemplo, son un 30 por ciento más rápidos en nuestro Blade 15 en comparación con el portátil medio GeForce RTX 2070 Max-Q.
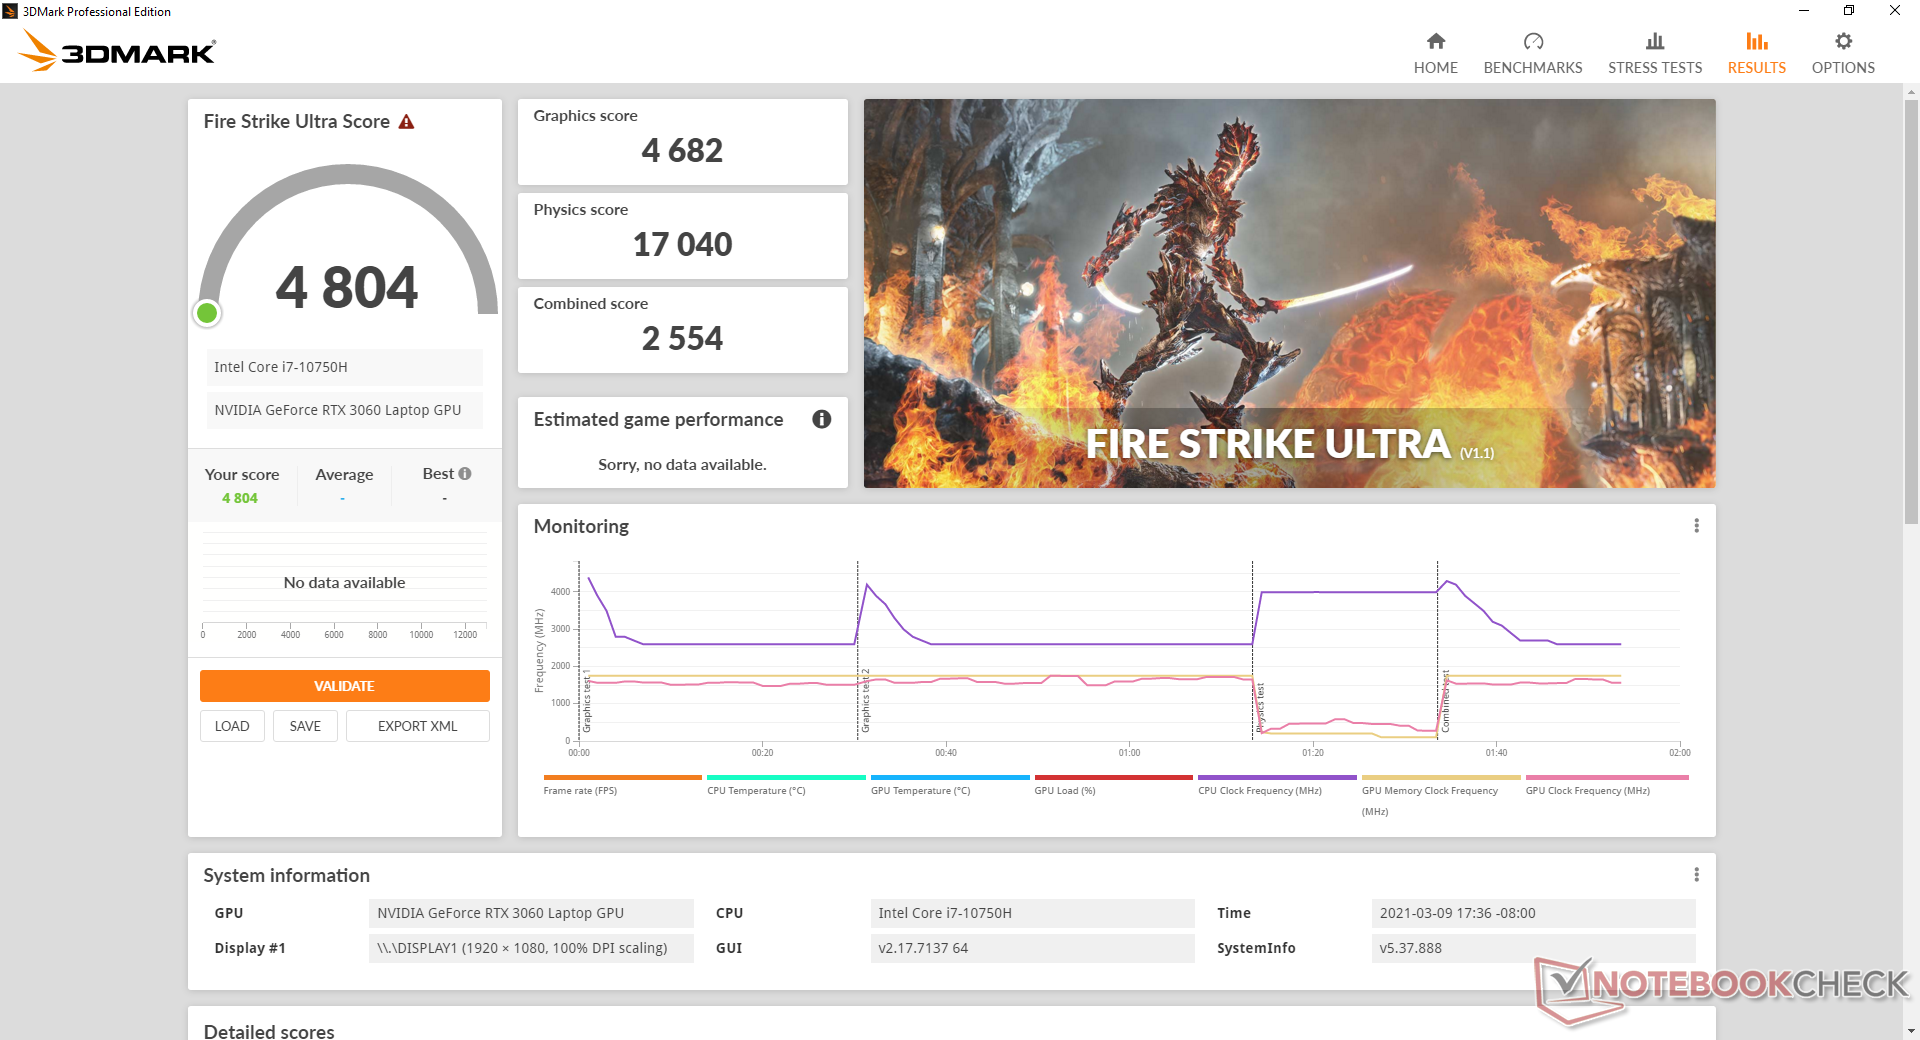
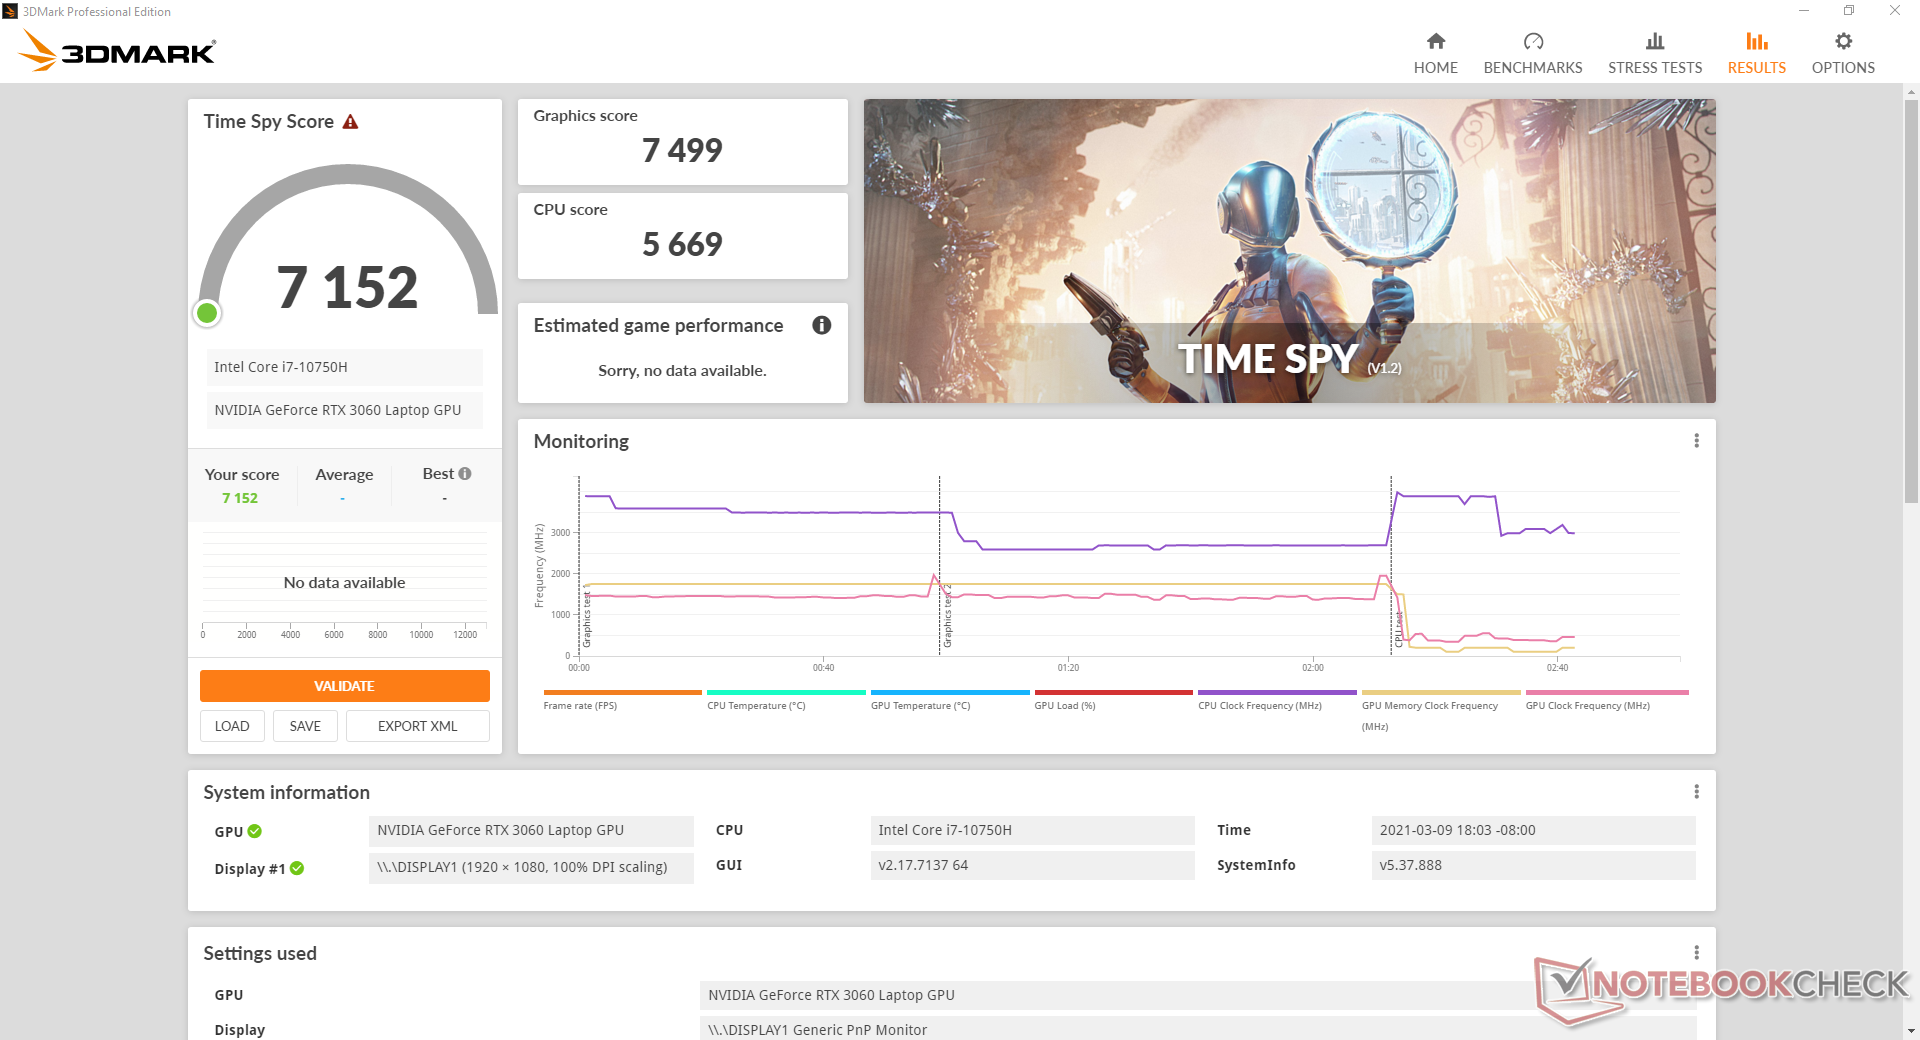
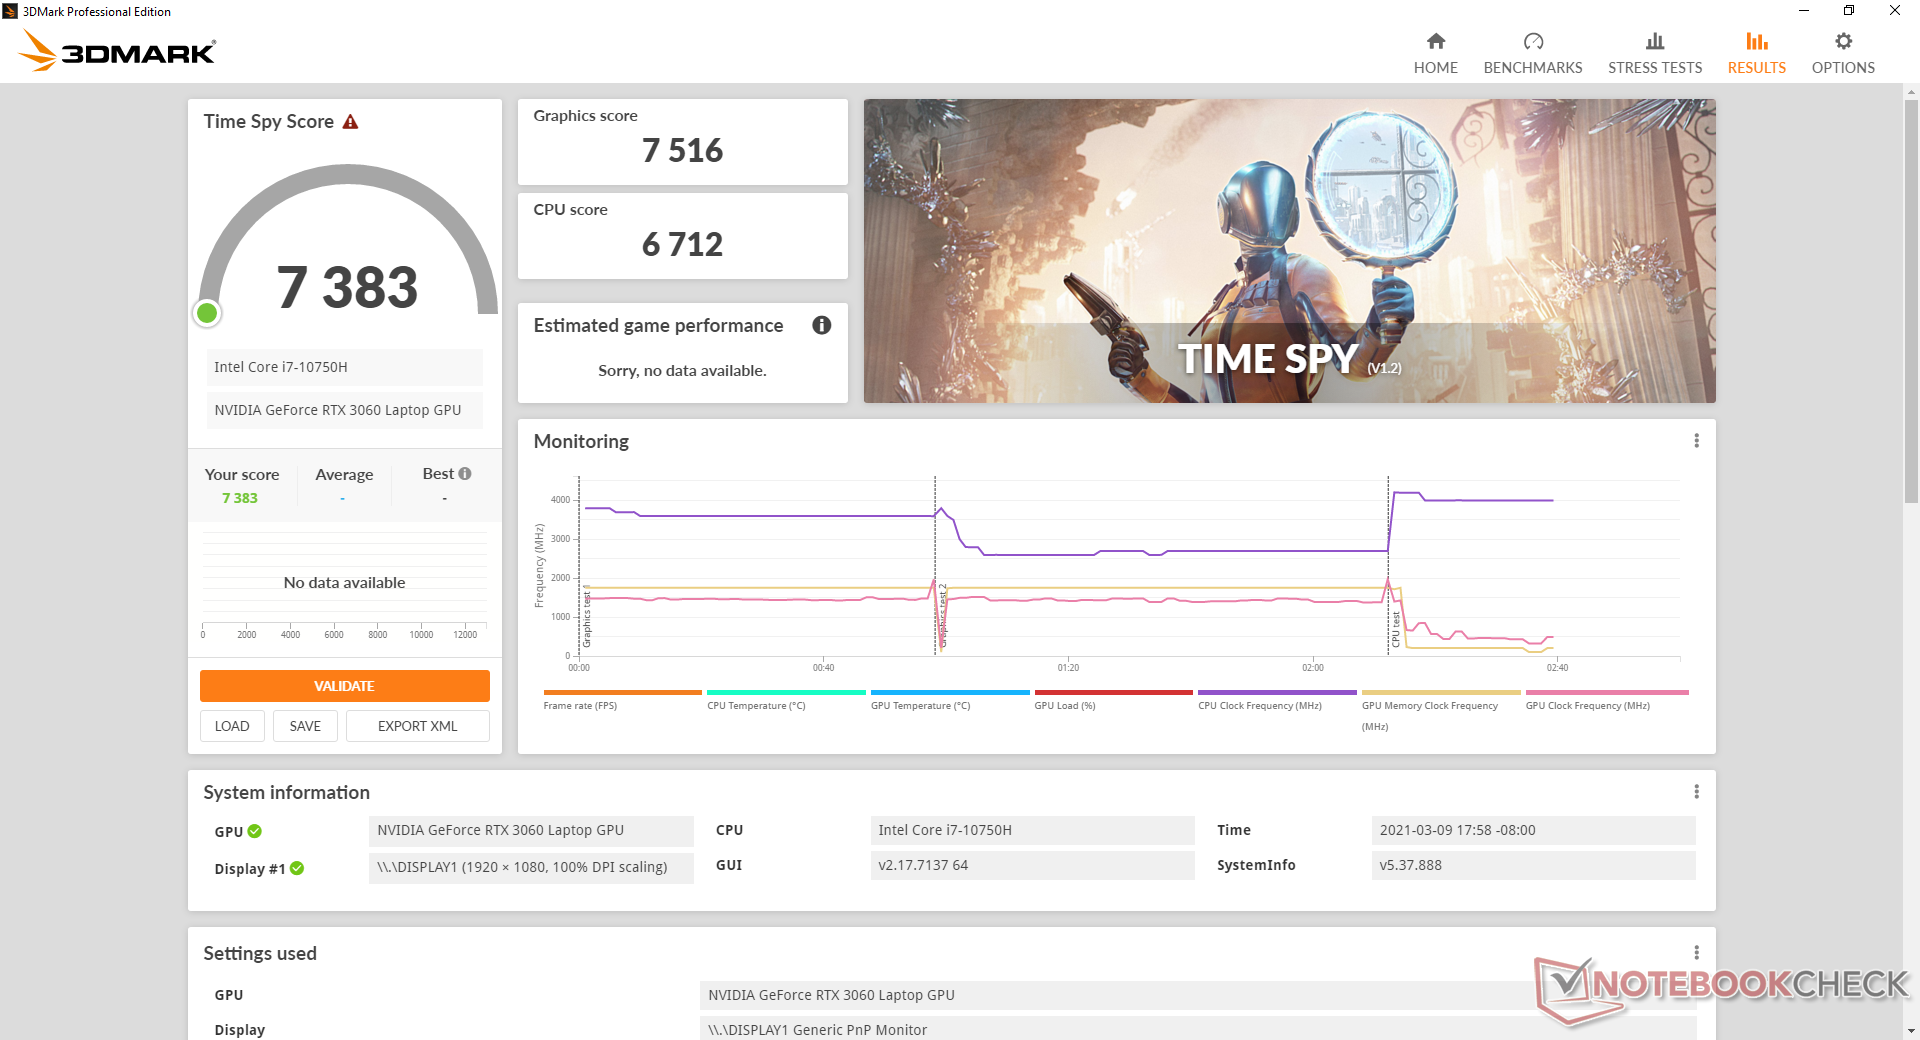
Hay un pequeño pero no insignificante cambio en el rendimiento gráfico dependiendo del perfil de energía seleccionado, como se muestra en la siguiente tabla. Lo más notable es que al pasar del modo Creador al modo Juego se produce un aumento del 5 por ciento en la puntuación de los gráficos de Time Spy.
| Perfil de potencia | Time Spy Puntuación de la CPU | Time Spy Puntuación de la GPU |
|---|---|---|
| Modo equilibrado | 5669 | 7499 |
| Modo de juego | 5709 | 7897 |
| Modo creador | 6712 | 7516 |
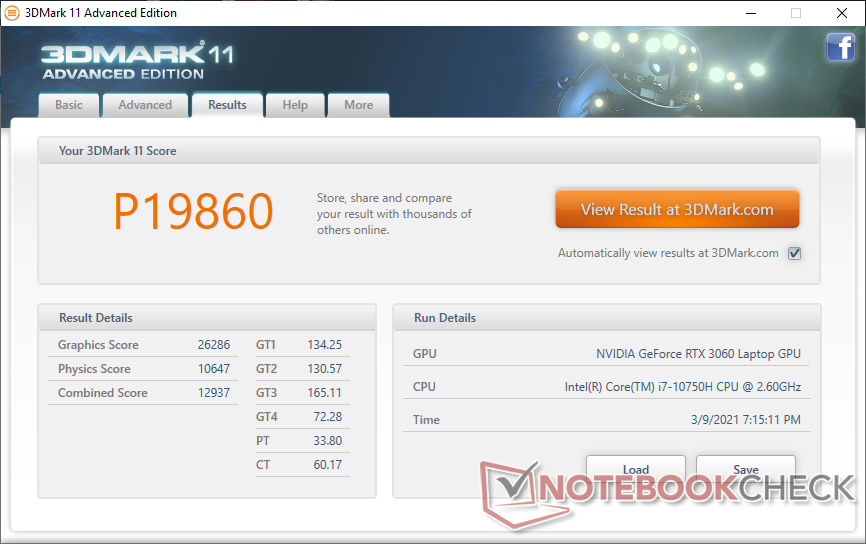

| 3DMark 11 Performance | 19860 puntos | |
| 3DMark Cloud Gate Standard Score | 34027 puntos | |
| 3DMark Fire Strike Score | 17109 puntos | |
| 3DMark Time Spy Score | 7467 puntos | |
ayuda | ||
| bajo | medio | alto | ultra | |
|---|---|---|---|---|
| GTA V (2015) | 175 | 168 | 149 | 84.5 |
| The Witcher 3 (2015) | 252.6 | 210.9 | 155 | 80.3 |
| Dota 2 Reborn (2015) | 147 | 134 | 128 | 121 |
| Final Fantasy XV Benchmark (2018) | 137 | 109 | 81.2 | |
| X-Plane 11.11 (2018) | 103 | 93 | 78.9 | |
| Strange Brigade (2018) | 359 | 210 | 164 | 141 |
Emissions
Ruido del sistema
Los ventiladores internos estarán inactivos cuando se ejecuten cargas muy bajas para una experiencia silenciosa. Sin embargo, tienden a pulsar con frecuencia si están en el perfil de alto rendimiento, por lo que recomendamos el modo equilibrado o inferior para limitar la actividad de los ventiladores.
El ruido de los ventiladores al jugar oscila entre 42 dB(A) y 52 dB(A) dependiendo de la carga de la CPU, como en el modelo 2020 Blade 15 Advanced. Los resultados son bastante parecidos a los que registramos en el Asus ROG Strix G15 bajo cargas similares. Ajustar manualmente los ventiladores al máximo a través de Synapse hará que los ventiladores funcionen a 52 dB(A) sin importar la carga.
| Razer Blade 15 Base Edition 2021, i7-10750H RTX 3060 GeForce RTX 3060 Laptop GPU, i7-10750H, Samsung SSD PM981a MZVLB512HBJQ | Razer Blade 15 RTX 2070 Super Max-Q GeForce RTX 2070 Super Max-Q, i7-10875H, Samsung SSD PM981a MZVLB512HBJQ | Asus ROG Strix G15 G513QR GeForce RTX 3070 Laptop GPU, R9 5900HX, SK Hynix HFM001TD3JX013N | MSI GS66 Stealth 10UG GeForce RTX 3070 Laptop GPU, i7-10870H, WDC PC SN730 SDBPNTY-1T00 | MSI GF65 Thin 10UE GeForce RTX 3060 Laptop GPU, i7-10750H, Samsung SSD PM981 MZVLB1T0HALR | Asus ROG Zephyrus M15 GU502LU-BI7N4 GeForce GTX 1660 Ti Mobile, i7-10750H, Intel SSD 660p SSDPEKNW512G8 | |
|---|---|---|---|---|---|---|
| Noise | -8% | -9% | -20% | -14% | -16% | |
| apagado / medio ambiente * (dB) | 25.3 | 27 -7% | 24 5% | 26.2 -4% | 24.7 2% | 25.8 -2% |
| Idle Minimum * (dB) | 25.4 | 27 -6% | 25 2% | 34 -34% | 33.1 -30% | 25.8 -2% |
| Idle Average * (dB) | 25.4 | 27 -6% | 31 -22% | 34 -34% | 33.1 -30% | 33.2 -31% |
| Idle Maximum * (dB) | 25.4 | 27 -6% | 33 -30% | 34 -34% | 33.1 -30% | 33.2 -31% |
| Load Average * (dB) | 42.5 | 44.7 -5% | 45 -6% | 47.2 -11% | 42.7 -0% | 37.3 12% |
| Witcher 3 ultra * (dB) | 42 | 51.2 -22% | 48 -14% | 46.3 -10% | 40.6 3% | 60.8 -45% |
| Load Maximum * (dB) | 52.2 | 54 -3% | 50 4% | 58.2 -11% | 59.4 -14% | 60.8 -16% |
* ... más pequeño es mejor
Ruido
| Ocioso |
| 25.4 / 25.4 / 25.4 dB(A) |
| Carga |
| 42.5 / 52.2 dB(A) |
 | ||
30 dB silencioso 40 dB(A) audible 50 dB(A) ruidosamente alto |
||
min: | ||
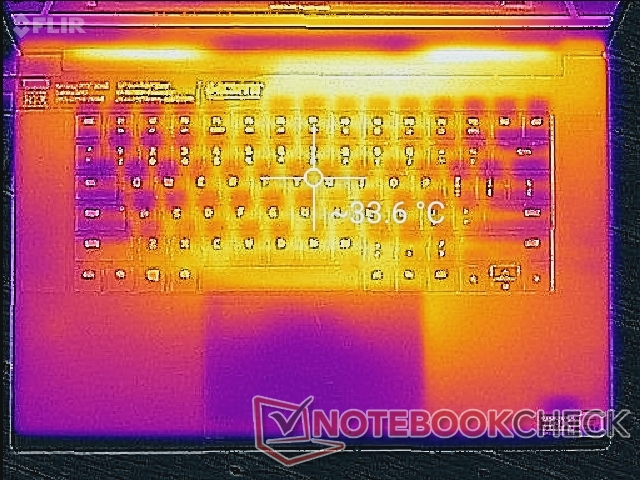
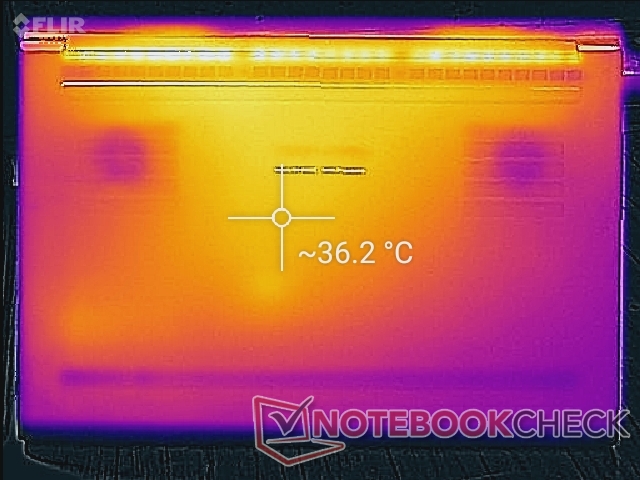
Temperatura
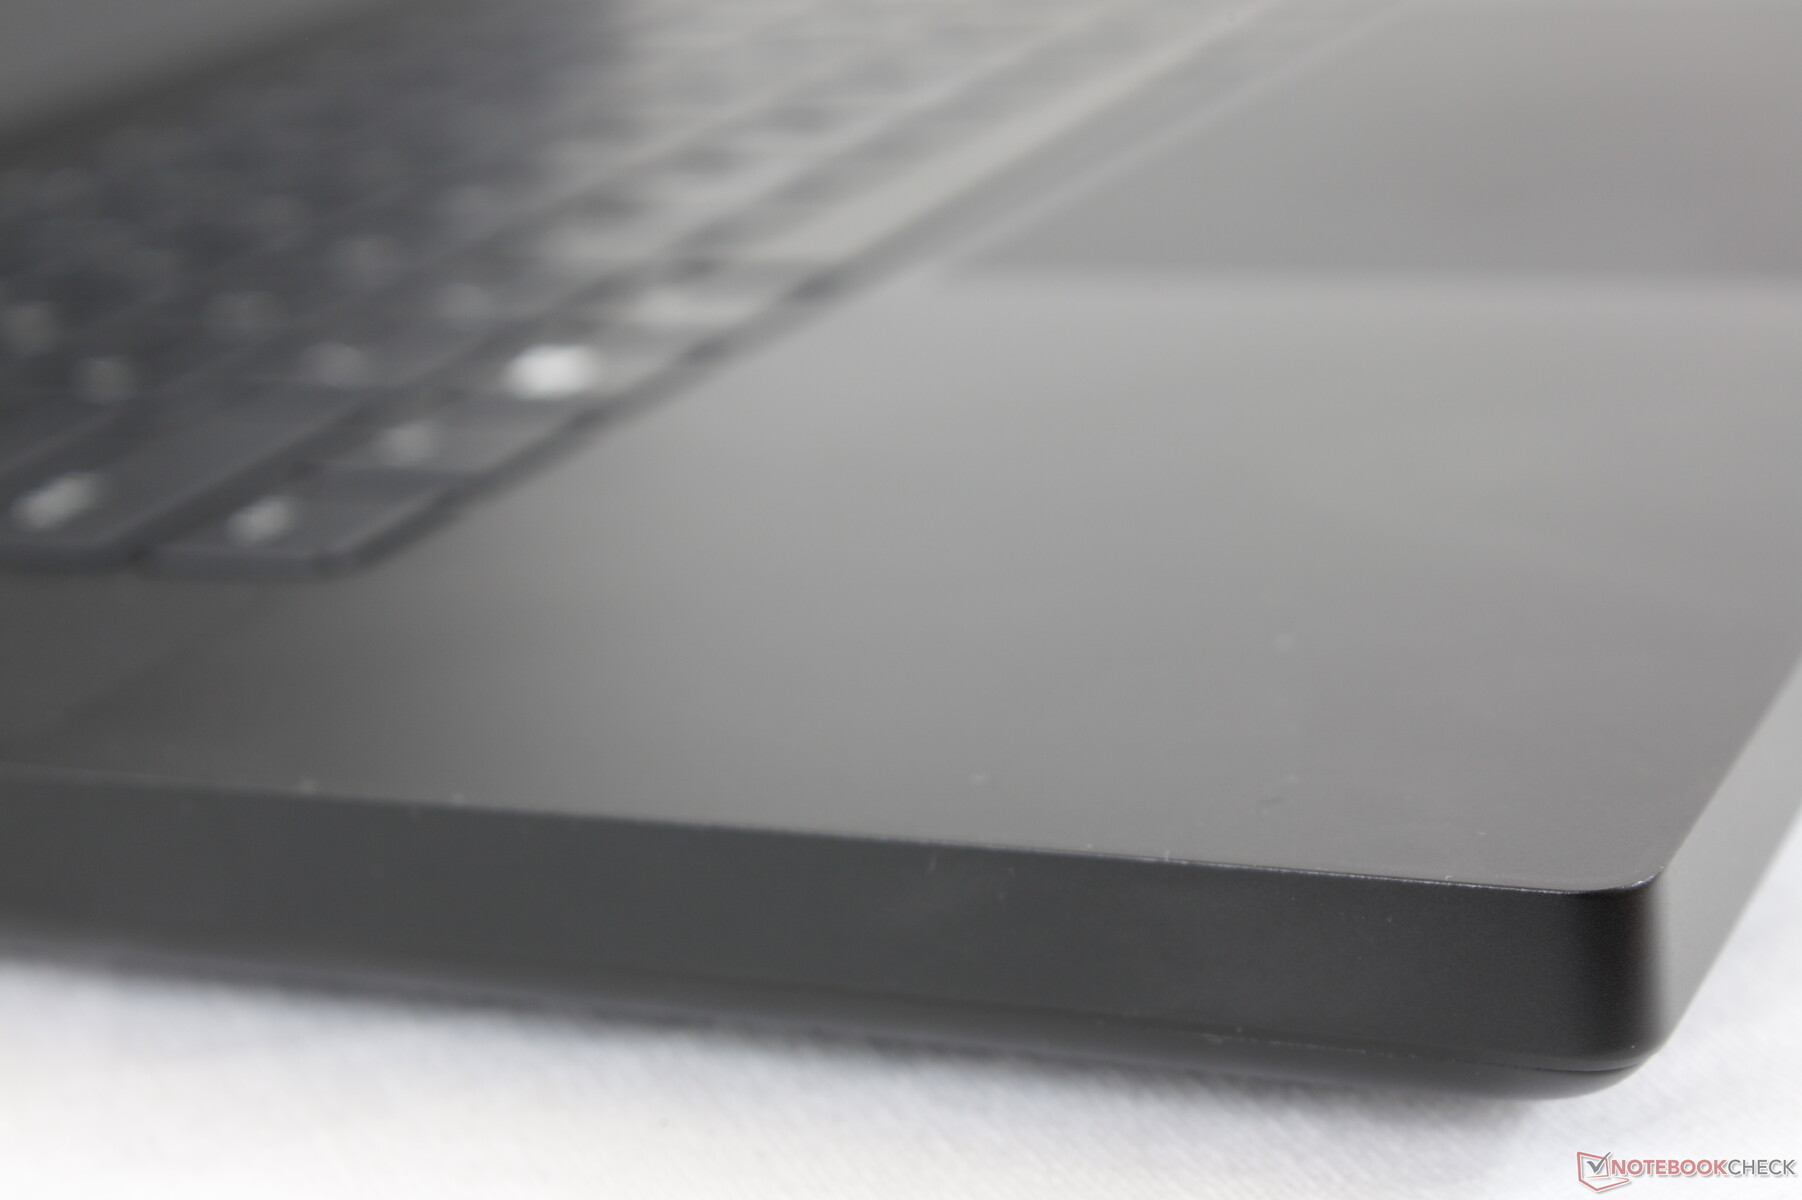
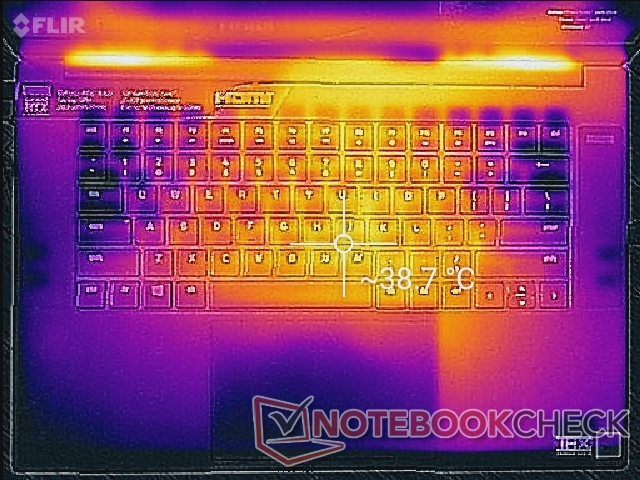
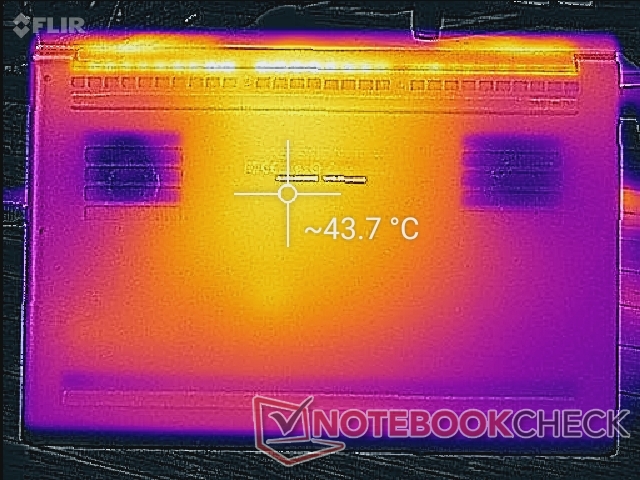
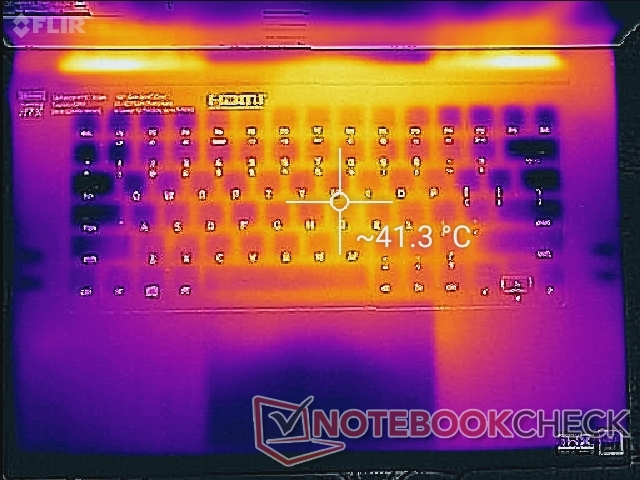
Los puntos calientes al jugar no son tan calientes como en el MSI GS66. No obstante, las zonas frontales son más cálidas que en la mayoría de portátiles de juego, probablemente debido al diseño más ajustado del chasis unibody del Razer y a las rejillas de ventilación más pequeñas del panel inferior. El reposamanos puede oscilar entre los 30 C y los 35 C en comparación con los 26 C del GS66 cuando se juega.
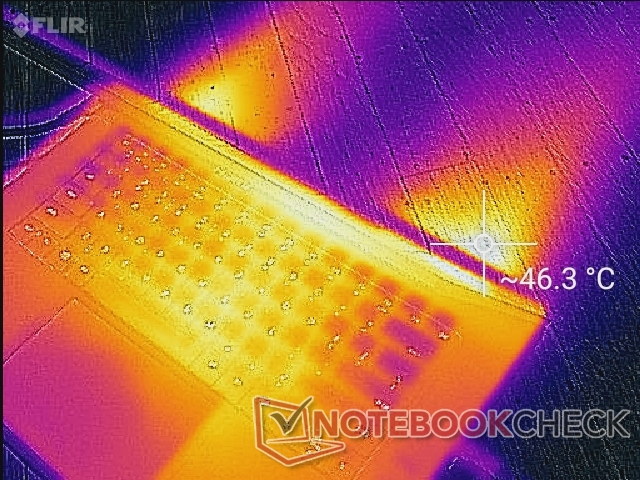
(-) La temperatura máxima en la parte superior es de 45.2 °C / 113 F, frente a la media de 40.4 °C / 105 F, que oscila entre 21.2 y 68.8 °C para la clase Gaming.
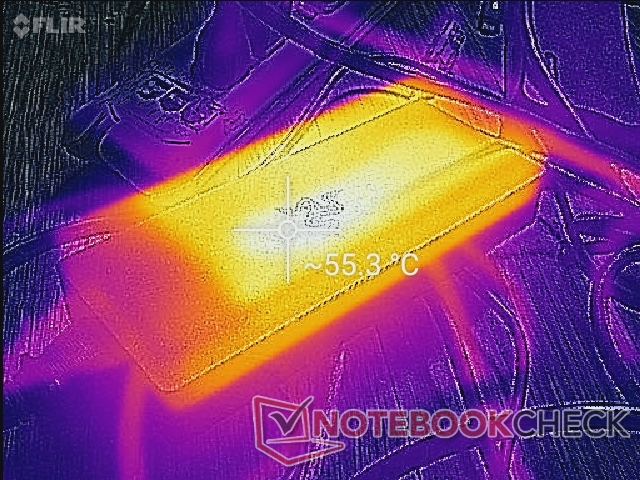
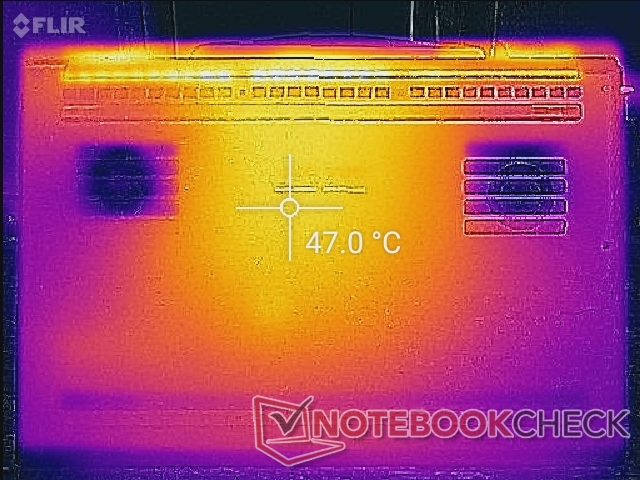
(-) El fondo se calienta hasta un máximo de 48 °C / 118 F, frente a la media de 43.2 °C / 110 F
(+) En reposo, la temperatura media de la parte superior es de 30.3 °C / 87# F, frente a la media del dispositivo de 33.9 °C / 93 F.
(+) Los reposamanos y el panel táctil alcanzan como máximo la temperatura de la piel (34.2 °C / 93.6 F) y, por tanto, no están calientes.
(-) La temperatura media de la zona del reposamanos de dispositivos similares fue de 28.8 °C / 83.8 F (-5.4 °C / -9.8 F).
Prueba de esfuerzo
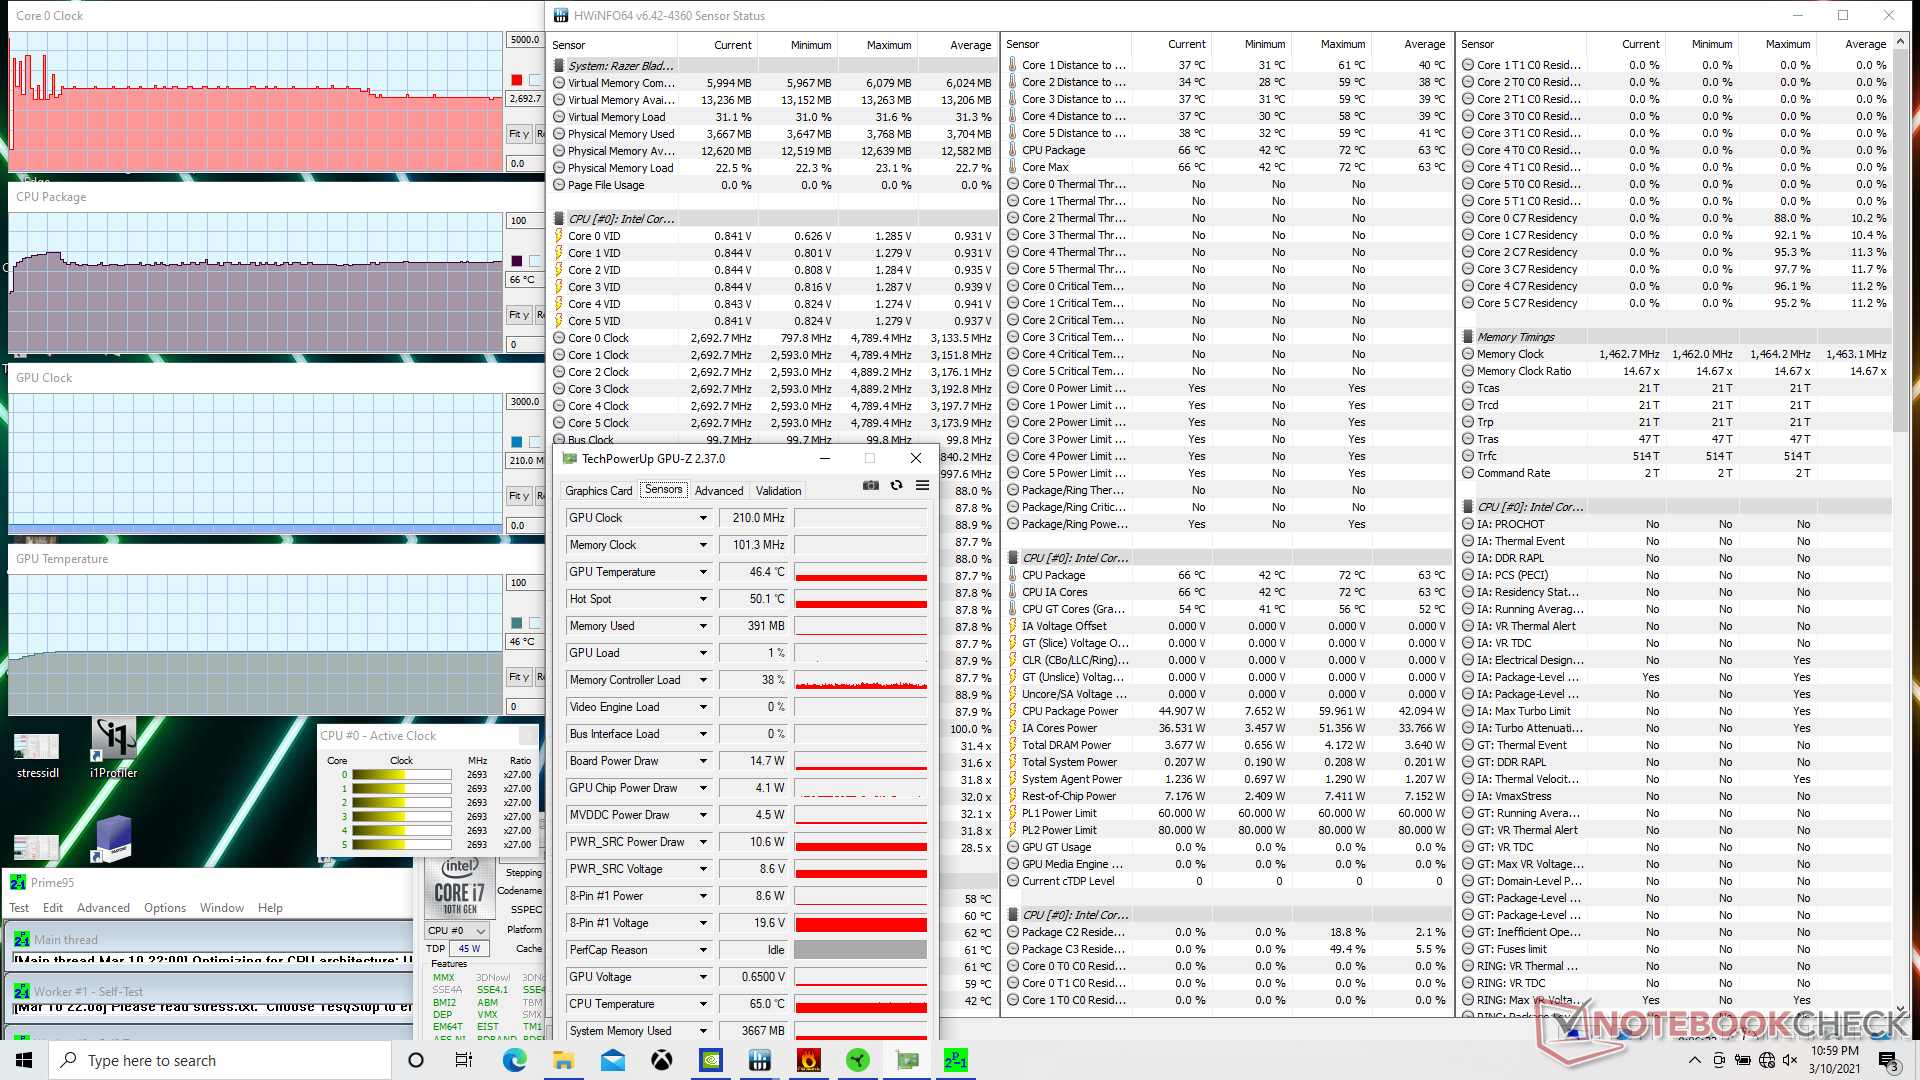
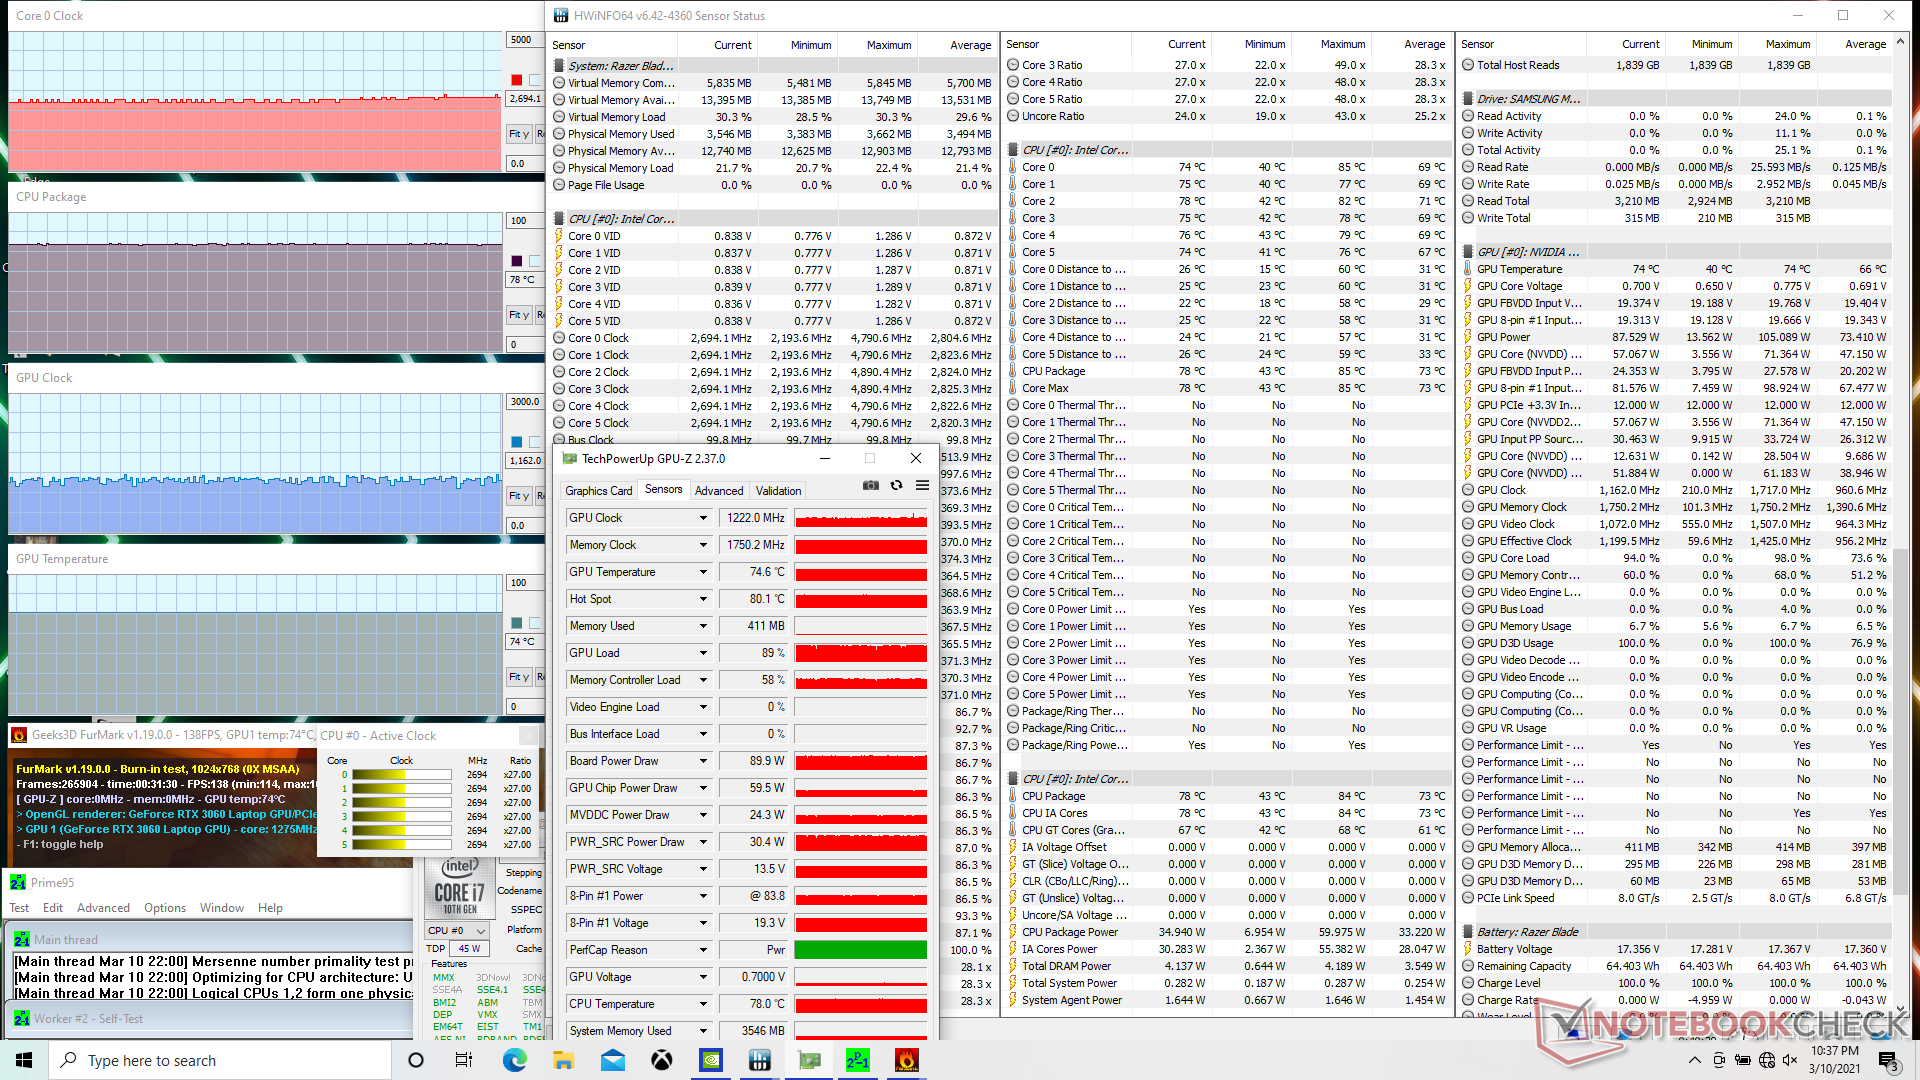
Cuando se ejecuta Prime95 en modo Juego para estresar la CPU, las velocidades de reloj aumentan a 4,2 GHz durante los primeros segundos hasta alcanzar una temperatura del núcleo de 73 C. A continuación, las velocidades de reloj caen y se estabilizan en 2,5 GHz y 58 C, respectivamente. Si se repite esta prueba en el modo Creator, las frecuencias de reloj saltan a 4,2 GHz antes de volver a caer. Sin embargo, esta vez la caída es más lenta y constante, a 3 GHz y finalmente a 2,7 GHz, a costa de una mayor temperatura del núcleo de 63 C.
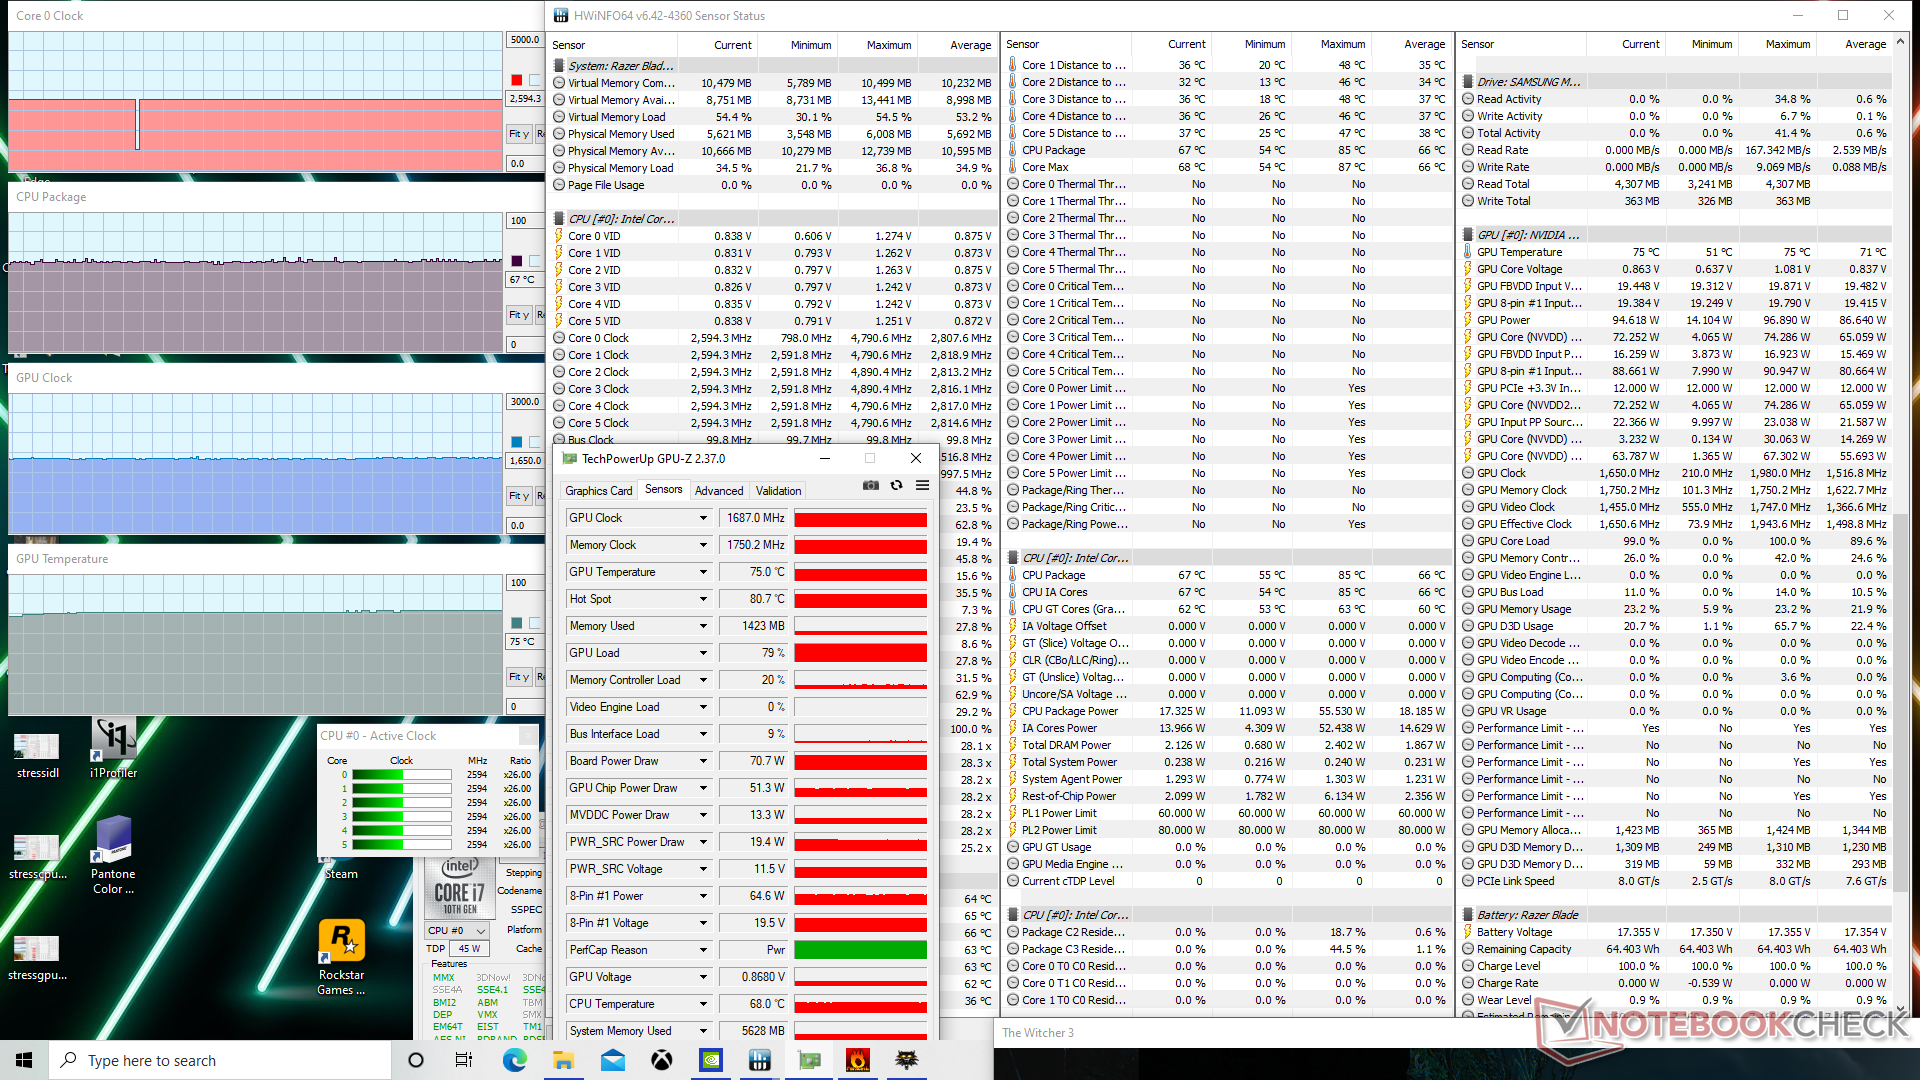
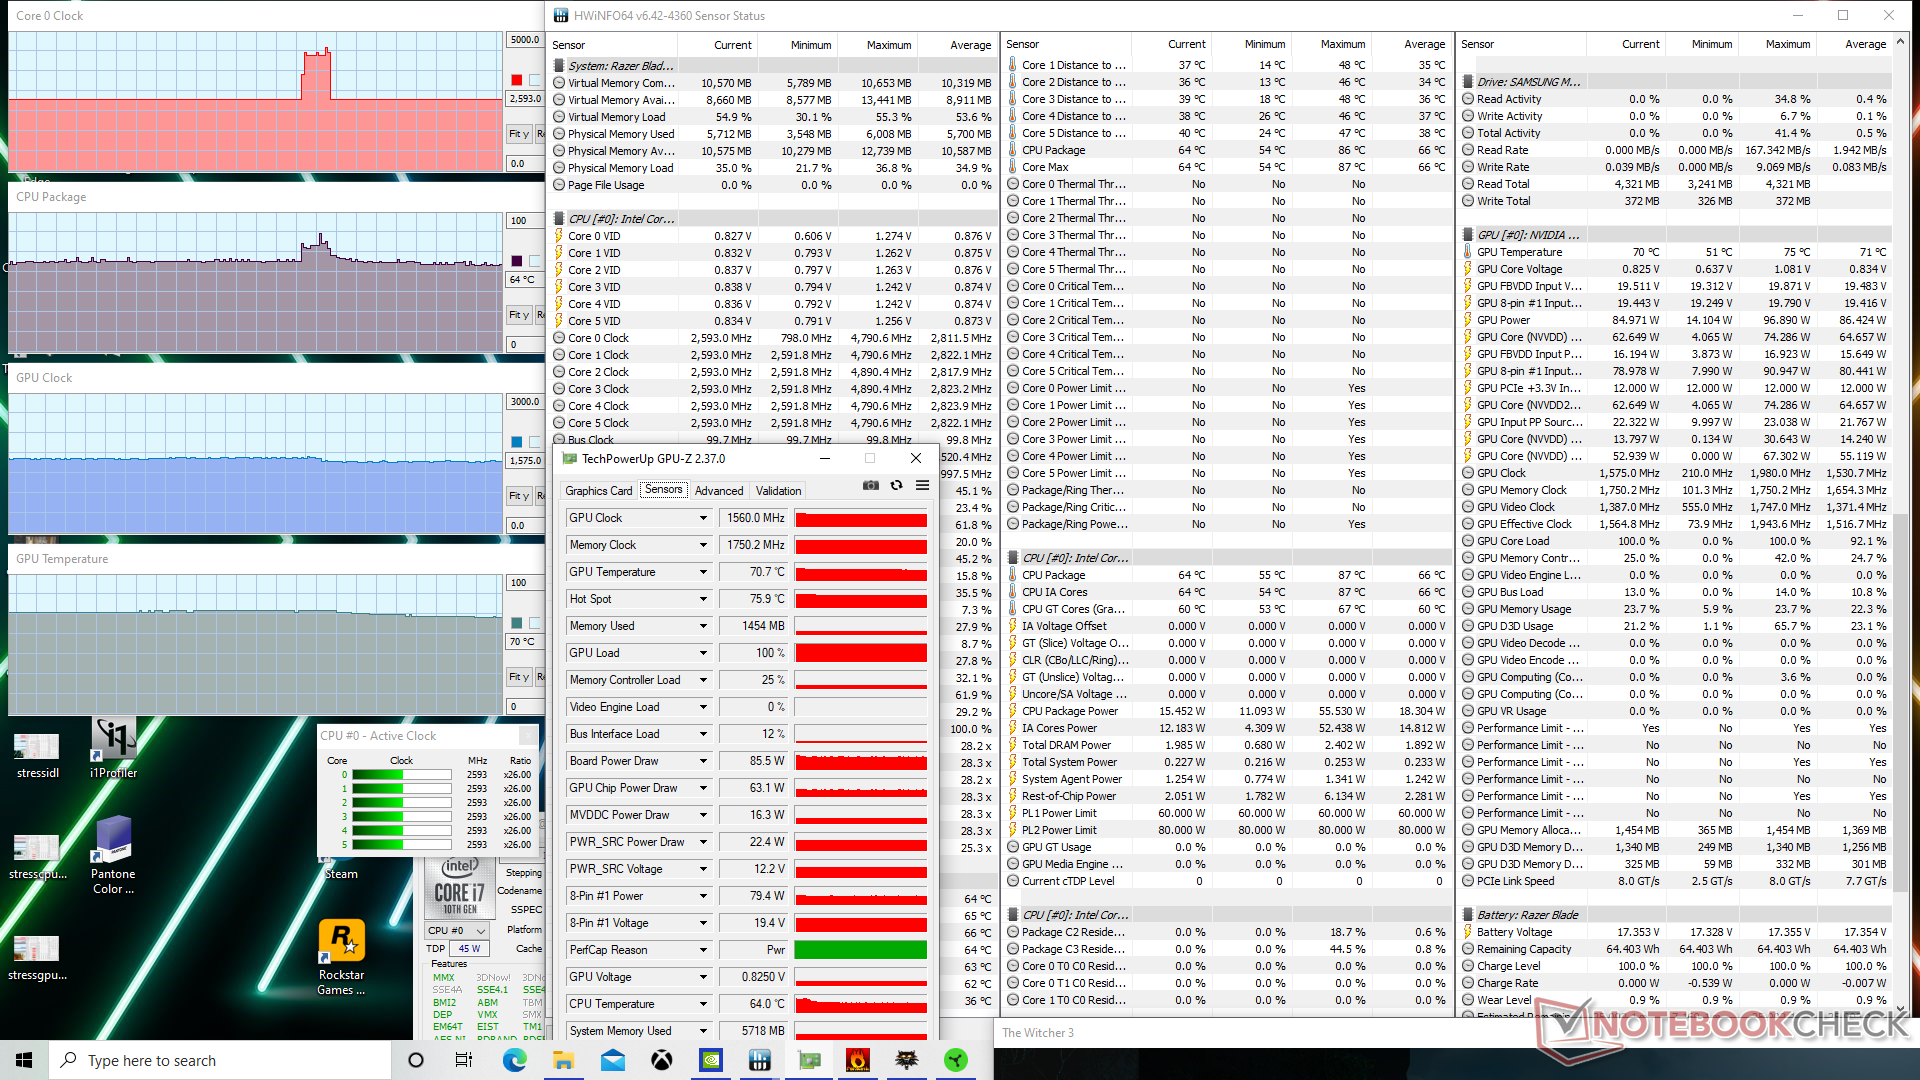
Si se ejecuta Witcher 3 en el modo Juego, las velocidades de reloj de la GPU y las temperaturas son ligeramente superiores a las del modo Creador, tal y como muestran nuestra tabla y las capturas de pantalla que aparecen a continuación. Estos cambios, pequeños pero medibles, coinciden con los resultados de 3DMark. El consumo de energía de la placa de la GPU parece rondar entre los 85 W y los 90 W cuando se ejecuta el juego.
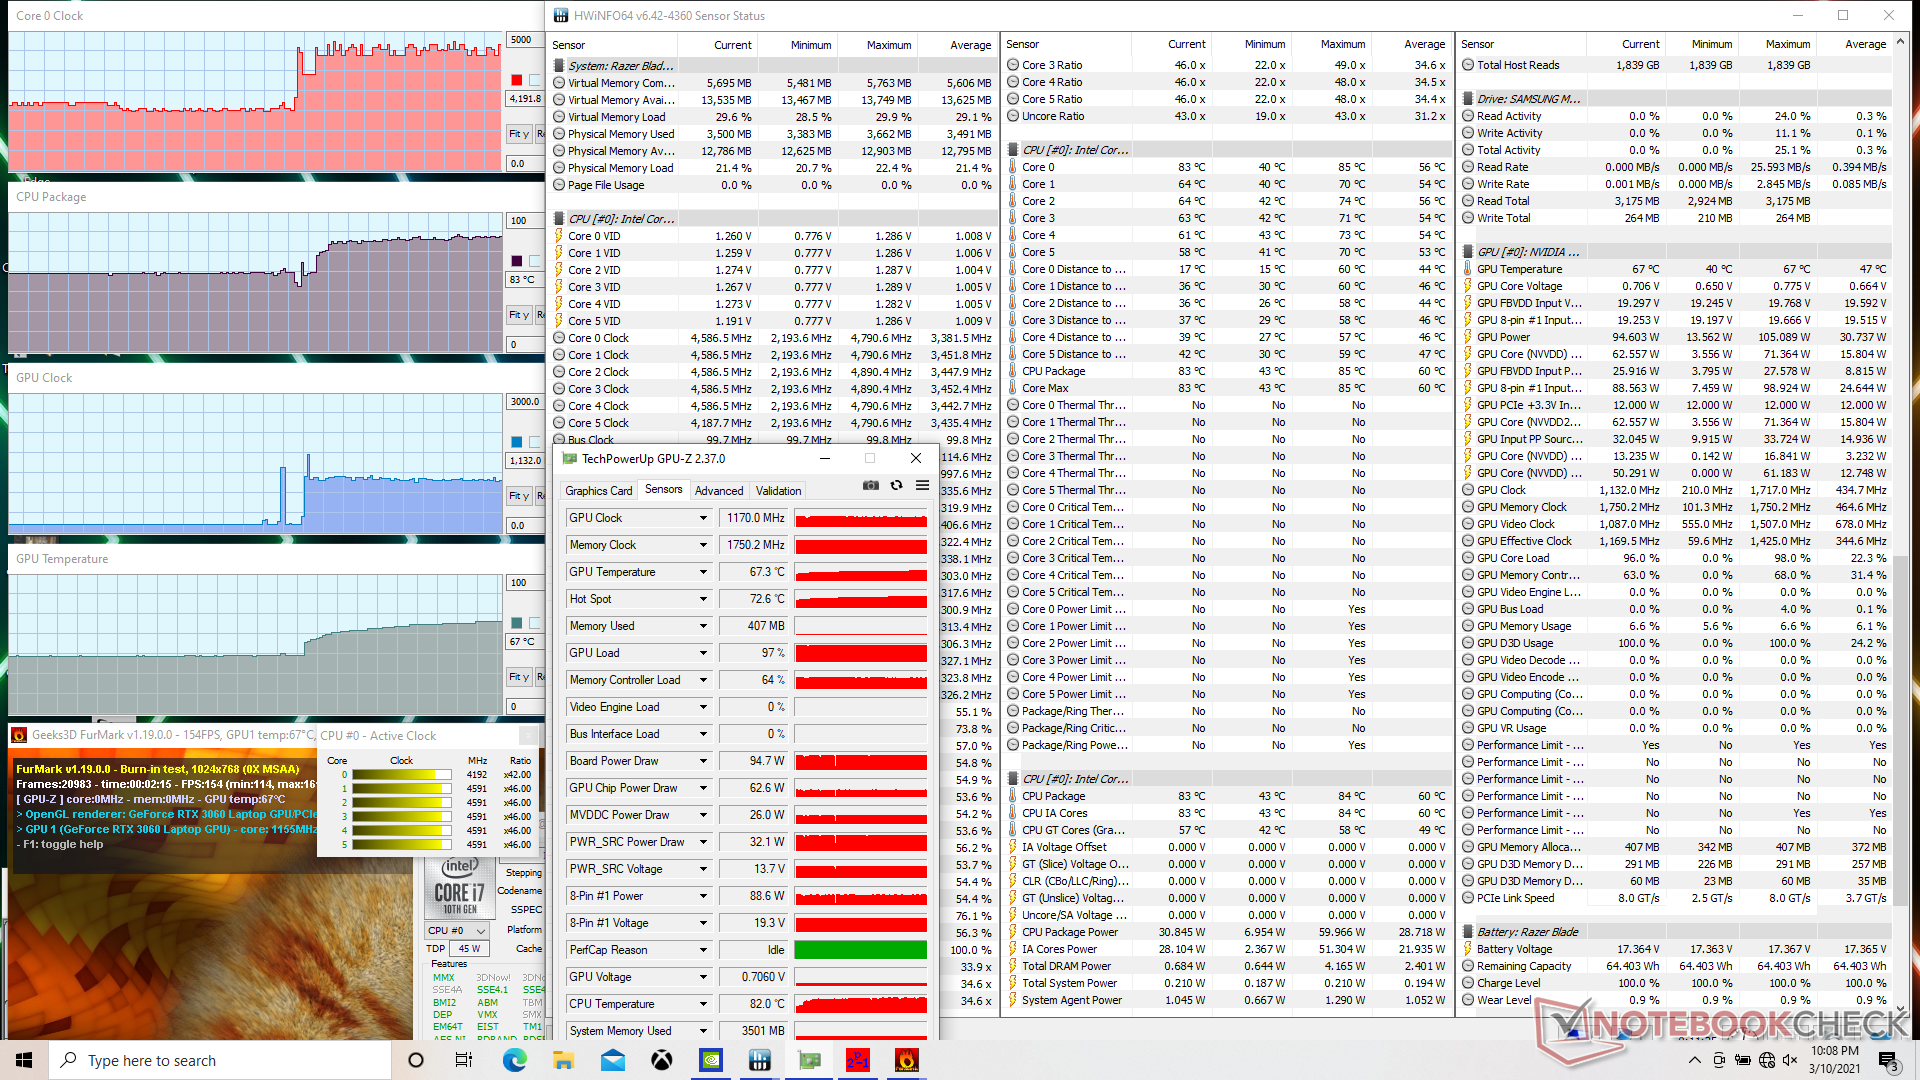
Ejecutando FurMark en modo Juego para poner la GPU al 100 por ciento de utilización, se obtiene un consumo de energía constante de la placa de 94,7 W, que está muy cerca de los 95 W TGP anunciados. Las temperaturas del núcleo nunca parecen subir por encima de 74 C a 78 C según nuestras pruebas de estrés.
El funcionamiento con baterías reducirá el rendimiento. Un test de Fire Strike con batería arroja unas puntuaciones de Física y Gráficos de 8609 y 4753 puntos, respectivamente, frente a los 16513 y 20155 puntos de la red eléctrica. Los modos Creador y Juego se desactivan si se utiliza la batería.
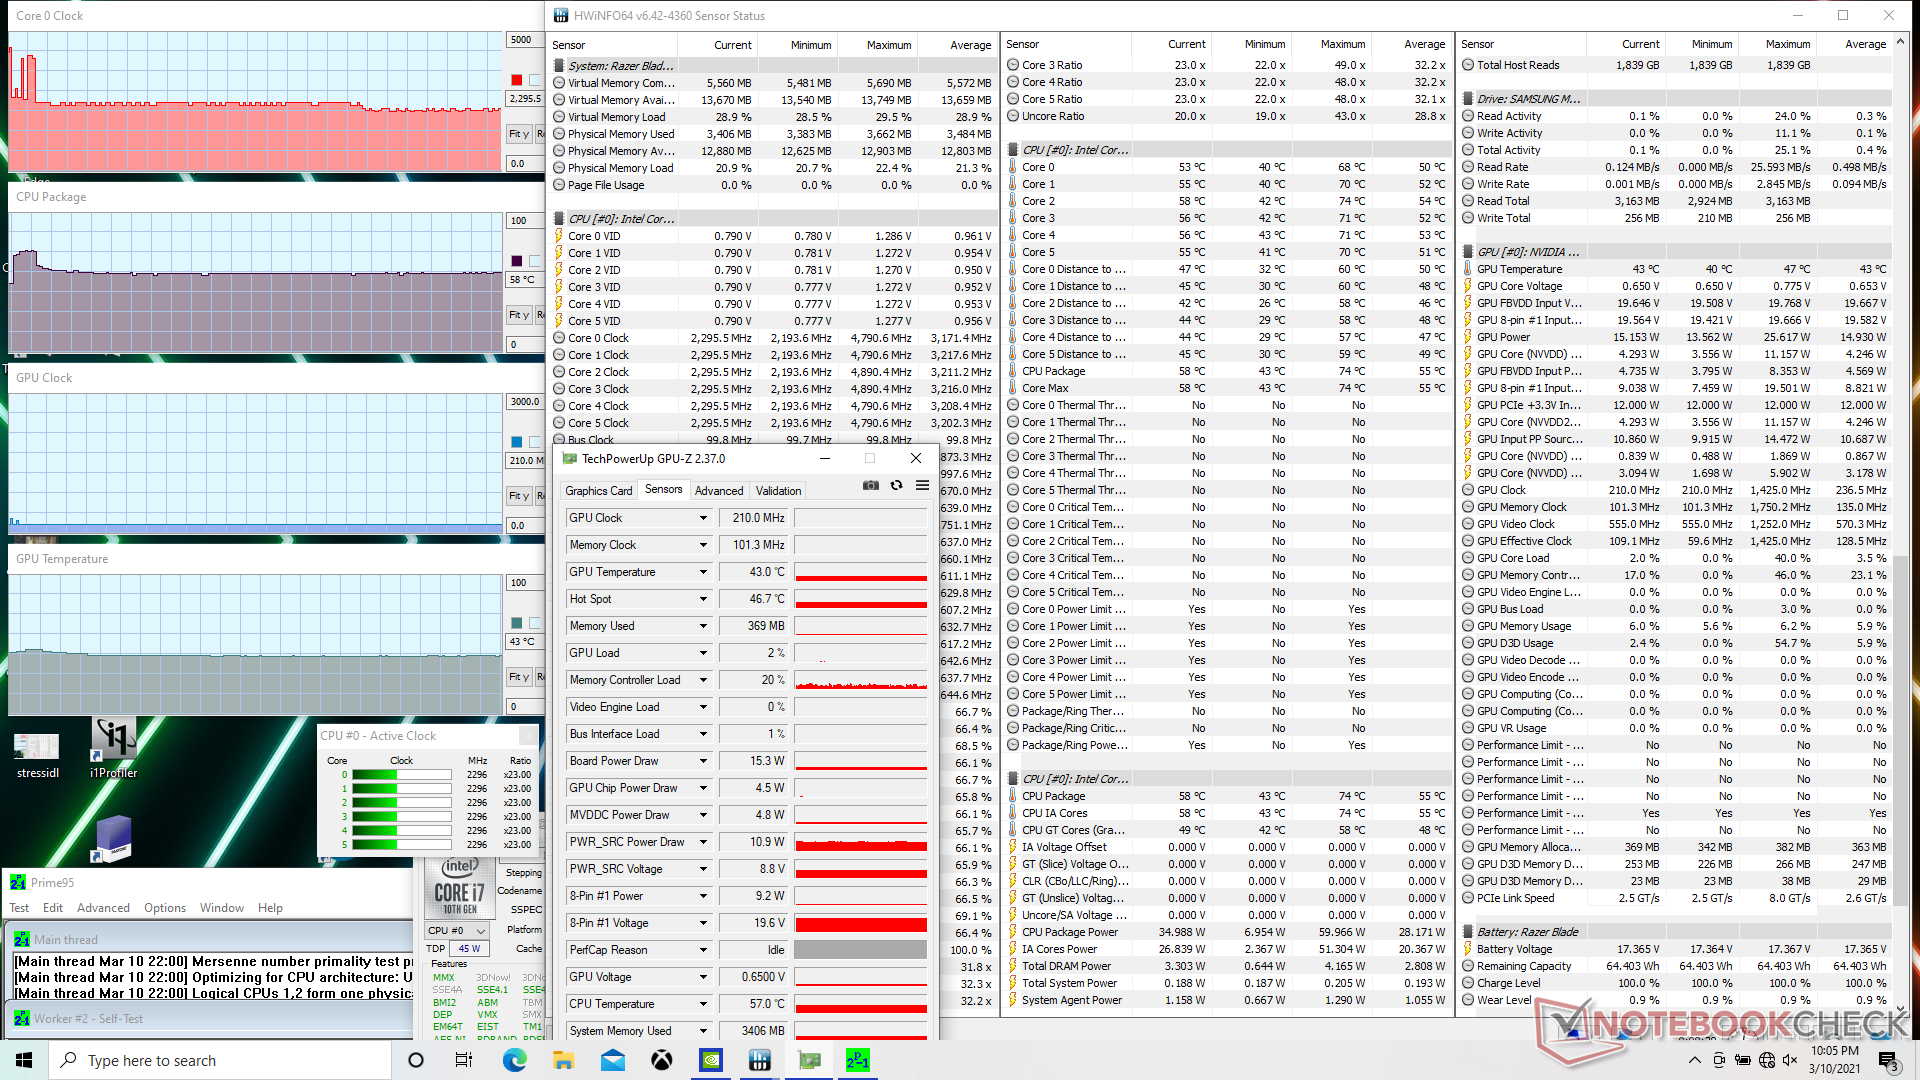
| Relojde la CPU(GHz) | Reloj dela GPU(MHz) | Temperatura media de la CPU (°C) | Temperaturamediade la GPU (°C) | |
| Sistema en reposo | 47 | 44 | ||
| Estrés Prime95 (modo Juego) | 2,2 - 2,3 | -- | 58 | 43 |
| Estrés de Prime95 (modoCreador) | 2,7 | -- | 66 | 46 |
| FurMark Stress (modo Juego) | -- | 1170 | 83 | 67 |
| Witcher 3 Estrés (modo Juego) | 2.6 | 1687 | 67 | 75 |
| Witcher 3 Estrés (modo Creador) | 2.6 | 1560 | 64 | 70 |
| Prime95 + FurMark Stress (modo Juego) | 2.6 - 2.7 | 1222 | 78 | 74 |
Altavoces


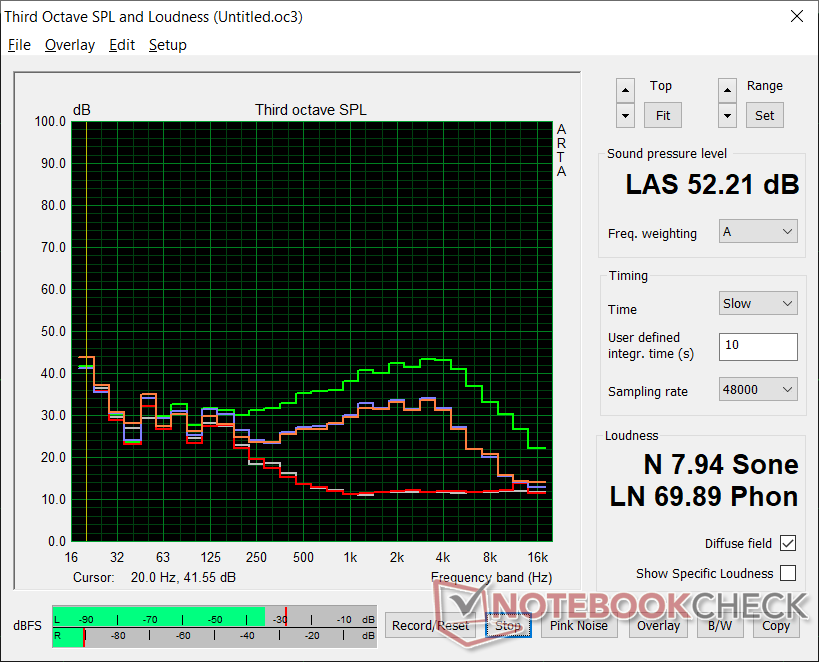
Razer Blade 15 Base Edition 2021, i7-10750H RTX 3060 análisis de audio
(±) | la sonoridad del altavoz es media pero buena (78.9 dB)
Graves 100 - 315 Hz
(-) | casi sin bajos - de media 18.9% inferior a la mediana
(±) | la linealidad de los graves es media (13% delta a frecuencia anterior)
Medios 400 - 2000 Hz
(±) | medias más altas - de media 5.2% más altas que la mediana
(+) | los medios son lineales (6.2% delta a la frecuencia anterior)
Altos 2 - 16 kHz
(+) | máximos equilibrados - a sólo 3.3% de la mediana
(±) | la linealidad de los máximos es media (7.4% delta a frecuencia anterior)
Total 100 - 16.000 Hz
(±) | la linealidad del sonido global es media (18.1% de diferencia con la mediana)
En comparación con la misma clase
» 57% de todos los dispositivos probados de esta clase eran mejores, 8% similares, 35% peores
» El mejor tuvo un delta de 6%, la media fue 18%, el peor fue ###max##%
En comparación con todos los dispositivos probados
» 38% de todos los dispositivos probados eran mejores, 8% similares, 54% peores
» El mejor tuvo un delta de 4%, la media fue 24%, el peor fue ###max##%
Apple MacBook 12 (Early 2016) 1.1 GHz análisis de audio
(+) | los altavoces pueden reproducir a un volumen relativamente alto (#83.6 dB)
Graves 100 - 315 Hz
(±) | lubina reducida - en promedio 11.3% inferior a la mediana
(±) | la linealidad de los graves es media (14.2% delta a frecuencia anterior)
Medios 400 - 2000 Hz
(+) | medios equilibrados - a sólo 2.4% de la mediana
(+) | los medios son lineales (5.5% delta a la frecuencia anterior)
Altos 2 - 16 kHz
(+) | máximos equilibrados - a sólo 2% de la mediana
(+) | los máximos son lineales (4.5% delta a la frecuencia anterior)
Total 100 - 16.000 Hz
(+) | el sonido global es lineal (10.2% de diferencia con la mediana)
En comparación con la misma clase
» 7% de todos los dispositivos probados de esta clase eran mejores, 2% similares, 91% peores
» El mejor tuvo un delta de 5%, la media fue 18%, el peor fue ###max##%
En comparación con todos los dispositivos probados
» 5% de todos los dispositivos probados eran mejores, 1% similares, 94% peores
» El mejor tuvo un delta de 4%, la media fue 24%, el peor fue ###max##%
Energy Management
Consumo de energía
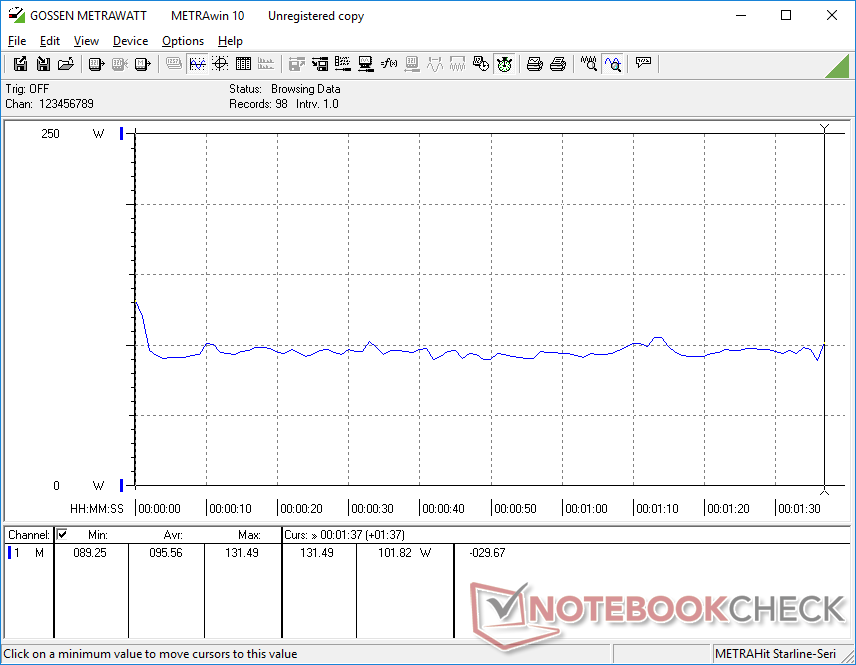
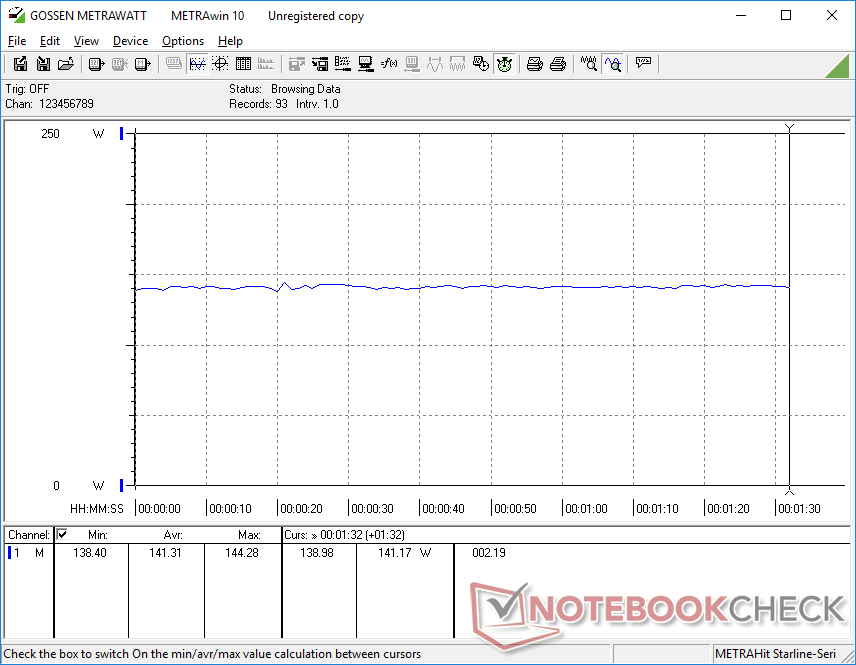
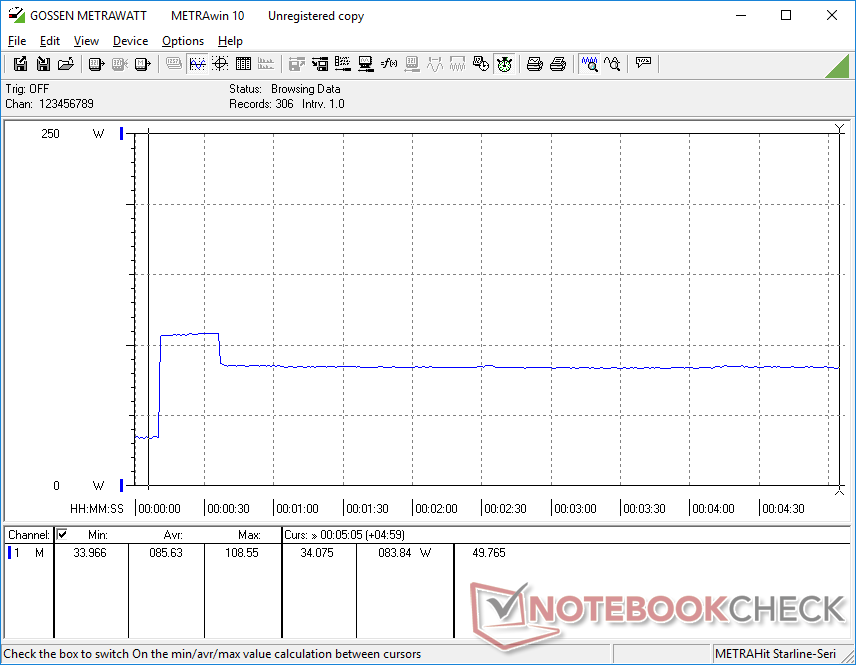
La Blade 15 RTX 3060 consume menos energía en general en comparación con la RTX 2070 Max-Q a pesar de estar a la par en 3DMark para indicar un mayor rendimiento por vatio. Hay que tener en cuenta que la MSI GF65 con la misma RTX 3060 consume incluso menos energía que nuestra Blade 15 cuando juega porque apunta a un TGP más bajo (70 W frente a 95 W). Tal vez no sea una coincidencia, el MSI consume exactamente 25,6 W menos cuando se ejecuta Witcher 3 lo que está muy cerca de la diferencia de TGP entre los dos modelos
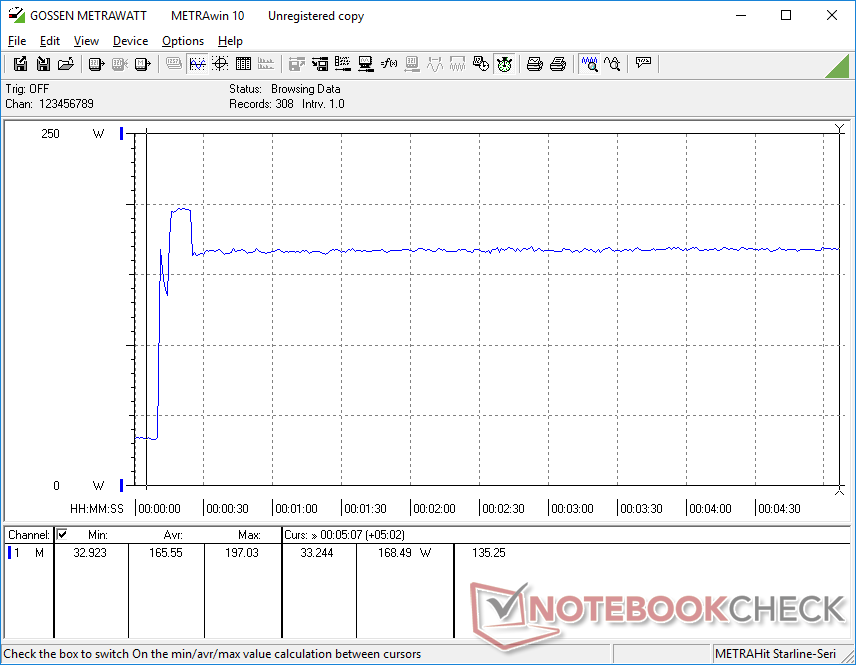
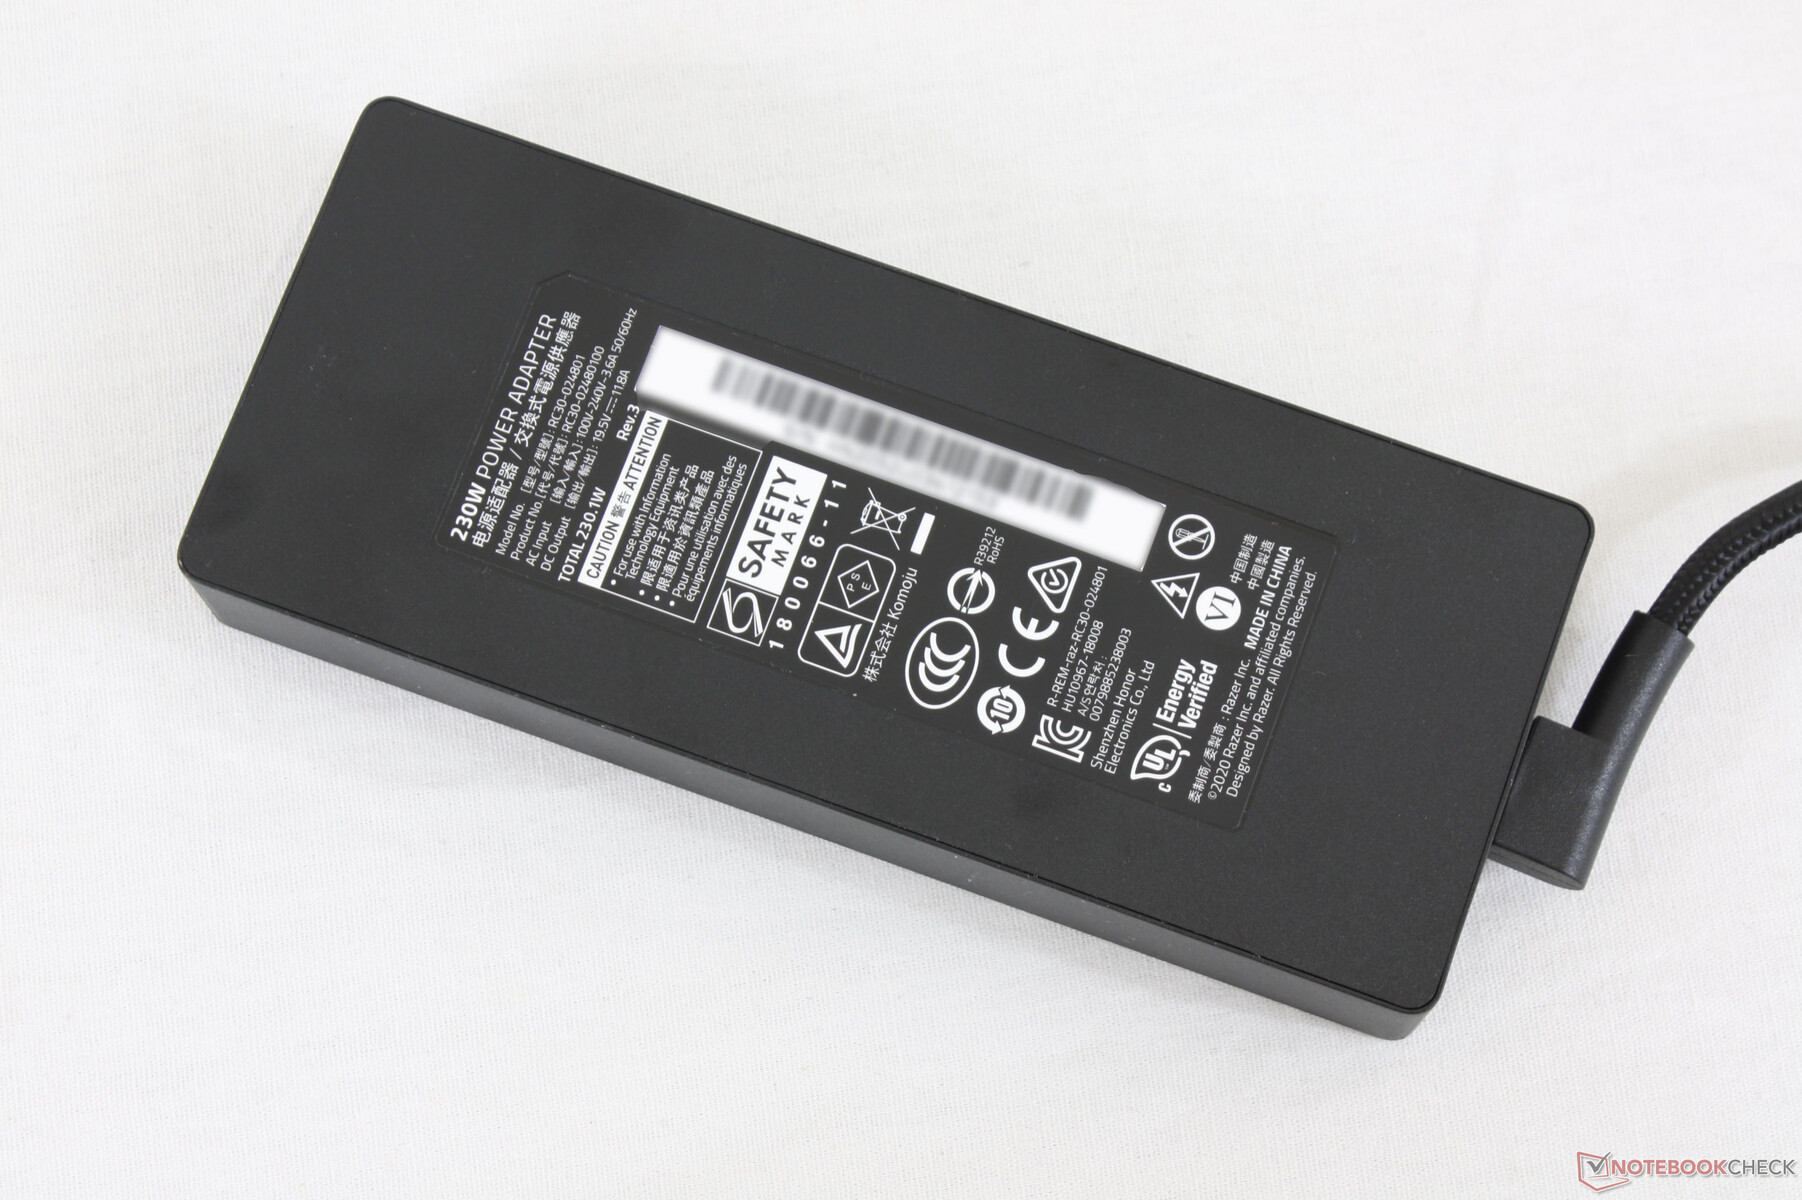
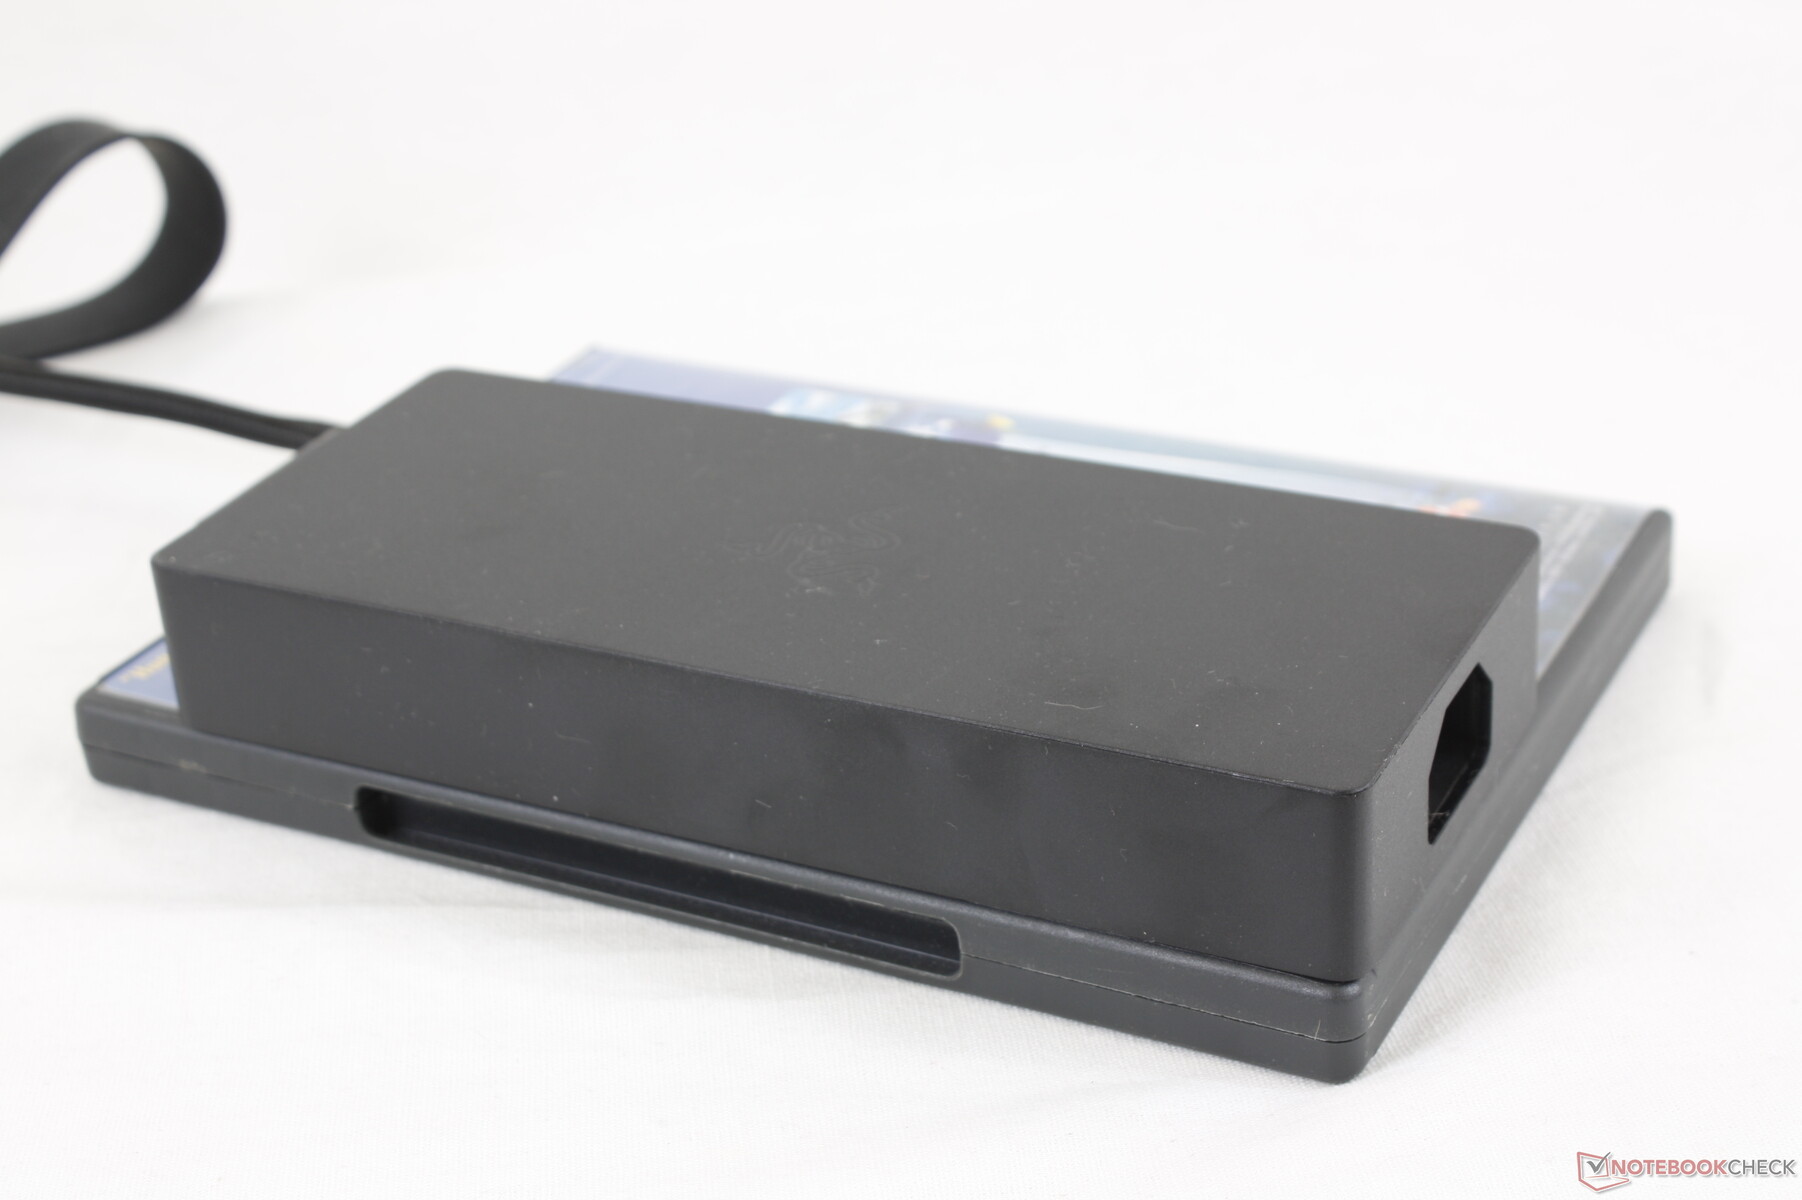
Podemos medir un consumo máximo de 197 W desde el adaptador de CA pequeño-mediano (~17 x 7 x 2,5 cm) de 230 W cuando se ejecuta Prime95 y FurMark simultáneamente. La batería seguirá recargándose incluso si se somete a cargas de procesamiento tan extremas.
| Off / Standby | |
| Ocioso | |
| Carga |
|
Clave:
min: | |
| Razer Blade 15 Base Edition 2021, i7-10750H RTX 3060 i7-10750H, GeForce RTX 3060 Laptop GPU, Samsung SSD PM981a MZVLB512HBJQ, IPS, 1920x1080, 15.6" | Razer Blade 15 RTX 2070 Super Max-Q i7-10875H, GeForce RTX 2070 Super Max-Q, Samsung SSD PM981a MZVLB512HBJQ, IPS, 1920x1080, 15.6" | MSI GS66 Stealth 10UG i7-10870H, GeForce RTX 3070 Laptop GPU, WDC PC SN730 SDBPNTY-1T00, IPS, 1920x1080, 15.6" | MSI GF65 Thin 10UE i7-10750H, GeForce RTX 3060 Laptop GPU, Samsung SSD PM981 MZVLB1T0HALR, IPS, 1920x1080, 15.6" | Asus ROG Zephyrus M15 GU502LU-BI7N4 i7-10750H, GeForce GTX 1660 Ti Mobile, Intel SSD 660p SSDPEKNW512G8, IPS, 1920x1080, 15.6" | |
|---|---|---|---|---|---|
| Power Consumption | -22% | -6% | 24% | -5% | |
| Idle Minimum * (Watt) | 11.7 | 14.3 -22% | 12.9 -10% | 5.4 54% | 10 15% |
| Idle Average * (Watt) | 16 | 22.3 -39% | 15.4 4% | 12.8 20% | 16.9 -6% |
| Idle Maximum * (Watt) | 29.3 | 36.9 -26% | 27.1 8% | 19.5 33% | 28.3 3% |
| Load Average * (Watt) | 95.6 | 118.4 -24% | 98.2 -3% | 86.6 9% | 122.7 -28% |
| Witcher 3 ultra * (Watt) | 141.3 | 153.7 -9% | 164.9 -17% | 115.7 18% | 143.2 -1% |
| Load Maximum * (Watt) | 197 | 220.8 -12% | 232.9 -18% | 175.2 11% | 224.1 -14% |
* ... más pequeño es mejor
Duración de la batería
La capacidad de la batería es menor que en el modelo Blade 15 Advanced (65 Wh frente a 80 Wh) y los tiempos de funcionamiento son más cortos como resultado. Pudimos registrar algo menos de 5 horas de uso WLAN en el mundo real comparado con casi 6,5 horas en el Blade 15 Advanced.
La carga de vacío a plena capacidad es relativamente rápida, aproximadamente 90 minutos. Los usuarios no pueden recargar el Modelo Base por USB-C; esa característica está reservada sólo para el Modelo Avanzado.
| Razer Blade 15 Base Edition 2021, i7-10750H RTX 3060 i7-10750H, GeForce RTX 3060 Laptop GPU, 65 Wh | Razer Blade 15 RTX 2070 Super Max-Q i7-10875H, GeForce RTX 2070 Super Max-Q, 80 Wh | Asus ROG Strix G15 G513QR R9 5900HX, GeForce RTX 3070 Laptop GPU, 90 Wh | MSI GS66 Stealth 10UG i7-10870H, GeForce RTX 3070 Laptop GPU, 99.9 Wh | MSI GF65 Thin 10UE i7-10750H, GeForce RTX 3060 Laptop GPU, 51 Wh | Asus ROG Zephyrus M15 GU502LU-BI7N4 i7-10750H, GeForce GTX 1660 Ti Mobile, 76 Wh | |
|---|---|---|---|---|---|---|
| Duración de Batería | 31% | 34% | 44% | 4% | 23% | |
| Reader / Idle (h) | 7.8 | 10.8 38% | 11.1 42% | |||
| WiFi v1.3 (h) | 4.8 | 6.3 31% | 7.4 54% | 7.1 48% | 4.6 -4% | 5.9 23% |
| Load (h) | 1.5 | 1.7 13% | 2.2 47% | 1.1 -27% |
Pro
Contra
Veredicto
En el momento de escribir este artículo, el Blade 15 Base Edition 2021 con gráficos GeForce RTX 3060 y el Blade 15 Base Edition 2020 con gráficos RTX 2070 Max-Q cuestan 1700 y 1600 dólares, respectivamente. Ambos vienen con la misma CPU, pantalla de 144 Hz, 16 GB de RAM y 512 GB de SSD. Basándonos en nuestras pruebas de juego, sin embargo, la opción RTX 3060 ejecutará los juegos más rápido por márgenes leves o moderados, especialmente en títulos exigentes con los ajustes al máximo. Es un poco más caro, pero los usuarios obtienen a cambio un poco más de potencia de la GPU más eficiente y también con soporte de la barra restablecida.
La configuración 2021 Blade 15 RTX 3060 más barata de Razer está a la par con la opción GeForce RTX 2080 Max-Q del año pasado. Es una buena razón para actualizar para los jugadores con Pascal o portátiles más antiguos, pero los que tienen portátiles Turing no se pierden mucho aquí.
La Base Edition 2021 sigue siendo una actualización menor de un año a otro, lo que significa que conserva casi todas las ventajas y desventajas de la versión 2020. El rendimiento de la CPU sigue siendo mediocre y un montón de características siguen ausentes, incluyendo la carga USB-C y la iluminación RGB por tecla a pesar del precio inicial relativamente alto. Es una pena que los usuarios no puedan fusionar el modo Creador y el modo Juego en un solo modo "Super", ya que el máximo rendimiento de la CPU y el máximo rendimiento de la GPU son mutuamente excluyentes en este sistema. Alcanzar frecuencias de cuadro muy altas, por encima de los 100 FPS, será más difícil en algunos juegos.
Precio y disponibilidad
Razer Blade 15 Base Edition 2021, i7-10750H RTX 3060
- 03/14/2021 v7 (old)
Allen Ngo
Price comparison

