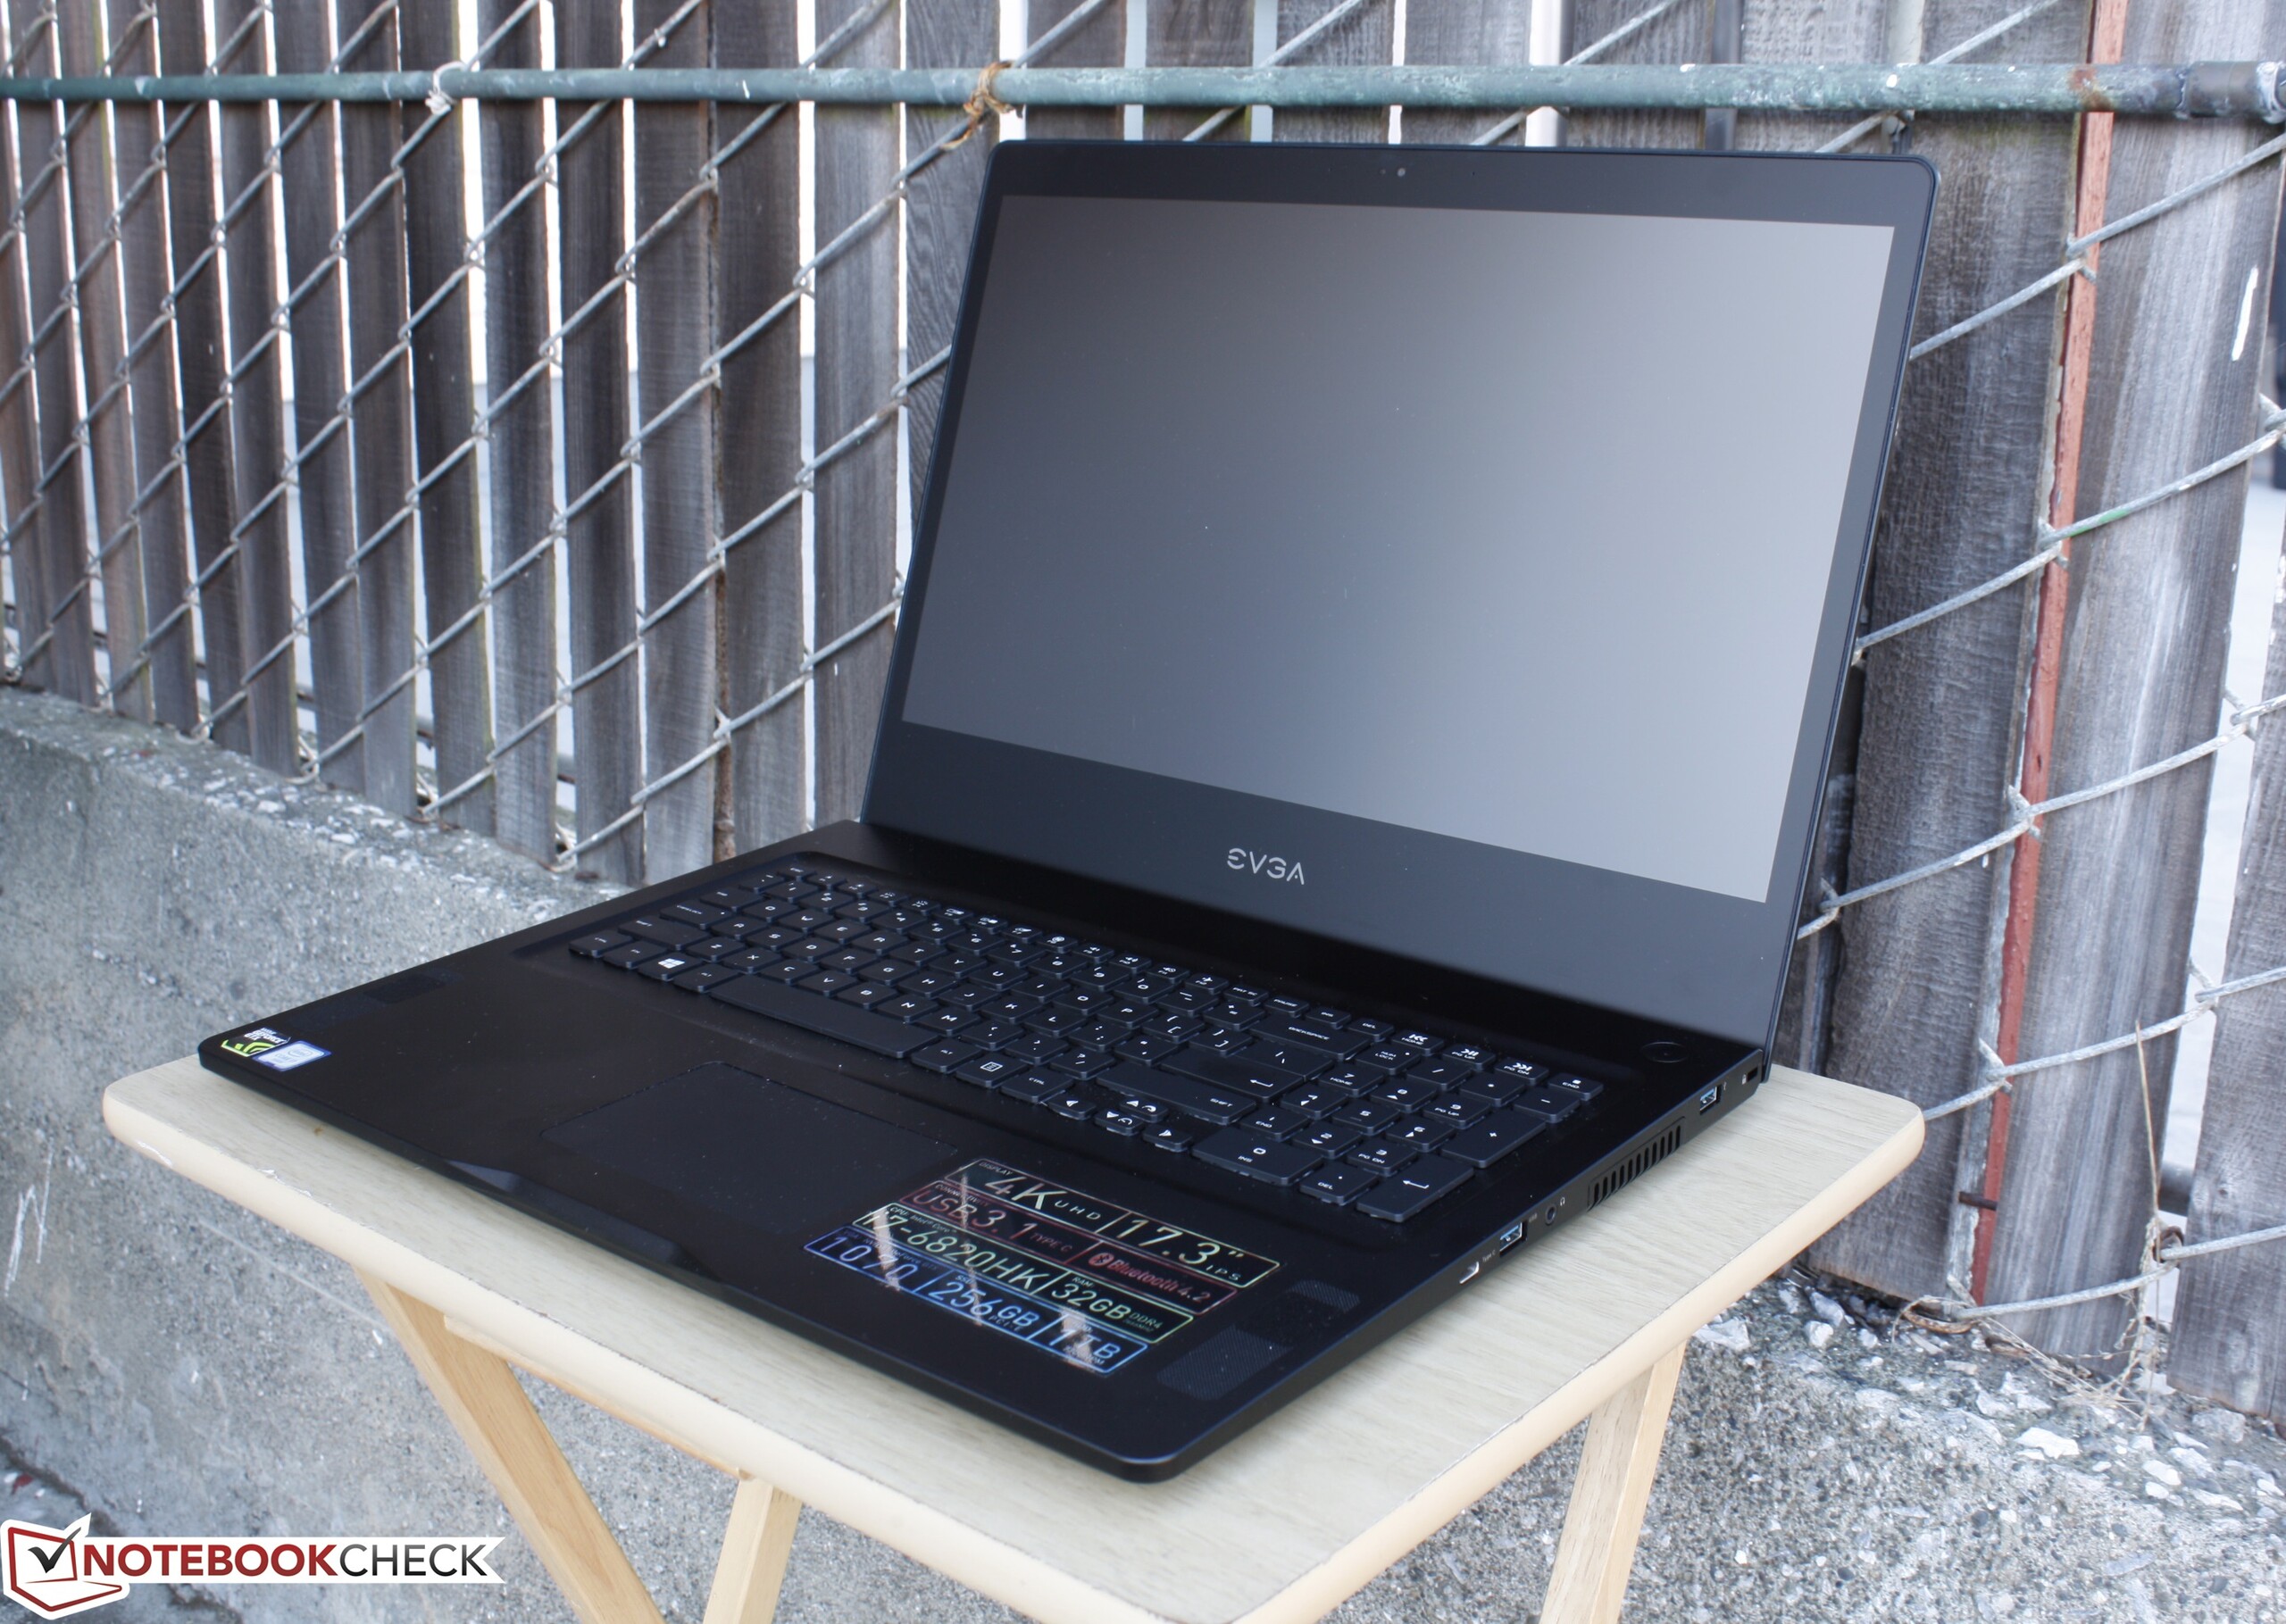
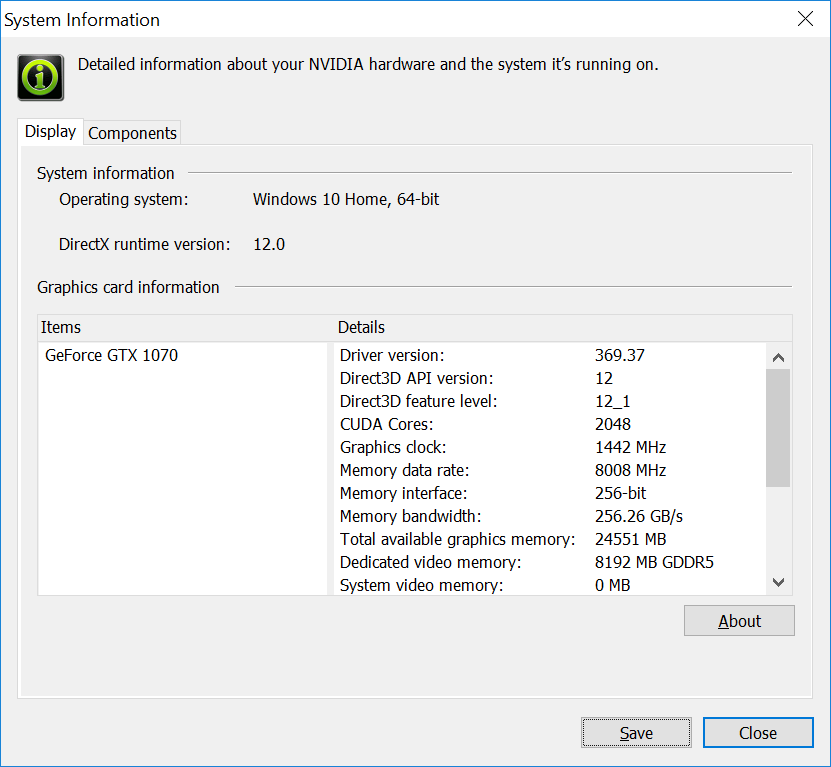
Breve análisis del EVGA SC17 GTX 1070


| Networking | |
| iperf3 transmit AX12 | |
| EVGA SC17 GTX 1070 | |
| iperf3 receive AX12 | |
| EVGA SC17 GTX 1070 | |
| |||||||||||||||||||||||||
iluminación: 81 %
Brillo con batería: 399.1 cd/m²
Contraste: 998:1 (Negro: 0.4 cd/m²)
ΔE ColorChecker Calman: 4.78 | ∀{0.5-29.43 Ø4.73}
ΔE Greyscale Calman: 3.8 | ∀{0.09-98 Ø4.97}
100% sRGB (Argyll 1.6.3 3D)
86.9% AdobeRGB 1998 (Argyll 1.6.3 3D)
98.8% AdobeRGB 1998 (Argyll 3D)
100% sRGB (Argyll 3D)
87.3% Display P3 (Argyll 3D)
Gamma: 2.03
CCT: 7288 K
| EVGA SC17 GTX 1070 Sharp LQ173D1JW31, IPS, 17.3", 3840x2160 | Aorus X7 v6 B173QTN01.0 (AUO1096), TN LED, 17.3", 2560x1440 | MSI GT73VR 6RF IPS, 17.3", 3840x2160 | Eurocom Sky X7E2 IPS, 17.3", 3840x2160 | HP Omen 17-w110ng LG Philips LGD046E, IPS, 17.3", 1920x1080 | |
|---|---|---|---|---|---|
| Display | -28% | -22% | -0% | -26% | |
| Display P3 Coverage (%) | 87.3 | 60.9 -30% | 63.6 -27% | 86.6 -1% | 66.6 -24% |
| sRGB Coverage (%) | 100 | 84.2 -16% | 95.8 -4% | 100 0% | 84.1 -16% |
| AdobeRGB 1998 Coverage (%) | 98.8 | 61.2 -38% | 65.7 -34% | 99.2 0% | 61.5 -38% |
| Response Times | 52% | 21% | 40% | 26% | |
| Response Time Grey 50% / Grey 80% * (ms) | 45.6 ? | 31 ? 32% | 33.6 ? 26% | 28 ? 39% | 37 ? 19% |
| Response Time Black / White * (ms) | 35.2 ? | 10 ? 72% | 30 ? 15% | 21.2 ? 40% | 24 ? 32% |
| PWM Frequency (Hz) | 1042 ? | ||||
| Screen | -33% | -12% | -9% | -3% | |
| Brightness middle (cd/m²) | 399.1 | 343 -14% | 334.8 -16% | 332.6 -17% | 362 -9% |
| Brightness (cd/m²) | 360 | 312 -13% | 316 -12% | 329 -9% | 342 -5% |
| Brightness Distribution (%) | 81 | 80 -1% | 87 7% | 87 7% | 87 7% |
| Black Level * (cd/m²) | 0.4 | 0.5 -25% | 0.422 -6% | 0.314 22% | 0.31 23% |
| Contrast (:1) | 998 | 686 -31% | 793 -21% | 1059 6% | 1168 17% |
| Colorchecker dE 2000 * | 4.78 | 7.33 -53% | 4.11 14% | 5.94 -24% | 4.5 6% |
| Colorchecker dE 2000 max. * | 7.65 | 10.79 -41% | 7.8 -2% | 8.6 -12% | 9.31 -22% |
| Greyscale dE 2000 * | 3.8 | 7.6 -100% | 5.74 -51% | 6.27 -65% | 3.48 8% |
| Gamma | 2.03 108% | 2.19 100% | 2.3 96% | 2.2 100% | 2.23 99% |
| CCT | 7288 89% | 9024 72% | 5987 109% | 6704 97% | 6144 106% |
| Color Space (Percent of AdobeRGB 1998) (%) | 86.9 | 55 -37% | 60.5 -30% | 91 5% | 55 -37% |
| Color Space (Percent of sRGB) (%) | 100 | 84 -16% | 96 -4% | 100 0% | 84 -16% |
| Media total (Programa/Opciones) | -3% /
-21% | -4% /
-10% | 10% /
-1% | -1% /
-4% |
* ... más pequeño es mejor
Tiempos de respuesta del display
| ↔ Tiempo de respuesta de Negro a Blanco | ||
|---|---|---|
| 35.2 ms ... subida ↗ y bajada ↘ combinada | ↗ 9.2 ms subida | 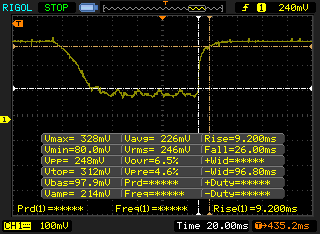 |
| ↘ 26 ms bajada | ||
| La pantalla mostró tiempos de respuesta lentos en nuestros tests y podría ser demasiado lenta para los jugones. En comparación, todos los dispositivos de prueba van de ##min### (mínimo) a 240 (máximo) ms. » 93 % de todos los dispositivos son mejores. Eso quiere decir que el tiempo de respuesta es peor que la media (19.9 ms) de todos los dispositivos testados. | ||
| ↔ Tiempo de respuesta 50% Gris a 80% Gris | ||
| 45.6 ms ... subida ↗ y bajada ↘ combinada | ↗ 22.8 ms subida | 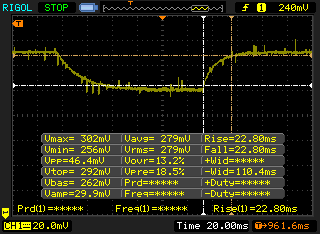 |
| ↘ 22.8 ms bajada | ||
| La pantalla mostró tiempos de respuesta lentos en nuestros tests y podría ser demasiado lenta para los jugones. En comparación, todos los dispositivos de prueba van de ##min### (mínimo) a 636 (máximo) ms. » 78 % de todos los dispositivos son mejores. Eso quiere decir que el tiempo de respuesta es peor que la media (31.1 ms) de todos los dispositivos testados. | ||
Parpadeo de Pantalla / PWM (Pulse-Width Modulation)
| Parpadeo de Pantalla / PWM detectado | 1042 Hz | ≤ 29 % de brillo | 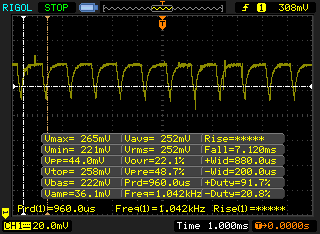 |
La retroiluminación del display parpadea a 1042 Hz (seguramente usa PWM - Pulse-Width Modulation) a un brillo del 29 % e inferior. Sobre este nivel de brillo no debería darse parpadeo / PWM. La frecuencia de 1042 Hz es bastante alta, por lo que la mayoría de gente sensible al parpadeo no debería ver parpadeo o tener fatiga visual. Comparación: 52 % de todos los dispositivos testados no usaron PWM para atenuar el display. Si se usó, medimos una media de 7801 (mínimo: 5 - máxmo: 343500) Hz. | |||

| Cinebench R15 | |
| CPU Single 64Bit | |
| MSI GT73VR 6RF | |
| Eurocom Sky X7E2 | |
| EVGA SC17 GTX 1070 | |
| MSI GE62 2QC-468XPL | |
| Asus R510JX-DM149H | |
| Toshiba Satellite S70-B-106 | |
| CPU Multi 64Bit | |
| Eurocom Sky X7E2 | |
| MSI GT73VR 6RF | |
| MSI GE62 2QC-468XPL | |
| EVGA SC17 GTX 1070 | |
| Asus R510JX-DM149H | |
| Toshiba Satellite S70-B-106 | |
| Cinebench R11.5 | |
| CPU Single 64Bit | |
| MSI GT73VR 6RF | |
| Eurocom Sky X7E2 | |
| MSI GE62 2QC-468XPL | |
| EVGA SC17 GTX 1070 | |
| Toshiba Satellite S70-B-106 | |
| CPU Multi 64Bit | |
| MSI GT73VR 6RF | |
| Eurocom Sky X7E2 | |
| MSI GE62 2QC-468XPL | |
| EVGA SC17 GTX 1070 | |
| Toshiba Satellite S70-B-106 | |
| Cinebench R10 | |
| Rendering Multiple CPUs 32Bit | |
| MSI GT73VR 6RF | |
| Eurocom Sky X7E2 | |
| MSI GE62 2QC-468XPL | |
| EVGA SC17 GTX 1070 | |
| Rendering Single 32Bit | |
| Eurocom Sky X7E2 | |
| MSI GT73VR 6RF | |
| EVGA SC17 GTX 1070 | |
| MSI GE62 2QC-468XPL | |
| wPrime 2.10 - 1024m | |
| Asus R510JX-DM149H | |
| EVGA SC17 GTX 1070 | |
| MSI GE62 2QC-468XPL | |
| Eurocom Sky X7E2 | |
| Super Pi Mod 1.5 XS 32M - 32M | |
| MSI GE62 2QC-468XPL | |
| EVGA SC17 GTX 1070 | |
| Asus R510JX-DM149H | |
| Eurocom Sky X7E2 | |
* ... más pequeño es mejor
| PCMark 8 | |
| Home Score Accelerated v2 | |
| HP Omen 17-w110ng | |
| Eurocom Sky X7E2 | |
| EVGA SC17 GTX 1070 | |
| MSI GT73VR 6RF | |
| EVGA SC17 | |
| Work Score Accelerated v2 | |
| HP Omen 17-w110ng | |
| Eurocom Sky X7E2 | |
| EVGA SC17 GTX 1070 | |
| MSI GT73VR 6RF | |
| EVGA SC17 | |
| Creative Score Accelerated v2 | |
| Eurocom Sky X7E2 | |
| MSI GT73VR 6RF | |
| EVGA SC17 GTX 1070 | |
| HP Omen 17-w110ng | |
| EVGA SC17 | |
| PCMark 8 Home Score Accelerated v2 | 4437 puntos | |
| PCMark 8 Creative Score Accelerated v2 | 7780 puntos | |
| PCMark 8 Work Score Accelerated v2 | 4623 puntos | |
ayuda | ||
| EVGA SC17 GTX 1070 Samsung SM951 MZVPV256 m.2 | Aorus X7 v6 Toshiba NVMe THNSN5512GPU7 | MSI GT73VR 6RF 2x SanDisk X400 1TB M.2 SD8SN8U1T001122 (RAID 0) | Eurocom Sky X7E2 Samsung SM951 MZVPV512HDGL m.2 PCI-e | HP Omen 17-w110ng Samsung PM951 NVMe MZVLV256 | |
|---|---|---|---|---|---|
| CrystalDiskMark 3.0 | 4% | -30% | 11% | -32% | |
| Read Seq (MB/s) | 1658 | 1499 -10% | 914 -45% | 1673 1% | 1156 -30% |
| Write Seq (MB/s) | 1249 | 1411 13% | 916 -27% | 1576 26% | 294.9 -76% |
| Read 512 (MB/s) | 1044 | 966 -7% | 698 -33% | 1180 13% | 616 -41% |
| Write 512 (MB/s) | 1254 | 1103 -12% | 916 -27% | 1561 24% | 294.7 -76% |
| Read 4k (MB/s) | 51.6 | 44.33 -14% | 31.37 -39% | 51.5 0% | 42.7 -17% |
| Write 4k (MB/s) | 145.2 | 155.5 7% | 65.7 -55% | 144 -1% | 153.3 6% |
| Read 4k QD32 (MB/s) | 601 | 696 16% | 425 -29% | 694 15% | 600 0% |
| Write 4k QD32 (MB/s) | 386.8 | 531 37% | 441.8 14% | 422.1 9% | 295.3 -24% |

| 3DMark | |
| 3840x2160 Fire Strike Ultra Graphics | |
| Nvidia GeForce GTX 1080 Founders Edition | |
| Nvidia GeForce GTX 1070 Founders Edition | |
| EVGA SC17 GTX 1070 | |
| Asus G701VO-CS74K | |
| MSI GT72VR 6RD-063US | |
| EVGA SC17 | |
| Fire Strike Extreme Graphics | |
| Nvidia GeForce GTX 1080 Founders Edition | |
| EVGA SC17 GTX 1070 | |
| Asus G701VO-CS74K | |
| MSI GT72VR 6RD-063US | |
| EVGA SC17 | |
| 1920x1080 Fire Strike Graphics | |
| Nvidia GeForce GTX 1080 Founders Edition | |
| MSI GT80-2QES32SR311BW | |
| EVGA SC17 GTX 1070 | |
| Nvidia GeForce GTX 1070 Founders Edition | |
| Asus G701VO-CS74K | |
| MSI GT72VR 6RD-063US | |
| EVGA SC17 | |
| 3DMark 11 | |
| 1280x720 Performance GPU | |
| Nvidia GeForce GTX 1080 Founders Edition | |
| Nvidia GeForce GTX 1070 Founders Edition | |
| EVGA SC17 GTX 1070 | |
| MSI GT80-2QES32SR311BW | |
| Asus G701VO-CS74K | |
| EVGA SC17 | |
| MSI GT72VR 6RD-063US | |
| 1280x720 Performance Combined | |
| Nvidia GeForce GTX 1080 Founders Edition | |
| Nvidia GeForce GTX 1070 Founders Edition | |
| MSI GT80-2QES32SR311BW | |
| EVGA SC17 GTX 1070 | |
| EVGA SC17 | |
| Asus G701VO-CS74K | |
| MSI GT72VR 6RD-063US | |
| 3DMark 11 Performance | 16824 puntos | |
| 3DMark Ice Storm Standard Score | 136715 puntos | |
| 3DMark Cloud Gate Standard Score | 26217 puntos | |
| 3DMark Fire Strike Score | 13287 puntos | |
| 3DMark Fire Strike Extreme Score | 7357 puntos | |
ayuda | ||
| Rise of the Tomb Raider | |
| 1920x1080 Very High Preset AA:FX AF:16x | |
| Aorus X5 v6 | |
| EVGA SC17 GTX 1070 | |
| MSI GT72VR 6RD-063US | |
| Asus G701VO-CS74K | |
| Asus Strix GL502VY-DS71 | |
| Asus Strix GL502VT-DS74 | |
| 3840x2160 High Preset AA:FX AF:4x | |
| MSI GT73VR 6RF | |
| EVGA SC17 GTX 1070 | |
| Guild Wars 2 - 1920x1080 All Maximum / On AA:FX | |
| Aorus X5 v6 | |
| EVGA SC17 GTX 1070 | |
| MSI GT72VR 6RD-063US | |
| BioShock Infinite - 1920x1080 Ultra Preset, DX11 (DDOF) | |
| Aorus X5 v6 | |
| EVGA SC17 GTX 1070 | |
| Asus G701VO-CS74K | |
| MSI GT72VR 6RD-063US | |
| Asus Strix GL502VY-DS71 | |
| Asus Strix GL502VT-DS74 | |
| Metro: Last Light - 1920x1080 Very High (DX11) AF:16x | |
| Aorus X5 v6 | |
| EVGA SC17 GTX 1070 | |
| Asus G701VO-CS74K | |
| MSI GT72VR 6RD-063US | |
| Asus Strix GL502VT-DS74 | |
| Thief - 1920x1080 Very High Preset AA:FXAA & High SS AF:8x | |
| Aorus X5 v6 | |
| EVGA SC17 GTX 1070 | |
| MSI GT72VR 6RD-063US | |
| Asus G701VO-CS74K | |
| Asus Strix GL502VY-DS71 | |
| Asus Strix GL502VT-DS74 | |
| Batman: Arkham Knight | |
| 1920x1080 High / On AA:SM AF:16x | |
| Aorus X5 v6 | |
| EVGA SC17 GTX 1070 | |
| Asus G701VO-CS74K | |
| MSI GT72VR 6RD-063US | |
| Asus Strix GL502VT-DS74 | |
| 3840x2160 High / On (Interactive Smoke & Paper Debris Off) AA:SM AF:8x | |
| MSI GT73VR 6RF | |
| EVGA SC17 GTX 1070 | |
| Fallout 4 | |
| 1920x1080 Ultra Preset AA:T AF:16x | |
| Aorus X5 v6 | |
| EVGA SC17 GTX 1070 | |
| Asus G701VO-CS74K | |
| MSI GT72VR 6RD-063US | |
| Asus Strix GL502VY-DS71 | |
| Asus Strix GL502VT-DS74 | |
| 3840x2160 High Preset AA:T AF:16x | |
| MSI GT73VR 6RF | |
| EVGA SC17 GTX 1070 | |
| Doom | |
| 1920x1080 Ultra Preset AA:SM | |
| Aorus X5 v6 | |
| EVGA SC17 GTX 1070 | |
| MSI GT72VR 6RD-063US | |
| Asus G701VO-CS74K | |
| Asus Strix GL502VY-DS71 | |
| 3840x2160 High Preset AA:FX | |
| MSI GT73VR 6RF | |
| EVGA SC17 GTX 1070 | |
| Overwatch - 3840x2160 High (Render Scale 100 %) AA:SM AF:4x | |
| MSI GT73VR 6RF | |
| EVGA SC17 GTX 1070 | |
| Mafia 3 | |
| 1920x1080 High Preset | |
| MSI GT73VR 6RF | |
| EVGA SC17 GTX 1070 | |
| 3840x2160 High Preset | |
| EVGA SC17 GTX 1070 | |
| bajo | medio | alto | ultra | 4K | |
|---|---|---|---|---|---|
| Guild Wars 2 (2012) | 63.9 | ||||
| BioShock Infinite (2013) | 131.8 | ||||
| Metro: Last Light (2013) | 114 | ||||
| Thief (2014) | 103.2 | ||||
| Batman: Arkham Knight (2015) | 87 | 45 | |||
| Metal Gear Solid V (2015) | 60 | 60 | |||
| Fallout 4 (2015) | 102.9 | 44.3 | |||
| Rise of the Tomb Raider (2016) | 96.4 | 40.6 | |||
| Doom (2016) | 118.8 | 50.6 | |||
| Overwatch (2016) | 83.5 | ||||
| Mafia 3 (2016) | 62 | 22.1 |
Ruido
| Ocioso |
| 33.9 / 33.9 / 33.9 dB(A) |
| Carga |
| 43.8 / 53.4 dB(A) |
 | ||
30 dB silencioso 40 dB(A) audible 50 dB(A) ruidosamente alto |
||
min: | ||
| EVGA SC17 GTX 1070 GeForce GTX 1070 Mobile, 6820HK, Samsung SM951 MZVPV256 m.2 | Aorus X7 v6 GeForce GTX 1070 Mobile, 6820HK, Toshiba NVMe THNSN5512GPU7 | MSI GT73VR 6RF GeForce GTX 1080 Mobile, 6820HK, 2x SanDisk X400 1TB M.2 SD8SN8U1T001122 (RAID 0) | Eurocom Sky X7E2 GeForce GTX 1080 Mobile, 6700K, Samsung SM951 MZVPV512HDGL m.2 PCI-e | HP Omen 17-w110ng GeForce GTX 1070 Mobile, 6700HQ, Samsung PM951 NVMe MZVLV256 | EVGA SC17 GeForce GTX 980M, 6820HK, Samsung SSD 950 Pro 512GB m.2 NVMe | |
|---|---|---|---|---|---|---|
| Noise | -3% | -4% | 1% | -1% | 4% | |
| apagado / medio ambiente * (dB) | 29.2 | 30 -3% | 29.2 -0% | 28.9 1% | 30 -3% | 29.1 -0% |
| Idle Minimum * (dB) | 33.9 | 33 3% | 32 6% | 28.9 15% | 33 3% | 33 3% |
| Idle Average * (dB) | 33.9 | 35 -3% | 32 6% | 30.6 10% | 34 -0% | 33.2 2% |
| Idle Maximum * (dB) | 33.9 | 40 -18% | 35 -3% | 35.7 -5% | 35 -3% | 33.7 1% |
| Load Average * (dB) | 43.8 | 43 2% | 50 -14% | 49 -12% | 45 -3% | 41.7 5% |
| Load Maximum * (dB) | 53.4 | 54 -1% | 64 -20% | 55 -3% | 52 3% | 48.2 10% |
* ... más pequeño es mejor
(-) La temperatura máxima en la parte superior es de 47.6 °C / 118 F, frente a la media de 40.4 °C / 105 F, que oscila entre 21.2 y 68.8 °C para la clase Gaming.
(-) El fondo se calienta hasta un máximo de 53.2 °C / 128 F, frente a la media de 43.2 °C / 110 F
(+) En reposo, la temperatura media de la parte superior es de 27.3 °C / 81# F, frente a la media del dispositivo de 33.9 °C / 93 F.
(±) El reposamanos y el touchpad pueden calentarse mucho al tacto con un máximo de 36.6 °C / 97.9 F.
(-) La temperatura media de la zona del reposamanos de dispositivos similares fue de 28.8 °C / 83.8 F (-7.8 °C / -14.1 F).
EVGA SC17 GTX 1070 análisis de audio
(-) | altavoces no muy altos (#64.6 dB)
Graves 100 - 315 Hz
(±) | lubina reducida - en promedio 8.6% inferior a la mediana
(±) | la linealidad de los graves es media (13.9% delta a frecuencia anterior)
Medios 400 - 2000 Hz
(+) | medios equilibrados - a sólo 3.9% de la mediana
(+) | los medios son lineales (6.7% delta a la frecuencia anterior)
Altos 2 - 16 kHz
(+) | máximos equilibrados - a sólo 2.8% de la mediana
(±) | la linealidad de los máximos es media (12.7% delta a frecuencia anterior)
Total 100 - 16.000 Hz
(±) | la linealidad del sonido global es media (24.8% de diferencia con la mediana)
En comparación con la misma clase
» 89% de todos los dispositivos probados de esta clase eran mejores, 3% similares, 7% peores
» El mejor tuvo un delta de 6%, la media fue 18%, el peor fue ###max##%
En comparación con todos los dispositivos probados
» 76% de todos los dispositivos probados eran mejores, 5% similares, 19% peores
» El mejor tuvo un delta de 4%, la media fue 24%, el peor fue ###max##%
Apple MacBook 12 (Early 2016) 1.1 GHz análisis de audio
(+) | los altavoces pueden reproducir a un volumen relativamente alto (#83.6 dB)
Graves 100 - 315 Hz
(±) | lubina reducida - en promedio 11.3% inferior a la mediana
(±) | la linealidad de los graves es media (14.2% delta a frecuencia anterior)
Medios 400 - 2000 Hz
(+) | medios equilibrados - a sólo 2.4% de la mediana
(+) | los medios son lineales (5.5% delta a la frecuencia anterior)
Altos 2 - 16 kHz
(+) | máximos equilibrados - a sólo 2% de la mediana
(+) | los máximos son lineales (4.5% delta a la frecuencia anterior)
Total 100 - 16.000 Hz
(+) | el sonido global es lineal (10.2% de diferencia con la mediana)
En comparación con la misma clase
» 7% de todos los dispositivos probados de esta clase eran mejores, 2% similares, 91% peores
» El mejor tuvo un delta de 5%, la media fue 18%, el peor fue ###max##%
En comparación con todos los dispositivos probados
» 5% de todos los dispositivos probados eran mejores, 1% similares, 94% peores
» El mejor tuvo un delta de 4%, la media fue 24%, el peor fue ###max##%
| Off / Standby | |
| Ocioso | |
| Carga |
|
Clave:
min: | |
| EVGA SC17 GTX 1070 6820HK, GeForce GTX 1070 Mobile, Samsung SM951 MZVPV256 m.2, IPS, 3840x2160, 17.3" | Aorus X7 v6 6820HK, GeForce GTX 1070 Mobile, Toshiba NVMe THNSN5512GPU7, TN LED, 2560x1440, 17.3" | MSI GT73VR 6RF 6820HK, GeForce GTX 1080 Mobile, 2x SanDisk X400 1TB M.2 SD8SN8U1T001122 (RAID 0), IPS, 3840x2160, 17.3" | HP Omen 17-w110ng 6700HQ, GeForce GTX 1070 Mobile, Samsung PM951 NVMe MZVLV256, IPS, 1920x1080, 17.3" | EVGA SC17 6820HK, GeForce GTX 980M, Samsung SSD 950 Pro 512GB m.2 NVMe, IPS, 3840x2160, 17.3" | |
|---|---|---|---|---|---|
| Power Consumption | 2% | -13% | 25% | 11% | |
| Idle Minimum * (Watt) | 27.3 | 29 -6% | 28.9 -6% | 19 30% | 20.9 23% |
| Idle Average * (Watt) | 34.9 | 31 11% | 30.6 12% | 25 28% | 31.7 9% |
| Idle Maximum * (Watt) | 37.6 | 38 -1% | 33.1 12% | 31 18% | 32.6 13% |
| Load Average * (Watt) | 164.4 | 111 32% | 224.4 -36% | 90 45% | 142.8 13% |
| Load Maximum * (Watt) | 202.5 | 253 -25% | 302.6 -49% | 193 5% | 210.5 -4% |
* ... más pequeño es mejor
| EVGA SC17 GTX 1070 6820HK, GeForce GTX 1070 Mobile, 74.48 Wh | Aorus X7 v6 6820HK, GeForce GTX 1070 Mobile, 94 Wh | MSI GT73VR 6RF 6820HK, GeForce GTX 1080 Mobile, 75.2 Wh | Eurocom Sky X7E2 6700K, GeForce GTX 1080 Mobile, 89 Wh | HP Omen 17-w110ng 6700HQ, GeForce GTX 1070 Mobile, 95 Wh | EVGA SC17 6820HK, GeForce GTX 980M, 74.48 Wh | |
|---|---|---|---|---|---|---|
| Duración de Batería | 11% | 24% | -8% | 81% | 33% | |
| Reader / Idle (h) | 4 | 5.1 27% | 2.3 -43% | 7.2 80% | 5.2 30% | |
| WiFi v1.3 (h) | 2.7 | 3 11% | 3.3 22% | 1.7 -37% | 4.1 52% | 3.4 26% |
| Load (h) | 0.9 | 1.1 22% | 1.4 56% | 1.9 111% | 1.3 44% |
Pro
Contra
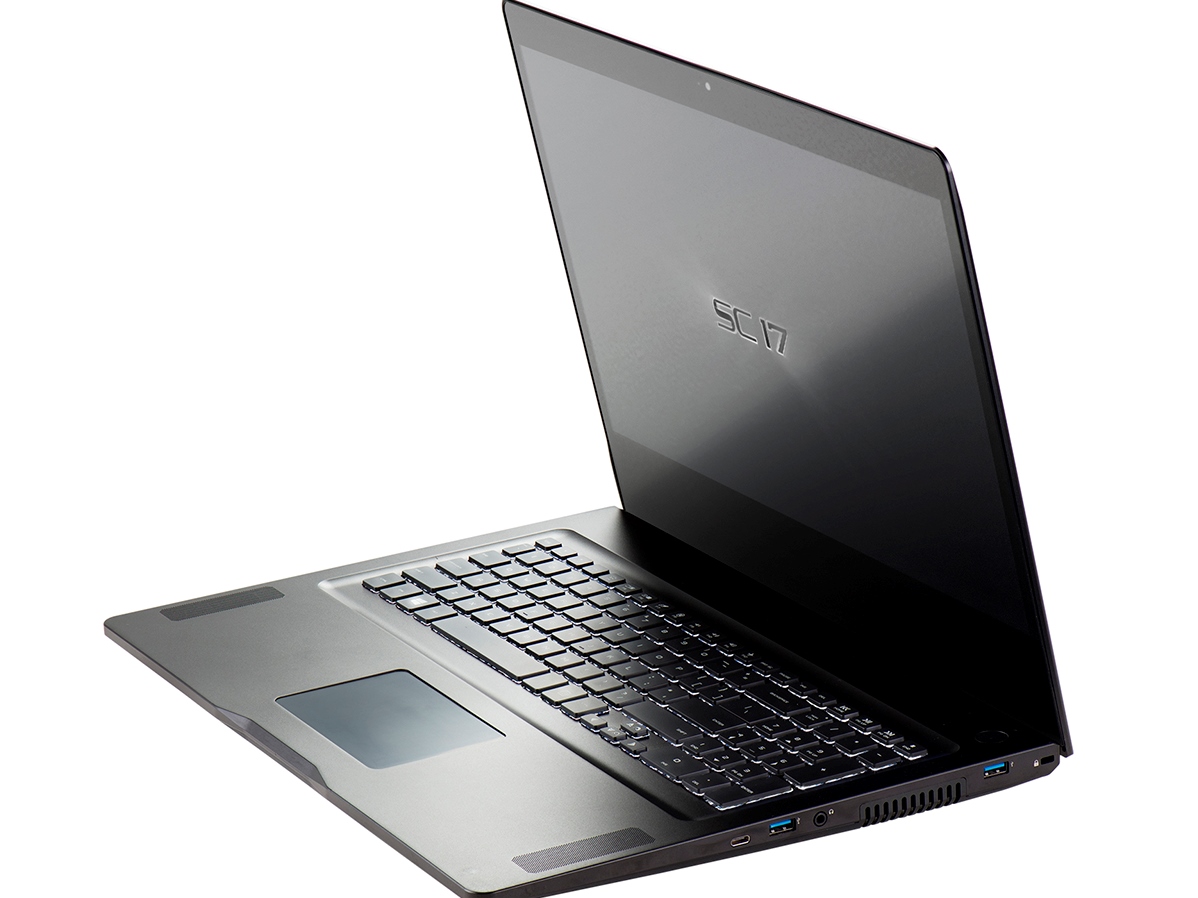
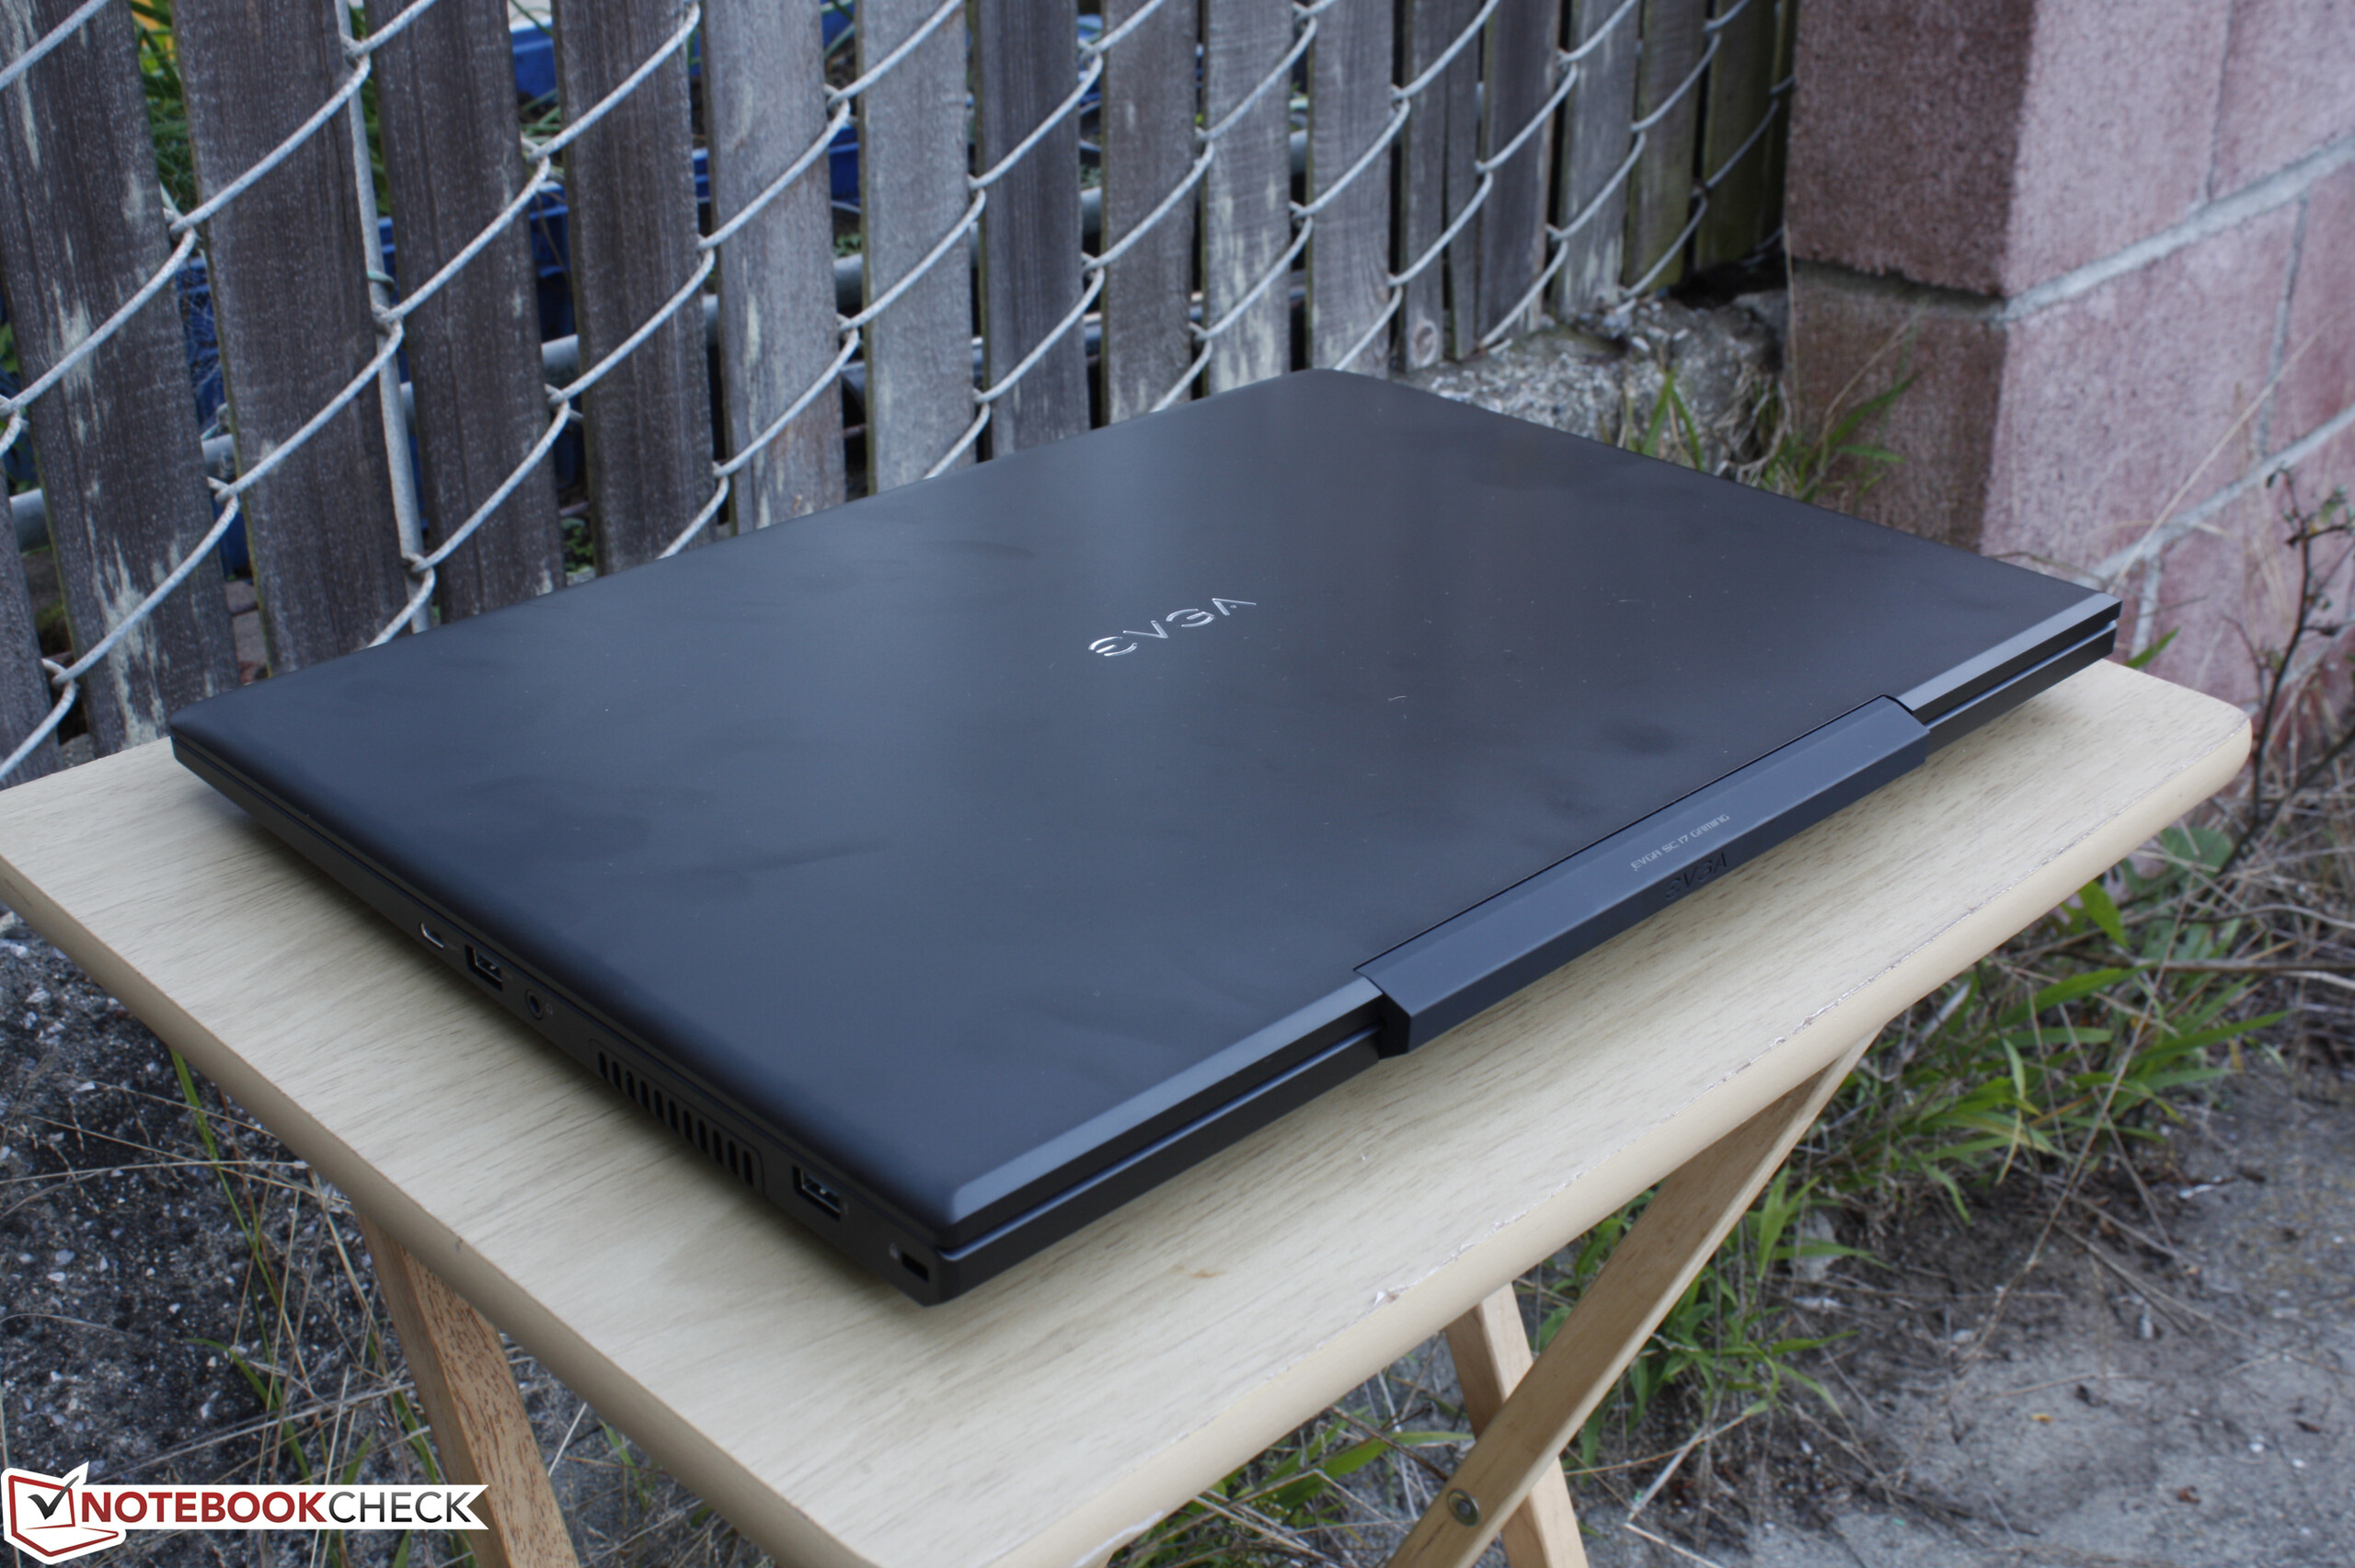
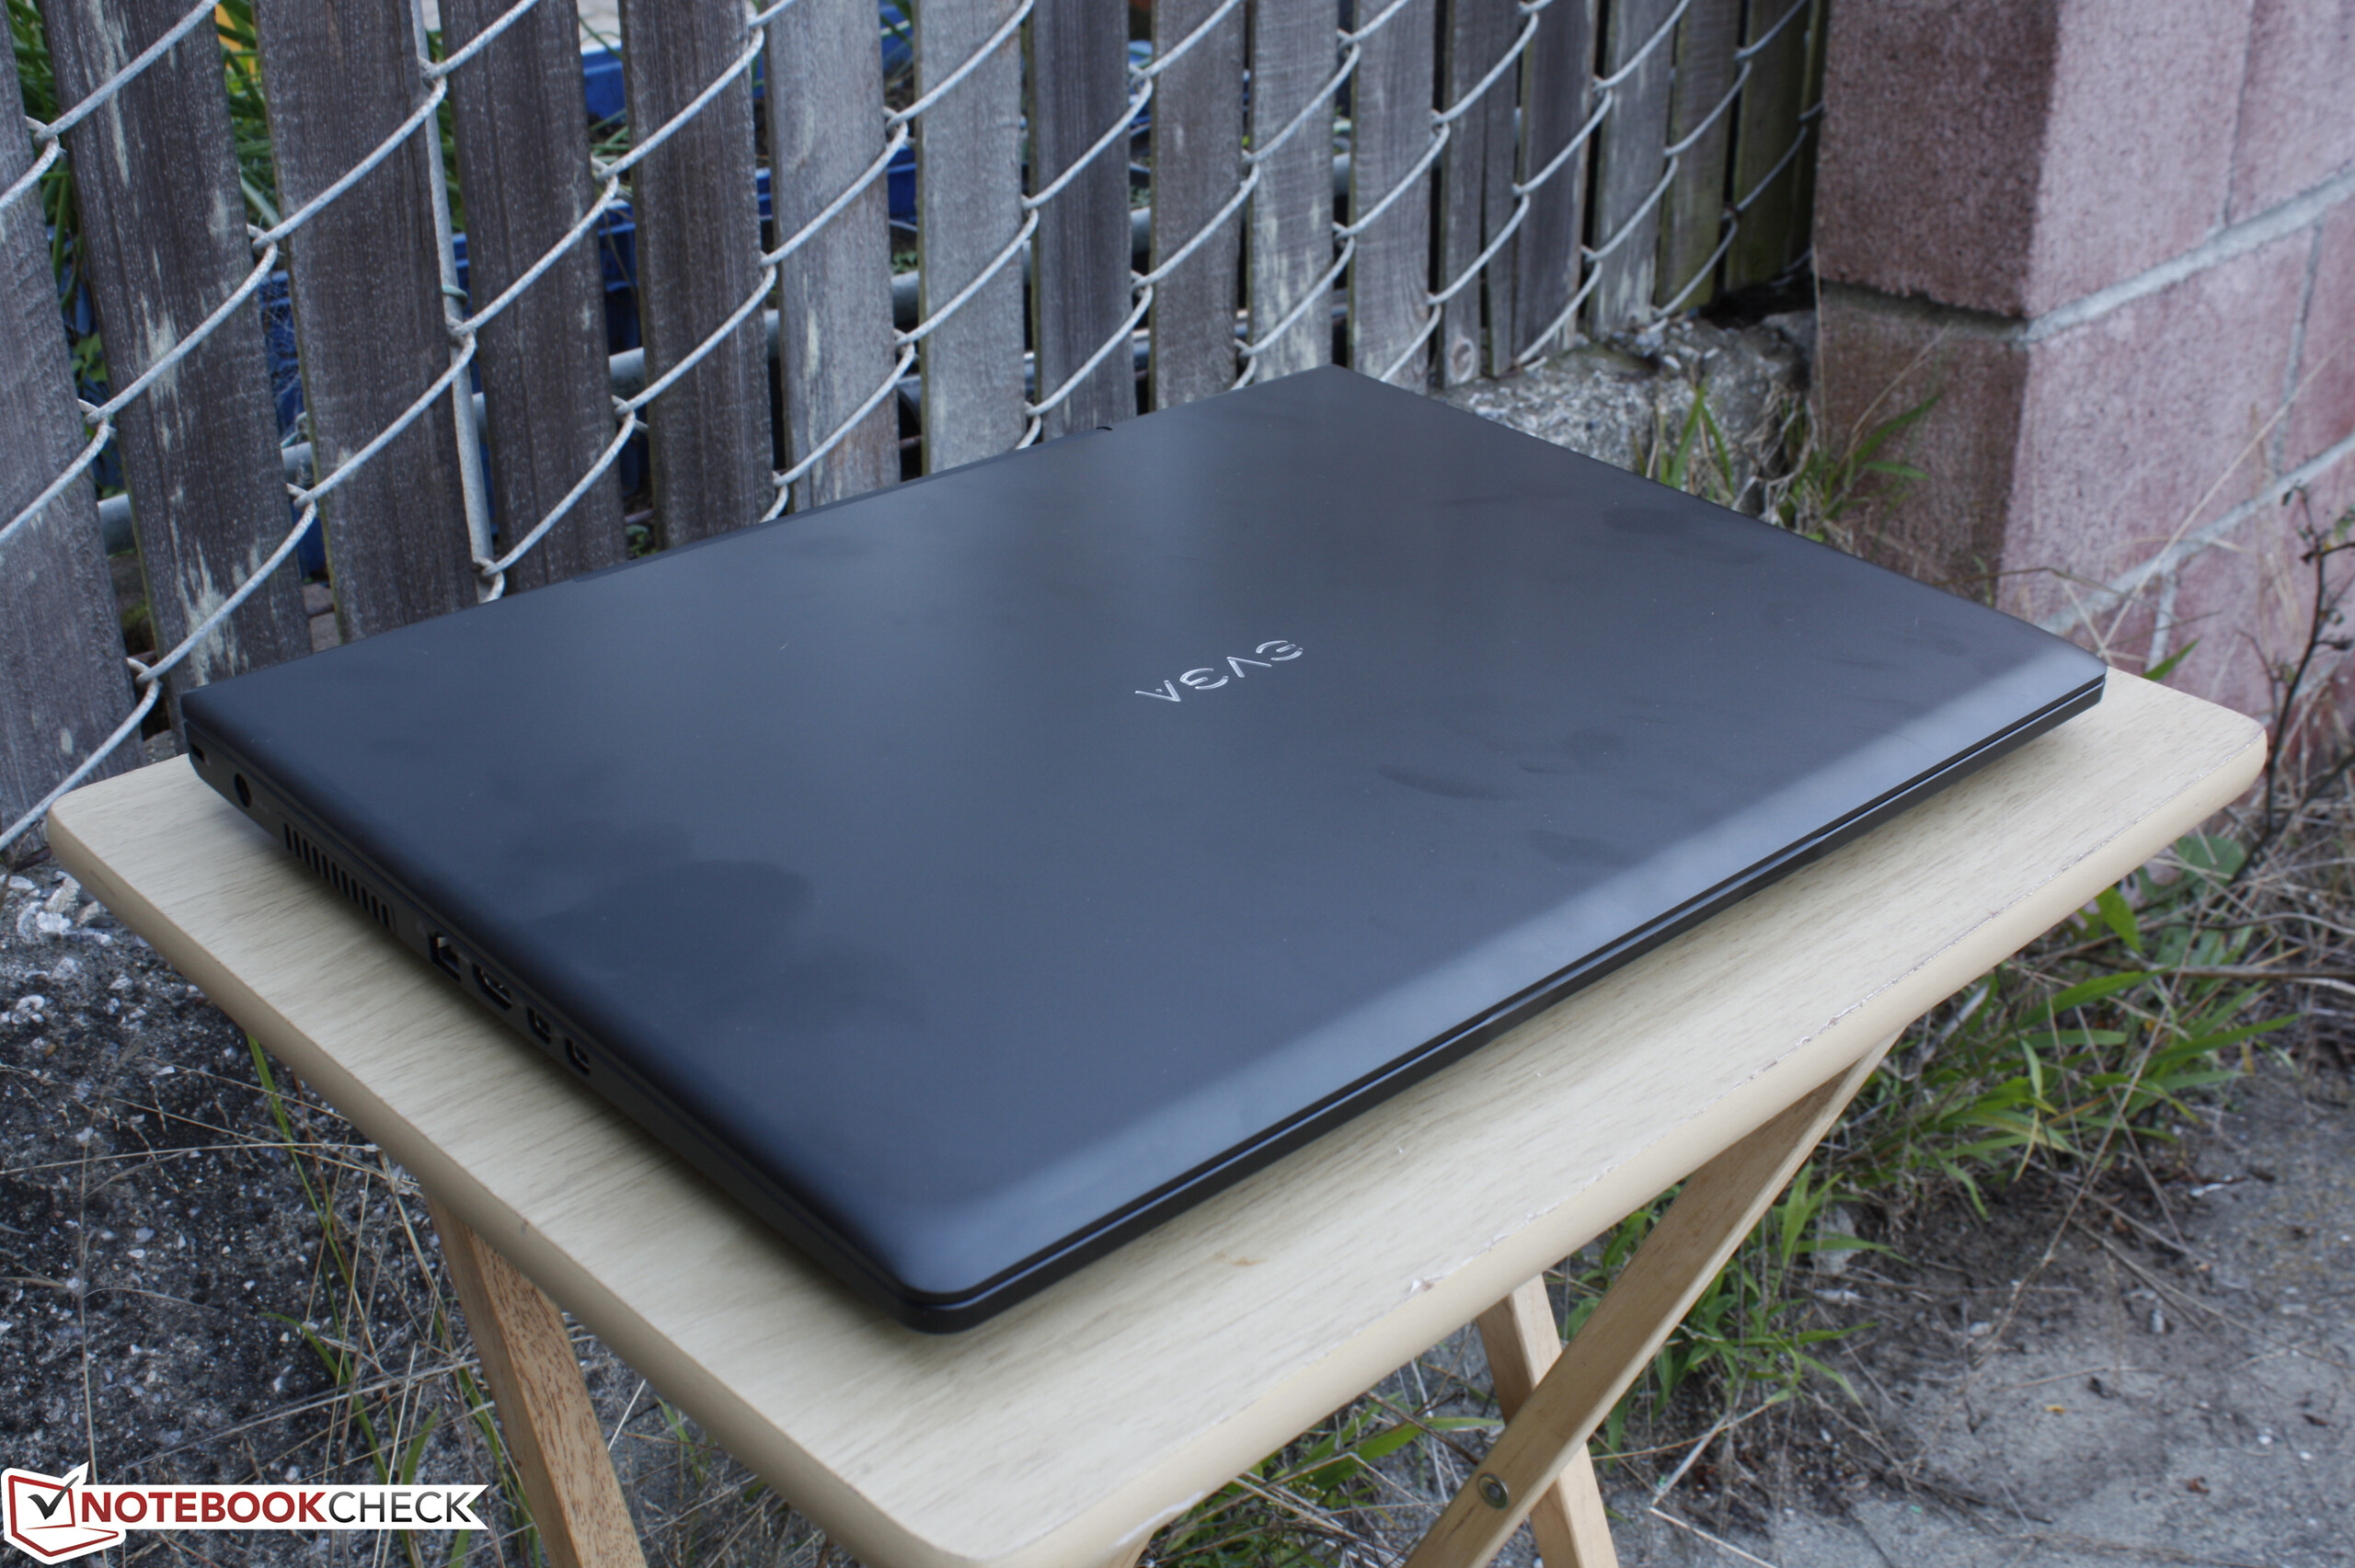
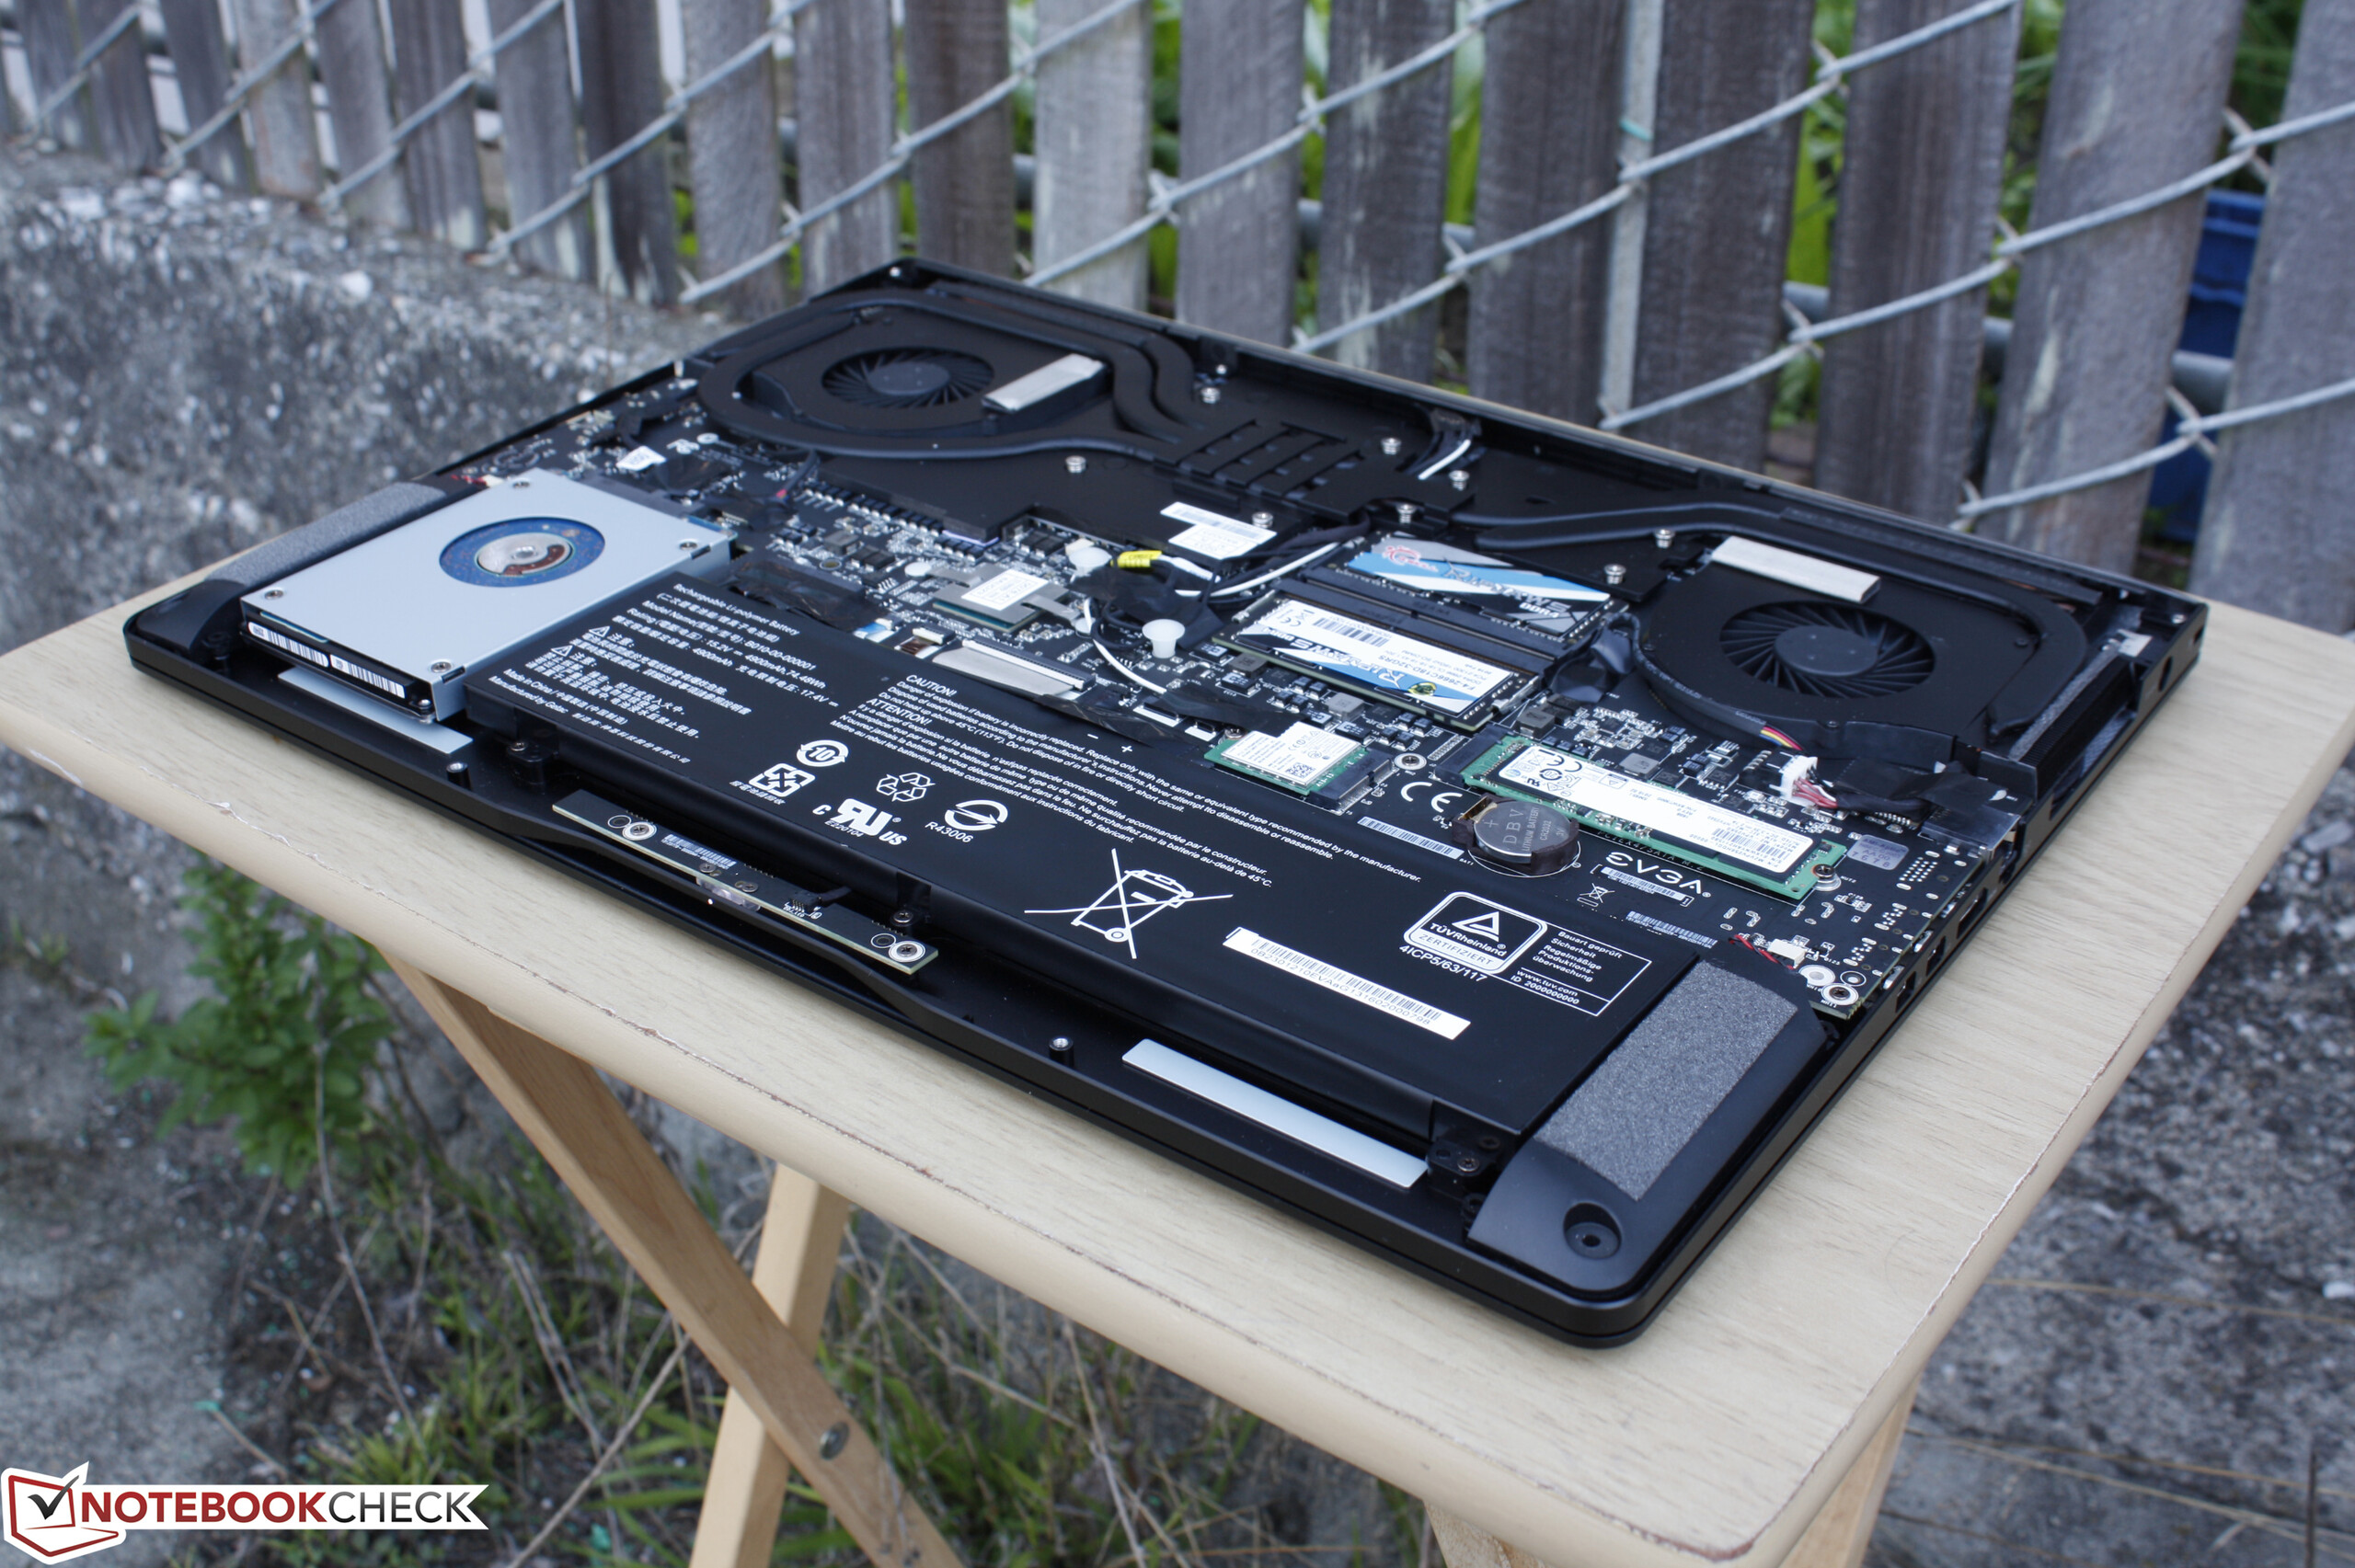
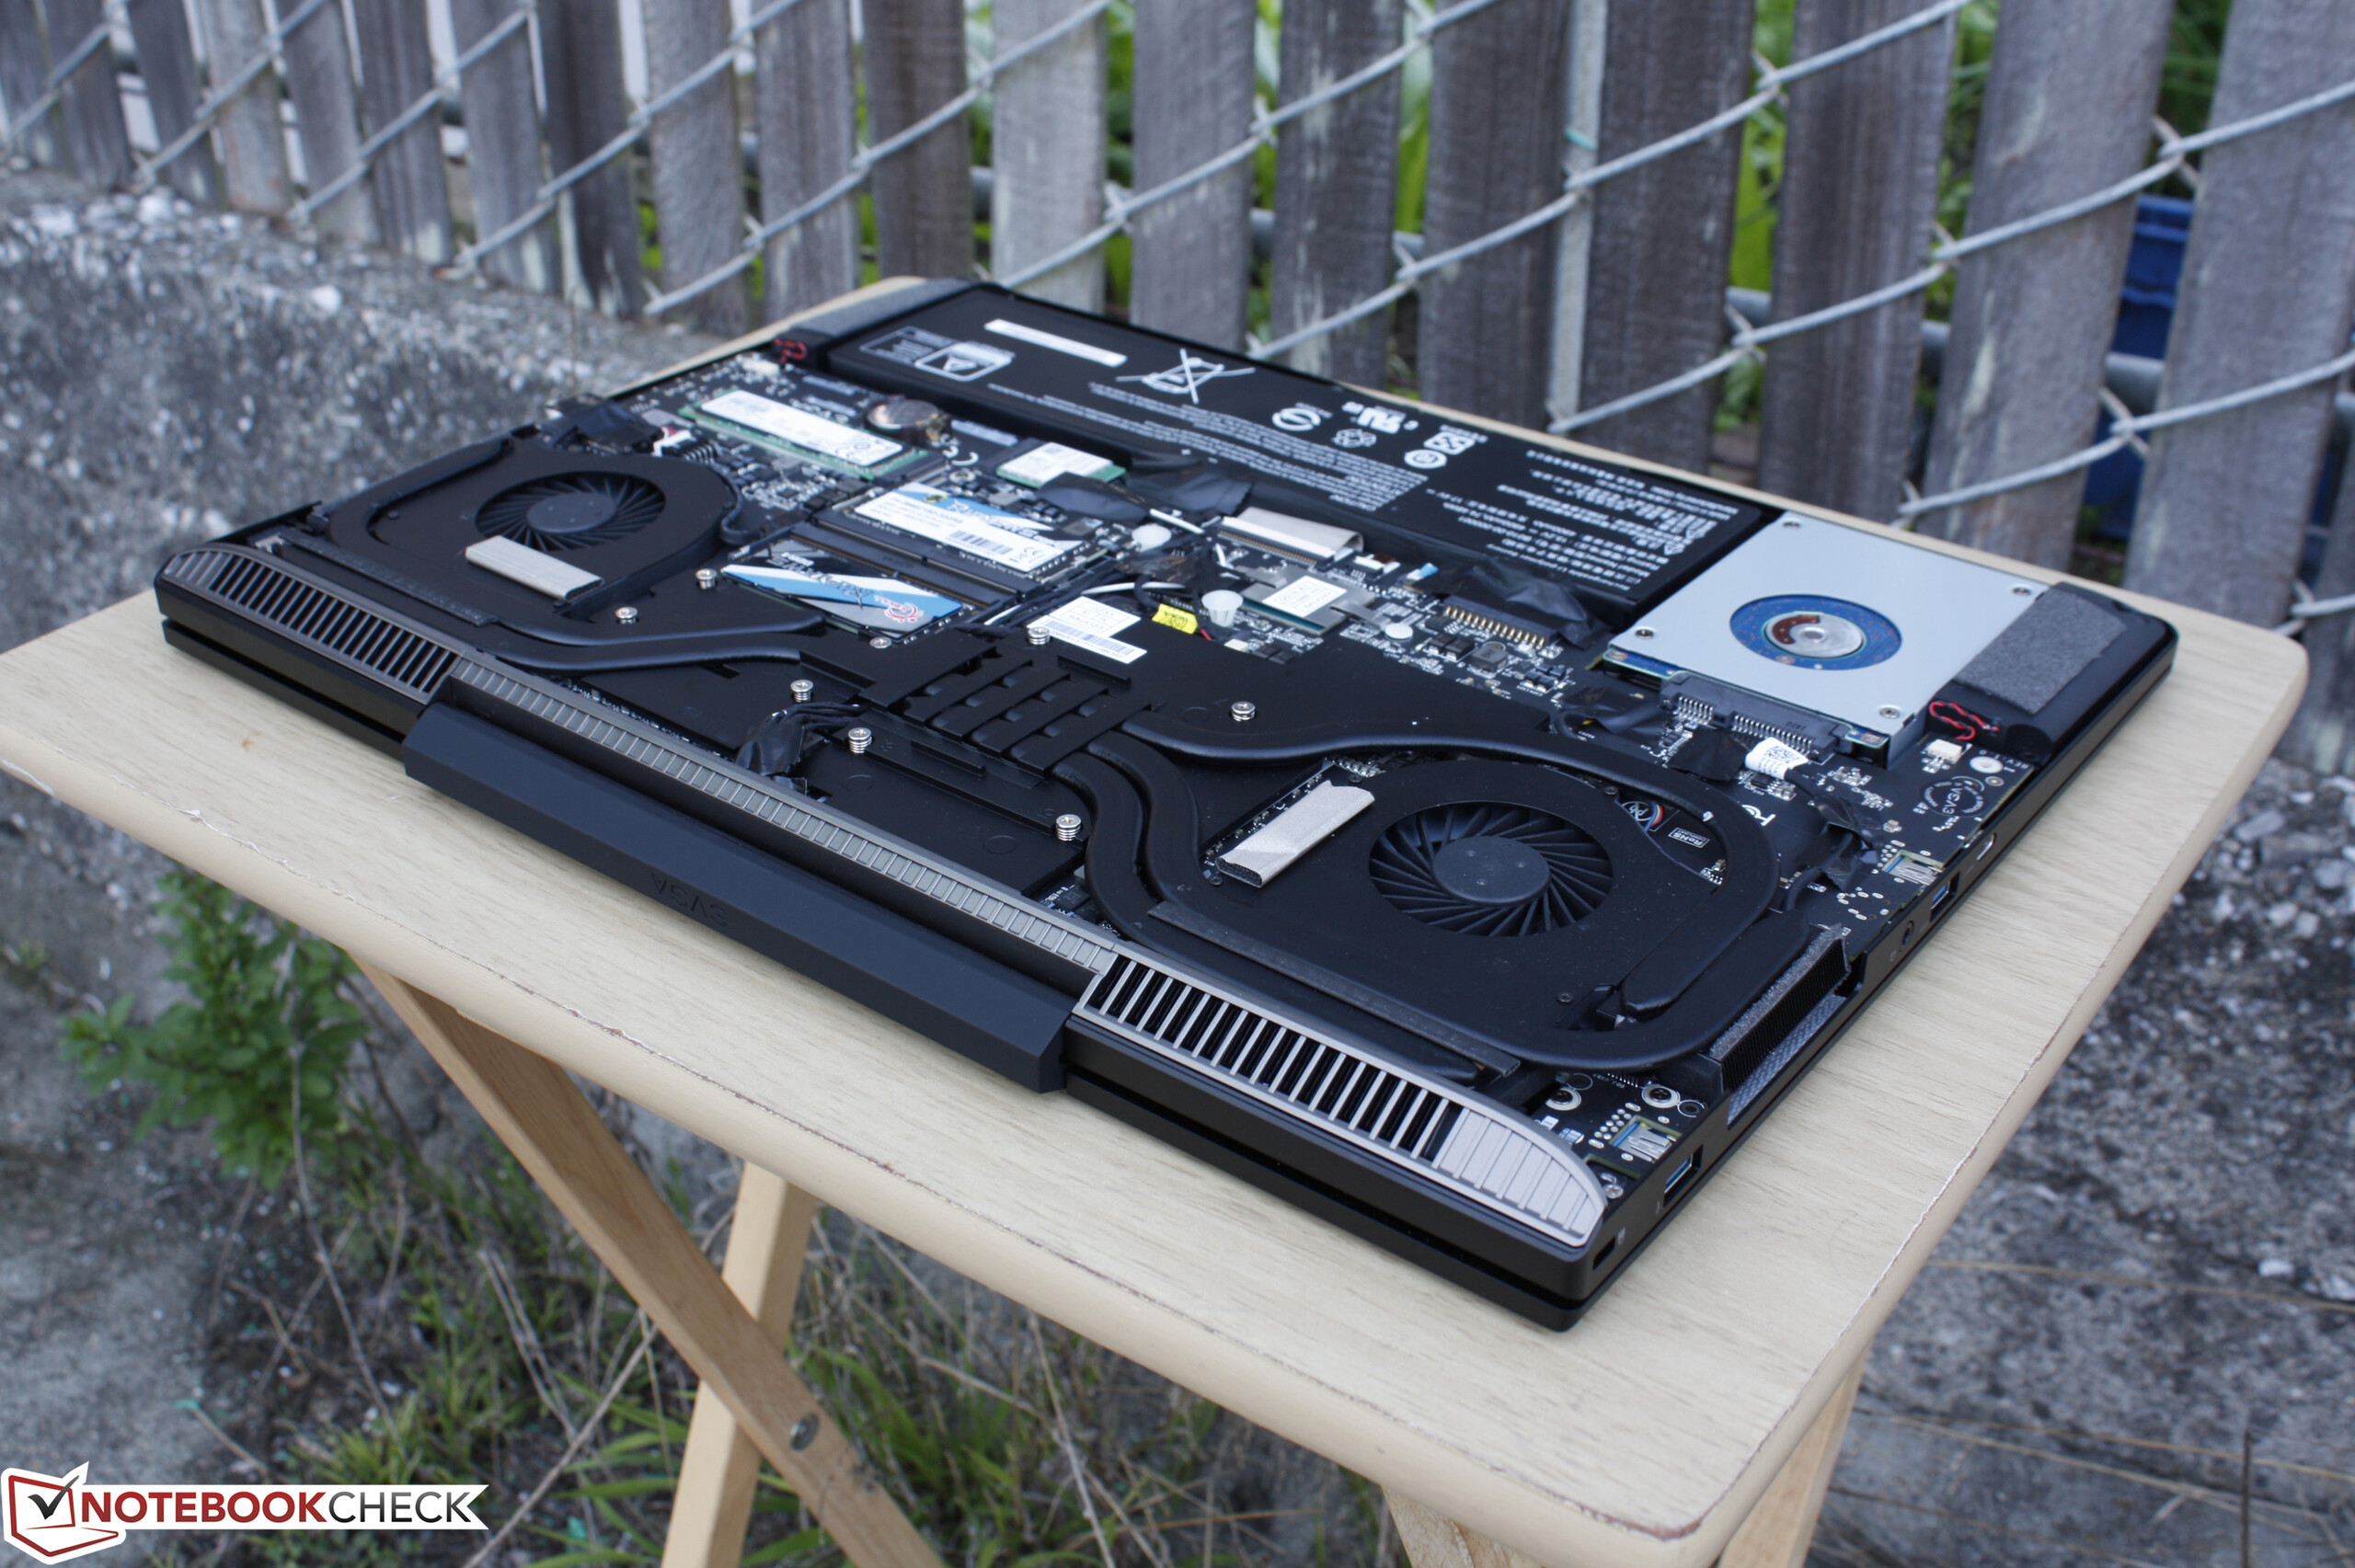
El SC17 original con GTX 980M sobresalía por su enfoque en el overclocking a la vez que ofrecía una plataforma muy sólida mucho más portable que un barebone GT72, G752, o Clevo equivalentes. Ahora que la mayoría de fabricantes gaming han actualizado sus respectivos portátiles a Pascal, la última renovación SC17 no ofrece bastante para que merezcan la compra. Fabricantes como MSI y Aorus han aprovechado la oportunidad para añadir hasta más características más allá de una sencilla renovación de GPU, tales como pantallas 5 ms/120 Hz, G-Sync, RAID, teclas iluminadas RGB individualmente, teclas Macro y auxiliares, Thunderbolt 3, y otros que le faltan al SC17. El EVGA ni siquiera tiene un sencillo lector de tarjetas como los salientes Razer Blade 14 o Blade Pro 17.
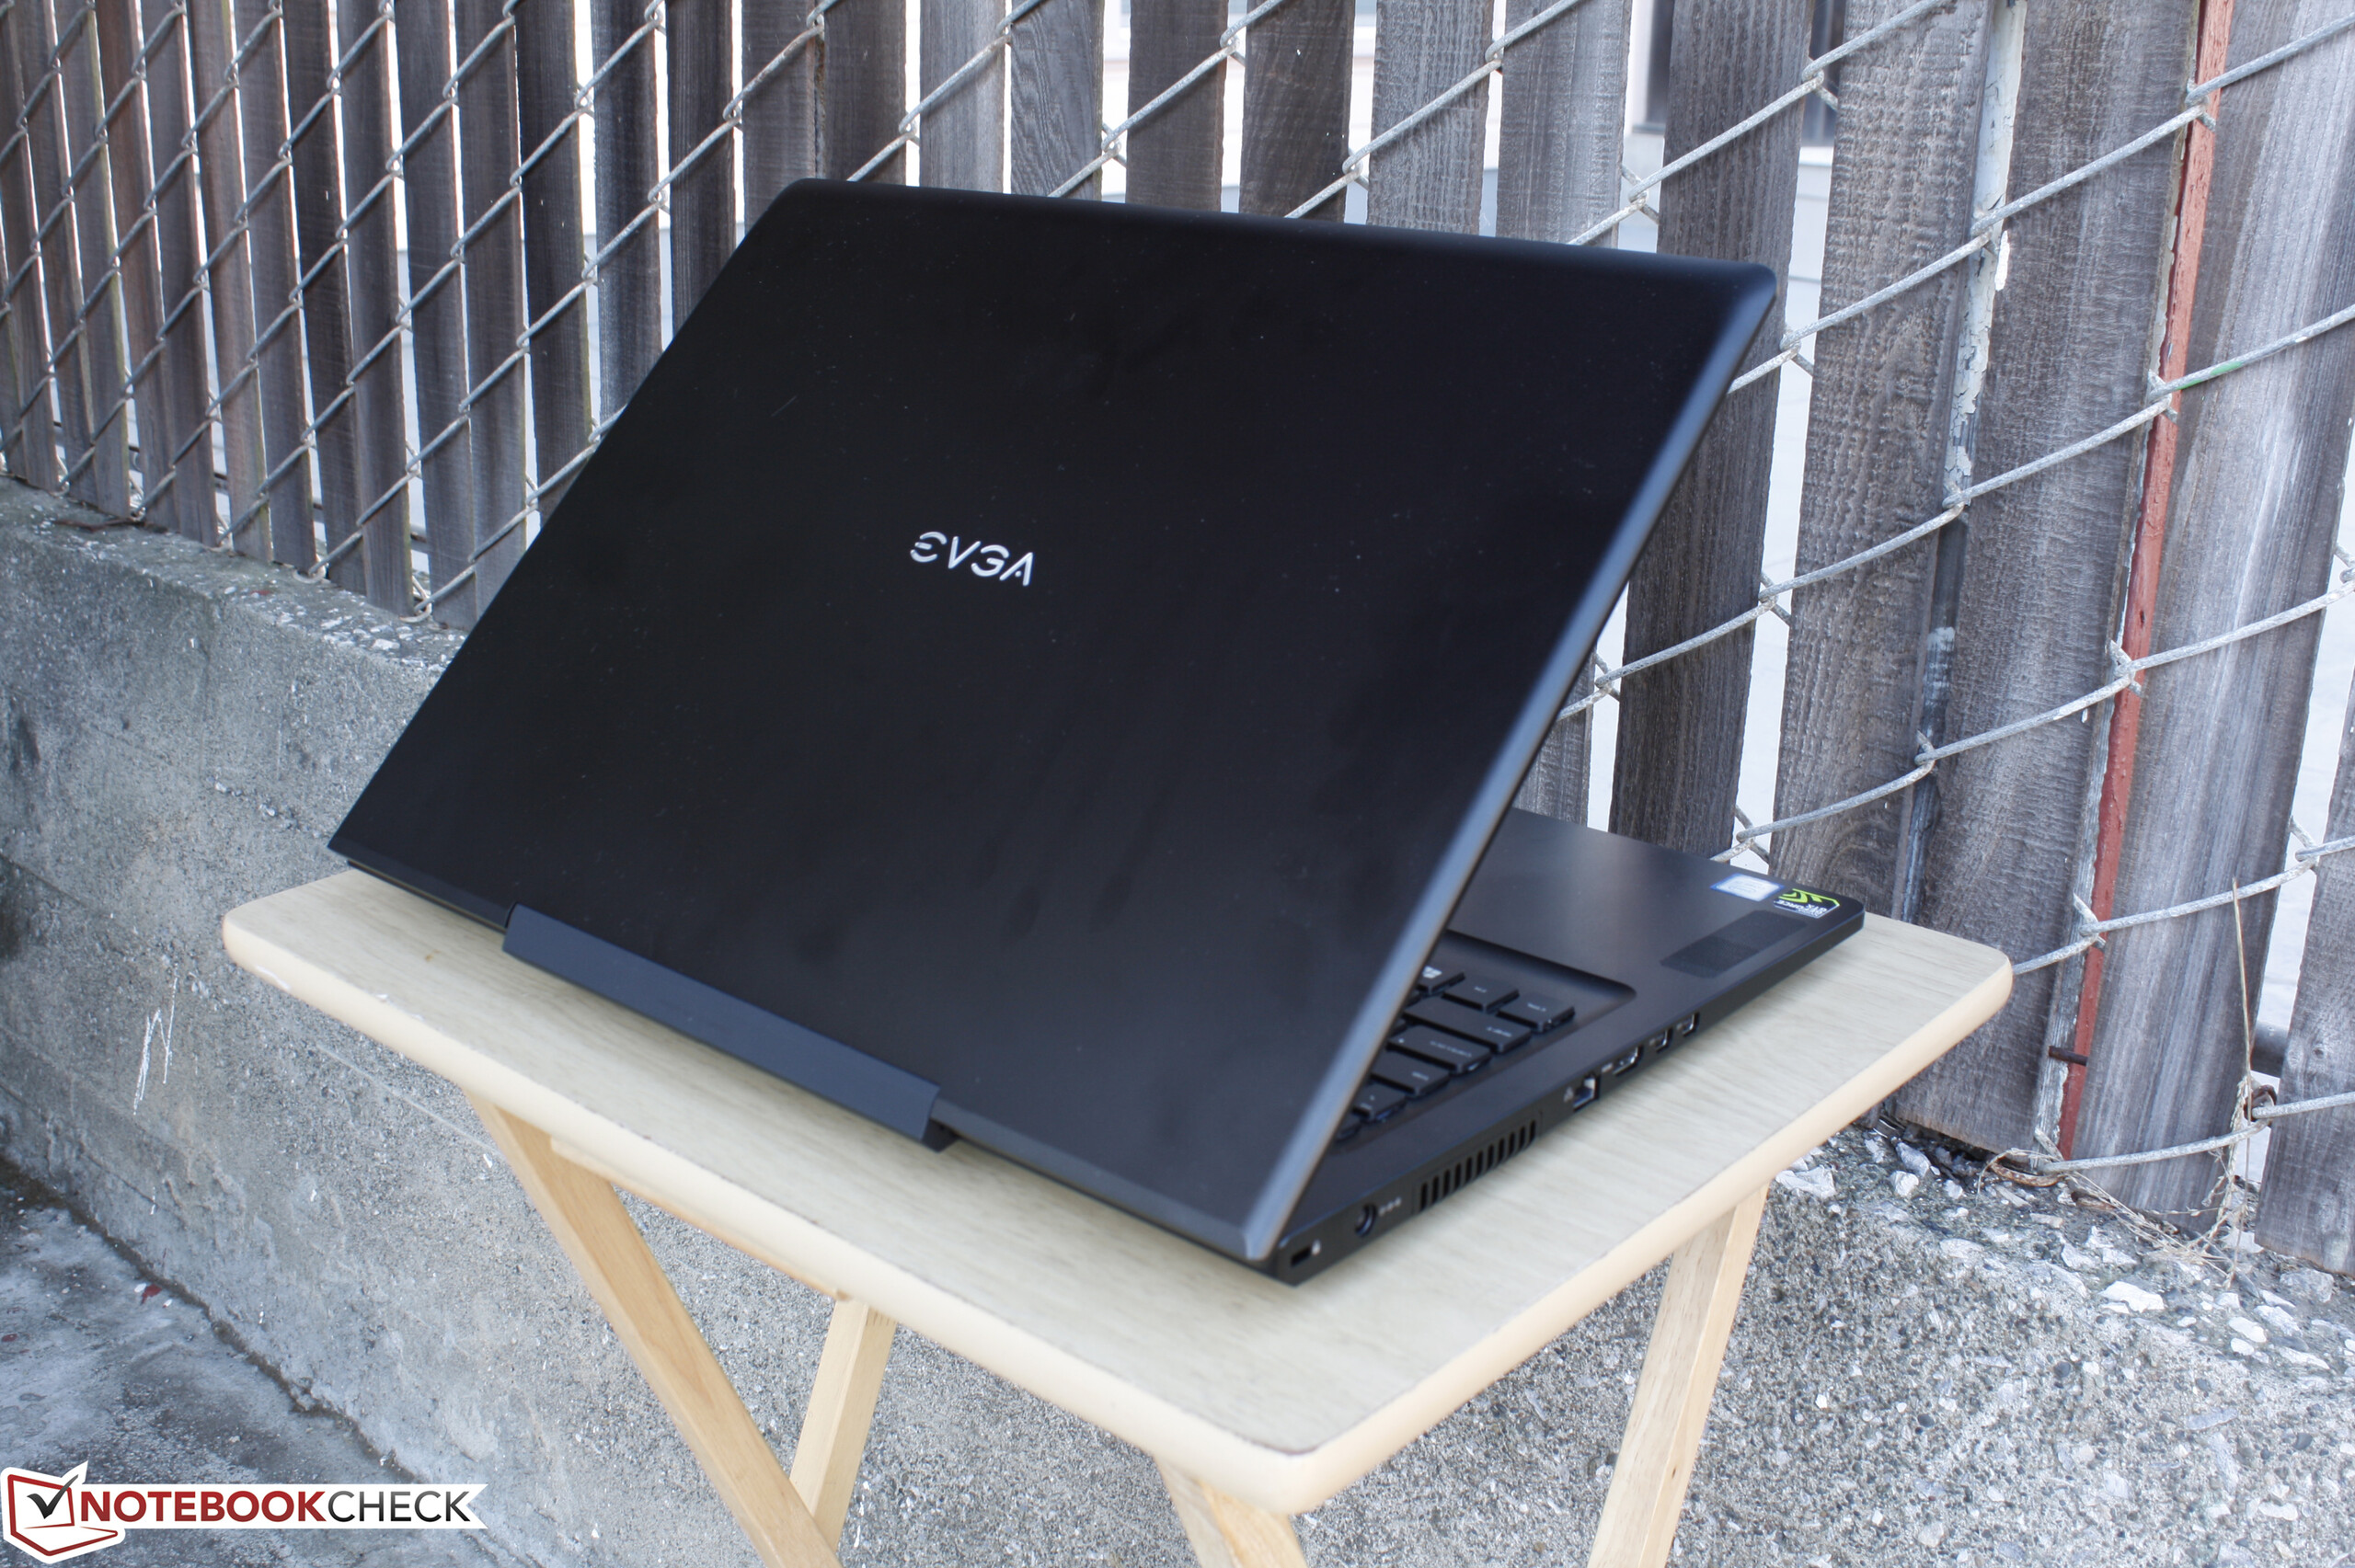
Rendimiento y especialmente calidad de construcción reflejan el precio premium, pero cuesta más olvidar la sensación barebone del SC17.
Ésta es una versión acortada del análisis original. Puedes leer el análisis completo en inglés aquí.
EVGA SC17 GTX 1070
- 11/20/2016 v5.1 (old)
Allen Ngo
Price comparison
