Breve análisis del Acer Swift 5 SF514-51-59AV


| SD Card Reader | |
| average JPG Copy Test (av. of 3 runs) | |
| Dell XPS 13 9360 FHD i5 | |
| Lenovo IdeaPad 510S-13IKB 80V00026GE | |
| Acer Swift 5 SF514-51-59AV | |
| Medion Akoya S3409-MD60234 | |
| maximum AS SSD Seq Read Test (1GB) | |
| Dell XPS 13 9360 FHD i5 | |
| Acer Swift 5 SF514-51-59AV | |
| Lenovo IdeaPad 510S-13IKB 80V00026GE | |
| Medion Akoya S3409-MD60234 | |
| Networking | |
| iperf Server (receive) TCP 1 m | |
| Asus Zenbook 3 UX390UA-GS041T (jseb) | |
| Acer Swift 5 SF514-51-59AV (jseb) | |
| Medion Akoya S3409-MD60234 (jseb) | |
| Lenovo IdeaPad 510S-13IKB 80V00026GE | |
| iperf Client (transmit) TCP 1 m | |
| Acer Swift 5 SF514-51-59AV (jseb) | |
| Asus Zenbook 3 UX390UA-GS041T (jseb) | |
| Medion Akoya S3409-MD60234 (jseb) | |
| Lenovo IdeaPad 510S-13IKB 80V00026GE | |
| |||||||||||||||||||||||||
iluminación: 79 %
Brillo con batería: 393 cd/m²
Contraste: 1355:1 (Negro: 0.29 cd/m²)
ΔE ColorChecker Calman: 6.17 | ∀{0.5-29.43 Ø4.73}
ΔE Greyscale Calman: 6.8 | ∀{0.09-98 Ø4.97}
91% sRGB (Argyll 1.6.3 3D)
51% AdobeRGB 1998 (Argyll 1.6.3 3D)
64.3% AdobeRGB 1998 (Argyll 3D)
91.3% sRGB (Argyll 3D)
62.8% Display P3 (Argyll 3D)
Gamma: 2.27
CCT: 6873 K
| Acer Swift 5 SF514-51-59AV AU Optronics B140HAN3.2, , 1920x1080, 14" | Lenovo IdeaPad 510S-13IKB 80V00026GE LG Philips LP133WF2-SPL1, , 1920x1080, 13.3" | Medion Akoya S3409-MD60234 LG Philips LP133QD1-SPA3, , 3200x1800, 13.3" | Dell XPS 13 9360 FHD i5 Sharp SHP1449 LQ133M1, , 1920x1080, 13.3" | Asus Zenbook 3 UX390UA-GS041T AUO B125HAN03.0 AUO306D, , 1920x1080, 12.5" | |
|---|---|---|---|---|---|
| Display | -38% | -1% | -21% | 1% | |
| Display P3 Coverage (%) | 62.8 | 38.61 -39% | 64.6 3% | 48.94 -22% | 64.7 3% |
| sRGB Coverage (%) | 91.3 | 57.9 -37% | 87.3 -4% | 73.3 -20% | 89.6 -2% |
| AdobeRGB 1998 Coverage (%) | 64.3 | 39.92 -38% | 63.8 -1% | 50.5 -21% | 65.4 2% |
| Response Times | 19% | 22% | 9% | 24% | |
| Response Time Grey 50% / Grey 80% * (ms) | 51 ? | 39 ? 24% | 34 ? 33% | 32.8 ? 36% | 30 ? 41% |
| Response Time Black / White * (ms) | 28 ? | 24 ? 14% | 25 ? 11% | 33.2 ? -19% | 26 ? 7% |
| PWM Frequency (Hz) | 250 ? | 50 ? | |||
| Screen | -10% | -10% | 4% | 1% | |
| Brightness middle (cd/m²) | 393 | 259 -34% | 295 -25% | 351.2 -11% | 355 -10% |
| Brightness (cd/m²) | 338 | 253 -25% | 283 -16% | 325 -4% | 341 1% |
| Brightness Distribution (%) | 79 | 82 4% | 88 11% | 89 13% | 87 10% |
| Black Level * (cd/m²) | 0.29 | 0.33 -14% | 0.65 -124% | 0.195 33% | 0.3 -3% |
| Contrast (:1) | 1355 | 785 -42% | 454 -66% | 1801 33% | 1183 -13% |
| Colorchecker dE 2000 * | 6.17 | 5.12 17% | 4 35% | 7.4 -20% | 5.97 3% |
| Colorchecker dE 2000 max. * | 11.21 | 10.12 10% | 7.26 35% | 9.08 19% | 10.55 6% |
| Greyscale dE 2000 * | 6.8 | 3.8 44% | 3.38 50% | 6.71 1% | 6.45 5% |
| Gamma | 2.27 97% | 2.39 92% | 2.38 92% | 2.74 80% | 2.45 90% |
| CCT | 6873 95% | 7405 88% | 6520 100% | 7222 90% | 7694 84% |
| Color Space (Percent of AdobeRGB 1998) (%) | 51 | 37 -27% | 57 12% | 50.48 -1% | 58 14% |
| Color Space (Percent of sRGB) (%) | 91 | 58 -36% | 85 -7% | 73.31 -19% | 89 -2% |
| Media total (Programa/Opciones) | -10% /
-12% | 4% /
-4% | -3% /
-0% | 9% /
4% |
* ... más pequeño es mejor
Tiempos de respuesta del display
| ↔ Tiempo de respuesta de Negro a Blanco | ||
|---|---|---|
| 28 ms ... subida ↗ y bajada ↘ combinada | ↗ 7 ms subida | 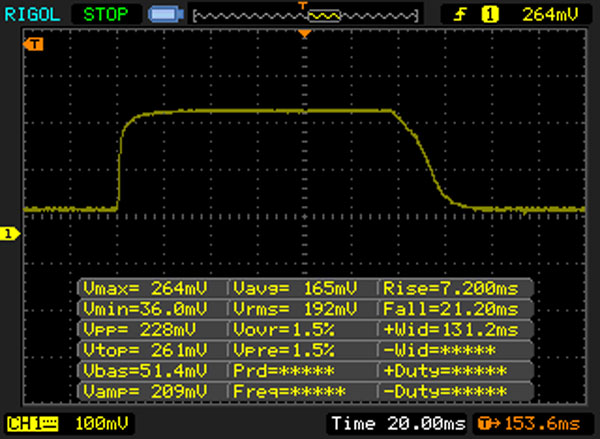 |
| ↘ 21 ms bajada | ||
| La pantalla mostró tiempos de respuesta relativamente lentos en nuestros tests pero podría ser demasiado lenta para los jugones. En comparación, todos los dispositivos de prueba van de ##min### (mínimo) a 240 (máximo) ms. » 71 % de todos los dispositivos son mejores. Eso quiere decir que el tiempo de respuesta es peor que la media (19.9 ms) de todos los dispositivos testados. | ||
| ↔ Tiempo de respuesta 50% Gris a 80% Gris | ||
| 51 ms ... subida ↗ y bajada ↘ combinada | ↗ 20 ms subida | 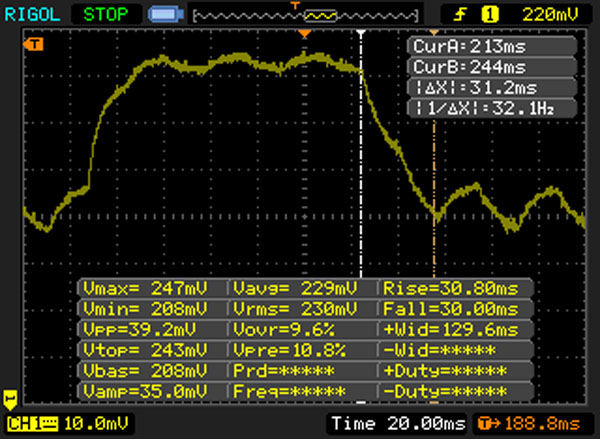 |
| ↘ 31 ms bajada | ||
| La pantalla mostró tiempos de respuesta lentos en nuestros tests y podría ser demasiado lenta para los jugones. En comparación, todos los dispositivos de prueba van de ##min### (mínimo) a 636 (máximo) ms. » 87 % de todos los dispositivos son mejores. Eso quiere decir que el tiempo de respuesta es peor que la media (31.1 ms) de todos los dispositivos testados. | ||
Parpadeo de Pantalla / PWM (Pulse-Width Modulation)
| Parpadeo de Pantalla / PWM no detectado | ||
Comparación: 52 % de todos los dispositivos testados no usaron PWM para atenuar el display. Si se usó, medimos una media de 7791 (mínimo: 5 - máxmo: 343500) Hz. | ||
| PCMark 8 - Home Score Accelerated v2 | |
| Lenovo IdeaPad 510S-13IKB 80V00026GE | |
| Dell XPS 13 9360 FHD i5 | |
| Acer Swift 5 SF514-51-59AV | |
| Medion Akoya S3409-MD60234 | |
| Asus Zenbook 3 UX390UA-GS041T | |
| PCMark 7 Score | 5367 puntos | |
| PCMark 8 Home Score Accelerated v2 | 3370 puntos | |
ayuda | ||
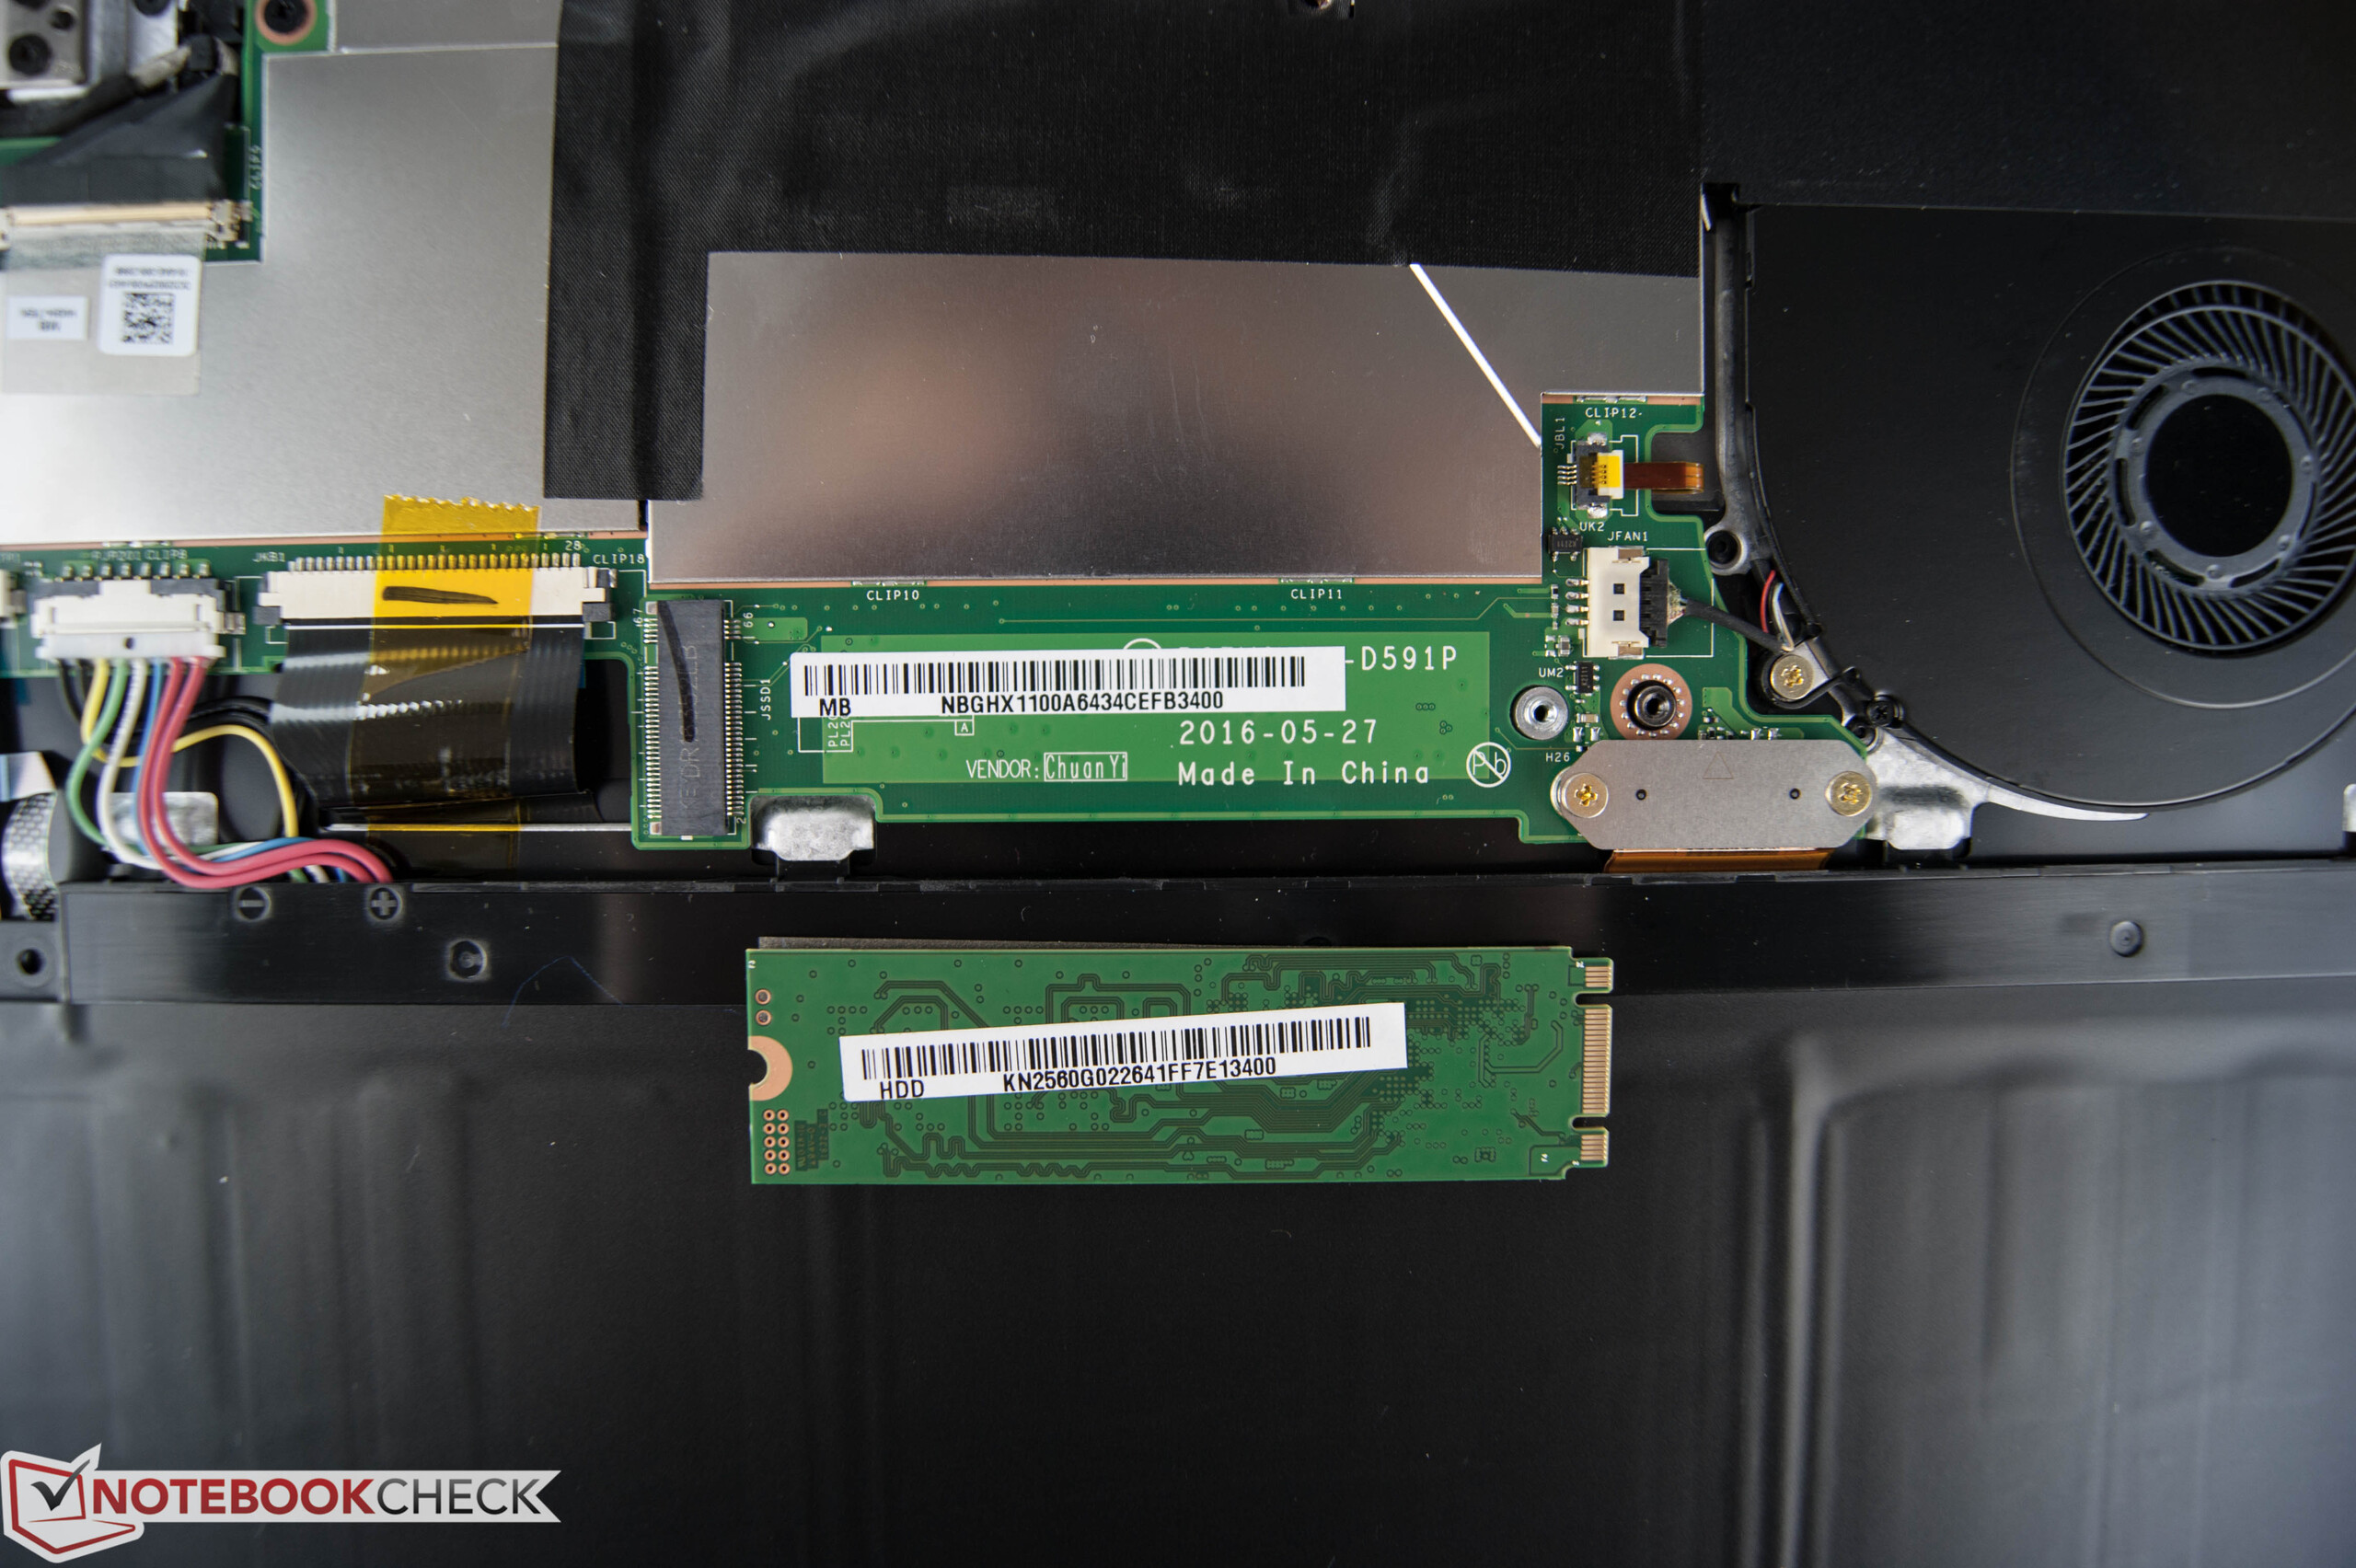
| Acer Swift 5 SF514-51-59AV SK Hynix HFS256G39TND-N210A | Lenovo IdeaPad 510S-13IKB 80V00026GE Samsung MZYTY256HDHP | Medion Akoya S3409-MD60234 Phison S10C-512G | Dell XPS 13 9360 FHD i5 Toshiba NVMe THNSN5256GPUK | Asus Zenbook 3 UX390UA-GS041T SK Hynix Canvas SC300 512GB M.2 (HFS512G39MND) | |
|---|---|---|---|---|---|
| CrystalDiskMark 3.0 | 15% | 25% | 87% | 15% | |
| Read Seq (MB/s) | 517 | 494.5 -4% | 522 1% | 1233 138% | 508 -2% |
| Write Seq (MB/s) | 258.1 | 494.1 91% | 384.4 49% | 733 184% | 454.4 76% |
| Read 512 (MB/s) | 355 | 383.9 8% | 412 16% | 1036 192% | 335.5 -5% |
| Write 512 (MB/s) | 258.5 | 155.5 -40% | 395.5 53% | 439.9 70% | 413.9 60% |
| Read 4k (MB/s) | 29.65 | 36.08 22% | 34.07 15% | 29.31 -1% | 28.13 -5% |
| Write 4k (MB/s) | 77.3 | 96.4 25% | 100.9 31% | 116.9 51% | 69.8 -10% |
| Read 4k QD32 (MB/s) | 277.1 | 403.3 46% | 316.3 14% | 479.2 73% | 245.7 -11% |
| Write 4k QD32 (MB/s) | 242.5 | 176.4 -27% | 286.4 18% | 218.3 -10% | 277.6 14% |

| 3DMark - 1280x720 Cloud Gate Standard Graphics | |
| Acer Swift 5 SF514-51-59AV | |
| Dell XPS 13 9360 FHD i5 | |
| Asus Zenbook 3 UX390UA-GS041T | |
| Medion Akoya S3409-MD60234 | |
| Lenovo IdeaPad 510S-13IKB 80V00026GE | |
| HP 15-ay116ng | |
| Lenovo Yoga 710-14IKB 80V4002HGE | |
| 3DMark 11 Performance | 1684 puntos | |
| 3DMark Cloud Gate Standard Score | 6378 puntos | |
ayuda | ||
| BioShock Infinite | |
| 1366x768 Medium Preset | |
| Acer Swift 5 SF514-51-59AV | |
| Medion Akoya S3409-MD60234 | |
| Asus Zenbook 3 UX390UA-GS041T | |
| Lenovo IdeaPad 510S-13IKB 80V00026GE | |
| 1366x768 High Preset | |
| Acer Swift 5 SF514-51-59AV | |
| Medion Akoya S3409-MD60234 | |
| Lenovo IdeaPad 510S-13IKB 80V00026GE | |
| Asus Zenbook 3 UX390UA-GS041T | |
| bajo | medio | alto | ultra | |
|---|---|---|---|---|
| BioShock Infinite (2013) | 51 | 30.9 | 25.6 | 8.2 |
| The Witcher 3 (2015) | 12.1 | 8.4 | 4.2 | |
| Rise of the Tomb Raider (2016) | 20.23 | 11.42 | 6.42 | 4.8 |
Ruido
| Ocioso |
| 30.5 / 30.5 / 30.5 dB(A) |
| Carga |
| 32.25 / 32.6 dB(A) |
 | ||
30 dB silencioso 40 dB(A) audible 50 dB(A) ruidosamente alto |
||
min: | ||
(+) La temperatura máxima en la parte superior es de 39.4 °C / 103 F, frente a la media de 35.9 °C / 97 F, que oscila entre 21.4 y 59 °C para la clase Subnotebook.
(±) El fondo se calienta hasta un máximo de 40 °C / 104 F, frente a la media de 39.2 °C / 103 F
(+) En reposo, la temperatura media de la parte superior es de 24 °C / 75# F, frente a la media del dispositivo de 30.8 °C / 87 F.
(+) El reposamanos y el panel táctil están a una temperatura inferior a la de la piel, con un máximo de 27.3 °C / 81.1 F y, por tanto, son fríos al tacto.
(±) La temperatura media de la zona del reposamanos de dispositivos similares fue de 28.2 °C / 82.8 F (+0.9 °C / 1.7 F).
Acer Swift 5 SF514-51-59AV análisis de audio
(-) | altavoces no muy altos (#66 dB)
Graves 100 - 315 Hz
(±) | lubina reducida - en promedio 14.7% inferior a la mediana
(±) | la linealidad de los graves es media (13.5% delta a frecuencia anterior)
Medios 400 - 2000 Hz
(±) | medias más altas - de media 5.3% más altas que la mediana
(±) | la linealidad de los medios es media (7.3% delta respecto a la frecuencia anterior)
Altos 2 - 16 kHz
(+) | máximos equilibrados - a sólo 3.9% de la mediana
(±) | la linealidad de los máximos es media (8.1% delta a frecuencia anterior)
Total 100 - 16.000 Hz
(±) | la linealidad del sonido global es media (22% de diferencia con la mediana)
En comparación con la misma clase
» 75% de todos los dispositivos probados de esta clase eran mejores, 6% similares, 19% peores
» El mejor tuvo un delta de 5%, la media fue 18%, el peor fue ###max##%
En comparación con todos los dispositivos probados
» 63% de todos los dispositivos probados eran mejores, 6% similares, 30% peores
» El mejor tuvo un delta de 4%, la media fue 24%, el peor fue ###max##%
Apple MacBook 12 (Early 2016) 1.1 GHz análisis de audio
(+) | los altavoces pueden reproducir a un volumen relativamente alto (#83.6 dB)
Graves 100 - 315 Hz
(±) | lubina reducida - en promedio 11.3% inferior a la mediana
(±) | la linealidad de los graves es media (14.2% delta a frecuencia anterior)
Medios 400 - 2000 Hz
(+) | medios equilibrados - a sólo 2.4% de la mediana
(+) | los medios son lineales (5.5% delta a la frecuencia anterior)
Altos 2 - 16 kHz
(+) | máximos equilibrados - a sólo 2% de la mediana
(+) | los máximos son lineales (4.5% delta a la frecuencia anterior)
Total 100 - 16.000 Hz
(+) | el sonido global es lineal (10.2% de diferencia con la mediana)
En comparación con la misma clase
» 7% de todos los dispositivos probados de esta clase eran mejores, 2% similares, 91% peores
» El mejor tuvo un delta de 5%, la media fue 18%, el peor fue ###max##%
En comparación con todos los dispositivos probados
» 5% de todos los dispositivos probados eran mejores, 1% similares, 94% peores
» El mejor tuvo un delta de 4%, la media fue 24%, el peor fue ###max##%
| Off / Standby | |
| Ocioso | |
| Carga |
|
Clave:
min: | |
| Acer Swift 5 SF514-51-59AV i5-7200U, HD Graphics 620, SK Hynix HFS256G39TND-N210A, IPS, 1920x1080, 14" | Lenovo IdeaPad 510S-13IKB 80V00026GE i7-7500U, HD Graphics 620, Samsung MZYTY256HDHP, IPS, 1920x1080, 13.3" | Medion Akoya S3409-MD60234 i7-7500U, HD Graphics 620, Phison S10C-512G, IPS, 3200x1800, 13.3" | Dell XPS 13 9360 FHD i5 i5-7200U, HD Graphics 620, Toshiba NVMe THNSN5256GPUK, IPS, 1920x1080, 13.3" | Asus Zenbook 3 UX390UA-GS041T i5-7200U, HD Graphics 620, SK Hynix Canvas SC300 512GB M.2 (HFS512G39MND), IPS, 1920x1080, 12.5" | |
|---|---|---|---|---|---|
| Power Consumption | 16% | -11% | 24% | 10% | |
| Idle Minimum * (Watt) | 3.6 | 3.3 8% | 4.2 -17% | 4.1 -14% | 3.3 8% |
| Idle Average * (Watt) | 7 | 5.8 17% | 9 -29% | 4.2 40% | 6.2 11% |
| Idle Maximum * (Watt) | 9.3 | 7.4 20% | 10.6 -14% | 5.1 45% | 10.4 -12% |
| Load Average * (Watt) | 37 | 29.2 21% | 34 8% | 22.1 40% | 28 24% |
| Load Maximum * (Watt) | 32.6 | 28.6 12% | 33 -1% | 29.4 10% | 25.7 21% |
* ... más pequeño es mejor
| Acer Swift 5 SF514-51-59AV i5-7200U, HD Graphics 620, 53.9 Wh | Lenovo IdeaPad 510S-13IKB 80V00026GE i7-7500U, HD Graphics 620, 35 Wh | Medion Akoya S3409-MD60234 i7-7500U, HD Graphics 620, 45 Wh | Dell XPS 13 9360 FHD i5 i5-7200U, HD Graphics 620, 60 Wh | Asus Zenbook 3 UX390UA-GS041T i5-7200U, HD Graphics 620, 40 Wh | |
|---|---|---|---|---|---|
| Duración de Batería | -24% | -35% | 35% | -18% | |
| Reader / Idle (h) | 16.9 | 10.8 -36% | 12 -29% | 21.6 28% | 14.1 -17% |
| H.264 (h) | 9.3 | 5.5 -41% | 4.1 -56% | 6.4 -31% | |
| WiFi v1.3 (h) | 9.2 | 5.7 -38% | 4.6 -50% | 11.3 23% | 6.6 -28% |
| Load (h) | 1.7 | 2 18% | 1.6 -6% | 2.6 53% | 1.8 6% |
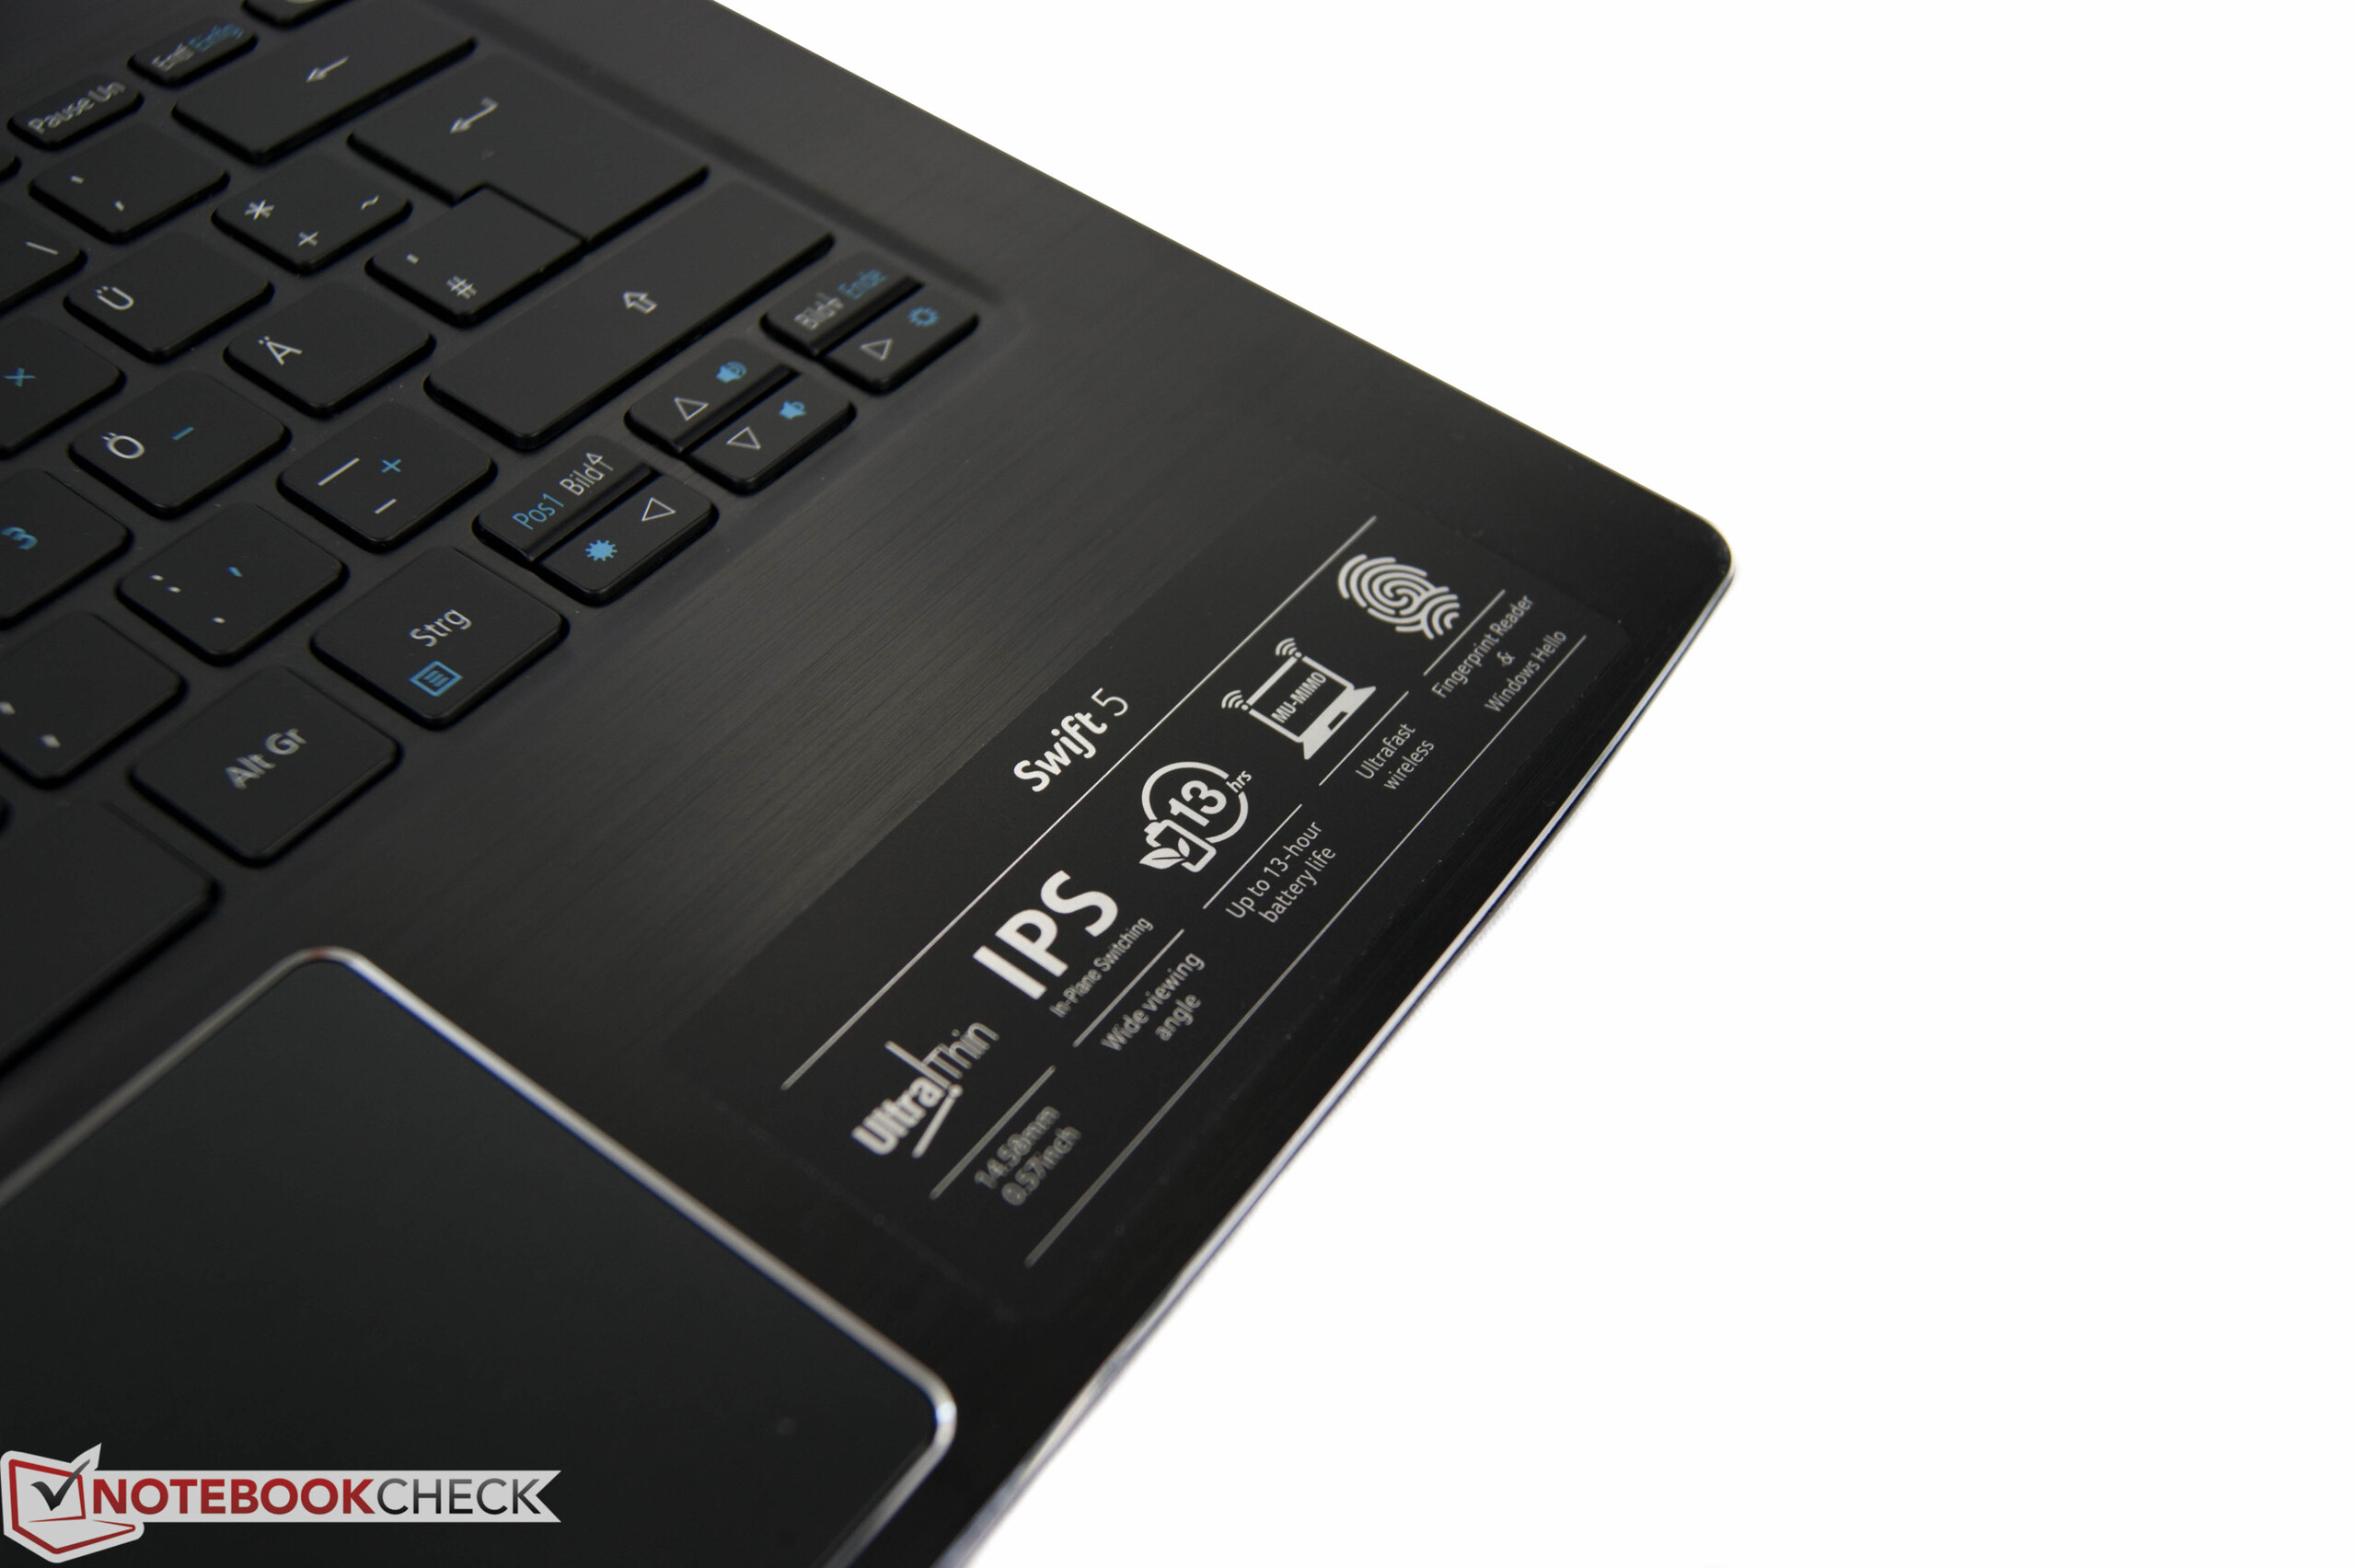
Pro
Contra
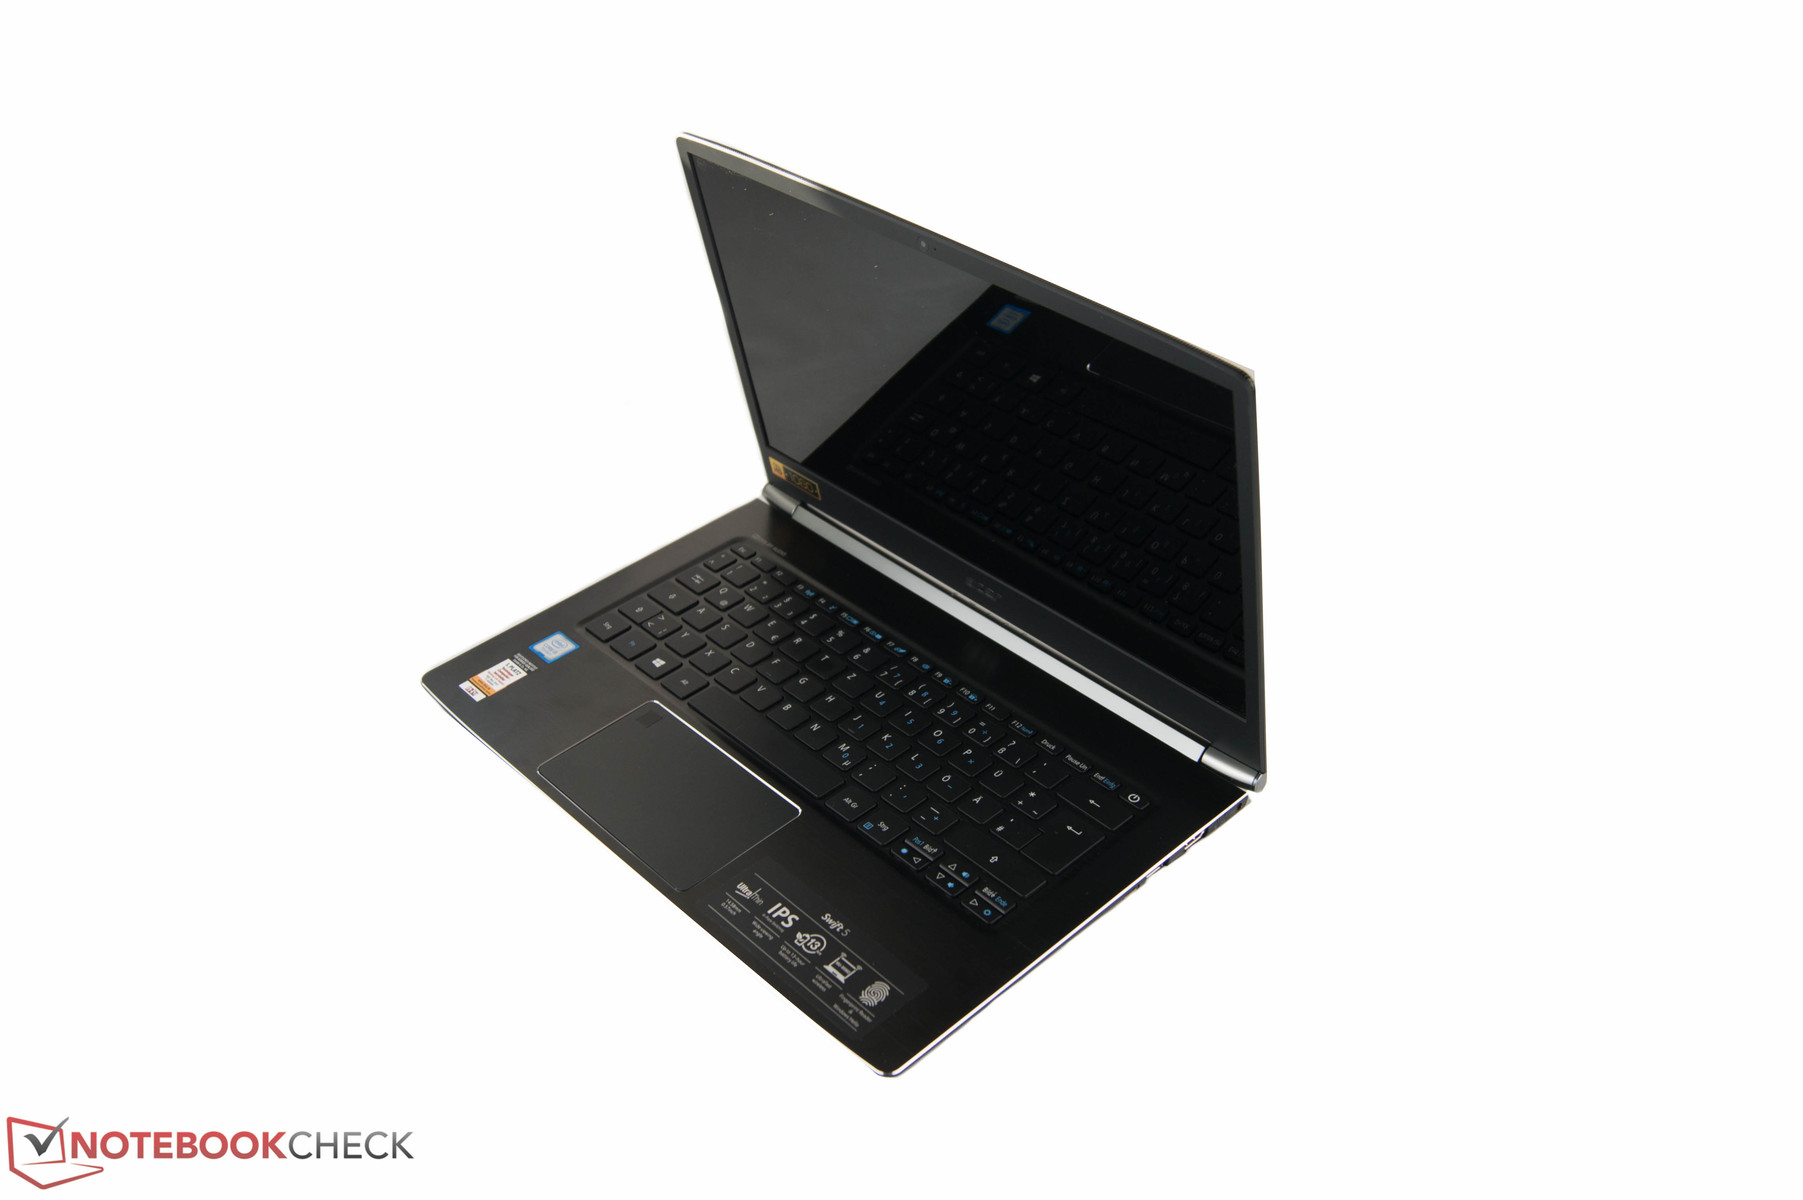
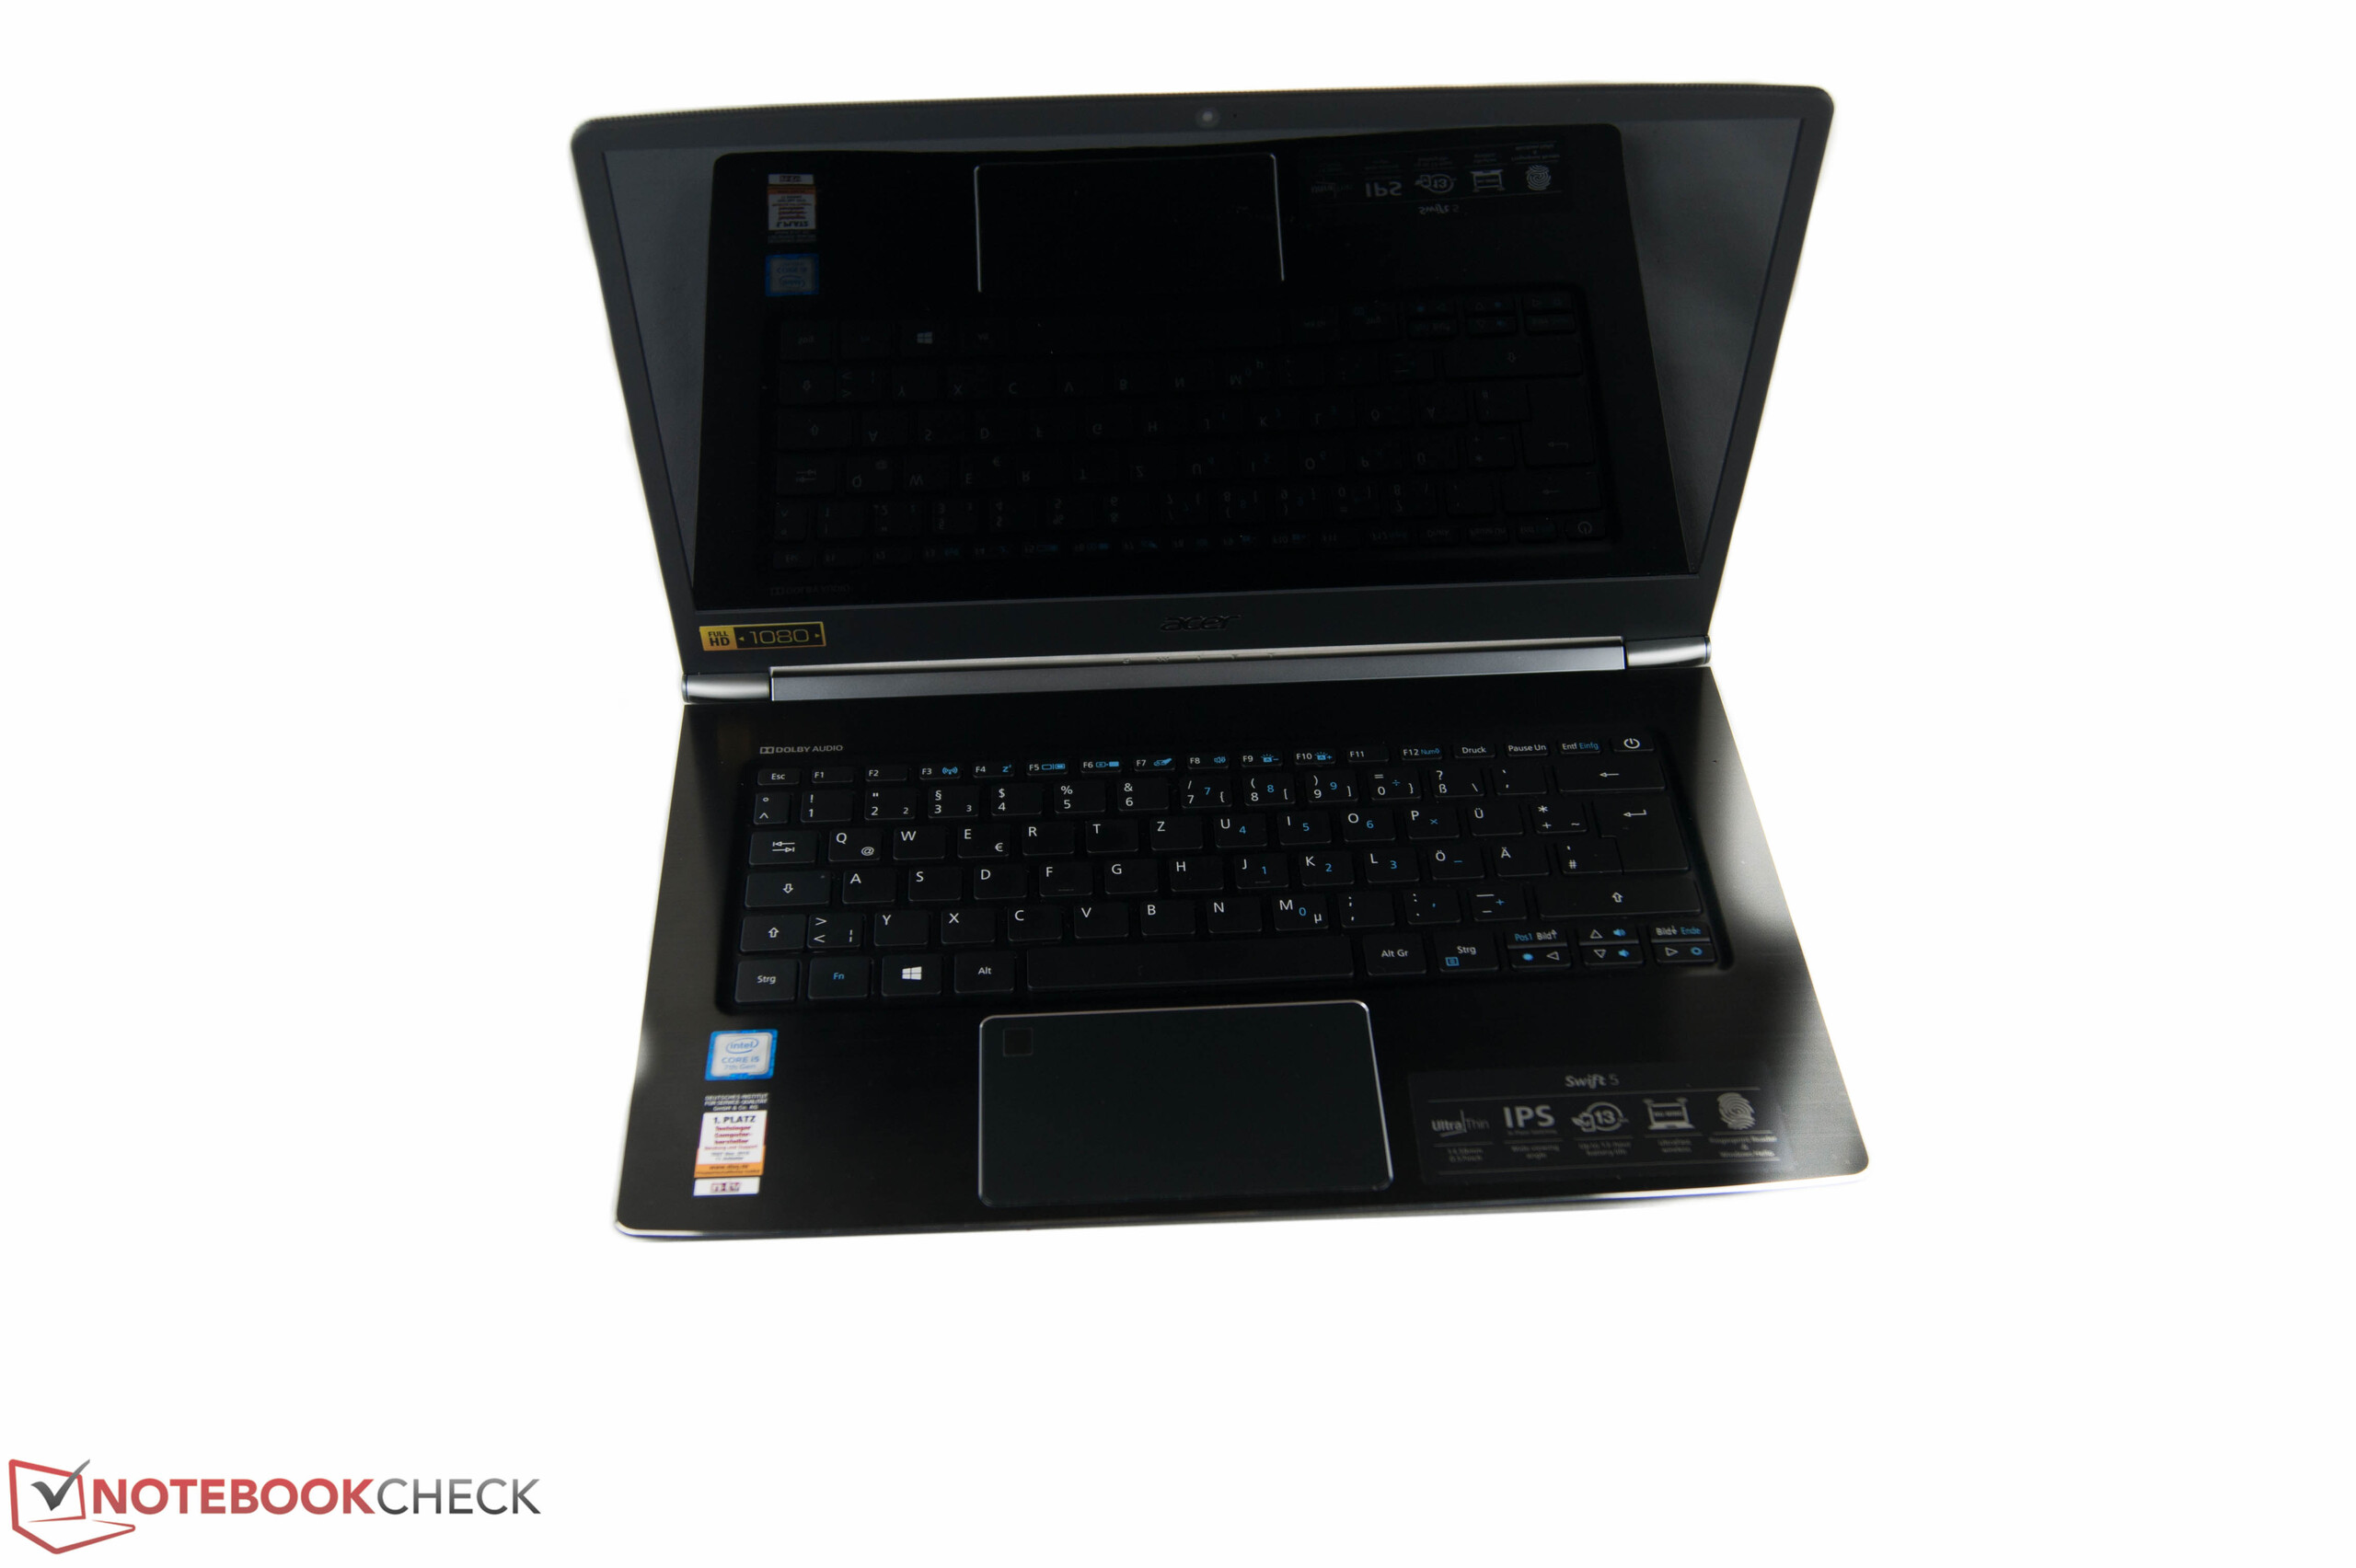
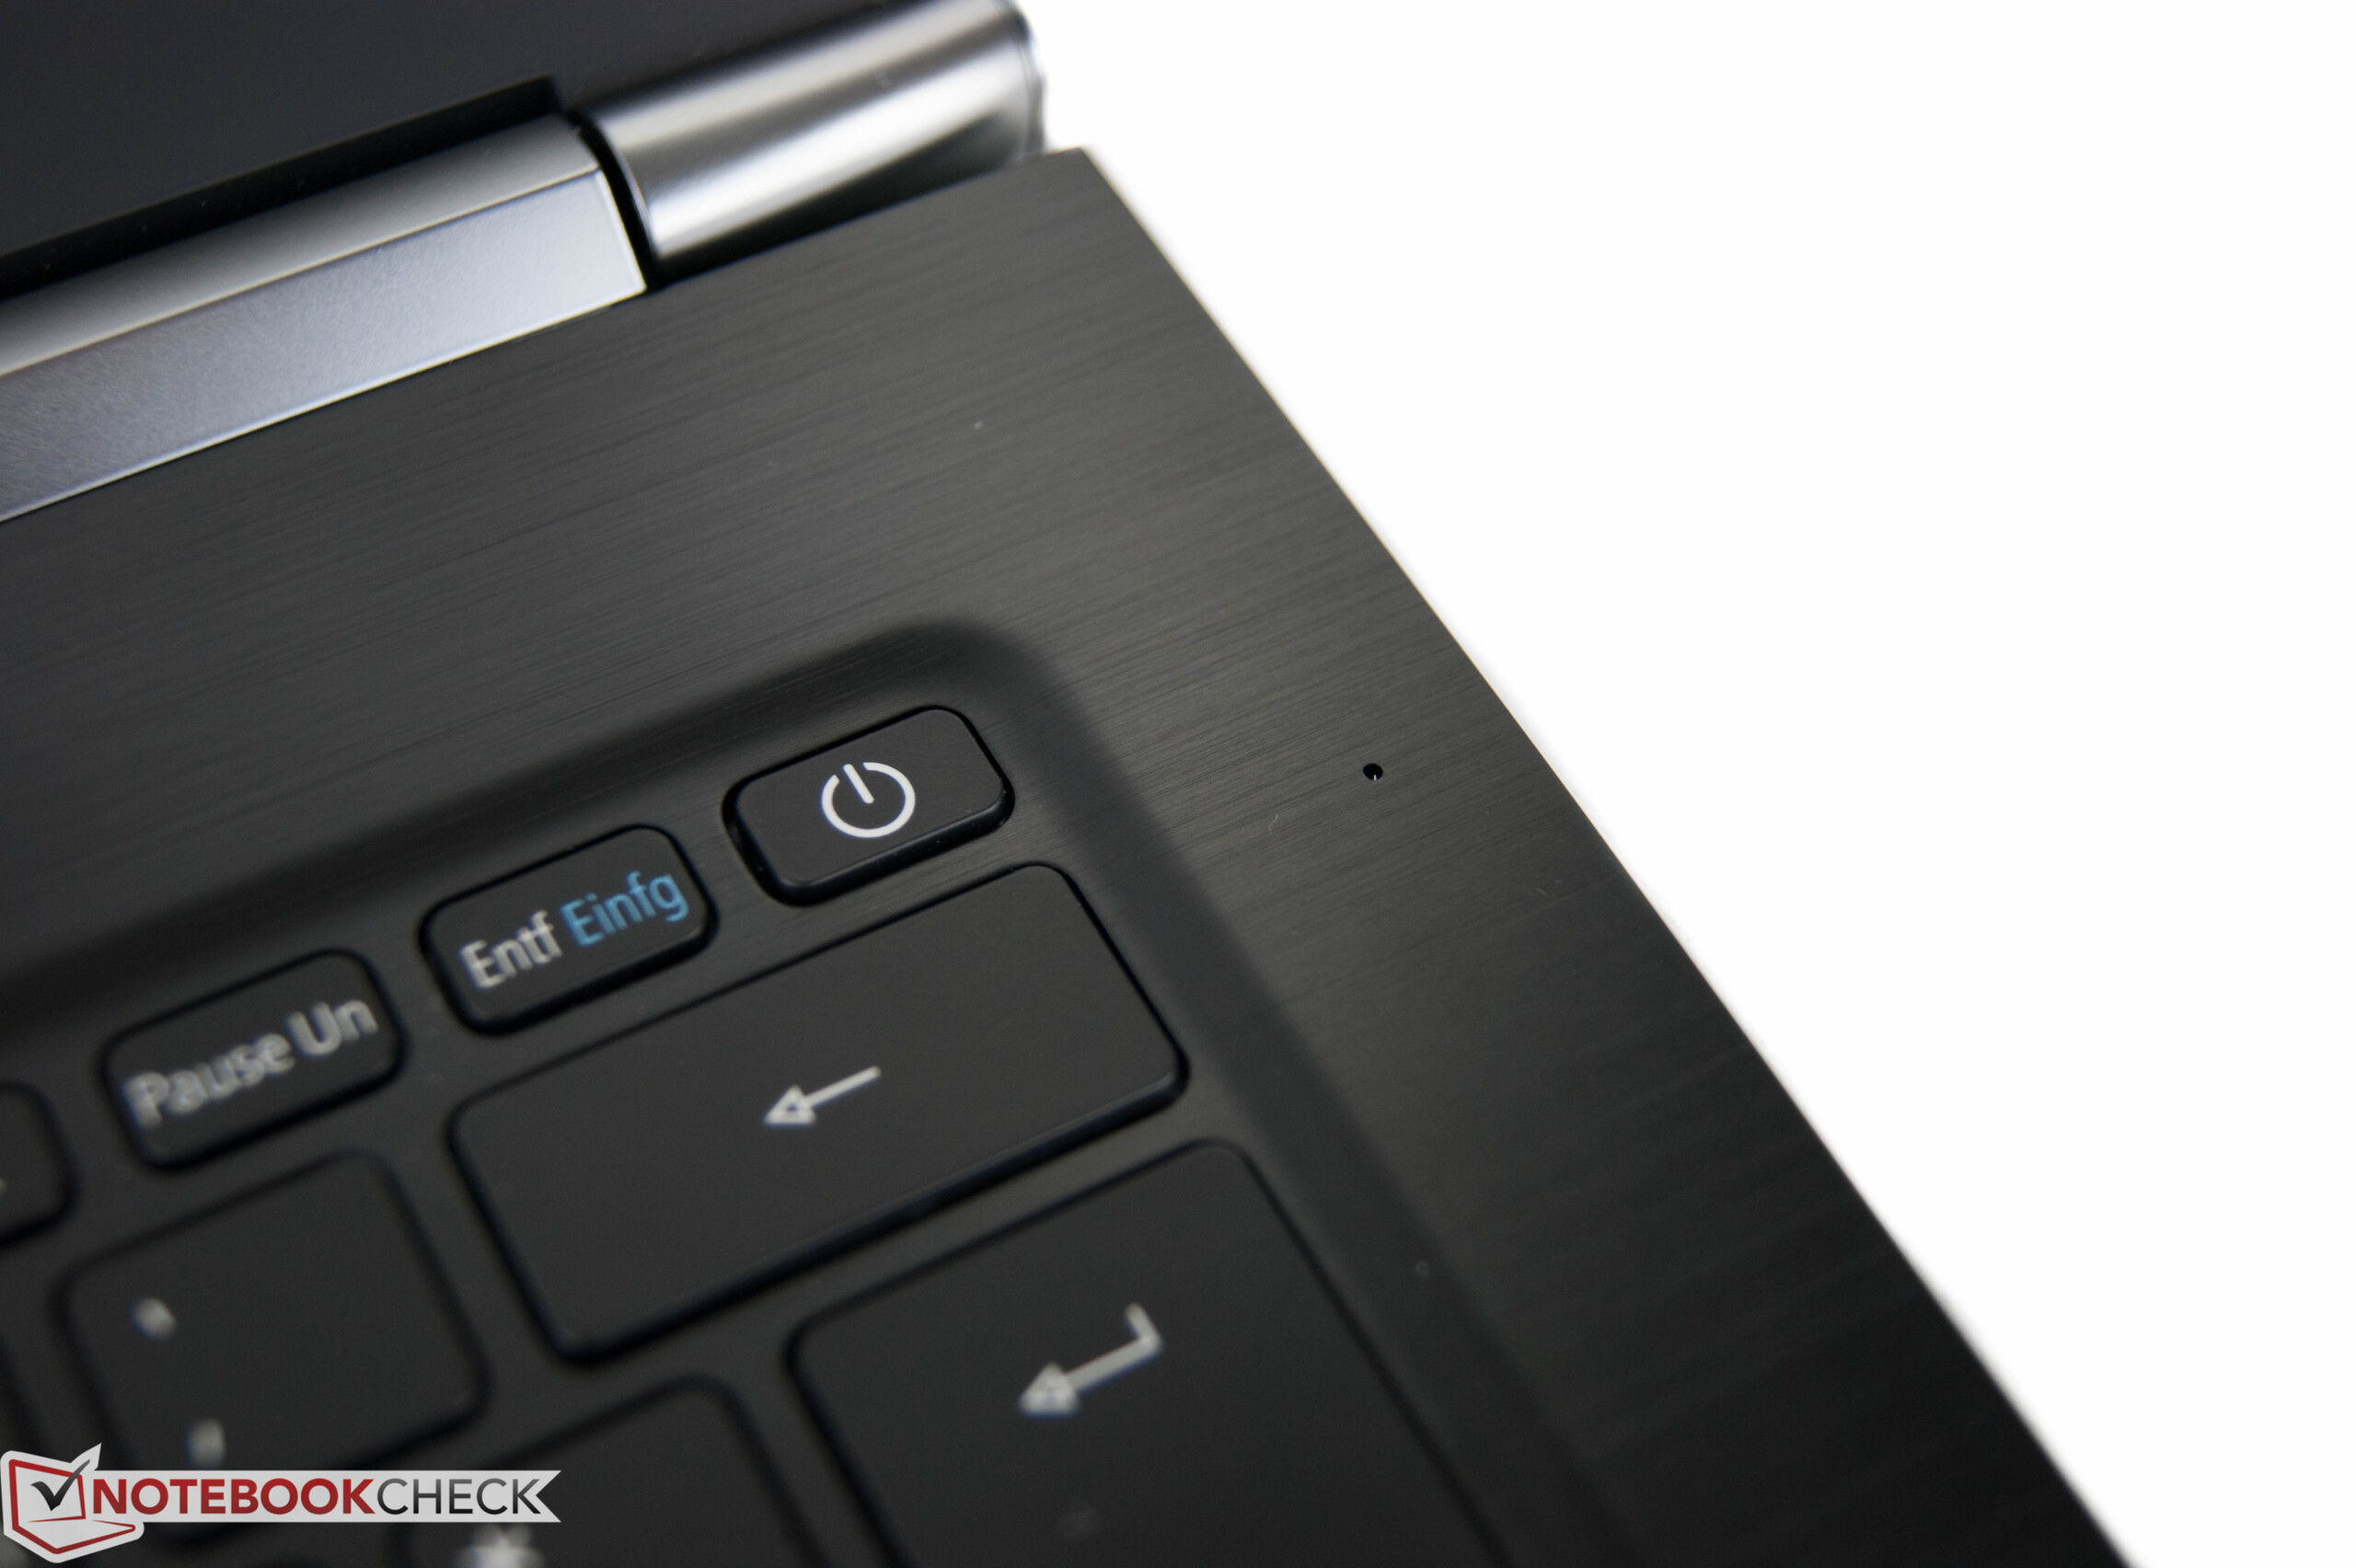
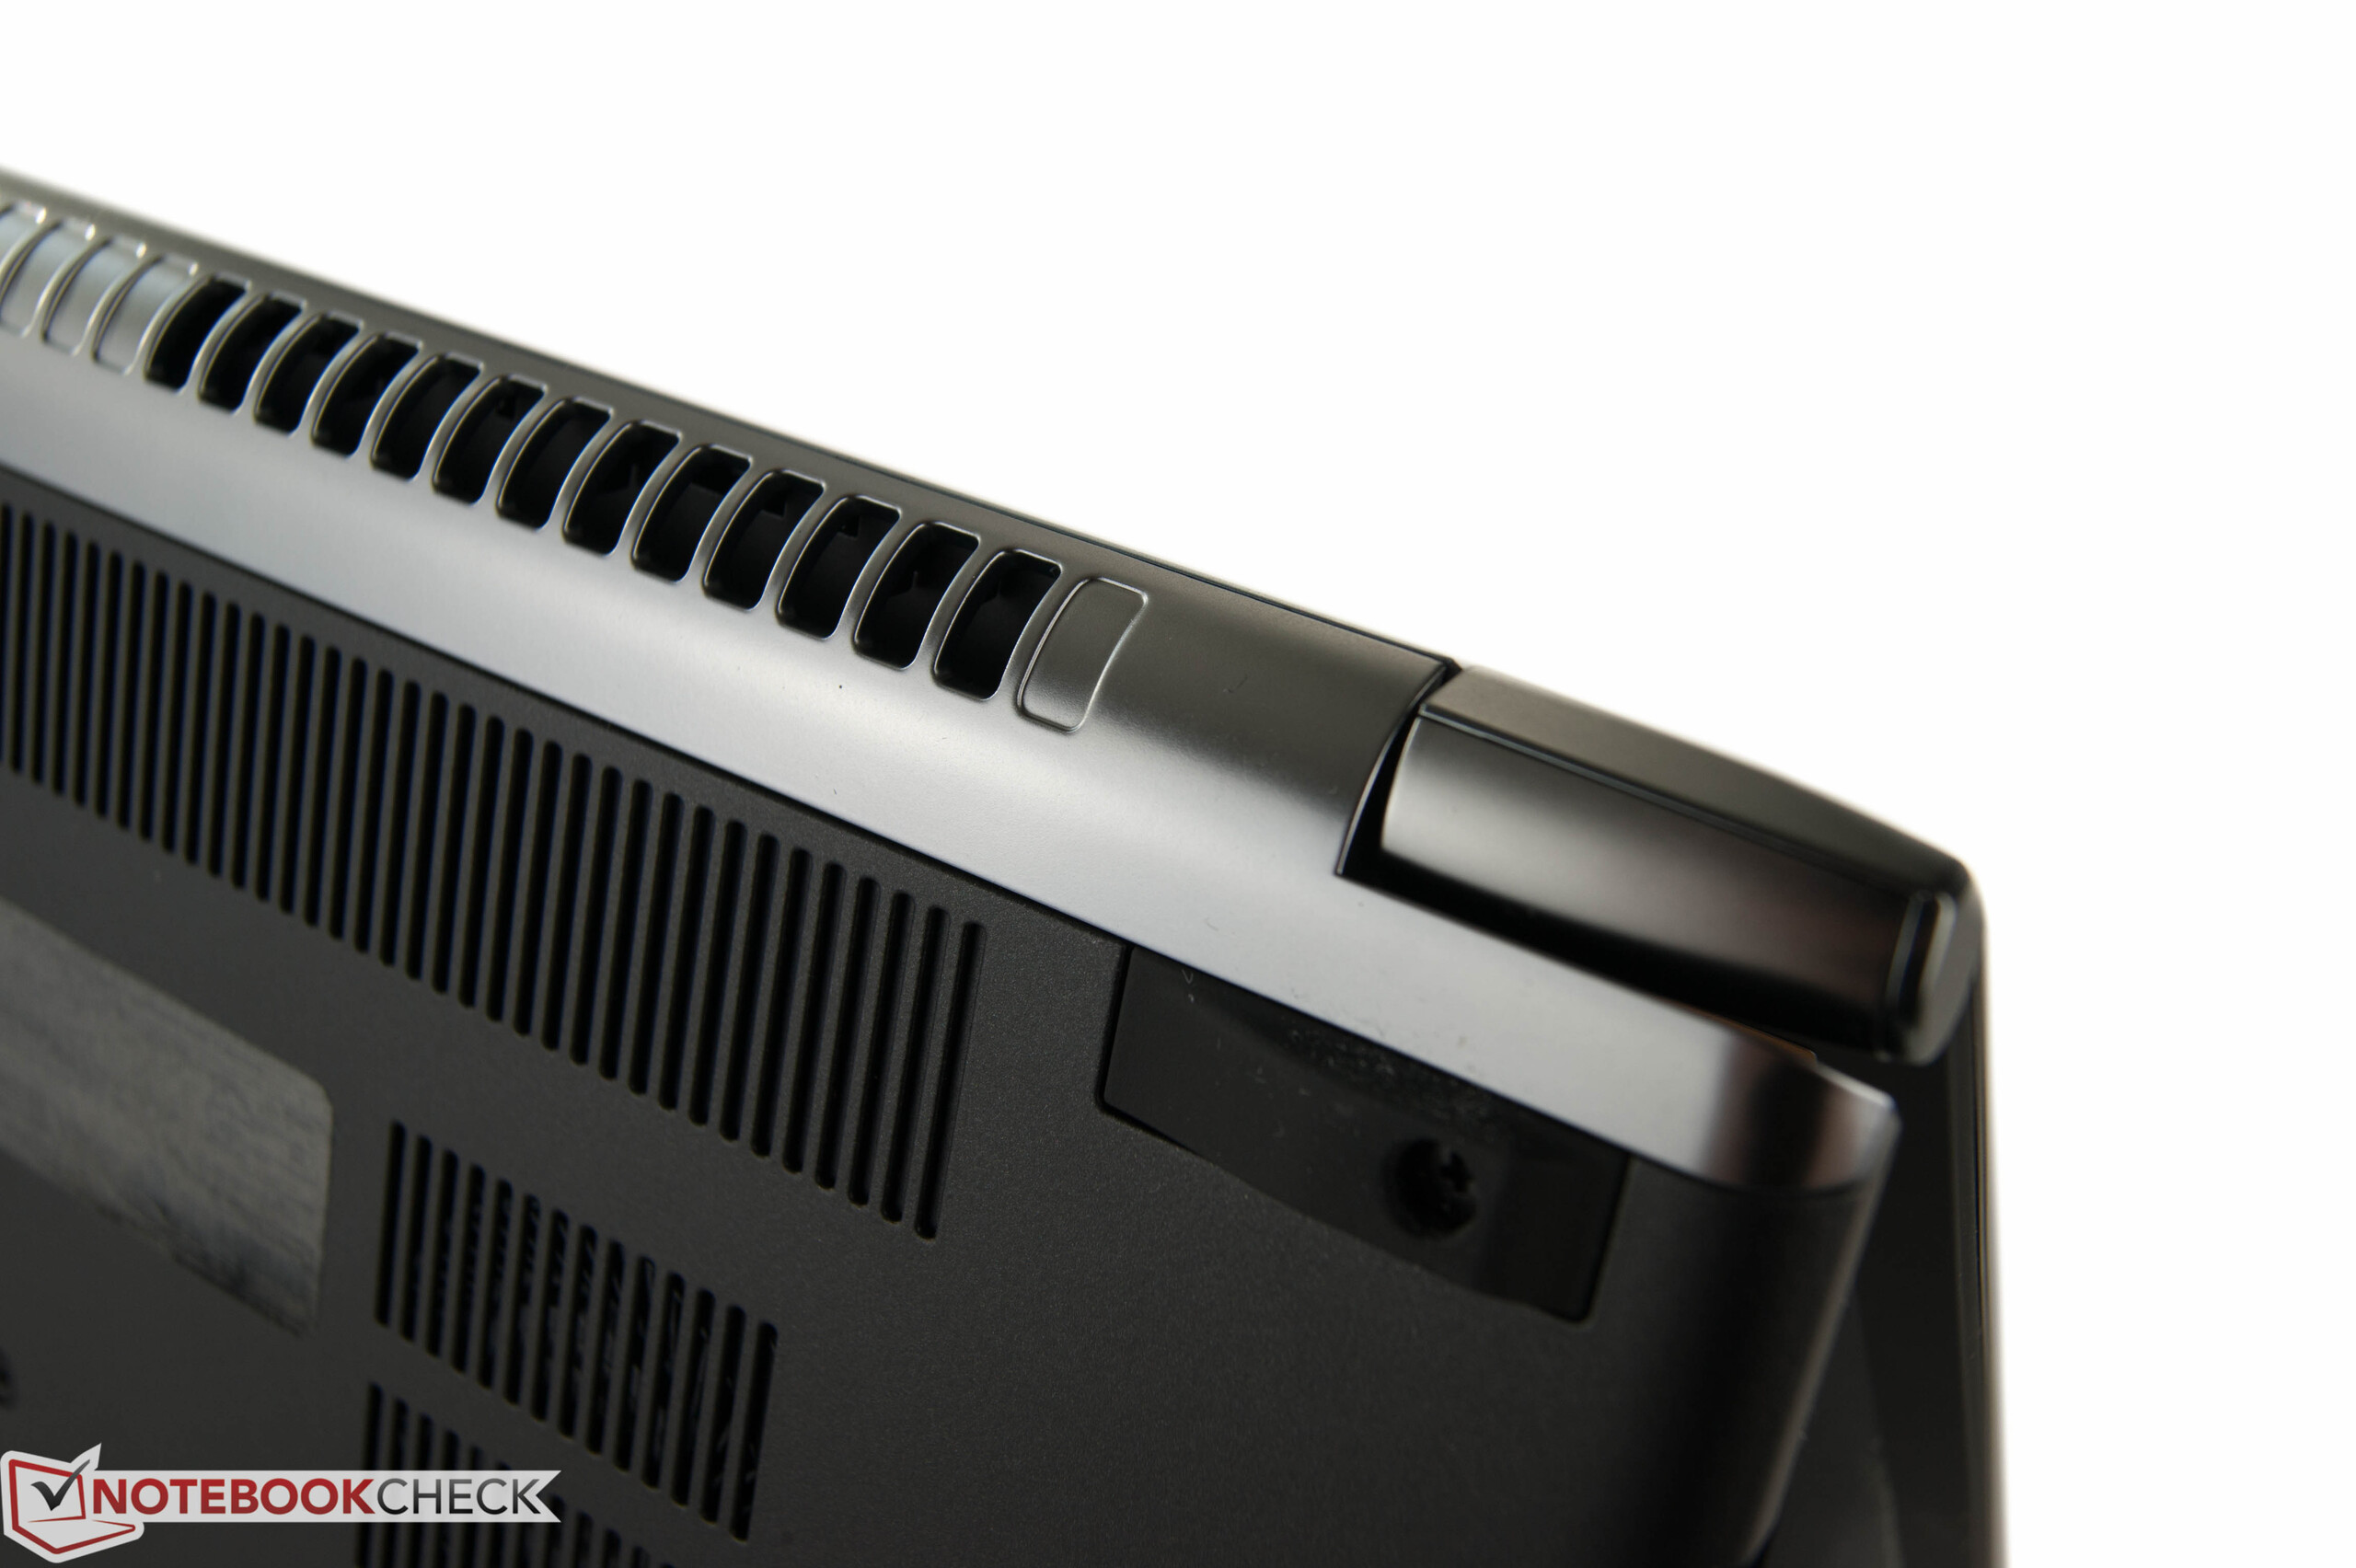
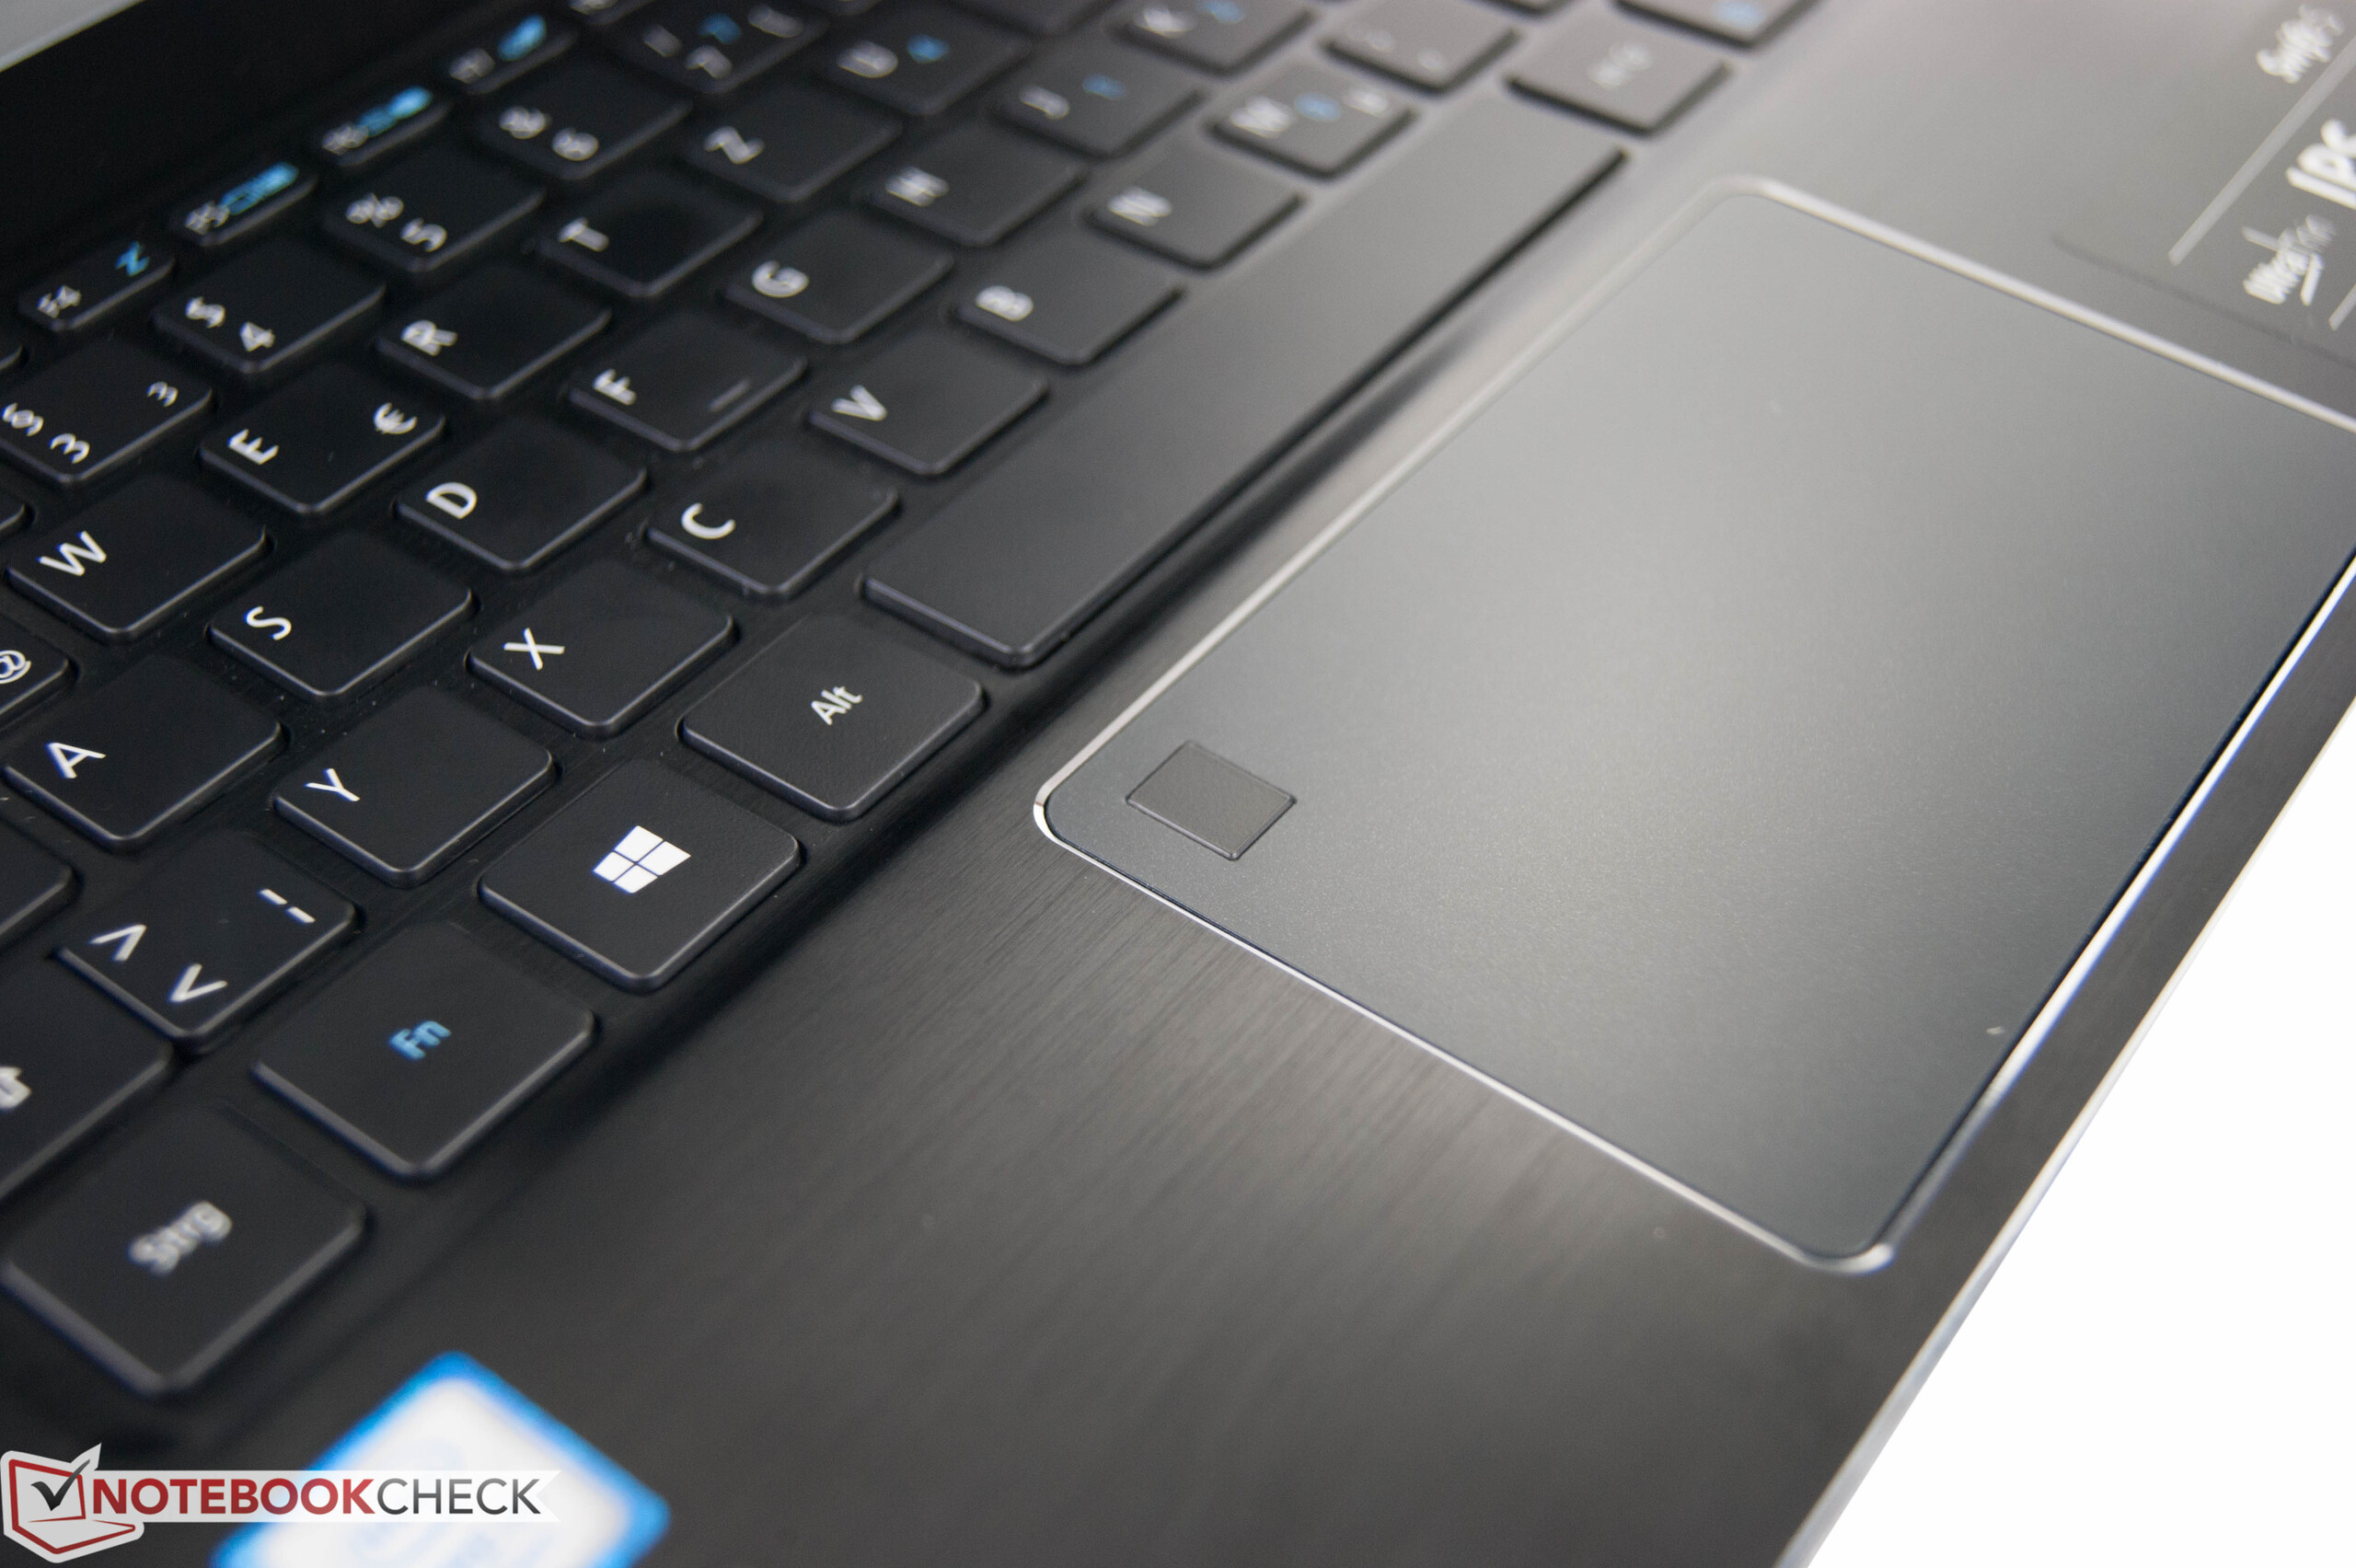
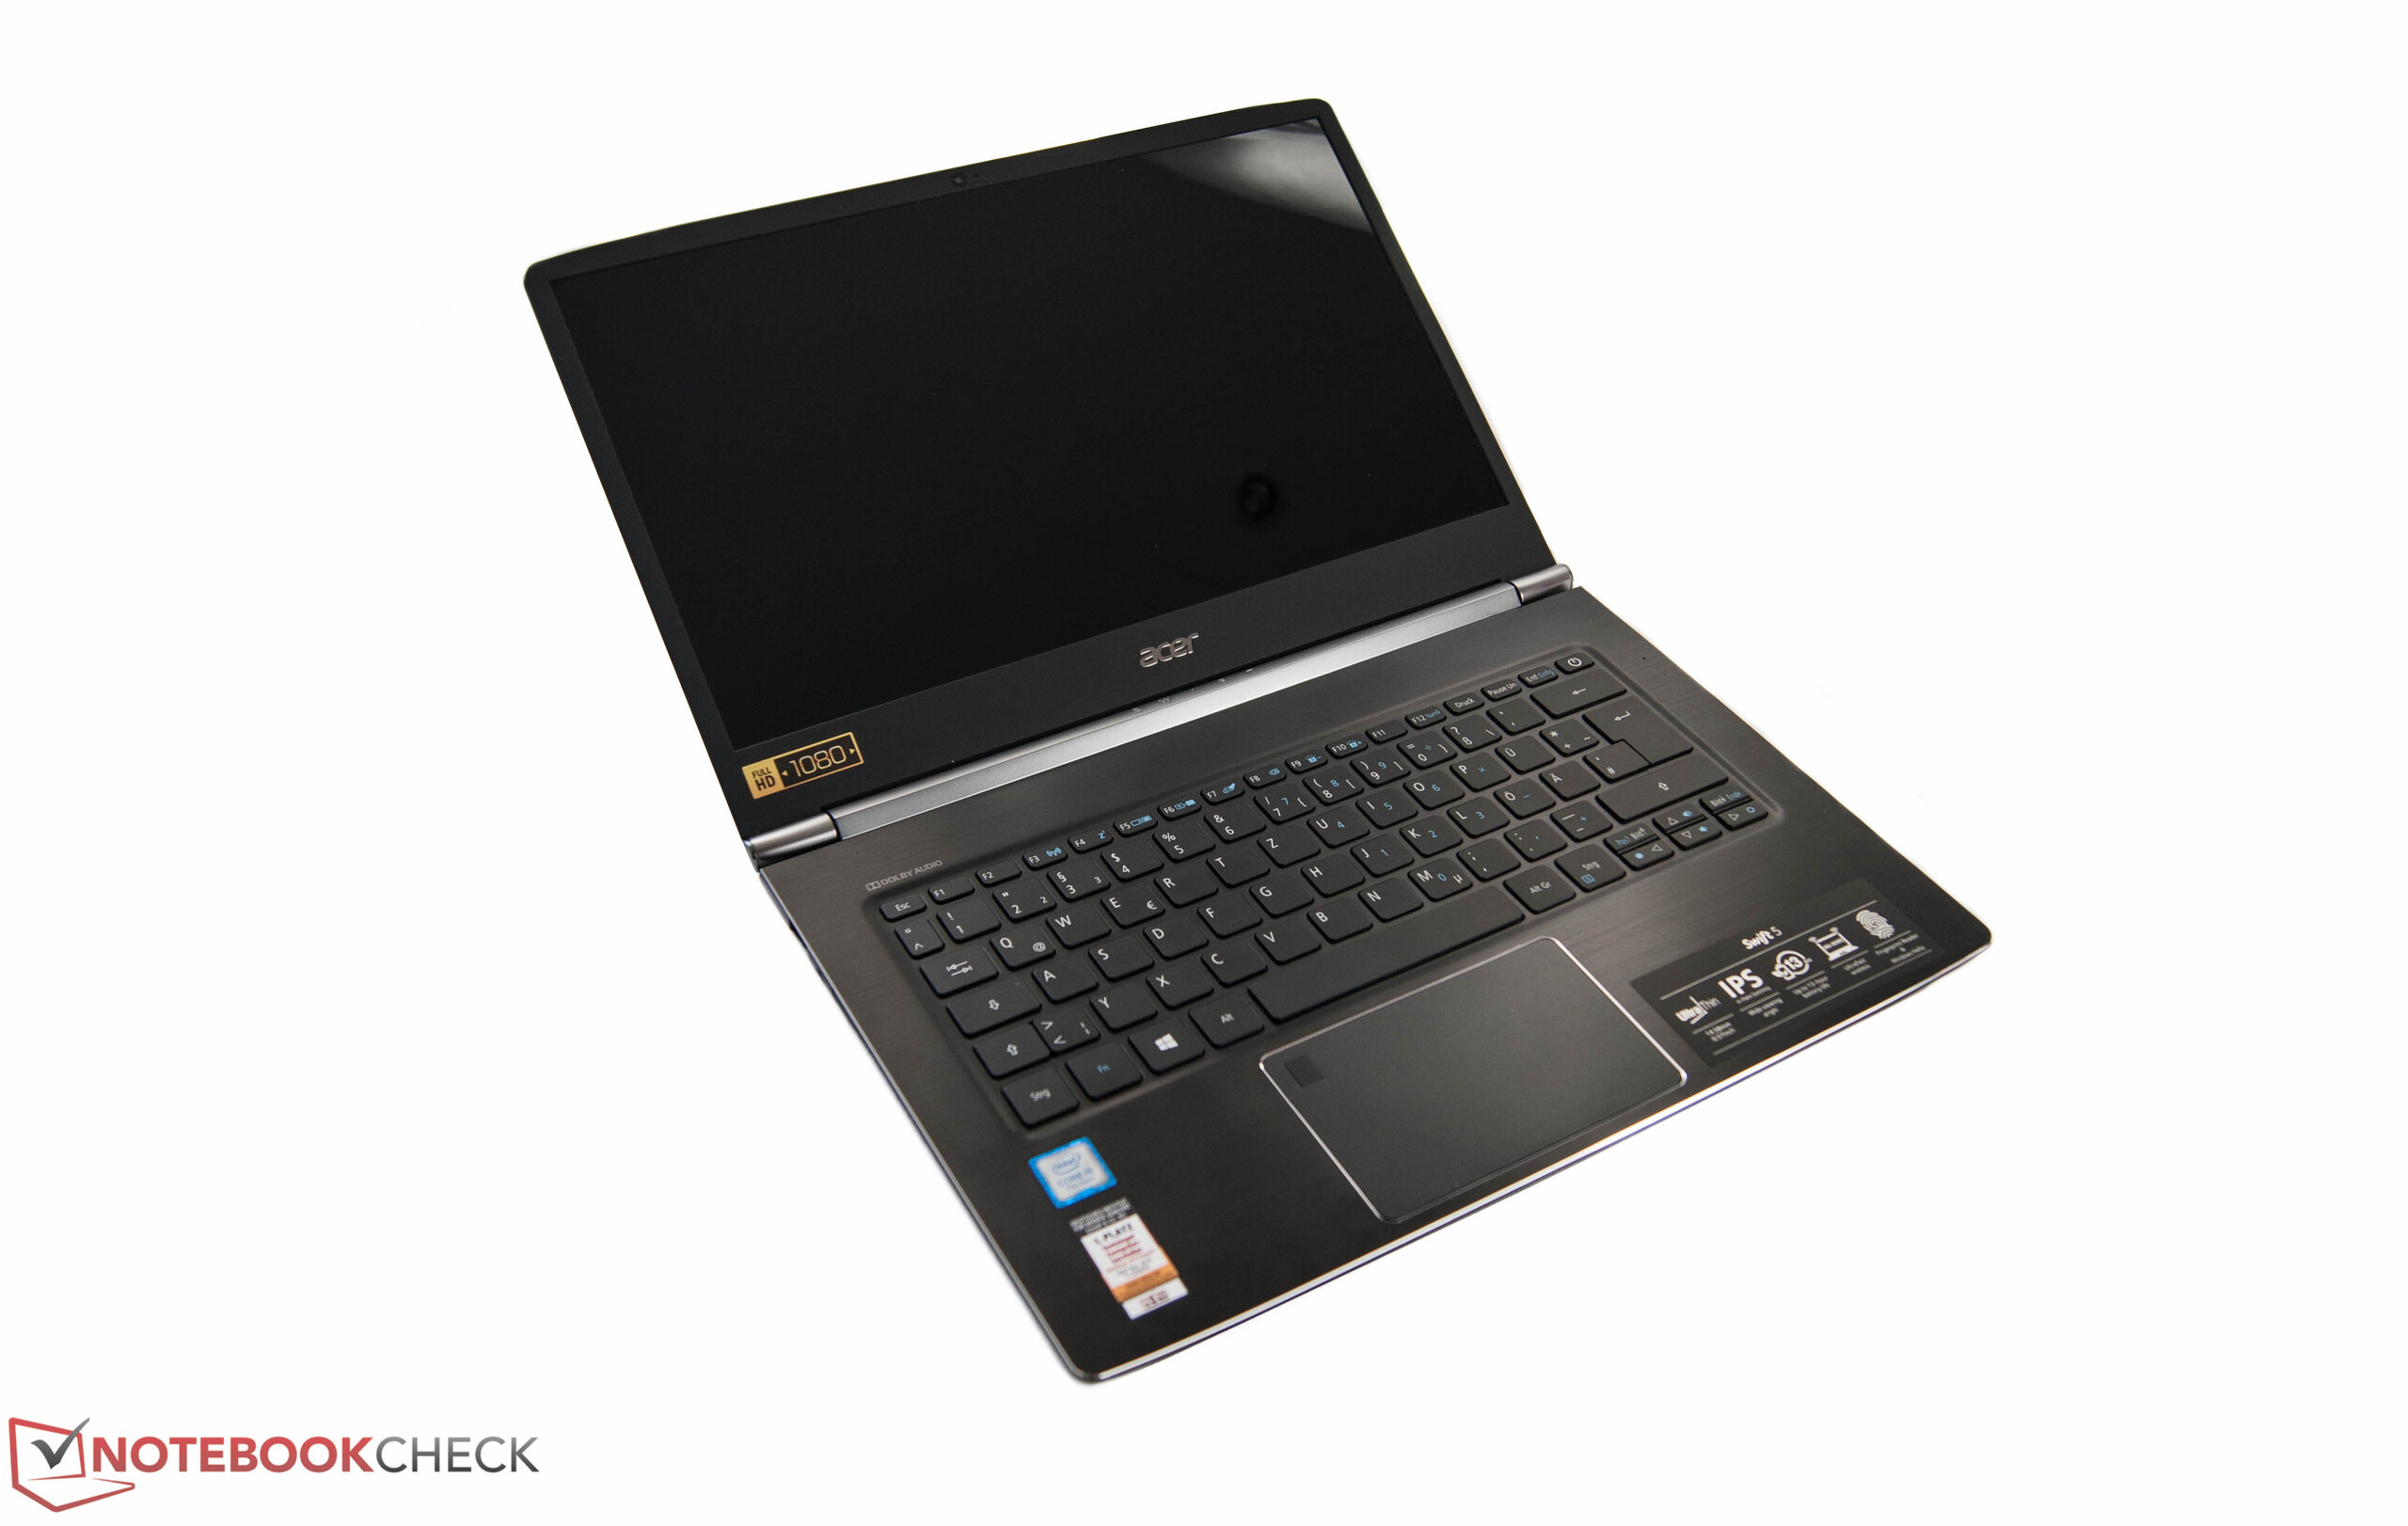
Mezcla exitosa: Acer combina un diseño noble con suficiente rendimiento, pero no se olvida de las importantes emisiones. Nos gustó particularmente el noble diseño de chasis con los biseles extremadamente delgados. Pero no es todo: Acer usa elementos sólidos de metal y convence con buena calidad de construcción, sólo el teclado puede ceder un poco. El desplazamiento de tecla también es algo corto, pero las teclas convencen con un punto de presión firme y bajo desarrollo de ruido durante el mecanografiado. El lustroso display IPS tiene resolución FHD y logra decentes resultados tanto en brillo como en contraste. La equipación hardware del Swift 5 está muy equilibrada, y el procesador casi puede usar su rendimiento máximo bajo carga, lo que no se puede decir de los dispositivos de la comparación. El desarrollo de temperatura también está bien cuando tienes en cuenta el rendimiento. El último aspecto importante de un subportátil es el aguante de la batería. El Swift 5 no aguanta tanto como el Dell XPS 13, pero sigues pudiendo echar una jornada laboral sin enchufarlo.
El nuevo Acer Swift 5 combina casi todos los aspectos importantes de un subportátil y su precio básico es de 900 Euros.
Tienes que echarle un vistazo al Dell XPS 13 9360 si estás en la calle la mayor parte del tiempo. Convence con un display mate y mucho aguante de batería. Aún más delgado y ligero es el rival de Asus a 1,500 Euros.
Ésta es una versión acortada del análisis original. Puedes leer el análisis completo en inglés aquí.
Acer Swift 5 SF514-51-59AV
- 12/22/2016 v6 (old)
Nino Ricchizzi
Price comparison
