Breve análisis del Aorus X3 Plus v7 (i7-7820HK, GTX 1060) Xotic PC Edition
| SD Card Reader | |
| average JPG Copy Test (av. of 3 runs) | |
| Eurocom Tornado F5 | |
| Aorus x3 Plus v7 | |
| Gigabyte Aero 15 | |
| Gigabyte Aero 14 | |
| MSI GS63VR 7RF-228US | |
| maximum AS SSD Seq Read Test (1GB) | |
| Eurocom Tornado F5 | |
| Aorus x3 Plus v7 | |
| Gigabyte Aero 15 | |
| Gigabyte Aero 14 | |
| MSI GS63VR 7RF-228US | |
| Networking | |
| iperf3 transmit AX12 | |
| MSI GS63VR 7RF-228US | |
| Alienware 13 R3 | |
| Eurocom Tornado F5 | |
| Gigabyte Aero 14 | |
| Aorus x3 Plus v7 | |
| Gigabyte Aero 15 | |
| iperf3 receive AX12 | |
| Gigabyte Aero 14 | |
| Gigabyte Aero 15 | |
| Alienware 13 R3 | |
| MSI GS63VR 7RF-228US | |
| Aorus x3 Plus v7 | |
| Eurocom Tornado F5 | |

| |||||||||||||||||||||||||
iluminación: 73 %
Brillo con batería: 348 cd/m²
Contraste: 1200:1 (Negro: 0.29 cd/m²)
ΔE ColorChecker Calman: 2.4 | ∀{0.5-29.43 Ø4.72}
ΔE Greyscale Calman: 2.3 | ∀{0.09-98 Ø4.97}
96% sRGB (Argyll 1.6.3 3D)
62% AdobeRGB 1998 (Argyll 1.6.3 3D)
67.5% AdobeRGB 1998 (Argyll 3D)
96.5% sRGB (Argyll 3D)
66.1% Display P3 (Argyll 3D)
Gamma: 2.21
CCT: 6206 K
| Aorus x3 Plus v7 Sharp SHP1401, IGZO TFT, 13.9", 3200x1800 | Alienware 13 R3 JJT6C_133KL05 (SDCA029), OLED, 13.3", 2560x1440 | Gigabyte Aero 14 LG Philips LP140QH1-SPF1 (LGD049A), IPS, 14", 2560x1440 | Razer Blade (2017) LP140WF3-SPD1, IPS, 14", 1920x1080 | Gigabyte Aero 15 N156HCA-EA1 (CMN15D7), IPS, 15.6", 1920x1080 | Eurocom Tornado F5 IPS, 15.6", 1920x1080 | MSI GS63VR 7RF-228US IPS, 15.6", 3840x2160 | Aorus X5 v6 AO-S107W516-PL-002 Panasonic MEI96A2 / VVX16T028J00, , 15.6", 2880x1620 | |
|---|---|---|---|---|---|---|---|---|
| Display | -4% | -2% | -9% | -26% | 5% | |||
| Display P3 Coverage (%) | 66.1 | 64.4 -3% | 65.2 -1% | 64.5 -2% | 48.21 -27% | 71.7 8% | ||
| sRGB Coverage (%) | 96.5 | 91.8 -5% | 92.5 -4% | 83 -14% | 72.6 -25% | 97.6 1% | ||
| AdobeRGB 1998 Coverage (%) | 67.5 | 65.5 -3% | 66.5 -1% | 60.7 -10% | 49.81 -26% | 72.1 7% | ||
| Response Times | 89% | -5% | 16% | -22% | -8% | 15% | ||
| Response Time Grey 50% / Grey 80% * (ms) | 38 ? | 41 ? -8% | 25.2 ? 34% | 42.8 ? -13% | 33.6 ? 12% | 28 ? 26% | ||
| Response Time Black / White * (ms) | 24.4 ? | 2.8 ? 89% | 25 ? -2% | 24.8 ? -2% | 32 ? -31% | 31.2 ? -28% | 23.6 ? 3% | |
| PWM Frequency (Hz) | 201.6 ? | 240 ? | 21370 | 26000 ? | 1351 ? | |||
| Screen | 10% | -32% | -30% | -40% | -35% | -89% | -15% | |
| Brightness middle (cd/m²) | 348 | 313 -10% | 290 -17% | 272 -22% | 320 -8% | 315.8 -9% | 274.2 -21% | 350 1% |
| Brightness (cd/m²) | 359 | 310 -14% | 257 -28% | 277 -23% | 316 -12% | 310 -14% | 263 -27% | 296 -18% |
| Brightness Distribution (%) | 73 | 87 19% | 79 8% | 84 15% | 90 23% | 90 23% | 92 26% | 79 8% |
| Black Level * (cd/m²) | 0.29 | 0.3 -3% | 0.26 10% | 0.36 -24% | 0.33 -14% | 0.44 -52% | 0.4 -38% | |
| Contrast (:1) | 1200 | 967 -19% | 1046 -13% | 889 -26% | 957 -20% | 623 -48% | 875 -27% | |
| Colorchecker dE 2000 * | 2.4 | 2.54 -6% | 4.59 -91% | 4.59 -91% | 4.62 -93% | 5 -108% | 8 -233% | |
| Colorchecker dE 2000 max. * | 5.1 | 3.94 23% | 8.68 -70% | 8.49 -66% | 9.75 -91% | 10.1 -98% | 14.6 -186% | |
| Greyscale dE 2000 * | 2.3 | 1.43 38% | 4.32 -88% | 4.28 -86% | 6 -161% | 4.2 -83% | 9.1 -296% | |
| Gamma | 2.21 100% | 2.3 96% | 2.25 98% | 2.23 99% | 2.46 89% | 2.12 104% | 2.24 98% | |
| CCT | 6206 105% | 6337 103% | 7320 89% | 6848 95% | 6761 96% | 6107 106% | 5020 129% | |
| Color Space (Percent of AdobeRGB 1998) (%) | 62 | 78 26% | 59 -5% | 55 -11% | 60 -3% | 54.5 -12% | 45.7 -26% | |
| Color Space (Percent of sRGB) (%) | 96 | 97 1% | 92 -4% | 83 -14% | 92 -4% | 83 -14% | 72.1 -25% | |
| Media total (Programa/Opciones) | 50% /
18% | -14% /
-23% | -7% /
-22% | -21% /
-30% | -17% /
-26% | -33% /
-62% | -5% /
-7% |
* ... más pequeño es mejor
Tiempos de respuesta del display
| ↔ Tiempo de respuesta de Negro a Blanco | ||
|---|---|---|
| 24.4 ms ... subida ↗ y bajada ↘ combinada | ↗ 11.2 ms subida | 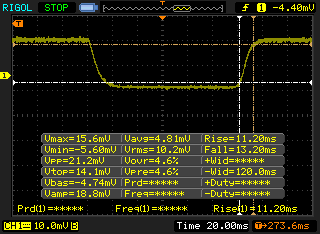 |
| ↘ 13.2 ms bajada | ||
| La pantalla mostró buenos tiempos de respuesta en nuestros tests pero podría ser demasiado lenta para los jugones competitivos. En comparación, todos los dispositivos de prueba van de ##min### (mínimo) a 240 (máximo) ms. » 57 % de todos los dispositivos son mejores. Eso quiere decir que el tiempo de respuesta es peor que la media (19.8 ms) de todos los dispositivos testados. | ||
| ↔ Tiempo de respuesta 50% Gris a 80% Gris | ||
| 38 ms ... subida ↗ y bajada ↘ combinada | ↗ 19.6 ms subida | 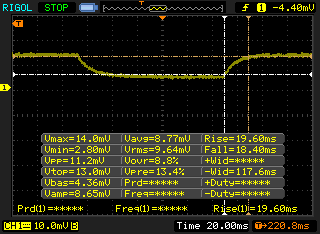 |
| ↘ 18.4 ms bajada | ||
| La pantalla mostró tiempos de respuesta lentos en nuestros tests y podría ser demasiado lenta para los jugones. En comparación, todos los dispositivos de prueba van de ##min### (mínimo) a 636 (máximo) ms. » 55 % de todos los dispositivos son mejores. Eso quiere decir que el tiempo de respuesta es peor que la media (31 ms) de todos los dispositivos testados. | ||
Parpadeo de Pantalla / PWM (Pulse-Width Modulation)
| Parpadeo de Pantalla / PWM detectado | 201.6 Hz | ≤ 50 % de brillo | 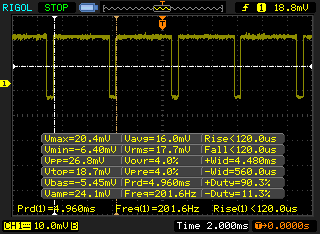 |
La retroiluminación del display parpadea a 201.6 Hz (seguramente usa PWM - Pulse-Width Modulation) a un brillo del 50 % e inferior. Sobre este nivel de brillo no debería darse parpadeo / PWM. La frecuencia de 201.6 Hz es relativamente baja, por lo que la gente sensible debería ver parpadeos y padecer fatiga visual por la pantalla (usado al brillo indicado a continuación). Comparación: 52 % de todos los dispositivos testados no usaron PWM para atenuar el display. Si se usó, medimos una media de 7769 (mínimo: 5 - máxmo: 343500) Hz. | |||
| Cinebench R15 | |
| CPU Single 64Bit | |
| Eurocom Tornado F5 | |
| Aorus x3 Plus v7 | |
| Aorus X5 v6 AO-S107W516-PL-002 | |
| MSI GS63VR 7RF-228US | |
| Gigabyte Aero 15 | |
| Alienware 13 R3 | |
| Gigabyte Aero 14 | |
| Razer Blade (2017) | |
| CPU Multi 64Bit | |
| Eurocom Tornado F5 | |
| Aorus x3 Plus v7 | |
| Aorus X5 v6 AO-S107W516-PL-002 | |
| MSI GS63VR 7RF-228US | |
| Gigabyte Aero 15 | |
| Alienware 13 R3 | |
| Gigabyte Aero 14 | |
| Razer Blade (2017) | |
| Cinebench R11.5 | |
| CPU Single 64Bit | |
| Eurocom Tornado F5 | |
| Aorus x3 Plus v7 | |
| Gigabyte Aero 15 | |
| Alienware 13 R3 | |
| MSI GS63VR 7RF-228US | |
| CPU Multi 64Bit | |
| Eurocom Tornado F5 | |
| Aorus x3 Plus v7 | |
| Gigabyte Aero 15 | |
| MSI GS63VR 7RF-228US | |
| Alienware 13 R3 | |
| Cinebench R10 | |
| Rendering Multiple CPUs 32Bit | |
| Aorus x3 Plus v7 | |
| Eurocom Tornado F5 | |
| MSI GS63VR 7RF-228US | |
| Rendering Single 32Bit | |
| Aorus x3 Plus v7 | |
| Eurocom Tornado F5 | |
| MSI GS63VR 7RF-228US | |
| wPrime 2.10 - 1024m | |
| Aorus x3 Plus v7 | |
| MSI GS63VR 7RF-228US | |
| Aorus X5 v6 AO-S107W516-PL-002 | |
| Eurocom Tornado F5 | |
* ... más pequeño es mejor
| PCMark 8 | |
| Home Score Accelerated v2 | |
| Eurocom Tornado F5 | |
| Gigabyte Aero 15 | |
| MSI GS63VR 7RF-228US | |
| Razer Blade (2017) | |
| Alienware 13 R3 | |
| Gigabyte Aero 14 | |
| Aorus x3 Plus v7 | |
| Work Score Accelerated v2 | |
| Eurocom Tornado F5 | |
| Gigabyte Aero 15 | |
| MSI GS63VR 7RF-228US | |
| Razer Blade (2017) | |
| Alienware 13 R3 | |
| Gigabyte Aero 14 | |
| Aorus x3 Plus v7 | |
| Creative Score Accelerated v2 | |
| Eurocom Tornado F5 | |
| MSI GS63VR 7RF-228US | |
| Alienware 13 R3 | |
| Aorus x3 Plus v7 | |
| PCMark 7 Score | 5966 puntos | |
| PCMark 8 Home Score Accelerated v2 | 3266 puntos | |
| PCMark 8 Creative Score Accelerated v2 | 4278 puntos | |
| PCMark 8 Work Score Accelerated v2 | 4605 puntos | |
ayuda | ||
| Aorus x3 Plus v7 Toshiba NVMe THNSN5512GPU7 | Alienware 13 R3 Toshiba NVMe THNSN5256GPUK | Gigabyte Aero 14 LiteOn CX2-8B256 | Razer Blade (2017) Samsung PM951 NVMe MZVLV256 | Gigabyte Aero 15 Lite-On CX2-8B512-Q11 | Eurocom Tornado F5 Samsung SSD 960 Pro 512 GB m.2 | MSI GS63VR 7RF-228US Samsung SM961 MZVKW512HMJP m.2 PCI-e | Aorus X5 v6 AO-S107W516-PL-002 LiteOn CX2-8B256 | |
|---|---|---|---|---|---|---|---|---|
| CrystalDiskMark 3.0 | -23% | -14% | -38% | -6% | 12% | 7% | -12% | |
| Read Seq (MB/s) | 1498 | 1373 -8% | 1584 6% | 1122 -25% | 1769 18% | 2145 43% | 2141 43% | 1605 7% |
| Write Seq (MB/s) | 1324 | 789 -40% | 795 -40% | 311 -77% | 1133 -14% | 1724 30% | 1621 22% | 767 -42% |
| Read 512 (MB/s) | 966 | 1070 11% | 985 2% | 682 -29% | 891 -8% | 715 -26% | 499.7 -48% | 952 -1% |
| Write 512 (MB/s) | 1221 | 405.6 -67% | 814 -33% | 310 -75% | 1069 -12% | 967 -21% | 1531 25% | 724 -41% |
| Read 4k (MB/s) | 44.8 | 37.65 -16% | 44.93 0% | 34.8 -22% | 44.7 0% | 55.9 25% | 54.2 21% | 46.13 3% |
| Write 4k (MB/s) | 156 | 140.2 -10% | 131.2 -16% | 134.3 -14% | 123.3 -21% | 180.6 16% | 158.2 1% | 143.2 -8% |
| Read 4k QD32 (MB/s) | 700 | 593 -15% | 602 -14% | 565 -19% | 645 -8% | 744 6% | 632 -10% | 644 -8% |
| Write 4k QD32 (MB/s) | 517 | 311.2 -40% | 441 -15% | 308 -40% | 490.5 -5% | 634 23% | 527 2% | 486.2 -6% |

| 3DMark | |
| 1280x720 Cloud Gate Standard Graphics | |
| Eurocom Tornado F5 | |
| Aorus X5 v6 AO-S107W516-PL-002 | |
| Gigabyte Aero 15 | |
| Alienware 13 R3 | |
| Aorus x3 Plus v7 | |
| Gigabyte Aero 14 | |
| MSI GS63VR 7RF-228US | |
| 1920x1080 Fire Strike Graphics | |
| Aorus X5 v6 AO-S107W516-PL-002 | |
| Eurocom Tornado F5 | |
| Aorus x3 Plus v7 | |
| Gigabyte Aero 14 | |
| Alienware 13 R3 | |
| MSI GS63VR 7RF-228US | |
| Gigabyte Aero 15 | |
| Razer Blade (2017) | |
| 3DMark Ice Storm Standard Score | 33625 puntos | |
| 3DMark Cloud Gate Standard Score | 20785 puntos | |
| 3DMark Fire Strike Score | 10361 puntos | |
| 3DMark Fire Strike Extreme Score | 5532 puntos | |
ayuda | ||
| BioShock Infinite - 1920x1080 Ultra Preset, DX11 (DDOF) (ordenar por valor) | |
| Aorus x3 Plus v7 | |
| Eurocom Tornado F5 | |
| MSI GS63VR 7RF-228US | |
| Aorus X5 v6 AO-S107W516-PL-002 | |
| Metro: Last Light - 1920x1080 Very High (DX11) AF:16x (ordenar por valor) | |
| Aorus x3 Plus v7 | |
| Eurocom Tornado F5 | |
| MSI GS63VR 7RF-228US | |
| Thief - 1920x1080 Very High Preset AA:FXAA & High SS AF:8x (ordenar por valor) | |
| Aorus x3 Plus v7 | |
| MSI GS63VR 7RF-228US | |
| Aorus X5 v6 AO-S107W516-PL-002 | |
| The Witcher 3 - 1920x1080 Ultra Graphics & Postprocessing (HBAO+) (ordenar por valor) | |
| Aorus x3 Plus v7 | |
| Gigabyte Aero 14 | |
| Razer Blade (2017) | |
| Gigabyte Aero 15 | |
| MSI GS63VR 7RF-228US | |
| Aorus X5 v6 AO-S107W516-PL-002 | |
| Rise of the Tomb Raider - 1920x1080 Very High Preset AA:FX AF:16x (ordenar por valor) | |
| Aorus x3 Plus v7 | |
| Razer Blade (2017) | |
| Eurocom Tornado F5 | |
| MSI GS63VR 7RF-228US | |
| Ashes of the Singularity - 1920x1080 high (ordenar por valor) | |
| Aorus x3 Plus v7 | |
| Eurocom Tornado F5 | |
| Doom - 1920x1080 Ultra Preset AA:SM (ordenar por valor) | |
| Aorus x3 Plus v7 | |
| Eurocom Tornado F5 | |
| MSI GS63VR 7RF-228US | |
| Fallout 4 - 1920x1080 Ultra Preset AA:T AF:16x (ordenar por valor) | |
| Aorus x3 Plus v7 | |
| Eurocom Tornado F5 | |
| MSI GS63VR 7RF-228US | |
| bajo | medio | alto | ultra | |
|---|---|---|---|---|
| BioShock Infinite (2013) | 109 | |||
| Metro: Last Light (2013) | 82 | |||
| Thief (2014) | 42 | |||
| The Witcher 3 (2015) | 40 | |||
| Fallout 4 (2015) | 77 | |||
| Rise of the Tomb Raider (2016) | 65 | |||
| Ashes of the Singularity (2016) | 50 | |||
| Doom (2016) | 97 | |||
| Mafia 3 (2016) | 45 |
Ruido
| Ocioso |
| 31.4 / 37 / 40.8 dB(A) |
| Carga |
| 50 / 53.6 dB(A) |
 | ||
30 dB silencioso 40 dB(A) audible 50 dB(A) ruidosamente alto |
||
min: | ||
| Aorus x3 Plus v7 GeForce GTX 1060 Mobile, i7-7820HK, Toshiba NVMe THNSN5512GPU7 | Alienware 13 R3 GeForce GTX 1060 Mobile, i7-7700HQ, Toshiba NVMe THNSN5256GPUK | Gigabyte Aero 14 GeForce GTX 1060 Mobile, i7-7700HQ, LiteOn CX2-8B256 | Razer Blade (2017) GeForce GTX 1060 Mobile, i7-7700HQ, Samsung PM951 NVMe MZVLV256 | Gigabyte Aero 15 GeForce GTX 1060 Mobile, i7-7700HQ, Lite-On CX2-8B512-Q11 | Eurocom Tornado F5 GeForce GTX 1070 Mobile, i7-7700K, Samsung SSD 960 Pro 512 GB m.2 | MSI GS63VR 7RF-228US GeForce GTX 1060 Mobile, i7-7700HQ, Samsung SM961 MZVKW512HMJP m.2 PCI-e | Aorus X5 v6 AO-S107W516-PL-002 GeForce GTX 1070 Mobile, 6820HK, LiteOn CX2-8B256 | |
|---|---|---|---|---|---|---|---|---|
| Noise | 15% | 9% | 10% | 10% | 6% | 11% | 1% | |
| apagado / medio ambiente * (dB) | 29.1 | 29 -0% | 31 -7% | 31 -7% | 29.4 -1% | 28.8 1% | ||
| Idle Minimum * (dB) | 31.4 | 29 8% | 31 1% | 30 4% | 32 -2% | 33.3 -6% | 33.1 -5% | 33.4 -6% |
| Idle Average * (dB) | 37 | 30 19% | 32 14% | 30 19% | 33 11% | 33.5 9% | 33.1 11% | 34.2 8% |
| Idle Maximum * (dB) | 40.8 | 31 24% | 33 19% | 30 26% | 34 17% | 33.5 18% | 34 17% | 35 14% |
| Load Average * (dB) | 50 | 36 28% | 42 16% | 51 -2% | 39 22% | 44.2 12% | 37.2 26% | 53.3 -7% |
| Witcher 3 ultra * (dB) | 53.6 | 45 16% | 43 20% | 46.1 14% | ||||
| Load Maximum * (dB) | 53.6 | 49 9% | 53 1% | 51 5% | 50 7% | 52.5 2% | 47.1 12% | 57 -6% |
* ... más pequeño es mejor
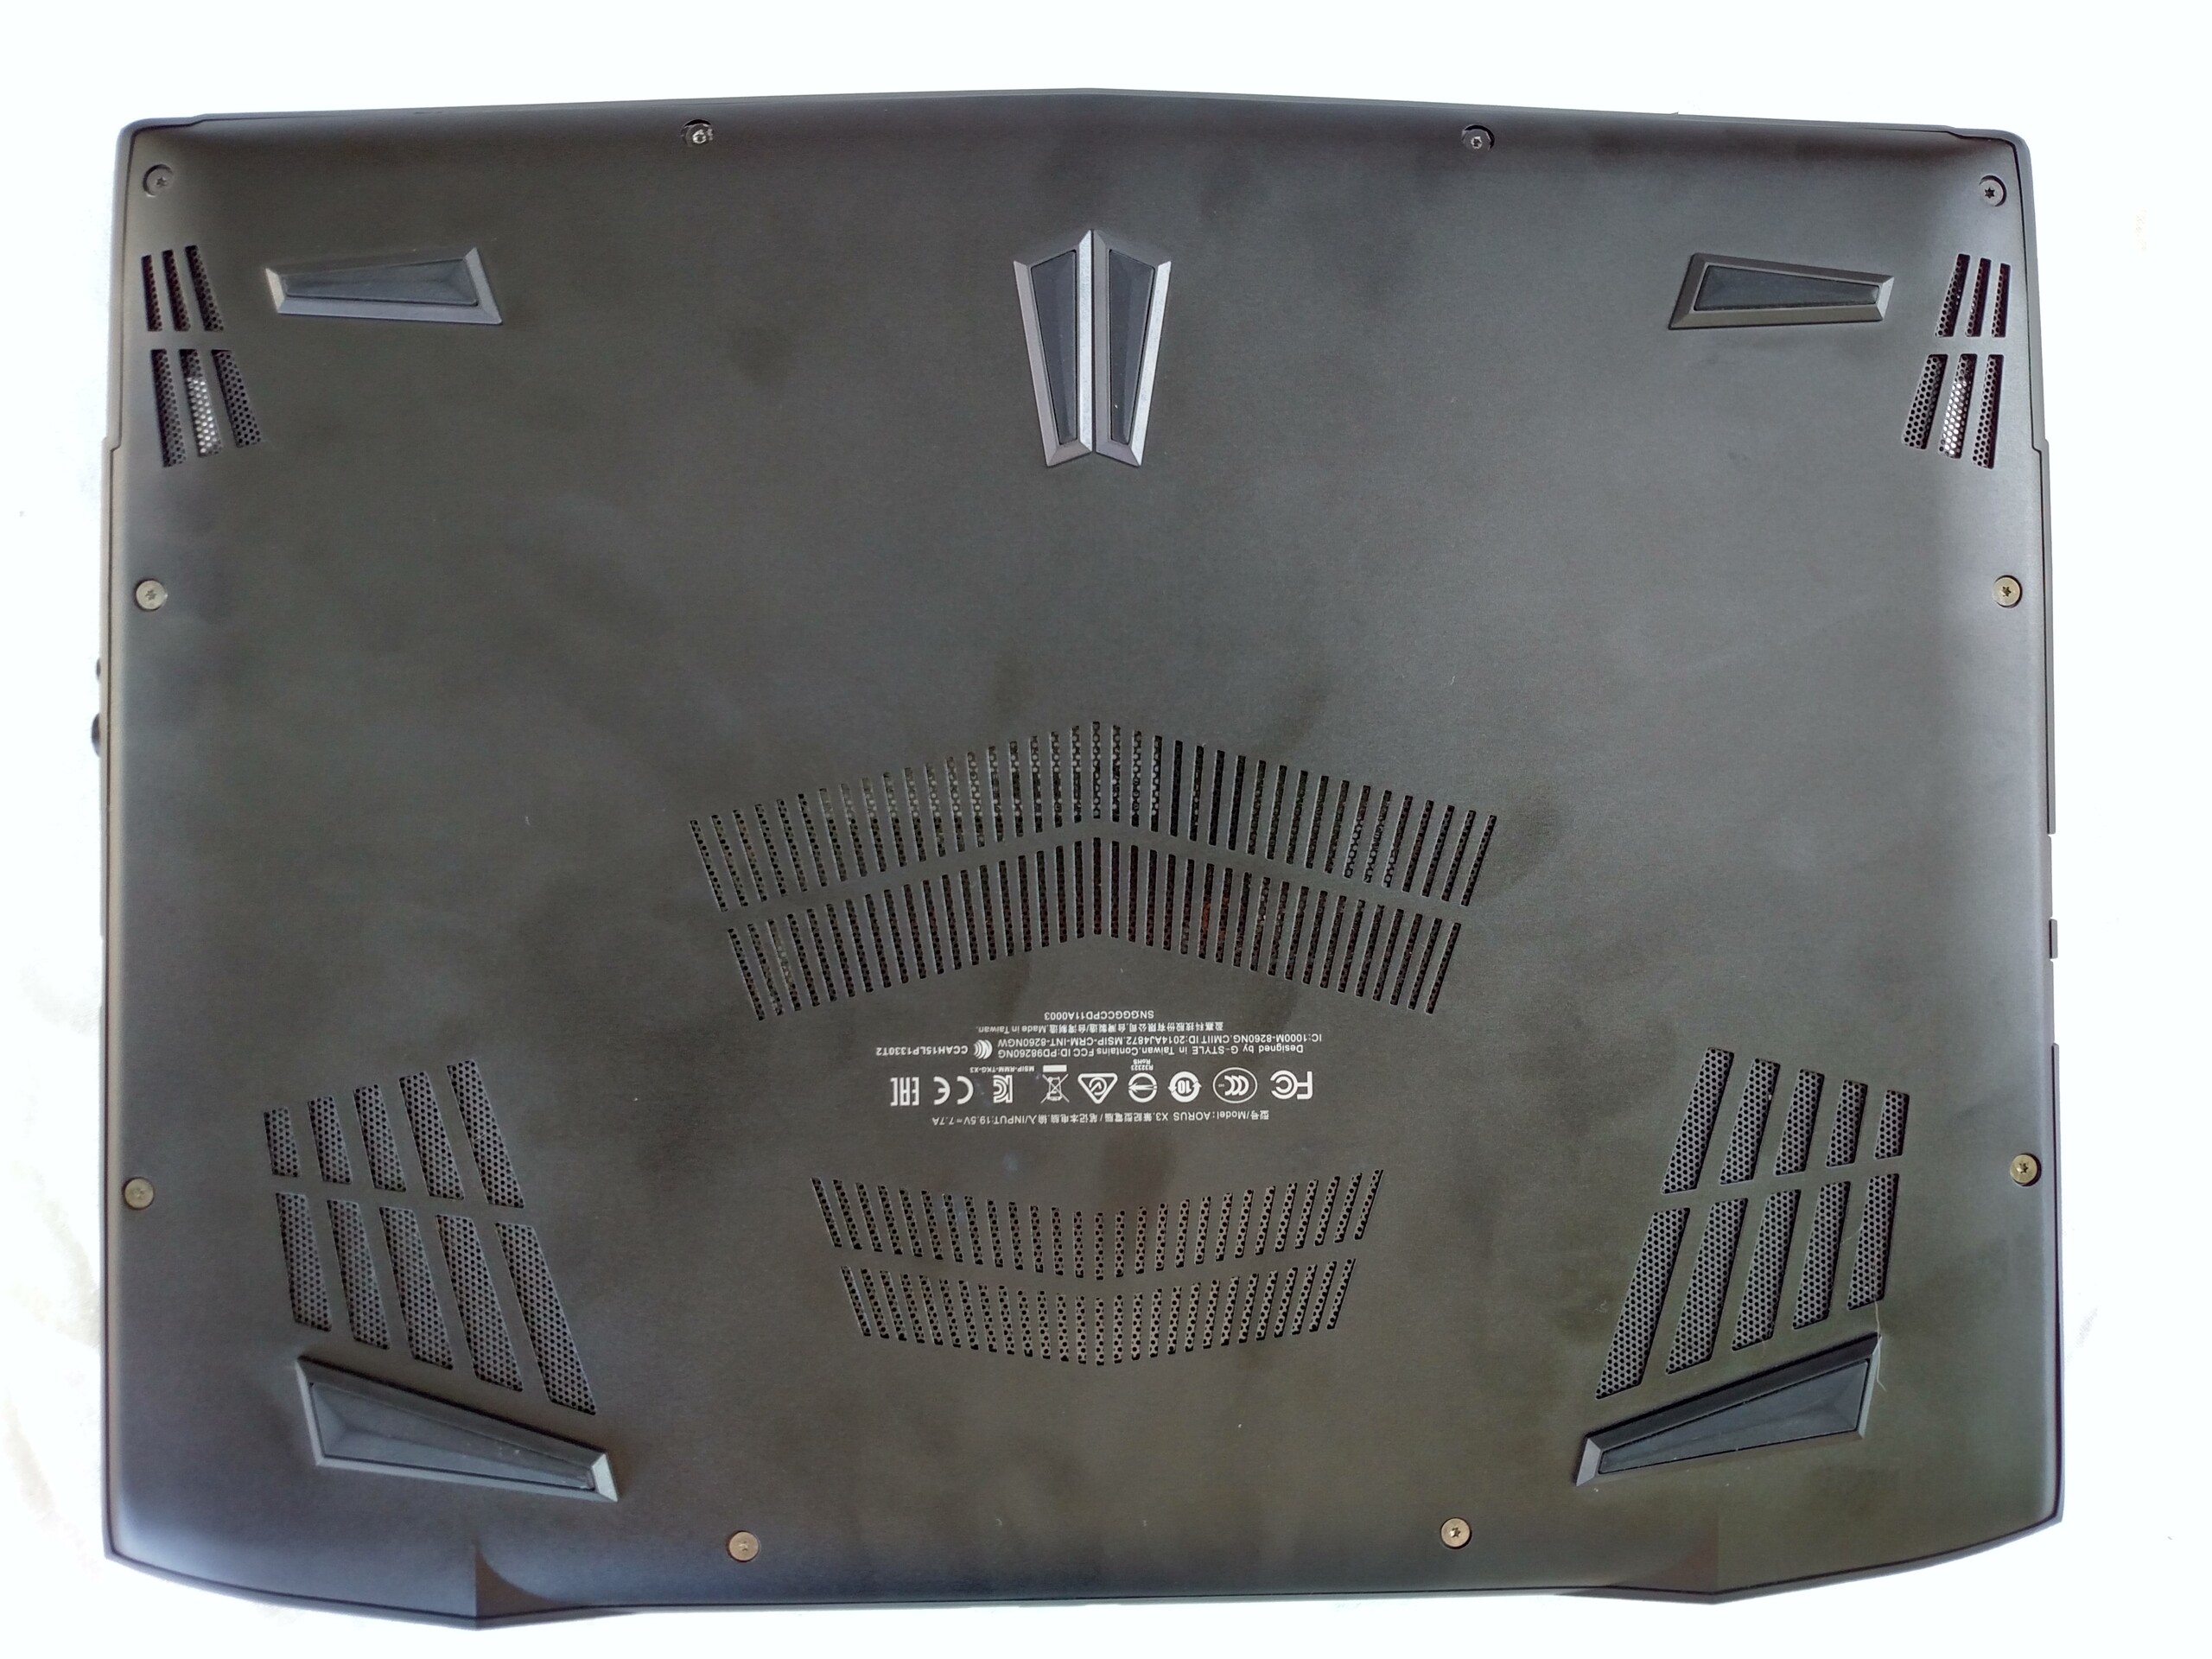
(-) La temperatura máxima en la parte superior es de 46.8 °C / 116 F, frente a la media de 40.4 °C / 105 F, que oscila entre 21.2 y 68.8 °C para la clase Gaming.
(-) El fondo se calienta hasta un máximo de 55.2 °C / 131 F, frente a la media de 43.2 °C / 110 F
(+) En reposo, la temperatura media de la parte superior es de 25 °C / 77# F, frente a la media del dispositivo de 33.9 °C / 93 F.
(±) Jugando a The Witcher 3, la temperatura media de la parte superior es de 32.6 °C / 91 F, frente a la media del dispositivo de 33.9 °C / 93 F.
(+) El reposamanos y el panel táctil están a una temperatura inferior a la de la piel, con un máximo de 27 °C / 80.6 F y, por tanto, son fríos al tacto.
(±) La temperatura media de la zona del reposamanos de dispositivos similares fue de 28.8 °C / 83.8 F (+1.8 °C / 3.2 F).
Aorus x3 Plus v7 análisis de audio
(±) | la sonoridad del altavoz es media pero buena (72.5 dB)
Graves 100 - 315 Hz
(-) | casi sin bajos - de media 18.4% inferior a la mediana
(±) | la linealidad de los graves es media (12.6% delta a frecuencia anterior)
Medios 400 - 2000 Hz
(+) | medios equilibrados - a sólo 1.6% de la mediana
(±) | la linealidad de los medios es media (7.1% delta respecto a la frecuencia anterior)
Altos 2 - 16 kHz
(+) | máximos equilibrados - a sólo 4% de la mediana
(±) | la linealidad de los máximos es media (8% delta a frecuencia anterior)
Total 100 - 16.000 Hz
(±) | la linealidad del sonido global es media (25.5% de diferencia con la mediana)
En comparación con la misma clase
» 91% de todos los dispositivos probados de esta clase eran mejores, 2% similares, 7% peores
» El mejor tuvo un delta de 6%, la media fue 18%, el peor fue ###max##%
En comparación con todos los dispositivos probados
» 78% de todos los dispositivos probados eran mejores, 4% similares, 17% peores
» El mejor tuvo un delta de 4%, la media fue 24%, el peor fue ###max##%
Alienware 13 R3 análisis de audio
(±) | la sonoridad del altavoz es media pero buena (79 dB)
Graves 100 - 315 Hz
(±) | lubina reducida - en promedio 14.8% inferior a la mediana
(±) | la linealidad de los graves es media (10% delta a frecuencia anterior)
Medios 400 - 2000 Hz
(+) | medios equilibrados - a sólo 3.8% de la mediana
(+) | los medios son lineales (6.2% delta a la frecuencia anterior)
Altos 2 - 16 kHz
(+) | máximos equilibrados - a sólo 3.6% de la mediana
(+) | los máximos son lineales (6.9% delta a la frecuencia anterior)
Total 100 - 16.000 Hz
(±) | la linealidad del sonido global es media (18.4% de diferencia con la mediana)
En comparación con la misma clase
» 59% de todos los dispositivos probados de esta clase eran mejores, 9% similares, 32% peores
» El mejor tuvo un delta de 6%, la media fue 18%, el peor fue ###max##%
En comparación con todos los dispositivos probados
» 41% de todos los dispositivos probados eran mejores, 8% similares, 52% peores
» El mejor tuvo un delta de 4%, la media fue 24%, el peor fue ###max##%
| Off / Standby | |
| Ocioso | |
| Carga |
|
Clave:
min: | |
| Aorus x3 Plus v7 i7-7820HK, GeForce GTX 1060 Mobile, Toshiba NVMe THNSN5512GPU7, IGZO TFT, 3200x1800, 13.9" | Alienware 13 R3 i7-7700HQ, GeForce GTX 1060 Mobile, Toshiba NVMe THNSN5256GPUK, OLED, 2560x1440, 13.3" | Gigabyte Aero 14 i7-7700HQ, GeForce GTX 1060 Mobile, LiteOn CX2-8B256, IPS, 2560x1440, 14" | Razer Blade (2017) i7-7700HQ, GeForce GTX 1060 Mobile, Samsung PM951 NVMe MZVLV256, IPS, 1920x1080, 14" | Gigabyte Aero 15 i7-7700HQ, GeForce GTX 1060 Mobile, Lite-On CX2-8B512-Q11, IPS, 1920x1080, 15.6" | Eurocom Tornado F5 i7-7700K, GeForce GTX 1070 Mobile, Samsung SSD 960 Pro 512 GB m.2, IPS, 1920x1080, 15.6" | MSI GS63VR 7RF-228US i7-7700HQ, GeForce GTX 1060 Mobile, Samsung SM961 MZVKW512HMJP m.2 PCI-e, IPS, 3840x2160, 15.6" | Aorus X5 v6 AO-S107W516-PL-002 6820HK, GeForce GTX 1070 Mobile, LiteOn CX2-8B256, , 2880x1620, 15.6" | |
|---|---|---|---|---|---|---|---|---|
| Power Consumption | 21% | 18% | 29% | 9% | -46% | 2% | -70% | |
| Idle Minimum * (Watt) | 15.1 | 7 54% | 8 47% | 7.5 50% | 12 21% | 21.2 -40% | 14.5 4% | 23.3 -54% |
| Idle Average * (Watt) | 15.8 | 12 24% | 13 18% | 12.1 23% | 15 5% | 25.1 -59% | 17.3 -9% | 30.1 -91% |
| Idle Maximum * (Watt) | 16.7 | 18 -8% | 20 -20% | 14.3 14% | 20 -20% | 26.3 -57% | 17.4 -4% | 31 -86% |
| Load Average * (Watt) | 110.9 | 76 31% | 78 30% | 73.5 34% | 82 26% | 169.4 -53% | 93 16% | 195.8 -77% |
| Witcher 3 ultra * (Watt) | 135 | 110 19% | 108 20% | 111 18% | 128.8 5% | |||
| Load Maximum * (Watt) | 170.4 | 161 6% | 146 14% | 110.2 35% | 161 6% | 202.4 -19% | 242 -42% |
* ... más pequeño es mejor
| Aorus x3 Plus v7 i7-7820HK, GeForce GTX 1060 Mobile, 74 Wh | Alienware 13 R3 i7-7700HQ, GeForce GTX 1060 Mobile, 76 Wh | Gigabyte Aero 14 i7-7700HQ, GeForce GTX 1060 Mobile, 94 Wh | Razer Blade (2017) i7-7700HQ, GeForce GTX 1060 Mobile, 70 Wh | Gigabyte Aero 15 i7-7700HQ, GeForce GTX 1060 Mobile, 94.24 Wh | Eurocom Tornado F5 i7-7700K, GeForce GTX 1070 Mobile, 75.24 Wh | MSI GS63VR 7RF-228US i7-7700HQ, GeForce GTX 1060 Mobile, 65 Wh | Aorus X5 v6 AO-S107W516-PL-002 6820HK, GeForce GTX 1070 Mobile, 94.2 Wh | |
|---|---|---|---|---|---|---|---|---|
| Duración de Batería | 2% | 66% | 86% | 29% | -34% | -21% | -50% | |
| Reader / Idle (h) | 8 | 8.7 9% | 15.2 90% | 10.6 33% | 4.9 -39% | 6.4 -20% | 4 -50% | |
| WiFi v1.3 (h) | 4.9 | 5.3 8% | 8.7 78% | 9.1 86% | 7 43% | 3.6 -27% | 3.9 -20% | |
| Load (h) | 1.7 | 1.5 -12% | 2.2 29% | 1.9 12% | 1.1 -35% | 1.3 -24% | ||
| WiFi (h) | 3 |
Pro
Contra

El X3 Plus v7 es un dispositivo ambicioso. Sigue el empuje de Aorus de encajar hardware potente en una carcasa compacta. Por desgracia, el X3 intenta abarcar mucho, y el resultado final es un portátil con sacrificios. Si bien hay algunos puntos fuertes claros, se tuvieron que hacer recortes para lograr este nivel de rendimiento, y el Aorus puede haberlos hecho en los sitios equivocados.
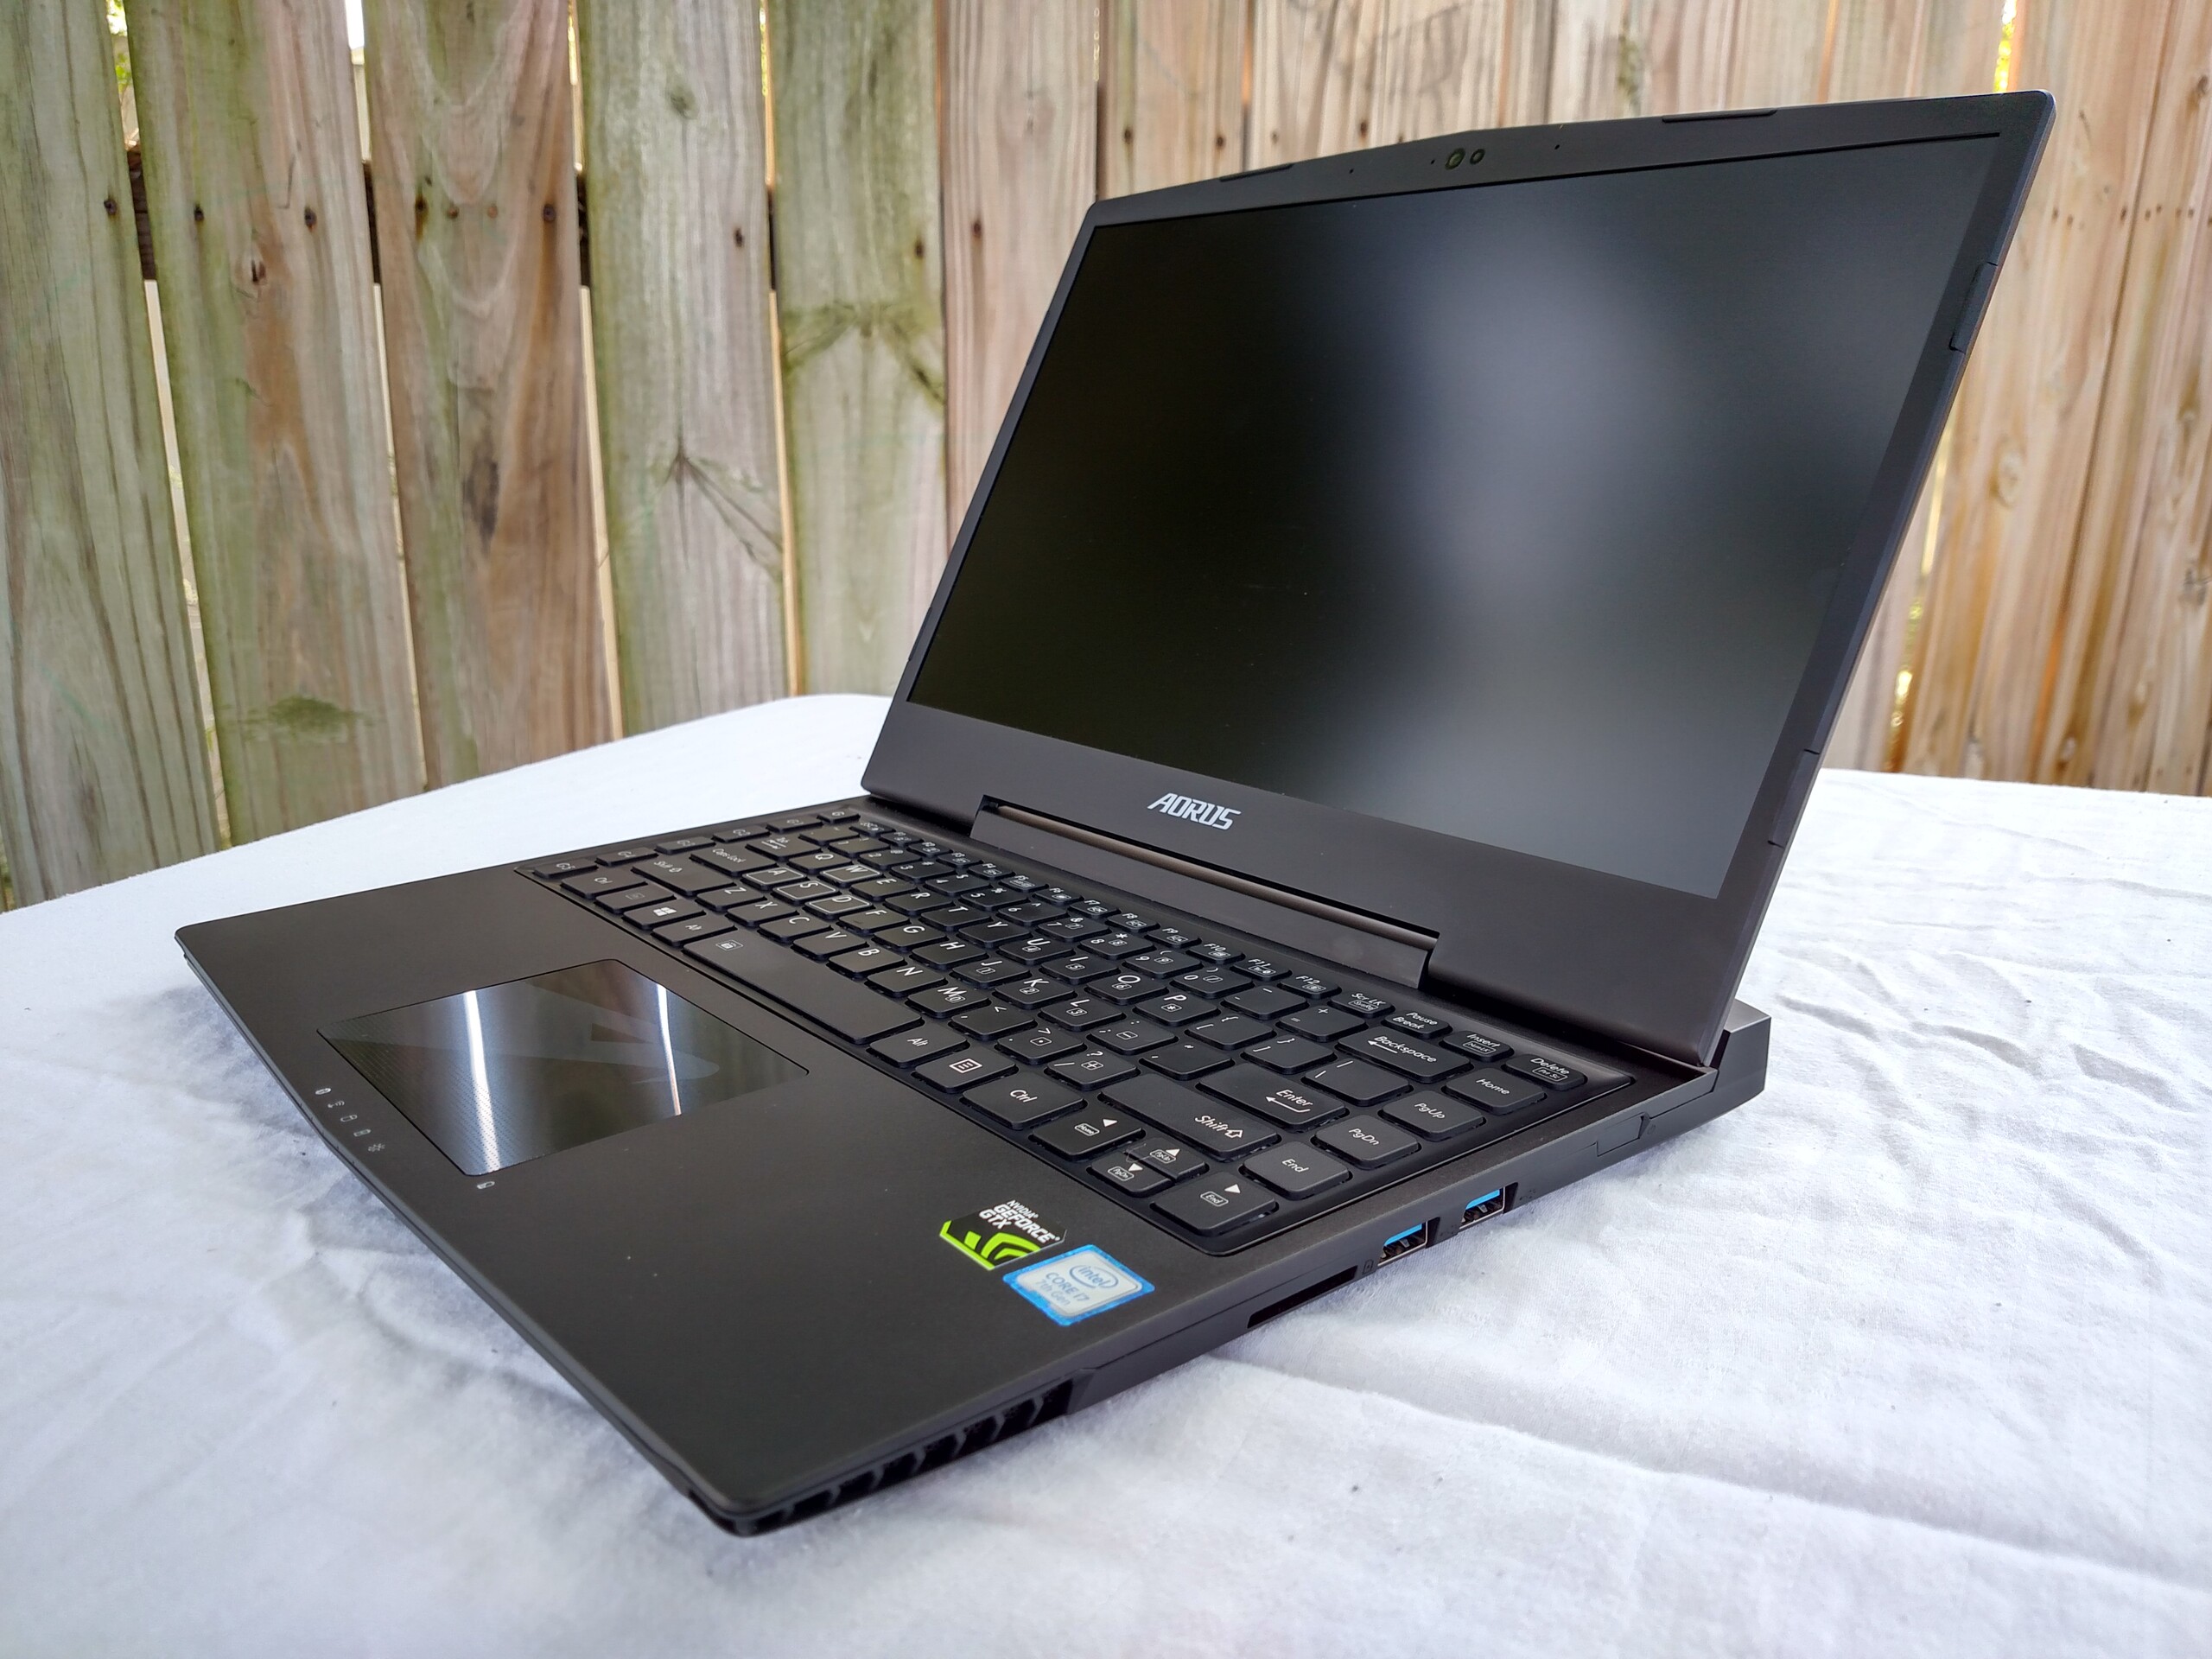
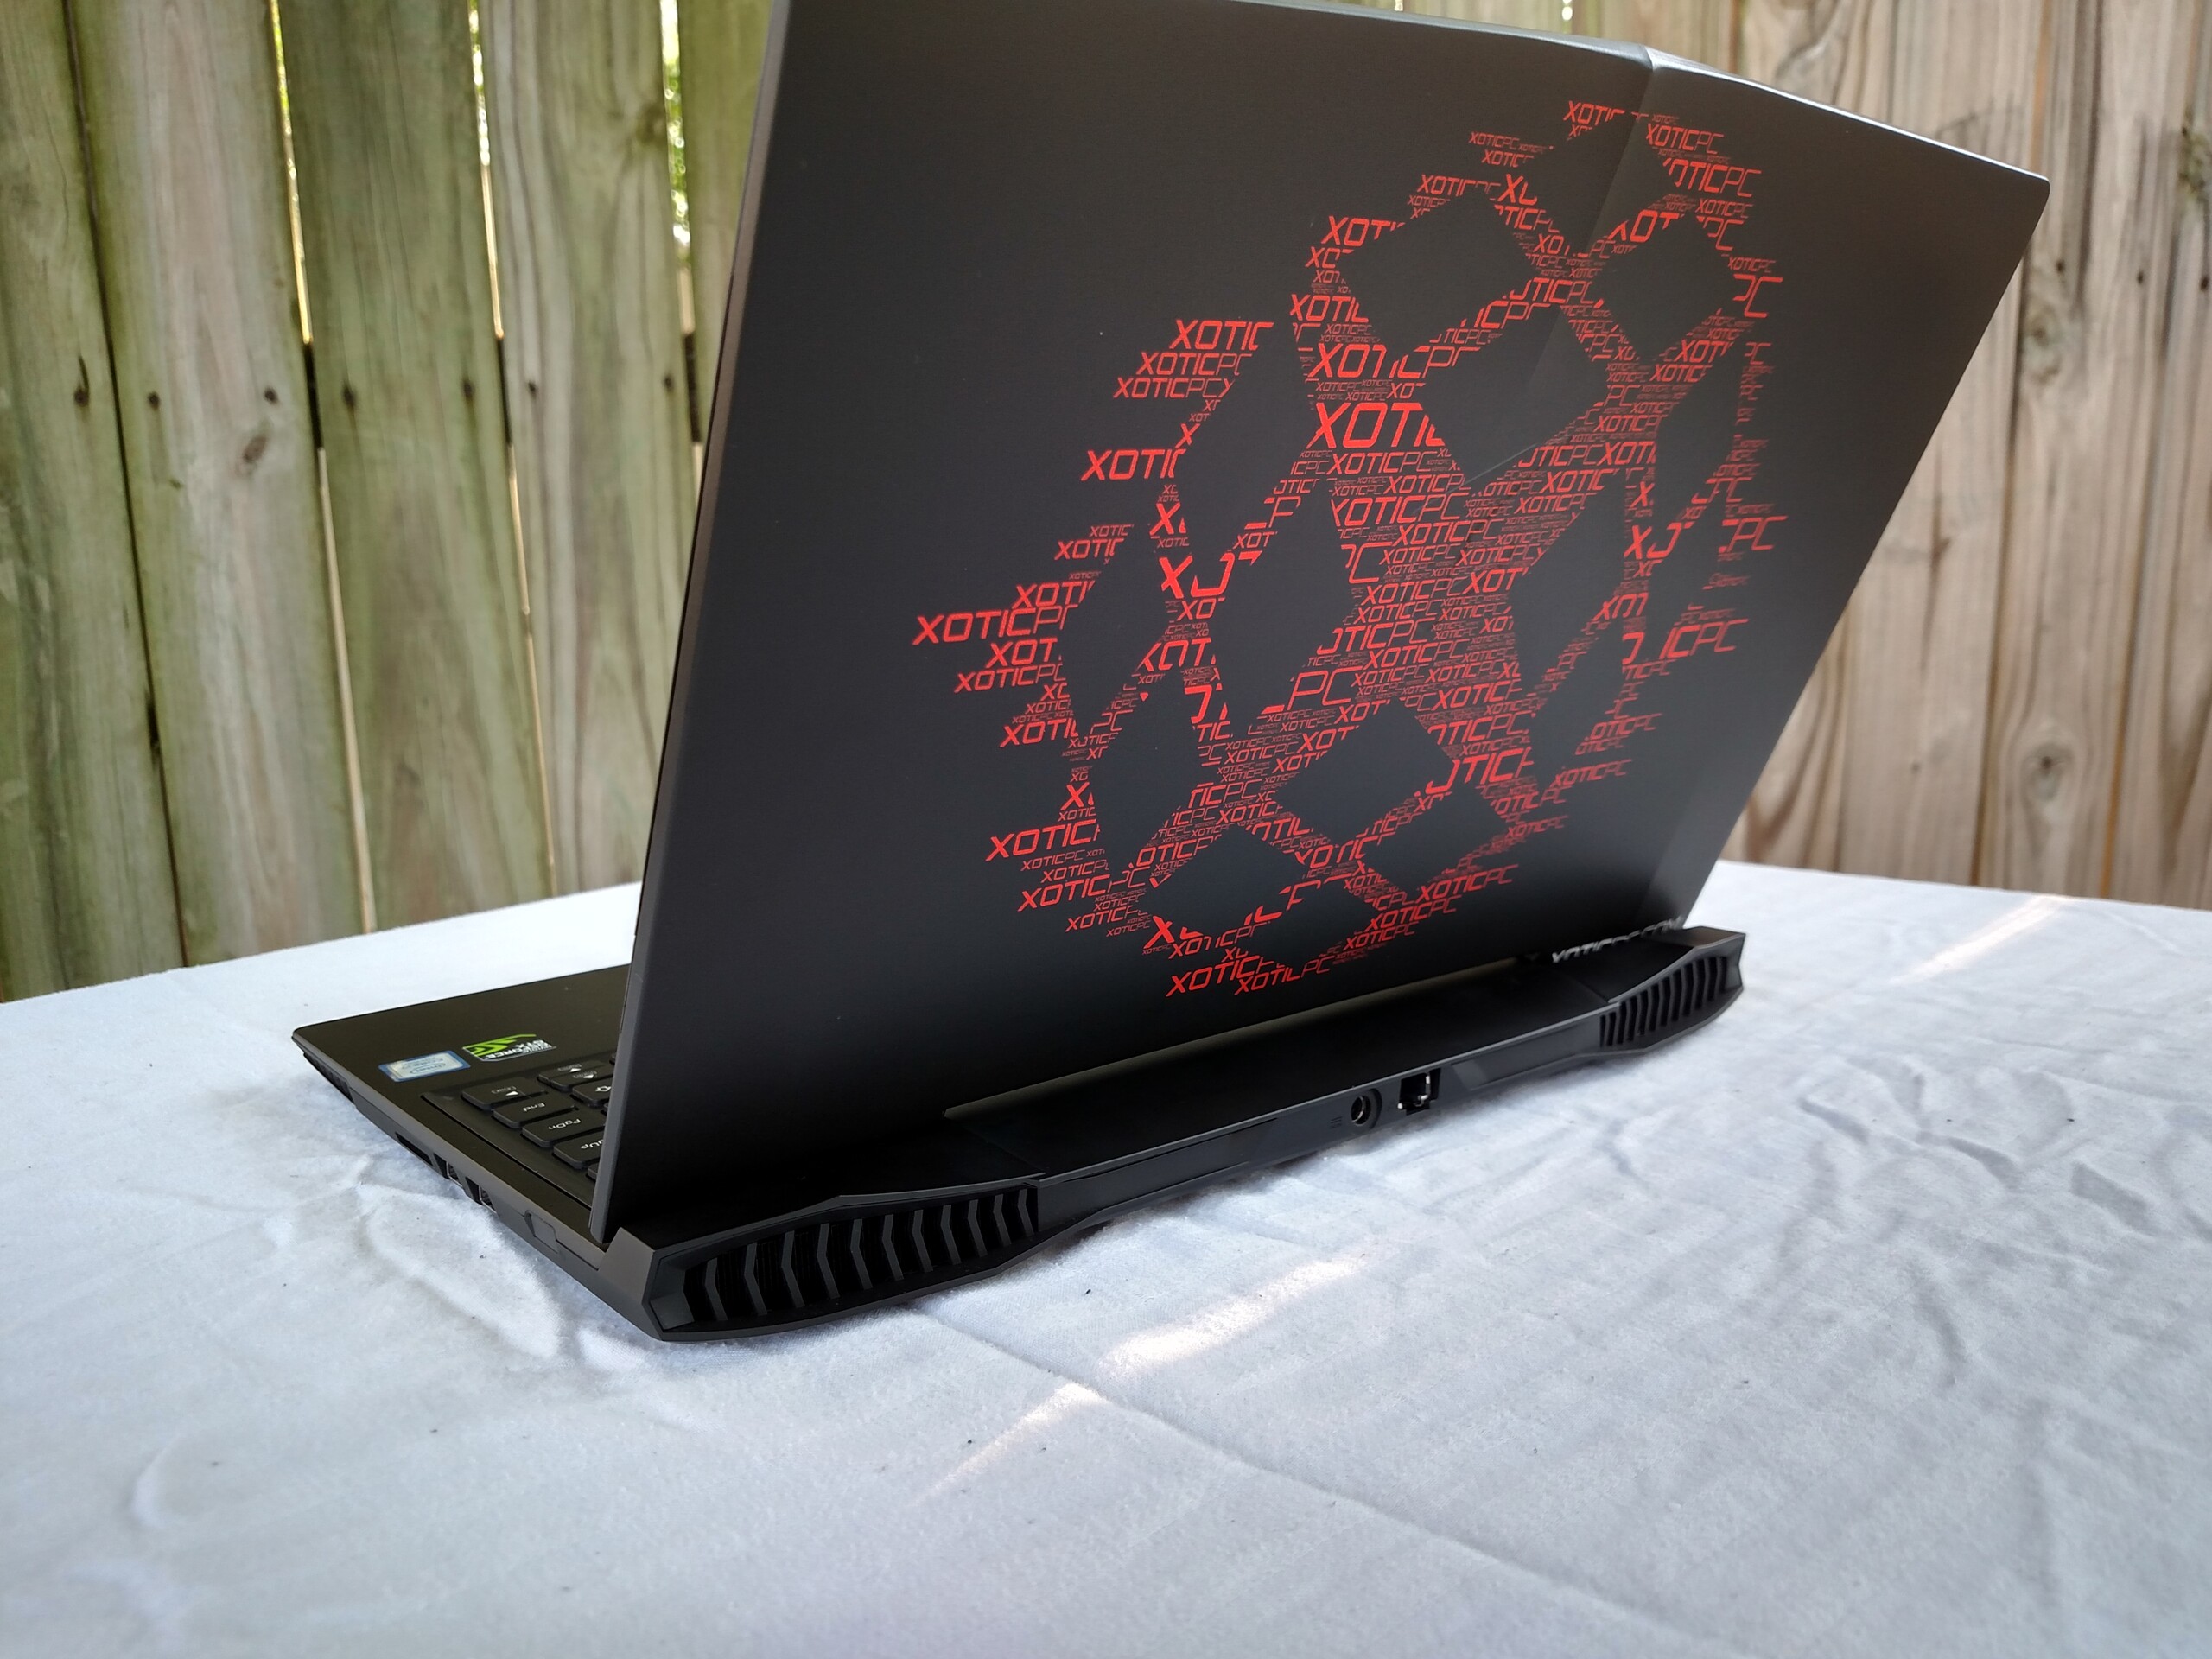
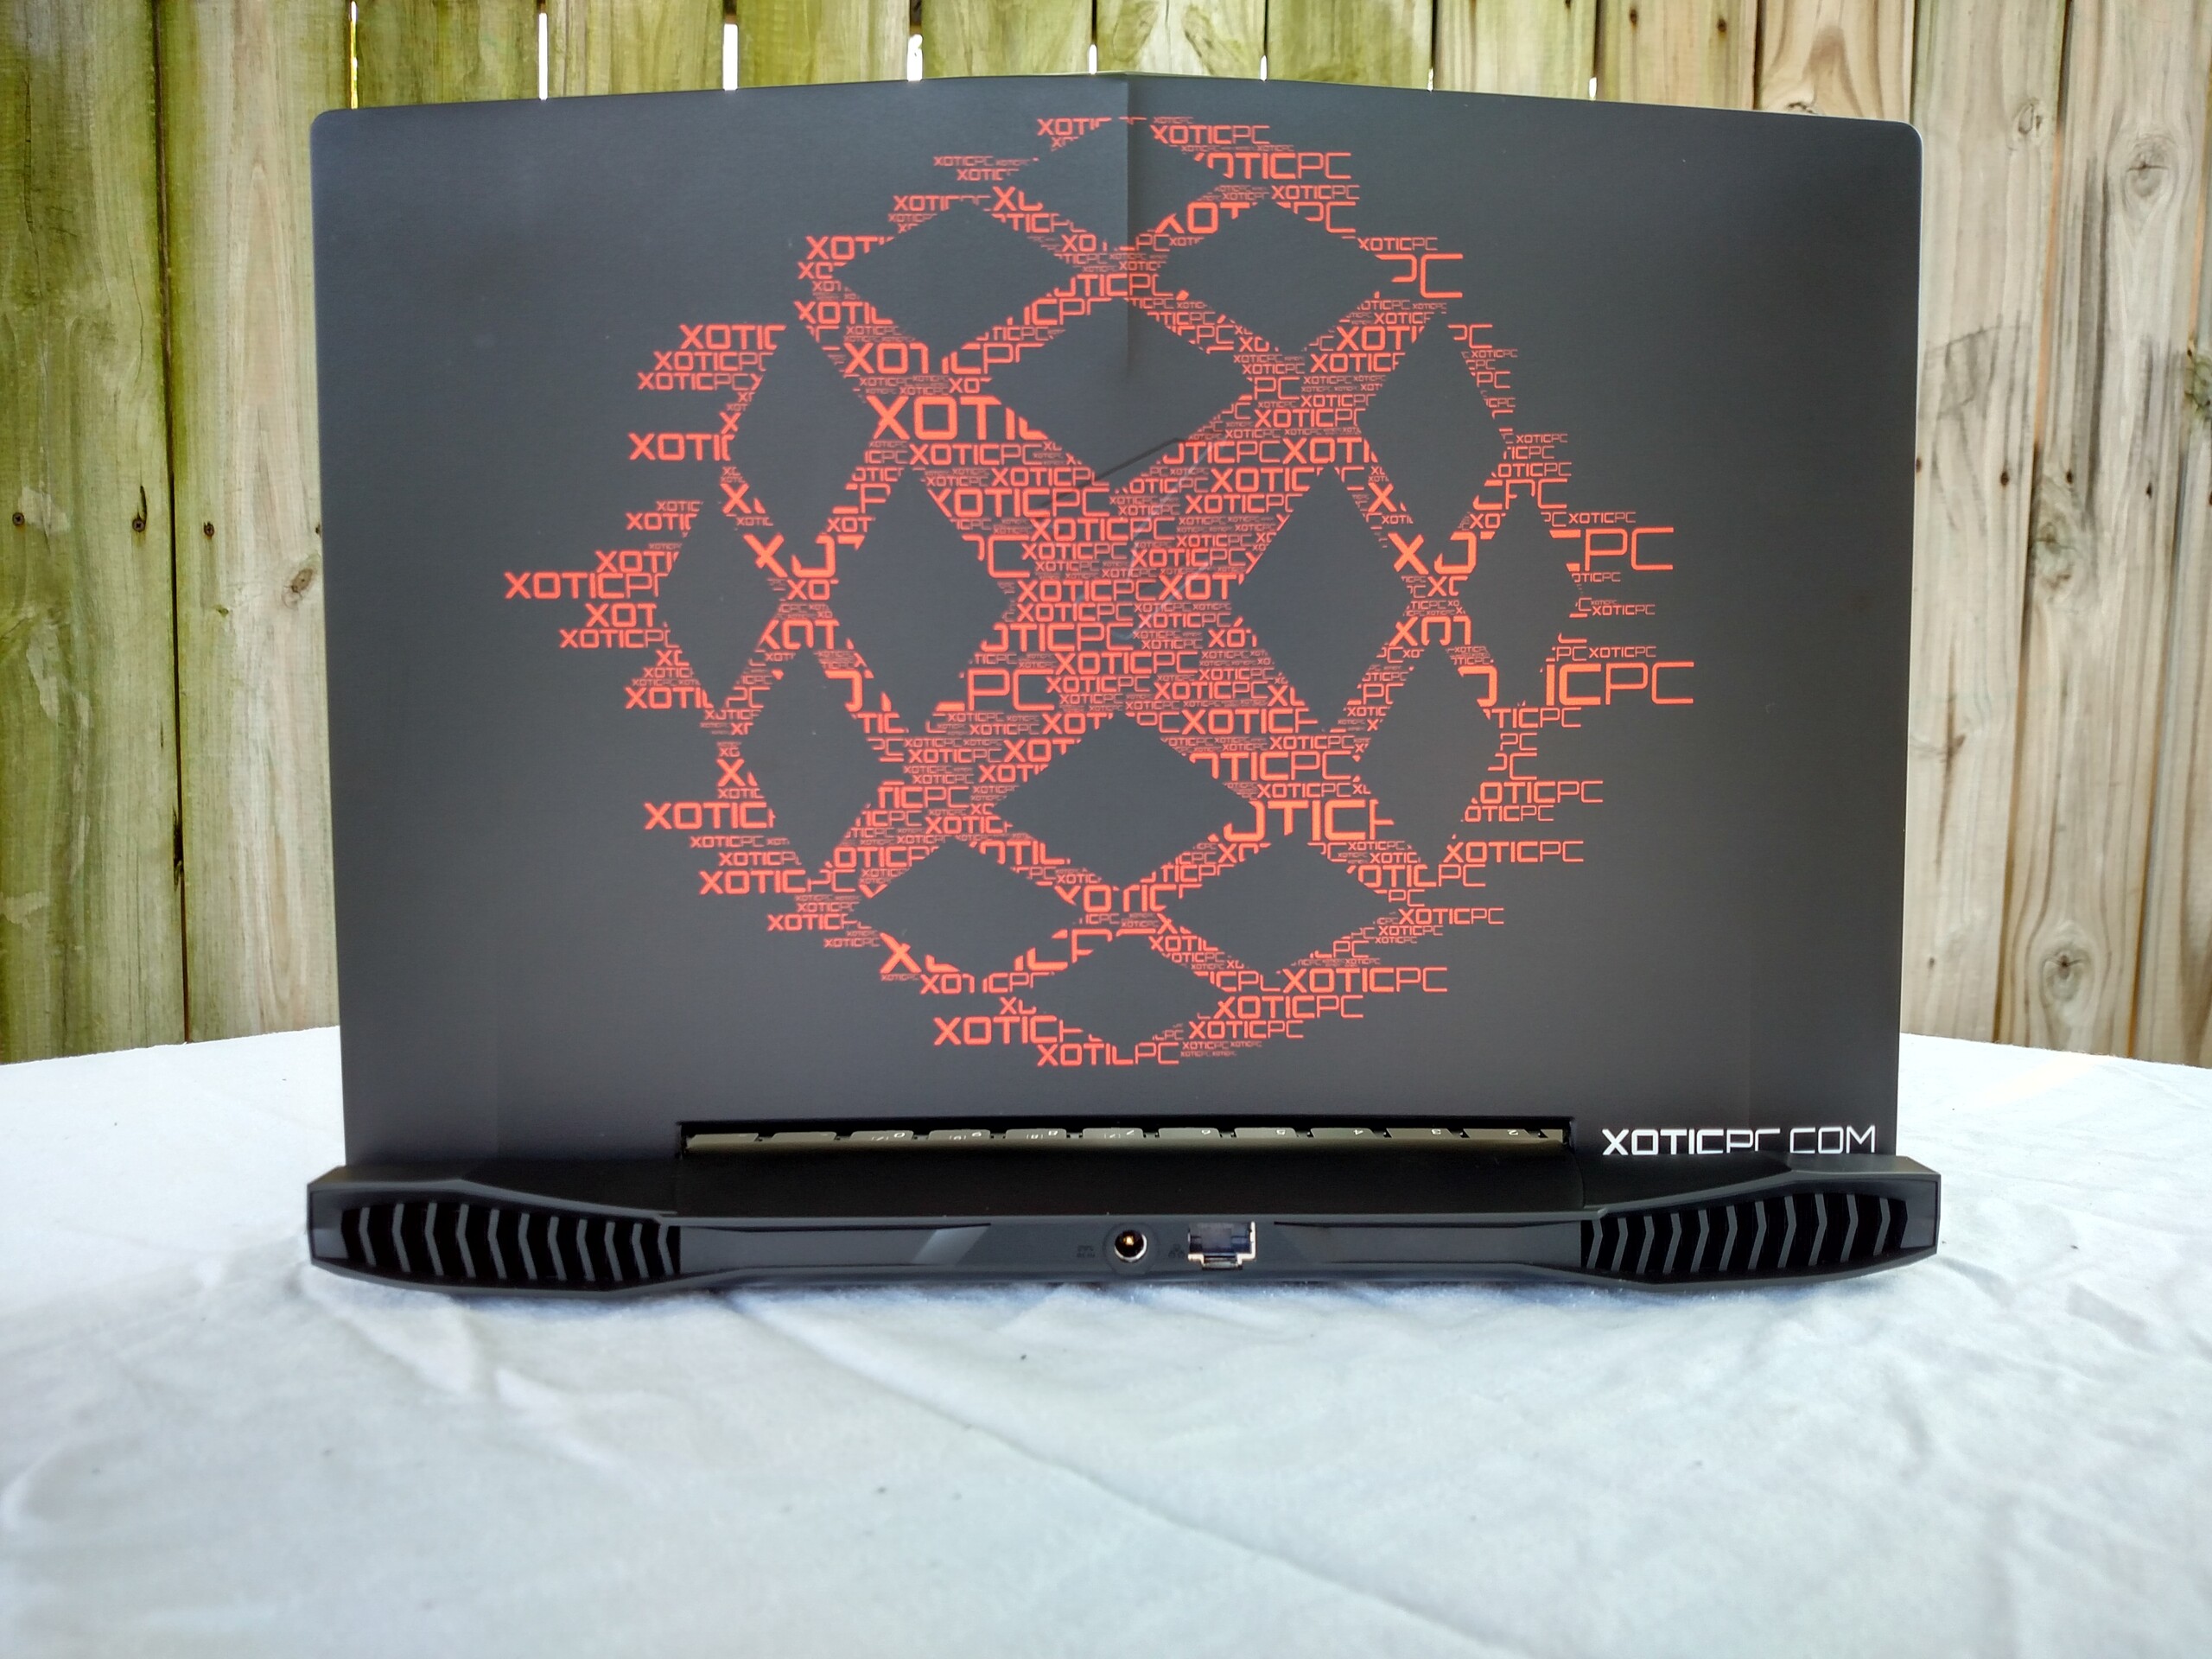
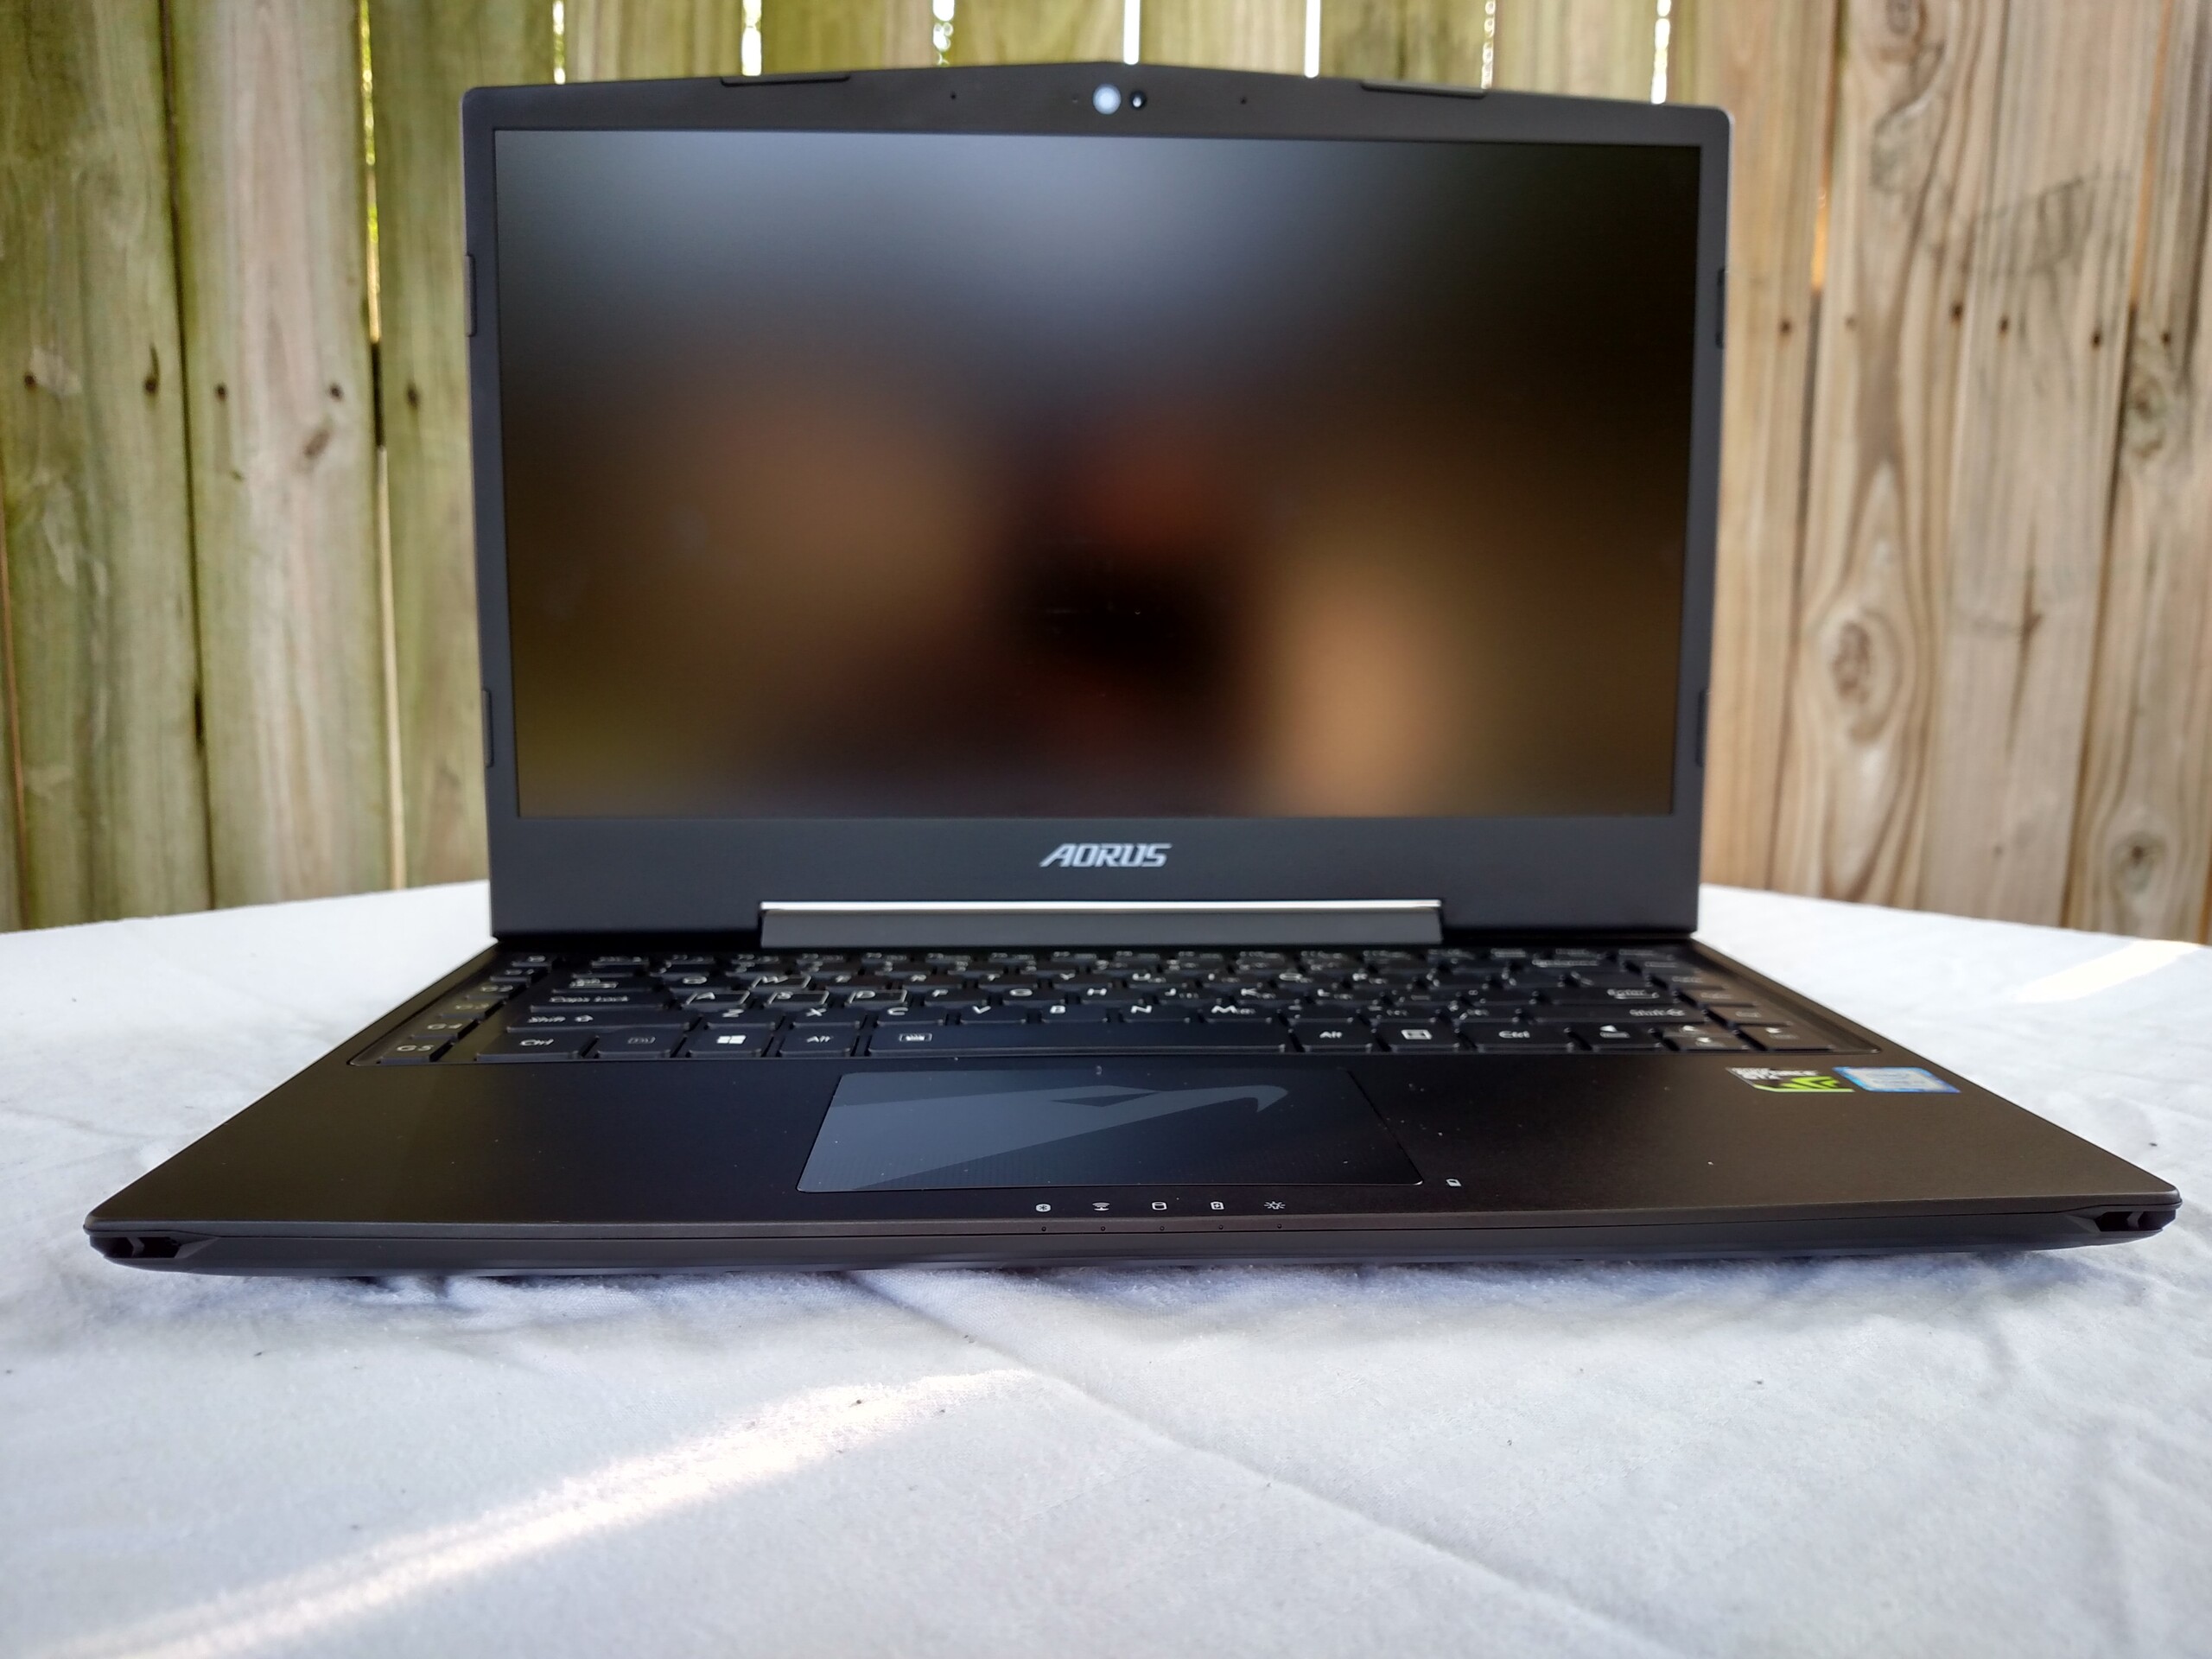
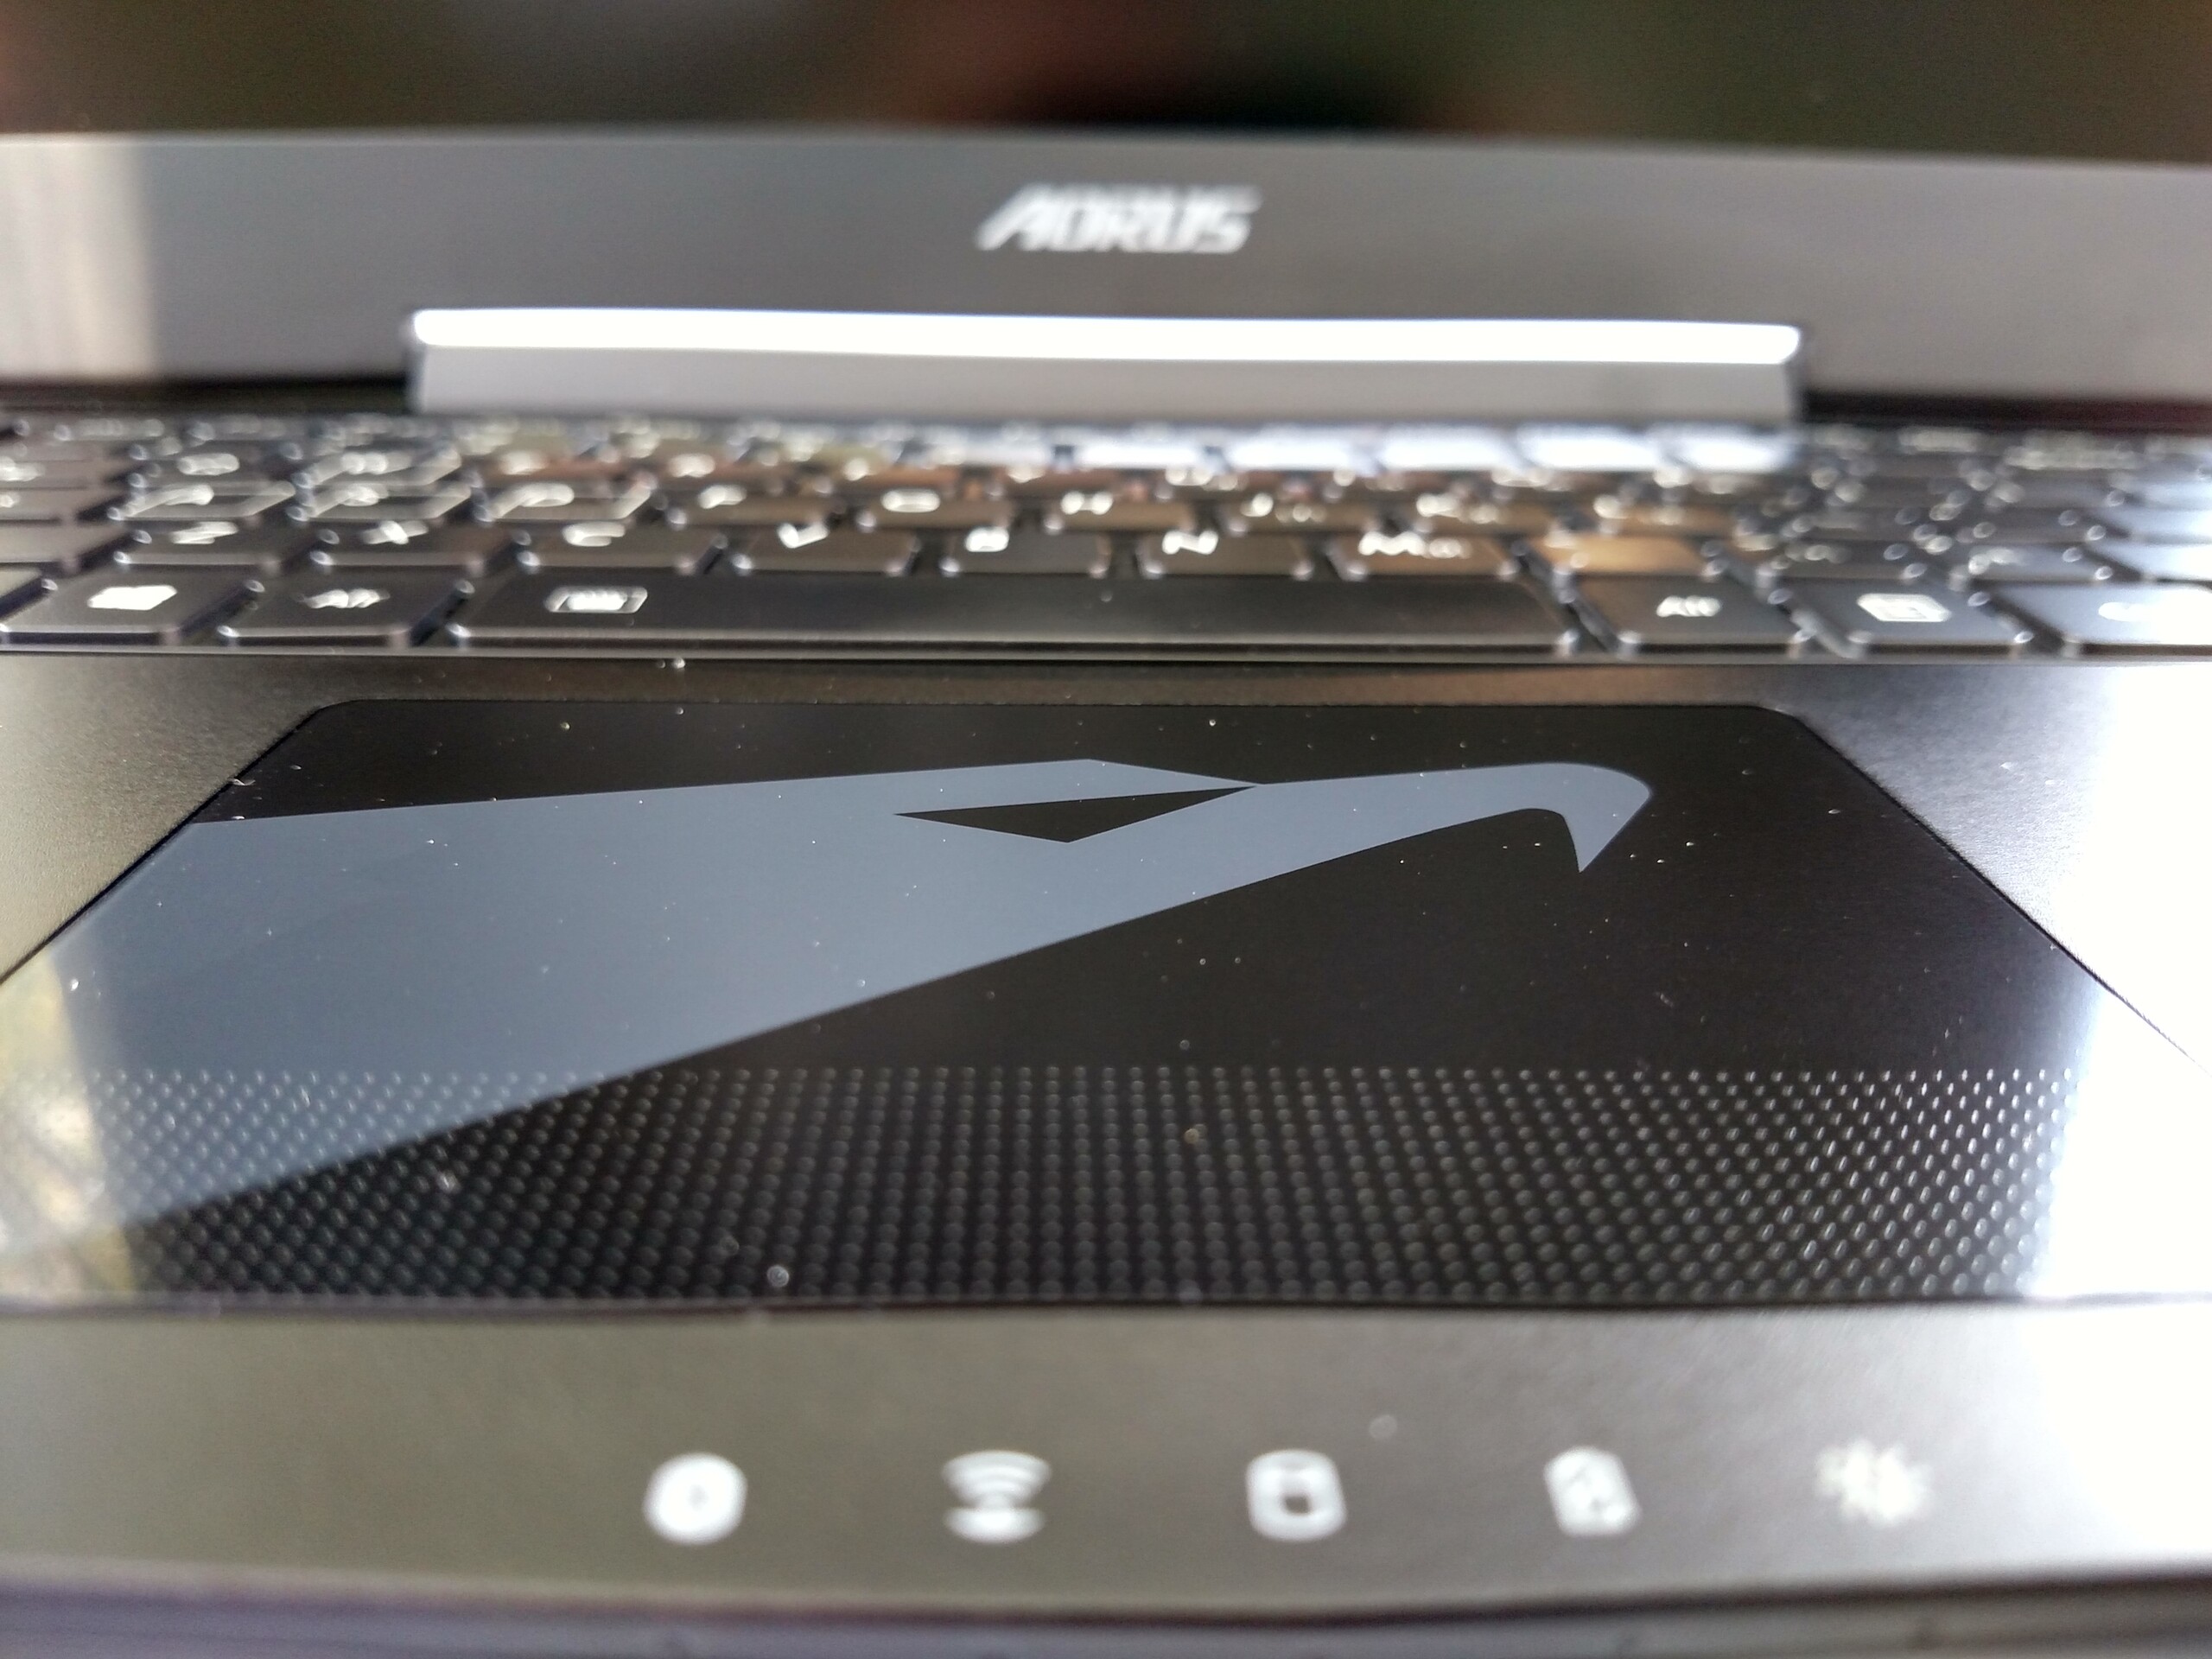
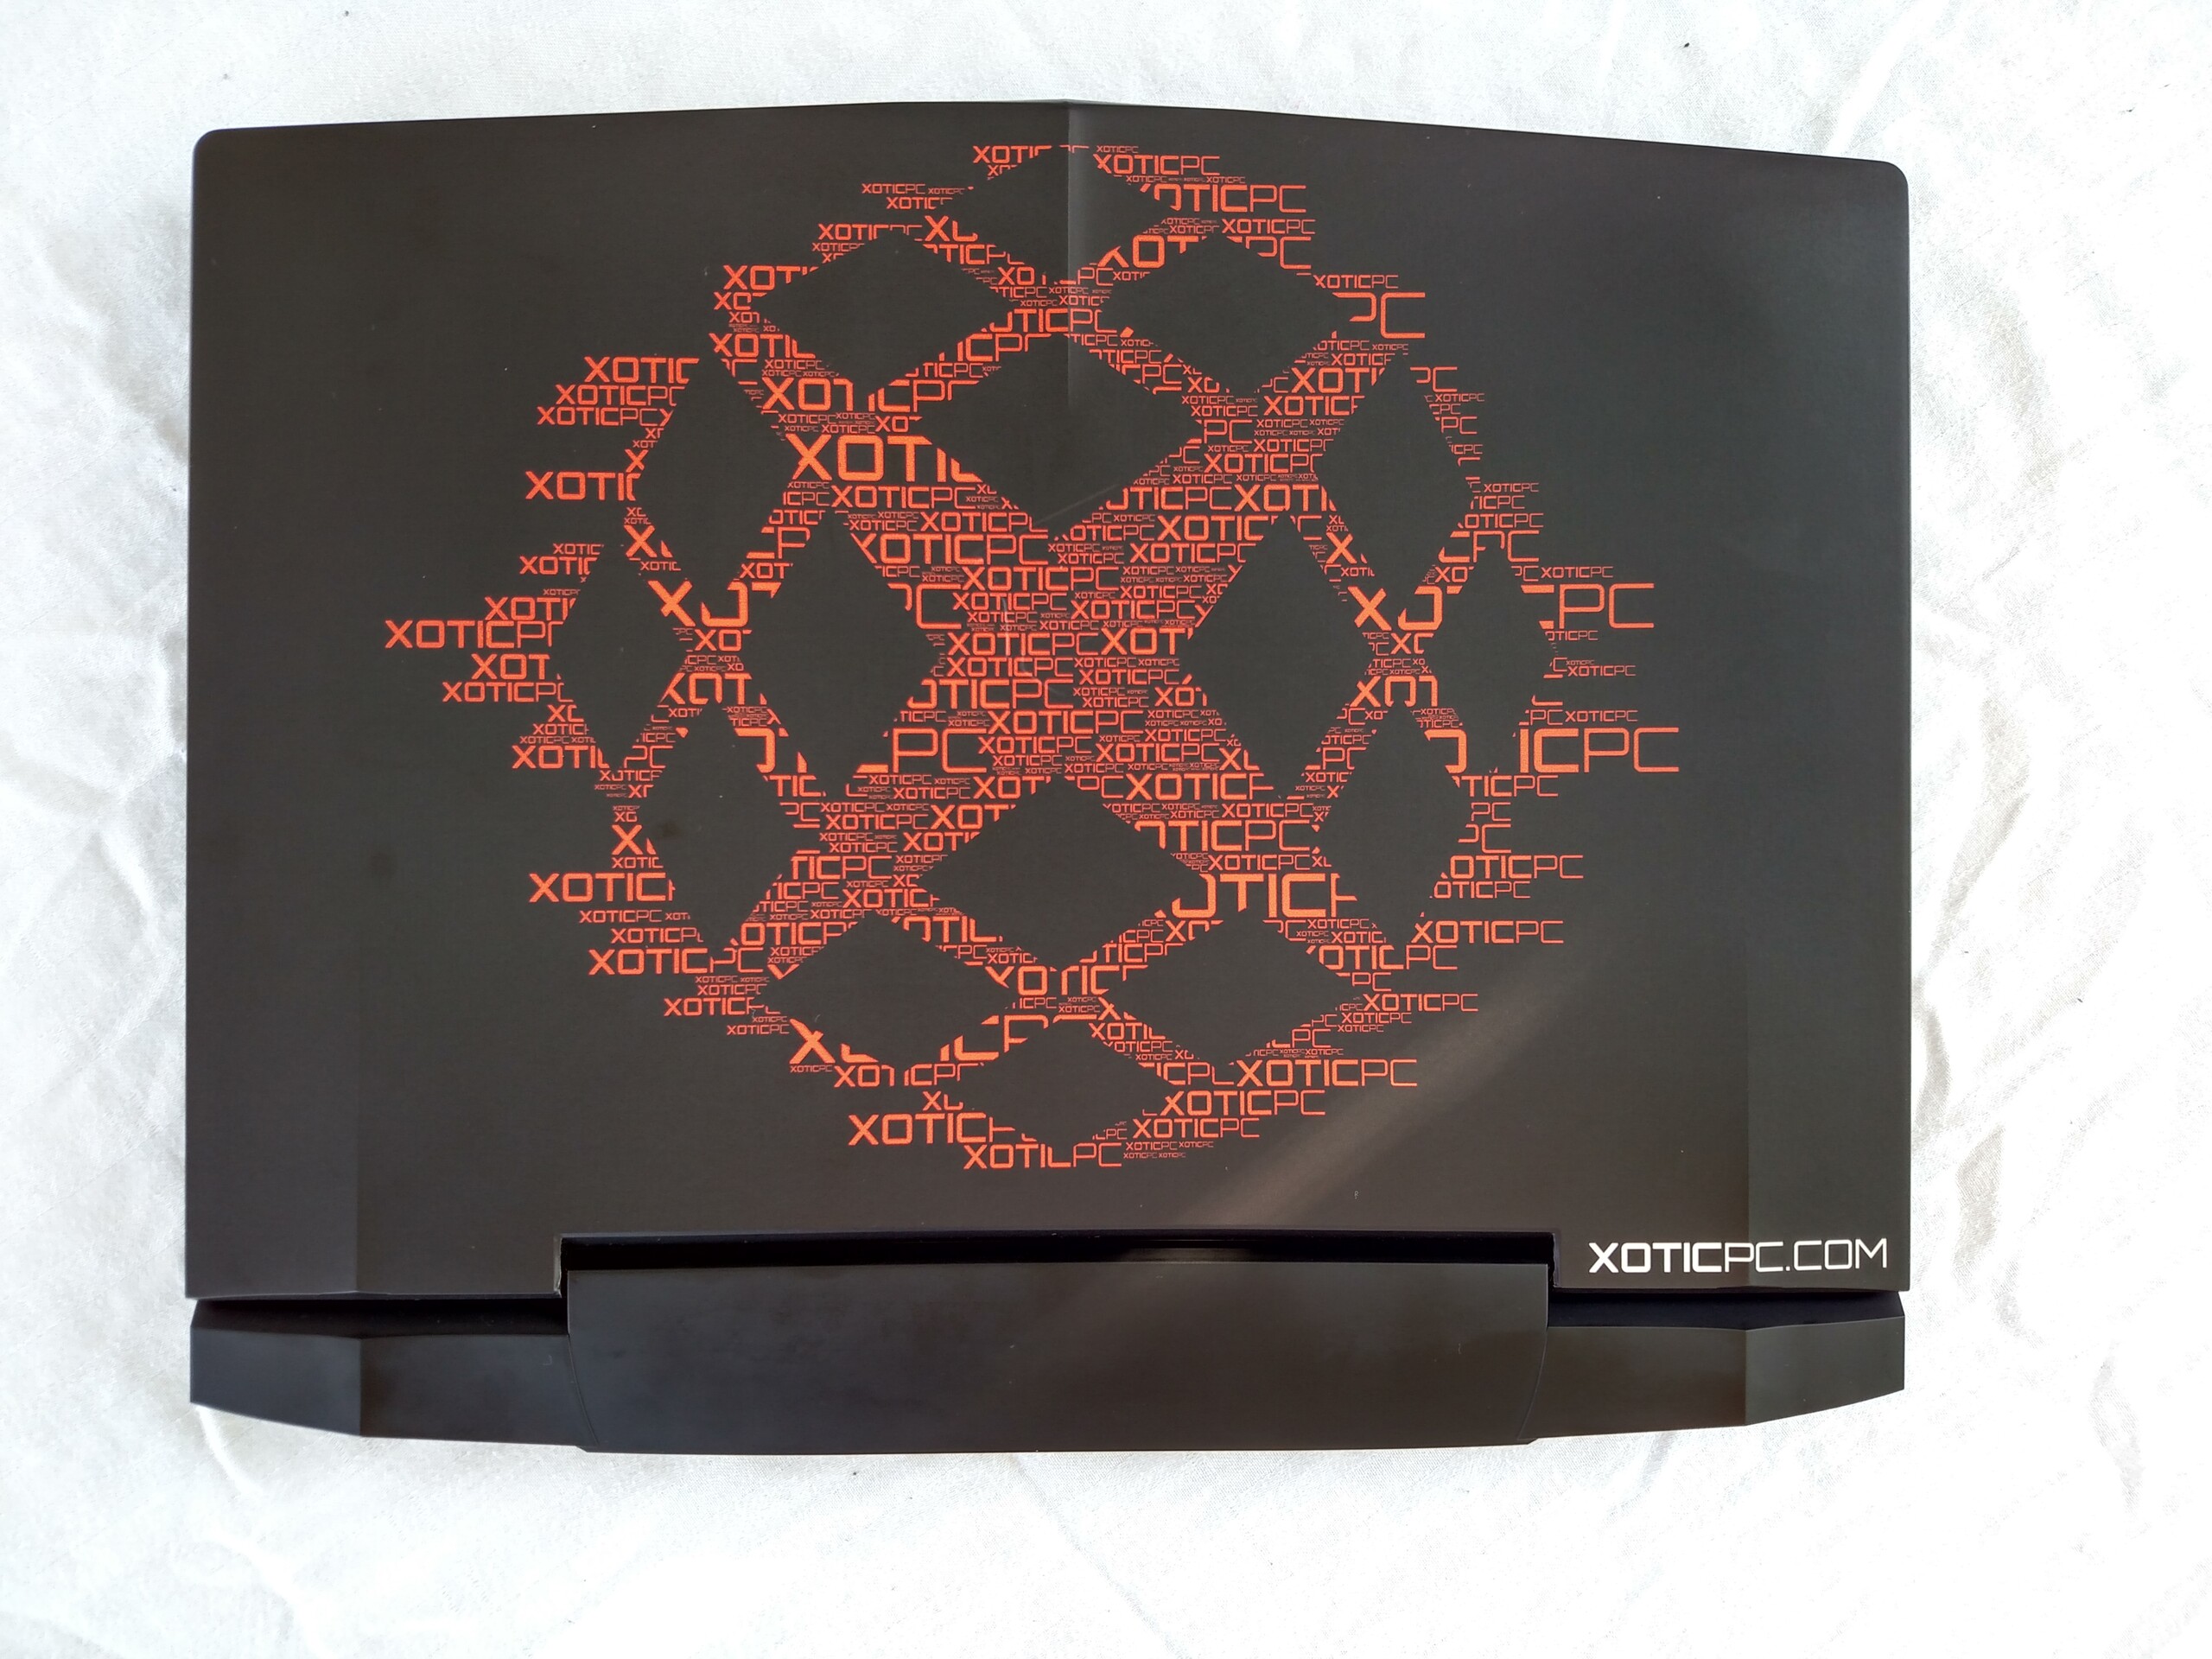
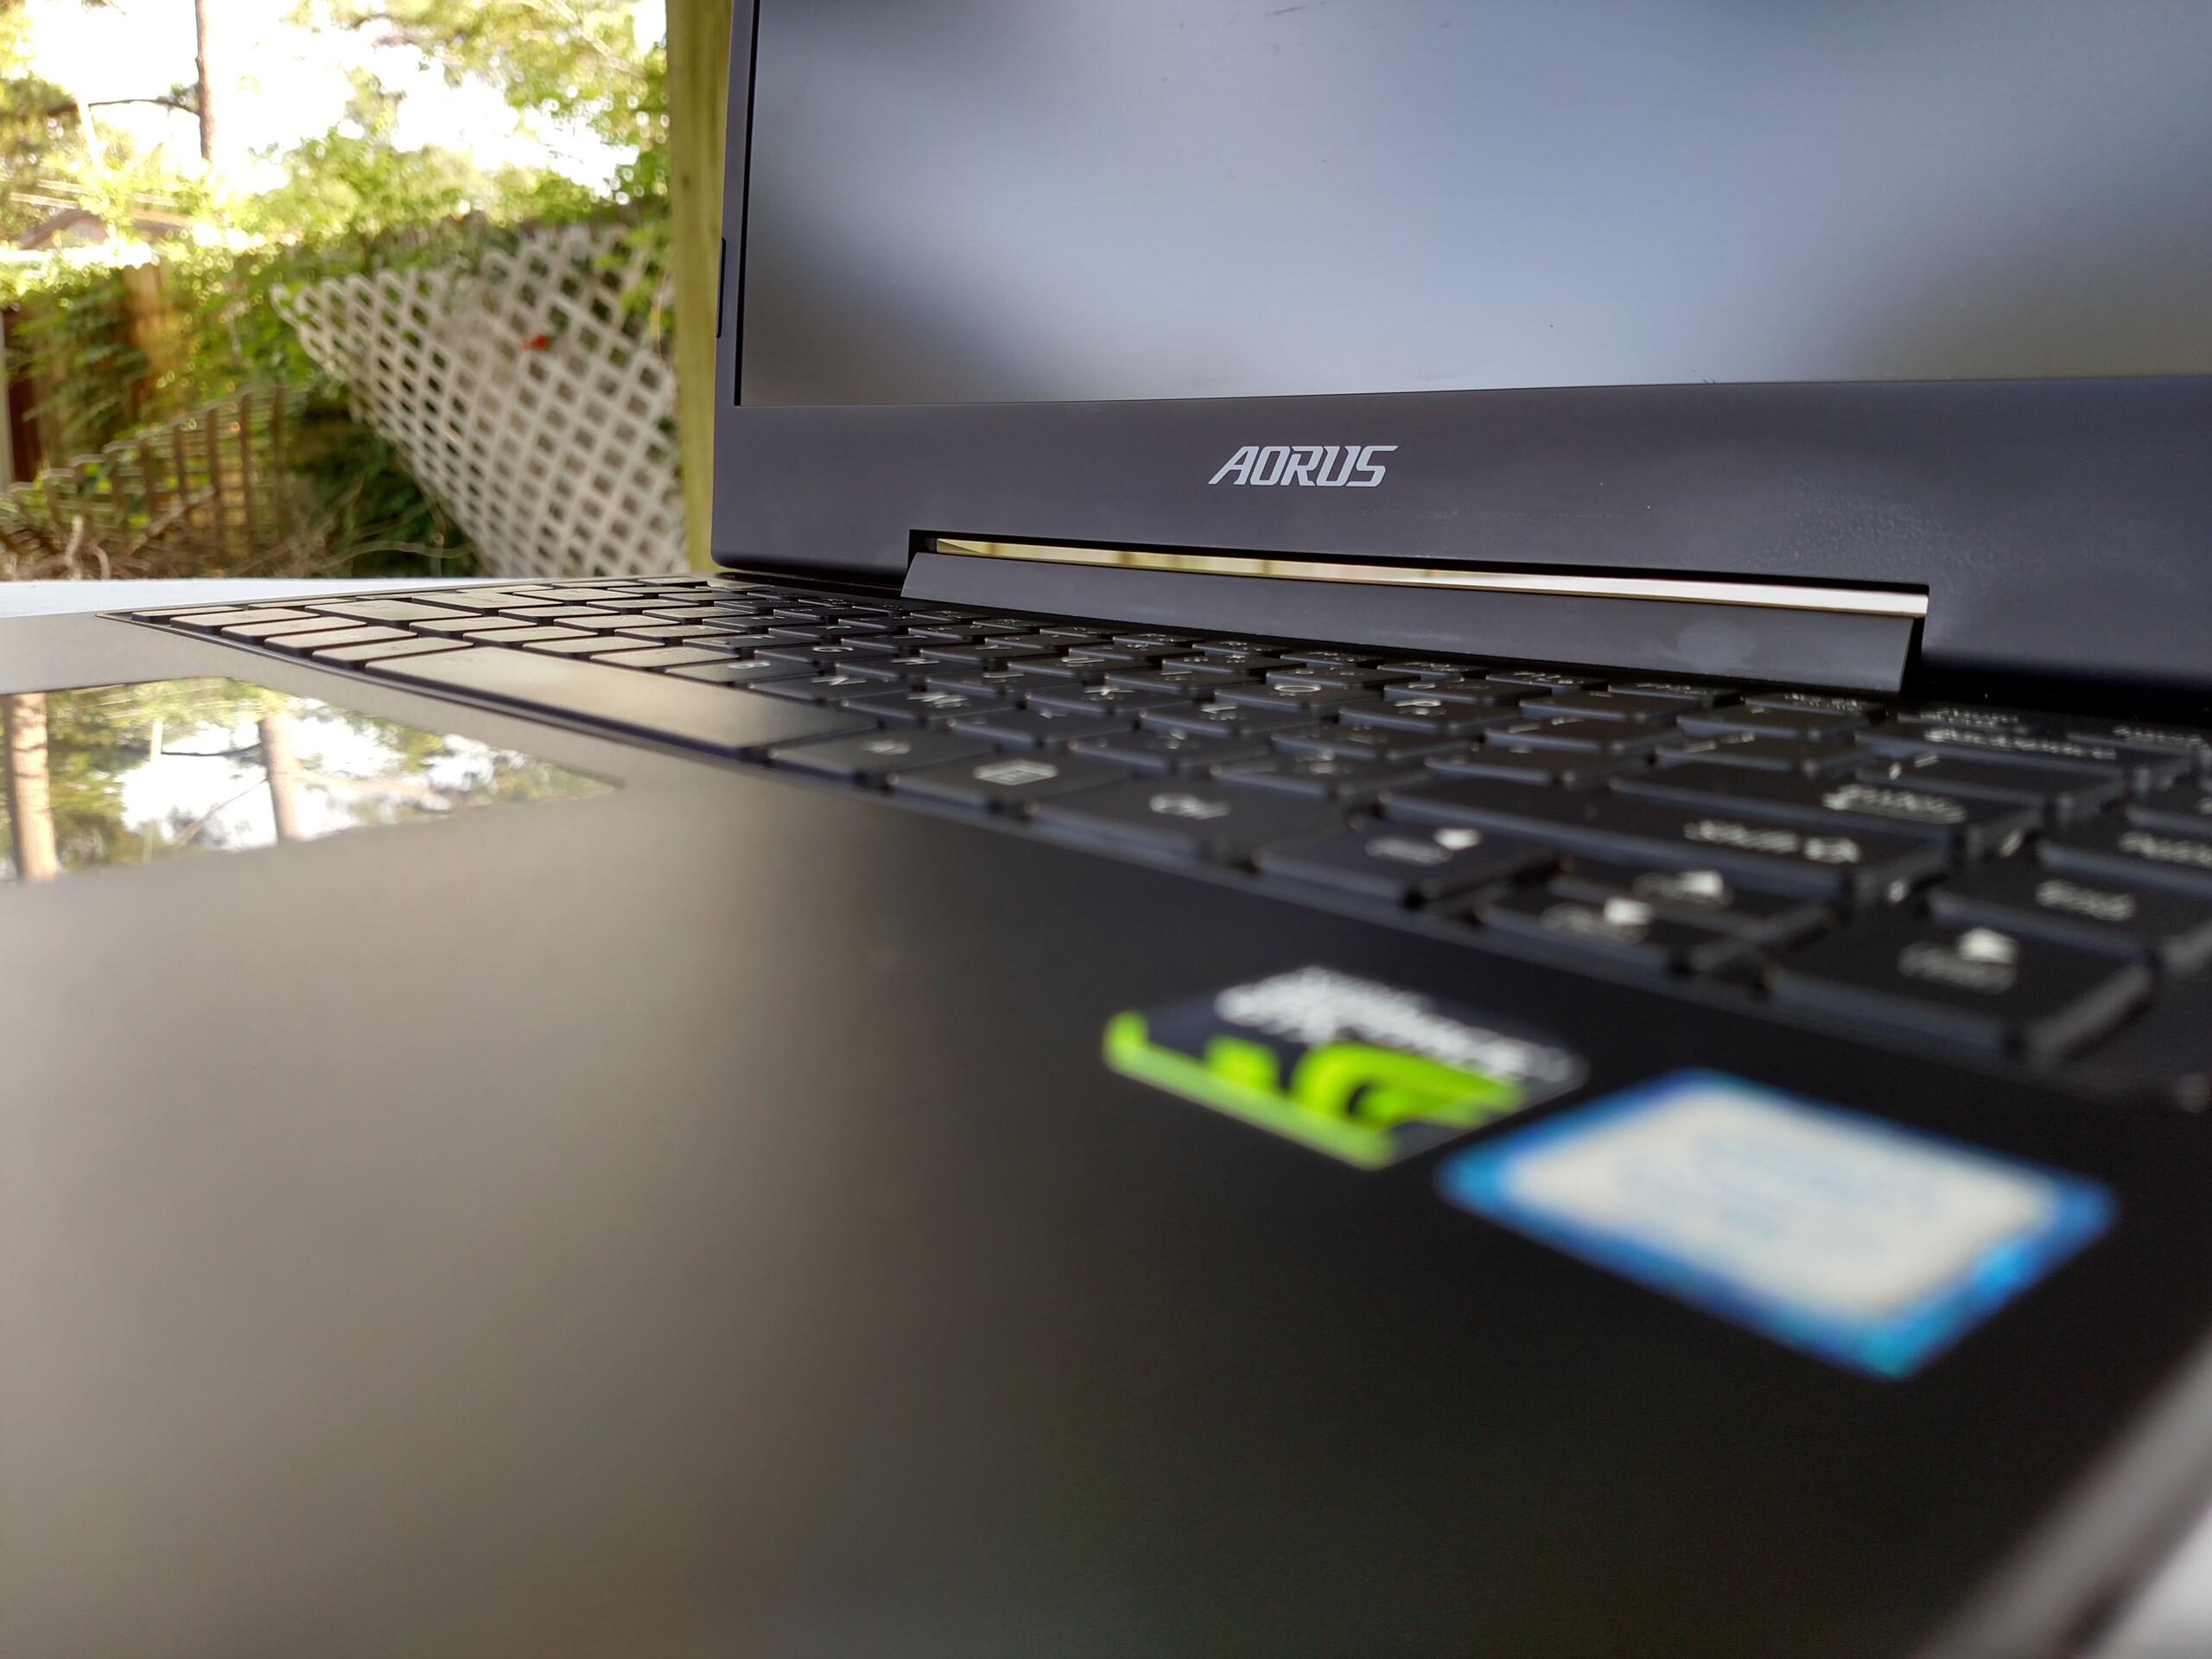
El diseño del X3 es excelente. El atractivo acabado junto con los sutiles acentos dan un chasis muy bonito, y el uso de metal alrededor del cuerpo hacen que el dispositivo parezca caro. La pantalla QHD+ también es impresionante. Las imágenes y el texto son bastante nítidas para verle el pelo al huevo, los colores son vibrantes y precisos, y la pantalla sigue brillante y legible incluso bajo luz solar directa. También nos impresionó el rendimiento gaming. Es sorprendente que los usuarios tengan ahora rendimiento de nivel sobremesa (¡o superior!) en un portátil así de compacto. Además, la opción de acelerar tanto CPU como GPU son buenos añadidos; más flexibilidad suma valor.
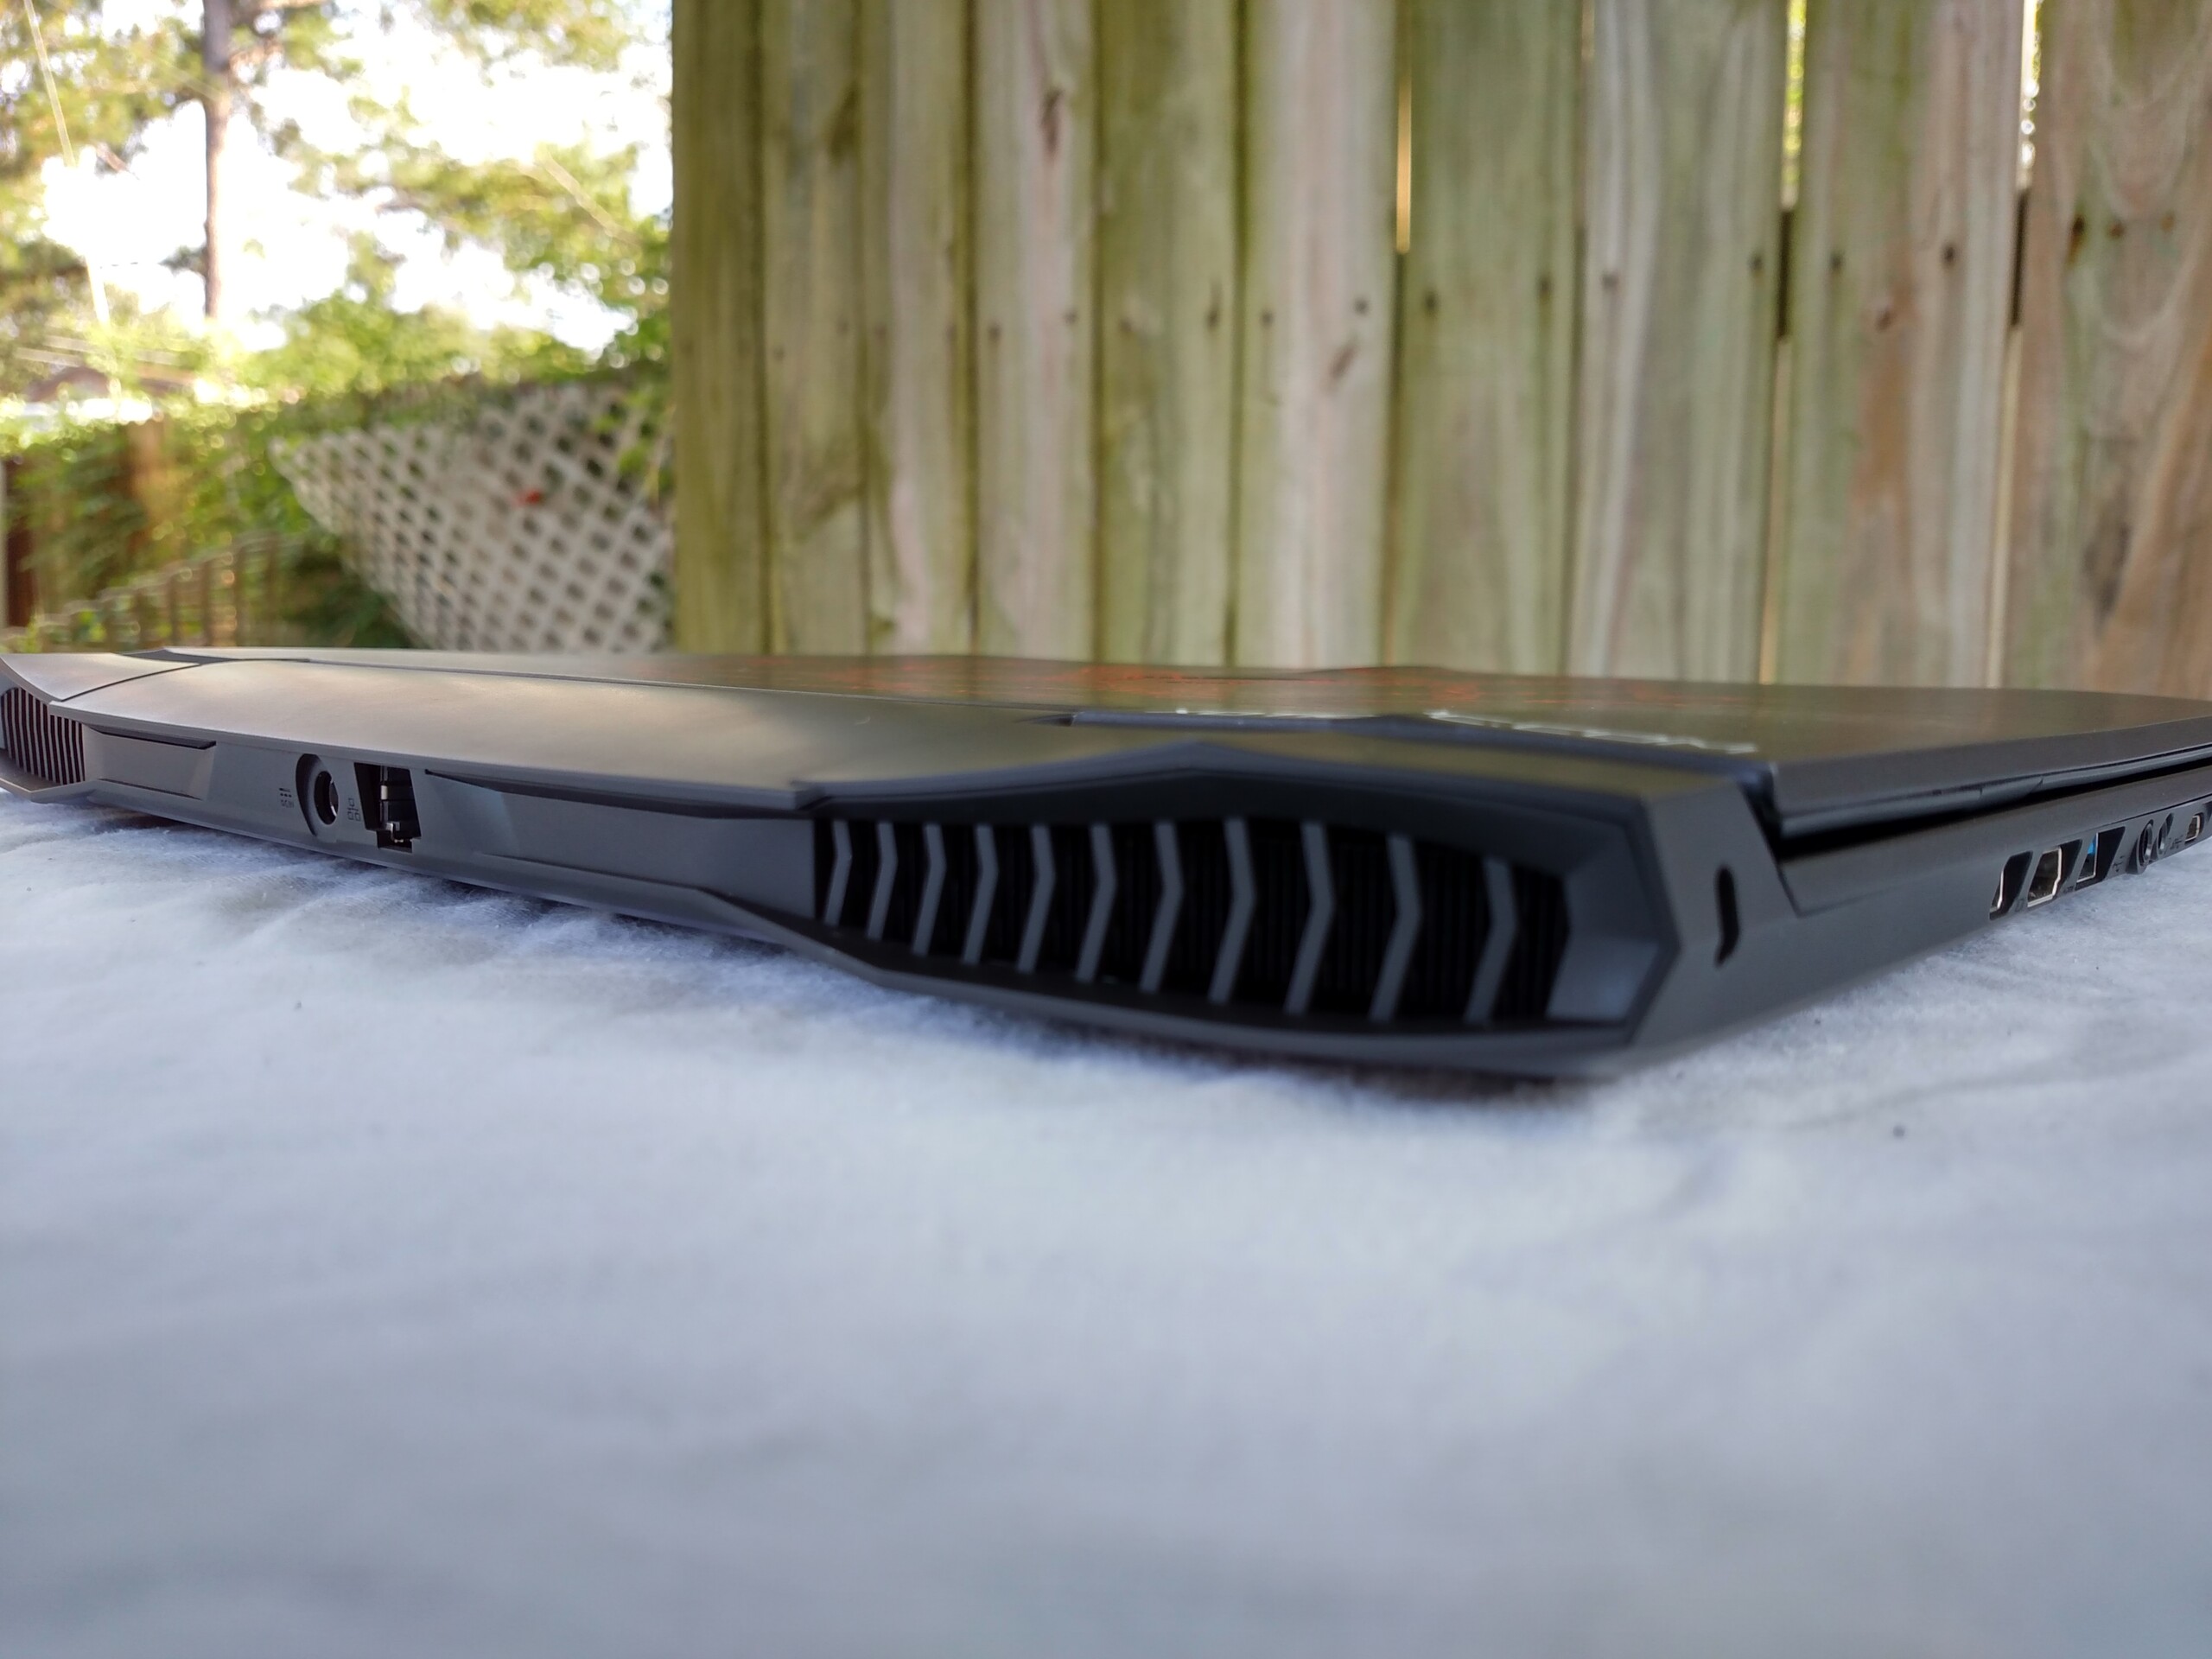
Por desgracia, este rendimiento tiene un precio. El chasis es demasiado pequeño para manejar adecuadamente el calor generado por las potentes entrañas, lo que fuerza que los ventiladores redoblen esfuerzos con frecuencia y agresividad intentando sacar bastante calor para que todo siga funcionando. El resultado final es un portátil ruidoso que se calienta y puede ralentizarse térmicamente bajo fuerte carga. Además, el enorme consumo de energía es superior a lo que ofrece el adaptador de corriente, lo que es motivo de preocupación. De nuevo, los usuarios deberían tener cuidado al poner al portátil contra las cuerdas.
En general, nos gusta el Aorus X3 Plus v7. Rinde genial, pero comparado con la rígida competencia de Gigabyte Aero 14 y Alienware 13, el X3 se queda corto en otras áreas. El teclado mediocre, el frustrante touchpad, y los problemas de calor y ruido impiden que el X3 alcance el último escalón de los portátiles gaming delgados y ligeros.
Si bien el Aorus X3 Plus v7 ofrece un rendimiento impresionante en un paquete pequeño, hay demasiados sacrificios para que recomendemos el dispositivo. Hay opciones más equilibradas para los gamers que busquen un dispositivo portable.
Ésta es una versión acortada del análisis original. Puedes leer el análisis completo en inglés aquí.
Aorus x3 Plus v7
- 05/16/2017 v6 (old)
Sam Medley
Price comparison
