Breve análisis del Eurocom Tornado F5


| SD Card Reader | |
| average JPG Copy Test (av. of 3 runs) | |
| MSI GT73VR 7RF-296 | |
| Eurocom Tornado F5 | |
| MSI GT72VR 7RE-433 | |
| maximum AS SSD Seq Read Test (1GB) | |
| MSI GT73VR 7RF-296 | |
| MSI GT72VR 7RE-433 | |
| Eurocom Tornado F5 | |
| Networking | |
| iperf3 receive AX12 | |
| MSI GT73VR 7RF-296 | |
| EVGA SC17 GTX 1070 | |
| Eurocom Tornado F5 | |
| iperf3 transmit AX12 | |
| MSI GT73VR 7RF-296 | |
| Eurocom Tornado F5 | |
| EVGA SC17 GTX 1070 | |
| |||||||||||||||||||||||||
iluminación: 90 %
Brillo con batería: 315.8 cd/m²
Contraste: 957:1 (Negro: 0.33 cd/m²)
ΔE ColorChecker Calman: 5 | ∀{0.5-29.43 Ø4.72}
ΔE Greyscale Calman: 4.2 | ∀{0.09-98 Ø4.97}
83% sRGB (Argyll 1.6.3 3D)
54.5% AdobeRGB 1998 (Argyll 1.6.3 3D)
60.7% AdobeRGB 1998 (Argyll 3D)
83% sRGB (Argyll 3D)
64.5% Display P3 (Argyll 3D)
Gamma: 2.12
CCT: 6107 K
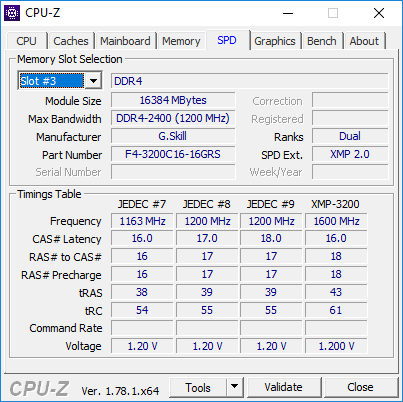
| Eurocom Tornado F5 IPS, 15.6", 1920x1080 | Asus Strix GL502VM-FY039T LG Philips LP156WF6-SPB6 (LGD046F), IPS, 15.6", 1920x1080 | Acer Predator 15 G9-593-765Q LG Philips LP156WF6-SPP1 (LGD04D5), IPS, 15.6", 1920x1080 | Asus Zenbook UX510UW-CN044T LG Philips LP156WF6-SPB6, IPS, 15.6", 1920x1080 | MSI GS63VR-6RF16H22 Stealth Pro Samsung 156HL01-104 (SDC324C) , IPS, 15.6", 1920x1080 | |
|---|---|---|---|---|---|
| Display | 0% | 0% | -4% | 12% | |
| Display P3 Coverage (%) | 64.5 | 64.5 0% | 63.6 -1% | 61.5 -5% | 67.8 5% |
| sRGB Coverage (%) | 83 | 83.4 0% | 83.9 1% | 80.4 -3% | 97.4 17% |
| AdobeRGB 1998 Coverage (%) | 60.7 | 60.9 0% | 61.3 1% | 58.8 -3% | 69.7 15% |
| Response Times | 1% | 8% | -1% | 17% | |
| Response Time Grey 50% / Grey 80% * (ms) | 33.6 ? | 40 ? -19% | 35 ? -4% | 40 ? -19% | |
| Response Time Black / White * (ms) | 31.2 ? | 25 ? 20% | 25 ? 20% | 26 ? 17% | 26 ? 17% |
| PWM Frequency (Hz) | 202 ? | ||||
| Screen | 3% | 5% | -6% | 8% | |
| Brightness middle (cd/m²) | 315.8 | 321 2% | 273 -14% | 326 3% | 293 -7% |
| Brightness (cd/m²) | 310 | 296 -5% | 267 -14% | 316 2% | 279 -10% |
| Brightness Distribution (%) | 90 | 88 -2% | 83 -8% | 80 -11% | 84 -7% |
| Black Level * (cd/m²) | 0.33 | 0.33 -0% | 0.27 18% | 0.35 -6% | 0.33 -0% |
| Contrast (:1) | 957 | 973 2% | 1011 6% | 931 -3% | 888 -7% |
| Colorchecker dE 2000 * | 5 | 4.42 12% | 3.77 25% | 5.49 -10% | 3.59 28% |
| Colorchecker dE 2000 max. * | 10.1 | 9.78 3% | 10.64 -5% | 11.36 -12% | 5.79 43% |
| Greyscale dE 2000 * | 4.2 | 3.34 20% | 2.48 41% | 4.84 -15% | 3.86 8% |
| Gamma | 2.12 104% | 2.4 92% | 2.37 93% | 2.23 99% | 2.53 87% |
| CCT | 6107 106% | 6213 105% | 6854 95% | 5971 109% | 7229 90% |
| Color Space (Percent of AdobeRGB 1998) (%) | 54.5 | 55 1% | 55 1% | 53 -3% | 63 16% |
| Color Space (Percent of sRGB) (%) | 83 | 83 0% | 84 1% | 80 -4% | 97 17% |
| Media total (Programa/Opciones) | 1% /
2% | 4% /
5% | -4% /
-5% | 12% /
10% |
* ... más pequeño es mejor
Tiempos de respuesta del display
| ↔ Tiempo de respuesta de Negro a Blanco | ||
|---|---|---|
| 31.2 ms ... subida ↗ y bajada ↘ combinada | ↗ 4.4 ms subida | 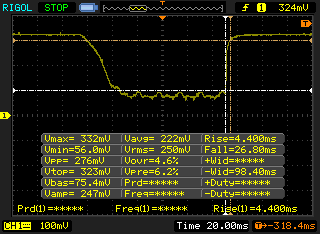 |
| ↘ 26.8 ms bajada | ||
| La pantalla mostró tiempos de respuesta lentos en nuestros tests y podría ser demasiado lenta para los jugones. En comparación, todos los dispositivos de prueba van de ##min### (mínimo) a 240 (máximo) ms. » 84 % de todos los dispositivos son mejores. Eso quiere decir que el tiempo de respuesta es peor que la media (19.8 ms) de todos los dispositivos testados. | ||
| ↔ Tiempo de respuesta 50% Gris a 80% Gris | ||
| 33.6 ms ... subida ↗ y bajada ↘ combinada | ↗ 8.4 ms subida | 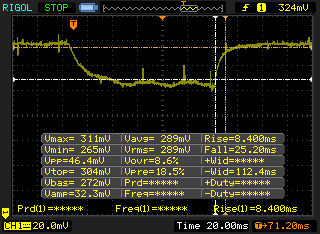 |
| ↘ 25.2 ms bajada | ||
| La pantalla mostró tiempos de respuesta lentos en nuestros tests y podría ser demasiado lenta para los jugones. En comparación, todos los dispositivos de prueba van de ##min### (mínimo) a 636 (máximo) ms. » 46 % de todos los dispositivos son mejores. Eso quiere decir que el tiempo de respuesta es similar al dispositivo testado medio (31 ms). | ||
Parpadeo de Pantalla / PWM (Pulse-Width Modulation)
| Parpadeo de Pantalla / PWM no detectado | 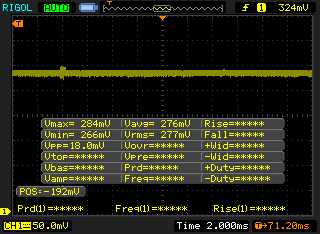 | ||
Comparación: 52 % de todos los dispositivos testados no usaron PWM para atenuar el display. Si se usó, medimos una media de 7769 (mínimo: 5 - máxmo: 343500) Hz. | |||
| Cinebench R15 | |
| CPU Single 64Bit | |
| Eurocom Tornado F5 | |
| Eurocom Sky X7E2 | |
| EVGA SC17 GTX 1070 | |
| MSI GE62 2QC-468XPL | |
| MSI GE72VR-6RF16H21 | |
| Eurocom Shark 4 | |
| CPU Multi 64Bit | |
| Eurocom Tornado F5 | |
| Eurocom Sky X7E2 | |
| MSI GE62 2QC-468XPL | |
| EVGA SC17 GTX 1070 | |
| MSI GE72VR-6RF16H21 | |
| Eurocom Shark 4 | |
| Cinebench R11.5 | |
| CPU Single 64Bit | |
| Eurocom Tornado F5 | |
| Eurocom Sky X7E2 | |
| MSI GE62 2QC-468XPL | |
| EVGA SC17 GTX 1070 | |
| Eurocom Shark 4 | |
| MSI GE72VR-6RF16H21 | |
| CPU Multi 64Bit | |
| Eurocom Tornado F5 | |
| Eurocom Sky X7E2 | |
| MSI GE62 2QC-468XPL | |
| EVGA SC17 GTX 1070 | |
| MSI GE72VR-6RF16H21 | |
| Eurocom Shark 4 | |
| Cinebench R10 | |
| Rendering Multiple CPUs 32Bit | |
| Eurocom Tornado F5 | |
| Eurocom Sky X7E2 | |
| MSI GE62 2QC-468XPL | |
| EVGA SC17 GTX 1070 | |
| MSI GE72VR-6RF16H21 | |
| Eurocom Shark 4 | |
| Rendering Single 32Bit | |
| Eurocom Tornado F5 | |
| Eurocom Sky X7E2 | |
| EVGA SC17 GTX 1070 | |
| MSI GE62 2QC-468XPL | |
| Eurocom Shark 4 | |
| MSI GE72VR-6RF16H21 | |
| wPrime 2.10 - 1024m | |
| Eurocom Shark 4 | |
| EVGA SC17 GTX 1070 | |
| MSI GE62 2QC-468XPL | |
| Eurocom Sky X7E2 | |
| Eurocom Tornado F5 | |
| Super Pi Mod 1.5 XS 32M - 32M | |
| MSI GE62 2QC-468XPL | |
| EVGA SC17 GTX 1070 | |
| Eurocom Shark 4 | |
| Eurocom Sky X7E2 | |
| Eurocom Tornado F5 | |
* ... más pequeño es mejor
| PCMark 8 | |
| Home Score Accelerated v2 | |
| Eurocom Tornado F5 | |
| Eurocom Sky X7E2 | |
| EVGA SC17 GTX 1070 | |
| Eurocom Shark 4 | |
| Work Score Accelerated v2 | |
| Eurocom Tornado F5 | |
| Eurocom Shark 4 | |
| Eurocom Sky X7E2 | |
| EVGA SC17 GTX 1070 | |
| Creative Score Accelerated v2 | |
| Eurocom Tornado F5 | |
| Eurocom Sky X7E2 | |
| EVGA SC17 GTX 1070 | |
| Eurocom Shark 4 | |
| PCMark 8 Home Score Accelerated v2 | 5476 puntos | |
| PCMark 8 Creative Score Accelerated v2 | 8593 puntos | |
| PCMark 8 Work Score Accelerated v2 | 6515 puntos | |
ayuda | ||
| Eurocom Tornado F5 Samsung SSD 960 Pro 512 GB m.2 | MSI GT73VR 7RF-296 2x Samsung SM951 MZVPV256HDGL (RAID 0) | Eurocom Sky X7E2 Samsung SM951 MZVPV512HDGL m.2 PCI-e | EVGA SC17 GTX 1070 Samsung SM951 MZVPV256 m.2 | MSI GE72VR-6RF16H21 Toshiba HG6 THNSNJ256G8NY | |
|---|---|---|---|---|---|
| CrystalDiskMark 3.0 | 43% | 3% | -8% | -64% | |
| Read Seq (MB/s) | 2145 | 3219 50% | 1673 -22% | 1658 -23% | 510 -76% |
| Write Seq (MB/s) | 1724 | 2572 49% | 1576 -9% | 1249 -28% | 274.6 -84% |
| Read 512 (MB/s) | 715 | 1776 148% | 1180 65% | 1044 46% | 427.2 -40% |
| Write 512 (MB/s) | 967 | 2445 153% | 1561 61% | 1254 30% | 247.2 -74% |
| Read 4k (MB/s) | 55.9 | 51.1 -9% | 51.5 -8% | 51.6 -8% | 21.23 -62% |
| Write 4k (MB/s) | 180.6 | 141.3 -22% | 144 -20% | 145.2 -20% | 86.8 -52% |
| Read 4k QD32 (MB/s) | 744 | 658 -12% | 694 -7% | 601 -19% | 335.4 -55% |
| Write 4k QD32 (MB/s) | 634 | 554 -13% | 422.1 -33% | 386.8 -39% | 178.1 -72% |

| 3DMark | |
| 3840x2160 Fire Strike Ultra Graphics | |
| MSI Gaming Z GeForce GTX 1070 OC Bios Desktop PC | |
| Eurocom Tornado F5 | |
| Asus G701VO-CS74K | |
| MSI GE72VR-6RF16H21 | |
| Asus Strix GL502VY-DS71 | |
| Fire Strike Extreme Graphics | |
| Aorus X7 DT v6 | |
| Eurocom Tornado F5 | |
| Asus G701VO-CS74K | |
| MSI GE72VR-6RF16H21 | |
| Asus Strix GL502VY-DS71 | |
| 1920x1080 Fire Strike Graphics | |
| Aorus X7 DT v6 | |
| MSI Gaming Z GeForce GTX 1070 OC Bios Desktop PC | |
| Eurocom Tornado F5 | |
| Asus G701VO-CS74K | |
| MSI GE72VR-6RF16H21 | |
| Asus Strix GL502VY-DS71 | |
| 3DMark 11 Performance | 18317 puntos | |
| 3DMark Ice Storm Standard Score | 174858 puntos | |
| 3DMark Cloud Gate Standard Score | 34367 puntos | |
| 3DMark Fire Strike Score | 14664 puntos | |
| 3DMark Fire Strike Extreme Score | 7647 puntos | |
ayuda | ||
| Rise of the Tomb Raider - 1920x1080 Very High Preset AA:FX AF:16x | |
| Aorus X7 DT v6 | |
| Eurocom Tornado F5 | |
| Nvidia GeForce GTX 1070 Founders Edition | |
| MSI GT72VR 6RD-063US | |
| Asus G701VO-CS74K | |
| Asus Strix GL502VT-DS74 | |
| Sleeping Dogs - 1920x1080 Extreme Preset AA:Extreme | |
| Aorus X7 DT v6 | |
| Eurocom Tornado F5 | |
| Asus G701VO-CS74K | |
| Asus Strix GL502VT-DS74 | |
| Guild Wars 2 - 1920x1080 All Maximum / On AA:FX | |
| Eurocom Tornado F5 | |
| MSI GT72VR 6RD-063US | |
| BioShock Infinite - 1920x1080 Ultra Preset, DX11 (DDOF) | |
| Aorus X7 DT v6 | |
| Nvidia GeForce GTX 1070 Founders Edition | |
| Eurocom Tornado F5 | |
| Asus G701VO-CS74K | |
| MSI GT72VR 6RD-063US | |
| Asus Strix GL502VT-DS74 | |
| Metro: Last Light - 1920x1080 Very High (DX11) AF:16x | |
| Aorus X7 DT v6 | |
| Nvidia GeForce GTX 1070 Founders Edition | |
| Eurocom Tornado F5 | |
| Asus G701VO-CS74K | |
| MSI GT72VR 6RD-063US | |
| Asus Strix GL502VT-DS74 | |
| Batman: Arkham Knight - 1920x1080 High / On AA:SM AF:16x | |
| Aorus X7 DT v6 | |
| Eurocom Tornado F5 | |
| Asus G701VO-CS74K | |
| MSI GT72VR 6RD-063US | |
| Asus Strix GL502VT-DS74 | |
| Fallout 4 - 1920x1080 Ultra Preset AA:T AF:16x | |
| Aorus X7 DT v6 | |
| Nvidia GeForce GTX 1070 Founders Edition | |
| Eurocom Tornado F5 | |
| Asus G701VO-CS74K | |
| MSI GT72VR 6RD-063US | |
| Asus Strix GL502VT-DS74 | |
| Doom - 1920x1080 Ultra Preset AA:SM | |
| Aorus X7 DT v6 | |
| Eurocom Tornado F5 | |
| Nvidia GeForce GTX 1070 Founders Edition | |
| MSI GT72VR 6RD-063US | |
| Asus G701VO-CS74K | |
| Overwatch - 1920x1080 Epic (Render Scale 100 %) AA:SM AF:16x | |
| Nvidia GeForce GTX 1070 Founders Edition | |
| Eurocom Tornado F5 | |
| Asus G701VO-CS74K | |
| MSI GT72VR 6RD-063US | |
| Mafia 3 - 1920x1080 High Preset | |
| Eurocom Tornado F5 | |
| Ashes of the Singularity - 1920x1080 high | |
| Eurocom Tornado F5 | |
| Nvidia GeForce GTX 1070 Founders Edition | |
| bajo | medio | alto | ultra | |
|---|---|---|---|---|
| Sleeping Dogs (2012) | 117.1 | |||
| Guild Wars 2 (2012) | 91.7 | |||
| BioShock Infinite (2013) | 149.6 | |||
| Metro: Last Light (2013) | 117.6 | |||
| Batman: Arkham Knight (2015) | 87 | |||
| Metal Gear Solid V (2015) | 60 | |||
| Fallout 4 (2015) | 107.6 | |||
| Rise of the Tomb Raider (2016) | 98 | |||
| Ashes of the Singularity (2016) | 78.2 | |||
| Doom (2016) | 136.5 | |||
| Overwatch (2016) | 160.5 | |||
| Mafia 3 (2016) | 66 |
Ruido
| Ocioso |
| 33.3 / 33.5 / 33.5 dB(A) |
| Carga |
| 44.2 / 52.5 dB(A) |
 | ||
30 dB silencioso 40 dB(A) audible 50 dB(A) ruidosamente alto |
||
min: | ||
| Eurocom Tornado F5 GeForce GTX 1070 Mobile, i7-7700K, Samsung SSD 960 Pro 512 GB m.2 | MSI GT73VR 7RF-296 GeForce GTX 1080 Mobile, i7-7820HK, 2x Samsung SM951 MZVPV256HDGL (RAID 0) | MSI GT72VR 7RE-433 GeForce GTX 1070 Mobile, i7-7700HQ, Kingston RBU-SNS8152S3256GG5 | EVGA SC17 GTX 1070 GeForce GTX 1070 Mobile, 6820HK, Samsung SM951 MZVPV256 m.2 | Aorus X7 DT v6 GeForce GTX 1080 Mobile, 6820HK, Samsung SM951 MZVPV512HDGL m.2 PCI-e | |
|---|---|---|---|---|---|
| Noise | -2% | 2% | -1% | -5% | |
| apagado / medio ambiente * (dB) | 29.4 | 30 -2% | 31 -5% | 29.2 1% | 28.6 3% |
| Idle Minimum * (dB) | 33.3 | 34 -2% | 34 -2% | 33.9 -2% | 32.2 3% |
| Idle Average * (dB) | 33.5 | 35 -4% | 35 -4% | 33.9 -1% | 35.2 -5% |
| Idle Maximum * (dB) | 33.5 | 37 -10% | 37 -10% | 33.9 -1% | 35.2 -5% |
| Load Average * (dB) | 44.2 | 39 12% | 37 16% | 43.8 1% | 51.7 -17% |
| Load Maximum * (dB) | 52.5 | 56 -7% | 44 16% | 53.4 -2% | 55.7 -6% |
* ... más pequeño es mejor
(+) La temperatura máxima en la parte superior es de 37.4 °C / 99 F, frente a la media de 40.4 °C / 105 F, que oscila entre 21.2 y 68.8 °C para la clase Gaming.
(±) El fondo se calienta hasta un máximo de 44.8 °C / 113 F, frente a la media de 43.2 °C / 110 F
(+) En reposo, la temperatura media de la parte superior es de 23.8 °C / 75# F, frente a la media del dispositivo de 33.9 °C / 93 F.
(+) El reposamanos y el panel táctil están a una temperatura inferior a la de la piel, con un máximo de 28.8 °C / 83.8 F y, por tanto, son fríos al tacto.
(±) La temperatura media de la zona del reposamanos de dispositivos similares fue de 28.8 °C / 83.8 F (0 °C / 0 F).
Eurocom Tornado F5 análisis de audio
(-) | altavoces no muy altos (#71.3 dB)
Graves 100 - 315 Hz
(±) | lubina reducida - en promedio 13.2% inferior a la mediana
(±) | la linealidad de los graves es media (10.6% delta a frecuencia anterior)
Medios 400 - 2000 Hz
(±) | medias más altas - de media 5.1% más altas que la mediana
(±) | la linealidad de los medios es media (12.8% delta respecto a la frecuencia anterior)
Altos 2 - 16 kHz
(+) | máximos equilibrados - a sólo 2.7% de la mediana
(±) | la linealidad de los máximos es media (7.2% delta a frecuencia anterior)
Total 100 - 16.000 Hz
(±) | la linealidad del sonido global es media (24.4% de diferencia con la mediana)
En comparación con la misma clase
» 88% de todos los dispositivos probados de esta clase eran mejores, 3% similares, 8% peores
» El mejor tuvo un delta de 6%, la media fue 18%, el peor fue ###max##%
En comparación con todos los dispositivos probados
» 74% de todos los dispositivos probados eran mejores, 6% similares, 20% peores
» El mejor tuvo un delta de 4%, la media fue 24%, el peor fue ###max##%
Apple MacBook 12 (Early 2016) 1.1 GHz análisis de audio
(+) | los altavoces pueden reproducir a un volumen relativamente alto (#83.6 dB)
Graves 100 - 315 Hz
(±) | lubina reducida - en promedio 11.3% inferior a la mediana
(±) | la linealidad de los graves es media (14.2% delta a frecuencia anterior)
Medios 400 - 2000 Hz
(+) | medios equilibrados - a sólo 2.4% de la mediana
(+) | los medios son lineales (5.5% delta a la frecuencia anterior)
Altos 2 - 16 kHz
(+) | máximos equilibrados - a sólo 2% de la mediana
(+) | los máximos son lineales (4.5% delta a la frecuencia anterior)
Total 100 - 16.000 Hz
(+) | el sonido global es lineal (10.2% de diferencia con la mediana)
En comparación con la misma clase
» 7% de todos los dispositivos probados de esta clase eran mejores, 2% similares, 91% peores
» El mejor tuvo un delta de 5%, la media fue 18%, el peor fue ###max##%
En comparación con todos los dispositivos probados
» 5% de todos los dispositivos probados eran mejores, 1% similares, 94% peores
» El mejor tuvo un delta de 4%, la media fue 24%, el peor fue ###max##%
| Off / Standby | |
| Ocioso | |
| Carga |
|
Clave:
min: | |
| Eurocom Tornado F5 i7-7700K, GeForce GTX 1070 Mobile, Samsung SSD 960 Pro 512 GB m.2, IPS, 1920x1080, 15.6" | MSI GT73VR 7RF-296 i7-7820HK, GeForce GTX 1080 Mobile, 2x Samsung SM951 MZVPV256HDGL (RAID 0), TN LED, 1920x1080, 17.3" | MSI GT72VR 7RE-433 i7-7700HQ, GeForce GTX 1070 Mobile, Kingston RBU-SNS8152S3256GG5, TN LED, 1920x1080, 17.3" | MSI GE62 2QC-468XPL 5700HQ, GeForce GTX 960M, Samsung SSD PM851 256 GB MZNTE256HMHP, TN, 1920x1080, 15.6" | Aorus X7 DT v6 6820HK, GeForce GTX 1080 Mobile, Samsung SM951 MZVPV512HDGL m.2 PCI-e, TN LED, 2560x1440, 17.3" | |
|---|---|---|---|---|---|
| Power Consumption | -28% | 8% | 7% | -32% | |
| Idle Minimum * (Watt) | 21.2 | 29 -37% | 20 6% | 15.5 27% | 31.5 -49% |
| Idle Average * (Watt) | 25.1 | 35 -39% | 27 -8% | 22.5 10% | 33.9 -35% |
| Idle Maximum * (Watt) | 26.3 | 40 -52% | 31 -18% | 44.9 -71% | 34.6 -32% |
| Load Average * (Watt) | 169.4 | 94 45% | 86 49% | 122.4 28% | 205.6 -21% |
| Load Maximum * (Watt) | 202.4 | 315 -56% | 184 9% | 122.6 39% | 250.8 -24% |
* ... más pequeño es mejor
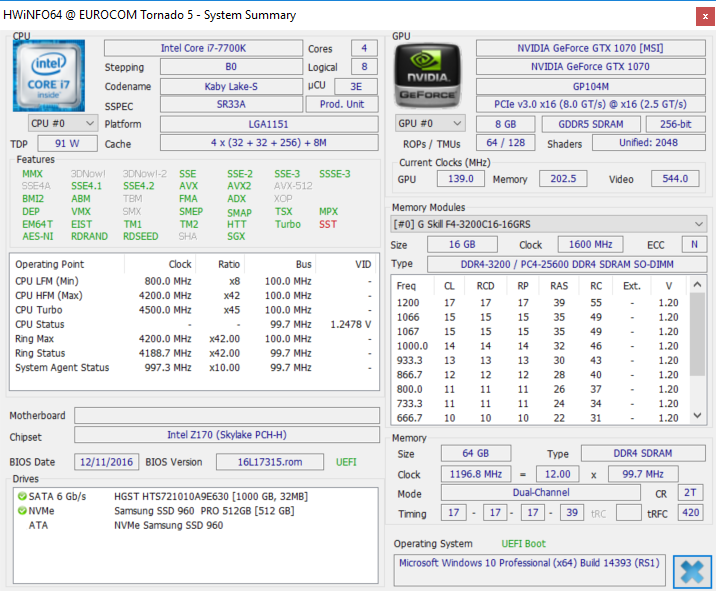
| Eurocom Tornado F5 i7-7700K, GeForce GTX 1070 Mobile, 75.24 Wh | MSI GT73VR 7RF-296 i7-7820HK, GeForce GTX 1080 Mobile, 75.2 Wh | Eurocom Sky X7E2 6700K, GeForce GTX 1080 Mobile, 89 Wh | EVGA SC17 GTX 1070 6820HK, GeForce GTX 1070 Mobile, 74.48 Wh | Aorus X7 DT v6 6820HK, GeForce GTX 1080 Mobile, 94 Wh | |
|---|---|---|---|---|---|
| Duración de Batería | -25% | -26% | -20% | -9% | |
| Reader / Idle (h) | 4.9 | 2.3 -53% | 4 -18% | 3 -39% | |
| WiFi v1.3 (h) | 3.6 | 2.7 -25% | 1.7 -53% | 2.7 -25% | 2.4 -33% |
| Load (h) | 1.1 | 1.4 27% | 0.9 -18% | 1.6 45% |
Pro
Contra
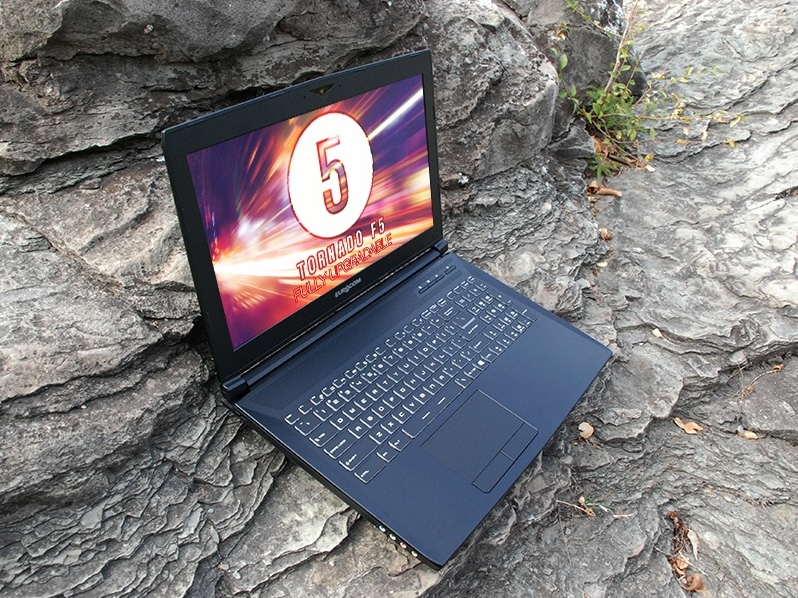
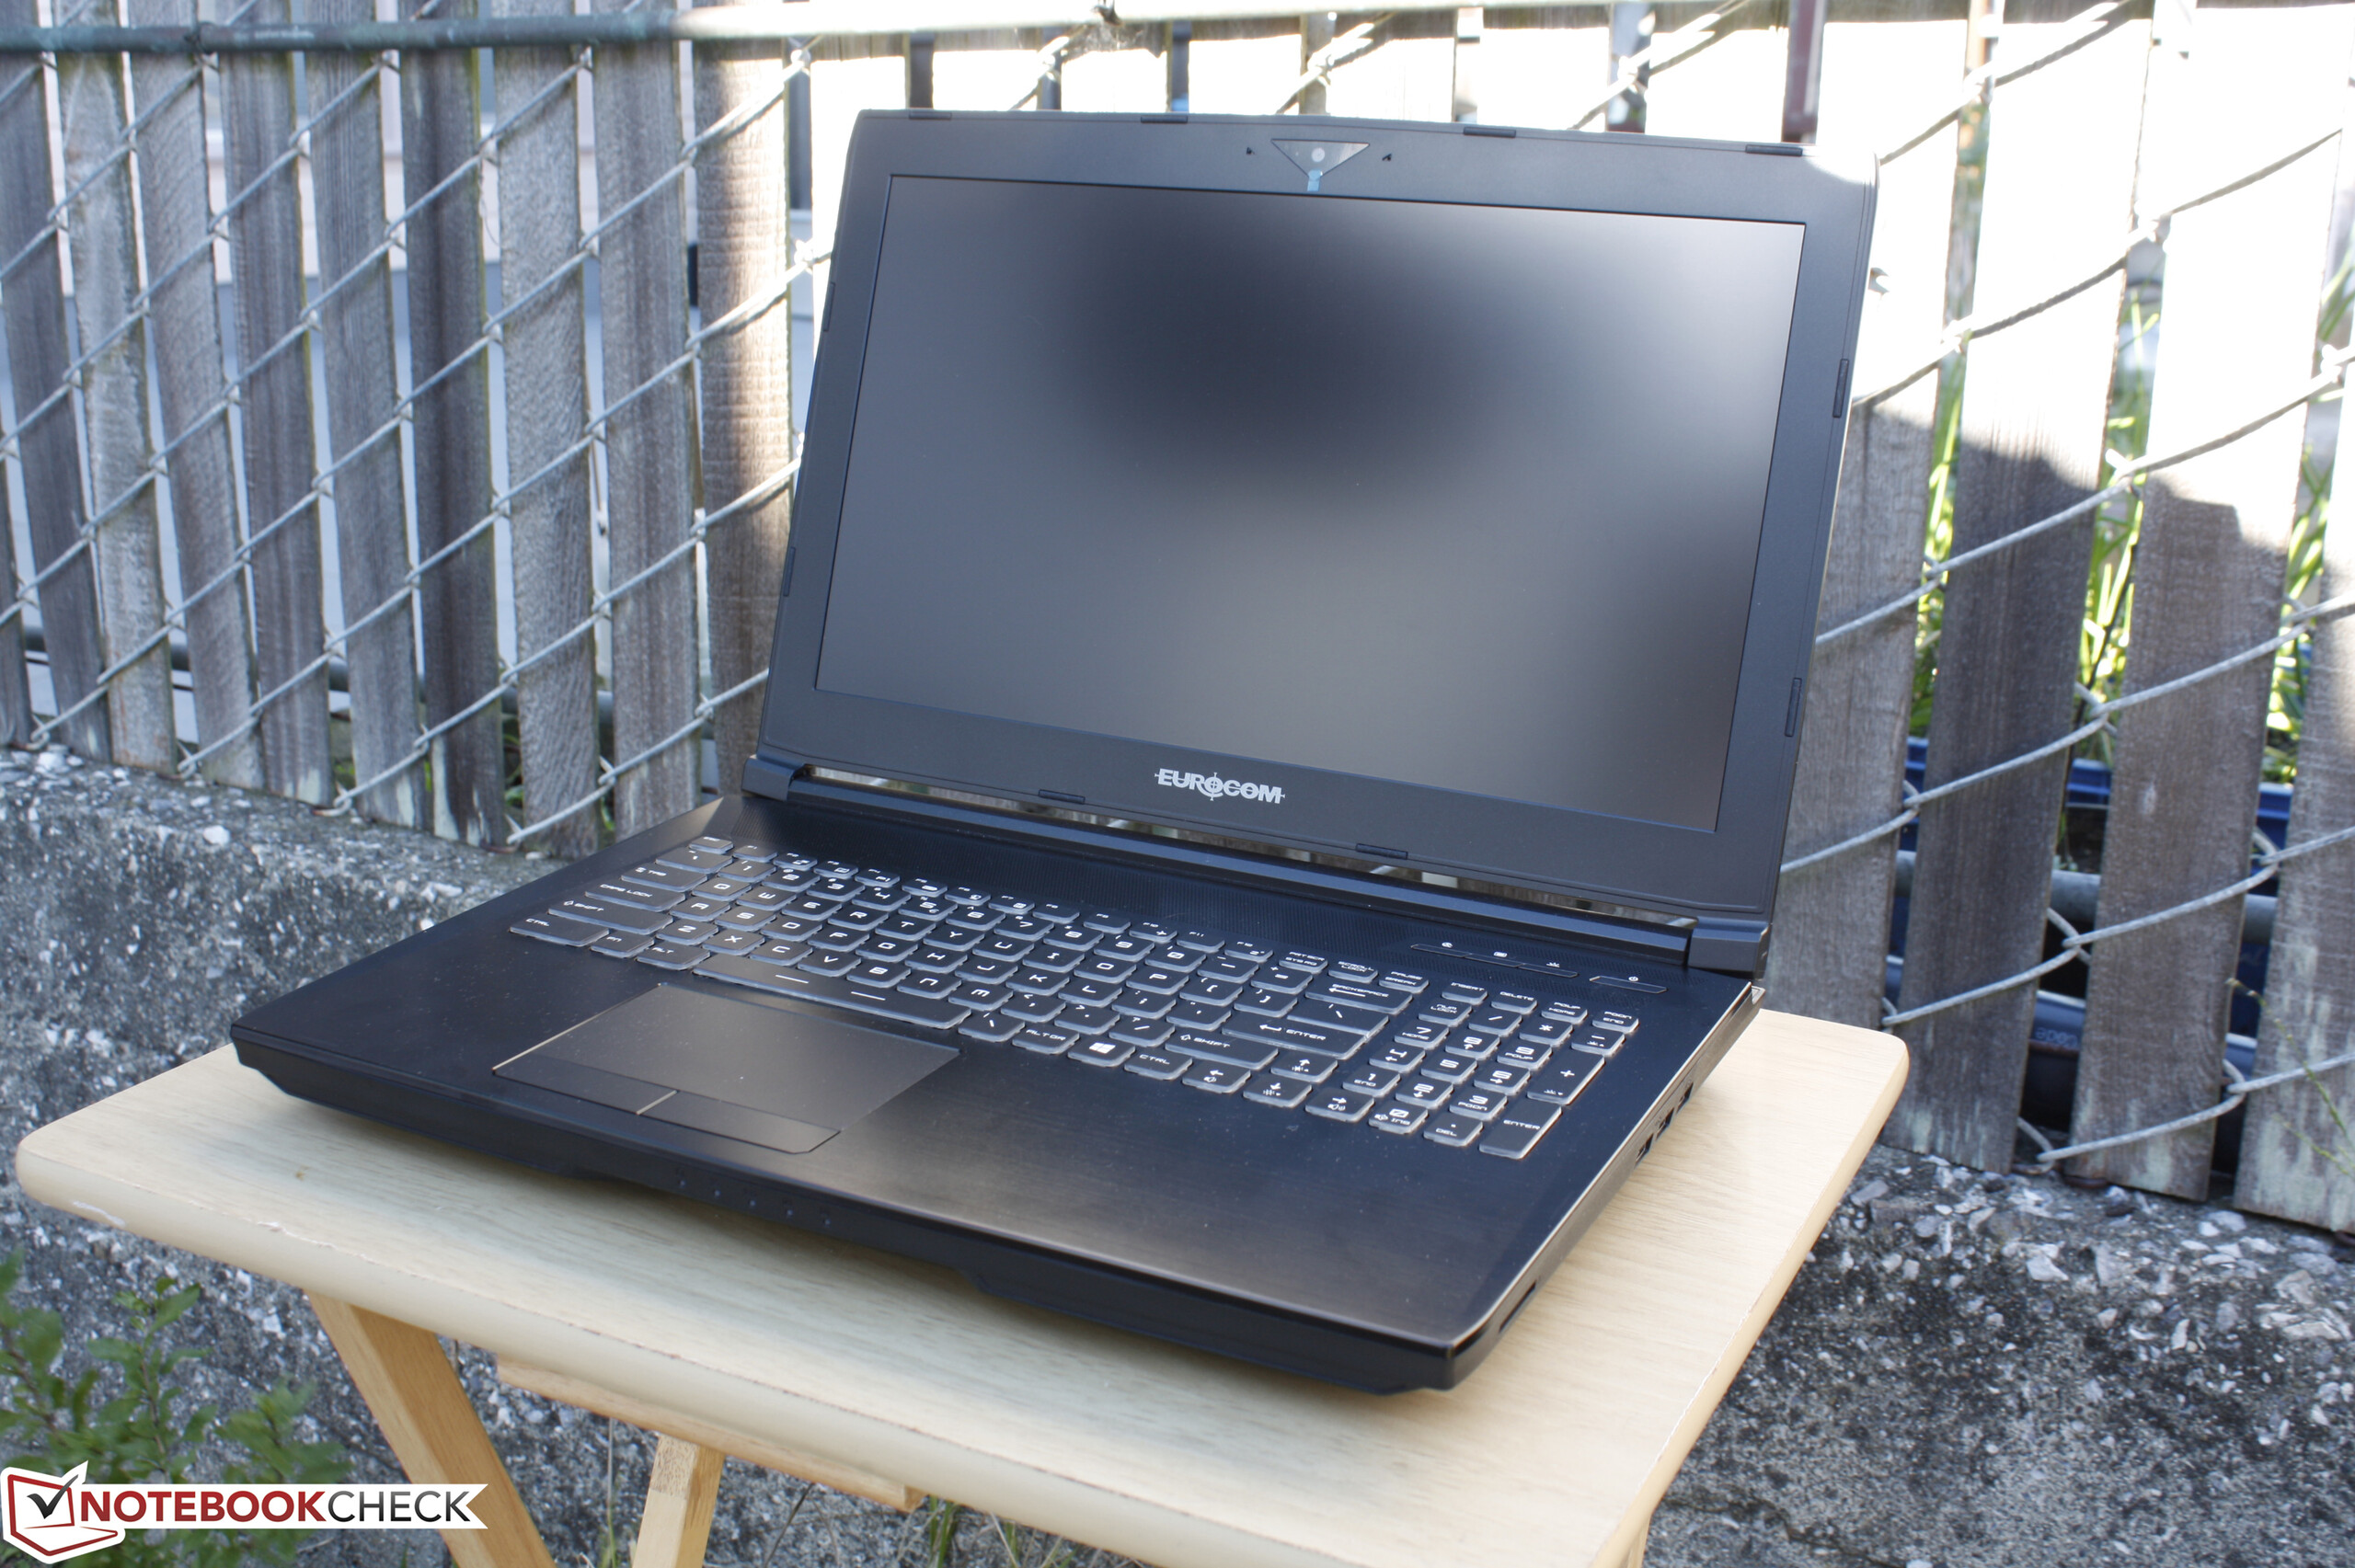
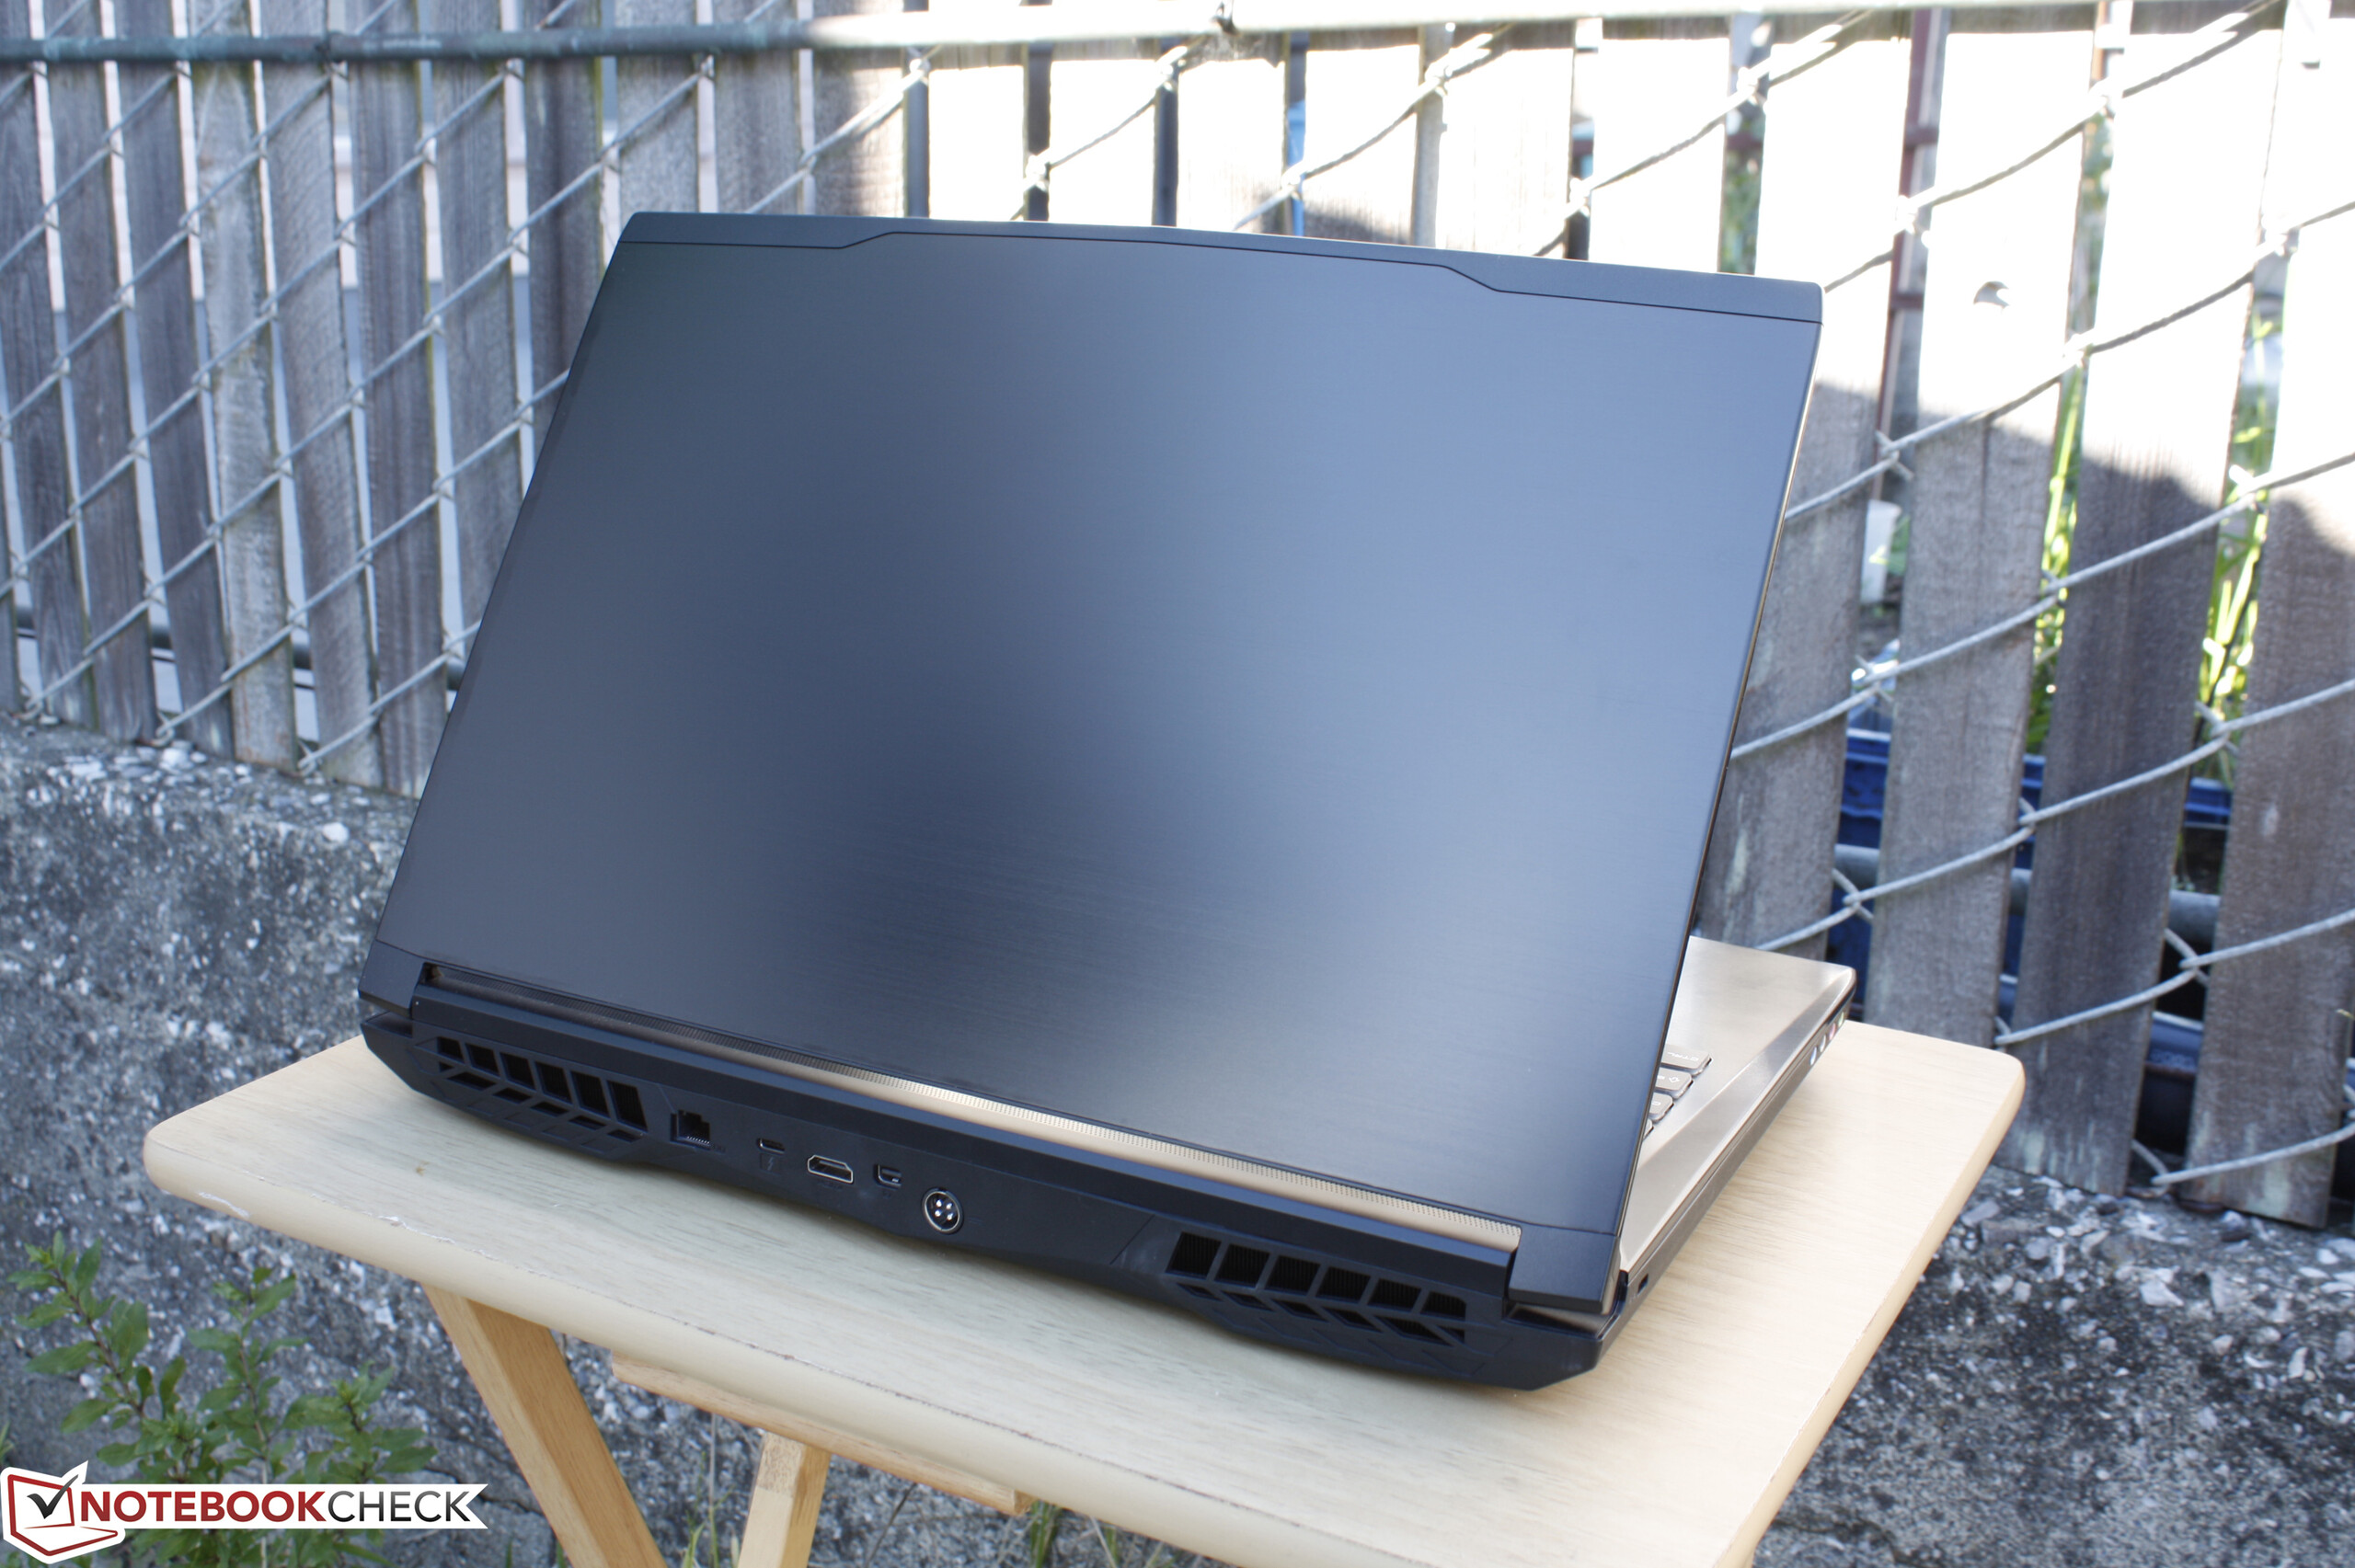
El Tornado F5 sigue la tradición Eurocom de ofrecer rendimiento más rápido, más personalización, y piernas más largas que los equivalentes populares de fabricantes famosos. No se puede negar que la capacidad de usar procesadores de sobremesa estándar y GPUs extraíbles sin anular un sello de garantía es uno de los mejores aspectos de tener un sistema Eurocom.
Si las anteriores ventajas no te atraen, no tienes mucho motivo para preferir el entusiasta Tornado F5 frente a algo más mainstream como MSI GE62, Asus GL502, o HP Omen 17. Estos sistemas son más asequibles y mucho menos voluminosos y llevan la misma GPU GTX 1070. El rendimiento de sistema general puede ser más lento, pero el rendimiento gaming puede ser casi idéntico ya que el rendimiento bruto de CPU de un procesador i7-5700HQ o i7-6700HQ en la mayoría de portátiles gaming ya es más que suficiente para la mayoría de títulos.
El sistema no parece sufrir ralentización importante bajo cargas de juegos. Cargas más extremas con Prime95, empero, llevan las temperaturas a casi 100 C incluso después de ralentizar las frecuencias. Por ello, los usuarios que esperen mucha holgura de overclocking del i7-7700K pueden quedar decepcionados. Las temperaturas de la GTX 1070 son más aceptables ya que se puede configurar el sistema con la GTX 1080. En cualquier caso, Eurocom camina por una línea delgada en términos de límites termales y opciones configurables para ofrecer uno de los portátiles más rápidos en este tamaño de pantalla.
El chasis podría ser más fuerte y las temperaturas internas más bajas. Por lo demás, el Tornado F5 vence a la competencia en potencia bruta y personalización siempre que su elevado precio no sea un impedimento.
Ésta es una versión acortada del análisis original. Puedes leer el análisis completo en inglés aquí.
Eurocom Tornado F5
- 01/03/2017 v6 (old)
Allen Ngo
Price comparison
