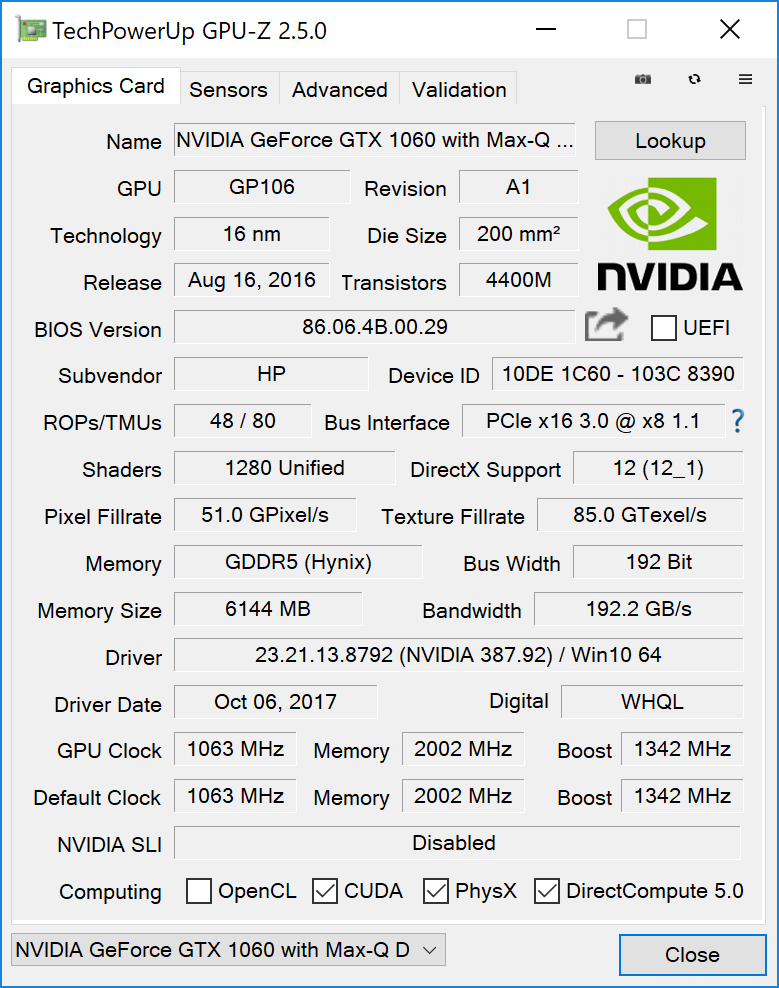
Breve análisis del HP Omen 15t-ce000 (7700HQ, GTX 1060 Max-Q, UHD)
| SD Card Reader | |
| average JPG Copy Test (av. of 3 runs) | |
| Dell XPS 15 9560 (i7-7700HQ, UHD) | |
| Gigabyte Aero 15 | |
| HP Omen 15t-ce000 | |
| Dell Inspiron 15 7000 7577 | |
| Acer Aspire VN7-593G-73HP V15 Nitro BE | |
| maximum AS SSD Seq Read Test (1GB) | |
| Dell XPS 15 9560 (i7-7700HQ, UHD) | |
| Gigabyte Aero 15 | |
| HP Omen 15t-ce000 | |
| Dell Inspiron 15 7000 7577 | |
| Acer Aspire VN7-593G-73HP V15 Nitro BE | |
| |||||||||||||||||||||||||
iluminación: 95 %
Brillo con batería: 358.5 cd/m²
Contraste: 919:1 (Negro: 0.39 cd/m²)
ΔE ColorChecker Calman: 4.6 | ∀{0.5-29.43 Ø4.71}
ΔE Greyscale Calman: 5.2 | ∀{0.09-98 Ø4.96}
91.8% sRGB (Argyll 1.6.3 3D)
66.9% AdobeRGB 1998 (Argyll 1.6.3 3D)
66.9% AdobeRGB 1998 (Argyll 3D)
91.8% sRGB (Argyll 3D)
66.1% Display P3 (Argyll 3D)
Gamma: 2.28
CCT: 6410 K
| HP Omen 15t-ce000 AU Optronics AUO23EB, IPS, 15.6", 3840x2160 | Lenovo Legion Y520-15IKBN 80WK0042GE LG Philips LP156WF6-SPK3, IPS, 15.6", 1920x1080 | Dell Inspiron 15 7000 7577 ID: LG Philips LGD053F, Name: 156WF6, Dell P/N: 4XK13, IPS, 15.6", 1920x1080 | Gigabyte Aero 15 N156HCA-EA1 (CMN15D7), IPS, 15.6", 1920x1080 | Acer Aspire VN7-593G-73HP V15 Nitro BE LG Display LP156WF6-SPP1, AH-IPS, Normally Black, Transmissive, 15.6", 1920x1080 | HP Omen 15-ce002ng AUO42ED, IPS, 15.6", 1920x1080 | Aorus X5 v7 AU Optronics B156ZAN02.3 (AUO23EB), IPS, 15.6", 3840x2160 | |
|---|---|---|---|---|---|---|---|
| Display | -39% | -42% | -0% | -5% | -1% | -1% | |
| Display P3 Coverage (%) | 66.1 | 39.01 -41% | 37.07 -44% | 65.2 -1% | 65.8 0% | 65.8 0% | 65.3 -1% |
| sRGB Coverage (%) | 91.8 | 58.4 -36% | 55.6 -39% | 92.5 1% | 85.1 -7% | 90.9 -1% | 91.9 0% |
| AdobeRGB 1998 Coverage (%) | 66.9 | 40.34 -40% | 38.32 -43% | 66.5 -1% | 62.2 -7% | 66.5 -1% | 66.3 -1% |
| Response Times | -11% | -3% | -22% | -23% | -21% | -12% | |
| Response Time Grey 50% / Grey 80% * (ms) | 37.6 ? | 39 ? -4% | 35.6 ? 5% | 42.8 ? -14% | 41 ? -9% | 43.2 ? -15% | 44 ? -17% |
| Response Time Black / White * (ms) | 24.8 ? | 29 ? -17% | 27.6 ? -11% | 32 ? -29% | 34 ? -37% | 31.2 ? -26% | 26.4 ? -6% |
| PWM Frequency (Hz) | 21000 ? | 26000 ? | |||||
| Screen | -22% | -27% | -6% | -3% | 9% | 0% | |
| Brightness middle (cd/m²) | 358.5 | 283 -21% | 235.4 -34% | 320 -11% | 322 -10% | 304 -15% | 307 -14% |
| Brightness (cd/m²) | 350 | 281 -20% | 223 -36% | 316 -10% | 297 -15% | 289 -17% | 297 -15% |
| Brightness Distribution (%) | 95 | 91 -4% | 91 -4% | 90 -5% | 86 -9% | 86 -9% | 92 -3% |
| Black Level * (cd/m²) | 0.39 | 0.39 -0% | 0.28 28% | 0.36 8% | 0.31 21% | 0.26 33% | 0.3 23% |
| Contrast (:1) | 919 | 726 -21% | 841 -8% | 889 -3% | 1039 13% | 1169 27% | 1023 11% |
| Colorchecker dE 2000 * | 4.6 | 6.1 -33% | 5.6 -22% | 4.62 -0% | 4.73 -3% | 3.46 25% | 4.72 -3% |
| Colorchecker dE 2000 max. * | 8.5 | 11.08 -30% | 20.3 -139% | 9.75 -15% | 12.37 -46% | 7.72 9% | 8.07 5% |
| Greyscale dE 2000 * | 5.2 | 5.69 -9% | 3.6 31% | 6 -15% | 2.99 42% | 2.46 53% | 4.79 8% |
| Gamma | 2.28 96% | 2.44 90% | 2.23 99% | 2.46 89% | 2.32 95% | 2.38 92% | 2.42 91% |
| CCT | 6410 101% | 6702 97% | 7214 90% | 6761 96% | 6905 94% | 6915 94% | 7690 85% |
| Color Space (Percent of AdobeRGB 1998) (%) | 66.9 | 37 -45% | 35.2 -47% | 60 -10% | 56 -16% | 59 -12% | 60 -10% |
| Color Space (Percent of sRGB) (%) | 91.8 | 58 -37% | 55.4 -40% | 92 0% | 85 -7% | 91 -1% | 92 0% |
| Media total (Programa/Opciones) | -24% /
-24% | -24% /
-27% | -9% /
-7% | -10% /
-6% | -4% /
3% | -4% /
-2% |
* ... más pequeño es mejor
Tiempos de respuesta del display
| ↔ Tiempo de respuesta de Negro a Blanco | ||
|---|---|---|
| 24.8 ms ... subida ↗ y bajada ↘ combinada | ↗ 12.4 ms subida | 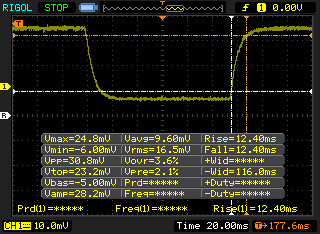 |
| ↘ 12.4 ms bajada | ||
| La pantalla mostró buenos tiempos de respuesta en nuestros tests pero podría ser demasiado lenta para los jugones competitivos. En comparación, todos los dispositivos de prueba van de ##min### (mínimo) a 240 (máximo) ms. » 58 % de todos los dispositivos son mejores. Eso quiere decir que el tiempo de respuesta es peor que la media (19.8 ms) de todos los dispositivos testados. | ||
| ↔ Tiempo de respuesta 50% Gris a 80% Gris | ||
| 37.6 ms ... subida ↗ y bajada ↘ combinada | ↗ 19.6 ms subida | 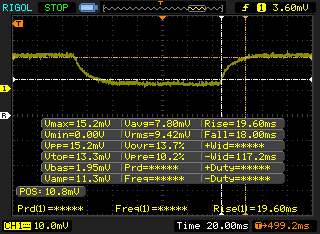 |
| ↘ 18 ms bajada | ||
| La pantalla mostró tiempos de respuesta lentos en nuestros tests y podría ser demasiado lenta para los jugones. En comparación, todos los dispositivos de prueba van de ##min### (mínimo) a 636 (máximo) ms. » 55 % de todos los dispositivos son mejores. Eso quiere decir que el tiempo de respuesta es peor que la media (31 ms) de todos los dispositivos testados. | ||
Parpadeo de Pantalla / PWM (Pulse-Width Modulation)
| Parpadeo de Pantalla / PWM no detectado | 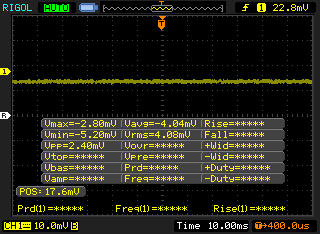 | ||
Comparación: 52 % de todos los dispositivos testados no usaron PWM para atenuar el display. Si se usó, medimos una media de 7757 (mínimo: 5 - máxmo: 343500) Hz. | |||
| Cinebench R10 | |
| Rendering Multiple CPUs 32Bit | |
| HP Omen 15-ce002ng | |
| HP Omen 15t-ce000 | |
| Lenovo Legion Y520-15IKBN 80WK0042GE | |
| Dell Inspiron 15 7000 7577 | |
| HP Spectre x360 15t-bl100 | |
| Rendering Single 32Bit | |
| HP Spectre x360 15t-bl100 | |
| HP Omen 15-ce002ng | |
| HP Omen 15t-ce000 | |
| Lenovo Legion Y520-15IKBN 80WK0042GE | |
| Dell Inspiron 15 7000 7577 | |
| wPrime 2.10 - 1024m | |
| HP Spectre x360 15t-bl100 | |
| Dell Inspiron 15 7000 7577 | |
| HP Omen 15t-ce000 | |
* ... más pequeño es mejor
| PCMark 8 | |
| Home Score Accelerated v2 | |
| HP Omen 15-ce002ng | |
| Aorus X5 v7 | |
| HP Omen 15t-ce000 | |
| Gigabyte Aero 15 | |
| Dell Inspiron 15 7000 7577 | |
| Lenovo Legion Y520-15IKBN 80WK0042GE | |
| Work Score Accelerated v2 | |
| HP Omen 15-ce002ng | |
| Gigabyte Aero 15 | |
| Dell Inspiron 15 7000 7577 | |
| Lenovo Legion Y520-15IKBN 80WK0042GE | |
| HP Omen 15t-ce000 | |
| Creative Score Accelerated v2 | |
| HP Omen 15t-ce000 | |
| Dell Inspiron 15 7000 7577 | |
| Lenovo Legion Y520-15IKBN 80WK0042GE | |
| PCMark 8 Home Score Accelerated v2 | 4325 puntos | |
| PCMark 8 Creative Score Accelerated v2 | 6901 puntos | |
| PCMark 8 Work Score Accelerated v2 | 2484 puntos | |
| PCMark 10 Score | 3969 puntos | |
ayuda | ||
| HP Omen 15t-ce000 Samsung PM961 NVMe MZVLW128HEGR | Lenovo Legion Y520-15IKBN 80WK0042GE Samsung PM961 NVMe MZVLW128HEGR | Dell Inspiron 15 7000 7577 Samsung PM961 MZVLW256HEHP | Aorus X5 v7 Toshiba NVMe THNSN5256GPU7 | HP Spectre x360 15t-bl100 Samsung PM961 NVMe MZVLW512HMJP | |
|---|---|---|---|---|---|
| AS SSD | -9% | 32% | -436% | 133% | |
| Copy Game MB/s (MB/s) | 736 | 197.3 -73% | 382.5 -48% | 988 34% | 1134 54% |
| Copy Program MB/s (MB/s) | 195.4 | 127.3 -35% | 274.8 41% | 424.4 117% | 534 173% |
| Copy ISO MB/s (MB/s) | 1087 | 497.6 -54% | 814 -25% | 1482 36% | 1936 78% |
| Score Total (Points) | 1515 | 1434 -5% | 2405 59% | 490 -68% | 3781 150% |
| Score Write (Points) | 361 | 368 2% | 594 65% | 24 -93% | 1556 331% |
| Score Read (Points) | 789 | 746 -5% | 1241 57% | 361 -54% | 1493 89% |
| Access Time Write * (ms) | 0.034 | 0.032 6% | 0.037 -9% | 1.987 -5744% | 0.026 24% |
| Access Time Read * (ms) | 0.071 | 0.07 1% | 0.058 18% | 0.067 6% | 0.04 44% |
| 4K-64 Write (MB/s) | 175.9 | 158.6 -10% | 375.8 114% | 2.12 -99% | 1262 617% |
| 4K-64 Read (MB/s) | 568 | 463.2 -18% | 929 64% | 112.5 -80% | 1206 112% |
| 4K Write (MB/s) | 111.2 | 127.9 15% | 100.2 -10% | 2.03 -98% | 141.1 27% |
| 4K Read (MB/s) | 43.09 | 46.98 9% | 46.95 9% | 38.45 -11% | 51.9 20% |
| Seq Write (MB/s) | 743 | 814 10% | 1181 59% | 200.3 -73% | 1530 106% |
| Seq Read (MB/s) | 1774 | 2362 33% | 2652 49% | 2103 19% | 2342 32% |
* ... más pequeño es mejor

| 3DMark | |
| 3840x2160 Fire Strike Ultra Graphics | |
| Dell Inspiron 15 7000 7577 | |
| HP Omen 15t-ce000 | |
| Lenovo Legion Y520-15IKBN 80WK0042GE | |
| Fire Strike Extreme Graphics | |
| Dell Inspiron 15 7000 7577 | |
| HP Omen 15t-ce000 | |
| Lenovo Legion Y520-15IKBN 80WK0042GE | |
| 1920x1080 Fire Strike Graphics | |
| Aorus X5 v7 | |
| Acer Aspire VN7-593G-73HP V15 Nitro BE | |
| Gigabyte Aero 15 | |
| HP Omen 15-ce002ng | |
| Dell Inspiron 15 7000 7577 | |
| HP Omen 15t-ce000 | |
| Lenovo Legion Y520-15IKBN 80WK0042GE | |
| 1280x720 Cloud Gate Standard Graphics | |
| Aorus X5 v7 | |
| Gigabyte Aero 15 | |
| Dell Inspiron 15 7000 7577 | |
| HP Omen 15-ce002ng | |
| Acer Aspire VN7-593G-73HP V15 Nitro BE | |
| Lenovo Legion Y520-15IKBN 80WK0042GE | |
| HP Omen 15t-ce000 | |
| 3DMark 11 Performance | 11761 puntos | |
| 3DMark Cloud Gate Standard Score | 21508 puntos | |
| 3DMark Fire Strike Score | 8725 puntos | |
| 3DMark Fire Strike Extreme Score | 4487 puntos | |
ayuda | ||
| Rise of the Tomb Raider | |
| 3840x2160 High Preset AA:FX AF:4x (ordenar por valor) | |
| HP Omen 15t-ce000 | |
| HP Omen 15-ce002ng | |
| Aorus X5 v7 | |
| 1920x1080 Very High Preset AA:FX AF:16x (ordenar por valor) | |
| HP Omen 15t-ce000 | |
| Dell Inspiron 15 7000 7577 | |
| Acer Aspire VN7-593G-73HP V15 Nitro BE | |
| HP Omen 15-ce002ng | |
| Aorus X5 v7 | |
| HP Spectre x360 15t-bl100 | |
| 1920x1080 High Preset AA:FX AF:4x (ordenar por valor) | |
| HP Omen 15t-ce000 | |
| Dell Inspiron 15 7000 7577 | |
| Acer Aspire VN7-593G-73HP V15 Nitro BE | |
| HP Omen 15-ce002ng | |
| Aorus X5 v7 | |
| HP Spectre x360 15t-bl100 | |
| The Witcher 3 | |
| 3840x2160 High Graphics & Postprocessing (Nvidia HairWorks Off) (ordenar por valor) | |
| HP Omen 15t-ce000 | |
| HP Omen 15-ce002ng | |
| Aorus X5 v7 | |
| 1920x1080 Ultra Graphics & Postprocessing (HBAO+) (ordenar por valor) | |
| HP Omen 15t-ce000 | |
| Lenovo Legion Y520-15IKBN 80WK0042GE | |
| Dell Inspiron 15 7000 7577 | |
| Gigabyte Aero 15 | |
| Acer Aspire VN7-593G-73HP V15 Nitro BE | |
| HP Omen 15-ce002ng | |
| Aorus X5 v7 | |
| HP Spectre x360 15t-bl100 | |
| 1920x1080 High Graphics & Postprocessing (Nvidia HairWorks Off) (ordenar por valor) | |
| HP Omen 15t-ce000 | |
| Lenovo Legion Y520-15IKBN 80WK0042GE | |
| Dell Inspiron 15 7000 7577 | |
| Gigabyte Aero 15 | |
| Acer Aspire VN7-593G-73HP V15 Nitro BE | |
| HP Omen 15-ce002ng | |
| Aorus X5 v7 | |
| HP Spectre x360 15t-bl100 | |
| bajo | medio | alto | ultra | 4K | |
|---|---|---|---|---|---|
| Dirt 3 (2011) | 140.1 | 126.3 | 112.2 | 64.5 | |
| Sleeping Dogs (2012) | 218.4 | 192.7 | 164.7 | 69.5 | |
| Hitman: Absolution (2012) | 105.8 | 101 | 88.7 | 70 | |
| Tomb Raider (2013) | 308.4 | 277.7 | 170.5 | 115.6 | |
| BioShock Infinite (2013) | 209 | 193.3 | 180.1 | 102.4 | |
| GRID 2 (2013) | 210.8 | 152.8 | 143.3 | 116.7 | |
| Company of Heroes 2 (2013) | 68.9 | 65.7 | 63.4 | 40 | |
| Thief (2014) | 117.2 | 112 | 107.6 | 69 | |
| Middle-earth: Shadow of Mordor (2014) | 170.2 | 139.9 | 96.7 | 76.9 | |
| The Witcher 3 (2015) | 172.3 | 133.8 | 68.5 | 35 | 23.7 |
| Rise of the Tomb Raider (2016) | 148.1 | 117.8 | 67.6 | 54.6 | 24 |
| Ashes of the Singularity (2016) | 75.8 | 62.2 | 53.2 | 20.8 | |
| Deus Ex Mankind Divided (2016) | 110.3 | 93 | 52 | 27.6 | 16.3 |
| Prey (2017) | 116 | 92.9 | 80.2 | 30.7 | |
| Ark Survival Evolved (2017) | 109 | 48 | 35.5 | 25.6 | 8.5 |
| Middle-earth: Shadow of War (2017) | 128 | 81 | 62 | 46 | 27 |
| ELEX (2017) | 108.1 | 83.5 | 69.6 | 57.2 | 17 |
Ruido
| Ocioso |
| 30.4 / 30.4 / 30.5 dB(A) |
| Carga |
| 38.5 / 49 dB(A) |
 | ||
30 dB silencioso 40 dB(A) audible 50 dB(A) ruidosamente alto |
||
min: | ||
| HP Omen 15t-ce000 GeForce GTX 1060 Max-Q, i7-7700HQ, Samsung PM961 NVMe MZVLW128HEGR | Lenovo Legion Y520-15IKBN 80WK0042GE GeForce GTX 1050 Ti Mobile, i5-7300HQ, Samsung PM961 NVMe MZVLW128HEGR | Dell Inspiron 15 7000 7577 GeForce GTX 1060 Max-Q, i5-7300HQ, Samsung PM961 MZVLW256HEHP | Gigabyte Aero 15 GeForce GTX 1060 Mobile, i7-7700HQ, Lite-On CX2-8B512-Q11 | Acer Aspire VN7-593G-73HP V15 Nitro BE GeForce GTX 1060 Mobile, i7-7700HQ, Seagate Mobile HDD 1TB ST1000LM035 | HP Omen 15-ce002ng GeForce GTX 1060 Max-Q, i7-7700HQ, Samsung PM961 MZVLW256HEHP | Aorus X5 v7 GeForce GTX 1070 Mobile, i7-7820HK, Toshiba NVMe THNSN5256GPU7 | |
|---|---|---|---|---|---|---|---|
| Noise | -1% | 7% | -7% | -5% | -8% | -18% | |
| apagado / medio ambiente * (dB) | 28.2 | 30.6 -9% | 28 1% | 31 -10% | 30.4 -8% | 30 -6% | 30 -6% |
| Idle Minimum * (dB) | 30.4 | 31.9 -5% | 28 8% | 32 -5% | 30.9 -2% | 30 1% | 35 -15% |
| Idle Average * (dB) | 30.4 | 31.9 -5% | 28 8% | 33 -9% | 30.9 -2% | 33 -9% | 36 -18% |
| Idle Maximum * (dB) | 30.5 | 31.9 -5% | 28 8% | 34 -11% | 31.5 -3% | 37 -21% | 40 -31% |
| Load Average * (dB) | 38.5 | 34.6 10% | 30.3 21% | 39 -1% | 40.7 -6% | 41 -6% | 43 -12% |
| Witcher 3 ultra * (dB) | 37.6 | 39.3 -5% | 39.5 -5% | 43 -14% | 45.5 -21% | 42 -12% | 49 -30% |
| Load Maximum * (dB) | 49 | 41.7 15% | 46.5 5% | 50 -2% | 43.9 10% | 50 -2% | 55 -12% |
* ... más pequeño es mejor
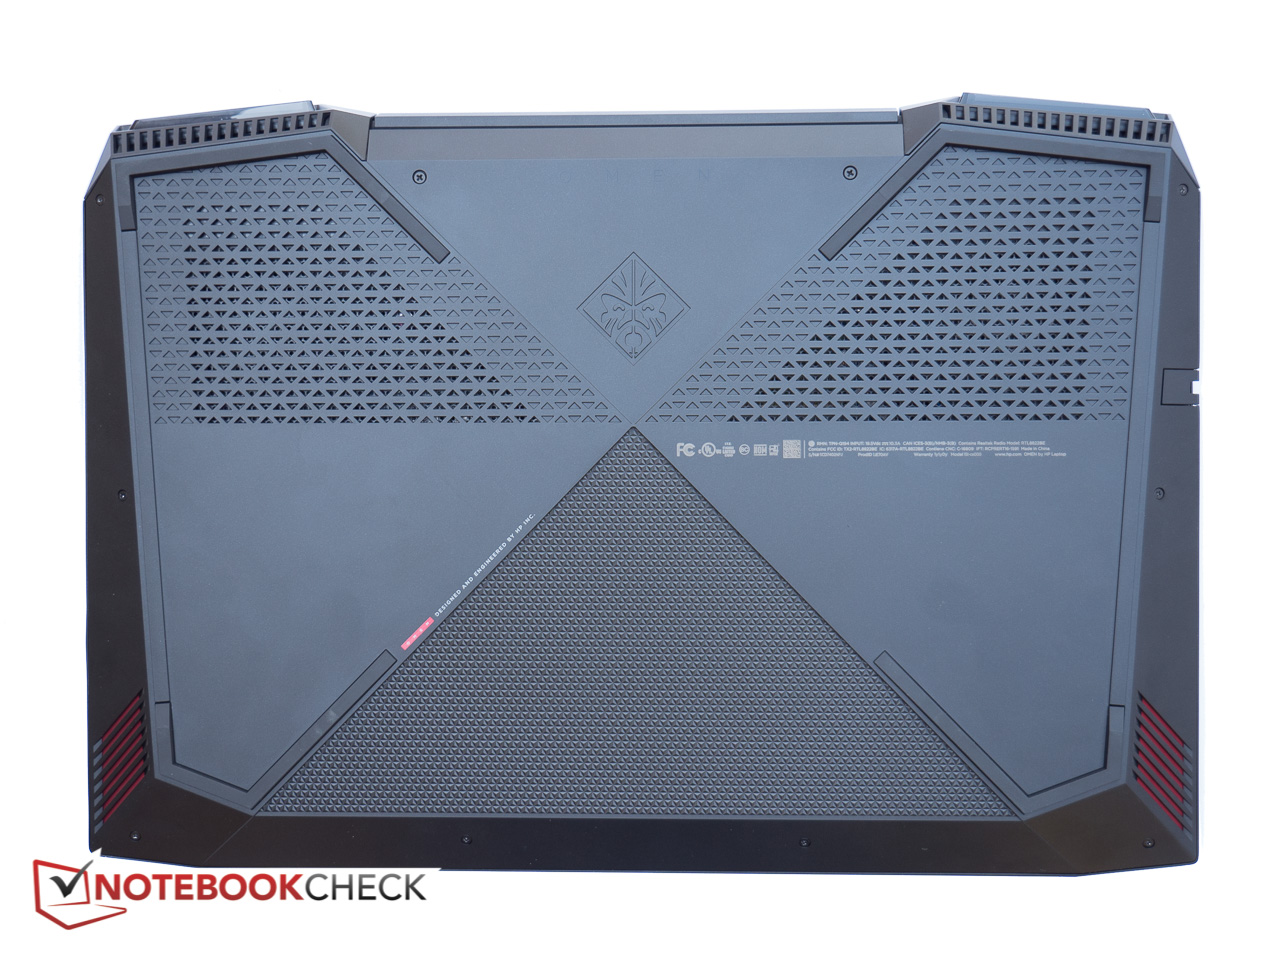
(-) La temperatura máxima en la parte superior es de 46 °C / 115 F, frente a la media de 40.4 °C / 105 F, que oscila entre 21.2 y 68.8 °C para la clase Gaming.
(-) El fondo se calienta hasta un máximo de 49.2 °C / 121 F, frente a la media de 43.2 °C / 110 F
(+) En reposo, la temperatura media de la parte superior es de 31.2 °C / 88# F, frente a la media del dispositivo de 33.9 °C / 93 F.
(±) Jugando a The Witcher 3, la temperatura media de la parte superior es de 36.2 °C / 97 F, frente a la media del dispositivo de 33.9 °C / 93 F.
(+) El reposamanos y el panel táctil están a una temperatura inferior a la de la piel, con un máximo de 31 °C / 87.8 F y, por tanto, son fríos al tacto.
(-) La temperatura media de la zona del reposamanos de dispositivos similares fue de 28.8 °C / 83.8 F (-2.2 °C / -4 F).
HP Omen 15t-ce000 análisis de audio
(-) | altavoces no muy altos (#65.4 dB)
Graves 100 - 315 Hz
(±) | lubina reducida - en promedio 13.8% inferior a la mediana
(-) | los graves no son lineales (15.7% delta a la frecuencia anterior)
Medios 400 - 2000 Hz
(+) | medios equilibrados - a sólo 3.3% de la mediana
(±) | la linealidad de los medios es media (10.4% delta respecto a la frecuencia anterior)
Altos 2 - 16 kHz
(+) | máximos equilibrados - a sólo 3.8% de la mediana
(±) | la linealidad de los máximos es media (7.2% delta a frecuencia anterior)
Total 100 - 16.000 Hz
(±) | la linealidad del sonido global es media (21.7% de diferencia con la mediana)
En comparación con la misma clase
» 78% de todos los dispositivos probados de esta clase eran mejores, 5% similares, 17% peores
» El mejor tuvo un delta de 6%, la media fue 18%, el peor fue ###max##%
En comparación con todos los dispositivos probados
» 62% de todos los dispositivos probados eran mejores, 7% similares, 31% peores
» El mejor tuvo un delta de 4%, la media fue 23%, el peor fue ###max##%
Apple MacBook 12 (Early 2016) 1.1 GHz análisis de audio
(+) | los altavoces pueden reproducir a un volumen relativamente alto (#83.6 dB)
Graves 100 - 315 Hz
(±) | lubina reducida - en promedio 11.3% inferior a la mediana
(±) | la linealidad de los graves es media (14.2% delta a frecuencia anterior)
Medios 400 - 2000 Hz
(+) | medios equilibrados - a sólo 2.4% de la mediana
(+) | los medios son lineales (5.5% delta a la frecuencia anterior)
Altos 2 - 16 kHz
(+) | máximos equilibrados - a sólo 2% de la mediana
(+) | los máximos son lineales (4.5% delta a la frecuencia anterior)
Total 100 - 16.000 Hz
(+) | el sonido global es lineal (10.2% de diferencia con la mediana)
En comparación con la misma clase
» 7% de todos los dispositivos probados de esta clase eran mejores, 2% similares, 90% peores
» El mejor tuvo un delta de 5%, la media fue 18%, el peor fue ###max##%
En comparación con todos los dispositivos probados
» 5% de todos los dispositivos probados eran mejores, 1% similares, 94% peores
» El mejor tuvo un delta de 4%, la media fue 23%, el peor fue ###max##%
| Off / Standby | |
| Ocioso | |
| Carga |
|
Clave:
min: | |
| HP Omen 15t-ce000 i7-7700HQ, GeForce GTX 1060 Max-Q, Samsung PM961 NVMe MZVLW128HEGR, IPS, 3840x2160, 15.6" | Lenovo Legion Y520-15IKBN 80WK0042GE i5-7300HQ, GeForce GTX 1050 Ti Mobile, Samsung PM961 NVMe MZVLW128HEGR, IPS, 1920x1080, 15.6" | Dell Inspiron 15 7000 7577 i5-7300HQ, GeForce GTX 1060 Max-Q, Samsung PM961 MZVLW256HEHP, IPS, 1920x1080, 15.6" | Gigabyte Aero 15 i7-7700HQ, GeForce GTX 1060 Mobile, Lite-On CX2-8B512-Q11, IPS, 1920x1080, 15.6" | Acer Aspire VN7-593G-73HP V15 Nitro BE i7-7700HQ, GeForce GTX 1060 Mobile, Seagate Mobile HDD 1TB ST1000LM035, AH-IPS, Normally Black, Transmissive, 1920x1080, 15.6" | HP Omen 15-ce002ng i7-7700HQ, GeForce GTX 1060 Max-Q, Samsung PM961 MZVLW256HEHP, IPS, 1920x1080, 15.6" | Aorus X5 v7 i7-7820HK, GeForce GTX 1070 Mobile, Toshiba NVMe THNSN5256GPU7, IPS, 3840x2160, 15.6" | |
|---|---|---|---|---|---|---|---|
| Power Consumption | 39% | 39% | 4% | 15% | -13% | -58% | |
| Idle Minimum * (Watt) | 15.4 | 5.2 66% | 7.1 54% | 12 22% | 7.2 53% | 18 -17% | 26 -69% |
| Idle Average * (Watt) | 22.4 | 8.3 63% | 7.6 66% | 15 33% | 10.5 53% | 23 -3% | 31 -38% |
| Idle Maximum * (Watt) | 22.4 | 10.1 55% | 8.6 62% | 20 11% | 16 29% | 30 -34% | 36 -61% |
| Load Average * (Watt) | 78.1 | 62.7 20% | 59.5 24% | 82 -5% | 82 -5% | 85 -9% | 93 -19% |
| Witcher 3 ultra * (Watt) | 97.5 | 94 4% | 89 9% | 111 -14% | 124 -27% | 96 2% | 176 -81% |
| Load Maximum * (Watt) | 133.52 | 100 25% | 112.8 16% | 161 -21% | 155 -16% | 158 -18% | 240 -80% |
* ... más pequeño es mejor
| HP Omen 15t-ce000 i7-7700HQ, GeForce GTX 1060 Max-Q, 70 Wh | Lenovo Legion Y520-15IKBN 80WK0042GE i5-7300HQ, GeForce GTX 1050 Ti Mobile, 45 Wh | Dell Inspiron 15 7000 7577 i5-7300HQ, GeForce GTX 1060 Max-Q, 56 Wh | Gigabyte Aero 15 i7-7700HQ, GeForce GTX 1060 Mobile, 94.24 Wh | Acer Aspire VN7-593G-73HP V15 Nitro BE i7-7700HQ, GeForce GTX 1060 Mobile, 69 Wh | HP Omen 15-ce002ng i7-7700HQ, GeForce GTX 1060 Max-Q, 70 Wh | Aorus X5 v7 i7-7820HK, GeForce GTX 1070 Mobile, 94 Wh | |
|---|---|---|---|---|---|---|---|
| Duración de Batería | 54% | 77% | 83% | 70% | -9% | -20% | |
| Reader / Idle (h) | 5 | 10.6 112% | 11 120% | 10.6 112% | 8.4 68% | 4.3 -14% | 3.5 -30% |
| WiFi v1.3 (h) | 3.5 | 5.2 49% | 6.9 97% | 7 100% | 6 71% | 3.3 -6% | 2.5 -29% |
| Load (h) | 1.4 | 1.4 0% | 1.6 14% | 1.9 36% | 2.4 71% | 1.3 -7% | 1.4 0% |
Pro
Contra


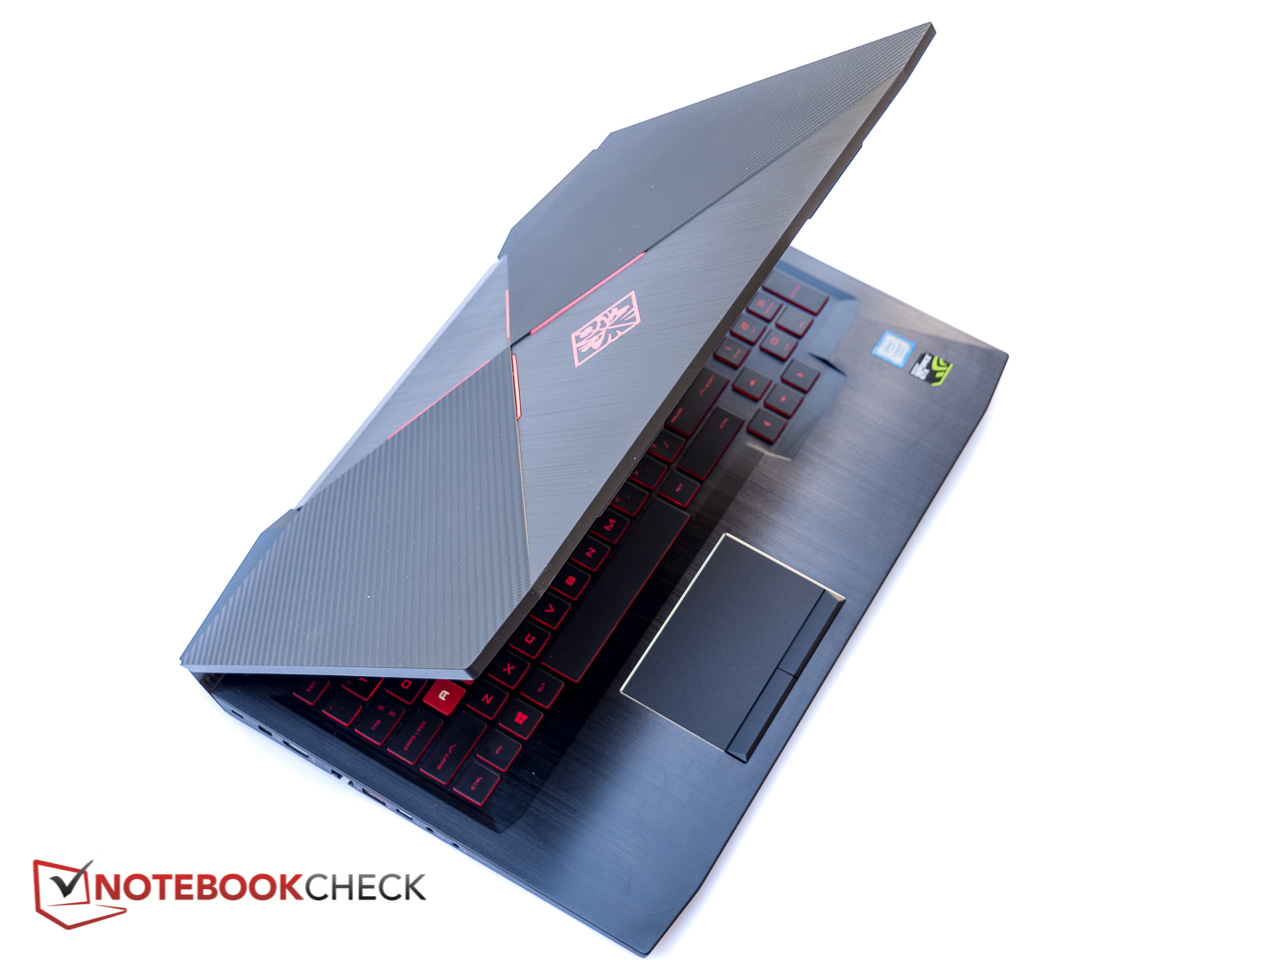
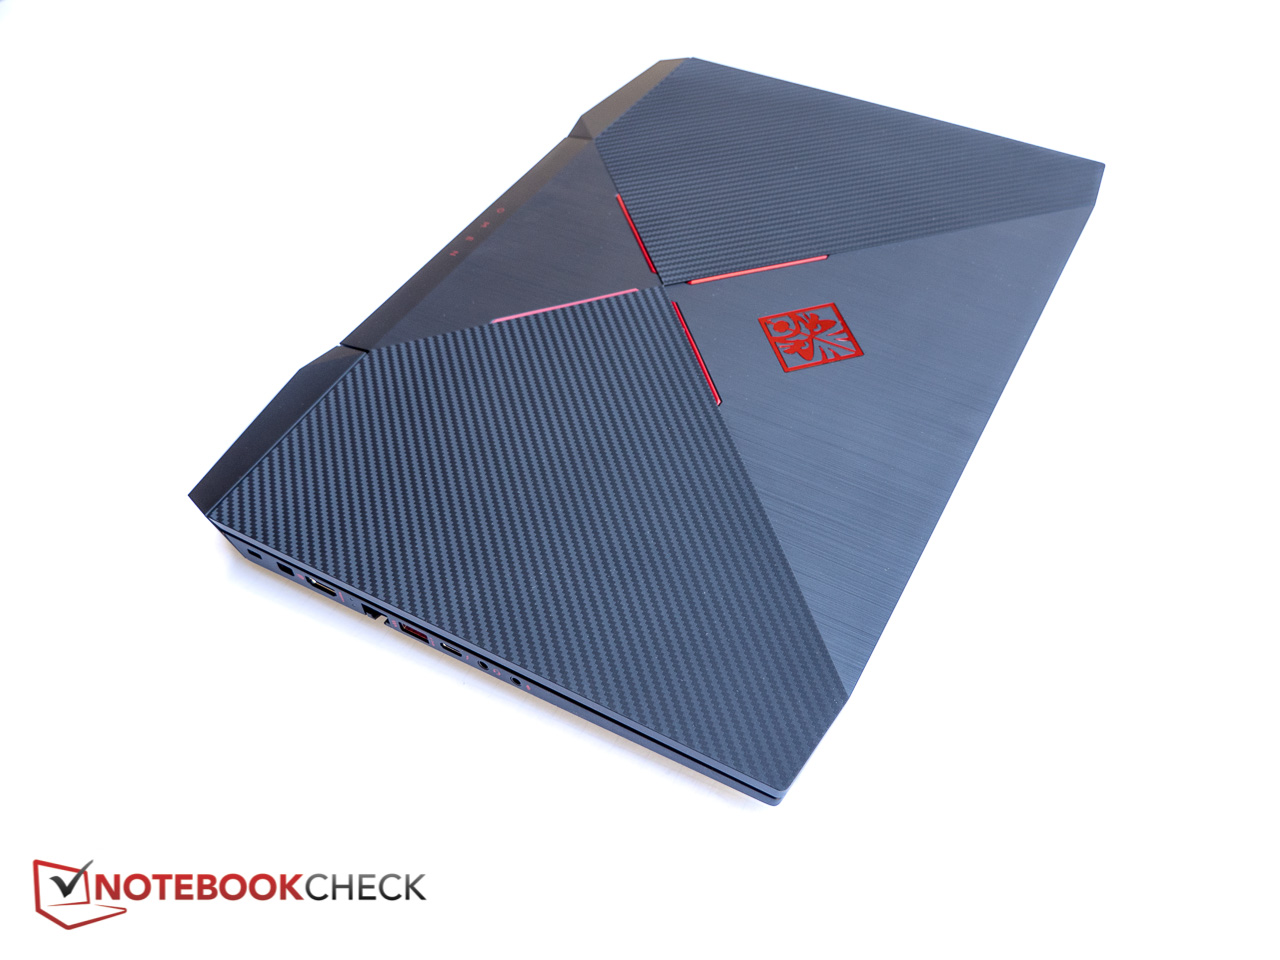
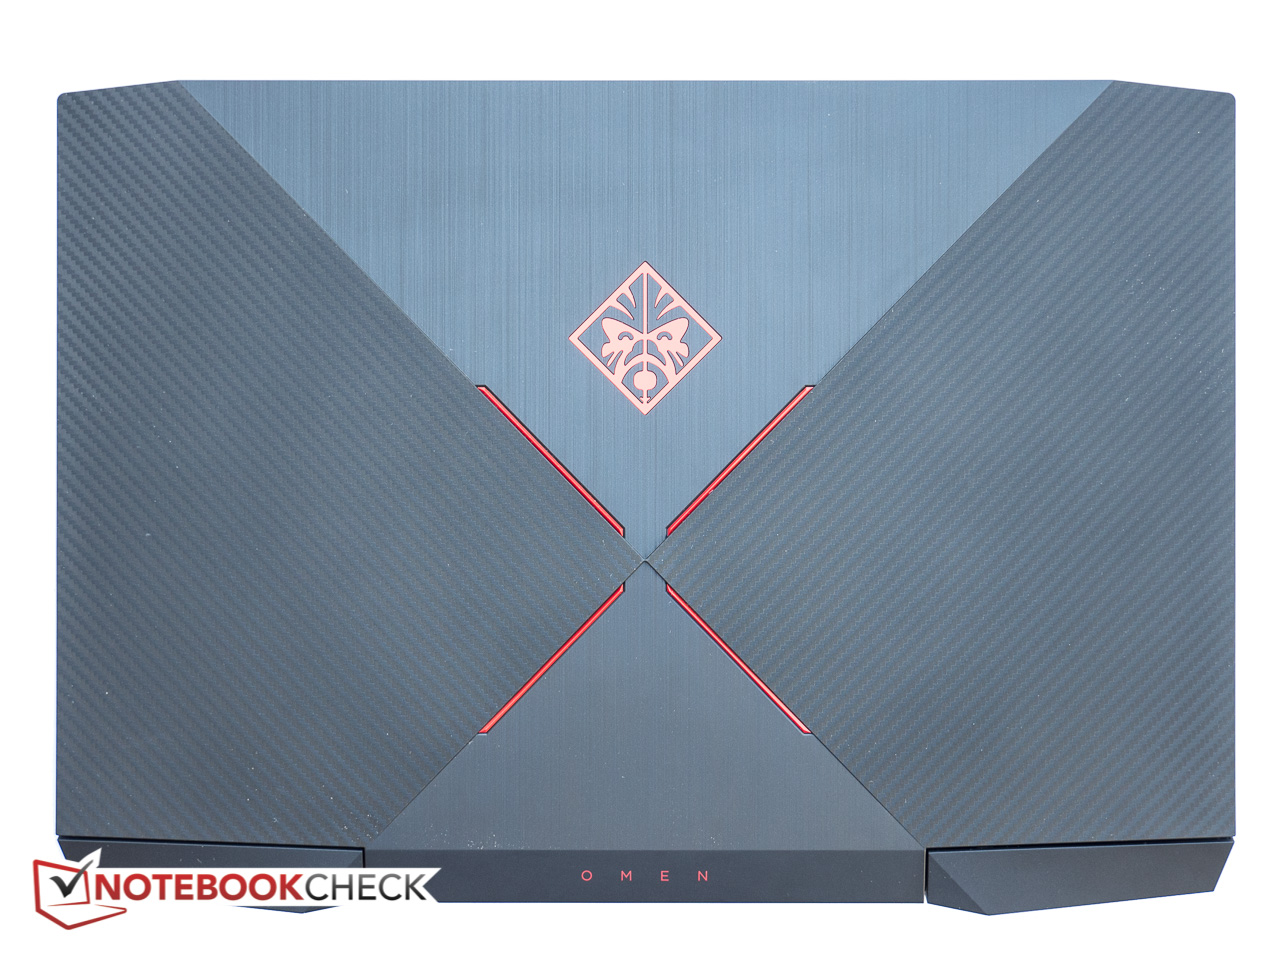
No es muy difícil encontrarle fallos a los portátiles gaming más baratos, ya que el fabricante tiene que hacer equilibrios entre materiales relativamente baratos, buen aspecto, y hardware bastante potente para poder atraer al mayor número de usuarios posibles. Estamos tentados de criticar al Omen 15 por su concha metálica superior de bordes afilados, el notable sangrado de pantalla, o el molesto ventilador. Pero ninguno de los defectos es para echarse atrás en lo que a un sistema gaming se refiere: con todo, el HP Omen 15 es un sistema Max-Q asequible con bastantes redaños para manejar muchos títulos actuales al menos a Full HD.
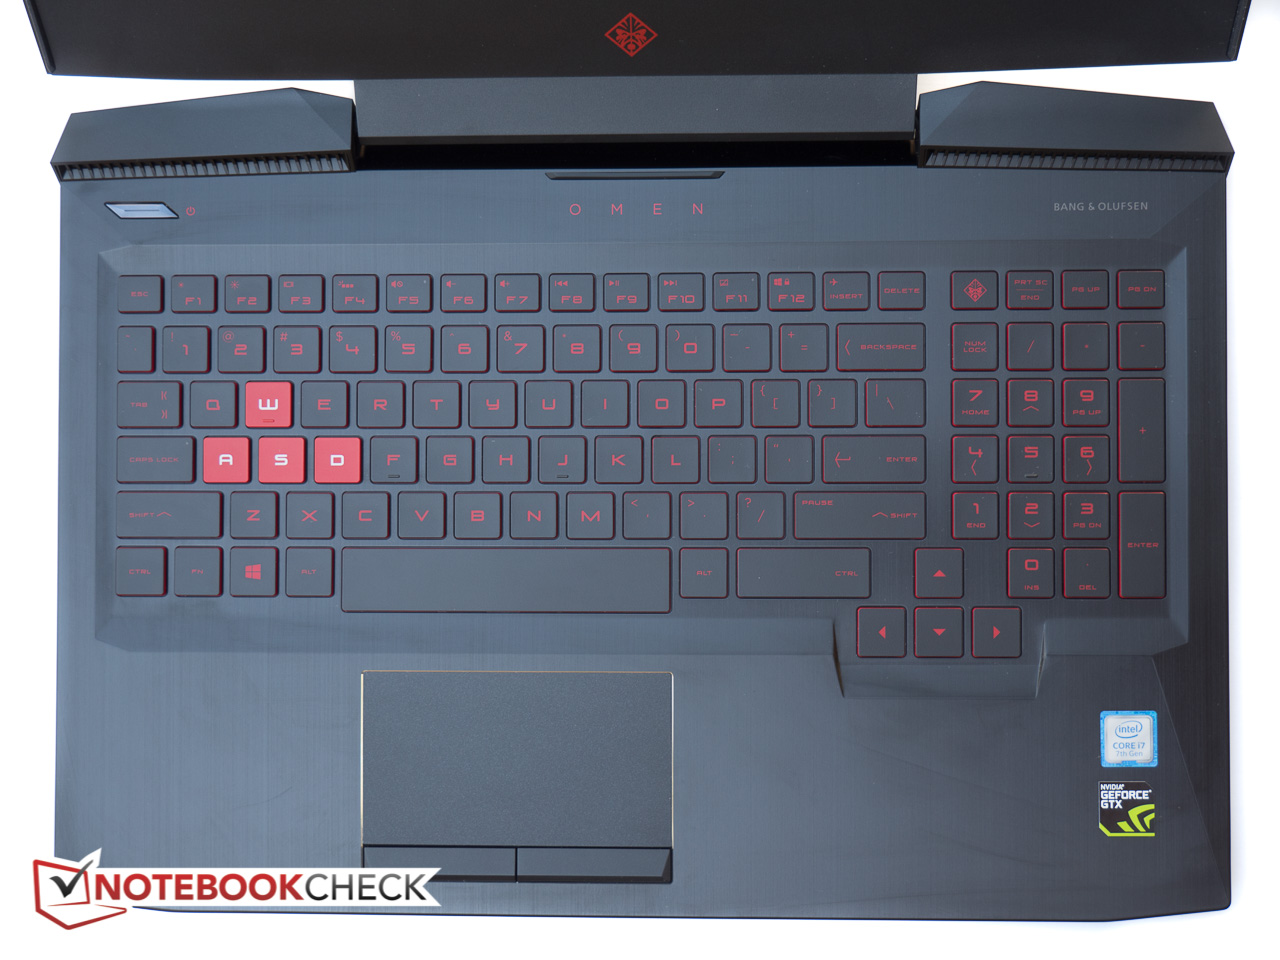
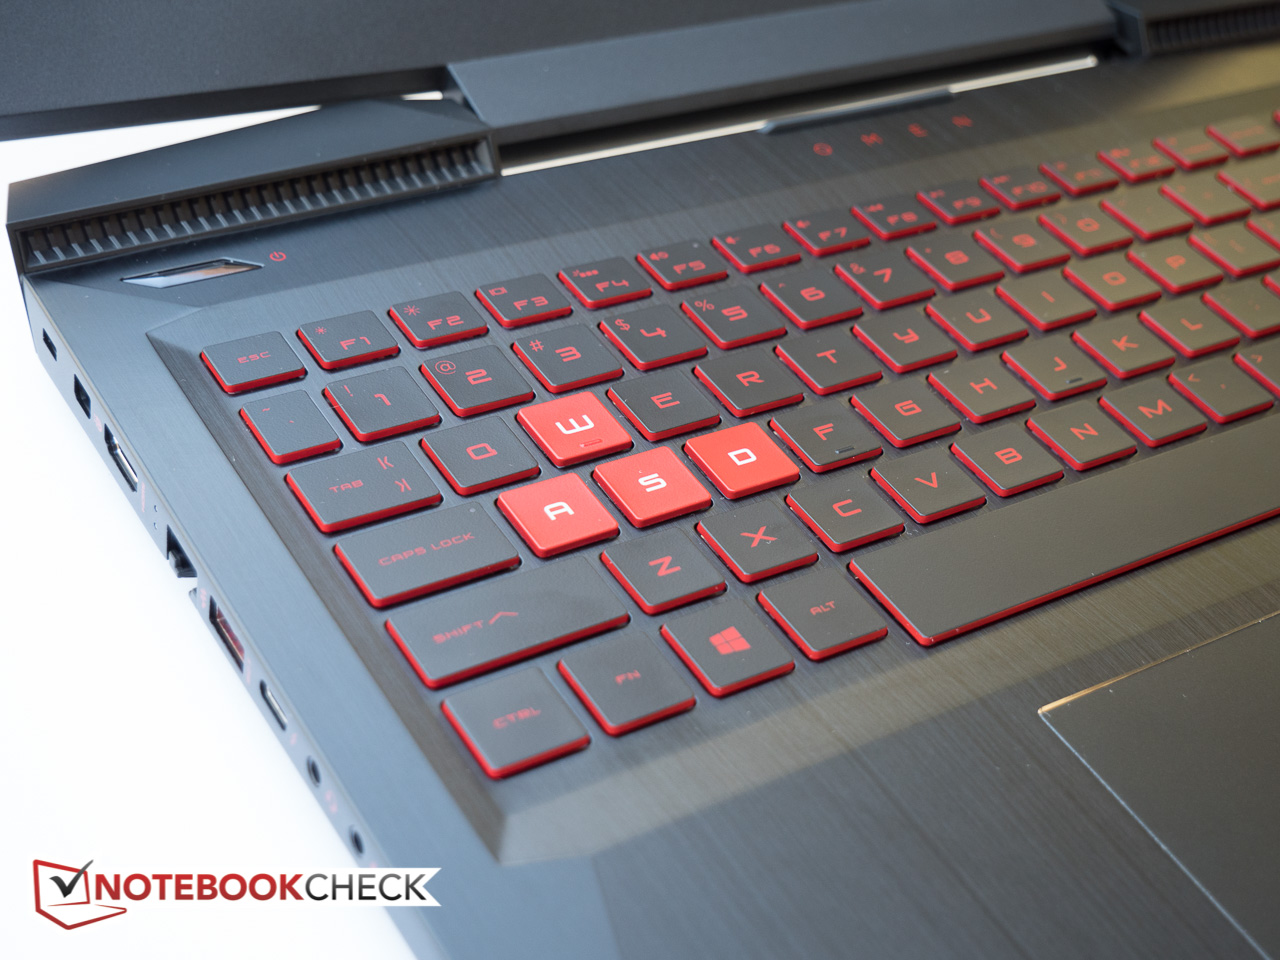
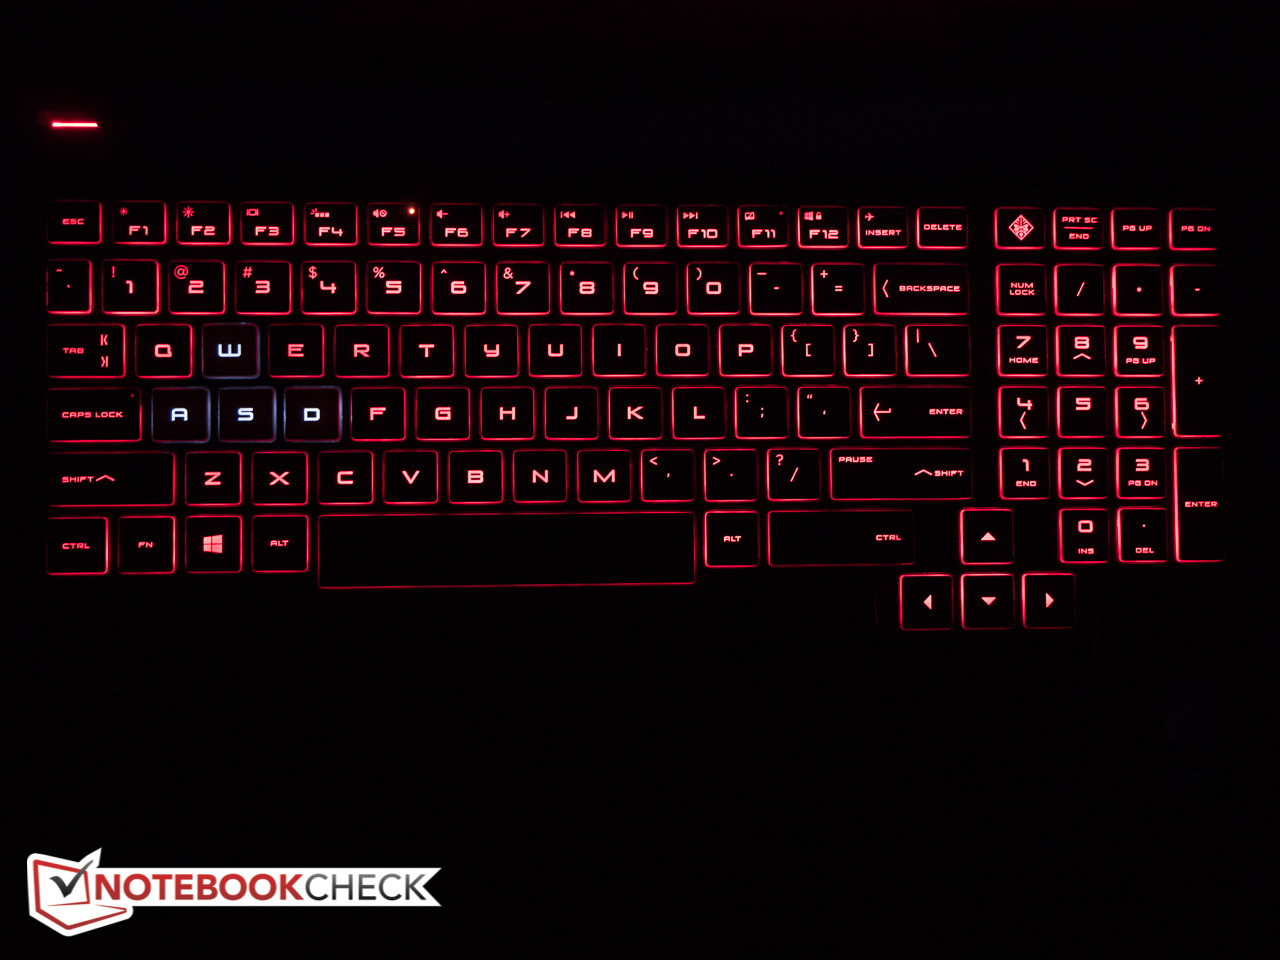
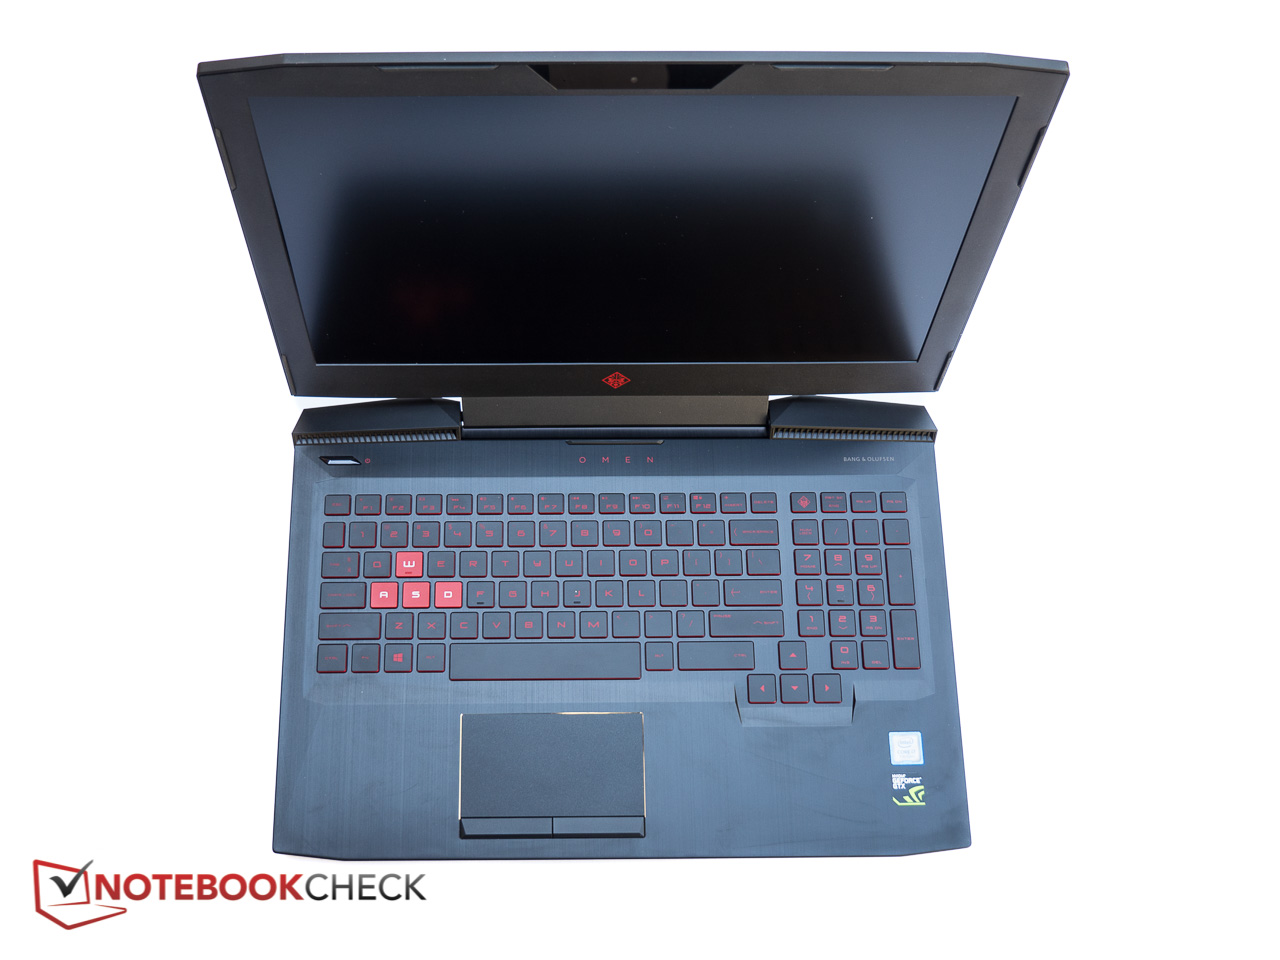
El diseño más reciente con su estilo más descarado puede que no sea del gusto de todos, pero no cabe duda que la calidad de la construcción en sí es decente con buena rigidez torsional de la base y un lecho de teclado que no cede apenas. Los dispositivos de entrada funcionan bien, el hardware tiene potencia, y el brillante display UHD IPS - especialmente después del calibrado - es bastante increíble para el precio. El Omen 15 se calienta bastante, pero no tanto como otros sistemas. Los ventiladores, empero, son bastante molestos, ya que giran frecuentemente, y suelen producir un sonido oscilante que pone los nervios de punta.
Los usuarios que busquen un portátil gaming asequible de gama baja-media con display 4K deberían tener en su lista de candidatos al Omen 15.
El Dell Inspiron 15 tiene un display inferior, pero un rendimiento muy decente y aguanta el doble con una carga de batería.
Ésta es una versión acortada del análisis original. Puedes leer el análisis completo en inglés aquí.
HP Omen 15t-ce000
- 12/01/2017 v6 (old)
Bernhard Pechlaner
Price comparison
