Breve análisis del portátil Alienware 15 R3 (i7-7820HK, GTX 1080 Max-Q, Full-HD)
| Networking | |
| iperf3 transmit AX12 | |
| Alienware 15 R3 Max-Q | |
| Alienware 15 R3 | |
| Acer Predator Triton 700 | |
| Aorus X5 v7 | |
| Eurocom Q5 | |
| iperf3 receive AX12 | |
| Alienware 15 R3 Max-Q | |
| Acer Predator Triton 700 | |
| Alienware 15 R3 | |
| Eurocom Q5 | |
| Aorus X5 v7 | |
| |||||||||||||||||||||||||
iluminación: 89 %
Brillo con batería: 306 cd/m²
Contraste: 1093:1 (Negro: 0.28 cd/m²)
ΔE ColorChecker Calman: 5.45 | ∀{0.5-29.43 Ø4.71}
ΔE Greyscale Calman: 4.9 | ∀{0.09-98 Ø4.96}
83% sRGB (Argyll 1.6.3 3D)
54% AdobeRGB 1998 (Argyll 1.6.3 3D)
60.6% AdobeRGB 1998 (Argyll 3D)
82.9% sRGB (Argyll 3D)
64.3% Display P3 (Argyll 3D)
Gamma: 2.49
CCT: 7062 K
| Alienware 15 R3 Max-Q LG Philips LP156WF6 (LGD049B), 1920x1080, 15.6" | Alienware 15 R3 HPJGK_B156HTN (AUO51ED), 1920x1080, 15.6" | Acer Predator Triton 700 AUO B156HAN04.2 (AUO42ED), 1920x1080, 15.6" | Aorus X5 v7 AU Optronics B156ZAN02.3 (AUO23EB), 3840x2160, 15.6" | Eurocom Q5 ID: LGD04D4, Name: LG Philips LP156UD1-SPB1, 3840x2160, 15.6" | |
|---|---|---|---|---|---|
| Display | 7% | 3% | 7% | 5% | |
| Display P3 Coverage (%) | 64.3 | 66 3% | 62.5 -3% | 65.3 2% | 63 -2% |
| sRGB Coverage (%) | 82.9 | 90.5 9% | 88.7 7% | 91.9 11% | 92.7 12% |
| AdobeRGB 1998 Coverage (%) | 60.6 | 66.2 9% | 63.5 5% | 66.3 9% | 64.4 6% |
| Response Times | 47% | -9% | -2% | 8% | |
| Response Time Grey 50% / Grey 80% * (ms) | 40 ? | 25 ? 37% | 44.8 ? -12% | 44 ? -10% | 32.4 ? 19% |
| Response Time Black / White * (ms) | 28 ? | 12 ? 57% | 29.6 ? -6% | 26.4 ? 6% | 28.8 ? -3% |
| PWM Frequency (Hz) | 21100 ? | ||||
| Screen | -26% | -1% | 4% | -16% | |
| Brightness middle (cd/m²) | 306 | 386 26% | 291 -5% | 307 0% | 287.5 -6% |
| Brightness (cd/m²) | 297 | 382 29% | 277 -7% | 297 0% | 279 -6% |
| Brightness Distribution (%) | 89 | 93 4% | 84 -6% | 92 3% | 87 -2% |
| Black Level * (cd/m²) | 0.28 | 0.39 -39% | 0.22 21% | 0.3 -7% | 0.65 -132% |
| Contrast (:1) | 1093 | 990 -9% | 1323 21% | 1023 -6% | 442 -60% |
| Colorchecker dE 2000 * | 5.45 | 10.2 -87% | 5.52 -1% | 4.72 13% | 4.5 17% |
| Colorchecker dE 2000 max. * | 9.45 | 15.81 -67% | 10.72 -13% | 8.07 15% | 8.9 6% |
| Greyscale dE 2000 * | 4.9 | 11.28 -130% | 6.59 -34% | 4.79 2% | 4.6 6% |
| Gamma | 2.49 88% | 2.23 99% | 2.44 90% | 2.42 91% | 2.39 92% |
| CCT | 7062 92% | 11383 57% | 7816 83% | 7690 85% | 7393 88% |
| Color Space (Percent of AdobeRGB 1998) (%) | 54 | 59 9% | 58 7% | 60 11% | 59 9% |
| Color Space (Percent of sRGB) (%) | 83 | 90 8% | 89 7% | 92 11% | 92.3 11% |
| Media total (Programa/Opciones) | 9% /
-9% | -2% /
-1% | 3% /
4% | -1% /
-8% |
* ... más pequeño es mejor
Parpadeo de Pantalla / PWM (Pulse-Width Modulation)
| Parpadeo de Pantalla / PWM detectado | 21100 Hz | ≤ 95 % de brillo | 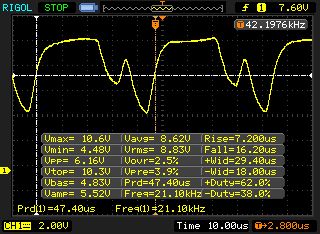 |
La retroiluminación del display parpadea a 21100 Hz (seguramente usa PWM - Pulse-Width Modulation) a un brillo del 95 % e inferior. Sobre este nivel de brillo no debería darse parpadeo / PWM. La frecuencia de 21100 Hz es bastante alta, por lo que la mayoría de gente sensible al parpadeo no debería ver parpadeo o tener fatiga visual. Comparación: 52 % de todos los dispositivos testados no usaron PWM para atenuar el display. Si se usó, medimos una media de 7754 (mínimo: 5 - máxmo: 343500) Hz. | |||
Tiempos de respuesta del display
| ↔ Tiempo de respuesta de Negro a Blanco | ||
|---|---|---|
| 28 ms ... subida ↗ y bajada ↘ combinada | ↗ 16 ms subida | 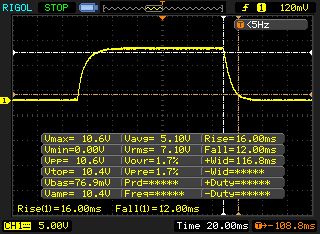 |
| ↘ 12 ms bajada | ||
| La pantalla mostró tiempos de respuesta relativamente lentos en nuestros tests pero podría ser demasiado lenta para los jugones. En comparación, todos los dispositivos de prueba van de ##min### (mínimo) a 240 (máximo) ms. » 71 % de todos los dispositivos son mejores. Eso quiere decir que el tiempo de respuesta es peor que la media (19.8 ms) de todos los dispositivos testados. | ||
| ↔ Tiempo de respuesta 50% Gris a 80% Gris | ||
| 40 ms ... subida ↗ y bajada ↘ combinada | ↗ 19.6 ms subida | 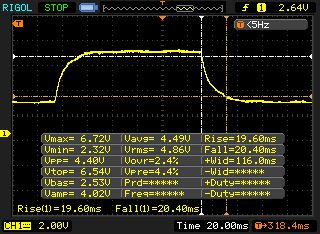 |
| ↘ 20.4 ms bajada | ||
| La pantalla mostró tiempos de respuesta lentos en nuestros tests y podría ser demasiado lenta para los jugones. En comparación, todos los dispositivos de prueba van de ##min### (mínimo) a 636 (máximo) ms. » 61 % de todos los dispositivos son mejores. Eso quiere decir que el tiempo de respuesta es peor que la media (31 ms) de todos los dispositivos testados. | ||
| Cinebench R15 | |
| CPU Single 64Bit | |
| Aorus X5 v7 | |
| Alienware 15 R3 Max-Q | |
| Alienware 15 R3 | |
| Acer Predator Triton 700 | |
| Eurocom Q5 | |
| CPU Multi 64Bit | |
| Aorus X5 v7 | |
| Alienware 15 R3 Max-Q | |
| Eurocom Q5 | |
| Alienware 15 R3 | |
| Acer Predator Triton 700 | |
| Cinebench R10 | |
| Rendering Single 32Bit | |
| Alienware 15 R3 Max-Q | |
| Eurocom Q5 | |
| Rendering Multiple CPUs 32Bit | |
| Alienware 15 R3 Max-Q | |
| Eurocom Q5 | |
| Geekbench 3 | |
| 32 Bit Multi-Core Score | |
| Alienware 15 R3 Max-Q | |
| 32 Bit Single-Core Score | |
| Alienware 15 R3 Max-Q | |
| Geekbench 4.0 | |
| 64 Bit Multi-Core Score | |
| Alienware 15 R3 Max-Q | |
| 64 Bit Single-Core Score | |
| Alienware 15 R3 Max-Q | |
| Geekbench 4.4 | |
| 64 Bit Multi-Core Score | |
| Alienware 15 R3 Max-Q | |
| 64 Bit Single-Core Score | |
| Alienware 15 R3 Max-Q | |
| JetStream 1.1 - 1.1 Total | |
| Alienware 15 R3 Max-Q | |
| Eurocom Q5 | |
| PCMark 7 Score | 6972 puntos | |
| PCMark 8 Home Score Accelerated v2 | 5121 puntos | |
| PCMark 8 Creative Score Accelerated v2 | 7892 puntos | |
| PCMark 8 Work Score Accelerated v2 | 5305 puntos | |
| PCMark 10 Score | 5295 puntos | |
ayuda | ||
| PCMark 8 | |
| Home Score Accelerated v2 | |
| Acer Predator Triton 700 | |
| Alienware 15 R3 Max-Q | |
| Alienware 15 R3 | |
| Aorus X5 v7 | |
| Eurocom Q5 | |
| Work Score Accelerated v2 | |
| Alienware 15 R3 Max-Q | |
| Alienware 15 R3 | |
| Acer Predator Triton 700 | |
| Eurocom Q5 | |

| Alienware 15 R3 Max-Q LiteOn CX2-8B256 | Aorus X5 v7 Toshiba NVMe THNSN5256GPU7 | Alienware 15 R3 | |
|---|---|---|---|
| CrystalDiskMark 3.0 | 19% | -20% | |
| Read Seq (MB/s) | 1840 | 1479 -20% | 1123 -39% |
| Write Seq (MB/s) | 802 | 1076 34% | 429.2 -46% |
| Read 512 (MB/s) | 944 | 1086 15% | 833 -12% |
| Write 512 (MB/s) | 671 | 1101 64% | 428.1 -36% |
| Read 4k (MB/s) | 43.03 | 44 2% | 37.8 -12% |
| Write 4k (MB/s) | 141 | 137.8 -2% | 122.9 -13% |
| Read 4k QD32 (MB/s) | 595 | 697 17% | 542 -9% |
| Write 4k QD32 (MB/s) | 403.6 | 556 38% | 429.8 6% |
| 3DMark 06 Standard Score | 31555 puntos | |
| 3DMark 11 Performance | 17829 puntos | |
| 3DMark Ice Storm Standard Score | 134673 puntos | |
| 3DMark Cloud Gate Standard Score | 28375 puntos | |
| 3DMark Fire Strike Score | 14631 puntos | |
| 3DMark Fire Strike Extreme Score | 7998 puntos | |
| 3DMark Time Spy Score | 5793 puntos | |
ayuda | ||
| 3DMark 11 - 1280x720 Performance GPU | |
| Guru Mars K | |
| MSI GT75VR 7RF-012 Titan Pro | |
| Alienware 15 R3 Max-Q | |
| Acer Predator Triton 700 | |
| Alienware 15 R3 | |
| Aorus X5 v7 | |
| Eurocom Q5 | |
| 3DMark - 1920x1080 Fire Strike Graphics | |
| Guru Mars K | |
| MSI GT75VR 7RF-012 Titan Pro | |
| Alienware 15 R3 Max-Q | |
| Acer Predator Triton 700 | |
| Alienware 15 R3 | |
| Aorus X5 v7 | |
| Eurocom Q5 | |
| The Witcher 3 - 1920x1080 Ultra Graphics & Postprocessing (HBAO+) | |
| MSI GT75VR 7RF-012 Titan Pro | |
| Guru Mars K | |
| Razer Blade Pro 2017 | |
| Alienware 15 R3 Max-Q | |
| Acer Predator Triton 700 | |
| Aorus X5 v7 | |
| Eurocom Q5 | |
| Prey - 1920x1080 Very High Preset AA:2TX SM AF:16x | |
| Alienware 15 R3 Max-Q | |
| Guru Mars K | |
| Eurocom Q5 | |
| MSI GT75VR 7RF-012 Titan Pro | |
| Acer Predator Triton 700 | |
| Razer Blade Pro 2017 | |
| BioShock Infinite - 1920x1080 Ultra Preset, DX11 (DDOF) | |
| Alienware 15 R3 Max-Q | |
| Eurocom Q5 | |
| Ghost Recon Wildlands - 1920x1080 Ultra Preset AA:T AF:16x | |
| Guru Mars K | |
| MSI GT75VR 7RF-012 Titan Pro | |
| Razer Blade Pro 2017 | |
| Alienware 15 R3 Max-Q | |
| Acer Predator Triton 700 | |
| bajo | medio | alto | ultra | |
|---|---|---|---|---|
| Tomb Raider (2013) | 486.5 | 461.9 | 419.2 | 230.4 |
| BioShock Infinite (2013) | 272.3 | 243.6 | 232 | 151.7 |
| The Witcher 3 (2015) | 278.6 | 201.6 | 122.4 | 64.2 |
| For Honor (2017) | 229.6 | 161.2 | 152.9 | 121.3 |
| Ghost Recon Wildlands (2017) | 131.7 | 101.4 | 94.9 | 54.6 |
| Prey (2017) | 141.7 | 142 | 139.8 | 140.8 |
| Middle-earth: Shadow of War (2017) | 146 | 132 | 111 | 88 |
| The Evil Within 2 (2017) | 90.1 | 66.6 | 64 | 62.6 |
Ruido
| Ocioso |
| 32 / 33 / 35 dB(A) |
| HDD |
| 33 dB(A) |
| Carga |
| 46 / 50 dB(A) |
 | ||
30 dB silencioso 40 dB(A) audible 50 dB(A) ruidosamente alto |
||
min: | ||
| Alienware 15 R3 Max-Q i7-7820HK, GeForce GTX 1080 Max-Q | Acer Predator Triton 700 i7-7700HQ, GeForce GTX 1080 Max-Q | Aorus X5 v7 i7-7820HK, GeForce GTX 1070 Mobile | Eurocom Q5 i7-7700HQ, GeForce GTX 1070 Max-Q | Alienware 15 R3 i7-7700HQ, GeForce GTX 1070 Mobile | Guru Mars K i7-7700, GeForce GTX 1080 Mobile | MSI GT75VR 7RF-012 Titan Pro i7-7820HK, GeForce GTX 1080 Mobile | |
|---|---|---|---|---|---|---|---|
| Noise | -0% | -6% | 2% | -4% | -7% | -8% | |
| apagado / medio ambiente * (dB) | 29 | 31 -7% | 30 -3% | 29 -0% | 30 -3% | 29 -0% | 30 -3% |
| Idle Minimum * (dB) | 32 | 33 -3% | 35 -9% | 31.5 2% | 31 3% | 36 -13% | 33 -3% |
| Idle Average * (dB) | 33 | 34 -3% | 36 -9% | 33.8 -2% | 32 3% | 37 -12% | 34 -3% |
| Idle Maximum * (dB) | 35 | 40 -14% | 40 -14% | 33.8 3% | 42 -20% | 40 -14% | 38 -9% |
| Load Average * (dB) | 46 | 41 11% | 43 7% | 41.7 9% | 49 -7% | 45 2% | 44 4% |
| Witcher 3 ultra * (dB) | 48 | 43 10% | 49 -2% | 41.7 13% | 50 -4% | 56 -17% | |
| Load Maximum * (dB) | 50 | 48 4% | 55 -10% | 54.2 -8% | 50 -0% | 55 -10% | 62 -24% |
* ... más pequeño es mejor
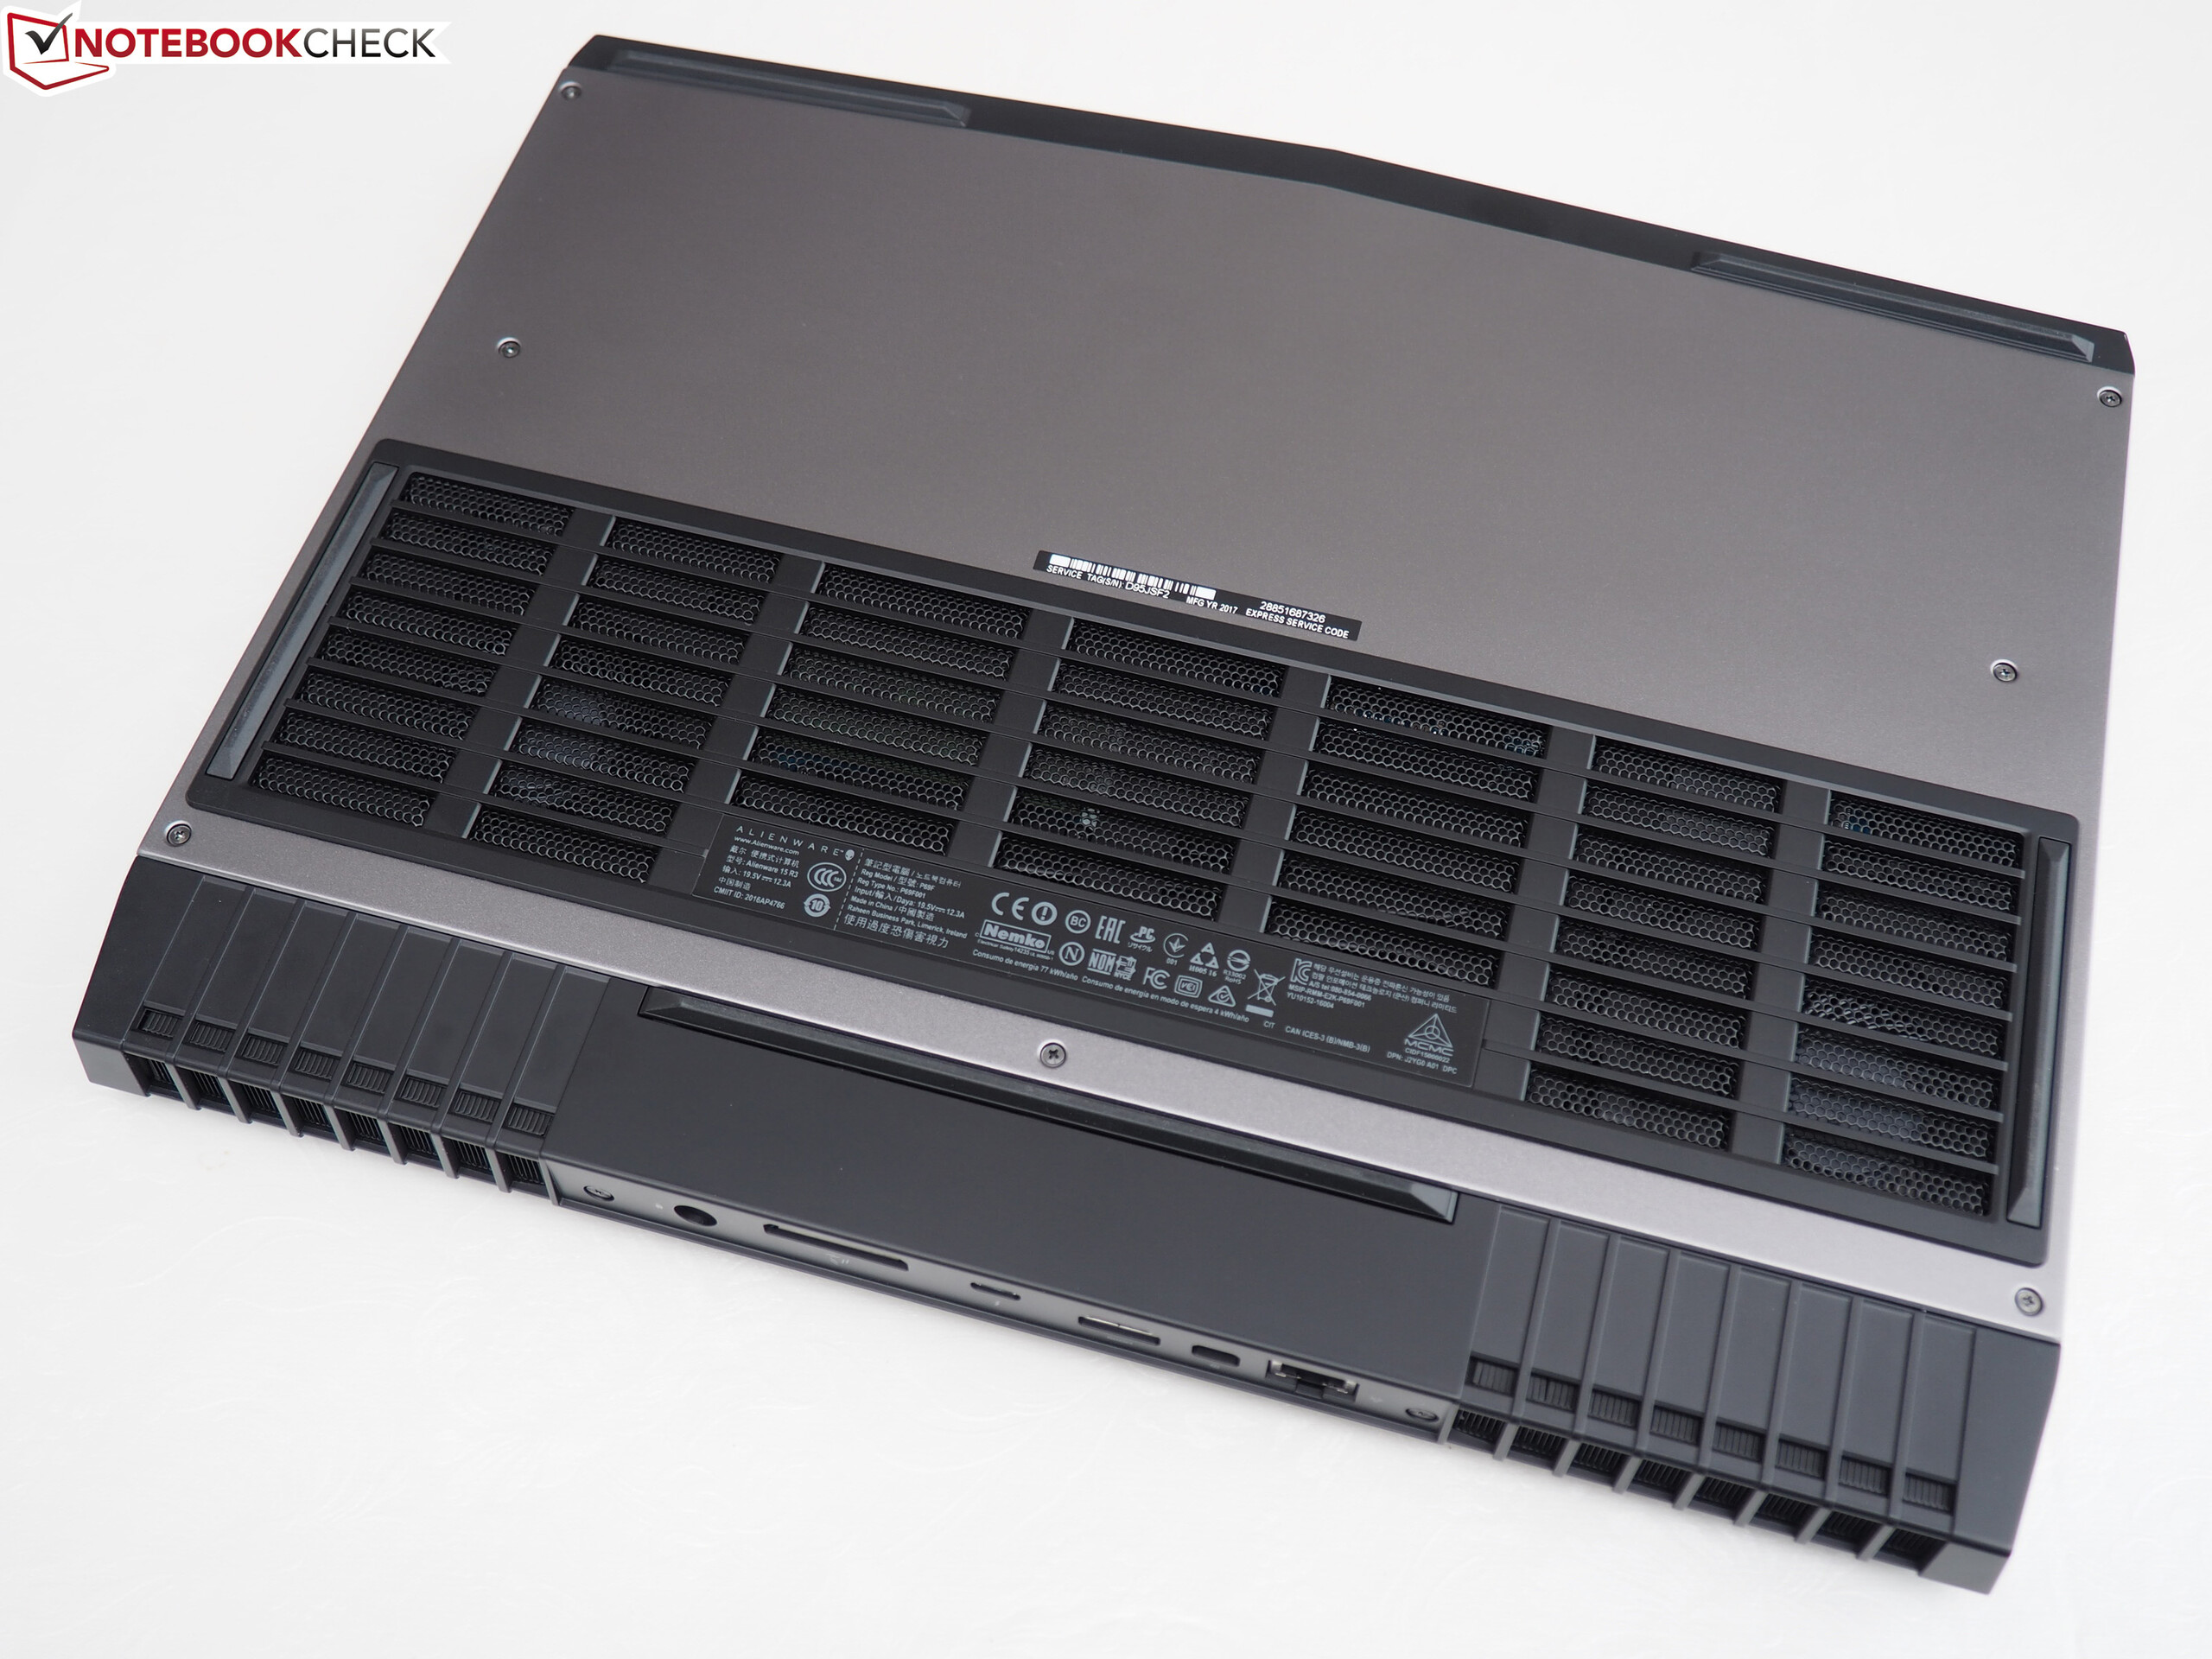
(-) La temperatura máxima en la parte superior es de 47 °C / 117 F, frente a la media de 40.4 °C / 105 F, que oscila entre 21.2 y 68.8 °C para la clase Gaming.
(-) El fondo se calienta hasta un máximo de 55 °C / 131 F, frente a la media de 43.2 °C / 110 F
(+) En reposo, la temperatura media de la parte superior es de 31.7 °C / 89# F, frente a la media del dispositivo de 33.9 °C / 93 F.
(-) Jugando a The Witcher 3, la temperatura media de la parte superior es de 38.2 °C / 101 F, frente a la media del dispositivo de 33.9 °C / 93 F.
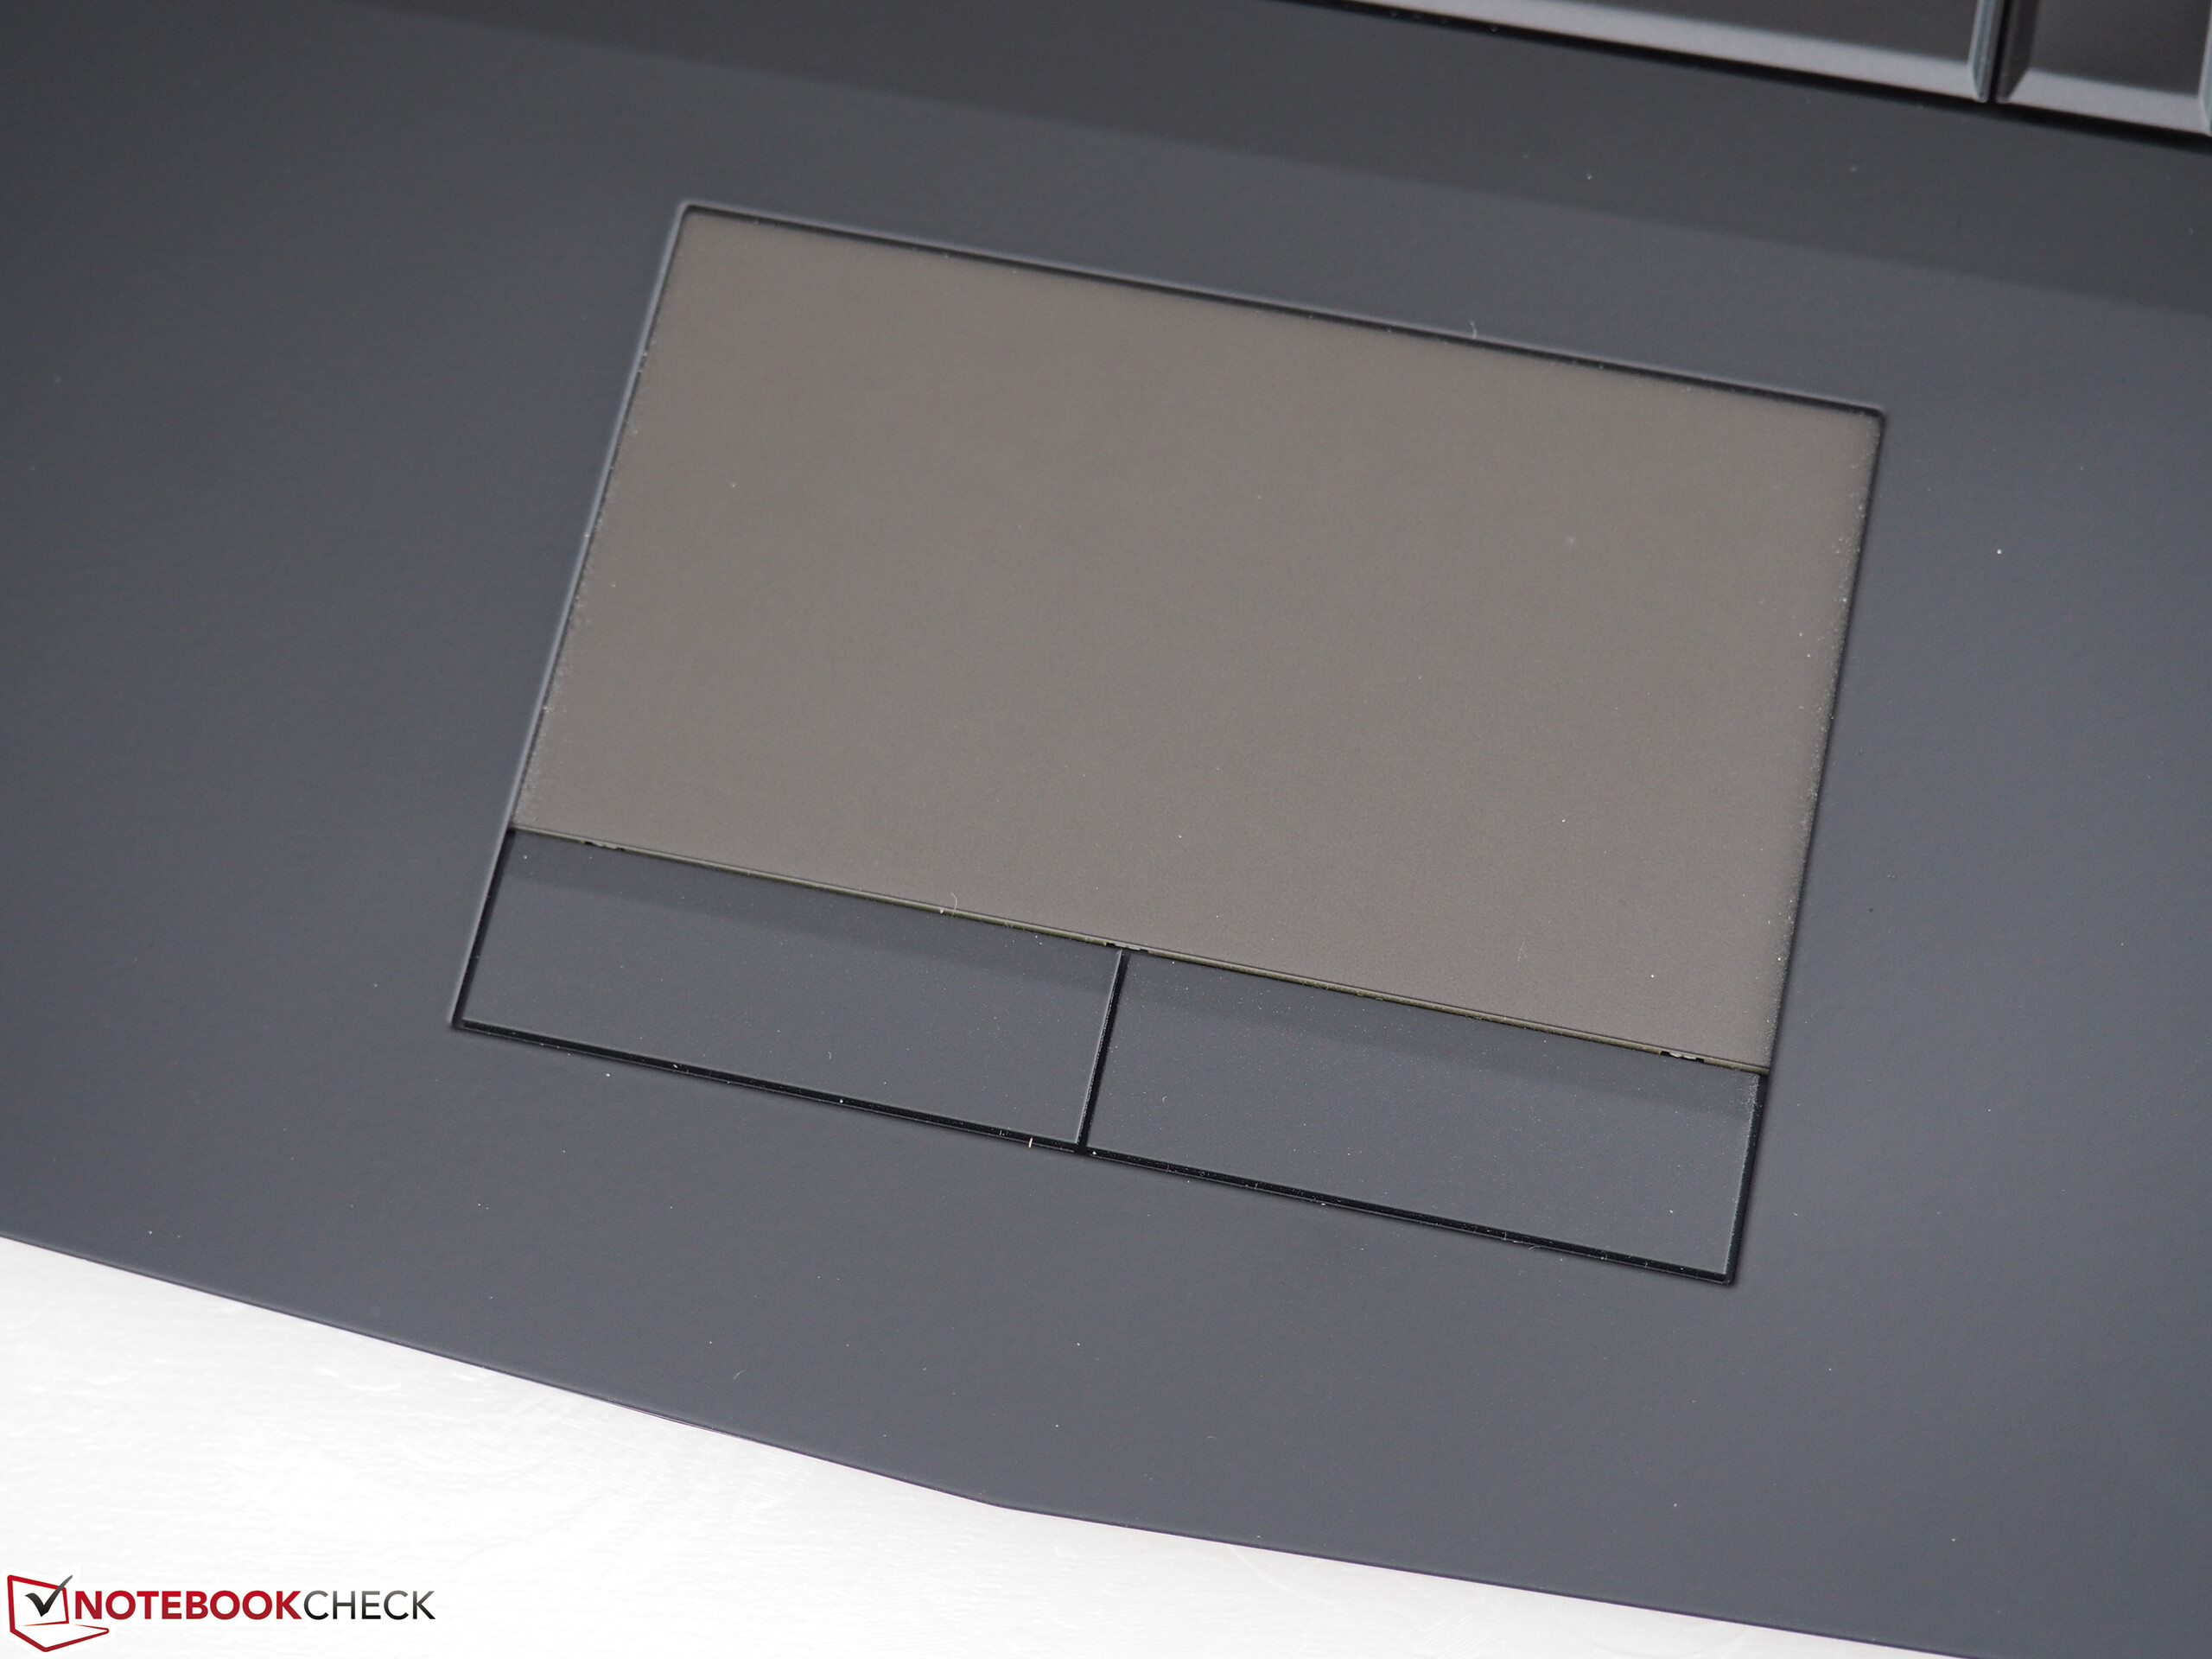
(+) El reposamanos y el panel táctil están a una temperatura inferior a la de la piel, con un máximo de 27 °C / 80.6 F y, por tanto, son fríos al tacto.
(±) La temperatura media de la zona del reposamanos de dispositivos similares fue de 28.8 °C / 83.8 F (+1.8 °C / 3.2 F).
| Alienware 15 R3 Max-Q i7-7820HK, GeForce GTX 1080 Max-Q | Acer Predator Triton 700 i7-7700HQ, GeForce GTX 1080 Max-Q | Aorus X5 v7 i7-7820HK, GeForce GTX 1070 Mobile | Eurocom Q5 i7-7700HQ, GeForce GTX 1070 Max-Q | Alienware 15 R3 i7-7700HQ, GeForce GTX 1070 Mobile | Guru Mars K i7-7700, GeForce GTX 1080 Mobile | MSI GT75VR 7RF-012 Titan Pro i7-7820HK, GeForce GTX 1080 Mobile | |
|---|---|---|---|---|---|---|---|
| Heat | -5% | 1% | 4% | 2% | 12% | 3% | |
| Maximum Upper Side * (°C) | 47 | 61 -30% | 64 -36% | 56.2 -20% | 46 2% | 46 2% | 46 2% |
| Maximum Bottom * (°C) | 55 | 69 -25% | 56 -2% | 61.2 -11% | 51.8 6% | 46 16% | 57 -4% |
| Idle Upper Side * (°C) | 36 | 29 19% | 29 19% | 27.8 23% | 36.5 -1% | 32 11% | 34 6% |
| Idle Bottom * (°C) | 38 | 32 16% | 30 21% | 29.6 22% | 38.2 -1% | 31 18% | 35 8% |
* ... más pequeño es mejor
Alienware 15 R3 Max-Q análisis de audio
(+) | los altavoces pueden reproducir a un volumen relativamente alto (#87 dB)
Graves 100 - 315 Hz
(-) | casi sin bajos - de media 17.1% inferior a la mediana
(±) | la linealidad de los graves es media (11% delta a frecuencia anterior)
Medios 400 - 2000 Hz
(±) | medias más altas - de media 6.6% más altas que la mediana
(+) | los medios son lineales (4.7% delta a la frecuencia anterior)
Altos 2 - 16 kHz
(+) | máximos equilibrados - a sólo 3% de la mediana
(+) | los máximos son lineales (4.3% delta a la frecuencia anterior)
Total 100 - 16.000 Hz
(±) | la linealidad del sonido global es media (15.2% de diferencia con la mediana)
En comparación con la misma clase
» 33% de todos los dispositivos probados de esta clase eran mejores, 6% similares, 61% peores
» El mejor tuvo un delta de 6%, la media fue 18%, el peor fue ###max##%
En comparación con todos los dispositivos probados
» 22% de todos los dispositivos probados eran mejores, 4% similares, 74% peores
» El mejor tuvo un delta de 4%, la media fue 23%, el peor fue ###max##%
Aorus X5 v7 análisis de audio
(±) | la sonoridad del altavoz es media pero buena (78 dB)
Graves 100 - 315 Hz
(-) | casi sin bajos - de media 19% inferior a la mediana
(±) | la linealidad de los graves es media (10.6% delta a frecuencia anterior)
Medios 400 - 2000 Hz
(+) | medios equilibrados - a sólo 4.2% de la mediana
(+) | los medios son lineales (5.8% delta a la frecuencia anterior)
Altos 2 - 16 kHz
(+) | máximos equilibrados - a sólo 2.1% de la mediana
(+) | los máximos son lineales (5.4% delta a la frecuencia anterior)
Total 100 - 16.000 Hz
(±) | la linealidad del sonido global es media (18.7% de diferencia con la mediana)
En comparación con la misma clase
» 62% de todos los dispositivos probados de esta clase eran mejores, 8% similares, 30% peores
» El mejor tuvo un delta de 6%, la media fue 18%, el peor fue ###max##%
En comparación con todos los dispositivos probados
» 43% de todos los dispositivos probados eran mejores, 8% similares, 49% peores
» El mejor tuvo un delta de 4%, la media fue 23%, el peor fue ###max##%
| Off / Standby | |
| Ocioso | |
| Carga |
|
Clave:
min: | |
| Alienware 15 R3 Max-Q i7-7820HK, GeForce GTX 1080 Max-Q | Acer Predator Triton 700 i7-7700HQ, GeForce GTX 1080 Max-Q | Aorus X5 v7 i7-7820HK, GeForce GTX 1070 Mobile | Eurocom Q5 i7-7700HQ, GeForce GTX 1070 Max-Q | Alienware 15 R3 i7-7700HQ, GeForce GTX 1070 Mobile | Guru Mars K i7-7700, GeForce GTX 1080 Mobile | MSI GT75VR 7RF-012 Titan Pro i7-7820HK, GeForce GTX 1080 Mobile | |
|---|---|---|---|---|---|---|---|
| Power Consumption | -15% | -13% | 35% | 10% | -43% | -50% | |
| Idle Minimum * (Watt) | 22 | 28 -27% | 26 -18% | 9 59% | 19 14% | 31 -41% | 34 -55% |
| Idle Average * (Watt) | 26 | 33 -27% | 31 -19% | 13.5 48% | 23 12% | 37 -42% | 41 -58% |
| Idle Maximum * (Watt) | 33 | 41 -24% | 36 -9% | 13.7 58% | 29 12% | 44 -33% | 50 -52% |
| Load Average * (Watt) | 86 | 94 -9% | 93 -8% | 87.8 -2% | 85 1% | 116 -35% | 106 -23% |
| Witcher 3 ultra * (Watt) | 159 | 160 -1% | 176 -11% | 129 19% | 259 -63% | 257 -62% | |
| Load Maximum * (Watt) | 215 | 222 -3% | 240 -12% | 158.6 26% | 192 11% | 312 -45% | 320 -49% |
* ... más pequeño es mejor
| Alienware 15 R3 Max-Q i7-7820HK, GeForce GTX 1080 Max-Q, 99 Wh | Alienware 15 R3 i7-7700HQ, GeForce GTX 1070 Mobile, 99 Wh | Acer Predator Triton 700 i7-7700HQ, GeForce GTX 1080 Max-Q, 54 Wh | Aorus X5 v7 i7-7820HK, GeForce GTX 1070 Mobile, 94 Wh | Eurocom Q5 i7-7700HQ, GeForce GTX 1070 Max-Q, 55 Wh | |
|---|---|---|---|---|---|
| Duración de Batería | -13% | -56% | -44% | -23% | |
| Reader / Idle (h) | 7.1 | 6.4 -10% | 2.5 -65% | 3.5 -51% | 7.8 10% |
| H.264 (h) | 5 | 4.4 -12% | 1.8 -64% | 2.7 -46% | |
| WiFi v1.3 (h) | 5.4 | 4.4 -19% | 2.4 -56% | 2.5 -54% | 4.3 -20% |
| Load (h) | 1.9 | 1.7 -11% | 1.2 -37% | 1.4 -26% | 0.8 -58% |
Pro
Contra
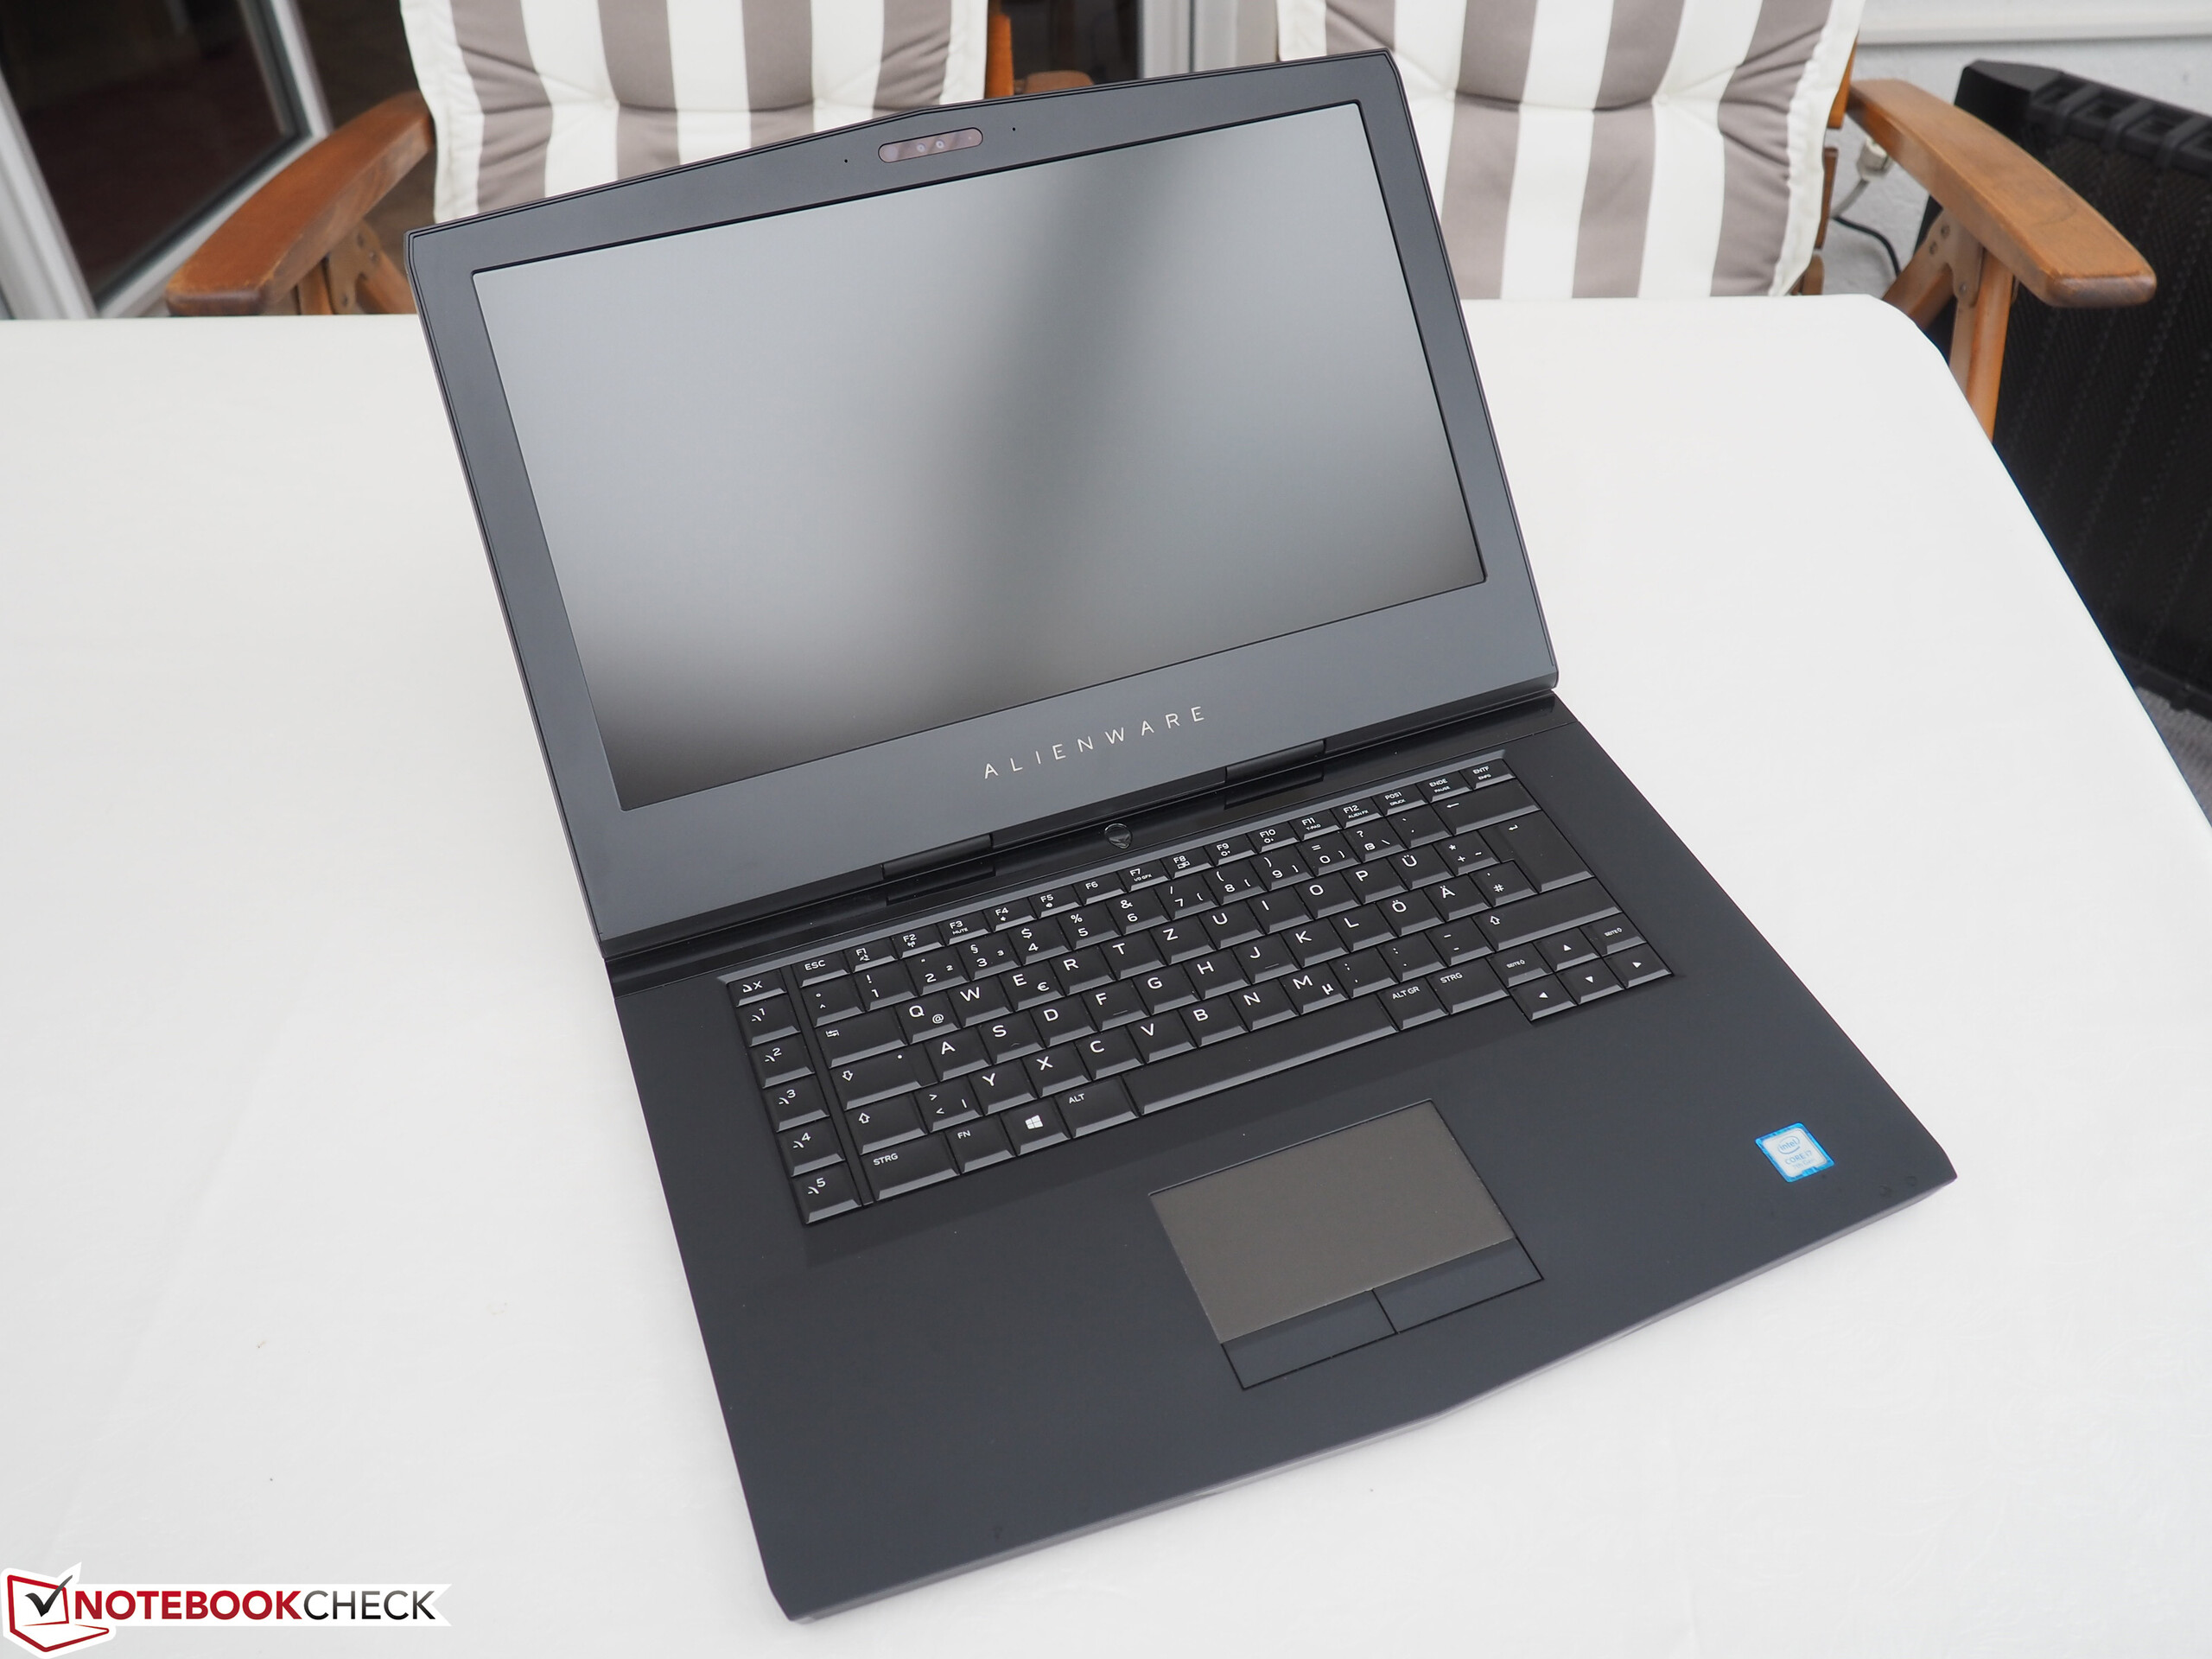
El Alienware 15 R3 muestra todos los juegos de ordenador actuales sin problemas en su pantalla mate FHD.
Sin compromisos: todos los juegos se ejecutan sin problemas en la configuración de calidad máxima.
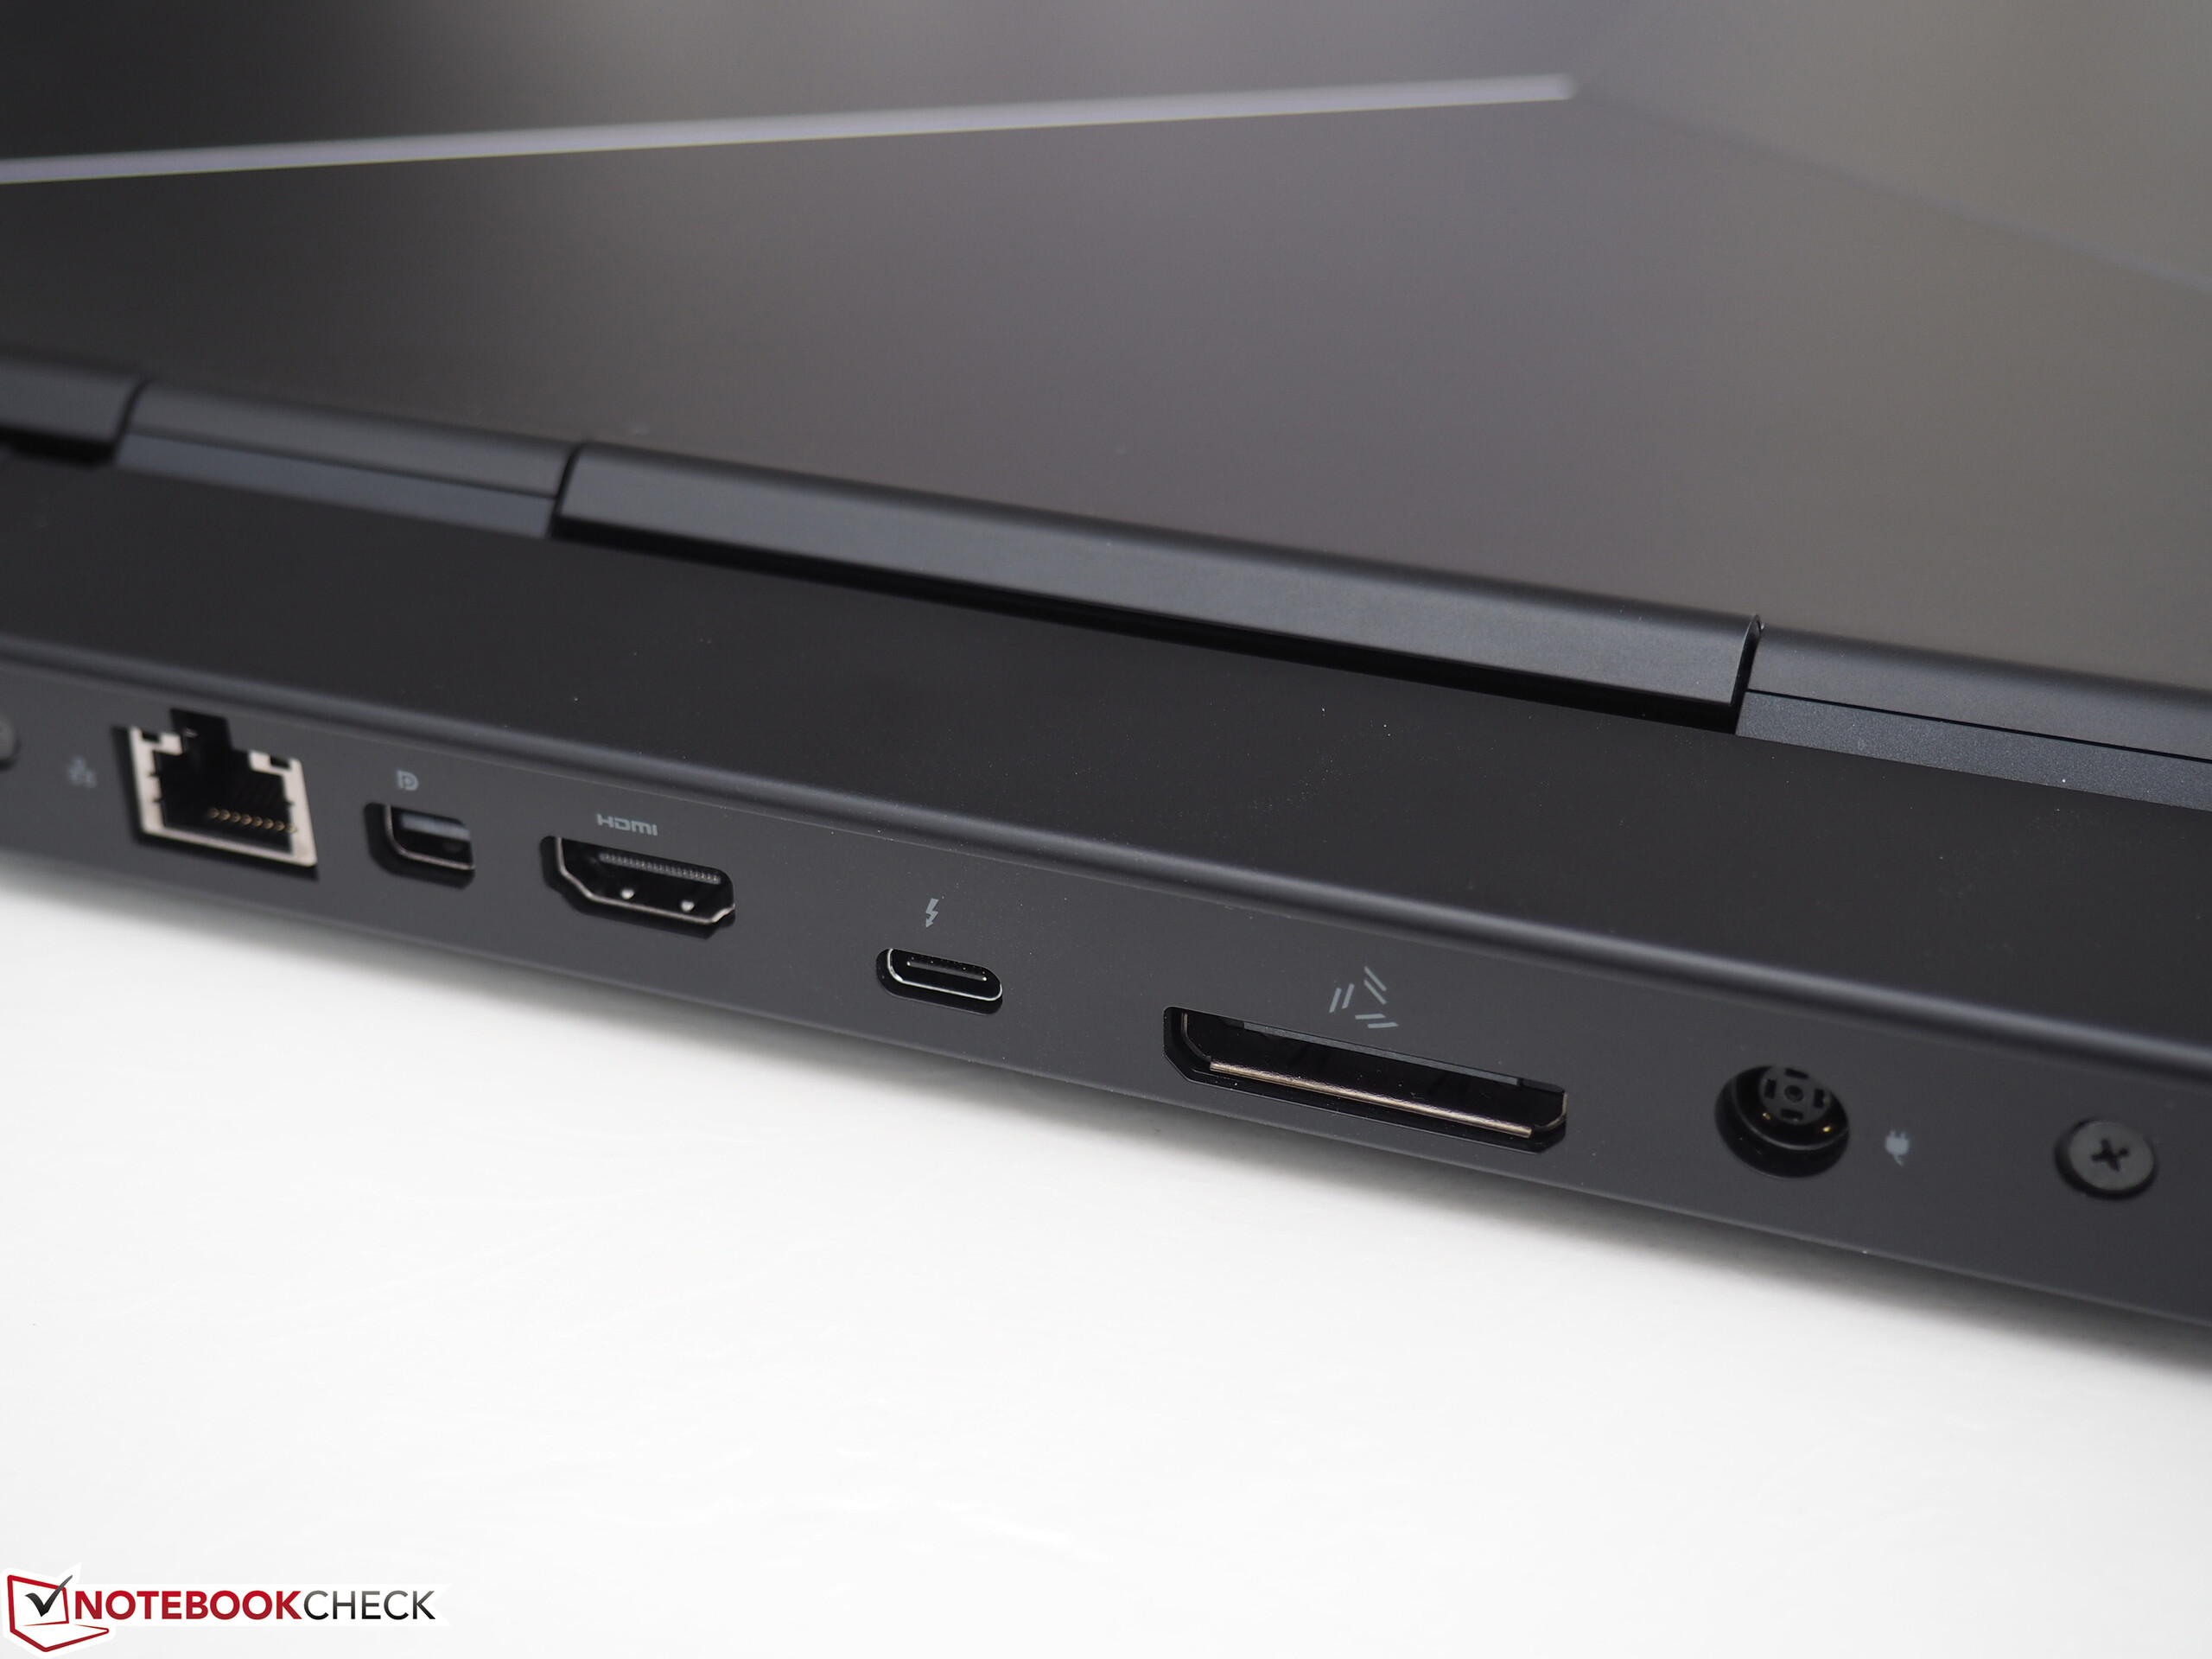
Si la GPU se queda anticuada algún día, puede conectar una GPU externa a través del puerto Thunderbolt 3 o el amplificador de gráficos.
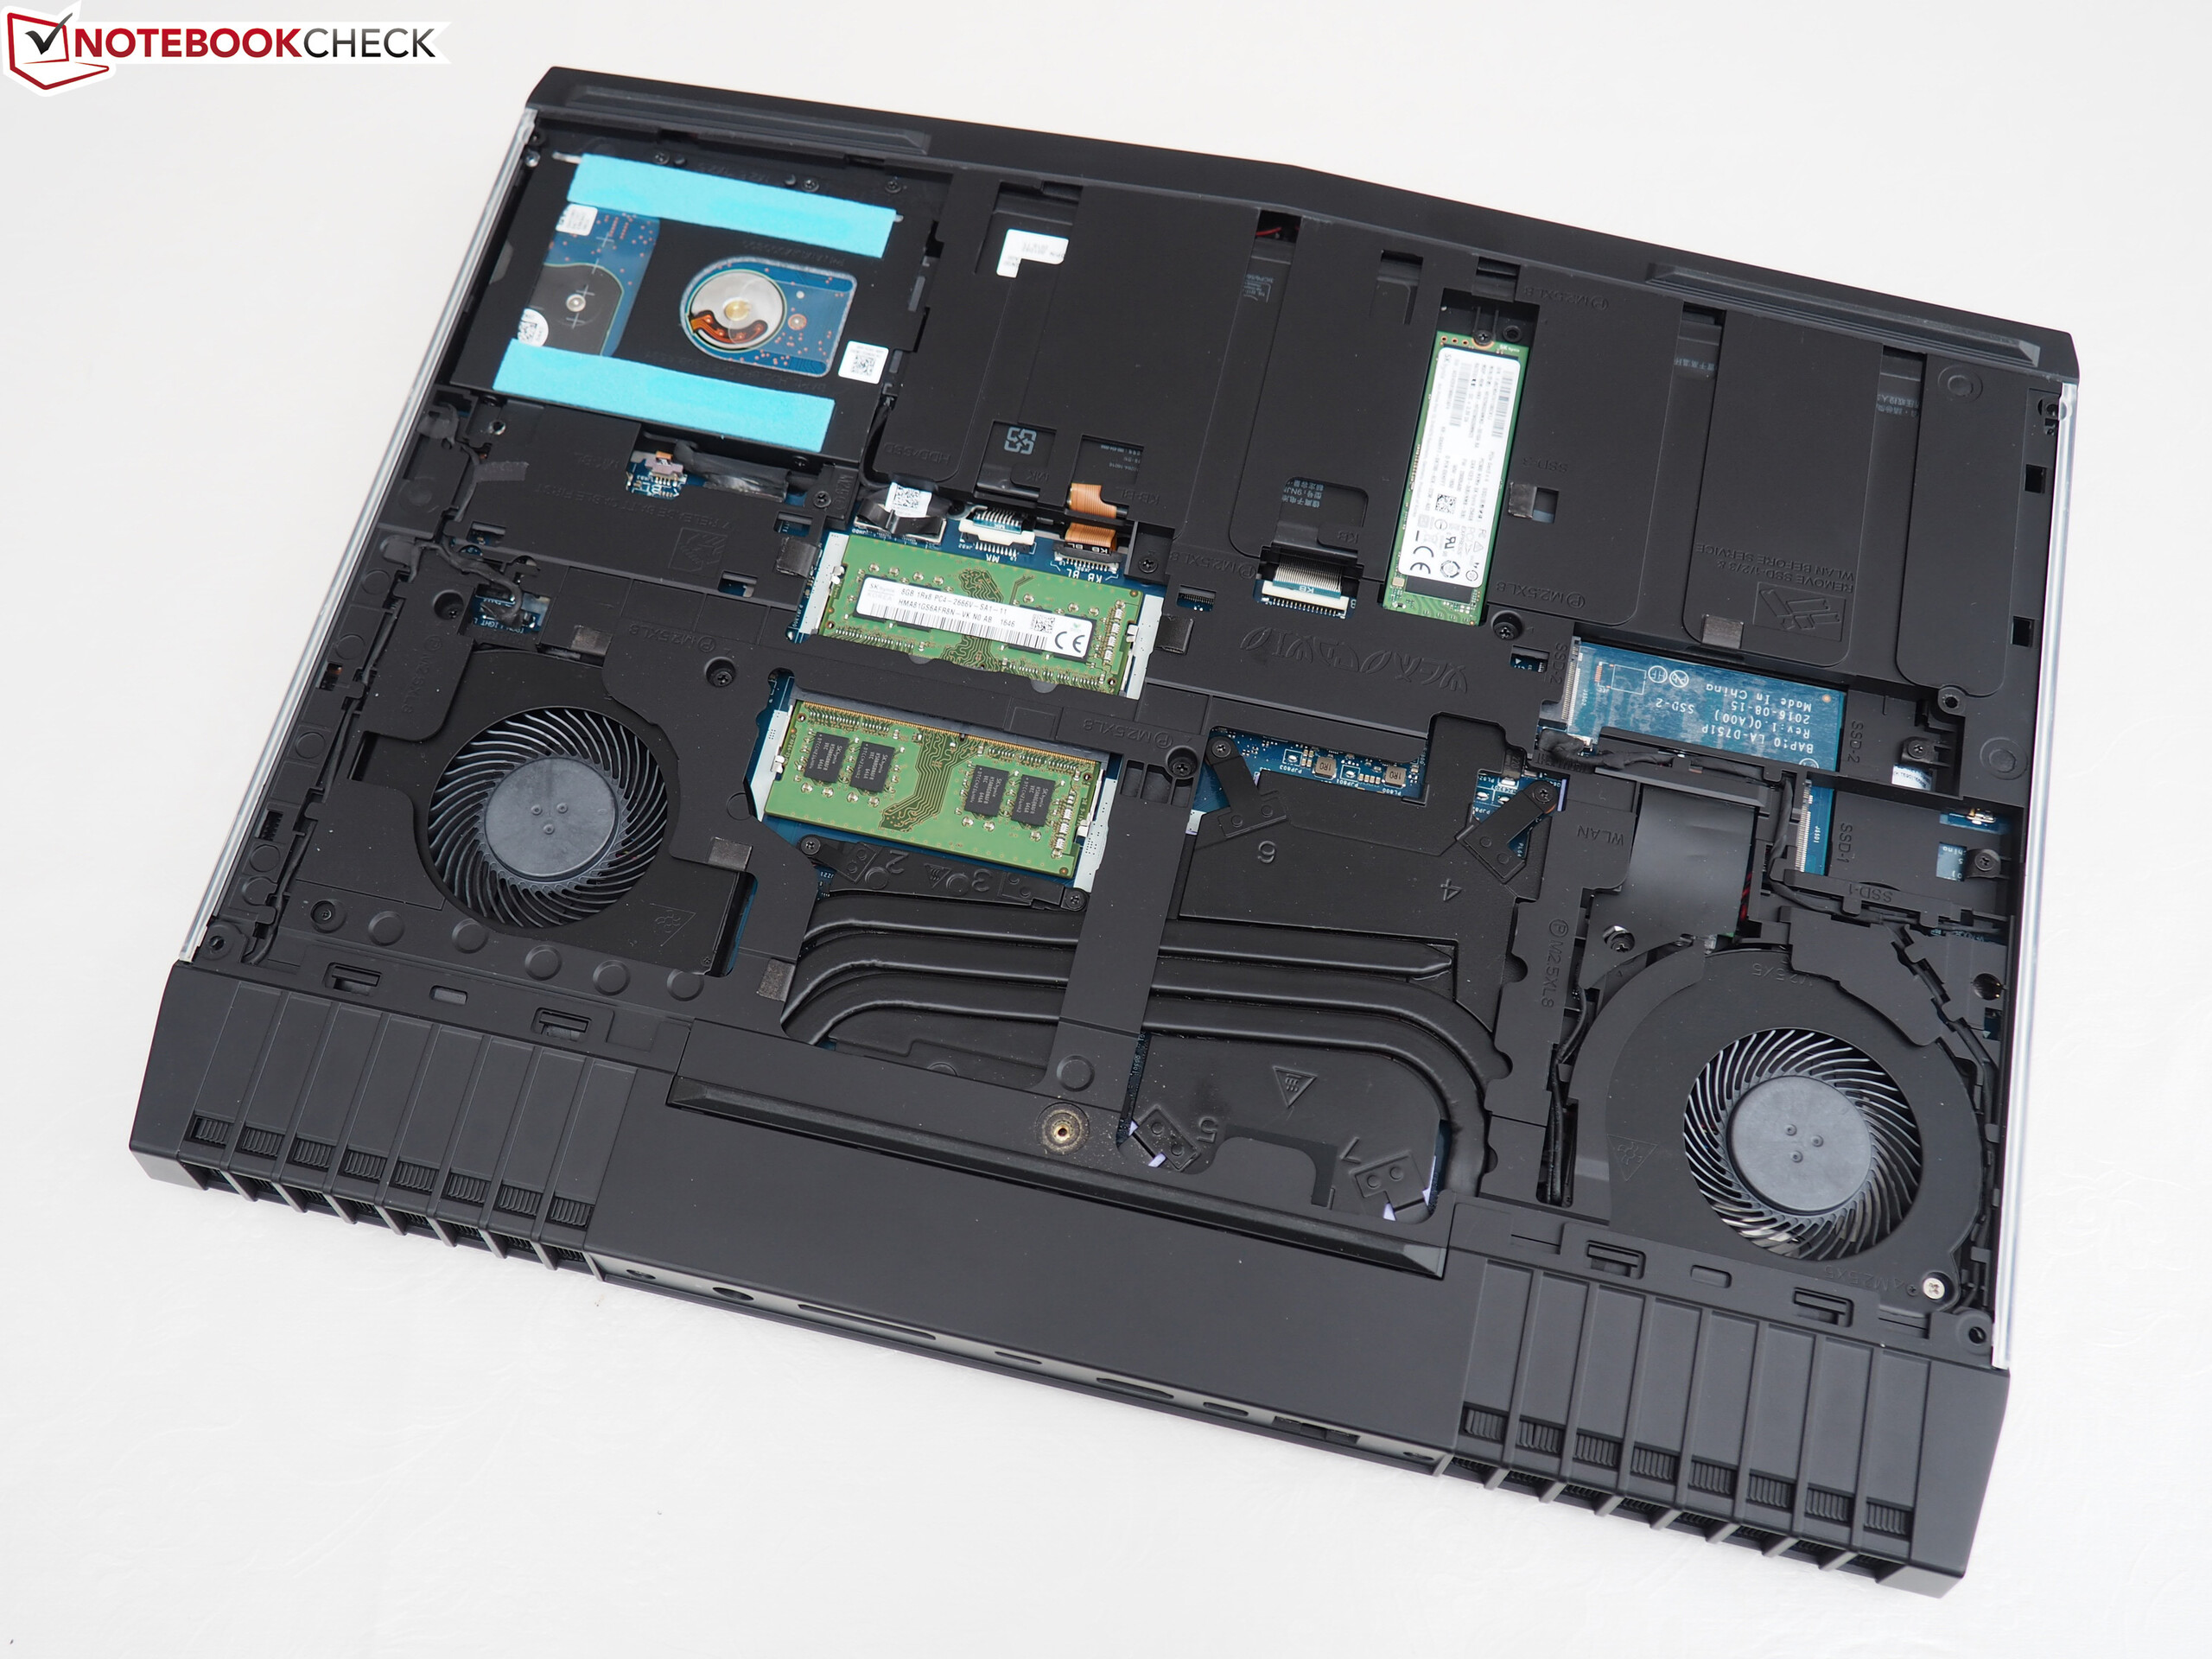
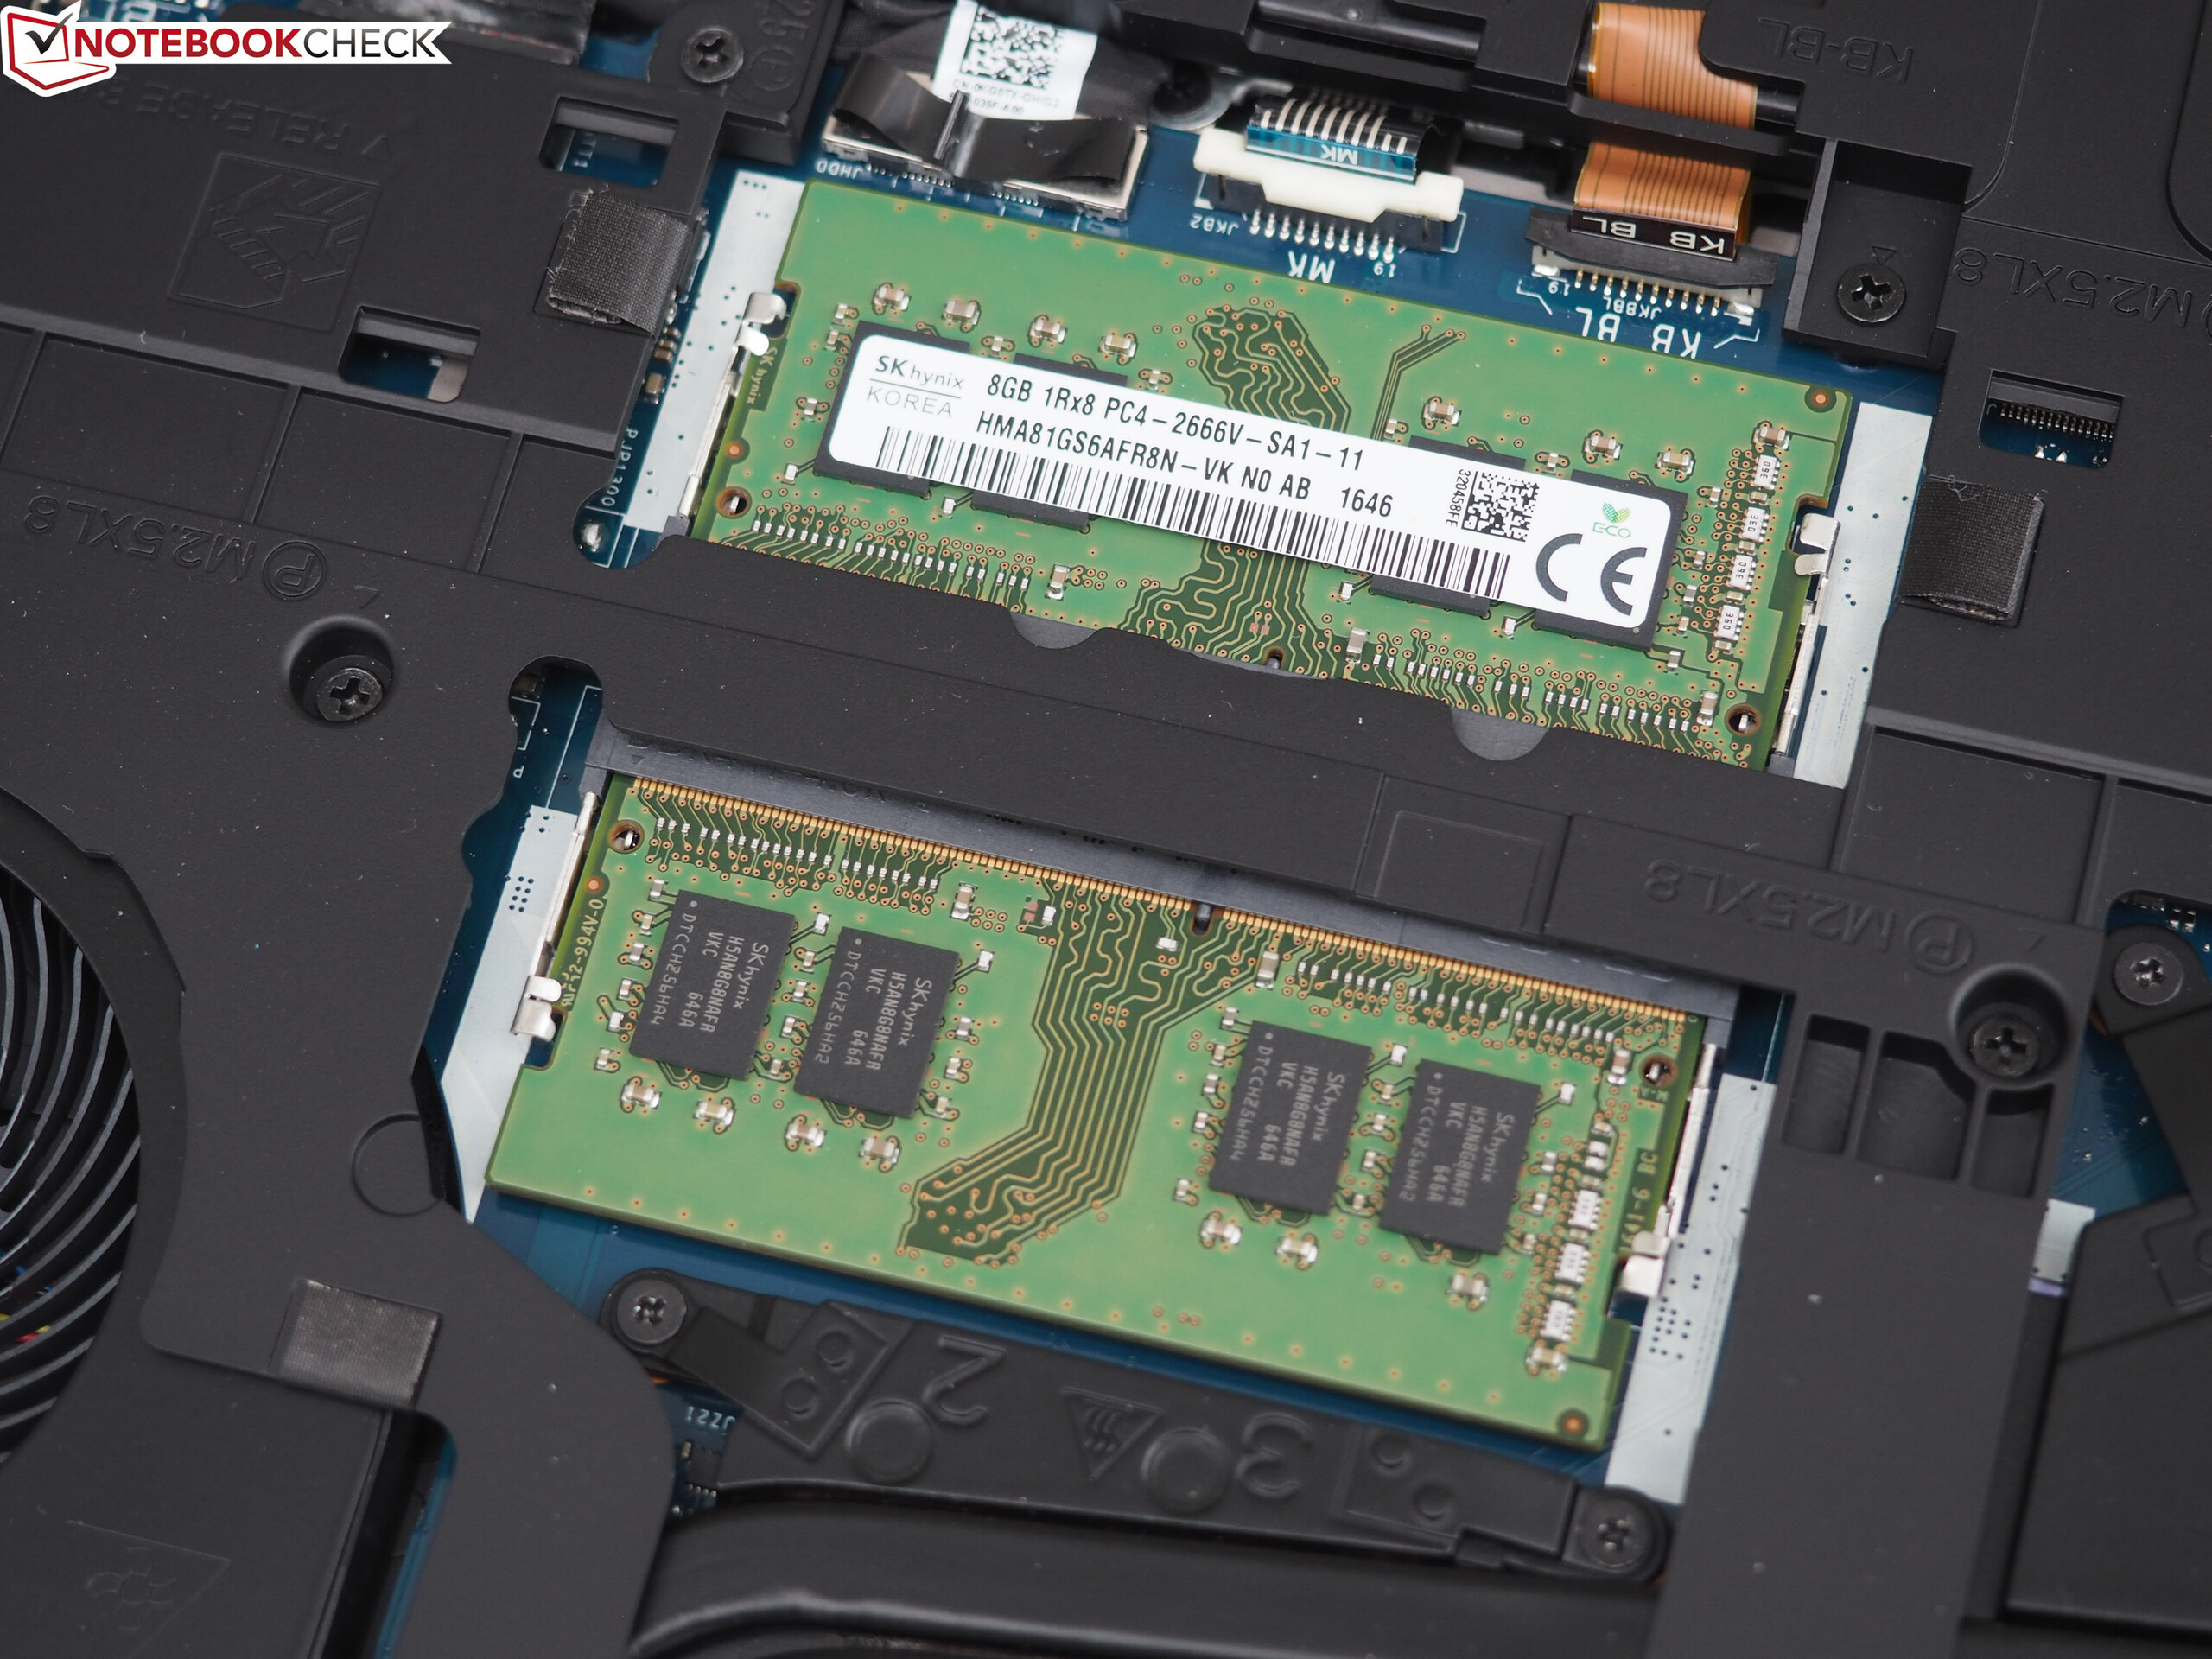
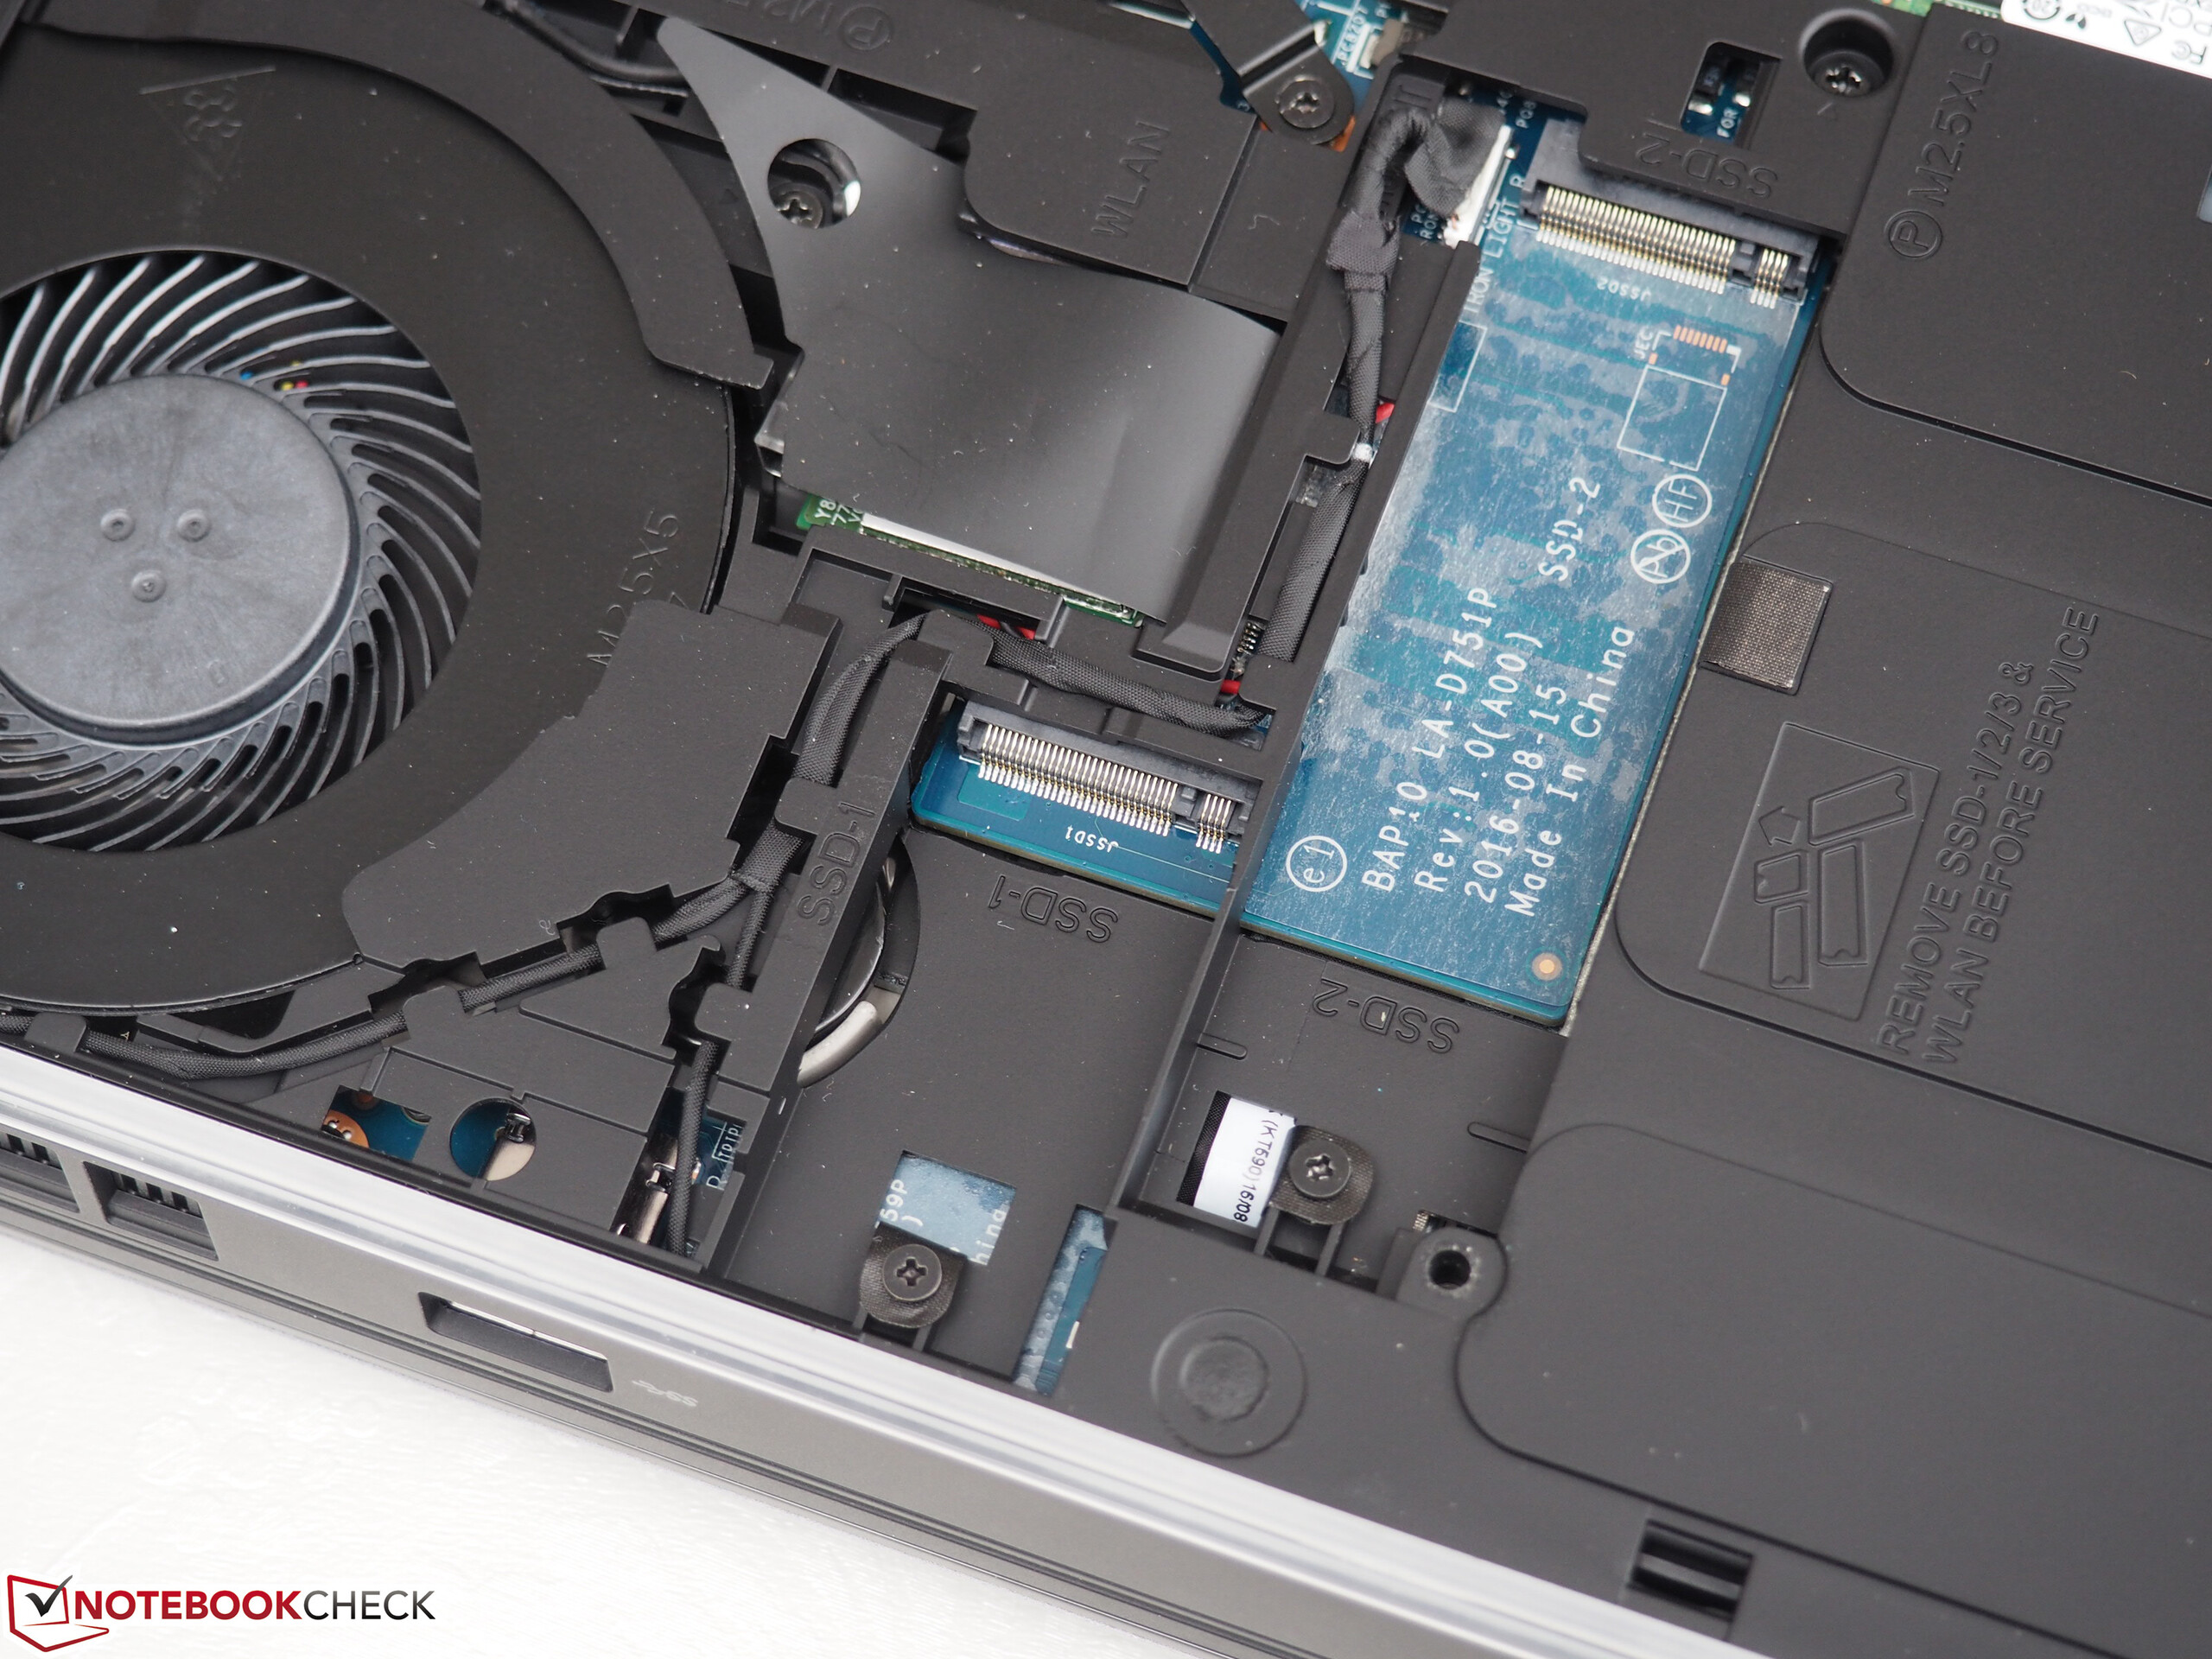
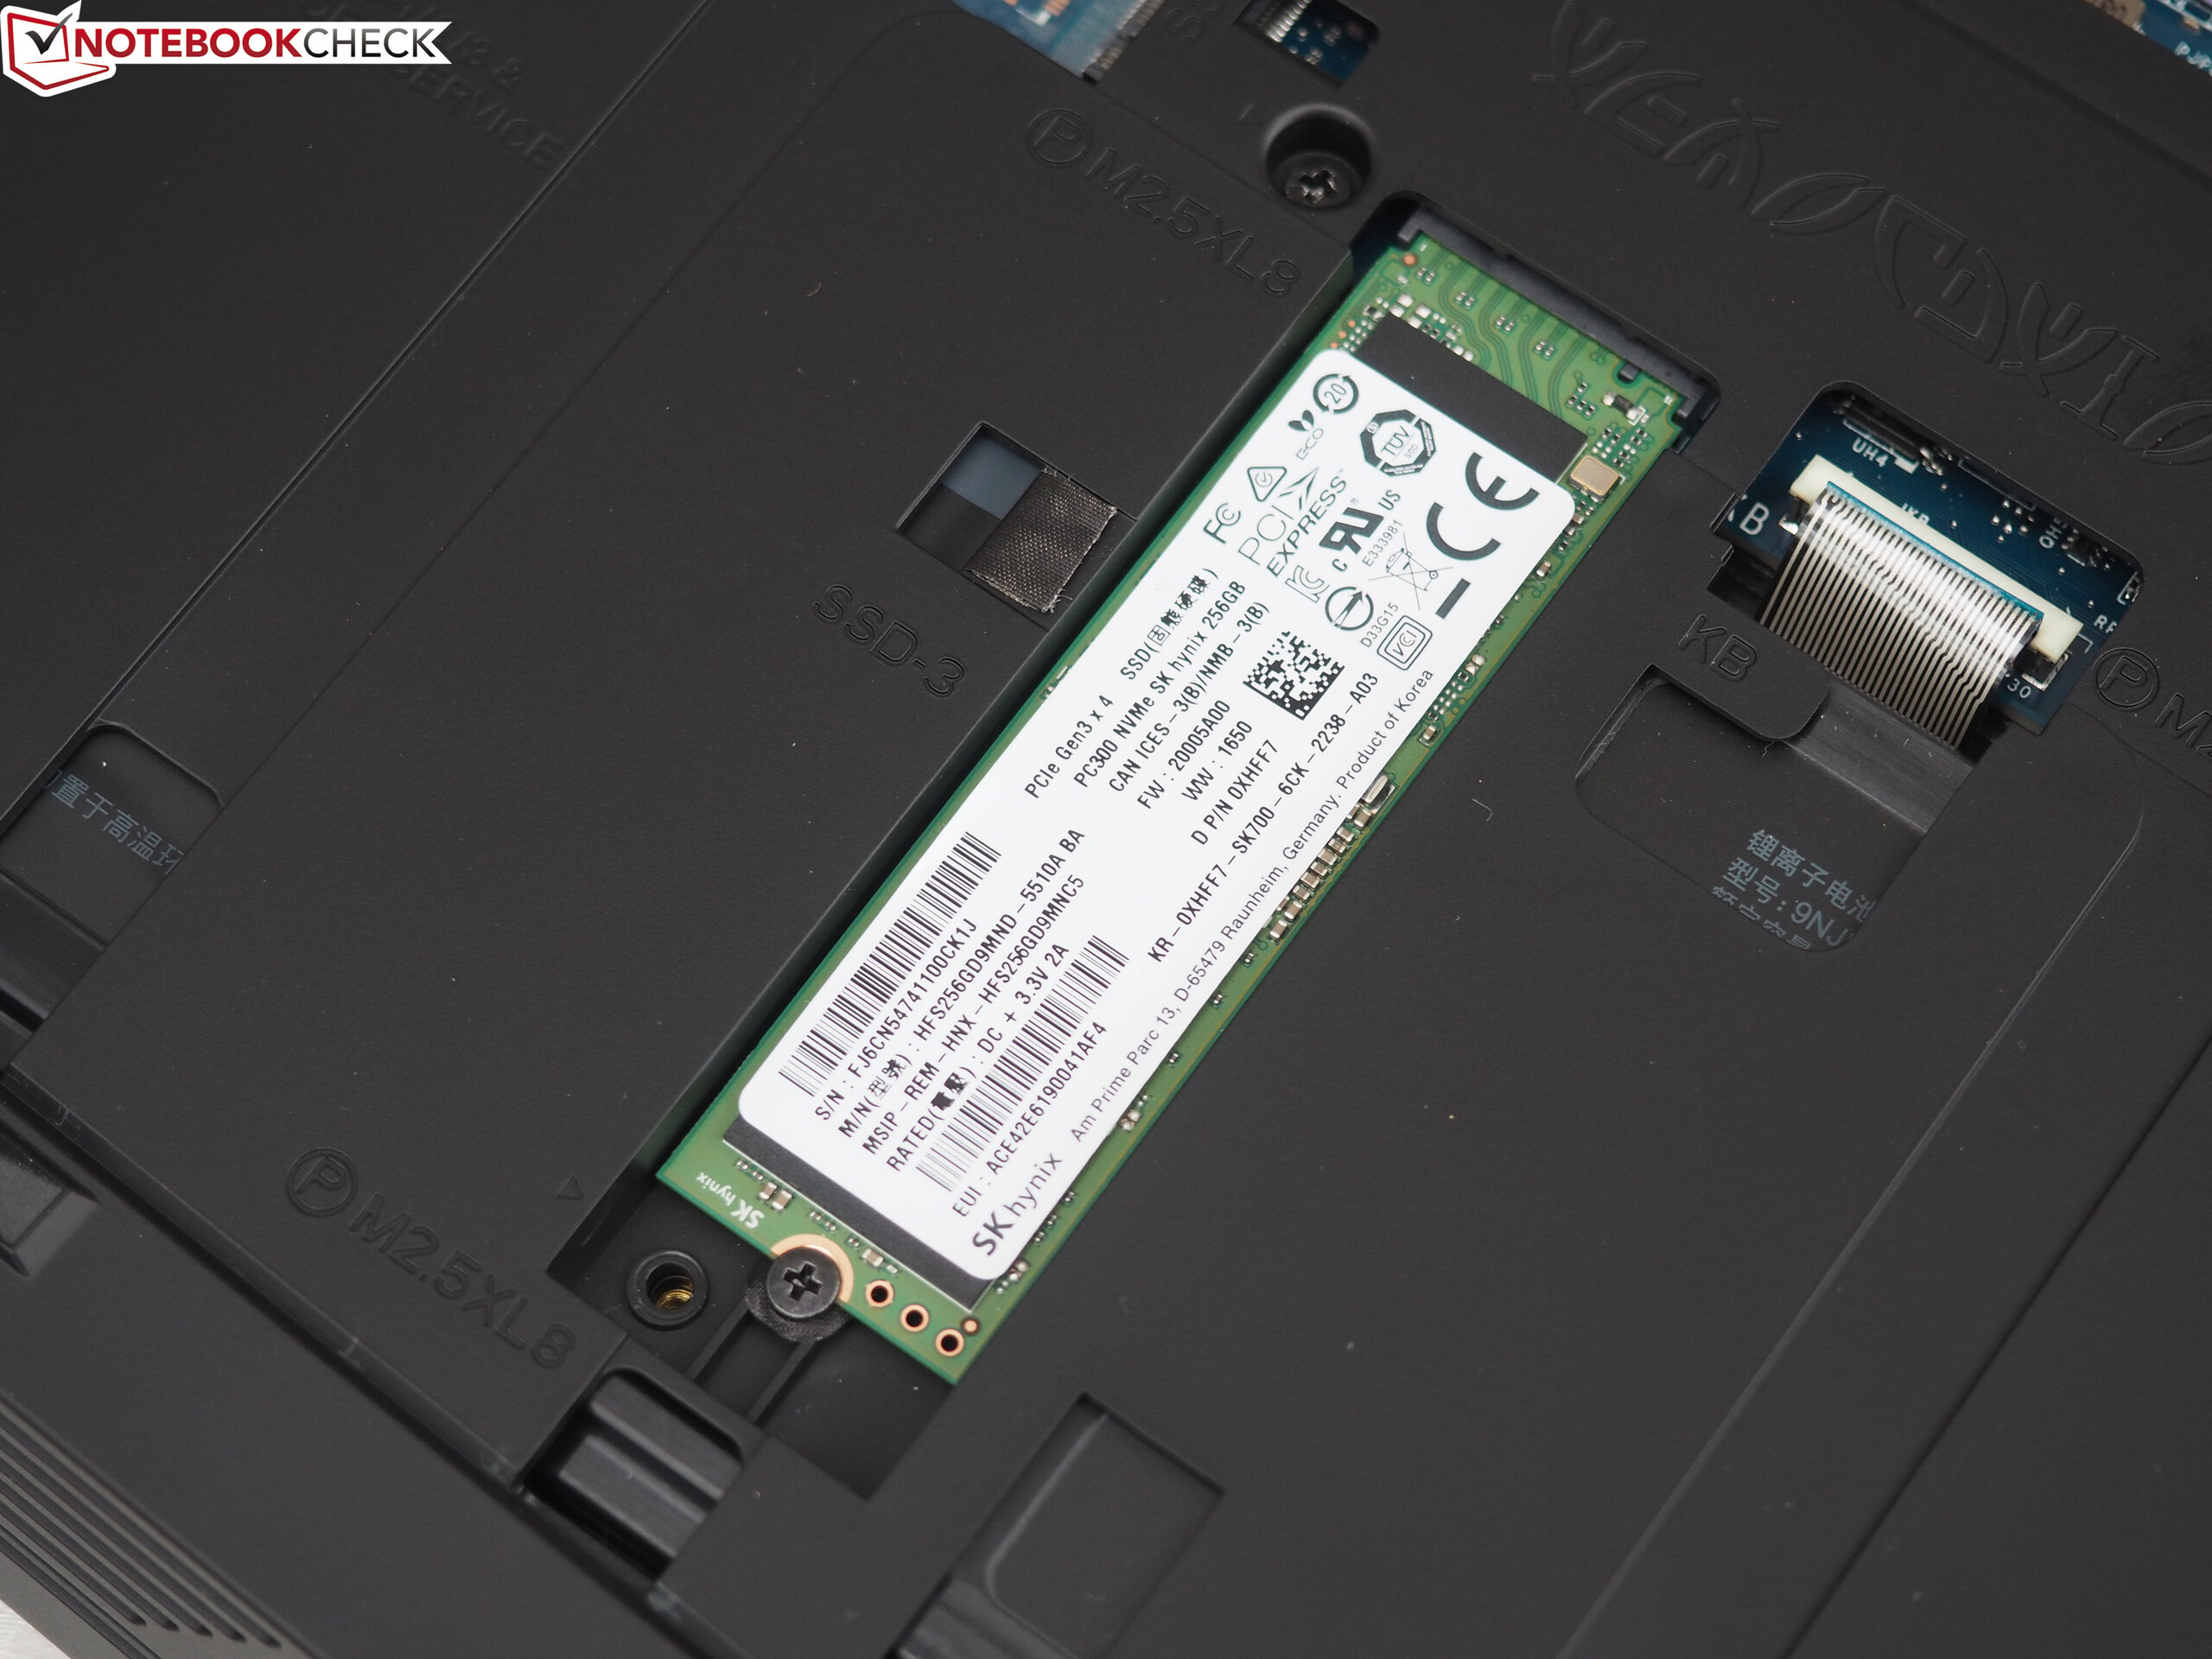
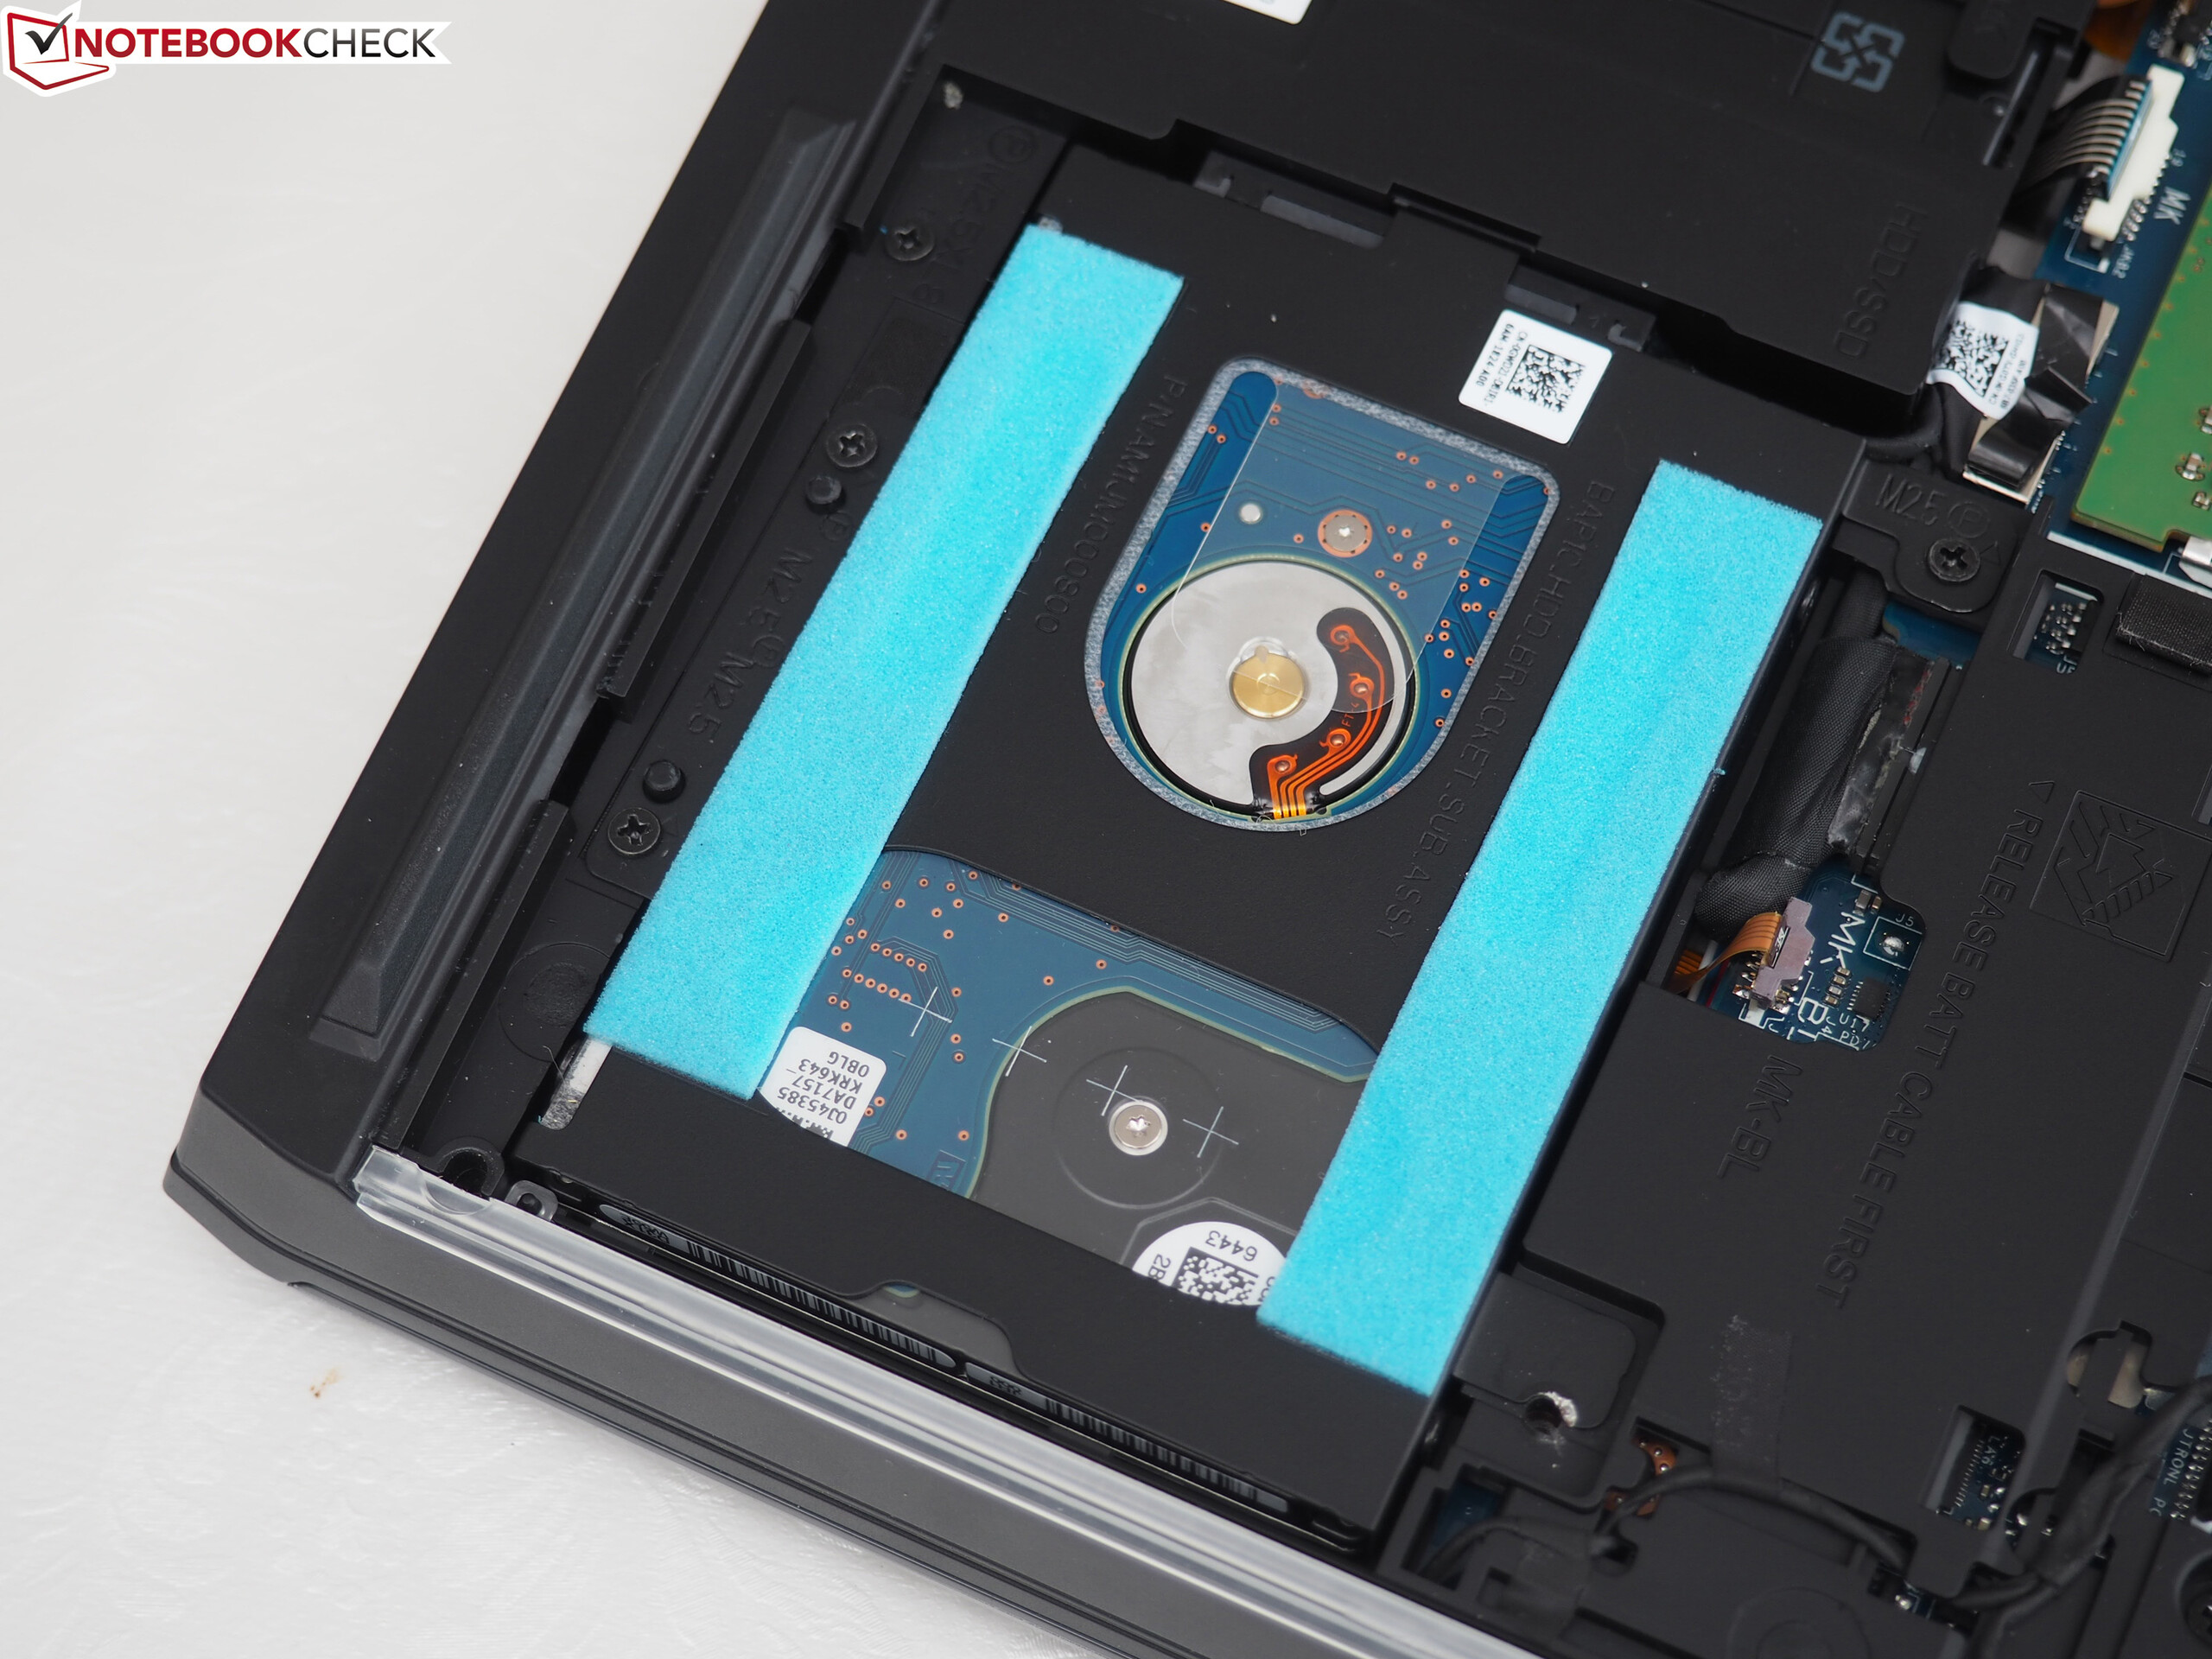
El SSD NVMe es rápido como el viento y permite un sistema suave y de funcionamiento rápido. El dispositivo también está equipado con un disco duro de 1 TB. Ambos dispositivos de almacenamiento se pueden cambiar. El aguante de la batería es muy bueno para un dispositivo con este nivel de rendimiento
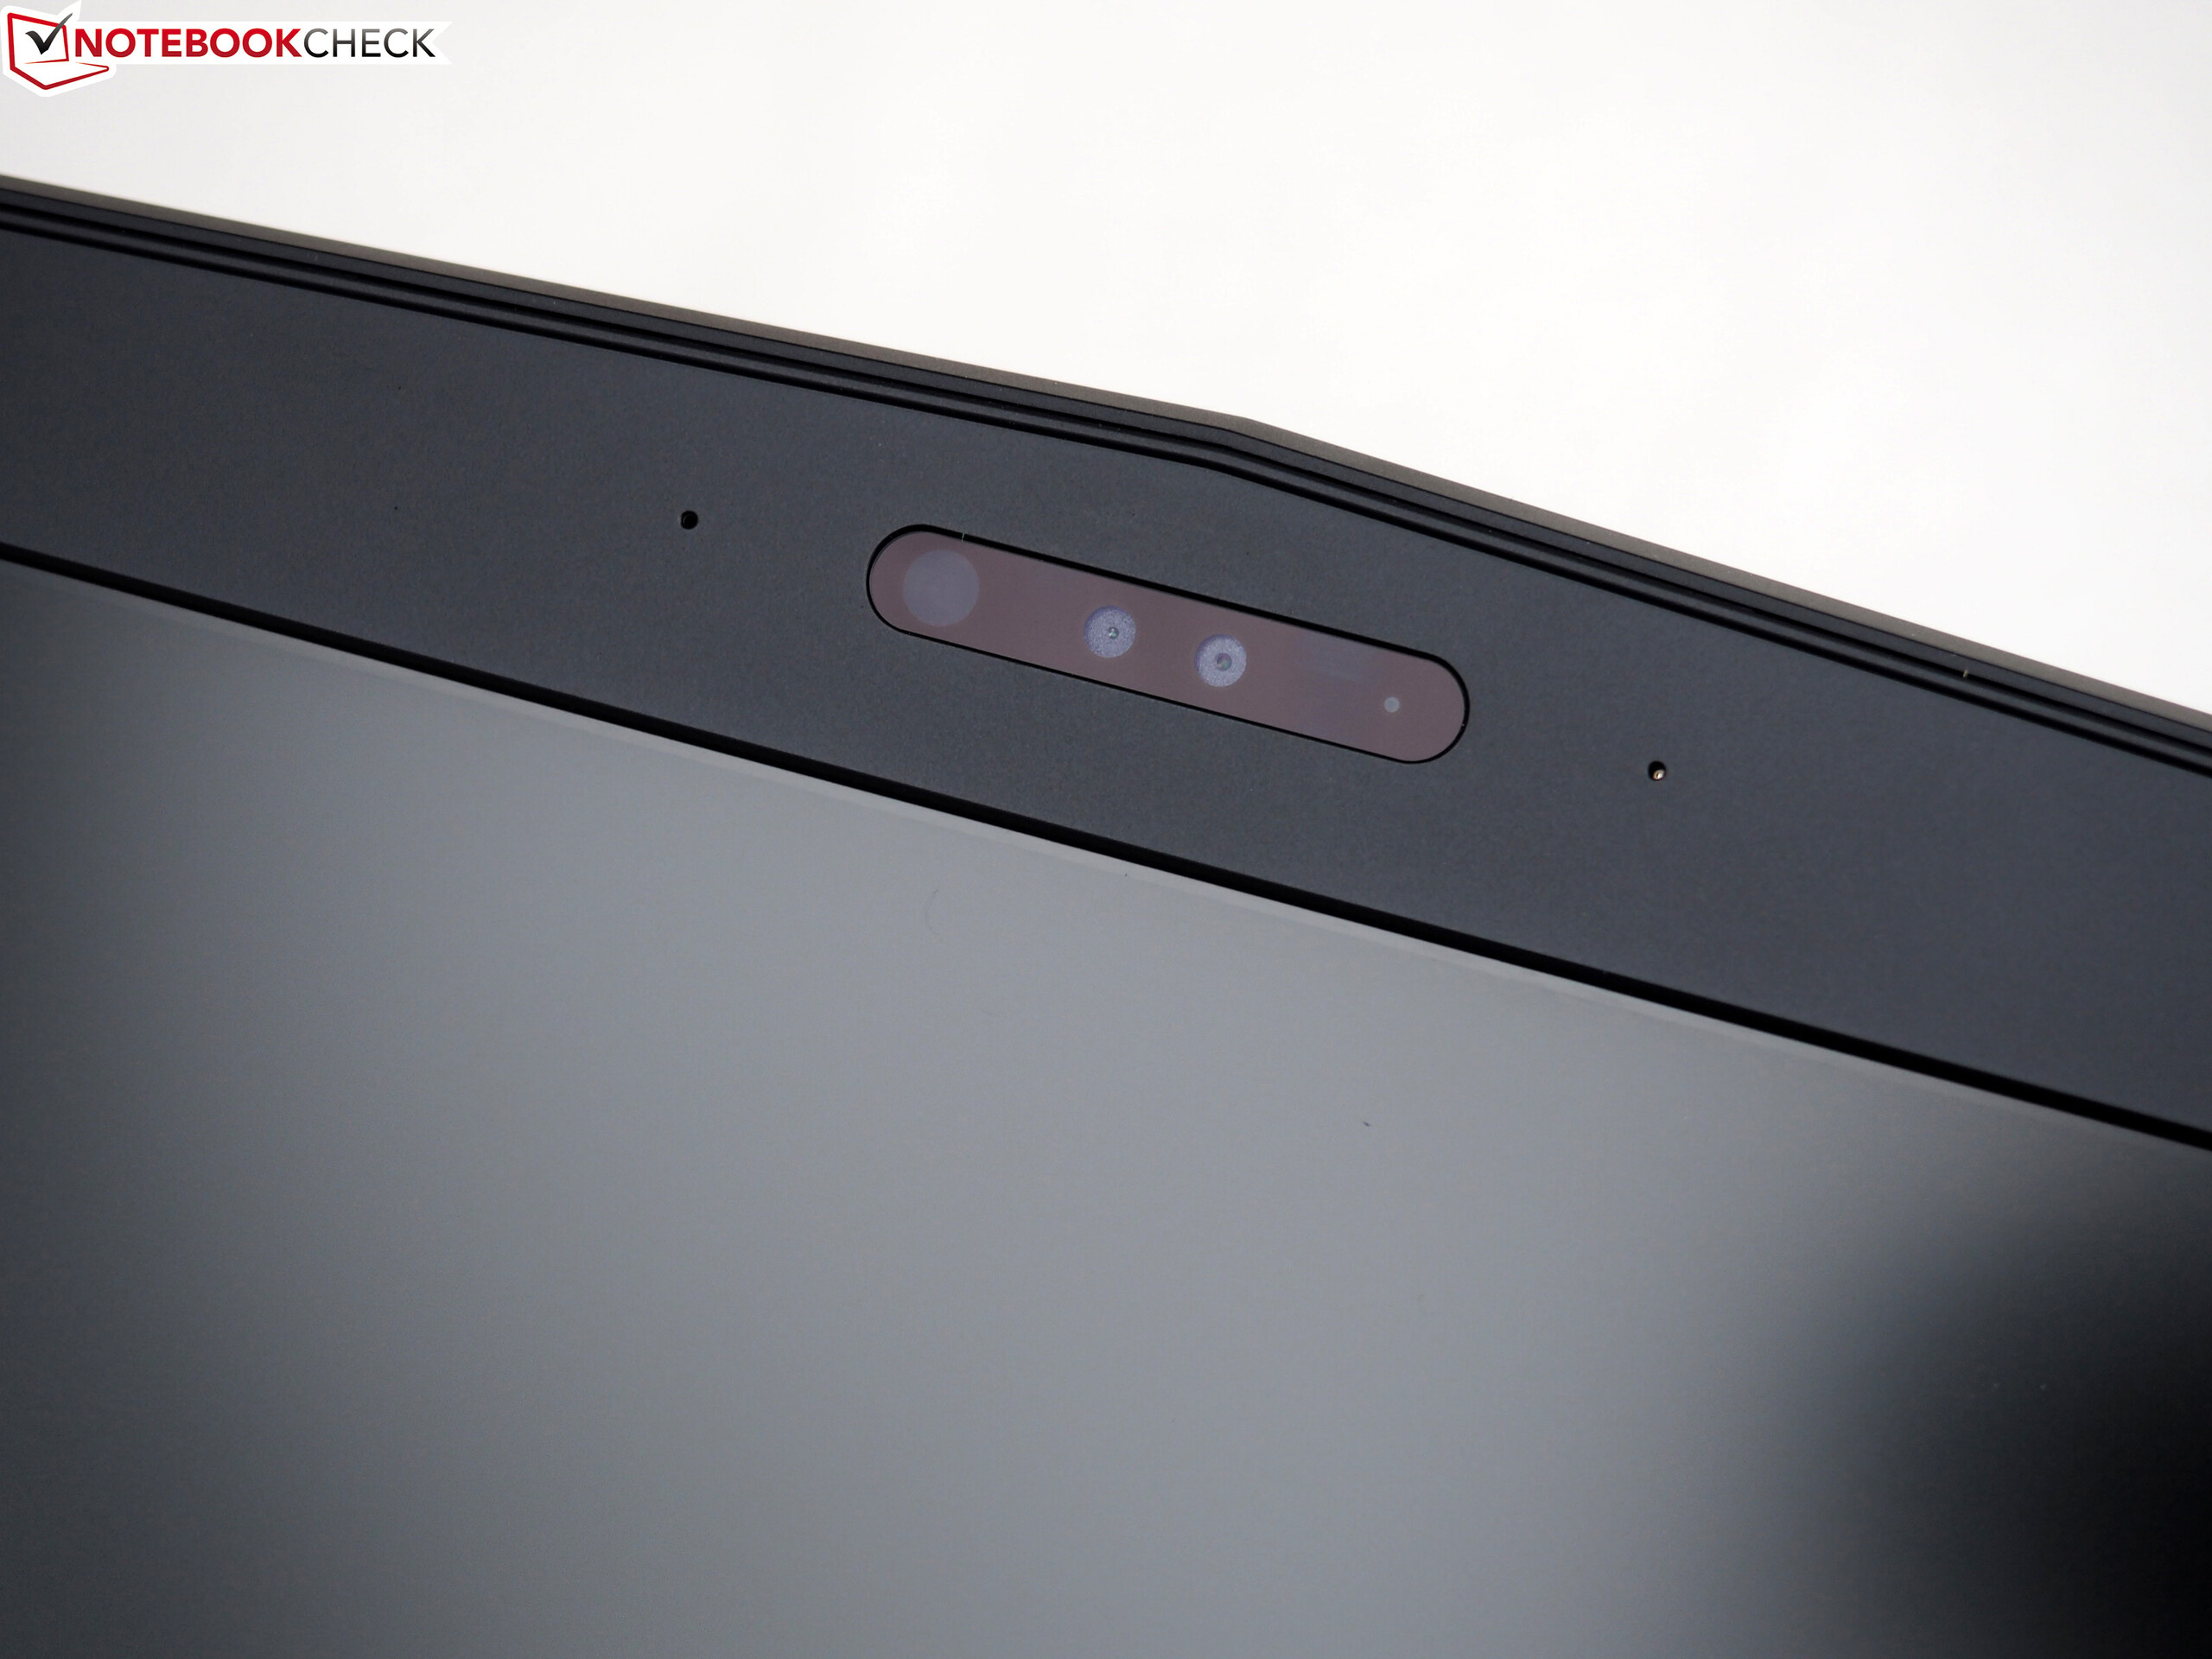
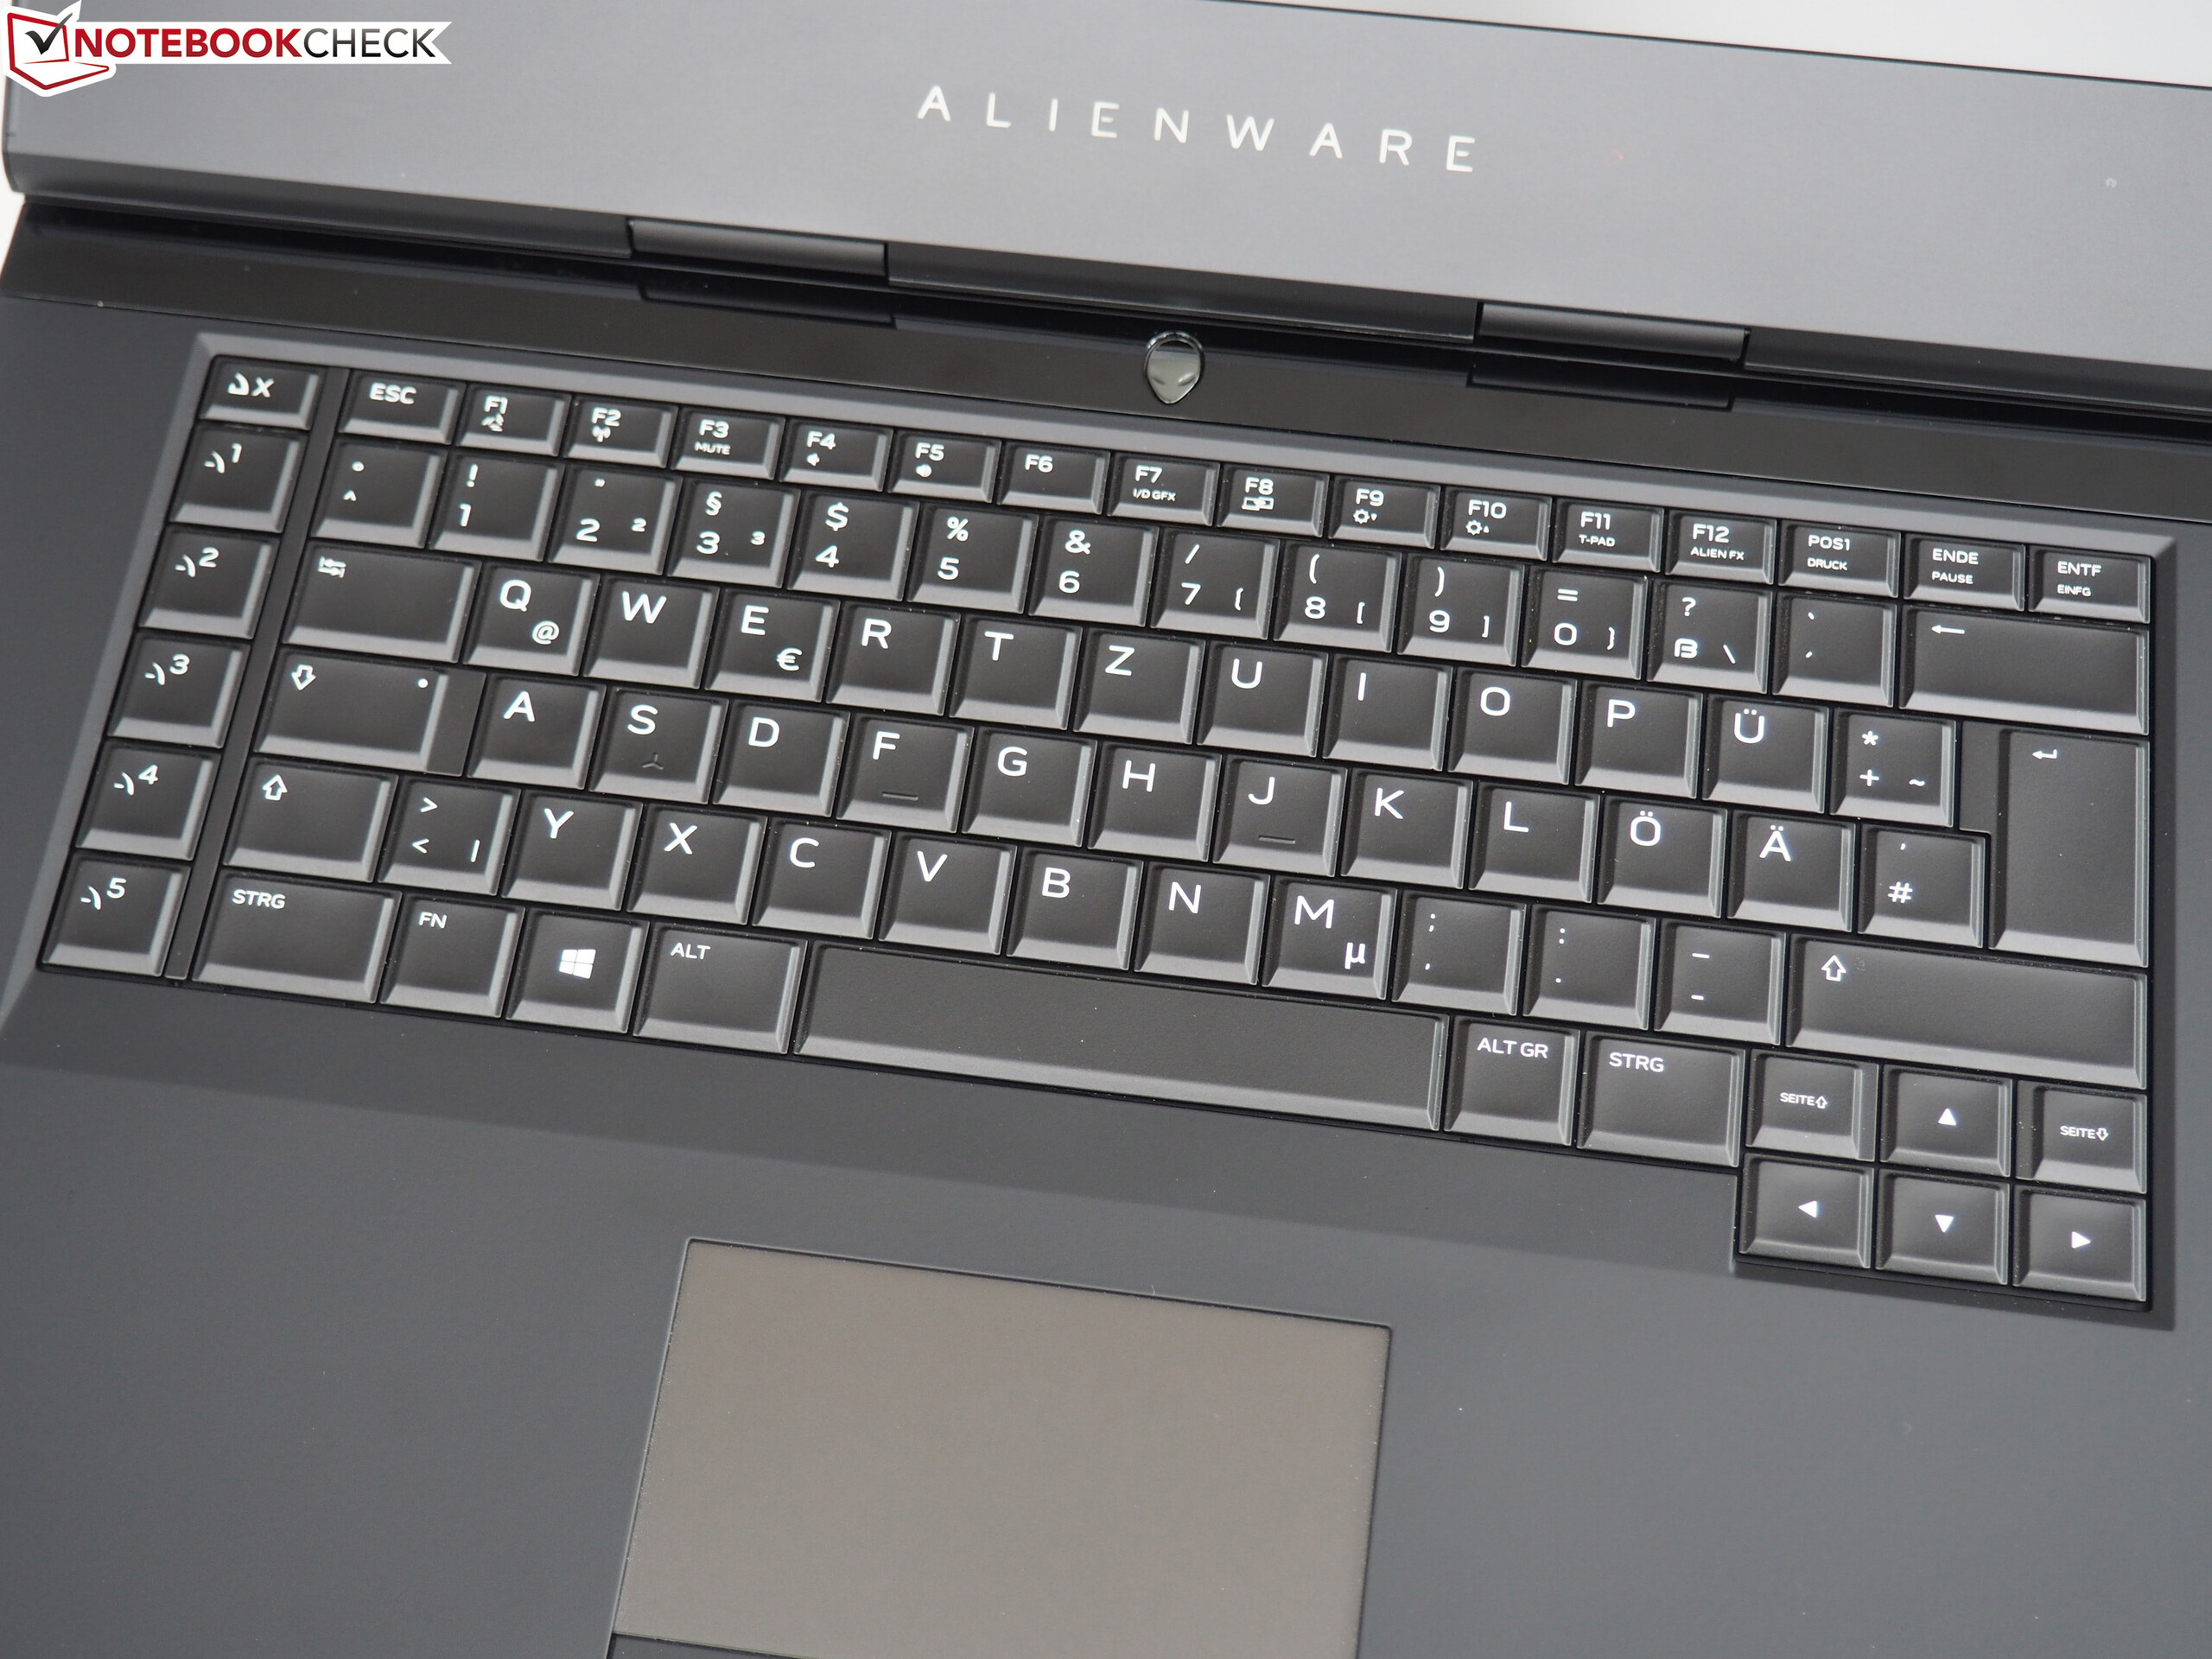
La pantalla también ofrece cambios significativos en comparación con el modelo 15 R3 que ya probamos. Mientras que el modelo hermano está equipado con un panel TN de 120 Hz, nuestra unidad de prueba actual ofrece un panel IPS de 60 Hz. La pantalla mate de 15.6" tiene ángulos de visión estables, una buena relación de contraste y suficiente brillo. Solo el tiempo de respuesta es más alto que el del panel TN.
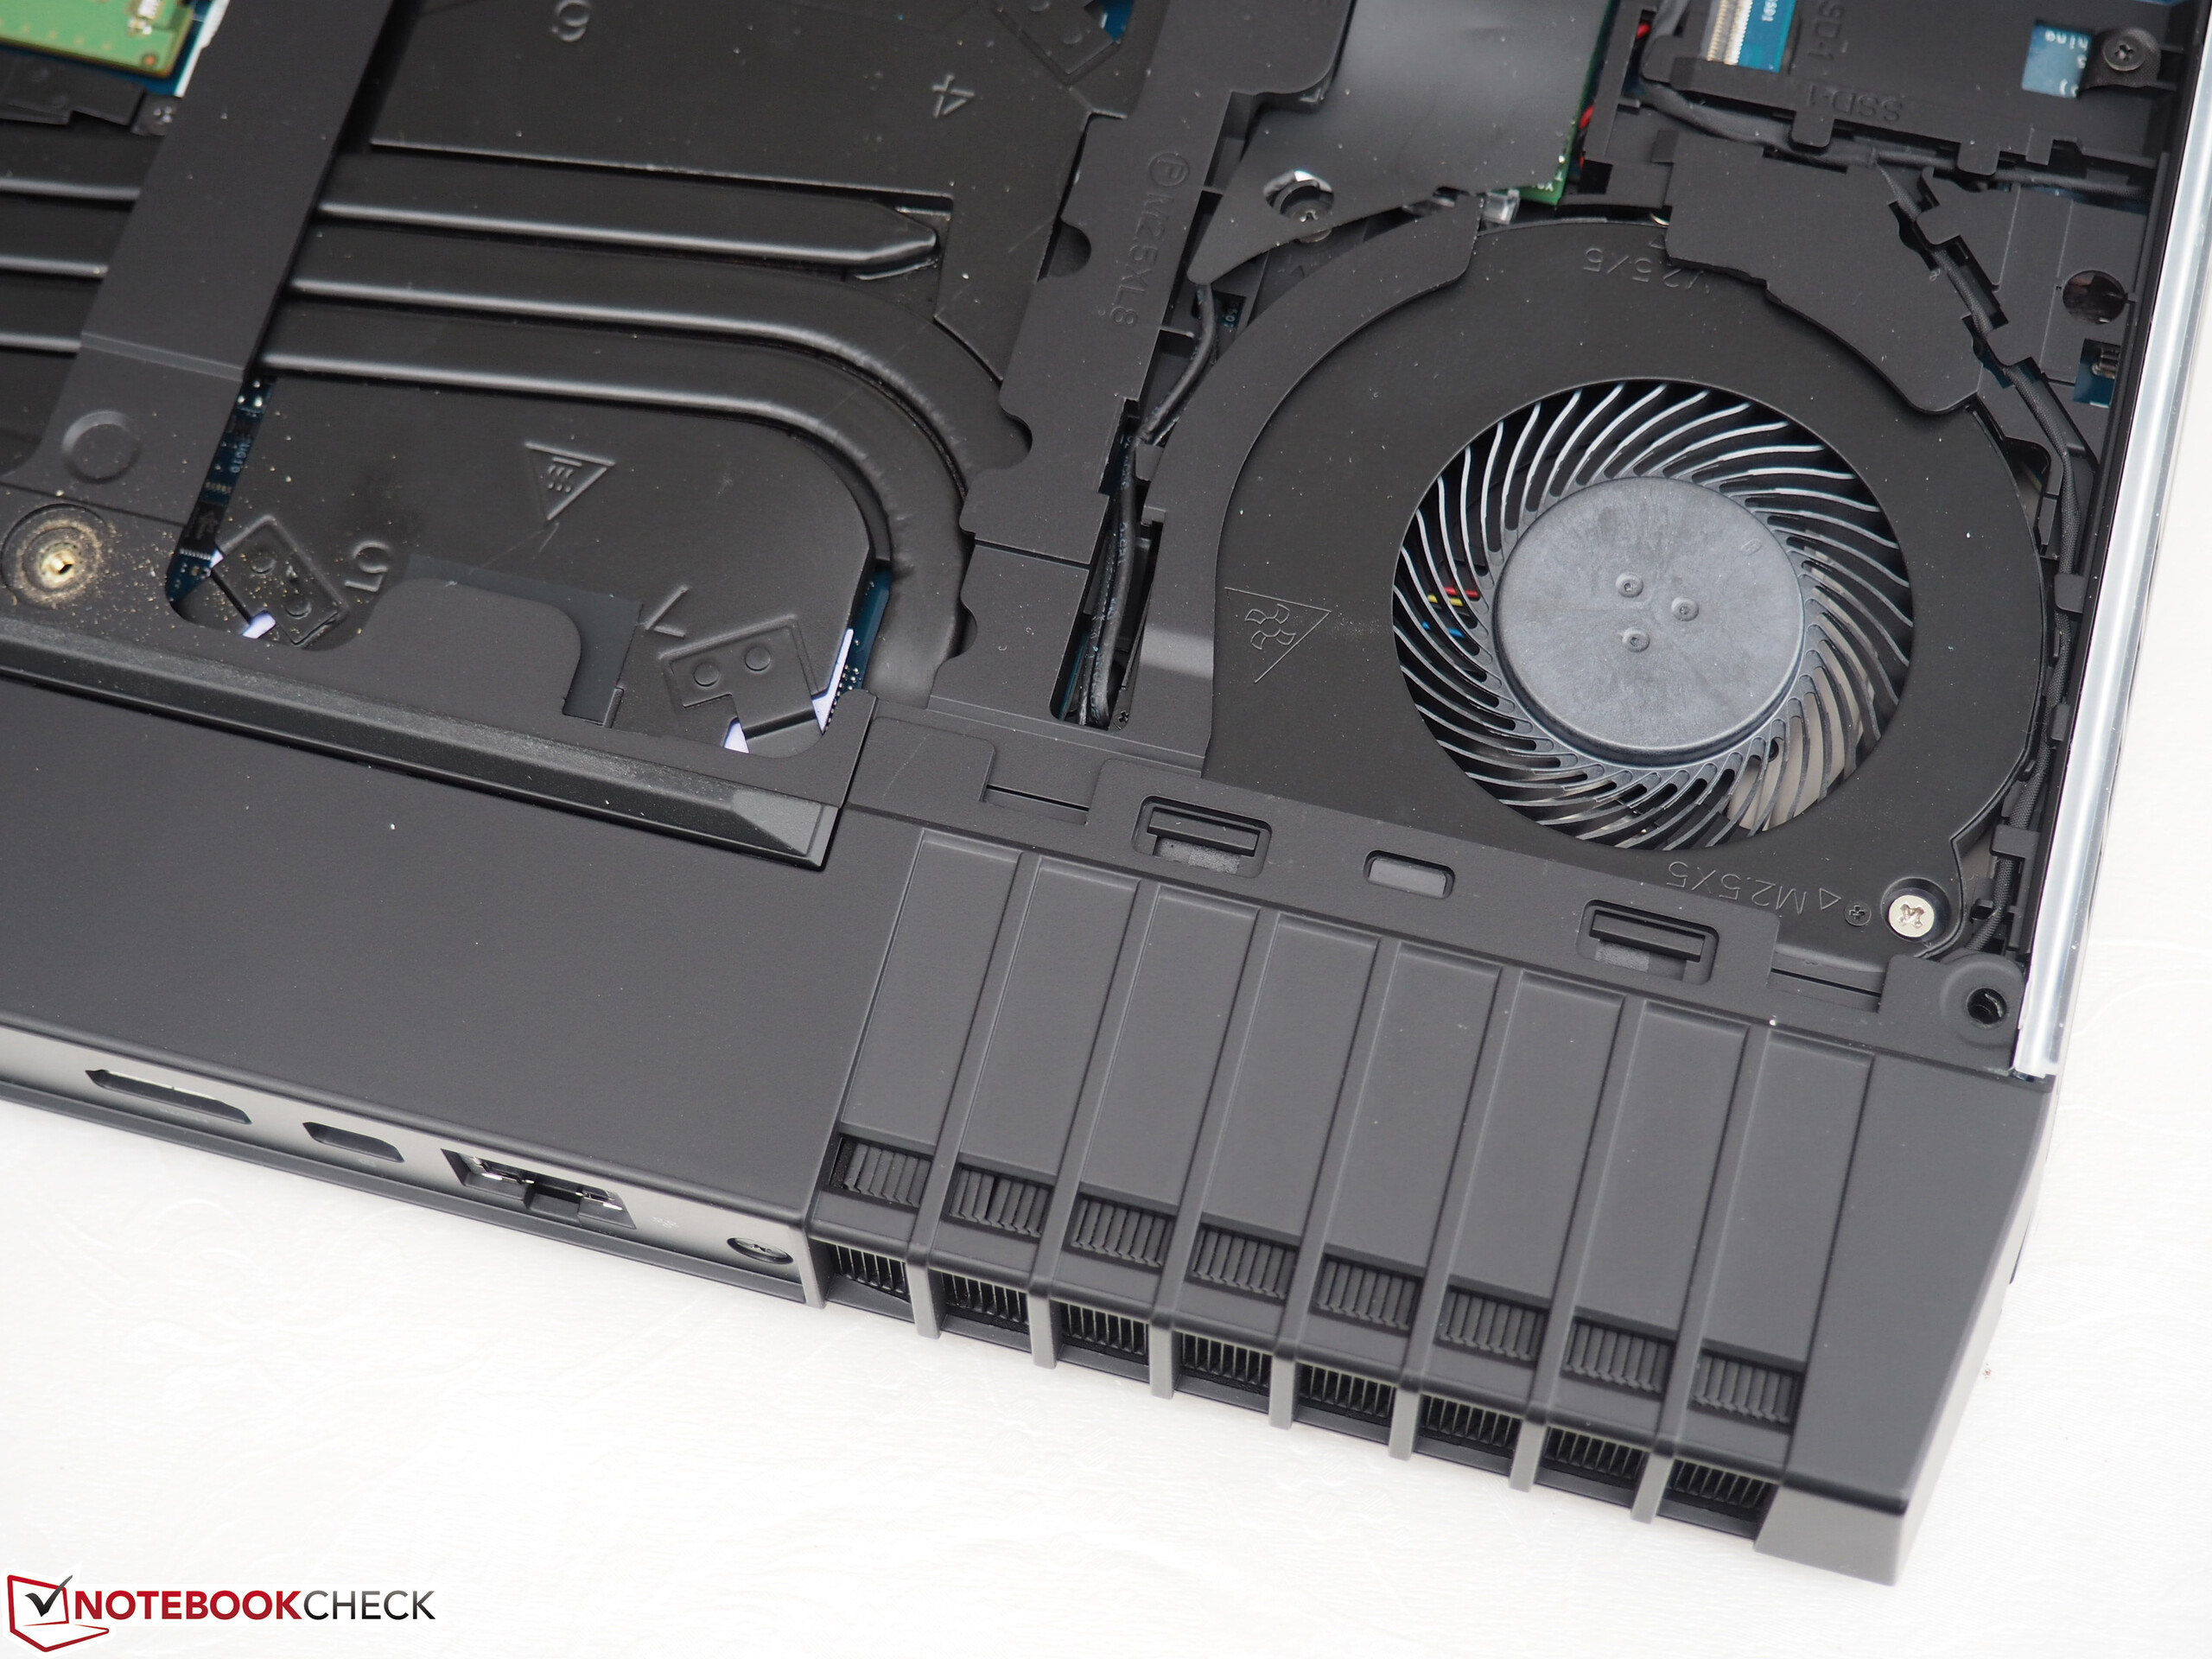
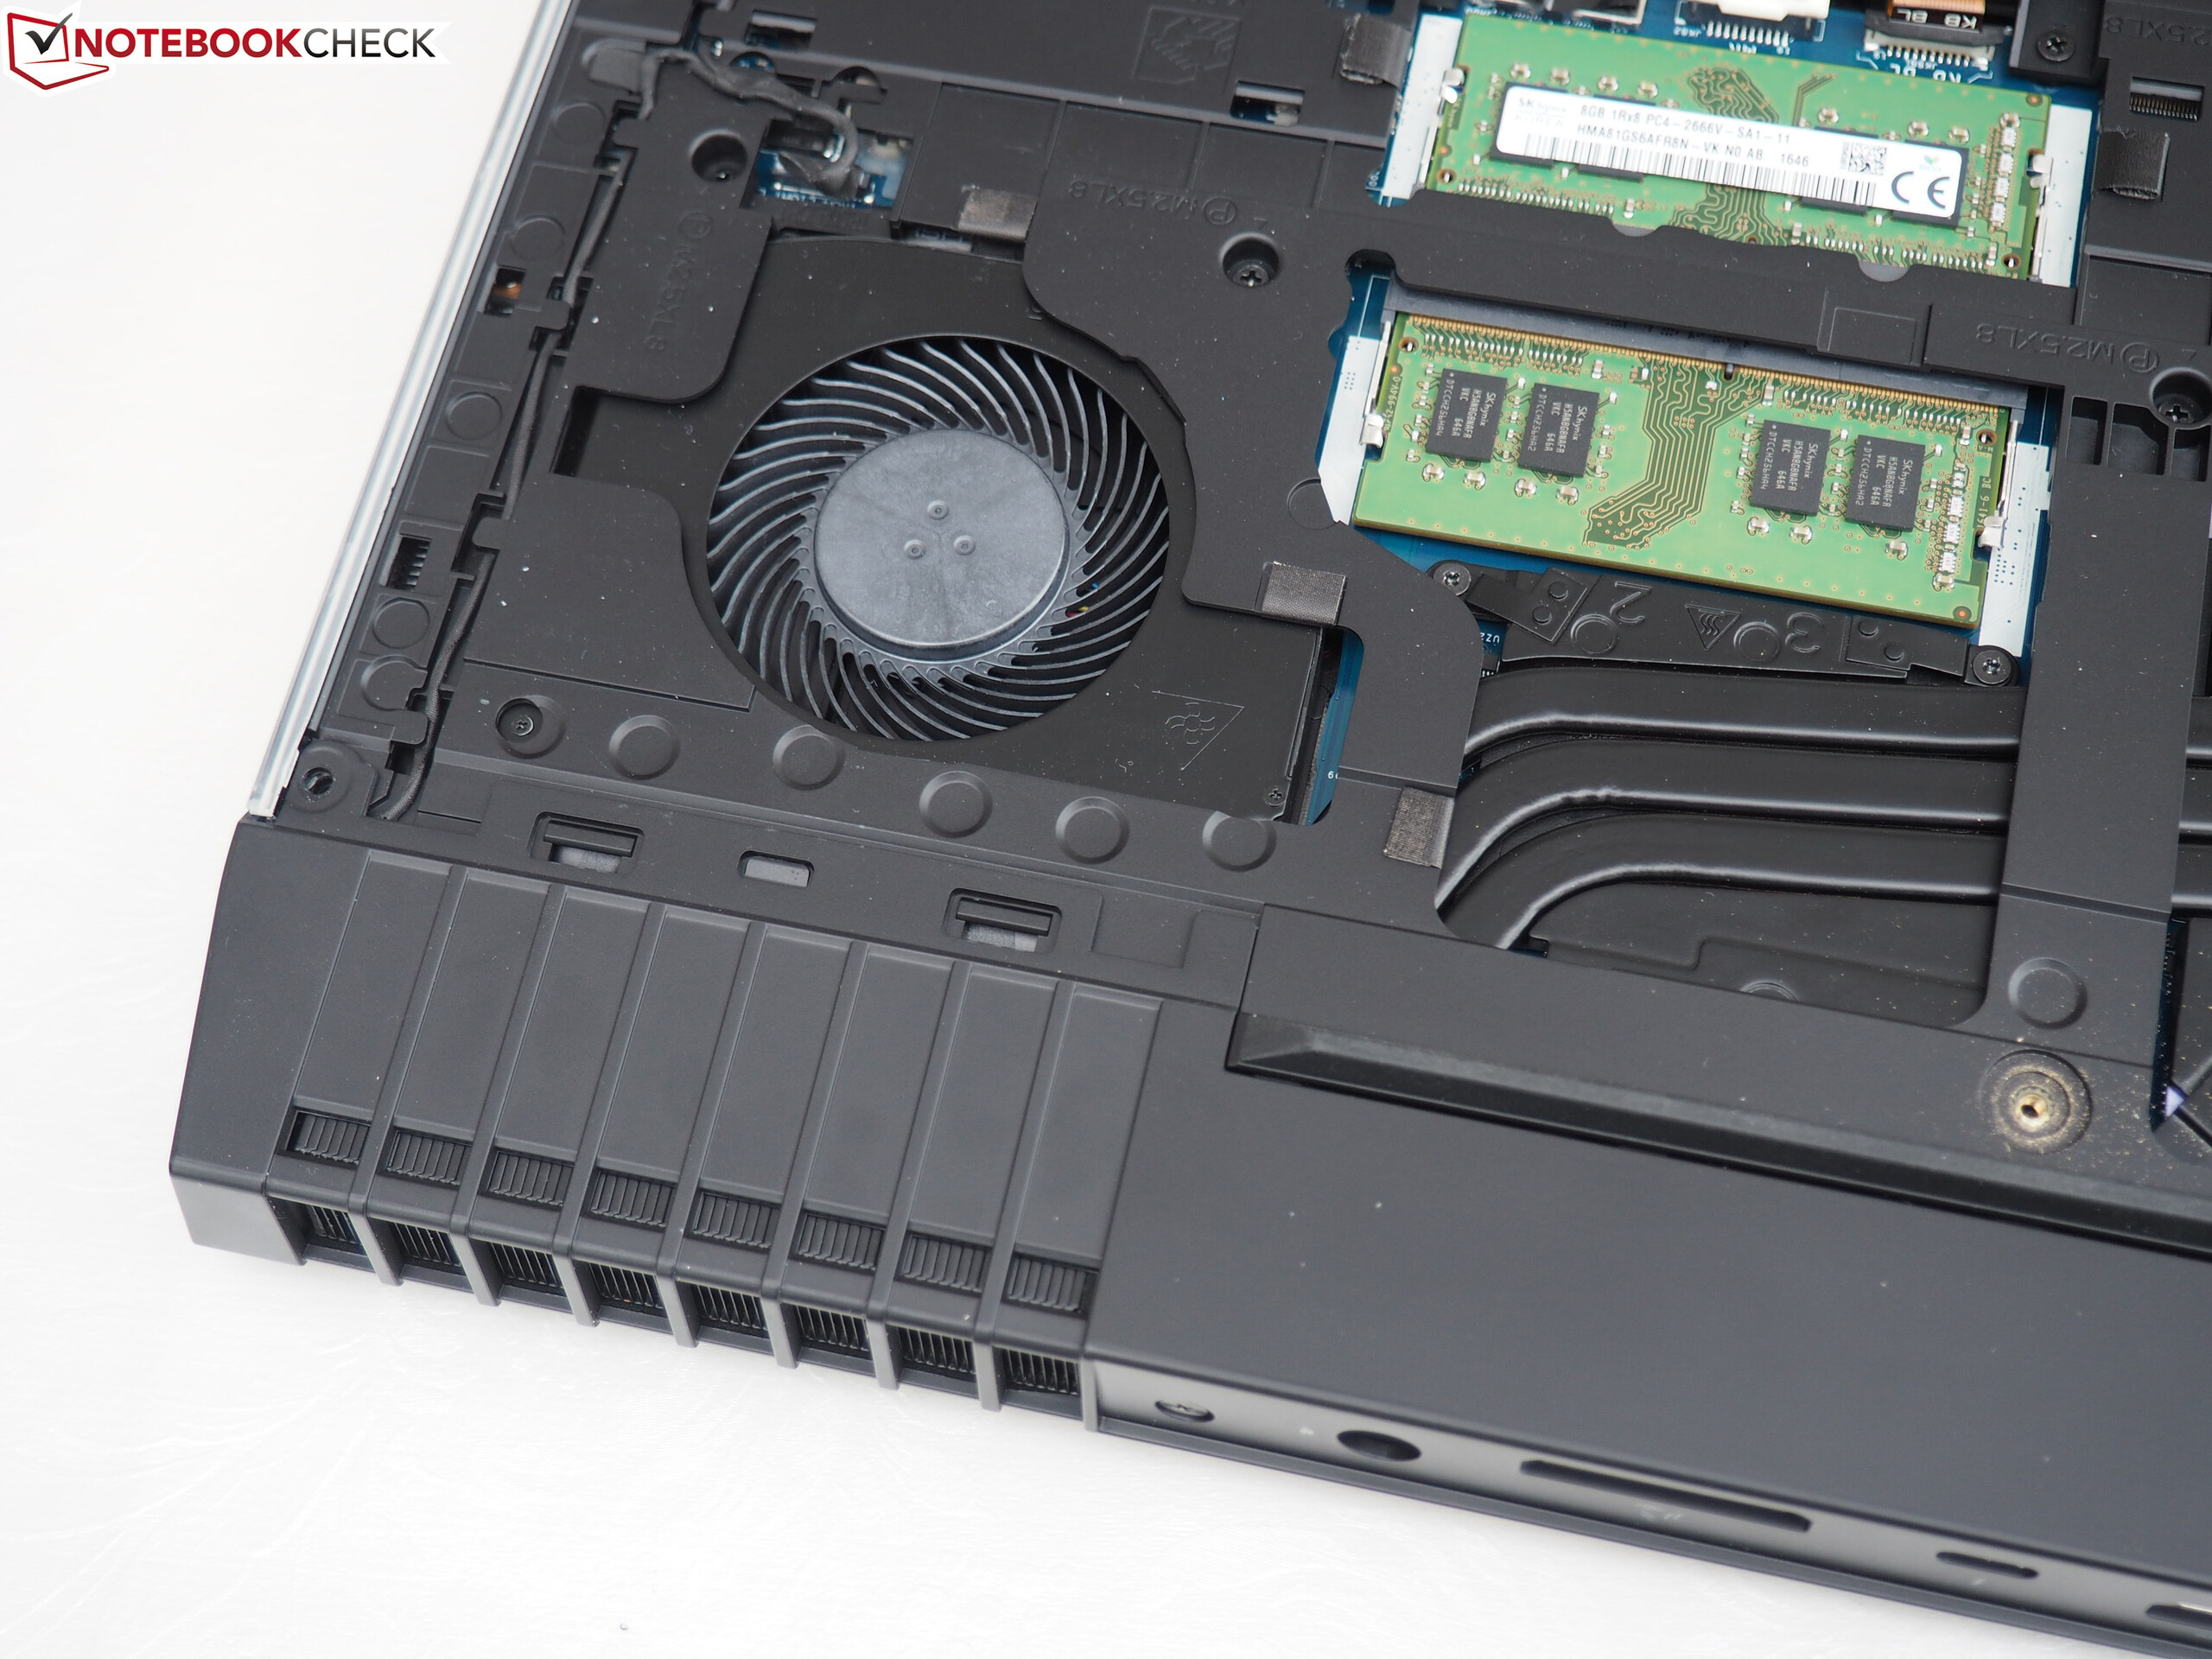
El modelo de Alienware 15 R3 que ya probamos tenía un gran problema con las temperaturas y el ruido del sistema, que se conectaba a la CPU y se calentaba de forma irregular. Esto no ocurrió en nuestra unidad de análisis actual y los núcleos se calentaron de manera uniforme.
Ésta es una versión acortada del análisis original. Puedes leer el análisis completo en inglés aquí.
Alienware 15 R3 Max-Q
- 10/27/2017 v6 (old)
Sascha Mölck