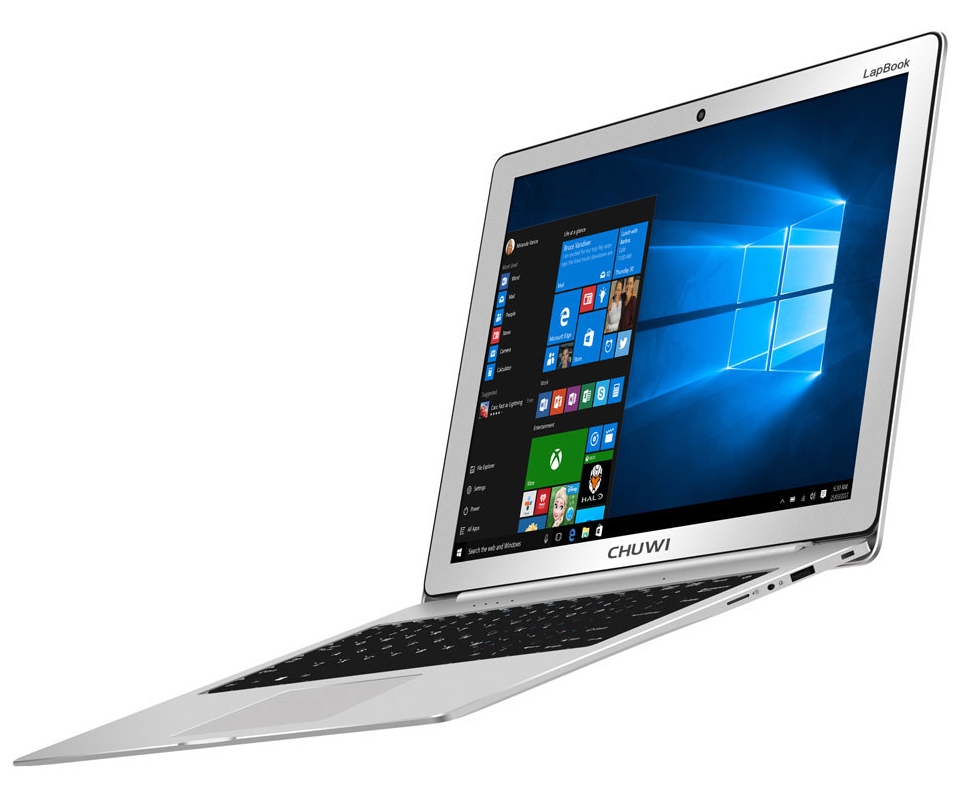
Breve análisis del portátil Chuwi LapBook 12.3 (Celeron, 2K IPS)
| SD Card Reader | |
| average JPG Copy Test (av. of 3 runs) | |
| Lenovo E31-80 80MX0107GE (Toshiba Exceria Pro SDXC 64 GB UHS-II) | |
| Acer Swift 1 SF113-31-P2CP (Toshiba Exceria Pro SDXC 64 GB UHS-II) | |
| Chuwi Lapbook 12.3 (Toshiba Exceria Pro M501) | |
| Jumper EZbook 3 | |
| maximum AS SSD Seq Read Test (1GB) | |
| Chuwi Lapbook 12.3 (Toshiba Exceria Pro M501) | |
| Acer Swift 1 SF113-31-P2CP (Toshiba Exceria Pro SDXC 64 GB UHS-II) | |
| Jumper EZbook 3 (Toshiba Exceria Pro M401 64 GB) | |
| Lenovo E31-80 80MX0107GE (Toshiba Exceria Pro SDXC 64 GB UHS-II) | |
| Networking | |
| iperf3 transmit AX12 | |
| Acer Switch 3 SW312-31-P5VG | |
| Chuwi Lapbook 12.3 | |
| Acer Swift 1 SF113-31-P2CP | |
| Acer Aspire 1 A114-31-C472 | |
| Jumper EZbook 3 | |
| iperf3 receive AX12 | |
| Acer Switch 3 SW312-31-P5VG | |
| Acer Swift 1 SF113-31-P2CP | |
| Acer Aspire 1 A114-31-C472 | |
| Chuwi Lapbook 12.3 | |
| Jumper EZbook 3 | |
| |||||||||||||||||||||||||
iluminación: 81 %
Brillo con batería: 222 cd/m²
Contraste: 1723:1 (Negro: 0.13 cd/m²)
ΔE ColorChecker Calman: 2.4 | ∀{0.5-29.43 Ø4.71}
ΔE Greyscale Calman: 2.5 | ∀{0.09-98 Ø4.96}
98.3% sRGB (Argyll 1.6.3 3D)
63.4% AdobeRGB 1998 (Argyll 1.6.3 3D)
69.5% AdobeRGB 1998 (Argyll 3D)
98.4% sRGB (Argyll 3D)
68% Display P3 (Argyll 3D)
Gamma: 2.31
CCT: 6869 K
| Chuwi Lapbook 12.3 SDC8353, , 2736x1824, 12.3" | Microsoft Surface Pro 4, Core m3 Samsung SDC3853, , 2736x1824, 12.3" | Acer Swift 1 SF113-31-P2CP AU Optronics AUO442D, , 1920x1080, 13.3" | Acer Switch 3 SW312-31-P5VG XR122EA2T, , 1920x1200, 12.2" | Jumper EZbook 3 MS_9003, , 1920x1080, 14.1" | Lenovo E31-80 80MX0107GE AU Optronics B133XTN01.6, , 1366x768, 13.3" | |
|---|---|---|---|---|---|---|
| Display | -1% | -41% | -8% | -23% | -44% | |
| Display P3 Coverage (%) | 68 | 67.5 -1% | 39.24 -42% | 68 0% 58.8 -14% | 51.6 -24% | 37.35 -45% |
| sRGB Coverage (%) | 98.4 | 96.6 -2% | 59 -40% | 91.2 -7% 87.5 -11% | 77.3 -21% | 56.2 -43% |
| AdobeRGB 1998 Coverage (%) | 69.5 | 69 -1% | 40.55 -42% | 66.9 -4% 60.6 -13% | 53 -24% | 38.58 -44% |
| Response Times | 2% | 15% | 22% | 34% | 13% | |
| Response Time Grey 50% / Grey 80% * (ms) | 48.4 ? | 46 ? 5% | 37 ? 24% | 37 ? 24% | 46 ? 5% | 44 ? 9% |
| Response Time Black / White * (ms) | 30.8 ? | 31 ? -1% | 29 ? 6% | 25 ? 19% | 11.6 ? 62% | 26 ? 16% |
| PWM Frequency (Hz) | 50 ? | 20000 ? | 200 ? | |||
| Screen | -7% | -52% | -32% | -226% | -174% | |
| Brightness middle (cd/m²) | 224 | 389.2 74% | 273 22% | 364 63% | 384 71% | 234 4% |
| Brightness (cd/m²) | 219 | 392 79% | 258 18% | 341 56% | 341 56% | 222 1% |
| Brightness Distribution (%) | 81 | 92 14% | 81 0% | 85 5% | 76 -6% | 87 7% |
| Black Level * (cd/m²) | 0.13 | 0.27 -108% | 0.24 -85% | 0.47 -262% | 1.28 -885% | 0.54 -315% |
| Contrast (:1) | 1723 | 1441 -16% | 1138 -34% | 774 -55% | 300 -83% | 433 -75% |
| Colorchecker dE 2000 * | 2.4 | 3.61 -50% | 4.84 -102% | 3.4 -42% | 8.7 -263% | 12.09 -404% |
| Colorchecker dE 2000 max. * | 3.7 | 9.11 -146% | 7.61 -106% | 16.7 -351% | 20.25 -447% | |
| Greyscale dE 2000 * | 2.5 | 3.8 -52% | 5.23 -109% | 1.7 32% | 11.1 -344% | 13 -420% |
| Gamma | 2.31 95% | 2.16 102% | 2.38 92% | 2.36 93% | 2.2 100% | 2.78 79% |
| CCT | 6869 95% | 5969 109% | 7180 91% | 6750 96% | 12445 52% | 15562 42% |
| Color Space (Percent of AdobeRGB 1998) (%) | 63.4 | 63 -1% | 37 -42% | 59 -7% | 36 -43% | |
| Color Space (Percent of sRGB) (%) | 98.3 | 97 -1% | 59 -40% | 91 -7% | 56 -43% | |
| Media total (Programa/Opciones) | -2% /
-4% | -26% /
-41% | -6% /
-18% | -72% /
-139% | -68% /
-123% |
* ... más pequeño es mejor
Tiempos de respuesta del display
| ↔ Tiempo de respuesta de Negro a Blanco | ||
|---|---|---|
| 30.8 ms ... subida ↗ y bajada ↘ combinada | ↗ 16.4 ms subida | 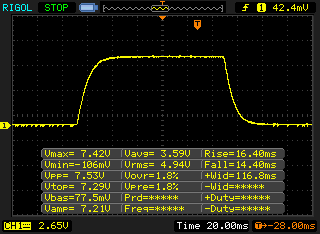 |
| ↘ 14.4 ms bajada | ||
| La pantalla mostró tiempos de respuesta lentos en nuestros tests y podría ser demasiado lenta para los jugones. En comparación, todos los dispositivos de prueba van de ##min### (mínimo) a 240 (máximo) ms. » 83 % de todos los dispositivos son mejores. Eso quiere decir que el tiempo de respuesta es peor que la media (19.8 ms) de todos los dispositivos testados. | ||
| ↔ Tiempo de respuesta 50% Gris a 80% Gris | ||
| 48.4 ms ... subida ↗ y bajada ↘ combinada | ↗ 24.8 ms subida | 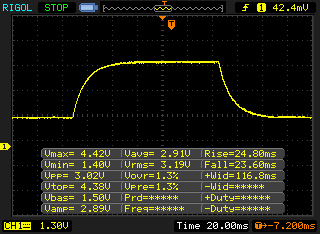 |
| ↘ 23.6 ms bajada | ||
| La pantalla mostró tiempos de respuesta lentos en nuestros tests y podría ser demasiado lenta para los jugones. En comparación, todos los dispositivos de prueba van de ##min### (mínimo) a 636 (máximo) ms. » 84 % de todos los dispositivos son mejores. Eso quiere decir que el tiempo de respuesta es peor que la media (30.9 ms) de todos los dispositivos testados. | ||
Parpadeo de Pantalla / PWM (Pulse-Width Modulation)
| Parpadeo de Pantalla / PWM no detectado | 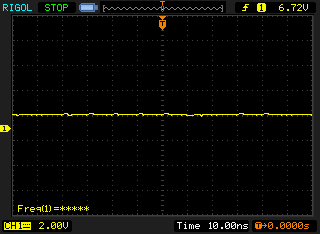 | ||
Comparación: 52 % de todos los dispositivos testados no usaron PWM para atenuar el display. Si se usó, medimos una media de 7748 (mínimo: 5 - máxmo: 343500) Hz. | |||
| Cinebench R15 | |
| CPU Single 64Bit | |
| Microsoft Surface Pro 4, Core i5, 128GB | |
| Lenovo E31-80 80MX0107GE | |
| Cube Thinker m3 | |
| Microsoft Surface Pro 4, Core m3 | |
| Acer Swift 1 SF113-31-P2CP | |
| Acer Switch 3 SW312-31-P5VG | |
| Acer Aspire 1 A114-31-C472 | |
| Jumper EZbook 3 | |
| Chuwi Lapbook 12.3 | |
| CPU Multi 64Bit | |
| Microsoft Surface Pro 4, Core i5, 128GB | |
| Lenovo E31-80 80MX0107GE | |
| Cube Thinker m3 | |
| Microsoft Surface Pro 4, Core m3 | |
| Chuwi Lapbook 12.3 | |
| Acer Switch 3 SW312-31-P5VG | |
| Acer Swift 1 SF113-31-P2CP | |
| Acer Aspire 1 A114-31-C472 | |
| Jumper EZbook 3 | |
| PCMark 8 - Home Score Accelerated v2 | |
| Lenovo E31-80 80MX0107GE | |
| Cube Thinker m3 | |
| Acer Switch 3 SW312-31-P5VG | |
| Acer Swift 1 SF113-31-P2CP | |
| Jumper EZbook 3 | |
| Chuwi Lapbook 12.3 | |
| PCMark 8 Home Score Accelerated v2 | 1461 puntos | |
| PCMark 8 Creative Score Accelerated v2 | 1861 puntos | |
| PCMark 8 Work Score Accelerated v2 | 2152 puntos | |
| PCMark 10 Score | 1269 puntos | |
ayuda | ||
| Chuwi Lapbook 12.3 64 GB eMMC Flash | Microsoft Surface Pro 4, Core i5, 128GB Samsung MZFLV128 NVMe | Acer Switch 3 SW312-31-P5VG Hynix HCG4a2 64 GB | Acer Aspire 1 A114-31-C472 Hynix HBG4a2 32 GB eMMC | Acer Swift 1 SF113-31-P2CP 256 GB NVMe | Lenovo E31-80 80MX0107GE Samsung MZYTY256HDHP | |
|---|---|---|---|---|---|---|
| CrystalDiskMark 3.0 | 1721% | 387% | 435% | 1141% | 2114% | |
| Read Seq (MB/s) | 150.8 | 666 342% | 272.2 81% | 275.7 83% | 450.3 199% | 522 246% |
| Write Seq (MB/s) | 51.5 | 154.2 199% | 149.3 190% | 147.9 187% | 440.1 755% | 457.4 788% |
| Read 512 (MB/s) | 132 | 266.3 102% | 231.6 75% | 233.9 77% | 318.9 142% | 398.1 202% |
| Write 512 (MB/s) | 32.94 | 154.2 368% | 140 325% | 132.1 301% | 387.1 1075% | 303.6 822% |
| Read 4k (MB/s) | 4.93 | 28.51 478% | 11.43 132% | 24.06 388% | 10.78 119% | 35.05 611% |
| Write 4k (MB/s) | 2.42 | 101.5 4094% | 26.31 987% | 28.62 1083% | 57 2255% | 88 3536% |
| Read 4k QD32 (MB/s) | 15.28 | 368.3 2310% | 30.39 99% | 29.93 96% | 130.3 753% | 299.7 1861% |
| Write 4k QD32 (MB/s) | 2.57 | 153.6 5877% | 33.54 1205% | 35.02 1263% | 101 3830% | 229.8 8842% |

| 3DMark 11 - 1280x720 Performance GPU | |
| Lenovo ThinkPad X270 20HN0012PB | |
| Lenovo E31-80 80MX0107GE | |
| Microsoft Surface Pro 4, Core m3 | |
| Acer Switch 3 SW312-31-P5VG | |
| Chuwi Lapbook 12.3 | |
| Acer Swift 1 SF113-31-P2CP | |
| Jumper EZbook 3 | |
| 3DMark 11 Performance | 655 puntos | |
| 3DMark Cloud Gate Standard Score | 2262 puntos | |
| 3DMark Fire Strike Score | 286 puntos | |
| 3DMark Fire Strike Extreme Score | 129 puntos | |
ayuda | ||
| bajo | medio | alto | ultra | |
|---|---|---|---|---|
| BioShock Infinite (2013) | 21.2 | 13 |
(+) La temperatura máxima en la parte superior es de 39.2 °C / 103 F, frente a la media de 35.9 °C / 97 F, que oscila entre 21.4 y 59 °C para la clase Subnotebook.
(+) El fondo se calienta hasta un máximo de 39.4 °C / 103 F, frente a la media de 39.2 °C / 103 F
(+) En reposo, la temperatura media de la parte superior es de 26.5 °C / 80# F, frente a la media del dispositivo de 30.8 °C / 87 F.
(+) Los reposamanos y el panel táctil alcanzan como máximo la temperatura de la piel (34.1 °C / 93.4 F) y, por tanto, no están calientes.
(-) La temperatura media de la zona del reposamanos de dispositivos similares fue de 28.2 °C / 82.8 F (-5.9 °C / -10.6 F).
Chuwi Lapbook 12.3 análisis de audio
(±) | la sonoridad del altavoz es media pero buena (76.4 dB)
Graves 100 - 315 Hz
(-) | casi sin bajos - de media 23.2% inferior a la mediana
(+) | el bajo es lineal (6.5% delta a la frecuencia anterior)
Medios 400 - 2000 Hz
(±) | medias más altas - de media 7.5% más altas que la mediana
(±) | la linealidad de los medios es media (11.7% delta respecto a la frecuencia anterior)
Altos 2 - 16 kHz
(±) | máximos más altos - de media 6.7% más altos que la mediana
(±) | la linealidad de los máximos es media (7.5% delta a frecuencia anterior)
Total 100 - 16.000 Hz
(-) | el sonido global no es lineal (31.2% de diferencia con la mediana)
En comparación con la misma clase
» 93% de todos los dispositivos probados de esta clase eran mejores, 1% similares, 5% peores
» El mejor tuvo un delta de 5%, la media fue 18%, el peor fue ###max##%
En comparación con todos los dispositivos probados
» 90% de todos los dispositivos probados eran mejores, 2% similares, 8% peores
» El mejor tuvo un delta de 4%, la media fue 23%, el peor fue ###max##%
Acer Switch 3 SW312-31-P5VG análisis de audio
(-) | altavoces no muy altos (#63 dB)
Graves 100 - 315 Hz
(-) | casi sin bajos - de media 28.4% inferior a la mediana
(+) | el bajo es lineal (5.1% delta a la frecuencia anterior)
Medios 400 - 2000 Hz
(±) | medios reducidos - de media 6.7% inferior a la mediana
(±) | la linealidad de los medios es media (14.4% delta respecto a la frecuencia anterior)
Altos 2 - 16 kHz
(+) | máximos equilibrados - a sólo 2.4% de la mediana
(+) | los máximos son lineales (5.6% delta a la frecuencia anterior)
Total 100 - 16.000 Hz
(-) | el sonido global no es lineal (33.2% de diferencia con la mediana)
En comparación con la misma clase
» 93% de todos los dispositivos probados de esta clase eran mejores, 1% similares, 6% peores
» El mejor tuvo un delta de 6%, la media fue 20%, el peor fue ###max##%
En comparación con todos los dispositivos probados
» 92% de todos los dispositivos probados eran mejores, 1% similares, 7% peores
» El mejor tuvo un delta de 4%, la media fue 23%, el peor fue ###max##%
| Chuwi Lapbook 12.3 Celeron N3450, 12.3", 2736x1824 | Acer Swift 1 SF113-31-P2CP Pentium N4200, 13.3", 1920x1080 | Jumper EZbook 3 Celeron N3350, 14.1", 1920x1080 | Cube Thinker m3 m3-7Y30, 13.5", 3000x2000 | Lenovo E31-80 80MX0107GE 6200U, 13.3", 1366x768 | Microsoft Surface Pro 4, Core i5, 128GB 6300U, 12.3", 2736x1824 | |
|---|---|---|---|---|---|---|
| Power Consumption | 20% | 32% | -12% | -6% | -2% | |
| Idle Minimum * (Watt) | 5.9 | 3.4 42% | 3.18 46% | 4.5 24% | 5.6 5% | 4.4 25% |
| Idle Average * (Watt) | 7.7 | 7 9% | 6.14 20% | 10.3 -34% | 6.8 12% | 9 -17% |
| Idle Maximum * (Watt) | 8.6 | 9.1 -6% | 6.4 26% | 11.5 -34% | 7.5 13% | 10.7 -24% |
| Load Average * (Watt) | 18.2 | 15.2 16% | 13.3 27% | 23.3 -28% | 26.9 -48% | 19.6 -8% |
| Load Maximum * (Watt) | 23.6 | 14.7 38% | 13.6 42% | 21.1 11% | 26.4 -12% | 19.9 16% |
* ... más pequeño es mejor
| Off / Standby | |
| Ocioso | |
| Carga |
|
Clave:
min: | |
Pro
Contra
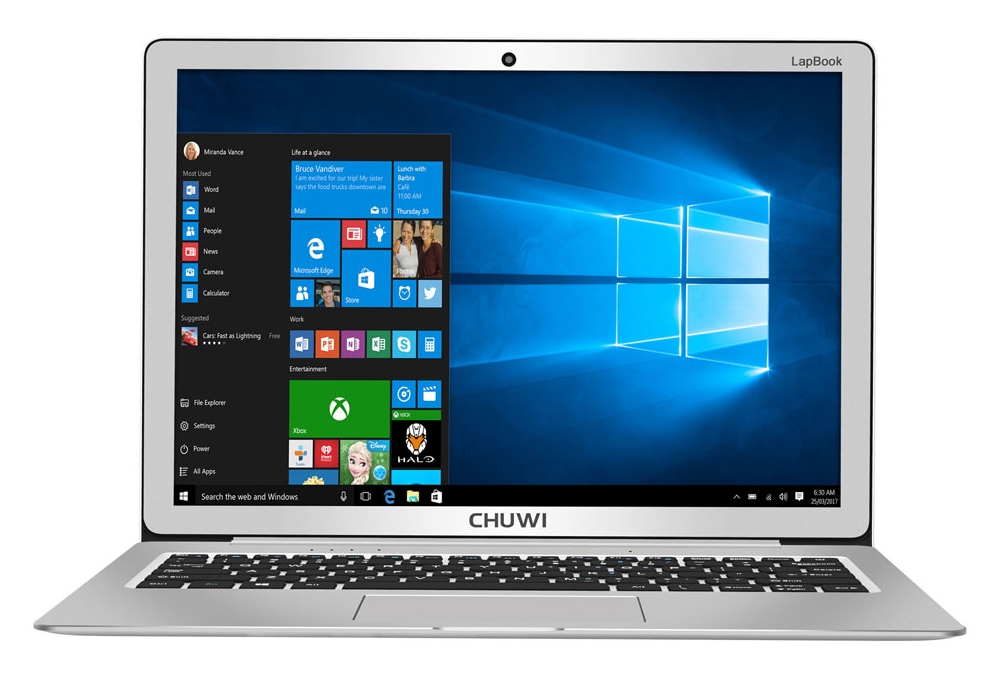
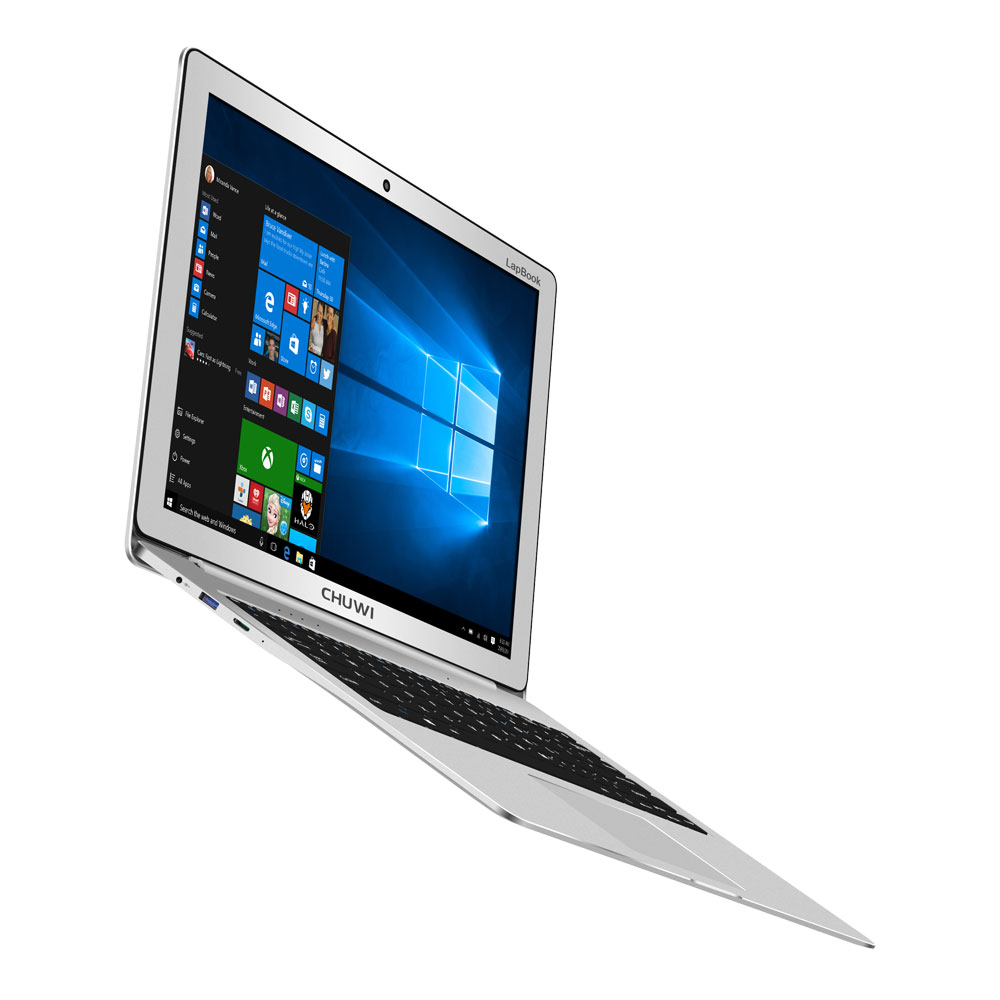
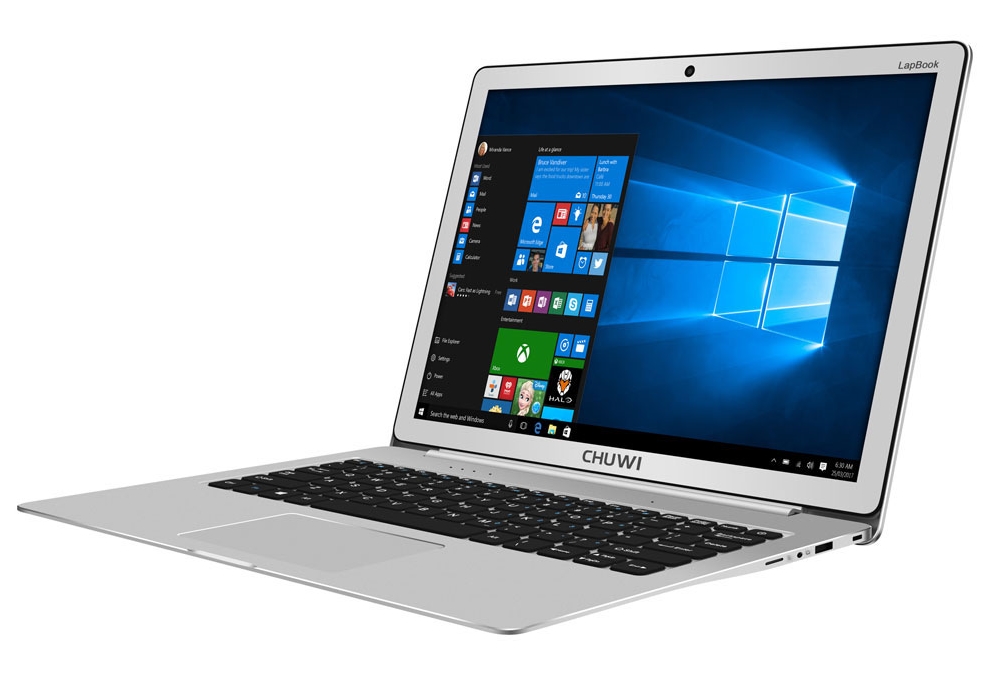
Nos ha sorprendido positivamente el Chuwi LapBook 12.3. Los modelos de prueba en este rango de precios generalmente están equipados con carcasas de plástico y pantallas mediocres. El chasis de aluminio del LapBook 12.3 por otro lado se siente premium, y te hace creer que cuesta un precio de cuatro dígitos cuando ves un video en la pantalla de alta resolución.
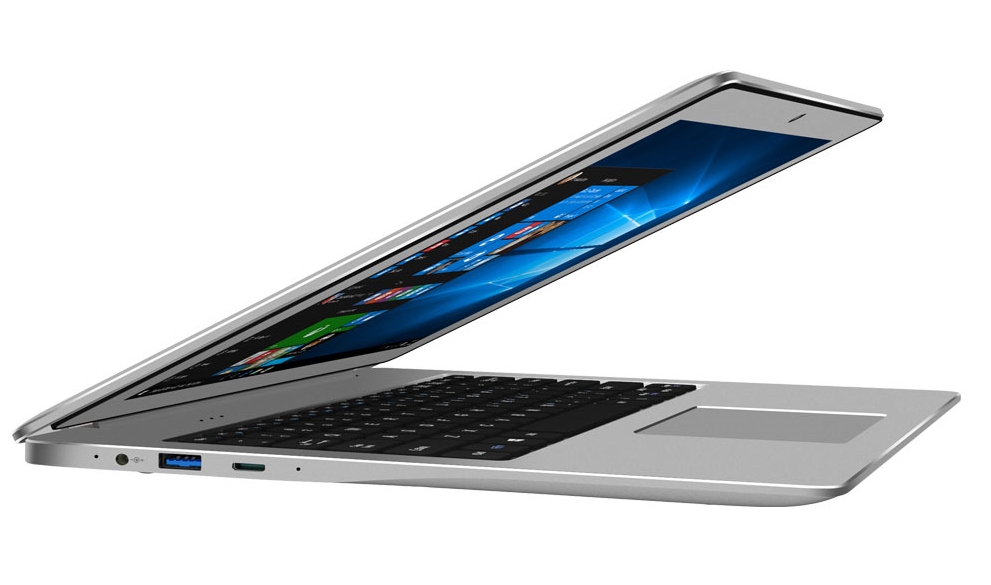
Las otras secciones, especialmente el rendimiento, están mucho más en línea con el precio. Aún así, las tareas diarias no son un problema para el pequeño procesador de cuatro núcleos, y lo mismo se aplica para la reproducción de películas de alta resolución. El LapBook 12.3 no tiene problemas serios en general. Creemos que se podrían mejorar dos áreas: el muy buen panel podría ser más brillante, y el Surface Pro 4 muestra que todavía hay mucho espacio. Sin embargo, el consumo de energía probablemente sea mucho mayor a cambio. También habría sido agradable tener un teclado iluminado.
Ésta es una versión acortada del análisis original. Puedes leer el análisis completo en inglés aquí.
Chuwi Lapbook 12.3
- 10/16/2017 v6 (old)
Andreas Osthoff, Benjamin Herzig
Price comparison
