Breve análisis del portátil Lenovo IdeaPad 320-17AST (E2-9000, HD )
| SD Card Reader | |
| average JPG Copy Test (av. of 3 runs) | |
| Lenovo Ideapad 320-17AST-80XW0013GE (Toshiba Exceria Pro SDXC 64 GB UHS-II) | |
| HP 17-y044ng (Toshiba Exceria Pro SDXC 64 GB UHS-II) | |
| HP 17-x066ng (Toshiba Exceria Pro SDXC 64 GB UHS-II) | |
| maximum AS SSD Seq Read Test (1GB) | |
| HP 17-y044ng (Toshiba Exceria Pro SDXC 64 GB UHS-II) | |
| Lenovo Ideapad 320-17AST-80XW0013GE (Toshiba Exceria Pro SDXC 64 GB UHS-II) | |
| HP 17-x066ng (Toshiba Exceria Pro SDXC 64 GB UHS-II) | |
| Networking | |
| iperf3 transmit AX12 | |
| Lenovo Ideapad 320-17AST-80XW0013GE | |
| HP 17-x066ng | |
| HP 17-y044ng (jseb) | |
| iperf3 receive AX12 | |
| Lenovo Ideapad 320-17AST-80XW0013GE | |
| HP 17-x066ng | |
| HP 17-y044ng (jseb) | |
| |||||||||||||||||||||||||
iluminación: 81 %
Brillo con batería: 232 cd/m²
Contraste: 373:1 (Negro: 0.55 cd/m²)
ΔE ColorChecker Calman: 11.26 | ∀{0.5-29.43 Ø4.71}
ΔE Greyscale Calman: 13.85 | ∀{0.09-98 Ø4.96}
73% sRGB (Argyll 1.6.3 3D)
47% AdobeRGB 1998 (Argyll 1.6.3 3D)
52.1% AdobeRGB 1998 (Argyll 3D)
73.3% sRGB (Argyll 3D)
50.5% Display P3 (Argyll 3D)
Gamma: 2.48
CCT: 15307 K
| Lenovo Ideapad 320-17AST-80XW0013GE TN LED, 1600x900, 17.3" | HP 17-x066ng IPS, 1920x1080, 17.3" | HP 17-y044ng TN LED, 1600x900, 17.3" | Acer Aspire ES1-731-P4A6 TN LED, 1600x900, 17.3" | |
|---|---|---|---|---|
| Display | 22% | 1% | 10% | |
| Display P3 Coverage (%) | 50.5 | 63.6 26% | 50.9 1% | 55.4 10% |
| sRGB Coverage (%) | 73.3 | 86.5 18% | 73.8 1% | 80.1 9% |
| AdobeRGB 1998 Coverage (%) | 52.1 | 63.3 21% | 52.6 1% | 57.3 10% |
| Response Times | -13% | -12% | -21% | |
| Response Time Grey 50% / Grey 80% * (ms) | 40 ? | 38 ? 5% | 43 ? -8% | 41 ? -2% |
| Response Time Black / White * (ms) | 20 ? | 26 ? -30% | 23 ? -15% | 28 ? -40% |
| PWM Frequency (Hz) | 199 ? | |||
| Screen | 54% | 7% | 25% | |
| Brightness middle (cd/m²) | 205 | 331 61% | 264 29% | 219 7% |
| Brightness (cd/m²) | 209 | 310 48% | 232 11% | 224 7% |
| Brightness Distribution (%) | 81 | 87 7% | 80 -1% | 91 12% |
| Black Level * (cd/m²) | 0.55 | 0.33 40% | 0.59 -7% | 0.31 44% |
| Contrast (:1) | 373 | 1003 169% | 447 20% | 706 89% |
| Colorchecker dE 2000 * | 11.26 | 4.58 59% | 10.58 6% | 9.31 17% |
| Colorchecker dE 2000 max. * | 19.86 | 7.83 61% | 18.96 5% | 13.74 31% |
| Greyscale dE 2000 * | 13.85 | 6.18 55% | 13.13 5% | 10.87 22% |
| Gamma | 2.48 89% | 2.34 94% | 2.49 88% | 2.9 76% |
| CCT | 15307 42% | 6076 107% | 14044 46% | 11513 56% |
| Color Space (Percent of AdobeRGB 1998) (%) | 47 | 56 19% | 48 2% | 52 11% |
| Color Space (Percent of sRGB) (%) | 73 | 86 18% | 74 1% | 80 10% |
| Media total (Programa/Opciones) | 21% /
38% | -1% /
3% | 5% /
16% |
* ... más pequeño es mejor
Parpadeo de Pantalla / PWM (Pulse-Width Modulation)
| Parpadeo de Pantalla / PWM no detectado | ||
Comparación: 52 % de todos los dispositivos testados no usaron PWM para atenuar el display. Si se usó, medimos una media de 7741 (mínimo: 5 - máxmo: 343500) Hz. | ||
Tiempos de respuesta del display
| ↔ Tiempo de respuesta de Negro a Blanco | ||
|---|---|---|
| 20 ms ... subida ↗ y bajada ↘ combinada | ↗ 16 ms subida | 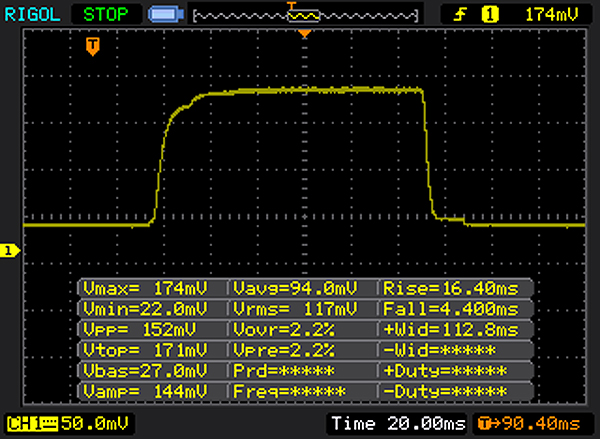 |
| ↘ 4 ms bajada | ||
| La pantalla mostró buenos tiempos de respuesta en nuestros tests pero podría ser demasiado lenta para los jugones competitivos. En comparación, todos los dispositivos de prueba van de ##min### (mínimo) a 240 (máximo) ms. » 44 % de todos los dispositivos son mejores. Eso quiere decir que el tiempo de respuesta es similar al dispositivo testado medio (19.8 ms). | ||
| ↔ Tiempo de respuesta 50% Gris a 80% Gris | ||
| 40 ms ... subida ↗ y bajada ↘ combinada | ↗ 22 ms subida | 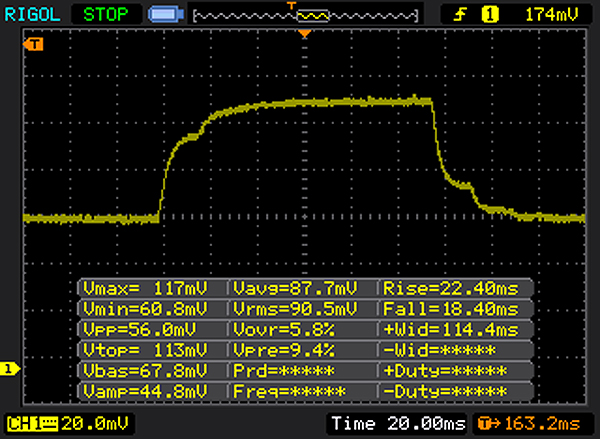 |
| ↘ 18 ms bajada | ||
| La pantalla mostró tiempos de respuesta lentos en nuestros tests y podría ser demasiado lenta para los jugones. En comparación, todos los dispositivos de prueba van de ##min### (mínimo) a 636 (máximo) ms. » 61 % de todos los dispositivos son mejores. Eso quiere decir que el tiempo de respuesta es peor que la media (30.9 ms) de todos los dispositivos testados. | ||
| Geekbench 4.4 | |
| 64 Bit Multi-Core Score | |
| Asus VivoBook Flip 12 TP203NAH-BP049T | |
| Dell Latitude 3180 | |
| Lenovo Ideapad 320-17AST-80XW0013GE | |
| 64 Bit Single-Core Score | |
| Asus VivoBook Flip 12 TP203NAH-BP049T | |
| Lenovo Ideapad 320-17AST-80XW0013GE | |
| Dell Latitude 3180 | |
| PCMark 7 Score | 2185 puntos | |
| PCMark 8 Home Score Accelerated v2 | 1844 puntos | |
| PCMark 8 Creative Score Accelerated v2 | 2119 puntos | |
| PCMark 8 Work Score Accelerated v2 | 3225 puntos | |
| PCMark 10 Score | 1385 puntos | |
ayuda | ||
| PCMark 8 - Home Score Accelerated v2 | |
| HP 17-x066ng | |
| HP 17-y044ng | |
| Lenovo Ideapad 320-17AST-80XW0013GE | |
| Acer Aspire ES1-731G-P5UR | |

| Lenovo Ideapad 320-17AST-80XW0013GE Seagate Mobile HDD 1TB ST1000LM035 | HP 17-x066ng WDC WD10JPVX-08JC3T5 | HP 17-y044ng WDC Scorpio Blue WD10JPVX-75JC3T0 | Acer Aspire ES1-731G-P5UR Toshiba MQ01ABD100 | |
|---|---|---|---|---|
| CrystalDiskMark 3.0 | 86% | 83% | 74% | |
| Read Seq (MB/s) | 98.6 | 98.6 0% | 105.5 7% | 105 6% |
| Write Seq (MB/s) | 87 | 98.2 13% | 102 17% | 96 10% |
| Read 512 (MB/s) | 30.3 | 33.8 12% | 19.17 -37% | 32.89 9% |
| Write 512 (MB/s) | 92.2 | 45.98 -50% | 28.27 -69% | 25.77 -72% |
| Read 4k (MB/s) | 0.448 | 0.395 -12% | 0.328 -27% | 0.324 -28% |
| Write 4k (MB/s) | 0.316 | 0.96 204% | 1.013 221% | 0.755 139% |
| Read 4k QD32 (MB/s) | 1.088 | 1.039 -5% | 0.891 -18% | 0.892 -18% |
| Write 4k QD32 (MB/s) | 0.154 | 0.959 523% | 1.03 569% | 1 549% |
| 3DMark 05 Standard | 6853 puntos | |
| 3DMark 06 Standard Score | 3809 puntos | |
| 3DMark Vantage P Result | 2136 puntos | |
| 3DMark 11 Performance | 788 puntos | |
| 3DMark Ice Storm Standard Score | 26099 puntos | |
| 3DMark Cloud Gate Standard Score | 2187 puntos | |
| 3DMark Fire Strike Score | 477 puntos | |
ayuda | ||
| 3DMark 11 - 1280x720 Performance GPU | |
| Lenovo Ideapad 110-17IKB 80VK0001GE | |
| Lenovo V320-17IKB 81AH0002GE | |
| HP 17-y044ng | |
| Acer Aspire ES1-731G-P5UR | |
| HP 17-x066ng | |
| Dell Latitude 3180 | |
| Acer Aspire E5-722-662J | |
| Lenovo Ideapad 320-17AST-80XW0013GE | |
| Acer Aspire ES1-533-P7WA | |
| Acer Aspire E5-722-2611 | |
| Asus VivoBook Flip 12 TP203NAH-BP049T | |
| Lenovo G70-35 80Q5000BGE | |
| bajo | medio | alto | ultra | |
|---|---|---|---|---|
| World of Warcraft (2005) | 65.2 | 33.2 | ||
| Dirt 3 (2011) | 55.7 | 28.1 | 22.1 | |
| Deus Ex Human Revolution (2011) | 41 | 20.3 | ||
| The Elder Scrolls V: Skyrim (2011) | 24.7 | 16.3 | 10.8 | |
| Anno 2070 (2011) | 48.8 | 22.3 | 13.9 | |
| Diablo III (2012) | 28.5 | 17.8 | 15.9 | |
| Counter-Strike: GO (2012) | 26.9 | 21.7 | 20 | |
| Dead Space 3 (2013) | 43.5 | 20.8 | 16.5 | |
| Tomb Raider (2013) | 35.7 | 15.7 | 11.1 | |
| BioShock Infinite (2013) | 36.8 | 18.1 | 14.2 | |
| GRID 2 (2013) | 39.5 | 20.7 | 12.6 | |
| GRID: Autosport (2014) | 46 | 16.9 | ||
| Sims 4 (2014) | 82.1 | 20.7 | ||
| F1 2014 (2014) | 28 | 18 | ||
| Metal Gear Solid V (2015) | 23.6 | 18.5 | ||
| Dota 2 Reborn (2015) | 28.7 | 18.4 | ||
| World of Warships (2015) | 25.5 | 20.3 | ||
| Overwatch (2016) | 17.5 | 15 | ||
| Farming Simulator 17 (2016) | 43.5 | 26.4 | ||
| Prey (2017) | 9.4 | |||
| Rocket League (2017) | 30.8 | |||
| Team Fortress 2 (2017) | 19.7 | 18.5 |
Ruido
| Ocioso |
| 31 / 31 / 31 dB(A) |
| HDD |
| 32.1 dB(A) |
| DVD |
| 34.8 / dB(A) |
| Carga |
| 22.6 / 32.2 dB(A) |
 | ||
30 dB silencioso 40 dB(A) audible 50 dB(A) ruidosamente alto |
||
min: | ||
(+) La temperatura máxima en la parte superior es de 29.6 °C / 85 F, frente a la media de 34.3 °C / 94 F, que oscila entre 21.2 y 62.5 °C para la clase Office.
(+) El fondo se calienta hasta un máximo de 33.4 °C / 92 F, frente a la media de 36.8 °C / 98 F
(+) En reposo, la temperatura media de la parte superior es de 25.4 °C / 78# F, frente a la media del dispositivo de 29.5 °C / 85 F.
(+) El reposamanos y el panel táctil están a una temperatura inferior a la de la piel, con un máximo de 27.9 °C / 82.2 F y, por tanto, son fríos al tacto.
(±) La temperatura media de la zona del reposamanos de dispositivos similares fue de 27.6 °C / 81.7 F (-0.3 °C / -0.5 F).
Lenovo Ideapad 320-17AST-80XW0013GE análisis de audio
(-) | altavoces no muy altos (#68.9 dB)
Graves 100 - 315 Hz
(-) | casi sin bajos - de media 21.4% inferior a la mediana
(±) | la linealidad de los graves es media (14.7% delta a frecuencia anterior)
Medios 400 - 2000 Hz
(+) | medios equilibrados - a sólo 2.1% de la mediana
(±) | la linealidad de los medios es media (8.6% delta respecto a la frecuencia anterior)
Altos 2 - 16 kHz
(+) | máximos equilibrados - a sólo 4.8% de la mediana
(±) | la linealidad de los máximos es media (8% delta a frecuencia anterior)
Total 100 - 16.000 Hz
(±) | la linealidad del sonido global es media (20.8% de diferencia con la mediana)
En comparación con la misma clase
» 49% de todos los dispositivos probados de esta clase eran mejores, 9% similares, 42% peores
» El mejor tuvo un delta de 7%, la media fue 21%, el peor fue ###max##%
En comparación con todos los dispositivos probados
» 56% de todos los dispositivos probados eran mejores, 8% similares, 36% peores
» El mejor tuvo un delta de 4%, la media fue 23%, el peor fue ###max##%
Apple MacBook 12 (Early 2016) 1.1 GHz análisis de audio
(+) | los altavoces pueden reproducir a un volumen relativamente alto (#83.6 dB)
Graves 100 - 315 Hz
(±) | lubina reducida - en promedio 11.3% inferior a la mediana
(±) | la linealidad de los graves es media (14.2% delta a frecuencia anterior)
Medios 400 - 2000 Hz
(+) | medios equilibrados - a sólo 2.4% de la mediana
(+) | los medios son lineales (5.5% delta a la frecuencia anterior)
Altos 2 - 16 kHz
(+) | máximos equilibrados - a sólo 2% de la mediana
(+) | los máximos son lineales (4.5% delta a la frecuencia anterior)
Total 100 - 16.000 Hz
(+) | el sonido global es lineal (10.2% de diferencia con la mediana)
En comparación con la misma clase
» 7% de todos los dispositivos probados de esta clase eran mejores, 2% similares, 90% peores
» El mejor tuvo un delta de 5%, la media fue 18%, el peor fue ###max##%
En comparación con todos los dispositivos probados
» 5% de todos los dispositivos probados eran mejores, 1% similares, 94% peores
» El mejor tuvo un delta de 4%, la media fue 23%, el peor fue ###max##%
| Off / Standby | |
| Ocioso | |
| Carga |
|
Clave:
min: | |
| Battery Runtime - WiFi Websurfing | |
| HP 17-x066ng | |
| Lenovo V320-17IKB 81AH0002GE | |
| Acer Aspire ES1-731G-P5UR | |
| HP 17-y044ng | |
| Lenovo Ideapad 320-17AST-80XW0013GE | |
Pro
Contra
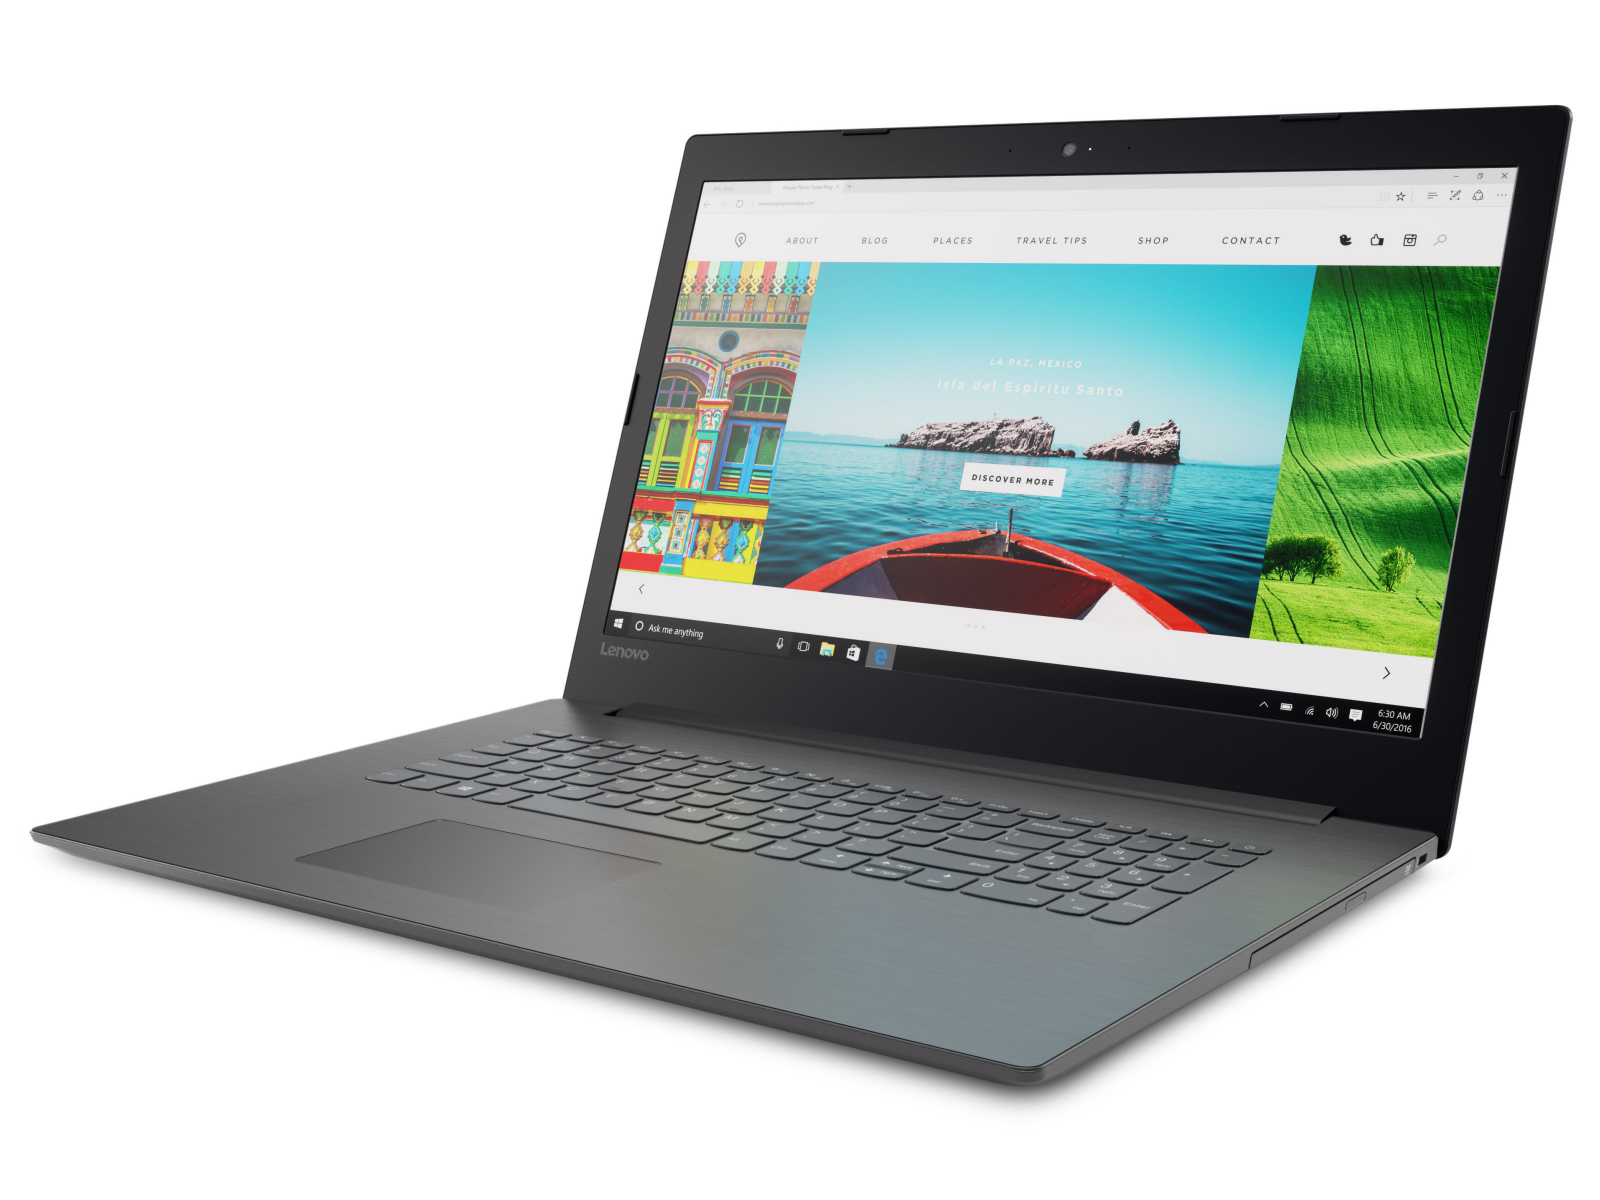
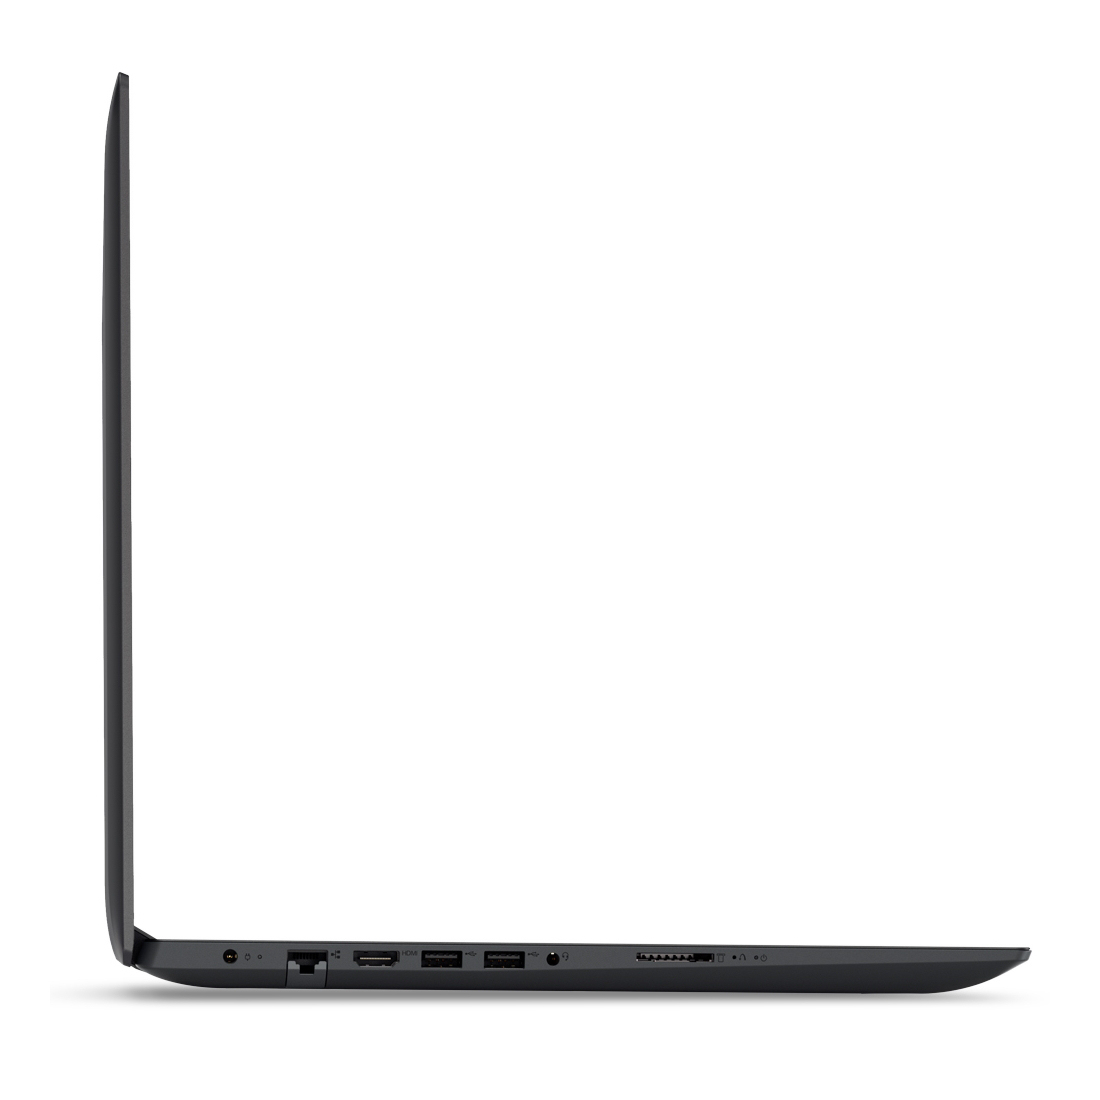
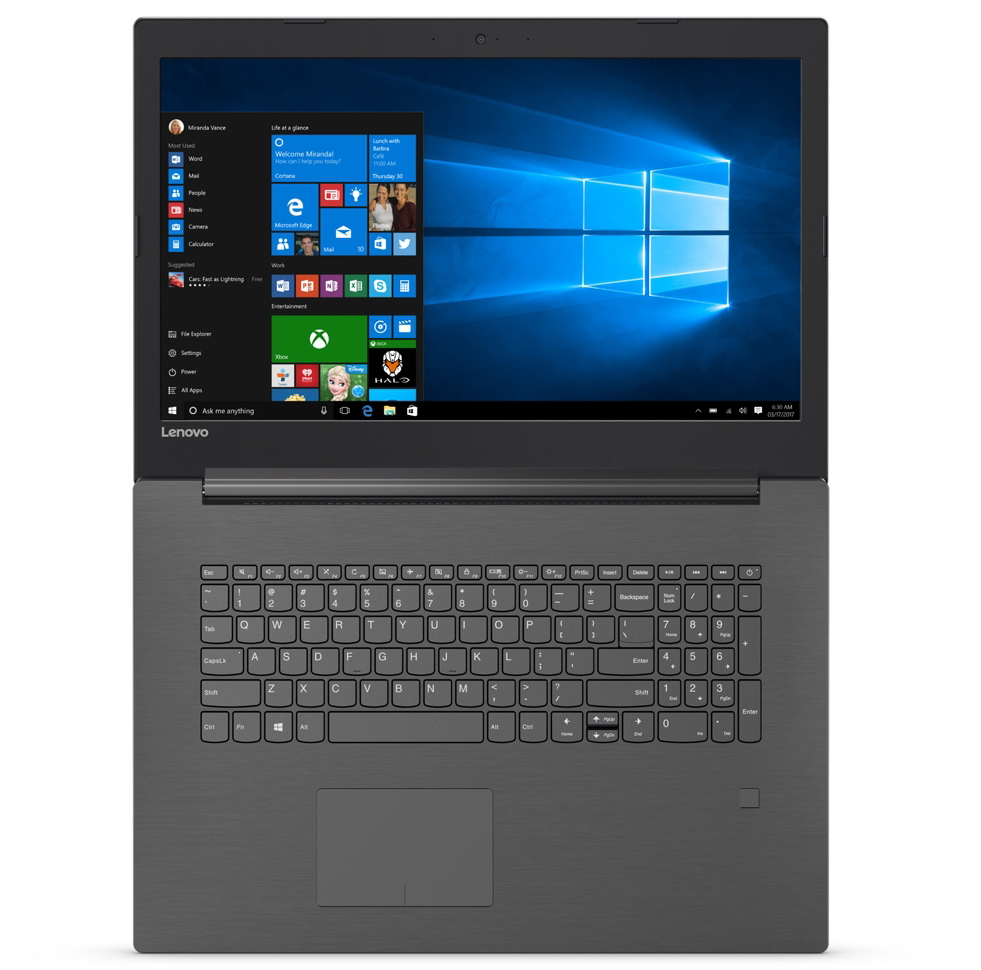
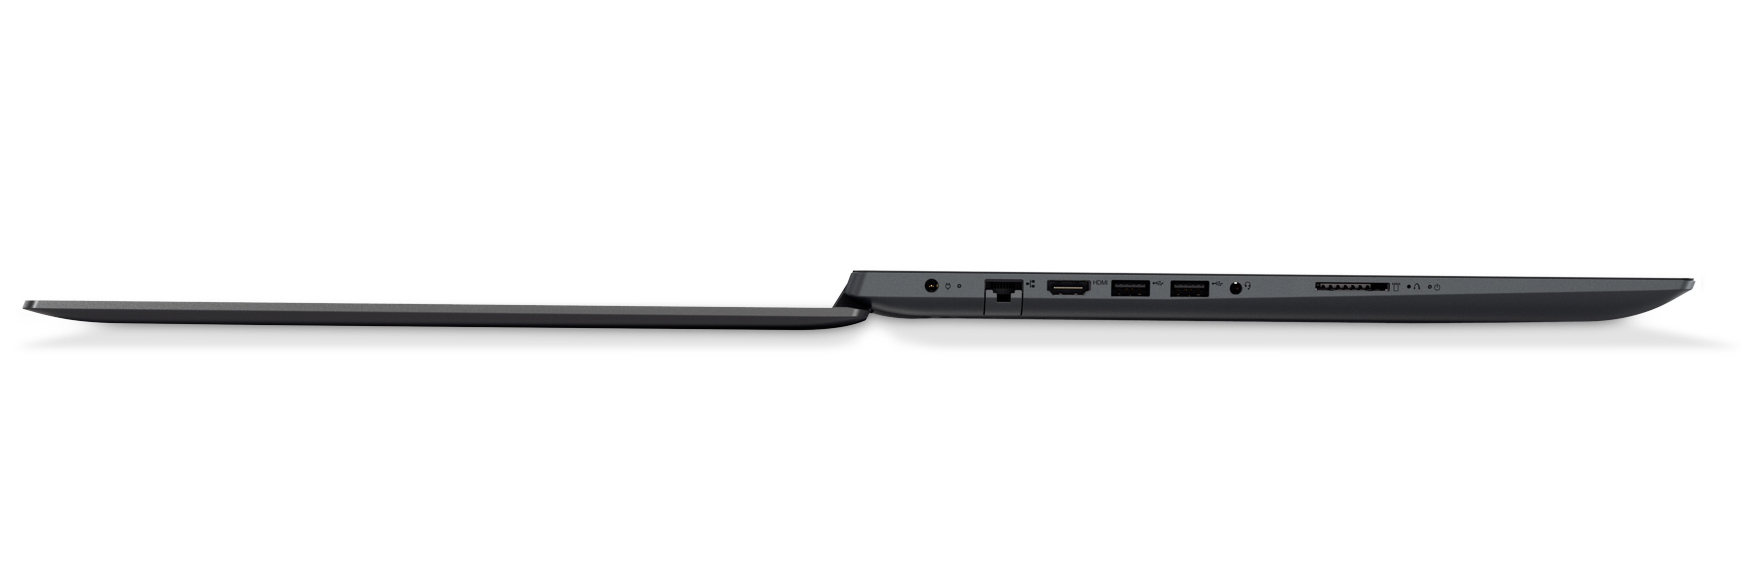
El Lenovo IdeaPad 320-17AST es un portátil de oficina de 17.3" para su escritorio en casa. La APU que contiene es adecuada para aplicaciones simples de oficina e Internet. Los posibles compradores deben ser conscientes de que la APU alcanza rápidamente sus límites. Por ejemplo, cuando varios sitios web están abiertos simultáneamente en el navegador.
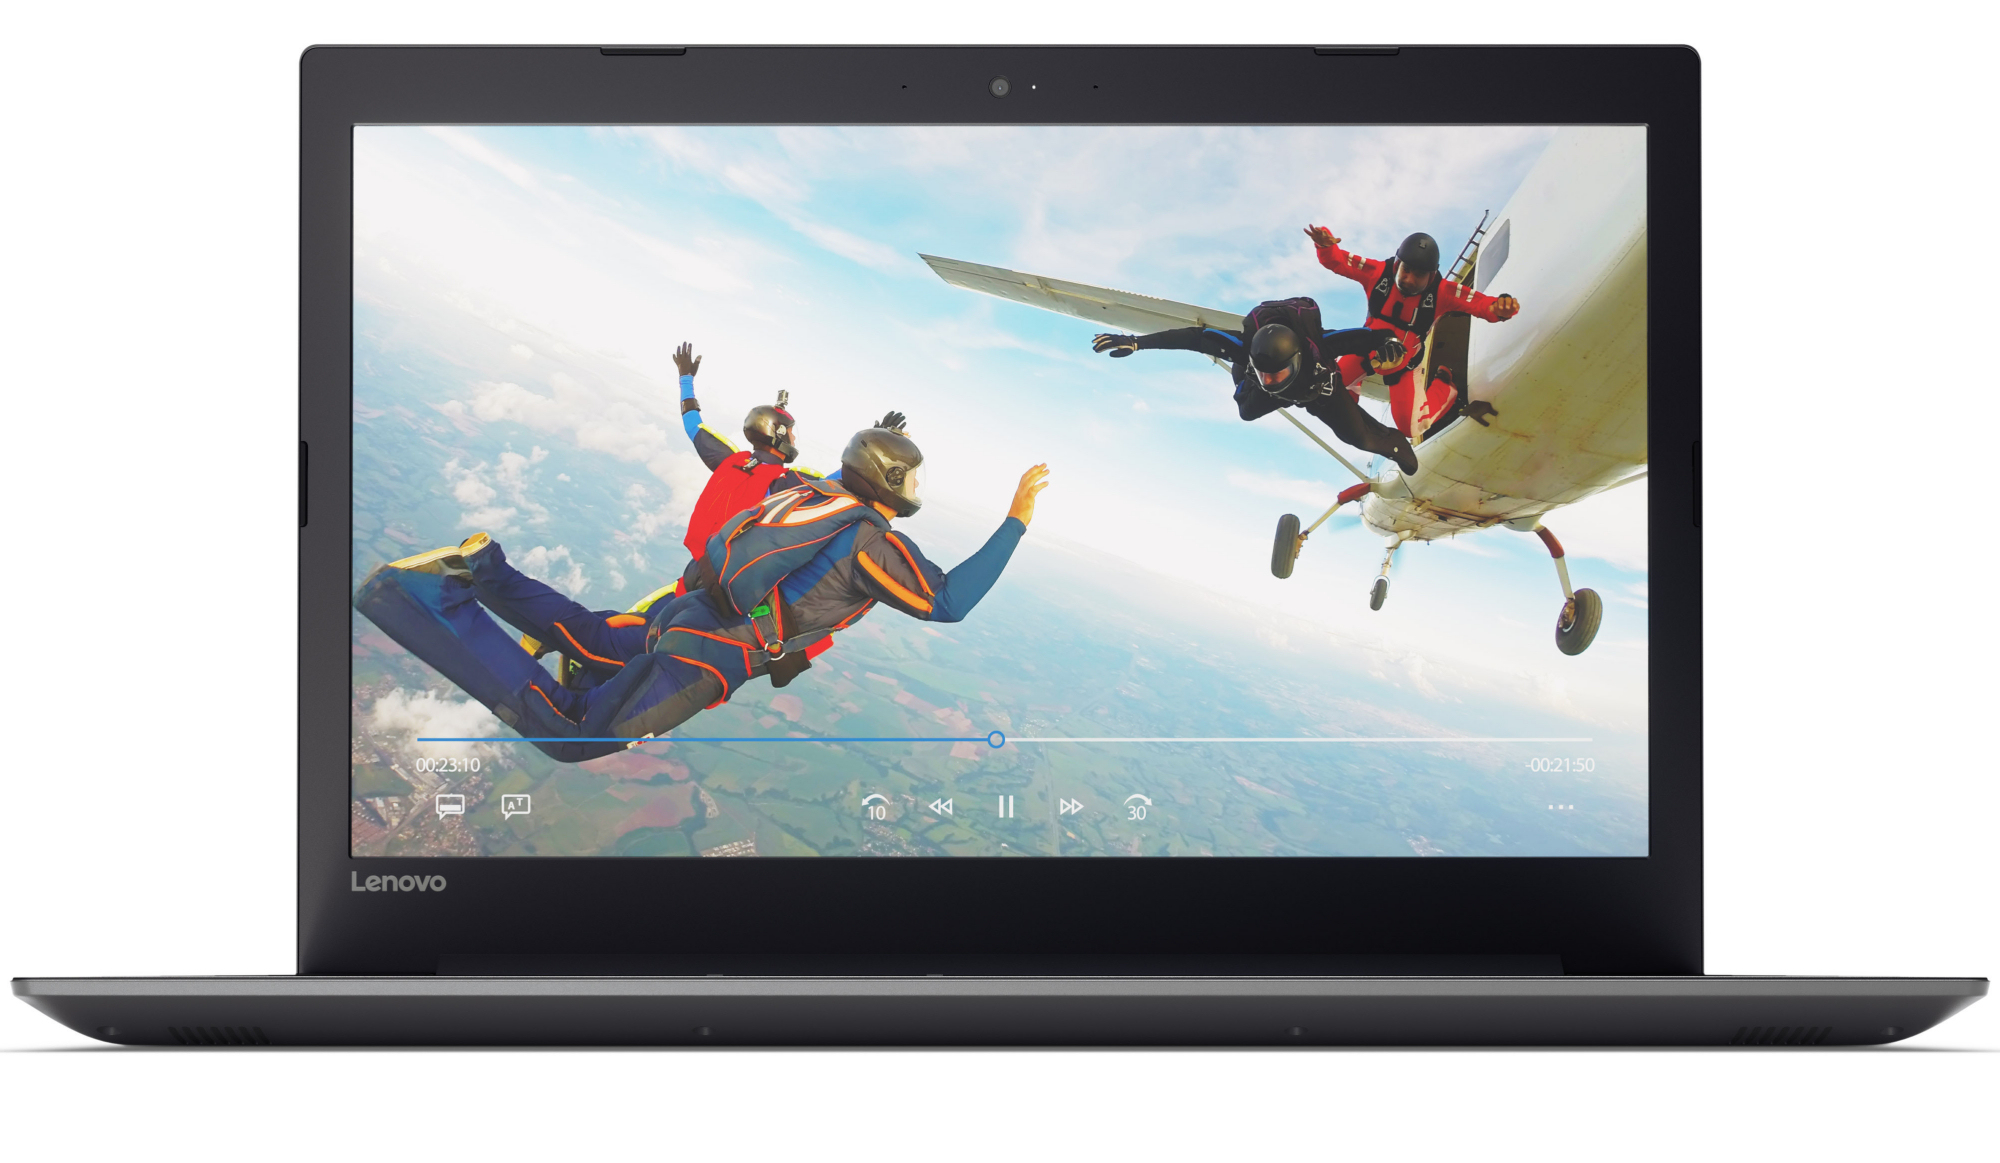
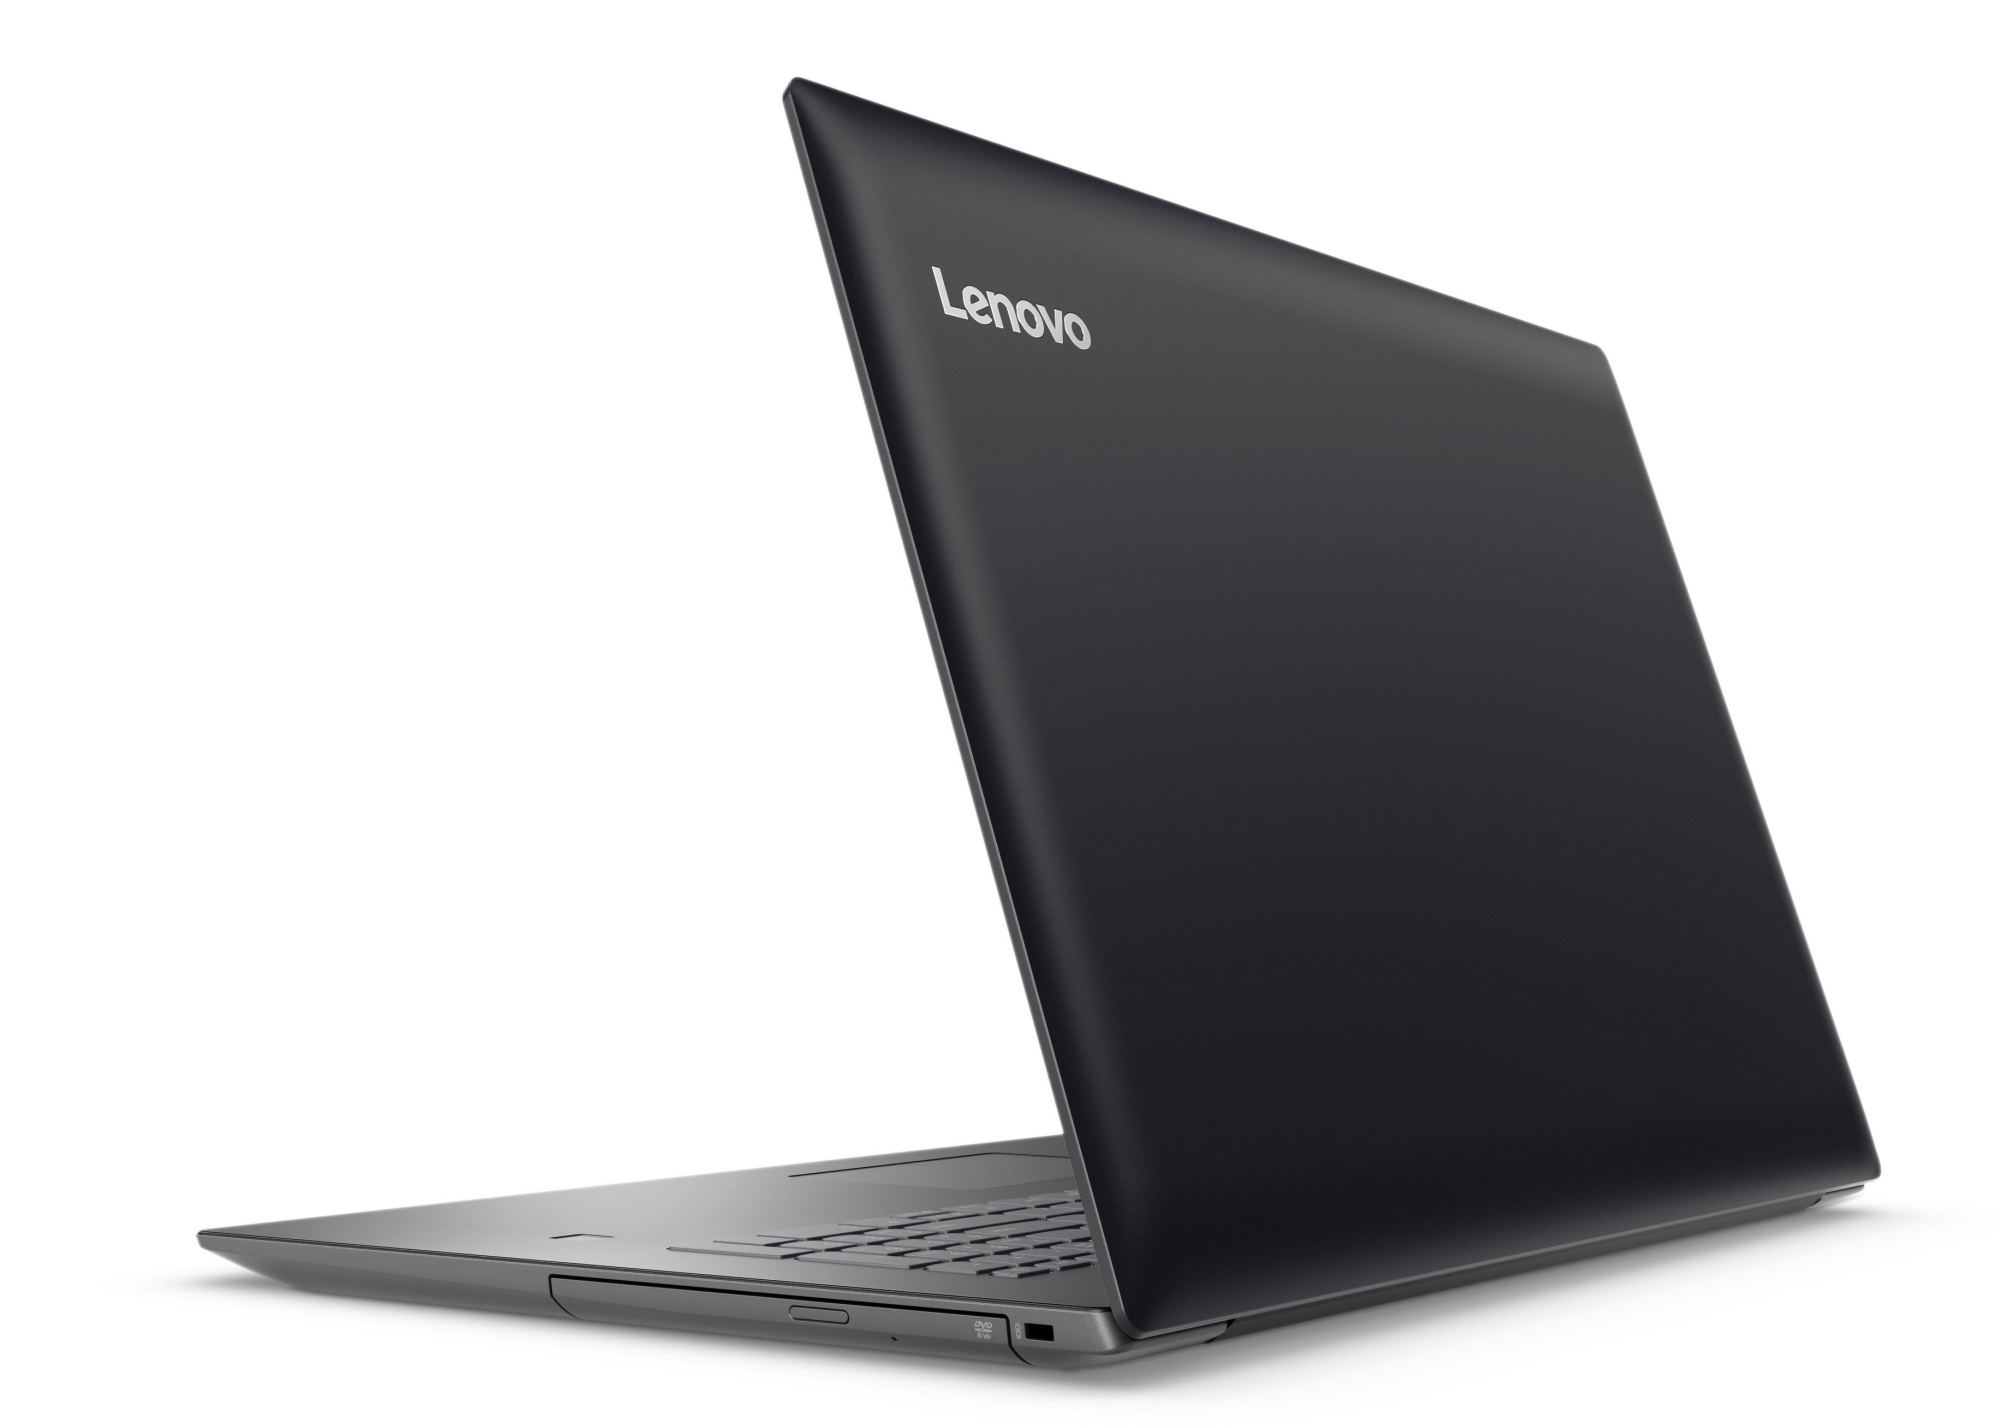
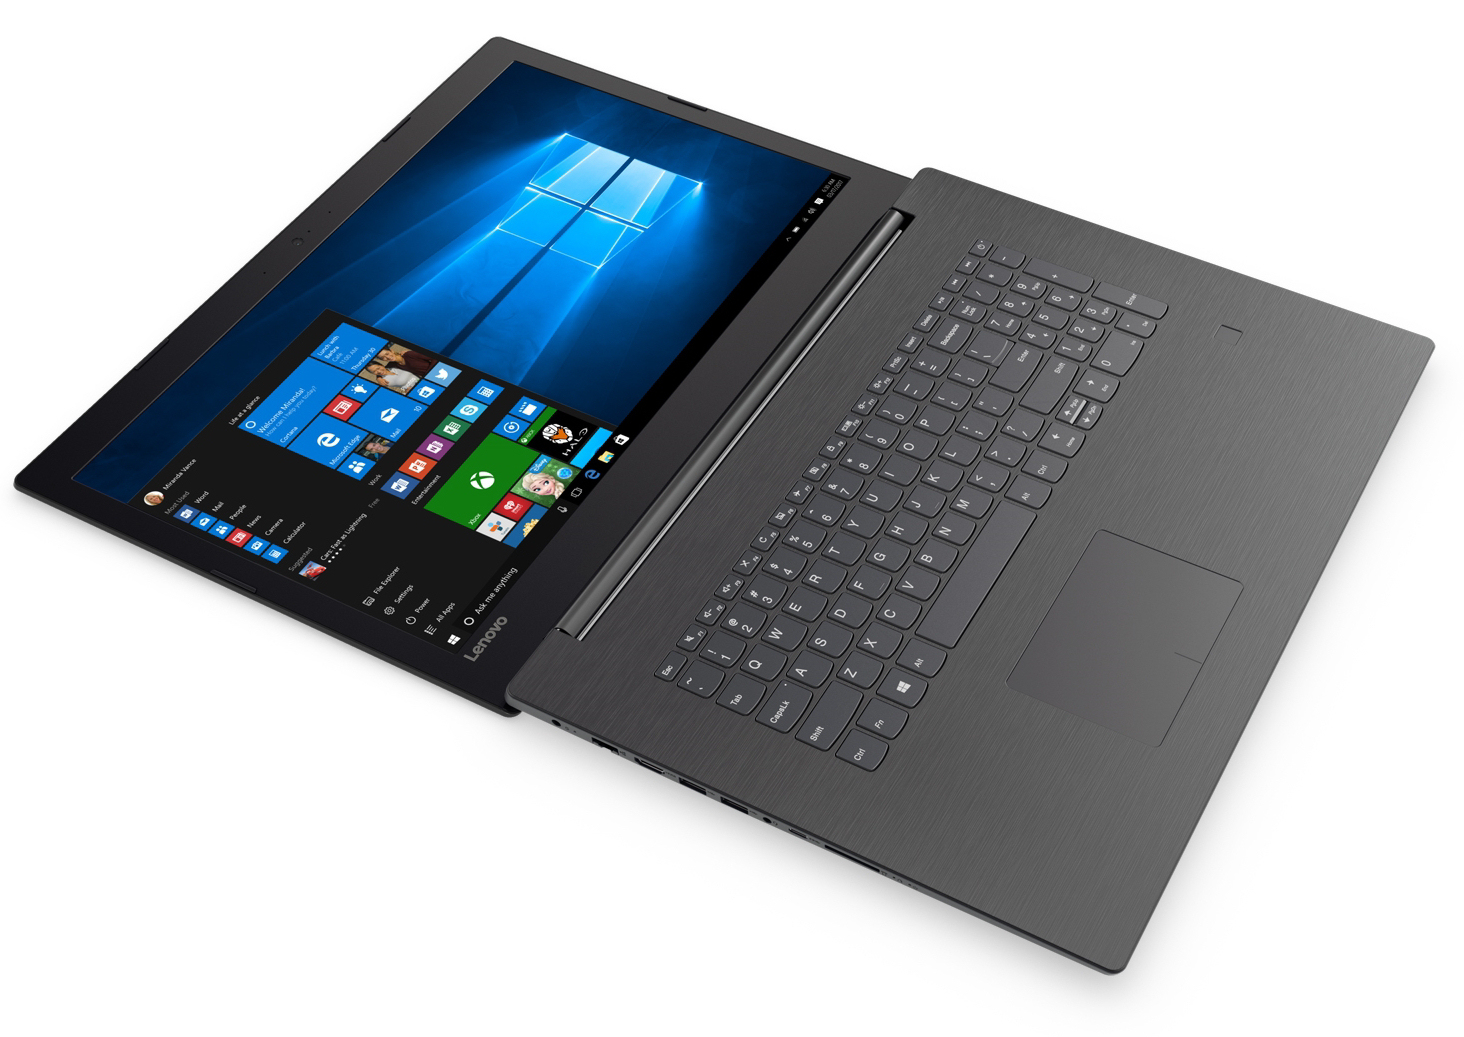
El portátil apenas se calienta y es muy silencioso incluso bajo carga. No le faltará espacio de almacenamiento gracias al disco duro de 1 TB, que también podría intercambiarse por una SSD. Sin embargo, para hacerlo, habría que abrir el dispositivo, y no tiene escotilla de mantenimiento. El teclado nos dio una buena impresión y es adecuado para mecanografiar con regularidad. La pantalla mate de 17.3" no nos pudo convencer: es oscura, tiene poco contraste y tiene malos ángulos de visión.
El principal problema del IdeaPad 320-17AST es su precio.
En Europa, nuestro dispositivo está disponible por alrededor de 460 Euros, y es un precio bastante alto para un dispositivo de tan baja potencia. Si está interesado en un IdeaPad, le recomendamos que piense en otro modelo.
El modelo 80XW0018GE puede ser una buena opción, por ejemplo, ya que está equipado con la APU A9-9420 que es más fuerte. El dispositivo también está disponible por aproximadamente 460 Euros, pero no está equipado con un sistema operativo Windows. Sin embargo, se puede comprar una licencia usada de Windows 7 o Windows 8.1 por entre $ 5 y $ 10, con la cual puede instalar fácilmente Windows 10.
Ésta es una versión acortada del análisis original. Puedes leer el análisis completo en inglés Lenovo IdeaPad 320-17AST (E2-9000, HD+) Laptop Reviewaquí.
Lenovo Ideapad 320-17AST-80XW0013GE
- 10/10/2017 v6 (old)
Sascha Mölck